UNITED STATES
SECURITIES AND EXCHANGE COMMISSION
Washington, D.C. 20549
FORM N-CSR
CERTIFIED SHAREHOLDER REPORT OF REGISTERED MANAGEMENT
INVESTMENT COMPANIES
Investment Company Act file number: 811-05576
Name of Fund: BlackRock Global Allocation Fund, Inc.
Fund Address: 100 Bellevue Parkway, Wilmington, DE 19809
Name and address of agent for service: John M. Perlowski, Chief Executive Officer, BlackRock Global
Allocation Fund, Inc., 55 East 52nd Street, New York, NY 10055
Registrant’s telephone number, including area code: (800) 441-7762
Date of fiscal year end: 10/31/2017
Date of reporting period: 10/31/2017
Item 1 – Report to Stockholders
OCTOBER 31, 2017
| | |
ANNUAL REPORT | |  |
BlackRock Global Allocation Fund, Inc.
|
| Not FDIC Insured • May Lose Value • No Bank Guarantee |
The Markets in Review
Dear Shareholder,
In the 12 months ended October 31, 2017, risk assets, such as stocks and high-yield bonds, continued to deliver strong performance. These markets showed great resilience during a period with big political surprises, including the aftermath of the U.K.’s vote to leave the European Union and the outcome of the U.S. presidential election, which brought only brief spikes in equity market volatility. In contrast, closely watched elections in France, the Netherlands, and Australia countered the isolationist and nationalist political developments in the U.K. and the United States.
Interest rates rose, which worked against high-quality assets with more interest rate sensitivity. Consequently, longer-term U.S. Treasuries posted negative returns, as rising energy prices, modest wage increases, and steady job growth led to expectations of higher inflation and further interest rate increases by the U.S. Federal Reserve (the “Fed”).
The market’s performance reflected reflationary expectations early in the reporting period, as investors began to sense that a global recovery was afoot. Thereafter, many countries throughout the world experienced sustained and synchronized growth for the first time since the financial crisis. Growth rates and inflation are still relatively low, but they are finally rising together.
The Fed responded to these positive developments by increasing short-term interest rates three times and setting expectations for additional interest rate increases. The Fed also began reducing the vast balance sheet reserves that had accumulated in the wake of the financial crisis. In October 2017, the Fed reduced its $4.5 trillion balance sheet by only $10 billion, while setting expectations for additional modest reductions and rate hikes in 2018.
By contrast, the European Central Bank (“ECB”) and the Bank of Japan (“BoJ”) both continued to expand their balance sheets despite nascent signs of sustained economic growth. The Eurozone and Japan are both approaching the limits of central banks’ ownership share of debt issued by their respective governments, which is a structural pressure point that limits their capacity to deliver additional monetary stimulus. In October 2017, the ECB announced plans to cut the amount of its bond purchases in half for 2018, while the BoJ reiterated its commitment to economic stimulus until the inflation rate rises to its target of 2.0%.
Emerging market growth also stabilized, as accelerating growth in China, the second largest economy in the world and the most influential of all developing economies, improved the outlook for corporate profits and economic growth across most developing nations. Chinese demand for commodities and other raw materials allayed concerns about the country’s banking system, leading to rising equity prices and foreign investment flows.
While escalating tensions between the United States and North Korea and our nation’s divided politics are significant concerns, benign credit conditions, modest inflation, solid corporate earnings, and the positive outlook for growth in the world’s largest economies have kept markets relatively tranquil.
High valuations across most assets have laid the groundwork for muted returns going forward. At current valuation levels, potential equity gains will likely be closely tied to the pace of earnings growth, which has remained solid thus far in 2017, particularly in emerging markets. In this environment, investors need to think globally, extend their scope across a broad array of asset classes, and be nimble as market conditions change. We encourage you to talk with your financial advisor and visit blackrock.com for further insight about investing in today’s markets.
Sincerely,

Rob Kapito
President, BlackRock Advisors, LLC

Rob Kapito
President, BlackRock Advisors, LLC
| | | | |
| Total Returns as of October 31, 2017 |
| | | 6-month | | 12-month |
U.S. large cap equities
(S&P 500® Index) | | 9.10% | | 23.63% |
U.S. small cap equities
(Russell 2000® Index) | | 8.01 | | 27.85 |
International equities
(MSCI Europe, Australasia,
Far East Index) | | 10.74 | | 23.44 |
Emerging market equities
(MSCI Emerging Markets Index) | | 16.14 | | 26.45 |
3-month Treasury bills
(BofA Merrill Lynch 3-Month
U.S. Treasury Bill Index) | | 0.49 | | 0.72 |
U.S. Treasury securities
(BofA Merrill Lynch
10-Year U.S. Treasury
Index) | | 0.15 | | (2.98) |
U.S. investment grade bonds
(Bloomberg Barclays U.S.
Aggregate Bond Index) | | 1.58 | | 0.90 |
Tax-exempt municipal bonds
(S&P Municipal Bond Index) | | 2.22 | | 1.80 |
U.S. high yield bonds
(Bloomberg Barclays U.S. Corporate High Yield 2% Issuer
Capped Index) | | 3.44 | | 8.92 |
| Past performance is no guarantee of future results. Index performance is shown for illustrative purposes only. You cannot invest directly in an index. |
| | |
| 2 | | THIS PAGEISNOT PARTOF YOUR FUND REPORT |
Table of Contents

| | |
| Fund Summary as of October 31, 2017 | | BlackRock Global Allocation Fund, Inc. |
Investment Objective
BlackRock Global Allocation Fund, Inc.’s (the “Fund”) investment objective is to provide high total investment return through a fully managed investment policy utilizing United States and foreign equity securities, debt and money market securities, the combination of which will be varied from time to time both with respect to types of securities and markets in response to changing market and economic trends. Total return means the combination of capital growth and investment income.
Portfolio Management Commentary
How did the Fund perform?
| • | | For the 12-month period ended October 31, 2017, the Fund underperformed both its reference benchmark, which is comprised of the S&P 500® Index (36%), FTSE World (ex-U.S.) Index (24%), BofA Merrill Lynch Current 5-Year U.S. Treasury Index (24%) and Citigroup Non-U.S. Dollar World Government Bond Index (16%) (the “Reference Benchmark”), and the broad-based all-equity benchmark, the FTSE World Index. The Fund invests in both equities and bonds; therefore, the Reference Benchmark provides a truer representation of the Fund’s composition and a more comparable means for measurement. The following discussion of relative performance pertains to the Reference Benchmark. The following commentary (and referenced allocation percentages) are based on the economic exposures of the Fund, which reflect adjustments for futures, swaps and options (except with respect to fixed income securities) and convertible bonds, and may vary relative to the market value. |
What factors influenced performance?
| • | | An underweight to broad equities detracted from performance. From a sector perspective, stock selection within and an underweight to information technology (“IT”) negatively impacted returns, as did stock selection in health care. Exposure to commodity-related securities (notably gold) and to cash and cash equivalents detracted from performance. Currency management, notably an underweight to the British pound sterling, negatively impacted performance as well. |
| • | | Within equities, an overweight to Japan contributed to performance. From a sector perspective, an underweight and stock selection in consumer staples positively impacted performance, as did stock selection in financials, materials, utilities, consumer discretionary and industrials. Within energy, stock selection contributed, although this was partially offset by an overweight to the sector. An underweight in fixed income positively impacted performance, and exposure to credit within fixed income was additive as well. |
| • | | The Fund uses derivatives, which include options, futures, swaps and forward contracts, both to seek to enhance returns of the Fund and to hedge (or protect) against adverse movements in currency exchange rates, interest rates and movements in the securities markets. During the period, the Fund’s use of derivatives positively contributed to the Fund’s performance. |
Describe recent portfolio activity.
| • | | During the 12-month period, the Fund’s overall equity allocation increased from 56% to 62% of net assets. Within equities, the Fund increased exposure to the United States and Europe and decreased exposure to Japan. On a sector basis, the Fund increased exposure to energy, IT, utilities, materials, consumer discretionary, health care, telecommunication services (“telecom”) and consumer staples, and reduced exposure to financials, real estate and industrials. |
| • | | The Fund’s allocation to fixed income decreased from 32% to 31% of net assets. Within fixed income, the Fund increased exposure to government debt, notably in the United States, Brazil and Australia, and reduced exposure to European sovereign debt and corporate bonds. |
| • | | The Fund’s overall allocation to commodity-related securities remained unchanged at 4%. |
| • | | Reflecting the changes in the Fund’s overall allocations to the equity, fixed income, and commodity-related asset classes during the period, the Fund’s cash and cash equivalent holdings decreased from 8% to 3% of net assets. During the 12-month period, cash was used to help mitigate portfolio volatility and served as a source of funds for new investments. |
Describe portfolio positioning at period end
| • | | Relative to its Reference Benchmark, the Fund ended the period overweight in equities, underweight in fixed income, and overweight in commodity-related securities and cash and cash equivalents. Within the equity segment, the Fund was overweight in Japan and Europe, and was underweight in the United States. Within Europe, the Fund was overweight in the Netherlands and France, and underweight in Denmark. From a sector perspective, the Fund was overweight in energy, consumer discretionary, telecom, utilities and materials, and was underweight in financials, consumer staples, IT and real estate. |
| • | | Within fixed income, the Fund was underweight in developed European sovereign debt, US Treasuries and Japanese government bonds, and overweight in government bonds in Brazil, Australia, Poland, Argentina and Mexico. In addition, the Fund was overweight in corporate debt. |
| • | | With respect to currency exposure, the Fund was overweight in the U.S. dollar, Indian rupee and Brazilian real, and underweight in the Canadian dollar, euro, and British pound sterling. |
The views expressed reflect the opinions of BlackRock as of the date of this report and are subject to change based on changes in market, economic or other conditions. These views are not intended to be a forecast of future events and are no guarantee of future results.
| | |
| 4 | | 2017 BLACKROCK ANNUAL REPORTTO SHAREHOLDERS |
| | |
| Fund Summary as of October 31, 2017 (continued) | | BlackRock Global Allocation Fund, Inc. |
TOTAL RETURN BASED ON A $10,000 INVESTMENT
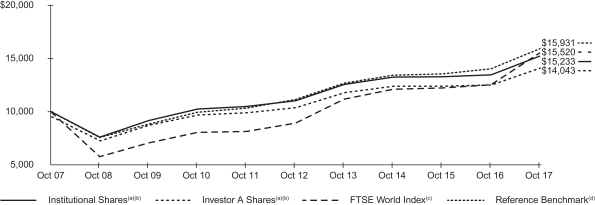
| (a) | Assuming maximum sales charges, if any, transaction costs and other operating expenses, including advisory fees. Institutional Shares do not have a sales charge. |
| (b) | The Fund invests in a portfolio of U.S. and foreign equity securities, debt and money market securities, the combination of which will be varied from time to time with respect to types of securities and markets in response to changing market and economic trends. |
| (c) | This unmanaged capitalization-weighted index is comprised of 2,584 equities from 35 countries in 4 regions, including the United States. |
| (d) | The Reference Benchmark is an unmanaged weighted index comprised as follows: 36% S&P 500® Index; 24% FTSE World (ex-U.S.) Index; 24% BofA Merrill Lynch Current 5-Year U.S. Treasury Index; and 16% Citigroup Non-U.S. Dollar World Government Bond Index. |
Descriptions of these indexes can be found in the footnotes below.
Performance Summary for the Period Ended October 31, 2017
| | | | | | | | | | | | | | | | | | | | | | | | | | | | | | | | | | | | | | | | |
| | | | | | | | | Average Annual Total Returns (e) | |
| | | | | | | | | 1 Year | | | | | | 5 Years | | | | | | 10 Years | |
| | | 6-Month Total Returns | | | | | | w/o sales charge | | | w/sales charge | | | | | | w/o sales charge | | | w/sales charge | | | | | | w/o sales charge | | | w/sales charge | |
Institutional | | | 5.57 | % | | | | | | | 13.10 | % | | | N/A | | | | | | | | 6.66 | % | | | N/A | | | | | | | | 4.30 | % | | | N/A | |
Investor A | | | 5.41 | | | | | | | | 12.77 | | | | 6.85 | | | | | | | | 6.37 | | | | 5.23 | % | | | | | | | 4.01 | | | | 3.45 | % |
Investor B | | | 4.92 | | | | | | | | 11.72 | | | | 7.22 | | | | | | | | 5.48 | | | | 5.15 | | | | | | | | 3.34 | | | | 3.34 | |
Investor C | | | 5.04 | | | | | | | | 11.92 | | | | 10.92 | | | | | | | | 5.59 | | | | 5.59 | | | | | | | | 3.24 | | | | 3.24 | |
Class K | | | 5.61 | | | | | | | | 13.20 | | | | N/A | | | | | | | | 6.74 | | | | N/A | | | | | | | | 4.37 | | | | N/A | |
Class R | | | 5.29 | | | | | | | | 12.42 | | | | N/A | | | | | | | | 6.01 | | | | N/A | | | | | | | | 3.66 | | | | N/A | |
FTSE World Index | | | 10.12 | | | | | | | | 23.69 | | | | N/A | | | | | | | | 11.66 | | | | N/A | | | | | | | | 4.49 | | | | N/A | |
Reference Benchmark | | | 6.60 | | | | | | | | 13.42 | | | | N/A | | | | | | | | 7.41 | | | | N/A | | | | | | | | 4.77 | | | | N/A | |
U.S. Stocks: S&P 500® Index(f) | | | 9.10 | | | | | | | | 23.63 | | | | N/A | | | | | | | | 15.18 | | | | N/A | | | | | | | | 7.52 | | | | N/A | |
Non-U.S. Stocks: FTSE World (ex-U.S.) Index(g) | | | 11.38 | | | | | | | | 23.49 | | | | N/A | | | | | | | | 8.02 | | | | N/A | | | | | | | | 1.59 | | | | N/A | |
U.S. Bonds: BofA Merrill Lynch Current 5-Year U.S. Treasury Index(h) | | | 0.06 | | | | | | | | (1.46 | ) | | | N/A | | | | | | | | 0.80 | | | | N/A | | | | | | | | 3.68 | | | | N/A | |
Non-U.S. Bonds: Citigroup Non-U.S. Dollar World Government Bond Index(i) | | | 3.99 | | | | | | | | 0.73 | | | | N/A | | | | | | | | (1.06 | ) | | | N/A | | | | | | | | 2.41 | | | | N/A | |
| | (e) | Assuming maximum sales charges, if any. Average annual total returns with and without sales charges reflect reductions for distribution and service fees. See “About Fund Performance” on page 7 for a detailed description of share classes, including any related sales charges and fees. |
| | (f) | This unmanaged index covers 500 leading companies and captures approximately 80% coverage of available market capitalization. |
| | (g) | This unmanaged capitalization-weighted index is comprised of 1,969 equities from 34 countries, excluding the United States. |
| | (h) | This unmanaged index is designed to track the total return of the current coupon five-year U.S. Treasury bond. |
| | (i) | This unmanaged market capitalization-weighted index tracks 22 government bond indexes, excluding the United States. |
| | | N/A — Not applicable as share class and index do not have a sales charge. |
| | | Past performance is not indicative of future results. |
| | | Performance results may include adjustments made for financial reporting purposes in accordance with U.S. generally accepted accounting principles. |
| | |
| Fund Summary as of October 31, 2017 (continued) | | BlackRock Global Allocation Fund, Inc. |
Portfolio Information
OVERALL ASSET EXPOSURE
| | | | | | | | | | | | |
| | | Percent of Fund’s
Net Assets (a) | | | Reference
Benchmark (b) Percentages | |
| | | 10/31/17 | | | 10/31/16 | | |
US Equities | | | 31 | % | | | 26 | % | | | 35 | % |
European Equities | | | 16 | | | | 13 | | | | 13 | |
Asia Pacific Equities | | | 14 | | | | 15 | | | | 9 | |
Other Equities | | | 1 | | | | 2 | | | | 3 | |
| | | | | | | | | | | | |
Total Equities | | | 62 | | | | 56 | | | | 60 | |
| | | | | | | | | | | | |
US Dollar Denominated Fixed Income Securities | | | 22 | | | | 20 | | | | 24 | |
U.S. Issuers | | | 19 | | | | 16 | | | | — | |
Non-U.S. Issuers | | | 3 | | | | 4 | | | | — | |
Non-U.S. Dollar Denominated Fixed Income Securities | | | 9 | | | | 12 | | | | 16 | |
| | | | | | | | | | | | |
Total Fixed Income Securities | | | 31 | | | | 32 | | | | 40 | |
| | | | | | | | | | | | |
Commodity-Related | | | 4 | | | | 4 | | | | — | |
| | | | | | | | | | | | |
Cash & Short-Term Securities | | | 3 | | | | 8 | | | | — | |
| | | | | | | | | | | | |
| | (a) | Exposure based on market value and adjusted for the economic value of futures, swaps and options (except with respect to fixed income securities), and convertible bonds. | |
| | (b) | The Reference Benchmark is an unmanaged weighted index comprised as follows: 36% of the S&P 500 Index®; 24% FTSE World (ex U.S.) Index; 24% BofA Merrill Lynch Current 5-Year U.S. Treasury Index; and 16% Citigroup Non-U.S. Dollar World Government Bond Index. Descriptions of these indexes are found on page 5 of this report to shareholders in the “Performance Summary” section. | |
GEOGRAPHIC ALLOCATION
| | | | |
| Country | | Percent of Total Investments (a) | |
United States | | | 58 | % |
Japan | | | 10 | |
United Kingdom | | | 4 | |
France | | | 3 | |
Germany | | | 3 | |
Australia | | | 2 | |
Brazil | | | 2 | |
Netherlands | | | 2 | |
India | | | 2 | |
Canada | | | 1 | |
Other(b) | | | 13 | |
| | (a) | Excludes short-term securities, options purchased and options written. | |
| | (b) | Includes holdings within countries and geographic regions that are 1% or less of long-term investments. Please refer to the Consolidated Schedule of Investments for such countries. | |
TEN LARGEST HOLDINGS (EQUITY INVESTMENTS)
| | | | |
| Security | | Percent of Total Investments (a) | |
Microsoft Corp. | | | 2 | % |
Apple, Inc. | | | 1 | |
Alphabet, Inc. | | | 1 | |
Amazon.com, Inc. | | | 1 | |
Bank of America Corp. | | | 1 | |
DowDuPont, Inc. | | | 1 | |
Danone SA | | | 1 | |
Uber Technologies, Inc. | | | 1 | |
Comcast Corp. | | | 1 | |
QUALCOMM, Inc. | | | 1 | |
| | |
| 6 | | 2017 BLACKROCK ANNUAL REPORTTO SHAREHOLDERS |
About Fund Performance
Institutional and Class K Shares are not subject to any sales charge. These shares bear no ongoing distribution or service fees and are available only to certain eligible investors. Prior to the Class K Shares’ inception date of June 8, 2016, Class K Share performance results are those of Institutional Shares (which have no distribution or service fees) and were restated to reflect Class K Share fees.
Investor A Shares are subject to a maximum initial sales charge (front-end load) of 5.25% and a service fee of 0.25% per year (but no distribution fee). Certain redemptions of these shares may be subject to a contingent deferred sales charge (“CDSC”) where no initial sales charge was paid at the time of purchase. These shares are generally available through financial intermediaries.
Investor B Shares are subject to a maximum CDSC of 4.50% declining to 0% after six years. In addition, these shares are subject to a distribution fee of 0.75% per year and a service fee of 0.25% per year. These shares automatically convert to Investor A Shares after approximately eight years. (There is no initial sales charge for automatic share conversions.) All returns for periods greater than eight years reflect this conversion. These shares are only available through exchanges and distribution reinvestment by current holders and for purchase by certain employer-sponsored retirement plans. Effective on or about the close of business on December 27, 2017, all issued and outstanding investor B Shares will be converted to investor A Shares.
Investor C Shares are subject to a 1.00% CDSC if redeemed within one year of purchase. In addition, these shares are subject to a distribution fee of 0.75% per year and a service fee of 0.25% per year. These shares are generally available through financial intermediaries.
Class R Shares are not subject to any sales charge. These shares are subject to a distribution fee of 0.25% per year and a service fee of 0.25% per year. These shares are available only to certain employer-sponsored retirement plans.
Performance information reflects past performance and does not guarantee future results. Current performance may be lower or higher than the performance data quoted. Refer to www.blackrock.com to obtain performance data current to the most recent month end. Performance results do not reflect the deduction of taxes that a shareholder would pay on fund distributions or the redemption of fund shares. Figures shown in the performance table on the previous page assume reinvestment of all distributions, if any, at net asset value (“NAV”) on the ex-dividend date. Investment return and principal value of shares will fluctuate so that shares, when redeemed, may be worth more or less than their original cost. Distributions paid to each class of shares will vary because of the different levels of service, distribution and transfer agency fees applicable to each class, which are deducted from the income available to be paid to shareholders.
BlackRock Advisors, LLC (the “Manager”), the Fund’s investment adviser voluntarily waived a portion of its expenses. Without such waiver, the Fund’s performance would have been lower. The Manager is under no obligation to waive or to continue waiving its fees and such voluntary waiver may be reduced or discontinued at any time. See Note 6 of the Notes to Consolidated Financial Statements for additional information on waivers.
| | |
| Disclosure of Expenses | | BlackRock Global Allocation Fund, Inc. |
Shareholders of the Fund may incur the following charges: (a) transactional expenses, such as sales charges; and (b) operating expenses, including investment advisory fees, service and distribution fees, including 12b-1 fees, acquired fund fees and expenses, and other fund expenses. The expense example shown below (which is based on a hypothetical investment of $1,000 invested on May 1, 2017 and held through October 31, 2017, is intended to assist shareholders both in calculating expenses based on an investment in the Fund and in comparing these expenses with similar costs of investing in other mutual funds.
The expense example provides information about actual account values and actual expenses. In order to estimate the expenses a shareholder paid during the period covered by this report, shareholders can divide their account value by $1,000 and then multiply the result by the number corresponding to their share class under the heading entitled “Expenses Paid During the Period.”
The expense example also provides information about hypothetical account values and hypothetical expenses based on the Fund’s actual expense ratio and an assumed rate of return of 5% per year before expenses. In order to assist shareholders in comparing the ongoing expenses of investing in the Fund and other funds, compare the 5% hypothetical example with the 5% hypothetical examples that appear in shareholder reports of other funds.
The expenses shown in the expense example are intended to highlight shareholders’ ongoing costs only and do not reflect any transactional expenses, such as sales charges, if any. Therefore, the hypothetical example is useful in comparing ongoing expenses only, and will not help shareholders determine the relative total expenses of owning different funds. If these transactional expenses were included, shareholder expenses would have been higher.
Expense Example
| | | | | | | | | | | | | | | | | | | | | | | | | | | | | | | | | | | | | | | | |
| | | Actual | | | | | | Hypothetical (c) | |
| | | | | | | | | Expenses Paid During the Period | | | | | | | | | Including Dividend Expense
and Broker Fees and
Expenses on Short Sales | | | Excluding Dividend Expense
and Broker Fees and
Expenses on Short Sales | |
| | | Beginning
Account Value
(05/01/17) | | | Ending
Account Value
(10/31/17) | | | Including
Dividend
Expense and
Broker Fees and
Expenses on
Short Sales (a) | | | Excluding
Dividend
Expense and
Broker Fees and
Expenses on
Short Sales (b) | | | | | | Beginning
Account Value
(05/01/17) | | | Ending
Account Value
(10/31/17) | | | Expenses
Paid During
the
Period (a) | | | Ending
Account Value
(10/31/17) | | | Expenses
Paid During
the
Period (b) | |
Institutional | | $ | 1,000.00 | | | $ | 1,055.70 | | | $ | 4.25 | | | $ | 4.15 | | | | | | | $ | 1,000.00 | | | $ | 1,021.07 | | | $ | 4.18 | | | $ | 1,021.17 | | | $ | 4.08 | |
Investor A | | $ | 1,000.00 | | | $ | 1,054.10 | | | $
| 5.64
|
| | $ | 5.54 | | | | | | | $ | 1,000.00 | | | $ | 1,019.71 | | | $ | 5.55 | | | $ | 1,019.81 | | | $ | 5.45 | |
Investor B | | $ | 1,000.00 | | | $ | 1,049.20 | | | $
| 10.69
|
| | $ | 10.69 | | | | | | | $ | 1,000.00 | | | $ | 1,014.77 | | | $ | 10.51 | | | $ | 1,014.77 | | | $ | 10.51 | |
Investor C | | $ | 1,000.00 | | | $ | 1,050.40 | | | $
| 9.46
|
| | $ | 9.41 | | | | | | | $ | 1,000.00 | | | $ | 1,015.98 | | | $ | 9.30 | | | $ | 1,016.03 | | | $ | 9.25 | |
Class K | | $ | 1,000.00 | | | $ | 1,056.10 | | | $ | 3.84 | | | $ | 3.78 | | | | | | | $ | 1,000.00 | | | $ | 1,021.48 | | | $ | 3.77 | | | $ | 1,021.53 | | | $ | 3.72 | |
Class R | | $ | 1,000.00 | | | $ | 1,052.90 | | | $ | 7.35 | | | $ | 7.24 | | | | | | | $ | 1,000.00 | | | $ | 1,018.05 | | | $ | 7.22 | | | $ | 1,018.15 | | | $ | 7.12 | |
| | (a) | For each class of the Fund, expenses are equal to the annualized net expense ratio for the class (0.82% for Institutional, 1.09% for Investor A, 2.07% for Investor B, 1.83% for Investor C, 0.74% for Class K and 1.42% for Class R), multiplied by the average account value over the period, multiplied by 184/365 (to reflect the one-half year period shown). | |
| | (b) | For each class of the Fund, expenses are equal to the annualized net expense ratio for the class (0.80% for Institutional, 1.07% for Investor A, 2.07% for Investor B, 1.82% for Investor C, 0.73% for Class K and 1.40% for Class R), multiplied by the average account value over the period, multiplied by 184/365 (to reflect the one-half year period shown). | |
| | (c) | Hypothetical 5% annual return before expenses is calculated by prorating the number of days in the most recent fiscal half year divided by 365. | |
Derivative Financial Instruments
The Fund may invest in various derivative financial instruments. These instruments are used to obtain exposure to a security, commodity, index, market, and/or other assets without owning or taking physical custody of securities, commodities and/or other referenced assets or to manage market, equity, credit, interest rate, foreign currency exchange rate, commodity and/or other risks. Derivative financial instruments may give rise to a form of economic leverage and involve risks, including the imperfect correlation between the value of a derivative financial instrument and the underlying asset, possible default of the counterparty to the transaction or illiquidity of the instrument. The Fund’s successful use of a derivative financial instrument depends on the investment adviser’s ability to predict pertinent market movements accurately, which cannot be assured. The use of these instruments may result in losses greater than if they had not been used, may limit the amount of appreciation the Fund can realize on an investment and/or may result in lower distributions paid to shareholders. The Fund’s investments in these instruments, if any, are discussed in detail in the Notes to Consolidated Financial Statements.
| | |
| 8 | | 2017 BLACKROCK ANNUAL REPORTTO SHAREHOLDERS |
| | |
Consolidated Schedule of Investments October 31, 2017 | | BlackRock Global Allocation Fund, Inc. (Percentages shown are based on Net Assets) |
| | | | | | | | | | |
| Security | | | | Shares | | | Value | |
Common Stocks | |
|
| Australia — 0.0% | |
AGL Energy Ltd. | | | | | 10,395 | | | $ | 201,262 | |
BHP Billiton Ltd. | | | | | 28,821 | | | | 593,390 | |
National Australia Bank Ltd. | | | | | 13,470 | | | | 337,507 | |
Rio Tinto Ltd. | | | | | 8,762 | | | | 466,894 | |
Stockland | | | | | 158,518 | | | | 549,414 | |
Telstra Corp. Ltd. | | | | | 59,849 | | | | 162,429 | |
Woolworths Ltd. | | | | | 17,817 | | | | 353,216 | |
| | | | | | | | | | |
| | | | | | | | | 2,664,112 | |
| Belgium — 0.4% | |
Anheuser-Busch InBev SA | | | | | 1,355,720 | | | | 166,239,887 | |
UCB SA | | | | | 1,287 | | | | 93,689 | |
| | | | | | | | | | |
| | | | | | | | | 166,333,576 | |
| Brazil — 0.2% | |
Azul SA — ADR(a) | | | | | 3,300,508 | | | | 83,469,847 | |
Banco do Brasil SA | | | | | 41,000 | | | | 431,645 | |
Banco Santander Brasil SA | | | | | 25,736 | | | | 225,081 | |
Engie Brasil Energia SA | | | | | 5,697 | | | | 62,346 | |
JBS SA | | | | | 109,596 | | | | 252,607 | |
Vale SA | | | | | 10,204 | | | | 100,128 | |
| | | | | | | | | | |
| | | | | | | | | 84,541,654 | |
| Canada — 0.4% | |
Agrium, Inc. | | | | | 3,353 | | | | 365,033 | |
Bank of Nova Scotia | | | | | 14,319 | | | | 924,336 | |
Barrick Gold Corp. | | | | | 20,308 | | | | 293,420 | |
Canadian National Railway Co. | | | | | 5,219 | | | | 419,955 | |
Encana Corp.(b) | | | | | 11,769,415 | | | | 137,702,156 | |
Magna International, Inc. | | | | | 16,479 | | | | 898,994 | |
Platinum Group Metals Ltd.(a)(b)(v) | | | | | 8,627,632 | | | | 3,486,252 | |
Royal Bank of Canada | | | | | 3,283 | | | | 256,690 | |
Teck Resources Ltd., Class B | | | | | 29,668 | | | | 606,192 | |
Thomson Reuters Corp. | | | | | 19,794 | | | | 925,490 | |
Toronto-Dominion Bank | | | | | 4,281 | | | | 243,368 | |
| | | | | | | | | | |
| | | | | | | | | 146,121,886 | |
| China — 0.4% | |
Agricultural Bank of China Ltd., Class H | | | | | 1,418,000 | | | | 667,868 | |
Alibaba Group Holding Ltd. — ADR(a)(b) | | | | | 465,253 | | | | 86,020,627 | |
Bank of China Ltd., Class H | | | | | 939,000 | | | | 469,277 | |
Bank of Communications Co. Ltd., Class H | | | | | 264,000 | | | | 199,302 | |
Brilliance China Automotive Holdings Ltd. | | | | | 13,292,000 | | | | 33,683,641 | |
China Construction Bank Corp., Class H | | | | | 1,161,000 | | | | 1,037,603 | |
China Mobile Ltd. | | | | | 129,000 | | | | 1,297,529 | |
China Mobile Ltd. — ADR | | | | | 38,494 | | | | 1,942,022 | |
China Resources Power Holdings Co. Ltd. | | | | | 452,000 | | | | 869,230 | |
China Telecom Corp. Ltd., Class H | | | | | 246,000 | | | | 123,369 | |
China Vanke Co. Ltd., Class H | | | | | 46,800 | | | | 166,596 | |
CLP Holdings Ltd. | | | | | 1,473,500 | | | | 14,997,185 | |
CNOOC Ltd. | | | | | 627,000 | | | | 856,101 | |
Dongfeng Motor Group Co. Ltd., Class H | | | | | 180,000 | | | | 247,084 | |
Industrial & Commercial Bank of China Ltd., Class H | | | | | 723,000 | | | | 575,266 | |
Longfor Properties Co. Ltd. | | | | | 26,500 | | | | 22,191 | |
NetEase, Inc. — ADR | | | | | 1,970 | | | | 555,383 | |
PICC Property & Casualty Co. Ltd., Class H | | | | | 12,000 | | | | 23,814 | |
Want Want China Holdings Ltd.(b) | | | | | 12,158,000 | | | | 9,954,041 | |
Wilmar International Ltd. | | | | | 96,100 | | | | 239,140 | |
| | | | | | | | | | |
| | | | | | | | | 153,947,269 | |
| Czech Republic — 0.0% | |
CEZ AS | | | | | 700,264 | | | | 15,354,902 | |
| | | | | | | |
| | | | | | | | | | |
| Security | | | | Shares | | | Value | |
| Denmark — 0.0% | |
A.P. Moeller — Maersk A/S, Class A | | | | | 361 | | | $ | 669,124 | |
A.P. Moeller — Maersk A/S, Class B | | | | | 397 | | | | 761,043 | |
Danske Bank A/S | | | | | 29,938 | | | | 1,142,538 | |
Novo Nordisk A/S, Class B | | | | | 1,740 | | | | 86,632 | |
| | | | | | | | | | |
| | | | | | | | | 2,659,337 | |
| Finland — 0.3% | |
Nokia OYJ | | | | | 20,316,748 | | | | 99,916,142 | |
| | | | | | | | | | |
| France — 2.9% | |
AXA SA | | | | | 3,123,733 | | | | 94,300,463 | |
BNP Paribas SA | | | | | 6,997 | | | | 546,112 | |
Cie Generale des Etablissements Michelin | | | | | 399,475 | | | | 57,822,550 | |
Compagnie de Saint-Gobain | | | | | 1,042,072 | | | | 61,099,703 | |
Danone SA | | | | | 3,696,268 | | | | 302,100,197 | |
Dassault Aviation SA | | | | | 42,790 | | | | 66,719,238 | |
Engie SA | | | | | 3,003 | | | | 50,757 | |
LVMH Moet Hennessy Louis Vuitton SE | | | | | 1,201 | | | | 358,214 | |
Orange SA | | | | | 39,195 | | | | 643,883 | |
Safran SA | | | | | 1,295,168 | | | | 136,410,042 | |
Sanofi | | | | | 1,229,390 | | | | 116,406,690 | |
Societe Generale SA | | | | | 6,304 | | | | 350,846 | |
Sodexo SA | | | | | 496,216 | | | | 63,129,977 | |
Thales SA | | | | | 1,543 | | | | 160,801 | |
TOTAL SA | | | | | 1,612,144 | | | | 89,857,832 | |
TOTAL SA — ADR | | | | | 64,273 | | | | 3,581,291 | |
Unibail-Rodamco SE | | | | | 243,312 | | | | 60,902,686 | |
Vinci SA | | | | | 608,796 | | | | 59,648,347 | |
Vivendi SA | | | | | 4,495 | | | | 111,619 | |
| | | | | | | | | | |
| | | | | | | | | 1,114,201,248 | |
| Germany — 2.0% | |
adidas AG | | | | | 1,674 | | | | 372,604 | |
Allianz SE, Registered Shares | | | | | 4,082 | | | | 952,979 | |
BASF SE | | | | | 8,075 | | | | 883,028 | |
Bayer AG, Registered Shares | | | | | 1,741,125 | | | | 226,483,483 | |
Deutsche Post AG, Registered Shares | | | | | 23,415 | | | | 1,073,346 | |
Deutsche Telekom AG, Registered Shares | | | | | 4,498,376 | | | | 81,453,512 | |
E.ON SE | | | | | 50,060 | | | | 592,932 | |
Evonik Industries AG | | | | | 1,414,331 | | | | 51,447,560 | |
Fresenius Medical Care AG & Co. KGaA | | | | | 1,515 | | | | 146,685 | |
GEA Group AG | | | | | 975,918 | | | | 47,144,181 | |
Innogy SE(c) | | | | | 5,600,109 | | | | 260,438,416 | |
SAP SE | | | | | 11,522 | | | | 1,316,532 | |
Siemens AG, Registered Shares | | | | | 352,708 | | | | 50,660,404 | |
Vonovia SE | | | | | 1,383,271 | | | | 61,103,860 | |
| | | | | | | | | | |
| | | | | | | | | 784,069,522 | |
| Hong Kong — 0.8% | |
AIA Group Ltd. | | | | | 8,600 | | | | 64,805 | |
CK Infrastructure Holdings Ltd. | | | | | 1,405,000 | | | | 12,233,438 | |
Galaxy Entertainment Group Ltd. | | | | | 12,000 | | | | 81,833 | |
Hang Lung Properties Ltd. | | | | | 2,964,000 | | | | 6,806,158 | |
HKT Trust & HKT Ltd.(d) | | | | | 7,592,000 | | | | 9,274,202 | |
Hong Kong Exchanges & Clearing Ltd. | | | | | 2,600 | | | | 72,447 | |
Hongkong Land Holdings Ltd. | | | | | 65,100 | | | | 472,162 | |
I-CABLE Communications Ltd.(a) | | | | | 1,370,132 | | | | 42,917 | |
Jardine Matheson Holdings Ltd. | | | | | 193,900 | | | | 12,421,532 | |
Link REIT | | | | | 1,769,000 | | | | 14,872,520 | |
Power Assets Holdings Ltd. | | | | | 1,247,500 | | | | 10,814,721 | |
Sino Land Co. Ltd. | | | | | 5,450,000 | | | | 9,393,299 | |
Sun Hung Kai Properties Ltd. | | | | | 10,619,166 | | | | 173,723,096 | |
Swire Pacific Ltd., Class A | | | | | 1,139,000 | | | | 11,255,680 | |
Swire Properties Ltd. | | | | | 64,800 | | | | 218,974 | |
WH Group Ltd.(c) | | | | | 638,500 | | | | 647,044 | |
Wharf Holdings Ltd. | | | | | 1,866,000 | | | | 16,995,799 | |
| | | | | | | | | | |
| | | | | | | | | 279,390,627 | |
| | | | |
| CONSOLIDATED SCHEDULE OF INVESTMENTS | | | 9 | |
| | |
Consolidated Schedule of Investments (continued) October 31, 2017 | | BlackRock Global Allocation Fund, Inc. (Percentages shown are based on Net Assets) |
| | | | | | | | | | |
| Security | | | | Shares | | | Value | |
| India — 1.3% | |
Coal India Ltd. | | | | | 2,401,995 | | | $ | 10,629,027 | |
GAIL India Ltd. | | | | | 30,421 | | | | 218,606 | |
Grasim Industries Ltd. | | | | | 17,669 | | | | 335,045 | |
HCL Technologies Ltd. | | | | | 4,858 | | | | 64,200 | |
Hero MotoCorp Ltd. | | | | | 253,273 | | | | 15,073,263 | |
Hindustan Petroleum Corp. Ltd. | | | | | 23,092 | | | | 159,509 | |
Hindustan Unilever Ltd. | | | | | 19,986 | | | | 381,953 | |
Indian Oil Corp. Ltd. | | | | | 30,232 | | | | 194,114 | |
Infosys Ltd. | | | | | 9,121,929 | | | | 129,878,566 | |
Kotak Mahindra Bank Ltd. | | | | | 4,064,800 | | | | 64,334,782 | |
Maruti Suzuki India Ltd. | | | | | 412,274 | | | | 52,301,616 | |
Oil & Natural Gas Corp. Ltd. | | | | | 3,635,770 | | | | 10,743,080 | |
Reliance Industries Ltd. | | | | | 12,062,423 | | | | 175,370,973 | |
SBI Life Insurance Co. Ltd.(a)(c) | | | | | 447,299 | | | | 4,572,348 | |
State Bank of India | | | | | 7,562,983 | | | | 35,718,333 | |
Tata Motors Ltd.(a) | | | | | 8,101 | | | | 53,644 | |
Tata Motors Ltd., Class A(a) | | | | | 67,385 | | | | 250,792 | |
Tech Mahindra Ltd. | | | | | 31,280 | | | | 232,738 | |
Vedanta Ltd. | | | | | 51,845 | | | | 266,157 | |
Yes Bank Ltd. | | | | | 4,624,413 | | | | 22,478,396 | |
| | | | | | | | | | |
| | | | | | | | | 523,257,142 | |
| Indonesia — 0.1% | |
Siloam International Hospitals Tbk PT(a) | | | | | 58,702,387 | | | | 42,207,800 | |
| | | | | | | | | | |
| Ireland — 0.0% | |
Experian PLC | | | | | 2,711 | | | | 57,116 | |
Medtronic PLC | | | | | 143,705 | | | | 11,571,127 | |
| | | | | | | | | | |
| | | | | | | | | 11,628,243 | |
| Israel — 0.0% | |
Check Point Software Technologies Ltd.(a) | | | | | 263 | | | | 30,958 | |
| | | | | | | | | | |
| Italy — 1.0% | |
Atlantia SpA | | | | | 5,974 | | | | 194,756 | |
Ei Towers SpA(v) | | | | | 1,163,864 | | | | 68,057,465 | |
Enel SpA | | | | | 16,098,696 | | | | 99,838,788 | |
Luxottica Group SpA | | | | | 991,304 | | | | 56,858,411 | |
RAI Way SpA(c) | | | | | 7,991,096 | | | | 48,450,348 | |
Snam SpA | | | | | 1,392,865 | | | | 7,111,748 | |
Telecom Italia SpA(a)(b) | | | | | 110,879,309 | | | | 95,941,704 | |
Telecom Italia SpA, Non-Convertible Savings Shares | | | | | 3,897,526 | | | | 2,769,083 | |
| | | | | | | | | | |
| | | | | | | | | 379,222,303 | |
| Japan — 8.4% | |
Aisin Seiki Co. Ltd. | | | | | 897,690 | | | | 46,502,519 | |
Ajinomoto Co., Inc. | | | | | 2,944,600 | | | | 59,235,305 | |
Alfresa Holdings Corp. | | | | | 384,800 | | | | 7,352,417 | |
Alpine Electronics, Inc. | | | | | 268,100 | | | | 5,948,653 | |
Asahi Glass Co. Ltd. | | | | | 16,800 | | | | 658,395 | |
Asahi Kasei Corp. | | | | | 4,971,300 | | | | 60,201,068 | |
Astellas Pharma, Inc. | | | | | 6,076,550 | | | | 80,871,928 | |
Bridgestone Corp. | | | | | 3,226,400 | | | | 154,126,306 | |
Canon Marketing Japan, Inc. | | | | | 326,000 | | | | 8,200,252 | |
COMSYS Holdings Corp. | | | | | 398,800 | | | | 10,099,380 | |
Dai-ichi Life Holdings, Inc. | | | | | 1,300 | | | | 24,827 | |
Daicel Corp. | | | | | 776,000 | | | | 9,688,833 | |
Daikin Industries Ltd. | | | | | 448,600 | | | | 49,575,152 | |
Denso Corp. | | | | | 2,116,380 | | | | 116,557,459 | |
East Japan Railway Co. | | | | | 1,950,273 | | | | 189,136,704 | |
Exedy Corp. | | | | | 227,700 | | | | 6,827,704 | |
Fujitsu Ltd. | | | | | 132,000 | | | | 1,028,609 | |
Hino Motors Ltd. | | | | | 691,900 | | | | 8,905,447 | |
Hitachi Chemical Co. Ltd. | | | | | 1,473,100 | | | | 42,006,619 | |
Hitachi Ltd. | | | | | 170,000 | | | | 1,353,769 | |
Hoya Corp. | | | | | 1,228,117 | | | | 66,724,494 | |
Japan Airlines Co. Ltd. | | | | | 3,881,600 | | | | 132,856,689 | |
| | | | | | | | | | |
| Security | | | | Shares | | | Value | |
| Japan (continued) | |
Japan Aviation Electronics Industry Ltd. | | | | | 258,000 | | | $ | 4,719,502 | |
Japan Tobacco, Inc. | | | | | 1,900 | | | | 62,890 | |
Kamigumi Co. Ltd. | | | | | 362,000 | | | | 8,665,912 | |
Kao Corp. | | | | | 5,700 | | | | 344,480 | |
KDDI Corp. | | | | | 595,900 | | | | 15,876,347 | |
Keyence Corp. | | | | | 32,400 | | | | 17,989,283 | |
Kinden Corp. | | | | | 1,187,700 | | | | 20,057,728 | |
Kintetsu Group Holdings Co. Ltd. | | | | | 6,900 | | | | 265,325 | |
Koito Manufacturing Co. Ltd. | | | | | 477,800 | | | | 32,038,486 | |
Komatsu Ltd. | | | | | 2,664,800 | | | | 87,074,341 | |
Kubota Corp. | | | | | 2,791,910 | | | | 52,531,122 | |
Kuraray Co. Ltd. | | | | | 498,600 | | | | 9,819,709 | |
Kurita Water Industries Ltd. | | | | | 280,400 | | | | 8,910,063 | |
Kyudenko Corp. | | | | | 196,300 | | | | 8,667,180 | |
Kyushu Railway Co. | | | | | 1,143,200 | | | | 36,538,494 | |
Mabuchi Motor Co. Ltd. | | | | | 286,300 | | | | 15,023,610 | |
Maeda Road Construction Co. Ltd. | | | | | 470,000 | | | | 10,121,357 | |
Marubeni Corp. | | | | | 64,900 | | | | 435,157 | |
Mazda Motor Corp. | | | | | 37,300 | | | | 538,452 | |
Medipal Holdings Corp. | | | | | 448,600 | | | | 8,331,068 | |
Mitsubishi Electric Corp. | | | | | 8,856,900 | | | | 151,572,493 | |
Mitsubishi Tanabe Pharma Corp. | | | | | 7,800 | | | | 171,673 | |
Mitsubishi UFJ Financial Group, Inc. | | | | | 74,100 | | | | 502,631 | |
MS&AD Insurance Group Holdings, Inc. | | | | | 900 | | | | 30,575 | |
Murata Manufacturing Co. Ltd. | | | | | 624,440 | | | | 98,138,221 | |
Nintendo Co. Ltd. | | | | | 203,800 | | | | 79,066,567 | |
Nippo Corp. | | | | | 459,000 | | | | 9,584,194 | |
Nippon Telegraph & Telephone Corp. | | | | | 305,700 | | | | 14,779,837 | |
Nippon Television Holdings, Inc. | | | | | 903,200 | | | | 16,303,345 | |
Nitto Denko Corp. | | | | | 766,700 | | | | 71,293,673 | |
NTT DOCOMO, Inc. | | | | | 23,100 | | | | 559,453 | |
Okumura Corp. | | | | | 542,124 | | | | 20,752,459 | |
Olympus Corp. | | | | | 10,100 | | | | 375,868 | |
Osaka Gas Co. Ltd. | | | | | 1,200 | | | | 23,243 | |
Otsuka Holdings Co. Ltd. | | | | | 272,000 | | | | 11,362,693 | |
Rakuten, Inc. | | | | | 22,700 | | | | 242,908 | |
Renesas Electronics Corp.(a) | | | | | 2,728,600 | | | | 35,278,295 | |
Resona Holdings, Inc. | | | | | 73,700 | | | | 398,373 | |
Rohm Co. Ltd. | | | | | 1,101,700 | | | | 102,554,211 | |
Seino Holdings Co Ltd. | | | | | 503,000 | | | | 7,338,470 | |
Seven & i Holdings Co. Ltd. | | | | | 123,800 | | | | 4,989,691 | |
Shimamura Co. Ltd. | | | | | 70,200 | | | | 7,820,853 | |
Shin-Etsu Chemical Co. Ltd. | | | | | 1,734,740 | | | | 182,947,742 | |
Shionogi & Co. Ltd. | | | | | 23,100 | | | | 1,243,636 | |
SHO-BOND Holdings Co. Ltd. | | | | | 87,800 | | | | 5,403,065 | |
SKY Perfect JSAT Holdings, Inc. | | | | | 811,000 | | | | 3,760,400 | |
Sony Corp. | | | | | 37,300 | | | | 1,560,434 | |
Stanley Electric Co. Ltd. | | | | | 441,900 | | | | 16,312,481 | |
Subaru Corp. | | | | | 1,784,990 | | | | 61,669,777 | |
Sumitomo Electric Industries Ltd. | | | | | 2,934,200 | | | | 49,955,723 | |
Sumitomo Mitsui Financial Group, Inc. | | | | | 3,445,800 | | | | 138,048,111 | |
Suzuken Co. Ltd. | | | | | 201,700 | | | | 7,270,854 | |
Suzuki Motor Corp. | | | | | 3,545,308 | | | | 194,188,087 | |
T&D Holdings, Inc. | | | | | 5,200 | | | | 81,123 | |
Toda Corp. | | | | | 2,816,900 | | | | 22,949,833 | |
Toho Co. Ltd. | | | | | 300,000 | | | | 9,939,388 | |
Tokio Marine Holdings, Inc. | | | | | 1,849,721 | | | | 79,736,324 | |
Tokyo Electron Ltd. | | | | | 4,300 | | | | 757,143 | |
Tokyo Gas Co. Ltd. | | | | | 4,855,657 | | | | 121,127,484 | |
Tokyo Steel Manufacturing Co. Ltd.(b) | | | | | 1,367,400 | | | | 11,810,312 | |
Toray Industries, Inc. | | | | | 5,357,400 | | | | 54,225,684 | |
Toshiba Corp.(a) | | | | | 236,000 | | | | 682,855 | |
Toyota Industries Corp. | | | | | 2,387,780 | | | | 146,971,383 | |
Trend Micro, Inc. | | | | | 141,400 | | | | 7,582,381 | |
TV Asahi Holdings Corp. | | | | | 657,000 | | | | 13,230,673 | |
| | |
| 10 | | 2017 BLACKROCK ANNUAL REPORTTO SHAREHOLDERS |
| | |
Consolidated Schedule of Investments (continued) October 31, 2017 | | BlackRock Global Allocation Fund, Inc. (Percentages shown are based on Net Assets) |
| | | | | | | | | | |
| Security | | | | Shares | | | Value | |
| Japan (continued) | |
Ube Industries Ltd. | | | | | 1,385,950 | | | $ | 42,576,473 | |
Unicharm Corp. | | | | | 17,100 | | | | 389,123 | |
West Japan Railway Co. | | | | | 748,300 | | | | 52,767,082 | |
Yamato Kogyo Co. Ltd. | | | | | 211,600 | | | | 5,660,097 | |
| | | | | | | | | | |
| | | | | | | | | 3,261,880,429 | |
| Mexico — 0.0% | |
Cemex SAB de CV(a) | | | | | 1,112,351 | | | | 903,957 | |
| | | | | | | | | | |
| Netherlands — 1.3% | |
ABN AMRO Group NV(c) | | | | | 2,819,275 | | | | 87,071,467 | |
Aegon NV | | | | | 7,476 | | | | 44,137 | |
ING Groep NV | | | | | 7,151,679 | | | | 132,159,193 | |
Koninklijke Ahold Delhaize NV | | | | | 2,363 | | | | 44,467 | |
Koninklijke Philips NV | | | | | 5,984,600 | | | | 243,889,808 | |
Randstad Holding NV | | | | | 790,014 | | | | 48,603,337 | |
RELX NV | | | | | 20,216 | | | | 456,412 | |
Unilever NV CVA | | | | | 154,609 | | | | 8,981,221 | |
| | | | | | | | | | |
| | | | | | | | | 521,250,042 | |
| Norway — 0.0% | |
DNB ASA | | | | | 12,507 | | | | 241,377 | |
Statoil ASA | | | | | 14,483 | | | | 294,259 | |
| | | | | | | | | | |
| | | | | | | | | 535,636 | |
| Peru — 0.0% | |
Credicorp Ltd. | | | | | 99 | | | | 20,735 | |
| | | | | | | | | | |
| Poland — 0.0% | |
Jeronimo Martins SGPS SA | | | | | 277,784 | | | | 5,047,098 | |
PGE SA(a) | | | | | 108,668 | | | | 389,633 | |
Polskie Gornictwo Naftowe i Gazownictwo SA | | | | | 112,598 | | | | 206,918 | |
| | | | | | | | | | |
| | | | | | | | | 5,643,649 | |
| Portugal — 0.1% | |
NOS SGPS SA | | | | | 5,119,925 | | | | 30,678,518 | |
| | | | | | | | | | |
| Singapore — 0.3% | |
CapitaLand Ltd. | | | | | 28,645,300 | | | | 77,141,576 | |
ComfortDelGro Corp. Ltd. | | | | | 6,255,800 | | | | 9,273,954 | |
Genting Singapore PLC | | | | | 612,100 | | | | 547,874 | |
Singapore Telecommunications Ltd. | | | | | 6,216,600 | | | | 17,107,863 | |
| | | | | | | | | | |
| | | | | | | | | 104,071,267 | |
| South Africa — 0.0% | |
Barclays Africa Group Ltd. | | | | | 28,428 | | | | 281,609 | |
RMB Holdings Ltd. | | | | | 67,392 | | | | 297,935 | |
Tiger Brands Ltd. | | | | | 11,817 | | | | 322,742 | |
| | | | | | | | | | |
| | | | | | | | | 902,286 | |
| South Korea — 0.6% | |
Amorepacific Corp. | | | | | 126,325 | | | | 35,445,803 | |
Coway Co. Ltd. | | | | | 140,612 | | | | 12,224,625 | |
Doosan Bobcat, Inc. | | | | | 1,917,913 | | | | 62,016,077 | |
Hana Financial Group, Inc. | | | | | 4,742 | | | | 202,952 | |
Hotel Shilla Co. Ltd.(b) | | | | | 156,438 | | | | 10,945,608 | |
Hyundai Mobis Co. Ltd. | | | | | 100 | | | | 23,787 | |
Korea Electric Power Corp. | | | | | 4,314 | | | | 151,247 | |
KT&G Corp. | | | | | 483,813 | | | | 45,775,140 | |
LG Chem Ltd. | | | | | 56,748 | | | | 20,460,862 | |
LG Display Co. Ltd. | | | | | 20,440 | | | | 534,722 | |
LG Household & Health Care Ltd. | | | | | 16,948 | | | | 17,804,968 | |
Lotte Chemical Corp. | | | | | 234 | | | | 77,290 | |
POSCO | | | | | 50,499 | | | | 14,719,722 | |
Samsung Electronics Co. Ltd. | | | | | 913 | | | | 2,250,641 | |
SK Hynix, Inc. | | | | | 4,775 | | | | 352,074 | |
SK Innovation Co. Ltd. | | | | | 3,696 | | | | 677,997 | |
SK Telecom Co. Ltd. | | | | | 60,343 | | | | 14,245,768 | |
| | | | | | | | | | |
| | | | | | | | | 237,909,283 | |
| | | | | | | | | | | | |
| Security | | | | | Shares | | | Value | |
| Spain — 0.4% | |
Aena SME SA(c) | | | | | | | 8,763 | | | $ | 1,607,778 | |
CaixaBank SA | | | | | | | 68,443 | | | | 320,203 | |
Cellnex Telecom SAU(c) | | | | | | | 4,881,246 | | | | 121,162,109 | |
Gas Natural SDG SA | | | | | | | 1,206,903 | | | | 25,824,724 | |
Telefonica SA | | | | | | | 25,179 | | | | 264,014 | |
| | | | | | | | | | | | |
| | | | | | | | | | | 149,178,828 | |
| Sweden — 0.6% | |
Nordea Bank AB | | | | | | | 30,955 | | | | 374,082 | |
Skandinaviska Enskilda Banken AB, Class A | | | | | | | 29,611 | | | | 364,914 | |
SKF AB, Class B | | | | | | | 7,462,190 | | | | 173,412,568 | |
Svenska Handelsbanken AB, Class A | | | | | | | 4,325,098 | | | | 61,988,726 | |
Swedbank AB, Class A | | | | | | | 1,280 | | | | 31,767 | |
Volvo AB, Class B | | | | | | | 31,469 | | | | 623,283 | |
| | | | | | | | | | | | |
| | | | | | | | | | | 236,795,340 | |
| Switzerland — 1.2% | |
ABB Ltd., Registered Shares | | | | | | | 35,124 | | | | 917,264 | |
Nestle SA, Registered Shares | | | | | | | 3,050,502 | | | | 256,664,664 | |
Novartis AG, Registered Shares | | | | | | | 149,190 | | | | 12,305,076 | �� |
Roche Holding AG | | | | | | | 7,517 | | | | 1,737,412 | |
SGS SA, Registered Shares | | | | | | | 197 | | | | 486,500 | |
UBS Group AG, Registered Shares(a) | | | | | | | 10,987,826 | | | | 186,937,024 | |
Zurich Insurance Group AG | | | | | | | 3,775 | | | | 1,151,998 | |
| | | | | | | | | | | | |
| | | | | | | | | | | 460,199,938 | |
| Taiwan — 0.7% | |
Catcher Technology Co. Ltd. | | | | | | | 14,000 | | | | 149,001 | |
Cathay Financial Holding Co. Ltd. | | | | | | | 7,141,000 | | | | 11,799,918 | |
Cheng Shin Rubber Industry Co. Ltd. | | | | | | | 10,804,672 | | | | 21,326,275 | |
Chunghwa Telecom Co. Ltd. | | | | | | | 18,955,000 | | | | 64,735,049 | |
Far EasTone Telecommunications Co. Ltd. | | | | | | | 10,554,000 | | | | 24,780,894 | |
Formosa Chemicals & Fibre Corp. | | | | | | | 3,115,000 | | | | 9,463,416 | |
Formosa Petrochemical Corp. | | | | | | | 2,226,000 | | | | 7,792,268 | |
Formosa Plastics Corp. | | | | | | | 3,323,000 | | | | 10,130,057 | |
Fubon Financial Holding Co. Ltd. | | | | | | | 7,441,000 | | | | 11,858,790 | |
Hon Hai Precision Industry Co. Ltd. | | | | | | | 4,042,700 | | | | 15,026,485 | |
Innolux Corp. | | | | | | | 616,000 | | | | 269,996 | |
Nan Ya Plastics Corp. | | | | | | | 4,168,000 | | | | 10,285,840 | |
Pegatron Corp. | | | | | | | 571,000 | | | | 1,479,603 | |
Taiwan Cooperative Financial Holding Co. Ltd. | | | | | | | 650 | | | | 351 | |
Taiwan Mobile Co. Ltd. | | | | | | | 9,334,000 | | | | 33,277,766 | |
Taiwan Semiconductor Manufacturing Co. Ltd. | | | | | | | 1,638,000 | | | | 13,242,082 | |
Uni-President Enterprises Corp. | | | | | | | 8,046,000 | | | | 16,811,343 | |
| | | | | | | | | | | | |
| | | | | | | | | | | 252,429,134 | |
| Thailand — 0.2% | |
Advanced Info Service PCL, Foreign Registered Shares | | | | | | | 3,260,100 | | | | 19,087,581 | |
Intouch Holdings PCL | | | | | | | 8,059,800 | | | | 14,851,987 | |
PTT Global Chemical PCL, Foreign Registered Shares | | | | | | | 6,903,600 | | | | 16,625,166 | |
Siam Cement PCL, Foreign Registered Shares | | | | | | | 1,030,800 | | | | 15,201,353 | |
Thai Oil PCL — NVDR | | | | | | | 3,146,100 | | | | 9,659,910 | |
| | | | | | | | | | | | |
| | | | | | | | | | | 75,425,997 | |
| Turkey — 0.0% | |
KOC Holding AS | | | | | | | 34,080 | | | | 152,606 | |
Tupras Turkiye Petrol Rafinerileri AS | | | | | | | 4,389 | | | | 158,134 | |
Turkiye Garanti Bankasi AS | | | | | | | 97,908 | | | | 269,746 | |
Turkiye Halk Bankasi | | | | | | | 54,393 | | | | 158,897 | |
| | | | | | | | | | | | |
| | | | | | | | | | | 739,383 | |
| United Arab Emirates — 0.3% | |
NMC Health PLC | | | | | | | 3,391,795 | | | | 130,329,723 | |
| | | | | | | | | | | | |
| United Kingdom — 3.5% | |
Aon PLC | | | | | | | 3,611 | | | | 517,926 | |
| | | | |
| CONSOLIDATED SCHEDULE OF INVESTMENTS | | | 11 | |
| | |
Consolidated Schedule of Investments (continued) October 31, 2017 | | BlackRock Global Allocation Fund, Inc. (Percentages shown are based on Net Assets) |
| | | | | | | | | | |
| Security | | | | Shares | | | Value | |
| United Kingdom (continued) | |
Associated British Foods PLC | | | | | 8,818 | | | $ | 390,278 | |
Aviva PLC | | | | | 26,249 | | | | 176,090 | |
BAE Systems PLC | | | | | 7,003,537 | | | | 55,169,215 | |
Barclays PLC | | | | | 191,014 | | | | 471,367 | |
Berkeley Group Holdings PLC | | | | | 1,048,579 | | | | 52,099,792 | |
BP PLC | | | | | 5,065,139 | | | | 34,355,103 | |
BP PLC — ADR | | | | | 3,142,282 | | | | 127,796,609 | |
Centrica PLC | | | | | 167,064 | | | | 376,757 | |
Compass Group PLC | | | | | 1,681 | | | | 36,905 | |
Diageo PLC | | | | | 4,186 | | | | 142,947 | |
GlaxoSmithKline PLC | | | | | 9,021,784 | | | | 161,916,943 | |
GW Pharmaceuticals PLC, ADR(a)(b) | | | | | 230,877 | | | | 24,923,172 | |
HSBC Holdings PLC | | | | | 20,592,007 | | | | 201,083,378 | |
Imperial Brands PLC | | | | | 16,435 | | | | 670,080 | |
Legal & General Group PLC | | | | | 162,741 | | | | 577,010 | |
Liberty Global PLC, Class A(a) | | | | | 583,704 | | | | 18,007,268 | |
Liberty Global PLC, Class C(a) | | | | | 6,007 | | | | 179,549 | |
Lloyds Banking Group PLC | | | | | 1,385,443 | | | | 1,255,808 | |
Meggitt PLC | | | | | 6,891,463 | | | | 47,441,010 | |
National Grid PLC | | | | | 349,780 | | | | 4,210,470 | |
Prudential PLC | | | | | 4,975 | | | | 122,113 | |
Reckitt Benckiser Group PLC | | | | | 2,931 | | | | 262,227 | |
Rio Tinto PLC | | | | | 9,637 | | | | 455,451 | |
Royal Dutch Shell PLC — ADR, Class A | | | | | 2,709,691 | | | | 170,791,824 | |
Royal Dutch Shell PLC, Class A | | | | | 6,588 | | | | 207,389 | |
Royal Dutch Shell PLC, Class B | | | | | 40,419 | | | | 1,301,381 | |
Royal Dutch Shell PLC, A Shares | | | | | 3,613,458 | | | | 113,779,660 | |
Smiths Group PLC | | | | | 2,824,922 | | | | 58,944,493 | |
Spire Healthcare Group PLC(c) | | | | | 4,430,188 | | | | 17,480,040 | |
SSE PLC | | | | | 27,964 | | | | 513,584 | |
TechnipFMC PLC(a) | | | | | 16,657 | | | | 456,235 | |
Vodafone Group PLC | | | | | 70,833,226 | | | | 202,606,995 | |
Vodafone Group PLC — ADR | | | | | 1,905,638 | | | | 55,225,389 | |
| | | | | | | | | | |
| | | | | | | | | 1,353,944,458 | |
| United States — 29.2% | |
3M Co. | | | | | 24,632 | | | | 5,670,040 | |
AbbVie, Inc. | | | | | 75,550 | | | | 6,818,387 | |
Acadia Healthcare Co., Inc.(a)(b) | | | | | 1,717,744 | | | | 53,868,452 | |
Accenture PLC, Class A | | | | | 48,785 | | | | 6,945,033 | |
Activision Blizzard, Inc. | | | | | 937,875 | | | | 61,421,434 | |
Adobe Systems, Inc.(a) | | | | | 53,238 | | | | 9,325,168 | |
Aetna, Inc.(u) | | | | | 1,254,810 | | | | 213,355,344 | |
Agilent Technologies, Inc. | | | | | 5,413 | | | | 368,246 | |
Air Products & Chemicals, Inc. | | | | | 1,438,615 | | | | 229,358,389 | |
Alliance Data Systems Corp. | | | | | 14,949 | | | | 3,344,540 | |
Allstate Corp. | | | | | 994,084 | | | | 93,304,724 | |
Alphabet, Inc., Class A(a) | | | | | 2,475 | | | | 2,556,774 | |
Alphabet, Inc., Class C(a) | | | | | 391,376 | | | | 397,888,497 | |
Altria Group, Inc. | | | | | 6,664 | | | | 427,962 | |
Amazon.com, Inc.(a)(u) | | | | | 342,454 | | | | 378,507,557 | |
Amdocs Ltd. | | | | | 105,745 | | | | 6,883,999 | |
American Express Co. | | | | | 3,775 | | | | 360,588 | |
American International Group, Inc. | | | | | 44,812 | | | | 2,895,303 | |
American Tower Corp. | | | | | 58,801 | | | | 8,447,980 | |
Ameriprise Financial, Inc. | | | | | 31,573 | | | | 4,942,437 | |
Amgen, Inc. | | | | | 52,365 | | | | 9,175,395 | |
Anadarko Petroleum Corp. | | | | | 2,956,993 | | | | 145,986,744 | |
Anthem, Inc. | | | | | 534,445 | | | | 111,811,238 | |
Apple, Inc.(u) | | | | | 2,563,227 | | | | 433,287,892 | |
Applied Materials, Inc. | | | | | 17,135 | | | | 966,928 | |
Archer-Daniels-Midland Co. | | | | | 9,616 | | | | 393,006 | |
AT&T, Inc. | | | | | 23,504 | | | | 790,910 | |
Automatic Data Processing, Inc. | | | | | 1,477 | | | | 171,716 | |
Axalta Coating Systems Ltd.(a) | | | | | 3,820,868 | | | | 127,043,861 | |
| | | | | | | | | | |
| Security | | | | Shares | | | Value | |
| United States (continued) | |
Axis Capital Holdings Ltd. | | | | | 78,819 | | | $ | 4,286,965 | |
Bank of America Corp. | | | | | 13,785,338 | | | | 377,580,408 | |
Bank of New York Mellon Corp. | | | | | 72,156 | | | | 3,712,426 | |
Baxter International, Inc. | | | | | 301,832 | | | | 19,459,109 | |
Berkshire Hathaway, Inc., Class B(a) | | | | | 861,036 | | | | 160,962,070 | |
Biogen, Inc.(a) | | | | | 57,710 | | | | 17,985,899 | |
Boeing Co. | | | | | 35,741 | | | | 9,220,463 | |
Bristol-Myers Squibb Co. | | | | | 2,068 | | | | 127,513 | |
CA, Inc. | | | | | 28,387 | | | | 919,171 | |
Campbell Soup Co. | | | | | 1,280 | | | | 60,634 | |
Capital One Financial Corp. | | | | | 55,506 | | | | 5,116,543 | |
Cardinal Health, Inc. | | | | | 38,357 | | | | 2,374,298 | |
Carnival Corp. | | | | | 15,921 | | | | 1,056,995 | |
Caterpillar, Inc. | | | | | 4,828 | | | | 655,642 | |
Celgene Corp.(a) | | | | | 6,894 | | | | 696,087 | |
CenterPoint Energy, Inc. | | | | | 79,989 | | | | 2,366,075 | |
Charles Schwab Corp. | | | | | 1,712,446 | | | | 76,786,079 | |
Charter Communications, Inc., Class A(a) | | | | | 305,928 | | | | 102,231,960 | |
Chevron Corp. | | | | | 28,521 | | | | 3,305,299 | |
Chubb Ltd. | | | | | 889,359 | | | | 134,133,124 | |
Cisco Systems, Inc. | | | | | 1,461 | | | | 49,893 | |
Citigroup, Inc. | | | | | 3,031,444 | | | | 222,811,134 | |
Cloudera, Inc.(a)(b) | | | | | 3,713,367 | | | | 56,183,243 | |
Coca-Cola Co. | | | | | 12,119 | | | | 557,232 | |
Colgate-Palmolive Co. | | | | | 182,249 | | | | 12,839,442 | |
Comcast Corp., Class A | | | | | 7,373,784 | | | | 265,677,437 | |
CommScope Holding Co., Inc.(a)(b) | | | | | 3,324,329 | | | | 106,843,934 | |
Conagra Brands, Inc. | | | | | 40,244 | | | | 1,374,735 | |
ConocoPhillips | | | | | 2,068 | | | | 105,778 | |
Constellation Brands, Inc., Class A | | | | | 33,733 | | | | 7,390,563 | |
Corning, Inc. | | | | | 16,282 | | | | 509,789 | |
Costco Wholesale Corp. | | | | | 2,174 | | | | 350,188 | |
Crown Holdings, Inc.(a) | | | | | 76,686 | | | | 4,614,197 | |
Cummins, Inc. | | | | | 17,794 | | | | 3,147,403 | |
CVS Health Corp. | | | | | 1,458,720 | | | | 99,966,082 | |
Deere & Co. | | | | | 1,247 | | | | 165,701 | |
Dell Technologies, Inc., Class V(a) | | | | | 3,036 | | | | 251,290 | |
Delta Air Lines, Inc. | | | | | 65,417 | | | | 3,272,812 | |
Devon Energy Corp. | | | | | 1,510 | | | | 55,719 | |
Discover Financial Services | | | | | 68,086 | | | | 4,529,762 | |
DISH Network Corp., Class A(a)(b) | | | | | 811,671 | | | | 39,398,510 | |
Dominion Energy, Inc. | | | | | 205,151 | | | | 16,645,952 | |
DowDuPont, Inc. | | | | | 4,357,683 | | | | 315,104,058 | |
Eaton Corp. PLC | | | | | 12,513 | | | | 1,001,290 | |
eBay, Inc.(a) | | | | | 32,307 | | | | 1,216,035 | |
Edgewell Personal Care Co.(a) | | | | | 1,837,316 | | | | 119,296,928 | |
Electronic Arts, Inc.(a) | | | | | 577,194 | | | | 69,032,402 | |
EQT Corp.(b) | | | | | 915,070 | | | | 57,228,478 | |
Equity Residential | | | | | 10,734 | | | | 721,969 | |
Expedia, Inc. | | | | | 203,691 | | | | 25,392,120 | |
Express Scripts Holding Co.(a) | | | | | 31,513 | | | | 1,931,432 | |
Exxon Mobil Corp. | | | | | 32,637 | | | | 2,720,294 | |
Facebook, Inc., Class A(a) | | | | | 1,444,103 | | | | 260,025,186 | |
Fifth Third Bancorp | | | | | 99,034 | | | | 2,862,083 | |
FirstEnergy Corp. | | | | | 3,828 | | | | 126,133 | |
FleetCor Technologies, Inc.(a) | | | | | 243,822 | | | | 40,296,462 | |
Ford Motor Co. | | | | | 41,263 | | | | 506,297 | |
Fortune Brands Home & Security, Inc. | | | | | 1,294,697 | | | | 85,527,684 | |
Franklin Resources, Inc. | | | | | 6,060 | | | | 255,308 | |
General Dynamics Corp. | | | | | 30,028 | | | | 6,095,083 | |
General Electric Co. | | | | | 8,822,159 | | | | 177,854,725 | |
Gilead Sciences, Inc. | | | | | 2,325,767 | | | | 174,339,494 | |
Global Payments, Inc. | | | | | 620,580 | | | | 64,509,291 | |
Goldman Sachs Group, Inc. | | | | | 443,260 | | | | 107,481,685 | |
Goodyear Tire & Rubber Co. | | | | | 70,771 | | | | 2,164,885 | |
| | |
| 12 | | 2017 BLACKROCK ANNUAL REPORTTO SHAREHOLDERS |
| | |
Consolidated Schedule of Investments (continued) October 31, 2017 | | BlackRock Global Allocation Fund, Inc. (Percentages shown are based on Net Assets) |
| | | | | | | | | | |
| Security | | | | Shares | | | Value | |
| United States (continued) | |
Halliburton Co. | | | | | 14,128 | | | $ | 603,831 | |
Hartford Financial Services Group, Inc. | | | | | 215,407 | | | | 11,858,155 | |
HCA Healthcare, Inc.(a) | | | | | 2,176,813 | | | | 164,675,903 | |
HCP, Inc. | | | | | 30,891 | | | | 798,223 | |
Helmerich & Payne, Inc. | | | | | 58,766 | | | | 3,191,581 | |
Hewlett Packard Enterprise Co. | | | | | 19,867 | | | | 276,549 | |
Home Depot, Inc. | | | | | 531,522 | | | | 88,115,717 | |
Honeywell International, Inc. | | | | | 1,910 | | | | 275,346 | |
HP, Inc. | | | | | 65,620 | | | | 1,414,111 | |
Humana, Inc. | | | | | 694 | | | | 177,213 | |
Illinois Tool Works, Inc. | | | | | 34,534 | | | | 5,405,262 | |
Illumina, Inc.(a) | | | | | 919 | | | | 188,570 | |
Ingersoll-Rand PLC | | | | | 4,169 | | | | 369,373 | |
Intel Corp. | | | | | 176,071 | | | | 8,009,470 | |
International Business Machines Corp. | | | | | 137,989 | | | | 21,258,585 | |
International Paper Co. | | | | | 106,276 | | | | 6,086,426 | |
Intuit, Inc. | | | | | 53,318 | | | | 8,052,084 | |
Jawbone Health Hub, Inc.,
(Acquired 1/24/17, Cost $0)(a)(e)(f) | | | | | 1,518,232 | | | | 2,070,261 | |
Johnson & Johnson | | | | | 123,682 | | | | 17,242,508 | |
JPMorgan Chase & Co. | | | | | 1,681,156 | | | | 169,141,105 | |
Kansas City Southern | | | | | 1,324,894 | | | | 138,080,453 | |
Kimberly-Clark Corp. | | | | | 5,663 | | | | 637,144 | |
Kinder Morgan, Inc. | | | | | 18,054 | | | | 326,958 | |
KLA-Tencor Corp. | | | | | 54,749 | | | | 5,961,619 | |
Kroger Co. | | | | | 6,138 | | | | 127,057 | |
Lam Research Corp. | | | | | 889 | | | | 185,419 | |
Las Vegas Sands Corp. | | | | | 24,127 | | | | 1,529,169 | |
Lear Corp. | | | | | 31,181 | | | | 5,475,072 | |
Liberty Broadband Corp., Class A(a) | | | | | 248,373 | | | | 21,412,236 | |
Liberty Broadband Corp., Class C(a) | | | | | 606,683 | | | | 52,957,359 | |
Liberty Media Corp. — Liberty SiriusXM, Class A(a) | | | | | 890,637 | | | | 37,148,469 | |
Liberty Media Corp. — Liberty SiriusXM, Class C(a) | | | | | 1,492,392 | | | | 62,158,127 | |
Lookout, Inc., (Acquired 3/04/15, cost $2,096,082)(a)(e)(f) | | | | | 183,495 | | | | 187,165 | |
Lowe’s Cos., Inc. | | | | | 2,480,081 | | | | 198,282,476 | |
LyondellBasell Industries NV, Class A | | | | | 6,356 | | | | 658,037 | |
ManpowerGroup, Inc. | | | | | 28,617 | | | | 3,527,904 | |
Marathon Oil Corp. | | | | | 6,326,969 | | | | 89,969,499 | |
Marathon Petroleum Corp. | | | | | 3,460,105 | | | | 206,706,673 | |
Marsh & McLennan Cos., Inc. | | | | | 977,431 | | | | 79,103,491 | |
Masco Corp. | | | | | 2,150,540 | | | | 85,634,503 | |
Mastercard, Inc., Class A | | | | | 539,205 | | | | 80,217,528 | |
McDonald’s Corp. | | | | | 58,689 | | | | 9,795,781 | |
McKesson Corp. | | | | | 31,159 | | | | 4,296,203 | |
Merck & Co., Inc. | | | | | 11,419 | | | | 629,073 | |
MetLife, Inc. | | | | | 1,932,062 | | | | 103,519,882 | |
Michael Kors Holdings Ltd.(a) | | | | | 2,373,870 | | | | 115,868,595 | |
Micron Technology, Inc.(a) | | | | | 20,451 | | | | 906,184 | |
Microsoft Corp. | | | | | 8,260,345 | | | | 687,095,497 | |
Mohawk Industries, Inc.(a) | | | | | 376,261 | | | | 98,490,079 | |
Mondelez International, Inc., Class A | | | | | 343,758 | | | | 14,241,894 | |
Monsanto Co. | | | | | 11,527 | | | | 1,395,920 | |
Moody’s Corp. | | | | | 7,169 | | | | 1,020,937 | |
Morgan Stanley | | | | | 4,537,728 | | | | 226,886,400 | |
Motorola Solutions, Inc. | | | | | 2,331 | | | | 211,049 | |
NextEra Energy Partners LP | | | | | 1,331,767 | | | | 52,391,714 | |
NextEra Energy, Inc. | | | | | 1,254,560 | | | | 194,544,619 | |
Norfolk Southern Corp. | | | | | 2,199 | | | | 288,993 | |
Northern Trust Corp. | | | | | 5,022 | | | | 469,657 | |
Northrop Grumman Corp. | | | | | 24,957 | | | | 7,375,542 | |
O’Reilly Automotive, Inc.(a) | | | | | 683,816 | | | | 144,250,985 | |
ONEOK, Inc. | | | | | 5,533 | | | | 300,276 | |
Ocean Rig UDW, Inc.(a) | | | | | 667,003 | | | | 17,862,340 | |
Oracle Corp. | | | | | 36,339 | | | | 1,849,655 | |
| | | | | | | | | | | | |
| Security | | | | | Shares | | | Value | |
| United States (continued) | |
PACCAR, Inc. | | | | | | | 3,512 | | | $ | 251,916 | |
Packaging Corp. of America | | | | | | | 63,753 | | | | 7,412,561 | |
PepsiCo, Inc. | | | | | | | 147,820 | | | | 16,294,199 | |
Perrigo Co. PLC | | | | | | | 1,100,782 | | | | 89,152,334 | |
Pfizer, Inc. | | | | | | | 7,155,386 | | | | 250,867,833 | |
PG&E Corp. | | | | | | | 3,315 | | | | 191,508 | |
Philip Morris International, Inc. | | | | | | | 16,401 | | | | 1,716,201 | |
Phillips 66 | | | | | | | 58,014 | | | | 5,283,915 | |
Pioneer Natural Resources Co. | | | | | | | 575,140 | | | | 86,081,204 | |
Praxair, Inc. | | | | | | | 2,437 | | | | 356,094 | |
Priceline Group, Inc.(a) | | | | | | | 14,442 | | | | 27,612,526 | |
Procter & Gamble Co. | | | | | | | 18,612 | | | | 1,606,960 | |
Prudential Financial, Inc. | | | | | | | 55,120 | | | | 6,088,555 | |
Pure Storage, Inc., Class A(a) | | | | | | | 4,305,334 | | | | 70,736,638 | |
PVH Corp. | | | | | | | 23,641 | | | | 2,997,915 | |
QUALCOMM, Inc. | | | | | | | 5,176,254 | | | | 264,040,717 | |
Ralph Lauren Corp. | | | | | | | 597,307 | | | | 53,417,165 | |
Raytheon Co. | | | | | | | 29,684 | | | | 5,349,057 | |
Reinsurance Group of America, Inc. | | | | | | | 45,652 | | | | 6,819,496 | |
Republic Services, Inc. | | | | | | | 11,658 | | | | 758,586 | |
Rockwell Automation, Inc. | | | | | | | 26,475 | | | | 5,316,709 | |
Royal Caribbean Cruises Ltd. | | | | | | | 29,269 | | | | 3,622,624 | |
S&P Global, Inc. | | | | | | | 2,462 | | | | 385,229 | |
Sabre Corp. | | | | | | | 342,832 | | | | 6,705,794 | |
Schlumberger Ltd. | | | | | | | 876,588 | | | | 56,101,632 | |
Sempra Energy | | | | | | | 657,390 | | | | 77,243,325 | |
Snap, Inc., Class A(a)(b) | | | | | | | 2,879,170 | | | | 44,166,468 | |
St. Joe Co.(a)(v) | | | | | | | 4,900,721 | | | | 87,232,834 | |
Starbucks Corp. | | | | | | | 5,154 | | | | 282,645 | |
State Street Corp. | | | | | | | 15,351 | | | | 1,412,292 | |
Stryker Corp. | | | | | | | 20,837 | | | | 3,227,026 | |
SunTrust Banks, Inc. | | | | | | | 969,032 | | | | 58,345,417 | |
Symantec Corp. | | | | | | | 2,954 | | | | 96,005 | |
Target Corp. | | | | | | | 1,197,614 | | | | 70,707,131 | |
Tenet Healthcare Corp.(a)(b) | | | | | | | 2,941,993 | | | | 42,011,660 | |
TESARO, Inc.(a)(b) | | | | | | | 302,946 | | | | 35,072,058 | |
Texas Instruments, Inc. | | | | | | | 12,441 | | | | 1,202,920 | |
Thermo Fisher Scientific, Inc. | | | | | | | 70,125 | | | | 13,592,329 | |
Travelers Cos., Inc. | | | | | | | 113,388 | | | | 15,018,241 | |
TripAdvisor, Inc.(a)(b) | | | | | | | 1,456,250 | | | | 54,609,375 | |
Tyson Foods, Inc., Class A | | | | | | | 49,913 | | | | 3,639,157 | |
Union Pacific Corp. | | | | | | | 6,183 | | | | 715,930 | |
United Continental Holdings, Inc.(a) | | | | | | | 2,609,685 | | | | 152,614,379 | |
United Rentals, Inc.(a) | | | | | | | 42,781 | | | | 6,052,656 | |
United Technologies Corp. | | | | | | | 9,353 | | | | 1,120,115 | |
UnitedHealth Group, Inc. | | | | | | | 93,587 | | | | 19,673,859 | |
Unum Group | | | | | | | 836,905 | | | | 43,552,536 | |
Valero Energy Corp. | | | | | | | 127,987 | | | | 10,096,894 | |
VeriFone Systems, Inc.(a)(b) | | | | | | | 1,640,162 | | | | 31,294,291 | |
VeriSign, Inc.(a)(b) | | | | | | | 64,047 | | | | 6,886,333 | |
Verizon Communications, Inc. | | | | | | | 3,633,215 | | | | 173,922,002 | |
Visa, Inc., Class A | | | | | | | 673,091 | | | | 74,026,548 | |
Vistra Energy Corp. | | | | | | | 1,011,006 | | | | 19,653,957 | |
VMware, Inc., Class A(a)(b) | | | | | | | 569,088 | | | | 68,114,143 | |
WABCO Holdings, Inc.(a) | | | | | | | 33,026 | | | | 4,873,647 | |
Wal-Mart Stores, Inc. | | | | | | | 3,873 | | | | 338,152 | |
Walgreens Boots Alliance, Inc. | | | | | | | 14,542 | | | | 963,698 | |
Waste Management, Inc. | | | | | | | 12,934 | | | | 1,062,787 | |
Wells Fargo & Co. | | | | | | | 6,685 | | | | 375,296 | |
Western Digital Corp. | | | | | | | 36,687 | | | | 3,275,048 | |
WestRock Co. | | | | | | | 1,068,917 | | | | 65,556,680 | |
Weyerhaeuser Co. | | | | | | | 14,589 | | | | 523,891 | |
Williams Cos., Inc. | | | | | | | 5,522,059 | | | | 157,378,681 | |
Williams-Sonoma, Inc. | | | | | | | 1,112,731 | | | | 57,416,920 | |
Wyndham Worldwide Corp. | | | | | | | 65,407 | | | | 6,988,738 | |
| | | | |
| CONSOLIDATED SCHEDULE OF INVESTMENTS | | | 13 | |
| | |
Consolidated Schedule of Investments (continued) October 31, 2017 | | BlackRock Global Allocation Fund, Inc. (Percentages shown are based on Net Assets) |
| | | | | | | | | | | | |
| Security | | | | | Shares | | | Value | |
| United States (continued) | |
Wynn Resorts Ltd. | | | | | | | 37,510 | | | $ | 5,532,350 | |
Yum China Holdings, Inc.(a) | | | | | | | 5,842 | | | | 235,725 | |
Zimmer Biomet Holdings, Inc. | | | | | | | 1,206,874 | | | | 146,780,016 | |
| | | | | | | | | | | | |
| | | | | | | | | | | 11,401,024,851 | |
| | | | | | | | |
Total Common Stocks — 56.6% | | | | 22,029,410,175 | |
| | | | | | | | |
|
Corporate Bonds | |
|
| Australia — 0.2% | |
Quintis Ltd., 8.75%, 8/01/23(c)(g) | | | USD | | | | 120,610 | | | | 84,427,000 | |
| | | | | | | | |
| Brazil — 0.0% | |
Odebrecht Finance Ltd., 4.38%, 4/25/25(c) | | | | | | | 21,269 | | | | 8,082,220 | |
| | | | | | | | |
| Chile — 0.0% | |
Inversiones Alsacia SA, 8.00%, 12/31/18(a)(c)(g) | | | | | | | 34,787 | | | | 869,680 | |
| | | | | | | | |
| China — 0.0% | |
China Milk Products Group Ltd., 0.00%, 1/05/12(a)(e)(g)(h)(i) | | | | | | | 39,500 | | | | 197,500 | |
| | | | | | | | |
| France — 0.1% | |
Danone SA, 2.59%, 11/02/23(c) | | | | | | | 29,684 | | | | 29,159,222 | |
| | | | | | | | |
| Germany — 0.2% | |
Bayer Capital Corp. BV, 5.63%, 11/22/19(c)(i) | | | EUR | | | | 59,300 | | | | 82,458,968 | |
Unitymedia Hessen GmbH & Co. KG/Unitymedia NRW GmbH, 5.50%, 1/15/23(c) | | | USD | | | | 12,406 | | | | 12,746,754 | |
| | | | | | | | | | | | |
| | | | | | | | | | | 95,205,722 | |
| India — 0.0% | |
REI Agro Ltd., 5.50%, 11/13/17(a)(e)(g)(i) | | | | | | | 54,787 | | | | 5 | |
| | | | | | | | |
| Italy — 0.1% | |
Telecom Italia SpA, 5.30%, 5/30/24(c) | | | | | | | 26,823 | | | | 28,901,783 | |
| | | | | | | | |
| Luxembourg — 0.1% | |
Actavis Funding SCS, 3.45%, 3/15/22 | | | | | | | 27,962 | | | | 28,712,888 | |
Intelsat Jackson Holdings SA: | | | | | | | | | | | | |
7.50%, 4/01/21 | | | | | | | 24,262 | | | | 22,988,245 | |
8.00%, 2/15/24 (c) | | | | | | | 8,522 | | | | 9,033,320 | |
| | | | | | | | | | | | |
| | | | | | | | | | | 60,734,453 | |
| Mexico — 0.3% | |
Petroleos Mexicanos: | | | | | | | | | | | | |
(3 mo. LIBOR US + 3.65%), 4.97%, 3/11/22(c)(j) | | | | | | | 32,239 | | | | 35,140,510 | |
4.63%, 9/21/23 | | | | | | | 70,540 | | | | 72,127,150 | |
Trust F/1401, 5.25%, 12/15/24(c) | | | | | | | 12,400 | | | | 13,237,000 | |
| | | | | | | | | | | | |
| | | | | | | | | | | 120,504,660 | |
| Netherlands — 0.3% | |
Bio City Development Co. BV, 8.00%, 7/06/18(a)(c)(e)(g)(v) | | | | | | | 140,850 | | | | 36,860,445 | |
Cooperatieve Rabobank UA, 3.95%, 11/09/22 | | | | | | | 8,259 | | | | 8,711,674 | |
Petrobras Global Finance BV: | | | | | | | | | | | | |
6.13%, 1/17/22 | | | | | | | 26,895 | | | | 29,073,495 | |
7.38%, 1/17/27 | | | | | | | 31,333 | | | | 34,795,297 | |
| | | | | | | | | | | | |
| | | | | | | | | | | 109,440,911 | |
| Singapore — 0.1% | |
CapitaLand Ltd., 1.95%, 10/17/23(c) | | | SGD | | | | 35,000 | | | | 26,755,190 | |
| | | | | | | | |
| Switzerland — 0.1% | |
UBS Group Funding Switzerland AG, 4.13%, 9/24/25(c) | | | USD | | | | 20,186 | | | | 21,289,983 | |
| | | | | | | | |
| United Arab Emirates — 0.2% | |
Dana Gas Sukuk Ltd., 7.00%, 10/31/17(a)(c)(g)(i) | | | USD | | | | 86,375 | | | | 68,581,956 | |
| | | | | | | | |
| | | | | | | | | | | | |
| Security | | | | | Shares | | | Value | |
| United States — 2.0% | |
Activision Blizzard, Inc., 2.30%, 9/15/21 | | | | | | | 7,649 | | | $ | 7,546,389 | |
AliphCom(a)(e)(f)(g)(i): | | | | | | | | | | | | |
(Acquired 11/11/15, cost $11,493,000), 15.00%, 4/28/20 | | | | | | | 11,493 | | | | 99,989 | |
(Acquired 4/27/15 — 7/21/15, cost $204,855,000), 15.00%, 4/28/20 | | | | | | | 204,855 | | | | 1,782,239 | |
Ally Financial, Inc., 3.50%, 1/27/19 | | | | | | | 17,849 | | | | 18,066,758 | |
Apple, Inc.: | | | | | | | | | | | | |
3.35%, 2/09/27 | | | | | | | 49,337 | | | | 50,625,462 | |
3.20%, 5/11/27 | | | | | | | 47,407 | | | | 48,117,363 | |
AT&T, Inc.: | | | | | | | | | | | | |
3.00%, 6/30/22 | | | | | | | 58,958 | | | | 59,670,864 | |
2.85%, 2/14/23 | | | | | | | 43,328 | | | | 43,034,250 | |
3.40%, 8/14/24 | | | | | | | 70,382 | | | | 70,325,050 | |
Bank of America Corp.: | | | | | | | | | | | | |
3.30%, 1/11/23 | | | | | | | 32,504 | | | | 33,296,683 | |
4.00%, 1/22/25 | | | | | | | 15,102 | | | | 15,640,896 | |
Becton Dickinson & Co.: | | | | | | | | | | | | |
3.13%, 11/08/21 | | | | | | | 29,124 | | | | 29,765,087 | |
2.89%, 6/06/22 | | | | | | | 24,015 | | | | 24,068,710 | |
3.36%, 6/06/24 | | | | | | | 12,584 | | | | 12,688,708 | |
Citigroup, Inc.: | | | | | | | | | | | | |
2.70%, 3/30/21 | | | | | | | 29,067 | | | | 29,321,513 | |
2.90%, 12/08/21 | | | | | | | 13,366 | | | | 13,509,090 | |
eBay, Inc., 3.80%, 3/09/22 | | | | | | | 14,531 | | | | 15,210,059 | |
Edgewell Personal Care Co.: | | | | | | | | | | | | |
4.70%, 5/19/21 | | | | | | | 15,982 | | | | 16,861,010 | |
4.70%, 5/24/22 | | | | | | | 14,893 | | | | 15,823,812 | |
Forest Laboratories LLC, 5.00%, 12/15/21(c) | | | | | | | 14,215 | | | | 15,430,958 | |
General Motors Financial Co., Inc., 3.45%, 4/10/22 | | | | | | | 12,099 | | | | 12,369,247 | |
Hughes Satellite Systems Corp., 7.63%, 6/15/21 | | | | | | | 4,968 | | | | 5,551,740 | |
JPMorgan Chase & Co.: | | | | | | | | | | | | |
4.35%, 8/15/21 | | | | | | | 12,267 | | | | 13,110,591 | |
(3 mo. LIBOR US + 1.00%), 2.36%, 1/15/23(j) | | | | | | | 32,732 | | | | 33,092,548 | |
Santander Holdings USA, Inc., 3.70%, 3/28/22(c) | | | | | | | 8,170 | | | | 8,359,426 | |
Sherwin-Williams Co., 2.75%, 6/01/22 | | | | | | | 10,469 | | | | 10,533,508 | |
Synchrony Financial, 3.75%, 8/15/21 | | | | | | | 8,436 | | | | 8,726,320 | |
Verizon Communications, Inc.: | | | | | | | | | | | | |
3.13%, 3/16/22 | | | | | | | 141,123 | | | | 144,199,177 | |
2.63%, 8/15/26 | | | | | | | 13,931 | | | | 13,140,282 | |
| | | | | | | | |
| | | | | | | | | | | 769,967,729 | |
| | | | | | | | |
Total Corporate Bonds — 3.7% | | | | 1,424,118,014 | |
| | | | | | | | |
|
Floating Rate Loan Interests(k) | |
|
| United States — 0.5% | |
Fieldwood Energy LLC: | | | | | | | | | | | | |
1st Lien Last Out Term Loan, (3 mo. LIBOR + 7.12%), 8.45%, 9/30/20 | | | | | | | 15,642 | | | | 11,053,922 | |
1st Lien Term Loan, (3 mo. LIBOR + 7.00%, 1.00% Floor), 8.33%, 8/31/20 | | | | | | | 11,587 | | | | 10,457,146 | |
2nd Lien Term Loan, (3 mo. LIBOR + 7.12%), 8.45%, 9/30/20 | | | | | | | 26,326 | | | | 9,411,687 | |
Hilton Worldwide Finance LLC, Term Loan B2, (1 mo. LIBOR + 2.00%), 3.24%, 10/25/23 | | | | | | | 54,710 | | | | 55,052,171 | |
Neiman Marcus Group, Inc., 2020 Term Loan, (1 mo. LIBOR + 3.25%, 1.00% Floor), 4.49%, 10/25/20 | | | | | | | 11,961 | | | | 9,376,954 | |
Seadrill Partners Finco LLC, Term Loan B, (3 mo. LIBOR + 3.00%, 1.00% Floor), 4.33%, 2/21/21 | | | | | | | 54,131 | | | | 41,061,973 | |
Sheridan Investment Partners II LP: | | | | | | | | | | | | |
Term Loan A, (3 mo. LIBOR + 3.50%), 4.82%, 12/16/20 | | | USD | | | | 61,204 | | | | 51,411,114 | |
| | |
| 14 | | 2017 BLACKROCK ANNUAL REPORTTO SHAREHOLDERS |
| | |
Consolidated Schedule of Investments (continued) October 31, 2017 | | BlackRock Global Allocation Fund, Inc. (Percentages shown are based on Net Assets) |
| | | | | | | | | | | | |
| Security | | | | | Shares | | | Value | |
| United States (continued) | |
Term Loan B, (3 mo. LIBOR + 3.50%), 4.82%, 12/16/20 | | | | | | | 3,175 | | | $ | 2,667,134 | |
Term Loan M, (3 mo. LIBOR + 3.50%), 4.82%, 12/16/20 | | | | | | | 8,514 | | | | 7,151,667 | |
| | | | | | | | |
Total Floating Rate Loan Interests — 0.5% | | | | 197,643,768 | |
| | | | | | | | |
|
Foreign Agency Obligations | |
|
| Argentina — 0.7% | |
Argentine Republic Government International Bond: | | | | | | | | | | | | |
6.88%, 4/22/21 | | | | | | | 36,038 | | | | 39,281,420 | |
5.63%, 1/26/22 | | | | | | | 73,052 | | | | 76,704,600 | |
7.50%, 4/22/26 | | | | | | | 67,784 | | | | 76,595,920 | |
6.88%, 1/26/27 | | | | | | | 47,049 | | | | 51,283,410 | |
Republic of Argentina, 3.88%, 1/15/22 | | | EUR | | | | 19,363 | | | | 23,312,828 | |
| | | | | | | | | | | | |
| | | | | | | | | | | 267,178,178 | |
| Australia — 2.0% | |
Australia Government Bond: | | | | | | | | | | | | |
5.75%, 5/15/21 | | | AUD | | | | 176,906 | | | | 152,481,422 | |
2.75%, 4/21/24 | | | | | | | 473,682 | | | | 369,845,455 | |
3.00%, 3/21/47 | | | | | | | 118,878 | | | | 83,476,777 | |
Series 133, 5.50%, 4/21/23 | | | | | | | 197,811 | | | | 176,252,860 | |
| | | | | | | | | | | | |
| | | | | | | | | | | 782,056,514 | |
| Brazil — 1.7% | |
Brazil Notas do Tesouro Nacional: | | | | | | | | | | | | |
Series B, 6.00%, 8/15/22 | | | BRL | | | | 111 | | | | 109,462,983 | |
Series F, 10.00%, 1/01/23 | | | | | | | 658 | | | | 204,770,876 | |
Series F, 10.00%, 1/01/27 | | | | | | | 476 | | | | 146,614,360 | |
Brazilian Government International Bond: | | | | | | | | | | | | |
4.63%, 1/13/28 | | | USD | | | | 100,574 | | | | 99,869,982 | |
5.00%, 1/27/45 | | | | | | | 73,010 | | | | 67,562,236 | |
5.63%, 2/21/47 | | | | | | | 27,704 | | | | 28,230,376 | |
| | | | | | | | | | | | |
| | | | | | | | | | | 656,510,813 | |
| Canada — 1.0% | |
Canadian Government Bond: | | | | | | | | | | | | |
0.50%, 8/01/18 | | | CAD | | | | 380,119 | | | | 293,093,228 | |
0.75%, 3/01/21 | | | | | | | 94,879 | | | | 71,762,678 | |
| | | | | | | | | | | | |
| | | | | | | | | | | 364,855,906 | |
| Germany — 0.5% | |
Bundesrepublik Deutschland, 0.00%, 8/15/26 | | | EUR | | | | 168,606 | | | | 192,929,548 | |
| | | | | | | | |
| Hungary — 0.2% | |
Hungary Government International Bond, 6.38%, 3/29/21 | | | USD | | | | 81,410 | | | | 91,077,438 | |
| | | | | | | | |
| Indonesia — 0.1% | |
Indonesia Government International Bond: | | | | | | | | | | | | |
4.88%, 5/05/21 | | | | | | | 9,336 | | | | 10,036,667 | |
3.70%, 1/08/22(c) | | | | | | | 13,396 | | | | 13,904,231 | |
| | | | | | | | | | | | |
| | | | | | | | | | | 23,940,898 | |
| Italy — 0.2% | |
Italy Buoni Poliennali Del Tesoro, 1.85%, 5/15/24 | | | EUR | | | | 49,555 | | | | 60,304,154 | |
| | | | | | | | |
| Japan — 1.1% | |
Japan Government Bond: | | | | | | | | | | | | |
0.10%, 3/15/18 | | | JPY | | | | 26,525,200 | | | | 233,497,810 | |
0.10%, 10/15/18 | | | | | | | 24,956,150 | | | | 220,028,062 | |
| | | | | | | | | | | | |
| | | | | | | | | | | 453,525,872 | |
| Mexico — 0.7% | |
Mexican Bonos: | | | | | | | | | | | | |
8.50%, 12/13/18 | | | MXN | | | | 27,236 | | | | 144,116,873 | |
6.50%, 6/09/22 | | | | | | | 26,610 | | | | 135,766,874 | |
| | | | | | | | | | | | |
| | | | | | | | | | | 279,883,747 | |
| | | | | | | | | | | | |
| Security | | | | | Shares | | | Value | |
| New Zealand — 0.4% | |
New Zealand Government Bond, 6.00%, 5/15/21 | | | NZD | | | | 215,038 | | | $ | 166,245,530 | |
| | | | | | | | |
| Poland — 1.2% | |
Poland Government Bond: | | | | | | | | | | | | |
3.25%, 7/25/25 | | | PLN | | | | 354,526 | | | | 97,349,891 | |
2.50%, 7/25/26 | | | | | | | 356,739 | | | | 91,577,335 | |
2.50%, 7/25/27 | | | | | | | 1,160,308 | | | | 294,256,876 | |
Poland Government International Bond, 5.00%, 3/23/22 | | | USD | | | | 13,059 | | | | 14,358,371 | |
| | | | | | | | |
| | | | | | | | | | | 497,542,473 | |
| Saudi Arabia — 0.1% | |
Saudi Arabia Government Bond, 2.38%, 10/26/21(c) | | | | | | | 28,234 | | | | 27,755,151 | |
| | | | | | | | |
| South Korea — 0.1% | |
Export-Import Bank of Korea: | | | | | | | | | | | | |
2.88%, 9/17/18 | | | | | | | 12,426 | | | | 12,489,584 | |
2.63%, 12/30/20 | | | | | | | 25,337 | | | | 25,301,123 | |
| | | | | | | | |
| | | | | | | | | | | 37,790,707 | |
| | | | | | | | |
Total Foreign Agency Obligations — 10.0% | | | | 3,901,596,929 | |
| | | | | | | | |
| | | |
Investment Companies(l) | | | | | | | | | | | | |
|
| United States — 3.5% | |
ETFS Gold Trust(a) | | | | | | | 1,201,717 | | | | 149,012,908 | |
ETFS Palladium Trust(a) | | | | | | | 348,916 | | | | 32,731,810 | |
ETFS Platinum Trust(a) | | | | | | | 294,567 | | | | 25,836,472 | |
iShares Gold Trust(a)(v) | | | | | | | 20,256,855 | | | | 247,336,199 | |
SPDR Gold Shares(a) | | | | | | | 7,407,780 | | | | 893,896,813 | |
| | | | | | | | |
Total Investment Companies — 3.5% | | | | 1,348,814,202 | |
| | | | | | | | |
|
Non-Agency Mortgage-Backed Securities | |
|
| Commercial Mortgage-Backed Securities — 0.1% | |
Logistics UK PLC, Series 2015 1-A, Class F, (3 mo. LIBOR GBP + 3.60%), 3.88%, 8/20/25(c)(j) | | | GBP | | | | 30,423 | | | | 40,458,836 | |
| | | | | | | | |
|
Preferred Securities | |
|
| Capital Trusts | |
| Netherlands — 0.0% | |
ING Groep NV, 6.00%(m)(n) | | | USD | | | | 14,653 | | | | 15,382,719 | |
| | | | | | | | |
| United Kingdom — 0.4% | |
HSBC Holdings PLC, 6.38%(m)(n) | | | | | | | 53,998 | | | | 58,655,328 | |
Lloyds Bank PLC, 13.00%(m)(n) | | | | | | | 29,991 | | | | 74,645,555 | |
| | | | | | | | | | | | |
| | | | | | | | | | | 133,300,883 | |
| United States — 0.6% | |
American Express Co., Series C, 4.90%(m)(n) | | | | | | | 18,721 | | | | 19,212,426 | |
Citigroup, Inc., Series O, 5.88%(m)(n) | | | | | | | 34,796 | | | | 36,427,932 | |
General Electric Co.(m)(n):
6.38% | | | | | | | 17,475 | | | | 17,497,718 | |
Series D, 5.00% | | | | | | | 29,629 | | | | 30,925,269 | |
Goldman Sachs Group, Inc., Series M, 5.38%(m)(n) | | | | | | | 30,081 | | | | 31,209,037 | |
Morgan Stanley, Series H, 5.45%(m)(n) | | | | | | | 21,230 | | | | 22,015,510 | |
NBCUniversal Enterprise, Inc., 5.25%(c)(n) | | | USD | | | | 22,612 | | | | 24,138,310 | |
Prudential Financial, Inc.: | | | | | | | | | | | | |
5.88%, 9/15/42(m) | | | | | | | 16,174 | | | | 17,872,270 | |
5.63%, 6/15/43(m) | | | | | | | 11,171 | | | | 12,137,292 | |
USB Capital IX, 3.50%(m)(n) | | | | | | | 7,788 | | | | 6,993,546 | |
| | | | | | | | | | | | |
| | | | | | | | | | | 218,429,310 | |
| | | | | | | | |
Total Capital Trusts — 1.0% | | | | 367,112,912 | |
| | | | | | | | |
| | | | |
| CONSOLIDATED SCHEDULE OF INVESTMENTS | | | 15 | |
| | |
Consolidated Schedule of Investments (continued) October 31, 2017 | | BlackRock Global Allocation Fund, Inc. (Percentages shown are based on Net Assets) |
| | | | | | | | | | | | |
| Security | | | | | Shares | | | Value | |
Preferred Stocks | | | | | | | | | | | | |
|
| Brazil — 0.0% | |
Itau Unibanco Holding SA, Preference Shares | | | | | | | 29,989 | | | $ | 385,485 | |
Petroleo Brasileiro SA, Preference Shares(a) | | | | | | | 10,997 | | | | 56,375 | |
Vale SA, Preference Shares | | | | | | | 25,774 | | | | 234,317 | |
| | | | | | | | | | | | |
| | | | | | | | | | | 676,177 | |
| South Korea — 0.0% | |
Samsung Electronics Co. Ltd., Preference Shares | | | | | | | 525 | | | | 1,051,493 | |
| | | | | | | | |
| United States — 2.2% | |
Anthem, Inc., 5.25%(i) | | | | | | | 1,515,402 | | | | 80,740,618 | |
Crown Castle International Corp., Series A, 6.88%(i) | | | | | | | 49,059 | | | | 53,857,951 | |
Dominion Resources, Inc., Series A, 6.75%(i) | | | | | | | 1,196,315 | | | | 62,603,164 | |
Domo, Inc., Series D-2, (Acquired 4/01/15, cost $89,772,577), 0.00%(a)(e)(f) | | | | | | | 10,647,157 | | | | 94,546,763 | |
DropBox, Inc., Series C (Acquired 1/28/14, cost $150,070,985), 0.00%(a)(e)(f) | | | | | | | 7,856,626 | | | | 104,493,126 | |
Grand Rounds, Inc., Series C, (Acquired 3/31/15, cost $27,587,149), 0.00%(a)(e)(f) | | | | | | | 9,935,944 | | | | 30,503,348 | |
Lookout, Inc., Series F (Acquired 9/19/14, cost $53,322,391), 0.00%(a)(e)(f) | | | | | | | 4,667,944 | | | | 49,900,321 | |
Palantir Technologies, Inc., Series I (Acquired 3/27/14, cost $58,747,474), 0.00%(a)(e)(f) | | | | | | | 9,583,601 | | | | 54,339,018 | |
Uber Technologies, Inc., Series D (Acquired 6/01014, cost $90,664,966), 0.00%(a)(e)(f) | | | | | | | 5,844,432 | | | | 267,674,986 | |
Wells Fargo & Co., Series L, 7.50%(i) | | | | | | | 11,678 | | | | 15,298,180 | |
Welltower, Inc., Series I, 6.50%(i)(n) | | | | | | | 561,548 | | | | 34,439,739 | |
| | | | | | | | | | | | |
| | | | | | | | | | | 848,397,214 | |
| | | | | | | | |
Total Preferred Stocks — 2.2% | | | | 850,124,884 | |
| | | | | | | | |
|
Trust Preferreds | |
|
| Diversified Financial Services — 0.5% | |
Citigroup Capital XIII, 7.68%, 10/30/40(k) | | | | | | | 1,319,420 | | | | 35,316,146 | |
GMAC Capital Trust I, Series 2, 7.10%, 2/15/40(p) | | | | | | | 1,506,882 | | | | 39,028,035 | |
Mandatory Exchangeable Trust, 5.75%(c)(i)(n) | | | | | | | 592,921 | | | | 124,270,312 | |
| | | | | | | | |
Total Trust Preferreds — 0.5% | | | | 198,614,493 | |
| | | | | | | | |
Total Preferred Securities — 3.7% | | | | 1,415,852,289 | |
| | | | | | | | |
| | | |
U.S. Treasury Obligations | | | | | | | | | | | | |
U.S. Treasury Inflation Protected Security, 0.13%, 4/15/22 | | | USD | | | | 687,956 | | | | 686,880,617 | |
U.S. Treasury Notes: | | | | | | | | | | | | |
1.13%, 7/31/21(p) | | | | | | | 81,315 | | | | 79,161,909 | |
1.88%, 9/30/22 | | | | | | | 881,123 | | | | 875,374,749 | |
2.00%, 10/31/22 | | | | | | | 1,255,713 | | | | 1,254,977,227 | |
2.13%, 9/30/24(p)(r) | | | | | | | 1,942,757 | | | | 1,930,463,299 | |
2.25%, 8/15/27 | | | | | | | 1,145,561 | | | | 1,132,942,232 | |
| | | | | | | | |
Total U.S. Treasury Obligations — 15.3% | | | | 5,959,800,033 | |
| | | | | | | | |
Warrants — 0.0% | | | | | | | | | | | | |
|
| Australia — 0.0% | |
Quintis Ltd. (Issued/exercisable 8/01/11, 1 share for 1 warrant, Expires 7/15/18, Strike Price AUD 1.28)(c) | | | | | | | 21,267,512 | | | | 213 | |
| | | | | | | | |
Total Long-Term Investments — 93.4%
(Cost — $30,792,355,726) | | | | 36,317,694,459 | |
| | | | | | | | |
| | | | | | | | | | | | |
| Security | | | | | Shares | | | Value | |
Short-Term Securities | |
| | | |
| Time Deposits | | | | | | | | | |
| Canada — 0.0% | |
Brown Brothers Harriman & Co., 0.15%, 11/01/17 | | | CAD | | | | 19 | | | $ | 14,659 | |
| | | | | | | | |
| Hong Kong — 0.0% | |
BNP Paribas S.A., 0.01%, 11/01/17 | | | HKD | | | | 1,920 | | | | 246,154 | |
| | | | | | | | |
| Japan — 0.0% | |
Sumitomo Bank, (0.24)%, 11/01/17 | | | JPY | | | | 7,266 | | | | 63,900 | |
| | | | | | | | |
| United Kingdom — 0.0% | |
Brown Brothers Harriman & Co., 0.50%, 11/01/17 | | | GBP | | | | 14 | | | | 18,632 | |
| | | | | | | | |
Total Time Deposits — 0.0% | | | | 343,345 | |
| | | | | | | | |
| | | |
U.S. Treasury Obligations | | | | | | | | | | | | |
U.S. Treasury Bills(q): | | | | | | | | | | | | |
1.01%, 11/02/17 | | | USD | | | | 65,000 | | | | 64,998,253 | |
0.92% - 1.05%, 11/09/17 | | | | | | | 979,281 | | | | 979,071,817 | |
0.97% - 1.00%, 11/16/17 | | | | | | | 257,430 | | | | 257,325,151 | |
0.96% - 0.98%, 11/24/17 | | | | | | | 402,000 | | | | 401,751,512 | |
0.98% - 1.00%, 11/30/17 | | | | | | | 129,000 | | | | 128,896,852 | |
0.95% - 0.96%, 12/07/17 | | | | | | | 135,000 | | | | 134,867,531 | |
0.93%, 12/14/17 | | | | | | | 125,000 | | | | 124,855,546 | |
U.S. Treasury Notes, 0.75%, 12/31/17(l) | | | | | | | 120,000 | | | | 119,915,449 | |
| | | | | | | | |
Total U.S. Treasury Obligations — 5.7% | | | | 2,211,682,111 | |
| | | | | | | | |
| | | |
| Money Market Funds — 1.0% | | | | | | | | | |
BlackRock Liquidity Funds, T-Fund, Institutional Class, 0.21%(s)(v) | | | | | | | 98,212,840 | | | | 98,212,840 | |
SL Liquidity Series, LLC, Money Market Series, 1.32%(s)(t)(v) | | | | | | | 307,218,218 | | | | 307,248,940 | |
| | | | | | | | |
Total Money Markey Funds — 1.0% | | | | 405,461,780 | |
| | | | | | | | |
Total Short-Term Securities — 6.7%
(Cost — $2,617,538,554) | | | | 2,617,487,236 | |
| | | | | | | | | | | | |
Options Purchased — 0.3%
(Cost — $132,295,218) | | | | 123,731,279 | |
| | | | | | | | | | | | |
Total Investments Before Options Written — 100.4%
(Cost — $33,542,189,498) | | | | 39,058,912,974 | |
| | | | | | | | | | | | |
Options Written — (0.2)%
(Premiums Received — $90,757,580) | | | | (65,499,354 | ) |
| | | | | | | | | | | | |
| |
Total Investments, Net of Options Written — 100.2%
(Cost — $33,451,431,918) | | | | 38,993,413,620 | |
Liabilities in Excess of Other Assets — (0.2)% | | | | (69,323,572 | ) |
| | | | | | | | | | | | |
Net Assets — 100.0% | | | $ | 38,924,090,048 | |
| | | | | | | | | | | | |
| (a) | Non-income producing security. |
| (b) | Security, or a portion of the security, is on loan. |
| (c) | Security exempt from registration pursuant to Rule 144A under the Securities Act of 1933, as amended. These securities may be resold in transactions exempt from registration to qualified institutional investors. |
| (d) | A security contractually bound to one or more other securities to form a single saleable unit which cannot be sold separately. |
| (e) | Security is valued using significant unobservable inputs and is classified as Level 3 in the fair value hierarchy. |
| (f) | Restricted security as to resale, excluding 144A securities. As of period end, the Fund held restricted securities with a current value of $605,597,216 and an original cost of $688,609,624, which was 1.6% of its net assets. |
| (g) | Issuer filed for bankruptcy and/or is in default. |
| | |
| 16 | | 2017 BLACKROCK ANNUAL REPORTTO SHAREHOLDERS |
| | |
Consolidated Schedule of Investments (continued) October 31, 2017 | | BlackRock Global Allocation Fund, Inc. (Percentages shown are based on Net Assets) |
| (i) | Convertible security. |
| (j) | Floating rate security. Rate shown is the rate in effect as of period end. |
| (k) | Variable rate security. Rate shown is the rate in effect as of period end. |
| (l) | All or a portion of the security is held by a wholly-owned subsidiary. See Note 1 of the Notes to Consolidated Financial Statements for details on the wholly-owned subsidiary. |
| (m) | Variable rate security. Security may be issued at a fixed coupon rate, which converts to a variable rate at a specified date. Rate shown is the rate in effect as of period end. |
| (n) | Perpetual security with no stated maturity date. |
| (o) | Variable or floating rate security, which interest rate adjusts periodically based on changes in current interest rates and prepayments on the underlying pool of assets. Rate shown is the rate in effect as of period end. |
| (p) | All or a portion of the security has been pledged in connection with outstanding futures contracts. |
| (q) | Rates are discount rates or a range of discount rates paid at the time of purchase. |
| (r) | All or a portion of the security has been pledged as collateral in connection with outstanding OTC derivatives. |
| (s) | Annualized 7-day yield as of period end. |
| (t) | Security was purchased with the cash collateral from loaned securities. |
| (u) | All or a portion of security has been pledged as collateral in connection with short sales. |
| (v) | During the year ended October 31, 2017, investments in issuers considered to be affiliates of the Fund for purposes of Section 2(a)(3) of the Investment Company Act of 1940, as amended, and/or related parties of the Fund were as follows: |
| | | | | | | | | | | | | | | | | | | | | | | | | | | | | | | | |
| Affiliate Persons and/or Related Parties | | Shares/Par
Held at
10/31/16 | | | Shares/Par Purchased | | | Shares/Par Sold | | | Shares/Par Held at
10/31/17 | | | Value at
10/31/17 | | | Income | | | Net Realized
Gain (Loss) (a) | | | Change in
Unrealized
Appreciation
(Depreciation) | |
BlackRock Liquidity Funds, T-Fund, Institutional Class | | | 9,025,760 | | | | 89,187,080 | (b) | | | — | | | | 98,212,840 | | | $ | 98,212,840 | | | $ | 60,871 | | | $ | 62 | | | $ | — | |
SL Liquidity Series, LLC, Money Market Series | | | 334,360,632 | | | | — | | | | (27,142,414 | )(c) | | | 307,218,218 | | | | 307,248,940 | | | | 5,811,215 | (d) | | | 25,928 | | | | 338 | |
Bio City Development Co. BV | | $ | 140,850,000 | | | | — | | | | — | | | $ | 140,850,000 | | | | 36,860,445 | | | | — | | | | — | | | | (13,577,940 | ) |
Ei Towers SpA | | | 1,450,608 | | | | — | | | | (286,744 | ) | | | 1,163,864 | | | | 68,057,465 | | | | 6,951,105 | | | | (259,431 | ) | | | 15,552,096 | |
Invitae Corp. | | | 1,735,647 | | | | — | | | | (1,735,647 | ) | | | — | | | | — | | | | — | | | | (4,018,085 | ) | | | 7,497,995 | |
Platinum Group Metals Ltd. | | | 8,067,432 | | | | 2,291,919 | | | | (1,731,719 | ) | | | 8,627,632 | | | | 3,486,252 | | | | — | | | | (9,490,708 | ) | | | (3,099,848 | ) |
St. Joe Co. | | | 6,735,420 | | | | — | | | | (1,834,699 | ) | | | 4,900,721 | | | | 87,232,834 | | | | — | | | | (7,014,082 | ) | | | 8,740,937 | |
iShares Gold Trust | | | 11,663,809 | | | | 12,133,104 | | | | (3,540,058 | ) | | | 20,256,855 | | | | 247,336,200 | | | | — | | | | (5,807,300 | ) | | | 4,938,614 | |
iShares iBoxx USD High Yield Corporate Bond ETF | | | 493,494 | | | | — | | | | (493,494 | ) | | | — | | | | — | | | | 897,275 | | | | 1,481,866 | | | | (1,161,978 | ) |
| | | | | | | | | | | | | | | | | | | | | | | | | | | | | | | | |
| | | $ | 848,434,976 | | | $ | 13,720,466 | | | $ | (25,081,750 | ) | | $ | 18,890,214 | |
| | | | | | | | | | | | | | | | | | | | | | | | | | | | | | | | |
| | (a) | Includes net capital gain distributions, if applicable. | |
| | (b) | Represents net shares purchased. | |
| | (c) | Represents net shares sold. | |
| | (d) | Represents securities lending income earned from the reinvestment of cash collateral from loaned securities, net of fees and collateral investment expenses, and other payments to and from borrowers of securities. | |
Derivative Financial Instruments Outstanding as of Period End
Futures Contracts
| | | | | | | | | | | | | | | | |
| Description | | Number of
Contracts | | | Expiration
Date | | | Notional
Amount (000) | | | Value/
Unrealized
Appreciation
(Depreciation) | |
Short Contracts | | | | | | | | | | | | | | | | |
Euro Stoxx 50 Index | | | (884 | ) | | | 12/15/17 | | | $ | 37,873 | | | $ | (1,746,868 | ) |
FTSE 100 Index | | | (122 | ) | | | 12/15/17 | | | | 12,100 | | | | (185,509 | ) |
NASDAQ 100 E-Mini Index | | | (1,812 | ) | | | 12/15/17 | | | | 226,491 | | | | (8,832,511 | ) |
S&P 500 E-Mini Index | | | (1,065 | ) | | | 12/15/17 | | | | 136,996 | | | | (2,538,634 | ) |
Yen Denominated Nikkei 225 Index | | | (508 | ) | | | 12/15/17 | | | | 49,614 | | | | (4,228,277 | ) |
| | | | | | | | | | | | | | | | |
Total | | | $ | (17,531,799 | ) |
| | | | | | | | | | | | | | | | |
| | | | |
| CONSOLIDATED SCHEDULE OF INVESTMENTS | | | 17 | |
| | |
Consolidated Schedule of Investments (continued) October 31, 2017 | | BlackRock Global Allocation Fund, Inc. (Percentages shown are based on Net Assets) |
Forward Foreign Currency Exchange Contracts
| | | | | | | | | | | | | | | | | | | | |
| Currency Purchased | | | Currency Sold | | | Counterparty | | Settlement Date | | | Unrealized
Appreciation
(Depreciation) | |
| USD | | | 25,694 | | | BRL | | | 84,000 | | | Brown Brothers Harriman & Co. | | | 11/03/17 | | | $ | 17 | |
| GBP | | | 231,549,000 | | | USD | | | 299,750,600 | | | JPMorgan Chase Bank N.A. | | | 11/16/17 | | | | 7,899,730 | |
| USD | | | 137,172,042 | | | EUR | | | 115,675,000 | | | Deutsche Bank AG | | | 11/16/17 | | | | 2,330,631 | |
| USD | | | 90,657,425 | | | NZD | | | 125,043,000 | | | UBS AG | | | 12/07/17 | | | | 5,144,750 | |
| USD | | | 117,694,868 | | | EUR | | | 99,195,000 | | | UBS AG | | | 12/11/17 | | | | 1,900,948 | |
| USD | | | 35,370,548 | | | AUD | | | 44,644,000 | | | Deutsche Bank AG | | | 12/15/17 | | | | 1,216,648 | |
| USD | | | 142,937,799 | | | EUR | | | 120,317,000 | | | BNP Paribas S.A. | | | 12/15/17 | | | | 2,449,097 | |
| USD | | | 96,294,000 | | | MXN | | | 1,789,498,808 | | | UBS AG | | | 01/11/18 | | | | 4,052,982 | |
| USD | | | 77,098,000 | | | MXN | | | 1,472,109,212 | | | Deutsche Bank AG | | | 01/18/18 | | | | 1,305,938 | |
| USD | | | 226,472,930 | | | AUD | | | 289,243,000 | | | Goldman Sachs International | | | 01/25/18 | | | | 5,266,739 | |
| USD | | | 88,500,085 | | | NZD | | | 123,740,000 | | | JPMorgan Chase Bank N.A. | | | 02/22/18 | | | | 3,976,820 | |
| USD | | | 38,881,000 | | | AUD | | | 50,000,000 | | | Citibank N.A. | | | 04/06/18 | | | | 657,605 | |
| | | | | | | | | | | | | | | | | | | | |
| | | | | | | | | | | | | | | | | | | 36,201,905 | |
| | | | | | | | | | | | | | | | | | | | |
| EUR | | | 115,675,000 | | | USD | | | 139,556,682 | | | Deutsche Bank AG | | | 11/16/17 | | | | (4,715,271 | ) |
| JPY | | | 11,045,869,894 | | | USD | | | 97,917,000 | | | Barclays Bank PLC | | | 12/07/17 | | | | (626,334 | ) |
| EUR | | | 114,402,000 | | | USD | | | 137,230,919 | | | UBS AG | | | 12/14/17 | | | | (3,658,002 | ) |
| EUR | | | 218,626,890 | | | USD | | | 258,128,396 | | | UBS AG | | | 12/14/17 | | | | (2,865,101 | ) |
| JPY | | | 13,291,739,580 | | | USD | | | 118,545,000 | | | Goldman Sachs International | | | 12/14/17 | | | | (1,421,078 | ) |
| EUR | | | 81,419,000 | | | PLN | | | 348,872,273 | | | Deutsche Bank AG | | | 12/15/17 | | | | (788,839 | ) |
| EUR | | | 120,317,000 | | | USD | | | 143,728,883 | | | BNP Paribas S.A. | | | 12/15/17 | | | | (3,240,181 | ) |
| EUR | | | 120,357,000 | | | USD | | | 143,644,876 | | | UBS AG | | | 12/15/17 | | | | (3,109,467 | ) |
| NOK | | | 623,181,000 | | | USD | | | 78,088,943 | | | Morgan Stanley International PLC | | | 01/26/18 | | | | (1,622,837 | ) |
| | | | | | | | | | | | | | | | | | | | |
| | | | | | | | | | | | | | | | | | | (22,047,110 | ) |
| | | | | | | | | | | | | | | | | | | | |
| | | Net Unrealized Appreciation | | | $ | 14,154,795 | |
| | | | | | | | | | | | | | | | | | | | |
OTC Interest Rate Swaptions Purchased
| | | | | | | | | | | | | | | | | | | | | | | | | | | | | | | | | | | | | | |
| Description | | Counterparty | | Expiration
Date | | | Exercise
Rate | | | Received by the Fund | | | Paid by the Fund | | | Notional
Amount (000) | | | Value | |
| | | | | Rate | | | Frequency | | | Rate | | | Frequency | | | |
Call | | | |
10-Year Interest Rate Swap, 12/09/27 | | Bank of America N.A. | | | 12/07/17 | | | | 2.00 | % | | | 2.00% | | | | Semi-annual | | | | 3-Month LIBOR | | | | Quarterly | | | | USD | | | | 504,243 | | | $ | 157,051 | |
5-Year Interest Rate Swap, 4/26/23 | | Goldman Sachs International | | | 04/24/18 | | | | 2.15 | | | | 2.15 | | | | Semi-annual | | | | 3-Month LIBOR | | | | Quarterly | | | | USD | | | | 2,512,116 | | | | 19,041,134 | |
| | | | | | | | | | | | | | | | | | | | | | | | | | | | | | | | | | | | | | |
| | | | 19,198,185 | |
| | | | | |
Put | | | |
5-Year Interest Rate Swap, 4/06/23 | | Deutsche Bank AG | | | 04/04/18 | | | | 1.07 | | | | 6-Month LIBOR | | | | Semi-annual | | | | 1.07% | | | | Semi-annual | | | | JPY | | | | 12,739,074 | | | | 1,749 | |
30-Year Interest Rate Swap, 5/04/48 | | Goldman Sachs International | | | 05/02/18 | | | | 2.75 | | | | 3-Month LIBOR | | | | Quarterly | | | | 2.75 | | | | Semi-annual | | | | USD | | | | 120,387 | | | | 3,057,166 | |
| | | | | | | | | | | | | | | | | | | | | | | | | | | | | | | | | | | | | | |
| | | | | | | | | | | | | | | | | | | | | | | | | | | | | | | | | | | | | 3,058,915 | |
| | | | | | | | | | | | | | | | | | | | | | | | | | | | | | | | | | | | | | |
| | | $ | 22,257,100 | |
| | | | | | | | | | | | | | | | | | | | | | | | | | | | | | | | | | | | | | |
OTC Options Purchased
| | | | | | | | | | | | | | | | | | | | | | | | | | | | | | |
| Description | | Counterparty | | Number of
Contracts | | | Expiration
Date | | | Exercise
Price | | | Notional
Amount (000) | | | Value | |
Call | | | | | | | | | | | | | | | | | | | | | | | | | | | | | | |
Euro STOXX 50 Index | | Citibank N.A. | | | 32,074 | | | | 12/15/17 | | | | EUR | | | | 3,650.00 | | | | EUR | | | | 117,838 | | | $ | 2,693,756 | |
EUR Currency | | UBS AG | | | — | | | | 12/20/17 | | | | USD | | | | 1.22 | | | | EUR | | | | 251,305 | | | | 229,502 | |
Topix Index | | Morgan Stanley International PLC | | | 14,863,314 | | | | 01/12/18 | | | | JPY | | | | 1,785.00 | | | | JPY | | | | 26,248,018 | | | | 3,826,650 | |
Aflac, Inc. | | Goldman Sachs International | | | 571,594 | | | | 01/19/18 | | | | USD | | | | 85.00 | | | | USD | | | | 47,951 | | | | 917,408 | |
Franklin Resources, Inc. | | Goldman Sachs International | | | 972,073 | | | | 01/19/18 | | | | USD | | | | 45.00 | | | | USD | | | | 40,953 | | | | 388,829 | |
MetLife, Inc. | | Goldman Sachs International | | | 677,225 | | | | 01/19/18 | | | | USD | | | | 52.50 | | | | USD | | | | 36,286 | | | | 1,726,924 | �� |
S&P 500 Index | | BNP Paribas S.A. | | | 74,319 | | | | 01/19/18 | | | | USD | | | | 2,610.00 | | | | USD | | | | 191,391 | | | | 1,649,882 | |
S&P 500 Index | | Deutsche Bank AG | | | 74,368 | | | | 01/19/18 | | | | USD | | | | 2,615.00 | | | | USD | | | | 191,517 | | | | 1,488,408 | |
Synchrony Financial | | Goldman Sachs International | | | 1,076,685 | | | | 01/19/18 | | | | USD | | | | 35.00 | | | | USD | | | | 35,121 | | | | 834,431 | |
| | |
| 18 | | 2017 BLACKROCK ANNUAL REPORTTO SHAREHOLDERS |
| | |
Consolidated Schedule of Investments (continued) October 31, 2017 | | BlackRock Global Allocation Fund, Inc. (Percentages shown are based on Net Assets) |
OTC Options Purchased (continued)
| | | | | | | | | | | | | | | | | | | | | | | | | | | | | | |
| Description | | Counterparty | | Number of
Contracts | | | Expiration
Date | | | Exercise
Price | | | Notional
Amount (000) | | | Value | |
Travelers Cos., Inc. | | Goldman Sachs International | | | 387,703 | | | | 01/19/18 | | | | USD | | | | 135.00 | | | | USD | | | | 51,351 | | | $ | 920,795 | |
Wells Fargo & Co. | | Goldman Sachs International | | | 1,394,418 | | | | 01/19/18 | | | | USD | | | | 55.00 | | | | USD | | | | 78,283 | | | | 3,430,268 | |
Topix Index | | Citibank N.A. | | | 8,926,626 | | | | 02/09/18 | | | | JPY | | | | 1,785.00 | | | | JPY | | | | 15,764,064 | | | | 3,016,925 | |
SPDR Gold Trust ETF(a) | | Morgan Stanley International PLC | | | 1,258,820 | | | | 02/16/18 | | | | USD | | | | 130.00 | | | | USD | | | | 151,902 | | | | 847,941 | |
Topix Index | | Morgan Stanley International PLC | | | 9,908,876 | | | | 03/09/18 | | | | JPY | | | | 1,800.00 | | | | JPY | | | | 17,498,679 | | | | 3,377,415 | |
SPDR Gold Trust ETF(a) | | Morgan Stanley International PLC | | | 1,256,777 | | | | 03/16/18 | | | | USD | | | | 127.00 | | | | USD | | | | 151,655 | | | | 1,790,907 | |
EUR Currency | | UBS AG | | | — | | | | 03/27/18 | | | | USD | | | | 1.20 | | | | EUR | | | | 1,023,320 | | | | 11,051,158 | |
EUR Currency | | Barclays Bank PLC | | | — | | | | 05/18/18 | | | | USD | | | | 1.19 | | | | EUR | | | | 507,587 | | | | 9,917,843 | |
Euro STOXX 50 Index | | Deutsche Bank AG | | | 15,600 | | | | 09/21/18 | | | | EUR | | | | 3,426.55 | | | | EUR | | | | 57,314 | | | | 5,391,529 | |
BP PLC | | UBS AG | | | 3,155,984 | | | | 01/18/19 | | | | USD | | | | 40.00 | | | | USD | | | | 128,354 | | | | 8,820,975 | |
Chevron Corp. | | UBS AG | | | 1,000,733 | | | | 01/18/19 | | | | USD | | | | 125.00 | | | | USD | | | | 115,975 | | | | 4,353,189 | |
ConocoPhillips | | UBS AG | | | 1,663,706 | | | | 01/18/19 | | | | USD | | | | 52.50 | | | | USD | | | | 85,099 | | | | 7,944,196 | |
Exxon Mobil Corp. | | UBS AG | | | 680,375 | | | | 01/18/19 | | | | USD | | | | 95.00 | | | | USD | | | | 56,709 | | | | 799,441 | |
Occidental Petroleum Corp. | | UBS AG | | | 1,462,156 | | | | 01/18/19 | | | | USD | | | | 75.00 | | | | USD | | | | 94,411 | | | | 2,668,435 | |
Royal Dutch Shell PLC | | UBS AG | | | 1,801,473 | | | | 01/18/19 | | | | USD | | | | 60.00 | | | | USD | | | | 113,547 | | | | 8,917,291 | |
Schlumberger Ltd. | | UBS AG | | | 984,842 | | | | 01/18/19 | | | | USD | | | | 90.00 | | | | USD | | | | 63,030 | | | | 433,330 | |
Suncor Energy, Inc. | | UBS AG | | | 2,124,878 | | | | 01/18/19 | | | | USD | | | | 35.00 | | | | USD | | | | 72,161 | | | | 5,896,536 | |
TOTAL SA | | UBS AG | | | 2,170,035 | | | | 01/18/19 | | | | USD | | | | 60.00 | | | | USD | | | | 120,914 | | | | 3,526,307 | |
| | | | | | | | | | | | | | | | | | | | | | | | | | | | | | |
| | | | | | | | | | | | | | | | | | | | | | | | | | | | | 96,860,271 | |
| | | | | | | | | | | | | | | | | | | | | | | | | | | | | | |
Put | | | | | | | | | | | | | | | | | | | | | | | | | | | | | | |
USD Currency | | BNP Paribas S.A. | | | — | | | | 01/12/18 | | | | JPY | | | | 111.75 | | | | USD | | | | 498,424 | | | | 4,613,908 | |
| | | | | | | | | | | | | | | | | | | | | | | | | | | | | | |
| | | $ | 101,474,179 | |
| | | | | |
| | (a) | All or a portion of the security is held by a wholly-owned subsidiary. See Note 1 of the Notes to Consolidated Financial Statements for details on the wholly-owned subsidiary. | |
OTC Barrier Options Written
| | | | | | | | | | | | | | | | | | | | | | | | | | | | | | | | | | | | | | | | |
| Description | | Type of Option | | Counterparty | | Number of
Contracts | | | Expiration
Date | | | Exercise
Price | | | Barrier
Price/Range | | | Notional
Amount (000) | | | Value | |
Put | | | | | | | | | | | | | | | | | | | | | | | | | | | | | | | | | | | | | | | | |
Euro STOXX 50 Index | | Down-and-In | | Deutsche Bank AG | | | 15,600 | | | | 09/21/18 | | | | EUR | | | | 2,586.07 | | | | EUR | | | | 2,165.83 | | | | EUR | | | | 57,314 | | | $ | (399,061 | ) |
| | | | | | | | | | | | | | | | | | | | | | | | | | | | | | | | | | | | | | | | |
OTC Interest Rate Swaptions Written
| | | | | | | | | | | | | | | | | | | | | | | | | | | | | | | | | | | | | | |
| Description | | Counterparty | | Expiration
Date | | | Exercise
Rate | | | Received by the Fund | | | Paid by the Fund | | | Notional
Amount (000) | | | Value | |
| | | | | Rate | | | Frequency | | | Rate | | | Frequency | | | |
Call | | | | | | | | | | | | | | | | | | | | | | | | | | | | | | | | | | | | | | |
5-Year Interest Rate Swap, 4/26/23 | | Goldman Sachs
International | | | 04/24/18 | | | | 1.90 | % | | | 3-Month
LIBOR | | | | Quarterly | | | | 1.90% | | | | Semi-annual | | | | USD | | | | 2,512,116 | | | $ | (8,391,522 | ) |
Put | | | | | | | | | | | | | | | | | | | | | | | | | | | | | | | | | | | | | | |
10-Year Interest Rate Swap, 12/09/27 | | Bank of America N.A. | | | 12/07/17 | | | | 2.40 | | | | 2.40 | | | | Semi-annual | | | | 3-Month LIBOR | | | | Quarterly | | | | USD | | | | 504,243 | | | | (2,490,479 | ) |
MC 5Yx5Y Interest Rate Swap, 3/27/28 | | Goldman Sachs International | | | 03/22/18 | | | | 2.81 | | | | 2.81 | | | | Semi-annual | | | | 3-Month LIBOR | | | | Quarterly | | | | USD | | | | 654,234 | | | | (3,233,179 | ) |
5-Year Interest Rate Swap, 4/26/23 | | Goldman Sachs International | | | 04/24/18 | | | | 2.40 | | | | 2.40% | | | | Semi-annual | | | | 3-Month
LIBOR | | | | Quarterly | | | | USD | | | | 2,512,116 | | | | (10,125,334 | ) |
5-Year Interest Rate Swap, 5/04/23 | | Goldman Sachs International | | | 05/02/18 | | | | 2.50 | | | | 2.50 | | | | Semi-annual | | | | 3-Month LIBOR | | | | Quarterly | | | | USD | | | | 550,706 | | | | (1,690,618 | ) |
| | | | | | | | | | | | | | | | | | | | | | | | | | | | | | | | | | | | | | |
| | | $ | (17,539,610 | ) |
| | | | | |
| | | $ | (25,931,132 | ) |
| | | | | |
| | | | |
| CONSOLIDATED SCHEDULE OF INVESTMENTS | | | 19 | |
| | |
Consolidated Schedule of Investments (continued) October 31, 2017 | | BlackRock Global Allocation Fund, Inc. (Percentages shown are based on Net Assets) |
OTC Options Written
| | | | | | | | | | | | | | | | | | | | | | | | | | | | | | |
| Description | | Counterparty | | Number of
Contracts | | | Expiration
Date | | | Exercise
Price | | | Notional
Amount (000) | | | Value | |
Call | | | | | | | | | | | | | | | | | | | | | | | | | | | | | | |
Topix Index | | Morgan Stanley International PLC | | | 12,306,404 | | | | 01/12/18 | | | | JPY | | | | 1,850.00 | | | | JPY | | | | 21,732,617 | | | $ | (1,048,404 | ) |
USD Currency | | BNP Paribas S.A. | | | — | | | | 01/12/18 | | | | JPY | | | | 115.00 | | | | USD | | | | 498,424 | | | | (3,987,389 | ) |
USD Currency | | BNP Paribas S.A. | | | — | | | | 01/26/18 | | | | ZAR | | | | 15.25 | | | | USD | | | | 124,552 | | | | (2,122,113 | ) |
SPDR Gold Trust ETF(a) | | Morgan Stanley International PLC | | | 1,256,777 | | | | 03/16/18 | | | | USD | | | | 140.00 | | | | USD | | | | 151,655 | | | | (370,749 | ) |
FleetCor Technologies, Inc. | | Barclays Bank PLC | | | 123,669 | | | | 01/18/19 | | | | USD | | | | 180.00 | | | | USD | | | | 20,439 | | | | (1,978,704 | ) |
Pioneer Natural Resources Co. | | UBS AG | | | 263,135 | | | | 01/18/19 | | | | USD | | | | 165.00 | | | | USD | | | | 39,383 | | | | (4,631,176 | ) |
United Continental Holdings, Inc. | | Deutsche Bank AG | | | 325,526 | | | | 01/18/19 | | | | USD | | | | 75.00 | | | | USD | | | | 19,037 | | | | (1,269,551 | ) |
| | | | | | | | | | | | | | | | | | | | | | | | | | | | | | |
| | | | (15,408,086 | ) |
| | | | | |
Put | | | | | | | | | | | | | | | | | | | | | | | | | | | | | | |
Topix Index | | Morgan Stanley & Co. International PLC | | | 12,306,404 | | | | 01/12/18 | | | | JPY | | | | 1,550.00 | | | | JPY | | | | 21,732,617 | | | | (474,932 | ) |
USD Currency | | BNP Paribas S.A. | | | — | | | | 01/12/18 | | | | JPY | | | | 108.00 | | | | USD | | | | 498,424 | | | | (1,418,514 | ) |
S&P 500 Index | | BNP Paribas S.A. | | | 74,319 | | | | 01/19/18 | | | | USD | | | | 2,410.00 | | | | USD | | | | 191,391 | | | | (999,591 | ) |
S&P 500 Index | | Deutsche Bank AG | | | 74,368 | | | | 01/19/18 | | | | USD | | | | 2,415.00 | | | | USD | | | | 191,517 | | | | (1,039,369 | ) |
Topix Index | | Citibank N.A. | | | 8,926,626 | | | | 02/09/18 | | | | JPY | | | | 1,675.00 | | | | JPY | | | | 15,764,064 | | | | (1,655,064 | ) |
SPDR Gold Trust ETF(a) | | Morgan Stanley International PLC | | | 1,258,820 | | | | 02/16/18 | | | | USD | | | | 115.00 | | | | USD | | | | 151,902 | | | | (872,375 | ) |
Topix Index | | Morgan Stanley International PLC | | | 9,908,876 | | | | 03/09/18 | | | | JPY | | | | 1,650.00 | | | | JPY | | | | 17,498,679 | | | | (1,950,560 | ) |
SPDR Gold Trust ETF(a) | | Morgan Stanley International PLC | | | 754,067 | | | | 03/16/18 | | | | USD | | | | 115.00 | | | | USD | | | | 90,993 | | | | (735,215 | ) |
BP PLC | | UBS AG | | | 3,155,984 | | | | 01/18/19 | | | | USD | | | | 25.00 | | | | USD | | | | 128,354 | | | | (1,088,815 | ) |
Chevron Corp. | | UBS AG | | | 1,000,733 | | | | 01/18/19 | | | | USD | | | | 80.00 | | | | USD | | | | 115,975 | | | | (1,491,092 | ) |
ConocoPhillips | | UBS AG | | | 1,663,706 | | | | 01/18/19 | | | | USD | | | | 35.00 | | | | USD | | | | 85,099 | | | | (1,281,054 | ) |
Exxon Mobil Corp. | | UBS AG | | | 680,375 | | | | 01/18/19 | | | | USD | | | | 60.00 | | | | USD | | | | 56,709 | | | | (619,141 | ) |
Occidental Petroleum Corp. | | UBS AG | | | 1,462,156 | | | | 01/18/19 | | | | USD | | | | 45.00 | | | | USD | | | | 94,411 | | | | (1,579,129 | ) |
Royal Dutch Shell PLC | | UBS AG | | | 1,801,473 | | | | 01/18/19 | | | | USD | | | | 40.00 | | | | USD | | | | 113,547 | | | | (675,552 | ) |
Schlumberger Ltd. | | UBS AG | | | 984,842 | | | | 01/18/19 | | | | USD | | | | 60.00 | | | | USD | | | | 63,030 | | | | (4,653,378 | ) |
Suncor Energy, Inc. | | UBS AG | | | 2,124,878 | | | | 01/18/19 | | | | USD | | | | 25.00 | | | | USD | | | | 72,161 | | | | (1,816,771 | ) |
TOTAL SA | | UBS AG | | | 2,170,035 | | | | 01/18/19 | | | | USD | | | | 40.00 | | | | USD | | | | 120,914 | | | | (1,410,523 | ) |
| | | | | | | | | | | | | | | | | | | | | | | | | | | | | | |
| | | | | | | | | | | | | | | | | | | | | | | | | | | | | (23,761,075 | ) |
| | | | | | | | | | | | | | | | | | | | | | | | | | | | | | |
| | | $ | (39,169,161 | ) |
| | | | | | | | | | | | | | | | | | | | | | | | | | | | | | |
| | (a) | All or a portion of the security is held by a wholly-owned subsidiary. See Note 1 of the Notes to Consolidated Financial Statements for details on the wholly-owned subsidiary. | |
Centrally Cleared Credit Default Swaps — Buy Protection
| | | | | | | | | | | | | | | | | | | | | | | | | | | | | | | | |
| Reference Obligation/Index | | Financing
Rate
Paid by
the Fund | | | Payment
Frequency | | | Termination
Date | | | Notional
Amount (000) | | | Value | | | Upfront
Premium
Paid
(Received) | | | Unrealized
Appreciation
(Depreciation) | |
CDX.NA.HY.29.VI | | | 5.00 | % | | | Quarterly | | | | 12/20/22 | | | | USD | | | | 88,404 | | | $ | (7,427,245 | ) | | $ | (6,469,334 | ) | | $ | (957,911 | ) |
| | | | | | | | | | | | | | | | | | | | | | | | | | | | | | | | |
Centrally Cleared Interest Rate Swaps
| | | | | | | | | | | | | | | | | | | | | | | | | | | | | | | | |
Paid by the Fund | | Received by the Fund | | Effective
Date | | | Termination
Date | | | Notional
Amount (000) | | | Value | | | Upfront
Premium
Paid
(Received) | | | Unrealized
Appreciation
(Depreciation) | |
| Rate | | Frequency | | Rate | | Frequency | | | | | | |
| 3-Month LIBOR | | Quarterly | | 2.40% | | Semi-annual | | | 3/07/18 | (a) | | | 03/07/23 | | | USD | | | 516,913 | | | $ | 6,174,267 | | | $ | 4,042 | | | $ | 6,170,225 | |
| 0.42% | | Annual | | 6-Month EURIBOR | | Semi-annual | | | 3/07/18 | (a) | | | 03/07/23 | | | EUR | | | 457,468 | | | | (3,618,544 | ) | | | 3,798 | | | | (3,622,342 | ) |
| 0.37 | | Annual | | 6-Month EURIBOR | | Semi-annual | | | N/A | | | | 08/15/26 | | | EUR | | | 168,618 | | | | 5,569,808 | | | | 5,085 | | | | 5,564,723 | |
| | | | | | | | | | | | | | | | | | | | | | | | | | | | | | | | |
| | | $ | 8,125,531 | | | $ | 12,925 | | | $ | 8,112,606 | |
| | | | | | | | | | | | | | | | | | | | | | | | | | | | | | | | |
| | |
| 20 | | 2017 BLACKROCK ANNUAL REPORTTO SHAREHOLDERS |
| | |
Consolidated Schedule of Investments (continued) October 31, 2017 | | BlackRock Global Allocation Fund, Inc. (Percentages shown are based on Net Assets) |
OTC Credit Default Swaps — Buy Protection
| | | | | | | | | | | | | | | | | | | | | | | | | | | | |
| Reference Obligation/Index | | Financing
Rate
Paid by
the Fund | | | Payment
Frequency | | Counterparty | | Termination
Date | | Notional
Amount (000) | | | Value | | | Upfront
Premium
Paid
(Received) | | | Unrealized
Appreciation
(Depreciation) | |
Airbus SE | | | 1.00 | % | | Quarterly | | Barclays Bank PLC | | 06/20/22 | | EUR | | | 25,423 | | | $ | (1,023,764 | ) | | $ | (879,204 | ) | | $ | (144,560 | ) |
Airbus SE | | | 1.00 | | | Quarterly | | Barclays Bank PLC | | 06/20/22 | | EUR | | | 12,668 | | | | (501,943 | ) | | | (467,432 | ) | | | (34,511 | ) |
Akzo Nobel NV | | | 1.00 | | | Quarterly | | Barclays Bank PLC | | 06/20/22 | | EUR | | | 25,423 | | | | (744,625 | ) | | | (599,498 | ) | | | (145,127 | ) |
BASF Schweiz AG | | | 1.00 | | | Quarterly | | Barclays Bank PLC | | 06/20/22 | | EUR | | | 25,423 | | | | (1,090,189 | ) | | | (949,847 | ) | | | (140,342 | ) |
BP Capital Markets PLC | | | 1.00 | | | Quarterly | | Barclays Bank PLC | | 06/20/22 | | EUR | | | 25,423 | | | | (851,801 | ) | | | (600,151 | ) | | | (251,650 | ) |
Barrick Gold Corp. | | | 1.00 | | | Quarterly | | Barclays Bank PLC | | 06/20/22 | | USD | | | 25,429 | | | | (518,127 | ) | | | (311,809 | ) | | | (206,318 | ) |
Bayer AG | | | 1.00 | | | Quarterly | | Barclays Bank PLC | | 06/20/22 | | EUR | | | 25,423 | | | | (1,000,097 | ) | | | (851,027 | ) | | | (149,070 | ) |
CSX Corp. | | | 1.00 | | | Quarterly | | Barclays Bank PLC | | 06/20/22 | | USD | | | 25,423 | | | | (806,787 | ) | | | (821,879 | ) | | | 15,092 | |
Caterpillar, Inc. | | | 1.00 | | | Quarterly | | Barclays Bank PLC | | 06/20/22 | | USD | | | 25,429 | | | | (907,251 | ) | | | (723,173 | ) | | | (184,078 | ) |
Caterpillar, Inc. | | | 1.00 | | | Quarterly | | Barclays Bank PLC | | 06/20/22 | | USD | | | 12,714 | | | | (453,625 | ) | | | (378,964 | ) | | | (74,661 | ) |
Cie de Saint-Gobain | | | 1.00 | | | Quarterly | | Barclays Bank PLC | | 06/20/22 | | EUR | | | 25,423 | | | | (925,885 | ) | | | (739,585 | ) | | | (186,300 | ) |
Deere & Co. | | | 1.00 | | | Quarterly | | Barclays Bank PLC | | 06/20/22 | | USD | | | 25,429 | | | | (924,110 | ) | | | (851,265 | ) | | | (72,845 | ) |
Dow Chemical Co. | | | 1.00 | | | Quarterly | | Barclays Bank PLC | | 06/20/22 | | USD | | | 25,429 | | | | (734,987 | ) | | | (578,985 | ) | | | (156,002 | ) |
General Electric Co. | | | 1.00 | | | Quarterly | | Barclays Bank PLC | | 06/20/22 | | USD | | | 25,429 | | | | (695,900 | ) | | | (723,173 | ) | | | 27,273 | |
International Paper Co. | | | 1.00 | | | Quarterly | | Barclays Bank PLC | | 06/20/22 | | USD | | | 25,423 | | | | (724,928 | ) | | | (636,351 | ) | | | (88,577 | ) |
Norfolk Southern Corp. | | | 1.00 | | | Quarterly | | Barclays Bank PLC | | 06/20/22 | | USD | | | 25,429 | | | | (865,332 | ) | | | (862,966 | ) | | | (2,366 | ) |
Shell International Finance BV | | | 1.00 | | | Quarterly | | Barclays Bank PLC | | 06/20/22 | | EUR | | | 25,423 | | | | (1,011,718 | ) | | | (766,772 | ) | | | (244,946 | ) |
Shell International Finance BV | | | 1.00 | | | Quarterly | | Barclays Bank PLC | | 06/20/22 | | EUR | | | 12,668 | | | | (496,817 | ) | | | (417,398 | ) | | | (79,419 | ) |
Sherwin-Williams Co. | | | 1.00 | | | Quarterly | | Barclays Bank PLC | | 06/20/22 | | USD | | | 12,714 | | | | (279,207 | ) | | | (246,577 | ) | | | (32,630 | ) |
Southwest Airlines Co. | | | 1.00 | | | Quarterly | | Barclays Bank PLC | | 06/20/22 | | USD | | | 25,429 | | | | (680,737 | ) | | | (723,173 | ) | | | 42,436 | |
Statoil ASA | | | 1.00 | | | Quarterly | | Barclays Bank PLC | | 06/20/22 | | EUR | | | 25,423 | | | | (1,194,035 | ) | | | (964,011 | ) | | | (230,024 | ) |
Volkswagen International Finance NV | | | 1.00 | | | Quarterly | | Barclays Bank PLC | | 06/20/22 | | EUR | | | 25,423 | | | | (635,556 | ) | | | (516,473 | ) | | | (119,083 | ) |
| | | | | | | | | | | | | | | | | | | | | | | | | | | | |
| | | $ | (17,067,421 | ) | | $ | (14,609,713 | ) | | $ | (2,457,708 | ) |
| | | | | | | | | | | | | | | | | | | | | | | | | | | | |
OTC Currency Swaps
| | | | | | | | | | | | | | | | | | | | | | | | | | | | | | | | | | | | | | |
| Paid by the Fund | | Received by the Fund | | Notional Amount (000) | | | Counterparty | | Termination
Date (a) | | | Value | | | Upfront
Premium
Paid
(Received) | | | Unrealized
Appreciation
(Depreciation) | |
| Rate | | Frequency | | Rate | | Frequency | | Delivered | | | Received | | | | | | |
| 0.10 JPY | | Semi-annual | | 1.84% | | Semi-annual | | | JPY | | | | 10,596,100 | | | USD | | | 94,118 | | | Bank of America N.A. | | | 03/15/18 | | | $ | 1,072,400 | | | $ | — | | | $ | 1,072,400 | |
| 0.10 JPY | | Semi-annual | | 1.96 | | Semi-annual | | | JPY | | | | 15,929,100 | | | USD | | | 140,468 | | | Bank of America N.A. | | | 03/15/18 | | | | 676,222 | | | | — | | | | 676,222 | |
| 0.10 JPY | | Semi-annual | | 2.01 | | Semi-annual | | | JPY | | | | 24,956,150 | | | USD | | | 241,239 | | | Bank of America N.A. | | | 10/15/18 | | | | 21,588,383 | | | | — | | | | 21,588,383 | |
| | | | | | | | | | | | | | | | | | | | | | | | | | | | | | | | | | | | | | |
| | | $ | 23,337,005 | | | $ | — | | | $ | 23,337,005 | |
| | | | | | | | | | | | | | | | | | | | | | | | | | | | | | | | | | | | | | |
| | (a) | At termination date, the notional amount delivered will be exchanged for the notional amount received. | |
OTC Total Return Swaps
| | | | | | | | | | | | | | | | | | | | | | | | | | | | | | |
| Reference Entity | | Fixed Amount Paid
(Received) by the
Fund (a) | | | Counterparty | | Termination
Date | | | Notional
Amount (000) | | | Value | | | Upfront
Premium
Paid
(Received) | | | Unrealized
Appreciation
(Depreciation) | |
SGX Nikkei Stock Average Dividend Point Index Future April 2017 | | JPY | | | 2,587,893,300 | | | BNP Paribas S.A. | | | 04/02/18 | | | JPY | | | 2,587,893 | | | $ | 2,802,011 | | | $ | — | | | $ | 2,802,011 | |
SGX Nikkei Stock Average Dividend Point Index Future April 2017 | | JPY | | | 1,548,600,000 | | | BNP Paribas S.A. | | | 04/02/18 | | | JPY | | | 1,548,600 | | | | 1,528,235 | | | | — | | | | 1,528,235 | |
Euro Stoxx 50 Index Dividend Future December 2018 | | EUR | | | 14,399,978 | | | BNP Paribas S.A. | | | 12/21/18 | | | EUR | | | 14,400 | | | | 1,718,401 | | | | — | | | | 1,718,401 | |
S&P 500 Index Annual Dividend Future December 2018 | | USD | | | 30,632,937 | | | BNP Paribas S.A. | | | 12/21/18 | | | USD | | | 30,633 | | | | 3,964,262 | | | | — | | | | 3,964,262 | |
SGX Nikkei Stock Average Dividend Point Index Future April 2018 | | JPY | | | 1,350,937,500 | | | BNP Paribas S.A. | | | 04/01/19 | | | JPY | | | 1,350,938 | | | | 2,566,312 | | | | — | | | | 2,566,312 | |
SGX Nikkei Stock Average Dividend Point Index Future April 2018 | | JPY | | | 2,680,496,000 | | | BNP Paribas S.A. | | | 04/01/19 | | | JPY | | | 2,680,496 | | | | 5,247,122 | | | | — | | | | 5,247,122 | |
Euro Stoxx 50 Index Dividend Future December 2019 | | EUR | | | 7,065,150 | | | BNP Paribas S.A. | | | 12/20/19 | | | EUR | | | 7,065 | | | | 2,129,112 | | | | — | | | | 2,129,112 | |
Euro Stoxx 50 Index Dividend Future December 2019 | | EUR | | | 9,746,040 | | | BNP Paribas S.A. | | | 12/20/19 | | | EUR | | | 9,746 | | | | 2,852,204 | | | | — | | | | 2,852,204 | |
| | | | |
| CONSOLIDATED SCHEDULE OF INVESTMENTS | | | 21 | |
| | |
Consolidated Schedule of Investments (continued) October 31, 2017 | | BlackRock Global Allocation Fund, Inc. (Percentages shown are based on Net Assets) |
OTC Total Return Swaps (continued)
| | | | | | | | | | | | | | | | | | | | | | | | | | | | | | |
| Reference Entity | | Fixed Amount Paid
(Received) by the
Fund (a) | | | Counterparty | | Termination
Date | | | Notional
Amount (000) | | | Value | | | Upfront
Premium
Paid
(Received) | | | Unrealized
Appreciation
(Depreciation) | |
Euro Stoxx 50 Index Dividend Future December 2019 | | EUR | | | 13,729,500 | | | BNP Paribas S.A. | | | 12/20/19 | | | EUR | | | 13,730 | | | $ | 3,899,916 | | | $ | — | | | $ | 3,899,916 | |
Euro Stoxx 50 Index Dividend Future December 2019 | | EUR | | | 10,557,560 | | | BNP Paribas S.A. | | | 12/20/19 | | | EUR | | | 10,558 | | | | 2,849,967 | | | | — | | | | 2,849,967 | |
SGX Nikkei Stock Average Dividend Point Index Future April 2019 | | JPY | | | 1,825,270,000 | | | BNP Paribas S.A. | | | 04/01/20 | | | JPY | | | 1,825,270 | | | | 5,004,389 | | | | — | | | | 5,004,389 | |
SGX Nikkei Stock Average Dividend Point Index Future April 2019 | | JPY | | | 2,223,600,000 | | | BNP Paribas S.A. | | | 04/01/20 | | | JPY | | | 2,223,600 | | | | 6,775,533 | | | | — | | | | 6,775,533 | |
Euro Stoxx 50 Index Dividend Future December 2020 | | EUR | | | 3,283,830 | | | BNP Paribas S.A. | | | 12/18/20 | | | EUR | | | 3,284 | | | | 1,132,059 | | | | — | | | | 1,132,059 | |
Euro Stoxx 50 Index Dividend Future December 2020 | | EUR | | | 4,010,240 | | | BNP Paribas S.A. | | | 12/18/20 | | | EUR | | | 4,010 | | | | 1,376,200 | | | | — | | | | 1,376,200 | |
Euro Stoxx 50 Index Dividend Future December 2020 | | EUR | | | 3,492,060 | | | BNP Paribas S.A. | | | 12/18/20 | | | EUR | | | 3,492 | | | | 1,209,323 | | | | — | | | | 1,209,323 | |
Euro Stoxx 50 Index Dividend Future December 2020 | | EUR | | | 2,995,000 | | | BNP Paribas S.A. | | | 12/18/20 | | | EUR | | | 2,995 | | | | 1,046,687 | | | | — | | | | 1,046,687 | |
Euro Stoxx 50 Index Dividend Future December 2020 | | EUR | | | 4,025,500 | | | BNP Paribas S.A. | | | 12/18/20 | | | EUR | | | 4,026 | | | | 1,343,887 | | | | — | | | | 1,343,887 | |
Euro Stoxx 50 Index Dividend Future December 2020 | | EUR | | | 12,076,500 | | | BNP Paribas S.A. | | | 12/18/20 | | | EUR | | | 12,077 | | | | 4,031,661 | | | | — | | | | 4,031,661 | |
Euro Stoxx 50 Index Dividend Future December 2020 | | EUR | | | 11,021,390 | | | BNP Paribas S.A. | | | 12/18/20 | | | EUR | | | 11,021 | | | | 2,149,718 | | | | — | | | | 2,149,718 | |
S&P 500 Index Annual Dividend Future December 2020 | | USD | | | 12,569,450 | | | Goldman Sachs
International | | | 12/18/20 | | | USD | | | 12,569 | | | | 2,246,650 | | | | — | | | | 2,246,650 | |
SGX Nikkei Stock Average Dividend Point Index Future April 2020 | | JPY | | | 526,875,000 | | | BNP Paribas S.A. | | | 04/01/21 | | | JPY | | | 526,875 | | | | 579,350 | | | | — | | | | 579,350 | |
SGX Nikkei Stock Average Dividend Point Index Future April 2020 | | JPY | | | 1,489,920,000 | | | BNP Paribas S.A. | | | 04/01/21 | | | JPY | | | 1,489,920 | | | | 2,911,112 | | | | — | | | | 2,911,112 | |
SGX Nikkei Stock Average Dividend Point Index Future April 2020 | | JPY | | | 738,707,500 | | | BNP Paribas S.A. | | | 04/01/21 | | | JPY | | | 738,708 | | | | 1,552,249 | | | | — | | | | 1,552,249 | |
SGX Nikkei Stock Average Dividend Point Index Future April 2020 | | JPY | | | 353,080,000 | | | BNP Paribas S.A. | | | 04/01/21 | | | JPY | | | 353,080 | | | | 689,873 | | | | — | | | | 689,873 | |
SGX Nikkei Stock Average Dividend Point Index Future April 2020 | | JPY | | | 393,210,000 | | | BNP Paribas S.A. | | | 04/01/21 | | | JPY | | | 393,210 | | | | 795,691 | | | | — | | | | 795,691 | |
Euro Stoxx 50 Index Dividend Future December 2021 | | EUR | | | 5,319,950 | | | BNP Paribas S.A. | | | 12/17/21 | | | EUR | | | 5,320 | | | | 1,085,814 | | | | — | | | | 1,085,814 | |
Euro Stoxx 50 Index Dividend Future December 2021 | | EUR | | | 5,510,880 | | | BNP Paribas S.A. | | | 12/17/21 | | | EUR | | | 5,511 | | | | 877,551 | | | | — | | | | 877,551 | |
Euro Stoxx 50 Index Dividend Future December 2021 | | EUR | | | 5,690,160 | | | BNP Paribas S.A. | | | 12/17/21 | | | EUR | | | 5,690 | | | | 499,022 | | | | — | | | | 499,022 | |
S&P 500 Index Annual Dividend Future December 2021 | | USD | | | 15,887,988 | | | BNP Paribas S.A. | | | 12/17/21 | | | USD | | | 15,888 | | | | 3,190,688 | | | | — | | | | 3,190,688 | |
SGX Nikkei Stock Average Dividend Point Index Future April 2021 | | JPY | | | 755,250,000 | | | BNP Paribas S.A. | | | 04/01/22 | | | JPY | | | 755,250 | | | | 1,338,464 | | | | — | | | | 1,338,464 | |
SGX Nikkei Stock Average Dividend Point Index Future April 2021 | | JPY | | | 765,120,000 | | | BNP Paribas S.A. | | | 04/01/22 | | | JPY | | | 765,120 | | | | 1,335,667 | | | | — | | | | 1,335,667 | |
SGX Nikkei Stock Average Dividend Point Index Future April 2021 | | JPY | | | 532,500,000 | | | BNP Paribas S.A. | | | 04/01/22 | | | JPY | | | 532,500 | | | | 567,257 | | | | — | | | | 567,257 | |
SGX Nikkei Stock Average Dividend Point Index Future April 2021 | | JPY | | | 1,509,120,000 | | | BNP Paribas S.A. | | | 04/01/22 | | | JPY | | | 1,509,120 | | | | 2,857,078 | | | | — | | | | 2,857,078 | |
Euro Stoxx 50 Index Dividend Future December 2022 | | EUR | | | 5,584,320 | | | BNP Paribas S.A. | | | 12/16/22 | | | EUR | | | 5,584 | | | | 440,313 | | | | — | | | | 440,313 | |
Euro Stoxx 50 Index Dividend Future December 2022 | | EUR | | | 2,737,500 | | | BNP Paribas S.A. | | | 12/16/22 | | | EUR | | | 2,738 | | | | 256,267 | | | | — | | | | 256,267 | |
Euro Stoxx 50 Index Dividend Future December 2022 | | EUR | | | 11,348,860 | | | BNP Paribas S.A. | | | 12/16/22 | | | EUR | | | 11,349 | | | | 367,533 | | | | — | | | | 367,533 | |
Euro Stoxx 50 Index Dividend Future December 2022 | | EUR | | | 5,466,780 | | | BNP Paribas S.A. | | | 12/16/22 | | | EUR | | | 5,467 | | | | 549,669 | | | | — | | | | 549,669 | |
SGX Nikkei Stock Average Dividend Point Index Future April 2022 | | JPY | | | 528,750,000 | | | BNP Paribas S.A. | | | 04/03/23 | | | JPY | | | 528,750 | | | | 688,184 | | | | — | | | | 688,184 | |
SGX Nikkei Stock Average Dividend Point Index Future April 2022 | | JPY | | | 535,000,000 | | | JPMorgan Chase
Bank N.A. | | | 04/03/23 | | | JPY | | | 535,000 | | | | 633,218 | | | | — | | | | 633,218 | |
| | | | | | | | | | | | | | | | | | | | | | | | | | | | | | |
| | | $ | 77,088,649 | | | $ | — | | | $ | 77,088,649 | |
| | | | | | | | | | | | | | | | | | | | | | | | | | | | | | |
| | (a) | At termination, the fixed amount paid (received) will be exchanged for the total return of the reference entity. | |
Balances Reported in the Consolidated Statement of Assets and Liabilities for Centrally Cleared Swaps and OTC Derivatives
| | | | | | | | | | | | | | | | |
| | | Swap
Premiums
Paid | | | Swap
Premiums
Received | | | Unrealized
Appreciation | | | Unrealized
Depreciation | |
Centrally Cleared Swaps(a) | | $ | 12,925 | | | $ | (6,469,334 | ) | | $ | 11,734,948 | | | $ | (4,580,253 | ) |
OTC Derivatives | | $ | — | | | $ | (14,609,713 | ) | | $ | 100,510,455 | | | $ | (2,542,509 | ) |
| | | | | | | | | | | | | | | | |
| | (a) | Includes cumulative appreciation (depreciation) on centrally cleared swaps, as reported in the Consolidated Schedule of Investments. Only current day’s variation margin is reported within the Consolidated Statement of Assets and Liabilities and is net of any previously paid (received) swap premium amounts. | |
| | |
| 22 | | 2017 BLACKROCK ANNUAL REPORTTO SHAREHOLDERS |
| | |
Consolidated Schedule of Investments (continued) October 31, 2017 | | BlackRock Global Allocation Fund, Inc. (Percentages shown are based on Net Assets) |
Derivative Financial Instruments Categorized by Risk Exposure
As of period end, the fair values of derivative financial instruments located in the Consolidated Statement of Assets and Liabilities were as follows:
| | | | | | | | | | | | | | | | | | | | | | | | | | | | |
| | | Commodity
Contracts | | | Credit
Contracts | | | Equity
Contracts | | | Foreign
Currency
Exchange
Contracts | | | Interest
Rate
Contracts | | | Other
Contracts | | | Total | |
Assets — Derivative Financial Instruments | | | | | | | | | | | | | | | | | | | | | | | | | | | | |
Forward foreign currency exchange contracts | | | | | | | | | | | | | | | | | | | | | | | | | | | | |
Unrealized appreciation on forward foreign currency exchange contracts | | $ | — | | | $ | — | | | $ | — | | | $ | 36,201,905 | | | $ | — | | | $ | — | | | $ | 36,201,905 | |
Options purchased | | | | | | | | | | | | | | | | | | | | | | | | | | | | |
Investments at value — unaffiliated(a) | | | — | | | | — | | | | 75,661,768 | | | | 25,812,411 | | | | 22,257,100 | | | | — | | | | 123,731,279 | |
Swaps — centrally cleared | | | | | | | | | | | | | | | | | | | | | | | | | | | | |
Net unrealized appreciation(b) | | | — | | | | — | | | | — | | | | — | | | | 11,734,948 | | | | — | | | | 11,734,948 | |
Swaps — OTC | | | | | | | | | | | | | | | | | | | | | | | | | | | | |
Unrealized appreciation on OTC swaps; Swap premiums paid | | | — | | | | 84,801 | | | | 77,088,649 | | | | — | | | | 23,337,005 | | | | — | | | | 100,510,455 | |
| | | | | | | | | | | | | | | | | | | | | | | | | | | | |
| | $ | — | | | $ | 84,801 | | | $ | 152,750,417 | | | $ | 62,014,316 | | | $ | 57,329,053 | | | $ | — | | | $ | 272,178,587 | |
| | | | | | | | | | | | | | | | | | | | | | | | | | | | |
| Liabilities — Derivative Financial Instruments | | | | | | | | | | | | | | | | | | | | | |
Futures contracts | | | | | | | | | | | | | | | | | | | | | | | | | | | | |
Net unrealized depreciation(b) | | $ | — | | | $ | — | | | $ | 17,531,799 | | | $ | — | | | $ | — | | | $ | — | | | $ | 17,531,799 | |
Forward foreign currency exchange contracts | | | | | | | | | | | | | | | | | | | | | | | | | | | | |
Unrealized depreciation on forward foreign currency exchange contracts | | | — | | | | — | | | | — | | | | 22,047,110 | | | | — | | | | — | | | | 22,047,110 | |
Options written | | | | | | | | | | | | | | | | | | | | | | | | | | | | |
Options written at value | | | — | | | | — | | | | 32,040,206 | | | | 7,528,016 | | | | 25,931,132 | | | | — | | | | 65,499,354 | |
Swaps — centrally cleared | | | | | | | | | | | | | | | | | | | | | | | | | | | | |
Net unrealized depreciation(b) | | | — | | | | 957,911 | | | | — | | | | — | | | | 3,622,342 | | | | — | | | | 4,580,253 | |
Swaps — OTC | | | | | | | | | | | | | | | | | | | | | | | | | | | | |
Unrealized depreciation on OTC swaps; Swap premiums received | | | — | | | | 17,152,222 | | | | — | | | | — | | | | — | | | | — | | | | 17,152,222 | |
| | | | | | | | | | | | | | | | | | | | | | | | | | | | |
| | $ | — | | | $ | 18,110,133 | | | $ | 49,572,005 | | | $ | 29,575,126 | | | $ | 29,553,474 | | | $ | — | | | $ | 126,810,738 | |
| | | | | | | | | | | | | | | | | | | | | | | | | | | | |
| | (a) | Includes options purchased at value as reported in the Consolidated Schedule of Investments. | |
| | (b) | Includes cumulative appreciation (depreciation) on futures contracts and centrally cleared swaps, if any, as reported in the Consolidated Schedule of Investments. Only current day’s variation margin is reported within the Consolidated Statement of Assets and Liabilities. | �� |
| | | | | | | | | | | | | | | | | | | | | | | | | | | | |
For the year ended October 31, 2017, the effect of derivative financial instruments in the Consolidated Statement of Operations was as follows: | |
| | | Commodity
Contracts | | | Credit Contracts | | | Equity Contracts | | | Foreign
Currency
Exchange
Contracts | | | Interest
Rate
Contracts | | | Other
Contracts | | | Total | |
Net Realized Gain (Loss) from: | | | | | | | | | | | | | | | | | | | | | | | | | | | | |
Futures contracts | | $ | — | | | $ | — | | | $ | (278,871,353 | ) | | $ | — | | | $ | — | | | $ | — | | | $ | (278,871,353 | ) |
Forward foreign currency exchange contracts | | | — | | | | — | | | | — | | | | 177,206,336 | | | | — | | | | — | | | | 177,206,336 | |
Options purchased(a) | | | — | | | | — | | | | 117,878,370 | | | | 14,014,310 | | | | (9,349,105 | ) | | | — | | | | 122,543,575 | |
Options written | | | — | | | | — | | | | 48,077,714 | | | | 73,039,131 | | | | (16,388,975 | ) | | | — | | | | 104,727,870 | |
Swaps | | | — | | | | 8,832,033 | | | | 15,434,957 | | | | — | | | | (27,433,265 | ) | | | — | | | | (3,166,275 | ) |
| | | | | | | | | | | | | | | | | | | | | | | | | | | | |
| | $ | — | | | $ | 8,832,033 | | | $ | (97,480,312 | ) | | $ | 264,259,777 | | | $ | (53,171,345 | ) | | $ | — | | | $ | 122,440,153 | |
| | | | | | | | | | | | | | | | | | | | | | | | | | | | |
| Net Change in Unrealized Appreciation (Depreciation) on: | |
Futures contracts | | $ | — | | | $ | — | | | $ | (43,250,257 | ) | | $ | — | | | $ | — | | | $ | — | | | $ | (43,250,257 | ) |
Forward foreign currency exchange contracts | | | — | | | | — | | | | — | | | | 8,991,790 | | | | — | | | | — | | | | 8,991,790 | |
Options purchased(b) | | | — | | | | — | | | | (21,660,252 | ) | | | (5,198,893 | ) | | | (615,402 | ) | | | — | | | | (27,474,547 | ) |
Options written | | | — | | | | — | | | | 6,631,170 | | | | (14,198,875 | ) | | | 1,744,940 | | | | — | | | | (5,822,765 | ) |
Swaps | | | — | | | | (1,508,083 | ) | | | 66,317,309 | | | | — | | | | 59,683,256 | | | | — | | | | 124,492,482 | |
| | | | | | | | | | | | | | | | | | | | | | | | | | | | |
| | $ | — | | | $ | (1,508,083 | ) | | $ | 8,037,970 | | | $ | (10,405,978 | ) | | $ | 60,812,794 | | | $ | — | | | $ | 56,936,703 | |
| | | | | | | | | | | | | | | | | | | | | | | | | | | | |
| | (a) | Options purchased are included in net realized gain (loss) from investments. | |
| | (b) | Options purchased are included in net change in unrealized appreciation (depreciation) on investments. | |
| | | | |
| CONSOLIDATED SCHEDULE OF INVESTMENTS | | | 23 | |
| | |
Consolidated Schedule of Investments (continued) October 31, 2017 | | BlackRock Global Allocation Fund, Inc. (Percentages shown are based on Net Assets) |
Average Quarterly Balances of Outstanding Derivative Financial Instruments
| | | | |
Futures contracts: | | | | |
Average notional value of contracts — long | | $ | 50,837,209 | |
Average notional value of contracts — short | | $ | 994,384,172 | |
Forward foreign currency exchange contracts: | | | | |
Average amounts purchased — in USD | | $ | 2,066,484,841 | |
Average amounts sold — in USD | | $ | 808,252,869 | |
Options: | | | | |
Average value of option contracts purchased | | $ | 249,424,815 | |
Average value of option contracts written | | $ | 53,112,257 | |
Average notional value of swaption contracts purchased | | $ | 4,244,530,460 | |
Average notional value of swaption contracts written | | $ | 6,057,647,339 | |
Credit default swaps: | | | | |
Average notional value — buy protection | | $ | 338,928,358 | |
Average notional value — sell protection | | $ | 38,513,835 | |
Interest rate swaps: | | | | |
Average notional value — pays fixed rate | | $ | 1,265,061,858 | |
Average notional amount — receives fixed rate | | $ | 1,557,726,753 | |
Currency swaps: | | | | |
Average notional value — pays | | $ | 483,906,421 | |
Total return swaps: | | | | |
Average notional amounts | | $ | 392,769,385 | |
For more information about the Fund’s investment risks regarding derivative financial instruments, refer to the Notes to Consolidated Financial Statements.
Derivative Financial Instruments — Offsetting as of Period End
The Fund’s derivative assets and liabilities (by type) were as follows:
| | | | | | | | |
| | | Assets | | | Liabilities | |
Derivative Financial Instruments: | | | | | | | | |
Futures contracts | | $ | — | | | $ | 1,839,967 | |
Swaps — Centrally cleared | | | — | | | | 512,033 | |
Forward foreign currency exchange contracts | | | 36,201,905 | | | | 22,047,110 | |
Options | | | 123,731,279 | (a) | | | 65,499,354 | |
Swaps — OTC(b) | | | 100,510,455 | | | | 17,152,222 | |
| | | | | | | | |
Total derivative assets and liabilities in the Consolidated Statement of Assets and Liabilities | | $ | 260,443,639 | | | $ | 107,050,686 | |
Derivatives not subject to a Master Netting Agreement or similar agreement (“MNA”) | | | — | | | | (2,352,000 | ) |
| | | | | | | | |
Total derivative assets and liabilities subject to an MNA | | $ | 260,443,639 | | | $ | 104,698,686 | |
| | | | | | | | |
| | (a) | Includes options purchased at value which is included in Investments at value — unaffiliated in the Consolidated Statement of Assets and Liabilities and reported in the Consolidated Schedule of Investments. | |
| | (b) | Includes unrealized appreciation (depreciation) on OTC swaps and swap premiums (paid/received) in the Consolidated Statement of Assets and Liabilities. | |
The following table presents the Fund’s derivative assets (and liabilities) by counterparty net of amounts available for offset under a Master Netting Agreement (“MNA”) and net of the related collateral received (and pledged) by the Fund:
| | | | | | | | | | | | | | | | | | | | |
| Counterparty | | Derivative
Assets
Subject to
an MNA by
Counterparty | | | Derivatives
Available
for Offset (a) | | | Non-cash
Collateral
Received | | | Cash
Collateral
Received (b) | | | Net Amount
of Derivative
Assets (c),(d) | |
Bank of America N.A. | | $ | 23,494,056 | | | $ | (2,490,479 | ) | | $ | — | | | $ | (19,905,000 | ) | | $ | 1,098,577 | |
Barclays Bank PLC | | | 10,002,644 | | | | (10,002,644 | ) | | | — | | | | — | | | | — | |
BNP Paribas S.A. | | | 82,921,668 | | | | (11,767,788 | ) | | | — | | | | (71,153,880 | ) | | | — | |
Brown Brothers Harriman & Co. | | | 17 | | | | — | | | | — | | | | — | | | | 17 | |
Citibank N.A. | | | 6,368,286 | | | | (1,655,064 | ) | | | — | | | | (2,240,771 | ) | | | 2,472,451 | |
Deutsche Bank AG | | | 11,734,903 | | | | (8,212,091 | ) | | | — | | | | (2,837,000 | ) | | | 685,812 | |
Goldman Sachs International | | | 37,830,344 | | | | (24,861,731 | ) | | | — | | | | (9,350,000 | ) | | | 3,618,613 | |
JPMorgan Chase Bank N.A. | | | 12,509,768 | | | | — | | | | — | | | | (580,000 | ) | | | 11,929,768 | |
Morgan Stanley International PLC(f) | | | 9,842,913 | | | | (7,075,072 | ) | | | — | | | | (2,767,841 | ) | | | — | |
UBS AG | | | 65,739,040 | | | | (28,879,201 | ) | | | (10,327,444 | ) | | | (21,775,000 | ) | | | 4,757,395 | |
| | | | | | | | | | | | | | | | | | | | |
| | $ | 260,443,639 | | | $ | (94,944,070 | ) | | $ | (10,327,444 | ) | | $ | (130,609,492 | ) | | $ | 24,562,633 | |
| | | | | | | | | | | | | | | | | | | | |
| | |
| 24 | | 2017 BLACKROCK ANNUAL REPORTTO SHAREHOLDERS |
| | |
Consolidated Schedule of Investments (continued) October 31, 2017 | | BlackRock Global Allocation Fund, Inc. (Percentages shown are based on Net Assets) |
| | | | | | | | | | | | | | | | | | | | |
| Counterparty | | Derivative
Liabilities
Subject to
an MNA by
Counterparty | | | Derivatives
Available for
Offset (a) | | | Non-cash
Collateral
Pledged | | | Cash
Collateral
Pledged | | | Net Amount
of Derivative
Liabilities (d),(e) | |
Bank of America N.A. | | $ | 2,490,479 | | | $ | (2,490,479 | ) | | $ | — | | | $ | — | | | $ | — | |
Barclays Bank PLC | | | 19,757,260 | | | | (10,002,644 | ) | | | (9,754,616 | ) | | | — | | | | — | |
BNP Paribas S.A. | | | 11,767,788 | | | | (11,767,788 | ) | | | — | | | | — | | | | — | |
Citibank N.A. | | | 1,655,064 | | | | (1,655,064 | ) | | | — | | | | — | | | | — | |
Deutsche Bank AG | | | 8,212,091 | | | | (8,212,091 | ) | | | — | | | | — | | | | — | |
Goldman Sachs International | | | 24,861,731 | | | | (24,861,731 | ) | | | — | | | | — | | | | — | |
Morgan Stanley International PLC(f) | | | 7,075,072 | | | | (7,075,072 | ) | | | — | | | | — | | | | — | |
UBS AG | | | 28,879,201 | | | | (28,879,201 | ) | | | — | | | | — | | | | — | |
| | | | | | | | | | | | | | | | | | | | |
| | $ | 104,698,686 | | | $ | (94,944,070 | ) | | $ | (9,754,616 | ) | | $ | — | | | $ | — | |
| | | | | | | | | | | | | | | | | | | | |
| | (a) | The amount of derivatives available for offset is limited to the amount of derivative asset and/or liabilities that are subject to an MNA. | |
| | (b) | Excess of collateral received from the individual counterparty is not shown for financial reporting purposes. | |
| | (c) | Net amount represents the net amount receivable from the counterparty in the event of default. | |
| | (d) | Net amount may also include forward foreign currency exchange contracts and currency options that are not required to be collateralized. | |
| | (e) | Net amount represents the net amount payable due to counterparty in the event of default. Net amount may be offset further by the options written receivable/payable on the Consolidated Statement of Assets and Liabilities. | |
| | (f) | Includes derivatives owned by the BlackRock Cayman Global Allocation Fund I, Ltd., a wholly-owned subsidiary of the Fund. See Note 1. | |
Fair Value Hierarchy as of Period End
Various inputs are used in determining the fair value of investments and derivative financial instruments. For information about the Fund’s policy regarding valuation of investments and derivative financial instruments, refer to the Notes to Consolidated Financial Statements.
The following tables summarize the Fund’s investments and derivative financial instruments categorized in the disclosure hierarchy:
| | | | | | | | | | | | | | | | |
| | | Level 1 | | | Level 2 | | | Level 3 | | | Total | |
Assets: | | | | | | | | | | | | | | | | |
Investments: | | | | | | | | | | | | | | | | |
Common Stocks: | | | | | | | | | | | | | | | | |
Australia | | $ | — | | | $ | 2,664,112 | | | $ | — | | | $ | 2,664,112 | |
Belgium | | | — | | | | 166,333,576 | | | | — | | | | 166,333,576 | |
Brazil | | | 84,541,654 | | | | — | | | | — | | | | 84,541,654 | |
Canada | | | 146,121,886 | | | | — | | | | — | | | | 146,121,886 | |
China | | | 89,815,561 | | | | 64,131,708 | | | | — | | | | 153,947,269 | |
Czech Republic | | | — | | | | 15,354,902 | | | | — | | | | 15,354,902 | |
Denmark | | | — | | | | 2,659,337 | | | | — | | | | 2,659,337 | |
Finland | | | — | | | | 99,916,142 | | | | — | | | | 99,916,142 | |
France | | | 3,632,048 | | | | 1,110,569,200 | | | | — | | | | 1,114,201,248 | |
Germany | | | — | | | | 784,069,522 | | | | — | | | | 784,069,522 | |
Hong Kong | | | 7,976,673 | | | | 271,413,954 | | | | — | | | | 279,390,627 | |
India | | | 4,572,348 | | | | 518,684,794 | | | | — | | | | 523,257,142 | |
Indonesia | | | — | | | | 42,207,800 | | | | — | | | | 42,207,800 | |
Ireland | | | 11,571,127 | | | | 57,116 | | | | — | | | | 11,628,243 | |
Israel | | | 30,958 | | | | — | | | | — | | | | 30,958 | |
Italy | | | 173,366,224 | | | | 205,856,079 | | | | — | | | | 379,222,303 | |
Japan | | | 682,855 | | | | 3,261,197,574 | | | | — | | | | 3,261,880,429 | |
Mexico | | | 903,957 | | | | — | | | | — | | | | 903,957 | |
Netherlands | | | 44,467 | | | | 521,205,575 | | | | — | | | | 521,250,042 | |
Norway | | | — | | | | 535,636 | | | | — | | | | 535,636 | |
Peru | | | 20,735 | | | | — | | | | — | | | | 20,735 | |
Poland | | | — | | | | 5,643,649 | | | | — | | | | 5,643,649 | |
Portugal | | | 30,678,518 | | | | — | | | | — | | | | 30,678,518 | |
Singapore | | | — | | | | 104,071,267 | | | | — | | | | 104,071,267 | |
South Africa | | | — | | | | 902,286 | | | | — | | | | 902,286 | |
South Korea | | | 63,603,895 | | | | 174,305,388 | | | | — | | | | 237,909,283 | |
Spain | | | — | | | | 149,178,828 | | | | — | | | | 149,178,828 | |
Sweden | | | — | | �� | | 236,795,340 | | | | — | | | | 236,795,340 | |
Switzerland | | | — | | | | 460,199,938 | | | | — | | | | 460,199,938 | |
Taiwan | | | — | | | | 252,429,134 | | | | — | | | | 252,429,134 | |
Thailand | | | 45,372,657 | | | | 30,053,340 | | | | — | | | | 75,425,997 | |
| | | | |
| CONSOLIDATED SCHEDULE OF INVESTMENTS | | | 25 | |
| | |
Consolidated Schedule of Investments (continued) October 31, 2017 | | BlackRock Global Allocation Fund, Inc. (Percentages shown are based on Net Assets) |
| | | | | | | | | | | | | | | | |
| | | Level 1 | | | Level 2 | | | Level 3 | | | Total | |
Turkey | | $ | — | | | $ | 739,383 | | | $ | — | | | $ | 739,383 | |
United Arab Emirates | | | — | | | | 130,329,723 | | | | — | | | | 130,329,723 | |
United Kingdom | | | 449,997,764 | | | | 903,946,694 | | | | — | | | | 1,353,944,458 | |
United States | | | 11,398,767,425 | | | | — | | | | 2,257,426 | | | | 11,401,024,851 | |
Corporate Bonds | | | — | | | | 1,385,177,836 | | | | 38,940,178 | | | | 1,424,118,014 | |
Floating Rate Loan Interests | | | — | | | | 197,643,768 | | | | — | | | | 197,643,768 | |
Foreign Agency Obligations | | | — | | | | 3,901,596,929 | | | | — | | | | 3,901,596,929 | |
Investment Companies | | | 1,348,814,202 | | | | — | | | | — | | | | 1,348,814,202 | |
Non-Agency Mortgage-Backed Securities | | | — | | | | 40,458,836 | | | | — | | | | 40,458,836 | |
Capital Trusts | | | — | | | | 367,112,912 | | | | — | | | | 367,112,912 | |
Preferred Stocks | | | 247,615,829 | | | | 1,051,493 | | | | 601,457,562 | | | | 850,124,884 | |
Trust Preferreds | | | 74,344,181 | | | | 124,270,312 | | | | — | | | | 198,614,493 | |
U.S. Treasury Obligations | | | — | | | | 5,959,800,033 | | | | — | | | | 5,959,800,033 | |
Warrants | | | — | | | | — | | | | 213 | | | | 213 | |
Short-Term Securities: | | | | | | | | | | | | | | | | |
Time Deposits | | | — | | | | 343,345 | | | | — | | | | 343,345 | |
U.S. Treasury Obligations | | | — | | | | 2,211,682,111 | | | | — | | | | 2,211,682,111 | |
Money Market Funds | | | 98,212,840 | | | | — | | | | — | | | | 98,212,840 | |
Options Purchased | | | | | | | | | | | | | | | | |
Equity contracts | | | — | | | | 75,661,768 | | | | — | | | | 75,661,768 | |
Foreign currency exchange contracts | | | — | | | | 25,812,411 | | | | — | | | | 25,812,411 | |
Interest rate contracts | | | — | | | | 22,257,100 | | | | — | | | | 22,257,100 | |
| | | | | | | | | | | | | | | | |
Subtotal | | $ | 14,280,687,804 | | | $ | 23,828,320,851 | | | $ | 642,655,379 | | | $ | 38,751,664,034 | |
| | | | | | | | | | | | | | | | |
Investments Valued at NAV(a) | | | | | | | | | | | | | | | 307,248,940 | |
| | | | | | | | | | | | | | | | |
Total Investments | | | | | | | | | | | | | | | | |
| | | | | | | | | | | | | | $ | 39,058,912,974 | |
| | | | | | | | | | | | | | | | |
| | | | | | | | | | | | | | | | |
Derivative Financial Instruments(b) | | | | | | | | | | | | | | | | |
Assets: | | | | | | | | | | | | | | | | |
Credit contracts | | $ | — | | | $ | 84,801 | | | $ | — | | | $ | 84,801 | |
Equity contracts | | | — | | | | 77,088,649 | | | | — | | | | 77,088,649 | |
Foreign currency exchange contracts | | | — | | | | 36,201,905 | | | | — | | | | 36,201,905 | |
Interest rate contracts | | | — | | | | 35,071,953 | | | | — | | | | 35,071,953 | |
Liabilities: | | | | | | | | | | | | | | | | |
Credit contracts | | | — | | | | (3,500,420 | ) | | | — | | | | (3,500,420 | ) |
Equity contracts | | | (17,531,799 | ) | | | (32,040,206 | ) | | | — | | | | (49,572,005 | ) |
Foreign currency exchange contracts | | | — | | | | (29,575,126 | ) | | | — | | | | (29,575,126 | ) |
Interest rate contracts | | | — | | | | (29,553,474 | ) | | | — | | | | (29,553,474 | ) |
| | | | | | | | | | | | | | | | |
| | $ | (17,531,799 | ) | | $ | 53,778,082 | | | $ | — | | | $ | 36,246,283 | |
| | | | | | | | | | | | | | | | |
| | (a) | As of October 31, 2017, certain of the Fund’s Investments were fair valued using net asset value (“NAV”) per share and have been excluded from the fair value hierarchy. | |
| | (b) | Derivative financial instruments are swaps, futures contracts, forward foreign currency exchange contracts and options written. Swaps, futures contracts and forward foreign currency exchange contracts are valued at the unrealized appreciation (depreciation) on the instrument and options written are shown at value. | |
A reconciliation of Level 3 investments is presented when the Fund had a significant amount of Level 3 investments at the beginning and/or end of the period in relation to net assets. The following table is a reconciliation of Level 3 investments for which significant unobservable inputs were used in determining fair value:
| | | | | | | | | | | | | | | | | | | | | | | | |
| | | Common
Stocks | | | Corporate
Bonds | | | Floating Rate
Loan
Interests | | | Preferred Securities | | | Warrants | | | Total | |
Assets: | | | | | | | | | | | | | | | | | | | | |
Opening balance, as of October 31, 2016 | | $ | 3,391,206 | | | $ | 141,246,994 | | | $ | 111,256,662 | | | $ | 604,588,415 | | | | — | | | $ | 860,483,277 | |
Transfers into Level 3 | | | — | | | | — | | | | — | | | | — | | | | 4,874,982 | | | | 4,874,982 | |
Transfers out of Level 3 | | | — | | | | — | | | | (50,082,056 | ) | | | — | | | | — | | | | (50,082,056 | ) |
Accrued discounts/premiums | | | — | | | | (37,954 | ) | | | — | | | | — | | | | — | | | | (37,954 | ) |
Net realized gain (loss) | | | (17,322,913 | ) | | | (79,324,002 | ) | | | 259,930 | | | | — | | | | — | | | | (96,386,985 | ) |
Net change in unrealized appreciation (depreciation)(a),(b) | | | 47,302,757 | | | | 25,468,808 | | | | (1,844,317 | ) | | | (11,082,509 | ) | | | (4,874,769 | ) | | | 54,969,970 | |
Purchases | | | — | | | | 8,061,467 | | | | — | | | | 7,951,656 | | | | — | | | | 16,013,123 | |
Sales | | | (31,113,624 | ) | | | (56,475,135 | ) | | | (59,590,219 | ) | | | — | | | | — | | | | (147,178,978 | ) |
| | | | | | | | | | | | | | | | | | | | | | | | |
Closing Balance, as of October 31, 2017 | | $ | 2,257,426 | | | $ | 38,940,178 | | | $ | — | | | $ | 601,457,562 | | | $ | 213 | | | $ | 642,655,379 | |
| | | | | | | | | | | | | | | | | | | | | | | | |
Net change in unrealized appreciation (depreciation) on investments still held at October 31, 2017(b) | | $ | 1,220,680 | | | $ | (22,070,569 | ) | | $ | — | | | $ | (11,082,509 | ) | | $ | (4,874,769 | ) | | $ | (36,807,167 | ) |
| | | | | | | | | | | | | | | | | | | | | | | | |
| | (a) | Included in the related net change in unrealized appreciation (depreciation) in the Consolidated Statement of Operations. | |
| | (b) | Any difference between net change in unrealized appreciation (depreciation) and net change in unrealized appreciation (depreciation) on investments still held at October 31, 2017 is generally due to investments no longer held or categorized as Level 3 at period end. | |
| | |
| 26 | | 2017 BLACKROCK ANNUAL REPORTTO SHAREHOLDERS |
| | |
Consolidated Schedule of Investments (continued) October 31, 2017 | | BlackRock Global Allocation Fund, Inc. (Percentages shown are based on Net Assets) |
The following table summarizes the valuation approaches used and unobservable inputs utilized by the BlackRock Global Valuation Methodologies Committee (the “Global Valuation Committee”) to determine the value of certain of the Fund’s Level 3 investments as of period end. The table does not include Level 3 investments with values based upon unadjusted third party pricing information in the amount of $197,718. A significant change in the third party information could result in a significantly lower or higher value of such Level 3 investments.
| | | | | | | | | | | | | | | | |
| | | Value | | | Valuation
Approaches | | Unobservable Inputs | | Range of
Unobservable
Inputs Utilized | | | Weighted
Average of
Unobservable
Inputs | |
Assets: | | | | | | | | | | | | | | | | |
Common Stocks(c) | | $ | 2,257,426 | | | Market | | Estimated Recovery Value(a) | | | — | | | | — | |
| | | | | | | | Gross Billings Multiple(a) | | | 7.5x | | | | — | |
| | | | | | | | Time to Exit(a) | | | 1 year | | | | — | |
| | | | | | | | Volatility(a) | | | 26 | % | | | — | |
| | | | | | | | Billing Growth Rate(a) | | | 30 | % | | | — | |
Corporate Bonds | | | 38,742,673 | | | Income | | Discount Rate(b) | | | 18.00 | % | | | — | |
| | | | | | Market | | Estimated Recovery Value(a) | | | — | | | | — | |
Preferred Stocks(c)(d) | | | 601,457,562 | | | Market | | Gross Billings Multiple(a) | | | 7.5x | | | | — | |
| | | | | | | | Revenue Growth Rate(a) | | | 39% - 110 | % | | | 74.26 | % |
| | | | | | | | Billings Growth Rate(a) | | | 30 | % | | | — | |
| | | | | | | | Revenue Multiple(a) | | | 8.00x - 11.75x | | | | 10.61x | |
| | | | | | | | Time to Exit(a)(b) | | | 1 year | | | | — | |
| | | | | | | | Volatility(a)(b) | | | 26% - 65 | % | | | 40.80 | % |
| | | | | | | | Discount Rate(b) | | | 20 | % | | | — | |
| | | | | | | | Exit Scenario Probability | | | 5% - 85 | % | | | — | |
| | | | | | | | | | | | | | | | |
| | $ | 642,457,661 | | | | | | | | | | | | | |
| | | | | | | | | | | | | | | | |
| | (a) | Increase in unobservable input may result in a significant increase to value, while a decrease in unobservable input may result in a significant decrease to value. | |
| | (b) | Decrease in unobservable input may result in a significant increase to value, while an increase in unobservable input may result in a significant decrease to value. | |
| | (c) | For the year ended October 31, 2017, the valuation technique changed for certain investments in common stocks and preferred stocks with a total value of $50,087,486 from a hybrid model using Probability-Weighted Expected Return Model (“PWERM”) and Option Pricing Model (“OPM”) to using only OPM. The change was due to consideration of liquidation preferences and exit strategy. | |
| | (d) | For the year ended October 31, 2017, the valuation technique changed for certain investments in preferred stocks with a total value of $94,546,763 from a hybrid model using PWERM and OPM to using only PWERM. The change was due to consideration of liquidation preferences and exit strategy. | |
See notes to consolidated financial statements.
| | | | |
| CONSOLIDATED SCHEDULE OF INVESTMENTS | | | 27 | |
Consolidated Statement of Assets and Liabilities
October 31, 2017
| | | | |
| | | BlackRock Global
Allocation Fund, Inc. | |
| |
ASSETS | | | | |
Investments at value — unaffiliated (including securities loaned at value of $301,654,977) (cost — $32,554,403,331) | | $ | 38,210,477,998 | |
Investments at value — affiliated (cost — $987,786,167) | | | 848,434,976 | |
Cash pledged as collateral for centrally cleared swaps | | | 13,051,000 | |
Receivables: | | | | |
Investments sold | | | 455,876,224 | |
Interest — unaffiliated | | | 77,167,203 | |
Dividends — unaffiliated | | | 41,265,926 | |
Capital shares sold | | | 19,405,602 | |
Options written | | | 14,921,008 | |
Securities lending income — affiliated | | | 353,630 | |
Dividends — affiliated | | | 23,536 | |
Unrealized appreciation on: | | | | |
OTC derivatives | | | 100,510,455 | |
Forward foreign currency exchange contracts | | | 36,201,905 | |
Prepaid expenses | | | 313,703 | |
| | | | |
Total assets | | | 39,818,003,166 | |
| | | | |
|
LIABILITIES | |
Cash collateral on securities loaned at value | | | 307,194,433 | |
Foreign bank overdraft | | | 1,422,815 | |
Bank overdraft | | | 83,080,994 | |
Cash received as collateral for OTC derivatives | | | 137,257,771 | |
Options written at value (premiums received — $90,757,580) | | | 65,499,354 | |
Payables: | | | | |
To broker — short sales | | | 71,085,556 | |
Capital shares redeemed | | | 56,224,270 | |
Investments purchased | | | 53,232,947 | |
Investment advisory fees | | | 22,489,147 | |
Deferred foreign capital gain tax | | | 15,223,197 | |
Options written | | | 14,140,007 | |
Service and distribution fees | | | 9,665,354 | |
Variation margin on futures contracts | | | 1,839,967 | |
Variation margin on centrally cleared swaps | | | 512,033 | |
Other affiliates | | | 107,211 | |
Officer’s and Directors’ fees | | | 74,346 | |
Other accrued expenses | | | 15,664,384 | |
Swap premiums received | | | 14,609,713 | |
Unrealized depreciation on: | | | | |
Forward foreign currency exchange contracts | | | 22,047,110 | |
OTC derivatives | | | 2,542,509 | |
| | | | |
Total liabilities | | | 893,913,118 | |
| | | | |
| |
NET ASSETS | | $ | 38,924,090,048 | |
| | | | |
|
NET ASSETS CONSIST OF | |
Paid-in capital | | $ | 32,276,236,952 | |
Undistributed net investment income | | | 19,713,998 | |
Accumulated net realized gain | | | 1,000,677,438 | |
Net unrealized appreciation (depreciation) | | | 5,627,461,660 | |
| | | | |
NET ASSETS | | $ | 38,924,090,048 | |
| | | | |
|
NET ASSET VALUE | |
Institutional — Based on net assets of $16,164,754,462 and 792,764,948 shares outstanding, 2 billion shares authorized, $0.10 par value | | $ | 20.39 | |
| | | | |
Investor A — Based on net assets of $12,809,355,909 and 632,197,338 shares outstanding, 2 billion shares authorized, $0.10 par value | | $ | 20.26 | |
| | | | |
Investor B — Based on net assets of $2,532,642 and 129,097 shares outstanding, 1.5 billion shares authorized, $0.10 par value | | $ | 19.62 | |
| | | | |
Investor C — Based on net assets of $7,545,248,811 and 411,564,351 shares outstanding, 2 billion shares authorized, $0.10 par value | | $ | 18.33 | |
| | | | |
Class K — Based on net assets of $1,341,925,244 and 65,815,374 shares outstanding, 2 billion shares authorized, $0.10 par value | | $ | 20.39 | |
| | | | |
Class R — Based on net assets of $1,060,272,980 and 54,879,284 shares outstanding, 2 billion shares authorized, $0.10 par value | | $ | 19.32 | |
| | | | |
See notes to consolidated financial statements.
| | |
| 28 | | 2017 BLACKROCK ANNUAL REPORTTO SHAREHOLDERS |
Consolidated Statement of Operations
Year Ended October 31, 2017
| | | | |
| | | BlackRock Global
Allocation Fund, Inc. | |
|
INVESTMENT INCOME | |
Dividends — unaffiliated | | $ | 489,404,957 | |
Interest — unaffiliated | | | 369,664,138 | |
Dividends — affiliated | | | 7,909,251 | |
Securities lending income — affiliated — net | | | 5,811,215 | |
Other income | | | 575,377 | |
Foreign taxes withheld | | | (27,231,564 | ) |
| | | | |
Total investment income | | | 846,133,374 | |
| | | | |
|
EXPENSES | |
Investment advisory | | | 301,394,305 | |
Service and distribution — class specific | | | 130,123,291 | |
Transfer agent — class specific | | | 39,133,984 | |
Accounting services | | | 5,377,726 | |
Professional | | | 5,244,934 | |
Custodian | | | 4,480,553 | |
Officer and Directors | | | 573,087 | |
Registration | | | 463,880 | |
Printing | | | 191,212 | |
Offering costs | | | 25,078 | |
Miscellaneous | | | 741,570 | |
| | | | |
Total expenses excluding dividends expense, broker fees and expenses on short sales | | | 487,749,620 | |
Dividends expense — unaffiliated | | | 9,472,919 | |
Broker fees and expenses on short sales | | | 338,405 | |
| | | | |
Total expenses | | | 497,560,944 | |
Less: | | | | |
Fees waived and/or reimbursed by the Manager | | | (31,454,759 | ) |
Fees paid indirectly | | | (45,569 | ) |
| | | | |
Total expenses after fees waived | | | 466,060,616 | |
| | | | |
Net investment income | | | 380,072,758 | |
| | | | |
|
REALIZED AND UNREALIZED GAIN (LOSS) | |
Net realized gain (loss) from: | |
Investments (net of $952,143 foreign capital gain tax) — unaffiliated | | | 1,769,929,365 | |
Investments — affiliated | | | (25,081,812 | ) |
Futures contracts | | | (278,871,353 | ) |
Forward foreign currency exchange contracts | | | 177,206,336 | |
Foreign currency transactions | | | (20,451,703 | ) |
Options written | | | 104,727,870 | |
Capital gain distributions from investment companies — affiliated | | | 62 | |
Swaps | | | (3,166,275 | ) |
Short sales — unaffiliated | | | (68,663,158 | ) |
| | | | |
| | | 1,655,629,332 | |
| | | | |
Net change in unrealized appreciation (depreciation) on: | |
Investments (including $13,407,795 foreign capital gain tax) | | | 2,683,285,095 | |
Investments — affiliated | | | 18,890,214 | |
Futures contracts | | | (43,250,257 | ) |
Forward foreign currency exchange contracts | | | 8,991,790 | |
Foreign currency translations | | | 646,554 | |
Options written | | | (5,822,765 | ) |
Swaps | | | 124,492,482 | |
Short sales — unaffiliated | | | (1,709,902 | ) |
| | | | |
| | | 2,785,523,211 | |
| | | | |
Net realized and unrealized gain | | | 4,441,152,543 | |
| | | | |
NET INCREASE IN NET ASSETS RESULTING FROM OPERATIONS | | $ | 4,821,225,301 | |
| | | | |
See notes to consolidated financial statements.
Consolidated Statements of Changes in Net Assets
| | | | | | | | |
| | | BlackRock Global Allocation Fund, Inc. | |
| | | Year Ended October 31, | |
| | | 2017 | | | 2016 | |
| | |
INCREASE (DECREASE) IN NET ASSETS: | | | | | | | | |
|
OPERATIONS | |
Net investment income | | $ | 380,072,758 | | | $ | 468,936,717 | |
Net realized gain | | | 1,655,629,332 | | | | 210,191,095 | |
Net change in unrealized appreciation (depreciation) | | | 2,785,523,211 | | | | (319,757,659 | ) |
| | | | | | | | |
Net increase in net assets resulting from operations | | | 4,821,225,301 | | | | 359,370,153 | |
| | | | | | | | |
|
DISTRIBUTIONS TO SHAREHOLDERS(a) | |
From net investment income: | |
Institutional | | | (220,641,771 | ) | | | (150,833,470 | ) |
Investor A | | | (127,032,734 | ) | | | (101,040,317 | ) |
Investor B | | | — | | | | (361,563 | ) |
Investor C | | | (27,597,872 | ) | | | (45,087,935 | ) |
Class K | | | (10,107,399 | ) | | | — | |
Class R | | | (8,119,089 | ) | | | (6,158,451 | ) |
From net realized gain: | |
Institutional | | | (128,100,603 | ) | | | (1,469,287,713 | ) |
Investor A | | | (106,372,279 | ) | | | (1,194,273,866 | ) |
Investor B | | | (395,344 | ) | | | (13,742,608 | ) |
Investor C | | | (94,425,268 | ) | | | (1,133,669,746 | ) |
Class K | | | (4,871,233 | ) | | | — | |
Class R | | | (9,462,459 | ) | | | (94,513,578 | ) |
| | | | | | | | |
Decrease in net assets resulting from distributions to shareholders | | | (737,126,051 | ) | | | (4,208,969,247 | ) |
| | | | | | | | |
|
CAPITAL SHARE TRANSACTIONS | |
Net decrease in net assets derived from capital share transactions | | | (7,554,010,477 | ) | | | (5,446,508,108 | ) |
| | | | | | | | |
|
NET ASSETS | |
Total decrease in net assets | | | (3,469,911,227 | ) | | | (9,296,107,202 | ) |
Beginning of year | | | 42,394,001,275 | | | | 51,690,108,477 | |
| | | | | | | | |
End of year | | $ | 38,924,090,048 | | | $ | 42,394,001,275 | |
| | | | | | | | |
Undistributed net investment income, end of year | | $ | 19,713,998 | | | $ | 17,035,515 | |
| | | | | | | | |
| (a) | Distributions for annual periods determined in accordance with U.S. federal income tax regulations. |
See notes to consolidated financial statements.
| | |
| 30 | | 2017 BLACKROCK ANNUAL REPORTTO SHAREHOLDERS |
Consolidated Financial Highlights
(For a share outstanding throughout each period)
| | | | | | | | | | | | | | | | | | | | |
| | | BlackRock Global Allocation Fund, Inc. | |
| | | Institutional | |
| | | Year Ended October 31, | |
| | | 2017 | | | 2016 | | | 2015 | | | 2014 | | | 2013 | |
Net asset value, beginning of year | | $ | 18.43 | | | $ | 19.88 | | | $ | 21.77 | | | $ | 21.95 | | | $ | 19.54 | |
| | | | | | | | | | | | | | | | | | | | |
Net investment income(a) | | | 0.25 | | | | 0.25 | | | | 0.26 | | | | 0.35 | | | | 0.28 | |
Net realized and unrealized gain (loss) | | | 2.12 | | | | (0.05 | ) | | | (0.22 | ) | | | 0.77 | | | | 2.43 | |
| | | | | | | | | | | | | | | | | | | | |
Net increase from investment operations | | | 2.37 | | | | 0.20 | | | | 0.04 | | | | 1.12 | | | | 2.71 | |
| | | | | | | | | | | | | | | | | | | | |
| Distributions:(b) | |
From net investment income | | | (0.26 | ) | | | (0.15 | ) | | | (0.45 | ) | | | (0.33 | ) | | | (0.30 | ) |
From net realized gain | | | (0.15 | ) | | | (1.50 | ) | | | (1.48 | ) | | | (0.97 | ) | | | — | |
| | | | | | | | | | | | | | | | | | | | |
Total distributions | | | (0.41 | ) | | | (1.65 | ) | | | (1.93 | ) | | | (1.30 | ) | | | (0.30 | ) |
| | | | | | | | | | | | | | | | | | | | |
Net asset value, end of year | | $ | 20.39 | | | $ | 18.43 | | | $ | 19.88 | (c) | | $ | 21.77 | | | $ | 21.95 | |
| | | | | | | | | | | | | | | | | | | | |
|
Total Return(d) | |
Based on net asset value | | | 13.10 | % | | | 1.34 | % | | | 0.31 | %(c) | | | 5.35 | % | | | 13.97 | % |
| | | | | | | | | | | | | | | | | | | | |
|
Ratios to Average Net Assets | |
Total expenses | | | 0.90 | %(e) | | | 0.88 | %(e) | | | 0.87 | % | | | 0.87 | % | | | 0.87 | % |
| | | | | | | | | | | | | | | | | | | | |
Total expenses after fees waived and paid indirectly | | | 0.82 | %(e) | | | 0.80 | %(e) | | | 0.78 | % | | | 0.78 | % | | | 0.78 | % |
| | | | | | | | | | | | | | | | | | | | |
Total expenses after fees waived and paid indirectly and excluding dividend expense, interest expense, broker fees and expenses on short sales | | | 0.80 | %(e) | | | 0.79 | %(e) | | | 0.78 | % | | | 0.78 | % | | | 0.78 | % |
| | | | | | | | | | | | | | | | | | | | |
Net investment income | | | 1.28 | %(e) | | | 1.39 | %(e) | | | 1.28 | % | | | 1.60 | % | | | 1.35 | % |
| | | | | | | | | | | | | | | | | | | | |
|
Supplemental Data | |
Net assets, end of year (000) | | $ | 16,164,754 | | | $ | 16,122,793 | | | $ | 20,210,226 | | | $ | 22,075,330 | | | $ | 20,968,279 | |
| | | | | | | | | | | | | | | | | | | | |
Portfolio turnover rate(f) | | | 110 | % | | | 131 | % | | | 84 | % | | | 75 | % | | | 50 | % |
| | | | | | | | | | | | | | | | | | | | |
| (a) | Based on average shares outstanding. |
| (b) | Distributions for annual periods determined in accordance with U.S. federal income tax regulations. |
| (c) | For financial reporting purposes, the market value of certain investments was adjusted as of report date. Accordingly, the NAV per share and total return performance based on NAV presented herein are different than the information previously published on October 31, 2015. |
| (d) | Where applicable, assumes the reinvestment of distributions. |
| (e) | Excludes expenses incurred indirectly as a result of investments in underlying funds of approximately 0.01% for the years ending October 31, 2017 and October 31, 2016. |
| (f) | Includes mortgage dollar roll transactions (“MDRs”). Additional information regarding portfolio turnover rate is as follows: |
| | | | | | | | | | | | | | | | | | | | | | | | | | | | | | | | | | | | | | | | |
| | | Year Ended October 31, | |
| | | 2017 | | | | | | 2016 | | | | | | 2015 | | | | | | 2014 | | | | | | 2013 | | | | |
Portfolio turnover rate (excluding MDRs) | | | 110 | % | | | | | | | 131 | % | | | | | | | 82 | % | | | | | | | 75 | % | | | | | | | 50 | % | | | | |
| | | | | | | | | | | | | | | | | | | | | | | | | | | | | | | | | | | | | | | | |
See notes to consolidated financial statements.
Consolidated Financial Highlights (continued)
(For a share outstanding throughout each period)
| | | | | | | | | | | | | | | | | | | | |
| | | BlackRock Global Allocation Fund, Inc. | |
| | | Investor A | |
| | | Year Ended October 31, | |
| | | 2017 | | | 2016 | | | 2015 | | | 2014 | | | 2013 | |
Net asset value, beginning of year | | $ | 18.29 | | | $ | 19.76 | | | $ | 21.65 | | | $ | 21.83 | | | $ | 19.44 | |
| | | | | | | | | | | | | | | | | | | | |
Net investment income(a) | | | 0.19 | | | | 0.20 | | | | 0.21 | | | | 0.29 | | | | 0.22 | |
Net realized and unrealized gain (loss) | | | 2.11 | | | | (0.04 | ) | | | (0.23 | ) | | | 0.77 | | | | 2.41 | |
| | | | | | | | | | | | | | | | | | | | |
Net increase (decrease) from investment operations | | | 2.30 | | | | 0.16 | | | | (0.02 | ) | | | 1.06 | | | | 2.63 | |
| | | | | | | | | | | | | | | | | | | | |
| Distributions:(b) | | | | | | | | | | | | | | | |
From net investment income | | | (0.18 | ) | | | (0.13 | ) | | | (0.39 | ) | | | (0.27 | ) | | | (0.24 | ) |
From net realized gain | | | (0.15 | ) | | | (1.50 | ) | | | (1.48 | ) | | | (0.97 | ) | | | — | |
| | | | | | | | | | | | | | | | | | | | |
Total distributions | | | (0.33 | ) | | | (1.63 | ) | | | (1.87 | ) | | | (1.24 | ) | | | (0.24 | ) |
| | | | | | | | | | | | | | | | | | | | |
Net asset value, end of year | | $ | 20.26 | | | $ | 18.29 | | | $ | 19.76 | (c) | | $ | 21.65 | | | $ | 21.83 | |
| | | | | | | | | | | | | | | | | | | | |
| | | | | |
Total Return(d) | | | | | | | | | | | | | | | | | | | | |
Based on net asset value | | | 12.77 | % | | | 1.08 | % | | | 0.02 | %(c) | | | 5.10 | % | | | 13.63 | % |
| | | | | | | | | | | | | | | | | | | | |
| | | | | |
Ratios to Average Net Assets | | | | | | | | | | | | | | | | | | | | |
Total expenses | | | 1.18 | %(e) | | | 1.15 | %(e) | | | 1.14 | % | | | 1.13 | % | | | 1.13 | % |
| | | | | | | | | | | | | | | | | | | | |
Total expenses after fees waived and paid indirectly | | | 1.10 | %(e) | | | 1.08 | %(e) | | | 1.05 | % | | | 1.04 | % | | | 1.05 | % |
| | | | | | | | | | | | | | | | | | | | |
Total expenses after fees waived and paid indirectly and excluding dividend expense, interest expense, broker fees and expenses on short sales | | | 1.07 | %(e) | | | 1.07 | %(e) | | | 1.05 | % | | | 1.04 | % | | | 1.05 | % |
| | | | | | | | | | | | | | | | | | | | |
Net investment income | | | 1.00 | %(e) | | | 1.10 | %(e) | | | 1.01 | % | | | 1.33 | % | | | 1.08 | % |
| | | | | | | | | | | | | | | | | | | | |
|
Supplemental Data | |
Net assets, end of year (000) | | $ | 12,809,356 | | | $ | 13,447,603 | | | $ | 16,016,234 | | | $ | 17,792,885 | | | $ | 18,858,846 | |
| | | | | | | | | | | | | | | | | | | | |
Portfolio turnover rate(f) | | | 110 | % | | | 131 | % | | | 84 | % | | | 75 | % | | | 50 | % |
| | | | | | | | | | | | | | | | | | | | |
| (a) | Based on average shares outstanding. |
| (b) | Distributions for annual periods determined in accordance with U.S. federal income tax regulations. |
| (c) | For financial reporting purposes, the market value of certain investments was adjusted as of report date. Accordingly, the NAV per share and total return performance based on NAV presented herein are different than the information previously published on October 31, 2015. |
| (d) | Where applicable, excludes the effects of any sales charges and assumes the reinvestment of distributions. |
| (e) | Excludes expenses incurred indirectly as a result of investments in underlying funds of approximately 0.01% for the years ending October 31, 2017 and October 31, 2016. |
| (f) | Includes mortgage dollar roll transactions (“MDRs”). Additional information regarding portfolio turnover rate is as follows: |
| | | | | | | | | | | | | | | | | | | | | | | | | | | | | | | | | | | | | | | | |
| | | Year Ended October 31, | |
| | | 2017 | | | | | | 2016 | | | | | | 2015 | | | | | | 2014 | | | | | | 2013 | | | | |
Portfolio turnover rate (excluding MDRs) | | | 110 | % | | | | | | | 131 | % | | | | | | | 82 | % | | | | | | | 75 | % | | | | | | | 50 | % | | | | |
| | | | | | | | | | | | | | | | | | | | | | | | | | | | | | | | | | | | | | | | |
See notes to consolidated financial statements.
| | |
| 32 | | 2017 BLACKROCK ANNUAL REPORTTO SHAREHOLDERS |
Consolidated Financial Highlights (continued)
(For a share outstanding throughout each period)
| | | | | | | | | | | | | | | | | | | | |
| | | BlackRock Global Allocation Fund, Inc. | |
| | | Investor B | |
| | | Year Ended October 31, | |
| | | 2017 | | | 2016 | | | 2015 | | | 2014 | | | 2013 | |
Net asset value, beginning of year | | $ | 17.71 | | | $ | 19.25 | | | $ | 21.13 | | | $ | 21.31 | | | $ | 18.96 | |
| | | | | | | | | | | | | | | | | | | | |
Net investment income(a) | | | 0.00 | (b) | | | 0.06 | | | | 0.04 | | | | 0.11 | | | | 0.06 | |
Net realized and unrealized gain (loss) | | | 2.06 | | | | (0.06 | ) | | | (0.22 | ) | | | 0.76 | | | | 2.35 | |
| | | | | | | | | | | | | | | | | | | | |
Net increase (decrease) from investment operations | | | 2.06 | | | | — | | | | (0.18 | ) | | | 0.87 | | | | 2.41 | |
| | | | | | | | | | | | | | | | | | | | |
| Distributions:(c) | |
From net investment income | | | — | | | | (0.04 | ) | | | (0.22 | ) | | | (0.08 | ) | | | (0.06 | ) |
From net realized gain | | | (0.15 | ) | | | (1.50 | ) | | | (1.48 | ) | | | (0.97 | ) | | | — | |
| | | | | | | | | | | | | | | | | | | | |
Total distributions | | | (0.15 | ) | | | (1.54 | ) | | | (1.70 | ) | | | (1.05 | ) | | | (0.06 | ) |
| | | | | | | | | | | | | | | | | | | | |
Net asset value, end of year | | $ | 19.62 | | | $ | 17.71 | | | $ | 19.25 | (d) | | $ | 21.13 | | | $ | 21.31 | |
| | | | | | | | | | | | | | | | | | | | |
|
Total Return(e) | |
Based on net asset value | | | 11.72 | % | | | 0.21 | % | | | (0.82 | )%(d) | | | 4.27 | % | | | 12.75 | % |
| | | | | | | | | | | | | | | | | | | | |
|
Ratios to Average Net Assets | |
Total expenses | | | 2.11 | %(f) | | | 1.98 | %(f) | | | 1.92 | % | | | 1.93 | % | | | 1.95 | % |
| | | | | | | | | | | | | | | | | | | | |
Total expenses after fees waived and paid indirectly | | | 2.03 | %(f) | | | 1.90 | %(f) | | | 1.84 | % | | | 1.84 | % | | | 1.86 | % |
| | | | | | | | | | | | | | | | | | | | |
Total expenses after fees waived and paid indirectly and excluding dividend expense, interest expense, broker fees and expenses on short sales | | | 2.01 | %(f) | | | 1.89 | %(f) | | | 1.84 | % | | | 1.84 | % | | | 1.86 | % |
| | | | | | | | | | | | | | | | | | | | |
Net investment income | | | 0.01 | %(f) | | | 0.31 | %(f) | | | 0.22 | % | | | 0.54 | % | | | 0.28 | % |
| | | | | | | | | | | | | | | | | | | | |
|
Supplemental Data | |
Net assets, end of year (000) | | $ | 2,533 | | | $ | 57,642 | | | $ | 191,881 | | | $ | 335,683 | | | $ | 500,197 | |
| | | | | | | | | | | | | | | | | | | | |
Portfolio turnover rate(g) | | | 110 | % | | | 131 | % | | | 84 | % | | | 75 | % | | | 50 | % |
| | | | | | | | | | | | | | | | | | | | |
| (a) | Based on average shares outstanding. |
| (b) | Amount is less than $0.005 per share. |
| (c) | Distributions for annual periods determined in accordance with U.S. federal income tax regulations. |
| (d) | For financial reporting purposes, the market value of certain investments was adjusted as of report date. Accordingly, the NAV per share and total return performance based on NAV presented herein are different than the information previously published on October 31, 2015. |
| (e) | Where applicable, excludes the effects of any sales charges and assumes the reinvestment of distributions. |
| (f) | Excludes expenses incurred indirectly as a result of investments in underlying funds of approximately 0.01% for the years ending October 31, 2017 and October 31, 2016. |
| (g) | Includes mortgage dollar roll transactions (“MDRs”). Additional information regarding portfolio turnover rate is as follows: |
| | | | | | | | | | | | | | | | | | | | | | | | | | | | | | | | | | | | | | | | |
| | | Year Ended October 31, | |
| | | 2017 | | | | | | 2016 | | | | | | 2015 | | | | | | 2014 | | | | | | 2013 | | | | |
Portfolio turnover rate (excluding MDRs) | | | 110 | % | | | | | | | 131 | % | | | | | | | 82 | % | | | | | | | 75 | % | | | | | | | 50 | % | | | | |
| | | | | | | | | | | | | | | | | | | | | | | | | | | | | | | | | | | | | | | | |
See notes to consolidated financial statements.
Consolidated Financial Highlights (continued)
(For a share outstanding throughout each period)
| | | | | | | | | | | | | | | | | | | | |
| | | BlackRock Global Allocation Fund, Inc. | |
| | | Investor C | |
| | | Year Ended October 31, | |
| | | 2017 | | | 2016 | | | 2015 | | | 2014 | | | 2013 | |
Net asset value, beginning of year | | $ | 16.57 | | | $ | 18.11 | | | $ | 20.00 | | | $ | 20.27 | | | $ | 18.06 | |
| | | | | | | | | | | | | | | | | | | | |
Net investment income(a) | | | 0.04 | | | | 0.06 | | | | 0.05 | | | | 0.12 | | | | 0.06 | |
Net realized and unrealized gain (loss) | | | 1.91 | | | | (0.04 | ) | | | (0.21 | ) | | | 0.71 | | | | 2.26 | |
| | | | | | | | | | | | | | | | | | | | |
Net increase (decrease) from investment operations | | | 1.95 | | | | 0.02 | | | | (0.16 | ) | | | 0.83 | | | | 2.32 | |
| | | | | | | | | | | | | | | | | | | | |
| Distributions:(b) | | | | | | | | | | | | | | | |
From net investment income | | | (0.04 | ) | | | (0.06 | ) | | | (0.25 | ) | | | (0.13 | ) | | | (0.11 | ) |
From net realized gain | | | (0.15 | ) | | | (1.50 | ) | | | (1.48 | ) | | | (0.97 | ) | | | — | |
| | | | | | | | | | | | | | | | | | | | |
Total distributions | | | (0.19 | ) | | | (1.56 | ) | | | (1.73 | ) | | | (1.10 | ) | | | (0.11 | ) |
| | | | | | | | | | | | | | | | | | | | |
Net asset value, end of year | | $ | 18.33 | | | $ | 16.57 | | | $ | 18.11 | (c) | | $ | 20.00 | | | $ | 20.27 | |
| | | | | | | | | | | | | | | | | | | | |
| | | | | |
Total Return(d) | | | | | | | | | | | | | | | | | | | | |
Based on net asset value | | | 11.92 | % | | | 0.36 | % | | | (0.73 | )%(c) | | | 4.29 | % | | | 12.86 | % |
| | | | | | | | | | | | | | | | | | | | |
| | | | | |
Ratios to Average Net Assets | | | | | | | | | | | | | | | | | | | | |
Total expenses | | | 1.92 | %(e) | | | 1.89 | %(e) | | | 1.88 | % | | | 1.87 | % | | | 1.88 | % |
| | | | | | | | | | | | | | | | | | | | |
Total expenses after fees waived and paid indirectly | | | 1.84 | %(e) | | | 1.82 | %(e) | | | 1.79 | % | | | 1.79 | % | | | 1.80 | % |
| | | | | | | | | | | | | | | | | | | | |
Total expenses after fees waived and paid indirectly and excluding dividend expense, interest expense, broker fees and expenses on short sales | | | 1.82 | %(e) | | | 1.82 | %(e) | | | 1.79 | % | | | 1.79 | % | | | 1.80 | % |
| | | | | | | | | | | | | | | | | | | | |
Net investment income | | | 0.27 | %(e) | | | 0.37 | %(e) | | | 0.27 | % | | | 0.59 | % | | | 0.33 | % |
| | | | | | | | | | | | | | | | | | | | |
| | | | | |
Supplemental Data | | | | | | | | | | | | | | | | | | | | |
Net assets, end of year (000) | | $ | 7,545,249 | | | $ | 11,029,706 | | | $ | 14,085,089 | | | $ | 15,976,240 | | | $ | 16,170,658 | |
| | | | | | | | | | | | | | | | | | | | |
Portfolio turnover rate(f) | | | 110 | % | | | 131 | % | | | 84 | % | | | 75 | % | | | 50 | % |
| | | | | | | | | | | | | | | | | | | | |
| (a) | Based on average shares outstanding. |
| (b) | Distributions for annual periods determined in accordance with U.S. federal income tax regulations. |
| (c) | For financial reporting purposes, the market value of certain investments was adjusted as of report date. Accordingly, the NAV per share and total return performance based on NAV presented herein are different than the information previously published on October 31, 2015. |
| (d) | Where applicable, excludes the effects of any sales charges and assumes the reinvestment of distributions. |
| (e) | Excludes expenses incurred indirectly as a result of investments in underlying funds of approximately 0.01% for the years ending October 31, 2017 and October 31, 2016. |
| (f) | Includes mortgage dollar roll transactions (“MDRs”). Additional information regarding portfolio turnover rate is as follows: |
| | | | | | | | | | | | | | | | | | | | | | | | | | | | | | | | | | | | | | | | |
| | | Year Ended October 31, | |
| | | 2017 | | | | | | 2016 | | | | | | 2015 | | | | | | 2014 | | | | | | 2013 | | | | |
Portfolio turnover rate (excluding MDRs) | | | 110 | % | | | | | | | 131 | % | | | | | | | 82 | % | | | | | | | 75 | % | | | | | | | 50 | % | | | | |
| | | | | | | | | | | | | | | | | | | | | | | | | | | | | | | | | | | | | | | | |
See notes to consolidated financial statements.
| | |
| 34 | | 2017 BLACKROCK ANNUAL REPORTTO SHAREHOLDERS |
Consolidated Financial Highlights (continued)
(For a share outstanding throughout each period)
| | | | | | | | |
| | | BlackRock Global Allocation Fund, Inc. | |
| | | Class K | |
| | | Year Ended
10/31/17 | | | Period 06/08/16 (a) to 10/31/16 | |
Net asset value, beginning of period | | $ | 18.44 | | | $ | 18.23 | |
| | | | | | | | |
Net investment income(b) | | | 0.27 | | | | 0.08 | |
Net realized and unrealized gain | | | 2.12 | | | | 0.13 | |
| | | | | | | | |
Net increase (decrease) from investment operations | | | 2.39 | | | | 0.21 | |
| | | | | | | | |
| Distributions:(c) | |
From net investment income | | | (0.29 | ) | | | — | |
From net realized gain | | | (0.15 | ) | | | — | |
| | | | | | | | |
Total distributions | | | (0.44 | ) | | | — | |
| | | | | | | | |
Net asset value, end of period | | $ | 20.39 | | | $ | 18.44 | |
| | | | | | | | |
|
Total Return(d) | |
Based on net asset value | | | 13.20 | % | | | 1.15 | %(e) |
| | | | | | | | |
| | |
Ratios to Average Net Assets | | | | | | | | |
Total expenses | | | 0.82 | %(f) | | | 0.79 | %(f)(g) |
| | | | | | | | |
Total expenses after fees waived and paid indirectly | | | 0.74 | %(f) | | | 0.71 | %(f)(g) |
| | | | | | | | |
Total expenses after fees waived and paid indirectly and excluding dividend expense, interest expense, broker fees and expenses on short sales | | | 0.72 | %(f) | | | 0.71 | %(f)(g) |
| | | | | | | | |
Net investment income | | | 1.39 | %(f) | | | 1.06 | %(f)(g) |
| | | | | | | | |
|
Supplemental Data | |
Net assets, end of period (000) | | $ | 1,341,925 | | | $ | 604,611 | |
| | | | | | | | |
Portfolio turnover rate | | | 110 | % | | | 131 | %(h) |
| | | | | | | | |
| (a) | Commencement of operations. |
| (b) | Based on average shares outstanding. |
| (c) | Distributions for annual periods determined in accordance with U.S. federal income tax regulations. |
| (d) | Where applicable, assumes the reinvestment of distributions. |
| (e) | Aggregate total return. |
| (f) | Excludes expenses incurred indirectly as a result of investments in underlying funds of approximately 0.01% for the year ending October 31, 2017 and the period ended October 31, 2016. |
| (h) | Portfolio turnover is representative of the Fund for the entire year. |
See notes to consolidated financial statements.
Consolidated Financial Highlights (continued)
(For a share outstanding throughout each period)
| | | | | | | | | | | | | | | | | | | | |
| | | BlackRock Global Allocation Fund, Inc. | |
| | | Class R | |
| | | Year Ended October 31, | |
| | | 2017 | | | 2016 | | | 2015 | | | 2014 | | | 2013 | |
Net asset value, beginning of year | | $ | 17.46 | | | $ | 18.96 | | | $ | 20.86 | | | $ | 21.08 | | | $ | 18.78 | |
| | | | | | | | | | | | | | | | | | | | |
Net investment income(a) | | | 0.13 | | | | 0.14 | | | | 0.13 | | | | 0.21 | | | | 0.15 | |
Net realized and unrealized gain (loss) | | | 2.01 | | | | (0.04 | ) | | | (0.22 | ) | | | 0.74 | | | | 2.33 | |
| | | | | | | | | | | | | | | | | | | | |
Net increase (decrease) from investment operations | | | 2.14 | | | | 0.10 | | | | (0.09 | ) | | | 0.95 | | | | 2.48 | |
| | | | | | | | | | | | | | | | | | | | |
| Distributions:(b) | |
From net investment income | | | (0.13 | ) | | | (0.10 | ) | | | (0.33 | ) | | | (0.20 | ) | | | (0.18 | ) |
From net realized gain | | | (0.15 | ) | | | (1.50 | ) | | | (1.48 | ) | | | (0.97 | ) | | | — | |
| | | | | | | | | | | | | | | | | | | | |
Total distributions | | | (0.28 | ) | | | (1.60 | ) | | | (1.81 | ) | | | (1.17 | ) | | | (0.18 | ) |
| | | | | | | | | | | | | | | | | | | | |
Net asset value, end of year | | $ | 19.32 | | | $ | 17.46 | | | $ | 18.96 | (c) | | $ | 20.86 | | | $ | 21.08 | |
| | | | | | | | | | | | | | | | | | | | |
|
Total Return(d) | |
Based on net asset value | | | 12.42 | % | | | 0.79 | % | | | (0.37 | )%(c) | | | 4.73 | % | | | 13.26 | % |
| | | | | | | | | | | | | | | | | | | | |
|
Ratios to Average Net Assets | |
Total expenses | | | 1.50 | %(e) | | | 1.47 | %(e) | | | 1.48 | % | | | 1.47 | % | | | 1.48 | % |
| | | | | | | | | | | | | | | | | | | | |
Total expenses after fees waived and paid indirectly | | | 1.42 | %(e) | | | 1.39 | %(e) | | | 1.40 | % | | | 1.38 | % | | | 1.39 | % |
| | | | | | | | | | | | | | | | | | | | |
Total expenses after fees waived and paid indirectly and excluding dividend expense, interest expense, broker fees and expenses on short sales | | | 1.40 | %(e) | | | 1.39 | %(e) | | | 1.40 | % | | | 1.38 | % | | | 1.39 | % |
| | | | | | | | | | | | | | | | | | | | |
Net investment income | | | 0.68 | %(e) | | | 0.79 | %(e) | | | 0.67 | % | | | 0.99 | % | | | 0.74 | % |
| | | | | | | | | | | | | | | | | | | | |
|
Supplemental Data | |
Net assets, end of year (000) | | $ | 1,060,273 | | | $ | 1,131,647 | | | $ | 1,186,678 | | | $ | 1,269,833 | | | $ | 1,296,522 | |
| | | | | | | | | | | | | | | | | | | | |
Portfolio turnover rate(f) | | | 110 | % | | | 131 | % | | | 84 | % | | | 75 | % | | | 50 | % |
| | | | | | | | | | | | | | | | | | | | |
| (a) | Based on average shares outstanding. |
| (b) | Distributions for annual periods determined in accordance with U.S. federal income tax regulations. |
| (c) | For financial reporting purposes, the market value of certain investments was adjusted as of report date. Accordingly, the NAV per share and total return performance based on NAV presented herein are different than the information previously published on October 31, 2015. |
| (d) | Where applicable, assumes the reinvestment of distributions. |
| (e) | Excludes expenses incurred indirectly as a result of investments in underlying funds of approximately 0.01% for the years ending October 31, 2017 and October 31, 2016. |
| (f) | Includes mortgage dollar roll transactions (“MDRs”). Additional information regarding portfolio turnover rate is as follows: |
| | | | | | | | | | | | | | | | | | | | | | | | | | | | | | | | | | | | | | | | |
| | | Year Ended October 31, | |
| | | 2017 | | | | | | 2016 | | | | | | 2015 | | | | | | 2014 | | | | | | 2013 | | | | |
Portfolio turnover rate (excluding MDRs) | | | 110 | % | | | | | | | 131 | % | | | | | | | 82 | % | | | | | | | 75 | % | | | | | | | 50 | % | | | | |
| | | | | | | | | | | | | | | | | | | | | | | | | | | | | | | | | | | | | | | | |
See notes to consolidated financial statements.
| | |
| 36 | | 2017 BLACKROCK ANNUAL REPORTTO SHAREHOLDERS |
Notes to Consolidated Financial Statements
BlackRock Global Allocation Fund, Inc. (the “Fund”) is registered under the Investment Company Act of 1940, as amended (the “1940 Act”), as an open-end management investment company. The Fund is classified as diversified. The Fund is organized as a Maryland Corporation.
The Fund offers multiple classes of shares. All classes of shares have identical voting, dividend, liquidation and other rights and are subject to the same terms and conditions, except that certain classes bear expenses related to the shareholder servicing and distribution of such shares. Institutional and Class K Shares are sold only to certain eligible investors. Class R Shares are available only to certain employer-sponsored retirement plans. Investor A and Investor C Shares are generally available through financial intermediaries. Investor B Shares are available only through exchanges and distribution reinvestment by existing shareholders, and for purchase by certain employer-sponsored retirement plans. Each class has exclusive voting rights with respect to matters relating to its shareholder servicing and distribution expenditures (except that Investor B shareholders may vote on material changes to the Investor A distribution and service plan).
| | | | | | |
| Share Class | | Initial Sales Charge | | CDSC | | Conversion Privilege |
Institutional, Class K Shares and Class R Shares | | No | | No | | None |
Investor A Shares | | Yes | | No(a) | | None |
Investor B Shares | | No | | Yes | | To Investor A Shares after approximately 8 years(b) |
Investor C Shares | | No | | Yes | | None |
| | (a) | Investor A Shares may be subject to a Contingent Deferred Sales Charge (“CDSC”) for certain redemptions where no initial sales charge was paid at the time of purchase. | |
| | (b) | Effective on or about the close of business December 27, 2017, all issued and outstanding Investor B Shares will be converted into Investor A Shares. | |
The Fund, together with certain other registered investment companies advised by BlackRock Advisors, LLC (the “Manager”) or its affiliates, is included in a complex of open-end funds referred to as the Equity-Bond Complex.
Basis of Consolidation: The accompanying consolidated financial statements of the Fund include the account of BlackRock Cayman Global Allocation Fund I, Ltd. (the “Subsidiary”), which is a wholly-owned subsidiary of the Fund and primarily invests in commodity-related instruments and other derivatives. The Subsidiary enables the Fund to hold these commodity-related instruments and satisfy regulated investment company tax requirements. The Fund may invest up to 25% of its total assets in the Subsidiary. The net assets of the Subsidiary as of period end were $1,468,693,238, which is 3.8% of the Fund’s consolidated net assets. Intercompany accounts and transactions, if any, have been eliminated. The Subsidiary is subject to the same investment policies and restrictions that apply to the Fund, except that the Subsidiary may invest without limitation in commodity-related instruments.
| 2. | SIGNIFICANT ACCOUNTING POLICIES: |
The consolidated financial statements are prepared in conformity with accounting principles generally accepted in the United States of America (“U.S. GAAP”), which may require management to make estimates and assumptions that affect the reported amounts of assets and liabilities in the consolidated financial statements, disclosure of contingent assets and liabilities at the date of the consolidated financial statements and the reported amounts of increases and decreases in net assets from operations during the reporting period. Actual results could differ from those estimates. The Fund is considered an investment company under U.S. GAAP and follows the accounting and reporting guidance applicable to investment companies. Below is a summary of significant accounting policies:
Investment Transactions and Income Recognition: For financial reporting purposes, investment transactions are recorded on the dates the transactions are entered into (the “trade dates”). Realized gains and losses on investment transactions are determined on the identified cost basis. Dividend income is recorded on the ex-dividend date. Dividends from foreign securities where the ex-dividend date may have passed are subsequently recorded when the Fund is informed of the ex-dividend date. Under the applicable foreign tax laws, a withholding tax at various rates may be imposed on capital gains, dividends and interest. Upon notification from issuers, some of the dividend income received from a real estate investment trust may be redesignated as a reduction of cost of the related investment and/or realized gain. Interest income, including amortization and accretion of premiums and discounts on debt securities, is recognized on an accrual basis. Income, expenses and realized and unrealized gains and losses are allocated daily to each class based on its relative net assets.
Foreign Currency Translation: The Fund’s books and records are maintained in U.S. dollars. Securities and other assets and liabilities denominated in foreign currencies are translated into U.S. dollars using exchange rates determined as of the close of trading on the New York Stock Exchange (“NYSE”). Purchases and sales of investments are recorded at the rates of exchange prevailing on the respective dates of such transactions. Generally, when the U.S. dollar rises in value against a foreign currency, the investments denominated in that currency will lose value; the opposite effect occurs if the U.S. dollar falls in relative value.
The Fund does not isolate the portion of the results of operations arising as a result of changes in the exchange rates from the changes in the market prices of investments held or sold for financial reporting purposes. Accordingly, the effects of changes in exchange rates on investments are not segregated in the Consolidated Statement of Operations from the effects of changes in market prices of those investments, but are included as a component of net realized and unrealized gain (loss) from investments. The Fund reports realized currency gains (losses) on foreign currency related transactions as components of net realized gain (loss) for financial reporting purposes, whereas such components are generally treated as ordinary income for U.S. federal income tax purposes.
Segregation and Collateralization: In cases where the Fund enters into certain investments (e.g., TBA sale commitments, futures contracts, forward foreign currency exchange contracts, options written, swaps and short sales) that would be treated as “senior securities” for 1940 Act purposes, the Fund may segregate or designate on its books and records cash or liquid assets having a market value at least equal to the amount of its future obligations under such investments. Doing so allows the investment to be excluded from treatment as a “senior security.” Furthermore, if required by an exchange or counterparty agreement, the Fund may be required to deliver/deposit cash and/or securities to/with an exchange, or broker-dealer or custodian as collateral for certain investments or obligations.
| | | | |
| NOTESTO CONSOLIDATED FINANCIAL STATEMENTS | | | 37 | |
Notes to Consolidated Financial Statements (continued)
Distributions: Distributions paid by the Fund are recorded on the ex-dividend date. The character and timing of distributions are determined in accordance with U.S. federal income tax regulations, which may differ from U.S. GAAP.
Net income and realized gains from investments held by the Subsidiary are treated as ordinary income for tax purposes. If a net loss is realized by the Subsidiary in any taxable year, the loss will generally not be available to offset the Fund’s ordinary income and/or capital gains for that year.
Recent Accounting Standards: In March 2017, the Financial Accounting Standards Board issued Accounting Standards Update “Premium Amortization of Purchased Callable Debt Securities” which amends the amortization period for certain purchased callable debt securities. Under the new guidance, the premium amortization of purchased callable debt securities that have explicit, non-contingent call features and are callable at fixed prices will be amortized to the earliest call date. The guidance will be applied on a modified retrospective basis and is effective for fiscal years, and their interim periods, beginning after December 15, 2018. Management is currently evaluating the impact of this guidance to the Fund.
Indemnifications: In the normal course of business, the Fund enters into contracts that contain a variety of representations that provide general indemnification. The Fund’s maximum exposure under these arrangements is unknown because it involves future potential claims against the Fund, which cannot be predicted with any certainty.
Other: Expenses directly related to the Fund or its classes are charged to the Fund or the applicable class. Other operating expenses shared by several funds, including other funds managed by the Manager, are prorated among those funds on the basis of relative net assets or other appropriate methods. Expenses directly related to the Fund and other shared expenses prorated to the Fund are allocated daily to each class based on its relative net assets or other appropriate methods.
The Fund has an arrangement with its custodian whereby credits are earned on uninvested cash balances, which could be used to reduce custody fees and/or overdraft charges. The Fund may incur charges on certain uninvested cash balances and overdrafts, subject to certain conditions.
| 3. | INVESTMENT VALUATION AND FAIR VALUE MEASUREMENTS: |
Investment Valuation Policies: The Fund’s investments are valued at fair value (also referred to as “market value” within the consolidated financial statements) as of the close of trading on the NYSE (generally 4:00 p.m., Eastern time). U.S. GAAP defines fair value as the price the Fund would receive to sell an asset or pay to transfer a liability in an orderly transaction between market participants at the measurement date. The Fund determines the fair values of its financial instruments using various independent dealers or pricing services under policies approved by the Board of Directors of the Fund (the “Board”). The BlackRock Global Valuation Methodologies Committee (the “Global Valuation Committee”) is the committee formed by management to develop global pricing policies and procedures and to oversee the pricing function for all financial instruments.
Fair Value Inputs and Methodologies: The following methods and inputs are used to establish the fair value of the Fund’s assets and liabilities:
| | • | | Equity investments traded on a recognized securities exchange are valued at the official closing price each day, if available. For equity investments traded on more than one exchange, the official closing price on the exchange where the stock is primarily traded is used. Equity investments traded on a recognized exchange for which there were no sales on that day may be valued at the last available bid (long positions) or ask (short positions) price. |
| | • | | Fixed-income securities for which market quotations are readily available are generally valued using the last available bid prices or current market quotations provided by independent dealers or third party pricing services. Floating rate loan interests are valued at the mean of the bid prices from one or more independent brokers or dealers as obtained from a third party pricing service. Pricing services generally value fixed-income securities assuming orderly transactions of an institutional round lot size, but a fund may hold or transact in such securities in smaller, odd lot sizes. Odd lots often trade at lower prices than institutional round lots. The pricing services may use matrix pricing or valuation models that utilize certain inputs and assumptions to derive values, including transaction data (e.g., recent representative bids and offers), credit quality information, perceived market movements, news, and other relevant information. Certain fixed-income securities, including asset-backed and mortgage related securities may be valued based on valuation models that consider the estimated cash flows of each tranche of the entity, establish a benchmark yield and develop an estimated tranche specific spread to the benchmark yield based on the unique attributes of the tranche. The amortized cost method of valuation may be used with respect to debt obligations with sixty days or less remaining to maturity unless the Manager determines such method does not represent fair value. |
Generally, trading in foreign instruments is substantially completed each day at various times prior to the close of trading on the NYSE. Occasionally, events affecting the values of such instruments may occur between the foreign market close and the close of trading on the NYSE that may not be reflected in the computation of the Fund’s net assets. Each business day, the Fund uses a pricing service to assist with the valuation of certain foreign exchange-traded equity securities and foreign exchange-traded over-the-counter (“OTC”) options (the “Systematic Fair Value Price”). Using current market factors, the Systematic Fair Value Price is designed to value such foreign securities and foreign options at fair value as of the close of trading on the NYSE, which follows the close of the local markets.
| | • | | Investments in open-end U.S. mutual funds are valued at net asset value (“NAV”) each business day. |
| | • | | The Fund values its investment in SL Liquidity Series, LLC, Money Market Series (the “Money Market Series”) at fair value, which is ordinarily based upon its pro rata ownership in the underlying fund’s net assets. The Money Market Series seeks current income consistent with maintaining liquidity and preserving capital. Although the Money Market Series is not registered under the 1940 Act, its investments may follow the parameters of investments by a money market fund that is subject to Rule 2a-7 under the 1940 Act. |
| | • | | Futures contracts traded on exchanges are valued at their last sale price. |
| | • | | Forward foreign currency exchange contracts are valued at the mean between the bid and ask prices and are determined as of the close of trading on the NYSE. Interpolated values are derived when the settlement date of the contract is an interim date for which quotations are not available. |
| | |
| 38 | | 2017 BLACKROCK ANNUAL REPORTTO SHAREHOLDERS |
Notes to Consolidated Financial Statements (continued)
| | • | | Exchange-traded options are valued at the mean between the last bid and ask prices at the close of the options market in which the options trade. An exchange-traded option for which there is no mean price is valued at the last bid (long positions) or ask (short positions) price. If no bid or ask price is available, the prior day’s price will be used, unless it is determined that the prior day’s price no longer reflects the fair value of the option. OTC options and options on swaps (“swaptions”) are valued by an independent pricing service using a mathematical model, which incorporates a number of market data factors, such as the trades and prices of the underlying instruments. |
| | • | | Swap agreements are valued utilizing quotes received daily by the Fund’s pricing service or through brokers, which are derived using daily swap curves and models that incorporate a number of market data factors, such as discounted cash flows, trades and values of the underlying reference instruments. |
| | • | | To-be-announced (“TBA”) commitments are valued on the basis of last available bid prices or current market quotations provided by pricing services. |
If events (e.g., a company announcement, market volatility or a natural disaster) occur that are expected to materially affect the value of such investments, or in the event that the application of these methods of valuation results in a price for an investment that is deemed not to be representative of the market value of such investment, or if a price is not available, the investment will be valued by the Global Valuation Committee, or its delegate, in accordance with a policy approved by the Board as reflecting fair value (“Fair Valued Investments”). The fair valuation approaches that may be used by the Global Valuation Committee will include Market approach, Income approach and Cost approach. Valuation techniques such as discounted cash flow, use of market comparables and matrix pricing are types of valuation approaches and are typically used in determining fair value. When determining the price for Fair Valued Investments, the Global Valuation Committee, or its delegate, seeks to determine the price that the Fund might reasonably expect to receive or pay from the current sale or purchase of that asset or liability in an arm’s-length transaction. Fair value determinations shall be based upon all available factors that the Global Valuation Committee, or its delegate, deems relevant and consistent with the principles of fair value measurement.
The Global Valuation Committee, or its delegate, employs various methods for calibrating valuation approaches for investments where an active market does not exist, including regular due diligence of the Fund’s pricing vendors, regular reviews of key inputs and assumptions, transactional back-testing or disposition analysis to compare unrealized gains and losses to realized gains and losses, reviews of missing or stale prices and large movements in market values and reviews of any market related activity. The pricing of all Fair Valued Investments is subsequently reported to the Board or a committee thereof on a quarterly basis. As a result of the inherent uncertainty in valuation of these investments, the fair values may differ from the values that would have been used had an active market existed.
For investments in equity or debt issued by privately held companies or funds (“Private Company” or collectively, the “Private Companies”) and other Fair Valued Investments, the fair valuation approaches that are used by third party pricing services utilize one or a combination of, but not limited to, the following inputs.
| | |
| | | Standard Inputs Generally Considered By Third Party Pricing Services |
Market approach | | (i) recent market transactions, including subsequent rounds of financing, in the underlying investment or comparable issuers; (ii) recapitalizations and other transactions across the capital structure; and (iii) market multiples of comparable issuers. |
Income approach | | (i) future cash flows discounted to present and adjusted as appropriate for liquidity, credit, and/or market risks; (ii) quoted prices for similar investments or assets in active markets; and (iii) other risk factors, such as interest rates, yield curves, volatilities, prepayment speeds, loss severities, credit risks, recovery rates, liquidation amounts and/or default rates. |
Cost approach | | (i) audited or unaudited financial statements, investor communications and financial or operational metrics issued by the Private Company; (ii) changes in the valuation of relevant indices or publicly traded companies comparable to the Private Company; (iii) relevant news and other public sources; and (iv) known secondary market transactions in the Private Company’s interests and merger or acquisition activity in companies comparable to the Private Company. |
Investments in series of preferred stock issued by Private Companies are typically valued utilizing Market approach in determining the enterprise value of the company. Such investments often contain rights and preferences that differ from other series of preferred and common stock of the same issuer. Valuation techniques such as an option pricing model (“OPM”), a probability weighted expected return model (“PWERM”) or a hybrid of those techniques are used in allocating enterprise value of the company, as deemed appropriate under the circumstances. The use of OPM and PWERM techniques involve a determination of the exit scenarios of the investment in order to appropriately allocate the enterprise value of the company among the various parts of its capital structure.
The Private Companies are not subject to the public company disclosure, timing, and reporting standards as other investments held by the Fund. Typically, the most recently available information by a Private Company is as of a date that is earlier than the date the Fund is calculating its NAV. This factor may result in a difference between the value of the investment and the price the Fund could receive upon the sale of the investment.
Fair Value Hierarchy: Various inputs are used in determining the fair value of investments and derivative financial instruments. These inputs to valuation techniques are categorized into a fair value hierarchy consisting of three broad levels for financial statement purposes as follows:
| | • | | Level 1 — Unadjusted price quotations in active markets/exchanges for identical assets or liabilities that the Fund has the ability to access |
| | • | | Level 2 — Other observable inputs (including, but not limited to, quoted prices for similar assets or liabilities in markets that are active, quoted prices for identical or similar assets or liabilities in markets that are not active, inputs other than quoted prices that are observable for the assets or liabilities (such as interest rates, yield curves, volatilities, prepayment speeds, loss severities, credit risks and default rates) or other market–corroborated inputs) |
| | • | | Level 3 — Unobservable inputs based on the best information available in the circumstances, to the extent observable inputs are not available (including the Fund’s own assumptions used in determining the fair value of investments and derivative financial instruments) |
| | | | |
| NOTESTO CONSOLIDATED FINANCIAL STATEMENTS | | | 39 | |
Notes to Consolidated Financial Statements (continued)
The hierarchy gives the highest priority to unadjusted quoted prices in active markets for identical assets or liabilities (Level 1 measurements) and the lowest priority to unobservable inputs (Level 3 measurements). Accordingly, the degree of judgment exercised in determining fair value is greatest for instruments categorized in Level 3. The inputs used to measure fair value may fall into different levels of the fair value hierarchy. In such cases, for disclosure purposes, the fair value hierarchy classification is determined based on the lowest level input that is significant to the fair value measurement in its entirety. Investments classified within Level 3 have significant unobservable inputs used by the Global Valuation Committee in determining the price for Fair Valued Investments. Level 3 investments include equity or debt issued by Private Companies. There may not be a secondary market, and/or there are a limited number of investors. Level 3 investments may also be adjusted to reflect illiquidity and/or non-transferability, with the amount of such discount estimated by the Global Valuation Committee in the absence of market information.
Changes in valuation techniques may result in transfers into or out of an assigned level within the hierarchy. In accordance with the Fund’s policy, transfers between different levels of the fair value hierarchy are deemed to have occurred as of the beginning of the reporting period. The categorization of a value determined for investments and derivative financial instruments is based on the pricing transparency of the investments and derivative financial instruments and is not necessarily an indication of the risks associated with investing in those securities.
As of October 31, 2017, certain investments of the Fund were valued using NAV per share as no quoted market value is available and therefore have been excluded from the fair value hierarchy.
| 4. | Securities and Other Investments: |
Asset-Backed and Mortgage-Backed Securities: Asset-backed securities are generally issued as pass-through certificates or as debt instruments. Asset-backed securities issued as pass-through certificates represent undivided fractional ownership interests in an underlying pool of assets. Asset-backed securities issued as debt instruments, which are also known as collateralized obligations, are typically issued as the debt of a special purpose entity organized solely for the purpose of owning such assets and issuing such debt. Asset-backed securities are often backed by a pool of assets representing the obligations of a number of different parties. The yield characteristics of certain asset-backed securities may differ from traditional debt securities. One such major difference is that all or a principal part of the obligations may be prepaid at any time because the underlying assets (i.e., loans) may be prepaid at any time. As a result, a decrease in interest rates in the market may result in increases in the level of prepayments as borrowers, particularly mortgagors, refinance and repay their loans. An increased prepayment rate with respect to an asset-backed security will have the effect of shortening the maturity of the security. In addition, a fund may subsequently have to reinvest the proceeds at lower interest rates. If a fund has purchased such an asset-backed security at a premium, a faster than anticipated prepayment rate could result in a loss of principal to the extent of the premium paid.
For mortgage pass-through securities (the “Mortgage Assets”) there are a number of important differences among the agencies and instrumentalities of the U.S. Government that issue mortgage-related securities and among the securities that they issue. For example, mortgage-related securities guaranteed by Ginnie Mae are guaranteed as to the timely payment of principal and interest by Ginnie Mae and such guarantee is backed by the full faith and credit of the United States. However, mortgage-related securities issued by Freddie Mac and Fannie Mae, including Freddie Mac and Fannie Mae guaranteed mortgage pass-through certificates, which are solely the obligations of Freddie Mac and Fannie Mae, are not backed by or entitled to the full faith and credit of the United States, but are supported by the right of the issuer to borrow from the U.S. Treasury.
Non-agency mortgage-backed securities are securities issued by non-governmental issuers and have no direct or indirect government guarantees of payment and are subject to various risks. Non-agency mortgage loans are obligations of the borrowers thereunder only and are not typically insured or guaranteed by any other person or entity. The ability of a borrower to repay a loan is dependent upon the income or assets of the borrower. A number of factors, including a general economic downturn, acts of God, terrorism, social unrest and civil disturbances, may impair a borrower’s ability to repay its loans.
Inflation-Indexed Bonds: Inflation-indexed bonds (other than municipal inflation-indexed and certain corporate inflation-indexed bonds) are fixed-income securities whose principal value is periodically adjusted according to the rate of inflation. If the index measuring inflation rises or falls, the principal value of inflation-indexed bonds (other than municipal inflation-indexed and certain corporate inflation-indexed bonds) will be adjusted upward or downward, and consequently the interest payable on these securities (calculated with respect to a larger or smaller principal amount) will be increased or reduced, respectively. Any upward or downward adjustment in the principal amount of an inflation-indexed bond will be included as interest income in the Consolidated Statement of Operations, even though investors do not receive their principal until maturity. Repayment of the original bond principal upon maturity (as adjusted for inflation) is guaranteed in the case of U.S. Treasury inflation-indexed bonds. For bonds that do not provide a similar guarantee, the adjusted principal value of the bond repaid at maturity may be less than the original principal. With regard to municipal inflation-indexed bonds and certain corporate inflation-indexed bonds, the inflation adjustment is typically reflected in the semi-annual coupon payment. As a result, the principal value of municipal inflation-indexed bonds and such corporate inflation-indexed bonds does not adjust according to the rate of inflation.
Zero-Coupon Bonds: Zero-coupon bonds are normally issued at a significant discount from face value and do not provide for periodic interest payments. These bonds may experience greater volatility in market value than other debt obligations of similar maturity which provide for regular interest payments.
Capital Securities and Trust Preferred Securities: Capital securities, including trust preferred securities, are typically issued by corporations, generally in the form of interest-bearing notes with preferred securities characteristics. In the case of trust preferred securities, an affiliated business trust of a corporation issues these securities, generally in the form of beneficial interests in subordinated debentures or similarly structured securities. The securities can be structured with either a fixed or adjustable coupon that can have either a perpetual or stated maturity date. For trust preferred securities, the issuing bank or corporation pays interest to the trust, which is then distributed to holders of these securities as a dividend. Dividends can be deferred without creating an event of default or acceleration, although maturity cannot take place unless all cumulative payment obligations have been met. The deferral of payments does not affect the purchase or sale of these securities in the open market. These securities generally are rated below that of the issuing company’s senior debt securities and are freely callable at the issuer’s option.
Preferred Stocks: Preferred stock has a preference over common stock in liquidation (and generally in receiving dividends as well), but is subordinated to the liabilities of the issuer in all respects. As a general rule, the market value of preferred stock with a fixed dividend rate and no conversion element varies inversely with interest rates
| | |
| 40 | | 2017 BLACKROCK ANNUAL REPORTTO SHAREHOLDERS |
Notes to Consolidated Financial Statements (continued)
and perceived credit risk, while the market price of convertible preferred stock generally also reflects some element of conversion value. Because preferred stock is junior to debt securities and other obligations of the issuer, deterioration in the credit quality of the issuer will cause greater changes in the value of a preferred stock than in a more senior debt security with similar stated yield characteristics. Unlike interest payments on debt securities, preferred stock dividends are payable only if declared by the issuer’s board of directors. Preferred stock also may be subject to optional or mandatory redemption provisions.
Warrants: Warrants entitle a fund to purchase a specified number of shares of common stock and are non-income producing. The purchase price and number of shares are subject to adjustment under certain conditions until the expiration date of the warrants, if any. If the price of the underlying stock does not rise above the strike price before the warrant expires, the warrant generally expires without any value and a fund will lose any amount it paid for the warrant. Thus, investments in warrants may involve more risk than investments in common stock. Warrants may trade in the same markets as their underlying stock; however, the price of the warrant does not necessarily move with the price of the underlying stock.
Floating Rate Loan Interests: Floating rate loan interests are typically issued to companies (the “borrower”) by banks, other financial institutions, or privately and publicly offered corporations (the “lender”). Floating rate loan interests are generally non-investment grade, often involve borrowers whose financial condition is troubled or uncertain and companies that are highly leveraged or in bankruptcy proceedings. In addition, transactions in floating rate loan interests may settle on a delayed basis, which may result in proceeds from the sale not being readily available for a fund to make additional investments or meet its redemption obligations. Floating rate loan interests may include fully funded term loans or revolving lines of credit. Floating rate loan interests are typically senior in the corporate capital structure of the borrower. Floating rate loan interests generally pay interest at rates that are periodically determined by reference to a base lending rate plus a premium. Since the rates reset only periodically, changes in prevailing interest rates (and particularly sudden and significant changes) can be expected to cause some fluctuations in the NAV of a fund to the extent that it invests in floating rate loan interests. The base lending rates are generally the lending rate offered by one or more European banks, such as the London Interbank Offered Rate (“LIBOR”), the prime rate offered by one or more U.S. banks or the certificate of deposit rate. Floating rate loan interests may involve foreign borrowers, and investments may be denominated in foreign currencies. These investments are treated as investments in debt securities for purposes of a fund’s investment policies.
When a fund purchases a floating rate loan interest, it may receive a facility fee and when it sells a floating rate loan interest, it may pay a facility fee. On an ongoing basis, a fund may receive a commitment fee based on the undrawn portion of the underlying line of credit amount of a floating rate loan interest. Facility and commitment fees are typically amortized to income over the term of the loan or term of the commitment, respectively. Consent and amendment fees are recorded to income as earned. Prepayment penalty fees, which may be received by a fund upon the prepayment of a floating rate loan interest by a borrower, are recorded as realized gains. A fund may invest in multiple series or tranches of a loan. A different series or tranche may have varying terms and carry different associated risks.
Floating rate loan interests are usually freely callable at the borrower’s option. A fund may invest in such loans in the form of participations in loans (“Participations”) or assignments (“Assignments”) of all or a portion of loans from third parties. Participations typically will result in a fund having a contractual relationship only with the lender, not with the borrower. A fund has the right to receive payments of principal, interest and any fees to which it is entitled only from the lender selling the Participation and only upon receipt by the lender of the payments from the borrower. In connection with purchasing Participations, a fund generally will have no right to enforce compliance by the borrower with the terms of the loan agreement, nor any rights of offset against the borrower. A fund may not benefit directly from any collateral supporting the loan in which it has purchased the Participation. As a result, a fund assumes the credit risk of both the borrower and the lender that is selling the Participation. A fund’s investment in loan participation interests involves the risk of insolvency of the financial intermediaries who are parties to the transactions. In the event of the insolvency of the lender selling the Participation, a fund may be treated as a general creditor of the lender and may not benefit from any offset between the lender and the borrower. Assignments typically result in a fund having a direct contractual relationship with the borrower, and a fund may enforce compliance by the borrower with the terms of the loan agreement.
Forward Commitments and When-Issued Delayed Delivery Securities: The Fund may purchase securities on a when-issued basis and may purchase or sell securities on a forward commitment basis. Settlement of such transactions normally occurs within a month or more after the purchase or sale commitment is made. The Fund may purchase securities under such conditions with the intention of actually acquiring them, but may enter into a separate agreement to sell the securities before the settlement date. Since the value of securities purchased may fluctuate prior to settlement, the Fund may be required to pay more at settlement than the security is worth. In addition, the Fund is not entitled to any of the interest earned prior to settlement. When purchasing a security on a delayed delivery basis, the Fund assumes the rights and risks of ownership of the security, including the risk of price and yield fluctuations. In the event of default by the counterparty, the Fund’s maximum amount of loss is the unrealized appreciation of unsettled when-issued transactions.
TBA Commitments: TBA commitments are forward agreements for the purchase or sale of mortgage-backed securities for a fixed price, with payment and delivery on an agreed upon future settlement date. The specific securities to be delivered are not identified at the trade date. However, delivered securities must meet specified terms, including issuer, rate and mortgage terms. When entering into TBA commitments, a fund may take possession of or deliver the underlying mortgage-backed securities but can extend the settlement or roll the transaction. TBA commitments involve a risk of loss if the value of the security to be purchased or sold declines or increases, respectively, prior to settlement date.
In order to better define contractual rights and to secure rights that will help a fund mitigate their counterparty risk, TBA commitments may be entered into by a fund under Master Securities Forward Transaction Agreements (each, an “MSFTA”). An MSFTA typically contains, among other things, collateral posting terms and netting provisions in the event of default and/or termination event. The collateral requirements are typically calculated by netting the mark-to-market amount for each transaction under such agreement and comparing that amount to the value of the collateral currently pledged by a fund and the counterparty. Cash collateral that has been pledged to cover the obligations of a fund and cash collateral received from the counterparty, if any, is reported separately on the Consolidated Statement of Assets and Liabilities as cash pledged as collateral for TBA commitments or cash received as collateral for TBA commitments, respectively. Non-cash collateral pledged by a fund, if any, is noted in the Consolidated Schedule of Investments. Typically, a fund is permitted to sell, re-pledge or use the collateral it receives; however, the counterparty is not permitted to do so. To the extent amounts due to a fund is not fully collateralized, contractually or otherwise, a fund bears the risk of loss from counterparty non-performance.
| | | | |
| NOTESTO CONSOLIDATED FINANCIAL STATEMENTS | | | 41 | |
Notes to Consolidated Financial Statements (continued)
Short Sale Transactions: In short sale transactions, a fund sells a security it does not hold in anticipation of a decline in the market price of that security. When a fund makes a short sale, it will borrow the security sold short from a broker/counterparty and deliver the security to the purchaser. To close out a short position, a fund delivers the same security to the broker and records a liability to reflect the obligation to return the security to the broker. The amount of the liability is subsequently marked-to-market to reflect the market value of the short sale. A fund maintains a segregated account of securities or deposits cash with the broker-dealer as collateral for the short sales. Cash deposited with the broker is recorded as an asset in the Consolidated Statement of Assets and Liabilities. Securities segregated as collateral are denoted in the Consolidated Schedule of Investments. A fund may pay a financing fee for the difference between the market value of the short position and the cash collateral deposited with the broker which would be recorded as interest expense. A fund is required to repay the counterparty any dividends received on the security sold short, which, if applicable, is shown as dividend expense in the Consolidated Statement of Operations. A fund may pay a fee on the assets borrowed from the counterparty, which, if applicable, is shown as broker fees and expenses on short sales in the Consolidated Statement of Operations. A fund is exposed to market risk based on the amount, if any, that the market value of the security increases beyond the market value at which the position was sold. Thus, a short sale of a security involves the risk that instead of declining, the price of the security sold short will rise. The short sale of securities involves the possibility of an unlimited loss since there is an unlimited potential for the market price of the security sold short to increase. Gains are limited to the price at which the Fund sold the security short. A realized gain or loss is recognized upon the termination of a short sale if the market price is either less than or greater than the proceeds originally received. There is no assurance that a fund will be able to close out a short position at a particular time or at an acceptable price.
Securities Lending: The Fund may lend its securities to approved borrowers, such as brokers, dealers and other financial institutions. The borrower pledges and maintains with the Fund collateral consisting of cash, an irrevocable letter of credit issued by a bank, or securities issued or guaranteed by the U.S. Government. The initial collateral received by the Fund is required to have a value of at least 102% of the current value of the loaned securities for securities traded on U.S. exchanges and a value of at least 105% for all other securities. The collateral is maintained thereafter at a value equal to at least 100% of the current market value of the securities on loan. The market value of the loaned securities is determined at the close of each business day of the Fund and any additional required collateral is delivered to the Fund, or excess collateral returned by the Fund, on the next business day. During the term of the loan, the Fund is entitled to all distributions made on or in respect of the loaned securities, but does not receive interest income on securities received as collateral. Loans of securities are terminable at any time and the borrower, after notice, is required to return borrowed securities within the standard time period for settlement of securities transactions.
The market value of any securities on loan, all of which were classified as common stocks in the Fund’s Consolidated Schedule of Investments, and the value of any related collateral are shown separately in the Consolidated Statement of Assets and Liabilities as a component of investments at value-unaffiliated, and collateral on securities loaned at value, respectively. As of period end, any securities on loan were collateralized by cash and/or U.S. Government obligations. Cash collateral invested by the securities lending agent, BlackRock Investment Management, LLC (“BIM”), if any, is disclosed in the Consolidated Schedule of Investments.
Securities lending transactions are entered into by the Fund under Master Securities Lending Agreements (each, an “MSLA”), which provide the right, in the event of default (including bankruptcy or insolvency), for the non-defaulting party to liquidate the collateral and calculate a net exposure to the defaulting party or request additional collateral. In the event that a borrower defaults, the Fund, as lender, would offset the market value of the collateral received against the market value of the securities loaned. When the value of the collateral is greater than that of the market value of the securities loaned, the lender is left with a net amount payable to the defaulting party. However, bankruptcy or insolvency laws of a particular jurisdiction may impose restrictions on or prohibitions against such a right of offset in the event of an MSLA counterparty’s bankruptcy or insolvency. Under the MSLA, absent an event of default, the borrower can resell or re-pledge the loaned securities, and the Fund can reinvest cash collateral received in connection with loaned securities. Upon an event of default, the parties’ obligations to return the securities or collateral to the other party are extinguished, and the parties can resell or re-pledge the loaned securities or the collateral received in connection with the loaned securities in order to satisfy the defaulting party’s net payment obligation for all transactions under the MSLA. The defaulting party remains liable for any deficiency.
As of period end, the following table is a summary of the Fund’s securities lending agreements by counterparty which are subject to offset under an MSLA:
| | | | | | | | | | | | |
| Counterparty | | Securities Loaned at Value | | | Cash Collateral
Received (a) | | | Net Amount | |
Barclays Capital Inc. | | $ | 11,643,428 | | | $ | (11,643,428 | ) | | $ | — | |
BNP Paribas S.A. | | | 3,377,101 | | | | (3,377,101 | ) | | | — | |
Citigroup Global Markets, Inc. | | | 18,309,166 | | | | (18,309,166 | ) | | | — | |
Credit Suisse Securities (USA) LLC | | | 21,417,450 | | | | (21,417,450 | ) | | | — | |
Deutsche Bank Securities, Inc. | | | 25,087,466 | | | | (25,087,466 | ) | | | — | |
Goldman Sachs & Co. | | | 84,081,578 | | | | (84,081,578 | ) | | | — | |
JP Morgan Securities LLC | | | 75,863,484 | | | | (75,863,484 | ) | | | — | |
Merrill Lynch, Pierce, Fenner & Smith, Inc. | | | 5,044,685 | | | | (5,044,685 | ) | | | — | |
Morgan Stanley & Co. LLC | | | 42,919,835 | | | | (42,919,835 | ) | | | — | |
SG Americas Securities LLC | | | 2,546,379 | | | | (2,546,379 | ) | | | — | |
State Street Bank & Trust Co. | | | 11,364,405 | | | | (11,364,405 | ) | | | — | |
| | | | | | | | | | | | |
| | $ | 301,654,977 | | | $ | (301,654,977 | ) | | $ | — | |
| | | | | | | | | | | | |
| | (a) | Cash collateral with a value of $307,194,433 has been received in connection with securities lending agreements. Collateral received in excess of the value of securities loaned from the individual counterparty is not shown for financial reporting purposes in the table above. | |
The risks of securities lending include the risk that the borrower may not provide additional collateral when required or may not return the securities when due. To mitigate these risks, the Fund benefits from a borrower default indemnity provided by BIM. BIM’s indemnity allows for full replacement of the securities loaned if the collateral received does not cover the value on the securities loaned in the event of borrower default. The Fund could incur a loss if the value of an investment purchased with cash collateral falls below the market value of loaned securities or if the value of an investment purchased with cash collateral falls below the value of the original cash collateral received.
| | |
| 42 | | 2017 BLACKROCK ANNUAL REPORTTO SHAREHOLDERS |
Notes to Consolidated Financial Statements (continued)
| 5. | DERIVATIVE FINANCIAL INSTRUMENTS: |
The Fund engages in various portfolio investment strategies using derivative contracts both to increase the returns of the Fund and/or to manage its exposure to certain risks such as credit risk, equity risk, interest rate risk, foreign currency exchange rate risk, commodity price risk or other risks (e.g., inflation risk). Derivative financial instruments categorized by risk exposure are included in the Consolidated Schedule of Investments. These contracts may be transacted on an exchange or OTC.
Futures Contracts: Futures contracts are purchased or sold to gain exposure to, or manage exposure to, changes in interest rates (interest rate risk), changes in the value of equity securities (equity risk) or foreign currencies (foreign currency exchange rate risk).
Futures contracts are agreements between the Fund and a counterparty to buy or sell a specific quantity of an underlying instrument at a specified price and on a specified date. Depending on the terms of a contract, it is settled either through physical delivery of the underlying instrument on the settlement date or by payment of a cash amount on the settlement date. Upon entering into a futures contract, the Fund is required to deposit initial margin with the broker in the form of cash or securities in an amount that varies depending on a contract’s size and risk profile. The initial margin deposit must then be maintained at an established level over the life of the contract.
Securities deposited as initial margin are designated in the Consolidated Schedule of Investments and cash deposited, if any, is shown as cash pledged for futures contracts in the Consolidated Statement of Assets and Liabilities. Pursuant to the contract, the Fund agrees to receive from or pay to the broker an amount of cash equal to the daily fluctuation in market value of the contract (“variation margin”). Variation margin is recorded as unrealized appreciation (depreciation) and, if any, shown as variation margin receivable (or payable) on futures contracts in the Consolidated Statement of Assets and Liabilities. When the contract is closed, a realized gain or loss is recorded in the Consolidated Statement of Operations equal to the difference between the value of the contract at the time it was opened and the value at the time it was closed. The use of futures contracts involves the risk of an imperfect correlation in the movements in the price of futures contracts and interest, foreign currency exchange rates or underlying assets.
Forward Foreign Currency Exchange Contracts: Forward foreign currency exchange contracts are entered into to gain or reduce exposure to foreign currencies (foreign currency exchange rate risk).
A forward foreign currency exchange contract is an agreement between two parties to buy and sell a currency at a set exchange rate on a specified date. These contracts help to manage the overall exposure to the currencies in which some of the investments held by the Fund are denominated and in some cases, may be used to obtain exposure to a particular market.
The contract is marked-to-market daily and the change in market value is recorded as unrealized appreciation (depreciation) in the Consolidated Statement of Assets and Liabilities. When a contract is closed, a realized gain or loss is recorded in the Consolidated Statement of Operations equal to the difference between the value at the time it was opened and the value at the time it was closed. Non-deliverable forward foreign currency exchange contracts are settled with the counterparty in cash without the delivery of foreign currency. The use of forward foreign currency exchange contracts involves the risk that the value of a forward foreign currency exchange contract changes unfavorably due to movements in the value of the referenced foreign currencies.
Options: The Fund purchases and writes call and put options to increase or decrease its exposure to the risks of underlying instruments, including equity risk, interest rate risk and/or commodity price risk and/or, in the case of options written, to generate gains from options premiums.
A call option gives the purchaser (holder) of the option the right (but not the obligation) to buy, and obligates the seller (writer) to sell (when the option is exercised) the underlying instrument at the exercise or strike price at any time or at a specified time during the option period. A put option gives the holder the right to sell and obligates the writer to buy the underlying instrument at the exercise or strike price at any time or at a specified time during the option period.
Premiums paid on options purchased and premiums received on options written, as well as the daily fluctuation in market value, are included in investments at value — unaffiliated and options written at value, respectively, in the Consolidated Statement of Assets and Liabilities. When an instrument is purchased or sold through the exercise of an option, the premium is offset against the cost or proceeds of the underlying instrument. When an option expires, a realized gain or loss is recorded in the Consolidated Statement of Operations to the extent of the premiums received or paid. When an option is closed or sold, a gain or loss is recorded in the Consolidated Statement of Operations to the extent the cost of the closing transaction exceeds the premiums received or paid. When the Fund writes a call option, such option is typically “covered,” meaning that it holds the underlying instrument subject to being called by the option counterparty. When the Fund writes a put option, such option is covered by cash in an amount sufficient to cover the obligation. As of period end, the value of portfolio securities subject to covered call options written was $91,409,316,033.
| | • | | Swaptions — The Fund purchases and writes options on swaps (“swaptions”) primarily to preserve a return or spread on a particular investment or portion of the Fund’s holdings, as a duration management technique or to protect against an increase in the price of securities it anticipates purchasing at a later date. The purchaser and writer of a swaption is buying or granting the right to enter into a previously agreed upon interest rate or credit default swap agreement (interest rate risk and/or credit risk) at any time before the expiration of the option. |
| | • | | Foreign currency options — The Fund purchases and writes foreign currency options, foreign currency futures and options on foreign currency futures to gain or reduce exposure to foreign currencies (foreign currency exchange rate risk). Foreign currency options give the purchaser the right to buy from or sell to the writer a foreign currency at any time before the expiration of the option. |
| | • | | Barrier options — The Fund may purchase and write a variety of options with non-standard payout structures or other features (“barrier options”) that are generally traded OTC. |
The Fund may invest in various types of barrier options, including down-and-out options, down-and-in options, double no-touch options, one-touch options, up-and-out options and up-and-in options. Down-and-out options expire worthless to the purchaser if the price of the underlying instrument falls below a specific barrier price level prior to the expiration date. Down-and-in options expire worthless to the purchaser unless the price of the underlying instrument falls below a specific barrier price level prior to
| | | | |
| NOTESTO CONSOLIDATED FINANCIAL STATEMENTS | | | 43 | |
Notes to Consolidated Financial Statements (continued)
the expiration date. Double no-touch options provide the purchaser an agreed-upon payout if the price of the underlying instrument does not reach or surpass predetermined barrier price levels prior to the option’s expiration date. One-touch options provide the purchaser an agreed-upon payout if the price of the underlying instrument reaches or surpasses predetermined barrier price levels prior to the expiration date. Up-and-out options expire worthless to the purchaser if the price of the underlying instrument increases beyond a predetermined barrier price level prior to the expiration date. Up-and-in options can only be exercised when the price of the underlying instrument increases beyond a predetermined barrier price level.
In purchasing and writing options, the Fund bears the risk of an unfavorable change in the value of the underlying instrument or the risk that it may not be able to enter into a closing transaction due to an illiquid market. Exercise of a written option could result in the Fund purchasing or selling a security when it otherwise would not, or at a price different from the current market value.
Swaps: Swap contracts are entered into to manage exposure to issuers, markets and securities. Such contracts are agreements between the Fund and a counterparty to make periodic net payments on a specified notional amount or a net payment upon termination. Swap agreements are privately negotiated in the OTC market and may be entered into as a bilateral contract (“OTC swaps”) or centrally cleared (“centrally cleared swaps”).
For OTC swaps, any upfront premiums paid and any upfront fees received are shown as swap premiums paid and swap premiums received, respectively, in the Consolidated Statement of Assets and Liabilities and amortized over the term of the contract. The daily fluctuation in market value is recorded as unrealized appreciation (depreciation) on OTC Swaps in the Consolidated Statement of Assets and Liabilities. Payments received or paid are recorded in the Consolidated Statement of Operations as realized gains or losses, respectively. When an OTC swap is terminated, a realized gain or loss is recorded in the Consolidated Statement of Operations equal to the difference between the proceeds from (or cost of) the closing transaction and the Fund’s basis in the contract, if any. Generally, the basis of the contract is the premium received or paid.
In a centrally cleared swap, immediately following execution of the swap contract, the swap contract is novated to a central counterparty (the “CCP”) and the Fund’s counterparty on the swap agreement becomes the CCP. The Fund is required to interface with the CCP through the broker. Upon entering into a centrally cleared swap, the Fund is required to deposit initial margin with the broker in the form of cash or securities in an amount that varies depending on the size and risk profile of the particular swap. Securities deposited as initial margin are designated in the Consolidated Schedule of Investments and cash deposited is shown as cash pledged for centrally cleared swaps in the Consolidated Statement of Assets and Liabilities. Pursuant to the contract, the Fund agrees to receive from or pay to the broker an amount of cash equal to the daily fluctuation in market value of the contract (“variation margin”). Variation margin is recorded as unrealized appreciation (depreciation) and shown as variation margin receivable (or payable) on centrally cleared swaps in the Consolidated Statement of Assets and Liabilities. Payments received from (paid to) the counterparty, including at termination, are recorded as realized gains (losses) in the Consolidated Statement of Operations.
| | • | | Credit default swaps — Credit default swaps are entered into to manage exposure to the market or certain sectors of the market, to reduce risk exposure to defaults of corporate and/or sovereign issuers or to create exposure to corporate and/or sovereign issuers to which a fund is not otherwise exposed (credit risk). |
The Fund may either buy or sell (write) credit default swaps on single-name issuers (corporate or sovereign), a combination or basket of single-name issuers or traded indexes. Credit default swaps are agreements in which the protection buyer pays fixed periodic payments to the seller in consideration for a promise from the protection seller to make a specific payment should a negative credit event take place with respect to the referenced entity (e.g., bankruptcy, failure to pay, obligation acceleration, repudiation, moratorium or restructuring). As a buyer, if an underlying credit event occurs, the Fund will either (i) receive from the seller an amount equal to the notional amount of the swap and deliver the referenced security or underlying securities comprising the index, or (ii) receive a net settlement of cash equal to the notional amount of the swap less the recovery value of the security or underlying securities comprising the index. As a seller (writer), if an underlying credit event occurs, the Fund will either pay the buyer an amount equal to the notional amount of the swap and take delivery of the referenced security or underlying securities comprising the index or pay a net settlement of cash equal to the notional amount of the swap less the recovery value of the security or underlying securities comprising the index.
| | • | | Total return swaps — Total return swaps are entered into to obtain exposure to a security or market without owning such security or investing directly in such market or to exchange the risk/return of one market (e.g., fixed-income) with another market (e.g., equity or commodity prices) (equity risk, commodity price risk and/or interest rate risk). |
Total return swaps are agreements in which there is an exchange of cash flows whereby one party commits to make payments based on the total return (distributions plus capital gains/losses) of an underlying instrument in exchange for fixed or floating rate interest payments. If the total return of the instrument or index underlying the transaction exceeds or falls short of the offsetting fixed or floating interest rate obligation, the Fund receives payment from or makes a payment to the counterparty.
| | • | | Interest rate swaps — Interest rate swaps are entered into to gain or reduce exposure to interest rates or to manage duration, the yield curve or interest rate (interest rate risk). |
Interest rate swaps are agreements in which one party pays a stream of interest payments, either fixed or floating, in exchange for another party’s stream of interest payments, either fixed or floating, on the same notional amount for a specified period of time. In more complex interest rate swaps, the notional principal amount may decline (or amortize) over time.
| | • | | Currency swaps — Currency swaps are entered into to gain or reduce exposure to foreign currencies (foreign currency exchange rate risk). |
Currency swaps are interest rate swaps in which one party pays a stream of interest payments, either fixed or floating, in exchange for another party’s stream of interest payments, either fixed or floating, based on the notional amounts of two different currencies. The notional amounts are typically determined based on the spot exchange rates at the inception of the trade. Currency swaps may also involve an exchange of notional amounts at the start, during and/or at expiration of the contract, either at the current spot rate or another specified rate.
| | • | | Forward swaps — The Fund enters into forward interest rate swaps and forward total return swaps. In a forward swap, the Fund and the counterparty agree to make periodic net payments beginning on a specified date or a net payment at termination. |
| | |
| 44 | | 2017 BLACKROCK ANNUAL REPORTTO SHAREHOLDERS |
Notes to Consolidated Financial Statements (continued)
Swap transactions involve, to varying degrees, elements of interest rate, credit and market risk in excess of the amounts recognized in the Consolidated Statement of Assets and Liabilities. Such risks involve the possibility that there will be no liquid market for these agreements, that the counterparty to the agreements may default on its obligation to perform or disagree as to the meaning of the contractual terms in the agreements, and that there may be unfavorable changes in interest rates and/or market values associated with these transactions.
Master Netting Arrangements: In order to define its contractual rights and to secure rights that will help it mitigate its counterparty risk, the Fund may enter into an International Swaps and Derivatives Association, Inc. Master Agreement (“ISDA Master Agreement”) or similar agreement with its counterparties. An ISDA Master Agreement is a bilateral agreement between the Fund and a counterparty that governs certain OTC derivatives and typically contains, among other things, collateral posting terms and netting provisions in the event of a default and/or termination event. Under an ISDA Master Agreement, the Fund may, under certain circumstances, offset with the counterparty certain derivative financial instruments’ payables and/or receivables with collateral held and/or posted and create one single net payment. The provisions of the ISDA Master Agreement typically permit a single net payment in the event of default including the bankruptcy or insolvency of the counterparty. Bankruptcy or insolvency laws of a particular jurisdiction may restrict or prohibit the right of offset in bankruptcy, insolvency or other events. In addition, certain ISDA Master Agreements allow counterparties to terminate derivative contracts prior to maturity in the event the Fund’s net assets decline by a stated percentage or the Fund fails to meet the terms of its ISDA Master Agreements. The result would cause the Fund to accelerate payment of any net liability owed to the counterparty.
Collateral Requirements: For derivatives traded under an ISDA Master Agreement, the collateral requirements are typically calculated by netting the mark-to-market amount for each transaction under such agreement and comparing that amount to the value of any collateral currently pledged by the Fund and the counterparty.
Cash collateral that has been pledged to cover obligations of the Fund and cash collateral received from the counterparty, if any, is reported separately on the Consolidated Statement of Assets and Liabilities as cash pledged as collateral and cash received as collateral, respectively. Non-cash collateral pledged by the Fund, if any, is noted in the Consolidated Schedule of Investments. Generally, the amount of collateral due from or to a counterparty is subject to a certain minimum transfer amount threshold before a transfer is required, which is determined at the close of business of the Fund. Any additional required collateral is delivered to/pledged by the Fund on the next business day. Typically, the counterparty is not permitted to sell, re-pledge or use cash and non-cash collateral it receives. The Fund generally agrees not to use non-cash collateral that it receives but may, absent default or certain other circumstances defined in the underlying ISDA Master Agreement, be permitted to use cash collateral received. In such cases, interest may be paid pursuant to the collateral arrangement with the counterparty. To the extent amounts due to the Fund from its counterparties are not fully collateralized, it bears the risk of loss from counterparty non-performance. Likewise, to the extent the Fund has delivered collateral to a counterparty and stands ready to perform under the terms of its agreement with such counterparty, it bears the risk of loss from a counterparty in the amount of the value of the collateral in the event the counterparty fails to return such collateral. Based on the terms of agreements, collateral may not be required for all derivative contracts.
For financial reporting purposes, the Fund does not offset derivative assets and derivative liabilities that are subject to netting arrangements, if any, in the Consolidated Statement of Assets and Liabilities.
| 6. | INVESTMENT ADVISORY AGREEMENT AND OTHER TRANSACTIONS WITH AFFILIATES: |
The PNC Financial Services Group, Inc. is the largest stockholder and an affiliate of BlackRock, Inc. (“BlackRock”) for 1940 Act purposes.
Investment Advisory: The Trust, on behalf of the Fund, entered into an Investment Advisory Agreement with the Manager, the Fund’s investment adviser, an indirect, wholly-owned subsidiary of BlackRock, to provide investment advisory and administrative services. The Manager is responsible for the management of the Fund’s portfolio and provides the personnel, facilities, equipment and certain other services necessary to the operations of the Fund.
For such services, the Fund pays the Manager a monthly fee at an annual rate equal to 0.75% of the average daily value of the Fund’s net assets.
The Manager provides investment management and other services to the Subsidiary. The Manager does not receive separate compensation from the Subsidiary for providing investment management or administrative services. However, the Fund pays the Manager based on the Fund’s net assets, which includes the assets of the Subsidiary.
Service and Distribution Fees: The Fund entered into a Distribution Agreement and a Distribution and Service Plan with BlackRock Investments, LLC (“BRIL”), an affiliate of the Manager. Pursuant to the Distribution and Service Plan and in accordance with Rule 12b-1 under the 1940 Act, the Fund pays BRIL ongoing service and distribution fees. The fees are accrued daily and paid monthly at annual rates based upon the average daily net assets of the relevant share class of the Fund as follows:
| | | | | | | | | | | | | | | | |
| | | Investor A | | | Investor B | | | Investor C | | | Class R | |
Service Fee | | | 0.25 | % | | | 0.25 | % | | | 0.25 | % | | | 0.25 | % |
Distribution Fee | | | — | | | | 0.75 | % | | | 0.75 | % | | | 0.25 | % |
BRIL and broker-dealers, pursuant to sub-agreements with BRIL, provide shareholder servicing and distribution services to the Fund. The ongoing service and/or distribution fee compensates BRIL and each broker-dealer for providing shareholder servicing and/or distribution related services to the shareholders.
For the year ended October 31, 2017, the following table shows the class specific service and distribution fees borne directly by each share class of the Fund:
| | | | | | | | | | | | | | | | | | | | | | | | | | |
| Investor A | | | | | Investor B | | | | | Investor C | | | | | Class R | | | | | Total | |
| $ | 32,289,492 | | | | | $ | 227,235 | | | | | $ | 92,135,177 | | | | | $ | 5,471,387 | | | | | $ | 130,123,291 | |
Transfer Agent: Pursuant to written agreements, certain financial intermediaries, some of which may be affiliates, provide the Fund with sub-accounting, recordkeeping, sub-transfer agency and other administrative services with respect to sub-accounts they service. For these services, these entities receive an asset-based fee or an
| | | | |
| NOTESTO CONSOLIDATED FINANCIAL STATEMENTS | | | 45 | |
Notes to Consolidated Financial Statements (continued)
annual fee per shareholder account, which will vary depending on share class and/or net assets. For the year ended October 31, 2017, the Fund paid the following amounts to affiliates of BlackRock in return for these services, which are included in transfer agent — class specific in the Consolidated Statement of Operations:
| | | | | | | | | | | | | | | | | | | | |
| Institutional | | | | | Investor A | | | | | Investor C | | | | | Total | |
| $ | 269,966 | | | | | $ | 12,619 | | | | | $ | 296 | | | | | $ | 282,881 | |
The Manager maintains a call center that is responsible for providing certain shareholder services to the Fund. Shareholder services include responding to inquiries and processing subscriptions and redemptions based upon instructions from shareholders. For the year ended October 31, 2017, the Fund reimbursed the Manager the following amounts for costs incurred in running the call center, which are included in transfer agent — class specific in the Consolidated Statement of Operations:
| | | | | | | | | | | | | | | | | | | | | | | | | | | | | | | | | | | | | | |
| Institutional | | | | | | Investor A | | | | Investor B | | | | | | Investor C | | | | Class K | | | | | | Class R | | | | Total | |
| $ | 37,214 | | | | | | | $223,221 | | | | $ | 2,232 | | | | | | | $143,545 | | | | $ | 2,016 | | | | | | | $6,335 | | | | $ | 414,563 | |
For the year ended October 31, 2017, the following table shows the class specific transfer agent fees borne directly by each class of the Fund:
| | | | | | | | | | | | | | | | | | | | | | | | | | | | | | | | | | | | | | |
| Institutional | | | | | Investor A | | | | | Investor B | | | | | Investor C | | | | | Class K | | | | | Class R | | | | | Total | |
| $ | 13,653,510 | | | | | $ | 13,910,177 | | | | | $ | 70,182 | | | | | $ | 9,477,139 | | | | | $ | 4,291 | | | | | $ | 2,018,685 | | | | | $ | 39,133,984 | |
Other Fees: For the year ended October 31, 2017, affiliates earned underwriting discounts, direct commissions and dealer concessions on sales of the Fund’s Investor A Shares, which totaled $390,351.
For the year ended October 31, 2017, affiliates received CDSCs as follows:
| | | | | | | | | | | | | | | | | | | | |
| Investor A | | | | | Investor B | | | | | Investor C | | | | | Total | |
| $ | 136,292 | | | | | $ | 922 | | | | | $ | 508,018 | | | | | $ | 645,232 | |
Expense Waivers and Reimbursements: Effective June 12, 2017, the Manager contractually agreed to waive a portion of its management fees payable by the Fund through February 28, 2019, so that such fee is reduced as a percentage of average daily net assets of the Fund as follows:
| | | | |
| | | Rate Waived to | |
First $10 Billion | | | 0.75% | |
$10 Billion — $15 Billion | | | 0.69% | |
$15 Billion — $20 Billion | | | 0.68% | |
$20 Billion — $25 Billion | | | 0.67% | |
$25 Billion — $30 Billion | | | 0.65% | |
$30 Billion — $40 Billion | | | 0.63% | |
$40 Billion — $60 Billion | | | 0.62% | |
$60 Billion — $80 Billion | | | 0.61% | |
Greater than $80 Billion | | | 0.60% | |
Prior to June 12, 2017, the contractual waiver was voluntary. For the year ended October 31, 2017, the Manager waived $27,770,623, which is included in fees waived and/or reimbursed by the Manager in the Consolidated Statement of Operations. This contractual waiver may be terminated upon 90 days’ notice by a majority of the non-interested directors of the Fund or by a vote of a majority of the outstanding voting securities of the Fund.
During the year ended October 31, 2017, the Manager reimbursed the Fund $2,389,679 for certain operating expenses which is included in fees waived and/or reimbursed by the Manager in the Consolidated Statement of Operations.
With respect to the Fund, the Manager voluntarily agreed to waive its investment advisory fees by the amount of investment advisory fees the Fund pays to the Manager indirectly through its investment in affiliated money market funds (the “affiliated money market fund waiver”). The amount of waivers and/or reimbursements of fees and expenses made pursuant to the expense limitations, as applicable, will be reduced by the amount of the affiliated money market fund waiver. This amount is included in fees waived by the Manager in the Consolidated Statement of Operations. For the year ended October 31, 2017, the Manager waived $11,298.
The Manager has contractually agreed to waive its investment advisory fee with respect to any portion of the Fund’s assets invested in affiliated equity and fixed-income mutual funds and affiliated exchange-traded funds that have a contractual management fee, through February 28, 2019. The contractual agreement may be terminated upon 90 days’ notice by a majority of the independent trustees who are not “interested persons” of the Fund, as defined in the 1940 Act (“Independent Trustees”) or by a vote of a majority of the outstanding voting securities of the Fund. For the year ended October 31, 2017, the Fund waived $1,283,159 in investment advisory fees pursuant to these arrangements.
For the year ended October 31, 2017, the Fund reimbursed the Manager $425,740 for certain accounting services, which is included in accounting services in the Consolidated Statement of Operations.
Securities Lending: The U.S. Securities and Exchange Commission (“SEC”) has issued an exemptive order which permits BIM, an affiliate of the Manager, to serve as securities lending agent for the Fund, subject to applicable conditions. As securities lending agent, BIM bears all operational costs directly related to securities lending. The Fund is responsible for expenses in connection with the investment of cash collateral received for securities on loan (the “collateral investment expenses”). The cash collateral is invested in a private investment company managed by the Manager or its affiliates. However, BIM has agreed to cap the collateral investment expenses of the private investment company to an annual rate of 0.04%. The investment adviser to the private investment company will not charge any advisory fees with respect to shares purchased by the Fund. The private investment company in which the cash collateral has been invested may, under certain circumstances, impose a liquidity fee of
| | |
| 46 | | 2017 BLACKROCK ANNUAL REPORTTO SHAREHOLDERS |
Notes to Consolidated Financial Statements (continued)
up to 2% on the value redeemed or temporarily restrict redemptions for up to 10 business days during a 90 day period, in the event that the private investment company’s weekly liquid assets fall below certain thresholds.
Securities lending income is equal to the total of income earned from the reinvestment of cash collateral, net of fees and other payments to and from borrowers of securities, and less the collateral investment expenses. The Fund retains a portion of securities lending income and remits a remaining portion to BIM as compensation for its services as securities lending agent.
Pursuant to a securities lending agreement, the Fund retains 80% of securities lending income, and this amount retained can never be less than 70% of the total of securities lending income plus the collateral investment expenses.
In addition, commencing the business day following the date that the aggregate securities lending income earned across the Equity-Bond Complex in a calendar year exceeds a specified threshold, the Fund, pursuant to the securities lending agreement, will retain for the remainder of that calendar year securities lending income as follows: 85% of securities lending income, and this amount retained can never be less than 70% of the total of securities lending income plus the collateral investment expenses.
The share of securities lending income earned by the Fund is shown as securities lending income — affiliated — net in the Consolidated Statement of Operations. For the year ended October 31, 2017, the Fund paid BIM $1,248,620 for securities lending agent services.
Officers and Directors: Certain officers and/or directors of the Fund are officers and/or directors of BlackRock or its affiliates. The Fund reimburses the Manager for a portion of the compensation paid to the Fund’s Chief Compliance Officer, which is included in Officer and Directors in the Consolidated Statement of Operations.
Other Transactions: The Fund may purchase securities from, or sell securities to, an affiliated fund provided the affiliation is due solely to having a common investment adviser, common officers, or common trustees. For the year ended October 31, 2017, the purchase and sale transactions and any net realized gains (losses) with an affiliated fund in compliance with Rule 17a-7 under the 1940 Act were as follows:
| | | | | | |
| | | Purchases | | Sales | | Net Realized Gain (Loss) |
| | | $13,811,080 | | $23,599,652 | | $10,196,054 |
For the year ended October 31, 2017, purchases and sales of investments, including paydowns and excluding short-term securities, were as follows:
| | | | | | | | |
| | | Purchases | | | Sales | |
Non-U.S. Government Securities | | $ | 16,360,277,179 | | | $ | 25,456,248,694 | |
U.S. Government Securities | | | 23,870,417,124 | | | | 22,337,477,772 | |
| 8. | INCOME TAX INFORMATION: |
It is the Fund’s policy to comply with the requirements of the Internal Revenue Code of 1986, as amended, applicable to regulated investment companies, and to distribute substantially all of its taxable income to its shareholders. Therefore, no U.S. federal income tax provision is required.
The Fund files U.S. federal and various state and local tax returns. No income tax returns are currently under examination. The statute of limitations on the Fund’s U.S. federal tax returns generally remains open for each of the four years ended October 31, 2017. The statutes of limitations on the Fund’s state and local tax returns may remain open for an additional year depending upon the jurisdiction.
Management has analyzed tax laws and regulations and their application to the Fund as of October 31, 2017, inclusive of the open tax return years, and does not believe that there are any uncertain tax positions that require recognition of a tax liability in the Fund’s consolidated financial statements.
US GAAP requires that certain components of net assets be adjusted to reflect permanent differences between financial and tax reporting. These reclassifications have no effect on net assets or net asset values per share. As of October 31, 2017, the following permanent differences attributable to foreign currency transactions, amortization methods on fixed income securities, income recognized from wholly owned subsidiary, the accounting for swap agreements, the classification of investment, the use of equalization, income recognized from pass-through entities and the sale of stock of passive foreign investment companies were reclassified to the following accounts:
| | | | |
Paid-in capital | | $ | 85,048,665 | |
Undistributed net investment income | | | 16,104,590 | |
Accumulated net realized gain | | | (101,153,255 | ) |
The tax character of distributions paid was as follows:
| | | | | | | | |
| | | 10/31/17 | | | 10/31/16 | |
Ordinary income | | $ | 393,498,865 | | | $ | 595,281,203 | |
Long-term capital gains(a) | | | 501,867,110 | | | | 3,613,688,044 | |
| | | | | | | | |
| | $ | 895,365,975 | | | $ | 4,208,969,247 | |
| | | | | | | | |
| | (a) | Distribution amounts may include a portion of the proceeds from redeemed shares. | |
| | | | |
| NOTESTO CONSOLIDATED FINANCIAL STATEMENTS | | | 47 | |
Notes to Consolidated Financial Statements (continued)
As of October 31, 2017, the tax components of accumulated net earnings (losses) were as follows:
| | | | |
Undistributed ordinary income | | $ | 768,473,947 | |
Undistributed long-term capital gains | | | 815,893,065 | |
Net unrealized gains(a) | | | 5,063,486,084 | |
| | | | |
| | $ | 6,647,853,096 | |
| | | | |
| | (a) | The difference between book-basis and tax-basis net unrealized gains was attributable primarily to the tax deferral of losses on wash sales and straddles, the realization for tax purposes of unrealized gains/losses on certain futures, options and foreign currency contracts, the realization for tax purposes of unrealized gains on investments in passive foreign investment companies, amortization methods for premiums and discounts on fixed income securities, the accounting for swap agreements, the classification of investments and the investment in a wholly owned subsidiary. | |
As of October 31, 2017, gross unrealized appreciation and depreciation for investments and derivatives based on cost for U.S. federal income tax purposes were as follows:
| | | | |
Tax cost | | $ | 33,938,549,354 | |
| | | | |
Gross unrealized appreciation | | $ | 6,528,138,635 | |
Gross unrealized depreciation | | | (1,278,272,491 | ) |
| | | | |
Net unrealized appreciation (depreciation) | | $ | 5,249,866,144 | |
| | | | |
The Fund, along with certain other funds managed by the Manager and its affiliates (“Participating Funds”), is a party to a 364-day, $2.1 billion credit agreement with a group of lenders. Under this agreement, the Fund may borrow to fund shareholder redemptions. Excluding commitments designated for certain individual funds, the Participating Funds, including the Fund, can borrow up to an aggregate commitment amount of $1.6 billion at any time outstanding, subject to asset coverage and other limitations as specified in the agreement. The credit agreement has the following terms: a fee of 0.12% per annum on unused commitment amounts and interest at a rate equal to the higher of (a) one-month LIBOR (but, in any event, not less than 0.00%) on the date the loan is made plus 0.80% per annum or (b) the Fed Funds rate (but, in any event, not less than 0.00%) in effect from time to time plus 0.80% per annum on amounts borrowed. The agreement expires in April 2018 unless extended or renewed. Participating Funds paid administration, legal and arrangement fees, which, if applicable, are included in miscellaneous expenses in the Consolidated Statement of Operations. These fees were allocated among such funds based upon portions of the aggregate commitment available to them and relative net assets of Participating Funds. During the year ended October 31, 2017, the Fund did not borrow under the credit agreement.
In the normal course of business, the Fund invests in securities or other instruments and may enter into certain transactions, and such activities subject the Fund to various risks, including among others, fluctuations in the market (market risk) or failure of an issuer to meet all of its obligations. The value of securities or other instruments may also be affected by various factors, including, without limitation: (i) general economy; (ii) overall market as well as local, regional or global political and/or social instability; (iii) regulation, taxation or international tax treaties between various countries; or (iv) currency, interest rate and price fluctuations. The Fund’s prospectus provides details of the risks to which the Fund is subject.
The Fund may be exposed to prepayment risk, which is the risk that borrowers may exercise their option to prepay principal earlier than scheduled during periods of declining interest rates, which would force the Fund to reinvest in lower yielding securities. The Fund may also be exposed to reinvestment risk, which is the risk that income from the Fund’s portfolio will decline if the Fund invests the proceeds from matured, traded or called fixed-income securities at market interest rates that are below the Fund portfolio’s current earnings rate.
On October 11, 2016, BlackRock implemented certain changes required by amendments to Rule 2a-7 under the 1940 Act, which governs the operations of U.S. money market funds. The Fund may be exposed to additional risks when reinvesting cash collateral in money market funds that do not seek to maintain a stable NAV per share of $1.00 and which may be subject to redemption gates or liquidity fees under certain circumstances.
Valuation Risk: The market values of equities, such as common stocks and preferred securities or equity related investments, such as futures and options, may decline due to general market conditions which are not specifically related to a particular company. They may also decline due to factors which affect a particular industry or industries. The Fund may invest in illiquid investments and may experience difficulty in selling those investments in a timely manner at the price that it believes the investments are worth. Prices may fluctuate widely over short or extended periods in response to company, market or economic news. Markets also tend to move in cycles, with periods of rising and falling prices. This volatility may cause the Fund’s NAV to experience significant increases or decreases over short periods of time. If there is a general decline in the securities and other markets, the NAV of the Fund may lose value, regardless of the individual results of the securities and other instruments in which the Fund invests.
The price the Fund could receive upon the sale of any particular portfolio investment may differ from the Fund’s valuation of the investment, particularly for securities that trade in thin or volatile markets or that are valued using a fair valuation technique or a price provided by an independent pricing service. Changes to significant unobservable inputs and assumptions (i.e., publicly traded company multiples, growth rate, time to exit) due to the lack of observable inputs may significantly impact the resulting fair value and therefore the Fund’s results of operations. As a result, the price received upon the sale of an investment may be less than the value ascribed by the Fund, and the Fund could realize a greater than expected loss or lesser than expected gain upon the sale of the investment. The Fund’s ability to value its investments may also be impacted by technological issues and/or errors by pricing services or other third party service providers.
| | |
| 48 | | 2017 BLACKROCK ANNUAL REPORTTO SHAREHOLDERS |
Notes to Consolidated Financial Statements (continued)
Counterparty Credit Risk: Similar to issuer credit risk, the Fund may be exposed to counterparty credit risk, or the risk that an entity may fail to or be unable to perform on its commitments related to unsettled or open transactions. The Fund manages counterparty credit risk by entering into transactions only with counterparties that the Manager believes have the financial resources to honor their obligations and by monitoring the financial stability of those counterparties. Financial assets, which potentially expose the Fund to market, issuer and counterparty credit risks, consist principally of financial instruments and receivables due from counterparties. The extent of the Fund’s exposure to market, issuer and counterparty credit risks with respect to these financial assets is approximately their value recorded in the Consolidated Statement of Assets and Liabilities, less any collateral held by the Fund.
A derivative contract may suffer a mark-to-market loss if the value of the contract decreases due to an unfavorable change in the market rates or values of the underlying instrument. Losses can also occur if the counterparty does not perform under the contract.
The Fund’s risk of loss from counterparty credit risk on OTC derivatives is generally limited to the aggregate unrealized gain less the value of any collateral held by the Fund.
For OTC options purchased, the Fund bears the risk of loss in the amount of the premiums paid plus the positive change in market values net of any collateral held by the Fund should the counterparty fail to perform under the contracts. Options written by the Fund do not typically give rise to counterparty credit risk, as options written generally obligate the Fund, and not the counterparty, to perform. The Fund may be exposed to counterparty credit risk with respect to options written to the extent the Fund deposits collateral with its counterparty to a written option.
With exchange-traded options purchased and futures and centrally cleared swaps, there is less counterparty credit risk to the Fund since the exchange or clearinghouse, as counterparty to such instruments, guarantees against a possible default. The clearinghouse stands between the buyer and the seller of the contract; therefore, credit risk is limited to failure of the clearinghouse. While offset rights may exist under applicable law, the Fund does not have a contractual right of offset against a clearing broker or clearinghouse in the event of a default (including the bankruptcy or insolvency). Additionally, credit risk exists in exchange-traded futures and centrally cleared swaps with respect to initial and variation margin that is held in a clearing broker’s customer accounts. While clearing brokers are required to segregate customer margin from their own assets, in the event that a clearing broker becomes insolvent or goes into bankruptcy and at that time there is a shortfall in the aggregate amount of margin held by the clearing broker for all its clients, typically the shortfall would be allocated on a pro rata basis across all the clearing broker’s customers, potentially resulting in losses to the Fund.
Concentration Risk: The Fund invests a significant portion of its assets in fixed-income securities and/or uses derivatives tied to the fixed-income markets. Changes in market interest rates or economic conditions may affect the value and/or liquidity of such investments. Interest rate risk is the risk that prices of bonds and other fixed-income securities will increase as interest rates fall and decrease as interest rates rise. The Fund may be subject to a greater risk of rising interest rates due to the current period of historically low rates.
The Fund invests a substantial amount of its assets in issuers located in a single country or a limited number of countries. When the Fund concentrates its investments in this manner, it assumes the risk that economic, political and social conditions in those countries may have a significant impact on their investment performance. Foreign issuers may not be subject to the same uniform accounting, auditing and financial reporting standards and practices as used in the United States. Foreign securities markets may also be less liquid, more volatile, and less subject to governmental supervision not typically associated with investing in U.S. securities. Investment percentages in specific countries are presented in the Consolidated Schedule of Investments.
| 11. | CAPITAL SHARE TRANSACTIONS: |
Transactions in capital shares for each class were as follows:
| | | | | | | | | | | | | | | | |
| | | Year Ended October 31, | |
| | | 2017 | | | 2016 | |
| | | Shares | | | Amount | | | Shares | | | Amount | |
Institutional | | | | | | | | | | | | | | | | |
Shares sold | | | 201,044,432 | | | $ | 3,870,155,574 | | | | 207,256,970 | | | $ | 3,737,465,336 | |
Shares issued in reinvestment of distributions | | | 17,345,735 | | | | 319,335,255 | | | | 84,341,321 | | | | 1,500,432,396 | |
Shares redeemed | | | (300,404,285 | ) | | | (5,767,287,773 | ) | | | (433,648,405 | ) | | | (7,923,132,542 | ) |
| | | | | | | | | | | | | | | | |
Net decrease | | | (82,014,118 | ) | | $ | (1,577,796,944 | ) | | | (142,050,114 | ) | | $ | (2,685,234,810 | ) |
| | | | | | | | | | | | | | | | |
| | | | | | | | | | | | | | | | |
Investor A | | | | | | | | | | | | | | | | |
Shares sold | | | 122,059,376 | | | $ | 2,370,161,566 | | | | 85,333,497 | | | $ | 1,537,657,237 | |
Shares issued in reinvestment of distributions | | | 12,020,911 | | | | 219,022,298 | | | | 68,832,829 | | | | 1,218,342,178 | |
Shares redeemed | | | (237,165,293 | ) | | | (4,540,701,435 | ) | | | (229,485,621 | ) | | | (4,155,813,569 | ) |
| | | | | | | | | | | | | | | | |
Net decrease | | | (103,085,006 | ) | | $ | (1,951,517,571 | ) | | | (75,319,295 | ) | | $ | (1,399,814,154 | ) |
| | | | | | | | | | | | | | | | |
| | | | | | | | | | | | | | | | |
Investor B | | | | | | | | | | | | | | | | |
Shares sold | | | 10,782 | | | $ | 200,009 | | | | 23,808 | | | $ | 425,284 | |
Shares issued in reinvestment of distributions | | | 20,992 | | | | 373,456 | | | | 757,798 | | | | 13,087,172 | |
Shares redeemed | | | (3,157,422 | ) | | | (58,100,281 | ) | | | (7,493,425 | ) | | | (130,848,809 | ) |
| | | | | | | | | | | | | | | | |
Net decrease | | | (3,125,648 | ) | | $ | (57,526,816 | ) | | | (6,711,819 | ) | | $ | (117,336,353 | ) |
| | | | | | | | | | | | | | | | |
| | | | |
| NOTESTO CONSOLIDATED FINANCIAL STATEMENTS | | | 49 | |
Notes to Consolidated Financial Statements (continued)
| | | | | | | | | | | | | | | | |
| | | Year Ended October 31, | |
| | | 2017 | | | 2016 | |
| | | Shares | | | Amount | | | Shares | | | Amount | |
Investor C | | | | | | | | | | | | | | | | |
Shares sold | | | 16,858,128 | | | $ | 292,411,789 | | | | 47,656,817 | | | $ | 776,118,876 | |
Shares issued in reinvestment of distributions | | | 6,886,593 | | | | 114,248,755 | | | | 68,596,464 | | | | 1,106,462,321 | |
Shares redeemed | | | (277,935,505 | ) | | | (4,834,568,055 | ) | | | (228,269,479 | ) | | | (3,759,925,232 | ) |
| | | | | | | | | | | | | | | | |
Net decrease | | | (254,190,784 | ) | | $ | (4,427,907,511 | ) | | | (112,016,198 | ) | | $ | (1,877,344,035 | ) |
| | | | | | | | | | | | | | | | |
| | | | | | | | | | | | | | | | |
Class K(a) | | | | | | | | | | | | | | | | |
Shares sold | | | 43,430,054 | | | $ | 850,443,402 | | | | 38,679,074 | | | $ | 703,249,511 | |
Shares issued in reinvestment of distributions | | | 782,469 | | | | 14,478,283 | | | | — | | | | — | |
Shares redeemed | | | (11,185,907 | ) | | | (221,810,674 | ) | | | (5,890,316 | ) | | | (106,392,764 | ) |
| | | | | | | | | | | | | | | | |
Net increase | | | 33,026,616 | | | $ | 643,111,011 | | | | 32,788,758 | | | $ | 596,856,747 | |
| | | | | | | | | | | | | | | | |
| | | | | | | | | | | | | | | | |
Class R | | | | | | | | | | | | | | | | |
Shares sold | | | 8,135,005 | | | $ | 148,613,616 | | | | 16,105,650 | | | $ | 277,453,802 | |
Shares issued in reinvestment of distributions | | | 1,008,140 | | | | 17,561,793 | | | | 5,935,563 | | | | 100,548,434 | |
Shares redeemed | | | (19,075,815 | ) | | | (348,548,055 | ) | | | (19,801,987 | ) | | | (341,637,739 | ) |
| | | | | | | | | | | | | | | | |
Net increase (decrease) | | | (9,932,670 | ) | | $ | (182,372,646 | ) | | | 2,239,226 | | | $ | 36,364,497 | |
| | | | | | | | | | | | | | | | |
Total Net Decrease | | | (419,321,610 | ) | | $ | (7,554,010,477 | ) | | | (301,069,442 | ) | | $ | (5,446,508,108 | ) |
| | | | | | | | | | | | | | | | |
| | (a) | Commencement of operations on June 8, 2016. | |
Management has evaluated the impact of all subsequent events on the Fund through the date the consolidated financial statements were issued and has determined that there were no subsequent events requiring adjustment or additional disclosure in the consolidated financial statements.
| | |
| 50 | | 2017 BLACKROCK ANNUAL REPORTTO SHAREHOLDERS |
Report of Independent Registered Public Accounting Firm
To the Shareholders and Board of Directors of
BlackRock Global Allocation Fund, Inc.:
We have audited the accompanying consolidated statement of assets and liabilities of BlackRock Global Allocation Fund, Inc. and Subsidiary (the “Fund”), including the consolidated schedule of investments, as of October 31, 2017, and the related consolidated statement of operations for the year then ended, the consolidated statements of changes in net assets for each of the two years in the period then ended, and the consolidated financial highlights for each of the periods presented. These financial statements and financial highlights are the responsibility of the Fund’s management. Our responsibility is to express an opinion on these financial statements and financial highlights based on our audits.
We conducted our audits in accordance with the standards of the Public Company Accounting Oversight Board (United States). Those standards require that we plan and perform the audit to obtain reasonable assurance about whether the financial statements and financial highlights are free of material misstatement. The Fund is not required to have, nor were we engaged to perform, an audit of its internal control over financial reporting. Our audits included consideration of internal control over financial reporting as a basis for designing audit procedures that are appropriate in the circumstances, but not for the purpose of expressing an opinion on the effectiveness of the Fund’s internal control over financial reporting. Accordingly, we express no such opinion. An audit also includes examining, on a test basis, evidence supporting the amounts and disclosures in the financial statements, assessing the accounting principles used and significant estimates made by management, as well as evaluating the overall financial statement presentation. Our procedures included confirmation of securities owned as of October 31, 2017, by correspondence with the custodian, brokers and agent banks; when replies were not received from brokers or agent banks, we performed other auditing procedures. We believe that our audits provide a reasonable basis for our opinion.
In our opinion, such consolidated financial statements and consolidated financial highlights referred to above present fairly, in all material respects, the consolidated financial position of BlackRock Global Allocation Fund, Inc. and Subsidiary as of October 31, 2017, the consolidated results of their operations for the year then ended, the consolidated changes in their net assets for each of the two years in the period then ended, and the consolidated financial highlights for each of the periods presented, in conformity with accounting principles generally accepted in the United States of America.
Deloitte & Touche LLP
Boston, Massachusetts
December 21, 2017
| | | | |
| REPORTOF INDEPENDENT REGISTERED PUBLIC ACCOUNTING FIRM | | | 51 | |
Important Tax Information (Unaudited)
The following information is provided with respect to the ordinary income distributions paid by BlackRock Global Allocation Fund, Inc. during the fiscal year ended October 31, 2017.
| | | | | | | | | | |
| | | Payable Date | | 12/20/16 | | | 07/21/17 | |
Qualified Dividend Income for Individuals(a) | | | | | 85.46 | % | | | 54.51 | % |
Dividends Qualifying for the Dividend Received Deduction for Corporations(a) | | | | | 62.53 | % | | | 21.00 | % |
Federal Obligation Interest(b) | | | | | 7.41 | % | | | 11.26 | % |
Interest-Related Dividends for Non-US Residents(c ) | | | | | 19.53 | % | | | 18.19 | % |
| | (a) | The Fund hereby designates the percentage indicated above or the maximum amount allowable by law. | |
| | (b) | The law varies in each state as to whether and what percentage of dividend income attributable to federal obligations is exempt from state income tax. We recommend that you consult your tax advisor to determine if any portion of the dividends you received is exempt from state income taxes. | |
| | (c) | Represents the portion of the taxable ordinary income dividends eligible for exemption from US withholding tax for nonresident aliens and foreign corporations. | |
Additionally, the Fund distributed long-term capital gains of $0.149977 to shareholders of record on December 16, 2016.
| | |
| 52 | | 2017 BLACKROCK ANNUAL REPORTTO SHAREHOLDERS |
Disclosure of Investment Advisory Agreement
The Board of Directors (the “Board,” the members of which are referred to as “Board Members”) of BlackRock Global Allocation Fund, Inc. (the “Fund”) met in person on April 6, 2017 (the “April Meeting”) and May 9-10, 2017 (the “May Meeting”) to consider the approval of the investment advisory agreement (the “Advisory Agreement” or the “Agreement”) with BlackRock Advisors, LLC (the “Manager” or “BlackRock”), the Fund’s investment advisor.
Activities and Composition of the Board
On the date of the May Meeting, the Board consisted of thirteen individuals, eleven of whom were not “interested persons” of the Fund as defined in the Investment Company Act of 1940, as amended (the “1940 Act”) (the “Independent Board Members”). The Board Members are responsible for the oversight of the operations of the Fund and perform the various duties imposed on the directors of investment companies by the 1940 Act. The Independent Board Members have retained independent legal counsel to assist them in connection with their duties. The Chair of the Board is an Independent Board Member. The Board has established five standing committees: an Audit Committee, a Governance and Nominating Committee, a Compliance Committee, a Performance Oversight Committee and an Executive Committee, each of which is chaired by an Independent Board Member and composed of Independent Board Members (except for the Performance Oversight Committee and the Executive Committee, each of which also has one interested Board Member).
The Agreement
Pursuant to the 1940 Act, the Board is required to consider the continuation of the Agreement on an annual basis. The Board has four quarterly meetings per year, each extending over two days, a fifth one-day meeting to consider specific information surrounding the consideration of renewing the Agreement and additional in-person and telephonic meetings as needed. In connection with this year-long deliberative process, the Board assessed, among other things, the nature, extent and quality of the services provided to the Fund by BlackRock, BlackRock’s personnel and affiliates, including (as applicable): investment management; administrative and shareholder services; the oversight of fund service providers; marketing; risk oversight; compliance; and ability to meet applicable legal and regulatory requirements.
The Board, acting directly and through its committees, considers at each of its meetings, and from time to time as appropriate, factors that are relevant to its annual consideration of the renewal of the Agreement, including the services and support provided by BlackRock to the Fund and its shareholders. BlackRock also furnished additional information to the Board in response to specific questions from the Board. This additional information is discussed further below in the section titled “Board Considerations in Approving the Agreement.” Among the matters the Board considered were: (a) investment performance for one-year, three-year, five-year, ten-year, and/or since inception periods, as applicable, against peer funds, applicable benchmark, and performance metrics, as applicable, as well as senior management’s and portfolio managers’ analysis of the reasons for any over-performance or underperformance relative to its peers, benchmarks, and other performance metrics, as applicable; (b) fees, including advisory, administration, if applicable, and other amounts paid to BlackRock and its affiliates by the Fund for services; (c) Fund operating expenses and how BlackRock allocates expenses to the Fund; (d) the resources devoted to, risk oversight of, and compliance reports relating to, implementation of the Fund’s investment objective(s), policies and restrictions, and meeting regulatory requirements; (e) the Fund’s adherence to its compliance policies and procedures; (f) the nature, cost and character of non-investment management services provided by BlackRock and its affiliates; (g) BlackRock’s and other service providers’ internal controls and risk and compliance oversight mechanisms; (h) BlackRock’s implementation of the proxy voting policies approved by the Board; (i) the use of brokerage commissions and execution quality of portfolio transactions; (j) BlackRock’s implementation of the Fund’s valuation and liquidity procedures; (k) an analysis of management fees for products with similar investment mandates across the open-end fund, exchange-traded fund (“ETF”), closed-end fund, sub-advised mutual fund, separately managed account, collective investment trust, and institutional separate account product channels, as applicable, and the similarities and differences between these products and the services provided as compared to the Fund; (l) BlackRock’s compensation methodology for its investment professionals and the incentives and accountability it creates, along with investment professionals’ investments in the fund(s) they manage; and (m) periodic updates on BlackRock’s business.
Board Considerations in Approving the Agreement
The Approval Process: Prior to the April Meeting, the Board requested and received materials specifically relating to the Agreement. The Board is continuously engaged in a process with its independent legal counsel and BlackRock to review the nature and scope of the information provided to better assist its deliberations. The materials provided in connection with the April Meeting included (a) information independently compiled and prepared by Broadridge Financial Solutions, Inc. (“Broadridge”) on Fund fees and expenses as compared with a peer group of funds as determined by Broadridge (“Expense Peers”) and the investment performance of the Fund as compared with a peer group of funds as determined by Broadridge(a); (b) information on the profits realized by BlackRock and its affiliates pursuant to the Agreement and a discussion of fall-out benefits to BlackRock and its affiliates; (c) a general analysis provided by BlackRock concerning investment management fees charged to other clients, such as institutional clients, sub-advised mutual funds, ETFs, closed-end funds, and separately managed accounts, under similar investment mandates, as well as the performance of such other clients, as applicable; (d) review of non-management fees; (e) the existence, impact and sharing of potential economies of scale; (f) a summary of aggregate amounts paid by the Fund to BlackRock; and (g) sales and redemption data regarding the Fund’s shares.
At the April Meeting, the Board reviewed materials relating to its consideration of the Agreement. As a result of the discussions that occurred during the April Meeting, and as a culmination of the Board’s year-long deliberative process, the Board presented BlackRock with questions and requests for additional information. BlackRock responded to these requests with additional written information in advance of the May Meeting.
At the May Meeting, the Board, including the Independent Board Members, approved the continuation of the Advisory Agreement between the Manager and the Fund for a one-year term ending June 30, 2018. In approving the continuation of the Agreement, the Board considered: (a) the nature, extent and quality of the services provided by BlackRock; (b) the investment performance of the Fund; (c) the advisory fee and the cost of the services and profits to be realized by BlackRock and its affiliates from their relationship with the Fund; (d) the Fund’s costs to investors compared to the costs of Expense Peers and performance compared to the relevant performance metrics as previously discussed; (e) the sharing of potential economies of scale; (f) fall-out benefits to BlackRock and its affiliates as a result of its relationship with the Fund; and (g) other factors deemed relevant by the Board Members.
| (a) | Funds are ranked by Broadridge in quartiles, ranging from first to fourth, where first is the most desirable quartile position and fourth is the least desirable. |
| | | | |
| DISCLOSUREOF INVESTMENT ADVISORY AGREEMENT | | | 53 | |
Disclosure of Investment Advisory Agreement (continued)
The Board also considered other matters it deemed important to the approval process, such as other payments made to BlackRock or its affiliates, securities lending and cash management, services related to the valuation and pricing of Fund portfolio holdings, and materials submitted for the Board’s review. The Board noted the willingness of BlackRock personnel to engage in open, candid discussions with the Board. The Board did not identify any particular information as determinative, and each Board Member may have attributed different weights to the various items considered.
A. Nature, Extent and Quality of the Services Provided by BlackRock: The Board, including the Independent Board Members, reviewed the nature, extent and quality of services provided by BlackRock, including the investment advisory services and the resulting performance of the Fund. Throughout the year, the Board compared Fund performance to the performance of a comparable group of mutual funds, a relevant benchmark, and performance metrics, as applicable. The Board met with BlackRock’s senior management personnel responsible for investment activities, including the senior investment officers. The Board also reviewed the materials provided by the Fund’s portfolio management team discussing the Fund’s performance and the Fund’s investment objective(s), strategies and outlook.
The Board considered, among other factors, with respect to BlackRock: the number, education and experience of investment personnel generally and the Fund’s portfolio management team; BlackRock’s research capabilities; investments by portfolio managers in the funds they manage; portfolio trading capabilities; use of technology; commitment to compliance; credit analysis capabilities; risk analysis and oversight capabilities; and the approach to training and retaining portfolio managers and other research, advisory and management personnel. The Board engaged in a review of BlackRock’s compensation structure with respect to the Fund’s portfolio management team and BlackRock’s ability to attract and retain high-quality talent and create performance incentives.
In addition to investment advisory services, the Board considered the quality of the administrative and other non-investment advisory services provided to the Fund. BlackRock and its affiliates provide the Fund with certain administrative, shareholder and other services (in addition to any such services provided to the Fund by third parties) and officers and other personnel as are necessary for the operations of the Fund. In particular, BlackRock and its affiliates provide the Fund with administrative services including, among others: (i) preparing disclosure documents, such as the prospectus, the summary prospectus (as applicable), the statement of additional information and periodic shareholder reports; (ii) oversight of daily accounting and pricing; (iii) preparing periodic filings with regulators; (iv) overseeing and coordinating the activities of other service providers; (v) organizing Board meetings and preparing the materials for such Board meetings; (vi) providing legal and compliance support; (vii) furnishing analytical and other support to assist the Board in its consideration of strategic issues such as the merger, consolidation or repurposing of certain open-end funds; and (viii) performing other administrative functions necessary for the operation of the Fund, such as tax reporting, fulfilling regulatory filing requirements and call center services. The Board reviewed the structure and duties of BlackRock’s fund administration, shareholder services, and legal & compliance departments and considered BlackRock’s policies and procedures for assuring compliance with applicable laws and regulations.
B. The Investment Performance of the Fund and BlackRock: The Board, including the Independent Board Members, also reviewed and considered the performance history of the Fund. In preparation for the April Meeting, the Board was provided with reports independently prepared by Broadridge, which included a comprehensive analysis of the Fund’s performance. The Board also reviewed a narrative and statistical analysis of the Broadridge data that was prepared by BlackRock. In connection with its review, the Board received and reviewed information regarding the investment performance of the Fund as compared to other funds in its applicable Broadridge category. The Board was provided with a description of the methodology used by Broadridge to select peer funds and periodically meets with Broadridge representatives to review its methodology. The Board was provided with information on the composition of the Broadridge performance universes and expense universes. The Board and its Performance Oversight Committee regularly review, and meet with Fund management to discuss, the performance of the Fund throughout the year.
In evaluating performance, the Board recognized that the performance data reflects a snapshot of a period as of a particular date and that selecting a different performance period could produce significantly different results. Further, the Board recognized that it is possible that long-term performance can be adversely affected by even one period of significant underperformance so that a single investment decision or theme has the ability to affect long-term performance disproportionately.
The Board noted that for the one-, three- and five-year periods reported, the Fund ranked in the fourth, third and third quartiles, respectively, against its Broadridge Performance Universe through December 31, 2016. The Board and BlackRock reviewed the Fund’s underperformance during these periods. The Board noted that the Fund’s performance against its Broadridge Performance Universe improved, and the Fund’s Sharpe Ratio ranked in the second quartile for the one-year period against its Competitor Sampling, through February 28, 2017.
The Board and BlackRock discussed BlackRock’s strategy for improving the Fund’s investment performance. Discussions covered topics such as: investment risks undertaken by the Fund; performance attribution; the Fund’s investment personnel; and the resources appropriate to support the Fund’s investment processes.
C. Consideration of the Advisory/Management Fees and the Cost of the Services and Profits to be Realized by BlackRock and its Affiliates from their Relationship with the Fund: The Board, including the Independent Board Members, reviewed the Fund’s contractual management fee rate compared with the other funds in its Broadridge category. The contractual management fee rate represents a combination of the advisory fee and any administrative fees, before taking into account any reimbursements or fee waivers. The Board also compared the Fund’s total expense ratio, as well as its actual management fee rate, to those of other funds in its Broadridge category. The total expense ratio represents a fund’s total net operating expenses, including any 12b-1 or non 12b-1 service fees. The total expense ratio gives effect to any expense reimbursements or fee waivers that benefit a fund, and the actual management fee rate gives effect to any management fee reimbursements or waivers that benefit a fund. The Board considered the services provided and the fees charged by BlackRock and its affiliates to other types of clients with similar investment mandates, as applicable, including institutional accounts and sub-advised mutual funds (including mutual funds sponsored by third parties).
The Board received and reviewed statements relating to BlackRock’s financial condition. The Board reviewed BlackRock’s profitability methodology and was also provided with a profitability analysis that detailed the revenues earned and the expenses incurred by BlackRock for services provided to the Fund. The Board reviewed BlackRock’s profitability with respect to the Fund and other funds the Board currently oversees for the year ended December 31, 2016 compared to available aggregate profitability data provided for the prior two years. The Board reviewed BlackRock’s profitability with respect to certain other U.S. fund complexes managed by the Manager and/or its affiliates. The Board reviewed BlackRock’s assumptions and methodology of allocating expenses in the profitability analysis, noting the inherent limitations in allocating costs among various advisory products. The Board recognized that profitability may be affected by numerous factors including, among other things, fee waivers and expense reimbursements by the Manager, the types of funds managed, precision of expense allocations and business mix. As a result, calculating and comparing profitability at individual fund levels is difficult.
| | |
| 54 | | 2017 BLACKROCK ANNUAL REPORTTO SHAREHOLDERS |
Disclosure of Investment Advisory Agreement (continued)
The Board noted that, in general, individual fund or product line profitability of other advisors is not publicly available. The Board reviewed BlackRock’s overall operating margin, in general, compared to that of certain other publicly-traded asset management firms. The Board considered the differences between BlackRock and these other firms, including the contribution of technology at BlackRock, BlackRock’s expense management, and the relative product mix.
In addition, the Board considered the cost of the services provided to the Fund by BlackRock, and BlackRock’s and its affiliates’ profits relating to the management and distribution of the Fund and the other funds advised by BlackRock and its affiliates. As part of its analysis, the Board reviewed BlackRock’s methodology in allocating its costs of managing the Fund, to the Fund. The Board may receive and review information from independent third parties as part of its annual evaluation. The Board considered whether BlackRock has the financial resources necessary to attract and retain high quality investment management personnel to perform its obligations under the Agreement and to continue to provide the high quality of services that is expected by the Board. The Board further considered factors including but not limited to BlackRock’s commitment of time, assumption of risk, and liability profile in servicing the Fund in contrast to what is required of BlackRock with respect to other products with similar investment mandates across the open-end fund, ETF, closed-end fund, sub-advised mutual fund, separately managed account, collective investment trust, and institutional separate account product channels, as applicable.
The Board noted that the Fund’s contractual management fee rate ranked in the third quartile, and that the actual management fee rate and total expense ratio each ranked in the second quartile, relative to the Fund’s Expense Peers. The Board also noted that the Fund previously had an advisory fee arrangement that included voluntary breakpoints, in the form of an advisory fee waiver, that adjusted the fee rate downward as the size of the Fund increased above certain contractually specified levels. In addition, after discussion between the Board, including the Independent Board Members, and BlackRock, the Board agreed to convert the advisory fee waiver from voluntary to contractual. The conversion was implemented on June 12, 2017.
D. Economies of Scale: The Board, including the Independent Board Members, considered the extent to which economies of scale might be realized as the assets of the Fund increase, as well as the existence of expense caps, as applicable. The Board also considered the extent to which the Fund benefits from such economies in a variety of ways, and whether there should be changes in the advisory fee rate or breakpoint structure in order to enable the Fund to more fully participate in these economies of scale. The Board considered the Fund’s asset levels and whether the current fee schedule was appropriate. In its consideration, the Board Members took into account the existence of any expense caps and further considered the continuation and/or implementation, as applicable, of such caps.
E. Other Factors Deemed Relevant by the Board Members: The Board, including the Independent Board Members, also took into account other ancillary or “fall-out” benefits that BlackRock or its affiliates may derive from their respective relationships with the Fund, both tangible and intangible, such as BlackRock’s ability to leverage its investment professionals who manage other portfolios and risk management personnel, an increase in BlackRock’s profile in the investment advisory community, and the engagement of BlackRock’s affiliates as service providers to the Fund, including for administrative, distribution, securities lending and cash management services. The Board also considered BlackRock’s overall operations and its efforts to expand the scale of, and improve the quality of, its operations. The Board also noted that BlackRock may use and benefit from third party research obtained by soft dollars generated by certain registered fund transactions to assist in managing all or a number of its other client accounts.
In connection with its consideration of the Agreement, the Board also received information regarding BlackRock’s brokerage and soft dollar practices. The Board received reports from BlackRock which included information on brokerage commissions and trade execution practices throughout the year.
The Board noted the competitive nature of the open-end fund marketplace, and that shareholders are able to redeem their Fund shares if they believe that the Fund’s fees and expenses are too high or if they are dissatisfied with the performance of the Fund.
Conclusion
The Board, including the Independent Board Members, approved the continuation of the Advisory Agreement between the Manager and the Fund for a one-year term ending June 30, 2018. Based upon its evaluation of all of the aforementioned factors in their totality, as well as other information, the Board, including the Independent Board Members, was satisfied that the terms of the Agreement were fair and reasonable and in the best interest of the Fund and its shareholders. In arriving at its decision to approve the Agreement, the Board did not identify any single factor or group of factors as all-important or controlling, but considered all factors together, and different Board Members may have attributed different weights to the various factors considered. The Independent Board Members were also assisted by the advice of independent legal counsel in making this determination. The contractual fee arrangements for the Fund reflect the results of several years of review by the Board Members and predecessor Board Members, and discussions between such Board Members (and predecessor Board Members) and BlackRock. As a result, the Board Members’ conclusions may be based in part on their consideration of these arrangements in prior years.
| | | | |
| DISCLOSUREOF INVESTMENT ADVISORY AGREEMENT | | | 55 | |
Director and Officer Information
| | | | | | | | |
| Independent Directors (a) |
| | | | | |
Name (b)
Year of Birth | | Position(s) Held
(Length of Service) (c) | | Principal Occupation(s) During Past Five Years | | Number of BlackRock-Advised
Registered Investment Companies
(“RICs”) Consisting of Investment
Portfolios (“Portfolios”) Overseen | | Public Directorships |
Robert M. Hernandez 1944 | | Chair of the Board and Director (Since 2007) | | Director, Vice Chairman and Chief Financial Officer of USX Corporation (energy and steel business) from 1991 to 2001; Director, RTI International Metals, Inc. from 1990 to 2015; Director, TE Connectivity (electronics) from 2006 to 2012. | | 27 RICs consisting of 98 Portfolios | | Chubb Limited (insurance company); Eastman Chemical Company |
James H. Bodurtha 1944 | | Director (Since 2007) | | Director, The China Business Group, Inc. (consulting and investing firm) from 1996 to 2013 and Executive Vice President thereof from 1996 to 2003; Chairman of the Board, Berkshire Holding Corporation since 1980; Director, ICI Mutual since 2010. | | 27 RICs consisting of 98 Portfolios | | None |
Bruce R. Bond 1946 | | Director (Since 2007) | | Trustee and Member of the Governance Committee, State Street Research Mutual Funds from 1997 to 2005; Board Member of Governance, Audit and Finance Committee, Avaya Inc. (computer equipment) from 2003 to 2007. | | 27 RICs consisting of 98 Portfolios | | None |
Donald W. Burton 1944 | | Director (Since 2007) | | Managing General Partner, The Burton Partnership, LP (an investment partnership) from 1979 to 2017; Managing General Partner, The Burton Partnership (QP), LP (an investment partnership) since 2000; Managing General Partner, The South Atlantic Venture Funds from 1983 to 2012; Director, IDology, Inc. (technology solutions) since 2006; Director, Knology, Inc. (telecommunications) from 1996 to 2012; Director, Capital Southwest (financial) from 2006 to 2012; Director, Burtons Grill (restaurant) since 2013; Director, PDQ South Texas (restaurant) since 2013; Director, ITC/Talon (data) since 2015. | | 27 RICs consisting of 98 Portfolios | | None |
Honorable Stuart E. Eizenstat 1943 | | Director (Since 2007) | | Partner and Head of International Practice, Covington and Burling LLP (law firm) since 2001; International Advisory Board Member, The Coca-Cola Company from 2002 to 2011; Advisory Board Member, Veracity Worldwide, LLC (risk management) from 2007 to 2012; Member of the International Advisory Board GML Ltd. (energy) since 2003. | | 27 RICs consisting of 98 Portfolios | | Alcatel-Lucent (telecommunications); Global Specialty Metallurgical; UPS Corporation (delivery service); Ferroglobe (metals) |
Henry Gabbay 1947 | | Director (Since 2007) | | Consultant, BlackRock, Inc. from 2007 to 2008; Managing Director, BlackRock, Inc. from 1989 to 2007; Chief Administrative Officer, BlackRock Advisors, LLC from 1998 to 2007; President of BlackRock Funds and BlackRock Allocation Target Shares (formerly, BlackRock Bond Allocation Target Shares) from 2005 to 2007 and Treasurer of certain closed-end funds in the BlackRock fund complex from 1989 to 2006. | | 27 RICs consisting of 98 Portfolios | | None |
Lena G. Goldberg 1949 | | Director (Since 2016) | | Senior Lecturer, Harvard Business School since 2008; Executive Vice President, FMR LLC/Fidelity Investments (financial services) from 2007 to 2008, Executive Vice President and General Counsel thereof from 2002 to 2007, Senior Vice President and General Counsel thereof from 1999 to 2002, Vice President and General Counsel thereof from 1997 to 1999, Senior Vice President and Deputy General Counsel thereof in 1997, and Vice President and Corporate Counsel thereof from 1996 to 1997; Partner, Sullivan & Worcester LLP from 1985 to 1996 and Associate thereof from 1979 to 1985. | | 27 RICs consisting of 98 Portfolios | | None |
| | |
| 56 | | 2017 BLACKROCK ANNUAL REPORTTO SHAREHOLDERS |
Director and Officer Information (continued)
| | | | | | | | |
| Independent Directors (a) |
| | | | | |
Name (a)
Year of Birth | | Position(s) Held
(Length of Service) (c) | | Principal Occupation(s) During Past Five Years | | Number of BlackRock-Advised
Registered Investment Companies
(“RICs”) Consisting of Investment
Portfolios (“Portfolios”) Overseen | | Public
Directorships |
Henry R. Keizer 1956 | | Director (Since 2016) | | Director, Park Indemnity Ltd. (captive insurer) since 2010; Director, MUFG Americas Holdings Corporation and MUFG Union Bank, N.A. (financial and bank holding company) from 2014 to 2016; Director, Montpelier Re Holdings, Ltd. (publicly held property and casual reinsurance) from 2013 to 2015; Director, American Institute of Certified Public Accountants from 2009 to 2011; Director, KPMG LLP (audit, tax and advisory services) from 2004 to 2005 and 2010 to 2012; Director, KPMG International in 2012, Deputy Chairman and Chief Operating Officer thereof from 2010 to 2012 and U.S. Vice Chairman of Audit thereof from 2005 to 2010; Global Head of Audit, KPMGI (consortium of KPMG firms) from 2006 to 2010; Director, YMCA of Greater New York from 2006 to 2010. | | 27 RICs consisting of 98 Portfolios | | Hertz Global Holdings (car rental); WABCO (commercial vehicle safety systems) |
John F. O'Brien 1943 | | Director (Since 2007) | | Trustee, Woods Hole Oceanographic Institute since 2003 and Chairman thereof from 2009 to 2015; Co-Founder and Managing Director, Board Leaders LLC (director education) since 2005. | | 27 RICs consisting of 98 Portfolios | | Cabot Corporation (chemicals); LKQ Corporation (auto parts manufacturing); TJX Companies, Inc. (retailer) |
Donald C. Opatrny 1952 | | Director (Since 2015) | | Trustee, Member of the Executive Committee and Chair of the Investment Committee, Cornell University since 2004; Member of the Board and Investment Committee, University School since 2007; Member of the Investment Committee, Mellon Foundation from 2009 to 2015; President and Trustee, the Center for the Arts, Jackson Hole since 2011; Director, Athena Capital Advisors LLC (investment management firm) since 2013; Trustee and Chair of the Investment Committee, Community Foundation of Jackson Hole since 2014; Trustee, Artstor (a Mellon Foundation affiliate) from 2010 to 2015; President, Trustee and Member of the Investment Committee, The Aldrich Contemporary Art Museum from 2007 to 2014. | | 27 RICs consisting of 98 Portfolios | | None |
Roberta Cooper Ramo 1942 | | Director (Since 2007) | | Shareholder and Attorney, Modrall, Sperling, Roehl, Harris & Sisk, P.A. (law firm) since 1993; Director, ECMC Group (service provider to students, schools and lenders) since 2001; President, The American Law Institute (non-profit) since 2008; Vice President, Santa Fe Opera (non-profit) since 2011; Chair, Think New Mexico (non-profit) since 2013; Chairman of the Board, Cooper’s Inc. (retail) from 1999 to 2011. | | 27 RICs consisting of 98 Portfolios | | None |
| | | | |
| DIRECTORAND OFFICER INFORMATION | | | 57 | |
Director and Officer Information (continued)
| | | | | | | | |
| Interested Directors (d) |
| | | | | |
Name (b)
Year of Birth | | Position(s) Held
(Length of Service) (c) | | Principal Occupation(s) During Past Five Years | | Number of BlackRock-Advised
Registered Investment Companies
(“RICs”) Consisting of Investment
Portfolios (“Portfolios”) Overseen | | Public
Directorships |
Robert Fairbairn 1965 | | Director (Since 2015) | | Senior Managing Director of BlackRock, Inc. since 2010; Global Head of BlackRock’s Retail and iShares® businesses since 2012; Member of BlackRock’s Global Executive and Global Operating Committees; Head of BlackRock’s Global Client Group from 2009 to 2012; Chairman of BlackRock’s international businesses from 2007 to 2010. | | 27 RICs consisting of 98 Portfolios | | None |
John M. Perlowski 1964 | | Director (Since 2015), President and Chief Executive Officer (Since 2010) | | Managing Director of BlackRock, Inc. since 2009; Head of BlackRock Global Fund & Accounting Services since 2009; Managing Director and Chief Operating Officer of the Global Product Group at Goldman Sachs Asset Management, L.P. from 2003 to 2009; Treasurer of Goldman Sachs Mutual Funds from 2003 to 2009 and Senior Vice President thereof from 2007 to 2009; Director of Goldman Sachs Offshore Funds from 2002 to 2009; Advisory Director of Family Resource Network (charitable foundation) since 2009. | | 127 RICs consisting of 316 Portfolios | | None |
(a) The address of each Director is c/o BlackRock, Inc., 55 East 52nd Street, New York, NY 10055. |
(b) Each Independent Director holds office until his or her successor is duly elected and qualifies or until his or her earlier death, resignation, retirement or removal as provided by the Fund’s by-laws or charter or statute, or until December 31 of the year in which he or she turns 75. The Board may determine to extend the terms of Independent Directors on a case-by-case basis, as appropriate. Interested Directors serve until their successor is duly elected and qualifies or until their earlier death, resignation, retirement or removal as provided by the Trust’s/Fund’s by-laws or statute, or until December 31 of the year in which they turn 72. |
(c) Following the combination of Merrill Lynch Investment Managers, L.P. (“MLIM”) and BlackRock, Inc. in September 2006, the various legacy MLIM and legacy BlackRock fund boards were realigned and consolidated into three new fund boards in 2007. As a result, although the chart shows certain Independent Directors as joining the Board in 2007, those Directors first became members of the boards of other legacy MLIM or legacy BlackRock funds as follows: James H. Bodurtha, 1995; Bruce R. Bond, 2005; Donald W. Burton, 2002; Honorable Stuart E. Eizenstat, 2001; Robert M. Hernandez, 1996; John F. O’Brien, 2005; and Roberta Cooper Ramo, 1999. |
(d) Messrs. Fairbairn and Perlowski are both “interested persons,” as defined in the 1940 Act, of the Fund based on their positions with BlackRock, Inc. and its affiliates. Mr. Perlowski is also a board member of the BlackRock Closed-End Complex and the BlackRock Equity-Liquidity Complex. |
| | |
| 58 | | 2017 BLACKROCK ANNUAL REPORTTO SHAREHOLDERS |
Director and Officer Information (continued)
| | | | |
| Officers Who Are Not Directors (a) |
| | | |
Name (b)
Year of Birth | | Position(s) Held
(Length of Service) | | Principal Occupation(s) During Past Five Years |
Jennifer McGovern 1977 | | Vice President (Since 2014) | | Managing Director of BlackRock, Inc. since 2016; Director of BlackRock, Inc. from 2011 to 2015; Head of Product Structure and Oversight for BlackRock’s U.S. Wealth Advisory Group since 2013; Vice President of BlackRock, Inc. from 2008 to 2010. |
Neal J. Andrews 1966 | | Chief Financial Officer (Since 2007) | | Managing Director of BlackRock, Inc. since 2006; Senior Vice President and Line of Business Head of Fund Accounting and Administration at PNC Global Investment Servicing (U.S.) Inc. from 1992 to 2006. |
Jay M. Fife 1970 | | Treasurer (Since 2007) | | Managing Director of BlackRock, Inc. since 2007; Director of BlackRock, Inc. in 2006; Assistant Treasurer of the MLIM and Fund Asset Management, L.P. advised funds from 2005 to 2006; Director of MLIM Fund Services Group from 2001 to 2006. |
Charles Park 1967 | | Chief Compliance Officer (Since 2014) | | Anti-Money Laundering Compliance Officer for the BlackRock-advised Funds in the Equity-Bond Complex, the Equity-Liquidity Complex and the Closed-End Complex from 2014 to 2015; Chief Compliance Officer of BlackRock Advisors, LLC and the BlackRock-advised Funds in the Equity-Bond Complex, the Equity-Liquidity Complex and the Closed-End Complex since 2014; Principal of and Chief Compliance Officer for iShares® Delaware Trust Sponsor LLC since 2012 and BlackRock Fund Advisors (“BFA”) since 2006; Chief Compliance Officer for the BFA-advised iShares® exchange traded funds since 2006; Chief Compliance Officer for BlackRock Asset Management International Inc. since 2012. |
Fernanda Piedra 1969 | | Anti-Money Laundering Compliance Officer (Since 2015) | | Director of BlackRock, Inc. since 2014; Anti-Money Laundering Compliance Officer and Regional Head of Financial Crime for the Americas at BlackRock, Inc. since 2014; Head of Regulatory Changes and Remediation for the Asset Wealth Management Division of Deutsche Bank from 2010 to 2014; Vice President of Goldman Sachs (Anti-Money Laundering/Suspicious Activities Group) from 2004 to 2010. |
Benjamin Archibald 1975 | | Secretary (Since 2012) | | Managing Director of BlackRock, Inc. since 2014; Director of BlackRock, Inc. from 2010 to 2013; Secretary of the iShares® exchange traded funds since 2015; Secretary of the BlackRock-advised mutual funds since 2012. |
(a) The address of each Officer is c/o BlackRock, Inc., 55 East 52nd Street, New York, NY 10055. |
(b) Officers of the Fund serve at the pleasure of the Board. |
Further information about the Fund's Directors and Officers is available in the Fund's Statement of Additional Information, which can be obtained without charge by calling (800) 441-7762.
| | |
| Investment Adviser | | Custodian |
| BlackRock Advisors, LLC | | Brown Brothers Harriman & Co. |
| Wilmington, DE 19809 | | Boston, MA 02109 |
| | |
| Accounting Agent | | Transfer Agent |
| State Street Bank and Trust Company | | BNY Mellon Investment Servicing (U.S.) Inc.
|
| Boston, MA 02111 | | Wilmington, DE 19809 |
| | |
| | Independent Registered Public Accounting Firm
|
| | Deloitte & Touche LLP
|
| | Boston, MA 02116 |
| | |
| | Distributor BlackRock Investments, LLC
New York, NY 10022 |
| | |
| | Legal Counsel Willkie Farr & Gallagher LLP New York, NY 10019 |
| | |
| | Address of the Fund
100 Bellevue Parkway
Wilmington, DE 19809 |
| | | | |
| DIRECTORAND OFFICER INFORMATION | | | 59 | |
Additional Information
General Information
Householding
The Fund will mail only one copy of shareholder documents, including prospectuses, annual and semi-annual reports and proxy statements, to shareholders with multiple accounts at the same address. This practice is commonly called “householding” and is intended to reduce expenses and eliminate duplicate mailings of shareholder documents. Mailings of your shareholder documents may be householded indefinitely unless you instruct us otherwise. If you do not want the mailing of these documents to be combined with those for other members of your household, please call the Fund at (800) 441-7762.
Availability of Quarterly Schedule of Investments
The Fund files its complete schedule of portfolio holdings with the SEC for the first and third quarters of each fiscal year on Form N-Q. The Fund’s Forms N-Q are available on the SEC’s website at http://www.sec.gov and may also be reviewed and copied at the SEC’s Public Reference Room in Washington, DC. Information on the operation of the Public Reference Room or how to access documents on the SEC’s website without charge may be obtained by calling (800) SEC-0330. The Fund’s Forms N-Q may also be obtained upon request and without charge by calling (800) 441-7762.
Availability of Proxy Voting Policies and Procedures
A description of the policies and procedures that the Fund uses to determine how to vote proxies relating to portfolio securities is available upon request and without charge (1) by calling (800) 441-7762; (2) at http://www.blackrock.com; and (3) on the SEC’s website at http://www.sec.gov.
Availability of Proxy Voting Record
Information about how the Fund voted proxies relating to securities held in the Fund’s portfolio during the most recent 12-month period ended June 30 is available upon request and without charge (1) at http://www.blackrock.com or by calling (800) 441-7762 and (2) on the SEC’s website at http://www.sec.gov.
BlackRock’s Mutual Fund Family
BlackRock offers a diverse lineup of open-end mutual funds crossing all investment styles and managed by experts in equity, fixed income and tax-exempt investing. Visit http://www.blackrock.com for more information.
Shareholder Privileges
Account Information
Call us at (800) 441-7762 from 8:00 AM to 6:00 PM ET on any business day to get information about your account balances, recent transactions and share prices. You can also reach us on the Web at http://www.blackrock.com/funds.
Automatic Investment Plans
Investor Class shareholders who want to invest regularly can arrange to have $50 or more automatically deducted from their checking or savings account and invested in any of the BlackRock funds.
Systematic Withdrawal Plans
Investor Class shareholders can establish a systematic withdrawal plan and receive periodic payments of $50 or more from their BlackRock funds, as long as their account balance is at least $10,000.
Retirement Plans
Shareholders may make investments in conjunction with Traditional, Rollover, Roth, Coverdell, Simple IRAs, SEP IRAs and 403(b) Plans.
| | |
| 60 | | 2017 BLACKROCK ANNUAL REPORTTO SHAREHOLDERS |
Additional Information (continued)
BlackRock Privacy Principles
BlackRock is committed to maintaining the privacy of its current and former fund investors and individual clients (collectively, “Clients”) and to safeguarding their non-public personal information. The following information is provided to help you understand what personal information BlackRock collects, how we protect that information and why in certain cases we share such information with select parties.
If you are located in a jurisdiction where specific laws, rules or regulations require BlackRock to provide you with additional or different privacy-related rights beyond what is set forth below, then BlackRock will comply with those specific laws, rules or regulations.
BlackRock obtains or verifies personal non-public information from and about you from different sources, including the following: (i) information we receive from you or, if applicable, your financial intermediary, on applications, forms or other documents; (ii) information about your transactions with us, our affiliates, or others; (iii) information we receive from a consumer reporting agency; and (iv) from visits to our websites.
BlackRock does not sell or disclose to non-affiliated third parties any non-public personal information about its Clients, except as permitted by law or as is necessary to respond to regulatory requests or to service Client accounts. These non-affiliated third parties are required to protect the confidentiality and security of this information and to use it only for its intended purpose.
We may share information with our affiliates to service your account or to provide you with information about other BlackRock products or services that may be of interest to you. In addition, BlackRock restricts access to non-public personal information about its Clients to those BlackRock employees with a legitimate business need for the information. BlackRock maintains physical, electronic and procedural safeguards that are designed to protect the non-public personal information of its Clients, including procedures relating to the proper storage and disposal of such information.
| | | | |
| ADDITIONAL INFORMATION | | | 61 | |
Glossary of Terms Used in this Report
| | |
| Portfolio Abbreviations |
| |
| ADR | | American Depositary Receipts |
| AUD | | Australian Dollar |
| BRL | | Brazilian Real |
| CAD | | Canadian Dollar |
| CLP | | Chilean Peso |
| ETF | | Exchange-Traded Fund |
| EUR | | Euro |
| EURIBOR | | Euro Interbank Offered Rate |
| GBP | | British Pound |
| HKD | | Hong Kong Dollar |
| JPY | | Japanese Yen |
| LIBOR | | London Interbank Offered Rate |
| MXN | | Mexican Peso |
| NOK | | Norwegian Krone |
| NVDR | | Non-voting Depository Receipts |
| NZD | | New Zealand Dollar |
| OTC | | Over-the-Counter |
| PLN | | Polish Zloty |
| REIT | | Real Estate Investment Trust |
| SGD | | Singapore Dollar |
| USD | | U.S. Dollar |
| ZAR | | South African Rand |
| | |
| 62 | | 2017 BLACKROCK ANNUAL REPORTTO SHAREHOLDERS |
This report is intended for current holders. It is not authorized for use as an offer of sale or a solicitation of an offer to buy shares of the Fund unless preceded or accompanied by the Fund’s current prospectus. Past performance results shown in this report should not be considered a representation of future performance. Investment returns and principal value of shares will fluctuate so that shares, when redeemed, may be worth more or less than their original cost. Statements and other information herein are as dated and are subject to change.

| | |
| GA-10/17-AR | |  |
| | |
| Item 2 – | | Code of Ethics – The registrant (or the “Fund”) has adopted a code of ethics, as of the end of the period covered by this report, applicable to the registrant’s principal executive officer, principal financial officer, principal accounting officer or controller, or persons performing similar functions. During the period covered by this report, the code of ethics was amended to clarify an inconsistency as to whom persons covered by the code should report suspected violations of the code. The amendment clarifies that such reporting should be made to BlackRock Advisors, LLC’s (“Investment Adviser” or “BlackRock”) General Counsel, and retains the alternative option of anonymous reporting following “whistleblower” policies. Other non-material changes were also made in connection with this amendment. During the period covered by this report, there have been no waivers granted under the code of ethics. The registrant undertakes to provide a copy of the code of ethics to any person upon request, without charge, who calls 1-800-441-7762. |
| |
| Item 3 – | | Audit Committee Financial Expert – The registrant’s board of directors (the “board of directors”), has determined that (i) the registrant has the following audit committee financial experts serving on its audit committee and (ii) each audit committee financial expert is independent: |
| |
| | Robert M. Hernandez Henry R. Keizer Stuart E. Eizenstat Bruce R. Bond |
| |
| | Under applicable securities laws, a person determined to be an audit committee financial expert will not be deemed an “expert” for any purpose, including without limitation for the purposes of Section 11 of the Securities Act of 1933, as a result of being designated or identified as an audit committee financial expert. The designation or identification of a person as an audit committee financial expert does not impose on such person any duties, obligations, or liabilities greater than the duties, obligations, and liabilities imposed on such person as a member of the audit committee and board of directors in the absence of such designation or identification. |
| |
| Item 4 – | | Principal Accountant Fees and Services |
| |
| | The following table presents fees billed by Deloitte & Touche LLP (“D&T”) in each of the last two fiscal years for the services rendered to the Fund: |
| | | | | | | | | | | | | | | | |
| | | (a) Audit Fees | | (b) Audit-Related Fees1 | | (c) Tax Fees2 | | (d) All Other Fees |
| Entity Name | | Current
Fiscal Year
End | | Previous
Fiscal Year
End | | Current
Fiscal Year
End | | Previous
Fiscal Year
End | | Current
Fiscal Year
End | | Previous
Fiscal Year
End | | Current
Fiscal Year
End | | Previous
Fiscal Year
End |
| BlackRock Global Allocation Fund, Inc. | | $99,399 | | $99,642 | | $0 | | $0 | | $21,800 | | $20,000 | | $0 | | $0 |
| | |
| |
| | | The following table presents fees billed by D&T that were required to be approved by the registrant’s audit committee (the “Committee”) for services that relate directly to the operations or financial reporting of the Fund and that are rendered on behalf of BlackRock and entities controlling, controlled by, or under common control with BlackRock (not including any sub-adviser whose role is primarily portfolio management and is subcontracted with or overseen by another investment adviser) that provide ongoing services to the Fund (“Affiliated Service Providers”): |
2
| | | | |
| | | Current Fiscal Year End | | Previous Fiscal Year End |
| (b) Audit-Related Fees1 | | $0 | | $0 |
| (c) Tax Fees2 | | $0 | | $0 |
| (d) All Other Fees3 | | $2,129,000 | | $2,154,000 |
1 The nature of the services includes assurance and related services reasonably related to the performance of the audit or review of financial statements not included in Audit Fees, including accounting consultations, agreed-upon procedure reports, attestation reports, comfort letters, out-of-pocket expenses and internal control reviews not required by regulators.
2 The nature of the services includes tax compliance and/or tax preparation, including services relating to the filing or amendment of federal, state or local income tax returns, regulated investment company qualification reviews, taxable income and tax distribution calculations.
3 Non-audit fees of $2,129,000 and $2,154,000 for the current fiscal year and previous fiscal year, respectively, were paid to the Fund’s principal accountant in their entirety by BlackRock, in connection with services provided to the Affiliated Service Providers of the Fund and of certain other funds sponsored and advised by BlackRock or its affiliates for a service organization review and an accounting research tool subscription. These amounts represent aggregate fees paid by BlackRock and were not allocated on a per fund basis.
(e)(1) Audit Committee Pre-Approval Policies and Procedures:
The Committee has adopted policies and procedures with regard to the pre-approval of services. Audit, audit-related and tax compliance services provided to the registrant on an annual basis require specific pre-approval by the Committee. The Committee also must approve other non-audit services provided to the registrant and those non-audit services provided to the Investment Adviser and Affilliated Service Providers that relate directly to the operations and the financial reporting of the registrant. Certain of these non-audit services that the Committee believes are (a) consistent with the SEC’s auditor independence rules and (b) routine and recurring services that will not impair the independence of the independent accountants may be approved by the Committee without consideration on a specific case-by-case basis (“general pre-approval”). The term of any general pre-approval is 12 months from the date of the pre-approval, unless the Committee provides for a different period. Tax or other non-audit services provided to the registrant which have a direct impact on the operations or financial reporting of the registrant will only be deemed pre-approved provided that any individual project does not exceed $10,000 attributable to the registrant or $50,000 per project. For this purpose, multiple projects will be aggregated to determine if they exceed the previously mentioned cost levels.
Any proposed services exceeding the pre-approved cost levels will require specific pre-approval by the Committee, as will any other services not subject to general pre-approval (e.g., unanticipated but permissible services). The Committee is informed of each service approved subject to general pre-approval at the next regularly scheduled in-person board meeting. At this meeting, an analysis of such services is presented to the Committee for ratification. The Committee may delegate to the Committee Chairman the authority to approve the provision of and fees for any specific engagement of permitted non-audit services, including services exceeding pre-approved cost levels.
(e)(2) None of the services described in each of Items 4(b) through (d) were approved by the Committee pursuant to the de minimis exception in paragraph (c)(7)(i)(C) of Rule 2-01 of Regulation S-X.
(f) Not Applicable
(g) The aggregate non-audit fees, defined as the sum of the fees shown under “Audit-Related Fees,”
3
“Tax Fees” and “All Other Fees,” paid to the accountant for services rendered by the accountant to the registrant, the Investment Adviser and the Affiliated Service Providers were:
| | | | | | |
| Entity Name | | Current Fiscal Year
End | | Previous Fiscal Year
End | | |
| BlackRock Global Allocation Fund, Inc. | | $21,800 | | $20,000 | | |
| | |
| | These amounts represent aggregate fees paid by BlackRock and were not allocated on a per fund basis. |
| |
| | (h) The Committee has considered and determined that the provision of non-audit services that were rendered to the Investment Adviser and the Affiliated Service Providers that were not pre-approved pursuant to paragraph (c)(7)(ii) of Rule 2-01 of Regulation S-X is compatible with maintaining the principal accountant’s independence. |
| |
| Item 5 – | | Audit Committee of Listed Registrants – Not Applicable |
| |
| Item 6 – | | Investments |
| |
| | (a) The registrant’s Schedule of Investments is included as part of the Report to Stockholders filed under Item 1 of this Form. |
| |
| | (b) Not Applicable due to no such divestments during the semi-annual period covered since the previous Form N-CSR filing. |
| |
| Item 7 – | | Disclosure of Proxy Voting Policies and Procedures for Closed-End Management Investment Companies – Not Applicable |
| |
| Item 8 – | | Portfolio Managers of Closed-End Management Investment Companies – Not Applicable |
| |
| Item 9 – | | Purchases of Equity Securities by Closed-End Management Investment Company and Affiliated Purchasers – Not Applicable |
| |
| Item 10 – | | Submission of Matters to a Vote of Security Holders – There have been no material changes to these procedures. |
| |
| Item 11 – | | Controls and Procedures |
| |
| | (a) – The registrant’s principal executive and principal financial officers, or persons performing similar functions, have concluded that the registrant’s disclosure controls and procedures (as defined in Rule 30a-3(c) under the Investment Company Act of 1940, as amended (the “1940 Act”)) are effective as of a date within 90 days of the filing of this report based on the evaluation of these controls and procedures required by Rule 30a-3(b) under the 1940 Act and Rule 15d-15(b) under the Securities Exchange Act of 1934, as amended. |
| |
| | (b) – There were no changes in the registrant’s internal control over financial reporting (as defined in Rule 30a-3(d) under the 1940 Act) that occurred during the second fiscal quarter of the period |
4
| | |
| | covered by this report that have materially affected, or are reasonably likely to materially affect, the registrant’s internal control over financial reporting. |
| |
| Item 12 – | | Disclosure of Securities Lending Activities for Closed-End Management Investment Companies – Not Applicable to the registrant. |
| |
| Item 13 – | | Exhibits attached hereto |
| |
| | (a)(1) Code of Ethics – See Item 2 |
| |
| | (a)(2) Certifications – Attached hereto |
| |
| | (a)(3) Not Applicable |
| |
| | (a)(4) Not Applicable |
| |
| | (b) Certifications – Attached hereto |
5
Pursuant to the requirements of the Securities Exchange Act of 1934 and the Investment Company Act of 1940, the registrant has duly caused this report to be signed on its behalf by the undersigned, thereunto duly authorized.
| | | | |
| | BlackRock Global Allocation Fund, Inc. |
| | |
| | By: | | /s/ John M. Perlowski |
| | | | John M. Perlowski |
| | | | Chief Executive Officer (principal executive officer) of |
| | | | BlackRock Global Allocation Fund, Inc. |
| |
| | Date: January 5, 2018 |
Pursuant to the requirements of the Securities Exchange Act of 1934 and the Investment Company Act of 1940, this report has been signed below by the following persons on behalf of the registrant and in the capacities and on the dates indicated.
| | | | |
| | By: | | /s/ John M. Perlowski |
| | | | John M. Perlowski |
| | | | Chief Executive Officer (principal executive officer) of |
| | | | BlackRock Global Allocation Fund, Inc. |
| |
| | Date: January 5, 2018 |
| | |
| | By: | | /s/ Neal J. Andrews |
| | | | Neal J. Andrews |
| | | | Chief Financial Officer (principal financial officer) of |
| | | | BlackRock Global Allocation Fund, Inc. |
| |
| | Date: January 5, 2018 |
6