UNITED STATES
SECURITIES AND EXCHANGE COMMISSION
Washington, D.C. 20549
FORM N-CSR
CERTIFIED SHAREHOLDER REPORT OF REGISTERED MANAGEMENT
INVESTMENT COMPANIES
Investment Company Act file number: 811-05576
| Name of Fund: | | BlackRock Global Allocation Fund, Inc. |
| Fund Address: 100 | | Bellevue Parkway, Wilmington, DE 19809 |
Name and address of agent for service: John M. Perlowski, Chief Executive Officer, BlackRock Global Allocation Fund, Inc., 55 East 52nd Street, New York, NY 10055
Registrant’s telephone number, including area code: (800) 441-7762
Date of fiscal year end: 10/31/2020
Date of reporting period: 10/31/2020
Item 1 – Report to Stockholders
| | |

| | OCTOBER 31, 2020 |
BlackRock Global Allocation Fund, Inc.
Beginning on January 1, 2021, as permitted by regulations adopted by the Securities and Exchange Commission, paper copies of the Fund’s shareholder reports will no longer be sent by mail, unless you specifically request paper copies of the reports from BlackRock or from your financial intermediary, such as a broker-dealer or bank. Instead, the reports will be made available on a website, and you will be notified by mail each time a report is posted and provided with a website link to access the report.
You may elect to receive all future reports in paper free of charge. If you hold accounts directly with BlackRock, you can call (800) 441-7762 to inform BlackRock that you wish to continue receiving paper copies of your shareholder reports. If you hold accounts through a financial intermediary, you can follow the instructions included with this disclosure, if applicable, or contact your financial intermediary to request that you continue to receive paper copies of your shareholder reports. Please note that not all financial intermediaries may offer this service. Your election to receive reports in paper will apply to all funds advised by BlackRock Advisors, LLC, BlackRock Fund Advisors or their affiliates, or all funds held with your financial intermediary, as applicable.
If you already elected to receive shareholder reports electronically, you will not be affected by this change and you need not take any action. You may elect to receive electronic delivery of shareholder reports and other communications by: (i) accessing the BlackRock website at www.blackrock.com/edelivery and logging into your accounts, if you hold accounts directly with BlackRock, or (ii) contacting your financial intermediary, if you hold accounts through a financial intermediary. Please note that not all financial intermediaries may offer this service.
|
| Not FDIC Insured • May Lose Value • No Bank Guarantee |
The Markets in Review
Dear Shareholder,
The 12-month reporting period as of October 31, 2020 has been a time of sudden change in global financial markets, as the emergence and spread of the coronavirus (or “COVID-19”) led to a vast disruption in the global economy and financial markets. Prior to the outbreak of the virus, U.S. equities and bonds both delivered solid returns, despite fears and doubts about the economy that were ultimately laid to rest with unprecedented monetary stimulus and a sluggish yet resolute performance from the U.S. economy. But as the threat from the coronavirus became more apparent throughout February and March 2020, countries around the world took economically disruptive countermeasures. Stay-at-home orders and closures of non-essential businesses became widespread, many workers were laid off, and unemployment claims spiked, causing a global recession and a sharp fall in equity prices.
After markets hit their lowest point of the reporting period in late March 2020, a steady recovery ensued, as businesses began to re-open and governments learned to adapt to life with the virus. Equity prices continued to rise throughout the summer, fed by strong fiscal and monetary support and improving economic indicators. Many equity indices neared or surpassed all-time highs in early September 2020 before retreating amid concerns about a second wave of infections. In the United States, large-capitalization stocks advanced, outperforming small-capitalization stocks, which declined marginally during the reporting period. International equities from developed economies declined, significantly lagging emerging market stocks, which rebounded sharply.
During the market downturn, the performance of different types of fixed-income securities initially diverged due to a reduced investor appetite for risk. U.S. Treasuries benefited from the risk-off environment, and posted solid returns, as the 10-year U.S. Treasury yield (which is inversely related to bond prices) touched an all-time low. In the corporate bond market, support from the U.S. Federal Reserve (the “Fed”) assuaged credit concerns and both investment-grade and high-yield bonds recovered to post positive returns.
The Fed took an accommodative monetary stance in late 2019 to support slowing economic growth. After the coronavirus outbreak, the Fed instituted two emergency interest rate cuts, pushing short-term interest rates close to zero. To stabilize credit markets, the Fed also implemented a new bond-buying program, as did several other central banks around the world, including the European Central Bank and the Bank of Japan.
Looking ahead, while coronavirus-related disruptions have clearly hindered worldwide economic growth, we believe that the global expansion is likely to continue as economic activity resumes. Several risks remain, however, including a potential resurgence of the coronavirus amid loosened restrictions, policy fatigue among governments already deep into deficit spending, and structural damage to the financial system from lengthy economic interruptions.
Overall, we favor a moderately positive stance toward risk, and in particular toward credit given the extraordinary central bank measures taken in recent months. This support extends beyond investment-grade corporates and into high-yield, leading to attractive opportunities in that end of the market. We believe that international diversification and a focus on sustainability can help provide portfolio resilience, and the disruption created by the coronavirus appears to be accelerating the shift toward sustainable investments. We remain neutral on equities overall while favoring emerging market stocks and tilting toward the quality factor for its resilience.
In this environment, our view is that investors need to think globally, extend their scope across a broad array of asset classes, and be nimble as market conditions change. We encourage you to talk with your financial advisor and visit blackrock.com for further insight about investing in today’s markets.
Sincerely,

Rob Kapito
President, BlackRock Advisors, LLC

Rob Kapito
President, BlackRock Advisors, LLC
| | | | |
| Total Returns as of October 31, 2020 |
| | | |
| | | 6-Month | | 12-Month |
U.S. large cap equities
(S&P 500® Index) | | 13.29% | | 9.71% |
U.S. small cap equities
(Russell 2000® Index) | | 18.13 | | (0.14) |
International equities
(MSCI Europe, Australasia, Far East Index) | | 8.57 | | (6.86) |
Emerging market equities
(MSCI Emerging Markets Index) | | 20.96 | | 8.25 |
3-month Treasury bills
(ICE BofA 3-Month
U.S. Treasury Bill Index) | | 0.06 | | 0.92 |
U.S. Treasury securities
(ICE BofA 10-Year
U.S. Treasury Index) | | (1.63) | | 8.92 |
U.S. investment grade bonds
(Bloomberg Barclays U.S. Aggregate Bond Index) | | 1.27 | | 6.19 |
Tax-exempt municipal bonds (S&P Municipal Bond Index) | | 4.87 | | 3.55 |
U.S. high yield bonds
(Bloomberg Barclays
U.S. Corporate High Yield 2% Issuer Capped Index) | | 10.73 | | 3.42 |
Past performance is not an indication of future results. Index performance is shown for illustrative purposes only. You cannot invest directly in an index. |
| | |
| 2 | | THIS PAGEISNOT PARTOF YOUR FUND REPORT |
Table of Contents

| | |
| Fund Summary as of October 31, 2020 | | BlackRock Global Allocation Fund, Inc. |
Investment Objective
BlackRock Global Allocation Fund, Inc.’s (the “Fund”) investment objective is to provide high total investment return through a fully managed investment policy utilizing United States and foreign equity securities, debt and money market securities, the combination of which will be varied from time to time both with respect to types of securities and markets in response to changing market and economic trends. Total return means the combination of capital growth and investment income.
Portfolio Management Commentary
How did the Fund perform?
For the 12-month period ended October 31, 2020, the Fund outperformed both its reference benchmark, which is comprised of the S&P 500® Index (36%), FTSE World (ex-US) Index (24%), ICE BofA Current 5-Year U.S. Treasury Index (24%) and FTSE Non-U.S. Dollar World Government Bond Index (16%) (the “Reference Benchmark”), and the broad-based all-equity benchmark, the FTSE World Index. The Fund invests in both equities and bonds; therefore, Fund management believes that the Reference Benchmark provides a more accurate representation of the Fund’s composition and a more comparable means for measurement. The following discussion of relative performance pertains to the Reference Benchmark. The following commentary (and referenced allocation percentages) are based on the economic exposures of the Fund, which reflect adjustments for futures, swaps, and options (except with respect to fixed income securities), and convertible bonds, and may vary relative to the market value.
What factors influenced performance?
From an equity sector perspective, stock selection within and an overweight to both consumer discretionary and information technology (“IT”) was additive to performance. Stock selection within and an underweight to energy also contributed to returns. Within fixed income, exposure to U.S. credit, namely investment grade corporate bonds, as well as yield curve positioning positively impacted performance. Exposure to cash and cash equivalents and gold-related securities added to returns as well.
From an equity sector perspective, stock selection within industrials negatively impacted returns. Stock selection within financials weighed on performance, although this was partially offset by an underweight to the sector. A broad underweight to fixed income relative to the reference benchmark detracted. Within fixed income, exposure to select emerging market government bonds negatively impacted performance. Currency management weighed on returns as well, notably an underweight to the Australian dollar and an overweight to the U.S. dollar.
The Fund uses derivatives, which may include options, futures, swaps and forward contracts both to seek to enhance returns of the Fund and to hedge (or protect) against adverse movements in currency exchange rates, interest rates and movements in the securities markets. During the period, the Fund’s use of derivatives contributed to the Fund’s performance.
Describe recent portfolio activity.
During the 12-month period, the Fund’s overall equity allocation decreased slightly from 65% to 64% of net assets. Within equities, the Fund increased exposure to Europe, and decreased exposure to Japan and the United States. On a sector basis, the Fund increased exposure to IT, consumer discretionary and materials, and reduced exposure to financials, energy, consumer staples, communication services and real estate.
The Fund’s allocation to fixed income decreased from 30% to 28% of net assets. Within fixed income, the Fund increased exposure to corporate credit and bank loans, and decreased exposure to government bonds, primarily in the United States, and securitized debt. The Fund’s exposure to commodity-related securities remained unchanged at 2% of net assets.
Reflecting the changes in the Fund’s overall allocations to the equity, fixed income and commodity-related asset classes during the period, the Fund’s exposure to cash and cash equivalent holdings increased from 3% to 6% of net assets. During the 12-month period, cash helped mitigate portfolio volatility and served as a source of funds for new investments and meeting redemptions.
Describe portfolio positioning at period end.
Relative to its Reference Benchmark, the Fund ended the period overweight in equities, underweight in fixed income, and had modest exposure to gold-related securities and cash and cash equivalents. Within equities, the Fund was overweight in the United States, China and Europe (ex-U.K.), and underweight in Asia, primarily Japan and Australia. From a sector perspective, the Fund was overweight in consumer discretionary, health care, information technology, materials, industrials and communication services, and underweight in consumer staples, real estate and financials. Within fixed income, the Fund was underweight in U.S. Treasuries, developed European sovereign debt and Japanese government bonds. In addition, the Fund was overweight in corporate credit and securitized debt. With respect to currency exposure, the Fund was overweight in the U.S. dollar, Japanese yen and euro, and was underweight in the Australian dollar.
The views expressed reflect the opinions of BlackRock as of the date of this report and are subject to change based on changes in market, economic or other conditions. These views are not intended to be a forecast of future events and are no guarantee of future results.
| | |
| 4 | | 2020 BLACKROCK ANNUAL REPORTTO SHAREHOLDERS |
| | |
| Fund Summary as of October 31, 2020 (continued) | | BlackRock Global Allocation Fund, Inc. |
TOTAL RETURN BASED ON A $10,000 INVESTMENT
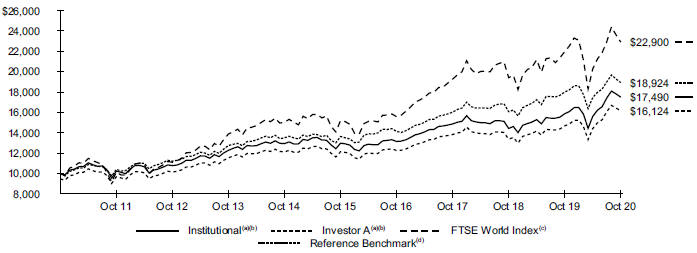
| | (a) | Assuming maximum sales charges, if any, transaction costs and other operating expenses including advisory fees. Institutional Shares do not have a sales charge. | |
| | (b) | The Fund invests in a portfolio of U.S. and foreign equity securities, debt and money market securities, the combination of which will be varied from time to time with respect to types of securities and markets in response to changing market and economic trends. | |
| | (c) | This unmanaged capitalization-weighted index is comprised of 2,620 equities from 35 countries in 4 regions, including the United States. | |
| | (d) | The Reference Benchmark is an unmanaged weighted index comprised as follows: 36% S&P 500® Index; 24% FTSE World (ex-U.S.) Index; 24% ICE BofA Current 5-Year U.S. Treasury Index; and 16% FTSE Non-U.S. Dollar World Government Bond Index. | |
Performance Summary for the Period Ended October 31, 2020
| | | | | | | | | | | | | | | | | | | | | | | | | | | | | | | | | | | | | | | | |
| | | | | | | | | Average Annual Total Returns(a) | |
| | | | | | | | | 1 Year | | | | | | 5 Years | | | | | | 10 Years | |
| | | 6-Month
Total
Returns | | | | | | Without
Sales
Charge | | | With
Sales
Charge | | | | | | Without
Sales
Charge | | | With
Sales
Charge | | | | | | Without
Sales
Charge | | | With
Sales
Charge | |
Institutional | | | 12.07 | % | | | | | | | 10.23 | % | | | N/A | | | | | | | | 6.15 | % | | | N/A | | | | | | | | 5.75 | % | | | N/A | |
Investor A | | | 11.88 | | | | | | | | 9.87 | | | | 4.10 | % | | | | | | | 5.85 | | | | 4.72 | % | | | | | | | 5.46 | | | | 4.89 | % |
Investor C | | | 11.50 | | | | | | | | 9.06 | | | | 8.06 | | | | | | | | 5.07 | | | | 5.07 | | | | | | | | 4.67 | | | | 4.67 | |
Class K | | | 12.14 | | | | | | | | 10.28 | | | | N/A | | | | | | | | 6.22 | | | | N/A | | | | | | | | 5.79 | | | | N/A | |
Class R | | | 11.74 | | | | | | | | 9.54 | | | | N/A | | | | | | | | 5.51 | | | | N/A | | | | | | | | 5.11 | | | | N/A | |
FTSE World Index | | | 12.97 | | | | | | | | 4.26 | | | | N/A | | | | | | | | 8.55 | | | | N/A | | | | | | | | 8.64 | | | | N/A | |
Reference Benchmark | | | 8.36 | | | | | | | | 5.12 | | | | N/A | | | | | | | | 6.78 | | | | N/A | | | | | | | | 6.59 | | | | N/A | |
U.S. Stocks: S&P 500® Index(b) | | | 13.29 | | | | | | | | 9.71 | | | | N/A | | | | | | | | 11.71 | | | | N/A | | | | | | | | 13.01 | | | | N/A | |
Non-U.S. Stocks: FTSE World (ex-U.S.) Index(c) | | | 10.54 | | | | | | | | (5.33 | ) | | | N/A | | | | | | | | 4.04 | | | | N/A | | | | | | | | 3.86 | | | | N/A | |
Non-U.S. Bonds: FTSE Non-U.S. Dollar World Government Bond Index(d) | | | 6.37 | | | | | | | | 4.99 | | | | N/A | | | | | | | | 3.92 | | | | N/A | | | | | | | | 1.08 | | | | N/A | |
U.S. Bonds: ICE BofA Current 5-Year U.S. Treasury Index(e) | | | 0.07 | | | | | | | | 6.42 | | | | N/A | | | | | | | | 2.90 | | | | N/A | | | | | | | | 2.50 | | | | N/A | |
| | (a) | Assuming maximum sales charges, if any. Average annual total returns with and without sales charges reflect reductions for distribution and service fees. See “About Fund Performance” for a detailed description of share classes, including any related sales charges and fees, and how performance was calculated for certain share classes. | |
| | (b) | This unmanaged index covers 500 leading companies and captures approximately 80% coverage of available market capitalization. | |
| | (c) | This unmanaged capitalization-weighted index is comprised of 1,985 equities from 34 countries, excluding the United States. | |
| | (d) | This unmanaged market capitalization-weighted index tracks 22 government bond indexes, excluding the United States. | |
| | (e) | This unmanaged index is designed to track the total return of the current coupon five-year U.S. Treasury bond. | |
N/A — Not applicable as the share class and index do not have a sales charge.
Past performance is not an indication of future results.
Performance results may include adjustments made for financial reporting purposes in accordance with U.S. generally accepted accounting principles.
| | |
| Fund Summary as of October 31, 2020 (continued) | | BlackRock Global Allocation Fund, Inc. |
Expense Example
| | | | | | | | | | | | | | | | | | | | | | | | | | | | | | | | | | | | | | | | | | | | |
| | | Actual | | | Hypothetical(a) | | | | | | | |
| | | | | | Expenses Paid during the
Period | | | | | | Including Dividend
Expense and Broker
Fees and Expenses
on Short Sales | | | Excluding Dividend
Expense and Broker
Fees and Expenses
on Short Sales | | | Annualized Expense Ratio | |
| | |
| Beginning
Account
Value
(05/01/20) |
| |
| Ending
Account
Value
(10/31/20) |
| |
| Including
Dividend
Expense and
BrokerFees and
Expenses on
Short Sales |
(b) | |
| Excluding
Dividend
Expense and
Broker
Fees and
Expenses on
Short Sales |
(b) | |
| Beginning
Account Value
(05/01/20) |
| |
| Ending
Account
Value
(10/31/20) |
| |
| Expenses
Paid
duringthe
Period |
(b) | |
| Ending
Account
Value
(10/31/20) |
| |
| Expenses
Paid
duringthe
Period |
(b) | |
| Including
Dividend
Expense and
Broker
Fees and
Expenses on
Short Sales |
| |
| Excluding
Dividend
Expense and
Broker
Fees and
Expenses on
Short Sales |
|
Institutional | | $ | 1,000.00 | | | $ | 1,120.70 | | | $ | 4.26 | | | $ | 4.26 | | | $ | 1,000.00 | | | $ | 1,021.11 | | | $ | 4.06 | | | $ | 1,021.11 | | | $ | 4.06 | | | | 0.80 | % | | | 0.80 | % |
Investor A | | | 1,000.00 | | | | 1,118.80 | | | | 5.70 | | | | 5.70 | | | | 1,000.00 | | | | 1,019.76 | | | | 5.43 | | | | 1,019.76 | | | | 5.43 | | | | 1.07 | | | | 1.07 | |
Investor C | | | 1,000.00 | | | | 1,115.00 | | | | 9.84 | | | | 9.78 | | | | 1,000.00 | | | | 1,015.84 | | | | 9.37 | | | | 1,015.89 | | | | 9.32 | | | | 1.85 | | | | 1.84 | |
Class K | | | 1,000.00 | | | | 1,121.40 | | | | 3.84 | | | | 3.84 | | | | 1,000.00 | | | | 1,021.52 | | | | 3.66 | | | | 1,021.52 | | | | 3.66 | | | | 0.72 | | | | 0.72 | |
Class R | | | 1,000.00 | | | | 1,117.40 | | | | 7.50 | | | | 7.45 | | | | 1,000.00 | | | | 1,018.05 | | | | 7.15 | | | | 1,018.10 | | | | 7.10 | | | | 1.41 | | | | 1.40 | |
| | (a) | Hypothetical 5% annual return before expenses is calculated by prorating the number of days in the most recent fiscal half year divided by 366. | |
| | (b) | For each class of the Fund, expenses are equal to the annualized expense ratio for the class, multiplied by the average account value over the period, multiplied by 184/366 (to reflect the six-month period shown). | |
See “Disclosure of Expenses” for further information on how expenses were calculated.
Portfolio Information
OVERALL ASSET EXPOSURE
| | | | | | | | | | | | |
| | |
| Percent of Fund’s
Net Assets(a) |
| |
| Reference
BenchmarkPercentages |
(b) |
| | | 10/31/20 | | | 10/31/19 | |
U.S. Equities | | | 40 | % | | | 41 | % | | | 36 | % |
European Equities | | | 15 | | | | 11 | | | | 12 | |
Asia Pacific Equities | | | 8 | | | | 11 | | | | 10 | |
Other Equities | | | 1 | | | | 2 | | | | 2 | |
| | | | | | | | | | | | |
Total Equities | | | 64 | | | | 65 | | | | 60 | |
| | | | | | | | | | | | |
U.S. Dollar Denominated Fixed-Income Securities | | | 20 | | | | 24 | | | | 24 | |
U.S. Issuers | | | 17 | | | | 22 | | | | — | |
Non-U.S. Issuers | | | 3 | | | | 2 | | | | — | |
Non-U.S. Dollar Denominated Fixed-Income Securities | | | 8 | | | | 6 | | | | 16 | |
| | | | | | | | | | | | |
Total Fixed-Income Securities | | | 28 | | | | 30 | | | | 40 | |
| | | | | | | | | | | | |
Commodity-Related | | | 2 | | | | 2 | | | | — | |
| | | | | | | | | | | | |
Cash & Short-Term Securities | | | 6 | | | | 3 | | | | — | |
| | | | | | | | | | | | |
| | (a) | Exposure based on market value and adjusted for the economic value of futures, swaps and options (except with respect to fixed-income securities), and convertible bonds. | |
| | (b) | The Reference Benchmark is an unmanaged weighted index comprised as follows: 36% of the S&P 500® Index; 24% FTSE World (ex U.S.) Index; 24% ICE BofA Current 5-Year U.S. Treasury Index; and 16% FTSE Non-U.S. Dollar World Government Bond Index. Descriptions of these indexes are found on page 5 of this report to shareholders in the “Performance Summary” section. | |
| | |
| 6 | | 2020 BLACKROCK ANNUAL REPORTTO SHAREHOLDERS |
| | |
| Fund Summary as of October 31, 2020 (continued) | | BlackRock Global Allocation Fund, Inc. |
TEN LARGEST HOLDINGS (EQUITY INVESTMENTS)
| | | | |
| Security | |
| Percent of
Total Investments |
(a) |
Microsoft Corp. | | | 2 | % |
Apple, Inc. | | | 2 | |
Amazon.com, Inc. | | | 2 | |
Alphabet, Inc. | | | 2 | |
UnitedHealth Group, Inc. | | | 1 | |
JPMorgan Chase & Co. | | | 1 | |
Johnson & Johnson | | | 1 | |
NextEra Energy, Inc. | | | 1 | |
Taiwan Semiconductor Manufacturing
Co. Ltd. | | | 1 | |
Siemens AG | | | 1 | |
GEOGRAPHIC ALLOCATION
| | | | | | | | | | | | |
| | |
| Percent of
Total Investments(b) |
|
| Country/Geographic Region | | Long | | | Short | | | Total | |
United States | | | 65 | % | | | — | % | | | 65% | |
China | | | 4 | | | | — | | | | 4 | |
Italy | | | 4 | | | | — | | | | 4 | |
Japan | | | 3 | | | | — | | | | 3 | |
Netherlands | | | 3 | | | | — | | | | 3 | |
France | | | 3 | | | | — | | | | 3 | |
Germany | | | 2 | | | | — | | | | 2 | |
United Kingdom | | | 2 | | | | — | | | | 2 | |
Australia | | | 2 | | | | — | | | | 2 | |
Spain | | | 2 | | | | — | | | | 2 | |
Switzerland | | | 1 | | | | — | | | | 1 | |
Taiwan | | | 1 | | | | — | | | | 1 | |
Canada | | | 1 | | | | — | | | | 1 | |
Sweden | | | 1 | | | | — | | | | 1 | |
Hong Kong | | | 1 | | | | — | | | | 1 | |
Other(c) | | | 5 | | | | — | | | | 5 | |
| | | | 100 | % | | | — | % | | | 100% | |
| | (a) | Excludes short-term securities, options purchased and options written. | |
| | (b) | Total investments include the gross values of long and short equity securities of the underlying derivative contracts utilized by the Fund and exclude short-term securities. | |
| | (c) | Includes holdings within countries that are 1% or less of long-term investments. Please refer to the Consolidated Schedule of Investments for such countries. | |
| | |
About Fund Performance | | BlackRock Global Allocation Fund, Inc. |
Institutional and Class K Shares are not subject to any sales charge. These shares bear no ongoing distribution or service fees and are available only to certain eligible investors. Class K Shares performance shown prior to the Class K Shares inception date of June 8, 2016 is that of Institutional Shares. The performance of the Fund’s Class K Shares would be substantially similar to Institutional Shares because Class K Shares and Institutional Shares invest in the same portfolio of securities and performance would only differ to the extent that Class K Shares and Institutional Shares have different expenses. The actual returns of Class K Shares would have been higher than those of the Institutional Shares because Class K Shares have lower expenses than the Institutional Shares.
Investor A Shares are subject to a maximum initial sales charge (front-end load) of 5.25% and a service fee of 0.25% per year (but no distribution fee). Certain redemptions of these shares may be subject to a contingent deferred sales charge (“CDSC”) where no initial sales charge was paid at the time of purchase. These shares are generally available through financial intermediaries.
Investor C Shares are subject to a 1.00% CDSC if redeemed within one year of purchase. In addition, these shares are subject to a distribution fee of 0.75% per year and a service fee of 0.25% per year. These shares are generally available through financial intermediaries. These shares automatically convert to Investor A Shares after approximately ten years. Effective November 23, 2020, the automatic conversion feature will be modified to reduce the conversion period from ten years to eight years.
Class R Shares are not subject to any sales charge. These shares are subject to a distribution fee of 0.25% per year and a service fee of 0.25% per year. These shares are available only to certain employer-sponsored retirement plans.
Past performance is not an indication of future results. Financial markets have experienced extreme volatility and trading in many instruments has been disrupted. These circumstances may continue for an extended period of time, and may continue to affect adversely the value and liquidity of the fund’s investments. As a result, current performance may be lower or higher than the performance data quoted. Refer to blackrock.com to obtain performance data current to the most recent month-end. Performance results do not reflect the deduction of taxes that a shareholder would pay on Fund distributions or the redemption of Fund shares. Figures shown in the performance tables on the previous page assume reinvestment of all distributions, if any, at net asset value (“NAV”) on the ex-dividend date or payable date, as applicable. Investment return and principal value of shares will fluctuate so that shares, when redeemed, may be worth more or less than their original cost. Distributions paid to each class of shares will vary because of the different levels of service, distribution and transfer agency fees applicable to each class, which are deducted from the income available to be paid to shareholders.
BlackRock Advisors, LLC (the “Manager”), the Fund’s investment adviser, has contractually and/or voluntarily agreed to waive and/or reimburse a portion of the Fund’s expenses. Without such waivers and/or reimbursements, the Fund’s performance would have been lower. With respect to the Fund’s voluntary waiver(s), if any, the Manager is under no obligation to waive and/or reimburse or to continue waiving and/or reimbursing its fees and such voluntary waiver(s) may be reduced or discontinued at any time. With respect to the Fund’s contractual waiver(s), if any, the Manager is under no obligation to continue waiving and/or reimbursing its fees after the applicable termination date of such agreement. See the Notes to Consolidated Financial Statements for additional information on waivers and/or reimbursements.
Disclosure of Expenses
Shareholders of the Fund may incur the following charges: (a) transactional expenses, such as sales charges; and (b) operating expenses, including investment advisory fees, service and distribution fees, including 12b-1 fees, acquired fund fees and expenses, and other fund expenses. The expense example shown (which is based on a hypothetical investment of $1,000 invested on May 1, 2020 and held through October 31, 2020) is intended to assist shareholders both in calculating expenses based on an investment in the Fund and in comparing these expenses with similar costs of investing in other mutual funds.
The expense example provides information about actual account values and actual expenses. In order to estimate the expenses a shareholder paid during the period covered by this report, shareholders can divide their account value by $1,000 and then multiply the result by the number corresponding to their share class under the heading entitled “Expenses Paid During the Period.”
The expense example also provides information about hypothetical account values and hypothetical expenses based on the Fund’s actual expense ratio and an assumed rate of return of 5% per year before expenses. In order to assist shareholders in comparing the ongoing expenses of investing in the Fund and other funds, compare the 5% hypothetical example with the 5% hypothetical examples that appear in shareholder reports of other funds.
The expenses shown in the expense example are intended to highlight shareholders’ ongoing costs only and do not reflect transactional expenses, such as sales charges, if any. Therefore, the hypothetical example is useful in comparing ongoing expenses only, and will not help shareholders determine the relative total expenses of owning different funds. If these transactional expenses were included, shareholder expenses would have been higher.
| | |
| 8 | | 2020 BLACKROCK ANNUAL REPORTTO SHAREHOLDERS |
| | |
| Derivative Financial Instruments | | BlackRock Global Allocation Fund, Inc. |
The Fund may invest in various derivative financial instruments. These instruments are used to obtain exposure to a security, commodity, index, market, and/or other assets without owning or taking physical custody of securities, commodities and/or other referenced assets or to manage market, equity, credit, interest rate, foreign currency exchange rate, commodity and/or other risks. Derivative financial instruments may give rise to a form of economic leverage and involve risks, including the imperfect correlation between the value of a derivative financial instrument and the underlying asset, possible default of the counterparty to the transaction or illiquidity of the instrument. The Fund’s successful use of a derivative financial instrument depends on the investment adviser’s ability to predict pertinent market movements accurately, which cannot be assured. The use of these instruments may result in losses greater than if they had not been used, may limit the amount of appreciation the Fund can realize on an investment and/or may result in lower distributions paid to shareholders. The Fund’s investments in these instruments, if any, are discussed in detail in the Notes to Consolidated Financial Statements.
| | |
DERIVATIVE FINANCIAL INSTRUMENTS | | 9 |
| | |
Consolidated Schedule of Investments October 31, 2020 | | BlackRock Global Allocation Fund, Inc. (Percentages shown are based on Net Assets) |
| | | | | | | | | | | | |
| Security | | | | | Par
(000) | | | Value | |
| | | |
Asset-Backed Securities | | | | | | | | | | | | |
| | | |
Cayman Islands(a) — 0.2% | | | | | | | | | | | | |
AGL Core CLO 5 Ltd.(b) | | | | | | | | | | | | |
Series 2020-5A, Class A2, (3 mo. LIBOR US + 2.35%), 2.65%, 07/20/30 | | | USD | | | | 1,500 | | | $ | 1,499,629 | |
Series 2020-5A, Class B, (3 mo. LIBOR US + 2.78%), 3.08%, 07/20/30 | | | | | | | 2,025 | | | | 2,035,223 | |
ALM Ltd., Series 2020-1A, Class A2, (3 mo. LIBOR US + 1.85%), 2.09%, 10/15/29(b) | | | | | | | 373 | | | | 372,845 | |
Atrium XII, Series 12A, Class BR, (3 mo. LIBOR US + 1.35%), 1.57%, 04/22/27(b) | | | | | | | 695 | | | | 678,216 | |
Atrium XIII, Series 13A, Class B, (3 mo. LIBOR US + 1.50%), 1.71%, 11/21/30(b) | | | | | | | 600 | | | | 583,896 | |
Bain Capital Credit CLO Ltd., Series 2020-2A, | | | | | | | | | | | | |
Class B1, (3 mo. LIBOR US + 2.50%), 2.72%, 07/21/31(b) | | | | | | | 1,575 | | | | 1,567,897 | |
Birch Grove CLO Ltd., Series 19X, Class A, (3 mo. LIBOR US + 1.49%), 1.74%, 06/15/31 | | | | | | | 3,343 | | | | 3,337,990 | |
BlueMountain CLO Ltd., Series 2014-2A, Class BR2, (3 mo. LIBOR US + 1.75%), 1.97%, 10/20/30(b) | | | | | | | 465 | | | | 455,462 | |
Catskill Park CLO Ltd., Series 2017-1A, Class A1B, (3 mo. LIBOR US + 1.35%),
1.57%, 04/20/29(b) | | | | | | | 892 | | | | 886,293 | |
Dryden 33 Senior Loan Fund, Series 2014-33A, Class BR2, (3 mo. LIBOR US + 1.75%), 1.99%, 04/15/29(b) | | | | | | | 250 | | | | 247,116 | |
Elmwood CLO II Ltd., Series 2019-2A, Class B, 2.32%, 04/20/31(b) | | | | | | | 825 | | | | 825,830 | |
Figueroa CLO Ltd., Series 2014-1A, Class CR, 2.34%, 01/15/27(b) | | | | | | | 500 | | | | 487,914 | |
Flatiron CLO 18 Ltd., Series 2018-1A, Class A, (3 mo. LIBOR US + 0.95%), 1.17%, 04/17/31(b) | | | | | | | 437 | | | | 431,275 | |
Madison Park Funding XXXVI Ltd., Series 2019- 36A, Class B1, (3 mo. LIBOR US + 1.85%), 2.09%, 01/15/33(b) | | | | | | | 1,481 | | | | 1,473,980 | |
OCP CLO Ltd., Series 2017-13A, Class A2A, 2.04%, 07/15/30(b) | | | | | | | 1,146 | | | | 1,130,542 | |
Octagon Investment Partners 46 Ltd.(b) | | | | | | | | | | | | |
Series 2020-2A, Class A, (3 mo. LIBOR US + 1.65%), 1.90%, 07/15/33 | | | | | | | 2,750 | | | | 2,758,337 | |
Series 2020-2A, Class B, (3 mo. LIBOR US + 2.20%), 2.45%, 07/15/33 | | | | | | | 800 | | | | 799,976 | |
OHA Credit Funding Ltd., Series 2019-3A, Class B1, (3 mo. LIBOR US + 1.80%), 2.02%, 07/20/32(b) | | | | | | | 922 | | | | 915,311 | |
Palmer Square CLO Ltd., Series 2018-1A, Class A1, (3 mo. LIBOR US + 1.03%), 1.25%, 04/18/31(b) | | | | | | | 250 | | | | 246,581 | |
Palmer Square Loan Funding Ltd., Series 2018-2A, Class A2, (3 mo. LIBOR US + 1.05%), 1.29%, 07/15/26(b) | | | | | | | 1,750 | | | | 1,727,967 | |
Park Avenue Institutional Advisers CLO Ltd., | | | | | | | | | | | | |
Series 2019-1A, Class A2A, 2.28%, 05/15/32(b) | | | | | | | 250 | | | | 247,230 | |
RR 11 Ltd., Series 2020-11A, Class A2, (3 mo. LIBOR US + 2.10%),
2.28%, 10/15/31(b) | | | | | | | 875 | | | | 874,993 | |
RR 2 Ltd., Series 2017-2A, Class A2, (3 mo. LIBOR US + 1.60%), 1.84%, 10/15/29(b) | | | | | | | 1,147 | | | | 1,121,310 | |
TICP CLO XIV Ltd., Series 2019-14A, Class A1B, (3 mo. LIBOR US + 1.70%),
1.92%, 10/20/32(b) | | | | | | | 500 | | | | 492,419 | |
| | | | | | | | | | | | |
| Security | | | | | Par
(000) | | | Value | |
| | | |
| Cayman Islands (continued) | | | | | | | | | |
TRESTLES CLO III Ltd., Series 2020-3A, Class A1, (3 mo. LIBOR US + 1.33%), 1.60%, 01/20/33(b) | | | USD | | | | 2,489 | | | $ | 2,463,553 | |
Tryon Park CLO Ltd., Series 2013-1A, Class A2R, (3 mo. LIBOR US + 1.50%), 1.74%, 04/15/29(b) | | | | | | | 431 | | | | 426,644 | |
Whitebox Clo II Ltd., Series 2020-2A, Class A1, (3 mo. LIBOR US + 1.75%),
1.99%, 10/24/31(b) | | | | | | | 1,285 | | | | 1,284,975 | |
York CLO 3 Ltd., Series 2016-1A, Class BR, (3 mo. LIBOR US + 1.75%), 1.97%, 10/20/29(b) | | | | | | | 2,025 | | | | 1,990,698 | |
York CLO 6 Ltd., Series 2019-1A, Class A1, (3 mo. LIBOR US + 1.35%), 1.57%, 07/22/32(b) | | | | | | | 3,122 | | | | 3,102,187 | |
| | | | | | | | |
| | | | | | | | | | | 34,466,289 | |
| | | |
| Ireland(a) — 0.0% | | | | | | | | | |
Anchorage Capital Europe CLO 2 DAC, Series 2A, Class B, 1.80%, 05/15/31(b) | | | EUR | | | | 500 | | | | 580,895 | |
Aqueduct European CLO DAC | | | | | | | | | | | | |
Series 2019-4A, Class B1, (3 mo. Euribor + 1.80%), 1.80%, 07/15/32(b) | | | | | | | 475 | | | | 550,427 | |
Series 2019-4X, Class B1, (3 mo. Euribor + 1.80%), 1.80%, 07/15/32 | | | | | | | 593 | | | | 687,164 | |
Arbour CLO II DAC, Series 2014-2X, Class B2R, (3 mo. Euribor + 1.50%),
1.50%, 05/15/30 | | | | | | | 375 | | | | 435,576 | |
Ares European CLO XI BV, Series 11X, Class B1, 1.85%, 04/15/32 | | | | | | | 593 | | | | 685,457 | |
Avoca CLO XV DAC, Series 15X, Class B2R, 1.05%, 04/15/31 | | | | | | | 134 | | | | 151,148 | |
Avoca CLO XVII Designated Activity Co. | | | | | | | | | | | | |
Series 17A, Class B1R, (3 mo. Euribor + 1.70%), 1.70%, 10/15/32(b) | | | | | | | 500 | | | | 575,164 | |
Series 17X, Class AR, (3 mo. Euribor + 0.96%), 0.96%, 10/15/32 | | | | | | | 406 | | | | 476,526 | |
Cairn CLO XII DAC, Series 2020-12A, Class B, (3 mo. Euribor + 2.30%),
2.30%, 04/15/33(b)(c) | | | | | | | 460 | | | | 535,739 | |
CIFC European Funding CLO II DAC, Series 2X, Class B1, (3 mo. Euribor + 1.60%), 1.60%, 04/15/33 | | | | | | | 593 | | | | 676,162 | |
Harvest CLO XVIII DAC, Series 18X, Class B, 1.20%, 10/15/30 | | | | | | | 662 | | | | 755,360 | |
Holland Park CLO DAC, Series 1X, Class A1RR, (3 mo. Euribor + 0.92%),
0.92%, 11/14/32 | | | | | | | 390 | | | | 450,427 | |
Invesco Euro CLO II DAC, Series 2X, Class B1, (3 mo. Euribor + 1.80%),
1.80%, 08/15/32 | | | | | | | 593 | | | | 686,796 | |
OAK Hill European Credit Partners V Designated Activity Co., Series 2016-5X, Class B1, (3 mo. Euribor + 1.55%),
1.55%, 02/21/30 | | | | | | | 460 | | | | 531,313 | |
OAK Hill European Credit Partners VI DAC, Series 2017-6X, Class B1, 1.20%, 01/20/32 | | | | | | | 456 | | | | 517,442 | |
OCP Euro CLO DAC, Series 2017-2X, Class B, 1.35%, 01/15/32 | | | | | | | 456 | | | | 519,010 | |
Rockford Tower Europe CLO DAC, Series 2018-1X, Class B, 1.85%, 12/20/31 | | | | | | | 593 | | | | 690,072 | |
RRE 2 Loan Management DAC, Series 2A, Class B, (3 mo. Euribor + 1.80%),
1.80%, 01/15/32(b) | | | | | | | 715 | | | | 827,619 | |
| | |
| 10 | | 2020 BLACKROCK ANNUAL REPORTTO SHAREHOLDERS |
| | |
Consolidated Schedule of Investments (continued) October 31, 2020 | | BlackRock Global Allocation Fund, Inc. (Percentages shown are based on Net Assets) |
| | | | | | | | | | | | |
| Security | | | | | Par
(000) | | | Value | |
| | | |
| Ireland (continued) | | | | | | | | | |
Sound Point Euro CLO II Funding DAC, Series 2X, Class A, (3 mo. Euribor + 1.11%), 1.11%, 10/26/32 | | | EUR | | | | 460 | | | $ | 535,682 | |
Voya Euro CLO II DAC, Series 2X, Class B1, 1.90%, 07/15/32 | | | | | | | 243 | | | | 282,183 | |
| | | | | | | | |
| | | | | | | | | | | 11,150,162 | |
| | | |
| Netherlands — 0.0% | | | | | | | | | |
Ares European CLO X BV, Series 10X, Class B1, 1.70%, 10/15/31(a) | | | | | | | 165 | | | | 191,507 | |
| | | | | | | | |
| | | |
| United States — 0.4% | | | | | | | | | |
AGL CLO 7 Ltd., Series 2020-7A, Class A1, (3 mo. LIBOR US + 1.80%),
2.05%, 07/15/31(a)(b) | | | USD | | | | 1,530 | | | | 1,533,064 | |
AIMCO CLO, Series 2018-AA, Class B, (3 mo. LIBOR US + 1.40%),
1.62%, 04/17/31(a)(b) | | | | | | | 466 | | | | 454,825 | |
ALM XVIII Ltd., Series 2016-18A, Class A2R, (3 mo. LIBOR US + 1.65%),
1.89%, 01/15/28(a)(b) | | | | | | | 459 | | | | 452,133 | |
Apidos CLO XII, Series 2013-12A, Class AR, (3 mo. LIBOR US + 1.08%),
1.32%, 04/15/31(a)(b) | | | | | | | 550 | | | | 540,767 | |
Apidos CLO XV, Series 2013-15A, Class A1RR, 1.23%, 04/20/31(a)(b) | | | | | | | 1,770 | | | | 1,740,409 | |
Ares LV CLO Ltd., Series 2020-55A, Class B, (3 mo. LIBOR US + 2.50%),
2.74%, 04/15/31(a)(b) | | | | | | | 2,750 | | | | 2,749,982 | |
Ares XXIX CLO Ltd., Series 2014-1A, Class BR, (3 mo. LIBOR US + 2.30%),
2.52%, 04/17/26(a)(b) | | | | | | | 500 | | | | 494,105 | |
Battalion CLO 18 Ltd.(a)(b) | | | | | | | | | | | | |
Series 2020-18A, Class A1, (3 mo. LIBOR US + 1.80%), 2.05%, 10/15/32 | | | | | | | 787 | | | | 776,977 | |
Series 2020-18A, Class B, (3 mo. LIBOR US + 2.30%), 2.55%, 10/15/32 | | | | | | | 787 | | | | 773,009 | |
BlueMountain CLO XXIX Ltd., Series 2020-29A, Class B, (3 mo. LIBOR US + 2.25%), 2.56%, 07/25/31(a)(b) | | | | | | | 625 | | | | 624,965 | |
California Street CLO XII Ltd., Series 2013-12A, Class CR, (3 mo. LIBOR US + 2.10%), 2.34%, 10/15/25(a)(b) | | | | | | | 613 | | | | 601,825 | |
Canyon Capital CLO Ltd., Series 2019-1A, Class B, 2.24%, 04/15/32(a)(b) | | | | | | | 550 | | | | 543,491 | |
Chenango Park CLO Ltd., Series 2018-1A, Class A2, 1.79%, 04/15/30(a)(b) | | | | | | | 1,143 | | | | 1,112,411 | |
CIFC Funding Ltd.(a)(b) | | | | | | | | | | | | |
Series 2017-3A, Class A2, (3 mo. LIBOR US + 1.80%), 2.02%, 07/20/30 | | | | | | | 637 | | | | 631,040 | |
Series 2020-1A, Class B, (3 mo. LIBOR US + 2.30%), 2.54%, 07/15/32 | | | | | | | 2,475 | | | | 2,484,719 | |
Cook Park CLO Ltd., Series 2018-1A, Class B, 1.62%, 04/17/30(a)(b) | | | | | | | 1,148 | | | | 1,109,755 | |
Elmwood CLO V Ltd.(a)(b) | | | | | | | | | | | | |
Series 2020-2A, Class A1, (3 mo. LIBOR US + 1.75%), 2.03%, 07/24/31 | | | | | | | 2,750 | | | | 2,755,310 | |
| | | | | | | | | | | | |
| Security | | | | | Par
(000) | | | Value | |
| | | |
| United States (continued) | | | | | | | | | |
Elmwood CLO V Ltd.(a)(b) (continued) | | | | | | | | | | | | |
Series 2020-2A, Class B, (3 mo. LIBOR US + 2.20%), 2.48%, 07/24/31 | | | USD | | | | 375 | | | $ | 375,603 | |
Goldentree Loan Management US Clo 6 Ltd., Series 2019-6A, Class B1, (3 mo. LIBOR US + 1.90%), 2.12%, 01/20/33(a)(b) | | | | | | | 924 | | | | 920,547 | |
Gulf Stream Meridian 1 Ltd., Series 2020-IA, Class A1, (3 mo. LIBOR US + 1.37%), 1.61%, 04/15/33(a)(b) | | | | | | | 4,718 | | | | 4,690,955 | |
Madison Park Funding XII Ltd., Series 2014-12A, Class B1R, (3 mo. LIBOR US + 1.65%), 1.92%, 07/20/26(a)(b) | | | | | | | 559 | | | | 556,223 | |
Madison Park Funding XIII Ltd., Series 2014-13A, Class BR2, (3 mo. LIBOR US + 1.50%), 1.72%, 04/19/30(a)(b) | | | | | | | 550 | | | | 540,597 | |
Mariner Finance Issuance Trust, Series 2020-AA, Class A, 2.19%, 08/21/34(b) | | | | | | | 5,860 | | | | 5,870,099 | |
Navient Private Education Refi Loan Trust, Series 2019-A, Class A2A,
3.42%, 01/15/43(b) | | | | | | | 2,150 | | | | 2,248,365 | |
Neuberger Berman Loan Advisers CLO 37 Ltd., Series 2020-37A, Class B, (3 mo. LIBOR US + 2.20%), 2.42%, 07/20/31(a)(b)(c) | | | | | | | 375 | | | | 375,000 | |
OCP CLO Ltd., Series 2020-19A, Class B, (3 mo. LIBOR US + 2.50%),
2.82%, 07/20/31(a)(b) | | | | | | | 450 | | | | 452,176 | |
Octagon Investment Partners 32 Ltd., Series 2017- 1A, Class B1, (3 mo. LIBOR US + 1.70%), 1.94%, 07/15/29(a)(b) | | | | | | | 335 | | | | 331,407 | |
Palmer Square Loan Funding Ltd.(a)(b) | | | | | | | | | | | | |
Series 2019-2A, Class A2, 1.82%, 04/20/27 | | | | | | | 1,663 | | | | 1,634,386 | |
Series 2019-3A, Class A2, (3 mo. LIBOR US + 1.60%), 1.85%, 08/20/27 | | | | | | | 500 | | | | 493,612 | |
Series 2020-3A, Class A2, (3 mo. LIBOR US + 2.40%), 2.62%, 07/20/28 | | | | | | | 1,375 | | | | 1,374,994 | |
Park Avenue Institutional Advisers CLO Ltd., Series 2016-1A, Class A2R,
2.06%, 08/23/31(a)(b) | | | | | | | 610 | | | | 607,125 | |
RR 10 Ltd.(a)(b) | | | | | | | | | | | | |
Series 2020-10A, Class A2A, (3 mo. LIBOR US + 2.50%), 2.74%, 07/15/33 | | | | | | | 1,875 | | | | 1,874,988 | |
Series 2020-10A, Class A2B, (3 mo. LIBOR US + 3.00%), 3.24%, 07/15/33 | | | | | | | 1,875 | | | | 1,842,888 | |
SLM Private Credit Student Loan Trust(a) | | | | | | | | | | | | |
Series 2005-B, Class A4, (3 mo. LIBOR US + 0.33%), 0.58%, 06/15/39 | | | | | | | 4,351 | | | | 4,118,056 | |
Series 2006-A, Class A5, (3 mo. LIBOR US + 0.29%), 0.54%, 06/15/39 | | | | | | | 6,611 | | | | 6,299,543 | |
Series 2007-A, Class A4A, (3 mo. LIBOR US + 0.24%), 0.55%, 12/16/41 | | | | | | | 7,011 | | | | 6,750,313 | |
SLM Private Education Loan Trust, Series 2010-C, Class A5, (1 mo. LIBOR US + 4.75%), 4.90%, 10/15/41(a)(b) | | | | | | | 16,108 | | | | 17,468,801 | |
SMB Private Education Loan Trust(b) | | | | | | | | | | | | |
Series 2019-A, Class A2A, 3.44%, 07/15/36 | | | | | | | 5,978 | | | | 6,285,833 | |
Series 2020-B, Class B, 2.76%, 07/15/53 | | | | | | | 3,800 | | | | 3,780,496 | |
| | |
CONSOLIDATED SCHEDULE OF INVESTMENTS | | 11 |
| | |
Consolidated Schedule of Investments (continued) October 31, 2020 | | BlackRock Global Allocation Fund, Inc. (Percentages shown are based on Net Assets) |
| | | | | | | | | | | | |
| Security | | | | | Par (000) | | | Value | |
| | | |
| United States (continued) | | | | | | | | | |
Sofi Professional Loan Program LLC, Series 2019-A, Class A2FX,
3.69%, 06/15/48(b) | | | USD | | | | 3,790 | | | $ | 4,000,024 | |
Sofi Professional Loan Program Trust, Series 2018-B, Class A2FX,
3.34%, 08/25/47(b) | | | | | | | 1,691 | | | | 1,736,547 | |
Whitebox Clo II Ltd., Series 2020-2A, Class B, (3 mo. LIBOR US + 2.25%), 2.49%, 10/24/31(a)(b) | | | | | | | 700 | | | | 699,979 | |
York CLO 1 Ltd., Series 2014-1A, Class BRR, 1.87%, 10/22/29(a)(b) | | | | | | | 466 | | | | 455,709 | |
| | | | | | | | |
| | | | | | | | | | | 95,163,053 | |
| | | | | | | | |
| | |
Total Asset-Backed Securities — 0.6%
(Cost: $138,063,656) | | | | | | | | 140,971,011 | |
| | | | | | | | |
| | | |
| | | | | | Shares | | | | |
| | | |
Common Stocks | | | | | | | | | | | | |
| | | |
Argentina(d) — 0.0% | | | | | | | | | | | | |
Globant SA | | | | | | | 33,112 | | | | 5,980,359 | |
MercadoLibre, Inc. | | | | | | | 224 | | | | 271,947 | |
| | | | | | | | |
| | | | | | | | | | | 6,252,306 | |
| | | |
| Australia — 0.3% | | | | | | | | | |
BHP Group Ltd. | | | | | | | 34,937 | | | | 837,497 | |
BHP Group PLC | | | | | | | 306,489 | | | | 5,937,412 | |
Brambles Ltd. | | | | | | | 119,316 | | | | 804,705 | |
Coles Group Ltd. | | | | | | | 10,793 | | | | 134,829 | |
CSL Ltd. | | | | | | | 1,040 | | | | 210,555 | |
Fortescue Metals Group Ltd. | | | | | | | 26,873 | | | | 328,751 | |
Glencore PLC(d) | | | | | | | 33,607 | | | | 67,793 | |
Goodman Group | | | | | | | 27,457 | | | | 355,380 | |
Newcrest Mining Ltd. | | | | | | | 452,887 | | | | 9,391,740 | |
Quintis HoldCo. Pty. Ltd., (Acquired 10/01/20, Cost: $21,821,022)(c)(e)(f) | | | | | | | 43,735,802 | | | | 36,275,449 | |
Wesfarmers Ltd. | | | | | | | 33,066 | | | | 1,070,334 | |
| | | | | | | | |
| | | | | | | | | | | 55,414,445 | |
| | | |
| Brazil — 0.0% | | | | | | | | | |
B3 SA - Brasil Bolsa Balcao | | | | | | | 87,767 | | | | 780,855 | |
Banco do Brasil SA | | | | | | | 44,427 | | | | 230,731 | |
Banco Santander Brasil SA | | | | | | | 36,891 | | | | 206,059 | |
Centrais Eletricas Brasileiras SA | | | | | | | 31,188 | | | | 168,823 | |
CPFL Energia SA | | | | | | | 9,892 | | | | 48,047 | |
Engie Brasil Energia SA | | | | | | | 153,419 | | | | 1,066,563 | |
Vale SA, ADR | | | | | | | 391,966 | | | | 4,143,081 | |
| | | | | | | | |
| | | | | | | | | | | 6,644,159 | |
| | | |
| Canada — 0.8% | | | | | | | | | |
Barrick Gold Corp. | | | | | | | 648,503 | | | | 17,338,195 | |
Brookfield Asset Management, Inc., Class A | | | | | | | 7,363 | | | | 218,795 | |
CGI, Inc.(d) | | | | | | | 1,465 | | | | 90,904 | |
Constellation Software, Inc. | | | | | | | 397 | | | | 416,753 | |
Enbridge, Inc. | | | | | | | 4,869,641 | | | | 134,177,378 | |
Fairfax Financial Holdings Ltd. | | | | | | | 984 | | | | 258,678 | |
Loblaw Cos. Ltd. | | | | | | | 15,748 | | | | 783,913 | |
Magna International, Inc. | | | | | | | 2,886 | | | | 147,365 | |
Manulife Financial Corp. | | | | | | | 15,620 | | | | 211,737 | |
Nutrien Ltd. | | | | | | | 2,471 | | | | 100,450 | |
Restaurant Brands International, Inc. | | | | | | | 7,396 | | | | 384,317 | |
| | | | | | | | | | | | |
| | | |
| Security | | | | | Shares | | | Value | |
| | | |
| Canada (continued) | | | | | | | | | |
Shopify, Inc., Class A(d) | | | | | | | 532 | | | $ | 490,444 | |
Thomson Reuters Corp. | | | | | | | 7,398 | | | | 575,159 | |
Wheaton Precious Metals Corp. | | | | | | | 403,893 | | | | 18,534,878 | |
| | | | | | | | |
| | | | | | | | | | | 173,728,966 | |
| | | |
| China — 2.5% | | | | | | | | | |
AAC Technologies Holdings, Inc. | | | | | | | 709,500 | | | | 3,729,401 | |
Agile Group Holdings Ltd. | | | | | | | 104,000 | | | | 142,705 | |
Aier Eye Hospital Group Co. Ltd., Class A | | | | | | | 1,003,956 | | | | 9,356,983 | |
Alibaba Group Holding Ltd.(d) | | | | | | | 210,300 | | | | 7,969,076 | |
Alibaba Group Holding Ltd., ADR(d) | | | | | | | 223,803 | | | | 68,190,536 | |
Amoy Diagnostics Co. Ltd., Class A | | | | | | | 320,150 | | | | 4,030,145 | |
Anhui Conch Cement Co. Ltd., Class H | | | | | | | 50,000 | | | | 312,774 | |
Anhui Gujing Distillery Co. Ltd., Class B | | | | | | | 17,800 | | | | 202,532 | |
Anta Sports Products Ltd. | | | | | | | 1,155,000 | | | | 12,821,825 | |
Asymchem Laboratories Tianjin Co. Ltd., Class A | | | | | | | 143,503 | | | | 5,892,726 | |
Autobio Diagnostics Co. Ltd., Class A | | | | | | | 223,378 | | | | 5,824,767 | |
Baidu, Inc., ADR(d) | | | | | | | 5,016 | | | | 667,379 | |
Brilliance China Automotive Holdings Ltd. | | | | | | | 3,194,000 | | | | 2,757,097 | |
BYD Co. Ltd., Class A | | | | | | | 290,000 | | | | 6,923,100 | |
China CITIC Bank Corp. Ltd., Class H | | | | | | | 449,000 | | | | 182,746 | |
China Feihe Ltd.(b) | | | | | | | 337,000 | | | | 766,754 | |
China Galaxy Securities Co. Ltd., Class H | | | | | | | 462,500 | | | | 253,831 | |
China Merchants Bank Co. Ltd., Class H | | | | | | | 1,168,000 | | | | 6,084,034 | |
China Mobile Ltd. | | | | | | | 255,500 | | | | 1,562,776 | |
China National Building Material Co. Ltd., Class H | | | | | | | 696,000 | | | | 801,139 | |
China Oilfield Services Ltd., Class H | | | | | | | 1,652,000 | | | | 997,612 | |
China Resources Cement Holdings Ltd. | | | | | | | 366,000 | | | | 479,251 | |
China Resources Power Holdings Co. Ltd. | | | | | | | 418,000 | | | | 435,063 | |
China Telecom Corp. Ltd., Class H | | | | | | | 4,330,000 | | | | 1,359,227 | |
China Unicom Hong Kong Ltd. | | | | | | | 868,000 | | | | 535,026 | |
CNOOC Ltd. | | | | | | | 288,000 | | | | 263,507 | |
Contemporary Amperex Technology Co. Ltd., Class A | | | | | | | 309,900 | | | | 11,387,774 | |
Country Garden Services Holdings Co. Ltd. | | | | | | | 78,298 | | | | 493,097 | |
CRRC Corp. Ltd., Class H | | | | | | | 1,501,000 | | | | 582,209 | |
Dali Foods Group Co. Ltd.(b) | | | | | | | 606,500 | | | | 376,553 | |
Dongfeng Motor Group Co. Ltd., Class H | | | | | | | 138,000 | | | | 97,211 | |
ENN Energy Holdings Ltd. | | | | | | | 266,500 | | | | 3,372,851 | |
Ganfeng Lithium Co. Ltd., Class H(b) | | | | | | | 213,000 | | | | 1,239,099 | |
Glodon Co. Ltd., Class A | | | | | | | 521,830 | | | | 5,558,932 | |
Gree Electric Appliances, Inc. of Zhuhai, Class A | | | | | | | 453,000 | | | | 3,973,680 | |
Guangdong Marubi Biotechnology Co. Ltd., Class A | | | | | | | 305,800 | | | | 2,837,675 | |
Guangzhou Automobile Group Co. Ltd., Class A | | | | | | | 1,488,262 | | | | 2,991,963 | |
Guangzhou Automobile Group Co. Ltd.,
Class H | | | | | | | 3,340,000 | | | | 3,433,798 | |
Guangzhou Baiyun International Airport Co. Ltd., Class A | | | | | | | 2,942,171 | | | | 5,528,714 | |
Haidilao International Holding Ltd.(b) | | | | | | | 558,000 | | | | 3,696,079 | |
Haier Smart Home Co. Ltd., Class A | | | | | | | 928,616 | | | | 3,457,254 | |
Haitong Securities Co. Ltd., Class H | | | | | | | 431,200 | | | | 365,290 | |
Hangzhou Hikvision Digital Technology Co. Ltd., Class A | | | | | | | 2,258,097 | | | | 15,187,185 | |
Hangzhou Robam Appliances Co. Ltd., Class A | | | | | | | 996,733 | | | | 5,459,720 | |
Hangzhou Tigermed Consulting Co. Ltd., Class A | | | | | | | 207,162 | | | | 3,850,008 | |
Hangzhou Tigermed Consulting Co. Ltd., Class H(b)(d) | | | | | | | 313,400 | | | | 5,032,996 | |
Han’s Laser Technology Industry Group Co. Ltd., Class A | | | | | | | 1,149,132 | | | | 6,922,550 | |
Hansoh Pharmaceutical Group Ltd.(b)(d) | | | | | | | 580,000 | | | | 2,595,909 | |
| | |
| 12 | | 2020 BLACKROCK ANNUAL REPORTTO SHAREHOLDERS |
| | |
Consolidated Schedule of Investments (continued) October 31, 2020 | | BlackRock Global Allocation Fund, Inc. (Percentages shown are based on Net Assets) |
| | | | | | | | |
| Security | | Shares | | | Value | |
| | |
| China (continued) | | | | | | |
Hengan International Group Co. Ltd. | | | 120,000 | | | $ | 837,066 | |
Huazhu Group Ltd., ADR | | | 237,332 | | | | 9,405,467 | |
Hundsun Technologies, Inc., Class A | | | 199,890 | | | | 2,786,468 | |
Industrial & Commercial Bank of China Ltd., Class H | | | 8,155,000 | | | | 4,630,931 | |
Inner Mongolia Yili Industrial Group Co. Ltd., Class A | | | 692,914 | | | | 4,119,992 | |
Inspur Electronic Information Industry Co. Ltd., Class A | | | 512,404 | | | | 2,341,155 | |
JD.com, Inc., ADR(d) | | | 22,932 | | | | 1,869,417 | |
Jiangxi Copper Co. Ltd., Class H | | | 213,000 | | | | 254,362 | |
KE Holdings, Inc.(d)(g) | | | 180,768 | | | | 12,608,568 | |
Kingdee International Software Group Co.
Ltd.(d) | | | 7,206,000 | | | | 19,025,680 | |
Kunlun Energy Co. Ltd. | | | 294,000 | | | | 190,337 | |
Kweichow Moutai Co. Ltd., Class A | | | 21,800 | | | | 5,449,714 | |
Lenovo Group Ltd. | | | 552,000 | | | | 346,586 | |
Li Auto, Inc., ADR(d)(g) | | | 734,752 | | | | 14,819,948 | |
Maxscend Microelectronics Co. Ltd., Class A | | | 700 | | | | 45,428 | |
Meituan, Class B(d) | | | 216,200 | | | | 8,059,754 | |
Momo, Inc., ADR | | | 45,594 | | | | 683,910 | |
NetEase, Inc., ADR | | | 109,430 | | | | 9,497,430 | |
New Oriental Education & Technology Group, Inc., ADR(d) | | | 34,996 | | | | 5,612,658 | |
Offcn Education Technology Co. Ltd., Class A | | | 38,900 | | | | 229,978 | |
PICC Property & Casualty Co. Ltd., Class H | | | 938,000 | | | | 636,633 | |
Ping An Insurance Group Co. of China Ltd., Class A | | | 447,300 | | | | 5,208,406 | |
Poly Property Development Co. Ltd. | | | 10,200 | | | | 73,590 | |
Prosus NV(d) | | | 2,773 | | | | 276,845 | |
Shanghai International Airport Co. Ltd., Class A | | | 617,817 | | | | 6,115,432 | |
Shenzhen Goodix Technology Co. Ltd., Class A | | | 5,500 | | | | 141,507 | |
Shenzhen Inovance Technology Co. Ltd., Class A | | | 595,700 | | | | 5,729,824 | |
Silergy Corp. | | | 135,000 | | | | 8,323,131 | |
Tencent Holdings Ltd. | | | 1,769,500 | | | | 135,199,724 | |
Tingyi Cayman Islands Holding Corp. | | | 532,000 | | | | 973,518 | |
Trip.com Group Ltd., ADR(d) | | | 346,298 | | | | 9,959,530 | |
Venus MedTech Hangzhou, Inc., Class H(b)(d) | | | 601,000 | | | | 5,794,741 | |
Venustech Group, Inc., Class A | | | 1,034,688 | | | | 4,789,342 | |
Vipshop Holdings Ltd., ADR(d)(g) | | | 24,687 | | | | 528,302 | |
Want Want China Holdings Ltd. | | | 4,867,000 | | | | 3,223,095 | |
Wuhan Raycus Fiber Laser Technologies Co. Ltd., Class A | | | 542,751 | | | | 6,076,077 | |
Wuhu Sanqi Interactive Entertainment Network Technology Group Co. Ltd., Class A | | | 77,400 | | | | 343,306 | |
WuXi AppTec Co. Ltd., Class A | | | 225,211 | | | | 3,806,592 | |
Wuxi Biologics Cayman, Inc.(b)(d) | | | 279,000 | | | | 7,835,355 | |
Yifeng Pharmacy Chain Co. Ltd., Class A | | | 419,120 | | | | 6,387,261 | |
Yihai International Holding Ltd.(d) | | | 246,000 | | | | 3,267,881 | |
Yonyou Network Technology Co. Ltd., Class A | | | 564,209 | | | | 3,653,419 | |
Yum China Holdings, Inc. | | | 166,072 | | | | 8,840,013 | |
Zhejiang Century Huatong Group Co. Ltd., Class A | | | 201,400 | | | | 257,115 | |
ZTO Express Cayman, Inc., ADR | | | 31,945 | | | | 925,766 | |
| | | | | |
| | | | | | | 562,163,813 | |
| | |
| Denmark — 0.1% | | | | | | |
AP Moeller - Maersk A/S, Class A | | | 476 | | | | 703,840 | |
AP Moeller - Maersk A/S, Class B | | | 644 | | | | 1,032,097 | |
| | | | | | | | |
| Security | | Shares | | | Value | |
| | |
| Denmark (continued) | | | | | | |
DSV Panalpina AS | | | 134,587 | | | $ | 21,835,587 | |
Genmab A/S(d) | | | 18,377 | | | | 6,138,375 | |
| | | | | |
| | | | | | | 29,709,899 | |
| | |
| Finland — 0.3% | | | | | | |
Fortum OYJ | | | 9,611 | | | | 180,654 | |
Neste OYJ | | | 1,228,560 | | | | 64,073,757 | |
Nokia OYJ(d) | | | 890,277 | | | | 3,001,298 | |
| | | | | |
| | | | | | | 67,255,709 | |
| | |
| France — 2.3% | | | | | | |
Arkema SA | | | 541,266 | | | | 53,011,451 | |
AXA SA | | | 34,186 | | | | 549,003 | |
BNP Paribas SA(d) | | | 314,174 | | | | 10,956,744 | |
Carrefour SA | | | 68,450 | | | | 1,063,843 | |
Cie de Saint-Gobain(d) | | | 154,686 | | | | 6,025,562 | |
Danone SA | | | 1,617,637 | | | | 89,722,557 | |
Engie SA(d) | | | 30,880 | | | | 373,480 | |
EssilorLuxottica SA(d) | | | 420,938 | | | | 51,968,532 | |
Kering SA | | | 27,272 | | | | 16,480,909 | |
LVMH Moet Hennessy Louis Vuitton SE | | | 126,371 | | | | 59,236,115 | |
Orange SA | | | 18,634 | | | | 209,253 | |
Pernod Ricard SA | | | 28,055 | | | | 4,519,729 | |
Safran SA(d) | | | 1,039,653 | | | | 109,662,488 | |
Sanofi | | | 1,127,022 | | | | 101,762,580 | |
Schneider Electric SE | | | 7,818 | | | | 949,937 | |
Societe Generale SA(d) | | | 435,210 | | | | 5,913,594 | |
TOTAL SA | | | 139,368 | | | | 4,222,392 | |
Vivendi SA | | | 36,788 | | | | 1,061,831 | |
| | | | | |
| | | | | | | 517,690,000 | |
| | |
| Germany — 2.2% | | | | | | |
adidas AG(d) | | | 356,846 | | | | 106,020,681 | |
Allianz SE, Registered Shares | | | 277,480 | | | | 48,879,377 | |
Bayer AG, Registered Shares | | | 16,395 | | | | 770,409 | |
Daimler AG, Registered Shares | | | 7,061 | | | | 364,972 | |
Deutsche Boerse AG | | | 6,613 | | | | 974,449 | |
Deutsche Post AG, Registered Shares | | | 32,533 | | | | 1,442,447 | |
Deutsche Telekom AG, Registered Shares | | | 5,837,689 | | | | 88,725,561 | |
Evonik Industries AG | | | 37,885 | | | | 912,153 | |
Fresenius SE & Co. KGaA | | | 17,794 | | | | 660,041 | |
Henkel AG & Co. KGaA | | | 2,756 | | | | 249,153 | |
Infineon Technologies AG | | | 252,452 | | | | 7,028,561 | |
SAP SE | | | 3,335 | | | | 355,793 | |
Siemens AG, Registered Shares | | | 1,697,623 | | | | 199,158,395 | |
Siemens Energy AG(d) | | | 856,998 | | | | 18,764,332 | |
Vonovia SE | | | 235,152 | | | | 15,017,626 | |
| | | | | |
| | | | | | | 489,323,950 | |
| | |
| Hong Kong — 0.8% | | | | | | |
AIA Group Ltd. | | | 11,702,400 | | | | 111,373,770 | |
CLP Holdings Ltd. | | | 488,000 | | | | 4,496,698 | |
Hang Lung Properties Ltd. | | | 3,247,000 | | | | 7,904,785 | |
HKT Trust & HKT Ltd.(h) | | | 3,245,000 | | | | 4,196,651 | |
Hysan Development Co. Ltd. | | | 750,000 | | | | 2,391,067 | |
Jardine Matheson Holdings Ltd. | | | 114,500 | | | | 5,075,285 | |
Sun Art Retail Group Ltd. | | | 459,000 | | | | 497,300 | |
Sun Hung Kai Properties Ltd. | | | 2,920,166 | | | | 37,587,828 | |
WH Group Ltd.(b) | | | 1,113,500 | | | | 877,022 | |
| | | | | |
| | | | | | | 174,400,406 | |
| | |
CONSOLIDATED SCHEDULE OF INVESTMENTS | | 13 |
| | |
Consolidated Schedule of Investments (continued) October 31, 2020 | | BlackRock Global Allocation Fund, Inc. (Percentages shown are based on Net Assets) |
| | | | | | | | |
| Security | | Shares | | | Value | |
| | |
| India — 0.4% | | | | | | |
HDFC Asset Management Co. Ltd.(b) | | | 4,763 | | | $ | 144,540 | |
Hindustan Unilever Ltd. | | | 12,871 | | | | 359,878 | |
NTPC Ltd. | | | 372,567 | | | | 440,228 | |
Petronet LNG Ltd. | | | 741,866 | | | | 2,310,996 | |
Power Grid Corp. of India Ltd. | | | 54,418 | | | | 125,575 | |
Reliance Industries Ltd. | | | 3,152,052 | | | | 83,723,151 | |
Tata Consultancy Services Ltd. | | | 5,512 | | | | 198,655 | |
Vedanta Ltd. | | | 274,110 | | | | 354,570 | |
| | | | | |
| | | | | | | 87,657,593 | |
| | |
| Indonesia — 0.0% | | | | | | |
Bank Central Asia Tbk PT | | | 3,419,500 | | | | 6,728,399 | |
| | | | | |
| | |
| Italy — 1.4% | | | | | | |
Enel SpA | | | 21,379,570 | | | | 169,978,322 | |
Intesa Sanpaolo SpA(d) | | | 81,955 | | | | 136,054 | |
RAI Way SpA(b) | | | 3,859,825 | | | | 23,510,706 | |
Snam SpA | | | 1,577,852 | | | | 7,693,734 | |
UniCredit SpA(d) | | | 14,990,654 | | | | 112,270,829 | |
| | | | | |
| | | | | | | 313,589,645 | |
| | |
| Japan — 2.4% | | | | | | |
Aisin Seiki Co. Ltd. | | | 4,400 | | | | 133,311 | |
Ajinomoto Co., Inc. | | | 3,004,100 | | | | 60,354,659 | |
Asahi Kasei Corp. | | | 42,800 | | | | 370,886 | |
Astellas Pharma, Inc. | | | 4,317,150 | | | | 59,200,804 | |
Canon, Inc. | | | 58,200 | | | | 1,013,041 | |
Disco Corp. | | | 51,700 | | | | 13,954,260 | |
Eisai Co. Ltd. | | | 1,700 | | | | 132,181 | |
FANUC Corp. | | | 93,300 | | | | 19,707,260 | |
Fujitsu Ltd. | | | 2,000 | | | | 236,629 | |
Hitachi Ltd. | | | 16,000 | | | | 539,269 | |
Honda Motor Co. Ltd. | | | 16,600 | | | | 392,639 | |
Hoya Corp. | | | 659,917 | | | | 74,476,182 | |
Kao Corp. | | | 1,700 | | | | 121,038 | |
KDDI Corp. | | | 478,800 | | | | 12,953,929 | |
Keyence Corp. | | | 71,000 | | | | 32,221,397 | |
Kose Corp. | | | 83,700 | | | | 10,669,695 | |
Maeda Road Construction Co. Ltd. | | | 80,100 | | | | 1,335,284 | |
Marubeni Corp. | | | 41,700 | | | | 217,724 | |
Mitsubishi Corp. | | | 20,200 | | | | 450,689 | |
Mitsubishi Estate Co. Ltd. | | | 737,000 | | | | 10,993,001 | |
Mitsubishi Heavy Industries Ltd. | | | 52,200 | | | | 1,121,528 | |
NEC Corp. | | | 5,300 | | | | 266,962 | |
Nexon Co. Ltd. | | | 3,800 | | | | 105,909 | |
Nintendo Co. Ltd. | | | 600 | | | | 324,413 | |
Nippon Telegraph & Telephone Corp. | | | 501,700 | | | | 10,553,677 | |
Nomura Holdings, Inc. | | | 17,200 | | | | 77,029 | |
NTT Data Corp. | | | 33,100 | | | | 373,573 | |
Olympus Corp. | | | 11,500 | | | | 220,157 | |
Oriental Land Co. Ltd. | | | 98,600 | | | | 13,801,828 | |
Otsuka Holdings Co. Ltd. | | | 8,500 | | | | 314,811 | |
Panasonic Corp. | | | 48,600 | | | | 448,944 | |
Rakuten, Inc. | | | 40,700 | | | | 395,978 | |
Recruit Holdings Co. Ltd. | | | 456,900 | | | | 17,385,340 | |
Ryohin Keikaku Co. Ltd. | | | 356,800 | | | | 7,488,990 | |
Sekisui House Ltd. | | | 32,000 | | | | 531,626 | |
Seven & i Holdings Co. Ltd. | | | 28,000 | | | | 851,051 | |
Shin-Etsu Chemical Co. Ltd. | | | 653,640 | | | | 87,304,574 | |
Shionogi & Co. Ltd. | | | 4,800 | | | | 226,416 | |
Sompo Holdings, Inc. | | | 8,900 | | | | 332,289 | |
| | | | | | | | |
| Security | | Shares | | | Value | |
| | |
| Japan (continued) | | | | | | |
Sony Corp. | | | 251,200 | | | $ | 20,941,646 | |
Subaru Corp. | | | 1,696,590 | | | | 31,137,467 | |
Sumitomo Electric Industries Ltd. | | | 24,300 | | | | 268,274 | |
Suzuki Motor Corp. | | | 1,177,208 | | | | 50,558,369 | |
Terumo Corp. | | | 2,600 | | | | 95,690 | |
Tokyo Electron Ltd. | | | 1,600 | | | | 429,457 | |
| | | | | |
| | | | | | | 545,029,876 | |
| | |
| Mexico — 0.0% | | | | | | |
Fomento Economico Mexicano SAB de CV | | | 67,885 | | | | 363,852 | |
Grupo Bimbo SAB de CV, Series A | | | 317,851 | | | | 614,229 | |
Wal-Mart de Mexico SAB de CV | | | 45,738 | | | | 110,509 | |
| | | | | |
| | | | | | | 1,088,590 | |
| | |
| Netherlands — 2.7% | | | | | | |
Adyen NV(b)(d) | | | 32,105 | | | | 53,960,259 | |
Akzo Nobel NV | | | 1,348,498 | | | | 129,709,685 | |
ASML Holding NV | | | 344,999 | | | | 124,821,631 | |
ING Groep NV(d) | | | 14,956,921 | | | | 102,450,677 | |
ING Groep NV, ADR(d)(g) | | | 146,000 | | | | 995,720 | |
Koninklijke Philips NV(d) | | | 2,178,558 | | | | 100,903,726 | |
NXP Semiconductors NV | | | 725,184 | | | | 97,986,862 | |
| | | | | |
| | | | | | | 610,828,560 | |
| | |
| Norway — 0.0% | | | | | | |
LINK Mobility Group Holding ASA(d) | | | 742,585 | | | | 3,967,029 | |
| | | | | |
| | |
| Poland — 0.0% | | | | | | |
Polski Koncern Naftowy ORLEN SA | | | 21,598 | | | | 208,165 | |
| | | | | |
| | |
| Portugal — 0.0% | | | | | | |
Jeronimo Martins SGPS SA | | | 278,896 | | | | 4,429,904 | |
| | | | | |
| | |
| Singapore — 0.2% | | | | | | |
CapitaLand Ltd. | | | 10,896,200 | | | | 20,504,320 | |
ComfortDelGro Corp. Ltd. | | | 2,901,900 | | | | 2,870,156 | |
DBS Group Holdings Ltd. | | | 384,100 | | | | 5,721,496 | |
Singapore Telecommunications Ltd. | | | 669,800 | | | | 995,673 | |
United Overseas Bank Ltd. | | | 437,700 | | | | 6,081,599 | |
| | | | | |
| | | | | | | 36,173,244 | |
| | |
| South Africa — 0.0% | | | | | | |
Anglo American Platinum Ltd. | | | 10,400 | | | | 688,635 | |
Anglo American PLC | | | 177,580 | | | | 4,166,590 | |
AngloGold Ashanti Ltd. | | | 16,469 | | | | 379,536 | |
MTN Group Ltd. | | | 208,933 | | | | 745,997 | |
| | | | | |
| | | | | | | 5,980,758 | |
| | |
| South Korea — 0.3% | | | | | | |
Celltrion, Inc.(d) | | | 1,405 | | | | 300,001 | |
Hyundai Mobis Co. Ltd. | | | 1,387 | | | | 277,904 | |
Kakao Corp. | | | 48,689 | | | | 14,197,271 | |
KB Financial Group, Inc. | | | 5,762 | | | | 206,105 | |
Kia Motors Corp. | | | 17,595 | | | | 789,121 | |
LG Chem Ltd. | | | 41,004 | | | | 22,358,703 | |
LG Electronics, Inc. | | | 6,950 | | | | 516,659 | |
LG Uplus Corp. | | | 19,582 | | | | 191,699 | |
NCSoft Corp. | | | 14,330 | | | | 9,845,911 | |
POSCO | | | 20,914 | | | | 3,860,812 | |
Samsung Biologics Co. Ltd.(b)(d) | | | 1,233 | | | | 745,098 | |
Samsung SDI Co. Ltd. | | | 23,899 | | | | 9,414,682 | |
Shinhan Financial Group Co. Ltd. | | | 3,765 | | | | 102,153 | |
| | | | | |
| | |
| | | | | | 62,806,119 | |
| | |
| 14 | | 2020 BLACKROCK ANNUAL REPORTTO SHAREHOLDERS |
| | |
Consolidated Schedule of Investments (continued) October 31, 2020 | | BlackRock Global Allocation Fund, Inc. (Percentages shown are based on Net Assets) |
| | | | | | | | |
| Security | | Shares | | | Value | |
| | |
| Spain — 0.4% | | | | | | |
Cellnex Telecom SA(b) | | | 1,287,393 | | | $ | 82,638,985 | |
Repsol SA | | | 107,300 | | | | 673,636 | |
Telefonica SA | | | 165,944 | | | | 539,821 | |
| | | | | |
| | | | | | | 83,852,442 | |
| | |
| Sweden — 0.8% | | | | | | |
Assa Abloy AB, Class B | | | 35,790 | | | | 767,068 | |
Atlas Copco AB, A Shares | | | 174,280 | | | | 7,692,921 | |
Hexagon AB, B Shares | | | 248,045 | | | | 18,180,999 | |
Sandvik AB(d) | | | 26,340 | | | | 469,513 | |
Telefonaktiebolaget LM Ericsson, B Shares | | | 1,447,002 | | | | 16,155,075 | |
Volvo AB, B Shares(d) | | | 7,461,548 | | | | 145,031,517 | |
| | | | | |
| | | | | | | 188,297,093 | |
| | |
| Switzerland — 1.2% | | | | | | |
Alcon, Inc.(d) | | | 173,487 | | | | 9,861,183 | |
LafargeHolcim Ltd., Registered Shares(d) | | | 9,196 | | | | 394,689 | |
Lonza Group AG, Registered Shares | | | 283 | | | | 171,472 | |
Nestle SA, Registered Shares | | | 773,199 | | | | 86,967,791 | |
Novartis AG, Registered Shares | | | 21,586 | | | | 1,682,037 | |
Roche Holding AG | | | 403,992 | | | | 129,815,291 | |
SGS SA, Registered Shares | | | 255 | | | | 636,942 | |
Sika AG, Registered Shares | | | 88,313 | | | | 21,725,418 | |
Straumann Holding AG, Registered Shares | | | 10,756 | | | | 11,227,678 | |
| | | | | |
| | | | | | | 262,482,501 | |
| | |
| Taiwan — 1.1% | | | | | | |
ASE Technology Holding Co. Ltd. | | | 103,000 | | | | 231,190 | |
Asustek Computer, Inc. | | | 67,000 | | | | 569,239 | |
Cathay Financial Holding Co. Ltd. | | | 2,811,000 | | | | 3,777,235 | |
Chunghwa Telecom Co. Ltd. | | | 1,438,000 | | | | 5,394,931 | |
Formosa Chemicals & Fibre Corp. | | | 1,249,000 | | | | 3,008,215 | |
Formosa Petrochemical Corp. | | | 669,000 | | | | 1,841,710 | |
Formosa Plastics Corp. | | | 1,108,000 | | | | 3,067,132 | |
Fubon Financial Holding Co. Ltd. | | | 3,058,000 | | | | 4,356,289 | |
Hon Hai Precision Industry Co. Ltd. | | | 1,569,760 | | | | 4,257,394 | |
MediaTek, Inc. | | | 220,000 | | | | 5,229,457 | |
Nan Ya Plastics Corp. | | | 1,516,000 | | | | 3,114,073 | |
Nanya Technology Corp. | | | 249,000 | | | | 504,584 | |
Taiwan Semiconductor Manufacturing Co. Ltd. | | | 13,290,000 | | | | 201,073,361 | |
Uni-President Enterprises Corp. | | | 2,234,000 | | | | 4,788,717 | |
United Microelectronics Corp. | | | 1,098,000 | | | | 1,180,076 | |
Yageo Corp. | | | 493,000 | | | | 6,141,692 | |
| | | | | |
| | | | | | | 248,535,295 | |
| | |
| Thailand — 0.1% | | | | | | |
Advanced Info Service PCL, Foreign Registered Shares | | | 866,100 | | | | 4,811,930 | |
Intouch Holdings PCL, Class F | | | 2,781,700 | | | | 4,784,292 | |
Thai Beverage PCL | | | 3,284,400 | | | | 1,396,748 | |
| | | | | |
| | | | | | | 10,992,970 | |
| | |
| Turkey — 0.0% | | | | | | |
BIM Birlesik Magazalar AS | | | 16,821 | | | | 132,995 | |
Tupras Turkiye Petrol Rafinerileri AS(d)(g) | | | 67,457 | | | | 603,174 | |
| | | | | |
| | | | | | | 736,169 | |
| | |
| United Arab Emirates(c) — 0.0% | | | | | | |
Jawbone Health Hub, Inc., (Acquired 01/24/17, Cost: $0)(f) | | | 1,518,232 | | | | 15 | |
NMC Health PLC(d) | | | 1,077,976 | | | | 14 | |
| | | | | |
| | | | | | | 29 | |
| | | | | | | | |
| Security | | Shares | | | Value | |
| | |
| United Kingdom — 1.7% | | | | | | |
Associated British Foods PLC | | | 10,396 | | | $ | 228,626 | |
AstraZeneca PLC | | | 32,612 | | | | 3,274,423 | |
Barclays PLC(d) | | | 3,856,244 | | | | 5,345,036 | |
Berkeley Group Holdings PLC | | | 220,578 | | | | 11,597,613 | |
Coca-Cola European Partners PLC | | | 2,023 | | | | 72,241 | |
Diageo PLC | | | 47,417 | | | | 1,532,415 | |
Ferguson PLC | | | 124,438 | | | | 12,359,294 | |
Fiat Chrysler Automobiles NV(d) | | | 15,401 | | | | 188,933 | |
GlaxoSmithKline PLC | | | 52,036 | | | | 868,922 | |
HSBC Holdings PLC(d) | | | 133,762 | | | | 560,542 | |
Legal & General Group PLC | | | 191,514 | | | | 459,175 | |
RELX PLC | | | 649,295 | | | | 12,848,188 | |
Rio Tinto Ltd. | | | 7,869 | | | | 511,909 | |
Rio Tinto PLC | | | 112,589 | | | | 6,368,187 | |
The HUT Group (THG) | | | 7,054,033 | | | | 60,277,524 | |
THG Holdings Ltd.(d) | | | 3,609,577 | | | | 30,844,251 | |
Unilever NV | | | 1,608,500 | | | | 90,677,151 | |
Unilever PLC | | | 850,418 | | | | 48,464,315 | |
Vodafone Group PLC | | | 61,877,625 | | | | 82,542,780 | |
| | | | | |
| | | | | | | 369,021,525 | |
| | |
| United States — 41.6% | | | | | | |
Abbott Laboratories(i) | | | 1,012,695 | | | | 106,444,371 | |
AbbVie, Inc.(i) | | | 1,342,881 | | | | 114,279,173 | |
Adobe, Inc.(d) | | | 92,936 | | | | 41,551,686 | |
Advanced Micro Devices, Inc.(d) | | | 5,969 | | | | 449,406 | |
Agilent Technologies, Inc. | | | 643,535 | | | | 65,698,488 | |
Air Products & Chemicals, Inc. | | | 599,218 | | | | 165,527,980 | |
Akamai Technologies, Inc.(d) | | | 64,437 | | | | 6,129,247 | |
Alaska Air Group, Inc. | | | 109,547 | | | | 4,150,736 | |
Alexion Pharmaceuticals, Inc.(d) | | | 42,248 | | | | 4,864,435 | |
Allstate Corp. | | | 8,825 | | | | 783,219 | |
Alphabet, Inc., Class C(d) | | | 208,336 | | | | 337,714,739 | |
Altair Engineering, Inc., Class A(d)(g) | | | 315,599 | | | | 13,580,225 | |
Altria Group, Inc. | | | 6,801 | | | | 245,380 | |
Amazon.com, Inc.(d)(i) | | | 133,044 | | | | 403,941,541 | |
American Tower Corp. | | | 70,504 | | | | 16,191,244 | |
American Water Works Co., Inc. | | | 77,644 | | | | 11,686,198 | |
Amgen, Inc. | | | 9,209 | | | | 1,997,800 | |
Analog Devices, Inc. | | | 27,074 | | | | 3,209,081 | |
Annaly Capital Management, Inc. | | | 276,122 | | | | 1,957,705 | |
Anthem, Inc. | | | 433,350 | | | | 118,217,880 | |
Aon PLC, Class A | | | 3,375 | | | | 621,034 | |
Apellis Pharmaceuticals, Inc.(d) | | | 132,284 | | | | 4,219,860 | |
Apple, Inc. | | | 3,925,482 | | | | 427,327,971 | |
Applied Materials, Inc. | | | 1,651,409 | | | | 97,812,955 | |
Aptiv PLC | | | 943,231 | | | | 91,012,359 | |
Atlassian Corp. PLC, Class A(d) | | | 66,549 | | | | 12,752,119 | |
Autodesk, Inc.(d) | | | 316,113 | | | | 74,457,256 | |
AutoZone, Inc.(d) | | | 813 | | | | 917,861 | |
Bank of America Corp. | | | 4,371,016 | | | | 103,593,079 | |
Bank of New York Mellon Corp. | | | 20,248 | | | | 695,721 | |
Baxter International, Inc. | | | 121,732 | | | | 9,442,751 | |
Becton Dickinson and Co. | | | 310,521 | | | | 71,770,719 | |
Berkshire Hathaway, Inc., Class B(d) | | | 142,079 | | | | 28,685,750 | |
Booking Holdings, Inc.(d) | | | 2,887 | | | | 4,684,157 | |
Boston Scientific Corp.(d) | | | 1,856,775 | | | | 63,631,679 | |
Bristol-Myers Squibb Co. | | | 1,266,319 | | | | 74,016,346 | |
Broadcom, Inc. | | | 20,765 | | | | 7,260,067 | |
C.H. Robinson Worldwide, Inc. | | | 129,719 | | | | 11,471,051 | |
Cadence Design Systems, Inc.(d) | | | 128,815 | | | | 14,088,497 | |
| | |
CONSOLIDATED SCHEDULE OF INVESTMENTS | | 15 |
| | |
Consolidated Schedule of Investments (continued) October 31, 2020 | | BlackRock Global Allocation Fund, Inc. (Percentages shown are based on Net Assets) |
| | | | | | | | |
| Security | | Shares | | | Value | |
| | |
| United States (continued) | | | | | | |
Capital One Financial Corp. | | | 1,746,920 | | | $ | 127,664,914 | |
Cardinal Health, Inc. | | | 19,701 | | | | 902,109 | |
Cerner Corp. | | | 10,844 | | | | 760,056 | |
Charles Schwab Corp. | | | 969,880 | | | | 39,871,767 | |
Charter Communications, Inc., Class A(d)(g) | | | 270,027 | | | | 163,047,703 | |
Chubb Ltd. | | | 321,428 | | | | 41,756,711 | |
Ciena Corp.(d) | | | 27,639 | | | | 1,088,700 | |
Cigna Corp. | | | 3,951 | | | | 659,698 | |
Citigroup, Inc. | | | 560,634 | | | | 23,221,460 | |
Clorox Co. | | | 560 | | | | 116,060 | |
CME Group, Inc. | | | 3,783 | | | | 570,174 | |
Cognizant Technology Solutions Corp., Class A | | | 3,531 | | | | 252,184 | |
Colgate-Palmolive Co. | | | 205,098 | | | | 16,180,181 | |
Comcast Corp., Class A(i) | | | 3,621,917 | | | | 152,989,774 | |
ConocoPhillips | | | 821,700 | | | | 23,517,054 | |
Constellation Brands, Inc., Class A | | | 4,343 | | | | 717,594 | |
Corteva, Inc. | | | 4,203 | | | | 138,615 | |
Costco Wholesale Corp. | | | 188,147 | | | | 67,285,130 | |
Crowdstrike Holdings, Inc., Class A(d) | | | 223,859 | | | | 27,722,699 | |
Crown Castle International Corp. | | | 8,098 | | | | 1,264,908 | |
Cummins, Inc. | | | 547 | | | | 120,280 | |
D.R. Horton, Inc. | | | 1,835,520 | | | | 122,631,091 | |
Darden Restaurants, Inc. | | | 45,120 | | | | 4,147,430 | |
Dell Technologies, Inc., Class C(d) | | | 880,675 | | | | 53,069,475 | |
DexCom, Inc.(d) | | | 3,234 | | | | 1,033,522 | |
Dollar General Corp. | | | 1,940 | | | | 404,897 | |
Dollar Tree, Inc.(d) | | | 4,134 | | | | 373,383 | |
Dow, Inc. | | | 4,540 | | | | 206,525 | |
Eaton Corp. PLC | | | 11,397 | | | | 1,182,895 | |
eBay, Inc. | | | 32,033 | | | | 1,525,732 | |
Edwards Lifesciences Corp.(d) | | | 286,942 | | | | 20,570,872 | |
Electronic Arts, Inc.(d) | | | 6,753 | | | | 809,212 | |
Eli Lilly & Co. | | | 5,228 | | | | 682,045 | |
Emerson Electric Co. | | | 902,361 | | | | 58,463,969 | |
EPAM Systems, Inc.(d) | | | 28,688 | | | | 8,863,158 | |
Epic Games, Inc., (Acquired 07/02/20, Cost: $23,484,725)(c)(f) | | | 40,843 | | | | 23,484,725 | |
Exelon Corp. | | | 3,054 | | | | 121,824 | |
Facebook, Inc., Class A(d) | | | 401,182 | | | | 105,554,996 | |
FedEx Corp. | | | 1,821 | | | | 472,495 | |
FirstEnergy Corp. | | | 18,747 | | | | 557,161 | |
Fiserv, Inc.(d) | | | 1,489 | | | | 142,155 | |
Fisker Pipe | | | 677,224 | | | | 6,772,240 | |
Fortinet, Inc.(d) | | | 112,871 | | | | 12,457,572 | |
Fortive Corp. | | | 1,423,979 | | | | 87,717,106 | |
Fortune Brands Home & Security, Inc. | | | 133,595 | | | | 10,803,828 | |
Freeport-McMoRan, Inc. | | | 1,211,069 | | | | 20,999,936 | |
Gilead Sciences, Inc. | | | 289,985 | | | | 16,862,628 | |
Global Payments, Inc. | | | 418,629 | | | | 66,034,538 | |
Goldman Sachs Group, Inc. | | | 140,429 | | | | 26,546,698 | |
GoodRx Holdings, Inc., Class A(d)(g) | | | 114,770 | | | | 5,553,720 | |
Guardant Health, Inc.(d) | | | 127,269 | | | | 13,574,512 | |
HCA Healthcare, Inc. | | | 763,446 | | | | 94,621,497 | |
Healthcare Merger Corp., 10/30/20 | | | 890,702 | | | | 8,907,020 | |
Hewlett Packard Enterprise Co. | | | 134,234 | | | | 1,159,782 | |
Hilton Worldwide Holdings, Inc. | | | 160,548 | | | | 14,097,720 | |
Home Depot, Inc. | | | 465,233 | | | | 124,082,293 | |
HP, Inc. | | | 52,252 | | | | 938,446 | |
Humana, Inc. | | | 10,875 | | | | 4,342,170 | |
iHeartMedia, Inc., Class B(d) | | | 10,778 | | | | 66,285 | |
Illinois Tool Works, Inc. | | | 1,233 | | | | 241,520 | |
| | | | | | | | |
| Security | | Shares | | | Value | |
| | |
| United States (continued) | | | | | | |
Illumina, Inc.(d) | | | 13,328 | | | $ | 3,901,106 | |
Incyte Corp.(d) | | | 3,262 | | | | 282,620 | |
Inphi Corp.(d) | | | 13,731 | | | | 1,919,045 | |
Insulet Corp.(d) | | | 16,101 | | | | 3,578,447 | |
Intel Corp. | | | 42,336 | | | | 1,874,638 | |
International Flavors & Fragrances, Inc.(g) | | | 689,052 | | | | 70,738,078 | |
International Paper Co. | | | 6,613 | | | | 289,319 | |
Intuit, Inc. | | | 4,327 | | | | 1,361,620 | |
Intuitive Surgical, Inc.(d) | | | 43,497 | | | | 29,015,979 | |
Iovance Biotherapeutics, Inc.(d) | | | 86,575 | | | | 3,088,996 | |
IQVIA Holdings, Inc.(d) | | | 9,611 | | | | 1,479,998 | |
JBS SA | | | 177,080 | | | | 600,250 | |
Johnson & Johnson | | | 1,485,655 | | | | 203,698,157 | |
JPMorgan Chase & Co. | | | 2,167,234 | | | | 212,475,621 | |
Kinder Morgan, Inc. | | | 63,125 | | | | 751,187 | |
Kraft Heinz Co. | | | 6,014 | | | | 183,968 | |
Kroger Co. | | | 18,130 | | | | 583,967 | |
L3Harris Technologies, Inc. | | | 1,055,785 | | | | 170,097,521 | |
Lam Research Corp. | | | 1,037 | | | | 354,737 | |
Las Vegas Sands Corp. | | | 146,580 | | | | 7,044,635 | |
Lennar Corp., Class A | | | 316,561 | | | | 22,232,079 | |
Liberty Broadband Corp., Class C(d) | | | 17,600 | | | | 2,494,096 | |
Liberty Media Corp. - Liberty SiriusXM,
Class A(d) | | | 757,137 | | | | 26,174,226 | |
Liberty Media Corp. - Liberty SiriusXM,
Class C(d) | | | 1,178,782 | | | | 40,785,857 | |
Live Nation Entertainment, Inc.(d)(g) | | | 74,606 | | | | 3,640,773 | |
Lookout, Inc., (Acquired 03/04/15, Cost: $2,002,652)(c)(f) | | | 175,316 | | | | 902,877 | |
Lowe’s Cos., Inc. | | | 959,489 | | | | 151,695,211 | |
Madison Square Garden Sports Corp.(d) | | | 2,352 | | | | 333,137 | |
Marsh & McLennan Cos., Inc. | | | 1,043,046 | | | | 107,913,539 | |
Marvell Technology Group Ltd. | | | 475,080 | | | | 17,820,251 | |
Masco Corp. | | | 341,796 | | | | 18,320,266 | |
Mastercard, Inc., Class A | | | 611,317 | | | | 176,450,539 | |
McDonald’s Corp. | | | 566,636 | | | | 120,693,468 | |
Medtronic PLC | | | 18,298 | | | | 1,840,230 | |
Merck & Co., Inc. | | | 1,447,939 | | | | 108,899,492 | |
MGM Resorts International | | | 85,836 | | | | 1,765,647 | |
Microchip Technology, Inc. | | | 521,528 | | | | 54,802,162 | |
Micron Technology, Inc.(d) | | | 1,171,226 | | | | 58,959,517 | |
Microsoft Corp.(i) | | | 2,223,576 | | | | 450,207,433 | |
Mondelez International, Inc., Class A | | | 213,865 | | | | 11,360,509 | |
MongoDB, Inc.(d) | | | 31,797 | | | | 7,264,661 | |
Moody’s Corp. | | | 1,754 | | | | 461,127 | |
Morgan Stanley | | | 3,299,248 | | | | 158,858,791 | |
MSCI, Inc. | | | 759 | | | | 265,529 | |
Netflix, Inc.(d) | | | 1,261 | | | | 599,908 | |
Nevro Corp.(d) | | | 24,265 | | | | 3,620,581 | |
New Relic, Inc.(d) | | | 81,923 | | | | 4,969,449 | |
Newmont Corp. | | | 308,025 | | | | 19,356,291 | |
NextEra Energy, Inc. | | | 2,758,152 | | | | 201,924,308 | |
Northrop Grumman Corp. | | | 11,990 | | | | 3,474,942 | |
NortonLifeLock, Inc. | | | 360,286 | | | | 7,411,083 | |
NVIDIA Corp. | | | 229,875 | | | | 115,250,130 | |
Okta, Inc.(d) | | | 75,596 | | | | 15,862,309 | |
Oracle Corp. | | | 25,207 | | | | 1,414,365 | |
Otis Worldwide Corp. | | | 26,430 | | | | 1,619,630 | |
Palantir Technologies, Inc., Class A(d)(g) | | | 1,415,821 | | | | 14,342,267 | |
Palantir Technologies, Inc. (Acquired , Cost: | | | | | | | | |
$46,997,981)(f) | | | 7,666,881 | | | | 74,429,444 | |
Palo Alto Networks, Inc.(d) | | | 70,061 | | | | 15,496,793 | |
Paycom Software, Inc.(d) | | | 25,218 | | | | 9,181,622 | |
| | |
| 16 | | 2020 BLACKROCK ANNUAL REPORTTO SHAREHOLDERS |
| | |
Consolidated Schedule of Investments (continued) October 31, 2020 | | BlackRock Global Allocation Fund, Inc. (Percentages shown are based on Net Assets) |
| | | | | | | | |
| Security | | Shares | | | Value | |
| | |
| United States (continued) | | | | | | |
PayPal Holdings, Inc.(d) | | | 483,101 | | | $ | 89,919,589 | |
Peloton Interactive, Inc., Class A(d) | | | 673,770 | | | | 74,256,192 | |
PepsiCo, Inc. | | | 117,348 | | | | 15,641,315 | |
Pfizer, Inc. | | | 1,777,115 | | | | 63,052,040 | |
PPG Industries, Inc. | | | 979,997 | | | | 127,125,211 | |
Procter & Gamble Co. | | | 7,065 | | | | 968,611 | |
Proofpoint, Inc.(d) | | | 50,352 | | | | 4,820,700 | |
Prudential Financial, Inc. | | | 10,119 | | | | 647,818 | |
PTC Therapeutics, Inc.(d)(g) | | | 43,411 | | | | 2,265,620 | |
PTC, Inc.(d) | | | 1,459,310 | | | | 122,406,923 | |
QUALCOMM, Inc. | | | 193,907 | | | | 23,920,368 | |
Raytheon Technologies Corp. | | | 1,397,504 | | | | 75,912,417 | |
Regeneron Pharmaceuticals, Inc.(d) | | | 504 | | | | 273,954 | |
ResMed, Inc. | | | 48,372 | | | | 9,284,522 | |
Rockwell Automation, Inc. | | | 3,429 | | | | 813,084 | |
salesforce.com, Inc.(d) | | | 604,672 | | | | 140,447,165 | |
Sarepta Therapeutics, Inc.(d) | | | 38,349 | | | | 5,212,013 | |
Schlumberger NV | | | 31,945 | | | | 477,258 | |
Seagen, Inc.(d)(g) | | | 56,578 | | | | 9,437,210 | |
Sempra Energy | | | 4,764 | | | | 597,215 | |
Sensata Technologies Holding PLC(d) | | | 27,514 | | | | 1,202,637 | |
ServiceNow, Inc.(d) | | | 115,589 | | | | 57,513,619 | |
Sherwin-Williams Co. | | | 1,009 | | | | 694,172 | |
Simply Good Foods Co.(d) | | | 300,085 | | | | 5,641,598 | |
Snowflake, Inc., Class A(d) | | | 1,659 | | | | 414,783 | |
Social Capital Hedosophia Holdings(c)(j) | | | 1,867,775 | | | | 19 | |
Southern Co. | | | 1,933 | | | | 111,051 | |
Southwest Airlines Co. | | | 611,648 | | | | 24,178,445 | |
Splunk, Inc.(d) | | | 101,712 | | | | 20,143,044 | |
Stanley Black & Decker, Inc. | | | 5,464 | | | | 908,117 | |
Starbucks Corp. | | | 1,599,271 | | | | 139,072,606 | |
Stryker Corp. | | | 44,926 | | | | 9,075,501 | |
Target Corp. | | | 4,611 | | | | 701,886 | |
Tesla, Inc.(d) | | | 364 | | | | 141,247 | |
Thermo Fisher Scientific, Inc. | | | 225,122 | | | | 106,509,721 | |
TJX Cos., Inc. | | | 1,624,952 | | | | 82,547,562 | |
T-Mobile US, Inc.(d) | | | 105,566 | | | | 11,566,867 | |
Toll Brothers, Inc. | | | 178,161 | | | | 7,532,647 | |
TransDigm Group, Inc. | | | 42,640 | | | | 20,356,762 | |
Travelers Cos., Inc. | | | 94,385 | | | | 11,393,213 | |
Truist Financial Corp. | | | 325,813 | | | | 13,723,244 | |
Twilio, Inc., Class A(d) | | | 34,354 | | | | 9,583,735 | |
Tyson Foods, Inc., Class A | | | 11,355 | | | | 649,847 | |
U.S. Bancorp | | | 1,401,452 | | | | 54,586,555 | |
Uber Technologies, Inc.(d) | | | 1,838,657 | | | | 61,429,530 | |
Union Pacific Corp. | | | 1,056,947 | | | | 187,280,439 | |
United Parcel Service, Inc., Class B | | | 154,244 | | | | 24,233,275 | |
UnitedHealth Group, Inc. | | | 742,523 | | | | 226,573,468 | |
Vail Resorts, Inc. | | | 2,245 | | | | 520,930 | |
Valero Energy Corp. | | | 650,744 | | | | 25,125,226 | |
VeriSign, Inc.(d) | | | 4,483 | | | | 854,908 | |
Verizon Communications, Inc. | | | 189,527 | | | | 10,801,144 | |
Vertex Pharmaceuticals, Inc.(d) | | | 170,811 | | | | 35,590,180 | |
Vertiv Holdings Co., (Acquired 02/04/20, Cost: $51,266,950)(f) | | | 5,126,695 | | | | 90,486,167 | |
Visa, Inc., Class A | | | 143,554 | | | | 26,085,197 | |
Vistra Corp. | | | 360,831 | | | | 6,267,634 | |
VMware, Inc., Class A(d) | | | 485,399 | | | | 62,485,413 | |
Vontier Corp.(d) | | | 569,605 | | | | 16,370,448 | |
Walmart, Inc. | | | 856,481 | | | | 118,836,739 | |
| | | | | | | | | | | | |
| Security | | | | | Shares | | | Value | |
| | | |
| United States (continued) | | | | | | | | | |
Walt Disney Co. | | | | | | | 620,331 | | | $ | 75,215,134 | |
Western Digital Corp. | | | | | | | 229,394 | | | | 8,655,036 | |
Weyerhaeuser Co. | | | | | | | 324,531 | | | | 8,856,451 | |
Williams Cos., Inc. | | | | | | | 9,757 | | | | 187,237 | |
Willis Towers Watson PLC | | | | | | | 534 | | | | 97,444 | |
Workday, Inc., Class A(d) | | | | | | | 37,558 | | | | 7,891,687 | |
Wynn Resorts Ltd. | | | | | | | 316,957 | | | | 22,957,196 | |
Xilinx, Inc. | | | | | | | 275,728 | | | | 32,726,156 | |
Yum! Brands, Inc. | | | | | | | 6,320 | | | | 589,846 | |
Zillow Group, Inc., Class C(d) | | | | | | | 123,438 | | | | 10,939,076 | |
Zimmer Biomet Holdings, Inc. | | | | | | | 704 | | | | 92,998 | |
Zoetis, Inc. | | | | | | | 87,132 | | | | 13,814,779 | |
Zoom Video Communications, Inc., Class A(d) | | | | | | | 956 | | | | 440,630 | |
Zscaler, Inc.(d)(g) | | | | | | | 110,671 | | | | 15,023,588 | |
| | | | | | | | |
| | | | | | | | | | | 9,309,577,097 | |
| | | |
| Zambia — 0.1% | | | | | | | | | |
First Quantum Minerals Ltd. | | | | | | | 1,753,320 | | | | 20,148,112 | |
| | | | | | | | |
| | | |
Total Common Stocks — 63.7%
(Cost: $10,500,756,728) | | | | | | | | | | | 14,254,714,768 | |
| | | | | | | | |
| | | |
| | | | | | Par (000) | | | | |
| | | |
Corporate Bonds | | | | | | | | | | | | |
| | | |
Australia(b) — 0.7% | | | | | | | | | | | | |
FMG Resources August 2006 Pty Ltd. | | | | | | | | | | | | |
4.75%, 05/15/22 | | | USD | | | | 407 | | | | 416,483 | |
5.13%, 03/15/23 | | | | | | | 277 | | | | 289,119 | |
5.13%, 05/15/24 | | | | | | | 419 | | | | 448,282 | |
Quintis Australia Pty. Ltd.(c)(e)(k) | | | | | | | | | | | | |
(0.00% Cash), 12.00%, 10/01/28 | | | | | | | 82,684 | | | | 82,684,528 | |
(7.50% Cash or 8.00% PIK),
7.50%, 10/01/26 | | | | | | | 82,134 | | | | 82,133,651 | |
| | | | | | | | |
| | | | | | | | | | | 165,972,063 | |
| | | |
| Brazil — 0.1% | | | | | | | | | |
Itau Unibanco Holding SA/Cayman Island, 3.25%, 01/24/25 | | | | | | | 2,738 | | | | 2,779,070 | |
Petrobras Global Finance BV | | | | | | | | | | | | |
5.30%, 01/27/25 | | | | | | | 2,645 | | | | 2,940,909 | |
5.60%, 01/03/31 | | | | | | | 5,355 | | | | 5,759,838 | |
| | | | | | | | |
| | | | | | | | | | | 11,479,817 | |
| | | |
| Canada — 0.1% | | | | | | | | | |
1011778 BC ULC/New Red Finance, Inc.(b) | | | | | | | | | | | | |
5.00%, 10/15/25 | | | | | | | 673 | | | | 690,094 | |
4.00%, 10/15/30 | | | | | | | 4,347 | | | | 4,319,831 | |
Brookfield Residential Properties, Inc./Brookfield Residential U.S. Corp., 6.25%, 09/15/27(b) | | | | | | | 341 | | | | 349,423 | |
First Quantum Minerals Ltd.,
6.88%, 10/15/27(b) | | | | | | | 4,329 | | | | 4,323,589 | |
Hudbay Minerals, Inc.,
6.13%, 04/01/29(b) | | | | | | | 923 | | | | 943,767 | |
Mattamy Group Corp.,
4.63%, 03/01/30(b) | | | | | | | 4,653 | | | | 4,722,795 | |
MEGlobal Canada ULC,
5.88%, 05/18/30 | | | | | | | 2,531 | | | | 3,000,026 | |
| | | | | | | | |
| | | | | | | | | | | 18,349,525 | |
| | | |
| Cayman Islands — 0.0% | | | | | | | | | |
Fibria Overseas Finance, Ltd.,
5.50%, 01/17/27 | | | | | | | 2,790 | | | | 3,154,444 | |
MGM China Holdings Ltd.(b)
5.38%, 05/15/24 | | | | | | | 409 | | | | 418,024 | |
| | |
CONSOLIDATED SCHEDULE OF INVESTMENTS | | 17 |
| | |
Consolidated Schedule of Investments (continued) October 31, 2020 | | BlackRock Global Allocation Fund, Inc. (Percentages shown are based on Net Assets) |
| | | | | | | | | | | | |
| Security | | | | | Par
(000) | | | Value | |
|
| Cayman Islands (continued) | |
MGM China Holdings Ltd.(b) (continued) 5.88%, 05/15/26 | | | USD | | | | 413 | | | $ | 417,646 | |
Wynn Macau Ltd., 4.88%, 10/01/24(b) | | | | | | | 324 | | | | 315,900 | |
| | | | | | | | | | | | |
| | | | | | | | | | | 4,306,014 | |
| | | |
| Chile — 0.1% | | | | | | | | | |
Corp. Nacional del Cobre de Chile,
4.25%, 07/17/42 | | | | | | | 5,401 | | | | 6,028,866 | |
Empresa Nacional del Petroleo, 4.50%, 09/14/47 | | | | 2,886 | | | | 3,069,983 | |
Falabella SA, 4.38%, 01/27/25 | | | | 2,633 | | | | 2,822,247 | |
| | | | | | | | | | | | |
| | | | | | | | | | | 11,921,096 | |
| | | |
| China — 0.0% | | | | | | | | | |
China Milk Products Group Ltd.,
0.00%, 01/15/49(d)(l) | | | | | | | 39,500 | | | | 39,500 | |
| | | | | | | | | | | | |
| | | |
| Colombia — 0.0% | | | | | | | | | |
Ecopetrol SA, 6.88%, 04/29/30 | | | | | | | 5,371 | | | | 6,455,942 | |
| | | | | | | | | | | | |
| | | |
| France — 0.1% | | | | | | | | | |
BNP Paribas SA, (5 year CMT + 2.05%), 2.59%, 08/12/35(a)(b) | | | | | | | 11,403 | | | | 10,980,603 | |
| | | | | | | | | | | | |
| | | |
| Germany(b) — 0.0% | | | | | | | | | |
Cheplapharm Arzneimittel GmbH | | | | | | | | | | | | |
4.38%, 01/15/28 | | | EUR | | | | 3,556 | | | | 4,100,081 | |
5.50%, 01/15/28 | | | USD | | | | 1,772 | | | | 1,794,522 | |
| | | | | | | | | | | | |
| | | | | | | | | | | 5,894,603 | |
| | | |
| Greece — 0.1% | | | | | | | | | |
Ellaktor Value PLC, 6.38%, 12/15/24(b) | | | EUR | | | | 16,171 | | | | 15,961,439 | |
| | | | | | | | | | | | |
| | | |
| India(d)(l) — 0.0% | | | | | | | | | |
REI Agro Ltd. | | | | | | | | | | | | |
5.50%, 11/13/21(b) | | | USD | | | | 44,430 | | | | 426,972 | |
5.50%, 11/13/21(c) | | | | | | | 8,271 | | | | 1 | |
| | | | | | | | | | | | |
| | | | | | | | | | | 426,973 | |
| | | |
| Indonesia — 0.0% | | | | | | | | | |
Pertamina Persero PT, 3.65%, 07/30/29 | | | | | | | 5,508 | | | | 5,929,706 | |
| | | | | | | | | | | | |
| | | |
| Israel — 0.0% | | | | | | | | | |
Leviathan Bond Ltd., 5.75%, 06/30/23(b) | | | | | | | 3,012 | | | | 3,072,598 | |
| | | | | | | | | | | | |
| | | |
| Italy — 0.0% | | | | | | | | | |
UniCredit SPA, (5 year CMT + 4.75%), 5.46%, 06/30/35(a)(b) | | | | | | | 5,921 | | | | 5,997,039 | |
| | | | | | | | | | | | |
| | | |
| Japan — 0.0% | | | | | | | | | |
Nissan Motor Co. Ltd., 4.35%, 09/17/27(b) | | | | | | | 3,208 | | | | 3,217,977 | |
Takeda Pharmaceutical Co. Ltd.,
3.18%, 07/09/50 | | | | | | | 3,705 | | | | 3,762,901 | |
| | | | | | | | | | | | |
| | | | | | | | | | | 6,980,878 | |
| | | |
| Luxembourg(b) — 0.2% | | | | | | | | | |
Garfunkelux Holdco 3 SA(j) | | | | | | | | | | | | |
6.75%, 11/01/25 | | | EUR | | | | 4,916 | | | | 5,610,912 | |
7.75%, 11/01/25 | | | GBP | | | | 8,358 | | | | 10,622,707 | |
Intelsat Jackson Holdings SA,
8.00%, 02/15/24 | | | USD | | | | 22,270 | | | | 22,604,050 | |
| | | | | | | | | | | | |
| | | | | | | | | | | 38,837,669 | |
| | | |
| Malaysia — 0.0% | | | | | | | | | |
Petronas Capital Ltd., 4.55%, 04/21/50(b) | | | | | | | 2,237 | | | | 2,791,027 | |
| | | | | | | | | | | | |
| | | | | | | | | | | | |
| Security | | | | | Par
(000) | | | Value | |
| | | |
| Mexico — 0.1% | | | | | | | | | |
Comision Federal de Electricidad,
4.75%, 02/23/27 | | | USD | | | | 5,288 | | | $ | 5,770,530 | |
Petroleos Mexicanos, 6.50%, 03/13/27 | | | | | | | 5,859 | | | | 5,408,589 | |
| | | | | | | | | | | | |
| | | | | | | | | | | 11,179,119 | |
| | | |
| MultiNational(b) — 0.0% | | | | | | | | | |
Delta Air Lines, Inc./SkyMiles IP Ltd.,
4.50%, 10/20/25 | | | | | | | 5,587 | | | | 5,670,504 | |
JBS USA LUX SA/JBS USA Food Co./JBS USA Finance, Inc., 6.50%, 04/15/29 | | | | | | | 832 | | | | 935,068 | |
| | | | | | | | | | | | |
| | | | | | | | | | | 6,605,572 | |
| | | |
| Netherlands(b) — 0.0% | | | | | | | | | |
NXP BV/NXP Funding LLC/NXP USA, Inc. | | | | | | | | | | | | |
2.70%, 05/01/25 | | | | | | | 390 | | | | 414,430 | |
3.15%, 05/01/27 | | | | | | | 930 | | | | 1,006,786 | |
3.40%, 05/01/30 | | | | | | | 625 | | | | 686,430 | |
| | | | | | | | | | | | |
| | | | | | | | | | | 2,107,646 | |
| | | |
| Peru — 0.0% | | | | | | | | | |
Orazul Energy Egenor SCA,
5.63%, 04/28/27 | | | | | | | 2,960 | | | | 3,054,350 | |
| | | | | | | | | | | | |
| | | |
| Saudi Arabia — 0.0% | | | | | | | | | |
Saudi Arabian Oil Co., 4.25%, 04/16/39 | | | | | | | 2,980 | | | | 3,371,125 | |
| | | | | | | | | | | | |
| | | |
| Singapore — 0.1% | | | | | | | | | |
CapitaLand Ltd., 1.95%, 10/17/23(b)(m) | | | SGD | | | | 15,000 | | | | 10,813,244 | |
| | | | | | | | | | | | |
| | | |
| South Korea — 0.0% | | | | | | | | | |
Clark Equipment Co., 5.88%, 06/01/25(b) | | | USD | | | | 1,684 | | | | 1,751,360 | |
| | | | | | | | | | | | |
| | | |
| Spain — 0.0% | | | | | | | | | |
Banco Santander SA | | | | | | | | | | | | |
2.75%, 05/28/25 | | | | | | | 2,800 | | | | 2,951,937 | |
3.49%, 05/28/30 | | | | | | | 1,000 | | | | 1,080,425 | |
| | | | | | | | | | | | |
| | | | | | | | | | | 4,032,362 | |
| | | |
| Switzerland — 0.1% | | | | | | | | | |
UBS Group AG, 4.13%, 09/24/25(b) | | | | | | | 8,816 | | | | 10,020,893 | |
| | | | | | | | | | | | |
| | | |
| Turkey — 0.1% | | | | | | | | | |
Bio City Development Co. BV,
8.00%, 07/06/21(b)(c)(d)(e)(l)(m) | | | | | | | 140,850 | | | | 13,732,875 | |
| | | | | | | | | | | | |
| | | |
| United Arab Emirates — 0.0% | | | | | | | | | |
DP World Ltd., 6.85%, 07/02/37 | | | | | | | 2,210 | | | | 2,768,715 | |
MDGH - GMTN BV, 3.70%, 11/07/49(b) | | | | | | | 2,700 | | | | 2,964,094 | |
| | | | | | | | | | | | |
| | | | | | | | | | | 5,732,809 | |
| | | |
| United Kingdom — 0.1% | | | | | | | | | |
Algeco Global Finance PLC,
6.50%, 02/15/23 | | | EUR | | | | 21,816 | | | | 25,115,814 | |
Natwest Group PLC, (5 year CMT + 2.35%), 3.03%, 11/28/35(a) | | | USD | | | | 6,153 | | | | 5,967,918 | |
| | | | | | | | | | | | |
| | | | | | | | | | | 31,083,732 | |
| | | |
| United States — 5.2% | | | | | | | | | |
AbbVie, Inc., 4.25%, 11/21/49(b) | | | | | | | 6,290 | | | | 7,346,136 | |
Acadia Healthcare Co., Inc.(b) | | | | | | | | | | | | |
5.50%, 07/01/28 | | | | | | | 2,832 | | | | 2,945,280 | |
5.00%, 04/15/29 | | | | | | | 702 | | | | 723,271 | |
Albertsons Cos., Inc./Safeway, Inc./New Albertsons LP/Albertsons LLC | | | | | | | | | | | | |
3.50%, 02/15/23(b) | | | | | | | 433 | | | | 439,884 | |
5.75%, 03/15/25 | | | | | | | 1,590 | | | | 1,638,694 | |
7.50%, 03/15/26(b) | | | | | | | 357 | | | | 395,556 | |
Allegaint Travel Co., 8.50%, 02/05/24(b) | | | | | | | 19,212 | | | | 19,115,940 | |
| | |
| 18 | | 2020 BLACKROCK ANNUAL REPORTTO SHAREHOLDERS |
| | |
Consolidated Schedule of Investments (continued) October 31, 2020 | | BlackRock Global Allocation Fund, Inc. (Percentages shown are based on Net Assets) |
| | | | | | | | | | | | |
| Security | | | | | Par
(000) | | | Value | |
| | | |
| United States (continued) | | | | | | | | | |
Ally Financial, Inc., 1.45%, 10/02/23 | | | USD | | | | 3,058 | | | $ | 3,084,011 | |
AMC Networks, Inc. | | | | | | | | | | | | |
5.00%, 04/01/24 | | | | | | | 541 | | | | 543,537 | |
4.75%, 08/01/25 | | | | | | | 429 | | | | 427,928 | |
American Tower Corp., 3.10%, 06/15/50 | | | | | | | 9,575 | | | | 9,369,443 | |
AMN Healthcare Inc. Co., 4.00%, 04/15/29(b) | | | | | | | 855 | | | | 851,794 | |
Aramark Services, Inc. | | | | | | | | | | | | |
4.75%, 06/01/26 | | | | | | | 273 | | | | 271,294 | |
5.00%, 02/01/28(b) | | | | | | | 637 | | | | 642,644 | |
AutoNation, Inc., 4.75%, 06/01/30 | | | | | | | 2,972 | | | | 3,485,271 | |
Avantor Funding, Inc., 4.63%, 07/15/28(b) | | | | | | | 3,631 | | | | 3,762,442 | |
Avantor, Inc., 6.00%, 10/01/24(b) | | | | | | | 844 | | | | 881,896 | |
Ball Corp., 2.88%, 08/15/30 | | | | | | | 3,154 | | | | 3,118,517 | |
Bank of America Corp. 4.00%, 01/22/25 | | | | | | | 7,325 | | | | 8,144,073 | |
(Secured Overnight Financing Rate + 2.15%), 2.59%, 04/29/31(a) | | | | | | | 18,790 | | | | 19,621,046 | |
Bausch Health Cos., Inc.(b) | | | | | | | | | | | | |
5.50%, 11/01/25 | | | | | | | 746 | | | | 766,366 | |
5.75%, 08/15/27 | | | | | | | 222 | | | | 238,095 | |
6.25%, 02/15/29 | | | | | | | 2,290 | | | | 2,359,982 | |
Becton Dickinson and Co. | | | | | | | | | | | | |
2.82%, 05/20/30 | | | | | | | 1,809 | | | | 1,933,401 | |
3.79%, 05/20/50 | | | | | | | 2,312 | | | | 2,575,667 | |
Boise Cascade Co., 4.88%, 07/01/30(b) | | | | | | | 769 | | | | 822,003 | |
Boyd Gaming Corp., 8.63%, 06/01/25(b) | | | | | | | 1,435 | | | | 1,570,894 | |
BP Capital Markets America, Inc.,
1.75%, 08/10/30 | | | | | | | 1,770 | | | | 1,726,304 | |
Broadcom, Inc. | | | | | | | | | | | | |
4.11%, 09/15/28 | | | | | | | 1,648 | | | | 1,835,475 | |
4.15%, 11/15/30 | | | | | | | 4,366 | | | | 4,891,119 | |
Buckeye Partners LP | | | | | | | | | | | | |
4.35%, 10/15/24 | | | | | | | 1,170 | | | | 1,134,900 | |
4.13%, 03/01/25(b) | | | | | | | 5,777 | | | | 5,473,707 | |
BY Crown Parent LLC/BY Bond Finance, Inc., 4.25%, 01/31/26(b) | | | | | | | 1,146 | | | | 1,160,325 | |
Caesars Entertainment, Inc.(b) | | | | | | | | | | | | |
6.25%, 07/01/25 | | | | | | | 21,047 | | | | 21,559,875 | |
8.13%, 07/01/27 | | | | | | | 7,996 | | | | 8,345,385 | |
Caesars Resort Collection LLC/CRC Finco, Inc., 5.75%, 07/01/25(b) | | | | | | | 3,012 | | | | 3,089,198 | |
Calpine Corp., 5.13%, 03/15/28(b) | | | | | | | 1,301 | | | | 1,341,468 | |
Carrier Global Corp., 3.58%, 04/05/50(b) | | | | | | | 4,325 | | | | 4,670,280 | |
Cedar Fair LP, 5.25%, 07/15/29 | | | | | | | 275 | | | | 249,563 | |
Cedar Fair LP/Canada’s Wonderland Co./Magnum Management Corp./Millennium Op, 5.38%, 04/15/27 | | | | | | | 280 | | | | 259,350 | |
Centene Corp. | | | | | | | | | | | | |
4.75%, 01/15/25 | | | | | | | 7,855 | | | | 8,071,012 | |
5.38%, 06/01/26(b) | | | | | | | 8,790 | | | | 9,248,926 | |
5.38%, 08/15/26(b) | | | | | | | 413 | | | | 436,748 | |
4.25%, 12/15/27 | | | | | | | 1,367 | | | | 1,439,041 | |
3.00%, 10/15/30 | | | | | | | 9,860 | | | | 10,239,147 | |
Charles River Laboratories International, Inc., 5.50%, 04/01/26(b) | | | | | | | 283 | | | | 295,735 | |
Charter Communications Operating LLC/Charter Communications Operating Capital, 2.80%, 04/01/31 | | | | | | | 15,705 | | | | 16,232,936 | |
Cheniere Energy Partners LP | | | | | | | | | | | | |
5.63%, 10/01/26 | | | | | | | 612 | | | | 628,279 | |
5.25%, 10/01/25 | | | | | | | 2,115 | | | | 2,151,378 | |
| | | | | | | | | | | | |
| Security | | | | | Par
(000) | | | Value | |
| | | |
| United States (continued) | | | | | | | | | |
Cheniere Energy, Inc., 4.63%, 10/15/28(b) | | | USD | | | | 3,988 | | | $ | 4,117,610 | |
Chobani LLC/Chobani Finance Corp., Inc., 4.63%, 11/15/28(b) | | | | | | | 983 | | | | 986,244 | |
CHS/Community Health Systems, Inc., 8.00%, 03/15/26(b) | | | | | | | 3,037 | | | | 3,049,148 | |
Churchill Downs, Inc., 5.50%, 04/01/27(b) | | | | | | | 333 | | | | 344,863 | |
Citigroup, Inc., (Secured Overnight Financing Rate + 3.91%), 4.41%, 03/31/31(a) | | | | | | | 6,463 | | | | 7,673,848 | |
Clean Harbors, Inc., 4.88%, 07/15/27(b) | | | | | | | 294 | | | | 307,230 | |
Colfax Corp., 6.00%, 02/15/24(b) | | | | | | | 339 | | | | 352,631 | |
CommScope, Inc., 7.13%, 07/01/28(b) | | | | | | | 3,109 | | | | 3,126,255 | |
Crown Castle International Corp.,
4.15%, 07/01/50 | | | | | | | 10,007 | | | | 11,451,191 | |
CrownRock LP/CrownRock Finance, Inc., 5.63%, 10/15/25(b) | | | | | | | 631 | | | | 620,513 | |
CSC Holdings LLC(b) | | | | | | | | | | | | |
5.50%, 05/15/26 | | | | | | | 3,763 | | | | 3,915,401 | |
5.38%, 02/01/28 | | | | | | | 1,324 | | | | 1,406,750 | |
4.13%, 12/01/30 | | | | | | | 9,915 | | | | 10,081,374 | |
4.63%, 12/01/30 | | | | | | | 18,890 | | | | 18,889,622 | |
3.38%, 02/15/31 | | | | | | | 3,518 | | | | 3,383,472 | |
CVS Health Corp. | | | | | | | | | | | | |
3.75%, 04/01/30 | | | | | | | 6,395 | | | | 7,251,050 | |
2.70%, 08/21/40 | | | | | | | 3,717 | | | | 3,548,629 | |
5.05%, 03/25/48 | | | | | | | 6,370 | | | | 8,078,955 | |
Darling Ingredients, Inc., 5.25%, 04/15/27(b) | | | | | | | 280 | | | | 296,800 | |
DaVita, Inc.(b) | | | | | | | | | | | | |
4.63%, 06/01/30 | | | | | | | 13,941 | | | | 14,180,018 | |
3.75%, 02/15/31 | | | | | | | 31,583 | | | | 30,359,159 | |
Dow Chemical Co. (The), 3.63%, 05/15/26 | | | | | | | 2,907 | | | | 3,242,635 | |
Elanco Animal Health, Inc. | | | | | | | | | | | | |
4.91%, 08/27/21 | | | | | | | 272 | | | | 278,120 | |
5.27%, 08/28/23 | | | | | | | 421 | | | | 455,118 | |
Emergent BioSolutions, Inc.,
3.88%, 08/15/28(b) | | | | | | | 399 | | | | 400,995 | |
Endeavor Energy Resources LP/EER Finance, Inc.(b) | | | | | | | | | | | | |
5.50%, 01/30/26 | | | | | | | 270 | | | | 271,350 | |
5.75%, 01/30/28 | | | | | | | 553 | | | | 573,738 | |
Energizer Holdings, Inc.(b) | | | | | | | | | | | | |
4.75%, 06/15/28 | | | | | | | 2,066 | | | | 2,126,162 | |
4.38%, 03/31/29 | | | | | | | 768 | | | | 775,296 | |
Energy Transfer Operating LP,
4.05%, 03/15/25 | | | | | | | 4,186 | | | | 4,403,942 | |
ERAC USA Finance LLC, 3.80%, 11/01/25(b) | | | | | | | 6,493 | | | | 7,221,128 | |
ESH Hospitality, Inc., 5.25%, 05/01/25(b) | | | | | | | 703 | | | | 703,000 | |
Exxon Mobil Corp., 3.45%, 04/15/51 | | | | | | | 7,310 | | | | 7,658,107 | |
Ferguson Finance PLC, 3.25%, 06/02/30(b) | | | | | | | 6,260 | | | | 6,796,631 | |
FLIR Systems, Inc., 2.50%, 08/01/30 | | | | | | | 6,260 | | | | 6,449,415 | |
Flowserve Corp., 3.50%, 10/01/30 | | | | | | | 6,801 | | | | 6,774,816 | |
Ford Motor Credit Co. LLC | | | | | | | | | | | | |
5.13%, 06/16/25 | | | | | | | 2,435 | | | | 2,537,976 | |
4.13%, 08/17/27 | | | | | | | 4,157 | | | | 4,094,645 | |
Forestar Group, Inc.(b) | | | | | | | | | | | | |
8.00%, 04/15/24 | | | | | | | 3,097 | | | | 3,220,880 | |
5.00%, 03/01/28 | | | | | | | 9,970 | | | | 9,897,418 | |
Freeport-McMoRan, Inc. | | | | | | | | | | | | |
5.00%, 09/01/27 | | | | | | | 1,301 | | | | 1,356,553 | |
4.63%, 08/01/30 | | | | | | | 2,298 | | | | 2,453,115 | |
Fresh Market Inc. (The), 9.75%, 05/01/23(b) | | | | | | | 3,262 | | | | 3,121,343 | |
Frontier Communications Corp.,
5.88%, 10/15/27(b). | | | | | | | 4,579 | | | | 4,693,017 | |
GCI LLC, 4.75%, 10/15/28(b) | | | | | | | 1,436 | | | | 1,482,239 | |
General Electric Co., 4.35%, 05/01/50 | | | | | | | 2,535 | | | | 2,700,764 | |
| | |
CONSOLIDATED SCHEDULE OF INVESTMENTS | | 19 |
| | |
Consolidated Schedule of Investments (continued) October 31, 2020 | | BlackRock Global Allocation Fund, Inc. (Percentages shown are based on Net Assets) |
| | | | | | | | | | | | |
| Security | | | | | Par
(000) | | | Value | |
| | | |
| United States (continued) | | | | | | | | | |
General Motors Co., 6.80%, 10/01/27 | | | USD | | | | 4,564 | | | $ | 5,602,865 | |
General Motors Financial Co., Inc. | | | | | | | | | | | | |
5.20%, 03/20/23 | | | | | | | 4,320 | | | | 4,687,717 | |
2.70%, 08/20/27 | | | | | | | 8,499 | | | | 8,578,041 | |
3.60%, 06/21/30 | | | | | | | 6,274 | | | | 6,600,377 | |
Global Payments, Inc., 2.90%, 05/15/30 | | | | | | | 6,625 | | | | 7,043,307 | |
GLP Capital LP/GLP Financing II, Inc., 4.00%, 01/15/31 | | | | | | | 8,619 | | | | 9,011,682 | |
Goldman Sachs Group, Inc. | | | | | | | | | | | | |
2.60%, 02/07/30 | | | | | | | 6,502 | | | | 6,865,117 | |
4.75%, 10/21/45 | | | | | | | 1,500 | | | | 1,973,814 | |
Graham Packaging Co., Inc.,
7.13%, 08/15/28(b) | | | | | | | 592 | | | | 618,640 | |
Great Western Petroleum LLC/Great Western Finance Corp.,
9.00%, 09/30/21(b) | | | | | | | 3,464 | | | | 1,905,200 | |
H&E Equipment Services, Inc.,
5.63%, 09/01/25 | | | | | | | 528 | | | | 547,800 | |
Hanesbrands, Inc., 4.63%, 05/15/24(b) | | | | | | | 495 | | | | 515,567 | |
HCA, Inc. | | | | | | | | | | | | |
3.50%, 09/01/30 | | | | | | | 19,298 | | | | 19,733,934 | |
5.25%, 06/15/49 | | | | | | | 4,335 | | | | 5,277,720 | |
HD Supply, Inc., 5.38%, 10/15/26(b) | | | | | | | 421 | | | | 440,383 | |
Hilton Domestic Operating Co., Inc.,
5.13%, 05/01/26 | | | | | | | 825 | | | | 835,312 | |
Hilton Worldwide Finance LLC/Hilton Worldwide Finance Corp. | | | | | | | | | | | | |
4.63%, 04/01/25 | | | | | | | 486 | | | | 490,500 | |
4.88%, 04/01/27 | | | | | | | 332 | | | | 335,860 | |
Hologic, Inc., 3.25%, 02/15/29(b) | | | | | | | 8,571 | | | | 8,613,855 | |
Host Hotels & Resorts LP, Series I,
3.50%, 09/15/30 | | | | | | | 8,815 | | | | 8,418,283 | |
Howard Hughes Corp.(b) | | | | | | | | | | | | |
5.38%, 03/15/25 | | | | | | | 2,390 | | | | 2,392,987 | |
5.38%, 08/01/28 | | | | | | | 7,158 | | | | 7,229,580 | |
Hughes Satellite Systems Corp.,
7.63%, 06/15/21 | | | | | | | 2,510 | | | | 2,579,025 | |
iHeartCommunications, Inc. | | | | | | | | | | | | |
6.38%, 05/01/26 | | | | | | | 16,744 | | | | 17,434,381 | |
8.38%, 05/01/27 | | | | | | | 5,522 | | | | 5,358,010 | |
5.25%, 08/15/27(b) | | | | | | | 2,581 | | | | 2,547,602 | |
4.75%, 01/15/28(b) | | | | | | | 2,164 | | | | 2,066,620 | |
International Business Machines Corp. | | | | | | | | | | | | |
1.95%, 05/15/30 | | | | | | | 10,302 | | | | 10,464,059 | |
2.95%, 05/15/50 | | | | | | | 3,055 | | | | 3,070,840 | |
International Game Technology PLC(b) | | | | | | | | | | | | |
6.25%, 02/15/22 | | | | | | | 483 | | | | 494,474 | |
6.50%, 02/15/25 | | | | | | | 659 | | | | 705,130 | |
IQVIA, Inc.(b) | | | | | | | | | | | | |
5.00%, 10/15/26 | | | | | | | 581 | | | | 602,146 | |
5.00%, 05/15/27 | | | | | | | 613 | | | | 642,118 | |
Iron Mountain, Inc.(b) | | | | | | | | | | | | |
5.25%, 07/15/30 | | | | | | | 10,309 | | | | 10,579,611 | |
4.50%, 02/15/31 | | | | | | | 10,376 | | | | 10,330,034 | |
Jaguar Holding Co. II/PPD Development LP, 5.00%, 06/15/28(b) | | | | | | | 715 | | | | 745,252 | |
JBS Investments II GmbH(b) | | | | | | | | | | | | |
7.00%, 01/15/26 | | | | | | | 564 | | | | 602,578 | |
5.75%, 01/15/28 | | | | | | | 414 | | | | 434,959 | |
JBS USA LUX SA/JBS USA Finance, Inc.(b) | | | | | | | | | | | | |
5.75%, 06/15/25 | | | | | | | 1,871 | | | | 1,917,775 | |
6.75%, 02/15/28 | | | | | | | 532 | | | | 582,959 | |
Joseph T Ryerson & Son, Inc.,
8.50%, 08/01/28(b) | | | | | | | 1,356 | | | | 1,453,022 | |
JPMorgan Chase & Co., (Secured Overnight Financing Rate + 2.44%),
3.11%, 04/22/51(a) | | | | | | | 8,340 | | | | 8,810,239 | |
| | | | | | | | | | | | |
| Security | | | | | Par
(000) | | | Value | |
| | | |
| United States (continued) | | | | | | | | | |
KFC Holding Co./Pizza Hut Holdings LLC/Taco Bell of America LLC,
5.25%, 06/01/26(b) | | | USD | | | | 1,301 | | | $ | 1,344,356 | |
Kronos Acquisition Holdings, Inc.,
9.00%, 08/15/23(b) | | | | | | | 6,495 | | | | 6,576,187 | |
L Brands, Inc. | | | | | | | | | | | | |
6.88%, 07/01/25(b) | | | | | | | 2,212 | | | | 2,371,220 | |
5.25%, 02/01/28 | | | | | | | 867 | | | | 853,995 | |
6.63%, 10/01/30(b) | | | | | | | 900 | | | | 945,000 | |
Lamar Media Corp. | | | | | | | | | | | | |
5.75%, 02/01/26 | | | | | | | 367 | | | | 379,735 | |
4.88%, 01/15/29 | | | | | | | 1,105 | | | | 1,149,200 | |
Lamb Weston Holdings, Inc.(b) | | | | | | | | | | | | |
4.63%, 11/01/24 | | | | | | | 458 | | | | 472,885 | |
4.88%, 11/01/26 | | | | | | | 461 | | | | 478,799 | |
LD Holdings Group LLC, 6.50%, 11/01/25(b) | | | | | | | 1,205 | | | | 1,223,075 | |
Lennar Corp. | | | | | | | | | | | | |
4.75%, 04/01/21 | | | | | | | 270 | | | | 272,363 | |
4.13%, 01/15/22 | | | | | | | 321 | | | | 328,624 | |
4.50%, 04/30/24 | | | | | | | 365 | | | | 393,333 | |
Level 3 Financing, Inc. | | | | | | | | | | | | |
5.25%, 03/15/26 | | | | | | | 425 | | | | 438,770 | |
4.63%, 09/15/27(b) | | | | | | | 1,256 | | | | 1,281,120 | |
4.25%, 07/01/28(b) | | | | | | | 17,778 | | | | 17,866,890 | |
3.63%, 01/15/29(b) | | | | | | | 9,979 | | | | 9,654,682 | |
Life Storage LP, 2.20%, 10/15/30 | | | | | | | 2,809 | | | | 2,802,423 | |
Marathon Petroleum Corp., 4.70%, 05/01/25 | | | | | | | 5,587 | | | | 6,181,434 | |
Marriott International, Inc. | | | | | | | | | | | | |
4.63%, 06/15/30 | | | | | | | 1,330 | | | | 1,419,200 | |
Series GG, 3.50%, 10/15/32 | | | | | | | 9,243 | | | | 9,122,309 | |
Marriott Ownership Resorts, Inc.,
6.13%, 09/15/25(b) | | | | | | | 7,471 | | | | 7,788,517 | |
Marriott Ownership Resorts, Inc./ILG LLC, 6.50%, 09/15/26 | | | | | | | 433 | | | | 445,990 | |
Masonite International Corp.,
5.38%, 02/01/28(b) | | | | | | | 714 | | | | 756,840 | |
Mauser Packaging Solutions Holding Co., 7.25%, 04/15/25(b) | | | | | | | 2,165 | | | | 2,088,575 | |
McDonald’s Corp. | | | | | | | | | | | | |
4.45%, 09/01/48 | | | | | | | 5,587 | | | | 6,945,558 | |
4.20%, 04/01/50 | | | | | | | 276 | | | | 334,366 | |
Meritor, Inc., 6.25%, 06/01/25(b) | | | | | | | 2,819 | | | | 2,945,855 | |
MGM Growth Properties Operating Partnership LP/MGP Finance
Co-Issuer, Inc. | | | | | | | | | | | | |
5.63%, 05/01/24 | | | | | | | 600 | | | | 631,620 | |
4.63%, 06/15/25(b) | | | | | | | 1,039 | | | | 1,058,180 | |
Michaels Stores, Inc., 8.00%, 07/15/27(b) | | | | | | | 3,822 | | | | 3,936,660 | |
Microchip Technology, Inc., 4.33%, 06/01/23 | | | | | | | 6,144 | | | | 6,621,450 | |
Molina Healthcare, Inc., 5.38%, 11/15/22 | | | | | | | 392 | | | | 407,345 | |
Morgan Stanley, (Secured Overnight Financing Rate + 3.12%),
3.62%, 04/01/31(a) | | | | | | | 9,972 | | | | 11,414,080 | |
Motorola Solutions, Inc., 2.30%, 11/15/30 | | | | | | | 8,154 | | | | 8,109,626 | |
MPT Operating Partnership LP/MPT Finance Corp., 5.00%, 10/15/27 | | | | | | | 778 | | | | 814,138 | |
Nationstar Mortgage Holdings, Inc.,
5.50%, 08/15/28(b) | | | | | | | 2,103 | | | | 2,097,742 | |
Netflix, Inc., 5.50%, 02/15/22 | | | | | | | 392 | | | | 411,845 | |
New Home Co., Inc., 7.25%, 10/15/25(b) | | | | | | | 2,594 | | | | 2,610,212 | |
Newell Brands, Inc., 4.35%, 04/01/23 | | | | | | | 762 | | | | 795,316 | |
Nexstar Broadcasting Inc., 4.75%, 11/01/28(b) | | | | | | | 3,259 | | | | 3,295,338 | |
NRG Energy, Inc. | | | | | | | | | | | | |
7.25%, 05/15/26 | | | | | | | 570 | | | | 602,484 | |
6.63%, 01/15/27 | | | | | | | 686 | | | | 722,015 | |
| | |
| 20 | | 2020 BLACKROCK ANNUAL REPORTTO SHAREHOLDERS |
| | |
Consolidated Schedule of Investments (continued) October 31, 2020 | | BlackRock Global Allocation Fund, Inc. (Percentages shown are based on Net Assets) |
| | | | | | | | | | | | |
| Security | | | | | Par
(000) | | | Value | |
| | | |
| United States (continued) | | | | | | | | | |
NRG Energy, Inc. (continued) | | | | | | | | | | | | |
5.75%, 01/15/28 | | | USD | | | | 461 | | | $ | 497,165 | |
5.25%, 06/15/29(b) | | | | | | | 413 | | | | 447,589 | |
NuStar Logistics LP, 5.75%, 10/01/25 | | | | | | | 8,282 | | | | 8,338,566 | |
Nutrition & Biosciences, Inc.,
3.47%, 12/01/50(b) | | | | | | | 7,469 | | | | 7,645,611 | |
NVIDIA Corp., 3.50%, 04/01/50 | | | | | | | 4,885 | | | | 5,672,754 | |
ONEOK Inc., 2.20%, 09/15/25 | | | | | | | 435 | | | | 428,142 | |
ONEOK Partners LP, 4.90%, 03/15/25 | | | | | | | 9,738 | | | | 10,632,307 | |
ONEOK, Inc., 2.75%, 09/01/24 | | | | | | | 5,682 | | | | 5,757,416 | |
Oracle Corp., 3.60%, 04/01/40 | | | | | | | 18,804 | | | | 20,975,354 | |
Outfront Media Capital LLC/Outfront Media Capital Corp.(b) | | | | | | | | | | | | |
6.25%, 06/15/25 | | | | | | | 1,040 | | | | 1,061,450 | |
5.00%, 08/15/27 | | | | | | | 364 | | | | 344,894 | |
Park Intermediate Holdings LLC/PK Domestic Property LLC/PK Finance Co.Issuer, 5.88%, 10/01/28(b) | | | | | | | 1,083 | | | | 1,061,340 | |
Parsley Energy LLC/Parsley Finance
Corp.(b) | | | | | | | | | | | | |
5.38%, 01/15/25 | | | | | | | 3,360 | | | | 3,435,600 | |
5.25%, 08/15/25 | | | | | | | 7,000 | | | | 7,210,000 | |
5.63%, 10/15/27 | | | | | | | 390 | | | | 414,863 | |
PBF Holding Co. LLC/PBF Finance Corp., 9.25%, 05/15/25(b) | | | | | | | 6,823 | | | | 6,055,412 | |
PG&E Corp. | | | | | | | | | | | | |
5.00%, 07/01/28 | | | | | | | 6,251 | | | | 6,266,784 | |
5.25%, 07/01/30 | | | | | | | 1,069 | | | | 1,069,000 | |
Picasso Finance Sub, Inc.,
6.13%, 06/15/25(b) | | | | | | | 2,160 | | | | 2,277,936 | |
Pilgrim’s Pride Corp., 5.88%, 09/30/27(b) | | | | | | | 478 | | | | 504,950 | |
Pioneer Natural Resources Co.,
1.90%, 08/15/30 | | | | | | | 6,981 | | | | 6,534,356 | |
Prime Security Services Borrower LLC/Prime Finance, Inc.,
3.38%, 08/31/27(b) | | | | | | | 1,246 | | | | 1,202,390 | |
Prudential Financial, Inc., 3.70%, 03/13/51 | | | | | | | 6,964 | | | | 7,703,962 | |
QEP Resources, Inc., 5.25%, 05/01/23 | | | | | | | 2,600 | | | | 2,067,000 | |
Quicken Loans LLC/Quicken Loans Co-Issuer, Inc.(b) | | | | | | | | | | | | |
3.63%, 03/01/29 | | | | | | | 16,657 | | | | 16,407,145 | |
3.88%, 03/01/31 | | | | | | | 13,384 | | | | 13,166,510 | |
Quicken Loans, Inc., 5.25%, 01/15/28(b) | | | | | | | 2,720 | | | | 2,843,107 | |
Radiate Holdco LLC/Radiate Finance, Inc., 4.50%, 09/15/26(b) | | | | | | | 2,609 | | | | 2,616,175 | |
Regeneron Pharmaceuticals, Inc.,
2.80%, 09/15/50 | | | | | | | 4,989 | | | | 4,684,969 | |
Reliance Steel & Aluminum Co.,
2.15%, 08/15/30 | | | | | | | 2,119 | | | | 2,096,891 | |
Reynolds Group Issuer, Inc./Reynolds Group Issuer LLC/Reynolds Group Issuer Lu(b) | | | | | | | | | | | | |
5.13%, 07/15/23 | | | | | | | 107 | | | | 108,338 | |
4.00%, 10/15/27 | | | | | | | 778 | | | | 787,725 | |
SeaWorld Parks & Entertainment, Inc., 9.50%, 08/01/25(b) | | | | | | | 983 | | | | 1,032,150 | |
Select Medical Corp., 6.25%, 08/15/26(b) | | | | | | | 9,926 | | | | 10,471,930 | |
Sensata Technologies, Inc.,
3.75%, 02/15/31(b) | | | | | | | 520 | | | | 514,800 | |
Service Properties Trust | | | | | | | | | | | | |
5.00%, 08/15/22 | | | | | | | 11,857 | | | | 11,708,787 | |
4.50%, 06/15/23 | | | | | | | 8,652 | | | | 8,327,550 | |
7.50%, 09/15/25 | | | | | | | 1,395 | | | | 1,462,145 | |
Shea Homes LP/Shea Homes Funding Corp., 4.75%, 04/01/29(b) | | | | | | | 4,324 | | | | 4,388,860 | |
Shift4 Payments LLC/Shift4 Payments Finance Sub, Inc., 4.63%, 11/01/26(b) | | | | | | | 641 | | | | 649,205 | |
Sirius XM Radio, Inc.(b) | | | | | | | | | | | | |
3.88%, 08/01/22 | | | | | | | 540 | | | | 544,050 | |
4.63%, 07/15/24 | | | | | | | 762 | | | | 785,774 | |
| | | | | | | | | | | | |
| Security | | | | | Par
(000) | | | Value | |
| | | |
| United States (continued) | | | | | | | | | |
Sirius XM Radio, Inc.(b) (continued) | | | | | | | | | | | | |
5.38%, 07/15/26 | | | USD | | | | 553 | | | $ | 575,927 | |
5.00%, 08/01/27 | | | | | | | 836 | | | | 875,710 | |
5.50%, 07/01/29 | | | | | | | 702 | | | | 764,092 | |
4.13%, 07/01/30 | | | | | | | 9,086 | | | | 9,340,499 | |
Six Flags Entertainment Corp.,
4.88%, 07/31/24(b) | | | | | | | 543 | | | | 504,577 | |
SM Energy Co. | | | | | | | | | | | | |
1.50%, 07/01/21(m) | | | | | | | 6,032 | | | | 5,542,472 | |
10.00%, 01/15/25(b) | | | | | | | 5,648 | | | | 5,376,190 | |
Spectrum Brands, Inc., 5.50%, 07/15/30(b) | | | | | | | 1,012 | | | | 1,082,840 | |
Spirit Loyalty Cayman Ltd./Spirit IP Cayman Ltd., 8.00%, 09/20/25(b) | | | | | | | 2,013 | | | | 2,133,780 | |
Standard Industries, Inc.(b) | | | | | | | | | | | | |
5.00%, 02/15/27 | | | | | | | 257 | | | | 265,031 | |
4.38%, 07/15/30 | | | | | | | 1,657 | | | | 1,706,710 | |
3.38%, 01/15/31 | | | | | | | 986 | | | | 959,707 | |
Starbucks Corp., 3.50%, 11/15/50 | | | | | | | 6,502 | | | | 6,925,994 | |
Steel Dynamics, Inc., 3.25%, 01/15/31 | | | | | | | 835 | | | | 902,252 | |
Summit Materials LLC/Summit Materials Finance Corp., 5.25%, 01/15/29(b) | | | | | | | 890 | | | | 916,700 | |
Sunoco Logistics Partners Operations LP, 4.00%, 10/01/27 | | | | | | | 2,166 | | | | 2,215,112 | |
Sunoco LP/Sunoco Finance Corp. | | | | | | | | | | | | |
4.88%, 01/15/23 | | | | | | | 534 | | | | 538,005 | |
5.50%, 02/15/26 | | | | | | | 436 | | | | 436,818 | |
6.00%, 04/15/27 | | | | | | | 332 | | | | 343,192 | |
Talen Energy Supply LLC, 7.63%, 06/01/28(b) | | | | | | | 8,340 | | | | 8,162,775 | |
Targa Resources Partners LP/Targa Resources Partners Finance Corp. | | | | | | | | | | | | |
5.13%, 02/01/25 | | | | | | | 274 | | | | 274,685 | |
5.88%, 04/15/26 | | | | | | | 558 | | | | 569,160 | |
5.38%, 02/01/27 | | | | | | | 279 | | | | 280,395 | |
6.50%, 07/15/27 | | | | | | | 450 | | | | 471,375 | |
6.88%, 01/15/29 | | | | | | | 456 | | | | 489,060 | |
TEGNA, Inc., 4.75%, 03/15/26(b) | | | | | | | 1,957 | | | | 2,010,817 | |
Teleflex, Inc., 4.63%, 11/15/27 | | | | | | | 275 | | | | 289,994 | |
Tempur Sealy International, Inc.,
5.50%, 06/15/26 | | | | | | | 327 | | | | 340,073 | |
Tenet Healthcare Corp. | | | | | | | | | | | | |
4.63%, 07/15/24 | | | | | | | 2,302 | | | | 2,340,908 | |
4.63%, 09/01/24(b) | | | | | | | 328 | | | | 335,793 | |
5.13%, 05/01/25 | | | | | | | 756 | | | | 748,213 | |
4.88%, 01/01/26(b) | | | | | | | 1,131 | | | | 1,147,321 | |
6.25%, 02/01/27(b) | | | | | | | 844 | | | | 876,329 | |
4.63%, 06/15/28(b) | | | | | | | 849 | | | | 860,674 | |
Terex Corp., 5.63%, 02/01/25(b) | | | | | | | 330 | | | | 334,950 | |
T-Mobile USA, Inc.(b) | | | | | | | | | | | | |
3.88%, 04/15/30 | | | | | | | 6,066 | | | | 6,814,302 | |
2.55%, 02/15/31 | | | | | | | 13,946 | | | | 14,212,369 | |
2.25%, 11/15/31 | | | | | | | 4,051 | | | | 4,001,294 | |
TransDigm, Inc., 6.25%, 03/15/26(b) | | | | | | | 36,879 | | | | 38,445,989 | |
TRI Pointe Group, Inc., 5.70%, 06/15/28 | | | | | | | 645 | | | | 715,950 | |
Uber Technologies, Inc., 6.25%, 01/15/28(b) | | | | | | | 1,244 | | | | 1,261,105 | |
Union Pacific Corp., 3.25%, 02/05/50 | | | | | | | 6,503 | | | | 7,047,263 | |
United Airlines Pass-Through Trust, Series 2016-1, Class A, 5.88%, 04/15/29 | | | | | | | 21,106 | | | | 21,153,514 | |
United Rentals North America, Inc. | | | | | | | | | | | | |
5.88%, 09/15/26 | | | | | | | 568 | | | | 597,749 | |
5.50%, 05/15/27 | | | | | | | 569 | | | | 604,918 | |
4.88%, 01/15/28 | | | | | | | 906 | | | | 951,300 | |
United Shore Financial Services LLC,
5.50%, 11/15/25(b) | | | | | | | 20,133 | | | | 20,378,623 | |
| | |
CONSOLIDATED SCHEDULE OF INVESTMENTS | | 21 |
| | |
Consolidated Schedule of Investments (continued) October 31, 2020 | | BlackRock Global Allocation Fund, Inc. (Percentages shown are based on Net Assets) |
| | | | | | | | | | | | |
| Security | | | | | Par
(000) | | | Value | |
| | | |
| United States (continued) | | | | | | | | | |
US Concrete, Inc. | | | | | | | | | | | | |
6.38%, 06/01/24 | | | USD | | | | 109 | | | $ | 111,725 | |
5.13%, 03/01/29(b) | | | | | | | 2,843 | | | | 2,892,752 | |
VICI Properties LP/VICI Note Co., Inc.(b) | | | | | | | | | | | | |
3.50%, 02/15/25 | | | | | | | 3,730 | | | | 3,743,801 | |
3.75%, 02/15/27 | | | | | | | 3,595 | | | | 3,603,987 | |
4.13%, 08/15/30 | | | | | | | 4,285 | | | | 4,338,562 | |
Vistra Operations Co. LLC(b) | | | | | | | | | | | | |
5.50%, 09/01/26 | | | | | | | 559 | | | | 578,565 | |
5.63%, 02/15/27 | | | | | | | 12,703 | | | | 13,242,877 | |
5.00%, 07/31/27 | | | | | | | 721 | | | | 753,445 | |
Weekley Homes LLC/Weekley Finance Corp., 4.88%, 09/15/28(b) | | | | | | | 3,022 | | | | 3,060,742 | |
WESCO Distribution, Inc.(b) | | | | | | | | | | | | |
7.13%, 06/15/25 | | | | | | | 1,360 | | | | 1,465,400 | |
7.25%, 06/15/28 | | | | | | | 1,695 | | | | 1,856,025 | |
William Carter Co., 5.63%, 03/15/27(b) | | | | | | | 281 | | | | 294,874 | |
Williams Scotsman International, Inc., 4.63%, 08/15/28(b) | | | | | | | 608 | | | | 611,800 | |
WPX Energy, Inc., 5.75%, 06/01/26 | | | | | | | 274 | | | | 281,398 | |
Wyndham Destinations, Inc.,
6.63%, 07/31/26(b) | | | | | | | 4,252 | | | | 4,523,915 | |
Wyndham Hotels & Resorts, Inc.(b) | | | | | | | | | | | | |
5.38%, 04/15/26 | | | | | | | 277 | | | | 280,463 | |
4.38%, 08/15/28 | | | | | | | 1,378 | | | | 1,369,622 | |
Xerox Holdings Corp., 5.00%, 08/15/25(b) | | | | | | | 4,241 | | | | 4,187,097 | |
XHR LP, 6.38%, 08/15/25(b) | | | | | | | 8,099 | | | | 8,039,958 | |
XPO Logistics, Inc.(b) | | | | | | | | | | | | |
6.13%, 09/01/23 | | | | | | | 294 | | | | 297,675 | |
6.75%, 08/15/24 | | | | | | | 579 | | | | 612,698 | |
6.25%, 05/01/25 | | | | | | | 3,565 | | | | 3,788,953 | |
Yum! Brands, Inc., 3.63%, 03/15/31 | | | | | | | 5,149 | | | | 5,052,456 | |
| | | | | | | | | | | | |
| | | | | | | | | | | 1,170,505,357 | |
| | | | | | | | | | | | |
| |
Total Corporate Bonds — 7.1%
(Cost: $1,793,819,609) | | | | 1,589,386,936 | |
| | | | | | | | | | | | |
|
Floating Rate Loan Interests(a) | |
|
| Canada — 0.1% | |
Knowlton Development Corp. Inc., 2020 EUR Term Loan B, (EURIBOR + 5.00%), 5.00%, 12/22/25 | | | EUR | | | | 23,536 | | | | 27,095,504 | |
| | | | | | | | | | | | |
|
| Chile — 0.1% | |
Latam Airlines Group SA | | | | | | | | | | | | |
Term Loan 2015-1A, (3 mo. LIBOR + 3.20%), 4.70%, 08/30/29 | | | USD | | | | 27,809 | | | | 27,809,183 | |
Term Loan 2015-1B, (3 mo. LIBOR + 3.20%), 4.70%, 08/30/25 | | | | | | | 4,743 | | | | 4,743,024 | |
| | | | | | | | | | | | |
| | | | | | | | | | | 32,552,207 | |
|
| France — 0.3% | |
Babilou Group, EUR Term Loan B, 0.00%, 10/08/27(c)(n) | | | EUR | | | | 26,693 | | | | 30,077,644 | |
Casino Guichard-Perrachon SA, EUR Term Loan B, (EURIBOR + 5.50%), 5.50%, 01/31/24 | | | | | | | 24,454 | | | | 27,148,327 | |
| | | | | | | | | | | | |
| | | | | | | | | | | 57,225,971 | |
| | | | | | | | | | | | |
| Security | | | | | Par
(000) | | | Value | |
|
| Luxembourg — 0.1% | |
Luxembourg Life Fund, Long Term Loan G, (Fixed + 9.00%), 9.00%, 08/03/27(c) | | | USD | | | | 11,546 | | | $ | 11,459,664 | |
| | | | | | | | | | | | |
|
| Netherlands — 0.4% | |
Boels Topholding BV, 2020 EUR Term Loan B, (EURIBOR + 4.00%), 4.00%, 02/06/27 | | | EUR | | | | 31,155 | | | | 35,258,543 | |
Ziggo BV, 2019 EUR Term Loan H, (EURIBOR + 3.00%), 3.00%, 01/31/29 | | | | | | | 39,843 | | | | 45,112,955 | |
| | | | | | | | | | | | |
| | | | | | | | | | | 80,371,498 | |
|
| United Kingdom — 0.1% | |
BCA Marketplace PLC, 2020 EUR Term Loan, (Euribor + 5.50%),
5.50%, 04/29/23(c) | | | | | | | 20,860 | | | | 24,355,008 | |
| | | | | | | | | | | | |
|
| United States — 0.4% | |
Aimbridge Acquisition Co., Inc., 2020 Incremental Term Loan B, (3 mo. LIBOR + 6.00%), 6.75%, 02/02/26(c) | | | USD | | | | 9,327 | | | | 9,140,460 | |
Airbnb, Inc., Term Loan, (3 mo. LIBOR + 7.50%, 1.00% Floor), 8.50%, 04/17/25 | | | | | | | 7,611 | | | | 8,042,236 | |
Applecaramel Buyer LLC, Term Loan B, (6 mo. LIBOR + 4.00%), 4.50%, 10/19/27 | | | | | | | 16,714 | | | | 16,454,265 | |
Cablevision Lightpath LLC, Term Loan B, 0.00%, 09/15/27(n) | | | | | | | 2,385 | | | | 2,349,225 | |
Caesars Resort Collection LLC, 2020 Term Loan, (3 mo. LIBOR + 4.50%),
4.65%, 07/21/25 | | | | | | | 4,380 | | | | 4,236,292 | |
Douglas Dynamics Holdings, Inc., 2020 Additional Term Loan B, (1 mo. LIBOR + 3.75%, 1.00% Floor), 4.75%, 06/08/26(c) | | | | | | | 1,530 | | | | 1,515,003 | |
Herschend Entertainment Co. LLC, Term Loan B, (3 mo. LIBOR + 5.75%, 1.00% Floor), 6.75%, 08/25/25(c) | | | | | | | 11,177 | | | | 10,785,805 | |
Hilton Worldwide Finance LLC, 2019 Term Loan B2, (1 mo. LIBOR + 1.75%),
1.90%, 06/22/26 | | | | | | | 19,245 | | | | 18,216,236 | |
iHeartCommunications, Inc., 2020 Term Loan, (1 mo. LIBOR + 3.00%),
3.15%, 05/01/26 | | | | | | | 8,477 | | | | 7,945,909 | |
Opendoor GP II LLC, Term Loan, (UNFND), 3.33%, 01/23/26(c) | | | | | | | 7,955 | | | | 7,955,000 | |
Pacific Gas & Electric Co., 2020 Term Loan, (3 mo. LIBOR + 4.50%, 1.00% Floor), 5.50%, 06/23/25 | | | | | | | 6,042 | | | | 5,966,334 | |
Pike Corp., 2020 Term Loan B, (1 mo. LIBOR + 3.00%), 3.28%, 07/24/26 | | | | | | | 3,392 | | | | 3,337,100 | |
Shearer’s Foods, Inc., 2020 Term Loan B, (3 mo. LIBOR + 4.00%), 4.75%, 09/23/27 | | | | | | | 1,938 | | | | 1,911,760 | |
| | | | | | | | | | | | |
| | | | | | | | | | | 97,855,625 | |
| | | | | | | | | | | | |
| |
Total Floating Rate Loan Interests — 1.5%
(Cost: $325,327,454) | | | | 330,915,477 | |
| | | | | | | | | | | | |
|
| Foreign Agency Obligations | |
|
| Argentina — 0.2% | |
Argentine Republic Government International Bond | | | | | | | | | | | | |
1.00%, 07/09/29 | | | | | | | 3,751 | | | | 1,537,778 | |
0.13%, 07/09/30 | | | | | | | 35,805 | | | | 12,979,399 | |
0.13%, 07/09/35 | | | | | | | 44,033 | | | | 14,421,029 | |
0.13%, 01/09/38 | | | | | | | 14,865 | | | | 5,509,237 | |
| | | | | | | | | | | | |
| | | | | | | | | | | 34,447,443 | |
| | |
| 22 | | 2020 BLACKROCK ANNUAL REPORTTO SHAREHOLDERS |
| | |
Consolidated Schedule of Investments (continued) October 31, 2020 | | BlackRock Global Allocation Fund, Inc. (Percentages shown are based on Net Assets) |
| | | | | | | | | | | | |
| Security | | | | | Par (000) | | | Value | |
| | | |
| Australia — 0.7% | | | | | | | | | |
Australia Government Bond,
3.00%, 03/21/47 | | | AUD | | | | 180,503 | | | $ | 161,328,708 | |
| | | | | | | | |
| | | |
| Bahrain — 0.0% | | | | | | | | | |
Bahrain Government International Bond, 6.75%, 09/20/29 | | | USD | | | | 4,868 | | | | 5,268,089 | |
| | | | | | | | |
| | | |
| Brazil — 0.2% | | | | | | | | | |
Brazil Notas do Tesouro Nacional, Serie F, 10.00%, 01/01/27 | | | BRL | | | | 213,912 | | | | 41,994,541 | |
Brazilian Government International Bond, 3.88%, 06/12/30 | | | USD | | | | 3,013 | | | | 3,050,662 | |
| | | | | | | | |
| | | | | | | | | | | 45,045,203 | |
| | | |
| China — 1.7% | | | | | | | | | |
China Government Bond | | | | | | | | | | | | |
3.29%, 05/23/29 | | | CNY | | | | 2,077,850 | | | | 311,994,866 | |
2.68%, 05/21/30 | | | | | | | 383,440 | | | | 54,887,225 | |
| | | | | | | | |
| | | | | | | | | | | 366,882,091 | |
| | | |
| Colombia — 0.0% | | | | | | | | | |
Colombia Government International Bond, 4.50%, 03/15/29 | | | USD | | | | 2,561 | | | | 2,871,521 | |
| | | | | | | | |
| | | |
| Dominican Republic — 0.1% | | | | | | | | | |
Dominican Republic International Bond | | | | | | | | | | | | |
5.50%, 01/27/25 | | | | | | | 2,784 | | | | 2,974,530 | |
4.50%, 01/30/30 | | | | | | | 3,123 | | | | 3,151,302 | |
4.88%, 09/23/32(b) | | | | | | | 4,356 | | | | 4,439,036 | |
| | | | | | | | |
| | | | | | | | | | | 10,564,868 | |
| | | |
| Egypt — 0.0% | | | | | | | | | |
Egypt Government International Bond, 7.60%, 03/01/29 | | | | | | | 7,626 | | | | 7,931,040 | |
| | | | | | | | |
| | | |
| Germany — 0.1% | | | | | | | | | |
Bundesrepublik Deutschland Bundesanleihe, 0.01%, 08/15/50 | | | EUR | | | | 24,601 | | | | 30,556,547 | |
| | | | | | | | |
| | | |
| Greece — 0.3% | | | | | | | | | |
Hellenic Republic Government Bond, 2.00%, 04/22/27(b) | | | | | | | 44,232 | | | | 55,980,826 | |
| | | | | | | | |
| | | |
| Indonesia — 0.0% | | | | | | | | | |
Indonesia Government International Bond, 4.20%, 10/15/50 | | | USD | | | | 2,572 | | | | 2,970,660 | |
| | | | | | | | |
| | | |
| Italy — 2.1% | | | | | | | | | |
Italy Buoni Poliennali Del Tesoro | | | | | | | | | | | | |
1.35%, 04/01/30 | | | EUR | | | | 146,104 | | | | 181,243,919 | |
0.95%, 08/01/30 | | | | | | | 122,452 | | | | 146,357,627 | |
3.85%, 09/01/49(b) | | | | | | | 73,817 | | | | 131,659,905 | |
| | | | | | | | |
| | | | | | | | | | | 459,261,451 | |
| | | |
| Japan — 0.9% | | | | | | | | | |
Japan Government Thirty Year Bond, 0.40%, 09/20/49 | | | JPY | | | | 21,993,700 | | | | 198,160,727 | |
| | | | | | | | |
| | | |
| Mexico — 0.0% | | | | | | | | | |
Mexico Government International Bond, 4.75%, 04/27/32 | | | USD | | | | 7,140 | | | | 8,161,912 | |
| | | | | | | | |
| | | |
| Panama — 0.0% | | | | | | | | | |
Panama Government International Bond, 6.70%, 01/26/36 | | | | | | | 2,094 | | | | 3,018,632 | |
| | | | | | | | |
| | | | | | | | | | | | |
| Security | | | | | Par (000) | | | Value | |
| | | |
| Paraguay — 0.0% | | | | | | | | | |
Paraguay Government International Bond, 4.95%, 04/28/31(b) | | | USD | | | | 2,573 | | | $ | 3,000,922 | |
| | | | | | | | |
| | | |
| Qatar — 0.0% | | | | | | | | | |
Qatar Government International Bond, 4.40%, 04/16/50(b) | | | | | | | 2,272 | | | | 2,885,440 | |
| | | | | | | | |
| | | |
| Romania — 0.0% | | | | | | | | | |
Romanian Government International Bond, 6.13%, 01/22/44(b) | | | | | | | 2,162 | | | | 2,911,944 | |
| | | | | | | | |
| | | |
| Russia — 0.0% | | | | | | | | | |
Russian Foreign Bond - Eurobond, 5.25%, 06/23/47 | | | | | | | 2,200 | | | | 2,887,500 | |
| | | | | | | | |
| | | |
| Saudi Arabia — 0.0% | | | | | | | | | |
Saudi Government International Bond, 4.63%, 10/04/47 | | | | | | | 2,464 | | | | 2,972,200 | |
| | | | | | | | |
| | | |
| Spain(b) — 1.1% | | | | | | | | | |
Spain Government Bond | | | | | | | | | | | | |
0.60%, 10/31/29 | | | EUR | | | | 129,003 | | | | 157,890,740 | |
1.25%, 10/31/30 | | | | | | | 17,768 | | | | 22,975,996 | |
2.70%, 10/31/48 | | | | | | | 13,821 | | | | 23,289,246 | |
1.00%, 10/31/50 | | | | | | | 31,149 | | | | 36,843,617 | |
| | | | | | | | |
| | | | | | | | | | | 240,999,599 | |
| | | |
| Ukraine(b) — 0.0% | | | | | | | | | |
Ukraine Government International Bond | | | | | | | | | | | | |
7.75%, 09/01/25 | | | USD | | | | 2,658 | | | | 2,717,805 | |
7.25%, 03/15/33 | | | | | | | 6,112 | | | | 5,745,280 | |
| | | | | | | | |
| | | | | | | | | | | 8,463,085 | |
| | | |
| Uruguay — 0.0% | | | | | | | | | |
Uruguay Government International Bond, 5.10%, 06/18/50 | | | | | | | 4,657 | | | | 6,210,883 | |
| | | | | | | | |
| |
Total Foreign Agency Obligations — 7.4%
(Cost: $1,562,886,933) | | | | 1,662,781,291 | |
| | | | | | | | |
| | | |
| | | | | | Shares | | | | |
| Investment Companies | |
| |
| United States — 6.0% | | | | |
Consumer Discretionary Select Sector SPDR Fund | | | | 186,154 | | | | 26,614,437 | |
Financial Select Sector SPDR Fund | | | | 799,365 | | | | 19,072,849 | |
Industrial Select Sector SPDR Fund | | | | 521,106 | | | | 39,536,312 | |
InvesCo QQQ Trust, Series 1 | | | | 575,548 | | | | 155,041,120 | |
iShares China Large-Cap ETF(e)(g) | | | | 230,793 | | | | 10,177,971 | |
iShares iBoxx $ High Yield Corporate Bond
ETF(e)(g)(i) | | | | 3,634,252 | | | | 304,841,058 | |
iShares iBoxx $ Investment Grade Corporate Bond ETF(e)(g) | | | | 985,249 | | | | 131,757,349 | |
iShares MSCI Brazil ETF(e) | | | | 331,338 | | | | 8,899,738 | |
iShares MSCI Emerging Markets ETF(e) | | | | 84,232 | | | | 3,766,013 | |
iShares Nasdaq Biotechnology ETF(e)(g) | | | | 29,547 | | | | 3,859,429 | |
iShares Russell 2000 ETF(e)(g) | | | | 582,855 | | | | 89,229,272 | |
iShares S&P 500 Value ETF(e) | | | | 227,346 | | | | 25,096,725 | |
KraneShares Bosera MSCI China A ETF(g) | | | | 171,614 | | | | 7,008,716 | |
KraneShares CSI China Internet ETF(g) | | | | 131,443 | | | | 9,441,551 | |
| | |
CONSOLIDATED SCHEDULE OF INVESTMENTS | | 23 |
| | |
Consolidated Schedule of Investments (continued) October 31, 2020 | | BlackRock Global Allocation Fund, Inc. (Percentages shown are based on Net Assets) |
| | | | | | | | | | | | |
| | | |
| Security | | | | | Shares | | | Value | |
| | | |
| United States (continued) | | | | | | | | | |
SPDR Bloomberg Barclays High Yield Bond ETF | | | | | | | 553,344 | | | $ | 57,713,779 | |
SPDR Gold Shares(d)(o) | | | | | | | 2,447,401 | | | | 431,232,056 | |
SPDR S&P Oil & Gas Exploration & Production ETF(g) | | | | | | | 201,601 | | | | 8,180,969 | |
VanEck Vectors Semiconductor ETF | | | | | | | 57,794 | | | | 10,111,060 | |
| | | | | |
| |
Total Investment Companies — 6.0%
(Cost: $1,249,660,772) | | | | 1,341,580,404 | |
| | | | | |
| | | |
| | | | | | Par (000) | | | | |
| | | |
Municipal Bonds | | | | | | | | | | | | |
| | | |
Puerto Rico — 0.1% | | | | | | | | | | | | |
Puerto Rico Sales Tax Financing Corp. Sales Tax Revenue, RB, Series A-1, Restructured,
5.00%, 07/01/58 | | | USD | | | | 21,554 | | | | 22,923,541 | |
| | | | | |
| | | |
Total Municipal Bonds — 0.1%
(Cost: $22,782,462) | | | | | | | | | | | 22,923,541 | |
| | | | | |
|
| Non-Agency Mortgage-Backed Securities | |
| | | |
| United States — 0.6% | | | | | | | | | |
1211 Avenue of the Americas Trust, Series 2015- 1211, Class D, 4.14%, 08/10/35(a)(b) | | | | | | | 4,330 | | | | 4,373,759 | |
AOA Mortgage Trust, Series 2015-1177, Class C,
3.01%, 12/13/29(a)(b) | | | | | | | 2,924 | | | | 2,908,427 | |
BANK 2017-BNK8, Series 2017-BNK8, Class B, 3.93%, 11/15/50(a) | | | | | | | 1,551 | | | | 1,691,004 | |
BANK 2017-BNK9, Series 2017-BNK9, Class A4, 3.54%, 11/15/54 | | | | | | | 1,990 | | | | 2,244,045 | |
BBCMS Mortgage Trust, Series 2018-TALL, Class C, (1 mo. LIBOR US + 1.12%),
1.27%, 03/15/37(a)(b) | | | | | | | 4,880 | | | | 4,538,306 | |
BWAY Mortgage Trust, Series 2013-1515, Class D, 3.63%, 03/10/33(b) | | | | | | | 2,000 | | | | 2,060,598 | |
BX Commercial Mortgage Trust(a)(b) | | | | | | | | | | | | |
Series 2018-BIOA, Class D, (1 mo. LIBOR US + 1.32%),
1.47%, 03/15/37 | | | | | | | 1,300 | | | | 1,279,662 | |
Series 2018-BIOA, Class F, (1 mo. LIBOR US + 2.47%),
2.62%, 03/15/37 | | | | | | | 7,721 | | | | 7,508,721 | |
Series 2018-IND, Class G, (1 mo. LIBOR US + 2.05%),
2.20%, 11/15/35 | | | | | | | 2,539 | | | | 2,484,821 | |
Series 2019-XL, Class G, (1 mo. LIBOR US + 2.30%),
2.45%, 10/15/36 | | | | | | | 8,947 | | | | 8,678,272 | |
Series 2019-XL, Class J, (1 mo. LIBOR US + 2.65%),
2.80%, 10/15/36 | | | | | | | 3,014 | | | | 2,908,359 | |
BX Trust(a)(b) | | | | | | | | | | | | |
Series 2019-OC11, Class D, 4.08%, 12/09/41 | | | | | | | 8,408 | | | | 8,010,225 | |
Series 2019-OC11, Class E, 4.08%, 12/09/41 | | | | | | | 11,784 | | | | 10,714,758 | |
CD Mortgage Trust, Series 2017-CD6, Class B, 3.91%, 11/13/50(a) | | | | | | | 864 | | | | 924,720 | |
CGDBB Commercial Mortgage Trust, Series 2017-BIOC, Class E, (1 mo. LIBOR US + 2.15%),
2.30%, 07/15/32(a)(b) | | | | | | | 3,314 | | | | 3,283,162 | |
Citigroup Commercial Mortgage Trust, Series 2014-GC23, Class AS, 3.86%, 07/10/47 | | | | | | | 5,552 | | | | 5,980,691 | |
Citigroup COmmercial Mortgage Trust, Series 2018- C6, Class A4, 4.41%, 11/10/51 | | | | | | | 2,000 | | | | 2,367,563 | |
| | | | | | | | | | | | |
| | | |
| Security | | | | | Par (000) | | | Value | |
| | | |
| United States (continued) | | | | | | | | | |
COMM Mortgage Trust, Series 2014-CR21, Class A3, 3.53%, 12/10/47 | | | USD | | | | 4,009 | | | $ | 4,317,078 | |
CORE Mortgage Trust, Series 2019-CORE, Class F, (1 mo. LIBOR US + 2.35%), 2.50%, 12/15/31(a)(b) | | | | | | | 2,008 | | | | 1,930,279 | |
CSAIL Commercial Mortgage Trust, Series 2020- C19, Class A3, 2.56%, 03/15/53 | | | | | | | 11,759 | | | | 12,444,278 | |
CSMC 2020-NET, Series 2020-NET, Class A, 2.26%, 08/15/37(b) | | | | | | | 4,036 | | | | 4,143,082 | |
DBWF Mortgage Trust, Series 2018-GLKS, Class C, (1 mo. LIBOR US + 1.75%), 1.90%, 12/19/30(a)(b) | | | | | | | 1,650 | | | | 1,530,336 | |
GRACE Mortgage Trust, Series 2014-GRCE, Class B, 3.52%, 06/10/28(b) | | | | | | | 3,500 | | | | 3,510,246 | |
GS Mortgage Securities Trust, Series 2020-GC47, Class AS, 2.73%, 05/12/53 | | | | | | | 4,426 | | | | 4,713,862 | |
Hudson Yards Mortgage Trust, Series 2016-10HY, Class E,
2.98%, 08/10/38(a)(b) | | | | | | | 897 | | | | 862,861 | |
JP Morgan Chase Commercial Mortgage Securities Trust(b) | | | | | | | | | | | | |
Series 2018-WPT, Class DFL, (1 mo. LIBOR US + 2.25%),
2.39%, 07/05/33(a) | | | | | | | 1,253 | | | | 1,190,953 | |
Series 2018-WPT, Class DFX,
5.35%, 07/05/33 | | | | | | | 2,168 | | | | 2,155,227 | |
JPMCC Commercial Mortgage Securities Trust, | | | | | | | | | | | | |
Series 2019-COR4, Class A5,
4.03%, 03/10/52 | | | | | | | 4,308 | | | | 5,034,260 | |
Morgan Stanley Bank of America Merrill Lynch Trust | | | | | | | | | | | | |
Series 2015-C24, Class C,
4.34%, 05/15/48(a) | | | | | | | 647 | | | | 635,931 | |
Series 2016-C32, Class A4,
3.72%, 12/15/49 | | | | | | | 3,377 | | | | 3,802,218 | |
Morgan Stanley Capital I Trust, Series 2020-L4, Class A3, 2.70%, 02/15/53 | | | | | | | 2,855 | | | | 3,039,369 | |
UBS Commercial Mortgage Trust, Series 2019-C17, Class A4, 2.92%, 10/15/52 | | | | | | | 1,175 | | | | 1,269,323 | |
VNDO Trust, Series 2016-350P, Class D, 3.90%, 01/10/35(a)(b) | | | | | | | 2,150 | | | | 2,182,765 | |
Wells Fargo Commercial Mortgage Trust(a) | | | | | | | | | | | | |
Series 2015-C28, Class AS,
3.87%, 05/15/48 | | | | | | | 3,230 | | | | 3,530,335 | |
Series 2018-1745, Class A,
3.75%, 06/15/36(b) | | | | | | | 2,162 | | | | 2,356,368 | |
| | | | | |
| | | |
Total Non-Agency Mortgage-Backed Securities — 0.6%
(Cost: $130,396,251) | | | | | | | | | | | 130,605,864 | |
| | | | | |
| | | |
| Preferred Securities | | | | | | | | | |
| | | |
Capital Trusts — 0.5% | | | | | | | | | | | | |
| | | |
| United Kingdom — 0.2% | | | | | | | | | |
Lloyds Bank PLC, 13.00%(a)(p) | | | GBP | | | | 14,076 | | | | 31,875,096 | |
| | | | | |
| | | |
| United States — 0.3% | | | | | | | | | |
American Express Co., Series C, 3.54%(a)(p) | | | USD | | | | 9,039 | | | | 8,431,308 | |
Citigroup, Inc., Series Q, 4.38%(a)(p) | | | | | | | 12,482 | | | | 12,265,999 | |
General Motors Financial Co., Inc.,
Series C, 5.70%(a)(p) | | | | | | | 1,857 | | | | 1,921,995 | |
Goldman Sachs Group, Inc.,
Series M, 4.17%(a)(p) | | | | | | | 14,361 | | | | 14,145,585 | |
Morgan Stanley, Series H, 3.85%(a)(p) | | | | | | | 10,558 | | | | 10,161,681 | |
NBCUniversal Enterprise, Inc., 5.25%(b)(p) | | | | | | | 10,521 | | | | 10,652,512 | |
Prudential Financial, Inc.(a) 5.63%, 06/15/43 | | | | | | | 5,623 | | | | 5,995,119 | |
| | |
| 24 | | 2020 BLACKROCK ANNUAL REPORTTO SHAREHOLDERS |
| | |
Consolidated Schedule of Investments (continued) October 31, 2020 | | BlackRock Global Allocation Fund, Inc. (Percentages shown are based on Net Assets) |
| | | | | | | | | | | | |
| Security | | | | | Par (000) | | | Value | |
| | | |
| United States (continued) | | | | | | | | | |
Prudential Financial, Inc.(a) (continued) 5.88%, 09/15/42 | | | USD | | | | 8,044 | | | $ | 8,509,578 | |
USB Capital IX, 3.50%(a)(p) | | | | | | | 3,935 | | | | 3,588,877 | |
| | | | | | | | | | | | |
| | | | | | | | | | | 75,672,654 | |
| | | | | | | | | | | | |
| | | | | | | | | | | 107,547,750 | |
| | | |
| | | | | | Shares | | | | |
| | | |
| Preferred Stocks — 1.5% | | | | | | | | | |
| | | |
| Brazil — 0.1% | | | | | | | | | |
Centrais Eletricas Brasileiras SA, Preference B Shares | | | | | | | 40,575 | | | | 219,141 | |
Itau Unibanco Holding SA, Preference Shares | | | | | | | 997,172 | | | | 4,080,481 | |
Neon Payments Ltd.(c) | | | | | | | 19,718 | | | | 6,694,261 | |
| | | | | | | | | | | | |
| | | | | | | | | | | 10,993,883 | |
| | | |
| France — 0.1% | | | | | | | | | |
Arrival Ltd., Series A (Acquired 10/08/20, Cost: $31,415,722)(c)(f) | | | | | | | 7,836,122 | | | | 31,112,515 | |
| | | | | | | | | | | | |
| | | |
| Germany — 0.0% | | | | | | | | | |
Volkswagen AG, Preference Shares | | | | | | | 2,466 | | | | 359,207 | |
| | | | | | | | | | | | |
| | | |
| United States — 1.3% | | | | | | | | | |
Aptiv PLC, Series A, 06/15/23(m) | | | | | | | 132,372 | | | | 15,937,589 | |
Becton Dickinson and Co.,
Series B, 06/01/23(m) | | | | | | | 509,265 | | | | 26,522,521 | |
Boston Scientific Corp.,
Series A, 06/01/23(m) | | | | | | | 88,689 | | | | 9,186,407 | |
C3.ai, Inc.(c)(f) | | | | | | | | | | | | |
Series D, (Acquired 10/07/19, Cost: $21,206,692) | | | | | | | 4,782,853 | | | | 27,549,233 | |
Series E, (Acquired 10/07/19, Cost: $2,435,741) | | | | | | | 549,345 | | | | 3,164,227 | |
Cash Mandatory Exchangeable Trust, 06/01/23(b)(m) | | | | | | | 34,289 | | | | 35,715,422 | |
Databricks, Inc., Series F (Acquired 10/22/19, Cost: $11,769,837)(c)(f) | | | | | | | 274,046 | | | | 14,751,896 | |
Farmer’s Business Network, Inc, Series F (Acquired 07/31/20, Cost: $8,907,002)(c)(f) | | | | | | | 269,447 | | | | 8,907,918 | |
Grand Rounds, Inc.(c)(f) | | | | | | | | | | | | |
Series C, (Acquired 03/31/15, Cost: $26,357,523) | | | | | | | 9,493,075 | | | | 30,852,494 | |
Series D, (Acquired 05/01/18, Cost: $4,824,038) | | | | | | | 1,990,402 | | | | 6,409,094 | |
Jumpcloud, Inc., Series E-1 (Acquired 10/30/20, Cost: $11,778,091)(c)(f) | | | | | | | 6,458,349 | | | | 11,778,085 | |
Loadsmart, Inc., Series C (Acquired 10/05/20, Cost: $10,694,460)(c)(f) | | | | | | | 1,250,814 | | | | 10,694,460 | |
Lookout, Inc., Series F (Acquired 09/19/14, Cost: $50,945,689)(c)(f) | | | | | | | 4,459,883 | | | | 50,931,864 | |
Mount Sinai Genomics, Inc., Series C (Acquired 07/17/20, Cost: $10,527,582)(c)(f) | | | | | | | 17,155 | | | | 11,228,977 | |
Nuvia, Inc., Series B (Acquired 09/17/20, Cost: $5,286,012)(c)(f) | | | | | | | 1,648,095 | | | | 5,273,904 | |
SambaNova Systems, Inc., Series C (Acquired 02/20/20, Cost: $11,739,902)(c)(f) | | | | | | | 220,503 | | | | 12,610,567 | |
Zero Mass Water, Inc., Series C-1 (Acquired 05/07/20, Cost: $8,796,956)(c)(f) | | | | | | | 558,055 | | | | 8,700,077 | |
| | | | | | | | | | | | |
| | | | | | | | | | | 290,214,735 | |
| | | | | | | | | | | | |
| | | | | | | | | | | 332,680,340 | |
| | | | | | | | | | | | |
| Security | | | | | Shares | | | Value | |
| | | |
| Trust Preferreds — 0.2% | | | | | | | | | |
| | | |
| United States — 0.2% | | | | | | | | | |
Citigroup Capital XIII, 01/30/40(a) | | | | | | | 629,905 | | | $ | 17,259,397 | |
GMAC Capital Trust I,
Series 2, 02/15/40(a) | | | | | | | 691,942 | | | | 17,810,587 | |
Wells Fargo & Co., Series L(m)(p) | | | | | | | 5,825 | | | | 7,856,527 | |
| | | | | | | | | | | | |
| | | | | | | | | | | 42,926,511 | |
| | | | | | | | | | | | |
| | | |
Total Preferred Securities — 2.2%
(Cost: $455,336,632) | | | | | | | | | | | 483,154,601 | |
| | | | | | | | | | | | |
| | | |
| | | | | | Par (000) | | | | |
|
U.S. Government Sponsored Agency Securities | |
| | | |
| Mortgage-Backed Securities — 0.0% | | | | | | | | | |
Uniform Mortgage-Backed Securities, Class A2, 3.70%, 09/25/30(a) | | | USD | | | | 2,165 | | | | 2,597,888 | |
| | | | | | | | | | | | |
| | | |
Total U.S. Government Sponsored Agency Securities — 0.0%
(Cost: $2,598,804) | | | | | | | | | | | 2,597,888 | |
| | | | | | | | | | | | |
| | | |
| U.S. Treasury Obligations | | | | | | | | | |
U.S. Treasury Bonds | | | | | | | | | | | | |
1.13%, 05/15/40 - 08/15/40(q)(r) | | | | | | | 114,879 | | | | 109,379,532 | |
2.38%, 11/15/49(r) | | | | | | | 145,337 | | | | 171,145,789 | |
U.S. Treasury Inflation Indexed Bonds, 0.13%, 10/15/24 - 01/15/30 | | | | | | | 970,504 | | | | 1,029,132,319 | |
U.S. Treasury Notes,
1.75%, 11/15/29(q)(r) | | | | | | | 274,806 | | | | 297,842,470 | |
| | | | | | | | | | | | |
| | |
Total U.S. Treasury Obligations — 7.2%
(Cost: $1,535,589,742) | | | | | | | | 1,607,500,110 | |
| | | | | | | | | | | | |
| | | |
| | | | | | Shares | | | | |
| | | |
Warrants | | | | | | | | | | | | |
| | | |
| Brazil(c) — 0.0% | | | | | | | | | |
Neon Payments Ltd. - T1 | | | | | | | 9,859 | | | | 215,518 | |
Neon Payments Ltd. - T2 | | | | | | | 9,859 | | | | 215,518 | |
| | | | | | | | | | | | |
| | | | | | | | | | | 431,036 | |
| | | |
| United States(c)(f) — 0.0% | | | | | | | | | |
Healthcare Merger Corp, (Acquired 7/29/20, Cost: $0) | | | | | | | 890,702 | | | | 9 | |
Zero Mass Water, Inc. Series C-1, (Acquired 05/08/20, Cost: $0) | | | | | | | 558,055 | | | | 491,088 | |
| | | | | | | | | | | | |
| | | | | | | | | | | 491,097 | |
| | | | | | | | | | | | |
| | | |
Total Warrants — 0.0%
(Cost: $1) | | | | | | | | | | | 922,133 | |
| | | | | | | | | | | | |
| | |
Total Long-Term Investments — 96.4%
(Cost: $17,717,219,044) | | | | | | | | 21,568,054,024 | |
| | | | | | | | | | | | |
| | |
CONSOLIDATED SCHEDULE OF INVESTMENTS | | 25 |
| | |
Consolidated Schedule of Investments (continued) October 31, 2020 | | BlackRock Global Allocation Fund, Inc. (Percentages shown are based on Net Assets) |
| | | | | | | | | | | | |
| Security | | | | | Shares | | | Value | |
|
Short-Term Securities | |
|
Money Market Funds — 1.0% | |
BlackRock Liquidity Funds, T-Fund, Institutional
Class, 0.01%(e)(s) | | | | | | | 3,000,470 | | | $ | 3,000,470 | |
SL Liquidity Series, LLC, Money Market Series, 0.18%(e)(s)(t) | | | | | | | 212,921,937 | | | | 213,007,106 | |
| | | | | | | | | | | | |
| | | | | | | | | | | 216,007,576 | |
| | | | | | | | | | | | |
| | | |
| | | | | | Par (000) | | | | |
| | | |
| Time Deposits — 0.1% | | | | | | | | | |
| | | |
| Canada — 0.0% | | | | | | | | | |
Brown Brothers Harriman & Co., 0.01%, 11/02/20 | | | CAD | | | | 4,316 | | | | 3,239,299 | |
| | | | | | | | | | | | |
| | | |
| France — 0.0% | | | | | | | | | |
BNP Paribas SA,
(0.07%), 11/02/20 | | | EUR | | | | 9,082 | | | | 10,576,980 | |
| | | | | | | | | | | | |
| | | |
| Japan — 0.0% | | | | | | | | | |
Sumitomo Bank Tokyo,
(0.26%), 11/02/20 | | | JPY | | | | 114,037 | | | | 1,089,226 | |
| | | | | | | | | | | | |
| | | |
| United States — 0.1% | | | | | | | | | |
Citibank NA, New York,
0.10%, 11/02/20 | | | USD | | | | 13,968 | | | | 13,968,459 | |
| | | | | | | | | | | | |
| | | | | | | | | | | 28,873,964 | |
| | |
| U.S. Treasury Obligations — 3.2% | | | | | | | |
U.S. Treasury Bills(u) | | | | | | | | | | | | |
0.08%, 11/03/20 - 11/24/20 | | | | | | | 61,635 | | | | 61,633,032 | |
0.09%, 12/08/20 - 01/21/21 | | | | | | | 228,000 | | | | 227,964,028 | |
0.10%, 01/14/21 - 02/18/21 | | | | | | | 160,000 | | | | 159,957,125 | |
0.18%, 02/25/21 | | | | | | | 200,000 | | | | 199,935,312 | |
U.S. Treasury Notes,
1.75%, 11/15/20(i)(o)(q)(u) | | | | | | | 75,132 | | | | 75,175,099 | |
| | | | | | | | | | | | |
| | | | | | | | | | | 724,664,596 | |
| | | | | | | | | | | | |
| | |
Total Short-Term Securities — 4.3%
(Cost: $969,423,351) | | | | | | | | 969,546,136 | |
| | | | | | | | | | | | |
| | | |
Options Purchased — 0.7%
(Cost: $243,162,664) | | | | | | | | | | | 172,385,201 | |
| | | | | | | | | | | | |
| |
Total Investments Before Options
Written — 101.4%
(Cost: $18,929,805,059) | | | | 22,709,985,361 | |
| | | | | | | | | | | | |
| | | |
| | | | | | Shares | | | | |
| | | |
Investments Sold Short | | | | | | | | | | | | |
| | | |
| Common Stocks | | | | | | | | | |
| | | |
| Finland — (0.0)% | | | | | | | | | |
UPM-Kymmene OYJ | | | | | | | (340,436 | ) | | | (9,620,367 | ) |
| | | | | | | | | | | | |
| | | |
| Sweden — (0.1)% | | | | | | | | | |
Hennes & Mauritz AB, B Shares | | | | | | | (428,233 | ) | | | (6,962,384 | ) |
Svenska Cellulosa AB SCA, Class B(d) | | | | | | | (803,538 | ) | | | (10,869,067 | ) |
| | | | | | | | | | | | |
| | | | | | | | | | | (17,831,451 | ) |
| | | | | | | | | | | | |
| Security | | | | | Shares | | | Value | |
| | | |
| United States — (0.1)% | | | | | | | | | |
Hershey Co. | | | | | | | (48,247 | ) | | $ | (6,632,033 | ) |
JM Smucker Co. | | | | | | | (51,256 | ) | | | (5,750,923 | ) |
McCormick & Co., Inc. | | | | | | | (28,652 | ) | | | (5,171,972 | ) |
Seagate Technology PLC | | | | | | | (246,549 | ) | | | (11,789,973 | ) |
| | | | | | | | | | | | |
| | | | | | | | | | | (29,344,901 | ) |
| | | | | | | | | | | | |
| | | |
Total Investments Sold Short — (0.2)%
(Proceeds: $(57,803,641)) | | | | | | | | | | | (56,796,719 | ) |
| | | | | | | | | | | | |
| | | |
Options Written — (0.8)%
(Premiums Received: $(206,284,435)) | | | | | | | | | | | (189,089,992 | ) |
| | | | | | | | | | | | |
| | | |
Total Investments, Net of Options Written — 100.4%
(Cost: $18,665,716,983) | | | | | | | | | | | 22,464,098,650 | |
| |
Liabilities in Excess of Other Assets — (0.4)% | | | | (90,368,836 | ) |
| | | | | | | | | | | | |
| | | |
Net Assets — 100.0% | | | | | | | | | | $ | 22,373,729,814 | |
| | | | | |
| (a) | Variable rate security. Interest rate resets periodically. The rate shown is the effective interest rate as of period end. Security description also includes the reference rate and spread if published and available. |
| (b) | Security exempt from registration pursuant to Rule 144A under the Securities Act of 1933, as amended. These securities may be resold in transactions exempt from registration to qualified institutional investors. |
| (c) | Security is valued using significant unobservable inputs and is classified as Level 3 in the fair value hierarchy. |
| (d) | Non-income producing security. |
| (e) | Affiliate of the Fund. |
| (f) | Restricted security as to resale, excluding 144A securities. The Fund held restricted securities with a current value of $460,035,085, representing 2.06% of its net assets as of period end, and an original cost of $362,258,577. |
| (g) | All or a portion of this security is on loan. |
| (h) | A security contractually bound to one or more other securities to form a single saleable unit which cannot be sold separately. |
| (i) | All or a portion of the security has been pledged and/or segregated as collateral in connection with outstanding exchange-traded options written. |
| (j) | When-issued security. |
| (k) | Payment-in-kind security which may pay interest/dividends in additional par/shares and/or in cash. Rates shown are the current rate and possible payment rates. |
| (l) | Issuer filed for bankruptcy and/or is in default. |
| (m) | Convertible security. |
| (n) | Represents an unsettled loan commitment at period end. Certain details associated with this purchase are not known prior to the settlement date, including coupon rate. |
| (o) | All or a portion of the security is held by a wholly-owned subsidiary. See Note 1 of the Notes to Consolidated Financial Statements for details on the wholly-owned subsidiary. |
| (p) | Perpetual security with no stated maturity date. |
| (q) | All or a portion of the security has been pledged as collateral in connection with outstanding OTC derivatives. |
| (r) | All or a portion of the security has been pledged in connection with outstanding futures contracts. |
| (s) | Annualized 7-day yield as of period end. |
| (t) | All or a portion of this security was purchased with the cash collateral from loaned securities. |
| (u) | Rates are discount rates or a range of discount rates as of period end. |
| | |
| 26 | | 2020 BLACKROCK ANNUAL REPORTTO SHAREHOLDERS |
| | |
Consolidated Schedule of Investments (continued) October 31, 2020 | | BlackRock Global Allocation Fund, Inc. |
Affiliates
Investments in issuers considered to be affiliate(s) of the Fund during the year ended October 31, 2020 for purposes of Section 2(a)(3) of the 1940 Act, as amended, were as follows:
| | | | | | | | | | | | | | | | | | | | | | | | | | | | | | | | | | | | |
| Affiliated Issuer | | Value at
10/31/19 | | | Purchases at Cost | | | Proceeds
from Sales | | | Net Realized
Gain (Loss) | | | Change in
Unrealized
Appreciation
(Depreciation) | | | Value at
10/31/20 | | | Par/Shares
Held at
10/31/20 | | | Income | | | Capital Gain
Distributions
from
Underlying
Funds | |
Bio City Development Co. BV | | $ | 18,662,625 | | | $ | — | | | $ | — | | | $ | — | | | $ | (4,929,750 | ) | | $ | 13,732,875 | | | | 140,850,000 | | | $ | — | | | $ | — | |
BlackRock Liquidity Funds, T-Fund, Institutional Class | | | 15,160,728 | | | | — | | | | (12,160,258 | )(a) | | | — | | | | — | | | | 3,000,470 | | | | 3,000,470 | | | | 275,879 | | | | 156 | |
iShares China Large-Cap ETF | | | — | | | | 75,365,285 | | | | (63,519,390 | ) | | | (2,018,891 | ) | | | 350,967 | | | | 10,177,971 | | | | 230,793 | | | | 624,936 | | | | — | |
iShares iBoxx $ Investment Grade Corporate Bond ETF | | | — | | | | 470,268,167 | | | | (358,270,339 | ) | | | 21,248,267 | | | | (1,488,746 | ) | | | 131,757,349 | | | | 985,249 | | | | 492,320 | | | | — | |
iShares iBoxx High Yield Corporate Bond ETF | | | — | | | | 707,993,102 | | | | (431,428,997 | ) | | | 18,151,146 | | | | 10,125,807 | | | | 304,841,058 | | | | 3,634,252 | | | | 5,813,725 | | | | — | |
iShares MSCI Brazil ETF | | | — | | | | 10,161,673 | | | | — | | | | — | | | | (1,261,935 | ) | | | 8,899,738 | | | | 331,338 | | | | — | | | | — | |
iShares MSCI Emerging Markets ETF | | | — | | | | 60,096,616 | | | | (48,621,931 | ) | | | (7,714,905 | ) | | | 6,233 | | | | 3,766,013 | | | | 84,232 | | | | 19,398 | | | | — | |
iShares Nasdaq Biotechnology ETF | | | — | | | | 3,356,471 | | | | — | | | | — | | | | 502,958 | | | | 3,859,429 | | | | 29,547 | | | | 5,606 | | | | — | |
iShares Russell 2000 ETF | | | — | | | | 166,032,005 | | | | (56,870,195 | ) | | | (20,473,652 | ) | | | 541,114 | | | | 89,229,272 | | | | 582,855 | | | | 617,469 | | | | — | |
iShares S&P 500 Value ETF | | | 11,974,514 | | | | 18,059,421 | | | | (1,831,667 | ) | | | 41,968 | | | | (3,147,511 | ) | | | 25,096,725 | | | | 227,346 | | | | 687,201 | | | | — | |
Quintis Australia Pty. Ltd. | | | 75,937,178 | | | | 6,196,473 | | | | — | | | | — | | | | 14,954 | | | | 82,133,651 | | | | 82,133,651 | | | | 6,235,201 | | | | — | |
Quintis Australia Pty. Ltd. | | | 82,684,528 | | | | — | | | | — | | | | — | | | | 263,196 | | | | 82,684,528 | | | | 82,684,528 | | | | — | | | | — | |
Quintis HoldCo Pty. Ltd. | | | 26,229,868 | | | | — | | | | — | | | | — | | | | 10,045,581 | | | | 36,275,449 | | | | 43,735,802 | | | | — | | | | — | |
SL Liquidity Series, LLC, Money Market Series | | | 132,228,628 | | | | 80,615,624 | (a) | | | — | | | | 84,851 | | | | 78,003 | | | | 213,007,106 | | | | 212,921,937 | | | | 2,230,310 | (b) | | | — | |
| | | | | | | | | | | | | | | | | | | | | | | | | | | | | | | | | | | | |
| | | | | | | | | | | | | | $ | 9,318,784 | | | $ | 11,100,871 | | | $ | 1,008,461,634 | | | | | | | $ | 17,002,045 | | | $ | 156 | |
| | | | | | | | | | | | | | | | | | | | | | | | | | | | | | | | | | | | |
| | (a) | Represents net amount purchased (sold). | |
| | (b) | All or a portion represents securities lending income earned from the reinvestment of cash collateral from loaned securities, net of fees and collateral investment expenses, and other payments to and from borrowers of securities. | |
Derivative Financial Instruments Outstanding as of Period End
Futures Contracts
| | | | | | | | | | | | | | | | |
| Description | | Number of
Contracts | | | Expiration
Date | | | Notional
Amount (000) | | | Value/
Unrealized
Appreciation
(Depreciation) | |
Long Contracts | | | | | | | | | | | | | | | | |
Euro BTP | | | 2,290 | | | | 12/08/20 | | | $ | 398,964 | | | $ | 8,908,221 | |
Euro OAT Futures | | | 1,080 | | | | 12/08/20 | | | | 213,968 | | | | 3,231,471 | |
10-Year Australian T-Bond | | | 705 | | | | 12/15/20 | | | | 74,091 | | | | 603,297 | |
DAX Index | | | 49 | | | | 12/18/20 | | | | 16,498 | | | | (2,201,217 | ) |
Euro Stoxx 50 Index | | | 3,846 | | | | 12/18/20 | | | | 132,541 | | | | (16,317,144 | ) |
FTSE/MIB Index | | | 143 | | | | 12/18/20 | | | | 14,907 | | | | (1,534,810 | ) |
MSCI Emerging Markets Index | | | 631 | | | | 12/18/20 | | | | 34,765 | | | | 57,882 | |
Russell 2000 E-Mini Index | | | 675 | | | | 12/18/20 | | | | 51,867 | | | | 1,600,638 | |
10-Year U.S. Treasury Note | | | 6,924 | | | | 12/21/20 | | | | 957,027 | | | | (7,212,433 | ) |
10-Year U.S. Ultra Note | | | 5,468 | | | | 12/21/20 | | | | 860,014 | | | | (9,165,179 | ) |
| | | | | | | | | | | | | | | | |
| | | | | | | | | | | | | | | (22,029,274 | ) |
| | | | | | | | | | | | | | | | |
| | | | |
Short Contracts | | | | | | | | | | | | | | | | |
Euro Bund | | | 118 | | | | 12/08/20 | | | | 24,208 | | | | (311,996 | ) |
Yen Denom Nikkei Index | | | 27 | | | | 12/10/20 | | | | 2,984 | | | | (45,419 | ) |
SPI 200 Index | | | 35 | | | | 12/17/20 | | | | 3,623 | | | | 4,238 | |
NASDAQ 100 E-Mini Index | | | 1,996 | | | | 12/18/20 | | | | 440,966 | | | | 1,410,961 | |
S&P 500 E-Mini Index | | | 11,522 | | | | 12/18/20 | | | | 1,880,794 | | | | 69,977,253 | |
U.S. Long Treasury Bond | | | 71 | | | | 12/21/20 | | | | 12,245 | | | | 314,531 | |
U.S. Ultra Treasury Bond | | | 1,366 | | | | 12/21/20 | | | | 293,690 | | | | 1,840,424 | |
| | |
CONSOLIDATED SCHEDULE OF INVESTMENTS | | 27 |
| | |
Consolidated Schedule of Investments (continued) October 31, 2020 | | BlackRock Global Allocation Fund, Inc. |
Futures Contracts (continued)
| | | | | | | | | | | | | | | | |
| Description | | Number of
Contracts | | | Expiration
Date | | | Notional
Amount (000) | | | Value/
Unrealized
Appreciation
(Depreciation) | |
Short Contracts (continued) | | | | | | | | | | | | | | | | |
2-Year U.S. Treasury Note | | | 7,698 | | | | 12/31/20 | | | $ | 1,700,055 | | | $ | (133,314 | ) |
5-Year U.S. Treasury Note | | | 6,256 | | | | 12/31/20 | | | | 785,763 | | | | 2,428,322 | |
| | | | | | | | | | | | | | | | |
| | | | | | | | | | | | | | | 75,485,000 | |
| | | | | | | | | | | | | | | | |
| | | | | | | | | | | | | | $ | 53,455,726 | |
| | | | | | | | | | | | | | | | |
Forward Foreign Currency Exchange Contracts
| | | | | | | | | | | | | | | | | | | | |
| Currency Purchased | | | Currency Sold | | | Counterparty | | Settlement Date | | | Unrealized
Appreciation
(Depreciation) | |
| JPY | | | 17,179,770,000 | | | USD | | | 162,025,199 | | | JPMorgan Chase Bank N.A. | | | 11/05/20 | | | $ | 2,070,172 | |
| MXN | | | 1,220,134,000 | | | USD | | | 52,865,425 | | | Citibank N.A. | | | 11/05/20 | | | | 4,650,592 | |
| USD | | | 37,399,197 | | | EUR | | | 31,565,000 | | | Barclays Bank PLC | | | 11/05/20 | | | | 635,394 | |
| USD | | | 109,181,857 | | | HKD | | | 846,345,000 | | | HSBC Bank USA N.A. | | | 11/05/20 | | | | 11,669 | |
| JPY | | | 21,673,950,000 | | | USD | | | 203,817,856 | | | UBS AG | | | 11/06/20 | | | | 3,206,756 | |
| USD | | | 109,968,133 | | | HKD | | | 852,352,000 | | | HSBC Bank USA N.A. | | | 11/06/20 | | | | 23,304 | |
| JPY | | | 19,470,050,000 | | | USD | | | 183,851,948 | | | JPMorgan Chase Bank N.A. | | | 11/12/20 | | | | 2,134,172 | |
| USD | | | 33,560,356 | | | EUR | | | 28,321,262 | | | Deutsche Bank AG | | | 11/12/20 | | | | 569,445 | |
| USD | | | 67,571,964 | | | EUR | | | 56,956,027 | | | Citibank N.A. | | | 11/13/20 | | | | 1,223,490 | |
| USD | | | 22,742,332 | | | EUR | | | 19,243,498 | | | Deutsche Bank AG | | | 11/13/20 | | | | 325,446 | |
| KRW | | | 80,826,736,000 | | | USD | | | 68,295,819 | | | Deutsche Bank AG | | | 11/16/20 | | | | 2,775,702 | |
| USD | | | 73,716,298 | | | RUB | | | 5,449,035,000 | | | BNP Paribas S.A. | | | 11/16/20 | | | | 5,226,100 | |
| MYR | | | 260,353,000 | | | USD | | | 62,047,903 | | | Barclays Bank PLC | | | 11/17/20 | | | | 407,707 | |
| MXN | | | 960,614,000 | | | USD | | | 42,796,667 | | | JPMorgan Chase Bank N.A. | | | 11/19/20 | | | | 2,415,032 | |
| USD | | | 22,524,781 | | | EUR | | | 18,885,123 | | | JPMorgan Chase Bank N.A. | | | 11/19/20 | | | | 522,463 | |
| JPY | | | 6,055,650,000 | | | USD | | | 57,080,465 | | | JPMorgan Chase Bank N.A. | | | 12/03/20 | | | | 779,636 | |
| USD | | | 47,680,760 | | | INR | | | 3,525,277,000 | | | Bank of America N.A. | | | 12/08/20 | | | | 541,236 | |
| USD | | | 22,042,723 | | | INR | | | 1,629,365,000 | | | HSBC Bank USA N.A. | | | 12/08/20 | | | | 255,076 | |
| JPY | | | 13,365,100,000 | | | USD | | | 126,146,233 | | | JPMorgan Chase Bank N.A. | | | 12/10/20 | | | | 1,570,748 | |
| GBP | | | 43,845,689 | | | EUR | | | 47,558,000 | | | JPMorgan Chase Bank N.A. | | | 12/17/20 | | | | 1,374,133 | |
| GBP | | | 35,963,000 | | | USD | | | 46,346,086 | | | Citibank N.A. | | | 12/17/20 | | | | 259,674 | |
| JPY | | | 4,168,566,576 | | | EUR | | | 33,354,000 | | | JPMorgan Chase Bank N.A. | | | 12/17/20 | | | | 953,641 | |
| GBP | | | 17,642,000 | | | USD | | | 22,489,965 | | | HSBC Bank USA N.A. | | | 12/29/20 | | | | 375,922 | |
| JPY | | | 22,378,936,000 | | | USD | | | 213,799,371 | | | BNP Paribas S.A. | | | 12/30/20 | | | | 140,937 | |
| JPY | | | 25,727,510 | | | USD | | | 245,385 | | | UBS AG | | | 12/30/20 | | | | 567 | |
| GBP | | | 56,559,000 | | | USD | | | 73,226,287 | | | JPMorgan Chase Bank N.A. | | | 01/08/21 | | | | 86,180 | |
| JPY | | | 6,937,009,549 | | | EUR | | | 56,333,000 | | | JPMorgan Chase Bank N.A. | | | 01/08/21 | | | | 610,038 | |
| JPY | | | 11,135,912,000 | | | USD | | | 105,543,764 | | | Barclays Bank PLC | | | 01/08/21 | | | | 930,410 | |
| USD | | | 43,975,891 | | | INR | | | 3,270,443,000 | | | Barclays Bank PLC | | | 01/08/21 | | | | 381,280 | |
| CAD | | | 39,851,000 | | | USD | | | 29,742,984 | | | Goldman Sachs International | | | 01/14/21 | | | | 180,289 | |
| GBP | | | 90,892,000 | | | USD | | | 116,897,410 | | | JPMorgan Chase Bank N.A. | | | 01/14/21 | | | | 921,002 | |
| JPY | | | 15,251,700,000 | | | USD | | | 144,554,778 | | | Morgan Stanley & Co. International PLC | | | 01/14/21 | | | | 1,282,453 | |
| USD | | | 33,012,651 | | | AUD | | | 46,420,000 | | | Bank of America N.A. | | | 01/15/21 | | | | 371,349 | |
| USD | | | 30,912,212 | | | EUR | | | 26,082,551 | | | JPMorgan Chase Bank N.A. | | | 01/15/21 | | | | 480,171 | |
| GBP | | | 137,973,000 | | | USD | | | 178,654,836 | | | Barclays Bank PLC | | | 01/22/21 | | | | 198,400 | |
| USD | | | 88,004,184 | | | AUD | | | 124,687,000 | | | BNP Paribas S.A. | | | 01/22/21 | | | | 325,005 | |
| EUR | | | 276,920 | | | AUD | | | 459,430 | | | Bank of America N.A. | | | 01/29/21 | | | | 119 | |
| EUR | | | 28,144,080 | | | AUD | | | 46,692,042 | | | Bank of America N.A. | | | 01/29/21 | | | | 12,776 | |
| JPY | | | 11,566,358,861 | | | EUR | | | 94,265,000 | | | HSBC Bank USA N.A. | | | 01/29/21 | | | | 600,111 | |
| | | | | | | | | | | | | | | | | | | | |
| | | | | | | | | | | | | | | | | | | 38,828,597 | |
| | | | | | | | | | | | | | | | | | | | |
| EUR | | | 31,565,000 | | | USD | | | 37,558,171 | | | JPMorgan Chase Bank N.A. | | | 11/05/20 | | | | (794,368 | ) |
| USD | | | 579,908 | | | CNY | | | 4,049,000 | | | Bank of America N.A. | | | 11/05/20 | | | | (24,659 | ) |
| USD | | | 42,104,162 | | | CNY | | | 293,946,000 | | | Citibank N.A. | | | 11/05/20 | | | | (1,785,734 | ) |
| USD | | | 71,599,106 | | | CNY | | | 499,862,000 | | | Citibank N.A. | | | 11/05/20 | | | | (3,036,683 | ) |
| USD | | | 17,442,566 | | | MXN | | | 390,540,806 | | | BNP Paribas S.A. | | | 11/05/20 | | | | (967,175 | ) |
| CHF | | | 48,068,000 | | | USD | | | 52,628,536 | | | JPMorgan Chase Bank N.A. | | | 11/06/20 | | | | (202,266 | ) |
| USD | | | 5,227,523 | | | JPY | | | 555,764,000 | | | BNP Paribas S.A. | | | 11/06/20 | | | | (81,007 | ) |
| | |
| 28 | | 2020 BLACKROCK ANNUAL REPORTTO SHAREHOLDERS |
| | |
Consolidated Schedule of Investments (continued) October 31, 2020 | | BlackRock Global Allocation Fund, Inc. |
Forward Foreign Currency Exchange Contracts (continued)
| | | | | | | | | | | | | | | | | | | | |
| Currency Purchased | | | Currency Sold | | | Counterparty | | Settlement Date | | | Unrealized
Appreciation
(Depreciation) | |
| EUR | | | 28,321,262 | | | USD | | | 33,574,581 | | | Barclays Bank PLC | | | 11/12/20 | | | $ | (583,671 | ) |
| USD | | | 4,597,285 | | | JPY | | | 486,172,000 | | | BNP Paribas S.A. | | | 11/12/20 | | | | (46,835 | ) |
| EUR | | | 113,457,000 | | | USD | | | 134,262,336 | | | JPMorgan Chase Bank N.A. | | | 11/13/20 | | | | (2,095,483 | ) |
| USD | | | 61,044,561 | | | ZAR | | | 1,056,131,953 | | | Bank of America N.A. | | | 11/13/20 | | | | (3,778,775 | ) |
| BRL | | | 49,060,695 | | | USD | | | 8,883,462 | | | Citibank N.A. | | | 11/16/20 | | | | (338,184 | ) |
| RUB | | | 5,449,035,000 | | | USD | | | 73,965,454 | | | BNP Paribas S.A. | | | 11/16/20 | | | | (5,475,257 | ) |
| EUR | | | 74,081,000 | | | USD | | | 87,229,044 | | | Bank of America N.A. | | | 11/19/20 | | | | (920,169 | ) |
| EUR | | | 47,052,363 | | | USD | | | 56,289,683 | | | Bank of America N.A. | | | 12/03/20 | | | | (1,453,915 | ) |
| EUR | | | 172,637 | | | USD | | | 206,530 | | | BNP Paribas S.A. | | | 12/03/20 | | | | (5,335 | ) |
| EUR | | | 28,422,000 | | | USD | | | 33,696,981 | | | Bank of America N.A. | | | 12/04/20 | | | | (572,471 | ) |
| EUR | | | 9,908,182 | | | USD | | | 11,771,409 | | | Barclays Bank PLC | | | 12/04/20 | | | | (223,887 | ) |
| EUR | | | 28,764,053 | | | USD | | | 34,279,382 | | | Citibank N.A. | | | 12/04/20 | | | | (756,225 | ) |
| EUR | | | 26,467 | | | USD | | | 31,286 | | | JPMorgan Chase Bank N.A. | | | 12/10/20 | | | | (435 | ) |
| EUR | | | 28,080,533 | | | USD | | | 33,181,320 | | | JPMorgan Chase Bank N.A. | | | 12/10/20 | | | | (449,196 | ) |
| NOK | | | 6,360,000 | | | USD | | | 705,570 | | | Barclays Bank PLC | | | 12/11/20 | | | | (39,474 | ) |
| NOK | | | 203,628,000 | | | USD | | | 22,582,823 | | | JPMorgan Chase Bank N.A. | | | 12/11/20 | | | | (1,256,416 | ) |
| USD | | | 96,108,493 | | | CNY | | | 660,842,000 | | | HSBC Bank USA N.A. | | | 12/11/20 | | | | (2,308,344 | ) |
| CAD | | | 144,096,190 | | | USD | | | 108,281,036 | | | JPMorgan Chase Bank N.A. | | | 12/17/20 | | | | (100,491 | ) |
| EUR | | | 28,294,329 | | | USD | | | 33,218,176 | | | Barclays Bank PLC | | | 12/17/20 | | | | (230,282 | ) |
| USD | | | 100,860,503 | | | CNY | | | 688,615,000 | | | Barclays Bank PLC | | | 12/30/20 | | | | (1,548,485 | ) |
| EUR | | | 28,364,522 | | | USD | | | 33,100,538 | | | JPMorgan Chase Bank N.A. | | | 01/08/21 | | | | (11,015 | ) |
| EUR | | | 40,734,000 | | | USD | | | 47,689,522 | | | JPMorgan Chase Bank N.A. | | | 01/08/21 | | | | (169,997 | ) |
| EUR | | | 44,809,715 | | | USD | | | 53,146,213 | | | HSBC Bank USA N.A. | | | 01/14/21 | | | | (865,226 | ) |
| EUR | | | 75,578,000 | | | USD | | | 89,009,873 | | | Morgan Stanley & Co. International PLC | | | 01/15/21 | | | | (828,590 | ) |
| USD | | | 102,301,980 | | | CNY | | | 694,744,000 | | | BNP Paribas S.A. | | | 01/15/21 | | | | (896,520 | ) |
| JPY | | | 8,036,248,000 | | | USD | | | 77,077,609 | | | Barclays Bank PLC | | | 01/28/21 | | | | (221,679 | ) |
| JPY | | | 8,036,140,000 | | | USD | | | 77,077,498 | | | Barclays Bank PLC | | | 01/29/21 | | | | (221,666 | ) |
| | | | | | | | | | | | | | | | | | | | |
| | | | | | | | | | | | | | | | | | | (32,289,915 | ) |
| | | | | | | | | | | | | | | | | | | | |
| | | | | | | | | | | | | | | | | | $ | 6,538,682 | |
| | | | | | | | | | | | | | | | | | | | |
Exchange-Traded Options Purchased
| | | | | | | | | | | | | | | | | | | | | | | | | | |
| Description | | Number of
Contracts | | | Expiration
Date | | Exercise Price | | | Notional Amount (000) | | | Value | |
Call | |
Advanced Micro Devices, Inc. | | | 6,699 | | | 11/20/20 | | | USD | | | | 85.00 | | | | USD | | | | 50,437 | | | $ | 576,114 | |
Agilent Technologies, Inc. | | | 3,418 | | | 11/20/20 | | | USD | | | | 105.00 | | | | USD | | | | 34,894 | | | | 726,326 | |
Deutsche Telekom AG | | | 6,904 | | | 11/20/20 | | | EUR | | | | 15.00 | | | | EUR | | | | 9,010 | | | | 68,346 | |
Dow, Inc. | | | 1,535 | | | 11/20/20 | | | USD | | | | 52.50 | | | | USD | | | | 6,983 | | | | 37,608 | |
Global Payments, Inc. | | | 1,315 | | | 11/20/20 | | | USD | | | | 185.00 | | | | USD | | | | 20,743 | | | | 42,738 | |
iShares China Large-Cap ETF | | | 13,777 | | | 11/20/20 | | | USD | | | | 44.50 | | | | USD | | | | 60,757 | | | | 1,467,250 | |
Merck & Co., Inc. | | | 4,118 | | | 11/20/20 | | | USD | | | | 87.50 | | | | USD | | | | 30,971 | | | | 26,767 | |
Micron Technology, Inc. | | | 3,722 | | | 11/20/20 | | | USD | | | | 57.50 | | | | USD | | | | 18,737 | | | | 124,687 | |
PayPal Holdings, Inc. | | | 1,002 | | | 11/20/20 | | | USD | | | | 200.00 | | | | USD | | | | 18,650 | | | | 553,605 | |
Southwest Airlines Co. | | | 2,050 | | | 11/20/20 | | | USD | | | | 40.00 | | | | USD | | | | 8,104 | | | | 442,800 | |
SPDR S&P 500 ETF Trust | | | 16,931 | | | 11/20/20 | | | USD | | | | 350.00 | | | | USD | | | | 552,865 | | | | 2,683,563 | |
SPDR S&P 500 ETF Trust | | | 1,022 | | | 11/20/20 | | | USD | | | | 41.00 | | | | USD | | | | 3,433 | | | | 12,775 | |
SPDR S&P 500 ETF Trust | | | 1,022 | | | 11/20/20 | | | USD | | | | 38.00 | | | | USD | | | | 3,433 | | | | 15,330 | |
SPDR S&P 500 ETF Trust | | | 9,351 | | | 11/20/20 | | | USD | | | | 360.00 | | | | USD | | | | 305,348 | | | | 434,822 | |
SPDR S&P 500 ETF Trust | | | 20,877 | | | 11/20/20 | | | USD | | | | 355.00 | | | | USD | | | | 681,718 | | | | 1,774,545 | |
T-Mobile USA, Inc. | | | 3,421 | | | 11/20/20 | | | USD | | | | 125.00 | | | | USD | | | | 37,484 | | | | 112,893 | |
Walmart, Inc. | | | 1,849 | | | 11/20/20 | | | USD | | | | 150.00 | | | | USD | | | | 25,655 | | | | 230,201 | |
Walt Disney Co. | | | 855 | | | 11/20/20 | | | USD | | | | 140.00 | | | | USD | | | | 10,367 | | | | 49,163 | |
Alphabet, Inc., Class C | | | 153 | | | 12/18/20 | | | USD | | | | 1,620.00 | | | | USD | | | | 24,801 | | | | 1,466,505 | |
Alphabet, Inc., Class C | | | 152 | | | 12/18/20 | | | USD | | | | 1,520.00 | | | | USD | | | | 24,639 | | | | 2,335,480 | |
Amazon.com, Inc. | | | 73 | | | 12/18/20 | | | USD | | | | 3,250.00 | | | | USD | | | | 22,164 | | | | 885,307 | |
Apple, Inc. | | | 1,996 | | | 12/18/20 | | | USD | | | | 122.50 | | | | USD | | | | 21,728 | | | | 400,198 | |
Apple, Inc. | | | 1,990 | | | 12/18/20 | | | USD | | | | 117.50 | | | | USD | | | | 21,663 | | | | 629,835 | |
Bank of America Corp. | | | 8,845 | | | 12/18/20 | | | USD | | | | 27.00 | | | | USD | | | | 20,963 | | | | 296,308 | |
Bank of America Corp. | | | 14,564 | | | 12/18/20 | | | USD | | | | 28.00 | | | | USD | | | | 34,517 | | | | 334,972 | |
| | |
CONSOLIDATED SCHEDULE OF INVESTMENTS | | 29 |
| | |
Consolidated Schedule of Investments (continued) October 31, 2020 | | BlackRock Global Allocation Fund, Inc. |
Exchange-Traded Options Purchased (continued)
| | | | | | | | | | | | | | | | | | | | | | | | | | |
| Description | | Number of
Contracts | | | Expiration
Date | | Exercise Price | | | Notional Amount (000) | | | Value | |
Call (continued) | | | | | | | | | | | | | | | | | | | | | | | | | | |
Charter Communications, Inc., Class A | | | 169 | | | 12/18/20 | | | USD | | | | 670.00 | | | | USD | | | | 10,205 | | | $ | 81,120 | |
Citigroup, Inc. | | | 4,586 | | | 12/18/20 | | | USD | | | | 52.50 | | | | USD | | | | 18,995 | | | | 103,185 | |
ConocoPhillips | | | 6,581 | | | 12/18/20 | | | USD | | | | 36.00 | | | | USD | | | | 18,835 | | | | 253,369 | |
Dow, Inc. | | | 2,413 | | | 12/18/20 | | | USD | | | | 52.50 | | | | USD | | | | 10,977 | | | | 153,226 | |
Exxon Mobil Corp. | | | 4,992 | | | 12/18/20 | | | USD | | | | 37.50 | | | | USD | | | | 16,284 | | | | 292,032 | |
Fortive Corp. | | | 3,227 | | | 12/18/20 | | | USD | | | | 75.00 | | | | USD | | | | 19,878 | | | | 879,357 | |
Global Payments, Inc. | | | 1,359 | | | 12/18/20 | | | USD | | | | 180.00 | | | | USD | | | | 21,437 | | | | 258,210 | |
Health Care Select Sector SPDR Fund | | | 6,041 | | | 12/18/20 | | | USD | | | | 111.00 | | | | USD | | | | 61,413 | | | | 486,300 | |
Hilton Worldwide Holdings, Inc. | | | 954 | | | 12/18/20 | | | USD | | | | 92.50 | | | | USD | | | | 8,377 | | | | 438,840 | |
Industrial Select Sector SPDR Fund | | | 3,629 | | | 12/18/20 | | | USD | | | | 85.00 | | | | USD | | | | 27,533 | | | | 186,894 | |
InvesCo QQQ Trust, Series 1 | | | 4,386 | | | 12/18/20 | | | USD | | | | 310.00 | | | | USD | | | | 118,150 | | | | 567,987 | |
InvesCo QQQ Trust, Series 1 | | | 2,417 | | | 12/18/20 | | | USD | | | | 300.00 | | | | USD | | | | 65,109 | | | | 676,760 | |
InvesCo QQQ Trust, Series 1 | | | 2,821 | | | 12/18/20 | | | USD | | | | 295.00 | | | | USD | | | | 75,992 | | | | 1,121,347 | |
Ishares Latin Amarica ETF | | | 5,538 | | | 12/18/20 | | | USD | | | | 25.00 | | | | USD | | | | 11,657 | | | | 69,225 | |
JPMorgan Chase & Co. | | | 1,323 | | | 12/18/20 | | | USD | | | | 110.00 | | | | USD | | | | 12,971 | | | | 175,959 | |
JPMorgan Chase & Co. | | | 1,813 | | | 12/18/20 | | | USD | | | | 100.00 | | | | USD | | | | 17,775 | | | | 833,980 | |
L3Harris Technologies, Inc. | | | 1,274 | | | 12/18/20 | | | USD | | | | 190.00 | | | | USD | | | | 20,525 | | | | 121,030 | |
Lyondellbasell Industries NV, Class A | | | 1,050 | | | 12/18/20 | | | USD | | | | 75.00 | | | | USD | | | | 7,187 | | | | 212,625 | |
Marathon Oil Corp. | | | 3,465 | | | 12/18/20 | | | USD | | | | 5.00 | | | | USD | | | | 1,372 | | | | 46,778 | |
McDonald’s Corp. | | | 516 | | | 12/18/20 | | | USD | | | | 230.00 | | | | USD | | | | 10,991 | | | | 162,540 | |
McDonald’s Corp. | | | 1,105 | | | 12/18/20 | | | USD | | | | 220.00 | | | | USD | | | | 23,536 | | | | 687,862 | |
Merck & Co., Inc. | | | 3,912 | | | 12/18/20 | | | USD | | | | 90.00 | | | | USD | | | | 29,422 | | | | 46,944 | |
Microsoft Corp. | | | 1,253 | | | 12/18/20 | | | USD | | | | 165.00 | | | | USD | | | | 25,369 | | | | 4,902,362 | |
Microsoft Corp. | | | 1,105 | | | 12/18/20 | | | USD | | | | 220.00 | | | | USD | | | | 22,373 | | | | 439,238 | |
Pioneer Natural Resources Co. | | | 829 | | | 12/18/20 | | | USD | | | | 95.00 | | | | USD | | | | 6,595 | | | | 188,598 | |
Societe Generale SA | | | 4,060 | | | 12/18/20 | | | EUR | | | | 13.00 | | | | EUR | | | | 4,737 | | | | 222,238 | |
Societe Generale SA | | | 2,216 | | | 12/18/20 | | | EUR | | | | 13.50 | | | | EUR | | | | 2,585 | | | | 90,331 | |
SPDR S&P 500 ETF Trust | | | 5,633 | | | 12/18/20 | | | USD | | | | 340.00 | | | | USD | | | | 183,940 | | | | 4,619,060 | |
SPDR S&P 500 ETF Trust | | | 6,525 | | | 12/18/20 | | | USD | | | | 360.00 | | | | USD | | | | 213,067 | | | | 1,174,500 | |
SPDR S&P 500 ETF Trust | | | 2,213 | | | 12/18/20 | | | USD | | | | 350.00 | | | | USD | | | | 72,263 | | | | 927,247 | |
SPDR S&P 500 ETF Trust | | | 2,063 | | | 12/18/20 | | | USD | | | | 365.00 | | | | USD | | | | 67,365 | | | | 238,277 | |
SPDR S&P 500 ETF Trust | | | 3,784 | | | 12/18/20 | | | USD | | | | 355.00 | | | | USD | | | | 123,563 | | | | 1,057,628 | |
SPDR S&P 500 ETF Trust | | | 4,019 | | | 12/18/20 | | | USD | | | | 345.00 | | | | USD | | | | 131,236 | | | | 2,411,400 | |
UniCredit SPA | | | 1,001 | | | 12/18/20 | | | EUR | | | | 7.60 | | | | EUR | | | | 3,218 | | | | 59,923 | |
Valero Energy Corp. | | | 2,281 | | | 12/18/20 | | | USD | | | | 50.00 | | | | USD | | | | 8,807 | | | | 82,116 | |
Walt Disney Co. | | | 2,076 | | | 12/18/20 | | | USD | | | | 140.00 | | | | USD | | | | 25,171 | | | | 331,122 | |
SPDR S&P 500 ETF Trust | | | 1,712 | | | 12/31/20 | | | USD | | | | 350.00 | | | | USD | | | | 55,904 | | | | 832,032 | |
Alibaba Group Holding Ltd., ADR | | | 1,078 | | | 01/15/21 | | | USD | | | | 305.00 | | | | USD | | | | 32,846 | | | | 2,724,645 | |
Amazon.com, Inc. | | | 36 | | | 01/15/21 | | | USD | | | | 2,350.00 | | | | USD | | | | 10,930 | | | | 2,608,020 | |
Amazon.com, Inc. | | | 74 | | | 01/15/21 | | | USD | | | | 3,300.00 | | | | USD | | | | 22,467 | | | | 1,079,475 | |
Apple, Inc. | | | 3,748 | | | 01/15/21 | | | USD | | | | 125.00 | | | | USD | | | | 40,801 | | | | 1,066,306 | |
Autodesk, Inc. | | | 948 | | | 01/15/21 | | | USD | | | | 260.00 | | | | USD | | | | 22,329 | | | | 1,000,140 | |
Bank of America Corp. | | | 8,804 | | | 01/15/21 | | | USD | | | | 27.00 | | | | USD | | | | 20,865 | | | | 497,426 | |
Citigroup, Inc., Class A | | | 5,271 | | | 01/15/21 | | | USD | | | | 45.00 | | | | USD | | | | 22,265 | | | | 661,510 | |
D.R. Horton, Inc. | | | 3,111 | | | 01/15/21 | | | USD | | | | 80.00 | | | | USD | | | | 20,785 | | | | 468,206 | |
Home Depot, Inc. | | | 1,845 | | | 01/15/21 | | | USD | | | | 300.00 | | | | USD | | | | 49,208 | | | | 839,475 | |
Industrial Select Sector SPDR Fund | | | 3,475 | | | 01/15/21 | | | USD | | | | 85.00 | | | | USD | | | | 26,365 | | | | 342,288 | |
Marathon Oil Corp. | | | 3,465 | | | 01/15/21 | | | USD | | | | 5.00 | | | | USD | | | | 1,372 | | | | 74,498 | |
Mastercard, Inc., Class A | | | 1,918 | | | 01/15/21 | | | USD | | | | 335.00 | | | | USD | | | | 55,361 | | | | 752,815 | |
Mastercard, Inc., Class A | | | 701 | | | 01/15/21 | | | USD | | | | 315.00 | | | | USD | | | | 20,234 | | | | 588,840 | |
Merck & Co., Inc. | | | 2,779 | | | 01/15/21 | | | USD | | | | 85.00 | | | | USD | | | | 20,901 | | | | 276,511 | |
Morgan Stanley | | | 4,424 | | | 01/15/21 | | | USD | | | | 55.00 | | | | USD | | | | 21,302 | | | | 524,244 | |
PPG Industries, Inc. | | | 1,939 | | | 01/15/21 | | | USD | | | | 125.00 | | | | USD | | | | 25,153 | | | | 2,016,560 | |
Raytheon Technologies Corp. | | | 3,625 | | | 01/15/21 | | | USD | | | | 65.00 | | | | USD | | | | 19,691 | | | | 473,062 | |
SPDR S&P 500 ETF Trust | | | 7,846 | | | 01/15/21 | | | USD | | | | 365.00 | | | | USD | | | | 256,203 | | | | 1,690,813 | |
Starbucks Corp. | | | 2,923 | | | 01/15/21 | | | USD | | | | 82.50 | | | | USD | | | | 25,418 | | | | 2,287,247 | |
Starbucks Corp. | | | 1,983 | | | 01/15/21 | | | USD | | | | 90.00 | | | | USD | | | | 17,244 | | | | 773,370 | |
Union Pacific Corp. | | | 1,203 | | | 01/15/21 | | | USD | | | | 200.00 | | | | USD | | | | 21,316 | | | | 340,449 | |
VanEck Vectors Semiconductor ETF | | | 619 | | | 01/15/21 | | | USD | | | | 180.00 | | | | USD | | | | 10,829 | | | | 519,960 | |
VanEck Vectors Semiconductor ETF | | | 692 | | | 01/15/21 | | | USD | | | | 185.00 | | | | USD | | | | 12,106 | | | | 439,420 | |
VanEck Vectors Semiconductor ETF | | | 2,787 | | | 01/15/21 | | | USD | | | | 195.00 | | | | USD | | | | 48,759 | | | | 961,515 | |
Walt Disney Co. | | | 3,673 | | | 01/15/21 | | | USD | | | | 140.00 | | | | USD | | | | 44,535 | | | | 861,318 | |
| | |
| 30 | | 2020 BLACKROCK ANNUAL REPORTTO SHAREHOLDERS |
| | |
Consolidated Schedule of Investments (continued) October 31, 2020 | | BlackRock Global Allocation Fund, Inc. |
Exchange-Traded Options Purchased (continued)
| | | | | | | | | | | | | | | | | | | | | | | | | | |
| Description | | Number of
Contracts | | | Expiration
Date | | Exercise Price | | | Notional Amount (000) | | | Value | |
Call (continued) | | | | | | | | | | | | | | | | | | | | | | | | | | |
Alibaba Group Holding Ltd., ADR | | | 1,933 | | | 02/19/21 | | | USD | | | | 210.00 | | | | USD | | | | 58,897 | | | $ | 19,141,532 | |
Microsoft Corp. | | | 1,105 | | | 02/19/21 | | | USD | | | | 215.00 | | | | USD | | | | 22,373 | | | | 1,171,300 | |
Raytheon Technologies Corp. | | | 3,624 | | | 02/19/21 | | | USD | | | | 65.00 | | | | USD | | | | 19,686 | | | | 581,652 | |
SPDR S&P 500 ETF Trust | | | 13,179 | | | 02/19/21 | | | USD | | | | 380.00 | | | | USD | | | | 430,347 | | | | 2,062,513 | |
Bank of America Corp. | | | 4,840 | | | 03/19/21 | | | USD | | | | 25.00 | | | | USD | | | | 11,471 | | | | 771,980 | |
SPDR S&P 500 ETF Trust | | | 1,235 | | | 12/17/21 | | | USD | | | | 360.00 | | | | USD | | | | 40,328 | | | | 1,921,660 | |
| | | | | | | | | | | | | | | | | | | | | | | | | | |
| | | | | | | | | | | | | | | | | | | | | | | | | 90,678,530 | |
| | | | | | | | | | | | | | | | | | | | | | | | | | |
Put | | | | | | | | | | | | | | | | | | | | | | | | | | |
Alphabet, Inc., Class C | | | 144 | | | 11/20/20 | | | USD | | | | 1,415.00 | | | | USD | | | | 23,342 | | | | 144,000 | |
Alphabet, Inc., Class C | | | 126 | | | 11/20/20 | | | USD | | | | 1,480.00 | | | | USD | | | | 20,425 | | | | 245,700 | |
BJ’s Wholesale Club Holdings, Inc. | | | 1,712 | | | 11/20/20 | | | USD | | | | 30.00 | | | | USD | | | | 6,555 | | | | 29,960 | |
NVIDIA Corp. | | | 425 | | | 11/20/20 | | | USD | | | | 470.00 | | | | USD | | | | 21,308 | | | | 667,250 | |
Anthem, Inc. | | | 823 | | | 12/18/20 | | | USD | | | | 250.00 | | | | USD | | | | 22,451 | | | | 777,735 | |
Charter Communications, Inc., Class A | | | 407 | | | 12/18/20 | | | USD | | | | 500.00 | | | | USD | | | | 24,575 | | | | 209,605 | |
UnitedHealth Group, Inc. | | | 736 | | | 12/18/20 | | | USD | | | | 280.00 | | | | USD | | | | 22,458 | | | | 605,360 | |
Alphabet, Inc., Class C | | | 210 | | | 01/15/21 | | | USD | | | | 1,560.00 | | | | USD | | | | 34,041 | | | | 1,758,750 | |
Amazon.com, Inc. | | | 105 | | | 01/15/21 | | | USD | | | | 3,250.00 | | | | USD | | | | 31,880 | | | | 3,901,537 | |
Apple, Inc. | | | 2,614 | | | 01/15/21 | | | USD | | | | 125.00 | | | | USD | | | | 28,456 | | | | 4,992,740 | |
Microsoft Corp. | | | 1,533 | | | 01/15/21 | | | USD | | | | 215.00 | | | | USD | | | | 31,039 | | | | 3,111,990 | |
SPX Volatility Index | | | 4,162 | | | 01/20/21 | | | USD | | | | 22.00 | | | | USD | | | | 15,824 | | | | 416,200 | |
SPX Volatility Index | | | 13,901 | | | 02/17/21 | | | USD | | | | 21.00 | | | | USD | | | | 52,852 | | | | 1,494,357 | |
Amazon.com, Inc. | | | 99 | | | 02/19/21 | | | USD | | | | 3,350.00 | | | | USD | | | | 30,058 | | | | 4,873,275 | |
Microsoft Corp. | | | 1,530 | | | 02/19/21 | | | USD | | | | 215.00 | | | | USD | | | | 30,978 | | | | 3,541,950 | |
SPX Volatility Index | | | 13,901 | | | 03/17/21 | | | USD | | | | 21.00 | | | | USD | | | | 52,852 | | | | 1,980,892 | |
| | | | | | | | | | | | | | | | | | | | | | | | | | |
| | | | | | | | | | | | | | | | | | | | | | | | | 28,751,301 | |
| | | | | | | | | | | | | | | | | | | | | | | | | | |
| | | | | | | | | | | | | | | | | | | | | | | | $ | 119,429,831 | |
| | | | | | | | | | | | | | | | | | | | | | | | | | |
OTC Barrier Options Purchased
| | | | | | | | | | | | | | | | | | | | | | | | | | | | | | | | | | | | | | | | | | |
| Description | | Type of Option | | Counterparty | | | Number of
Contracts | | | Expiration
Date | | | Exercise Price | | | Barrier Price/Range | | | Notional Amount (000) | | | Value | |
Call | | | | | | | | | | | | | | | | | | | | | | | | | | | | | | | | | | | | | | | | | | |
USD Currency | | Down-and-in | | | BNP Paribas S.A. | | | | — | | | | 11/02/20 | | | | ZAR | | | | 16.58 | | | | ZAR | | | | 15.68 | | | | USD | | | | 49,283 | | | $ | 49 | |
| | | | | Morgan Stanley & Co. | | | | | | | | | | | | | | | | | | | | | | | | | | | | | | | | | | | | | |
USD Currency | | Down-and-in | | | International PLC | | | | — | | | | 11/02/20 | | | | MXN | | | | 21.40 | | | | MXN | | | | 20.40 | | | | USD | | | | 105,250 | | | | 105 | |
USD Currency | | One Touch | | | Bank of America N.A. | | | | — | | | | 11/03/20 | | | | CAD | | | | 1.40 | | | | CAD | | | | 1.40 | | | | USD | | | | 4,153 | | | | 615 | |
USD Currency | | One Touch | | | HSBC Bank PLC | | | | — | | | | 02/18/21 | | | | JPY | | | | 100.00 | | | | JPY | | | | 100.00 | | | | USD | | | | 4,851 | | | | 1,443,061 | |
| | | | | | | | | | | | | | | | | | | | | | | | | | | | | | | | | | | | | | | | | | |
| | | | | | | | | | | | | | | | | | | | | | | | | | | | | | | | | | | | | | | | | 1,443,830 | |
| | | | | | | | | | | | | | | | | | | | | | | | | | | | | | | | | | | | | | | | | | |
Put | | | | | | | | | | | | | | | | | | | | | | | | | | | | | | | | | | | | | | | | | | |
AUD Currency | | One Touch | | | Bank of America N.A. | | | | — | | | | 11/12/20 | | | | JPY | | | | 70.00 | | | | JPY | | | | 70.00 | | | | AUD | | | | 12,008 | | | | 666,385 | |
S&P 500 Index | | Down-and-out | |
| JPMorgan Chase
Bank N.A. |
| | | 16,135 | | | | 12/18/20 | | | | USD | | | | 2,900.00 | | | | USD | | | | 2,200.00 | | | | USD | | | | 46,792 | | | | 406,114 | |
| | | | | | | | | | | | | | | | | | | | | | | | | | | | | | | | | | | | | | | | | | |
| | | | | | | | | | | | | | | | | | | | | | | | | | | | | | | | | | | | | | | | | 1,072,499 | |
| | | | | | | | | | | | | | | | | | | | | | | | | | | | | | | | | | | | | | | | | | |
| | | | | | | | | | | | | | | | | | | | | | | | | | | | | | | | | | | | | | | | $ | 2,516,329 | |
| | | | | | | | | | | | | | | | | | | | | | | | | | | | | | | | | | | | | | | | | | |
OTC Options Purchased
| | | | | | | | | | | | | | | | | | | | | | | | | | | | | | |
| Description | | Counterparty | | Number of
Contracts | | | Expiration
Date | | | Exercise Price | | | Notional
Amount (000) | | | Value | |
Call | | | | | | | | | | | | | | | | | | | | | | | | | | | | | | |
USD Currency | | Bank of America N.A. | | | — | | | | 11/02/20 | | | | ZAR | | | | 17.03 | | | | USD | | | | 55,966 | | | $ | 1,007 | |
USD Currency | | Bank of America N.A. | | | — | | | | 11/03/20 | | | | CAD | | | | 1.36 | | | | USD | | | | 137,568 | | | | 16,233 | |
USD Currency | | Citibank N.A. | | | — | | | | 11/03/20 | | | | CNH | | | | 7.05 | | | | USD | | | | 103,176 | | | | 309 | |
USD Currency | | Morgan Stanley & Co. International PLC | | | — | | | | 11/19/20 | | | | NOK | | | | 10.70 | | | | USD | | | | 108,103 | | | | 84,645 | |
Boston Scientific Corp. | | Nomura International PLC | | | 340,784 | | | | 11/20/20 | | | | USD | | | | 41.00 | | | | USD | | | | 11,679 | | | | 28,513 | |
Capital One Financial Corp. | | Nomura International PLC | | | 156,407 | | | | 11/20/20 | | | | USD | | | | 55.00 | | | | USD | | | | 11,430 | | | | 2,845,478 | |
SPDR Gold Shares(a) | | Goldman Sachs International | | | 435,391 | | | | 11/20/20 | | | | USD | | | | 182.00 | | | | USD | | | | 76,716 | | | | 946,074 | |
Union Pacific Corp. | | Goldman Sachs International | | | 129,128 | | | | 11/20/20 | | | | USD | | | | 207.50 | | | | USD | | | | 22,880 | | | | 21,726 | |
GBP Currency | | UBS AG | | | — | | | | 12/17/20 | | | | USD | | | | 1.31 | | | | GBP | | | | 43,487 | | | | 550,304 | |
| | |
CONSOLIDATED SCHEDULE OF INVESTMENTS | | 31 |
| | |
Consolidated Schedule of Investments (continued) October 31, 2020 | | BlackRock Global Allocation Fund, Inc. |
OTC Options Purchased (continued)
| | | | | | | | | | | | | | | | | | | | | | | | | | | | | | |
| Description | | Counterparty | | Number of
Contracts | | | Expiration
Date | | | Exercise Price | | | Notional
Amount (000) | | | Value | |
Call (continued) | | | | | | | | | | | | | | | | | | | | | | |
adidas AG | | Barclays Bank PLC | | | 64,213 | | | | 12/18/20 | | | | EUR | | | | 285.00 | | | | EUR | | | | 16,381 | | | $ | 372,286 | |
Bank of Ireland Group PLC | | Morgan Stanley & Co. International PLC | | | 110,217 | | | | 12/18/20 | | | | EUR | | | | 1.90 | | | | EUR | | | | 110 | | | | 33,888 | |
LVMH Moet Hennessy Louis Vuitton SE | | Barclays Bank PLC | | | 85,444 | | | | 12/18/20 | | | | EUR | | | | 415.00 | | | | EUR | | | | 34,389 | | | | 1,409,094 | |
SPDR Gold Shares(a) | | BNP Paribas S.A. | | | 217,629 | | | | 12/18/20 | | | | USD | | | | 184.00 | | | | USD | | | | 38,346 | | | | 591,951 | |
SPDR Gold Shares(a) | | Morgan Stanley & Co. International PLC | | | 217,594 | | | | 12/18/20 | | | | USD | | | | 185.00 | | | | USD | | | | 38,340 | | | | 542,897 | |
SPDR Gold Shares(a) | | Morgan Stanley & Co. International PLC | | | 326,699 | | | | 12/18/20 | | | | USD | | | | 183.00 | | | | USD | | | | 57,564 | | | | 968,662 | |
SPDR Gold Shares(a) | | Societe Generale | | | 296,445 | | | | 12/18/20 | | | | USD | | | | 198.21 | | | | USD | | | | 52,234 | | | | 105,968 | |
SPDR Gold Shares(a) | | Societe Generale | | | 326,293 | | | | 12/31/20 | | | | USD | | | | 184.00 | | | | USD | | | | 57,493 | | | | 1,096,609 | |
SPDR Gold Shares(a) | | Societe Generale | | | 87,292 | | | | 01/15/21 | | | | USD | | | | 186.00 | | | | USD | | | | 15,381 | | | | 296,793 | |
SPDR Gold Shares(a) | | Societe Generale | | | 172,180 | | | | 01/15/21 | | | | USD | | | | 182.00 | | | | USD | | | | 30,338 | | | | 656,359 | |
SPDR Gold Shares(a) | | Societe Generale | | | 173,377 | | | | 01/15/21 | | | | USD | | | | 190.00 | | | | USD | | | | 30,549 | | | | 452,514 | |
EUR Currency | | BNP Paribas S.A. | | | — | | | | 01/27/21 | | | | USD | | | | 1.22 | | | | EUR | | | | 108,454 | | | | 366,553 | |
Topix-Bank Index | | Goldman Sachs International | | | 577,992 | | | | 02/12/21 | | | | JPY | | | | 1,650.00 | | | | JPY | | | | 578 | | | | 165,622 | |
Safran SA | | Barclays Bank PLC | | | 118,987 | | | | 02/19/21 | | | | EUR | | | | 86.00 | | | | EUR | | | | 10,776 | | | | 1,718,503 | |
Wisdomtree Japan Hedged Equity Fund | | Goldman Sachs International | | | 218,295 | | | | 02/19/21 | | | | USD | | | | 50.00 | | | | USD | | | | 218 | | | | 253,257 | |
Safran SA | | UBS AG | | | 137,786 | | | | 03/19/21 | | | | EUR | | | | 88.89 | | | | EUR | | | | 12,479 | | | | 1,938,518 | |
SPDR Gold Shares(a) | | Morgan Stanley & Co. International PLC | | | 302,874 | | | | 03/19/21 | | | | USD | | | | 191.10 | | | | USD | | | | 53,366 | | | | 251,748 | |
SPDR S&P 500 ETF Trust | | Morgan Stanley & Co. International PLC | | | 575,800 | | | | 06/18/21 | | | | USD | | | | 360.00 | | | | USD | | | | 576 | | | | 5,576,496 | |
Euro Stoxx 50 | | Credit Suisse International | | | 13,417 | | | | 12/17/21 | | | | EUR | | | | 3,400.00 | | | | EUR | | | | 13 | | | | 1,041,851 | |
| | | | | | | | | | | | | | | | | | | | | | | | | | | | | | |
| | | | | | | | | | | | | | | | | | | | | | | | | | | | | 22,333,858 | |
| | | | | | | | | | | | | | | | | | | | | | | | | | | | | | |
Put | | | | | | | | | | | | | | | | | | | | | | | | | | | | | | |
USD Currency | | Morgan Stanley & Co. International PLC | | | — | | | | 11/13/20 | | | | BRL | | | | 5.10 | | | | USD | | | | 69,100 | | | | 2,488 | |
Amazon.com, Inc. | | Citibank N.A. | | | 9,811 | | | | 11/20/20 | | | | USD | | | | 2,881.58 | | | | USD | | | | 29,788 | | | | 783,585 | |
D.R. Horton, Inc. | | Credit Suisse International | | | 213,017 | | | | 11/20/20 | | | | USD | | | | 70.00 | | | | USD | | | | 14,232 | | | | 1,166,268 | |
Lennar Corp., Class A | | JPMorgan Chase Bank N.A. | | | 97,987 | | | | 11/20/20 | | | | USD | | | | 76.00 | | | | USD | | | | 6,882 | | | | 703,379 | |
USD Currency | | JPMorgan Chase Bank N.A. | | | — | | | | 12/01/20 | | | | RUB | | | | 76.00 | | | | USD | | | | 34,042 | | | | 181,375 | |
USD Currency | | Bank of America N.A. | | | — | | | | 12/02/20 | | | | MXN | | | | 20.60 | | | | USD | | | | 101,380 | | | | 1,010,252 | |
Walgreens Boots Alliance, Inc. | | Morgan Stanley & Co. International PLC | | | 319,806 | | | | 12/18/20 | | | | USD | | | | 33.00 | | | | USD | | | | 320 | | | | 570,403 | |
USD Currency | | Morgan Stanley & Co. International PLC | | | — | | | | 01/21/21 | | | | JPY | | | | 104.00 | | | | USD | | | | 174,575 | | | | 2,129,117 | |
| | | | | | | | | | | | | | | | | | | | | | | | | | | | | | |
| | | | | | | | | | | | | | | | | | | | | | | | | | | | | 6,546,867 | |
| | | | | | | | | | | | | | | | | | | | | | | | | | | | | | |
| | | | | | | | | | | | | | | | | | | | | | | | | | | | $ | 28,880,725 | |
| | | | | | | | | | | | | | | | | | | | | | | | | | | | | | |
| | (a) | All or a portion of the security is held by a wholly-owned subsidiary. See Note 1 of the Notes to Consolidated Financial Statements for details on the wholly-owned subsidiary. | |
OTC Credit Default Swaptions Purchased
| | | | | | | | | | | | | | | | | | | | | | | | | | | | | | | | | | |
Description | | Paid by the Fund | | Received by the Fund | | Counterparty | | Expiration
Date | | | Credit
Rating | | | Exercise
Price | | | Notional
Amount (000) | | | Value | |
| | Rate | | | Frequency | | Rate | | | Frequency |
Call | | | | | | | | | | | | | | | | | | | | | | | | | | | | | | | | | | |
Sold Protection on 5-Year Credit Default Swap, 06/20/25 | | | CDX.NA.HY.34.V9 | | | Quarterly | | | 5.00% | | | Quarterly | | Barclays Bank PLC | | | 12/16/20 | | | | NR | | | | USD 105.00 | | | | USD 12,109 | | | $ | 121,265 | |
| | | | | | | | | | | | | | | | | | | | | | | | | | | | | | | | | | |
OTC Interest Rate Swaptions Purchased
| | | | | | | | | | | | | | | | | | | | | | | | | | | | | | | | | | |
Description | | Paid by the Fund | | Received by the Fund | | Counterparty | | Expiration
Date | | | Exercise
Rate | | | Notional
Amount (000) | | | Value | |
| | Rate | | | Frequency | | Rate | | | Frequency |
Call | | | | | | | | | | | | | | | | | | | | | | | | | | | | | | | | | | |
30-Year Interest Rate Swap, 12/20/50 | |
| 3-Month
LIBOR, 0.22% |
| | Quarterly | | | 0.85% | | | Semi-Annual | | Goldman Sachs International | | | 12/18/20 | | | | 0.85 | % | | | USD | | | | 119,778 | | | $ | 586,598 | |
30-Year Interest Rate Swap, 06/06/51 | |
| 3-Month
LIBOR, 0.22% |
| | Quarterly | | | 1.00% | | | Semi-Annual | | JPMorgan Chase Bank N.A. | | | 06/04/21 | | | | 1.00 | | | | USD | | | | 101,372 | | | | 2,940,876 | |
30-Year Interest Rate Swap, 06/13/51 | |
| 3-Month
LIBOR, 0.22% |
| | Quarterly | | | 1.00% | | | Semi-Annual | | BNP Paribas S.A. | | | 06/11/21 | | | | 1.00 | | | | USD | | | | 33,056 | | | | 979,559 | |
| | | | | | | | | | | | | | | | | | | | | | | | | | | | | | | | | | |
| | | | | | | | | | | | | | | | | | | | | | | | | | | | | | | | | 4,507,033 | |
| | | | | | | | | | | | | | | | | | | | | | | | | | | | | | | | | | |
| | |
| 32 | | 2020 BLACKROCK ANNUAL REPORTTO SHAREHOLDERS |
| | |
Consolidated Schedule of Investments (continued) October 31, 2020 | | BlackRock Global Allocation Fund, Inc. |
OTC Interest Rate Swaptions Purchased (continued)
| | | | | | | | | | | | | | | | | | | | | | | | | | | | | | | | |
Description | | Paid by the Fund | | Received by the Fund | | Counterparty | | Expiration
Date | | | Exercise
Rate | | | Notional
Amount (000) | | | Value | |
| | Rate | | Frequency | | Rate | | | Frequency |
Put | | | | | | | | | | | | | | | | | | | | | | | | | | | | | | | | |
10-Year Interest Rate Swap, 11/21/30 | | 0.81% | | Semi-Annual | |
| 3-Month
LIBOR, 0.22% |
| | Quarterly | | Citibank N.A. | | | 11/19/20 | | | | 0.81 | % | | | USD | | | | 83,001 | | | $ | 948,915 | |
30-Year Interest Rate Swap, 11/26/50 | | 1.22% | | Semi-Annual | |
| 3-Month
LIBOR, 0.22% |
| | Quarterly | | Citibank N.A. | | | 11/24/20 | | | | 1.22 | | | | USD | | | | 30,946 | | | | 1,190,372 | |
30-Year Interest Rate Swap, 12/26/50 | | 1.27% | | Semi-Annual | |
| 3-Month
LIBOR, 0.22% |
| | Quarterly | | Citibank N.A. | | | 12/24/20 | | | | 1.27 | | | | USD | | | | 30,946 | | | | 1,312,965 | |
30-Year Interest Rate Swap, 01/28/51 | | 1.48% | | Semi-Annual | |
| 3-Month
LIBOR, 0.22% |
| | Quarterly | | Citibank N.A. | | | 01/26/21 | | | | 1.48 | | | | USD | | | | 97,002 | | | | 2,562,674 | |
30-Year Interest Rate Swap, 02/10/51 | | 0.89% | | Semi-Annual | |
| 3-Month
LIBOR, 0.22% |
| | Quarterly | | Citibank N.A. | | | 02/08/21 | | | | 0.89 | | | | USD | | | | 57,762 | | | | 7,052,958 | |
5-Year Interest Rate Swap, 04/08/26 | | 0.60% | | Semi-Annual | |
| 3-Month
LIBOR, 0.22% |
| | Quarterly | | Bank of America N.A. | | | 04/06/21 | | | | 0.60 | | | | USD | | | | 308,805 | | | | 1,155,562 | |
5-Year Interest Rate Swap, 04/08/26 | | 0.60% | | Semi-Annual | |
| 3-Month
LIBOR, 0.22% |
| | Quarterly | | Bank of America N.A. | | | 04/06/21 | | | | 0.60 | | | | USD | | | | 441,149 | | | | 1,650,803 | |
5-Year Interest Rate Swap, 04/08/26 | | 0.62% | | Semi-Annual | |
| 3-Month
LIBOR, 0.22% |
| | Quarterly | | Bank of America N.A. | | | 04/06/21 | | | | 0.62 | | | | USD | | | | 308,805 | | | | 1,055,769 | |
| | | | | | | | | | | | | | | | | | | | | | | | | | | | | | | | |
| | | | | | | | | | | | | | | | | | | | | | | | | | | | | | | 16,930,018 | |
| | | | | | | | | | | | | | | | | | | | | | | | | | | | | | | | |
| | | | | | | | | | | | | | | | | | | | | | | | | | | | | | $ | 21,437,051 | |
| | | | | | | | | | | | | | | | | | | | | | | | | | | | | | | | |
Exchange-Traded Options Written
| | | | | | | | | | | | | | | | | | | | | | | | |
| Description | | Number of
Contracts | | | Expiration
Date | | | Exercise Price | | | Notional
Amount (000) | | | Value | |
| Call | |
SPDR S&P 500 ETF Trust | | | 13,396 | | | | 11/06/20 | | | USD | | | 345.00 | | | USD | | | 437,433 | | | $ | (850,646 | ) |
Abbott Laboratories | | | 1,181 | | | | 11/20/20 | | | USD | | | 110.00 | | | USD | | | 12,413 | | | | (222,619 | ) |
Advanced Micro Devices, Inc. | | | 10,717 | | | | 11/20/20 | | | USD | | | 92.50 | | | USD | | | 80,688 | | | | (316,151 | ) |
Agilent Technologies, Inc. | | | 1,229 | | | | 11/20/20 | | | USD | | | 110.00 | | | USD | | | 12,547 | | | | (141,335 | ) |
Agilent Technologies, Inc. | | | 3,418 | | | | 11/20/20 | | | USD | | | 115.00 | | | USD | | | 34,894 | | | | (111,085 | ) |
Amazon.com, Inc. | | | 170 | | | | 11/20/20 | | | USD | | | 3,500.00 | | | USD | | | 51,615 | | | | (301,750 | ) |
Bank of America Corp. | | | 4,772 | | | | 11/20/20 | | | USD | | | 26.00 | | | USD | | | 11,310 | | | | (124,072 | ) |
Citigroup, Inc. | | | 2,666 | | | | 11/20/20 | | | USD | | | 47.50 | | | USD | | | 11,043 | | | | (73,315 | ) |
Edwards Lifesciences Corp. | | | 1,471 | | | | 11/20/20 | | | USD | | | 85.00 | | | USD | | | 10,546 | | | | (36,775 | ) |
Facebook, Inc., Class A | | | 1,160 | | | | 11/20/20 | | | USD | | | 290.00 | | | USD | | | 30,521 | | | | (365,400 | ) |
Intuitive Surgical, Inc. | | | 166 | | | | 11/20/20 | | | USD | | | 760.00 | | | USD | | | 11,074 | | | | (59,345 | ) |
iShares China Large-Cap ETF | | | 6,889 | | | | 11/20/20 | | | USD | | | 47.00 | | | USD | | | 30,380 | | | | (189,448 | ) |
JPMorgan Chase & Co. | | | 1,187 | | | | 11/20/20 | | | USD | | | 105.00 | | | USD | | | 11,637 | | | | (141,847 | ) |
Morgan Stanley | | | 4,749 | | | | 11/20/20 | | | USD | | | 55.00 | | | USD | | | 22,866 | | | | (85,482 | ) |
NextEra Energy, Inc. | | | 3,412 | | | | 11/20/20 | | | USD | | | 77.50 | | | USD | | | 24,979 | | | | (281,490 | ) |
NVIDIA Corp. | | | 465 | | | | 11/20/20 | | | USD | | | 560.00 | | | USD | | | 23,313 | | | | (397,575 | ) |
NVIDIA Corp. | | | 216 | | | | 11/20/20 | | | USD | | | 620.00 | | | USD | | | 10,829 | | | | (42,984 | ) |
PayPal Holdings, Inc. | | | 1,002 | | | | 11/20/20 | | | USD | | | 220.00 | | | USD | | | 18,650 | | | | (168,336 | ) |
Pfizer, Inc. | | | 8,606 | | | | 11/20/20 | | | USD | | | 40.00 | | | USD | | | 30,534 | | | | (266,786 | ) |
Pfizer, Inc. | | | 3,302 | | | | 11/20/20 | | | USD | | | 41.00 | | | USD | | | 11,715 | | | | (75,946 | ) |
ServiceNow, Inc. | | | 272 | | | | 11/20/20 | | | USD | | | 490.00 | | | USD | | | 13,534 | | | | (699,040 | ) |
U.S. Bancorp | | | 4,495 | | | | 11/20/20 | | | USD | | | 42.50 | | | USD | | | 17,508 | | | | (209,018 | ) |
Western Digital Corp. | | | 551 | | | | 11/20/20 | | | USD | | | 45.00 | | | USD | | | 2,079 | | | | (12,122 | ) |
Alphabet, Inc., Class C | | | 153 | | | | 12/18/20 | | | USD | | | 1,800.00 | | | USD | | | 24,801 | | | | (431,460 | ) |
Alphabet, Inc., Class C | | | 152 | | | | 12/18/20 | | | USD | | | 1,650.00 | | | USD | | | 24,639 | | | | (1,171,920 | ) |
Amazon.com, Inc. | | | 73 | | | | 12/18/20 | | | USD | | | 3,600.00 | | | USD | | | 22,164 | | | | (299,665 | ) |
Anthem, Inc. | | | 823 | | | | 12/18/20 | | | USD | | | 290.00 | | | USD | | | 22,451 | | | | (761,275 | ) |
Apple, Inc. | | | 1,996 | | | | 12/18/20 | | | USD | | | 140.00 | | | USD | | | 21,728 | | | | (89,820 | ) |
Apple, Inc. | | | 1,990 | | | | 12/18/20 | | | USD | | | 130.00 | | | USD | | | 21,663 | | | | (194,025 | ) |
Charter Communications, Inc., Class A | | | 407 | | | | 12/18/20 | | | USD | | | 600.00 | | | USD | | | 24,575 | | | | (1,188,440 | ) |
Charter Communications, Inc., Class A | | | 208 | | | | 12/18/20 | | | USD | | | 660.00 | | | USD | | | 12,559 | | | | (128,960 | ) |
Fortive Corp. | | | 3,227 | | | | 12/18/20 | | | USD | | | 85.00 | | | USD | | | 19,878 | | | | (145,215 | ) |
HCA Healthcare, Inc. | | | 1,012 | | | | 12/18/20 | | | USD | | | 145.00 | | | USD | | | 12,543 | | | | (177,100 | ) |
InvesCo.QQQ Trust, Series 1 | | | 2,417 | | | | 12/18/20 | | | USD | | | 330.00 | | | USD | | | 65,109 | | | | (67,676 | ) |
JPMorgan Chase & Co. | | | 1,813 | | | | 12/18/20 | | | USD | | | 115.00 | | | USD | | | 17,775 | | | | (113,313 | ) |
Lyondellbasell Industries NV, Class A | | | 1,050 | | | | 12/18/20 | | | USD | | | 85.00 | | | USD | | | 7,187 | | | | (47,250 | ) |
| | |
CONSOLIDATED SCHEDULE OF INVESTMENTS | | 33 |
| | |
Consolidated Schedule of Investments (continued) October 31, 2020 | | BlackRock Global Allocation Fund, Inc. |
Exchange-Traded Options Written (continued)
| | | | | | | | | | | | | | | | | | | | | | | | |
| Description | | Number of
Contracts | | | Expiration
Date | | | Exercise Price | | | Notional
Amount (000) | | | Value | |
Call (continued) | | | | | | | | | | | | | | | | | | | | | | | | |
McDonald’s Corp. | | | 516 | | | | 12/18/20 | | | USD | | | 250.00 | | | USD | | | 10,991 | | | $ | (39,732 | ) |
McDonald’s Corp. | | | 1,105 | | | | 12/18/20 | | | USD | | | 240.00 | | | USD | | | 23,537 | | | | (178,458 | ) |
Microsoft Corp. | | | 1,252 | | | | 12/18/20 | | | USD | | | 190.00 | | | USD | | | 25,349 | | | | (2,325,590 | ) |
Microsoft Corp. | | | 1,105 | | | | 12/18/20 | | | USD | | | 250.00 | | | USD | | | 22,373 | | | | (57,460 | ) |
Societe Generale SA | | | 4,060 | | | | 12/18/20 | | | EUR | | | 15.00 | | | EUR | | | 4,737 | | | | (70,928 | ) |
Societe Generale SA | | | 2,216 | | | | 12/18/20 | | | EUR | | | 16.00 | | | EUR | | | 2,585 | | | | (20,647 | ) |
Truist Financial Corp. | | | 1,629 | | | | 12/18/20 | | | USD | | | 47.50 | | | USD | | | 6,861 | | | | (105,885 | ) |
U.S. Bancorp | | | 2,963 | | | | 12/18/20 | | | USD | | | 42.50 | | | USD | | | 11,541 | | | | (299,263 | ) |
UnitedHealth Group, Inc. | | | 736 | | | | 12/18/20 | | �� | USD | | | 320.00 | | | USD | | | 22,458 | | | | (693,680 | ) |
Walt Disney Co. | | | 2,076 | | | | 12/18/20 | | | USD | | | 155.00 | | | USD | | | 25,172 | | | | (92,382 | ) |
10-Year U.S. Treasury Note | | | 10,383 | | | | 12/24/20 | | | USD | | | 139.50 | | | USD | | | 1,431 | | | | (2,920,219 | ) |
Alibaba Group Holding Ltd., ADR | | | 1,078 | | | | 01/15/21 | | | USD | | | 350.00 | | | USD | | | 32,846 | | | | (927,080 | ) |
Amazon.com, Inc. | | | 73 | | | | 01/15/21 | | | USD | | | 2,900.00 | | | USD | | | 22,164 | | | | (2,351,877 | ) |
Amazon.com, Inc. | | | 74 | | | | 01/15/21 | | | USD | | | 3,750.00 | | | USD | | | 22,468 | | | | (357,975 | ) |
Apple, Inc. | | | 7,496 | | | | 01/15/21 | | | USD | | | 150.00 | | | USD | | | 81,601 | | | | (449,760 | ) |
Apple, Inc. | | | 2,769 | | | | 01/15/21 | | | USD | | | 130.00 | | | USD | | | 30,143 | | | | (553,800 | ) |
Apple, Inc. | | | 2,914 | | | | 01/15/21 | | | USD | | | 140.00 | | | USD | | | 31,722 | | | | (298,685 | ) |
Applied Materials, Inc. | | | 4,129 | | | | 01/15/21 | | | USD | | | 70.00 | | | USD | | | 24,456 | | | | (493,415 | ) |
Autodesk, Inc. | | | 1,757 | | | | 01/15/21 | | | USD | | | 290.00 | | | USD | | | 41,384 | | | | (676,445 | ) |
Bank of America Corp. | | | 4,772 | | | | 01/15/21 | | | USD | | | 28.00 | | | USD | | | 11,310 | | | | (195,652 | ) |
Bank of America Corp. | | | 8,804 | | | | 01/15/21 | | | USD | | | 31.00 | | | USD | | | 20,865 | | | | (136,462 | ) |
Citigroup, Inc. | | | 4,341 | | | | 01/15/21 | | | USD | | | 50.00 | | | USD | | | 17,980 | | | | (314,722 | ) |
Citigroup, Inc. | | | 2,535 | | | | 01/15/21 | | | USD | | | 55.00 | | | USD | | | 10,500 | | | | (72,248 | ) |
Citigroup, Inc., Class A | | | 5,271 | | | | 01/15/21 | | | USD | | | 52.50 | | | USD | | | 22,265 | | | | (63,252 | ) |
Guardant Health, Inc. | | | 1,232 | | | | 01/15/21 | | | USD | | | 120.00 | | | USD | | | 13,141 | | | | (868,560 | ) |
Home Depot, Inc. | | | 920 | | | | 01/15/21 | | | USD | | | 320.00 | | | USD | | | 24,537 | | | | (162,380 | ) |
Home Depot, Inc. | | | 1,845 | | | | 01/15/21 | | | USD | | | 330.00 | | | USD | | | 49,208 | | | | (219,555 | ) |
JPMorgan Chase & Co. | | | 1,187 | | | | 01/15/21 | | | USD | | | 110.00 | | | USD | | | 11,637 | | | | (252,238 | ) |
JPMorgan Chase & Co. | | | 1,156 | | | | 01/15/21 | | | USD | | | 120.00 | | | USD | | | 11,333 | | | | (73,984 | ) |
JPMorgan Chase & Co. | | | 698 | | | | 01/15/21 | | | USD | | | 115.00 | | | USD | | | 6,843 | | | | (82,713 | ) |
Lowe’s Cos., Inc. | | | 1,830 | | | | 01/15/21 | | | USD | | | 180.00 | | | USD | | | 28,932 | | | | (663,375 | ) |
Lowe’s Cos., Inc. | | | 876 | | | | 01/15/21 | | | USD | | | 190.00 | | | USD | | | 13,850 | | | | (167,316 | ) |
Mastercard, Inc., Class A | | | 1,918 | | | | 01/15/21 | | | USD | | | 365.00 | | | USD | | | 55,361 | | | | (216,734 | ) |
Mastercard, Inc., Class A | | | 701 | | | | 01/15/21 | | | USD | | | 350.00 | | | USD | | | 20,234 | | | | (143,004 | ) |
McDonald’s Corp. | | | 1,148 | | | | 01/15/21 | | | USD | | | 240.00 | | | USD | | | 24,452 | | | | (311,108 | ) |
McDonald’s Corp. | | | 599 | | | | 01/15/21 | | | USD | | | 250.00 | | | USD | | | 12,759 | | | | (84,160 | ) |
Morgan Stanley | | | 4,424 | | | | 01/15/21 | | | USD | | | 62.50 | | | USD | | | 21,302 | | | | (119,448 | ) |
Morgan Stanley | | | 2,393 | | | | 01/15/21 | | | USD | | | 60.00 | | | USD | | | 11,522 | | | | (105,292 | ) |
Morgan Stanley | | | 2,361 | | | | 01/15/21 | | | USD | | | 57.50 | | | USD | | | 11,368 | | | | (169,992 | ) |
PPG Industries, Inc. | | | 1,939 | | | | 01/15/21 | | | USD | | | 140.00 | | | USD | | | 25,153 | | | | (678,650 | ) |
Raytheon Technologies Corp. | | | 3,625 | | | | 01/15/21 | | | USD | | | 75.00 | | | USD | | | 19,691 | | | | (134,125 | ) |
ResMed, Inc. | | | 468 | | | | 01/15/21 | | | USD | | | 195.00 | | | USD | | | 8,983 | | | | (458,640 | ) |
SPDR S&P 500 ETF Trust | | | 695 | | | | 01/15/21 | | | USD | | | 367.00 | | | USD | | | 22,695 | | | | (128,923 | ) |
SPDR S&P 500 ETF Trust | | | 7,846 | | | | 01/15/21 | | | USD | | | 380.00 | | | USD | | | 256,203 | | | | (580,604 | ) |
Starbucks Corp. | | | 2,923 | | | | 01/15/21 | | | USD | | | 92.50 | | | USD | | | 25,418 | | | | (844,747 | ) |
Starbucks Corp. | | | 1,983 | | | | 01/15/21 | | | USD | | | 100.00 | | | USD | | | 17,244 | | | | (231,020 | ) |
Truist Financial Corp. | | | 1,629 | | | | 01/15/21 | | | USD | | | 50.00 | | | USD | | | 6,861 | | | | (89,595 | ) |
U.S. Bancorp | | | 2,963 | | | | 01/15/21 | | | USD | | | 45.00 | | | USD | | | 11,541 | | | | (210,373 | ) |
Union Pacific Corp. | | | 1,203 | | | | 01/15/21 | | | USD | | | 230.00 | | | USD | | | 21,316 | | | | (48,722 | ) |
VanEck Vectors Semiconductor ETF | | | 619 | | | | 01/15/21 | | | USD | | | 205.00 | | | USD | | | 10,829 | | | | (109,563 | ) |
VanEck Vectors Semiconductor ETF | | | 692 | | | | 01/15/21 | | | USD | | | 210.00 | | | USD | | | 12,107 | | | | (87,884 | ) |
Walt Disney Co. | | | 1,770 | | | | 01/15/21 | | | USD | | | 155.00 | | | USD | | | 21,461 | | | | (138,060 | ) |
Zoetis, Inc. | | | 387 | | | | 01/15/21 | | | USD | | | 175.00 | | | USD | | | 6,136 | | | | (127,710 | ) |
Alibaba Group Holding Ltd., ADR | | | 1,939 | | | | 02/19/21 | | | USD | | | 350.00 | | | USD | | | 59,079 | | | | (2,355,885 | ) |
Amazon.com, Inc. | | | 140 | | | | 02/19/21 | | | USD | | | 3,900.00 | | | USD | | | 42,506 | | | | (899,150 | ) |
Bank of America Corp. | | | 4,654 | | | | 02/19/21 | | | USD | | | 30.00 | | | USD | | | 11,030 | | | | (153,582 | ) |
Bank of America Corp. | | | 5,525 | | | | 02/19/21 | | | USD | | | 29.00 | | | USD | | | 13,094 | | | | (251,388 | ) |
Microsoft Corp. | | | 1,105 | | | | 02/19/21 | | | USD | | | 245.00 | | | USD | | | 22,373 | | | | (333,157 | ) |
Raytheon Technologies Corp. | | | 3,624 | | | | 02/19/21 | | | USD | | | 75.00 | | | USD | | | 19,686 | | | | (201,132 | ) |
salesforce.com, Inc. | | | 898 | | | | 02/19/21 | | | USD | | | 300.00 | | | USD | | | 20,858 | | | | (424,305 | ) |
Apple, Inc. | | | 1,734 | | | | 03/19/21 | | | USD | | | 150.00 | | | USD | | | 18,876 | | | | (291,312 | ) |
Bank of America Corp. | | | 4,840 | | | | 03/19/21 | | | USD | | | 28.00 | | | USD | | | 11,471 | | | | (387,200 | ) |
| | |
| 34 | | 2020 BLACKROCK ANNUAL REPORTTO SHAREHOLDERS |
| | |
Consolidated Schedule of Investments (continued) October 31, 2020 | | BlackRock Global Allocation Fund, Inc. |
Exchange-Traded Options Written (continued)
| | | | | | | | | | | | | | | | | | | | | | | | |
| Description | | Number of
Contracts | | | Expiration
Date | | | Exercise Price | | | Notional
Amount (000) | | | Value | |
Call (continued) | | | | | | | | | | | | | | | | | | | | | | | | |
Citigroup, Inc. | | | 1,550 | | | | 03/19/21 | | | USD | | | 52.50 | | | USD | | | 6,420 | | | $ | (149,575 | ) |
JPMorgan Chase & Co. | | | 1,381 | | | | 03/19/21 | | | USD | | | 115.00 | | | USD | | | 13,539 | | | | (355,607 | ) |
Starbucks Corp. | | | 1,040 | | | | 03/19/21 | | | USD | | | 105.00 | | | USD | | | 9,044 | | | | (152,880 | ) |
Goldman Sachs Group, Inc. | | | 335 | | | | 04/16/21 | | | USD | | | 240.00 | | | USD | | | 6,333 | | | | (111,388 | ) |
SPDR S&P 500 ETF Trust | | | 11,771 | | | | 06/18/21 | | | USD | | | 400.00 | | | USD | | | 384,370 | | | | (2,348,314 | ) |
| | | | | | | | | | | | | | | | | | | | | | | | |
| | | | | | | | | | | | | | | | | | | | | | | (39,607,653 | ) |
| | | | | | | | | | | | | | | | | | | | | | | | |
Put | | | | | | | | | | | | | | | | | | | | | | | | |
Agilent Technologies, Inc. | | | 1,708 | | | | 11/20/20 | | | USD | | | 90.00 | | | USD | | | 17,437 | | | | (85,400 | ) |
Bank of America Corp. | | | 4,772 | | | | 11/20/20 | | | USD | | | 22.00 | | | USD | | | 11,310 | | | | (202,810 | ) |
Bank of America Corp. | | | 4,654 | | | | 11/20/20 | | | USD | | | 21.00 | | | USD | | | 11,030 | | | | (111,696 | ) |
Bj’S Wholesale Club Holdings, Inc. | | | 1,712 | | | | 11/20/20 | | | USD | | | 25.00 | | | USD | | | 6,555 | | | | (17,120 | ) |
Citigroup, Inc. | | | 5,201 | | | | 11/20/20 | | | USD | | | 37.50 | | | USD | | | 21,543 | | | | (377,072 | ) |
Deutsche Telekom AG | | | 6,904 | | | | 11/20/20 | | | EUR | | | 13.60 | | | EUR | | | 9,010 | | | | (349,772 | ) |
Global Payments, Inc. | | | 1,315 | | | | 11/20/20 | | | USD | | | 155.00 | | | USD | | | 20,743 | | | | (696,950 | ) |
JPMorgan Chase & Co. | | | 2,341 | | | | 11/20/20 | | | USD | | | 85.00 | | | USD | | | 22,951 | | | | (184,939 | ) |
Microsoft Corp. | | | 1,105 | | | | 11/20/20 | | | USD | | | 185.00 | | | USD | | | 22,373 | | | | (263,543 | ) |
Morgan Stanley | | | 4,749 | | | | 11/20/20 | | | USD | | | 40.00 | | | USD | | | 22,866 | | | | (116,351 | ) |
Southwest Airlines Co. | | | 2,050 | | | | 11/20/20 | | | USD | | | 35.00 | | | USD | | | 8,104 | | | | (153,750 | ) |
SPDR S&P 500 ETF Trust | | | 6,710 | | | | 11/20/20 | | | USD | | | 300.00 | | | USD | | | 219,108 | | | | (2,533,025 | ) |
SPDR S&P 500 ETF Trust | | | 4,927 | | | | 11/20/20 | | | USD | | | 320.00 | | | USD | | | 160,886 | | | | (4,210,121 | ) |
Starbucks Corp. | | | 1,983 | | | | 11/20/20 | | | USD | | | 77.50 | | | USD | | | 17,244 | | | | (152,691 | ) |
T-Mobile USA, Inc. | | | 4,812 | | | | 11/20/20 | | | USD | | | 95.00 | | | USD | | | 52,725 | | | | (276,690 | ) |
T-Mobile USA, Inc. | | | 2,047 | | | | 11/20/20 | | | USD | | | 100.00 | | | USD | | | 22,429 | | | | (249,734 | ) |
VanEck Vectors Semiconductor ETF | | | 687 | | | | 11/20/20 | | | USD | | | 165.00 | | | USD | | | 12,019 | | | | (221,558 | ) |
Visa, Inc., Class A | | | 1,788 | | | | 11/20/20 | | | USD | | | 180.00 | | | USD | | | 32,490 | | | | (1,023,630 | ) |
Vulcan Materials Co. | | | 844 | | | | 11/20/20 | | | USD | | | 110.00 | | | USD | | | 12,224 | | | | (158,250 | ) |
Walmart, Inc. | | | 1,849 | | | | 11/20/20 | | | USD | | | 130.00 | | | USD | | | 25,655 | | | | (332,820 | ) |
Walt Disney Co. | | | 855 | | | | 11/20/20 | | | USD | | | 120.00 | | | USD | | | 10,367 | | | | (408,262 | ) |
Alphabet, Inc., Class C | | | 153 | | | | 12/18/20 | | | USD | | | 1,300.00 | | | USD | | | 24,801 | | | | (164,475 | ) |
Alphabet, Inc., Class C | | | 152 | | | | 12/18/20 | | | USD | | | 1,330.00 | | | USD | | | 24,639 | | | | (199,880 | ) |
Amazon.com, Inc. | | | 73 | | | | 12/18/20 | | | USD | | | 2,850.00 | | | USD | | | 22,164 | | | | (882,935 | ) |
Apple, Inc. | | | 1,996 | | | | 12/18/20 | | | USD | | | 97.50 | | | USD | | | 21,728 | | | | (442,114 | ) |
Apple, Inc. | | | 1,990 | | | | 12/18/20 | | | USD | | | 102.50 | | | USD | | | 21,663 | | | | (701,475 | ) |
Bank of America Corp. | | | 8,809 | | | | 12/18/20 | | | USD | | | 22.00 | | | USD | | | 20,877 | | | | (735,551 | ) |
Bank of America Corp. | | | 8,845 | | | | 12/18/20 | | | USD | | | 21.00 | | | USD | | | 20,963 | | | | (499,742 | ) |
Charter Communications, Inc., Class A | | | 169 | | | | 12/18/20 | | | USD | | | 590.00 | | | USD | | | 10,205 | | | | (353,210 | ) |
Citigroup, Inc. | | | 4,586 | | | | 12/18/20 | | | USD | | | 42.50 | | | USD | | | 18,995 | | | | (1,524,845 | ) |
ConocoPhillips | | | 6,581 | | | | 12/18/20 | | | USD | | | 27.00 | | | USD | | | 18,835 | | | | (1,158,256 | ) |
Dow, Inc. | | | 2,413 | | | | 12/18/20 | | | USD | | | 40.00 | | | USD | | | 10,977 | | | | (326,961 | ) |
Exxon Mobil Corp. | | | 4,992 | | | | 12/18/20 | | | USD | | | 27.50 | | | USD | | | 16,284 | | | | (406,848 | ) |
Fortive Corp. | | | 3,227 | | | | 12/18/20 | | | USD | | | 65.00 | | | USD | | | 19,878 | | | | (459,847 | ) |
Global Payments, Inc. | | | 1,359 | | | | 12/18/20 | | | USD | | | 150.00 | | | USD | | | 21,437 | | | | (801,810 | ) |
Hilton Worldwide Holdings, Inc. | | | 954 | | | | 12/18/20 | | | USD | | | 75.00 | | | USD | | | 8,377 | | | | (183,645 | ) |
InvesCo.QQQ Trust, Series 1 | | | 4,386 | | | | 12/18/20 | | | USD | | | 252.00 | | | USD | | | 118,150 | | | | (3,552,660 | ) |
InvesCo.QQQ Trust, Series 1 | | | 2,417 | | | | 12/18/20 | | | USD | | | 262.00 | | | USD | | | 65,109 | | | | (2,721,542 | ) |
JPMorgan Chase & Co. | | | 1,813 | | | | 12/18/20 | | | USD | | | 85.00 | | | USD | | | 17,775 | | | | (310,023 | ) |
L3Harris Technologies, Inc. | | | 1,274 | | | | 12/18/20 | | | USD | | | 155.00 | | | USD | | | 20,525 | | | | (745,290 | ) |
Lyondellbasell Industries NV, Class A | | | 1,050 | | | | 12/18/20 | | | USD | | | 60.00 | | | USD | | | 7,187 | | | | (244,125 | ) |
Marathon Oil Corp. | | | 3,465 | | | | 12/18/20 | | | USD | | | 3.00 | | | USD | | | 1,372 | | | | (41,580 | ) |
McDonald’s Corp. | | | 516 | | | | 12/18/20 | | | USD | | | 210.00 | | | USD | | | 10,991 | | | | (455,370 | ) |
McDonald’s Corp. | | | 1,105 | | | | 12/18/20 | | | USD | | | 180.00 | | | USD | | | 23,537 | | | | (216,580 | ) |
Merck & Co., Inc. | | | 3,912 | | | | 12/18/20 | | | USD | | | 70.00 | | | USD | | | 29,422 | | | | (655,260 | ) |
Microsoft Corp. | | | 1,105 | | | | 12/18/20 | | | USD | | | 180.00 | | | USD | | | 22,373 | | | | (397,800 | ) |
Pioneer Natural Resources Co. | | | 829 | | | | 12/18/20 | | | USD | | | 60.00 | | | USD | | | 6,596 | | | | (95,335 | ) |
Societe Generale SA | | | 4,060 | | | | 12/18/20 | | | EUR | | | 10.00 | | | EUR | | | 4,737 | | | | (184,410 | ) |
Societe Generale SA | | | 2,216 | | | | 12/18/20 | | | EUR | | | 10.50 | | | EUR | | | 2,585 | | | | (139,366 | ) |
SPDR S&P 500 ETF Trust | | | 3,068 | | | | 12/18/20 | | | USD | | | 310.00 | | | USD | | | 100,182 | | | | (3,107,886 | ) |
Truist Financial Corp. | | | 1,629 | | | | 12/18/20 | | | USD | | | 37.50 | | | USD | | | 6,861 | | | | (207,698 | ) |
Unicredit SPA | | | 1,001 | | | | 12/18/20 | | | EUR | | | 6.00 | | | EUR | | | 3,219 | | | | (177,379 | ) |
Valero Energy Corp. | | | 2,281 | | | | 12/18/20 | | | USD | | | 30.00 | | | USD | | | 8,807 | | | | (206,431 | ) |
Visa, Inc., Class A | | | 1,788 | | | | 12/18/20 | | | USD | | | 175.00 | | | USD | | | 32,490 | | | | (1,099,620 | ) |
| | |
CONSOLIDATED SCHEDULE OF INVESTMENTS | | 35 |
| | |
Consolidated Schedule of Investments (continued) October 31, 2020 | | BlackRock Global Allocation Fund, Inc. |
Exchange-Traded Options Written (continued)
| | | | | | | | | | | | | | | | | | | | | | | | |
| Description | | Number of
Contracts | | | Expiration
Date | | | Exercise Price | | | Notional
Amount (000) | | | Value | |
Put (continued) | | | | | | | | | | | | | | | | | | | | | | | | |
Walt Disney Co. | | | 852 | | | | 12/18/20 | | | USD | | | 110.00 | | | USD | | | 10,331 | | | $ | (287,550 | ) |
10-Year U.S. Treasury Note | | | 10,383 | | | | 12/24/20 | | | USD | | | 136.50 | | | USD | | | 1,431 | | | | (4,867,031 | ) |
Alibaba Group Holding Ltd., ADR | | | 539 | | | | 01/15/21 | | | USD | | | 250.00 | | | USD | | | 16,423 | | | | (393,470 | ) |
Alphabet, Inc., Class C | | | 210 | | | | 01/15/21 | | | USD | | | 1,320.00 | | | USD | | | 34,041 | | | | (462,000 | ) |
Amazon.com, Inc. | | | 74 | | | | 01/15/21 | | | USD | | | 2,695.00 | | | USD | | | 22,468 | | | | (792,170 | ) |
Amazon.com, Inc. | | | 105 | | | | 01/15/21 | | | USD | | | 2,740.00 | | | USD | | | 31,880 | | | | (1,265,250 | ) |
Apple, Inc. | | | 3,748 | | | | 01/15/21 | | | USD | | | 100.00 | | | USD | | | 40,801 | | | | (1,677,230 | ) |
Apple, Inc. | | | 2,614 | | | | 01/15/21 | | | USD | | | 107.50 | | | USD | | | 28,456 | | | | (1,895,150 | ) |
Apple, Inc. | | | 2,914 | | | | 01/15/21 | | | USD | | | 102.50 | | | USD | | | 31,722 | | | | (1,457,000 | ) |
Applied Materials, Inc. | | | 2,062 | | | | 01/15/21 | | | USD | | | 45.00 | | | USD | | | 12,213 | | | | (183,518 | ) |
Autodesk, Inc. | | | 948 | | | | 01/15/21 | | | USD | | | 210.00 | | | USD | | | 22,329 | | | | (971,700 | ) |
Bank of America Corp. | | | 8,804 | | | | 01/15/21 | | | USD | | | 22.00 | | | USD | | | 20,865 | | | | (968,440 | ) |
Bank of America Corp. | | | 4,772 | | | | 01/15/21 | | | USD | | | 20.00 | | | USD | | | 11,310 | | | | (286,320 | ) |
Citigroup, Inc. | | | 5,201 | | | | 01/15/21 | | | USD | | | 37.50 | | | USD | | | 21,543 | | | | (928,378 | ) |
Citigroup, Inc., Class A | | | 5,271 | | | | 01/15/21 | | | USD | | | 37.50 | | | USD | | | 22,265 | | | | (590,352 | ) |
D.R. Horton, Inc. | | | 3,111 | | | | 01/15/21 | | | USD | | | 60.00 | | | USD | | | 20,785 | | | | (1,018,852 | ) |
Home Depot, Inc. | | | 1,845 | | | | 01/15/21 | | | USD | | | 250.00 | | | USD | | | 49,208 | | | | (1,997,212 | ) |
iShares iBoxx $ Investment Grade Corporate Bond ETF | | | 7,972 | | | | 01/15/21 | | | USD | | | 130.00 | | | USD | | | 106,610 | | | | (1,147,968 | ) |
JPMorgan Chase & Co. | | | 2,341 | | | | 01/15/21 | | | USD | | | 80.00 | | | USD | | | 22,951 | | | | (423,721 | ) |
Marathon Oil Corp. | | | 3,465 | | | | 01/15/21 | | | USD | | | 3.00 | | | USD | | | 1,372 | | | | (62,370 | ) |
Mastercard, Inc., Class A | | | 959 | | | | 01/15/21 | | | USD | | | 300.00 | | | USD | | | 27,681 | | | | (2,435,860 | ) |
Mastercard, Inc., Class A | | | 708 | | | | 01/15/21 | | | USD | | | 280.00 | | | USD | | | 20,436 | | | | (1,152,270 | ) |
Merck & Co., Inc. | | | 2,779 | | | | 01/15/21 | | | USD | | | 72.50 | | | USD | | | 20,901 | | | | (836,479 | ) |
Microsoft Corp. | | | 1,533 | | | | 01/15/21 | | | USD | | | 180.00 | | | USD | | | 31,039 | | | | (774,165 | ) |
Morgan Stanley | | | 4,424 | | | | 01/15/21 | | | USD | | | 44.00 | | | USD | | | 21,302 | | | | (924,616 | ) |
Morgan Stanley | | | 4,749 | | | | 01/15/21 | | | USD | | | 40.00 | | | USD | | | 22,866 | | | | (541,386 | ) |
PPG Industries, Inc. | | | 1,939 | | | | 01/15/21 | | | USD | | | 100.00 | | | USD | | | 25,153 | | | | (295,698 | ) |
Raytheon Technologies Corp. | | | 3,625 | | | | 01/15/21 | | | USD | | | 55.00 | | | USD | | | 19,691 | | | | (1,758,125 | ) |
ResMed, Inc. | | | 468 | | | | 01/15/21 | | | USD | | | 160.00 | | | USD | | | 8,983 | | | | (150,930 | ) |
Starbucks Corp. | | | 2,923 | | | | 01/15/21 | | | USD | | | 67.50 | | | USD | | | 25,418 | | | | (257,224 | ) |
Truist Financial Corp. | | | 1,629 | | | | 01/15/21 | | | USD | | | 35.00 | | | USD | | | 6,861 | | | | (203,625 | ) |
Union Pacific Corp. | | | 1,203 | | | | 01/15/21 | | | USD | | | 165.00 | | | USD | | | 21,316 | | | | (866,160 | ) |
VanEck Vectors Semiconductor ETF | | | 619 | | | | 01/15/21 | | | USD | | | 145.00 | | | USD | | | 10,829 | | | | (183,843 | ) |
VanEck Vectors Semiconductor ETF | | | 692 | | | | 01/15/21 | | | USD | | | 150.00 | | | USD | | | 12,107 | | | | (266,420 | ) |
Walt Disney Co. | | | 3,673 | | | | 01/15/21 | | | USD | | | 110.00 | | | USD | | | 44,535 | | | | (1,542,660 | ) |
Walt Disney Co. | | | 1,706 | | | | 01/15/21 | | | USD | | | 100.00 | | | USD | | | 20,685 | | | | (353,142 | ) |
Zoetis, Inc. | | | 387 | | | | 01/15/21 | | | USD | | | 140.00 | | | USD | | | 6,136 | | | | (134,483 | ) |
SPX Volatility Index | | | 4,162 | | | | 01/20/21 | | | USD | | | 18.00 | | | USD | | | 15,824 | | | | (62,430 | ) |
SPX Volatility Index | | | 27,802 | | | | 02/17/21 | | | USD | | | 17.00 | | | USD | | | 105,703 | | | | (625,545 | ) |
Amazon.com, Inc. | | | 99 | | | | 02/19/21 | | | USD | | | 2,800.00 | | | USD | | | 30,058 | | | | (1,880,257 | ) |
Amazon.com, Inc. | | | 140 | | | | 02/19/21 | | | USD | | | 2,840.00 | | | USD | | | 42,506 | | | | (2,899,050 | ) |
Bank of America Corp. | | | 4,654 | | | | 02/19/21 | | | USD | | | 20.00 | | | USD | | | 11,030 | | | | (363,012 | ) |
Microsoft Corp. | | | 1,530 | | | | 02/19/21 | | | USD | | | 185.00 | | | USD | | | 30,978 | | | | (1,438,200 | ) |
Raytheon Technologies Corp. | | | 3,624 | | | | 02/19/21 | | | USD | | | 50.00 | | | USD | | | 19,686 | | | | (1,177,800 | ) |
salesforce.com, Inc. | | | 898 | | | | 02/19/21 | | | USD | | | 220.00 | | | USD | | | 20,858 | | | | (1,620,890 | ) |
SPDR S&P 500 ETF Trust | | | 13,179 | | | | 02/19/21 | | | USD | | | 280.00 | | | USD | | | 430,347 | | | | (11,215,329 | ) |
Vulcan Materials Co. | | | 844 | | | | 02/19/21 | | | USD | | | 110.00 | | | USD | | | 12,224 | | | | (229,990 | ) |
SPX Volatility Index | | | 27,802 | | | | 03/17/21 | | | USD | | | 17.00 | | | USD | | | 105,703 | | | | (1,042,575 | ) |
Bank of America Corp. | | | 4,840 | | | | 03/19/21 | | | USD | | | 21.00 | | | USD | | | 11,471 | | | | (595,320 | ) |
SPDR S&P 500 ETF Trust | | | 3,923 | | | | 06/18/21 | | | USD | | | 250.00 | | | USD | | | 128,102 | | | | (3,216,860 | ) |
SPDR S&P 500 ETF Trust | | | 617 | | | | 12/17/21 | | | USD | | | 270.00 | | | USD | | | 20,148 | | | | (1,065,867 | ) |
| | | | | | | | | | | | | | | | | | | | | | | | |
| | | | | | | | | | | | | | | | | | | | | | | (97,312,026 | ) |
| | | | | | | | | | | | | | | | | | | | | | | | |
| | | | | | | | | | | | | | | | | | | | | | $ | (136,919,679 | ) |
| | | | | | | | | | | | | | | | | | | | | | | | |
| | |
| 36 | | 2020 BLACKROCK ANNUAL REPORTTO SHAREHOLDERS |
| | |
Consolidated Schedule of Investments (continued) October 31, 2020 | | BlackRock Global Allocation Fund, Inc. |
OTC Barrier Options Written
| | | | | | | | | | | | | | | | | | | | | | | | | | | | | | | | | | | | | | | | | | |
| Description | | Type of Option | | Counterparty | | | Number of
Contracts | | | Expiration
Date | | | Exercise Price | | | Barrier Price/Range | | | Notional Amount (000) | | | Value | |
Call | | | | | | | | | | | | | | | | | | | | | | | | | | | | | | | | | | | | | | | | | | |
USD Currency | | One Touch | | | HSBC Bank PLC | | | | — | | | | 11/19/20 | | | | JPY | | | | 100.00 | | | | JPY | | | | 100.00 | | | | USD | | | | 4,851 | | | $ | (428,596 | ) |
| | | | | | | | | | | | | | | | | | | | | | | | | | | | | | | | | | | | | | | | | | |
Put | | | | | | | | | | | | | | | | | | | | | | | | | | | | | | | | | | | | | | | | | | |
Euro Stoxx 50 | | Down-and-in | | | Credit Suisse International | | | | 13,417 | | | | 12/17/21 | | | | EUR | | | | 2,600.00 | | | | EUR | | | | 2,200.00 | | | | EUR | | | | 13 | | | | (2,811,916 | ) |
| | | | | | | | | | | | | | | | | | | | | | | | | | | | | | | | | | | | | | | | | | |
| | | | | | | | | | | | | | | | | | | | | | | | | | | | | | | | | | | | | | | | $ | (3,240,512 | ) |
| | | | | | | | | | | | | | | | | | | | | | | | | | | | | | | | | | | | | | | | | | |
OTC Options Written
| | | | | | | | | | | | | | | | | | | | | | | | | | | | | | |
| Description | | Counterparty | | Number of
Contracts | | | Expiration
Date | | | Exercise Price | | | Notional
Amount (000) | | | Value | |
Call | | | | | | | | | | | | | | | | | | | | | | | | | | | | | | |
Amazon.com, Inc. | | Citibank N.A. | | | 9,811 | | | | 11/20/20 | | | | USD | | | | 3,397.23 | | | | USD | | | | 29,788 | | | $ | (288,798 | ) |
ASML Holding NV | | Credit Suisse International | | | 22,257 | | | | 11/20/20 | | | | EUR | | | | 335.00 | | | | EUR | | | | 22 | | | | (77,477 | ) |
Autodesk, Inc. | | Nomura International PLC | | | 62,860 | | | | 11/20/20 | | | | USD | | | | 260.00 | | | | USD | | | | 14,806 | | | | (209,084 | ) |
Capital One Financial Corp. | | Nomura International PLC | | | 156,407 | | | | 11/20/20 | | | | USD | | | | 70.00 | | | | USD | | | | 11,430 | | | | (826,947 | ) |
D.R. Horton, Inc. | | Credit Suisse International | | | 213,017 | | | | 11/20/20 | | | | USD | | | | 85.00 | | | | USD | | | | 14,232 | | | | (42,603 | ) |
Lennar Corp., Class A | | JPMorgan Chase Bank N.A. | | | 97,987 | | | | 11/20/20 | | | | USD | | | | 86.00 | | | | USD | | | | 6,882 | | | | (15,315 | ) |
Roche Holding AG | | Barclays Bank PLC | | | 25,584 | | | | 11/20/20 | | | | CHF | | | | 350.00 | | | | CHF | | | | 7,538 | | | | (876 | ) |
Sanofi | | Barclays Bank PLC | | | 85,286 | | | | 11/20/20 | | | | EUR | | | | 98.00 | | | | EUR | | | | 6,612 | | | | (121 | ) |
SPDR Gold Shares(a) | | Goldman Sachs International | | | 435,391 | | | | 11/20/20 | | | | USD | | | | 192.00 | | | | USD | | | | 76,716 | | | | (200,280 | ) |
GBP Currency | | UBS AG | | | — | | | | 12/17/20 | | | | USD | | | | 1.36 | | | | GBP | | | | 86,975 | | | | (190,085 | ) |
adidas AG | | Barclays Bank PLC | | | 64,213 | | | | 12/18/20 | | | | EUR | | | | 325.00 | | | | EUR | | | | 16,381 | | | | (53,817 | ) |
LVMH Moet Hennessy Louis Vuitton SE | | Barclays Bank PLC | | | 85,444 | | | | 12/18/20 | | | | EUR | | | | 450.00 | | | | EUR | | | | 34,389 | | | | (372,043 | ) |
Roche Holding AG | | Barclays Bank PLC | | | 26,749 | | | | 12/18/20 | | | | CHF | | | | 350.00 | | | | CHF | | | | 7,881 | | | | (19,233 | ) |
SPDR Gold Shares(a) | | BNP Paribas S.A. | | | 435,258 | | | | 12/18/20 | | | | USD | | | | 194.00 | | | | USD | | | | 76,692 | | | | (515,781 | ) |
SPDR Gold Shares(a) | | Morgan Stanley & Co. International PLC | | | 326,699 | | | | 12/18/20 | | | | USD | | | | 196.00 | | | | USD | | | | 57,564 | | | | (331,599 | ) |
SPDR Gold Shares(a) | | Morgan Stanley & Co. International PLC | | | 217,594 | | | | 12/18/20 | | | | USD | | | | 198.00 | | | | USD | | | | 38,340 | | | | (190,395 | ) |
SPDR Gold Shares(a) | | Societe Generale | | | 435,059 | | | | 12/31/20 | | | | USD | | | | 198.00 | | | | USD | | | | 76,657 | | | | (490,803 | ) |
SPDR Gold Shares(a) | | Societe Generale | | | 173,377 | | | | 01/15/21 | | | | USD | | | | 215.00 | | | | USD | | | | 30,549 | | | | (109,227 | ) |
SPDR Gold Shares(a) | | Societe Generale | | | 172,180 | | | | 01/15/21 | | | | USD | | | | 192.00 | | | | USD | | | | 30,338 | | | | (242,743 | ) |
SPDR Gold Shares(a) | | Societe Generale | | | 87,292 | | | | 01/15/21 | | | | USD | | | | 206.00 | | | | USD | | | | 15,381 | | | | (85,369 | ) |
USD Currency | | Morgan Stanley & Co. International PLC | | | — | | | | 01/21/21 | | | | JPY | | | | 108.00 | | | | USD | | | | 174,575 | | | | (481,478 | ) |
EUR Currency | | BNP Paribas S.A. | | | — | | | | 01/27/21 | | | | USD | | | | 1.34 | | | | EUR | | | | 162,682 | | | | (17,242 | ) |
Safran SA | | Barclays Bank PLC | | | 118,987 | | | | 02/19/21 | | | | EUR | | | | 98.00 | | | | EUR | | | | 10,776 | | | | (916,897 | ) |
Safran SA | | UBS AG | | | 137,786 | | | | 03/19/21 | | | | EUR | | | | 103.56 | | | | EUR | | | | 12,479 | | | | (971,218 | ) |
| | | | | | | | | | | | | | | | | | | | | | | | | | | | | | |
| | | | | | | | | | | | | | | | | | | | | | | | | | | | | (6,649,431 | ) |
| | | | | | | | | | | | | | | | | | | | | | | | | | | | | | |
Put | | | | | | | | | | | | | | | | | | | | | | | | | | | | | | |
USD Currency | | Morgan Stanley & Co. International PLC | | | — | | | | 11/13/20 | | | | BRL | | | | 4.85 | | | | USD | | | | 69,100 | | | | (138 | ) |
Boston Scientific Corp. | | Nomura International PLC | | | 170,392 | | | | 11/20/20 | | | | USD | | | | 35.00 | | | | USD | | | | 5,839 | | | | (311,817 | ) |
D.R. Horton, Inc. | | Credit Suisse International | | | 213,017 | | | | 11/20/20 | | | | USD | | | | 60.00 | | | | USD | | | | 14,232 | | | | (291,833 | ) |
Lennar Corp., Class A | | JPMorgan Chase Bank N.A. | | | 97,987 | | | | 11/20/20 | | | | USD | | | | 62.00 | | | | USD | | | | 6,882 | | | | (94,260 | ) |
Roche Holding AG | | Barclays Bank PLC | | | 25,584 | | | | 11/20/20 | | | | CHF | | | | 285.00 | | | | CHF | | | | 7,538 | | | | (118,029 | ) |
Sanofi | | Barclays Bank PLC | | | 85,286 | | | | 11/20/20 | | | | EUR | | | | 76.00 | | | | EUR | | | | 6,612 | | | | (182,999 | ) |
SPDR Gold Shares(a) | | Goldman Sachs International | | | 217,695 | | | | 11/20/20 | | | | USD | | | | 165.00 | | | | USD | | | | 38,358 | | | | (124,080 | ) |
SPDR Gold Shares(a) | | Morgan Stanley & Co. International PLC | | | 132,158 | | | | 11/20/20 | | | | USD | | | | 173.00 | | | | USD | | | | 23,286 | | | | (291,396 | ) |
Union Pacific Corp. | | Goldman Sachs International | | | 129,128 | | | | 11/20/20 | | | | USD | | | | 187.50 | | | | USD | | | | 22,880 | | | | (1,593,274 | ) |
USD Currency | | JPMorgan Chase Bank N.A. | | | — | | | | 12/01/20 | | | | RUB | | | | 72.00 | | | | USD | | | | 42,552 | | | | (31,276 | ) |
USD Currency | | Bank of America N.A. | | | — | | | | 12/02/20 | | | | MXN | | | | 19.80 | | | | USD | | | | 168,960 | | | | (422,907 | ) |
adidas AG | | Barclays Bank PLC | | | 64,213 | | | | 12/18/20 | | | | EUR | | | | 245.00 | | | | EUR | | | | 16,381 | | | | (912,385 | ) |
Bank of Ireland Group PLC | | Morgan Stanley & Co. International PLC | | | 110,217 | | | | 12/18/20 | | | | EUR | | | | 1.50 | | | | EUR | | | | 110 | | | | (969 | ) |
Givaudan REG | | UBS AG | | | 1,711 | | | | 12/18/20 | | | | CHF | | | | 3,680.00 | | | | CHF | | | | 2 | | | | (235,056 | ) |
LVMH Moet Hennessy Louis Vuitton SE | | Barclays Bank PLC | | | 42,721 | | | | 12/18/20 | | | | EUR | | | | 375.00 | | | | EUR | | | | 17,194 | | | | (565,715 | ) |
Roche Holding AG | | Barclays Bank PLC | | | 26,749 | | | | 12/18/20 | | | | CHF | | | | 275.00 | | | | CHF | | | | 7,881 | | | | (172,988 | ) |
SPDR Gold Shares(a) | | Morgan Stanley & Co. International PLC | | | 326,699 | | | | 12/18/20 | | | | USD | | | | 169.00 | | | | USD | | | | 57,564 | | | | (666,035 | ) |
SPDR Gold Shares(a) | | Morgan Stanley & Co. International PLC | | | 217,594 | | | | 12/18/20 | | | | USD | | | | 161.00 | | | | USD | | | | 38,340 | | | | (118,665 | ) |
Walgreens Boots Alliance, Inc. | | Morgan Stanley & Co. International PLC | | | 319,806 | | | | 12/18/20 | | | | USD | | | | 30.00 | | | | USD | | | | 320 | | | | (195,772 | ) |
SPDR Gold Shares(a) | | Societe Generale | | | 163,148 | | | | 12/31/20 | | | | USD | | | | 164.00 | | | | USD | | | | 28,747 | | | | (246,029 | ) |
SPDR Gold Shares(a) | | Societe Generale | | | 261,876 | | | | 01/15/21 | | | | USD | | | | 166.00 | | | | USD | | | | 46,143 | | | | (634,916 | ) |
SPDR Gold Shares(a) | | Societe Generale | | | 173,377 | | | | 01/15/21 | | | | USD | | | | 170.00 | | | | USD | | | | 30,549 | | | | (632,696 | ) |
USD Currency | | Morgan Stanley & Co. International PLC | | | — | | | | 01/21/21 | | | | JPY | | | | 100.00 | | | | USD | | | | 174,575 | | | | (637,722 | ) |
EUR Currency | | BNP Paribas S.A. | | | — | | | | 01/27/21 | | | | USD | | | | 1.10 | | | | EUR | | | | 108,454 | | | | (158,015 | ) |
| | |
CONSOLIDATED SCHEDULE OF INVESTMENTS | | 37 |
| | |
Consolidated Schedule of Investments (continued) October 31, 2020 | | BlackRock Global Allocation Fund, Inc. |
OTC Options Written (continued)
| | | | | | | | | | | | | | | | | | | | | | | | | | | | | | |
| Description | | Counterparty | | Number of
Contracts | | | Expiration
Date | | | Exercise Price | | | Notional
Amount (000) | | | Value | |
Put (continued) | | | | | | | | | | | | | | | | | | | | | | | | | | | | | | |
Topix-Bank Index | | Goldman Sachs International | | | 577,992 | | | | 02/12/21 | | | | JPY | | | | 1,500.00 | | | | JPY | | | | 578 | | | $ | (215,308 | ) |
Safran SA | | Barclays Bank PLC | | | 118,987 | | | | 02/19/21 | | | | EUR | | | | 70.00 | | | | EUR | | | | 10,776 | | | | (429,076 | ) |
Wisdomtree Japan Hedged Equity Fund | | Goldman Sachs International | | | 218,295 | | | | 02/19/21 | | | | USD | | | | 43.00 | | | | USD | | | | 218 | | | | (229,210 | ) |
Givaudan REG | | UBS AG | | | 1,711 | | | | 03/19/21 | | | | CHF | | | | 3,680.00 | | | | CHF | | | | 2 | | | | (409,860 | ) |
Safran SA | | UBS AG | | | 137,786 | | | | 03/19/21 | | | | EUR | | | | 73.35 | | | | EUR | | | | 12,479 | | | | (827,622 | ) |
| | | | | | | | | | | | | | | | | | | | | | | | | | | | | | |
| | | | | | | | | | | | | | | | | | | | | | | | | | | | | (10,750,048 | ) |
| | | | | | | | | | | | | | | | | | | | | | | | | | | | | | |
| | | | | | | | | | | | | | | | | | | | | | | | | | | | $ | (17,399,479 | ) |
| | | | | | | | | | | | | | | | | | | | | | | | | | | | | | |
| | (a) | All or a portion of the security is held by a wholly-owned subsidiary. See Note 1 of the Notes to Consolidated Financial Statements for details on the wholly-owned subsidiary. | |
OTC Credit Default Swaptions Written
| | | | | | | | | | | | | | | | | | | | | | | | | | | | | | | | |
Description | | Paid by the Fund | | Received by the Fund | | Counterparty | | Expiration
Date | | | Credit
Rating(a) | | | Exercise
Price | | | Notional Amount (000)(b) | | | Value | |
| | Rate | | | Frequency | | Rate | | Frequency |
Put | | | | | | | | | | | | | | | | | | | | | | | | | | | | | | | | |
Sold Protection on 5-Year Credit Default Swap, 06/20/25 | | | CDX.NA.HY.34.V9 | | | Quarterly | | 5.00% | | Quarterly | | Barclays Bank PLC | | | 12/16/20 | | | | NR | | | | USD 96.00 | | | | USD 12,109 | | | $ | (56,828 | ) |
| | | | | |
| | (a) | Using the rating of the issuer or the underlying securities of the index, as applicable, provided by S&P Global Ratings. | |
| | (b) | The maximum potential amount the Fund may pay should a negative credit event take place as defined under the terms of the agreement. | |
OTC Interest Rate Swaptions Written
| | | | | | | | | | | | | | | | | | | | | | | | | | | | | | | | |
| | | Paid by the Fund | | Received by the Fund | | | | Expiration | | | Exercise | | | | | | Notional | | | | |
| Description | | Rate | | | Frequency | | Rate | | Frequency | | Counterparty | | Date | | | Rate | | | | | | Amount (000) | | | Value | |
Call | | | | | | | | | | | | | | | | | | | | | | | | | | | | | | | | |
10-Year Interest Rate
Swap, 12/17/30 | | | 0.47% | | | Semi-Annual | | 3-Month LIBOR, 0.22% | | Quarterly | | Citibank N.A. | | | 12/15/20 | | | | 0.47 | % | | | USD | | | | 55,174 | | | $ | (43,643 | ) |
30-Year Interest Rate
Swap, 01/13/51 | | | 0.71% | | | Semi-Annual | | 3-Month LIBOR, 0.22% | | Quarterly | | Citibank N.A. | | | 01/11/21 | | | | 0.71 | | | | USD | | | | 68,414 | | | | (314,026 | ) |
30-Year Interest Rate
Swap, 03/26/51 | | | 0.87% | | | Semi-Annual | | 3-Month LIBOR, 0.22% | | Quarterly | | Citibank N.A. | | | 03/24/21 | | | | 0.87 | | | | USD | | | | 44,209 | | | | (686,447 | ) |
30-Year Interest Rate
Swap, 06/06/51 | | | 0.50% | | | Semi-Annual | | 3-Month LIBOR, 0.22% | | Quarterly | | JPMorgan Chase
Bank N.A. | | | 06/04/21 | | | | 0.50 | | | | USD | | | | 101,372 | | | | (850,158 | ) |
30-Year Interest Rate
Swap, 06/13/51 | | | 0.50% | | | Semi-Annual | | 3-Month LIBOR, 0.22% | | Quarterly | | BNP Paribas S.A. | | | 06/11/21 | | | | 0.50 | | | | USD | | | | 33,056 | | | | (288,057 | ) |
10-Year Interest Rate
Swap, 09/17/31 | | | 0.55% | | | Semi-Annual | | 3-Month LIBOR, 0.22% | | Quarterly | | Citibank N.A. | | | 09/15/21 | | | | 0.55 | | | | USD | | | | 55,174 | | | | (412,045 | ) |
10-Year Interest Rate
Swap, 09/22/31 | | | 0.55% | | | Semi-Annual | | 3-Month LIBOR, 0.22% | | Quarterly | | Morgan Stanley & Co. International PLC | | | 09/20/21 | | | | 0.55 | | | | USD | | | | 54,644 | | | | (411,596 | ) |
5-Year Interest Rate
Swap, 04/10/27 | | | 0.02% | | | Annual | | 6-Month EURIBOR, (0.52%) | | Semi-Annual | | Barclays Bank PLC | | | 04/08/22 | | | | 0.02 | | | | EUR | | | | 170,960 | | | | (4,418,203 | ) |
5-Year Interest Rate
Swap, 04/21/27 | | | 0.13% | | | Annual | | 6-Month EURIBOR, (0.52%) | | Semi-Annual | | Barclays Bank PLC | | | 04/19/22 | | | | 0.13 | | | | EUR | | | | 112,700 | | | | (2,311,883 | ) |
5-Year Interest Rate
Swap, 04/21/27 | | | 0.15% | | | Annual | | 6-Month EURIBOR, (0.52%) | | Semi-Annual | | Barclays Bank PLC | | | 04/19/22 | | | | 0.15 | | | | EUR | | | | 45,113 | | | | (880,959 | ) |
| | | | | | | | | | | | | | | | | | | | | | | | | | | | | | | | |
| | | | | | | | | | | | | | | | | | | | | | | | | | | | | | | (10,617,017 | ) |
| | | | | | | | | | | | | | | | | | | | | | | | | | | | | | | | |
Put | | | | | | | | | | | | | | | | | | | | | | | | | | | | | | | | |
5-Year Interest Rate
Swap, 11/27/25 | |
| 3-Month
LIBOR, 0.22% |
| | Quarterly | | 0.49% | | Semi-Annual | | Citibank N.A. | | | 11/25/20 | | | | 0.48 | | | | USD | | | | 518,671 | | | | (937,436 | ) |
10-Year Interest Rate
Swap, 12/17/30 | |
| 3-Month
LIBOR, 0.22% |
| | Quarterly | | 1.07% | | Semi-Annual | | Citibank N.A. | | | 12/15/20 | | | | 1.07 | | | | USD | | | | 165,523 | | | | (744,616 | ) |
30-Year Interest Rate
Swap, 12/20/50 | |
| 3-Month
LIBOR, 0.22% |
| | Quarterly | | 1.20% | | Semi-Annual | | Goldman Sachs International | | | 12/18/20 | | | | 1.20 | | | | USD | | | | 119,778 | | | | (6,138,664 | ) |
30-Year Interest Rate
Swap, 02/10/51 | |
| 3-Month
LIBOR, 0.22% |
| | Quarterly | | 1.24% | | Semi-Annual | | Citibank N.A. | | | 02/08/21 | | | | 1.24 | | | | USD | | | | 86,644 | | | | (4,876,574 | ) |
| | |
| 38 | | 2020 BLACKROCK ANNUAL REPORTTO SHAREHOLDERS |
| | |
Consolidated Schedule of Investments (continued) October 31, 2020 | | BlackRock Global Allocation Fund, Inc. |
OTC Interest Rate Swaptions Written (continued)
| | | | | | | | | | | | | | | | | | | | | | | | | | | | | | | | |
Description | | Paid by the Fund | | Received by the Fund | | Counterparty | | Expiration
Date | | | Exercise
Rate | | | Notional
Amount (000) | | | Value | |
| | Rate | | | Frequency | | Rate | | Frequency |
Put (continued) | | | | | | | | | | | | | | | | | | | | | | | | | | | | | | | | |
5-Year Interest Rate Swap, 02/10/26 | |
| 3-Month
LIBOR, 0.22% |
| | Quarterly | | 0.39% | | Semi-Annual | | Citibank N.A. | | | 02/08/21 | | | | 0.39 | % | | | USD | | | | 317,693 | | | $ | (2,333,541 | ) |
5-Year Interest Rate Swap, 04/08/26 | |
| 3-Month
LIBOR, 0.22% |
| | Quarterly | | 0.85% | | Semi-Annual | | Bank of America N.A. | | | 04/06/21 | | | | 0.85 | | | | USD | | | | 308,805 | | | | (377,134 | ) |
5-Year Interest Rate Swap, 04/08/26 | |
| 3-Month
LIBOR, 0.22% |
| | Quarterly | | 0.85% | | Semi-Annual | | Bank of America N.A. | | | 04/06/21 | | | | 0.85 | | | | USD | | | | 441,149 | | | | (538,762 | ) |
5-Year Interest Rate Swap, 04/08/26 | |
| 3-Month
LIBOR, 0.22% |
| | Quarterly | | 0.87% | | Semi-Annual | | Bank of America N.A. | | | 04/06/21 | | | | 0.87 | | | | USD | | | | 308,805 | | | | (346,071 | ) |
10-Year Interest Rate Swap, 09/17/31 | |
| 3-Month
LIBOR, 0.22% |
| | Quarterly | | 1.40% | | Semi-Annual | | Citibank N.A. | | | 09/15/21 | | | | 1.40 | | | | USD | | | | 110,349 | | | | (1,070,257 | ) |
10-Year Interest Rate Swap, 09/22/31 | |
| 3-Month
LIBOR, 0.22% |
| | Quarterly | | 1.40% | | Semi-Annual | | Morgan Stanley & Co.
International PLC | | | 09/20/21 | | | | 1.40 | | | | USD | | | | 109,287 | | | | (1,076,706 | ) |
10-Year Interest Rate Swap, 02/13/32 | |
| 3-Month
LIBOR, 0.22% |
| | Quarterly | | 2.00% | | Semi-Annual | | JPMorgan Chase Bank N.A. | | | 02/11/22 | | | | 2.00 | | | | USD | | | | 248,953 | | | | (1,239,960 | ) |
5-Year Interest Rate Swap, 04/10/27 | |
| 6-Month
EURIBOR,
(0.52%) |
| | Semi-Annual | | 0.02% | | Annual | | Barclays Bank PLC | | | 04/08/22 | | | | 0.02 | | | | EUR | | | | 170,960 | | | | (502,924 | ) |
| | | 6-Month | | | | | | | | | | | | | | | | | | | | | | | | | | | | | |
5-Year Interest Rate Swap, 04/21/27 | |
| EURIBOR,
(0.52%) |
| | Semi-Annual | | 0.13% | | Annual | | Barclays Bank PLC | | | 04/19/22 | | | | 0.13 | | | | EUR | | | | 112,700 | | | | (472,453 | ) |
5-Year Interest Rate Swap, 04/21/27 | |
| 6-Month
EURIBOR,
(0.52%) |
| | Semi-Annual | | 0.15% | | Annual | | Barclays Bank PLC | | | 04/19/22 | | | | 0.15 | | | | EUR | | | | 45,113 | | | | (201,379 | ) |
| | | | | | | | | | | | | | | | | | | | | | | | | | | | | | | | |
| | | | | | | | | | | | | | | | | | | | | | | | | | | | | | | (20,856,477 | ) |
| | | | | | | | | | | | | | | | | | | | | | | | | | | | | | | | |
| | | | | | | | | | | | | | | | | | | | | | | | | | | | | | $ | (31,473,494 | ) |
| | | | | | | | | | | | | | | | | | | | | | | | | | | | | | | | |
Centrally Cleared Credit Default Swaps — Buy Protection
| | | | | | | | | | | | | | | | | | | | | | | | | | | | | | | | |
| Reference Obligation/Index | | Financing
Rate Paid
by the Fund | | | Payment
Frequency | | | Termination Date | | | Notional
Amount (000) | | | Value | | | Upfront
Premium
Paid
(Received) | | | Unrealized
Appreciation
(Depreciation) | |
CDX.NA.HY.34.V9 | | | 5.00 | % | | | Quarterly | | | | 06/20/25 | | | | USD | | | | 137,532 | | | $ | (6,746,713 | ) | | $ | 4,098,283 | | | $ | (10,844,996 | ) |
CDX.NA.IG.34.V1 | | | 1.00 | | | | Quarterly | | | | 06/20/25 | | | | USD | | | | 124,255 | | | | (679,910 | ) | | | (1,690,908 | ) | | | 1,010,998 | |
| | | | | | | | | | | | | | | | | | | | | | | | | | | | | | | | |
| | | | | | | | | | | | | | | | | | | | | | $ | (7,426,623 | ) | | $ | 2,407,375 | | | $ | (9,833,998 | ) |
| | | | | | | | | | | | | | | | | | | | | | | | | | | | | | | | |
Centrally Cleared Credit Default Swaps — Sell Protection
| | | | | | | | | | | | | | | | | | | | | | | | | | | | | | | | |
| Reference Obligation/Index | |
| Financing
Rate Received
by the Fund |
| |
| Payment
Frequency |
| |
| Termination
Date |
| |
| Credit
Rating |
(a) | |
| Notional
Amount (000) |
(b) | | | Value | | |
| Upfront
Premium
Paid (Received) |
| |
| Unrealized
Appreciation
(Depreciation) |
|
CDX.NA.IG.33.V1 | | | 1.00 | % | | | Quarterly | | | | 12/20/24 | | | | BBB- | | | USD | 885,749 | | | $ | (5,901,647 | ) | | $ | (16,200,582 | ) | | $ | 10,298,935 | |
Markit iTraxx XO, Series 34, Version 1 | | | 5.00 | | | | Quarterly | | | | 12/20/25 | | | | B | | | EUR | 57,659 | | | | 4,456,137 | | | | 4,432,708 | | | | 23,429 | |
| | | | | | | | | | | | | | | | | | | | | | | | | | | | | | | | |
| | | | | | | | | | | | | | | | | | | | | | $ | (1,445,510 | ) | | $ | (11,767,874 | ) | | $ | 10,322,364 | |
| | | | | | | | | | | | | | | | | | | | | | | | | | | | | | | | |
| | (a) | Using the rating of the issuer or the underlying securities of the index, as applicable, provided by S&P Global Ratings. | |
| | (b) | The maximum potential amount the Fund may pay should a negative credit event take place as defined under the terms of the agreement. | |
Centrally Cleared Interest Rate Swaps
| | | | | | | | | | | | | | | | | | | | | | | | | | | | | | | | |
| Paid by the Fund | | Received by the Fund | | Effective
Date | | | Termination
Date | | | Notional
Amount (000) | | | Value | | | Upfront
Premium
Paid
(Received) | | | Unrealized
Appreciation
(Depreciation) | |
| Rate | | Frequency | | Rate | | Frequency |
| 6-Month CAD BA, 0.00% | | Semi-Annual | | 1.91% | | Semi-Annual | | | N/A | | | | 07/09/21 | | | CAD | | | 687,584 | | | $ | 7,309,911 | | | $ | 1,922 | | | $ | 7,307,989 | |
| 1.06% | | Semi-Annual | | 3-Month LIBOR, 0.22% | | Quarterly | | | N/A | | | | 03/28/22 | | | USD | | | 1,037,451 | | | | (13,054,586 | ) | | | 5,768 | | | | (13,060,354 | ) |
| | |
CONSOLIDATED SCHEDULE OF INVESTMENTS | | 39 |
| | |
Consolidated Schedule of Investments (continued) October 31, 2020 | | BlackRock Global Allocation Fund, Inc. |
Centrally Cleared Interest Rate Swaps (continued)
| | | | | | | | | | | | | | | | | | | | | | | | | | | | | | | | |
Paid by the Fund | | Received by the Fund | | Effective
Date | | | Termination
Date | | | Notional
Amount (000) | | | Value | | | Upfront
Premium
Paid
(Received) | | | Unrealized
Appreciation
(Depreciation) | |
| Rate | | Frequency | | Rate | | Frequency |
0.88% | | Semi-Annual | | 3-Month LIBOR, 0.22% | | Quarterly | | | N/A | | | | 08/17/22 | | | USD | | | 577,868 | | | $ | (7,419,198 | ) | | $ | 4,081 | | | $ | (7,423,279 | ) |
0.00% | | Semi-Annual | | 3-Month LIBOR, 0.22% | | Quarterly | | | N/A | | | | 06/06/24 | | | USD | | | 204,209 | | | | (471,596 | ) | | | 1,593 | | | | (473,189 | ) |
1.60% | | Semi-Annual | | 3-Month LIBOR, 0.22% | | Quarterly | | | N/A | | | | 01/24/25 | | | USD | | | 413,546 | | | | (23,089,009 | ) | | | 9,187 | | | | (23,098,196 | ) |
0.35% | | Semi-Annual | | 3-Month LIBOR, 0.22% | | Quarterly | | | N/A | | | | 08/27/25 | | | USD | | | 156,818 | | | | 596,589 | | | | 1,871 | | | | 594,718 | |
3-Month LIBOR, 0.22% | | Quarterly | | 0.37% | | Semi-Annual | | | N/A | | | | 10/29/25 | | | USD | | | 453,717 | | | | (1,779,318 | ) | | | 5,687 | | | | (1,785,005 | ) |
0.69% | | Semi-Annual | | 3-Month LIBOR, 0.22% | | Quarterly | | | N/A | | | | 06/24/30 | | | USD | | | 49,810 | | | | 706,059 | | | | 855 | | | | 705,204 | |
6-Month LIBOR, 0.24% | | Quarterly | | 1.08% | | Semi-Annual | | | N/A | | | | 08/19/30 | | | USD | | | 115,494 | | | | 2,474,674 | | | | 2,038 | | | | 2,472,636 | |
3-Month LIBOR, 0.22% | | Quarterly | | 0.64% | | Semi-Annual | | | N/A | | | | 08/21/30 | | | USD | | | 54,006 | | | | (1,180,857 | ) | | | 954 | | | | (1,181,811 | ) |
3-Month LIBOR, 0.22% | | Quarterly | | 0.68% | | Semi-Annual | | | N/A | | | | 09/16/30 | | | USD | | | 20,212 | | | | (388,680 | ) | | | 359 | | | | (389,039 | ) |
3-Month LIBOR, 0.22% | | Quarterly | | 0.66% | | Semi-Annual | | | N/A | | | | 09/25/30 | | | USD | | | 30,500 | | | | (640,302 | ) | | | 544 | | | | (640,846 | ) |
0.71% | | Semi-Annual | | 3-Month LIBOR, 0.22% | | Quarterly | | | N/A | | | | 09/25/30 | | | USD | | | 30,500 | | | | 492,309 | | | | 544 | | | | 491,765 | |
3-Month LIBOR, 0.22% | | Quarterly | | 0.69% | | Semi-Annual | | | N/A | | | | 09/30/30 | | | USD | | | 24,400 | | | | (436,661 | ) | | | 435 | | | | (437,096 | ) |
0.76% | | Semi-Annual | | 3-Month LIBOR, 0.22% | | Quarterly | | | N/A | | | | 09/30/30 | | | USD | | | 24,400 | | | | 266,809 | | | | 435 | | | | 266,374 | |
0.89% | | Semi-Annual | | 3-Month LIBOR, 0.22% | | Quarterly | | | N/A | | | | 07/05/50 | | | USD | | | 37,022 | | | | 3,960,208 | | | | 1,196 | | | | 3,959,012 | |
0.88% | | Semi-Annual | | 3-Month LIBOR, 0.22% | | Quarterly | | | N/A | | | | 07/21/50 | | | USD | | | 24,341 | | | | 2,678,458 | | | | 800 | | | | 2,677,658 | |
3-Month LIBOR, 0.22% | | Quarterly | | 1.08% | | Semi-Annual | | | N/A | | | | 09/28/50 | | | USD | | | 12,366 | | | | (727,098 | ) | | | 409 | | | | (727,507 | ) |
3-Month LIBOR, 0.22% | | Quarterly | | 1.08% | | Semi-Annual | | | N/A | | | | 09/28/50 | | | USD | | | 53,050 | | | | (3,188,839 | ) | | | 1,753 | | | | (3,190,592 | ) |
3-Month LIBOR, 0.22% | | Quarterly | | 1.07% | | Semi-Annual | | | N/A | | | | 10/21/50 | | | USD | | | 36,511 | | | | (2,265,685 | ) | | | 1,234 | | | | (2,266,919 | ) |
1.27% | | Semi-Annual | | 3-Month LIBOR, 0.22% | | Quarterly | | | N/A | | | | 10/24/50 | | | USD | | | 77,818 | | | | 754,783 | | | | 2,630 | | | | 752,153 | |
3-Month LIBOR, 0.22% | | Quarterly | | 0.97% | | Semi-Annual | | | N/A | | | | 10/28/50 | | | USD | | | 29,589 | | | | (2,618,552 | ) | | | 980 | | | | (2,619,532 | ) |
1.17% | | Semi-Annual | | 3-Month LIBOR, 0.22% | | Quarterly | | | N/A | | | | 10/28/50 | | | USD | | | 30,946 | | | | 1,116,901 | | | | 1,046 | | | | 1,115,855 | |
0.98% | | Semi-Annual | | 3-Month LIBOR, 0.22% | | Quarterly | | | N/A | | | | 10/31/50 | | | USD | | | 89,637 | | | | 7,691,078 | | | | 3,031 | | | | 7,688,047 | |
| | | | | | | | | | | | | | | | | | | | | | | | | | | | | | | | |
| | | | | | | | | | | | | | | | | | | | | | $ | (29,212,602 | ) | | $ | 49,352 | | | $ | (29,261,954 | ) |
| | | | | | | | | | | | | | | | | | | | | | | | | | | | | | | | |
OTC Total Return Swaps — Future
| | | | | | | | | | | | | | | | | | | | | | | | | | | | | | | | |
| Reference Entity | |
| Fixed Amount Paid/Received
by the Fund(a) |
| | Counterparty | |
| Termination
Date |
| | Notional Amount (000) | | | | Value | | |
| Premiums
Paid
(Received) |
| |
| Unrealized
Appreciation
(Depreciation) |
|
S&P 500 Index Annual Dividend Future December 2020 | | | USD | | | | 6,260,737 | | | Goldman Sachs International | | | 12/18/20 | | | USD | | | 6,261 | | | $ | 1,282,163 | | | $ | — | | | $ | 1,282,163 | |
S&P 500 Index Annual Dividend Future December 2021 | | | USD | | | | 7,937,925 | | | BNP Paribas S.A. | | | 12/17/21 | | | USD | | | 7,938 | | | | 572,250 | | | | — | | | | 572,250 | |
| | | | | | | | | | | | | | | | | | | | | | | | | | | | | | | | |
| | | | | | | | | | | | | | | | | | | | | | $ | 1,854,413 | | | $ | — | | | $ | 1,854,413 | |
| | | | | | | | | | | | | | | | | | | | | | | | | | | | | | | | |
| | (a) | At termination, the fixed amount paid (received) will be exchanged for the total return of the reference entity. | |
OTC Total Return Swaps
| | | | | | | | | | | | | | | | | | | | | | | | | | | | | | |
Paid by the Fund | | Received by the Fund | | Counterparty | | Effective
Date | | | Termination
Date | | | Notional
Amount (000) | | Value | | | Premiums
Paid (Received) | | | Unrealized
Appreciation
Depreciation | |
| Rate/Reference | | Frequency | | Rate/Reference | | Frequency |
Shell: Midstream Partners LP, 0.00% | | Semi-Annual | | 3-Month LIBOR plus 0.10% | | Quarterly | | Goldman Sachs International | | | N/A | | | | 01/22/21 | | | USD 38,210 | | $ | (2,693,288 | ) | | $ | — | | | $ | (2,693,288 | ) |
Shell: Midstream Partners LP, 0.00% | | Semi-Annual | | 3-Month LIBOR plus 0.10% | | Quarterly | | Goldman Sachs International | | | N/A | | | | 01/24/21 | | | USD 26,346 | | | (3,660,569 | ) | | | — | | | | (3,660,569 | ) |
| | | | | | | | | | | | | | | | | | | | | | | | | | | | | | |
| | | | | | | | | | | | | | | | | | | | $ | (6,353,857 | ) | | $ | — | | | $ | (6,353,857 | ) |
| | | | | | | | | | | | | | | | | | | | | | | | | | | | | | |
| | |
| 40 | | 2020 BLACKROCK ANNUAL REPORTTO SHAREHOLDERS |
| | |
Consolidated Schedule of Investments (continued) October 31, 2020 | | BlackRock Global Allocation Fund, Inc. |
OTC Total Return Swaps
| | | | | | | | | | | | | | | | | | | | | | | | | | |
| Reference Entity | | Payment Frequency | | | Counterparty(a) | | Termination Date | | | Net Notional | | | Accrued
Unrealized
Appreciation (Depreciation) | | | Net Value of
Reference
Entity | | | Gross
Notional
Amount
Net Asset
Percentage | |
Equity Securities Long/Short | | | Monthly | | | Citibank N.A.(b) | | | 01/25/21 – 05/31/23 | | | $ | 20,920,652 | | | $ | (5,002,581 | )(c) | | $ | 16,092,132 | | | | 0.3 | % |
| | | Monthly | | | JPMorgan Chase Bank N.A.(d) | | | 02/08/23 | | | | (24,561,306 | ) | | | 933,529 | (e) | | | (23,593,345 | ) | | | 0.1 | |
| | | | | | | | | | | | | | | | | | | | | | | | | | |
| | | | | | | | | | | | $ | (3,640,654 | ) | | $ | (4,069,052 | ) | | $ | (7,501,213 | ) | | | | |
| | | | | | | | | | | | | | | | | | | | | | | | | | |
| | (a) | The Fund receives the total return on a portfolio of long positions underlying the total return swap. In addition, the Fund pays or receives a variable rate of interest, based on a specified benchmark. The benchmark and spread are determined based upon the country and/or currency of the individual underlying positions. | |
| | (c) | Amount includes $(174,061) of net dividends and financing fees. | |
| | (e) | Amount includes $(34,432) of net dividends and financing fees. | |
| | The following | are the specified benchmarks (plus or minus a range) used in determining the variable rate of interest: | |
| | | | |
| | (b) | | (d) |
Range: | | 18-400 basis points | | 18-61 basis points |
Benchmarks: | | USD - 1M US Dollar LIBOR BBA | | USD - 1D Overnight Bank Funding Rate (OBFR01) |
| | USD - 1W US Dollar LIBOR BBA | | USD - 1M US Dollar LIBOR BBA |
The following table represents the individual long and short positions and related values of the equity securities underlying the total return swap with Citibank N.A. as of period end, termination date January 25, 2021 to May 31, 2023:
| | | | | | | | | | | | |
| Security | | Shares | | | Value | | | % of
Basket
Value | |
| | | |
Reference Entity — Long | | | | | | | | | | | | |
| | | |
| Common Stocks | | | | | | | | | |
| | | |
| Italy | | | | | | | | | |
Leonardo SpA | | | 8,805,434 | | | $ | 41,985,542 | | | | 260.9 | % |
| | | | | | | | | | | | |
Total Reference Entity — Long | | | | | | | 41,985,542 | | | | | |
| | | | | | | | | | | | |
| | | |
Reference Entity — Short | | | | | | | | | | | | |
| | | |
| Common Stocks | | | | | | | | | |
| | | |
| China | | | | | | | | | |
China Communications Services Corp. Ltd., Class H | | | (436,000 | ) | | | (254,038 | ) | | | (1.6 | ) |
China Conch Venture Holdings Ltd. | | | (252,000 | ) | | | (1,122,106 | ) | | | (7.0 | ) |
China Eastern Airlines Corp. Ltd., Class H | | | (900,000 | ) | | | (358,576 | ) | | | (2.2 | ) |
China Evergrande Group | | | (115,000 | ) | | | (229,335 | ) | | | (1.4 | ) |
China Literature Ltd. | | | (90,600 | ) | | | (744,318 | ) | | | (4.6 | ) |
China Molybdenum Co. Ltd., Class H | | | (861,000 | ) | | | (313,358 | ) | | | (1.9 | ) |
Cosco Shipping Holdings Co. Ltd., Class H | | | (495,500 | ) | | | (317,063 | ) | | | (2.0 | ) |
Gsx Techedu, Inc., ADR | | | (2,438 | ) | | | (161,932 | ) | | | (1.0 | ) |
Longfor Group Holdings Ltd. | | | (208,000 | ) | | | (1,139,655 | ) | | | (7.1 | ) |
Semiconductor Manufacturing International Corp. | | | (272,000 | ) | | | (802,436 | ) | | | (5.0 | ) |
Shanghai Fosun Pharmaceutical Group Co. Ltd., Class H | | | (157,000 | ) | | | (647,939 | ) | | | (4.0 | ) |
Travelsky Technology Ltd.,
Class H | | | (93,000 | ) | | | (196,043 | ) | | | (1.2 | ) |
Xiaomi Corp., Class B | | | (360,400 | ) | | | (1,024,990 | ) | | | (6.4 | ) |
ZhongAn Online P&C Insurance Co. Ltd.,
Class H | | | (14,500 | ) | | | (75,900 | ) | | | (0.5 | ) |
| | | | | | | | | | | | |
| | | | | | | (7,387,689 | ) | | | | |
| | | |
| Denmark | | | | | | | | | |
Orsted A/S | | | (2,754 | ) | | | (437,098 | ) | | | (2.7 | ) |
| | | | | | | | | | | | |
| | | |
| France | | | | | | | | | |
Airbus Se | | | (7,398 | ) | | | (541,282 | ) | | | (3.4 | ) |
| | | | | | | | | | | | |
| Security | | Shares | | | Value | | | % of
Basket
Value | |
| | | |
| France (continued) | | | | | | | | | |
Bouygues SA | | | (17,641 | ) | | $ | (578,509 | ) | | | (3.6 | )% |
Hermes International | | | (112 | ) | | | (104,283 | ) | | | (0.6 | ) |
| | | | | | | | | | | | |
| | | | | | | (1,224,074 | ) | | | | |
| | | |
| Hong Kong | | | | | | | | | |
China Resources Gas Group Ltd. | | | (96,000 | ) | | | (417,140 | ) | | | (2.6 | ) |
China Resources Land Ltd. | | | (68,000 | ) | | | (278,097 | ) | | | (1.7 | ) |
Galaxy Entertainment Group Ltd. | | | (19,000 | ) | | | (125,563 | ) | | | (0.8 | ) |
Shimao Group Holdings Ltd. | | | (63,500 | ) | | | (224,937 | ) | | | (1.4 | ) |
Sino Biopharmaceutical Ltd. | | | (450,000 | ) | | | (455,847 | ) | | | (2.8 | ) |
Wharf Real Estate Investment Co. Ltd. | | | (107,000 | ) | | | (411,820 | ) | | | (2.6 | ) |
| | | | | | | | | | | | |
| | | | | | | (1,913,404 | ) | | | | |
| | | |
| Italy | | | | | | | | | |
Atlantia SpA | | | (29,115 | ) | | | (446,931 | ) | | | (2.8 | ) |
| | | | | | | | | | | | |
| | | |
| Japan | | | | | | | | | |
ANA Holdings, Inc. | | | (9,100 | ) | | | (198,478 | ) | | | (1.2 | ) |
Z Holdings Corp. | | | (26,700 | ) | | | (186,181 | ) | | | (1.2 | ) |
| | | | | | | | | | | | |
| | | | | | | (384,659 | ) | | | | |
| | | |
| Norway | | | | | | | | | |
Equinor ASA | | | (51,365 | ) | | | (655,403 | ) | | | (4.1 | ) |
| | | | | | | | | | | | |
| | | |
| Poland | | | | | | | | | |
Polskie Gornictwo Naftowe i Gazownictwo SA | | | (155,634 | ) | | | (164,124 | ) | | | (1.0 | ) |
| | | | | | | | | | | | |
| | | |
| South Korea | | | | | | | | | |
Celltrion Healthcare Co. Ltd. | | | (7,459 | ) | | | (559,555 | ) | | | (3.5 | ) |
Korea Shipbuilding & Offshore Engineering Co. Ltd. | | | (7,231 | ) | | | (504,217 | ) | | | (3.1 | ) |
| | | | | | | | | | | | |
| | | | | | | (1,063,772 | ) | | | | |
| | | |
| Spain | | | | | | | | | |
Caixabank SA | | | (124,027 | ) | | | (226,298 | ) | | | (1.4 | ) |
Industria De Diseno Textil | | | (254,568 | ) | | | (6,285,112 | ) | | | (39.1 | ) |
| | | | | | | | | | | | |
| | | | | | | (6,511,410 | ) | | | | |
| | | |
| Sweden | | | | | | | | | |
Investor AB, B Shares | | | (2,390 | ) | | | (143,254 | ) | | | (0.9 | ) |
| | |
CONSOLIDATED SCHEDULE OF INVESTMENTS | | 41 |
| | |
Consolidated Schedule of Investments (continued) October 31, 2020 | | BlackRock Global Allocation Fund, Inc. |
| | | | | | | | | | | | |
| Security | | Shares | | | Value | | | % of
Basket
Value | |
| | | |
| Sweden (continued) | | | | | | | | | |
Swedbank AB, A Shares | | | (22,892 | ) | | $ | (358,388 | ) | | | (2.2 | )% |
Telia Co. AB | | | (131,922 | ) | | | (504,754 | ) | | | (3.1 | ) |
| | | | | | | | | | | | |
| | | | | | | (1,006,396 | ) | | | | |
| | | |
| Taiwan | | | | | | | | | |
Catcher Technology Co. Ltd. | | | (17,000 | ) | | | (107,466 | ) | | | (0.7 | ) |
E.sun Financial Holding Co. | | | (293,000 | ) | | | (249,113 | ) | | | (1.5 | ) |
Hotai Motor Co. Ltd. | | | (7,000 | ) | | | (147,535 | ) | | | (0.9 | ) |
| | | | | | | | | | | | |
| | | | | | | (504,114 | ) | | | | |
| | | |
| United Kingdom | | | | | | | | | |
British American Tobacco PLC | | | (5,969 | ) | | | (189,189 | ) | | | (1.2 | ) |
Prudential PLC | | | (14,628 | ) | | | (178,908 | ) | | | (1.1 | ) |
| | | | | | | | | | | | |
| | | | | | | (368,097 | ) | | | | |
| | | |
| United States | | | | | | | | | |
Boeing Co. | | | (6,753 | ) | | | (975,066 | ) | | | (6.1 | ) |
Eversource Energy | | | (5,969 | ) | | | (520,915 | ) | | | (3.2 | ) |
Honeywell International, Inc. | | | (2,970 | ) | | | (489,901 | ) | | | (3.1 | ) |
Keurig Dr Pepper, Inc. | | | (12,056 | ) | | | (324,306 | ) | | | (2.0 | ) |
Progressive Corp. | | | (7,370 | ) | | | (677,303 | ) | | | (4.2 | ) |
Simon Property Group, Inc. | | | (11,349 | ) | | | (712,831 | ) | | | (4.4 | ) |
Square, Inc., Class A | | | (813 | ) | | | (125,917 | ) | | | (0.8 | ) |
| | | | | | | | | | | | |
| | | | | | | (3,826,239 | ) | | | | |
| | | | | | | | | | | | |
| | | |
Total Reference Entity — Short | | | | | | | (25,893,410 | ) | | | | |
| | | | | | | | | | | | |
| | | |
Net Value of Reference Entity — Citibank N.A | | | | | | $ | 16,092,132 | | | | | |
| | | | | | | | | | | | |
The following table represents the individual short positions and related values of the equity securities underlying the total return swap with JPMorgan Chase Bank N.A. as of period end, termination date February 8, 2023:
| | | | | | | | | | | | |
| Security | | Shares | | | Value | | | % of
Basket
Value | |
| | | |
Reference Entity — Short | | | | | | | | | | | | |
| | | |
| Common Stocks | | | | | | | | | |
| | | |
| Australia | | | | | | | | | |
Ramsay Health Care Ltd. | | | (21,409 | ) | | $ | (938,020 | ) | | | 4.0 | % |
Scentre Group | | | (657,236 | ) | | | (969,896 | ) | | | 4.1 | |
Sydney Airport | | | (104,299 | ) | | | (399,891 | ) | | | 1.7 | |
Transurban Group | | | (74,015 | ) | | | (700,898 | ) | | | 3.0 | |
| | | | | | | | | | | | |
| | | | | | | (3,008,705 | ) | | | | |
| | | |
| Brazil | | | | | | | | | |
Hapvida Participacoes e Investimentos SA | | | (52,014 | ) | | | (583,508 | ) | | | 2.5 | |
Magazine Luiza SA | | | (126,440 | ) | | | (542,740 | ) | | | 2.3 | |
Raia Drogasil SA | | | (77,418 | ) | | | (324,624 | ) | | | 1.4 | |
Suzano SA | | | (50,327 | ) | | | (438,984 | ) | | | 1.8 | |
| | | | | | | | | | | | |
| | | | | | | (1,889,856 | ) | | | | |
| | | |
| Canada | | | | | | | | | |
Canadian National Railway Co. | | | (2,418 | ) | | | (240,203 | ) | | | 1.0 | |
Intact Financial Corp. | | | (2,868 | ) | | | (296,250 | ) | | | 1.2 | |
National Bank Of Canada | | | (5,688 | ) | | | (272,980 | ) | | | 1.2 | |
| | | | | | | | | | | | |
| | | | | | | (809,433 | ) | | | | |
| | | |
| China | | | | | | | | | |
Aluminum Corp. of China Ltd., Class H | | | (948,000 | ) | | | (207,063 | ) | | | 0.9 | |
China Southern Airlines Co. Ltd., Class H | | | (1,400,000 | ) | | | (733,297 | ) | | | 3.1 | |
Great Wall Motor Co. Ltd., Class H | | | (359,500 | ) | | | (582,056 | ) | | | 2.5 | |
| | | | | | | | | | | | |
| Security | | Shares | | | Value | | | % of
Basket
Value | |
| | | |
| China (continued) | | | | | | | | | |
iQIYI, Inc., ADR | | | (37,576 | ) | | $ | (928,127 | ) | | | 3.9 | % |
Nio American Depositary Shares Rep, ADR | | | (7,312 | ) | | | (223,601 | ) | | | 0.9 | |
Shandong Weigao Group Medical Polymer Co. Ltd. | | | (36,000 | ) | | | (69,818 | ) | | | 0.3 | |
Shenzhou International Group Holdings Ltd. | | | (21,100 | ) | | | (367,127 | ) | | | 1.6 | |
Tsingtao Brewery Co. Ltd., Class H | | | (48,000 | ) | | | (397,736 | ) | | | 1.7 | |
Xpeng, Inc., ADR | | | (8,995 | ) | | | (174,323 | ) | | | 0.7 | |
| | | | | | | | | | | | |
| | | | | | | (3,683,148 | ) | | | | |
| | | |
| France | | | | | | | | | |
Electricite de France SA | | | (27,826 | ) | | | (322,978 | ) | | | 1.4 | |
| | | | | | | | | | | | |
| | | |
| Germany | | | | | | | | | |
Merck Kgaa | | | (2,886 | ) | | | (427,507 | ) | | | 1.8 | |
| | | | | | | | | | | | |
| | | |
| Hong Kong | | | | | | | | | |
China Gas Holdings Ltd. | | | (52,200 | ) | | | (160,413 | ) | | | 0.7 | |
China Jinmao Holdings Group | | | (496,000 | ) | | | (251,300 | ) | | | 1.0 | |
Geely Automobile Holdings Ltd. | | | (192,000 | ) | | | (394,532 | ) | | | 1.7 | |
Link REIT | | | (62,900 | ) | | | (480,044 | ) | | | 2.0 | |
| | | | | | | | | | | | |
| | | | | | | (1,286,289 | ) | | | | |
| | | |
| Japan | | | | | | | | | |
Fast Retailing Co. Ltd. | | | (1,700 | ) | | | (1,185,821 | ) | | | 5.0 | |
Kintetsu Group Holdings Co. Ltd. | | | (3,600 | ) | | | (143,839 | ) | | | 0.6 | |
Nippon Paint Holdings Co. Ltd. | | | (7,600 | ) | | | (684,608 | ) | | | 2.9 | |
ORIX Corp. | | | (34,400 | ) | | | (402,316 | ) | | | 1.7 | |
Softbank Group Corp. | | | (10,800 | ) | | | (703,445 | ) | | | 3.0 | |
| | | | | | | | | | | | |
| | | | | | | (3,120,029 | ) | | | | |
| | | |
| Peru | | | | | | | | | |
Credicorp Ltd. | | | (5,284 | ) | | | (605,969 | ) | | | 2.6 | |
| | | | | | | | | | | | |
| | | |
| South Africa | | | | | | | | | |
Capitec Bank Holdings Ltd, | | | (9,219 | ) | | | (647,908 | ) | | | 2.7 | |
Shoprite Holdings Ltd. | | | (29,818 | ) | | | (236,198 | ) | | | 1.0 | |
Vodacom Group Ltd. | | | (58,801 | ) | | | (443,123 | ) | | | 1.9 | |
| | | | | | | | | | | | |
| | | | | | | (1,327,229 | ) | | | | |
| | | |
| South Korea | | | | | | | | | |
Amorepacific Group | | | (1,070 | ) | | | (31,025 | ) | | | 0.1 | |
Samsung C&T Corp. | | | (3,751 | ) | | | (367,432 | ) | | | 1.6 | |
| | | | | | | | | | | | |
| | | | | | | (398,457 | ) | | | | |
| | | |
| Spain | | | | | | | | | |
Aena SME SA | | | (4,203 | ) | | | (566,294 | ) | | | 2.4 | |
Amadeus IT Group SA | | | (8,323 | ) | | | (396,559 | ) | | | 1.7 | |
Ferrovial SA | | | (10,658 | ) | | | (230,826 | ) | | | 1.0 | |
| | | | | | | | | | | | |
| | | |
| | | | | | (1,193,679) | | | | |
| | | |
| Switzerland | | | | | | | | | |
Schindler Holding Part Cert | | | (337 | ) | | | (86,328 | ) | | | 0.4 | |
Swisscom AG, Registered Shares | | | (757 | ) | | | (385,011 | ) | | | 1.6 | |
| | | | | | | | | | | | |
| | | | | | | (471,339 | ) | | | | |
| | | |
| Taiwan | | | | | | | | | |
Mega Financial Holding Co.Ltd. | | | (123,000 | ) | | | (118,523 | ) | | | 0.5 | |
Taiwan Mobile Co. Ltd. | | | (26,000 | ) | | | (88,816 | ) | | | 0.4 | |
| | | | | | | | | | | | |
| | | | | | | (207,339 | ) | | | | |
| | | |
| United States | | | | | | | | | |
Amerisourcebergen Corp. | | | (2,081 | ) | | | (199,922 | ) | | | 0.8 | |
Delta Air Lines, Inc. | | | (7,622 | ) | | | (233,538 | ) | | | 1.0 | |
Dominion Energy, Inc. | | | (3,138 | ) | | | (252,107 | ) | | | 1.1 | |
Fox Corp., Class A | | | (17,876 | ) | | | (474,072 | ) | | | 2.0 | |
Fox Corp., Class B | | | (19,563 | ) | | | (511,377 | ) | | | 2.2 | |
| | |
| 42 | | 2020 BLACKROCK ANNUAL REPORTTO SHAREHOLDERS |
| | |
Consolidated Schedule of Investments (continued) October 31, 2020 | | BlackRock Global Allocation Fund, Inc. |
| | | | | | | | | | | | |
| Security | | Shares | | | Value | | | % of
Basket
Value | |
| | | |
| United States (continued) | | | | | | | | | |
Hormel Foods Corp. | | | (10,690 | ) | | $ | (520,496 | ) | | | 2.2 | % |
Roper Technologies, Inc. | | | (2,578 | ) | | | (957,314 | ) | | | 4.1 | |
Ross Stores, Inc. | | | (5,100 | ) | | | (434,367 | ) | | | 1.8 | |
Trane Technologies PLC | | | (903 | ) | | | (119,873 | ) | | | 0.5 | |
Twitter, Inc. | | | (4,497 | ) | | | (185,996 | ) | | | 0.8 | |
Welltower Inc. | | | (5,790 | ) | | | (311,328 | ) | | | 1.3 | |
Xcel Energy, Inc. | | | (8,238 | ) | | | (576,907 | ) | | | 2.4 | |
| | | | | | | | | | | | |
| | | | | | | (4,777,297 | ) | | | | |
| | | | | | | | | | | | |
| | | | | | | (23,529,254 | ) | | | | |
| | | | | | | | | | | | |
| Security | | Shares | | | Value | | | % of
Basket
Value | |
| | | |
| United States (continued) | | | | | | | | | |
| | | |
| Preferred Stocks | | | | | | | | | |
| | | |
| Brazil | | | | | | | | | |
Lojas Americanas SA, Preference Shares | | | (15,831 | ) | | $ | (64,091 | ) | | | 0.3 | % |
| | | | | | | | | | | | |
| | | |
Net Value of Reference Entity — JPMorgan Chase Bank N.A | | | | | | $ | (23,593,345 | ) | | | | |
| | | | | | | | | | | | |
Balances Reported in the Consolidated Statement of Assets and Liabilities for Centrally Cleared Swaps, OTC Swaps and Options Written
| | | | | | | | | | | | | | | | | | | | |
| Description | | Swap
Premiums
Paid | | | Swap
Premiums
Received | | | Unrealized
Appreciation | | | Unrealized
Depreciation | | | Value | |
Centrally Cleared Swaps(a) | | $ | 8,580,343 | | | $ | (17,891,490 | ) | | $ | 39,364,773 | | | $ | (68,138,361 | ) | | $ | — | |
OTC Swaps | | | — | | | | — | | | | 2,787,943 | | | | (11,356,439 | ) | | | — | |
Options Written | | | — | | | | — | | | | 67,304,587 | | | | (50,110,144 | ) | | | (189,089,992 | ) |
| | (a) | Includes cumulative appreciation (depreciation) on centrally cleared swaps, as reported in the Consolidated Schedule of Investments. Only current day’s variation margin is reported within the Consolidated Statement of Assets and Liabilities and is net of any previously paid (received) swap premium amounts. | |
Derivative Financial Instruments Categorized by Risk Exposure
As of period end, the fair values of derivative financial instruments located in the Consolidated Statement of Assets and Liabilities were as follows:
| | | | | | | | | | | | | | | | | | | | | | | | | | | | |
| | | Commodity
Contracts | | | Credit
Contracts | | | Equity
Contracts | | | Foreign
Currency
Exchange
Contracts | | | Interest
Rate
Contracts | | | Other
Contracts | | | Total | |
| | | | | | | |
| Assets — Derivative Financial Instruments | | | | | | | | | | | | | | | | | | | | | |
Futures contracts | | | | | | | | | | | | | | | | | | | | | | | | | | | | |
Unrealized appreciation on futures contracts(a) | | $ | — | | | $ | — | | | $ | 73,050,972 | | | $ | — | | | $ | 17,326,266 | | | $ | — | | | $ | 90,377,238 | |
Forward foreign currency exchange contracts | | | | | | | | | | | | | | | | | | | | | | | | | | | | |
Unrealized appreciation on forward foreign currency exchange contracts | | | — | | | | — | | | | — | | | | 38,828,597 | | | | — | | | | — | | | | 38,828,597 | |
Options purchased | | | | | | | | | | | | | | | | | | | | | | | | | | | | |
Investments at value — unaffiliated(b) | | | — | | | | 121,265 | | | | 144,374,387 | | | | 6,452,498 | | | | 21,437,051 | | | | — | | | | 172,385,201 | |
Swaps — centrally cleared | | | | | | | | | | | | | | | | | | | | | | | | | | | | |
Unrealized appreciation on centrally cleared swaps(a) | | | — | | | | 11,333,362 | | | | — | | | | — | | | | 28,031,411 | | | | — | | | | 39,364,773 | |
Swaps — OTC | | | | | | | | | | | | | | | | | | | | | | | | | | | | |
Unrealized appreciation on OTC swaps; Swap premiums paid | | | — | | | | — | | | | 2,787,943 | | | | — | | | | — | | | | — | | | | 2,787,943 | |
| | | | | | | | | | | | | | | | | | | | | | | | | | | | |
| | $ | — | | | $ | 11,454,627 | | | $ | 220,213,302 | | | $ | 45,281,095 | | | $ | 66,794,728 | | | $ | — | | | $ | 343,743,752 | |
| | | | | | | | | | | | | | | | | | | | | | | | | | | | |
| | | | | | | |
| Liabilities — Derivative Financial Instruments | | | | | | | | | | | | | | | | | | | | | |
Futures contracts | | | | | | | | | | | | | | | | | | | | | | | | | | | | |
Unrealized depreciation on futures contracts(a) | | $ | — | | | $ | — | | | $ | 20,098,590 | | | $ | — | | | $ | 16,822,922 | | | $ | — | | | $ | 36,921,512 | |
Forward foreign currency exchange contracts | | | | | | | | | | | | | | | | | | | | | | | | | | | | |
Unrealized depreciation on forward foreign currency exchange contracts | | | — | | | | — | | | | — | | | | 32,289,915 | | | | — | | | | — | | | | 32,289,915 | |
Options written | | | | | | | | | | | | | | | | | | | | | | | | | | | | |
Options written at value | | | — | | | | 56,828 | | | | 147,404,961 | | | | 2,367,459 | | | | 39,260,744 | | | | — | | | | 189,089,992 | |
| | |
CONSOLIDATED SCHEDULE OF INVESTMENTS | | 43 |
| | |
Consolidated Schedule of Investments (continued) October 31, 2020 | | BlackRock Global Allocation Fund, Inc. |
Derivative Financial Instruments Categorized by Risk Exposure (continued)
| | | | | | | | | | | | | | | | | | | | | | | | | | | | |
| | | Commodity
Contracts | | | Credit
Contracts | | | Equity Contracts | | | Foreign
Currency
Exchange
Contracts | | | Interest Rate
Contracts | | | Other
Contracts | | | Total | |
Swaps — centrally cleared | | | | | | | | | | | | | | | | | | | | | | | | | | | | |
Unrealized depreciation on centrally cleared swaps(a) | | $ | — | | | $ | 10,844,996 | | | $ | — | | | $ | — | | | $ | 57,293,365 | | | $ | — | | | $ | 68,138,361 | |
Swaps — OTC | | | | | | | | | | | | | | | | | | | | | | | | | | | | |
Unrealized depreciation on OTC swaps; Swap premiums received | | | — | | | | — | | | | 11,356,439 | | | | — | | | | — | | | | — | | | | 11,356,439 | |
| | | | | | | | | | | | | | | | | | | | | | | | | | | | |
| | $ | — | | | $ | 10,901,824 | | | $ | 178,859,990 | | | $ | 34,657,374 | | | $ | 113,377,031 | | | $ | — | | | $ | 337,796,219 | |
| | | | | | | | | | | | | | | | | | | | | | | | | | | | |
| | (a) | Net cumulative unrealized appreciation (depreciation) on futures contracts and centrally cleared swaps, if any, are reported in the Consolidated Schedule of Investments. In the Consolidated Statement of Assets and Liabilities, only current day’s variation margin is reported in receivables or payables and the net cumulative unrealized appreciation (depreciation) is included in accumulated earnings (loss). | |
| | (b) | Includes options purchased at value as reported in the Consolidated Schedule of Investments. | |
For the year ended October 31, 2020, the effect of derivative financial instruments in the Consolidated Statement of Operations was as follows:
| | | | | | | | | | | | | | | | | | | | | | | | | | | | |
| | | Commodity Contracts | | | Credit
Contracts | | | Equity
Contracts | | | Foreign
Currency
Exchange
Contracts | | | Interest Rate
Contracts | | | Other
Contracts | | | Total | |
| | | | | | | |
| Net Realized Gain (Loss) from | | | | | | | | | | | | | | | | | | | | | |
Futures contracts | | $ | — | | | $ | — | | | $ | 1,747,687 | | | $ | — | | | $ | 155,047,658 | | | $ | — | | | $ | 156,795,345 | |
Forward foreign currency exchange contracts | | | — | | | | — | | | | — | | | | (72,908,192 | ) | | | — | | | | — | | | | (72,908,192 | ) |
Options purchased(a) | | | — | | | | — | | | | 152,130,875 | | | | (22,040,389 | ) | | | (38,758,833 | ) | | | — | | | | 91,331,653 | |
Options written | | | — | | | | 489,253 | | | | 84,506,132 | | | | 23,859,157 | | | | 27,629,183 | | | | — | | | | 136,483,725 | |
Swaps | | | — | | | | 18,746,707 | | | | 5,523,018 | | | | — | | | | (6,965,870 | ) | | | — | | | | 17,303,855 | |
| | | | | | | | | | | | | | | | | | | | | | | | | | | | |
| | $ | — | | | $ | 19,235,960 | | | $ | 243,907,712 | | | $ | (71,089,424 | ) | | $ | 136,952,138 | | | $ | — | | | $ | 329,006,386 | |
| | | | | | | | | | | | | | | | | | | | | | | | | | | | |
| | | | | | | |
Net Change in Unrealized
Appreciation (Depreciation) on | | | | | | | | | | | | | | | | | | | | | |
Futures contracts | | $ | — | | | $ | — | | | $ | 91,398,542 | | | $ | — | | | $ | 5,659,828 | | | $ | — | | | $ | 97,058,370 | |
Forward foreign currency exchange contracts | | | — | | | | — | | | | — | | | | (8,988,431 | ) | | | — | | | | — | | | | (8,988,431 | ) |
Options purchased(b) | | | — | | | | 12,647 | | | | (62,907,512 | ) | | | (2,610,113 | ) | | | 11,755,737 | | | | — | | | | (53,749,241 | ) |
Options written | | | — | | | | (13,381 | ) | | | (2,352,222 | ) | | | (1,975,054 | ) | | | (8,051,420 | ) | | | — | | | | (12,392,077 | ) |
Swaps | | | — | | | | 1,890,555 | | | | (9,289,815 | ) | | | — | | | | (27,750,378 | ) | | | — | | | | (35,149,638 | ) |
| | | | | | | | | | | | | | | | | | | | | | | | | | | | |
| | $ | — | | | $ | 1,889,821 | | | $ | 16,848,993 | | | $ | (13,573,598 | ) | | $ | (18,386,233 | ) | | $ | — | | | $ | (13,221,017 | ) |
| | | | | | | | | | | | | | | | | | | | | | | | | | | | |
| | (a) | Options purchased are included in net realized gain (loss) from investments — unaffiliated. | |
| | (b) | Options purchased are included in net change in unrealized appreciation (depreciation) on investments — unaffiliated. | |
Average Quarterly Balances of Outstanding Derivative Financial Instruments
| | | | |
Futures contracts | | | | |
Average notional value of contracts — long | | $ | 2,882,394,505 | |
Average notional value of contracts — short | | $ | 3,634,103,879 | |
Forward foreign currency exchange contracts | | | | |
Average amounts purchased — in USD | | $ | 1,773,921,694 | |
Average amounts sold — in USD | | $ | 3,008,494,481 | |
Options | | | | |
Average value of option contracts purchased | | $ | 158,922,589 | |
Average value of option contracts written | | $ | 142,722,039 | |
Average notional value of swaption contracts purchased | | $ | 939,256,071 | |
Average notional value of swaption contracts written | | $ | 3,159,502,302 | |
Credit default swaps | | | | |
Average notional value — buy protection | | $ | 1,058,811,072 | |
Average notional value — sell protection | | $ | 67,516,155 | |
Interest rate swaps | | | | |
Average notional value — pays fixed rate | | $ | 1,749,907,401 | |
Average notional value — receives fixed rate | | $ | 879,120,073 | |
Total return swaps | | | | |
Average notional value | | $ | 67,679,789 | |
For more information about the Fund’s investment risks regarding derivative financial instruments, refer to the Notes to Consolidated Financial Statements.
| | |
| 44 | | 2020 BLACKROCK ANNUAL REPORTTO SHAREHOLDERS |
| | |
Consolidated Schedule of Investments (continued) October 31, 2020 | | BlackRock Global Allocation Fund, Inc. |
Derivative Financial Instruments — Offsetting as of Period End
The Fund’s derivative assets and liabilities (by type) were as follows:
| | | | | | | | |
| | | Assets | | | Liabilities | |
Derivative Financial Instruments | | | | | | | | |
Futures contracts | | $ | 34,308,238 | | | $ | 2,431,431 | |
Forward foreign currency exchange contracts | | | 38,828,597 | | | | 32,289,915 | |
Options | | | 172,385,201 | (a) | | | 189,089,992 | |
Swaps — centrally cleared | | | 931,930 | | | | — | |
Swaps — OTC(b) | | | 2,787,943 | | | | 11,356,439 | |
| | | | | | | | |
Total derivative assets and liabilities in the Consolidated Statement of Assets and Liabilities | | | 249,241,909 | | | | 235,167,777 | |
| | | | | | | | |
Derivatives not subject to a Master Netting Agreement or similar agreement (“MNA”) | | | (154,669,999 | ) | | | (139,351,110 | ) |
| | | | | | | | |
Total derivative assets and liabilities subject to an MNA | | $ | 94,571,910 | | | $ | 95,816,667 | |
| | | | | | | | |
| | (a) | Includes options purchased at value which is included in Investments at value — unaffiliated in the Consolidated Statement of Assets and Liabilities and reported in the Consolidated Schedule of Investments. | |
| | (b) | Includes unrealized appreciation (depreciation) on OTC swaps and swap premiums (paid/received) in the Consolidated Statement of Assets and Liabilities. | |
The following table presents the Fund’s derivative assets (and liabilities) by counterparty net of amounts available for offset under an MNA and net of the related collateral received (and pledged) by the Fund:
| | | | | | | | | | | | | | | | | | | | |
| Counterparty | |
| Derivative
Assets
Subject to an
MNA by
Counterparty |
| |
| Derivatives
Availablefor Offset |
(a) | |
| Non-Cash
Collateral
Received |
| |
| Cash Collateral
Received |
(b) | |
| Net Amount
of Derivative
Assets |
(c)(d) |
Bank of America N.A | | $ | 6,482,106 | | | $ | (6,482,106 | ) | | $ | — | | | $ | — | | | $ | — | |
Barclays Bank PLC | | | 6,174,339 | | | | (6,174,339 | ) | | | — | | | | — | | | | — | |
BNP Paribas S.A | | | 8,202,404 | | | | (8,202,404 | ) | | | — | | | | — | | | | — | |
Citibank N.A | | | 19,985,534 | | | | (19,985,534 | ) | | | — | | | | — | | | | — | |
Credit Suisse International | | | 2,208,119 | | | | (2,208,119 | ) | | | — | | | | — | | | | — | |
Deutsche Bank AG | | | 3,670,593 | | | | — | | | | — | | | | (3,210,000 | ) | | | 460,593 | |
Goldman Sachs International | | | 3,435,729 | | | | (3,435,729 | ) | | | — | | | | — | | | | — | |
HSBC Bank PLC | | | 1,443,061 | | | | (428,596 | ) | | | — | | | | (1,014,465 | ) | | | — | |
HSBC Bank USA N.A | | | 1,266,082 | | | | (1,266,082 | ) | | | — | | | | — | | | | — | |
JPMorgan Chase Bank N.A | | | 19,082,662 | | | | (7,310,636 | ) | | | — | | | | (2,690,000 | ) | | | 9,082,026 | |
Morgan Stanley & Co. International PLC | | | 11,442,902 | | | | (5,231,061 | ) | | | — | | | | (6,211,841 | ) | | | — | |
Nomura International PLC | | | 2,873,991 | | | | (1,347,848 | ) | | | — | | | | (1,270,000 | ) | | | 256,143 | |
Societe Generale | | | 2,608,243 | | | | (2,441,783 | ) | | | — | | | | — | | | | 166,460 | |
UBS AG | | | 5,696,145 | | | | (2,633,841 | ) | | | — | | | | — | | | | 3,062,304 | |
| | | | | | | | | | | | | | | | | | | | |
| | $ | 94,571,910 | | | $ | (67,148,078 | ) | | $ | — | | | $ | (14,396,306 | ) | | $ | 13,027,526 | |
| | | | | | | | | | | | | | | | | | | | |
| | | | | | | | | | | | | | | | | | | | |
| Counterparty | |
| Derivative
Liabilities
Subject to an
MNA by
Counterparty |
| |
| Derivatives
Availablefor Offset |
(a) | |
| Non-Cash
Collateral
Pledged |
(e) | |
| Cash Collateral
Pledged |
| |
| Net Amount
of Derivative
Liabilities |
(c)(f) |
Bank of America N.A | | $ | 8,434,863 | | | $ | (6,482,106 | ) | | $ | — | | | $ | — | | | $ | 1,952,757 | |
Barclays Bank PLC | | | 15,657,952 | | | | (6,174,339 | ) | | | (8,813,690 | ) | | | — | | | | 669,923 | |
BNP Paribas S.A | | | 8,451,224 | | | | (8,202,404 | ) | | | — | | | | — | | | | 248,820 | |
Citibank N.A | | | 22,626,791 | | | | (19,985,534 | ) | | | (2,641,257 | ) | | | — | | | | — | |
Credit Suisse International | | | 3,223,829 | | | | (2,208,119 | ) | | | (954,853 | ) | | | — | | | | 60,857 | |
Goldman Sachs International | | | 14,854,673 | | | | (3,435,729 | ) | | | (8,495,045 | ) | | | — | | | | 2,923,899 | |
HSBC Bank PLC | | | 428,596 | | | | (428,596 | ) | | | — | | | | — | | | | — | |
HSBC Bank USA N.A | | | 3,173,570 | | | | (1,266,082 | ) | | | — | | | | — | | | | 1,907,488 | |
JPMorgan Chase Bank N.A | | | 7,310,636 | | | | (7,310,636 | ) | | | — | | | | — | | | | — | |
Morgan Stanley & Co. International PLC | | | 5,231,061 | | | | (5,231,061 | ) | | | — | | | | — | | | | — | |
Nomura International PLC | | | 1,347,848 | | | | (1,347,848 | ) | | | — | | | | — | | | | — | |
| | |
CONSOLIDATED SCHEDULE OF INVESTMENTS | | 45 |
| | |
Consolidated Schedule of Investments (continued) October 31, 2020 | | BlackRock Global Allocation Fund, Inc. |
| | | | | | | | | | | | | | | | | | | | |
| Counterparty | |
| Derivative
Liabilities
Subject to
an MNA by
Counterparty |
| |
| Derivatives
Availablefor Offset |
(a) | |
| Non-Cash
Collateral
Pledged |
(e) | |
| Cash
Collateral
Pledged |
| |
| Net Amount
of Derivative
Liabilities |
(c)(f) |
Societe Generale | | $ | 2,441,783 | | | $ | (2,441,783 | ) | | $ | — | | | $ | — | | | $ | — | |
UBS AG | | | 2,633,841 | | | | (2,633,841 | ) | | | — | | | | — | | | | — | |
| | | | | | | | | | | | | | | | | | | | |
| | $ | 95,816,667 | | | $ | (67,148,078 | ) | | $ | (20,904,845 | ) | | $ | — | | | $ | 7,763,744 | |
| | | | | | | | | | | | | | | | | | | | |
| | (a) | The amount of derivatives available for offset is limited to the amount of derivative asset and/or liabilities that are subject to an MNA. | |
| | (b) | Excess of collateral received from the individual counterparty is not shown for financial reporting purposes. | |
| | (c) | Net amount may also include forward foreign currency exchange contracts that are not required to be collateralized. | |
| | (d) | Net amount represents the net amount receivable from the counterparty in the event of default. | |
| | (e) | Excess of collateral pledged to the individual counterparty is not shown for financial reporting purposes. | |
| | (f) | Net amount represents the net amount payable due to counterparty in the event of default. Net amount may be offset further by the options written receivable/payable on the Consolidated Statement of Assets and Liabilities. | |
Fair Value Hierarchy as of Period End
Various inputs are used in determining the fair value of financial instruments. For description of the input levels and information about the Fund’s policy regarding valuation of financial instruments, refer to the Notes to Consolidated Financial Statements.
The following table summarizes the Fund’s investments and derivative financial instruments categorized in the disclosure hierarchy. The breakdown of the Fund’s investments into major categories is disclosed in the Consolidated Schedule of Investments above.
| | | | | | | | | | | | | | | | |
| | | Level 1 | | | Level 2 | | | Level 3 | | | Total | |
Assets | | | | | | | | | | | | | | | | |
Investments | | | | | | | | | | | | | | | | |
Long-Term Investments | | | | | | | | | | | | | | | | |
Asset-Backed Securities | | $ | — | | | $ | 140,060,272 | | | $ | 910,739 | | | $ | 140,971,011 | |
Common Stocks | | | | | | | | | | | | | | | | |
Argentina | | | 6,252,306 | | | | — | | | | — | | | | 6,252,306 | |
Australia | | | — | | | | 19,138,996 | | | | 36,275,449 | | | | 55,414,445 | |
Brazil | | | 6,644,159 | | | | — | | | | — | | | | 6,644,159 | |
Canada | | | 173,728,966 | | | | — | | | | — | | | | 173,728,966 | |
China | | | 148,641,920 | | | | 413,521,893 | | | | — | | | | 562,163,813 | |
Denmark | | | — | | | | 29,709,899 | | | | — | | | | 29,709,899 | |
Finland | | | — | | | | 67,255,709 | | | | — | | | | 67,255,709 | |
France | | | — | | | | 517,690,000 | | | | — | | | | 517,690,000 | |
Germany | | | 18,764,332 | | | | 470,559,618 | | | | — | | | | 489,323,950 | |
Hong Kong | | | — | | | | 174,400,406 | | | | — | | | | 174,400,406 | |
India | | | — | | | | 87,657,593 | | | | — | | | | 87,657,593 | |
Indonesia | | | — | | | | 6,728,399 | | | | — | | | | 6,728,399 | |
Italy | | | — | | | | 313,589,645 | | | | — | | | | 313,589,645 | |
Japan | | | — | | | | 545,029,876 | | | | — | | | | 545,029,876 | |
Mexico | | | 1,088,590 | | | | — | | | | — | | | | 1,088,590 | |
Netherlands | | | 98,982,582 | | | | 511,845,978 | | | | — | | | | 610,828,560 | |
Norway | | | 3,967,029 | | | | — | | | | — | | | | 3,967,029 | |
Poland | | | — | | | | 208,165 | | | | — | | | | 208,165 | |
Portugal | | | — | | | | 4,429,904 | | | | — | | | | 4,429,904 | |
Singapore | | | — | | | | 36,173,244 | | | | — | | | | 36,173,244 | |
South Africa | | | — | | | | 5,980,758 | | | | — | | | | 5,980,758 | |
South Korea | | | — | | | | 62,806,119 | | | | — | | | | 62,806,119 | |
Spain | | | — | | | | 83,852,442 | | | | — | | | | 83,852,442 | |
Sweden | | | — | | | | 188,297,093 | | | | — | | | | 188,297,093 | |
Switzerland | | | 9,074,165 | | | | 253,408,336 | | | | — | | | | 262,482,501 | |
Taiwan | | | — | | | | 248,535,295 | | | | — | | | | 248,535,295 | |
Thailand | | | — | | | | 10,992,970 | | | | — | | | | 10,992,970 | |
Turkey | | | — | | | | 736,169 | | | | — | | | | 736,169 | |
United Arab Emirates | | | — | | | | — | | | | 29 | | | | 29 | |
United Kingdom | | | 30,916,492 | | | | 338,105,033 | | | | — | | | | 369,021,525 | |
United States | | | 9,104,594,605 | | | | 180,594,871 | | | | 24,387,621 | | | | 9,309,577,097 | |
Zambia | | | 20,148,112 | | | | — | | | | — | | | | 20,148,112 | |
| | |
| 46 | | 2020 BLACKROCK ANNUAL REPORTTO SHAREHOLDERS |
| | |
Consolidated Schedule of Investments (continued) October 31, 2020 | | BlackRock Global Allocation Fund, Inc. |
Fair Value Hierarchy as of Period End (continued)
| | | | | | | | | | | | | | | | |
| | | Level 1 | | | Level 2 | | | Level 3 | | | Total | |
Corporate Bonds | | | | | | | | | | | | | | | | |
Australia | | $ | — | | | $ | 1,153,884 | | | $ | 164,818,179 | | | $ | 165,972,063 | |
Brazil | | | — | | | | 11,479,817 | | | | — | | | | 11,479,817 | |
Canada | | | — | | | | 18,349,525 | | | | — | | | | 18,349,525 | |
Cayman Islands | | | — | | | | 4,306,014 | | | | — | | | | 4,306,014 | |
Chile | | | — | | | | 11,921,096 | | | | — | | | | 11,921,096 | |
China | | | — | | | | 39,500 | | | | — | | | | 39,500 | |
Colombia | | | — | | | | 6,455,942 | | | | — | | | | 6,455,942 | |
France | | | — | | | | 10,980,603 | | | | — | | | | 10,980,603 | |
Germany | | | — | | | | 5,894,603 | | | | — | | | | 5,894,603 | |
Greece | | | — | | | | 15,961,439 | | | | — | | | | 15,961,439 | |
India | | | — | | | | 426,972 | | | | 1 | | | | 426,973 | |
Indonesia | | | — | | | | 5,929,706 | | | | — | | | | 5,929,706 | |
Israel | | | — | | | | 3,072,598 | | | | — | | | | 3,072,598 | |
Italy | | | — | | | | 5,997,039 | | | | — | | | | 5,997,039 | |
Japan | | | — | | | | 6,980,878 | | | | — | | | | 6,980,878 | |
Luxembourg | | | — | | | | 38,837,669 | | | | — | | | | 38,837,669 | |
Malaysia | | | — | | | | 2,791,027 | | | | — | | | | 2,791,027 | |
Mexico | | | — | | | | 11,179,119 | | | | — | | | | 11,179,119 | |
MultiNational | | | — | | | | 6,605,572 | | | | — | | | | 6,605,572 | |
Netherlands | | | — | | | | 2,107,646 | | | | — | | | | 2,107,646 | |
Peru | | | — | | | | 3,054,350 | | | | — | | | | 3,054,350 | |
Saudi Arabia | | | — | | | | 3,371,125 | | | | — | | | | 3,371,125 | |
Singapore | | | 10,813,244 | | | | — | | | | — | | | | 10,813,244 | |
South Korea | | | — | | | | 1,751,360 | | | | — | | | | 1,751,360 | |
Spain | | | — | | | | 4,032,362 | | | | — | | | | 4,032,362 | |
Switzerland | | | — | | | | 10,020,893 | | | | — | | | | 10,020,893 | |
Turkey | | | — | | | | — | | | | 13,732,875 | | | | 13,732,875 | |
United Arab Emirates | | | — | | | | 5,732,809 | | | | — | | | | 5,732,809 | |
United Kingdom | | | — | | | | 31,083,732 | | | | — | | | | 31,083,732 | |
United States | | | — | | | | 1,170,505,357 | | | | — | | | | 1,170,505,357 | |
Floating Rate Loan Interests | | | — | | | | 235,626,893 | | | | 95,288,584 | | | | 330,915,477 | |
Foreign Agency Obligations | | | — | | | | 1,662,781,291 | | | | — | | | | 1,662,781,291 | |
Investment Companies | | | 1,341,580,404 | | | | — | | | | — | | | | 1,341,580,404 | |
Municipal Bonds | | | — | | | | 22,923,541 | | | | — | | | | 22,923,541 | |
Non-Agency Mortgage-Backed Securities | | | — | | | | 130,605,864 | | | | — | | | | 130,605,864 | |
Preferred Securities | | | | | | | | | | | | | | | | |
Capital Trusts | | | — | | | | 107,547,750 | | | | — | | | | 107,547,750 | |
Preferred Stocks | | | | | | | | | | | | | | | | |
Brazil | | | 4,299,622 | | | | — | | | | 6,694,261 | | | | 10,993,883 | |
Germany | | | — | | | | 359,207 | | | | — | | | | 359,207 | |
United States | | | 51,646,517 | | | | 35,715,422 | | | | 202,852,796 | | | | 290,214,735 | |
France | | | — | | | | — | | | | 31,112,515 | | | | 31,112,515 | |
Trust Preferreds | | | 42,926,511 | | | | — | | | | — | | | | 42,926,511 | |
U.S. Government Sponsored Agency Securities | | | — | | | | 2,597,888 | | | | — | | | | 2,597,888 | |
U.S. Treasury Obligations | | | — | | | | 1,607,500,110 | | | | — | | | | 1,607,500,110 | |
Warrants | | | — | | | | — | | | | 922,133 | | | | 922,133 | |
Short-Term Securities | | | | | | | | | | | | | | | | |
Money Market Funds | | | 3,000,470 | | | | — | | | | — | | | | 3,000,470 | |
Time Deposits | | | — | | | | 28,873,964 | | | | — | | | | 28,873,964 | |
U.S. Treasury Obligations | | | — | | | | 724,664,596 | | | | — | | | | 724,664,596 | |
Options Purchased | | | | | | | | | | | | | | | | |
Credit Contracts | | | — | | | | 121,265 | | | | — | | | | 121,265 | |
Equity Contracts | | | 119,429,831 | | | | 24,944,556 | | | | — | | | | 144,374,387 | |
Foreign Currency Exchange Contracts | | | — | | | | 6,452,498 | | | | — | | | | 6,452,498 | |
Interest Rate Contracts | | | — | | | | 21,437,051 | | | | — | | | | 21,437,051 | |
Unfunded Floating Rate Loan Interests(a) | | | — | | | | — | | | | — | | | | — | |
Liabilities | | | | | | | | | | | | | | | | |
Investments | | | | | | | | | | | | | | | | |
Investments Sold Short | | | | | | | | | | | | | | | | |
Common Stocks | | | | | | | | | | | | | | | | |
Finland | | | — | | | | (9,620,367 | ) | | | — | | | | (9,620,367 | ) |
| | |
CONSOLIDATED SCHEDULE OF INVESTMENTS | | 47 |
| | |
Consolidated Schedule of Investments (continued) October 31, 2020 | | BlackRock Global Allocation Fund, Inc. |
Fair Value Hierarchy as of Period End (continued)
| | | | | | | | | | | | | | | | |
| | | Level 1 | | | Level 2 | | | Level 3 | | | Total | |
Common Stocks (continued) | | | | | | | | | | | | | | | | |
Sweden | | $ | — | | | $ | (17,831,451 | ) | | $ | — | | | $ | (17,831,451 | ) |
United States | | | (29,344,901 | ) | | | — | | | | — | | | | (29,344,901 | ) |
| | | | | | | | | | | | | | | | |
| | $ | 11,167,154,956 | | | $ | 10,696,031,398 | | | $ | 576,995,182 | | | | 22,440,181,536 | |
| | | | | | | | | | | | | | | | |
Investments Valued at NAV(b) | | | | | | | | | | | | | | | 213,007,106 | |
| | | | | | | | | | | | | | | | |
| | | | | | | | | | | | | | $ | 22,653,188,642 | |
| | | | | | | | | | | | | | | | |
Derivative Financial Instruments(c) | | | | | | | | | | | | | | | | |
Assets | | | | | | | | | | | | | | | | |
Credit Contracts | | $ | — | | | $ | 11,333,362 | | | $ | — | | | $ | 11,333,362 | |
Equity Contracts | | | 73,050,972 | | | | 2,787,942 | | | | — | | | | 75,838,914 | |
Foreign Currency Exchange Contracts | | | — | | | | 38,828,597 | | | | — | | | | 38,828,597 | |
Interest Rate Contracts | | | 17,326,266 | | | | 28,031,411 | | | | — | | | | 45,357,677 | |
Liabilities | | | | | | | | | | | | | | | | |
Credit Contracts | | | — | | | | (10,901,824 | ) | | | — | | | | (10,901,824 | ) |
Equity Contracts | | | (149,231,019 | ) | | | (29,628,970 | ) | | | — | | | | (178,859,989 | ) |
Foreign Currency Exchange Contracts | | | — | | | | (34,657,374 | ) | | | — | | | | (34,657,374 | ) |
Interest Rate Contracts | | | (24,610,172 | ) | | | (88,766,859 | ) | | | — | | | | (113,377,031 | ) |
| | | | | | | | | | | | | | | | |
| | $ | (83,463,953 | ) | | $ | (82,973,715 | ) | | $ | — | | | $ | (166,437,668 | ) |
| | | | | | | | | | | | | | | | |
| | (a) | Unfunded floating rate loan interests are valued at the unrealized appreciation (depreciation) on the commitment. | |
| | (b) | Certain investments of the Fund were fair valued using NAV per share as no quoted market value is available and therefore have been excluded from the fair value hierarchy. | |
| | (c) | Derivative financial instruments are swaps, futures contracts, forward foreign currency exchange contracts and options written. Swaps, futures contracts and forward foreign currency exchange contracts are valued at the unrealized appreciation (depreciation) on the instrument and options written are shown at value. | |
A reconciliation of Level 3 financial instruments is presented when the Fund had a significant amount of Level 3 investments at the beginning and/or end of the period in relation to net assets. The following table is a reconciliation of Level 3 investments for which significant unobservable inputs were used in determining fair value:
| | | | | | | | | | | | | | | | | | | | | | | | | | | | |
| | | Asset-Backed
Securities | | | Common
Stocks | | | Corporate
Bonds | | | Floating
Rate Loan
Interests | | | Warrants | | | Preferred
Stocks | | | Total | |
Assets | | | | | | | | | | | | | | | | | | | | | | | | | | | | |
Opening balance, as of October 31, 2019 | | $ | — | | | $ | 37,705,545 | | | $ | 177,284,776 | | | $ | — | | | $ | — | | | $ | 156,271,267 | | | $ | 371,261,588 | |
Transfers into Level 3 | | | — | | | | 32,700,907 | | | | — | | | | — | | | | — | | | | — | | | | 32,700,907 | |
Transfers out of Level 3 | | | — | | | | — | | | | (444 | ) | | | — | | | | — | | | | (55,201,542 | ) | | | (55,201,986 | ) |
Accrued discounts/premiums | | | — | | | | — | | | | (278,150 | ) | | | 113,838 | | | | — | | | | — | | | | (164,312 | ) |
Net realized gain (loss) | | | — | | | | (31,106,631 | ) | | | — | | | | 55 | | | | — | | | | 74 | | | | (31,106,502 | ) |
Net change in unrealized appreciation (depreciation)(a)(b) | | | 5,658 | | | | (135,625 | ) | | | (4,651,600 | ) | | | 2,093,809 | | | | 922,132 | | | | 33,436,802 | | | | 31,671,176 | |
Purchases | | | 905,081 | | | | 23,484,726 | | | | 6,196,473 | | | | 115,258,057 | | | | 1 | | | | 106,166,124 | | | | 252,010,462 | |
Sales | | | — | | | | (1,985,823 | ) | | | — | | | | (22,177,175 | ) | | | — | | | | (13,153 | ) | | | (24,176,151 | ) |
| | | | | | | | | | | | | | | | | | | | | | | | | | | | |
Closing balance, as of October 31, 2020 | | $ | 910,739 | | | $ | 60,663,099 | | | $ | 178,551,055 | | | $ | 95,288,584 | | | $ | 922,133 | | | $ | 240,659,572 | | | $ | 576,995,182 | |
| | | | | | | | | | | | | | | | | | | | | | | | | | | | |
Net change in unrealized appreciation (depreciation) on investments still held at October 31, 2020(b) | | $ | 5,658 | | | $ | (21,594,195 | ) | | $ | (4,651,600 | ) | | $ | 2,093,809 | | | $ | 922,132 | | | $ | 33,436,909 | | | $ | 10,212,713 | |
| | | | | | | | | | | | | | | | | | | | | | | | | | | | |
| | (a) | Included in the related net change in unrealized appreciation (depreciation) in the Consolidated Statement of Operations. | |
| | (b) | Any difference between net change in unrealized appreciation (depreciation) and net change in unrealized appreciation (depreciation) on investments still held at October 31, 2020 is generally due to investments no longer held or categorized as Level 3 at period end. | |
The following table summarizes the valuation approaches used and unobservable inputs utilized by the BlackRock Global Valuation Methodologies Committee (the “Global Valuation Committee”) to determine the value of certain of the Fund’s Level 3 financial instruments as of period end. The table does not include Level 3 financial instruments
| | |
| 48 | | 2020 BLACKROCK ANNUAL REPORTTO SHAREHOLDERS |
| | |
Consolidated Schedule of Investments (continued) October 31, 2020 | | BlackRock Global Allocation Fund, Inc. |
with values based upon unadjusted third party pricing information in the amount of $76,784,719. A significant change in third party information could result in a significantly lower or higher value of such Level 3 financial instruments.
| | | | | | | | | | | | | | | | | | | | |
| | | | Value | | |
| Valuation
Approach |
| |
| Unobservable
Inputs |
| |
| Range of
Unobservable
InputsUtilized |
(a) | |
| Weighted
Average of
Unobservable
Inputs Based
on Fair Value |
|
Assets | | | | | | | | | | | | | | | | | | | | |
Common Stocks | | $ | 60,663,050 | | | | Market | | |
| Revenue Multiple
Time to Exit
Volatility
Recent Transactions |
| |
| 14.25x
1.6 years 53% — |
| |
| —
— — — |
|
| | | | | | | Income | | | | Discount Rate | | | | 15% | | | | — | |
| | | | | |
Corporate Bonds | | | 178,551,054 | | | | Income | | | | Discount Rate | | | | 15% - 31% | | | | 16% | |
Floating Rate Loan Interests | | | 19,414,664 | | | | Income | | | | Discount Rate | | | | 10% - 11% | | | | 10% | |
Preferred Stocks(b)(c) | | | 240,659,571 | | | | Market | | | | Revenue Multiple | | | | 3.00x - 14.25x | | | | 10.76x | |
| | | | | | | | | | | Time to Exit | | | | 0.9 years - 2.5 years | | | | 1.8 years | |
| | | | | | | | | | | Volatility | | | | 43% - 57% | | | | 53% | |
| | | | | | | | | | | Recent Transactions | | | | — | | | | — | |
Warrants | | | 922,124 | | | | Market | | |
| Revenue Multiple
Time to Exit
Volatility |
| |
| 6.75x - 9.50x
0.9 years - 2.5 years
43% - 56% |
| |
| 8.04x
1.8 years
49% |
|
| | | | | | | | | | | | | | | | | | | | |
| | $ | 500,210,463 | | | | | | | | | | | | | | | | | |
| | | | | | | | | | | | | | | | | | | | |
| | (a) | A significant change in unobservable input would have resulted in a correlated (inverse) significant change to value. | |
| | (b) | For the period ended October 31, 2020, the valuation technique for investments classified as Preferred Stocks amounting to $45,465,356 changed to Current Value Method. The investments were previously valued utilizing Transaction Price approach. The change was due to consideration of the information that was available at the time the investments were valued. | |
| | (c) | For the period ended October 31, 2020, the valuation technique for investments classified as Preferred Stocks amounting to $37,261,588 changed to Transaction Price approach. The investments were previously valued utilizing Probability-Weighted Expected Return Method. The change was due to consideration of the information that was available at the time the investments were valued. | |
See notes to consolidated financial statements.
| | |
CONSOLIDATED SCHEDULE OF INVESTMENTS | | 49 |
Consolidated Statement of Assets and Liabilities
October 31, 2020
| | | | |
| | | BlackRock Global
Allocation Fund, Inc. | |
|
ASSETS | |
Investments at value — unaffiliated(a)(b) | | $ | 21,701,523,728 | |
Investments at value — affiliated(c) | | | 1,008,461,634 | |
Cash | | | 94,030,270 | |
Cash pledged: | | | | |
Collateral — exchange-traded options written | | | 7,090,000 | |
Centrally cleared swaps | | | 56,433,000 | |
Foreign currency at value(d) | | | 1,226,921 | |
Receivables: | | | | |
Investments sold | | | 17,487,361 | |
Options written | | | 3,163,643 | |
Securities lending income — affiliated | | | 140,862 | |
Swaps | | | 634,028 | |
Capital shares sold | | | 35,668,224 | |
Dividends — unaffiliated | | | 20,226,146 | |
Dividends — affiliated | | | 454,923 | |
Interest — unaffiliated | | | 34,439,817 | |
Variation margin on futures contracts | | | 34,308,238 | |
Variation margin on centrally cleared swaps | | | 931,930 | |
Unrealized appreciation on: | | | | |
Forward foreign currency exchange contracts | | | 38,828,597 | |
OTC swaps | | | 2,787,943 | |
Prepaid expenses | | | 308,412 | |
| | | | |
Total assets | | | 23,058,145,677 | |
| | | | |
|
LIABILITIES | |
Investments sold short at value(e) | | | 56,796,719 | |
Cash received as collateral for OTC derivatives | | | 20,852,000 | |
Cash collateral on securities loaned at value | | | 212,741,137 | |
Options written at value(f) | | | 189,089,992 | |
Payables: | | | | |
Investments purchased | | | 77,480,889 | |
Swaps | | | 3,574,736 | |
Accounting services fees | | | 2,273,110 | |
Capital shares redeemed | | | 42,884,985 | |
Deferred foreign capital gain tax | | | 3,366,171 | |
Investment advisory fees | | | 13,615,379 | |
Directors’ and Officer’s fees | | | 35,636 | |
Options written | | | 7,783,709 | |
Other accrued expenses | | | 3,429,769 | |
Other affiliates | | | 133,882 | |
Professional fees | | | 313,914 | |
Service and distribution fees | | | 3,966,050 | |
Variation margin on futures contracts | | | 2,431,431 | |
Unrealized depreciation on: | | | | |
Forward foreign currency exchange contracts | | | 32,289,915 | |
OTC swaps | | | 11,356,439 | |
| | | | |
Total liabilities | | | 684,415,863 | |
| | | | |
| |
NET ASSETS | | $ | 22,373,729,814 | |
| | | | |
| | |
| 50 | | 2020 BLACKROCK ANNUAL REPORTTO SHAREHOLDERS |
Consolidated Statement of Assets and Liabilities (continued)
October 31, 2020
| | | | |
| | | BlackRock Global
Allocation Fund, Inc. | |
|
NET ASSETS CONSIST OF | |
Paid-in capital | | $ | 18,066,627,988 | |
Accumulated earnings | | | 4,307,101,826 | |
| | | | |
NET ASSETS | | $ | 22,373,729,814 | |
| | | | |
| |
(a) Investments at cost — unaffiliated | | $ | 17,805,768,607 | |
(b) Securities loaned at value | | $ | 207,571,491 | |
(c) Investments at cost — affiliated | | $ | 1,124,036,452 | |
(d) Foreign currency at cost | | $ | 1,527,280 | |
(e) Proceeds from investments sold short | | | 57,803,641 | |
(f) Premiums received | | $ | 206,284,435 | |
| | |
CONSOLIDATED FINANCIAL STATEMENTS | | 51 |
Consolidated Statement of Assets and Liabilities (continued)
October 31, 2020
| | | | |
| | | BlackRock Global
Allocation Fund, Inc. | |
|
NET ASSET VALUE | |
Institutional | | | | |
Net assets | | $ | 7,907,316,730 | |
| | | | |
Shares outstanding | | | 396,807,017 | |
| | | | |
Net asset value | | $ | 19.93 | |
| | | | |
Shares authorized | | | 2 billion | |
| | | | |
Par value | | $ | 0.10 | |
| | | | |
| |
Investor A | | | | |
Net assets | | $ | 11,184,639,130 | |
| | | | |
Shares outstanding | | | 566,207,193 | |
| | | | |
Net asset value | | $ | 19.75 | |
| | | | |
Shares authorized | | | 2 billion | |
| | | | |
Par value | | $ | 0.10 | |
| | | | |
| |
Investor C | | | | |
Net assets | | $ | 1,547,011,114 | |
| | | | |
Shares outstanding | | | 88,744,820 | |
| | | | |
Net asset value | | $ | 17.43 | |
| | | | |
Shares authorized | | | 2 billion | |
| | | | |
Par value | | $ | 0.10 | |
| | | | |
| |
Class K | | | | |
Net assets | | $ | 1,329,362,715 | |
| | | | |
Shares outstanding | | | 66,710,920 | |
| | | | |
Net asset value | | $ | 19.93 | |
| | | | |
Shares authorized | | | 2 billion | |
| | | | |
Par value | | $ | 0.10 | |
| | | | |
| |
Class R | | | | |
Net assets | | $ | 405,400,125 | |
| | | | |
Shares outstanding | | | 21,750,799 | |
| | | | |
Net asset value | | $ | 18.64 | |
| | | | |
Shares authorized | | | 2 billion | |
| | | | |
Par value | | $ | 0.10 | |
| | | | |
See notes to consolidated financial statements.
| | |
| 52 | | 2020 BLACKROCK ANNUAL REPORTTO SHAREHOLDERS |
Consolidated Statement of Operations
Year Ended October 31, 2020
| | | | |
| | | BlackRock Global
Allocation Fund, Inc. | |
|
INVESTMENT INCOME | |
Dividends — unaffiliated | | $ | 222,636,974 | |
Dividends — affiliated | | | 14,771,735 | |
Interest — unaffiliated | | | 155,218,314 | |
Securities lending income — affiliated — net | | | 2,230,310 | |
Other income | | | 777,583 | |
Other income — affiliated | | | 16,428 | |
Foreign taxes withheld | | | (9,086,205 | ) |
| | | | |
Total investment income | | | 386,565,139 | |
| | | | |
|
EXPENSES | |
Investment advisory | | | 168,840,350 | |
Service and distribution — class specific | | | 52,586,710 | |
Transfer agent — class specific | | | 20,953,607 | |
Accounting services | | | 1,848,261 | |
Custodian | | | 1,106,168 | |
Professional | | | 369,479 | |
Directors and Officer | | | 317,653 | |
Printing and postage | | | 268,493 | |
Registration | | | 266,159 | |
Miscellaneous | | | 371,414 | |
| | | | |
Total expenses excluding dividends expense and fees | | | 246,928,294 | |
Dividends expense — unaffiliated | | | 1,261,126 | |
Stock loan fees | | | 7,353 | |
| | | | |
Total expenses | | | 248,196,773 | |
Less: | | | | |
Fees paid indirectly | | | (31,220 | ) |
Fees waived and/or reimbursed by the Manager | | | (10,276,760 | ) |
| | | | |
Total expenses after fees waived and/or reimbursed | | | 237,888,793 | |
| | | | |
Net investment income | | | 148,676,346 | |
| | | | |
|
REALIZED AND UNREALIZED GAIN (LOSS) | |
Net realized gain (loss) from: | | | | |
Investments — unaffiliated(a) | | | 1,189,305,214 | |
Investments — affiliated | | | 9,318,784 | |
Capital gain distributions from underlying funds — affiliated | | | 156 | |
Foreign currency transactions | | | (7,662,060 | ) |
Forward foreign currency exchange contracts | | | (72,908,192 | ) |
Futures contracts | | | 156,795,345 | |
Options written | | | 136,483,725 | |
Short sales — unaffiliated | | | 19,841,739 | |
Swaps | | | 17,303,855 | |
| | | | |
| | | 1,448,478,566 | |
| | | | |
| | |
CONSOLIDATED FINANCIAL STATEMENTS | | 53 |
Consolidated Statement of Operations (continued)
Year Ended October 31, 2020
| | | | |
| | | BlackRock Global
Allocation Fund, Inc. | |
Net change in unrealized appreciation (depreciation) on: | | | | |
Investments — unaffiliated(b) | | $ | 393,958,996 | |
Investments — affiliated | | | 11,100,871 | |
Foreign currency translations | | | 1,724,643 | |
Forward foreign currency exchange contracts | | | (8,988,431 | ) |
Futures contracts | | | 97,058,370 | |
Options written | | | (12,392,077 | ) |
Short sales — unaffiliated | | | 1,006,922 | |
Swaps | | | (35,149,638 | ) |
| | | | |
| | | 448,319,656 | |
| | | | |
Net realized and unrealized gain | | | 1,896,798,222 | |
| | | | |
NET INCREASE IN NET ASSETS RESULTING FROM OPERATIONS | | $ | 2,045,474,568 | |
| | | | |
| |
(a) Net of foreign capital gain tax | | $ | 2,690,775 | |
(b) Net of deferred foreign capital gain tax | | $ | 1,068,013 | |
See notes to consolidated financial statements.
| | |
| 54 | | 2020 BLACKROCK ANNUAL REPORTTO SHAREHOLDERS |
Consolidated Statements of Changes in Net Assets
| | | | | | | | |
| | | BlackRock Global Allocation Fund, Inc. | |
| | | Year Ended October 31, | |
| | | 2020 | | | 2019 | |
| | |
INCREASE (DECREASE) IN NET ASSETS | | | | | | | | |
| | |
OPERATIONS | | | | | | | | |
Net investment income | | $ | 148,676,346 | | | $ | 359,384,978 | |
Net realized gain | | | 1,448,478,566 | | | | 1,657,511,891 | |
Net change in unrealized appreciation | | | 448,319,656 | | | | 460,854,493 | |
| | | | | | | | |
Net increase in net assets resulting from operations | | | 2,045,474,568 | | | | 2,477,751,362 | |
| | | | | | | | |
| | |
DISTRIBUTIONS TO SHAREHOLDERS(a) | | | | | | | | |
Institutional | | | (554,927,544 | ) | | | (740,960,412 | ) |
Investor A | | | (702,910,993 | ) | | | (660,060,342 | ) |
Investor C | | | (190,636,849 | ) | | | (268,550,116 | ) |
Class K | | | (83,133,683 | ) | | | (81,596,844 | ) |
Class R | | | (35,376,625 | ) | | | (44,354,639 | ) |
| | | | | | | | |
Decrease in net assets resulting from distributions to shareholders | | | (1,566,985,694 | ) | | | (1,795,522,353 | ) |
| | | | | | | | |
| | |
CAPITAL SHARE TRANSACTIONS | | | | | | | | |
Net decrease in net assets derived from capital share transactions | | | (2,216,536,634 | ) | | | (7,595,454,785 | ) |
| | | | | | | | |
| | |
NET ASSETS | | | | | | | | |
Total decrease in net assets | | | (1,738,047,760 | ) | | | (6,913,225,776 | ) |
Beginning of year | | | 24,111,777,574 | | | | 31,025,003,350 | |
| | | | | | | | |
End of year | | $ | 22,373,729,814 | | | $ | 24,111,777,574 | |
| | | | | | | | |
| (a) | Distributions for annual periods determined in accordance with U.S. federal income tax regulations. |
See notes to consolidated financial statements.
| | |
CONSOLIDATED FINANCIAL STATEMENTS | | 55 |
Consolidated Financial Highlights
(For a share outstanding throughout each period)
| | | | | | | | | | | | | | | | | | | | |
| | | BlackRock Global Allocation Fund, Inc. | |
| |
| | | Institutional | |
| |
| | | Year Ended October 31, | |
| | | 2020 | | | 2019 | | | 2018 | | | 2017 | | | 2016 | |
| | | | | |
Net asset value, beginning of year | | $ | 19.36 | | | $ | 18.81 | | | $ | 20.39 | | | $ | 18.43 | | | $ | 19.88 | |
| | | | | | | | | | | | | | | | | | | | |
Net investment income(a) | | | 0.17 | | | | 0.30 | | | | 0.28 | | | | 0.25 | | | | 0.25 | |
Net realized and unrealized gain (loss) | | | 1.75 | | | | 1.45 | | | | (0.84 | ) | | | 2.12 | | | | (0.05 | ) |
| | | | | | | | | | | | | | | | | | | | |
Net increase (decrease) from investment operations | | | 1.92 | | | | 1.75 | | | | (0.56 | ) | | | 2.37 | | | | 0.20 | |
| | | | | | | | | | | | | | | | | | | | |
| | | | | |
Distributions(b) | | | | | | | | | | | | | | | | | | | | |
From net investment income | | | (0.12 | ) | | | (0.22 | ) | | | (0.32 | ) | | | (0.26 | ) | | | (0.15 | ) |
From net realized gain | | | (1.23 | ) | | | (0.98 | ) | | | (0.70 | ) | | | (0.15 | ) | | | (1.50 | ) |
| | | | | | | | | | | | | | | | | | | | |
Total distributions | | | (1.35 | ) | | | (1.20 | ) | | | (1.02 | ) | | | (0.41 | ) | | | (1.65 | ) |
| | | | | | | | | | | | | | | | | | | | |
| | | | | |
Net asset value, end of year | | $ | 19.93 | | | $ | 19.36 | | | $ | 18.81 | | | $ | 20.39 | | | $ | 18.43 | |
| | | | | | | | | | | | | | | | | | | | |
| | | | | |
Total Return(c) | | | | | | | | | | | | | | | | | | | | |
Based on net asset value | | | 10.23 | %(d) | | | 9.96 | % | | | (2.94 | )% | | | 13.10 | % | | | 1.34 | % |
| | | | | | | | | | | | | | | | | | | | |
| | | | | |
Ratios to Average Net Assets(e) | | | | | | | | | | | | | | | | | | | | |
Total expenses | | | 0.86 | % | | | 0.85 | % | | | 0.87 | % | | | 0.90 | % | | | 0.88 | % |
| | | | | | | | | | | | | | | | | | | | |
Total expenses after fees waived and/or reimbursed | | | 0.81 | % | | | 0.80 | % | | | 0.80 | % | | | 0.82 | % | | | 0.80 | % |
| | | | | | | | | | | | | | | | | | | | |
Total expenses after fees waived and/or reimbursed and excluding interest expense | | | 0.81 | % | | | 0.80 | % | | | 0.79 | % | | | 0.80 | % | | | 0.79 | % |
| | | | | | | | | | | | | | | | | | | | |
Net investment income | | | 0.91 | % | | | 1.59 | % | | | 1.43 | % | | | 1.28 | % | | | 1.39 | % |
| | | | | | | | | | | | | | | | | | | | |
| | | | | |
Supplemental Data | | | | | | | | | | | | | | | | | | | | |
Net assets, end of year (000) | | $ | 7,907,317 | | | $ | 8,617,256 | | | $ | 12,963,106 | | | $ | 16,164,754 | | | $ | 16,122,793 | |
| | | | | | | | | | | | | | | | | | | | |
Portfolio turnover rate | | | 193 | % | | | 156 | % | | | 154 | % | | | 110 | % | | | 131 | % |
| | | | | | | | | | | | | | | | | | | | |
| (a) | Based on average shares outstanding. |
| (b) | Distributions for annual periods determined in accordance with U.S. federal income tax regulations. |
| (c) | Where applicable, assumes the reinvestment of distributions. |
| (d) | Includes payment received from an affiliate, which had no impact on the Fund’s total return. |
| (e) | Excludes expenses incurred indirectly as a result of investments in underlying funds as follows: |
| | | | | | | | | | | | | | | | | | | | |
| | | Year Ended October 31, | |
| | | 2020 | | | 2019 | | | 2018 | | | 2017 | | | 2016 | |
Investments in underlying funds | | | 0.02 | % | | | — | % | | | 0.01 | % | | | 0.01 | % | | | 0.01 | % |
| | | | | | | | | | | | | | | | | | | | |
See notes to consolidated financial statements.
| | |
| 56 | | 2020 BLACKROCK ANNUAL REPORTTO SHAREHOLDERS |
Consolidated Financial Highlights (continued)
(For a share outstanding throughout each period)
| | | | | | | | | | | | | | | | | | | | |
| | | BlackRock Global Allocation Fund, Inc. (continued) | |
| |
| | | Investor A | |
| |
| | | Year Ended October 31, | |
| | | 2020 | | | 2019 | | | 2018 | | | 2017 | | | 2016 | |
| | | | | |
Net asset value, beginning of year | | $ | 19.23 | | | $ | 18.68 | | | $ | 20.26 | | | $ | 18.29 | | | $ | 19.76 | |
| | | | | | | | | | | | | | | | | | | | |
Net investment income(a) | | | 0.12 | | | | 0.24 | | | | 0.23 | | | | 0.19 | | | | 0.20 | |
Net realized and unrealized gain (loss) | | | 1.72 | | | | 1.46 | | | | (0.85 | ) | | | 2.11 | | | | (0.04 | ) |
| | | | | | | | | | | | | | | | | | | | |
Net increase (decrease) from investment operations | | | 1.84 | | | | 1.70 | | | | (0.62 | ) | | | 2.30 | | | | 0.16 | |
| | | | | | | | | | | | | | | | | | | | |
| | | | | |
Distributions(b) | | | | | | | | | | | | | | | | | | | | |
From net investment income | | | (0.09 | ) | | | (0.17 | ) | | | (0.26 | ) | | | (0.18 | ) | | | (0.13 | ) |
From net realized gain | | | (1.23 | ) | | | (0.98 | ) | | | (0.70 | ) | | | (0.15 | ) | | | (1.50 | ) |
| | | | | | | | | | | | | | | | | | | | |
Total distributions | | | (1.32 | ) | | | (1.15 | ) | | | (0.96 | ) | | | (0.33 | ) | | | (1.63 | ) |
| | | | | | | | | | | | | | | | | | | | |
| | | | | |
Net asset value, end of year | | $ | 19.75 | | | $ | 19.23 | | | $ | 18.68 | | | $ | 20.26 | | | $ | 18.29 | |
| | | | | | | | | | | | | | | | | | | | |
| | | | | |
Total Return(c) | | | | | | | | | | | | | | | | | | | | |
Based on net asset value | | | 9.87 | %(d) | | | 9.71 | % | | | (3.24 | )% | | | 12.77 | % | | | 1.08 | % |
| | | | | | | | | | | | | | | | | | | | |
| | | | | |
Ratios to Average Net Assets(e) | | | | | | | | | | | | | | | | | | | | |
Total expenses | | | 1.13 | % | | | 1.13 | % | | | 1.14 | % | | | 1.18 | % | | | 1.15 | % |
| | | | | | | | | | | | | | | | | | | | |
Total expenses after fees waived and/or reimbursed | | | 1.08 | % | | | 1.08 | % | | | 1.07 | % | | | 1.10 | % | | | 1.08 | % |
| | | | | | | | | | | | | | | | | | | | |
Total expenses after fees waived and/or reimbursed and excluding interest expense | | | 1.08 | % | | | 1.08 | % | | | 1.07 | % | | | 1.07 | % | | | 1.07 | % |
| | | | | | | | | | | | | | | | | | | | |
Net investment income | | | 0.63 | % | | | 1.29 | % | | | 1.14 | % | | | 1.00 | % | | | 1.10 | % |
| | | | | | | | | | | | | | | | | | | | |
| | | | | |
Supplemental Data | | | | | | | | | | | | | | | | | | | | |
Net assets, end of year (000) | | $ | 11,184,639 | | | $ | 10,601,653 | | | $ | 10,547,464 | | | $ | 12,809,356 | | | $ | 13,447,603 | |
| | | | | | | | | | | | | | | | | | | | |
Portfolio turnover rate | | | 193 | % | | | 156 | % | | | 154 | % | | | 110 | % | | | 131 | % |
| | | | | | | | | | | | | | | | | | | | |
| (a) | Based on average shares outstanding. |
| (b) | Distributions for annual periods determined in accordance with U.S. federal income tax regulations. |
| (c) | Where applicable, excludes the effects of any sales charges and assumes the reinvestment of distributions. |
| (d) | Includes payment received from an affiliate, which had no impact on the Fund’s total return. |
| (e) | Excludes expenses incurred indirectly as a result of investments in underlying funds as follows: |
| | | | | | | | | | | | | | | | | | | | |
| | | Year Ended October 31, | |
| | | 2020 | | | 2019 | | | 2018 | | | 2017 | | | 2016 | |
Investments in underlying funds | | | 0.02 | % | | | — | % | | | 0.01 | % | | | 0.01 | % | | | 0.01 | % |
| | | | | | | | | | | | | | | | | | | | |
See notes to consolidated financial statements.
| | |
CONSOLIDATED FINANCIAL HIGHLIGHTS | | 57 |
Consolidated Financial Highlights (continued)
(For a share outstanding throughout each period)
| | | | | | | | | | | | | | | | | | | | |
| | | BlackRock Global Allocation Fund, Inc. (continued) | |
| |
| | | Investor C | |
| |
| | | Year Ended October 31, | |
| | | 2020 | | | 2019 | | | 2018 | | | 2017 | | | 2016 | |
| | | | | |
Net asset value, beginning of year | | $ | 17.17 | | | $ | 16.82 | | | $ | 18.33 | | | $ | 16.57 | | | $ | 18.11 | |
| | | | | | | | | | | | | | | | | | | | |
Net investment income (loss)(a) | | | (0.02 | ) | | | 0.09 | | | | 0.07 | | | | 0.04 | | | | 0.06 | |
Net realized and unrealized gain (loss) | | | 1.53 | | | | 1.30 | | | | (0.76 | ) | | | 1.91 | | | | (0.04 | ) |
| | | | | | | | | | | | | | | | | | | | |
Net increase (decrease) from investment operations | | | 1.51 | | | | 1.39 | | | | (0.69 | ) | | | 1.95 | | | | 0.02 | |
| | | | | | | | | | | | | | | | | | | | |
| | | | | |
Distributions(b) | | | | | | | | | | | | | | | | | | | | |
From net investment income | | | (0.02 | ) | | | (0.06 | ) | | | (0.12 | ) | | | (0.04 | ) | | | (0.06 | ) |
From net realized gain | | | (1.23 | ) | | | (0.98 | ) | | | (0.70 | ) | | | (0.15 | ) | | | (1.50 | ) |
| | | | | | | | | | | | | | | | | | | | |
Total distributions | | | (1.25 | ) | | | (1.04 | ) | | | (0.82 | ) | | | (0.19 | ) | | | (1.56 | ) |
| | | | | | | | | | | | | | | | | | | | |
| | | | | |
Net asset value, end of year | | $ | 17.43 | | | $ | 17.17 | | | $ | 16.82 | | | $ | 18.33 | | | $ | 16.57 | |
| | | | | | | | | | | | | | | | | | | | |
| | | | | |
Total Return(c) | | | | | | | | | | | | | | | | | | | | |
Based on net asset value | | | 9.06 | %(d) | | | 8.88 | % | | | (3.95 | )% | | | 11.92 | % | | | 0.36 | % |
| | | | | | | | | | | | | | | | | | | | |
| | | | | |
Ratios to Average Net Assets(e) | | | | | | | | | | | | | | | | | | | | |
Total expenses | | | 1.89 | % | | | 1.88 | % | | | 1.88 | % | | | 1.92 | % | | | 1.89 | % |
| | | | | | | | | | | | | | | | | | | | |
Total expenses after fees waived and/or reimbursed | | | 1.85 | % | | | 1.83 | % | | | 1.81 | % | | | 1.84 | % | | | 1.82 | % |
| | | | | | | | | | | | | | | | | | | | |
Total expenses after fees waived and/or reimbursed and excluding interest expense | | | 1.84 | % | | | 1.82 | % | | | 1.81 | % | | | 1.82 | % | | | 1.82 | % |
| | | | | | | | | | | | | | | | | | | | |
Net investment income (loss) | | | (0.13 | )% | | | 0.56 | % | | | 0.38 | % | | | 0.27 | % | | | 0.37 | % |
| | | | | | | | | | | | | | | | | | | | |
| | | | | |
Supplemental Data | | | | | | | | | | | | | | | | | | | | |
Net assets, end of year (000) | | $ | 1,547,011 | | | $ | 3,143,501 | | | $ | 5,402,163 | | | $ | 7,545,249 | | | $ | 11,029,706 | |
| | | | | | | | | | | | | | | | | | | | |
Portfolio turnover rate | | | 193 | % | | | 156 | % | | | 154 | % | | | 110 | % | | | 131 | % |
| | | | | | | | | | | | | | | | | | | | |
| (a) | Based on average shares outstanding. |
| (b) | Distributions for annual periods determined in accordance with U.S. federal income tax regulations. |
| (c) | Where applicable, excludes the effects of any sales charges and assumes the reinvestment of distributions. |
| (d) | Includes payment received from an affiliate, which had no impact on the Fund’s total return. |
| (e) | Excludes expenses incurred indirectly as a result of investments in underlying funds as follows: |
| | | | | | | | | | | | | | | | | | | | |
| | | Year Ended October 31, | |
| | | 2020 | | | 2019 | | | 2018 | | | 2017 | | | 2016 | |
Investments in underlying funds | | | 0.02 | % | | | — | % | | | 0.01 | % | | | 0.01 | % | | | 0.01 | % |
| | | | | | | | | | | | | | | | | | | | |
See notes to consolidated financial statements.
| | |
| 58 | | 2020 BLACKROCK ANNUAL REPORTTO SHAREHOLDERS |
Consolidated Financial Highlights (continued)
(For a share outstanding throughout each period)
| | | | | | | | | | | | | | | | | | | | |
| | | BlackRock Global Allocation Fund, Inc. (continued) | |
| |
| | | Class K | |
| | |
| | | Year Ended October 31, | | | Period from
06/08/16(a)
to 10/31/16 | |
| | | | | | | | |
| | | 2020 | | | 2019 | | | 2018 | | | 2017 | |
| | | | | | |
Net asset value, beginning of period | | $ | 19.36 | | | $ | 18.80 | | | $ | 20.39 | | | $ | 18.44 | | | $ | 18.23 | |
| | | | | | | | | | | | | | | | | | | | |
Net investment income(b) | | | 0.19 | | | | 0.31 | | | | 0.30 | | | | 0.27 | | | | 0.08 | |
Net realized and unrealized gain (loss) | | | 1.73 | | | | 1.46 | | | | (0.85 | ) | | | 2.12 | | | | 0.13 | |
| | | | | | | | | | | | | | | | | | | | |
Net increase (decrease) from investment operations | | | 1.92 | | | | 1.77 | | | | (0.55 | ) | | | 2.39 | | | | 0.21 | |
| | | | | | | | | | | | | | | | | | | | |
| | | | | |
Distributions(c) | | | | | | | | | | | | | | | | | | | | |
From net investment income | | | (0.12 | ) | | | (0.23 | ) | | | (0.34 | ) | | | (0.29 | ) | | | — | |
From net realized gain | | | (1.23 | ) | | | (0.98 | ) | | | (0.70 | ) | | | (0.15 | ) | | | — | |
| | | | | | | | | | | | | | | | | | | | |
Total distributions | | | (1.35 | ) | | | (1.21 | ) | | | (1.04 | ) | | | (0.44 | ) | | | — | |
| | | | | | | | | | | | | | | | | | | | |
| | | | | |
Net asset value, end of period | | $ | 19.93 | | | $ | 19.36 | | | $ | 18.80 | | | $ | 20.39 | | | $ | 18.44 | |
| | | | | | | | | | | | | | | | | | | | |
| | | | | |
Total Return(d) | | | | | | | | | | | | | | | | | | | | |
Based on net asset value | | | 10.28 | %(e) | | | 10.10 | % | | | (2.91 | )% | | | 13.20 | % | | | 1.15 | %(f) |
| | | | | | | | | | | | | | | | | | | | |
| | | | | |
Ratios to Average Net Assets(g) | | | | | | | | | | | | | | | | | | | | |
Total expenses | | | 0.78 | % | | | 0.78 | % | | | 0.80 | % | | | 0.82 | % | | | 0.79 | %(h) |
| | | | | | | | | | | | | | | | | | | | |
Total expenses after fees waived and/or reimbursed | | | 0.74 | % | | | 0.73 | % | | | 0.73 | % | | | 0.74 | % | | | 0.71 | %(h) |
| | | | | | | | | | | | | | | | | | | | |
Total expenses after fees waived and/or reimbursed and excluding interest expense | | | 0.73 | % | | | 0.72 | % | | | 0.72 | % | | | 0.72 | % | | | 0.71 | %(h) |
| | | | | | | | | | | | | | | | | | | | |
Net investment income | | | 0.98 | % | | | 1.67 | % | | | 1.53 | % | | | 1.39 | % | | | 1.06 | %(h) |
| | | | | | | | | | | | | | | | | | | | |
| | | | | |
Supplemental Data | | | | | | | | | | | | | | | | | | | | |
Net assets, end of period (000) | | $ | 1,329,363 | | | $ | 1,146,295 | | | $ | 1,326,617 | | | $ | 1,341,925 | | | $ | 604,611 | |
| | | | | | | | | | | | | | | | | | | | |
Portfolio turnover rate | | | 193 | % | | | 156 | % | | | 154 | % | | | 110 | % | | | 131 | %(i) |
| | | | | | | | | | | | | | | | | | | | |
| (a) | Commencement of operations. |
| (b) | Based on average shares outstanding. |
| (c) | Distributions for annual periods determined in accordance with U.S. federal income tax regulations. |
| (d) | Where applicable, assumes the reinvestment of distributions. |
| (e) | Includes payment received from an affiliate, which had no impact on the Fund’s total return. |
| (f) | Aggregate total return. |
| (g) | Excludes expenses incurred indirectly as a result of investments in underlying funds as follows: |
| | | | | | | | | | | | | | | | | | | | |
| | | |
| | | Year Ended October 31, | | | Period from
06/08/16(a) | |
| | | 2020 | | | 2019 | | | 2018 | | | 2017 | | | to 10/31/16 | |
Investments in underlying funds | | | 0.02 | % | | | — | % | | | 0.01 | % | | | 0.01 | % | | | 0.01 | % |
| | | | | | | | | | | | | | | | | | | | |
|
(h) Annualized. |
(i) Portfolio turnover rate is representative of the Fund for the entire year. |
|
| See notes to consolidated financial statements. |
|
| | |
CONSOLIDATED FINANCIAL HIGHLIGHTS | | 59 |
Consolidated Financial Highlights (continued)
(For a share outstanding throughout each period)
| | | | | | | | | | | | | | | | | | | | |
| | | BlackRock Global Allocation Fund, Inc. (continued) | |
| | | Class R | |
| | | Year Ended October 31, | |
| | | 2020 | | | 2019 | | | 2018 | | | 2017 | | | 2016 | |
Net asset value, beginning of year | | $ | 18.24 | | | $ | 17.77 | | | $ | 19.32 | | | $ | 17.46 | | | $ | 18.96 | |
| | | | | | | | | | | | | | | | | | | | |
Net investment income(a) | | | 0.06 | | | | 0.17 | | | | 0.15 | | | | 0.13 | | | | 0.14 | |
Net realized and unrealized gain (loss) | | | 1.63 | | | | 1.38 | | | | (0.80 | ) | | | 2.01 | | | | (0.04 | ) |
| | | | | | | | | | | | | | | | | | | | |
Net increase (decrease) from investment operations | | | 1.69 | | | | 1.55 | | | | (0.65 | ) | | | 2.14 | | | | 0.10 | |
| | | | | | | | | | | | | | | | | | | | |
| | | | | |
Distributions(b) | | | | | | | | | | | | | | | | | | | | |
From net investment income | | | (0.06 | ) | | | (0.10 | ) | | | (0.20 | ) | | | (0.13 | ) | | | (0.10 | ) |
From net realized gain | | | (1.23 | ) | | | (0.98 | ) | | | (0.70 | ) | | | (0.15 | ) | | | (1.50 | ) |
| | | | | | | | | | | | | | | | | | | | |
Total distributions | | | (1.29 | ) | | | (1.08 | ) | | | (0.90 | ) | | | (0.28 | ) | | | (1.60 | ) |
| | | | | | | | | | | | | | | | | | | | |
| | | | | |
Net asset value, end of year | | $ | 18.64 | | | $ | 18.24 | | | $ | 17.77 | | | $ | 19.32 | | | $ | 17.46 | |
| | | | | | | | | | | | | | | | | | | | |
| | | | | |
Total Return(c) | | | | | | | | | | | | | | | | | | | | |
Based on net asset value | | | 9.54 | %(d) | | | 9.35 | % | | | (3.56 | )% | | | 12.42 | % | | | 0.79 | % |
| | | | | | | | | | | | | | | | | | | | |
| | | | | |
Ratios to Average Net Assets(e) | | | | | | | | | | | | | | | | | | | | |
Total expenses | | | 1.47 | % | | | 1.46 | % | | | 1.47 | % | | | 1.50 | % | | | 1.47 | % |
| | | | | | | | | | | | | | | | | | | | |
Total expenses after fees waived and/or reimbursed, as applicable | | | 1.42 | % | | | 1.41 | % | | | 1.40 | % | | | 1.42 | % | | | 1.39 | % |
| | | | | | | | | | | | | | | | | | | | |
Total expenses after fees waived and/or reimbursed and excluding interest expense | | | 1.41 | % | | | 1.40 | % | | | 1.39 | % | | | 1.40 | % | | | 1.39 | % |
| | | | | | | | | | | | | | | | | | | | |
Net investment income | | | 0.31 | % | | | 0.98 | % | | | 0.81 | % | | | 0.68 | % | | | 0.79 | % |
| | | | | | | | | | | | | | | | | | | | |
| | | | | |
Supplemental Data | | | | | | | | | | | | | | | | | | | | |
Net assets, end of year (000) | | $ | 405,400 | | | $ | 603,073 | | | $ | 785,653 | | | $ | 1,060,273 | | | $ | 1,131,647 | |
| | | | | | | | | | | | | | | | | | | | |
Portfolio turnover rate | | | 193 | % | | | 156 | % | | | 154 | % | | | 110 | % | | | 131 | % |
| | | | | | | | | | | | | | | | | | | | |
| (a) | Based on average shares outstanding. |
| (b) | Distributions for annual periods determined in accordance with U.S. federal income tax regulations. |
| (c) | Where applicable, assumes the reinvestment of distributions. |
| (d) | Includes payment received from an affiliate, which had no impact on the Fund’s total return. |
| (e) | Excludes expenses incurred indirectly as a result of investments in underlying funds as follows: |
| | | | | | | | | | | | | | | | | | | | |
| | | Year Ended October 31, | |
| | | 2020 | | | 2019 | | | 2018 | | | 2017 | | | 2016 | |
Investments in underlying funds | | | 0.02 | % | | | — | % | | | 0.01 | % | | | 0.01 | % | | | 0.01 | % |
| | | | | | | | | | | | | | | | | | | | |
See notes to consolidated financial statements.
| | |
| 60 | | 2020 BLACKROCK ANNUAL REPORTTO SHAREHOLDERS |
Notes to Consolidated Financial Statements
BlackRock Global Allocation Fund, Inc. (the “Fund”) is registered under the Investment Company Act of 1940, as amended (the “1940 Act”), as an open-end management investment company. The Fund is organized as a Maryland corporation. The Fund is classified as diversified.
The Fund offers multiple classes of shares. All classes of shares have identical voting, dividend, liquidation and other rights and are subject to the same terms and conditions, except that certain classes bear expenses related to the shareholder servicing and distribution of such shares. Institutional and Class K Shares are sold only to certain eligible investors. Investor A, Investor C and Class R Shares bear certain expenses related to shareholder servicing of such shares, and Investor C and Class R Shares also bear certain expenses related to the distribution of such shares. Class R Shares are sold only to certain employer-sponsored retirement plans. Investor A and Investor C Shares are generally available through financial intermediaries. Each class has exclusive voting rights with respect to matters relating to its shareholder servicing and distribution expenditures (except that Investor C shareholders may vote on material changes to the Investor A Shares distribution and service plan).
| | | | | | | | | | |
| Share Class | | Initial Sales Charge | | CDSC | | | Conversion Privilege | |
Institutional, Class K and Class R Shares | | No | | | No | | | | None | |
Investor A Shares | | Yes | | | No | (a) | | | None | |
Investor C Shares | | No | | | Yes | (b) | | | To Investor A Shares��after approximately 10 years | (c) |
| | (a) | Investor A Shares may be subject to a contingent deferred sales charge (“CDSC”) for certain redemptions where no initial sales charge was paid at the time of purchase. | |
| | (b) | A CDSC of 1.00% is assessed on certain redemptions of Investor C Shares made within one year after purchase. | |
| | (c) | Effective November 23, 2020, the automatic conversion feature will be modified to reduce the conversion period from ten years to eight years. | |
The Fund, together with certain other registered investment companies advised by BlackRock Advisors, LLC (the “Manager”) or its affiliates, is included in a complex of equity, multi-asset, index and money market funds referred to as the BlackRock Multi-Asset Complex.
Basis of Consolidation: The accompanying consolidated financial statements of the Fund include the account of BlackRock Cayman Global Allocation Fund I, Ltd. (the “Subsidiary”), which is a wholly-owned subsidiary of the Fund and primarily invests in commodity-related instruments and other derivatives. The Subsidiary enables the Fund to hold these commodity-related instruments and satisfy regulated investment company tax requirements. The Fund may invest up to 25% of its total assets in the Subsidiary. The net assets of the Subsidiary as of period end were $506,608,658, which is 2.3% of the Fund’s consolidated net assets. Intercompany accounts and transactions, if any, have been eliminated. The Subsidiary is subject to the same investment policies and restrictions that apply to the Fund, except that the Subsidiary may invest without limitation in commodity-related instruments.
| 2. | SIGNIFICANT ACCOUNTING POLICIES |
The consolidated financial statements are prepared in conformity with accounting principles generally accepted in the United States of America (“U.S. GAAP”), which may require management to make estimates and assumptions that affect the reported amounts of assets and liabilities in the consolidated financial statements, disclosure of contingent assets and liabilities at the date of the consolidated financial statements and the reported amounts of increases and decreases in net assets from operations during the reporting period. Actual results could differ from those estimates. The Fund is considered an investment company under U.S. GAAP and follows the accounting and reporting guidance applicable to investment companies. Below is a summary of significant accounting policies:
Investment Transactions and Income Recognition: For financial reporting purposes, investment transactions are recorded on the dates the transactions are executed. Realized gains and losses on investment transactions are determined using the specific identification method. Dividend income and capital gain distributions, if any, are recorded on the ex-dividend date. Non-cash dividends, if any, are recorded on the ex-dividend date at fair value. Dividends from foreign securities where the ex-dividend date may have passed are subsequently recorded when the Fund is informed of the ex-dividend date. Under the applicable foreign tax laws, a withholding tax at various rates may be imposed on capital gains, dividends and interest. Interest income, including amortization and accretion of premiums and discounts on debt securities, is recognized daily on an accrual basis. Income, expenses and realized and unrealized gains and losses are allocated daily to each class based on its relative net assets. For convertible securities, premiums attributable to the debt instrument are amortized, but premiums attributable to the conversion feature are not amortized.
Foreign Currency Translation: The Fund’s books and records are maintained in U.S. dollars. Securities and other assets and liabilities denominated in foreign currencies are translated into U.S. dollars using exchange rates determined as of the close of trading on the New York Stock Exchange (“NYSE”). Purchases and sales of investments are recorded at the rates of exchange prevailing on the respective dates of such transactions. Generally, when the U.S. dollar rises in value against a foreign currency, the investments denominated in that currency will lose value; the opposite effect occurs if the U.S. dollar falls in relative value.
The Fund does not isolate the effect of fluctuations in foreign exchange rates from the effect of fluctuations in the market prices of investments for financial reporting purposes. Accordingly, the effects of changes in exchange rates on investments are not segregated in the Consolidated Statement of Operations from the effects of changes in market prices of those investments, but are included as a component of net realized and unrealized gain (loss) from investments. The Fund reports realized currency gains (losses) on foreign currency related transactions as components of net realized gain (loss) for financial reporting purposes, whereas such components are generally treated as ordinary income for U.S. federal income tax purposes.
Foreign Taxes: The Fund may be subject to foreign taxes (a portion of which may be reclaimable) on income, stock dividends, capital gains on investments, or certain foreign currency transactions. All foreign taxes are recorded in accordance with the applicable foreign tax regulations and rates that exist in the foreign jurisdictions in which the Fund invests. These foreign taxes, if any, are paid by the Fund and are reflected in its Consolidated Statement of Operations as follows: foreign taxes withheld at source are presented as a reduction of income, foreign taxes on securities lending income are presented as a reduction of securities lending income, foreign taxes on stock dividends are presented as “Foreign taxes withheld”, and foreign taxes on capital gains from sales of investments and foreign taxes on foreign currency transactions are included in their respective net realized gain (loss) categories. Foreign taxes payable or deferred as of October 31, 2020, if any, are disclosed in the Consolidated Statement of Assets and Liabilities.
| | |
NOTESTO CONSOLIDATED FINANCIAL STATEMENTS | | 61 |
Notes to Consolidated Financial Statements (continued)
Segregation and Collateralization: In cases where the Fund enters into certain investments (e.g., dollar rolls, futures contracts, forward foreign currency exchange contracts, options written, swaps and short sales) that would be treated as “senior securities” for 1940 Act purposes, the Fund may segregate or designate on its books and records cash or liquid assets having a market value at least equal to the amount of its future obligations under such investments. Doing so allows the investment to be excluded from treatment as a “senior security.” Furthermore, if required by an exchange or counterparty agreement, the Fund may be required to deliver/deposit cash and/or securities to/with an exchange, or broker-dealer or custodian as collateral for certain investments or obligations.
Distributions: Distributions paid by the Fund are recorded on the ex-dividend date. Distributions of capital gains are recorded on the ex-dividend date and made at least annually. The character and timing of distributions are determined in accordance with U.S. federal income tax regulations, which may differ from U.S. GAAP. Net income and realized gains from investments held by the Subsidiary are treated as ordinary income for tax purposes. If a net loss is realized by the Subsidiary in any taxable year, the loss will generally not be available to offset the Fund’s ordinary income and/or capital gains for that year.
Recent Accounting Standards: The Fund has adopted Financial Accounting Standards Board Accounting Standards Update 2017-08 to amend the amortization period for certain purchased callable debt securities held at a premium. Under the new standard, the Fund has changed the amortization period for the premium on certain purchased callable debt securities with non-contingent call features to the earliest call date. In accordance with the transition provisions of the standard, the Fund applied the amendments on a modified retrospective basis beginning with the fiscal period ended October 31, 2020. The adjusted cost basis of securities at October 31, 2019 is $21,758,799,568.
This change in accounting policy has been made to comply with the newly issued accounting standard and had no impact on accumulated earnings (loss) or the net asset value of the Fund.
Indemnifications: In the normal course of business, the Fund enters into contracts that contain a variety of representations that provide general indemnification. The Fund’s maximum exposure under these arrangements is unknown because it involves future potential claims against the Fund, which cannot be predicted with any certainty.
Other: Expenses directly related to the Fund or its classes are charged to the Fund or the applicable class. Expenses directly related to the Fund and other shared expenses prorated to the Fund are allocated daily to each class based on its relative net assets or other appropriate methods. Other operating expenses shared by several funds, including other funds managed by the Manager, are prorated among those funds on the basis of relative net assets or other appropriate methods.
The Fund has an arrangement with its custodian whereby credits are earned on uninvested cash balances, which could be used to reduce custody fees and/or overdraft charges. The Fund may incur charges on overdrafts, subject to certain conditions.
| 3. | INVESTMENT VALUATION AND FAIR VALUE MEASUREMENTS |
Investment Valuation Policies: The Fund’s investments are valued at fair value (also referred to as “market value” within the financial statements) each day that the Fund is open for business and, for financial reporting purposes, as of the report date. U.S. GAAP defines fair value as the price the Fund would receive to sell an asset or pay to transfer a liability in an orderly transaction between market participants at the measurement date. The Fund determines the fair values of its financial instruments using various independent dealers or pricing services under policies approved by the Board of Directors of the Fund (the “Board”). If a security’s market price is not readily available or does not otherwise accurately represent the fair value of the security, the security will be valued in accordance with a policy approved by the Board as reflecting fair value. The BlackRock Global Valuation Methodologies Committee (the “Global Valuation Committee”) is the committee formed by management to develop global pricing policies and procedures and to oversee the pricing function for all financial instruments.
Fair Value Inputs and Methodologies: The following methods and inputs are used to establish the fair value of the Fund’s assets and liabilities:
| | • | | Equity investments traded on a recognized securities exchange are valued at that day’s official closing price, as applicable, on the exchange where the stock is primarily traded. Equity investments traded on a recognized exchange for which there were no sales on that day may be valued at the last available bid (long positions) or ask (short positions) price. |
Generally, trading in foreign instruments is substantially completed each day at various times prior to the close of trading on the Fund’s listing exchange. Occasionally, events affecting the values of such instruments may occur between the foreign market close and the close of trading on the Fund’s listing exchange that may not be reflected in the computation of the Fund’s net assets. Each business day, the Fund uses a pricing service to assist with the valuation of certain foreign exchange-traded equity securities and foreign exchange-traded and over-the-counter (“OTC”) options (the “Systematic Fair Value Price”). Using current market factors, the Systematic Fair Value Price is designed to value such foreign securities and foreign options at fair value as of the close of trading on the NYSE, which follows the close of the local markets.
| | • | | Fixed-income investments for which market quotations are readily available are generally valued using the last available bid prices or current market quotations provided by independent dealers or third party pricing services. Floating rate loan interests are valued at the mean of the bid prices from one or more independent brokers or dealers as obtained from a third party pricing service. Pricing services generally value fixed-income securities assuming orderly transactions of an institutional round lot size, but a fund may hold or transact in such securities in smaller, odd lot sizes. Odd lots may trade at lower prices than institutional round lots. The pricing services may use matrix pricing or valuation models that utilize certain inputs and assumptions to derive values, including transaction data (e.g., recent representative bids and offers), market data, credit quality information, perceived market movements, news, and other relevant information. Certain fixed-income securities, including asset-backed and mortgage related securities may be valued based on valuation models that consider the estimated cash flows of each tranche of the entity, establish a benchmark yield and develop an estimated tranche specific spread to the benchmark yield based on the unique attributes of the tranche. The amortized cost method of valuation may be used with respect to debt obligations with sixty days or less remaining to maturity. |
| | • | | Investments in open-end U.S. mutual funds (including money market funds) are valued at that day’s published net asset value (“NAV”). |
| | |
| 62 | | 2020 BLACKROCK ANNUAL REPORTTO SHAREHOLDERS |
Notes to Consolidated Financial Statements (continued)
| | • | | The Fund values its investment in SL Liquidity Series, LLC, Money Market Series (the “Money Market Series”) at fair value, which is ordinarily based upon its pro rata ownership in the underlying fund’s net assets. |
| | • | | Futures contracts are valued based on that day’s last reported settlement price on the exchange where the contract is traded. |
| | • | | Forward foreign currency exchange contracts are valued at the mean between the bid and ask prices and are determined as of the close of trading on the NYSE based on that day’s prevailing forward exchange rate for the underlying currencies. |
| | • | | Exchange-traded equity options for which market quotations are readily available will be valued at the National Best Bid and Offer quotes (“NBBO”). NBBO represents the mean of the bid and ask prices as quoted on the exchange on which such options are traded. In the event that there is no mean price available, the last bid (long positions) or ask (short positions) price will be used. If no bid or ask price is available, the prior day’s price may be used. OTC options and options on swaps (“swaptions”) are valued by an independent pricing service using a mathematical model, which incorporates a number of market data factors, such as the trades and prices of the underlying instruments. |
| | • | | Swap agreements are valued utilizing quotes received daily by independent pricing services or through brokers, which are derived using daily swap curves and models that incorporate a number of market data factors, such as discounted cash flows, trades and values of the underlying reference instruments. |
If events (e.g., a market closure, market volatility, company announcement or a natural disaster) occur that are expected to materially affect the value of such investment, or in the event that the application of these methods of valuation results in a price for an investment that is deemed not to be representative of the market value of such investment, or if a price is not available, the investment will be valued by the Global Valuation Committee, or its delegate, in accordance with a policy approved by the Board as reflecting fair value (“Fair Valued Investments”). The fair valuation approaches that may be used by the Global Valuation Committee will include market approach, income approach and cost approach. Valuation techniques such as discounted cash flow, use of market comparables and matrix pricing are types of valuation approaches and are typically used in determining fair value. When determining the price for Fair Valued Investments, the Global Valuation Committee, or its delegate, seeks to determine the price that the Fund might reasonably expect to receive or pay from the current sale or purchase of that asset or liability in an arm’s-length transaction. Fair value determinations shall be based upon all available factors that the Global Valuation Committee, or its delegate, deems relevant and consistent with the principles of fair value measurement. The pricing of all Fair Valued Investments is subsequently reported to the Board or a committee thereof on a quarterly basis.
For investments in equity or debt issued by privately held companies or funds (“Private Company” or collectively, the “Private Companies”) and other Fair Valued Investments, the fair valuation approaches that are used by the Global Valuation Committee and third party pricing services utilize one or a combination of, but not limited to, the following inputs.
| | |
| | | Standard Inputs Generally Considered By Third Party Pricing Services |
Market approach | | (i) recent market transactions, including subsequent rounds of financing, in the underlying investment or comparable issuers; (ii) recapitalizations and other transactions across the capital structure; and (iii) market multiples of comparable issuers. |
Income approach | | (i) future cash flows discounted to present and adjusted as appropriate for liquidity, credit, and/or market risks; (ii) quoted prices for similar investments or assets in active markets; and (iii) other risk factors, such as interest rates, yield curves, volatilities, prepayment speeds, loss severities, credit risks, recovery rates, liquidation amounts and/or default rates. |
Cost approach | | (i) audited or unaudited financial statements, investor communications and financial or operational metrics issued by the Private Company; (ii) changes in the valuation of relevant indices or publicly traded companies comparable to the Private Company; (iii) relevant news and other public sources; and (iv) known secondary market transactions in the Private Company’s interests and merger or acquisition activity in companies comparable to the Private Company. |
Investments in series of preferred stock issued by Private Companies are typically valued utilizing market approach in determining the enterprise value of the company. Such investments often contain rights and preferences that differ from other series of preferred and common stock of the same issuer. Valuation techniques such as an option pricing model (“OPM”), a probability weighted expected return model (“PWERM”) or a hybrid of those techniques are used in allocating enterprise value of the company, as deemed appropriate under the circumstances. The use of OPM and PWERM techniques involve a determination of the exit scenarios of the investment in order to appropriately allocate the enterprise value of the company among the various parts of its capital structure.
The Private Companies are not subject to the public company disclosure, timing, and reporting standards applicable to other investments held by the Fund. Typically, the most recently available information by a Private Company is as of a date that is earlier than the date the Fund is calculating its NAV. This factor may result in a difference between the value of the investment and the price the Fund could receive upon the sale of the investment.
Fair Value Hierarchy: Various inputs are used in determining the fair value of financial instruments. These inputs to valuation techniques are categorized into a fair value hierarchy consisting of three broad levels for financial reporting purposes as follows:
| | • | | Level 1 – Unadjusted price quotations in active markets/exchanges for identical assets or liabilities that the Fund has the ability to access |
| | • | | Level 2 – Other observable inputs (including, but not limited to, quoted prices for similar assets or liabilities in markets that are active, quoted prices for identical or similar assets or liabilities in markets that are not active, inputs other than quoted prices that are observable for the assets or liabilities (such as interest rates, yield curves, volatilities, prepayment speeds, loss severities, credit risks and default rates) or other market–corroborated inputs) |
| | |
NOTESTO CONSOLIDATED FINANCIAL STATEMENTS | | 63 |
Notes to Consolidated Financial Statements (continued)
| | • | | Level 3 – Unobservable inputs based on the best information available in the circumstances, to the extent observable inputs are not available (including the Global Valuation Committee’s assumptions used in determining the fair value of financial instruments) |
The hierarchy gives the highest priority to unadjusted quoted prices in active markets for identical assets or liabilities (Level 1 measurements) and the lowest priority to unobservable inputs (Level 3 measurements). Accordingly, the degree of judgment exercised in determining fair value is greatest for instruments categorized in Level 3. The inputs used to measure fair value may fall into different levels of the fair value hierarchy. In such cases, for disclosure purposes, the fair value hierarchy classification is determined based on the lowest level input that is significant to the fair value measurement in its entirety. Investments classified within Level 3 have significant unobservable inputs used by the Global Valuation Committee in determining the price for Fair Valued Investments. Level 3 investments include equity or debt issued by Private Companies that may not have a secondary market and/or may have a limited number of investors. The categorization of a value determined for financial instruments is based on the pricing transparency of the financial instruments and is not necessarily an indication of the risks associated with investing in those securities.
As of October 31, 2020, certain investments of the Fund were valued using NAV (or its equivalent) as no quoted market value is available and therefore have been excluded from the fair value hierarchy.
| 4. | SECURITIES AND OTHER INVESTMENTS |
Asset-Backed and Mortgage-Backed Securities: Asset-backed securities are generally issued as pass-through certificates or as debt instruments. Asset-backed securities issued as pass-through certificates represent undivided fractional ownership interests in an underlying pool of assets. Asset-backed securities issued as debt instruments, which are also known as collateralized obligations, are typically issued as the debt of a special purpose entity organized solely for the purpose of owning such assets and issuing such debt. Asset-backed securities are often backed by a pool of assets representing the obligations of a number of different parties. The yield characteristics of certain asset-backed securities may differ from traditional debt securities. One such major difference is that all or a principal part of the obligations may be prepaid at any time because the underlying assets (i.e., loans) may be prepaid at any time. As a result, a decrease in interest rates in the market may result in increases in the level of prepayments as borrowers, particularly mortgagors, refinance and repay their loans. An increased prepayment rate with respect to an asset-backed security will have the effect of shortening the maturity of the security. In addition, a fund may subsequently have to reinvest the proceeds at lower interest rates. If a fund has purchased such an asset-backed security at a premium, a faster than anticipated prepayment rate could result in a loss of principal to the extent of the premium paid.
For mortgage pass-through securities (the “Mortgage Assets”) there are a number of important differences among the agencies and instrumentalities of the U.S. Government that issue mortgage-related securities and among the securities that they issue. For example, mortgage-related securities guaranteed by Ginnie Mae are guaranteed as to the timely payment of principal and interest by Ginnie Mae and such guarantee is backed by the full faith and credit of the United States. However, mortgage-related securities issued by Freddie Mac and Fannie Mae, including Freddie Mac and Fannie Mae guaranteed mortgage pass-through certificates, which are solely the obligations of Freddie Mac and Fannie Mae, are not backed by or entitled to the full faith and credit of the United States, but are supported by the right of the issuer to borrow from the U.S. Treasury.
Non-agency mortgage-backed securities are securities issued by non-governmental issuers and have no direct or indirect government guarantees of payment and are subject to various risks. Non-agency mortgage loans are obligations of the borrowers thereunder only and are not typically insured or guaranteed by any other person or entity. The ability of a borrower to repay a loan is dependent upon the income or assets of the borrower. A number of factors, including a general economic downturn, acts of God, terrorism, social unrest and civil disturbances, may impair a borrower’s ability to repay its loans.
Inflation-Indexed Bonds: Inflation-indexed bonds (other than municipal inflation-indexed and certain corporate inflation-indexed bonds) are fixed-income securities whose principal value is periodically adjusted according to the rate of inflation. If the index measuring inflation rises or falls, the principal value of inflation-indexed bonds (other than municipal inflation-indexed and certain corporate inflation-indexed bonds) will be adjusted upward or downward, and consequently the interest payable on these securities (calculated with respect to a larger or smaller principal amount) will be increased or reduced, respectively. Any upward or downward adjustment in the principal amount of an inflation-indexed bond will be included as interest income in the Consolidated Statement of Operations, even though investors do not receive their principal until maturity. Repayment of the original bond principal upon maturity (as adjusted for inflation) is guaranteed in the case of U.S. Treasury inflation-indexed bonds. For bonds that do not provide a similar guarantee, the adjusted principal value of the bond repaid at maturity may be less than the original principal. With regard to municipal inflation-indexed bonds and certain corporate inflation-indexed bonds, the inflation adjustment is typically reflected in the semi-annual coupon payment. As a result, the principal value of municipal inflation-indexed bonds and such corporate inflation-indexed bonds does not adjust according to the rate of inflation.
Capital Securities and Trust Preferred Securities: Capital securities, including trust preferred securities, are typically issued by corporations, generally in the form of interest-bearing notes with preferred securities characteristics. In the case of trust preferred securities, an affiliated business trust of a corporation issues these securities, generally in the form of beneficial interests in subordinated debentures or similarly structured securities. The securities can be structured with either a fixed or adjustable coupon that can have either a perpetual or stated maturity date. For trust preferred securities, the issuing bank or corporation pays interest to the trust, which is then distributed to holders of these securities as a dividend. Dividends can be deferred without creating an event of default or acceleration, although maturity cannot take place unless all cumulative payment obligations have been met. The deferral of payments does not affect the purchase or sale of these securities in the open market. These securities generally are rated below that of the issuing company’s senior debt securities and are freely callable at the issuer’s option.
Preferred Stocks: Preferred stock has a preference over common stock in liquidation (and generally in receiving dividends as well), but is subordinated to the liabilities of the issuer in all respects. As a general rule, the market value of preferred stock with a fixed dividend rate and no conversion element varies inversely with interest rates and perceived credit risk, while the market price of convertible preferred stock generally also reflects some element of conversion value. Because preferred stock is junior to debt securities and other obligations of the issuer, deterioration in the credit quality of the issuer will cause greater changes in the value of a preferred stock than in a more senior debt security with similar stated yield characteristics. Unlike interest payments on debt securities, preferred stock dividends are payable only if declared by the issuer’s board of directors. Preferred stock also may be subject to optional or mandatory redemption provisions.
Warrants: Warrants entitle a fund to purchase a specified number of shares of common stock and are non-income producing. The purchase price and number of shares are subject to adjustment under certain conditions until the expiration date of the warrants, if any. If the price of the underlying stock does not rise above the strike price before the
| | |
| 64 | | 2020 BLACKROCK ANNUAL REPORTTO SHAREHOLDERS |
Notes to Consolidated Financial Statements (continued)
warrant expires, the warrant generally expires without any value and a fund will lose any amount it paid for the warrant. Thus, investments in warrants may involve more risk than investments in common stock. Warrants may trade in the same markets as their underlying stock; however, the price of the warrant does not necessarily move with the price of the underlying stock.
Floating Rate Loan Interests: Floating rate loan interests are typically issued to companies (the “borrower”) by banks, other financial institutions, or privately and publicly offered corporations (the “lender”). Floating rate loan interests are generally non-investment grade, often involve borrowers whose financial condition is troubled or uncertain and companies that are highly leveraged or in bankruptcy proceedings. In addition, transactions in floating rate loan interests may settle on a delayed basis, which may result in proceeds from the sale not being readily available for a fund to make additional investments or meet its redemption obligations. Floating rate loan interests may include fully funded term loans or revolving lines of credit. Floating rate loan interests are typically senior in the corporate capital structure of the borrower. Floating rate loan interests generally pay interest at rates that are periodically determined by reference to a base lending rate plus a premium. Since the rates reset only periodically, changes in prevailing interest rates (and particularly sudden and significant changes) can be expected to cause some fluctuations in the NAV of a fund to the extent that it invests in floating rate loan interests. The base lending rates are generally the lending rate offered by one or more European banks, such as the London Interbank Offered Rate (“LIBOR”), the prime rate offered by one or more U.S. banks or the certificate of deposit rate. Floating rate loan interests may involve foreign borrowers, and investments may be denominated in foreign currencies. These investments are treated as investments in debt securities for purposes of a fund’s investment policies.
When a fund purchases a floating rate loan interest, it may receive a facility fee and when it sells a floating rate loan interest, it may pay a facility fee. On an ongoing basis, a fund may receive a commitment fee based on the undrawn portion of the underlying line of credit amount of a floating rate loan interest. Facility and commitment fees are typically amortized to income over the term of the loan or term of the commitment, respectively. Consent and amendment fees are recorded to income as earned. Prepayment penalty fees, which may be received by a fund upon the prepayment of a floating rate loan interest by a borrower, are recorded as realized gains. A fund may invest in multiple series or tranches of a loan. A different series or tranche may have varying terms and carry different associated risks.
Floating rate loan interests are usually freely callable at the borrower’s option. A fund may invest in such loans in the form of participations in loans (“Participations”) or assignments (“Assignments”) of all or a portion of loans from third parties. Participations typically will result in a fund having a contractual relationship only with the lender, not with the borrower. A fund has the right to receive payments of principal, interest and any fees to which it is entitled only from the lender selling the Participation and only upon receipt by the lender of the payments from the borrower. In connection with purchasing Participations, a fund generally will have no right to enforce compliance by the borrower with the terms of the loan agreement, nor any rights of offset against the borrower. A fund may not benefit directly from any collateral supporting the loan in which it has purchased the Participation. As a result, a fund assumes the credit risk of both the borrower and the lender that is selling the Participation. A fund’s investment in loan participation interests involves the risk of insolvency of the financial intermediaries who are parties to the transactions. In the event of the insolvency of the lender selling the Participation, a fund may be treated as a general creditor of the lender and may not benefit from any offset between the lender and the borrower. Assignments typically result in a fund having a direct contractual relationship with the borrower, and a fund may enforce compliance by the borrower with the terms of the loan agreement.
In connection with floating rate loan interests, the Fund may also enter into unfunded floating rate loan interests (“commitments”). In connection with these commitments, the Fund earns a commitment fee, typically set as a percentage of the commitment amount. Such fee income, which is included in interest income in the Consolidated Statement of Operations, is recognized ratably over the commitment period. Unfunded floating rate loan interests are marked-to-market daily, and any unrealized appreciation (depreciation) is included in the Consolidated Statement of Assets and Liabilities and Consolidated Statement of Operations. As of period end, the Fund had the following unfunded floating rate loan interests:
| | | | | | | | | | |
| Fund Name | | Borrower | | Par | | Commitment
Amount | | Value | | Unrealized
Appreciation
(Depreciation) |
BlackRock Global Allocation Fund, Inc. | | Opendoor GP II LLC | | $15,910,000 | | $15,910,000 | | $15,910,000 | | $ 0 |
Forward Commitments, When-Issued and Delayed Delivery Securities: The Fund may purchase securities on a when-issued basis and may purchase or sell securities on a forward commitment basis. Settlement of such transactions normally occurs within a month or more after the purchase or sale commitment is made. The Fund may purchase securities under such conditions with the intention of actually acquiring them, but may enter into a separate agreement to sell the securities before the settlement date. Since the value of securities purchased may fluctuate prior to settlement, the Fund may be required to pay more at settlement than the security is worth. In addition, the Fund is not entitled to any of the interest earned prior to settlement. When purchasing a security on a delayed delivery basis, the Fund assumes the rights and risks of ownership of the security, including the risk of price and yield fluctuations. In the event of default by the counterparty, the Fund’s maximum amount of loss is the unrealized appreciation of unsettled when-issued transactions.
Short Sale Transactions: In short sale transactions, a fund sells a security it does not hold in anticipation of a decline in the market price of that security. When a fund makes a short sale, it will borrow the security sold short from a broker/counterparty and deliver the security to the purchaser. To close out a short position, a fund delivers the same security to the broker and records a liability to reflect the obligation to return the security to the broker. The amount of the liability is subsequently marked-to-market to reflect the market value of the short sale. A fund maintains a segregated account of securities or deposits cash with the broker-dealer as collateral for the short sales. Cash deposited with the broker is recorded as an asset in the Consolidated Statement of Assets and Liabilities. Securities segregated as collateral are denoted in the Consolidated Schedule of Investments. A fund may pay a financing fee for the difference between the market value of the short position and the cash collateral deposited with the broker which would be recorded as interest expense. A fund is required to repay the counterparty any dividends received on the security sold short, which, if applicable, is shown as dividend expense in the Consolidated Statement of Operations. A fund may pay a fee on the assets borrowed from the counterparty, which, if applicable, is shown as broker fees and expenses on short sales in the Consolidated Statement of Operations. A fund is exposed to market risk based on the amount, if any, that the market value of the security increases beyond the market value at which the position was sold. Thus, a short sale of a security involves the risk that instead of declining, the price of the security sold short will rise. The short sale of securities involves the possibility of an unlimited loss since there is an unlimited potential for the market price of the security sold short to increase. A gain, limited to the price at which a fund sold the security short. A realized gain or loss is recognized upon the termination of a short sale if the market price is either less than or greater than the proceeds originally received. There is no assurance that a fund will be able to close out a short position at a particular time or at an acceptable price.
| | |
NOTESTO CONSOLIDATED FINANCIAL STATEMENTS | | 65 |
Notes to Consolidated Financial Statements (continued)
Securities Lending: The Fund may lend its securities to approved borrowers, such as brokers, dealers and other financial institutions. The borrower pledges and maintains with the Fund collateral consisting of cash, an irrevocable letter of credit issued by a bank, or securities issued or guaranteed by the U.S. Government. The initial collateral received by the Fund is required to have a value of at least 102% of the current value of the loaned securities for securities traded on U.S. exchanges and a value of at least 105% for all other securities. The collateral is maintained thereafter at a value equal to at least 100% of the current market value of the securities on loan. The market value of the loaned securities is determined at the close of each business day of the Fund and any additional required collateral is delivered to the Fund, or excess collateral returned by the Fund, on the next business day. During the term of the loan, the Fund is entitled to all distributions made on or in respect of the loaned securities, but does not receive interest income on securities received as collateral. Loans of securities are terminable at any time and the borrower, after notice, is required to return borrowed securities within the standard time period for settlement of securities transactions.
The market value of any securities on loan, all of which were classified as common stocks in the Fund’s Consolidated Schedule of Investments, and the value of any related collateral are shown separately in the Consolidated Statement of Assets and Liabilities as a component of investments at value - unaffiliated, and collateral on securities loaned at value, respectively. As of period end, any securities on loan were collateralized by cash and/or U.S. Government obligations. Cash collateral invested by the securities lending agent, BlackRock Investment Management, LLC (“BIM”), if any, is disclosed in the Consolidated Schedule of Investments.
Securities lending transactions are entered into by the Fund under Master Securities Lending Agreements (each, an “MSLA”), which provide the right, in the event of default (including bankruptcy or insolvency), for the non-defaulting party to liquidate the collateral and calculate a net exposure to the defaulting party or request additional collateral. In the event that a borrower defaults, the Fund, as lender, would offset the market value of the collateral received against the market value of the securities loaned. When the value of the collateral is greater than that of the market value of the securities loaned, the lender is left with a net amount payable to the defaulting party. However, bankruptcy or insolvency laws of a particular jurisdiction may impose restrictions on or prohibitions against such a right of offset in the event of an MSLA counterparty’s bankruptcy or insolvency. Under the MSLA, absent an event of default, the borrower can resell or re-pledge the loaned securities, and the Fund can reinvest cash collateral received in connection with loaned securities. Upon an event of default, the parties’ obligations to return the securities or collateral to the other party are extinguished, and the parties can resell or re-pledge the loaned securities or the collateral received in connection with the loaned securities in order to satisfy the defaulting party’s net payment obligation for all transactions under the MSLA. The defaulting party remains liable for any deficiency.
As of period end, the following table is a summary of the Fund’s securities on loan by counterparty which are subject to offset under an MSLA:
| | | | | | | | | | | | |
Counterparty | |
| Securities
Loaned at Value |
| |
| Cash Collateral
Received |
(a) | |
| Net
Amount |
(b) |
Barclays Capital, Inc. | | $ | 6,180,318 | | | $ | (6,180,318 | ) | | $ | — | |
BofA Securities, Inc. | | | 60,756,260 | | | | (60,756,260 | ) | | | — | |
Citigroup Global Markets, Inc. | | | 55,485,784 | | | | (55,485,784 | ) | | | — | |
Credit Suisse Securities (USA) LLC | | | 37,657,486 | | | | (37,525,401 | ) | | | 132,085 | |
Goldman Sachs & Co. | | | 8,520,988 | | | | (8,520,988 | ) | | | — | |
J.P. Morgan Securities LLC | | | 21,014,003 | | | | (21,014,003 | ) | | | — | |
Jefferies LLC | | | 10,359,180 | | | | (10,359,180 | ) | | | — | |
National Financial Services LLC | | | 3,323,061 | | | | (3,323,061 | ) | | | — | |
State Street Bank & Trust Company | | | 813,222 | | | | (813,222 | ) | | | — | |
TD Prime Services LLC | | | 3,461,189 | | | | (3,461,189 | ) | | | — | |
| | | | | | | | | | | | |
| | $ | 207,571,491 | | | $ | (207,439,406 | ) | | $ | 132,085 | |
| | | | | | | | | | | | |
| | (a) | Collateral received in excess of the market value of securities on loan is not presented in this table. The total cash collateral received by the Fund is disclosed in the Fund’s Consolidated Statement of Assets and Liabilities. | |
| | (b) | The market value of the loaned securities is determined as of October 31, 2020. Additional collateral is delivered to the Fund on the next business day in accordance with the MSLA. The net amount would be subject to the borrower default indemnity in the event of default by the counterparty. | |
The risks of securities lending include the risk that the borrower may not provide additional collateral when required or may not return the securities when due. To mitigate these risks, the Fund benefits from a borrower default indemnity provided by BIM. BIM’s indemnity allows for full replacement of the securities loaned to the extent the collateral received does not cover the value on the securities loaned in the event of borrower default. The Fund could incur a loss if the value of an investment purchased with cash collateral falls below the market value of loaned securities or if the value of an investment purchased with cash collateral falls below the value of the original cash collateral received. Such losses are borne entirely by the Fund.
| 5. | DERIVATIVE FINANCIAL INSTRUMENTS |
The Fund engages in various portfolio investment strategies using derivative contracts both to increase the returns of the Fund and/or to manage its exposure to certain risks such as credit risk, equity risk, interest rate risk, foreign currency exchange rate risk, commodity price risk or other risks (e.g., inflation risk). Derivative financial instruments categorized by risk exposure are included in the Consolidated Schedule of Investments. These contracts may be transacted on an exchange or OTC.
Futures Contracts: Futures contracts are purchased or sold to gain exposure to, or manage exposure to, changes in interest rates (interest rate risk) and changes in the value of equity securities (equity risk) or foreign currencies (foreign currency exchange rate risk).
Futures contracts are exchange-traded agreements between the Fund and a counterparty to buy or sell a specific quantity of an underlying instrument at a specified price and on a specified date. Depending on the terms of a contract, it is settled either through physical delivery of the underlying instrument on the settlement date or by payment of a cash amount on the settlement date. Upon entering into a futures contract, the Fund is required to deposit initial margin with the broker in the form of cash or securities in an amount that varies depending on a contract’s size and risk profile. The initial margin deposit must then be maintained at an established level over the life of the contract. Amounts pledged, which are considered restricted, are included in cash pledged for futures contracts in the Consolidated Statement of Assets and Liabilities.
| | |
| 66 | | 2020 BLACKROCK ANNUAL REPORTTO SHAREHOLDERS |
Notes to Consolidated Financial Statements (continued)
Securities deposited as initial margin are designated in the Consolidated Schedule of Investments and cash deposited, if any, are shown as cash pledged for futures contracts in the Consolidated Statement of Assets and Liabilities. Pursuant to the contract, the Fund agrees to receive from or pay to the broker an amount of cash equal to the daily fluctuation in market value of the contract (“variation margin”). Variation margin is recorded as unrealized appreciation (depreciation) and, if any, shown as variation margin receivable (or payable) on futures contracts in the Consolidated Statement of Assets and Liabilities. When the contract is closed, a realized gain or loss is recorded in the Consolidated Statement of Operations equal to the difference between the notional amount of the contract at the time it was opened and the notional amount at the time it was closed. The use of futures contracts involves the risk of an imperfect correlation in the movements in the price of futures contracts and interest, foreign currency exchange rates or underlying assets.
Forward Foreign Currency Exchange Contracts: Forward foreign currency exchange contracts are entered into to gain or reduce exposure to foreign currencies (foreign currency exchange rate risk).
A forward foreign currency exchange contract is an agreement between two parties to buy and sell a currency at a set exchange rate on a specified date. These contracts help to manage the overall exposure to the currencies in which some of the investments held by the Fund are denominated and in some cases, may be used to obtain exposure to a particular market. The contracts are traded OTC and not on an organized exchange.
The contract is marked-to-market daily and the change in market value is recorded as unrealized appreciation (depreciation) in the Consolidated Statement of Assets and Liabilities. When a contract is closed, a realized gain or loss is recorded in the Consolidated Statement of Operations equal to the difference between the value at the time it was opened and the value at the time it was closed. Non-deliverable forward foreign currency exchange contracts are settled with the counterparty in cash without the delivery of foreign currency. The use of forward foreign currency exchange contracts involves the risk that the value of a forward foreign currency exchange contract changes unfavorably due to movements in the value of the referenced foreign currencies, and such value may exceed the amount(s) reflected in the Consolidated Statement of Assets and Liabilities. Cash amounts pledged for forward foreign currency exchange contracts are considered restricted and are included in cash pledged as collateral for OTC derivatives in the Consolidated Statement of Assets and Liabilities. A Fund’s risk of loss from counterparty credit risk on OTC derivatives is generally limited to the aggregate unrealized gain netted against any collateral held by the Fund.
Options: The Fund purchases and writes call and put options to increase or decrease its exposure to the risks of underlying instruments, including equity risk, interest rate risk and/or commodity price risk and/or, in the case of options written, to generate gains from options premiums.
A call option gives the purchaser (holder) of the option the right (but not the obligation) to buy, and obligates the seller (writer) to sell (when the option is exercised) the underlying instrument at the exercise or strike price at any time or at a specified time during the option period. A put option gives the holder the right to sell and obligates the writer to buy the underlying instrument at the exercise or strike price at any time or at a specified time during the option period.
Premiums paid on options purchased and premiums received on options written, as well as the daily fluctuation in market value, are included in investments at value –unaffiliated and options written at value, respectively, in the Consolidated Statement of Assets and Liabilities. When an instrument is purchased or sold through the exercise of an option, the premium is offset against the cost or proceeds of the underlying instrument. When an option expires, a realized gain or loss is recorded in the Consolidated Statement of Operations to the extent of the premiums received or paid. When an option is closed or sold, a gain or loss is recorded in the Consolidated Statement of Operations to the extent the cost of the closing transaction exceeds the premiums received or paid. When the Fund writes a call option, such option is typically “covered,” meaning that it holds the underlying instrument subject to being called by the option counterparty. When the Fund writes a put option, cash is segregated in an amount sufficient to cover the obligation. These amounts, which are considered restricted, are included in cash pledged as collateral for options written in the Consolidated Statement of Assets and Liabilities.
| | • | | Swaptions — The Fund purchases and writes options on swaps (“swaptions”) primarily to preserve a return or spread on a particular investment or portion of the Fund’s holdings, as a duration management technique or to protect against an increase in the price of securities it anticipates purchasing at a later date. The purchaser and writer of a swaption is buying or granting the right to enter into a previously agreed upon interest rate or credit default swap agreement (interest rate risk and/or credit risk) at any time before the expiration of the option. |
| | • | | Foreign currency options — The Fund purchases and writes foreign currency options, foreign currency futures and options on foreign currency futures to gain or reduce exposure to foreign currencies (foreign currency exchange rate risk). Foreign currency options give the purchaser the right to buy from or sell to the writer a foreign currency at any time before the expiration of the option. |
| | • | | Barrier options — The Fund may purchase and write a variety of options with non-standard payout structures or other features (“barrier options”) that are generally traded OTC. |
The Fund may invest in various types of barrier options, including down-and-out options, down-and-in options, double no-touch options, one-touch options, up-and-out options and up-and-in options. Down-and-out options expire worthless to the purchaser if the price of the underlying instrument falls below a specific barrier price level prior to the expiration date. Down-and-in options expire worthless to the purchaser unless the price of the underlying instrument falls below a specific barrier price level prior to the expiration date. Double no-touch options provide the purchaser an agreed-upon payout if the price of the underlying instrument does not reach or surpass predetermined barrier price levels prior to the option’s expiration date. One-touch options provide the purchaser an agreed-upon payout if the price of the underlying instrument reaches or surpasses predetermined barrier price levels prior to the expiration date. Up-and-out options expire worthless to the purchaser if the price of the underlying instrument increases beyond a predetermined barrier price level prior to the expiration date. Up-and-in options can only be exercised when the price of the underlying instrument increases beyond a predetermined barrier price level.
In purchasing and writing options, the Fund bears the risk of an unfavorable change in the value of the underlying instrument or the risk that it may not be able to enter into a closing transaction due to an illiquid market. Exercise of a written option could result in the Fund purchasing or selling a security when it otherwise would not, or at a price different from the current market value.
| | |
NOTESTO CONSOLIDATED FINANCIAL STATEMENTS | | 67 |
Notes to Consolidated Financial Statements (continued)
Swaps: Swap contracts are entered into to manage exposure to issuers, markets and securities. Such contracts are agreements between the Fund and a counterparty to make periodic net payments on a specified notional amount or a net payment upon termination. Swap agreements are privately negotiated in the OTC market and may be entered into as a bilateral contract (“OTC swaps”) or centrally cleared (“centrally cleared swaps”).
For OTC swaps, any upfront premiums paid and any upfront fees received are shown as swap premiums paid and swap premiums received, respectively, in the Consolidated Statement of Assets and Liabilities and amortized over the term of the contract. The daily fluctuation in market value is recorded as unrealized appreciation (depreciation) on OTC Swaps in the Consolidated Statement of Assets and Liabilities. Payments received or paid are recorded in the Consolidated Statement of Operations as realized gains or losses, respectively. When an OTC swap is terminated, a realized gain or loss is recorded in the Consolidated Statement of Operations equal to the difference between the proceeds from (or cost of) the closing transaction and the Fund’s basis in the contract, if any. Generally, the basis of the contract is the premium received or paid.
In a centrally cleared swap, immediately following execution of the swap contract, the swap contract is novated to a central counterparty (the “CCP”) and the CCP becomes the Fund’s counterparty on the swap. The Fund is required to interface with the CCP through the broker. Upon entering into a centrally cleared swap, the Fund is required to deposit initial margin with the broker in the form of cash or securities in an amount that varies depending on the size and risk profile of the particular swap. Securities deposited as initial margin are designated in the Consolidated Schedule of Investments and cash deposited is shown as cash pledged for centrally cleared swaps in the Consolidated Statement of Assets and Liabilities. Amounts pledged, which are considered restricted cash, are included in cash pledged for centrally cleared swaps in the Consolidated Statement of Assets and Liabilities. Pursuant to the contract, the Fund agrees to receive from or pay to the broker an amount of cash equal to the daily fluctuation in market value of the contract (“variation margin”). Variation margin is recorded as unrealized appreciation (depreciation) and shown as variation margin receivable (or payable) on centrally cleared swaps in the Consolidated Statement of Assets and Liabilities. Payments received from (paid to) the counterparty are amortized over the term of the contract and recorded as realized gains (losses) in the Consolidated Statement of Operations, including those at termination.
| | • | | Credit default swaps — Credit default swaps are entered into to manage exposure to the market or certain sectors of the market, to reduce risk exposure to defaults of corporate and/or sovereign issuers or to create exposure to corporate and/or sovereign issuers to which a fund is not otherwise exposed (credit risk). |
The Fund may either buy or sell (write) credit default swaps on single-name issuers (corporate or sovereign), a combination or basket of single-name issuers or traded indexes. Credit default swaps are agreements in which the protection buyer pays fixed periodic payments to the seller in consideration for a promise from the protection seller to make a specific payment should a negative credit event take place with respect to the referenced entity (e.g., bankruptcy, failure to pay, obligation acceleration, repudiation, moratorium or restructuring). As a buyer, if an underlying credit event occurs, the Fund will either (i) receive from the seller an amount equal to the notional amount of the swap and deliver the referenced security or underlying securities comprising the index, or (ii) receive a net settlement of cash equal to the notional amount of the swap less the recovery value of the security or underlying securities comprising the index. As a seller (writer), if an underlying credit event occurs, the Fund will either pay the buyer an amount equal to the notional amount of the swap and take delivery of the referenced security or underlying securities comprising the index or pay a net settlement of cash equal to the notional amount of the swap less the recovery value of the security or underlying securities comprising the index.
| | • | | Total return swaps — Total return swaps are entered into to obtain exposure to a security or market without owning such security or investing directly in such market or to exchange the risk/return of one security or market (e.g., fixed-income) with another security or market (e.g., equity or commodity prices) (equity risk, commodity price risk and/or interest rate risk). |
Total return swaps are agreements in which there is an exchange of cash flows whereby one party commits to make payments based on the total return (distributions plus capital gains/losses) of an underlying instrument, or basket of underlying instruments, in exchange for fixed or floating rate interest payments. If the total return of the instrument(s) or index underlying the transaction exceeds or falls short of the offsetting fixed or floating interest rate obligation, the Fund receives payment from or makes a payment to the counterparty.
Certain total return swaps are designed to function as a portfolio of direct investments in long and short equity positions. This means that the Fund has the ability to trade in and out of these long and short positions within the swap and will receive the economic benefits and risks equivalent to direct investment in these positions, subject to certain adjustments due to events related to the counterparty. Benefits and risks include capital appreciation (depreciation), corporate actions and dividends received and paid, all of which are reflected in the swap’s market value. The market value also includes interest charges and credits (“financing fees”) related to the notional values of the long and short positions and cash balances within the swap. These interest charges and credits are based on a specified benchmark rate plus or minus a specified spread determined based upon the country and/or currency of the positions in the portfolio.
Positions within the swap and financing fees are reset periodically. During a reset, any unrealized appreciation (depreciation) on positions and accrued financing fees become available for cash settlement between the Fund and the counterparty. The amounts that are available for cash settlement are recorded as realized gains or losses in the Consolidated Statement of Operations. Cash settlement in and out of the swap may occur at a reset date or any other date, at the discretion of the Fund and the counterparty, over the life of the agreement. Certain swaps have no stated expiration and can be terminated by either party at any time.
| | • | | Interest rate swaps — Interest rate swaps are entered into to gain or reduce exposure to interest rates or to manage duration, the yield curve or interest rate (interest rate risk). |
Interest rate swaps are agreements in which one party pays a stream of interest payments, either fixed or floating, in exchange for another party’s stream of interest payments, either fixed or floating, on the same notional amount for a specified period of time. In more complex interest rate swaps, the notional principal amount may decline (or amortize) over time.
| | • | | Currency swaps — Currency swaps are entered into to gain or reduce exposure to foreign currencies (foreign currency exchange rate risk). |
Currency swaps are interest rate swaps in which one party pays a stream of interest payments, either fixed or floating, in exchange for another party’s stream of interest payments, either fixed or floating, based on the notional amounts of two different currencies. The notional amounts are typically determined based on the spot exchange
| | |
| 68 | | 2020 BLACKROCK ANNUAL REPORTTO SHAREHOLDERS |
Notes to Consolidated Financial Statements (continued)
rates at the inception of the trade. Currency swaps may also involve an exchange of notional amounts at the start, during and/or at expiration of the contract, either at the current spot rate or another specified rate.
| | • | | Forward swaps — The Fund enters into forward interest rate swaps and forward total return swaps. In a forward swap, the Fund and the counterparty agree to make periodic net payments beginning on a specified date or a net payment at termination. |
Swap transactions involve, to varying degrees, elements of interest rate, credit and market risk in excess of the amounts recognized in the Consolidated Statement of Assets and Liabilities. Such risks involve the possibility that there will be no liquid market for these agreements, that the counterparty to the agreements may default on its obligation to perform or disagree as to the meaning of the contractual terms in the agreements, and that there may be unfavorable changes in interest rates and/or market values associated with these transactions.
Master Netting Arrangements: In order to define its contractual rights and to secure rights that will help it mitigate its counterparty risk, a Fund may enter into an International Swaps and Derivatives Association, Inc. Master Agreement (“ISDA Master Agreement”) or similar agreement with its counterparties. An ISDA Master Agreement is a bilateral agreement between a Fund and a counterparty that governs certain OTC derivatives and typically contains, among other things, collateral posting terms and netting provisions in the event of a default and/or termination event. Under an ISDA Master Agreement, a Fund may, under certain circumstances, offset with the counterparty certain derivative financial instruments’ payables and/or receivables with collateral held and/or posted and create one single net payment. The provisions of the ISDA Master Agreement typically permit a single net payment in the event of default including the bankruptcy or insolvency of the counterparty. However, bankruptcy or insolvency laws of a particular jurisdiction may impose restrictions on or prohibitions against the right of offset in bankruptcy, insolvency or other events.
Collateral Requirements: For derivatives traded under an ISDA Master Agreement, the collateral requirements are typically calculated by netting the mark-to-market amount for each transaction under such agreement and comparing that amount to the value of any collateral currently pledged by the Fund and the counterparty.
Cash collateral that has been pledged to cover obligations of the Fund and cash collateral received from the counterparty, if any, is reported separately in the Consolidated Statement of Assets and Liabilities as cash pledged as collateral and cash received as collateral, respectively. Non-cash collateral pledged by the Fund, if any, is noted in the Consolidated Schedule of Investments. Generally, the amount of collateral due from or to a counterparty is subject to a certain minimum transfer amount threshold before a transfer is required, which is determined at the close of business of the Fund. Any additional required collateral is delivered to/pledged by the Fund on the next business day. Typically, the counterparty is not permitted to sell, re-pledge or use cash and non-cash collateral it receives. The Fund generally agrees not to use non-cash collateral that it receives but may, absent default or certain other circumstances defined in the underlying ISDA Master Agreement, be permitted to use cash collateral received. In such cases, interest may be paid pursuant to the collateral arrangement with the counterparty. To the extent amounts due to the Fund from the counterparties are not fully collateralized, the Fund bears the risk of loss from counterparty non-performance. Likewise, to the extent the Fund has delivered collateral to a counterparty and stands ready to perform under the terms of its agreement with such counterparty, the Fund bears the risk of loss from a counterparty in the amount of the value of the collateral in the event the counterparty fails to return such collateral. Based on the terms of agreements, collateral may not be required for all derivative contracts.
For financial reporting purposes, the Fund does not offset derivative assets and derivative liabilities that are subject to netting arrangements, if any, in the Consolidated Statement of Assets and Liabilities.
| 6. | INVESTMENT ADVISORY AGREEMENT AND OTHER TRANSACTIONS WITH AFFILIATES |
Investment Advisory: The Fund entered into an Investment Advisory Agreement with the Manager, the Fund’s investment adviser and an indirect, wholly-owned subsidiary of BlackRock, Inc. (“BlackRock”), to provide investment advisory and administrative services. The Manager is responsible for the management of the Fund’s portfolio and provides the personnel, facilities, equipment and certain other services necessary to the operations of the Fund.
For such services, the Fund pays the Manager a monthly fee at an annual rate equal to 0.75% of the average daily value of the Fund’s net assets.
For the year ended October 31, 2020, the Fund reimbursed the Manager for certain accounting services, which is included in accounting services in the Consolidated Statement of Operations. The reimbursements were $252,067.
The Manager provides investment management and other services to the Subsidiary. The Manager does not receive separate compensation from the Subsidiary for providing investment management or administrative services. However, the Fund pays the Manager based on the Fund’s net assets, which includes the assets of the Subsidiary.
Service and Distribution Fees: The Fund entered into a Distribution Agreement and a Distribution and Service Plan with BlackRock Investments, LLC (“BRIL”), an affiliate of the Manager. Pursuant to the Distribution and Service Plan and in accordance with Rule 12b-1 under the 1940 Act, the Fund pays BRIL ongoing service and distribution fees. The fees are accrued daily and paid monthly at annual rates based upon the average daily net assets of the relevant share class of the Fund as follows:
| | | | | | | | |
| Share Class | | Service Fees | | | Distribution Fees | |
Investor A | | | 0.25 | % | | | N/A | |
Investor C | | | 0.25 | | | | 0.75 | % |
Class R | | | 0.25 | | | | 0.25 | |
BRIL and broker-dealers, pursuant to sub-agreements with BRIL, provide shareholder servicing and distribution services to the Fund. The ongoing service and/or distribution fee compensates/reimburses BRIL and each broker-dealer for providing shareholder servicing and/or distribution related services to shareholders.
| | |
NOTESTO CONSOLIDATED FINANCIAL STATEMENTS | | 69 |
Notes to Consolidated Financial Statements (continued)
For the year ended October 31, 2020, the following table shows the class specific service and distribution fees borne directly by each share class of the Fund:
| | | | | | | | |
| | | Investor A | | Investor C | | Class R | | Total |
Service and distribution fees — class specific | | $ 26,163,358 | | $ 24,019,828 | | $ 2,403,524 | | $ 52,586,710 |
Transfer Agent: Pursuant to written agreements, certain financial intermediaries, some of which may be affiliates, provide the Fund with sub-accounting, recordkeeping, sub-transfer agency and other administrative services with respect to servicing of underlying investor accounts. For these services, these entities receive an asset-based fee or an annual fee per shareholder account, which will vary depending on share class and/or net assets. For the year ended October 31, 2020, the Fund paid the following amounts to affiliates of BlackRock in return for these services, which are included in transfer agent — class specific in the Consolidated Statement of Operations:
| | | | | | |
| | | Institutional | | Investor A | | Total |
Amounts paid to affiliates | | $ 56,923 | | $ 96 | | $ 57,019 |
The Manager maintains a call center that is responsible for providing certain shareholder services to the Fund. Shareholder services include responding to inquiries and processing purchases and sales based upon instructions from shareholders. For the year ended October 31, 2020, the Fund reimbursed the Manager the following amounts for costs incurred in running the call center, which are included in transfer agent — class specific in the Consolidated Statement of Operations:
| | | | | | | | | | | | | | |
| | | Institutional Investor A | | Investor C | | Class K | | Class R | | Total |
Reimbursed amounts | | | | $ 19,830 | | $ 199,240 | | $ 93,985 | | $ 5,775 | | $ 3,056 | | $ 321,886 |
For the year ended October 31, 2020, the following table shows the class specific transfer agent fees borne directly by each share class of the Fund:
| | | | | | | | | | | | | | |
| | | Institutional | | Investor A | | Investor C | | Class K | | Class R | | Total |
Transfer agent fees — class specific | | $ 6,491,811 | | $ 10,654,941 | | $ 2,817,602 | | $ 81,539 | | $ 907,714 | | $ 20,953,607 |
Other Fees: For the year ended October 31, 2020, affiliates earned underwriting discounts, direct commissions and dealer concessions on sales of the Fund’s Investor A Shares, which totaled $128,219.
For the year ended October 31, 2020, affiliates received CDSCs as follows:
| | | | | | |
| | | Investor A | | Investor C | | Total |
CDSC | | $ 74,341 | | $ 57,697 | | $ 132,038 |
Expense Waivers and Reimbursements: The Manager contractually agreed to waive a portion of its investment advisory fees payable by the Fund through February 28, 2021, so that the Manager receives such fees as a percentage of average daily net assets of the Fund as follows:
| | |
| Average Daily Net Assets | | Investment Advisory Fees |
First $10 billion | | 0.75% |
$10 billion — $15 billion | | 0.69 |
$15 billion — $20 billion | | 0.68 |
$20 billion — $25 billion | | 0.67 |
$25 billion — $30 billion | | 0.65 |
$30 billion — $40 billion | | 0.63 |
$40 billion — $60 billion | | 0.62 |
$60 billion — $80 billion | | 0.61 |
Greater than $80 billion | | 0.60 |
This contractual agreement may be terminated upon 90 days’ notice by a majority of the directors who are not “interested persons” of the Fund, as defined in the 1940 Act (“Independent Directors”), or by a vote of a majority of the outstanding voting securities of the Fund. This amount is included in fees waived and/or reimbursed by the Manager in the Consolidated Statement of Operations. For the year ended October 31, 2020, the Manager waived $8,515,091 pursuant to this agreement.
The Manager contractually agreed to waive its investment advisory fees by the amount of investment advisory fees the Fund pays to the Manager indirectly through its investment in affiliated money market funds (the “affiliated money market fund waiver”) through February 28, 2021. The contractual agreement may be terminated upon 90 days’ notice by a majority of the Independent Directors or by a vote of a majority of the outstanding voting securities of the Fund. Prior to February 28, 2020, this waiver was voluntary. This amount is included in fees waived and/or reimbursed by the Manager in the Consolidated Statement of Operations. For the year ended October 31, 2020, the amounts waived were $31,383.
| | |
| 70 | | 2020 BLACKROCK ANNUAL REPORTTO SHAREHOLDERS |
Notes to Consolidated Financial Statements (continued)
The Manager has contractually agreed to waive its investment advisory fee with respect to any portion of the Fund’s assets invested in affiliated equity and fixed-income mutual funds, affiliated and exchange-traded funds that have a contractual management fee through February 28, 2021. The contractual agreement may be terminated upon 90 days’ notice by a majority of the Independent Directors, or by a vote of a majority of the outstanding voting securities of the Fund. For the year ended October 31, 2020, the Manager waived $1,730,286 in investment advisory fees pursuant to this arrangement.
Securities Lending: The U.S. Securities and Exchange Commission (“SEC”) has issued an exemptive order which permits BlackRock Investment Management, LLC (“BIM”), an affiliate of the Manager, to serve as securities lending agent for the Fund, subject to applicable conditions. As securities lending agent, BIM bears all operational costs directly related to securities lending. The Fund is responsible for expenses in connection with the investment of cash collateral received for securities on loan (the “collateral investment expenses”). The cash collateral is invested in a private investment company, SL Liquidity Series, LLC (“Money Market Series”), managed by the Manager or its affiliates. However, BIM has agreed to cap the collateral investment expenses of the Money Market Series to an annual rate of 0.04%. The investment adviser to the Money Market Series will not charge any advisory fees with respect to shares purchased by the Fund. The Money Market Series may, under certain circumstances, impose a liquidity fee of up to 2% of the value withdrawn or temporarily restrict withdrawals for up to 10 business days during a 90 day period, in the event that the private investment company’s weekly liquid assets fall below certain thresholds. The Money Market Series seeks current income consistent with maintaining liquidity and preserving capital. Although the Money Market Series is not registered under the 1940 Act, its investments may follow the parameters of investments by a money market fund that is subject to Rule 2a-7 under the 1940 Act.
Securities lending income is equal to the total of income earned from the reinvestment of cash collateral, net of fees and other payments to and from borrowers of securities, and less the collateral investment expenses. The Fund retains a portion of securities lending income and remits a remaining portion to BIM as compensation for its services as securities lending agent.
Pursuant to the current securities lending agreement, the Fund retains 82% of securities lending income (which excludes collateral investment expenses), and this amount retained can never be less than 70% of the total of securities lending income plus the collateral investment expenses.
In addition, commencing the business day following the date that the aggregate securities lending income earned across the BlackRock Multi-Asset Complex in a calendar year exceeds a specified threshold, the Fund, pursuant to the securities lending agreement, will retain for the remainder of that calendar year securities lending income in an amount equal to 85% of securities lending income (which excludes collateral investment expenses), and this amount retained can never be less than 70% of the total of securities lending income plus the collateral investment expenses.
The share of securities lending income earned by the Fund is shown as securities lending income — affiliated – net in the Consolidated Statement of Operations. For the year ended October 31, 2020, the Fund paid BIM $452,570 for securities lending agent services.
Interfund Lending: In accordance with an exemptive order (the “Order”) from the SEC, the Fund may participate in a joint lending and borrowing facility for temporary purposes (the “Interfund Lending Program”), subject to compliance with the terms and conditions of the Order, and to the extent permitted by the Fund’s investment policies and restrictions. The Fund is currently permitted to borrow under the Interfund Lending Program.
A lending BlackRock fund may lend in aggregate up to 15% of its net assets, but may not lend more than 5% of its net assets to any one borrowing fund through the Interfund Lending Program. A borrowing BlackRock fund may not borrow through the Interfund Lending Program or from any other source more than 33 1/3% of its total assets (or any lower threshold provided for by the fund’s investment restrictions). If a borrowing BlackRock fund’s total outstanding borrowings exceed 10% of its total assets, each of its outstanding interfund loans will be subject to collateralization of at least 102% of the outstanding principal value of the loan. All interfund loans are for temporary or emergency purposes and the interest rate to be charged will be the average of the highest current overnight repurchase agreement rate available to a lending fund and the bank loan rate, as calculated according to a formula established by the Board.
During the year ended October 31, 2020, the Fund did not participate in the Interfund Lending Program.
Directors and Officers: Certain directors and/or officers of the Fund are directors and/or officers of BlackRock or its affiliates. The Fund reimburses the Manager for a portion of the compensation paid to the Fund’s Chief Compliance Officer, which is included in Directors and Officer in the Consolidated Statement of Operations.
Other Transactions: During the year ended October 31, 2020, the Fund received a reimbursement of $16,428 from an affiliate, which is included in Other income - affiliated in the Consolidated Statement of Operations, related to an operating event.
The Fund may purchase securities from, or sell securities to, an affiliated fund provided the affiliation is due solely to having a common investment adviser, common officers, or common directors. For the year ended October 31, 2020, the purchase and sale transactions and any net realized gains (losses) with affiliated funds in compliance with Rule 17a-7 under the 1940 Act were as follows:
| | | | | | |
| Fund Name | | Purchases | | Sales | | Net Realized
Gain (Loss) |
BlackRock Global Allocation Fund, Inc. | | $ 14,708,869 | | $ 14,989,498 | | $ 160,029 |
For the year ended October 31, 2020, purchases and sales of investments, including paydowns/payups and excluding short-term investments, were as follows:
| | | | |
| Asset Type | | Purchases | | Sales |
Non-U.S. government securities | | $35,241,102,515 | | $35,474,914,800 |
U.S. government securities | | 4,185,604,640 | | 5,760,298,365 |
| | |
NOTESTO CONSOLIDATED FINANCIAL STATEMENTS | | 71 |
Notes to Consolidated Financial Statements (continued)
It is the Fund’s policy to comply with the requirements of the Internal Revenue Code of 1986, as amended, applicable to regulated investment companies, and to distribute substantially all of its taxable income to its shareholders. Therefore, no U.S. federal income tax provision is required.
The Fund files U.S. federal and various state and local tax returns. No income tax returns are currently under examination. The statute of limitations on the Fund’s U.S. federal tax returns generally remains open for a period of three fiscal years after they are filed. The statutes of limitations on the Fund’s state and local tax returns may remain open for an additional year depending upon the jurisdiction.
Management has analyzed tax laws and regulations and their application to the Fund as of October 31, 2020, inclusive of the open tax return years, and does not believe that there are any uncertain tax positions that require recognition of a tax liability in the Fund’s consolidated financial statements.
U.S. GAAP requires that certain components of net assets be adjusted to reflect permanent differences between financial and tax reporting. These reclassifications have no effect on net assets or NAVs per share. As of period end, the following permanent differences attributable to income recognized from the Fund’s wholly owned subsidiary and the certain deemed distributions were reclassified to the following accounts:
| | | | | | |
| |
| | | | | Amounts | |
| |
Paid-in capital | | | | $ | 111,748,958 | |
Accumulated earnings (loss) | | | | | (111,748,958 | ) |
| |
The tax character of distributions paid was as follows:
| | | | |
| | | 10/31/20 | | 10/31/19 |
Ordinary income(a) | | $ 701,602,430 | | $ 301,805,775 |
Long-term capital gains(a) | | 1,005,848,390 | | 1,673,336,233 |
| | | | |
| | $ 1,707,450,820 | | $ 1,975,142,008 |
| | | | |
| | (a) | Distribution amounts may include a portion of the proceeds from redeemed shares. | |
As of period end, the tax components of accumulated earnings (loss) were as follows:
| | |
| | | Amounts |
Undistributed ordinary income | | $ 763,071,187 |
Undistributed long-term capital gains | | 317,432,659 |
Net unrealized gains(a) | | 3,226,597,980 |
| | |
| | $ 4,307,101,826 |
| | |
| | (a) | The difference between book-basis and tax-basis net unrealized gains (losses) was attributable primarily to the tax deferral of losses on wash sales. | |
As of October 31, 2020, gross unrealized appreciation and depreciation based on cost of investments (including short positions and derivatives, if any) for U.S. federal income tax purposes were as follows:
| | | | |
| | | Amounts | |
Tax cost | | $ | 19,125,765,390 | |
| | | | |
Gross unrealized appreciation | | $ | 4,614,763,819 | |
Gross unrealized depreciation | | | (1,038,787,881 | ) |
| | | | |
Net unrealized appreciation (depreciation) | | $ | 3,575,975,938 | |
| | | | |
The Fund, along with certain other funds managed by the Manager and its affiliates (“Participating Funds”), is a party to a 364-day, $2.25 billion credit agreement with a group of lenders. Under this agreement, the Fund may borrow to fund shareholder redemptions. Excluding commitments designated for certain individual funds, the Participating Funds, including the Fund, can borrow up to an aggregate commitment amount of $1.75 billion at any time outstanding, subject to asset coverage and other limitations as specified in the agreement. The credit agreement has the following terms: a fee of 0.10% per annum on unused commitment amounts and interest at a rate equal to the higher of (a) one-month LIBOR (but, in any event, not less than 0.00%) on the date the loan is made plus 0.80% per annum or (b) the Fed Funds rate (but, in any event, not less than 0.00%) in effect from time to time plus 0.80% per annum on amounts borrowed. The agreement expires in April 2021 unless extended or renewed. These fees were allocated among such funds based upon portions of the aggregate commitment available to them and relative net assets of Participating Funds. During the year ended October 31, 2020, the Fund did not borrow under the credit agreement.
In the normal course of business, the Fund invests in securities or other instruments and may enter into certain transactions, and such activities subject the Fund to various risks, including among others, fluctuations in the market (market risk) or failure of an issuer to meet all of its obligations. The value of securities or other instruments may also be affected by various factors, including, without limitation: (i) the general economy; (ii) the overall market as well as local, regional or global political and/or social instability;
| | |
| 72 | | 2020 BLACKROCK ANNUAL REPORTTO SHAREHOLDERS |
Notes to Consolidated Financial Statements (continued)
(iii) regulation, taxation or international tax treaties between various countries; or (iv) currency, interest rate and price fluctuations. Local, regional or global events such as war, acts of terrorism, the spread of infectious illness or other public health issues, recessions, or other events could have a significant impact on the Fund and its investments. The Fund’s prospectus provides details of the risks to which the Fund is subject.
The Fund may be exposed to additional risks when reinvesting cash collateral in money market funds that do not seek to maintain a stable NAV per share of $1.00, which may be subject to redemption gates or liquidity fees under certain circumstances.
Market Risk: The Fund may be exposed to prepayment risk, which is the risk that borrowers may exercise their option to prepay principal earlier than scheduled during periods of declining interest rates, which would force the Fund to reinvest in lower yielding securities. The Fund may also be exposed to reinvestment risk, which is the risk that income from the Fund’s portfolio will decline if the Fund invests the proceeds from matured, traded or called fixed-income securities at market interest rates that are below the Fund portfolio’s current earnings rate.
An outbreak of respiratory disease caused by a novel coronavirus has developed into a global pandemic and has resulted in closing borders, quarantines, disruptions to supply chains and customer activity, as well as general concern and uncertainty. The impact of this pandemic, and other global health crises that may arise in the future, could affect the economies of many nations, individual companies and the market in general in ways that cannot necessarily be foreseen at the present time. This pandemic may result in substantial market volatility and may adversely impact the prices and liquidity of a fund’s investments. The duration of this pandemic and its effects cannot be determined with certainty.
Valuation Risk: The market values of equities, such as common stocks and preferred securities or equity related investments, such as futures and options, may decline due to general market conditions which are not specifically related to a particular company. They may also decline due to factors which affect a particular industry or industries. The Fund may invest in illiquid investments. An illiquid investment is any investment that the Fund reasonably expects cannot be sold or disposed of in current market conditions in seven calendar days or less without the sale or disposition significantly changing the market value of the investment. The Fund may experience difficulty in selling illiquid investments in a timely manner at the price that it believes the investments are worth. Prices may fluctuate widely over short or extended periods in response to company, market or economic news. Markets also tend to move in cycles, with periods of rising and falling prices. This volatility may cause the Fund’s NAV to experience significant increases or decreases over short periods of time. If there is a general decline in the securities and other markets, the NAV of the Fund may lose value, regardless of the individual results of the securities and other instruments in which the Fund invests.
The price the Fund could receive upon the sale of any particular portfolio investment may differ from the Fund’s valuation of the investment, particularly for securities that trade in thin or volatile markets or that are valued using a fair valuation technique or a price provided by an independent pricing service. Changes to significant unobservable inputs and assumptions (i.e., publicly traded company multiples, growth rate, time to exit) due to the lack of observable inputs may significantly impact the resulting fair value and therefore the Fund’s results of operations. As a result, the price received upon the sale of an investment may be less than the value ascribed by the Fund, and the Fund could realize a greater than expected loss or lesser than expected gain upon the sale of the investment. The Fund’s ability to value its investments may also be impacted by technological issues and/or errors by pricing services or other third party service providers.
Counterparty Credit Risk: The Fund may be exposed to counterparty credit risk, or the risk that an entity may fail to or be unable to perform on its commitments related to unsettled or open transactions, including making timely interest and/or principal payments or otherwise honoring its obligations. The Fund manages counterparty credit risk by entering into transactions only with counterparties that the Manager believes have the financial resources to honor their obligations and by monitoring the financial stability of those counterparties. Financial assets, which potentially expose the Fund to market, issuer and counterparty credit risks, consist principally of financial instruments and receivables due from counterparties. The extent of the Fund’s exposure to market, issuer and counterparty credit risks with respect to these financial assets is approximately their value recorded in the Consolidated Statement of Assets and Liabilities, less any collateral held by the Fund.
A derivative contract may suffer a mark-to-market loss if the value of the contract decreases due to an unfavorable change in the market rates or values of the underlying instrument. Losses can also occur if the counterparty does not perform under the contract.
For OTC options purchased, the Fund bears the risk of loss in the amount of the premiums paid plus the positive change in market values net of any collateral held by the Fund should the counterparty fail to perform under the contracts. Options written by the Fund do not typically give rise to counterparty credit risk, as options written generally obligate the Fund, and not the counterparty, to perform. The Fund may be exposed to counterparty credit risk with respect to options written to the extent the Fund deposits collateral with its counterparty to a written option.
With exchange-traded options purchased and futures and centrally cleared swaps, there is less counterparty credit risk to the Fund since the exchange or clearinghouse, as counterparty to such instruments, guarantees against a possible default. The clearinghouse stands between the buyer and the seller of the contract; therefore, credit risk is limited to failure of the clearinghouse. While offset rights may exist under applicable law, the Fund does not have a contractual right of offset against a clearing broker or clearinghouse in the event of a default (including the bankruptcy or insolvency). Additionally, credit risk exists in exchange-traded futures and centrally cleared swaps with respect to initial and variation margin that is held in a clearing broker’s customer accounts. While clearing brokers are required to segregate customer margin from their own assets, in the event that a clearing broker becomes insolvent or goes into bankruptcy and at that time there is a shortfall in the aggregate amount of margin held by the clearing broker for all its clients, typically the shortfall would be allocated on a pro rata basis across all the clearing broker’s customers, potentially resulting in losses to the Fund.
Concentration Risk: A diversified portfolio, where this is appropriate and consistent with a fund’s objectives, minimizes the risk that a price change of a particular investment will have a material impact on the NAV of a fund. The investment concentrations within the Fund’s portfolio are disclosed in its Consolidated Schedule of Investments.
The Fund invests a significant portion of its assets in fixed-income securities and/or uses derivatives tied to the fixed-income markets. Changes in market interest rates or economic conditions may affect the value and/or liquidity of such investments. Interest rate risk is the risk that prices of bonds and other fixed-income securities will increase as interest rates fall and decrease as interest rates rise. The Fund may be subject to a greater risk of rising interest rates due to the current period of historically low rates.
| | |
NOTESTO CONSOLIDATED FINANCIAL STATEMENTS | | 73 |
Notes to Consolidated Financial Statements (continued)
The Fund invests a substantial amount of its assets in issuers located in a single country or a limited number of countries. When a Fund concentrates its investments in this manner, it assumes the risk that economic, regulatory, political and social conditions in those countries may have a significant impact on their investment performance and could affect the income from, or the value or liquidity of, the Fund’s portfolio. Foreign issuers may not be subject to the same uniform accounting, auditing and financial reporting standards and practices as used in the United States. Foreign securities markets may also be more volatile and less liquid than U.S. securities and may be less subject to governmental supervision not typically associated with investing in U.S. securities. Investment percentages in specific countries are presented in the Consolidated Schedule of Investments.
LIBOR Transition Risk: The United Kingdom’s Financial Conduct Authority announced a phase out of the London Interbank Offered Rate (“LIBOR”) by the end of 2021, and it is expected that LIBOR will cease to be published after that time. The Fund may be exposed to financial instruments tied to LIBOR to determine payment obligations, financing terms, hedging strategies or investment value. The transition process away from LIBOR might lead to increased volatility and illiquidity in markets for, and reduce the effectiveness of new hedges placed against, instruments whose terms currently include LIBOR. The ultimate effect of the LIBOR transition process on the Fund is uncertain.
| 11. | CAPITAL SHARE TRANSACTIONS |
Transactions in capital shares for each class were as follows:
| | | | | | | | | | | | | | | | |
| | | Year Ended 10/31/20 | | | Year Ended 10/31/19 | |
| Share Class | | Shares | | | Amounts | | | Shares | | | Amounts | |
Institutional | | | | | | | | | | | | | | | | |
Shares sold | | | 60,012,764 | | | $ | 1,165,102,853 | | | | 65,547,601 | | | $ | 1,211,921,527 | |
Shares issued in reinvestment of distributions | | | 26,172,269 | | | | 505,101,847 | | | | 38,223,294 | | | | 679,170,797 | |
Shares redeemed | | | (134,369,913 | ) | | | (2,548,330,718 | ) | | | (348,120,063 | ) | | | (6,489,291,802 | ) |
| | | | | | | | | | | | | | | | |
| | | (48,184,880 | ) | | $ | (878,126,018 | ) | | | (244,349,168 | ) | | $ | (4,598,199,478 | ) |
| | | | | | | | | | | | | | | | |
Investor A | | | | | | | | | | | | | | | | |
Shares sold and automatic conversion of shares | | | 106,473,620 | | | $ | 2,061,125,684 | | | | 114,513,713 | | | $ | 2,131,384,710 | |
Shares issued in reinvestment of distributions | | | 34,097,475 | | | | 653,789,198 | | | | 34,806,478 | | | | 615,764,480 | |
Shares redeemed | | | (125,629,074 | ) | | | (2,384,215,581 | ) | | | (162,648,789 | ) | | | (3,008,794,310 | ) |
| | | | | | | | | | | | | | | | |
| | | 14,942,021 | | | $ | 330,699,301 | | | | (13,328,598 | ) | | $ | (261,645,120 | ) |
| | | | | | | | | | | | | | | | |
Investor C | | | | | | | | | | | | | | | | |
Shares sold | | | 5,032,820 | | | $ | 85,563,106 | | | | 7,512,871 | | | $ | 123,175,408 | |
Shares issued in reinvestment of distributions | | | 10,648,558 | | | | 181,375,674 | | | | 16,253,238 | | | | 256,393,304 | |
Shares redeemed and automatic conversion of shares | | | (109,980,242 | ) | | | (1,877,176,344 | ) | | | (161,893,916 | ) | | | (2,696,127,334 | ) |
| | | | | | | | | | | | | | | | |
| | | (94,298,864 | ) | | $ | (1,610,237,564 | ) | | | (138,127,807 | ) | | $ | (2,316,558,622 | ) |
| | | | | | | | | | | | | | | | |
Class K | | | | | | | | | | | | | | | | |
Shares sold | | | 22,010,657 | | | $ | 426,992,355 | | | | 15,405,222 | | | $ | 288,087,479 | |
Shares issued in reinvestment of distributions | | | 4,276,611 | | | | 82,541,947 | | | | 4,551,509 | | | | 80,871,066 | |
Shares redeemed | | | (18,785,979 | ) | | | (368,238,193 | ) | | | (31,310,151 | ) | | | (589,431,669 | ) |
| | | | | | | | | | | | | | | | |
| | | 7,501,289 | | | $ | 141,296,109 | | | | (11,353,420 | ) | | $ | (220,473,124 | ) |
| | | | | | | | | | | | | | | | |
Class R | | | | | | | | | | | | | | | | |
Shares sold | | | 2,333,994 | | | $ | 42,200,269 | | | | 4,070,448 | | | $ | 71,438,095 | |
Shares issued in reinvestment of distributions | | | 1,949,910 | | | | 35,361,742 | | | | 2,644,412 | | | | 44,332,192 | |
Shares redeemed | | | (15,591,980 | ) | | | (277,730,473 | ) | | | (17,862,274 | ) | | | (314,348,728 | ) |
| | | | | | | | | | | | | | | | |
| | | (11,308,076 | ) | | $ | (200,168,462 | ) | | | (11,147,414 | ) | | $ | (198,578,441 | ) |
| | | | | | | | | | | | | | | | |
| | | (131,348,510 | ) | | $ | (2,216,536,634 | ) | | | (418,306,407 | ) | | $ | (7,595,454,785 | ) |
| | | | | | | | | | | | | | | | |
Management has evaluated the impact of all subsequent events on the Fund through the date the financial statements were issued and has determined that there were no subsequent events requiring adjustment or additional disclosure in the financial statements.
| | |
| 74 | | 2020 BLACKROCK ANNUAL REPORTTO SHAREHOLDERS |
Report of Independent Registered Public Accounting Firm
To the Shareholders and Board of Directors of BlackRock Global Allocation Fund, Inc.:
Opinion on the Financial Statements and Financial Highlights
We have audited the accompanying consolidated statement of assets and liabilities of BlackRock Global Allocation Fund, Inc. (the “Fund”), including the consolidated schedule of investments, as of October 31, 2020, the related consolidated statement of operations for the year then ended, the consolidated statements of changes in net assets for each of the two years in the period then ended, the consolidated financial highlights for each of the five years in the period then ended, and the related notes. In our opinion, the financial statements and financial highlights present fairly, in all material respects, the financial position of the Fund as of October 31, 2020, and the results of its operations for the year then ended, the changes in its net assets for each of the two years in the period then ended, and the financial highlights for each of the five years in the period then ended, in conformity with accounting principles generally accepted in the United States of America.
Basis for Opinion
These financial statements and financial highlights are the responsibility of the Fund’s management. Our responsibility is to express an opinion on the Fund’s financial statements and financial highlights based on our audits. We are a public accounting firm registered with the Public Company Accounting Oversight Board (United States) (PCAOB) and are required to be independent with respect to the Fund in accordance with the U.S. federal securities laws and the applicable rules and regulations of the Securities and Exchange Commission and the PCAOB.
We conducted our audit in accordance with the standards of the PCAOB. Those standards require that we plan and perform the audit to obtain reasonable assurance about whether the financial statements and financial highlights are free of material misstatement, whether due to error or fraud. The Fund is not required to have, nor were we engaged to perform, an audit of its internal control over financial reporting. As part of our audit we are required to obtain an understanding of internal control over financial reporting but not for the purpose of expressing an opinion on the effectiveness of the Fund’s internal control over financial reporting. Accordingly, we express no such opinion.
Our audits included performing procedures to assess the risks of material misstatement of the financial statements and financial highlights, whether due to error or fraud, and performing procedures that respond to those risks. Such procedures included examining, on a test basis, evidence regarding the amounts and disclosures in the financial statements and financial highlights. Our audits also included evaluating the accounting principles used and significant estimates made by management, as well as evaluating the overall presentation of the financial statements and financial highlights. Our procedures included confirmation of securities owned as of October 31, 2020, by correspondence with the custodian, agent banks, and brokers; when replies were not received from agent banks or brokers, we performed other auditing procedures. We believe that our audits provide a reasonable basis for our opinion.
Deloitte & Touche LLP
Boston, Massachusetts
December 21, 2020
We have served as the auditor of one or more BlackRock investment companies since 1992.
| | |
REPORTOF INDEPENDENT REGISTERED PUBLIC ACCOUNTING FIRM | | 75 |
Important Tax Information (unaudited)
For corporate shareholders, the percentage of ordinary income distributions paid during the fiscal year ended October 31, 2020 that qualified for the dividends-received deduction were as follows:
| | | | |
| Fund Name | | Dividends-Received
Deduction | |
BlackRock Global Allocation Fund, Inc. | | | 10.57 | % |
The following maximum amounts are hereby designated as qualified dividend income for individuals for the fiscal year ended October 31, 2020:
| | | | |
| Fund Name | | Qualified Dividend
Income | |
BlackRock Global Allocation Fund, Inc. | | $ | 392,034,820 | |
For the fiscal year ended October 31, 2020, the Fund hereby designates the following maximum amounts allowable as interest-related dividends eligible for exemption from U.S. withholding tax for nonresident aliens and foreign corporations:
| | | | |
| Fund Name | | Interest-Related
Dividends | |
BlackRock Global Allocation Fund, Inc. | | $ | 49,135,805 | |
The Fund hereby designates the following amount of distributions from direct federal obligation interest for the fiscal year ended October 31, 2020:
| | | | |
| Fund Name | | Federal Obligation
Interest | |
BlackRock Global Allocation Fund, Inc. | | $ | 19,652,833 | |
The law varies in each state as to whether and what percent of ordinary income dividends attribute to federal obligations is exempt from state income tax. Shareholders are advised to check with their tax advisers to determine if any portion of the dividends received is exempt from state income tax.
The following distribution amounts are hereby designated for the fiscal year ended October 31, 2020:
| | | | | | | | |
| Fund Name | | Short-Term Capital Gain Dividends | | | 20% Rate Long-
Term Capital Gain
Dividends | |
BlackRock Global Allocation Fund, Inc. | | $ | 591,602,008 | | | $ | 1,005,848,390 | |
| | |
| 76 | | 2020 BLACKROCK ANNUAL REPORTTO SHAREHOLDERS |
Disclosure of Investment Advisory Agreement
The Board of Directors (the “Board,” the members of which are referred to as “Board Members”) of BlackRock Global Allocation Fund, Inc. (the “Fund”) met on April 7, 2020 (the “April Meeting”) and May 11-13, 2020 (the “May Meeting”) to consider the approval of the investment advisory agreement (the “Agreement”) between the Fund and BlackRock Advisors, LLC (the “Manager” or “BlackRock”), the Fund’s investment advisor.
Activities and Composition of the Board
On the date of the May Meeting, the Board consisted of fourteen individuals, twelve of whom were not “interested persons” of the Fund as defined in the Investment Company Act of 1940, as amended (the “1940 Act”) (the “Independent Board Members”). The Board Members are responsible for the oversight of the operations of the Fund and perform the various duties imposed on the directors of investment companies by the 1940 Act. The Independent Board Members have retained independent legal counsel to assist them in connection with their duties. The Chair of the Board is an Independent Board Member. The Board has established five standing committees: an Audit Committee, a Governance and Nominating Committee, a Compliance Committee, a Performance Oversight Committee and an Ad Hoc Topics Committee, each of which is chaired by an Independent Board Member and composed of Independent Board Members (except for the Ad Hoc Topics Committee, which also has one interested Board Member).
The Agreement
Consistent with the requirements of the 1940 Act, the Board considers the continuation of the Agreement on an annual basis. The Board has four quarterly meetings per year, each typically extending for two days, and additional in-person and telephonic meetings throughout the year, as needed. While the Board also has a fifth one-day meeting to consider specific information surrounding the renewal of the Agreement, the Board’s consideration entails a year-long deliberative process whereby the Board and its committees assess BlackRock’s services to the Fund. In particular, the Board assessed, among other things, the nature, extent and quality of the services provided to the Fund by BlackRock, BlackRock’s personnel and affiliates, including (as applicable): investment management services; accounting oversight; administrative and shareholder services; oversight of the Fund’s service providers; risk management and oversight; and legal, regulatory and compliance services. Throughout the year, including during the contract renewal process, the Independent Board Members were advised by independent legal counsel, and met with independent legal counsel in various executive sessions outside of the presence of BlackRock’s management.
During the year, the Board, acting directly and through its committees, considers information that is relevant to its annual consideration of the renewal of the Agreement, including the services and support provided by BlackRock to the Fund and its shareholders. BlackRock also furnished additional information to the Board in response to specific questions from the Board. This additional information is discussed further in the section titled “Board Considerations in Approving the Agreement.” Among the matters the Board considered were: (a) investment performance for one-year, three-year, five-year, and/or since inception periods, as applicable, against peer funds, an applicable benchmark, and other performance metrics, as applicable, as well as BlackRock senior management’s and portfolio managers’ analyses of the reasons for any outperformance or underperformance relative to its peers, benchmarks, and other performance metrics, as applicable; (b) fees, including advisory, administration, if applicable, and other amounts paid to BlackRock and its affiliates by the Fund for services; (c) Fund operating expenses and how BlackRock allocates expenses to the Fund; (d) the resources devoted to risk oversight of, and compliance reports relating to, implementation of the Fund’s investment objective, policies and restrictions, and meeting regulatory requirements; (e) BlackRock’s and the Fund’s adherence to applicable compliance policies and procedures; (f) the nature, character and scope of non-investment management services provided by BlackRock and its affiliates and the estimated cost of such services; (g) BlackRock’s and other service providers’ internal controls and risk and compliance oversight mechanisms; (h) BlackRock’s implementation of the proxy voting policies approved by the Board; (i) the use of brokerage commissions and execution quality of portfolio transactions; (j) BlackRock’s implementation of the Fund’s valuation and liquidity procedures; (k) an analysis of management fees for products with similar investment mandates across the open-end fund, exchange-traded fund (“ETF”), closed-end fund, sub-advised mutual fund, separately managed account, collective investment trust, and institutional separate account product channels, as applicable, and the similarities and differences between these products and the services provided as compared to the Fund; (l) BlackRock’s compensation methodology for its investment professionals and the incentives and accountability it creates, along with investment professionals’ investments in the fund(s) they manage; and (m) periodic updates on BlackRock’s business.
Board Considerations in Approving the Agreement
The Approval Process: Prior to the April Meeting, the Board requested and received materials specifically relating to the Agreement. The Independent Board Members are continuously engaged in a process with their independent legal counsel and BlackRock to review the nature and scope of the information provided to the Board to better assist its deliberations. The materials provided in connection with the April Meeting included, among other things: (a) information independently compiled and prepared by Broadridge Financial Solutions, Inc. (“Broadridge”), based on either a Lipper classification or Morningstar category, regarding the Fund’s fees and expenses as compared with a peer group of funds as determined by Broadridge (“Expense Peers”) and the investment performance of the Fund as compared with a peer group of funds (“Performance Peers”); (b) information on the composition of the Expense Peers and Performance Peers and a description of Broadridge’s methodology; (c) information on the estimated profits realized by BlackRock and its affiliates pursuant to the Agreement and a discussion of fall-out benefits to BlackRock and its affiliates; (d) a general analysis provided by BlackRock concerning investment management fees received in connection with other types of investment products, such as institutional accounts, sub-advised mutual funds, ETFs, closed-end funds, open-end funds, and separately managed accounts under similar investment mandates, as well as the performance of such other products, as applicable; (e) a review of non-management fees; (f) the existence, impact and sharing of potential economies of scale, if any, with the Fund; (g) a summary of aggregate amounts paid by the Fund to BlackRock; (h) sales and redemption data regarding the Fund’s shares; and (i) various additional information requested by the Board as appropriate regarding BlackRock’s and the Fund’s operations.
At the April Meeting, the Board reviewed materials relating to its consideration of the Agreement. As a result of the discussions that occurred during the April Meeting, and as a culmination of the Board’s year-long deliberative process, the Board presented BlackRock with questions and requests for additional information. BlackRock responded to these questions and requests with additional written information in advance of the May Meeting.
At the May Meeting, the Board concluded its assessment of, among other things: (a) the nature, extent and quality of the services provided by BlackRock; (b) the investment performance of the Fund as compared to its Performance Peers and to other metrics, as applicable; (c) the advisory fee and the estimated cost of the services and estimated profits realized by BlackRock and its affiliates from their relationship with the Fund; (d) the Fund’s fees and expenses compared to its Expense Peers; (e) the existence and
| | |
DISCLOSURE OF INVESTMENT ADVISORY AGREEMENT | | 77 |
Disclosure of Investment Advisory Agreement (continued)
sharing of potential economies of scale; (f) any fall-out benefits to BlackRock and its affiliates as a result of BlackRock’s relationship with the Fund; and (g) other factors deemed relevant by the Board Members.
The Board also considered other matters it deemed important to the approval process, such as other payments made to BlackRock or its affiliates relating to securities lending and cash management, and BlackRock’s services related to the valuation and pricing of Fund portfolio holdings. The Board noted the willingness of BlackRock’s personnel to engage in open, candid discussions with the Board. The Board did not identify any particular information as determinative, and each Board Member may have attributed different weights to the various items considered.
A. Nature, Extent and Quality of the Services Provided by BlackRock
The Board, including the Independent Board Members, reviewed the nature, extent and quality of services provided by BlackRock, including the investment advisory services, and the resulting performance of the Fund. Throughout the year, the Board compared Fund performance to the performance of a comparable group of mutual funds, relevant benchmark, and performance metrics, as applicable. The Board met with BlackRock’s senior management personnel responsible for investment activities, including the senior investment officers. The Board also reviewed the materials provided by the Fund’s portfolio management team discussing the Fund’s performance, investment strategies and outlook.
The Board considered, among other factors, with respect to BlackRock: the number, education and experience of investment personnel generally and the Fund’s portfolio management team; research capabilities; investments by portfolio managers in the funds they manage; portfolio trading capabilities; use of technology; commitment to compliance; credit analysis capabilities; risk analysis and oversight capabilities; and the approach to training and retaining portfolio managers and other research, advisory and management personnel. The Board also considered BlackRock’s overall risk management program, including the continued efforts of BlackRock and its affiliates to address cybersecurity risks and the role of BlackRock’s Risk & Quantitative Analysis Group. The Board engaged in a review of BlackRock’s compensation structure with respect to the Fund’s portfolio management team and BlackRock’s ability to attract and retain high-quality talent and create performance incentives.
In addition to investment advisory services, the Board considered the nature and quality of the administrative and other non-investment advisory services provided to the Fund. BlackRock and its affiliates provide the Fund with certain administrative, shareholder and other services (in addition to any such services provided to the Fund by third parties) and officers and other personnel as are necessary for the operations of the Fund. In particular, BlackRock and its affiliates provide the Fund with administrative services including, among others: (i) responsibility for disclosure documents, such as the prospectus, the summary prospectus (as applicable), the statement of additional information and periodic shareholder reports; (ii) oversight of daily accounting and pricing; (iii) responsibility for periodic filings with regulators; (iv) overseeing and coordinating the activities of third-party service providers including, among others, the Fund’s custodian, fund accountant, transfer agent, and auditor; (v) organizing Board meetings and preparing the materials for such Board meetings; (vi) providing legal and compliance support; (vii) furnishing analytical and other support to assist the Board in its consideration of strategic issues such as the merger, consolidation or repurposing of certain open-end funds; and (viii) performing or managing administrative functions necessary for the operation of the Fund, such as tax reporting, expense management, fulfilling regulatory filing requirements, overseeing the Fund’s distribution partners, and shareholder call center and other services. The Board reviewed the structure and duties of BlackRock’s fund administration, shareholder services, and legal & compliance departments and considered BlackRock’s policies and procedures for assuring compliance with applicable laws and regulations.
B. The Investment Performance of the Fund and BlackRock
The Board, including the Independent Board Members, also reviewed and considered the performance history of the Fund. In preparation for the April Meeting, the Board was provided with reports independently prepared by Broadridge, which included an analysis of the Fund’s performance as of December 31, 2019, as compared to its Performance Peers. Broadridge ranks funds in quartiles, ranging from first to fourth, where first is the most desirable quartile position and fourth is the least desirable. In connection with its review, the Board received and reviewed information regarding the investment performance of the Fund as compared to its Performance Peers. The Board and its Performance Oversight Committee regularly review, and meet with Fund management, to discuss the performance of the Fund throughout the year.
In evaluating performance, the Board focused particular attention on funds with less favorable performance records. The Board also noted that while it found the data provided by Broadridge generally useful, it recognized the limitations of such data, including in particular, that notable differences may exist between a fund and its Performance Peers (for example, the investment objectives and strategies). Further, the Board recognized that the performance data reflects a snapshot of a period as of a particular date and that selecting a different performance period could produce significantly different results. The Board also acknowledged that long-term performance could be impacted by even one period of significant outperformance or underperformance, and that a single investment theme could have the ability to disproportionately affect long-term performance.
The Board noted that for the one-, three- and five-year periods reported, the Fund ranked in the second, third and third quartiles, respectively, against its Performance Peers. The Board and BlackRock reviewed the Fund’s underperformance relative to its Performance Peers during the applicable periods. The Board noted significant changes to the Fund’s portfolio management team under the senior leadership of BlackRock’s Global Fixed Income Chief Investment Officer and an expansion of resources.
C. Consideration of the Advisory/Management Fees and the Estimated Cost of the Services and Estimated Profits Realized by BlackRock and its Affiliates from their Relationship with the Fund
The Board, including the Independent Board Members, reviewed the Fund’s contractual management fee rate compared with those of its Expense Peers. The contractual management fee rate represents a combination of the advisory fee and any administrative fees, before taking into account any reimbursements or fee waivers. The Board also compared the Fund’s total expense ratio, as well as its actual management fee rate, to those of its Expense Peers. The total expense ratio represents a fund’s total net operating expenses, including any 12b-1 or non-12b-1 service fees. The total expense ratio gives effect to any expense reimbursements or fee waivers, and the actual management fee rate gives effect to any management fee reimbursements or waivers. The Board considered the services provided and the fees charged by BlackRock and its affiliates to other types of clients with similar investment mandates, as applicable, including institutional accounts and sub-advised mutual funds (including mutual funds sponsored by third parties).
| | |
| 78 | | 2020 BLACKROCK ANNUAL REPORTTO SHAREHOLDERS |
Disclosure of Investment Advisory Agreement (continued)
The Board received and reviewed statements relating to BlackRock’s financial condition. The Board reviewed BlackRock’s profitability methodology and was also provided with an estimated profitability analysis that detailed the revenues earned and the expenses incurred by BlackRock for services provided to the Fund. The Board reviewed BlackRock’s estimated profitability with respect to the Fund and other funds the Board currently oversees for the year ended December 31, 2019 compared to available aggregate estimated profitability data provided for the prior two years. The Board reviewed BlackRock’s estimated profitability with respect to certain other U.S. fund complexes managed by BlackRock and/or its affiliates. The Board reviewed BlackRock’s assumptions and methodology of allocating expenses in the estimated profitability analysis, noting the inherent limitations in allocating costs among various advisory products. The Board recognized that profitability may be affected by numerous factors including, among other things, fee waivers and expense reimbursements by BlackRock, the types of funds managed, precision of expense allocations and business mix. The Board thus recognized that calculating and comparing profitability at the individual fund level is difficult.
The Board noted that, in general, individual fund or product line profitability of other advisors is not publicly available. The Board reviewed BlackRock’s overall operating margin, in general, compared to that of certain other publicly traded asset management firms. The Board considered the differences between BlackRock and these other firms, including the contribution of technology at BlackRock, BlackRock’s expense management, and the relative product mix.
The Board considered whether BlackRock has the financial resources necessary to attract and retain high quality investment management personnel to perform its obligations under the Agreement and to continue to provide the high quality of services that is expected by the Board. The Board further considered factors including but not limited to BlackRock’s commitment of time, assumption of risk, and liability profile in servicing the Fund, including in contrast to what is required of BlackRock with respect to other products with similar investment mandates across the open-end fund, ETF, closed-end fund, sub-advised mutual fund, separately managed account, collective investment trust, and institutional separate account product channels, as applicable.
The Board noted that the Fund’s contractual management fee rate ranked in the third quartile, and that the actual management fee rate and total expense ratio ranked in the third and second quartiles, respectively, relative to the Fund’s Expense Peers. The Board also noted that the Fund has an advisory fee arrangement that includes breakpoints, in the form of an advisory fee waiver that adjusts the fee rate downward as the size of the Fund increases above certain contractually specified levels. The Board noted that if the size of the Fund were to decrease, the Fund could lose the benefit of one or more breakpoints.
D. Economies of Scale
The Board, including the Independent Board Members, considered the extent to which economies of scale might be realized as the assets of the Fund increase, including the existence of fee waivers and/or expense caps, as applicable, noting that any contractual fee waivers and contractual expense caps had been approved by the Board. In its consideration, the Board further considered the continuation and/or implementation of fee waivers and/or expense caps, as applicable. The Board also considered the extent to which the Fund benefits from such economies of scale in a variety of ways and whether there should be changes in the advisory fee rate or breakpoint structure in order to enable the Fund to more fully participate in these economies of scale. The Board considered the Fund’s asset levels and whether the current fee schedule was appropriate.
E. Other Factors Deemed Relevant by the Board Members
The Board, including the Independent Board Members, also took into account other ancillary or “fall-out” benefits that BlackRock or its affiliates may derive from BlackRock’s respective relationships with the Fund, both tangible and intangible, such as BlackRock’s ability to leverage its investment professionals who manage other portfolios and its risk management personnel, an increase in BlackRock’s profile in the investment advisory community, and the engagement of BlackRock’s affiliates as service providers to the Fund, including for administrative, distribution, securities lending and cash management services. The Board also considered BlackRock’s overall operations and its efforts to expand the scale of, and improve the quality of, its operations. The Board also noted that, subject to applicable law, BlackRock may use and benefit from third-party research obtained by soft dollars generated by certain registered fund transactions to assist in managing all or a number of its other client accounts.
In connection with its consideration of the Agreement, the Board also received information regarding BlackRock’s brokerage and soft dollar practices. The Board received reports from BlackRock which included information on brokerage commissions and trade execution practices throughout the year.
The Board noted the competitive nature of the open-end fund marketplace, and that shareholders are able to redeem their Fund shares if they believe that the Fund’s fees and expenses are too high or if they are dissatisfied with the performance of the Fund.
Conclusion
The Board, including the Independent Board Members, unanimously approved the continuation of the Agreement between the Manager and the Fund for a one-year term ending June 30, 2021. Based upon its evaluation of all of the aforementioned factors in their totality, as well as other information, the Board, including the Independent Board Members, was satisfied that the terms of the Agreement were fair and reasonable and in the best interest of the Fund and its shareholders. In arriving at its decision to approve the Agreement, the Board did not identify any single factor or group of factors as all-important or controlling, but considered all factors together, and different Board Members may have attributed different weights to the various factors considered. The Independent Board Members were also assisted by the advice of independent legal counsel in making this determination.
| | |
DISCLOSURE OF INVESTMENT ADVISORY AGREEMENT | | 79 |
Director and Officer Information
| | | | | | | | |
| Independent Directors(a) |
| | | | | |
Name Year of Birth(b) | | Position(s) Held (Length of Service)(c) | | Principal Occupation(s) During Past Five Years | | Number of BlackRock-Advised Registered Investment Companies (“RICs”) Consisting of Investment Portfolios (“Portfolios”) Overseen | | Public Company and Other
Investment
Company
Directorships Held
During Past Five Years |
| | | | |
Mark Stalnecker 1951 | | Chair of the Board and Director (Since 2019) | | Chief Investment Officer, University of Delaware from 1999 to 2013; Trustee and Chair of the Finance and Investment Committees, Winterthur Museum and Country Estate from 2005 to 2016; Member of the Investment Committee, Delaware Public Employees’ Retirement System since 2002; Member of the Investment Committee, Christiana Care Health System from 2009 to 2017; Member of the Investment Committee, Delaware Community Foundation from 2013 to 2014; Director and Chair of the Audit Committee, SEI Private Trust Co. from 2001 to 2014. | | 33 RICs consisting of 156 Portfolios | | None |
| | | | |
Bruce R. Bond 1946 | | Director (Since 2007) | | Board Member, Amsphere Limited (software) since 2018; Trustee and Member of the Governance Committee, State Street Research Mutual Funds from 1997 to 2005; Board Member of Governance, Audit and Finance Committee, Avaya Inc. (computer equipment) from 2003 to 2007. | | 33 RICs consisting of 156 Portfolios | | None |
| | | | |
Susan J. Carter 1956 | | Director (Since 2019) | | Director, Pacific Pension Institute from 2014 to 2018; Advisory Board Member, Center for Private Equity and Entrepreneurship at Tuck School of Business since 1997; Senior Advisor, Commonfund Capital, Inc. (“CCI”) (investment adviser) in 2015; Chief Executive Officer, CCI from 2013 to 2014; President & Chief Executive Officer, CCI from 1997 to 2013; Advisory Board Member, Girls Who Invest from 2015 to 2018 and Board Member thereof since 2018; Advisory Board Member, Bridges Fund Management since 2016; Trustee, Financial Accounting Foundation since 2017; Practitioner Advisory Board Member, Private Capital Research Institute (“PCRI”) since 2017; Lecturer in the Practice of Management, Yale School of Management since 2019. | | 33 RICs consisting of 156 Portfolios | | None |
| | | | |
Collette Chilton 1958 | | Director (Since 2019) | | Chief Investment Officer, Williams College since 2006; Chief Investment Officer, Lucent Asset Management Corporation from 1998 to 2006. | | 33 RICs consisting of 156 Portfolios | | None |
| | | | |
Neil A. Cotty 1954 | | Director (Since 2019) | | Bank of America Corporation from 1996 to 2015, serving in various senior finance leadership roles, including Chief Accounting Officer from 2009 to 2015, Chief Financial Officer of Global Banking, Markets and Wealth Management from 2008 to 2009, Chief Accounting Officer from 2004 to 2008, Chief Financial Officer of Consumer Bank from 2003 to 2004, Chief Financial Officer of Global Corporate Investment Bank from 1999 to 2002. | | 33 RICs consisting of 156 Portfolios | | None |
| | | | |
Lena G. Goldberg 1949 | | Director (Since 2016) | | Senior Lecturer, Harvard Business School, since 2008; Director, Charles Stark Draper Laboratory, Inc. since 2013; FMR LLC/Fidelity Investments (financial services) from 1996 to 2008, serving in various senior roles including Executive Vice President - Strategic Corporate Initiatives and Executive Vice President and General Counsel; Partner, Sullivan & Worcester LLP from 1985 to 1996 and Associate thereof from 1979 to 1985. | | 33 RICs consisting of 156 Portfolios | | None |
| | |
| 80 | | 2020 BLACKROCK ANNUAL REPORTTO SHAREHOLDERS |
Director and Officer Information (continued)
| | | | | | | | |
| Independent Directors(a) (continued) |
| | | | | |
Name Year of Birth(b) | | Position(s) Held (Length of Service)(c) | | Principal Occupation(s) During Past Five Years | | Number of BlackRock-Advised Registered Investment Companies (“RICs”) Consisting of Investment Portfolios (“Portfolios”) Overseen | | Public Company and Other
Investment
Company
Directorships Held During Past Five Years |
| | | | |
Henry R. Keizer 1956 | | Director (Since 2016) | | Director, Park Indemnity Ltd. (captive insurer) since 2010; Director, MUFG Americas Holdings Corporation and MUFG Union Bank, N.A. (financial and bank holding company) from 2014 to 2016; Director, American Institute of Certified Public Accountants from 2009 to 2011; Director, KPMG LLP (audit, tax and advisory services) from 2004 to 2005 and 2010 to 2012; Director, KPMG International in 2012, Deputy Chairman and Chief Operating Officer thereof from 2010 to 2012 and U.S. Vice Chairman of Audit thereof from 2005 to 2010; Global Head of Audit, KPMGI (consortium of KPMG firms) from 2006 to 2010; Director, YMCA of Greater New York from 2006 to 2010. | | 33 RICs consisting of 156 Portfolios | | Hertz Global Holdings (car rental); Montpelier Re Holdings, Ltd. (publicly held property and casualty reinsurance) from 2013 until 2015; WABCO (commercial vehicle safety systems); Sealed Air Corp. (packaging) |
| | | | |
Cynthia A. Montgomery 1952 | | Director (Since 2019) | | Professor, Harvard Business School since 1989. | | 33 RICs consisting of 156 Portfolios | | Newell Rubbermaid, Inc. (manufacturing) |
| | | | |
Donald C. Opatrny 1952 | | Director (Since 2015) | | Trustee, Vice Chair, Member of the Executive Committee and Chair of the Investment Committee, Cornell University since 2004; President, Trustee and Member of the Investment Committee, The Aldrich Contemporary Art Museum from 2007 to 2014; Member of the Board and Investment Committee, University School from 2007 to 2018; Member of the Investment Committee, Mellon Foundation from 2009 to 2015; Trustee, Artstor (a Mellon Foundation affiliate) from 2010 to 2015; President and Trustee, the Center for the Arts, Jackson Hole from 2011 to 2018; Director, Athena Capital Advisors LLC (investment management firm) since 2013; Trustee and Chair of the Investment Committee, Community Foundation of Jackson Hole since 2014; Member of Affordable Housing Supply Board of Jackson, Wyoming since 2018; Member, Investment Funds Committee, State of Wyoming since 2017; Trustee, Phoenix Art Museum since 2018; Trustee, Arizona Community Foundation and Member of Investment Committee since 2020. | | 33 RICs consisting of 156 Portfolios | | None |
| | | | |
Joseph P. Platt 1947 | | Director (Since 2019) | | General Partner, Thorn Partners, LP (private investments) since 1998; Director, WQED Multi-Media (public broadcasting not-for-profit) since 2001; Chair, Basic Health International (non-profit) since 2015. | | 33 RICs consisting of 156 Portfolios | | Greenlight Capital Re, Ltd. (reinsurance company); Consol Energy Inc. |
| | | | |
Kenneth L. Urish 1951 | | Director (Since 2019) | | Managing Partner, Urish Popeck & Co., LLC (certified public accountants and consultants) since 1976; Past- Chairman of the Professional Ethics Committee of the Pennsylvania Institute of Certified Public Accountants and Committee Member thereof since 2007; Member of External Advisory Board, The Pennsylvania State University Accounting Department since founding in 2001; Principal, UP Strategic Wealth Investment Advisors, LLC since 2013; Trustee, The Holy Family Institute from 2001 to 2010; President and Trustee, Pittsburgh Catholic Publishing Associates from 2003 to 2008; Director, Inter-Tel from 2006 to 2007. | | 33 RICs consisting of 156 Portfolios | | None |
| | |
DIRECTORAND OFFICER INFORMATION | | 81 |
Director and Officer Information (continued)
| | | | | | | | |
| Independent Directors(a) (continued) |
| | | | | |
Name Year of Birth(b) | | Position(s) Held (Length of Service)(c) | | Principal Occupation(s) During Past Five Years | | Number of BlackRock-Advised Registered Investment Companies (“RICs”) Consisting of Investment Portfolios (“Portfolios”) Overseen | | Public Company and Other
Investment
Company
Directorships Held
During Past Five Years |
| | | | |
Claire A. Walton 1957 | | Director (Since 2019) | | Chief Operating Officer and Chief Financial Officer of Liberty Square Asset Management, LP from 1998 to 2015; General Partner of Neon Liberty Capital Management, LLC since 2003; Director, Boston Hedge Fund Group from 2009 to 2018; Director, Woodstock Ski Runners since 2013; Director, Massachusetts Council on Economic Education from 2013 to 2015. | | 33 RICs consisting of 156 Portfolios | | None |
|
| Interested Directors(a)(d) |
| | | | | |
Name Year of Birth(b) | | Position(s) Held (Length of Service)(c) | | Principal Occupation(s) During Past Five Years | | Number of BlackRock-Advised Registered Investment Companies (“RICs”) Consisting of Investment Portfolios (“Portfolios”) Overseen | | Public Company and Other
Investment
Company
Directorships Held
During Past Five Years |
| | | | |
Robert Fairbairn 1965 | | Director (Since 2015) | | Vice Chairman of BlackRock, Inc. since 2019; Member of BlackRock’s Global Executive and Global Operating Committees; Co-Chair of BlackRock’s Human Capital Committee; Senior Managing Director of BlackRock, Inc. from 2010 to 2019; oversaw BlackRock’s Strategic Partner Program and Strategic Product Management Group from 2012 to 2019; Member of the Board of Managers of BlackRock Investments, LLC from 2011 to 2018; Global Head of BlackRock’s Retail and iShares® businesses from 2012 to 2016. | | 119 RICs consisting of 266 Portfolios | | None |
| | | | |
John M. Perlowski(e) 1964 | | Director (Since 2015); President and Chief Executive Officer (Since 2010) | | Managing Director of BlackRock, Inc. since 2009; Head of BlackRock Global Accounting and Product Services since 2009; Advisory Director of Family Resource Network (charitable foundation) since 2009. | | 120 RICs consisting of 267 Portfolios | | None |
| (a) | The address of each Director is c/o BlackRock, Inc., 55 East 52nd Street, New York, New York 10055. |
| (b) | Each Independent Director holds office until his or her successor is duly elected and qualifies or until his or her earlier death, resignation, retirement or removal as provided by the Fund’s by-laws or charter or statute, or until December 31 of the year in which he or she turns 75. Directors who are “interested persons,” as defined in the 1940 Act, serve until their successor is duly elected and qualifies or until their earlier death, resignation, retirement or removal as provided by the Fund’s by-laws or statute, or until December 31 of the year in which they turn 72. The Board may determine to extend the terms of Independent Directors on a case-by-case basis, as appropriate. |
| (c) | Following the combination of Merrill Lynch Investment Managers, L.P. (“MLIM”) and BlackRock, Inc. in September 2006, the various legacy MLIM and legacy BlackRock fund boards were realigned and consolidated into three new fund boards in 2007. In addition, effective January 1, 2019, three BlackRock Fund Complexes were realigned and consolidated into two BlackRock Fund Complexes. As a result, although the chart shows the year that each Independent Director joined the Board, certain Independent Directors first became members of the boards of other BlackRock-advised Funds, legacy MLIM funds or legacy BlackRock funds as follows: Bruce R. Bond, 2005; Susan J. Carter, 2016; Collette Chilton, 2015; Neil A. Cotty, 2016; Cynthia A. Montgomery, 1994; Joseph P. Platt, 1999; Mark Stalnecker, 2015; Kenneth L. Urish, 1999; Claire A. Walton, 2016. |
| (d) | Mr. Fairbairn and Mr. Perlowski are both “interested persons,” as defined in the 1940 Act, of the Fund based on their positions with BlackRock, Inc. and its affiliates. Mr. Fairbairn and Mr. Perlowski are also board members of the BlackRock Fixed-Income Complex. |
| (e) | Mr. Perlowski is also a trustee of the BlackRock Credit Strategies Fund. |
| | |
| 82 | | 2020 BLACKROCK ANNUAL REPORTTO SHAREHOLDERS |
Director and Officer Information (continued)
| | | | |
| Officers Who Are Not Directors(a) |
| | | |
Name Year of Birth(b) | | Position(s) Held (Length of Service) | | Principal Occupation(s) During Past Five Years |
| | |
Jennifer McGovern 1977 | | Vice President (Since 2014) | | Managing Director of BlackRock, Inc. since 2016; Director of BlackRock, Inc. from 2011 to 2015; Head of Americas Product Development and Governance for BlackRock’s Global Product Group since 2019; Head of Product Structure and Oversight for BlackRock’s U.S. Wealth Advisory Group from 2013 to 2019. |
| | |
Neal J. Andrews 1966 | | Chief Financial Officer (Since 2007) | | Chief Financial Officer of the iShares® exchange traded funds from 2019 to 2020; Managing Director of BlackRock, Inc. since 2006. |
| | |
Jay M. Fife 1970 | | Treasurer (Since 2007) | | Managing Director of BlackRock, Inc. since 2007. |
| | |
Charles Park 1967 | | Chief Compliance Officer (Since 2014) | | Anti-Money Laundering Compliance Officer for certain BlackRock-advised Funds from 2014 to 2015; Chief Compliance Officer of BlackRock Advisors, LLC and the BlackRock-advised Funds in the BlackRock Multi-Asset Complex and the BlackRock Fixed-Income Complex since 2014; Principal of and Chief Compliance Officer for iShares® Delaware Trust Sponsor LLC since 2012 and BlackRock Fund Advisors (“BFA”) since 2006; Chief Compliance Officer for the BFA-advised iShares® exchange traded funds since 2006; Chief Compliance Officer for BlackRock Asset Management International Inc. since 2012. |
| | |
Lisa Belle 1968 | | Anti-Money Laundering Compliance Officer (Since 2019) | | Managing Director of BlackRock, Inc. since 2019; Global Financial Crime Head for Asset and Wealth Management of JP Morgan from 2013 to 2019; Managing Director of RBS Securities from 2012 to 2013; Head of Financial Crimes for Barclays Wealth Americas from 2010 to 2012. |
| | |
Janey Ahn 1975 | | Secretary (Since 2019) | | Managing Director of BlackRock, Inc. since 2018; Director of BlackRock, Inc. from 2009 to 2017. |
| (a) | The address of each Officer is c/o BlackRock, Inc., 55 East 52nd Street, New York, New York 10055. |
| (b) | Officers of the Fund serve at the pleasure of the Board. |
Further information about the Fund’s Directors and Officers is available in the Fund’s Statement of Additional Information, which can be obtained without charge by calling (800) 441-7762.
| | |
DIRECTORAND OFFICER INFORMATION | | 83 |
Additional Information
General Information
Householding
The Fund will mail only one copy of shareholder documents, including prospectuses, annual and semi-annual reports and proxy statements, to shareholders with multiple accounts at the same address. This practice is commonly called “householding” and is intended to reduce expenses and eliminate duplicate mailings of shareholder documents. Mailings of your shareholder documents may be householded indefinitely unless you instruct us otherwise. If you do not want the mailing of these documents to be combined with those for other members of your household, please call the Fund at (800) 441-7762.
Availability of Quarterly Schedule of Investments
The Fund files its complete schedule of portfolio holdings with the SEC for the first and third quarters of each fiscal year as an exhibit to its reports on Form N-PORT. The Fund’s Form N-PORT is available on the SEC’s website at sec.gov.
Availability of Proxy Voting Policies and Procedures
A description of the policies and procedures that the Fund uses to determine how to vote proxies relating to portfolio securities is available upon request and without charge (1) by calling (800) 441-7762; (2) at blackrock.com; and (3) on the SEC’s website at sec.gov.
Availability of Proxy Voting Record
Information about how the Fund voted proxies relating to securities held in the Fund’s portfolio during the most recent 12-month period ended June 30 is available upon request and without charge (1) at blackrock.com; or by calling (800) 441-7762 and (2) on the SEC’s website at sec.gov.
BlackRock’s Mutual Fund Family
BlackRock offers a diverse lineup of open-end mutual funds crossing all investment styles and managed by experts in equity, fixed-income and tax-exempt investing. Visit blackrock.com for more information.
Shareholder Privileges
Account Information
Call us at (800) 441-7762 from 8:00 AM to 6:00 PM ET on any business day to get information about your account balances, recent transactions and share prices. You can also visit blackrock.com for more information.
Automatic Investment Plans
Investor class shareholders who want to invest regularly can arrange to have $50 or more automatically deducted from their checking or savings account and invested in any of the BlackRock funds.
Systematic Withdrawal Plans
Investor class shareholders can establish a systematic withdrawal plan and receive periodic payments of $50 or more from their BlackRock funds, as long as their account balance is at least $10,000.
Retirement Plans
Shareholders may make investments in conjunction with Traditional, Rollover, Roth, Coverdell, Simple IRAs, SEP IRAs and 403(b) Plans.
BlackRock Privacy Principles
BlackRock is committed to maintaining the privacy of its current and former fund investors and individual clients (collectively, “Clients”) and to safeguarding their non-public personal information. The following information is provided to help you understand what personal information BlackRock collects, how we protect that information and why in certain cases we share such information with select parties.
If you are located in a jurisdiction where specific laws, rules or regulations require BlackRock to provide you with additional or different privacy-related rights beyond what is set forth below, then BlackRock will comply with those specific laws, rules or regulations.
BlackRock obtains or verifies personal non-public information from and about you from different sources, including the following: (i) information we receive from you or, if applicable, your financial intermediary, on applications, forms or other documents; (ii) information about your transactions with us, our affiliates, or others; (iii) information we receive from a consumer reporting agency; and (iv) from visits to our websites.
| | |
| 84 | | 2020 BLACKROCK ANNUAL REPORTTO SHAREHOLDERS |
Additional Information (continued)
BlackRock does not sell or disclose to non-affiliated third parties any non-public personal information about its Clients, except as permitted by law or as is necessary to respond to regulatory requests or to service Client accounts. These non-affiliated third parties are required to protect the confidentiality and security of this information and to use it only for its intended purpose.
We may share information with our affiliates to service your account or to provide you with information about other BlackRock products or services that may be of interest to you. In addition, BlackRock restricts access to non-public personal information about its Clients to those BlackRock employees with a legitimate business need for the information. BlackRock maintains physical, electronic and procedural safeguards that are designed to protect the non-public personal information of its Clients, including procedures relating to the proper storage and disposal of such information.
Fund and Service Providers
| | |
Investment Adviser | | Distributor |
BlackRock Advisors, LLC | | BlackRock Investments, LLC |
Wilmington, DE 19809 | | New York, NY 10022 |
| |
Accounting Agent | | Independent Registered Public Accounting Firm |
State Street Bank and Trust Company | | Deloitte & Touche LLP |
Boston, MA 02111 | | Boston, MA 02116 |
| |
Custodian | | Legal Counsel |
Brown Brothers Harriman & Co. | | Sidley Austin LLP |
Boston, MA 02109 | | New York, NY 10019 |
| |
Transfer Agent | | Address of the Fund |
BNY Mellon Investment Servicing (US) Inc. | | 100 Bellevue Parkway |
Wilmington, DE 19809 | | Wilmington, DE 19809 |
| | |
ADDITIONAL INFORMATION | | 85 |
Glossary of Terms Used in this Report
Currency Abbreviation
| | |
| |
| AUD | | Australian Dollar |
| |
| BRL | | Brazilian Real |
| |
| CAD | | Canadian Dollar |
| |
| CHF | | Swiss Franc |
| |
| CNH | | Chinese Yuan |
| |
| CNY | | Chinese Yuan |
| |
| EUR | | Euro |
| |
| GBP | | British Pound |
| |
| HKD | | Hong Kong Dollar |
| |
| INR | | Indian Rupee |
| |
| JPY | | Japanese Yen |
| |
| KRW | | South Korean Won |
| |
| MXN | | Mexican Peso |
| |
| MYR | | Malaysian Ringgit |
| |
| NOK | | Norwegian Krone |
| |
| RUB | | New Russian Ruble |
| |
| SGD | | Singapore Dollar |
| |
| USD | | United States Dollar |
| |
| ZAR | | South African Rand |
Portfolio Abbreviation
| | |
| |
| ADR | | American Depositary Receipt |
| |
| CD | | Certificate of Deposit |
| |
| CLO | | Collateralized Loan Obligation |
| |
| CMT | | Constant Maturity Treasury |
| |
| CR | | Custodian Receipt |
| |
| DAC | | Designated Activity Company |
| |
| ETF | | Exchange-Traded Fund |
| |
| EURIBOR | | Euro Interbank Offered Rate |
| |
| GMTN | | Global Medium-Term Note |
| |
| LIBOR | | London Interbank Offered Rate |
| |
| LP | | Limited Partnership |
| |
| MSCI | | Morgan Stanley Capital International |
| |
| MTN | | Medium-Term Note |
| |
| PCL | | Public Company Limited |
| |
| PIK | | Payment-in-Kind |
| |
| RB | | Revenue Bond |
| |
| REIT | | Real Estate Investment Trust |
| |
| S&P | | Standard & Poor’s |
| |
| SAB | | Special Assessment Bonds |
| |
| SCA | | Svenska Celluosa Aktiebolaget |
| |
| SPDR | | Standard & Poor’s Depository Receipt |
| | |
| 86 | | 2020 BLACKROCK ANNUAL REPORTTO SHAREHOLDERS |
Want to know more?
blackrock.com | 800-441-7762
This report is intended for current holders. It is not authorized for use as an offer of sale or a solicitation of an offer to buy shares of the Fund unless preceded or accompanied by the Fund’s current prospectus. Past performance results shown in this report should not be considered a representation of future performance. Investment returns and principal value of shares will fluctuate so that shares, when redeemed, may be worth more or less than their original cost. Statements and other information herein are as dated and are subject to change.
GA-10/20-AR
| Item 2 – | Code of Ethics – The registrant (or the “Fund”) has adopted a code of ethics, as of the end of the period covered by this report, applicable to the registrant’s principal executive officer, principal financial officer, principal accounting officer or controller, or persons performing similar functions. During the period covered by this report, the code of ethics was amended to update certain information and to make other non-material changes. During the period covered by this report, there have been no waivers granted under the code of ethics. The registrant undertakes to provide a copy of the code of ethics to any person upon request, without charge, who calls 1-800-441-7762. |
| Item 3 – | Audit Committee Financial Expert – The registrant’s board of directors (the “board of directors”), has determined that (i) the registrant has the following audit committee financial experts serving on its audit committee and (ii) each audit committee financial expert is independent: |
Neil A. Cotty
Henry R. Keizer
Kenneth L. Urish
Under applicable securities laws, a person determined to be an audit committee financial expert will not be deemed an “expert” for any purpose, including without limitation for the purposes of Section 11 of the Securities Act of 1933, as a result of being designated or identified as an audit committee financial expert. The designation or identification of a person as an audit committee financial expert does not impose on such person any duties, obligations, or liabilities greater than the duties, obligations, and liabilities imposed on such person as a member of the audit committee and board of directors in the absence of such designation or identification. The designation or identification of a person as an audit committee financial expert does not affect the duties, obligations, or liability of any other member of the audit committee or board of directors.
| Item 4 – | Principal Accountant Fees and Services |
The following table presents fees billed by Deloitte & Touche LLP (“D&T”) in each of the last two fiscal years for the services rendered to the Fund:
| | | | | | | | | | | | | | | | |
| | | (a) Audit Fees | | (b) Audit-Related Fees1 | | (c) Tax Fees2 | | (d) All Other Fees |
| Entity Name | | Current Fiscal Year
End | | Previous
Fiscal Year
End | | Current
Fiscal Year
End | | Previous
Fiscal Year
End | | Current
Fiscal Year End | | Previous
Fiscal Year
End | | Current Fiscal Year
End | | Previous
Fiscal Year
End |
| BlackRock Global Allocation Fund, Inc. | | $97,002 | | $97,002 | | $0 | | $0 | | $26,300 | | $24,800 | | $0 | | $0 |
The following table presents fees billed by D&T that were required to be approved by the registrant’s audit committee (the “Committee”) for services that relate directly to the operations or financial reporting of the Fund and that are rendered on behalf of BlackRock Advisors, LLC (the “Investment Adviser” or “BlackRock”) and entities controlling, controlled by, or under common control with BlackRock (not including any sub-adviser whose role is primarily portfolio management and is subcontracted with or overseen by another investment adviser) that provide ongoing services to the Fund (“Affiliated Service Providers”):
2
| | | | |
| | | Current Fiscal Year End | | Previous Fiscal Year End |
| (b) Audit-Related Fees1 | | $0 | | $0 |
| (c) Tax Fees2 | | $0 | | $0 |
| (d) All Other Fees3 | | $1,984,000 | | $2,050,500 |
1 The nature of the services includes assurance and related services reasonably related to the performance of the audit or review of financial statements not included in Audit Fees, including accounting consultations, agreed-upon procedure reports, attestation reports, comfort letters, out-of-pocket expenses and internal control reviews not required by regulators.
2 The nature of the services includes tax compliance and/or tax preparation, including services relating to the filing or amendment of federal, state or local income tax returns, regulated investment company qualification reviews, taxable income and tax distribution calculations.
3 Non-audit fees of $1,984,000 and $2,050,500 for the current fiscal year and previous fiscal year, respectively, were paid to the Fund’s principal accountant in their entirety by BlackRock, in connection with services provided to the Affiliated Service Providers of the Fund and of certain other funds sponsored and advised by BlackRock or its affiliates for a service organization review and an accounting research tool subscription. These amounts represent aggregate fees paid by BlackRock and were not allocated on a per fund basis.
(e)(1) Audit Committee Pre-Approval Policies and Procedures:
The Committee has adopted policies and procedures with regard to the pre-approval of services. Audit, audit-related and tax compliance services provided to the registrant on an annual basis require specific pre-approval by the Committee. The Committee also must approve other non-audit services provided to the registrant and those non-audit services provided to the Investment Adviser and Affiliated Service Providers that relate directly to the operations and the financial reporting of the registrant. Certain of these non-audit services that the Committee believes are (a) consistent with the SEC’s auditor independence rules and (b) routine and recurring services that will not impair the independence of the independent accountants may be approved by the Committee without consideration on a specific case-by-case basis (“general pre-approval”). The term of any general pre-approval is 12 months from the date of the pre-approval, unless the Committee provides for a different period. Tax or other non-audit services provided to the registrant which have a direct impact on the operations or financial reporting of the registrant will only be deemed pre-approved provided that any individual project does not exceed $10,000 attributable to the registrant or $50,000 per project. For this purpose, multiple projects will be aggregated to determine if they exceed the previously mentioned cost levels.
Any proposed services exceeding the pre-approved cost levels will require specific pre-approval by the Committee, as will any other services not subject to general pre-approval (e.g., unanticipated but permissible services). The Committee is informed of each service approved subject to general pre-approval at the next regularly scheduled in-person board meeting. At this meeting, an analysis of such services is presented to the Committee for ratification. The Committee may delegate to the Committee Chairman the authority to approve the provision of and fees for any specific engagement of permitted non-audit services, including services exceeding pre-approved cost levels.
(e)(2) None of the services described in each of Items 4(b) through (d) were approved by the Committee pursuant to the de minimis exception in paragraph (c)(7)(i)(C) of Rule 2-01 of Regulation S-X.
(f) Not Applicable
(g) The aggregate non-audit fees, defined as the sum of the fees shown under “Audit-Related Fees,” “Tax Fees” and “All Other Fees,” paid to the accountant for services rendered by the accountant to the registrant, the Investment Adviser and the Affiliated Service Providers were:
3
| | | | | | | | | | | | | | |
| | | | Entity Name | | Current Fiscal Year
End | | Previous Fiscal Year
End | | | | | | |
| | | | BlackRock Global Allocation Fund, Inc. | | $26,300 | | $24,800 | | | | | | |
Additionally, the amounts billed by D&T in connection with services provided to the Affiliated Service Providers of the Fund and of other funds sponsored and advised by BlackRock or its affiliates during the current and previous fiscal years for a service organization review and an accounting research tool subscription were:
| | |
Current Fiscal Year
End | | Previous Fiscal Year
End |
$1,984,000 | | $2,050,500 |
These amounts represent aggregate fees paid by BlackRock and were not allocated on a per fund basis.
(h) The Committee has considered and determined that the provision of non-audit services that were rendered to the Investment Adviser and the Affiliated Service Providers that were not pre-approved pursuant to paragraph (c)(7)(ii) of Rule 2-01 of Regulation S-X is compatible with maintaining the principal accountant’s independence.
| Item 5 – | Audit Committee of Listed Registrant – Not Applicable |
(a) The registrant’s Schedule of Investments is included as part of the Report to Stockholders filed under Item 1 of this Form.
(b) Not Applicable due to no such divestments during the semi-annual period covered since the previous Form N-CSR filing.
| Item 7 – | Disclosure of Proxy Voting Policies and Procedures for Closed-End Management Investment Companies – Not Applicable |
| Item 8 – | Portfolio Managers of Closed-End Management Investment Companies – Not Applicable |
| Item 9 – | Purchases of Equity Securities by Closed-End Management Investment Company and Affiliated Purchasers – Not Applicable |
| Item 10 – | Submission of Matters to a Vote of Security Holders – There have been no material changes to these procedures. |
| Item 11 – | Controls and Procedures |
(a) The registrant’s principal executive and principal financial officers, or persons performing similar functions, have concluded that the registrant’s disclosure controls and procedures (as defined in Rule 30a-3(c) under the Investment Company Act of 1940, as amended (the “1940 Act”)) are
4
effective as of a date within 90 days of the filing of this report based on the evaluation of these controls and procedures required by Rule 30a-3(b) under the 1940 Act and Rule 15d-15(b) under the Securities Exchange Act of 1934, as amended.
(b) There were no changes in the registrant’s internal control over financial reporting (as defined in Rule 30a-3(d) under the 1940 Act) that occurred during the period covered by this report that have materially affected, or are reasonably likely to materially affect, the registrant’s internal control over financial reporting.
| Item 12 – | Disclosure of Securities Lending Activities for Closed-End Management Investment Companies – Not Applicable |
| Item 13 – | Exhibits attached hereto |
(a)(1) Code of Ethics – See Item 2
(a)(2) Section 302 Certifications are attached
(a)(3) Not Applicable
(a)(4) Not Applicable
(b) Section 906 Certifications are attached
5
Pursuant to the requirements of the Securities Exchange Act of 1934 and the Investment Company Act of 1940, the registrant has duly caused this report to be signed on its behalf by the undersigned, thereunto duly authorized.
BlackRock Global Allocation Fund, Inc.
| | | | |
| | By: | | /s/ John M. Perlowski |
| | | | John M. Perlowski |
| | | | Chief Executive Officer (principal executive officer) of |
| | | | BlackRock Global Allocation Fund, Inc. |
Date: December 31, 2020
Pursuant to the requirements of the Securities Exchange Act of 1934 and the Investment Company Act of 1940, this report has been signed below by the following persons on behalf of the registrant and in the capacities and on the dates indicated.
| | | | |
| | By: | | /s/ John M. Perlowski |
| | | | John M. Perlowski |
| | | | Chief Executive Officer (principal executive officer) of |
| | | | BlackRock Global Allocation Fund, Inc. |
Date: December 31, 2020
| | | | |
| | By: | | /s/ Neal J. Andrews |
| | | | Neal J. Andrews |
| | | | Chief Financial Officer (principal financial officer) of |
| | | | BlackRock Global Allocation Fund, Inc. |
Date: December 31, 2020
6