UNITED STATES
SECURITIES AND EXCHANGE COMMISSION
Washington, D.C. 20549
FORM N-CSR
CERTIFIED SHAREHOLDER REPORT OF REGISTERED MANAGEMENT
INVESTMENT COMPANIES
Investment Company Act file number: 811-05576
| Name of Fund: | | BlackRock Global Allocation Fund, Inc. |
| Fund Address: | | 100 Bellevue Parkway, Wilmington, DE 19809 |
Name and address of agent for service: John M. Perlowski, Chief Executive Officer, BlackRock Global Allocation Fund, Inc., 50 Hudson Yards, New York, NY 10001
Registrant’s telephone number, including area code: (800) 441-7762
Date of fiscal year end: 04/30/2023
Date of reporting period: 04/30/2023
Item 1 – Report to Stockholders
(a) The Report to Shareholders is attached herewith.
| | |

| | APRIL 30, 2023 |
BlackRock Global Allocation Fund, Inc.
|
| Not FDIC Insured • May Lose Value • No Bank Guarantee |
The Markets in Review
Dear Shareholder,
Investors faced an uncertain economic landscape during the 12-month reporting period ended April 30, 2023, amid mixed indicators and rapidly changing market conditions. The U.S. economy returned to modest growth beginning in the third quarter of 2022, although the pace of growth slowed thereafter. Inflation was elevated, reaching a 40-year high as labor costs grew rapidly and unemployment rates reached the lowest levels in decades. However, inflation moderated as the period continued, while continued strength in consumer spending backstopped the economy.
Equity returns varied substantially, as large-capitalization U.S. stocks gained for the period amid a rebound in big tech stocks, whereas small-capitalization U.S. stocks declined. International equities from developed markets advanced strongly, while emerging market stocks declined, pressured by higher interest rates and volatile commodities prices.
The 10-year U.S. Treasury yield rose during the reporting period, driving its price down, as investors reacted to elevated inflation and attempted to anticipate future interest rate changes. The corporate bond market also faced inflationary headwinds, although high-yield corporate bonds posted a positive return as demand from yield-seeking investors remained strong.
The U.S. Federal Reserve (the “Fed”), acknowledging that inflation has been more persistent than expected, raised interest rates eight times. Furthermore, the Fed wound down its bond-buying programs and incrementally reduced its balance sheet by not replacing securities that reach maturity. In addition, the Fed added liquidity to markets amid the failure of prominent regional banks.
Restricted labor supply kept inflation elevated even as other inflation drivers, such as goods prices and energy costs, moderated. While economic growth was modest in the last year, we believe that stickiness in services inflation and continued wage growth will keep inflation above central bank targets for some time. Although the Fed has decelerated the pace of interest rate hikes and indicated a pause could be its next step, we believe that the Fed still seems determined to get inflation back to target. With this in mind, we believe the possibility of a U.S. recession in the near term is high, but the dimming economic outlook has not yet been fully reflected in current market prices. We believe investors should expect a period of higher volatility as markets adjust to the new economic reality and policymakers attempt to adapt to rapidly changing conditions. Turmoil in the banking sector late in the period highlighted the potential for the rapid increase in interest rates to disrupt markets with little warning.
While we favor an overweight to equities in the long term, we prefer an underweight stance on equities overall in the near term. Expectations for corporate earnings remain elevated, which seems inconsistent with the possibility of a recession. Nevertheless, we are overweight on emerging market stocks as we believe a weakening U.S. dollar could provide a supportive backdrop. We also see selective, long-term opportunities in credit, where we believe that valuations are appealing, and higher yields offer attractive income. However, we are neutral on credit in the near term, as we’re concerned about tightening credit and financial conditions. For fixed income investing with a six- to twelve-month horizon, we see the most significant opportunities in short-term U.S. Treasuries, global inflation-linked bonds, and emerging market bonds denominated in local currency.
Overall, our view is that investors need to think globally, position themselves to be prepared for a decarbonizing economy, and be nimble as market conditions change. We encourage you to talk with your financial advisor and visit blackrock.com for further insight about investing in today’s markets.
Sincerely,

Rob Kapito
President, BlackRock Advisors, LLC

Rob Kapito
President, BlackRock Advisors, LLC
| | | | |
Total Returns as of April 30, 2023 |
| | | |
| | | 6-Month | | 12-Month |
| | | |
U.S. large cap equities
(S&P 500® Index) | | 8.63% | | 2.66% |
| | | |
U.S. small cap equities
(Russell 2000® Index) | | (3.45) | | (3.65) |
| | | |
International equities
(MSCI Europe, Australasia, Far East Index) | | 24.19 | | 8.42 |
| | | |
Emerging market equities
(MSCI Emerging Markets Index) | | 16.36 | | (6.51) |
| | | |
3-month Treasury bills
(ICE BofA 3-Month U.S. Treasury Bill Index) | | 2.09 | | 2.83 |
| | | |
U.S. Treasury securities (ICE BofA 10-Year U.S. Treasury Index) | | 7.14 | | (1.68) |
| | | |
U.S. investment grade bonds
(Bloomberg U.S. Aggregate Bond Index) | | 6.91 | | (0.43) |
| | | |
Tax-exempt municipal bonds
(Bloomberg Municipal Bond Index) | | 7.65 | | 2.87 |
| | | |
U.S. high yield bonds
(Bloomberg U.S. Corporate High Yield 2% Issuer Capped Index) | | 6.21 | | 1.21 |
|
| Past performance is not an indication of future results. Index performance is shown for illustrative purposes only. You cannot invest directly in an index. |
| | |
| 2 | | THIS PAGE IS NOT PART OF YOUR FUND REPORT |
Table of Contents

| | |
| Fund Summary as of April 30, 2023 | | BlackRock Global Allocation Fund, Inc. |
Investment Objective
BlackRock Global Allocation Fund, Inc.’s (the “Fund”) investment objective is to provide high total investment return through a fully managed investment policy utilizing United States and foreign equity securities, debt and money market securities, the combination of which will be varied from time to time both with respect to types of securities and markets in response to changing market and economic trends. Total return means the combination of capital growth and investment income.
Portfolio Management Commentary
How did the Fund perform?
For the 12-month period ended April 30, 2023, all of the Fund’s share classes underperformed its reference benchmark, which is comprised of the S&P 500® Index (36%), FTSE World (ex U.S.) Index (24%), ICE BofA Current 5-Year U.S. Treasury Index (24%) and FTSE Non-U.S. Dollar World Government Bond Index (16%) (the “Reference Benchmark”), and underperformed the broad-based all-equity benchmark, the FTSE World Index. The Fund invests in both equities and bonds; therefore, Fund management believes that the Reference Benchmark provides a more accurate representation of the Fund’s composition and a more comparable means for measurement. The following discussion of relative performance pertains to the Reference Benchmark. The following commentary (and referenced allocation percentages) are based on the economic exposures of the Fund, which reflect adjustments for futures, swaps, and options (except with respect to fixed income securities), and convertible bonds, and may vary relative to the market value.
What factors influenced performance?
From an equity sector perspective, security selection within information technology, industrials, materials and consumer staples weighed on performance. Within fixed income, exposure to interest rate derivatives to manage the Fund’s duration (and corresponding interest rate sensitivity) and positioning in corporate bonds detracted from performance.
From an equity sector perspective, security selection in healthcare was additive. An underweight to real estate also contributed to returns. Within fixed income, exposure to securitized assets added to returns. From a currency perspective, overweights to the U.S. dollar and Mexican peso contributed. Finally, the Fund’s exposure to cash and cash equivalents proved beneficial for the reporting period.
The Fund uses derivatives, which may include options, futures, swaps and forward contracts both to seek to enhance returns of the Fund and to hedge (or protect) against adverse movements in currency exchange rates, interest rates and movements in the securities markets. During the period, the Fund’s use of derivatives detracted from the Fund’s performance.
Describe recent portfolio activity.
During the reporting period, the Fund’s overall equity allocation remained unchanged at 56% of net assets. On a sector basis, the Fund increased exposure to financials, consumer staples, information technology and healthcare, and reduced exposure to materials, energy and consumer discretionary.
The Fund’s allocation to fixed income increased from 19% to 37% of net assets. Within fixed income, the Fund increased exposure to both U.S. and non-U.S. government bonds, as well as to securitized debt, most notably agency mortgage-backed securities, and to investment grade corporate bonds.
The Fund’s exposure to commodity-related securities remained unchanged at less than 1% of net assets.
Reflecting the changes in the Fund’s overall allocations to equity and fixed income during the reporting period, the Fund’s exposure to cash and cash equivalent holdings decreased from 25% to 5% of net assets. During the reporting period, cash helped manage portfolio volatility and served as a source of funds for new investments.
Describe portfolio positioning at period end.
Relative to its Reference Benchmark, the Fund ended the reporting period underweight equities and fixed income, with modest exposure to gold-related securities and an allocation to cash and cash equivalents. Within equities, the Fund was overweight select emerging markets and developed Europe, and underweight Japan and Australia. From a sector perspective, the Fund was overweight healthcare and energy, and underweight financials, consumer staples, real estate, materials and industrials. Within fixed income, the Fund was underweight U.S. Treasuries, developed European sovereign debt and Japanese government bonds. In addition, the Fund was overweight securitized debt, corporate bonds and bank loans. With respect to currency exposure, the Fund was overweight the Japanese yen and Swiss franc and underweight the U.S. dollar.
The views expressed reflect the opinions of BlackRock as of the date of this report and are subject to change based on changes in market, economic or other conditions. These views are not intended to be a forecast of future events and are no guarantee of future results.
| | |
| 4 | | 2 0 2 3 BLACK ROCK ANNUAL REPORT TO SHAREHOLDERS |
| | |
| Fund Summary as of April 30, 2023 (continued) | | BlackRock Global Allocation Fund, Inc. |
GROWTH OF $10,000 INVESTMENT
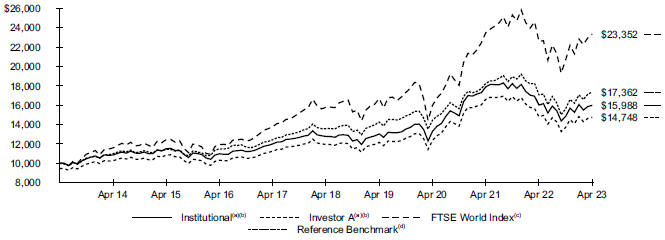
| | (a) | Assuming maximum sales charges, if any, transaction costs and other operating expenses including advisory fees. Institutional Shares do not have a sales charge. | |
| | (b) | The Fund invests in a portfolio of U.S. and foreign equity securities, debt and money market securities, the combination of which will be varied from time to time with respect to types of securities and markets in response to changing market and economic trends. | |
| | (c) | A market cap weighted index representing the performance of the large- and mid-cap stocks from the Developed and Advanced Emerging segments of the FTSE Global Equity Index Series and covers approximately 90-95% of the investable market capitalization. | |
| | (d) | The Reference Benchmark is an unmanaged weighted index comprised as follows: 36% S&P 500® Index; 24% FTSE World (ex U.S.) Index; 24% ICE BofA Current 5-Year U.S. Treasury Index; and 16% FTSE Non-U.S. Dollar World Government Bond Index. | |
Performance
| | | | | | | | | | | | | | | | | | | | | | | | |
| | | Average Annual Total Returns(a) | |
| | | | |
| | | |
| | | 1 Year | | | 5 Years | | | 10 Years | |
| | | | | | | | | | | | |
| | | | | | |
| | | Without Sales Charge | | | With Sales
Charge | | | Without Sales Charge | | | With Sales Charge | | | Without Sales Charge | | | With Sales Charge | |
| | | | | | |
Institutional | | | (0.12 | )% | | | N/A | | | | 4.58 | % | | | N/A | | | | 4.80 | % | | | N/A | |
Investor A | | | (0.39 | ) | | | (5.62 | )% | | | 4.31 | | | | 3.19 | % | | | 4.52 | | | | 3.96 | % |
Investor C | | | (1.12 | ) | | | (2.05 | ) | | | 3.52 | | | | 3.52 | | | | 3.90 | | | | 3.90 | |
Class K | | | (0.03 | ) | | | N/A | | | | 4.67 | | | | N/A | | | | 4.87 | | | | N/A | |
Class R | | | (0.75 | ) | | | N/A | | | | 3.94 | | | | N/A | | | | 4.17 | | | | N/A | |
| | | | | | |
FTSE World Index | | | 3.36 | | | | N/A | | | | 8.15 | | | | N/A | | | | 8.85 | | | | N/A | |
Reference Benchmark | | | 1.69 | | | | N/A | | | | 5.04 | | | | N/A | | | | 5.67 | | | | N/A | |
U.S. Stocks: S&P 500® Index(b) | | | 2.66 | | | | N/A | | | | 11.45 | | | | N/A | | | | 12.20 | | | | N/A | |
Non-U.S. Stocks: FTSE World (ex U.S.) Index(c) | | | 5.48 | | | | N/A | | | | 4.04 | | | | N/A | | | | 5.04 | | | | N/A | |
Non-U.S. Bonds: FTSE Non-U.S. Dollar World Government Bond Index(d) | | | (5.32 | ) | | | N/A | | | | (3.81 | ) | | | N/A | | | | (1.61 | ) | | | N/A | |
U.S. Bonds: ICE BofA Current 5-Year U.S. Treasury Index(e) | | | (0.06 | ) | | | N/A | | | | 1.16 | | | | N/A | | | | 0.64 | | | | N/A | |
| | (a) | Assuming maximum sales charges, if any. Average annual total returns with and without sales charges reflect reductions for distribution and service fees. See “About Fund Performance” for a detailed description of share classes, including any related sales charges and fees, and how performance was calculated for certain share classes. | |
| | (b) | An unmanaged index that covers 500 leading companies and captures approximately 80% coverage of available market capitalization. | |
| | (c) | An index comprised of large- and mid-cap stocks, providing coverage of developed and emerging markets excluding the United States. The index is derived from the FTSE Global Equity Index Series, which covers approximately 98% of the world’s investable market capitalization. | |
| | (d) | An unmanaged market capitalization-weighted index that tracks certain government bond indexes, excluding the United States. | |
| | (e) | An unmanaged index designed to track the total return of the current coupon 5-year U.S. Treasury bond. | |
N/A — Not applicable as the share class and index do not have a sales charge.
Past performance is not an indication of future results.
Performance results may include adjustments made for financial reporting purposes in accordance with U.S. generally accepted accounting principles.
| | |
| Fund Summary as of April 30, 2023 (continued) | | BlackRock Global Allocation Fund, Inc. |
Expense Example
| | | | | | | | | | | | | | | | | | | | | | | | | | | | | | | | | | | | | | | | | | | | | | | | |
| | | | | Actual | | | Hypothetical 5% Return | | | | | | | |
| | | | | | | | | | |
| | | | | | | | | | | Expenses Paid During the
Period | | | | | | Including Dividend
Expense and
Professional
Fees for
Foreign
Withholding
Tax Claims | | | Excluding Dividend
Expense and
Professional
Fees for
Foreign
Withholding
Tax Claims | | | Annualized Expense Ratio | | | | |
| | | | | | | | | | | | | | |
| | | |
| Beginning
Account Value (11/01/22) |
| |
| Ending
Account Value (04/30/23) |
| |
| Including
Dividend Expense and Professional Fees for Foreign Withholding Tax Claims |
(a) | |
| Excluding
Dividend Expense and Professional Fees for Foreign Withholding Tax Claims |
(a) | |
| Beginning
Account Value (11/01/22) |
| |
| Ending
Account Value (04/30/23) |
| |
| Expenses
Paid During the Period |
(a) | |
| Ending
Account Value (04/30/23) |
| |
| Expenses
Paid During the Period |
(a) | |
| Including
Dividend Expense and Professional Fees for Foreign Withholding Tax Claims |
| | Excluding Dividend Expense and Professional Fees for Foreign Withholding Tax Claims | | | | |
| | | | |
| | | | | | | | | | | | | | |
| | Institutional | | $ | 1,000.00 | | | $ | 1,077.40 | | | $ | 4.28 | | | $ | 4.22 | | | | $ 1,000.00 | | | | $ 1,020.68 | | | $ | 4.16 | | | $ | 1,020.73 | | | $ | 4.11 | | | | 0.83 | % | | 0.82% | | | | |
| | Investor A | | | 1,000.00 | | | | 1,075.60 | | | | 5.56 | | | | 5.51 | | | | 1,000.00 | | | | 1,019.44 | | | | 5.41 | | | | 1,019.49 | | | | 5.36 | | | | 1.08 | | | 1.07 | | | | |
| | Investor C | | | 1,000.00 | | | | 1,071.90 | | | | 9.56 | | | | 9.50 | | | | 1,000.00 | | | | 1,015.57 | | | | 9.30 | | | | 1,015.62 | | | | 9.25 | | | | 1.86 | | | 1.85 | | | | |
| | Class K | | | 1,000.00 | | | | 1,078.00 | | | | 3.81 | | | | 3.76 | | | | 1,000.00 | | | | 1,021.12 | | | | 3.71 | | | | 1,021.17 | | | | 3.66 | | | | 0.74 | | | 0.73 | | | | |
| | Class R | | | 1,000.00 | | | | 1,073.60 | | | | 7.46 | | | | 7.40 | | | | 1,000.00 | | | | 1,017.60 | | | | 7.25 | | | | 1,017.65 | | | | 7.20 | | | | 1.45 | | | 1.44 | | | | |
| | | | |
| | (a) | For each class of the Fund, expenses are equal to the annualized expense ratio for the class, multiplied by the average account value over the period, multiplied by 181/365 (to reflect the one-half year period shown). | |
See “Disclosure of Expenses” for further information on how expenses were calculated.
Portfolio Information
TEN LARGEST HOLDINGS (EQUITY INVESTMENTS)
| | | | |
| | |
| Security(a) | | Percent of Total Investments | |
| |
Microsoft Corp. | | | 2.5 | % |
Apple, Inc. | | | 1.7 | |
Alphabet, Inc. | | | 1.4 | |
Amazon.com, Inc. | | | 1.0 | |
UnitedHealth Group, Inc. | | | 0.9 | |
Nestle SA | | | 0.8 | |
Mastercard, Inc. | | | 0.8 | |
Marsh & McLennan Cos., Inc. | | | 0.7 | |
LVMH Moet Hennessy Louis Vuitton SE | | | 0.7 | |
ASML Holding NV | | | 0.6 | |
GEOGRAPHIC ALLOCATION
| | | | | | | | | | | | |
| | |
| |
| Percent of
Total Investments(b) |
|
| | | | |
| Country/Geographic Region | | Long | | | Short | | | Total | |
| | | |
United States | | | 62.1 | % | | | 0.8 | % | | | 62.9% | |
Spain | | | 3.9 | | | | — | (c) | | | 3.9 | |
United Kingdom | | | 3.8 | | | | — | (c) | | | 3.8 | |
France | | | 3.6 | | | | — | (c) | | | 3.6 | |
Germany | | | 3.1 | | | | 0.1 | | | | 3.2 | |
Netherlands | | | 2.9 | | | | — | (c) | | | 2.9 | |
Canada | | | 2.7 | | | | 0.1 | | | | 2.8 | |
Japan | | | 2.3 | | | | 0.2 | | | | 2.5 | |
Switzerland | | | 2.1 | | | | 0.1 | | | | 2.2 | |
China | | | 1.5 | | | | 0.1 | | | | 1.6 | |
Australia | | | 1.0 | | | | 0.1 | | | | 1.1 | |
Brazil | | | 1.0 | | | | 0.1 | | | | 1.1 | |
Mexico | | | 1.0 | | | | — | (c) | | | 1.0 | |
Other# | | | 7.2 | | | | 0.2 | | | | 7.4 | |
| | | |
| | | 98.2 | % | | | 1.8 | % | | | 100.0% | |
| (a) | Excludes short-term securities. |
| (b) | Total investments include the gross values of long and short equity securities of the underlying derivative contracts utilized by the Fund and exclude short-term securities. |
| (c) | Rounds to less than 0.1%. |
| # | Includes holdings within countries/geographic regions that are less than 1.0% of total investments. Please refer to the Consolidated Schedule of Investments for such countries/geographic regions. |
| | |
| 6 | | 2 0 2 3 BLACK ROCK ANNUAL REPORT TO SHAREHOLDERS |
| | |
| About Fund Performance | | BlackRock Global Allocation Fund, Inc. |
Institutional and Class K Shares are not subject to any sales charge. These shares bear no ongoing distribution or service fees and are available only to certain eligible investors. Class K Shares performance shown prior to the Class K Shares inception date of June 8, 2016 is that of Institutional Shares. The performance of the Fund’s Class K Shares would be substantially similar to Institutional Shares because Class K Shares and Institutional Shares invest in the same portfolio of securities and performance would only differ to the extent that Class K Shares and Institutional Shares have different expenses. The actual returns of Class K Shares would have been higher than those of the Institutional Shares because Class K Shares have lower expenses than the Institutional Shares.
Investor A Shares are subject to a maximum initial sales charge (front-end load) of 5.25% and a service fee of 0.25% per year (but no distribution fee). Certain redemptions of these shares may be subject to a contingent deferred sales charge (“CDSC”) where no initial sales charge was paid at the time of purchase. These shares are generally available through financial intermediaries.
Investor C Shares are subject to a 1.00% CDSC if redeemed within one year of purchase. In addition, these shares are subject to a distribution fee of 0.75% per year and a service fee of 0.25% per year. These shares are generally available through financial intermediaries. These shares automatically convert to Investor A Shares after approximately eight years.
Class R Shares are not subject to any sales charge. These shares are subject to a distribution fee of 0.25% per year and a service fee of 0.25% per year. These shares are available only to certain employer-sponsored retirement plans.
Past performance is not an indication of future results. Financial markets have experienced extreme volatility and trading in many instruments has been disrupted. These circumstances may continue for an extended period of time and may continue to affect adversely the value and liquidity of the Fund’s investments. As a result, current performance may be lower or higher than the performance data quoted. Refer to blackrock.com to obtain performance data current to the most recent month-end. Performance results do not reflect the deduction of taxes that a shareholder would pay on Fund distributions or the redemption of Fund shares. Figures shown in the performance table(s) assume reinvestment of all distributions, if any, at net asset value (“NAV”) on the ex-dividend date or payable date, as applicable. Investment return and principal value of shares will fluctuate so that shares, when redeemed, may be worth more or less than their original cost. Distributions paid to each class of shares will vary because of the different levels of service, distribution and transfer agency fees applicable to each class, which are deducted from the income available to be paid to shareholders.
BlackRock Advisors, LLC (the “Manager”), the Fund’s investment adviser, has contractually and/or voluntarily agreed to waive and/or reimburse a portion of the Fund’s expenses. Without such waiver(s) and/or reimbursement(s), the Fund’s performance would have been lower. With respect to the Fund’s voluntary waiver(s), if any, the Manager is under no obligation to waive and/or reimburse or to continue waiving and/or reimbursing its fees and such voluntary waiver(s) may be reduced or discontinued at any time. With respect to the Fund’s contractual waiver(s), if any, the Manager is under no obligation to continue waiving and/or reimbursing its fees after the applicable termination date of such agreement. See the Notes to Consolidated Financial Statements for additional information on waivers and/or reimbursements.
Disclosure of Expenses
Shareholders of the Fund may incur the following charges: (a) transactional expenses, such as sales charges; and (b) operating expenses, including investment advisory fees, service and distribution fees, including 12b-1 fees, acquired fund fees and expenses, and other fund expenses. The expense example shown (which is based on a hypothetical investment of $1,000 invested at the beginning of the period and held through the end of the period) is intended to assist shareholders both in calculating expenses based on an investment in the Fund and in comparing these expenses with similar costs of investing in other mutual funds.
The expense example provides information about actual account values and actual expenses. Annualized expense ratios reflect contractual and voluntary fee waivers, if any. In order to estimate the expenses a shareholder paid during the period covered by this report, shareholders can divide their account value by $1,000 and then multiply the result by the number corresponding to their share class under the heading entitled “Expenses Paid During the Period.”
The expense example also provides information about hypothetical account values and hypothetical expenses based on the Fund’s actual expense ratio and an assumed rate of return of 5% per year before expenses. In order to assist shareholders in comparing the ongoing expenses of investing in the Fund and other funds, compare the 5% hypothetical example with the 5% hypothetical examples that appear in shareholder reports of other funds.
The expenses shown in the expense example are intended to highlight shareholders’ ongoing costs only and do not reflect transactional expenses, such as sales charges, if any. Therefore, the hypothetical example is useful in comparing ongoing expenses only and will not help shareholders determine the relative total expenses of owning different funds. If these transactional expenses were included, shareholder expenses would have been higher.
| | |
ABOUT FUND PERFORMANCE / DISCLOSURE OF EXPENSES | | 7 |
| | |
| Derivative Financial Instruments | | BlackRock Global Allocation Fund, Inc. |
The Fund may invest in various derivative financial instruments. These instruments are used to obtain exposure to a security, commodity, index, market, and/or other assets without owning or taking physical custody of securities, commodities and/or other referenced assets or to manage market, equity, credit, interest rate, foreign currency exchange rate, commodity and/or other risks. Derivative financial instruments may give rise to a form of economic leverage and involve risks, including the imperfect correlation between the value of a derivative financial instrument and the underlying asset, possible default of the counterparty to the transaction or illiquidity of the instrument. Pursuant to Rule 18f-4 under the 1940 Act, among other things, the Fund must either use derivative financial instruments with embedded leverage in a limited manner or comply with an outer limit on fund leverage risk based on value-at-risk. The Fund’s successful use of a derivative financial instrument depends on the investment adviser’s ability to predict pertinent market movements accurately, which cannot be assured. The use of these instruments may result in losses greater than if they had not been used, may limit the amount of appreciation the Fund can realize on an investment and/or may result in lower distributions paid to shareholders. The Fund’s investments in these instruments, if any, are discussed in detail in the Notes to Consolidated Financial Statements.
| | |
| 8 | | 2 0 2 3 BLACK ROCK ANNUAL REPORT TO SHAREHOLDERS |
| | |
Consolidated Schedule of Investments April 30, 2023 | | BlackRock Global Allocation Fund, Inc. (Percentages shown are based on Net Assets) |
| | | | | | | | | | | | |
| Security | | | | | Par (000) | | | Value | |
| | | |
Asset-Backed Securities | | | | | | | | | | | | |
| | | |
| Cayman Islands(a)(b) — 0.4% | | | | | | | | | |
522 Funding CLO Ltd., Series 2019-4A, Class CR, (3-mo. LIBOR US + 2.40%), 7.65%, 04/20/30 | | | USD | | | | 500 | | | $ | 489,555 | |
AGL CLO 5 Ltd. | | | | | | | | | | | | |
Series 2020-5A, Class A2R, (3-mo. LIBOR US + 1.40%), 6.65%, 07/20/34 | | | | | | | 1,260 | | | | 1,206,162 | |
Series 2020-5A, Class BR, (3-mo. LIBOR US + 1.70%), 6.95%, 07/20/34 | | | | | | | 1,752 | | | | 1,704,161 | |
AGL Static CLO Ltd., Series 2022-18A, Class B, (3-mo. CME Term SOFR + 2.00%), 7.06%, 04/21/31 | | | | | | | 3,210 | | | | 3,148,347 | |
Allegro CLO IV Ltd., Series 2016-1A, Class BR2, (3-mo. LIBOR US + 1.55%), 6.81%, 01/15/30 | | | | | | | 430 | | | | 423,984 | |
ALM Ltd., Series 2020-1A, Class A2, (3-mo. LIBOR US + 1.85%), 7.11%, 10/15/29 | | | | | | | 373 | | | | 369,178 | |
AMMC CLO 22 Ltd., Series 2018-22A, Class B, (3-mo. LIBOR US + 1.45%), 6.71%, 04/25/31 | | | | | | | 375 | | | | 365,187 | |
Anchorage Capital CLO 7 Ltd., Series 2015-7A, Class A2, (3-mo. LIBOR US + 1.09%), 6.36%, 01/28/31 | | | | | | | 245 | | | | 242,737 | |
Anchorage Capital CLO Ltd., Series 2018-10A, Class A2, (3-mo. LIBOR US + 1.50%), 6.76%, 10/15/31 | | | | | | | 250 | | | | 244,914 | |
Apidos CLO XX, Series 2015-20A, Class A2RR, (3-mo. LIBOR US + 1.55%), 6.81%, 07/16/31 | | | | | | | 400 | | | | 392,034 | |
Apidos CLO XXII, Series 2015-7A, Class A2, (3-mo. LIBOR US + 1.50%), 6.75%, 04/20/31 | | | | | | | 500 | | | | 490,151 | |
Apidos CLO XXIII, Series 2015-23A, Class B1R, (3-mo. LIBOR US + 1.60%), 6.86%, 04/15/33 | | | | | | | 250 | | | | 242,630 | |
Apollo Credit Funding IV Ltd., Series 4A, Class A2R, (3-mo. LIBOR US + 1.60%), 6.86%, 07/15/30 | | | | | | | 250 | | | | 245,000 | |
ARES LII CLO Ltd., Series 2019-52A, Class A2R, (3-mo. LIBOR US + 1.45%), 6.72%, 04/22/31 | | | | | | | 250 | | | | 241,512 | |
Ares LV CLO Ltd., Series 2020-55A, Class BR, (3-mo. LIBOR US + 1.70%), 6.96%, 07/15/34 | | | | | | | 2,786 | | | | 2,695,571 | |
Ares XXXVII CLO Ltd., Series 2015-4A, Class A3R, (3-mo. LIBOR US + 1.50%), 6.76%, 10/15/30 | | | | | | | 250 | | | | 244,003 | |
ASSURANT CLO I Ltd., Series 2017-1A, Class CR, (3-mo. LIBOR US + 2.15%), 7.40%, 10/20/34 | | | | | | | 720 | | | | 667,804 | |
Atrium XIII, Series 13A, Class B, (3-mo. LIBOR US + 1.50%), 6.77%, 11/21/30 | | | | | | | 600 | | | | 588,047 | |
Bain Capital Credit CLO Ltd. | | | | | | | | | | | | |
Series 2018-2A, Class B, (3-mo. LIBOR US + 1.60%), 6.87%, 07/19/31 | | | | | | | 750 | | | | 728,427 | |
Series 2020-2A, Class BR, (3-mo. LIBOR US + 1.70%), 6.97%, 07/19/34 | | | | | | | 2,425 | | | | 2,322,621 | |
Battalion CLO VIII Ltd., Series 2015-8A, Class A1R2, (3-mo. LIBOR US + 1.07%), 6.33%, 07/18/30 | | | | | | | 469 | | | | 463,048 | |
Battalion CLO X Ltd., Series 2016-10A, Class A2R2, (3-mo. LIBOR US + 1.55%), 6.82%, 01/25/35 | | | | | | | 1,465 | | | | 1,389,977 | |
| | | | | | | | | | | | |
| Security | | | | | Par (000) | | | Value | |
| | | |
| Cayman Islands (continued) | | | | | | | | | |
Battalion CLO XI Ltd., Series 2017-11A, Class BR, (3-mo. LIBOR US + 1.72%), 6.99%, 04/24/34 | | | USD | | | | 712 | | | $ | 683,607 | |
Battalion CLO XX Ltd., Series 2021-20A, Class A, (3-mo. LIBOR US + 1.18%), 6.44%, 07/15/34 | | | | | | | 1,848 | | | | 1,799,936 | |
Benefit Street Partners CLO II Ltd., Series 2013- IIA, Class A2R2, (3-mo. LIBOR US + 1.45%), 6.71%, 07/15/29 | | | | | | | 1,845 | | | | 1,827,452 | |
Benefit Street Partners CLO III Ltd., Series 2013- IIIA, Class A2R2, (3-mo. LIBOR US + 1.65%), 6.90%, 07/20/29 | | | | | | | 667 | | | | 659,428 | |
Benefit Street Partners CLO Ltd., Series 2015- VIBR, Class A, (3-mo. LIBOR US + 1.19%), 6.44%, 07/20/34 | | | | | | | 250 | | | | 245,867 | |
Benefit Street Partners CLO XIX Ltd., Series 2019-19A, Class B, (3-mo. LIBOR US + 2.00%), 7.26%, 01/15/33 | | | | | | | 250 | | | | 244,654 | |
Birch Grove CLO Ltd., Series 19A, Class BR, (3-mo. LIBOR US + 1.75%), 6.62%, 06/15/31 | | | | | | | 500 | | | | 485,801 | |
BlueMountain CLO Ltd. | | | | | | | | | | | | |
Series 2013-2A, Class BR, (3-mo. LIBOR US + 1.60%), 6.87%, 10/22/30 | | | | | | | 500 | | | | 486,678 | |
Series 2014-2A, Class BR2, (3-mo. LIBOR US + 1.75%), 7.00%, 10/20/30 | | | | | | | 465 | | | | 448,169 | |
BlueMountain CLO XXII Ltd., Series 2018-22A, Class B, (3-mo. LIBOR US + 1.50%), 6.76%, 07/15/31 | | | | | | | 1,495 | | | | 1,465,039 | |
BlueMountain CLO XXIII Ltd., Series 2018-23A, Class A1, (3-mo. LIBOR US + 1.15%), 6.40%, 10/20/31 | | | | | | | 250 | | | | 247,398 | |
BlueMountain CLO XXIX Ltd., Series 2020-29A, Class BR, (3-mo. LIBOR US + 1.75%), 7.01%, 07/25/34 | | | | | | | 625 | | | | 603,503 | |
Canyon Capital CLO Ltd. | | | | | | | | | | | | |
Series 2016-1A, Class CR, (3-mo. LIBOR US + 1.90%), 7.16%, 07/15/31 | | | | | | | 250 | | | | 236,399 | |
Series 2019-1A, Class A1R, (3-mo. LIBOR US + 1.10%), 6.36%, 04/15/32 | | | | | | | 250 | | | | 246,445 | |
Series 2019-1A, Class BR, (3-mo. LIBOR US + 1.70%), 6.96%, 04/15/32 | | | | | | | 300 | | | | 290,463 | |
Canyon CLO Ltd., Series 2020-3A, Class B, (3-mo. LIBOR US + 1.70%), 6.96%, 01/15/34 | | | | | | | 250 | | | | 241,807 | |
Catskill Park CLO Ltd., Series 2017-1A, Class A1B, (3-mo. LIBOR US + 1.35%), 6.60%, 04/20/29 | | | | | | | 892 | | | | 882,764 | |
CBAM Ltd. | | | | | | | | | | | | |
Series 2018-7A, Class A, (3-mo. LIBOR US + 1.10%), 6.35%, 07/20/31 | | | | | | | 250 | | | | 246,561 | |
Series 2019-9A, Class B2, (3-mo. LIBOR US + 1.90%), 7.16%, 02/12/30 | | | | | | | 450 | | | | 440,869 | |
Cedar Funding IX CLO Ltd., Series 2018-9A, Class A1, (3-mo. LIBOR US + 0.98%), 6.23%, 04/20/31 | | | | | | | 1,050 | | | | 1,038,746 | |
Cedar Funding V CLO Ltd., Series 2016-5A, Class A1R, (3-mo. LIBOR US + 1.10%), 6.36%, 07/17/31 | | | | | | | 250 | | | | 246,912 | |
Cedar Funding XI CLO Ltd., Series 2019-11A, Class A2R, (3-mo. LIBOR US + 1.35%), 6.30%, 05/29/32 | | | | | | | 250 | | | | 243,501 | |
| | |
CONSOLIDATED SCHEDULE OF INVESTMENTS | | 9 |
| | |
Consolidated Schedule of Investments (continued) April 30, 2023 | | BlackRock Global Allocation Fund, Inc. (Percentages shown are based on Net Assets) |
| | | | | | | | | | | | |
| Security | | | | | Par
(000) | | | Value | |
| | | |
| Cayman Islands (continued) | | | | | | | | | |
CIFC Funding Ltd. | | | | | | | | | | | | |
Series 2013-4A, Class BRR, (3-mo. LIBOR US + 1.60%), 6.89%, 04/27/31 | | | USD | | | | 450 | | | $ | 441,160 | |
Series 2014-5A, Class A1R2, (3-mo. LIBOR US + 1.20%), 6.46%, 10/17/31 | | | | | | | 250 | | | | 248,042 | |
Series 2015-3A, Class BR, (3-mo. LIBOR US + 1.15%), 6.42%, 04/19/29 | | | | | | | 712 | | | | 696,844 | |
Series 2018-2A, Class A2, (3-mo. LIBOR US + 1.60%), 6.85%, 04/20/31 | | | | | | | 250 | | | | 243,687 | |
Series 2020-1A, Class BR, (3-mo. LIBOR US + 1.65%), 6.91%, 07/15/36 | | | | | | | 2,475 | | | | 2,420,916 | |
Series 2021-4A, Class B, (3-mo. LIBOR US + 1.58%), 6.84%, 07/15/33 | | | | | | | 250 | | | | 245,488 | |
Dryden 45 Senior Loan Fund, Series 2016-45A, Class BR, (3-mo. LIBOR US + 1.70%), 6.96%, 10/15/30 | | | | | | | 250 | | | | 244,339 | |
Dryden 65 CLO Ltd., Series 2018-65A, Class B, (3-mo. LIBOR US + 1.60%), 6.86%, 07/18/30 | | | | | | | 250 | | | | 244,207 | |
Elmwood CLO I Ltd., Series 2019-1A, Class AR, (3-mo. LIBOR US + 1.45%), 6.70%, 10/20/33 | | | | | | | 500 | | | | 497,113 | |
Elmwood CLO II Ltd. | | | | | | | | | | | | |
Series 2019-2A, Class AR, (3-mo. LIBOR US + 1.15%), 6.40%, 04/20/34 | | | | | | | 650 | | | | 638,212 | |
Series 2019-2A, Class BR, (3-mo. LIBOR US + 1.65%), 6.90%, 04/20/34 | | | | | | | 975 | | | | 949,231 | |
Elmwood CLO IV Ltd., Series 2020-1A, Class A, (3-mo. LIBOR US + 1.24%), 6.50%, 04/15/33 | | | | | | | 300 | | | | 296,751 | |
Galaxy XV CLO Ltd., Series 2013-15A, Class ARR, (3-mo. LIBOR US + 0.97%), 6.23%, 10/15/30 | | | | | | | 585 | | | | 578,017 | |
Galaxy XXVIII CLO Ltd., Series 2018-28A, Class A1, (3-mo. LIBOR US + 1.10%), 6.36%, 07/15/31 | | | | | | | 250 | | | | 246,425 | |
Generate CLO 3 Ltd., Series 2016-1A, Class BR, (3-mo. LIBOR US + 1.75%), 7.00%, 10/20/29 | | | | | | | 2,025 | | | | 1,996,398 | |
GoldenTree Loan Management U.S. CLO 3 Ltd., Series 2018-3A, Class B1, (3-mo. LIBOR US + 1.55%), 6.80%, 04/20/30 | | | | | | | 250 | | | | 245,737 | |
GoldenTree Loan Opportunities IX Ltd., Series 2014-9A, Class BR2, (3-mo. LIBOR US + 1.60%), 6.90%, 10/29/29 | | | | | | | 500 | | | | 496,949 | |
GoldenTree Loan Opportunities XI Ltd., Series 2015-11A, Class AR2, (3-mo. LIBOR US + 1.07%), 6.33%, 01/18/31 | | | | | | | 250 | | | | 248,131 | |
Greywolf CLO III Ltd., Series 2020-3RA, Class A1R, (3-mo. CME Term SOFR + 1.55%), 6.62%, 04/15/33 | | | | | | | 500 | | | | 493,353 | |
Gulf Stream Meridian 4 Ltd., Series 2021-4A, Class A2, (3-mo. LIBOR US + 1.85%), 7.11%, 07/15/34 | | | | | | | 500 | | | | 489,614 | |
Gulf Stream Meridian 5 Ltd., Series 2021-5A, Class A2, (3-mo. LIBOR US + 1.80%), 7.06%, 07/15/34 | | | | | | | 350 | | | | 342,520 | |
HPS Loan Management Ltd., Series 6A-2015, Class A1R, (3-mo. LIBOR US + 1.00%), 5.81%, 02/05/31 | | | | | | | 497 | | | | 492,948 | |
| | | | | | | | | | | | |
| Security | | | | | Par
(000) | | | Value | |
| | | |
| Cayman Islands (continued) | | | | | | | | | |
Jamestown CLO XII Ltd., Series 2019-1A, Class A2, (3-mo. LIBOR US + 2.15%), 7.40%, 04/20/32 | | | USD | | | | 442 | | | $ | 434,018 | |
Jamestown CLO XV Ltd., Series 2020-15A, Class A, (3-mo. LIBOR US + 1.34%), 6.60%, 04/15/33 | | | | | | | 250 | | | | 246,553 | |
KKR CLO 17 Ltd., Series 17, Class AR, (3-mo. LIBOR US + 1.08%), 6.34%, 04/15/34 | | | | | | | 500 | | | | 487,295 | |
Longfellow Place CLO Ltd., Series 2013-1A, Class BR3, (3-mo. LIBOR US + 1.75%), 7.01%, 04/15/29 | | | | | | | 472 | | | | 470,557 | |
Madison Park Funding XLI Ltd., Series 12A, Class BR, (3-mo. LIBOR US + 1.35%), 6.62%, 04/22/27 | | | | | | | 695 | | | | 684,945 | |
Madison Park Funding XXV Ltd., Series 2017- 25A, Class A2R, (3-mo. LIBOR US + 1.65%), 6.91%, 04/25/29 | | | | | | | 712 | | | | 700,507 | |
Madison Park Funding XXVI Ltd., Series 2007- 4A, Class AR, (3-mo. LIBOR US + 1.20%), 6.50%, 07/29/30 | | | | | | | 455 | | | | 456,300 | |
Madison Park Funding XXXI Ltd., Series 2018- 31A, Class B, (3-mo. LIBOR US + 1.70%), 6.97%, 01/23/31 | | | | | | | 250 | | | | 244,896 | |
Mariner CLO LLC, Series 2016-3A, Class BR2, (3-mo. LIBOR US + 1.50%), 6.77%, 07/23/29 | | | | | | | 500 | | | | 492,270 | |
Myers Park CLO Ltd., Series 2018-1A, Class B1, (3-mo. LIBOR US + 1.60%), 6.85%, 10/20/30 | | | | | | | 250 | | | | 244,348 | |
Neuberger Berman CLO XIV Ltd., Series 14A, Class AR2, (3-mo. LIBOR US + 1.03%), 6.30%, 01/28/30 | | | | | | | 235 | | | | 233,381 | |
Neuberger Berman CLO XX Ltd., Series 20A, Class BRR, (3-mo. LIBOR US + 1.65%), 6.91%, 07/15/34 | | | | | | | 250 | | | | 242,076 | |
Neuberger Berman CLO XXII Ltd., Series 2016- 22A, Class BR, (3-mo. LIBOR US + 1.65%), 6.91%, 10/17/30 | | | | | | | 250 | | | | 244,075 | |
Neuberger Berman Loan Advisers CLO 37 Ltd., Series 2020-37A, Class BR, (3-mo. LIBOR US + 1.45%), 6.70%, 07/20/31 | | | | | | | 333 | | | | 325,053 | |
Neuberger Berman Loan Advisers CLO 46 Ltd., Series 2021- 46A, Class B, (3-mo. LIBOR US + 1.65%), 6.90%, 01/20/36 | | | | | | | 250 | | | | 241,379 | |
OCP CLO Ltd. | | | | | | | | | | | | |
Series 2014-5A, Class A2R, (3-mo. LIBOR US + 1.40%), 6.67%, 04/26/31 | | | | | | | 450 | | | | 436,682 | |
Series 2014-7A, Class A2RR, (3-mo. LIBOR US + 1.65%), 6.90%, 07/20/29 | | | | | | | 250 | | | | 243,964 | |
Series 2016-11A, Class A2R, (3-mo. LIBOR US + 1.75%), 7.02%, 10/26/30 | | | | | | | 500 | | | | 489,216 | |
Series 2020-19A, Class BR, (3-mo. LIBOR US + 1.70%), 6.95%, 10/20/34 | | | | | | | 500 | | | | 483,170 | |
Octagon Investment Partners 29 Ltd., Series 2016-1A, Class AR, (3-mo. LIBOR US + 1.18%), 6.45%, 01/24/33 | | | | | | | 250 | | | | 246,136 | |
Octagon Investment Partners 37 Ltd., Series 2018-2A, Class A2, (3-mo. LIBOR US + 1.58%), 6.84%, 07/25/30 | | | | | | | 250 | | | | 243,718 | |
| | |
| 10 | | 2 0 2 3 BLACK ROCK ANNUAL REPORT TO SHAREHOLDERS |
| | |
Consolidated Schedule of Investments (continued) April 30, 2023 | | BlackRock Global Allocation Fund, Inc. (Percentages shown are based on Net Assets) |
| | | | | | | | | | | | |
| Security | | | | | Par (000) | | | Value | |
| | | |
| Cayman Islands (continued) | | | | | | | | | |
Octagon Investment Partners 46 Ltd., Series 2020-2A, Class BR, (3-mo. LIBOR US + 1.65%), 6.91%, 07/15/36 | | | USD | | | | 800 | | | $ | 768,229 | |
Octagon Investment Partners XV Ltd., Series 2013-1A, Class A2R, (3-mo. LIBOR US + 1.35%), 6.62%, 07/19/30 | | | | | | | 487 | | | | 482,642 | |
Octagon Investment Partners XVII Ltd., Series 2013-1A, Class A2R2, (3-mo. LIBOR US + 1.10%), 6.36%, 01/25/31 | | | | | | | 300 | | | | 290,256 | |
OHA Credit Funding 3 Ltd., Series 2019-3A, Class BR, (3-mo. LIBOR US + 1.65%), 6.90%, 07/02/35 | | | | | | | 936 | | | | 909,225 | |
OHA Credit Funding 7 Ltd., Series 2020-7A, Class AR, (3-mo. CME Term SOFR + 1.30%), 6.33%, 02/24/37 | | | | | | | 250 | | | | 245,165 | |
OHA Credit Partners XIII Ltd., Series 2016-13A, Class BR, (3-mo. LIBOR US + 1.70%), 6.96%, 10/25/34 | | | | | | | 250 | | | | 242,981 | |
OHA Loan Funding Ltd. | | | | | | | | | | | | |
Series 2013-2A, Class AR, (3-mo. LIBOR US + 1.04%), 5.96%, 05/23/31 | | | | | | | 500 | | | | 495,233 | |
Series 2016-1A, Class B1R, (3-mo. LIBOR US + 1.60%), 6.85%, 01/20/33 | | | | | | | 250 | | | | 243,427 | |
Palmer Square CLO Ltd. | | | | | | | | | | | | |
Series 2013-2A, Class A2R3, (3-mo. LIBOR US + 1.50%), 6.76%, 10/17/31 | | | | | | | 250 | | | | 244,574 | |
Series 2015-1A, Class A2R4, (3-mo. LIBOR US + 1.70%), 6.62%, 05/21/34 | | | | | | | 500 | | | | 484,272 | |
Series 2018-1A, Class A1, (3-mo. LIBOR US + 1.03%), 6.29%, 04/18/31 | | | | | | | 250 | | | | 247,528 | |
Park Avenue Institutional Advisers CLO Ltd. | | | | | | | | | | | | |
Series 2016-1A, Class A1R, (3-mo. LIBOR US + 1.20%), 6.12%, 08/23/31 | | | | | | | 500 | | | | 493,571 | |
Series 2016-1A, Class A2R, (3-mo. LIBOR US + 1.55%), 6.42%, 02/14/34 | | | | | | | 500 | | | | 479,747 | |
Series 2019-1A, Class A2A, (3-mo. LIBOR US + 2.00%), 6.86%, 05/15/32 | | | | | | | 250 | | | | 242,759 | |
Pikes Peak CLO 1, Series 2018-1A, Class A, (3-mo. LIBOR US + 1.18%), 6.45%, 07/24/31 | | | | | | | 555 | | | | 550,795 | |
Pikes Peak CLO 11, Series 2021-11A, Class A1, (3-mo. CME Term SOFR + 1.95%), 7.02%, 07/25/34 | | | | | | | 1,000 | | | | 1,002,367 | |
Pikes Peak CLO 8, Series 2021-8A, Class A, (3-mo. LIBOR US + 1.17%), 6.42%, 07/20/34 | | | | | | | 600 | | | | 587,411 | |
Rad CLO 3 Ltd., Series 2019-3A, Class BR, (3-mo. LIBOR US + 1.55%), 6.81%, 04/15/32 | | | | | | | 250 | | | | 242,606 | |
Rad CLO 7 Ltd., Series 2020-7A, Class A1, (3-mo. LIBOR US + 1.20%), 6.46%, 04/17/33 | | | | | | | 250 | | | | 245,518 | |
Recette CLO Ltd., Series 2015-1A, Class BRR, (3-mo. LIBOR US + 1.40%), 6.65%, 04/20/34 | | | | | | | 250 | | | | 239,323 | |
Regatta VII Funding Ltd., Series 2016-1A, Class A1R2, (3-mo. LIBOR US + 1.15%), 6.11%, 06/20/34 | | | | | | | 450 | | | | 441,364 | |
Regatta XVIII Funding Ltd., Series 2021-1A, Class B, (3-mo. LIBOR US + 1.45%), 6.71%, 01/15/34 | | | | | | | 350 | | | | 339,894 | |
Rockford Tower CLO Ltd. | | | | | | | | | | | | |
Series 2017-1A, Class BR2A, (3-mo. LIBOR US + 1.65%), 6.90%, 04/20/34 | | | | | | | 500 | | | | 477,754 | |
| | | | | | | | | | | | |
| Security | | | | | Par (000) | | | Value | |
| | | |
| Cayman Islands (continued) | | | | | | | | | |
Rockford Tower CLO Ltd. (continued) | | | | | | | | | | | | |
Series 2017-2A, Class BR, (3-mo. LIBOR US + 1.50%), 6.76%, 10/15/29 | | | USD | | | | 500 | | | $ | 486,559 | |
Series 2018-1A, Class A, (3-mo. LIBOR US + 1.10%), 6.02%, 05/20/31 | | | | | | | 250 | | | | 246,645 | |
Romark CLO II Ltd., Series 2018-2A, Class A1, (3-mo. LIBOR US + 1.18%), 6.43%, 07/25/31 | | | | | | | 250 | | | | 247,075 | |
Signal Peak CLO 5 Ltd., Series 2018-5A, Class A, (3-mo. LIBOR US + 1.11%), 6.37%, 04/25/31 | | | | | | | 300 | | | | 297,015 | |
Signal Peak CLO 8 Ltd. | | | | | | | | | | | | |
Series 2020-8A, Class A, (3-mo. LIBOR US + 1.27%), 6.52%, 04/20/33 | | | | | | | 250 | | | | 245,477 | |
Series 2020-8A, Class B, (3-mo. LIBOR US + 1.65%), 6.90%, 04/20/33 | | | | | | | 300 | | | | 288,382 | |
Sixth Street CLO XVI Ltd. | | | | | | | | | | | | |
Series 2020-16A, Class A1A, (3-mo. LIBOR US + 1.32%), 6.57%, 10/20/32 | | | | | | | 948 | | | | 940,881 | |
Series 2020-16A, Class B, (3-mo. LIBOR US + 1.85%), 7.10%, 10/20/32 | | | | | | | 710 | | | | 698,021 | |
Sound Point CLO XV Ltd., Series 2017-1A, Class BR, (3-mo. LIBOR US + 1.50%), 6.77%, 01/23/29 | | | | | | | 250 | | | | 246,710 | |
Symphony CLO XVI Ltd., Series 2015-16A, Class AR, (3-mo. LIBOR US + 1.15%), 6.41%, 10/15/31 | | | | | | | 250 | | | | 247,423 | |
TICP CLO VI Ltd. | | | | | | | | | | | | |
Series 2016-6A, Class AR2, (3-mo. LIBOR US + 1.12%), 6.38%, 01/15/34 | | | | | | | 500 | | | | 491,254 | |
Series 2016-6A, Class BR2, (3-mo. LIBOR US + 1.50%), 6.76%, 01/15/34 | | | | | | | 500 | | | | 483,780 | |
TICP CLO XII Ltd., Series 2018-12A, Class BR, (3-mo. LIBOR US + 1.65%), 6.91%, 07/15/34 | | | | | | | 700 | | | | 678,497 | |
TRESTLES CLO III Ltd., Series 2020-3A, Class A1, (3-mo. LIBOR US + 1.33%), 6.58%, 01/20/33 | | | | | | | 2,489 | | | | 2,457,828 | |
Trimaran CAVU Ltd., Series 2019-1A, Class B, (3-mo. LIBOR US + 2.20%), 7.45%, 07/20/32 | | | | | | | 500 | | | | 491,578 | |
Trinitas CLO XIV Ltd. | | | | | | | | | | | | |
Series 2020-14A, Class B, (3-mo. LIBOR US + 2.00%), 7.26%, 01/25/34 | | | | | | | 472 | | | | 457,507 | |
Series 2020-14A, Class C, (3-mo. LIBOR US + 3.00%), 8.26%, 01/25/34 | | | | | | | 1,023 | | | | 995,857 | |
Voya CLO Ltd. | | | | | | | | | | | | |
Series 2013-3A, Class A1RR, (3-mo. CME Term SOFR + 1.41%), 6.39%, 10/18/31 | | | | | | | 249 | | | | 247,400 | |
Series 2017-3A, Class A1R, (3-mo. LIBOR US + 1.04%), 6.29%, 04/20/34 | | | | | | | 250 | | | | 244,872 | |
Series 2017-4A, Class B, (3-mo. LIBOR US + 1.45%), 6.71%, 10/15/30 | | | | | | | 250 | | | | 244,245 | |
Series 2018-3A, Class A1A, (3-mo. LIBOR US + 1.15%), 6.41%, 10/15/31 | | | | | | | 250 | | | | 247,672 | |
Whitebox CLO II Ltd. | | | | | | | | | | | | |
Series 2020-2A, Class A1R, (3-mo. LIBOR US + 1.22%), 6.49%, 10/24/34 | | | | | | | 1,390 | | | | 1,358,736 | |
Series 2020-2A, Class BR, (3-mo. LIBOR US + 1.75%), 7.02%, 10/24/34 | | | | | | | 726 | | | | 700,040 | |
| | | | | | | | |
| | | |
| | | | | | | | | | | 75,943,765 | |
| | |
CONSOLIDATED SCHEDULE OF INVESTMENTS | | 11 |
| | |
Consolidated Schedule of Investments (continued) April 30, 2023 | | BlackRock Global Allocation Fund, Inc. (Percentages shown are based on Net Assets) |
| | | | | | | | | | | | |
| Security | | | | | Par (000) | | | Value | |
| | | |
| Ireland — 0.1% | | | | | | | | | |
Avoca CLO XV DAC, Series 15X, Class B2R, (1-mo. EURIBOR + 1.05%), 4.23%, 04/15/31(a)(c) | | | EUR | | | | 134 | | | $ | 140,204 | |
CIFC European Funding CLO II DAC, Series 2X, Class B1, (1-mo. EURIBOR + 1.60%), 4.78%, 04/15/33(a)(c) | | | | | | | 593 | | | | 622,812 | |
Harvest CLO XVIII DAC, Series 18X, Class B, (1-mo. EURIBOR + 1.20%), 4.38%, 10/15/30 | | | | | | | 662 | | | | 692,611 | |
Holland Park CLO DAC, Series 1X, Class A1RR, (1-mo. EURIBOR + 0.92%), 3.54%,��11/14/32(a)(c) | | | | | | | 390 | | | | 417,921 | |
OAK Hill European Credit Partners V Designated Activity Co., Series 2016-5A, Class BR, (1-mo. EURIBOR + 1.90%), 5.11%, 01/21/35(a)(b) | | | | | | | 590 | | | | 620,664 | |
OAK Hill European Credit Partners VI DAC, Series 2017-6X, Class B1, (1-mo. EURIBOR + 1.20%), 4.40%, 01/20/32(a)(c) | | | | | | | 456 | | | | 483,349 | |
OCP Euro CLO DAC, Series 2017-2X, Class B, (1-mo. EURIBOR + 1.35%), 4.53%, 01/15/32(a)(c) | | | | | | | 456 | | | | 482,640 | |
Prodigy Finance DAC(a)(b) | | | | | | | | | | | | |
Series 2021-1A, Class B, (1-mo. LIBOR US + 2.50%), 7.52%, 07/25/51 | | | USD | | | | 918 | | | | 903,922 | |
Series 2021-1A, Class C, (1-mo. LIBOR US + 3.75%), 8.77%, 07/25/51 | | | | | | | 925 | | | | 915,604 | |
Series 2021-1A, Class D, (1-mo. LIBOR US + 5.90%), 10.92%, 07/25/51 | | | | | | | 720 | | | | 710,495 | |
Rockford Tower Europe CLO DAC, Series 2018- 1X, Class B, (1-mo. EURIBOR + 1.85%), 4.67%, 12/20/31(a)(c) | | | EUR | | | | 343 | | | | 365,458 | |
| | | | | | | | |
| | | | | | | | | | | 6,355,680 | |
| | | |
| United States — 0.7% | | | | | | | | | |
AccessLex Institute, Series 2007-A, Class A3, (3-mo. LIBOR US + 0.30%), 5.26%, 05/25/36(a) | | | USD | | | | 1,834 | | | | 1,774,690 | |
AIMCO CLO, Series 2018-AA, Class B, (3-mo. LIBOR US + 1.40%), 6.66%, 04/17/31(a)(b) | | | | | | | 466 | | | | 454,197 | |
Anchorage Capital CLO 3-R Ltd., Series 2014- 3RA, Class A, (3-mo. LIBOR US + 1.05%), 6.32%, 01/28/31(a)(b) | | | | | | | 236 | | | | 233,247 | |
Apidos CLO XII, Series 2013-12A, Class AR, (3-mo. LIBOR US + 1.08%), 6.34%, 04/15/31(a)(b) | | | | | | | 550 | | | | 544,866 | |
Apidos CLO XV, Series 2013-15A, Class A1RR, (3-mo. LIBOR US + 1.01%), 6.26%, 04/20/31(a)(b) | | | | | | | 1,770 | | | | 1,750,433 | |
Bankers Healthcare Group Securitization Trust, Series 2020-A, Class C, 5.17%, 09/17/31(b) | | | | | | | 730 | | | | 683,130 | |
Chenango Park CLO Ltd., Series 2018-1A, Class A2, (3-mo. LIBOR US + 1.55%), 6.81%, 04/15/30(a)(b) | | | | | | | 1,143 | | | | 1,120,114 | |
CIFC Funding Ltd.(a)(b) | | | | | | | | | | | | |
Series 2013-1A, Class A2R, (3-mo. LIBOR US + 1.75%), 7.01%, 07/16/30 | | | | | | | 250 | | | | 246,009 | |
Series 2017-3A, Class A2, (3-mo. LIBOR US + 1.80%), 7.05%, 07/20/30 | | | | | | | 637 | | | | 625,707 | |
| | | | | | | | | | | | |
| Security | | | | | Par (000) | | | Value | |
| | | |
| United States (continued) | | | | | | | | | |
Clear Creek CLO, Series 2015-1A, Class AR, (3-mo. LIBOR US + 1.20%), 6.45%, 10/20/30(a)(b) | | | USD | | | | 258 | | | $ | 255,181 | |
College Ave Student Loans LLC, Series 2021-B, Class D, 3.78%, 06/25/52(b) | | | | | | | 230 | | | | 196,434 | |
Cook Park CLO Ltd., Series 2018-1A, Class B, (3-mo. LIBOR US + 1.40%), 6.66%, 04/17/30(a)(b) | | | | | | | 1,148 | | | | 1,122,631 | |
GoodLeap Sustainable Home Solutions Trust, Series 2021-3CS, Class A, 2.10%, 05/20/48(b) | | | | | | | 5,654 | | | | 4,450,871 | |
Gracie Point International Funding(a)(b) | | | | | | | | | | | | |
Series 2021-1A, Class B, (1-mo. LIBOR US + 1.40%), 6.25%, 11/01/23 | | | | | | | 1,240 | | | | 1,239,928 | |
Series 2021-1A, Class C, (1-mo. LIBOR US + 2.40%), 7.25%, 11/01/23 | | | | | | | 1,640 | | | | 1,639,826 | |
Gulf Stream Meridian 1 Ltd., Series 2020-IA, Class A1, (3-mo. LIBOR US + 1.37%), 6.63%, 04/15/33(a)(b) | | | | | | | 5,718 | | | | 5,641,508 | |
Lendmark Funding Trust, Series 2021-2A, Class D, 4.46%, 04/20/32(b) | | | | | | | 2,210 | | | | 1,663,987 | |
Madison Park Funding XIII Ltd., Series 2014- 13A, Class BR2, (3-mo. LIBOR US + 1.50%), 6.77%, 04/19/30(a)(b) | | | | | | | 900 | | | | 884,264 | |
Mariner Finance Issuance Trust, Series 2020- AA, Class A, 2.19%, 08/21/34(b) | | | | | | | 5,860 | | | | 5,640,586 | |
Navient Private Education Refi Loan Trust(b) | | | | | | | | | | | | |
Series 2021-DA, Class A, (Prime - -1.99%), 6.01%, 04/15/60(a) | | | | | | | 11,032 | | | | 10,323,521 | |
Series 2021-DA, Class B, 2.61%, 04/15/60 | | | | | | | 2,900 | | | | 2,710,428 | |
Series 2021-DA, Class C, 3.48%, 04/15/60 | | | | | | | 7,450 | | | | 6,489,539 | |
Series 2021-DA, Class D, 4.00%, 04/15/60 | | | | | | | 2,370 | | | | 2,090,730 | |
Nelnet Student Loan Trust(b) | | | | | | | | | | | | |
Series 2021-A, Class D, 4.93%, 04/20/62 | | | | | | | 6,030 | | | | 5,155,920 | |
Series 2021-BA, Class C, 3.57%, 04/20/62 | | | | | | | 6,450 | | | | 5,420,724 | |
Series 2021-CA, Class C, 3.36%, 04/20/62 | | | | | | | 850 | | | | 705,970 | |
Oportun Issuance Trust(b) | | | | | | | | | | | | |
Series 2021-B, Class A, 1.47%, 05/08/31 | | | | | | | 7,060 | | | | 6,405,263 | |
Series 2021-B, Class B, 1.96%, 05/08/31 | | | | | | | 1,340 | | | | 1,188,448 | |
Pagaya AI Debt Selection Trust, Series 2021-2, Class NOTE, 3.00%, 01/25/29(b) | | | | | | | 5,550 | | | | 5,299,016 | |
Park Avenue Institutional Advisers CLO Ltd., Series 2016-1A, Class A2R, (3-mo. LIBOR US + 1.80%), 6.72%, 08/23/31(a)(b) | | | | | | | 610 | | | | 592,501 | |
Progress Residential, Series 2021-SFR3, Class F, 3.44%, 05/17/26(b) | | | | | | | 2,736 | | | | 2,415,049 | |
Regional Management Issuance Trust, 3.88%, 10/17/33(b)(d) | | | | | | | 27,070 | | | | 23,518,416 | |
SLM Private Education Loan Trust, Series 2010-C, Class A5, (1-mo. LIBOR US + 4.75%), 9.70%, 10/15/41(a)(b) | | | | | | | 12,923 | | | | 13,994,190 | |
SMB Private Education Loan Trust(b) | | | | | | | | | | | | |
Series 2021-A, Class C, 2.99%, 01/15/53 | | | | | | | 13,880 | | | | 12,188,822 | |
Series 2021-C, Class B, 2.30%, 01/15/53 | | | | | | | 1,490 | | | | 1,335,880 | |
Series 2021-C, Class C, 3.00%, 01/15/53 | | | | | | | 1,240 | | | | 1,093,401 | |
| | |
| 12 | | 2 0 2 3 BLACK ROCK ANNUAL REPORT TO SHAREHOLDERS |
| | |
Consolidated Schedule of Investments (continued) April 30, 2023 | | BlackRock Global Allocation Fund, Inc. (Percentages shown are based on Net Assets) |
| | | | | | | | | | | | |
| Security | | | | | Par (000) | | | Value | |
| | | |
| United States (continued) | | | | | | | | | |
SMB Private Education Loan Trust(b) (continued) Series 2021-C, Class D, 3.93%, 01/15/53 | | | USD | | | | 590 | | | $ | 542,454 | |
York CLO 1 Ltd., Series 2014-1A, Class BRR, (3-mo. LIBOR US + 1.65%), 6.92%, 10/22/29(a)(b) | | | | | | | 466 | | | | 458,573 | |
| | | | | | | | |
| | | |
| | | | | | | | | | | 132,096,454 | |
| | | | | | | | |
| |
Total Asset-Backed Securities — 1.2%
(Cost: $228,809,564) | | | | 214,395,899 | |
| | | | | | | | |
| | | |
| | | | | | Shares | | | | |
| | | |
Common Stocks | | | | | | | | | | | | |
| | | |
| Australia — 0.4% | | | | | | | | | |
AGL Energy Ltd. | | | | | | | 713,066 | | | | 3,925,420 | |
BHP Group Ltd., Class DI | | | | | | | 90,084 | | | | 2,673,466 | |
CSL Ltd. | | | | | | | 6,972 | | | | 1,391,867 | |
Endeavour Group Ltd. | | | | | | | 432,597 | | | | 1,949,800 | |
Glencore PLC | | | | | | | 8,969,490 | | | | 52,943,621 | |
Medibank Pvt Ltd. | | | | | | | 838,531 | | | | 1,984,432 | |
Origin Energy Ltd. | | | | | | | 174,069 | | | | 965,128 | |
Qantas Airways Ltd.(e) | | | | | | | 348,242 | | | | 1,535,728 | |
Quintis HoldCo. Pty. Ltd.(d)(f) | | | | | | | 43,735,802 | | | | 289 | |
South32 Ltd. | | | | | | | 696,049 | | | | 1,967,557 | |
| | | | | | | | |
| | | |
| | | | | | | | | | | 69,337,308 | |
| | | |
| Belgium — 0.0% | | | | | | | | | |
KBC Group NV | | | | | | | 44,165 | | | | 3,157,285 | |
| | | | | | | | |
| | | |
| Brazil — 0.1% | | | | | | | | | |
Ambev SA | | | | | | | 3,064,572 | | | | 8,700,096 | |
Embraer SA(e) | | | | | | | 730,593 | | | | 2,844,564 | |
Engie Brasil Energia SA | | | | | | | 80,747 | | | | 667,468 | |
JBS S/A | | | | | | | 650,075 | | | | 2,332,961 | |
Lojas Renner SA | | | | | | | 736,590 | | | | 2,339,225 | |
Telefonica Brasil SA | | | | | | | 137,009 | | | | 1,129,518 | |
| | | | | | | | |
| | | |
| | | | | | | | | | | 18,013,832 | |
| | | |
| Canada — 1.4% | | | | | | | | | |
Barrick Gold Corp. | | | | | | | 301,497 | | | | 5,732,415 | |
BCE, Inc. | | | | | | | 26,777 | | | | 1,287,019 | |
Brookfield Asset Management Ltd., Class A | | | | | | | 82,492 | | | | 2,765,462 | |
Brookfield Corp. | | | | | | | 74,857 | | | | 2,428,840 | |
Cameco Corp.(g) | | | | | | | 777,523 | | | | 21,374,107 | |
Canadian Imperial Bank of Commerce | | | | | | | 81,376 | | | | 3,411,564 | |
Enbridge, Inc. | | | | | | | 3,053,863 | | | | 121,424,217 | |
George Weston Ltd. | | | | | | | 10,214 | | | | 1,371,466 | |
Imperial Oil Ltd. | | | | | | | 47,253 | | | | 2,408,600 | |
Lululemon Athletica, Inc.(e) | | | | | | | 5,197 | | | | 1,974,496 | |
Metro, Inc. | | | | | | | 31,333 | | | | 1,785,832 | |
National Bank of Canada | | | | | | | 19,356 | | | | 1,443,360 | |
Royal Bank of Canada | | | | | | | 65,531 | | | | 6,505,942 | |
Suncor Energy, Inc. | | | | | | | 1,387,977 | | | | 43,457,198 | |
TC Energy Corp. | | | | | | | 409,458 | | | | 17,017,810 | |
Teck Resources Ltd., Class B | | | | | | | 201,733 | | | | 9,400,758 | |
| | | | | | | | |
| Security | | Shares | | | Value | |
| | |
| Canada (continued) | | | | | | |
TELUS Corp. | | | 760,505 | | | $ | 16,121,123 | |
Toronto-Dominion Bank | | | 32,708 | | | | 1,981,286 | |
| | | | | | | | |
| | | | | | | 261,891,495 | |
| | |
| Cayman Islands — 0.0% | | | | | | |
Crown PropTech Acquisitions, Class A(e) | | | 108,245 | | | | 1,106,264 | |
Salt Pay Co. Ltd., Series C, (Acquired 11/16/21,
Cost: $10,172,087)(d)(h) | | | 5,237 | | | | 3,533,613 | |
| | | | | | | | |
| | |
| | | | | | | 4,639,877 | |
| | |
| China — 1.2% | | | | | | |
Agricultural Bank of China Ltd., Class H | | | 4,636,000 | | | | 1,792,428 | |
Aier Eye Hospital Group Co. Ltd., Class A | | | 817,551 | | | | 3,481,059 | |
Amoy Diagnostics Co. Ltd., Class A | | | 1,088,430 | | | | 4,426,408 | |
Anhui Gujing Distillery Co. Ltd., Class B | | | 14,700 | | | | 260,708 | |
Bank of Chengdu Co. Ltd., Class A | | | 2,440,600 | | | | 4,852,258 | |
BOC Hong Kong Holdings Ltd. | | | 293,500 | | | | 926,498 | |
BYD Co. Ltd., Class A | | | 89,900 | | | | 3,331,828 | |
BYD Co. Ltd., Class H | | | 183,500 | | | | 5,564,865 | |
BYD Electronic International Co. Ltd. | | | 29,000 | | | | 87,949 | |
China Construction Bank Corp., Class H | | | 10,164,000 | | | | 6,794,898 | |
China Merchants Bank Co. Ltd., Class H | | | 404,000 | | | | 1,950,157 | |
China Tourism Group Duty Free Corp. Ltd., Class A | | | 116,000 | | | | 2,706,806 | |
Dali Foods Group Co. Ltd.(b) | | | 406,000 | | | | 168,959 | |
Dongfang Electric Corp. Ltd., Class A | | | 228,200 | | | | 575,376 | |
Foshan Haitian Flavouring & Food Co. Ltd., Class A | | | 482,630 | | | | 4,930,012 | |
Glodon Co. Ltd., Class A | | | 555,630 | | | | 4,659,113 | |
Gree Electric Appliances, Inc. of Zhuhai, Class A | | | 1,167,100 | | | | 6,634,585 | |
Guangzhou Baiyun International Airport Co. Ltd., Class A(e) | | | 2,430,771 | | | | 5,511,830 | |
Haidilao International Holding Ltd.(b)(e) | | | 1,213,000 | | | | 2,965,667 | |
Hangzhou Robam Appliances Co. Ltd., Class A | | | 2,278,133 | | | | 8,582,576 | |
Hangzhou Tigermed Consulting Co. Ltd., Class H(b) | | | 128,900 | | | | 1,073,762 | |
Hundsun Technologies, Inc., Class A | | | 588,488 | | | | 4,209,139 | |
Hygeia Healthcare Holdings Co. Ltd.(b)(e) | | | 435,400 | | | | 3,208,549 | |
Industrial & Commercial Bank of China Ltd., Class H | | | 11,950,000 | | | | 6,429,148 | |
JD Health International, Inc.(b)(e) | | | 950,950 | | | | 6,862,171 | |
JD.com, Inc., Class A | | | 228,497 | | | | 4,078,178 | |
Jiangsu Hengrui Pharmaceuticals Co. Ltd., Class A | | | 827,700 | | | | 5,823,849 | |
Jinxin Fertility Group Ltd.(b) | | | 3,547,500 | | | | 2,341,514 | |
Kindstar Globalgene Technology, Inc.(b)(e) | | | 7,490,500 | | | | 1,693,130 | |
Kingsoft Corp. Ltd. | | | 527,400 | | | | 2,318,304 | |
Kweichow Moutai Co. Ltd., Class A | | | 20,900 | | | | 5,321,177 | |
Lenovo Group Ltd. | | | 784,000 | | | | 802,091 | |
LONGi Green Energy Technology Co. Ltd., Class A | | | 587,700 | | | | 2,969,187 | |
Meituan, Class B(b)(e) | | | 379,870 | | | | 6,492,149 | |
Microport Cardioflow Medtech Corp.(b)(e)(g) | | | 10,261,000 | | | | 3,032,923 | |
Ningbo Deye Technology Co. Ltd., Class A | | | 99,600 | | | | 3,621,547 | |
Nongfu Spring Co. Ltd., Class H(b) | | | 152,600 | | | | 827,970 | |
NXP Semiconductors NV | | | 27,784 | | | | 4,549,352 | |
PetroChina Co. Ltd., Class H | | | 2,322,000 | | | | 1,612,941 | |
| | |
CONSOLIDATED SCHEDULE OF INVESTMENTS | | 13 |
| | |
Consolidated Schedule of Investments (continued) April 30, 2023 | | BlackRock Global Allocation Fund, Inc. (Percentages shown are based on Net Assets) |
| | | | | | | | |
| Security | | Shares | | | Value | |
| | |
| China (continued) | | | | | | |
Pharmaron Beijing Co. Ltd., Class H(b) | | | 121,150 | | | $ | 525,236 | |
Ping An Insurance Group Co. of China Ltd., Class A | | | 708,100 | | | | 5,310,361 | |
Shanghai Fosun Pharmaceutical Group Co. Ltd., Class H(g) | | | 336,500 | | | | 961,919 | |
Shanghai Jinjiang International Hotels Co. Ltd., Class A | | | 403,200 | | | | 3,117,468 | |
StarPower Semiconductor Ltd., Class A | | | 114,900 | | | | 4,028,031 | |
Tencent Holdings Ltd. | | | 1,148,400 | | | | 51,007,462 | |
Venustech Group, Inc., Class A | | | 714,088 | | | | 3,206,220 | |
Want Want China Holdings Ltd. | | | 590,000 | | | | 376,276 | |
Wuhan Raycus Fiber Laser Technologies Co. Ltd., Class A(e) | | | 862,763 | | | | 3,232,794 | |
Wuliangye Yibin Co. Ltd., Class A | | | 184,900 | | | | 4,518,175 | |
Yifeng Pharmacy Chain Co. Ltd., Class A | | | 250,256 | | | | 1,803,208 | |
Yonyou Network Technology Co. Ltd., Class A | | | 1,627,409 | | | | 5,089,390 | |
Yum China Holdings, Inc. | | | 47,950 | | | | 2,934,468 | |
| | | | | | | | |
| | |
| | | | | | | 223,582,069 | |
| | |
| Denmark — 0.2% | | | | | | |
AP Moller - Maersk A/S, Class B | | | 1,259 | | | | 2,275,708 | |
Coloplast A/S, Class B | | | 11,229 | | | | 1,617,883 | |
Novo Nordisk A/S, Class B | | | 183,358 | | | | 30,502,401 | |
Novozymes A/S, B Shares | | | 119,557 | | | | 6,224,458 | |
Pandora A/S | | | 7,298 | | | | 675,516 | |
| | | | | | | | |
| | |
| | | | | | | 41,295,966 | |
| | |
| Finland — 0.0% | | | | | | |
Elisa OYJ | | | 18,944 | | | | 1,176,447 | |
Kesko OYJ, B Shares | | | 41,263 | | | | 860,244 | |
Kone OYJ, Class B | | | 42,796 | | | | 2,441,544 | |
| | | | | | | | |
| | |
| | | | | | | 4,478,235 | |
| | |
| France — 3.3% | | | | | | |
Accor SA(e) | | | 434,639 | | | | 15,419,732 | |
BNP Paribas SA | | | 1,821,714 | | | | 117,707,162 | |
Bollore SE | | | 161,168 | | | | 1,088,748 | |
Carrefour SA | | | 75,656 | | | | 1,573,691 | |
Cie de Saint-Gobain | | | 1,150,297 | | | | 66,596,104 | |
Dassault Systemes SE | | | 79,741 | | | | 3,237,136 | |
EssilorLuxottica SA | | | 252,701 | | | | 50,029,752 | |
Hermes International | | | 17,332 | | | | 37,629,080 | |
Kering SA | | | 107,110 | | | | 68,589,677 | |
La Francaise des Jeux SAEM(b) | | | 82,581 | | | | 3,529,664 | |
L’Oreal SA | | | 28,044 | | | | 13,402,704 | |
LVMH Moet Hennessy Louis Vuitton SE | | | 141,084 | | | | 135,706,040 | |
Remy Cointreau SA | | | 5,144 | | | | 890,056 | |
Sanofi | | | 252,497 | | | | 27,211,169 | |
Schneider Electric SE | | | 18,589 | | | | 3,241,769 | |
SCOR SE | | | 41,985 | | | | 1,085,988 | |
Societe Generale SA | | | 126,592 | | | | 3,074,700 | |
Teleperformance | | | 4,825 | | | | 964,303 | |
TotalEnergies SE | | | 683,224 | | | | 43,657,953 | |
Ubisoft Entertainment SA(e) | | | 105,417 | | | | 3,087,364 | |
Unibail-Rodamco-Westfield(e) | | | 13,183 | | | | 706,952 | |
| | | | | | | | |
| | |
| | | | | | | 598,429,744 | |
| | |
| Germany — 2.4% | | | | | | |
BASF SE | | | 21,054 | | | | 1,089,000 | |
Bayer AG, Registered Shares | | | 582,691 | | | | 38,455,440 | |
Brenntag SE | | | 44,845 | | | | 3,655,075 | |
Commerzbank AG(e) | | | 1,113,963 | | | | 12,379,591 | |
Deutsche Telekom AG, Registered Shares | | | 2,660,781 | | | | 64,156,155 | |
| | | | | | | | |
| Security | | Shares | | | Value | |
| | |
| Germany (continued) | | | | | | |
Fresenius SE & Co. KGaA | | | 61,978 | | | $ | 1,795,749 | |
Mercedes-Benz Group AG, Registered Shares | | | 861,390 | | | | 67,176,367 | |
Merck KGaA | | | 12,351 | | | | 2,215,384 | |
SAP SE | | | 806,455 | | | | 109,126,370 | |
SAP SE, ADR(g) | | | 64,922 | | | | 8,781,999 | |
Scout24 SE(b) | | | 15,932 | | | | 992,995 | |
Siemens AG, Registered Shares | | | 635,636 | | | | 104,773,348 | |
Symrise AG | | | 85,981 | | | | 10,388,439 | |
Telefonica Deutschland Holding AG | | | 566,616 | | | | 1,914,580 | |
United Internet AG, Registered Shares | | | 116,982 | | | | 2,008,503 | |
Vonovia SE | | | 73,887 | | | | 1,602,500 | |
| | | | | | | | |
| | |
| | | | | | | 430,511,495 | |
| | |
| Hong Kong — 0.3% | | | | | | |
AIA Group Ltd. | | | 4,882,800 | | | | 53,159,392 | |
ASMPT Ltd. | | | 126,900 | | | | 997,708 | |
CK Asset Holdings Ltd. | | | 155,500 | | | | 919,491 | |
GCL Technology Holdings Ltd.(e) | | | 2,156,000 | | | | 541,352 | |
Hang Seng Bank Ltd. | | | 65,500 | | | | 970,896 | |
MTR Corp. Ltd. | | | 273,000 | | | | 1,364,050 | |
Orient Overseas International Ltd. | | | 136,000 | | | | 2,763,138 | |
SITC International Holdings Co. Ltd. | | | 645,000 | | | | 1,193,045 | |
| | | | | | | | |
| | |
| | | | | | | 61,909,072 | |
| | |
| India — 0.1% | | | | | | |
Bajaj Auto Ltd. | | | 30,364 | | | | 1,648,035 | |
HCL Technologies Ltd. | | | 178,260 | | | | 2,330,578 | |
Indian Oil Corp. Ltd. | | | 577,611 | | | | 575,634 | |
Infosys Ltd. | | | 112,135 | | | | 1,730,148 | |
Think & Learn Private Ltd., (Acquired 12/11/20, Cost: $8,580,000)(d)(h) | | | 5,720 | | | | 9,724,462 | |
Vedanta Ltd. | | | 231,418 | | | | 793,856 | |
| | | | | | | | |
| | |
| | | | | | | 16,802,713 | |
| | |
| Ireland — 0.1% | | | | | | |
Allegion PLC | | | 72,378 | | | | 7,996,321 | |
Experian PLC | | | 79,053 | | | | 2,798,862 | |
Kingspan Group PLC | | | 96,492 | | | | 6,686,871 | |
Seagate Technology Holdings PLC | | | 51,335 | | | | 3,016,958 | |
Trane Technologies PLC | | | 20,838 | | | | 3,871,909 | |
| | | | | | | | |
| | |
| | | | | | | 24,370,921 | |
| | |
| Israel — 0.3% | | | | | | |
Nice Ltd., ADR(e)(g) | | | 239,269 | | | | 48,813,269 | |
| | | | | | | | |
| | |
| Italy — 0.4% | | | | | | |
Enel SpA | | | 415,051 | | | | 2,835,676 | |
Ferrari NV | | | 65,559 | | | | 18,267,907 | |
FinecoBank Banca Fineco SpA | | | 129,909 | | | | 1,969,120 | |
Intesa Sanpaolo SpA | | | 15,016,564 | | | | 39,484,421 | |
Snam SpA | | | 448,635 | | | | 2,493,368 | |
UniCredit SpA | | | 97,993 | | | | 1,941,778 | |
| | | | | | | | |
| | |
| | | | | | | 66,992,270 | |
| | |
| Japan — 2.1% | | | | | | |
AGC, Inc. | | | 9,200 | | | | 343,021 | |
Aozora Bank Ltd. | | | 57,300 | | | | 1,027,904 | |
Astellas Pharma, Inc. | | | 493,650 | | | | 7,436,619 | |
BayCurrent Consulting, Inc. | | | 57,600 | | | | 2,002,175 | |
Capcom Co. Ltd. | | | 900 | | | | 33,820 | |
Coca-Cola Bottlers Japan Holdings, Inc. | | | 69,500 | | | | 748,950 | |
CyberAgent, Inc. | | | 238,100 | | | | 2,077,803 | |
FANUC Corp. | | | 2,172,000 | | | | 73,351,032 | |
Heiwa Corp. | | | 21,800 | | | | 430,422 | |
Hino Motors Ltd.(e) | | | 287,200 | | | | 1,131,601 | |
| | |
| 14 | | 2 0 2 3 BLACK ROCK ANNUAL REPORT TO SHAREHOLDERS |
| | |
Consolidated Schedule of Investments (continued) April 30, 2023 | | BlackRock Global Allocation Fund, Inc. (Percentages shown are based on Net Assets) |
| | | | | | | | |
| Security | | Shares | | | Value | |
| | |
| Japan (continued) | | | | | | |
Honda Motor Co. Ltd. | | | 122,200 | | | $ | 3,241,113 | |
Hoya Corp. | | | 335,450 | | | | 35,173,603 | |
Ibiden Co. Ltd. | | | 39,900 | | | | 1,569,914 | |
Japan Post Bank Co. Ltd. | | | 475,900 | | | | 3,800,331 | |
Jeol Ltd. | | | 93,400 | | | | 2,725,085 | |
Kamigumi Co. Ltd. | | | 38,300 | | | | 839,377 | |
Kawasaki Kisen Kaisha Ltd. | | | 61,500 | | | | 1,465,565 | |
Kewpie Corp. | | | 41,700 | | | | 700,030 | |
Keyence Corp. | | | 168,629 | | | | 76,044,272 | |
Kobayashi Pharmaceutical Co. Ltd. | | | 26,100 | | | | 1,628,693 | |
Kose Corp. | | | 165,600 | | | | 19,324,724 | |
M3, Inc. | | | 56,200 | | | | 1,379,484 | |
Mazda Motor Corp. | | | 168,500 | | | | 1,524,838 | |
Mitsubishi Corp. | | | 72,200 | | | | 2,676,877 | |
Mitsubishi Heavy Industries Ltd. | | | 61,500 | | | | 2,332,094 | |
Mitsubishi Motors Corp.(e) | | | 313,100 | | | | 1,203,441 | |
Mitsubishi UFJ Financial Group, Inc. | | | 7,315,400 | | | | 45,790,987 | |
MS&AD Insurance Group Holdings, Inc. | | | 63,300 | | | | 2,077,652 | |
Nihon M&A Center Holdings, Inc. | | | 358,900 | | | | 2,743,375 | |
Nippon Yusen KK | | | 71,800 | | | | 1,697,272 | |
Nissan Chemical Corp. | | | 12,900 | | | | 573,302 | |
Nisshin Seifun Group, Inc. | | | 43,300 | | | | 524,859 | |
Nomura Research Institute Ltd. | | | 150,800 | | | | 3,794,060 | |
Oracle Corp./Japan | | | 7,200 | | | | 516,735 | |
Recruit Holdings Co. Ltd. | | | 63 | | | | 1,767 | |
Sega Sammy Holdings, Inc. | | | 159,300 | | | | 2,977,559 | |
SG Holdings Co. Ltd. | | | 60,500 | | | | 870,584 | |
Shin-Etsu Chemical Co. Ltd. | | | 104,600 | | | | 2,984,846 | |
Shionogi & Co. Ltd. | | | 44,000 | | | | 1,969,639 | |
Shiseido Co. Ltd. | | | 49,000 | | | | 2,456,163 | |
SoftBank Corp. | | | 120,600 | | | | 1,357,812 | |
Suzuken Co. Ltd. | | | 19,900 | | | | 566,368 | |
Sysmex Corp. | | | 657,100 | | | | 42,266,764 | |
Terumo Corp. | | | 295,600 | | | | 8,851,973 | |
Tokyo Electron Ltd. | | | 47,600 | | | | 5,450,461 | |
TOTO Ltd. | | | 33,700 | | | | 1,152,598 | |
ZOZO, Inc. | | | 113,400 | | | | 2,386,429 | |
| | | | | | | | |
| | | | | | | 375,223,993 | |
| | |
| Jordan — 0.0% | | | | | | |
Hikma Pharmaceuticals PLC | | | 32,117 | | | | 743,854 | |
| | | | | | | | |
| | | | | | | | |
| | |
| Mexico — 0.1% | | | | | | |
Fomento Economico Mexicano SAB de CV | | | 309,404 | | | | 3,010,148 | |
Grupo Aeroportuario del Sureste SAB de CV, Class B | | | 57,391 | | | | 1,647,244 | |
Grupo Financiero Banorte SAB de CV, Class O | | | 229,064 | | | | 1,980,860 | |
Wal-Mart de Mexico SAB de CV | | | 2,694,107 | | | | 10,862,138 | |
| | | | | | | | |
| | |
| | | | | | | 17,500,390 | |
| | |
| Netherlands — 2.3% | | | | | | |
Adyen NV(b)(e) | | | 21,029 | | | | 33,790,492 | |
ASML Holding NV | | | 193,188 | | | | 122,599,496 | |
ING Groep NV, Series N(e) | | | 8,954,753 | | | | 111,059,420 | |
Koninklijke Ahold Delhaize NV | | | 94,421 | | | | 3,246,633 | |
Koninklijke Philips NV | | | 74,835 | | | | 1,579,917 | |
Koninklijke Vopak NV | | | 81,337 | | | | 3,107,764 | |
Shell PLC | | | 3,060,640 | | | | 94,618,905 | |
Shell PLC, ADR | | | 750,642 | | | | 46,524,791 | |
| | | | | | | | |
| | |
| | | | | | | 416,527,418 | |
| | | | | | | | |
| Security | | Shares | | | Value | |
| | |
| Norway — 0.1% | | | | | | |
Equinor ASA | | | 297,438 | | | $ | 8,563,541 | |
| | | | | | | | |
| | |
| Peru — 0.0% | | | | | | |
Credicorp Ltd. | | | 7,421 | | | | 1,005,397 | |
Southern Copper Corp. | | | 20,968 | | | | 1,610,972 | |
| | | | | | | | |
| | |
| | | | | | | 2,616,369 | |
| | |
| Poland — 0.0% | | | | | | |
Polski Koncern Naftowy ORLEN SA | | | 54,006 | | | | 823,933 | |
| | | | | | | | |
| | |
| Saudi Arabia — 0.0% | | | | | | |
Dr Sulaiman Al Habib Medical Services Group Co. | | | 7,013 | | | | 538,710 | |
Saudi Telecom Co. | | | 130,818 | | | | 1,574,522 | |
| | | | | | | | |
| | |
| | | | | | | 2,113,232 | |
| | |
| Singapore — 0.1% | | | | | | |
DBS Group Holdings Ltd. | | | 147,000 | | | | 3,632,363 | |
Genting Singapore Ltd. | | | 1,721,800 | | | | 1,464,778 | |
Keppel Corp. Ltd. | | | 267,500 | | | | 1,242,106 | |
NetLink NBN Trust | | | 663,400 | | | | 435,493 | |
Oversea-Chinese Banking Corp. Ltd. | | | 108,900 | | | | 1,030,290 | |
Sembcorp Marine Ltd.(e) | | | 16,079,274 | | | | 1,499,596 | |
Singapore Airlines Ltd. | | | 207,800 | | | | 913,964 | |
Singapore Technologies Engineering Ltd. | | | 480,900 | | | | 1,309,165 | |
| | | | | | | | |
| | |
| | | | | | | 11,527,755 | |
| | |
| South Africa — 0.0% | | | | | | |
Anglo American Platinum Ltd. | | | 22,358 | | | | 1,325,571 | |
Anglo American PLC | | | 78,727 | | | | 2,425,907 | |
Kumba Iron Ore Ltd. | | | 84,377 | | | | 2,051,769 | |
| | | | | | | | |
| | |
| | | | | | | 5,803,247 | |
| | |
| South Korea — 0.2% | | | | | | |
Amorepacific Corp.(g) | | | 146,319 | | | | 13,537,670 | |
Celltrion Healthcare Co. Ltd. | | | 25,300 | | | | 1,318,792 | |
Fila Holdings Corp. | | | 20,577 | | | | 565,179 | |
Hana Financial Group, Inc. | | | 27,771 | | | | 872,666 | |
Hanwha Aerospace Co. Ltd. | | | 31,957 | | | | 2,459,134 | |
KB Financial Group, Inc. | | | 24,599 | | | | 913,021 | |
Korea Shipbuilding & Offshore Engineering Co. Ltd.(e) | | | 10,469 | | | | 665,874 | |
Samsung Electronics Co. Ltd. | | | 162,343 | | | | 7,987,939 | |
Samsung Fire & Marine Insurance Co. Ltd. | | | 13,067 | | | | 2,198,211 | |
SK Telecom Co. Ltd. | | | 72,512 | | | | 2,583,857 | |
| | | | | | | | |
| | |
| | | | | | | 33,102,343 | |
| | |
| Spain — 0.6% | | | | | | |
Aena SME SA(b)(e) | | | 6,729 | | | | 1,133,277 | |
Cellnex Telecom SA(b) | | | 2,368,223 | | | | 99,711,652 | |
Endesa SA | | | 45,024 | | | | 1,010,011 | |
Industria de Diseno Textil SA | | | 102,014 | | | | 3,506,911 | |
| | | | | | | | |
| | |
| | | | | | | 105,361,851 | |
| | |
| Sweden — 0.2% | | | | | | |
Assa Abloy AB, Class B | | | 226,796 | | | | 5,403,641 | |
Epiroc AB, Class A | | | 421,862 | | | | 8,451,191 | |
Hexagon AB, B Shares | | | 749,156 | | | | 8,577,616 | |
Industrivarden AB, A Shares | | | 44,476 | | | | 1,272,598 | |
Investor AB, B Shares | | | 86,303 | | | | 1,854,059 | |
Nibe Industrier AB, B Shares | | | 184,697 | | | | 2,068,029 | |
Swedbank AB, A Shares | | | 212,504 | | | | 3,692,561 | |
| | |
CONSOLIDATED SCHEDULE OF INVESTMENTS | | 15 |
| | |
Consolidated Schedule of Investments (continued) April 30, 2023 | | BlackRock Global Allocation Fund, Inc. (Percentages shown are based on Net Assets) |
| | | | | | | | |
| Security | | Shares | | | Value | |
| | |
| Sweden (continued) | | | | | | |
Telefonaktiebolaget LM Ericsson, B Shares | | | 805,686 | | | $ | 4,435,859 | |
Telia Co. AB | | | 2,474,841 | | | | 6,890,378 | |
| | | | | | | | |
| | |
| | | | | | | 42,645,932 | |
| | |
| Switzerland — 1.9% | | | | | | |
Alcon, Inc. | | | 771,701 | | | | 56,192,423 | |
Clariant AG, Registered Shares | | | 35,294 | | | | 588,711 | |
Coca-Cola HBC AG, Class DI | | | 105,520 | | | | 3,221,176 | |
Flughafen Zurich AG, Registered Shares | | | 7,771 | | | | 1,495,674 | |
Geberit AG, Registered Shares | | | 1,736 | | | | 988,760 | |
Givaudan SA, Registered Shares | | | 673 | | | | 2,354,132 | |
Kuehne and Nagel International AG, Registered Shares | | | 15,889 | | | | 4,707,210 | |
Lonza Group AG, Registered Shares | | | 35,432 | | | | 22,096,815 | |
Nestle SA, Registered Shares | | | 1,154,835 | | | | 148,153,275 | |
Novartis AG, Registered Shares | | | 78,337 | | | | 8,013,395 | |
Partners Group Holding AG | | | 1,281 | | | | 1,243,509 | |
Roche Holding AG | | | 97,191 | | | | 30,434,404 | |
Sonova Holding AG, Registered Shares | | | 5,361 | | | | 1,700,113 | |
STMicroelectronics NV | | | 238,195 | | | | 10,189,287 | |
Swisscom AG, Registered Shares | | | 1,797 | | | | 1,233,731 | |
TE Connectivity Ltd. | | | 375,636 | | | | 45,966,577 | |
VAT Group AG(b) | | | 3,799 | | | | 1,340,247 | |
| | | | | | | | |
| | |
| | | | | | | 339,919,439 | |
| | |
| Taiwan — 0.4% | | | | | | |
Chunghwa Telecom Co. Ltd. | | | 584,000 | | | | 2,416,496 | |
Far EasTone Telecommunications Co. Ltd. | | | 457,000 | | | | 1,174,201 | |
MediaTek, Inc. | | | 79,000 | | | | 1,717,763 | |
Nan Ya Printed Circuit Board Corp. | | | 84,000 | | | | 756,248 | |
Oneness Biotech Co. Ltd.(e) | | | 155,000 | | | | 1,219,472 | |
Taiwan Semiconductor Manufacturing Co. Ltd. | | | 4,087,000 | | | | 66,927,051 | |
Unimicron Technology Corp. | | | 450,000 | | | | 2,138,105 | |
Wiwynn Corp. | | | 68,000 | | | | 2,587,851 | |
| | | | | | | | |
| | |
| | | | | | | 78,937,187 | |
| | |
| United Arab Emirates — 0.0% | | | | | | |
NMC Health PLC(d)(e) | | | 1,077,976 | | | | 14 | |
| | | | | | | | |
| | |
| United Kingdom — 2.6% | | | | | | |
Admiral Group PLC | | | 6,642 | | | | 193,044 | |
AstraZeneca PLC | | | 340,825 | | | | 50,156,807 | |
AstraZeneca PLC, ADR | | | 388,593 | | | | 28,452,779 | |
Auto Trader Group PLC(b) | | | 1,267,951 | | | | 10,139,768 | |
BAE Systems PLC | | | 4,976,499 | | | | 63,400,502 | |
BP PLC | | | 726,231 | | | | 4,872,280 | |
British American Tobacco PLC | | | 79,045 | | | | 2,920,380 | |
Burberry Group PLC | | | 85,870 | | | | 2,802,967 | |
CNH Industrial NV | | | 336,444 | | | | 4,734,385 | |
Compass Group PLC | | | 2,797,962 | | | | 73,812,927 | |
Direct Line Insurance Group PLC | | | 627,199 | | | | 1,355,657 | |
Dr. Martens PLC | | | 3,972 | | | | 8,281 | |
Ferguson PLC | | | 17,074 | | | | 2,412,523 | |
Genius Sports Ltd.(e)(g) | | | 635,957 | | | | 2,359,400 | |
GSK PLC | | | 177,484 | | | | 3,200,598 | |
Hedosophia European Growth(e) | | | 637,585 | | | | 7,020,508 | |
Kingfisher PLC | | | 497,779 | | | | 1,613,350 | |
Legal & General Group PLC | | | 407,169 | | | | 1,201,361 | |
Lloyds Banking Group PLC | | | 104,505,291 | | | | 63,489,122 | |
London Stock Exchange Group PLC | | | 109,337 | | | | 11,479,649 | |
National Grid PLC | | | 55,939 | | | | 802,049 | |
NatWest Group PLC | | | 1,240,131 | | | | 4,085,112 | |
RELX PLC(i) | | | 329,917 | | | | 10,992,402 | |
| | | | | | | | |
| Security | | Shares | | | Value | |
| | |
| United Kingdom (continued) | | | | | | |
Spirax-Sarco Engineering PLC | | | 115,018 | | | $ | 16,072,618 | |
Standard Chartered PLC | | | 110,893 | | | | 878,620 | |
Unilever PLC | | | 1,929,448 | | | | 107,435,775 | |
| | | | | | | | |
| | |
| | | | | | | 475,892,864 | |
| | |
| United States — 33.9% | | | | | | |
3M Co. | | | 27,796 | | | | 2,952,491 | |
Abbott Laboratories(j) | | | 848,645 | | | | 93,749,813 | |
AbbVie, Inc.(j) | | | 292,447 | | | | 44,194,591 | |
Activision Blizzard, Inc. | | | 414,952 | | | | 32,245,920 | |
Adobe, Inc.(e) | | | 24,788 | | | | 9,358,957 | |
Advance Auto Parts, Inc. | | | 23,182 | | | | 2,910,036 | |
Advanced Micro Devices, Inc.(e) | | | 903,241 | | | | 80,722,648 | |
Agilent Technologies, Inc. | | | 13,792 | | | | 1,867,851 | |
Air Products and Chemicals, Inc. | | | 243,985 | | | | 71,819,425 | |
Airbnb, Inc., Class A(e) | | | 15,765 | | | | 1,886,598 | |
Akamai Technologies, Inc.(e) | | | 24,489 | | | | 2,007,363 | |
Albemarle Corp. | | | 229,223 | | | | 42,511,698 | |
Alliant Energy Corp. | | | 44,828 | | | | 2,471,816 | |
Allstate Corp. | | | 42,131 | | | | 4,877,085 | |
Alphabet, Inc., Class C(e)(j) | | | 2,550,549 | | | | 276,020,413 | |
Altria Group, Inc. | | | 110,103 | | | | 5,230,994 | |
Amazon.com, Inc.(e)(j) | | | 1,832,841 | | | | 193,273,083 | |
American International Group, Inc. | | | 69,307 | | | | 3,676,043 | |
American Tower Corp. | | | 324,243 | | | | 66,272,027 | |
AmerisourceBergen Corp. | | | 31,931 | | | | 5,327,687 | |
Amgen, Inc. | | | 18,581 | | | | 4,454,609 | |
ANSYS, Inc.(e) | | | 58,966 | | | | 18,510,607 | |
APA Corp. | | | 29,108 | | | | 1,072,630 | |
Apple, Inc.(j) | | | 1,915,576 | | | | 325,034,936 | |
Applied Materials, Inc. | | | 292,702 | | | | 33,084,107 | |
Aptiv PLC(e) | | | 279,288 | | | | 28,727,564 | |
Archer-Daniels-Midland Co. | | | 1,123,246 | | | | 87,703,048 | |
Astra Space, Inc. | | | 748,566 | | | | 316,269 | |
AT&T, Inc. | | | 84,230 | | | | 1,488,344 | |
Atlas Energy Solutions, Inc., Class A | | | 73,517 | | | | 1,326,247 | |
Atlassian Corp., Class A(e) | | | 5,209 | | | | 769,161 | |
Automatic Data Processing, Inc. | | | 12,418 | | | | 2,731,960 | |
AutoZone, Inc.(e) | | | 2,800 | | | | 7,457,268 | |
Ball Corp. | | | 23,107 | | | | 1,228,830 | |
Bank of America Corp.(j) | | | 383,634 | | | | 11,232,804 | |
Berkshire Hathaway, Inc., Class B(e) | | | 29,868 | | | | 9,813,131 | |
BioMarin Pharmaceutical, Inc.(e) | | | 28,300 | | | | 2,717,932 | |
Booking Holdings, Inc.(e) | | | 6,749 | | | | 18,129,906 | |
Boston Scientific Corp.(e)(j) | | | 2,303,420 | | | | 120,054,250 | |
Broadcom, Inc. | | | 3,017 | | | | 1,890,151 | |
Brown-Forman Corp., Class B | | | 70,914 | | | | 4,615,792 | |
Bunge Ltd. | | | 325,400 | | | | 30,457,440 | |
Cadence Design Systems, Inc.(e) | | | 157,701 | | | | 33,030,474 | |
California Resources Corp. | | | 96,554 | | | | 3,910,437 | |
Cardinal Health, Inc. | | | 71,028 | | | | 5,831,399 | |
Carrier Global Corp. | | | 86,519 | | | | 3,618,225 | |
CDW Corp. | | | 8,384 | | | | 1,421,843 | |
Centene Corp.(e) | | | 42,392 | | | | 2,922,081 | |
CF Industries Holdings, Inc. | | | 668,060 | | | | 47,819,735 | |
Charter Communications, Inc., Class A(e) | | | 91,768 | | | | 33,834,862 | |
Cheniere Energy, Inc. | | | 16,129 | | | | 2,467,737 | |
Chesapeake Energy Corp. | | | 70,609 | | | | 5,837,952 | |
Chevron Corp. | | | 34,079 | | | | 5,745,038 | |
Chipotle Mexican Grill, Inc.(e) | | | 5,475 | | | | 11,320,219 | |
Chubb Ltd. | | | 444,974 | | | | 89,688,959 | |
Cigna Group | | | 32,236 | | | | 8,165,056 | |
| | |
| 16 | | 2 0 2 3 BLACK ROCK ANNUAL REPORT TO SHAREHOLDERS |
| | |
Consolidated Schedule of Investments (continued) April 30, 2023 | | BlackRock Global Allocation Fund, Inc. (Percentages shown are based on Net Assets) |
| | | | | | | | |
| Security | | Shares | | | Value | |
| | |
| United States (continued) | | | | | | |
Cintas Corp. | | | 12,438 | | | $ | 5,668,867 | |
Cisco Systems, Inc. | | | 207,380 | | | | 9,798,705 | |
CME Group, Inc., Class A | | | 36,890 | | | | 6,853,055 | |
Coca-Cola Co. | | | 99,002 | | | | 6,350,978 | |
Colgate-Palmolive Co. | | | 81,376 | | | | 6,493,805 | |
Comcast Corp., Class A | | | 950,906 | | | | 39,338,981 | |
ConocoPhillips(j) | | | 316,468 | | | | 32,561,393 | |
Constellation Brands, Inc., Class A | | | 51,004 | | | | 11,703,888 | |
Copart, Inc.(e) | | | 64,033 | | | | 5,061,809 | |
Costco Wholesale Corp. | | | 176,680 | | | | 88,908,910 | |
Crowdstrike Holdings, Inc., Class A(e) | | | 148,020 | | | | 17,769,801 | |
Crown Castle, Inc. | | | 6,520 | | | | 802,547 | |
Crown Holdings, Inc. | | | 20,542 | | | | 1,762,093 | |
Crown PropTech Acquisitions(d) | | | 227,312 | | | | 147,753 | |
Danaher Corp. | | | 6,160 | | | | 1,459,366 | |
Davidson Kempner Merchant Co-investment Fund LP, (Acquired 04/01/21, Cost: $4,809,288)(h)(k) | | | — | (l) | | | 23,013,788 | |
Deere & Co. | | | 105,736 | | | | 39,970,323 | |
Dell Technologies, Inc., Class C | | | 50,582 | | | | 2,199,811 | |
Delta Air Lines, Inc.(e) | | | 1,167,276 | | | | 40,049,240 | |
Dexcom, Inc.(e) | | | 258,041 | | | | 31,310,695 | |
Domino’s Pizza, Inc. | | | 8,222 | | | | 2,610,238 | |
Dow, Inc. | | | 71,670 | | | | 3,898,848 | |
Dynatrace, Inc.(e) | | | 521,597 | | | | 22,053,121 | |
eBay, Inc. | | | 40,487 | | | | 1,879,811 | |
Ecolab, Inc. | | | 7,206 | | | | 1,209,455 | |
Edison International | | | 91,856 | | | | 6,760,602 | |
Edwards Lifesciences Corp.(e) | | | 285,353 | | | | 25,105,357 | |
Element Solutions, Inc. | | | 183,943 | | | | 3,338,565 | |
Eli Lilly & Co. | | | 177,811 | | | | 70,388,262 | |
EOG Resources, Inc. | | | 22,683 | | | | 2,709,938 | |
Epic Games, Inc., (Acquired 07/02/20,
Cost: $23,484,725)(d)(h) | | | 40,843 | | | | 29,362,441 | |
EQT Corp. | | | 1,067,845 | | | | 37,203,720 | |
Eversource Energy | | | 89,008 | | | | 6,907,911 | |
Expedia Group, Inc.(e) | | | 20,273 | | | | 1,904,851 | |
Exxon Mobil Corp. | | | 34,719 | | | | 4,108,646 | |
F5, Inc.(e) | | | 333,496 | | | | 44,808,523 | |
Fanatics Holdings, Inc., (Acquired 12/15/21, Cost: $40,652,984)(d)(h) | | | 599,248 | | | | 47,076,923 | |
Fastenal Co. | | | 64,367 | | | | 3,465,519 | |
Fidelity National Information Services, Inc. | | | 83,625 | | | | 4,910,460 | |
First Solar, Inc.(e) | | | 8,596 | | | | 1,569,458 | |
FleetCor Technologies, Inc.(e) | | | 13,501 | | | | 2,888,134 | |
Floor & Decor Holdings, Inc., Class A(e)(g) | | | 115,052 | | | | 11,429,266 | |
Fortinet, Inc.(e) | | | 423,547 | | | | 26,704,638 | |
Fortive Corp. | | | 1,358,142 | | | | 85,685,179 | |
Fox Corp., Class A | | | 22,220 | | | | 739,037 | |
FQT Private(d) | | | 2,439,185 | | | | 3,000,198 | |
Freeport-McMoRan, Inc.(j) | | | 1,341,867 | | | | 50,870,178 | |
Gartner, Inc.(e) | | | 5,709 | | | | 1,726,744 | |
Gen Digital, Inc. | | | 235,185 | | | | 4,155,719 | |
Generac Holdings, Inc.(e) | | | 8,813 | | | | 900,865 | |
General Dynamics Corp. | | | 22,165 | | | | 4,839,506 | |
General Electric Co. | | | 19,970 | | | | 1,976,431 | |
General Motors Co. | | | 240,809 | | | | 7,956,329 | |
Genuine Parts Co. | | | 5,924 | | | | 997,068 | |
Gilead Sciences, Inc. | | | 107,365 | | | | 8,826,477 | |
Global Payments, Inc. | | | 21,988 | | | | 2,478,267 | |
Goldman Sachs Group, Inc. | | | 17,260 | | | | 5,927,774 | |
| | | | | | | | |
| Security | | Shares | | | Value | |
| | |
| United States (continued) | | | | | | |
Grand Rounds, Inc., (Acquired 02/11/22, Cost: $31,181,561)(d)(h) | | | 11,562,554 | | | $ | 14,800,069 | |
Halliburton Co. | | | 152,894 | | | | 5,007,279 | |
Hartford Financial Services Group, Inc. | | | 13,328 | | | | 946,155 | |
Health Care Select Sector SPDR Fund | | | 42,280 | | | | 5,645,648 | |
Healthpeak Properties, Inc. | | | 185,451 | | | | 4,074,358 | |
Hewlett Packard Enterprise Co. | | | 399,435 | | | | 5,719,909 | |
Hilton Worldwide Holdings, Inc. | | | 325,324 | | | | 46,853,162 | |
Honeywell International, Inc. | | | 9,268 | | | | 1,852,117 | |
Humana, Inc. | | | 166,334 | | | | 88,238,524 | |
iHeartMedia, Inc., Class A(e) | | | 10,778 | | | | 37,400 | |
Illinois Tool Works, Inc. | | | 21,554 | | | | 5,214,775 | |
Informatica, Inc., Class A(e)(g) | | | 332,850 | | | | 5,145,861 | |
Intel Corp. | | | 26,677 | | | | 828,588 | |
Intercontinental Exchange, Inc. | | | 30,306 | | | | 3,301,233 | |
Intuit, Inc. | | | 73,646 | | | | 32,695,142 | |
Intuitive Surgical, Inc.(e) | | | 196,892 | | | | 59,307,808 | |
Invesco Municipal Opportunity Trust | | | 208,538 | | | | 1,993,623 | |
Invesco Municipal Trust | | | 206,960 | | | | 1,990,955 | |
Invesco Quality Municipal Income Trust | | | 205,405 | | | | 2,002,699 | |
Invesco Trust for Investment Grade Municipals | | | 210,256 | | | | 2,064,714 | |
Invesco Value Municipal Income Trust | | | 175,143 | | | | 2,129,739 | |
Jawbone Health Hub, Inc., (Acquired 01/24/17, Cost: $0)(d)(h) | | | 1,518,232 | | | | 15 | |
Johnson & Johnson | | | 446,590 | | | | 73,106,783 | |
Johnson Controls International PLC | | | 62,731 | | | | 3,753,823 | |
JPMorgan Chase & Co. | | | 307,712 | | | | 42,538,107 | |
Kellogg Co. | | | 21,641 | | | | 1,509,893 | |
Keurig Dr. Pepper, Inc. | | | 34,860 | | | | 1,139,922 | |
Kimberly-Clark Corp. | | | 19,340 | | | | 2,802,173 | |
Kinder Morgan, Inc. | | | 172,325 | | | | 2,955,374 | |
KLA Corp. | | | 66,923 | | | | 25,868,416 | |
Kroger Co. | | | 82,787 | | | | 4,025,932 | |
Latch, Inc. | | | 520,854 | | | | 411,370 | |
Liberty Media Corp.-Liberty SiriusXM, Class A(e) | | | 722,082 | | | | 20,290,504 | |
Liberty Media Corp.-Liberty SiriusXM, Class C(e) | | | 794,493 | | | | 22,198,134 | |
Lincoln National Corp. | | | 90,124 | | | | 1,958,395 | |
Linde PLC | | | 24,417 | | | | 9,020,861 | |
Lions Gate Entertainment Corp., Class A(e)(g) | | | 468,819 | | | | 5,391,419 | |
Lockheed Martin Corp. | | | 137,214 | | | | 63,729,042 | |
Lookout, Inc., (Acquired 03/04/15, Cost: $2,002,652)(d)(h) | | | 175,316 | | | | 441,796 | |
Lowe’s Cos., Inc. | | | 47,906 | | | | 9,956,304 | |
LPL Financial Holdings, Inc. | | | 414,162 | | | | 86,493,592 | |
LyondellBasell Industries NV, Class A | | | 88,967 | | | | 8,417,168 | |
Marathon Oil Corp. | | | 1,342,793 | | | | 32,441,879 | |
Marathon Petroleum Corp. | | | 55,960 | | | | 6,827,120 | |
Marsh & McLennan Cos., Inc. | | | 763,766 | | | | 137,622,996 | |
Masco Corp. | | | 115,547 | | | | 6,182,920 | |
Masimo Corp.(e) | | | 50,866 | | | | 9,620,795 | |
Mastercard, Inc., Class A | | | 380,091 | | | | 144,445,983 | |
McDonald’s Corp. | | | 204,874 | | | | 60,591,485 | |
McKesson Corp. | | | 30,729 | | | | 11,192,731 | |
Merck & Co., Inc. | | | 949,403 | | | | 109,627,564 | |
Meta Platforms, Inc., Class A(e) | | | 21,062 | | | | 5,061,620 | |
MetLife, Inc. | | | 45,756 | | | | 2,806,215 | |
Mettler-Toledo International, Inc.(e) | | | 2,440 | | | | 3,639,260 | |
MGM Resorts International | | | 152,515 | | | | 6,850,974 | |
Microchip Technology, Inc. | | | 29,237 | | | | 2,134,009 | |
Micron Technology, Inc. | | | 733,018 | | | | 47,177,038 | |
| | |
CONSOLIDATED SCHEDULE OF INVESTMENTS | | 17 |
| | |
Consolidated Schedule of Investments (continued) April 30, 2023 | | BlackRock Global Allocation Fund, Inc. (Percentages shown are based on Net Assets) |
| | | | | | | | | | |
| Security | | | | Shares | | | Value | |
| | | |
| United States (continued) | | | | | | | | |
Microsoft Corp.(j) | | | | | 1,604,528 | | | $ | 493,007,273 | |
Mirion Technologies, Inc. | | | | | 2,672,710 | | | | 21,648,951 | |
Mirion Technologies, Inc.(e)(g) | | | | | 223,121 | | | | 1,807,280 | |
Moderna, Inc.(e) | | | | | 4,804 | | | | 638,404 | |
Moody’s Corp. | | | | | 15,780 | | | | 4,941,034 | |
Morgan Stanley | | | | | 44,000 | | | | 3,958,680 | |
Mr. Cooper Group, Inc.(e) | | | | | 106,908 | | | | 4,949,840 | |
Netflix, Inc.(e) | | | | | 7,011 | | | | 2,313,139 | |
NextEra Energy, Inc. | | | | | 1,385,987 | | | | 106,208,184 | |
NIKE, Inc., Class B | | | | | 98,715 | | | | 12,509,165 | |
Northrop Grumman Corp. | | | | | 208,293 | | | | 96,079,312 | |
NRG Energy, Inc. | | | | | 27,849 | | | | 951,600 | |
Nucor Corp. | | | | | 17,126 | | | | 2,537,731 | |
Nuveen Municipal Value Fund, Inc. | | | | | 324,048 | | | | 2,851,622 | |
NVIDIA Corp.(j) | | | | | 137,639 | | | | 38,193,446 | |
Offerpad Solutions, Inc. | | | | | 573,570 | | | | 268,029 | |
Omnicom Group, Inc. | | | | | 6,685 | | | | 605,460 | |
Opendoor Technologies, Inc.(e)(g) | | | | | 744,088 | | | | 1,026,841 | |
Otis Worldwide Corp. | | | | | 140,973 | | | | 12,024,997 | |
Palo Alto Networks, Inc.(e) | | | | | 140,354 | | | | 25,608,991 | |
Park Hotels & Resorts, Inc. | | | | | 134,442 | | | | 1,620,026 | |
Paycom Software, Inc.(e) | | | | | 24,874 | | | | 7,222,663 | |
Peloton Interactive, Inc., Class A(e)(g) | | | | | 511,875 | | | | 4,545,450 | |
PepsiCo, Inc. | | | | | 69,478 | | | | 13,262,655 | |
Pfizer, Inc. | | | | | 390,891 | | | | 15,201,751 | |
Philip Morris International, Inc. | | | | | 57,847 | | | | 5,782,965 | |
Phillips 66 | | | | | 33,954 | | | | 3,361,446 | |
Playstudios, Inc. | | | | | 831,348 | | | | 3,641,304 | |
Procter & Gamble Co. | | | | | 42,088 | | | | 6,581,721 | |
Proof Acquisition Corp.(d) | | | | | 108,512 | | | | 45,575 | |
Public Storage | | | | | 27,979 | | | | 8,249,049 | |
Rockwell Automation, Inc. | | | | | 98,260 | | | | 27,847,867 | |
Rotor Acquisition Corp. | | | | | 87,039 | | | | 41,779 | |
RXO, Inc.(e) | | | | | 51,978 | | | | 940,282 | |
S&P Global, Inc. | | | | | 63,433 | | | | 22,999,537 | |
Salesforce, Inc.(e) | | | | | 166,976 | | | | 33,123,029 | |
Sarcos Technology & Robotics Corp. | | | | | 3,560,566 | | | | 1,424,582 | |
Sarcos Technology & Robotics Corp.(e) | | | | | 164,137 | | | | 65,671 | |
Schlumberger NV | | | | | 361,188 | | | | 17,824,628 | |
Sealed Air Corp. | | | | | 100,161 | | | | 4,806,726 | |
Sempra Energy | | | | | 753,176 | | | | 117,111,336 | |
ServiceNow, Inc.(e) | | | | | 4,834 | | | | 2,220,836 | |
Sirius XM Holdings, Inc. | | | | | 158,482 | | | | 602,232 | |
Snorkel AI, Inc., (Acquired 06/30/21, Cost: $1,060,929)(d)(h) | | | | | 70,636 | | | | 547,429 | |
Snowflake, Inc., Class A(e) | | | | | 9,051 | | | | 1,340,272 | |
Sonder Holdings, Inc., Class A | | | | | 830,701 | | | | 340,670 | |
SPDR S&P Metals & Mining ETF(g) | | | | | 56,433 | | | | 2,787,790 | |
Starbucks Corp. | | | | | 501,765 | | | | 57,346,722 | |
Sun Country Airlines Holdings, Inc. | | | | | 963,151 | | | | 19,002,969 | |
Symbotic Corp., Class A | | | | | 235,530 | | | | 6,255,677 | |
Symbotic, Inc.(e) | | | | | 20,080 | | | | 533,325 | |
Synchrony Financial | | | | | 55,606 | | | | 1,640,933 | |
Synopsys, Inc.(e) | | | | | 3,574 | | | | 1,327,098 | |
Tapestry, Inc. | | | | | 92,032 | | | | 3,755,826 | |
Tesla, Inc.(e) | | | | | 245,157 | | | | 40,281,747 | |
Texas Instruments, Inc. | | | | | 26,349 | | | | 4,405,553 | |
Thermo Fisher Scientific, Inc. | | | | | 182,265 | | | | 101,138,848 | |
TJX Cos., Inc. | | | | | 496,574 | | | | 39,139,963 | |
Tractor Supply Co. | | | | | 9,637 | | | | 2,297,461 | |
| | | | | | | | | | | | |
| Security | | | | | Shares | | | Value | |
| | | |
| United States (continued) | | | | | | | | | |
TransDigm Group, Inc. | | | | | | | 12,770 | | | $ | 9,769,050 | |
Transocean Ltd.(e)(g) | | | | | | | 834,174 | | | | 4,921,627 | |
Travelers Cos., Inc. | | | | | | | 32,274 | | | | 5,846,112 | |
U.S. Bancorp | | | | | | | 15,346 | | | | 526,061 | |
Uber Technologies, Inc.(e) | | | | | | | 271,695 | | | | 8,436,130 | |
Ulta Beauty, Inc.(e) | | | | | | | 3,603 | | | | 1,986,802 | |
Union Pacific Corp. | | | | | | | 9,073 | | | | 1,775,586 | |
United Airlines Holdings, Inc.(e)(g) | | | | | | | 488,718 | | | | 21,405,848 | |
United Parcel Service, Inc., Class B | | | | | | | 357,049 | | | | 64,200,981 | |
United Rentals, Inc. | | | | | | | 5,209 | | | | 1,881,022 | |
UnitedHealth Group, Inc. | | | | | | | 349,301 | | | | 171,887,529 | |
Valero Energy Corp. | | | | | | | 481,677 | | | | 55,233,902 | |
VeriSign, Inc.(e) | | | | | | | 110,241 | | | | 24,451,454 | |
Verisk Analytics, Inc. | | | | | | | 88,037 | | | | 17,088,862 | |
VF Corp. | | | | | | | 199,349 | | | | 4,686,695 | |
Visa, Inc., Class A | | | | | | | 169,296 | | | | 39,400,258 | |
Vulcan Materials Co. | | | | | | | 216,377 | | | | 37,891,940 | |
Walgreens Boots Alliance, Inc. | | | | | | | 174,278 | | | | 6,143,299 | |
Walmart, Inc. | | | | | | | 304,676 | | | | 45,996,936 | |
Walt Disney Co.(e) | | | | | | | 852,042 | | | | 87,334,305 | |
Waters Corp.(e) | | | | | | | 2,974 | | | | 893,271 | |
Wells Fargo & Co. | | | | | | | 1,053,816 | | | | 41,889,186 | |
West Pharmaceutical Services, Inc. | | | | | | | 5,176 | | | | 1,869,778 | |
Whirlpool Corp. | | | | | | | 34,751 | | | | 4,850,892 | |
Willis Towers Watson PLC | | | | | | | 10,766 | | | | 2,493,406 | |
Workday, Inc., Class A(e) | | | | | | | 20,140 | | | | 3,748,860 | |
Yum! Brands, Inc. | | | | | | | 9,111 | | | | 1,280,824 | |
Zoetis, Inc. | | | | | | | 169,398 | | | | 29,776,780 | |
Zscaler, Inc.(e) | | | | | | | 102,834 | | | | 9,265,343 | |
| | | | | | | | |
| | | |
| | | | | | | | | | | 6,207,217,290 | |
| | | | | | | | |
| | | |
Total Common Stocks — 54.7%
(Cost: $7,633,864,057) | | | | | | | | | | | 9,998,746,203 | |
| | | | | | | | |
| | | |
| | | | | | Par (000) | | | | |
| | | |
Corporate Bonds | | | | | | | | | | | | |
| | | |
| Australia(d) — 0.6% | | | | | | | | | |
Oceana Australian Fixed Income Trust | | | | | | | | | | | | |
10.00%, 08/31/23 | | | AUD | | | | 7,008 | | | | 4,631,629 | |
10.25%, 08/31/25 | | | | | | | 13,002 | | | | 8,861,525 | |
Oceana Australian Fixed Income Trust, A Note Upsize(a) | | | | | | | | | | | | |
8.00%, 01/21/24 | | | | | | | 1,940 | | | | 1,266,111 | |
1.00%, 03/28/26 | | | | | | | 10,036 | | | | 6,533,239 | |
Quintis Australia Pty. Ltd.(b)(f)(m) | | | | | | | | | | | | |
(12.00% PIK), (12.00% PIK), 12.00%, 10/01/28 | | | USD | | | | 82,685 | | | | 2,877,422 | |
(7.50% Cash or 8.00% PIK), (7.50% Cash or 8.00% PIK), 7.50%, 10/01/26 | | | | | | | 92,389 | | | | 92,389,186 | |
| | | | | | | | |
| | | |
| | | | | | | | | | | 116,559,112 | |
| | | |
| Austria — 0.1% | | | | | | | | | |
Benteler International AG, 9.38%, 05/15/28(b)(i) | | | EUR | | | | 7,883 | | | | 8,686,281 | |
Klabin Austria GmbH, 3.20%, 01/12/31(b) | | | USD | | | | 1,244 | | | | 994,018 | |
Suzano Austria GmbH, 3.13%, 01/15/32 | | | | | | | 1,692 | | | | 1,340,910 | |
| | | | | | | | |
| | | |
| | | | | | | | | | | 11,021,209 | |
| | |
| 18 | | 2 0 2 3 BLACK ROCK ANNUAL REPORT TO SHAREHOLDERS |
| | |
Consolidated Schedule of Investments (continued) April 30, 2023 | | BlackRock Global Allocation Fund, Inc. (Percentages shown are based on Net Assets) |
| | | | | | | | | | | | |
| Security | | | | | Par (000) | | | Value | |
| | | |
| Bahamas — 0.0% | | | | | | | | | |
Intercorp Peru Ltd., 3.88%, 08/15/29(b) | | | USD | | | | 793 | | | $ | 663,791 | |
| | | | | | | | |
| | | |
| Belgium(c) — 0.0% | | | | | | | | | |
Anheuser-Busch InBev SA, 4.00%, 09/24/25 | | | GBP | | | | 1,100 | | | | 1,358,606 | |
KBC Group NV, (1-year UK Government Bond + 0.92%), 1.25%, 09/21/27(a) | | | | | | | 1,100 | | | | 1,198,535 | |
| | | | | | | | |
| | | |
| | | | | | | | | 2,557,141 | |
| | | |
| Bermuda — 0.0% | | | | | | | | | |
Star Energy Geothermal Darajat II/Star Energy Geothermal Salak, 4.85%, 10/14/38(c) | | | USD | | | | 1,360 | | | | 1,174,105 | |
| | | | | | | | |
| | | |
| Brazil — 0.0% | | | | | | | | | |
Banco do Brasil SA, 6.25%, 04/18/30(b) | | | | | | | 1,405 | | | | 1,393,057 | |
Braskem Netherlands Finance BV, (5-year CMT + 8.22%), 8.50%, 01/23/81(a)(b) | | | | | | | 829 | | | | 821,228 | |
BRF SA, 4.88%, 01/24/30(c) | | | | | | | 1,659 | | | | 1,288,836 | |
Suzano Austria GmbH, 3.75%, 01/15/31 | | | | | | | 1,421 | | | | 1,199,324 | |
| | | | | | | | |
| | | |
| | | | | | | | | | | 4,702,445 | |
| | | |
| British Virgin Islands — 0.0% | | | | | | | | | |
Easy Tactic Ltd., (6.50% Cash or 7.50% PIK), 7.50%, 07/11/28(m) | | | | | | | 1,625 | | | | 225,414 | |
HKT Capital No. 6 Ltd., 3.00%, 01/18/32(c) | | | | | | | 900 | | | | 774,450 | |
New Metro Global Ltd., 4.50%, 05/02/26(c) | | | | | | | 543 | | | | 310,290 | |
| | | | | | | | |
| | | |
| | | | | | | | | | | 1,310,154 | |
| | | |
| Canada — 0.4% | | | | | | | | | |
First Quantum Minerals Ltd.(b) | | | | | | | | | | | | |
7.50%, 04/01/25 | | | | | | | 4,390 | | | | 4,367,392 | |
6.88%, 10/15/27 | | | | | | | 4,329 | | | | 4,187,766 | |
Garda World Security Corp., 7.75%, 02/15/28(b) | | | | | | | 798 | | | | 801,990 | |
HR Ottawa LP, 11.00%, 03/31/31(b) | | | | | | | 49,069 | | | | 47,596,930 | |
Nutrien Ltd., 4.90%, 03/27/28 | | | | | | | 1,670 | | | | 1,676,849 | |
Rogers Communications, Inc.(b) | | | | | | | | | | | | |
2.95%, 03/15/25 | | | | | | | 7,694 | | | | 7,370,446 | |
3.80%, 03/15/32 | | | | | | | 2,034 | | | | 1,831,488 | |
Toronto-Dominion Bank, 2.88%, 04/05/27(c) | | | GBP | | | | 1,100 | | | | 1,261,147 | |
| | | | | | | | |
| | | |
| | | | | | | | | | | 69,094,008 | |
| | | |
| Cayman Islands — 0.2% | | | | | | | | | |
Agile Group Holdings Ltd., 5.50%, 04/21/25(c) | | | USD | | | | 905 | | | | 407,703 | |
China Evergrande Group, 10.00%, 04/11/23(e)(n) | | | | | | | 1,139 | | | | 76,384 | |
China SCE Group Holdings Ltd.(c) | | | | | | | | | | | | |
7.38%, 04/09/24 | | | | | | | 339 | | | | 189,586 | |
7.00%, 05/02/25 | | | | | | | 314 | | | | 111,470 | |
CK Hutchison International 23 Ltd. | | | | | | | | | | | | |
4.75%, 04/21/28(b) | | | | | | | 1,502 | | | | 1,514,639 | |
4.75%, 04/21/28(c) | | | | | | | 480 | | | | 484,039 | |
4.88%, 04/21/33(c) | | | | | | | 405 | | | | 409,577 | |
Fantasia Holdings Group Co. Ltd.(e)(n) | | | | | | | | | | | | |
7.95%, 07/05/22 | | | | | | | 510 | | | | 50,291 | |
10.88%, 01/09/23 | | | | | | | 3,132 | | | | 297,540 | |
9.25%, 07/28/23(c) | | | | | | | 902 | | | | 85,690 | |
9.88%, 10/19/23(c) | | | | | | | 481 | | | | 45,695 | |
IHS Holding Ltd. | | | | | | | | | | | | |
5.63%, 11/29/26(c) | | | | | | | 1,377 | | | | 1,146,611 | |
6.25%, 11/29/28(b) | | | | | | | 1,244 | | | | 991,157 | |
Jingrui Holdings Ltd.,
12.00%, 07/25/22(c)(e)(n) | | | | | | | 1,269 | | | | 104,759 | |
Liberty Costa Rica Senior Secured Finance, 10.88%, 01/15/31(b) | | | | | | | 837 | | | | 794,313 | |
MAF Global Securities Ltd.(c) | | | | | | | | | | | | |
4.75%, 05/07/24 | | | | | | | 1,895 | | | | 1,874,629 | |
| | | | | | | | | | | | |
| Security | | | | | Par (000) | | | Value | |
| | | |
| Cayman Islands (continued) | | | | | | | | | |
MAF Global Securities Ltd.(c) (continued) | | | | | | | | | | | | |
(5-year CMT + 3.54%), 6.38%(a)(o) | | | USD | | | | 829 | | | $ | 811,280 | |
Melco Resorts Finance Ltd., 5.38%, 12/04/29(c) | | | | | | | 1,234 | | | | 1,020,981 | |
MGM China Holdings Ltd., 5.38%, 05/15/24(c) | | | | | | | 400 | | | | 391,950 | |
Modern Land China Co. Ltd.(c)(e)(m)(n) | | | | | | | | | | | | |
(2.00% Cash or 2.00% PIK), 7.00%, 12/30/23 | | | | | | | 150 | | | | 9,872 | |
(2.00% Cash or 2.00% PIK), 8.00%, 12/30/24 | | | | | | | 588 | | | | 37,232 | |
(2.00% Cash or 2.00% PIK), 9.00%, 12/30/25 | | | | | | | 1,072 | | | | 66,182 | |
(2.00% Cash or 2.00% PIK), 9.00%, 12/30/27 | | | | | | | 1,614 | | | | 106,764 | |
(2.00% Cash or 9.00% PIK), 9.00%, 12/30/26 | | | | | | | 326 | | | | 20,951 | |
Ronshine China Holdings Ltd.(c)(e)(n) | | | | | | | | | | | | |
6.75%, 08/05/24 | | | | | | | 200 | | | | 13,000 | |
7.10%, 01/25/25 | | | | | | | 2,778 | | | | 180,570 | |
Sands China Ltd., 4.88%, 06/18/30 | | | | | | | 800 | | | | 724,400 | |
Seagate HDD Cayman, 9.63%, 12/01/32(b) | | | | | | | 5,055 | | | | 5,543,212 | |
Shelf Drilling North Sea Holdings Ltd., 10.25%, 10/31/25(b) | | | | | | | 4,823 | | | | 4,831,440 | |
Sinic Holdings Group Co. Ltd.(e)(n) | | | | | | | | | | | | |
8.50%, 01/24/22(c) | | | | | | | 490 | | | | 4,900 | |
10.50%, 12/31/79 | | | | | | | 1,188 | | | | 11,880 | |
Transocean Titan Financing Ltd., 8.38%, 02/01/28(b) | | | | | | | 1,405 | | | | 1,432,018 | |
Transocean, Inc., 8.75%, 02/15/30(b) | | | | | | | 1,507 | | | | 1,520,548 | |
Vantage Drilling International, 9.50%, 02/15/28(b) | | | | | | | 4,464 | | | | 4,419,549 | |
| | | | | | | | |
| | | |
| | | | | | | | | | | 29,730,812 | |
| | | |
| Chile — 0.0% | | | | | | | | | |
Empresa Nacional del Petroleo, 3.75%, 08/05/26(c) | | | | | | | 1,161 | | | | 1,093,734 | |
Empresa Nacional del Petroleo ENAP, 6.15%, 05/10/33 | | | | | | | 920 | | | | 917,222 | |
Engie Energia Chile SA, 3.40%, 01/28/30(c) | | | | | | | 1,152 | | | | 943,776 | |
Kenbourne Invest SA, 6.88%, 11/26/24(b) | | | | | | | 1,290 | | | | 852,448 | |
| | | | | | | | |
| | | |
| | | | | | | | | | | 3,807,180 | |
| | | |
| China — 0.0% | | | | | | | | | |
China Evergrande Group,
11.50%, 01/22/23(e)(n) | | | | | | | 2,277 | | | | 147,721 | |
Fantasia Holdings Group Co. Ltd., 11.75%, 04/17/22(c)(e)(n) | | | | | | | 2,110 | | | | 200,450 | |
Fortune Star BVI Ltd.(c) | | | | | | | | | | | | |
6.85%, 07/02/24 | | | | | | | 732 | | | | 638,670 | |
5.00%, 05/18/26 | | | | | | | 579 | | | | 365,783 | |
RKPF Overseas Ltd., Series 2019-A, 6.00%, 09/04/25(c) | | | | | | | 877 | | | | 629,686 | |
| | | | | | | | |
| | | |
| | | | | | | | | | | 1,982,310 | |
| | | |
| Colombia — 0.1% | | | | | | | | | |
Ecopetrol SA | | | | | | | | | | | | |
4.13%, 01/16/25 | | | | | | | 2,269 | | | | 2,169,050 | |
4.63%, 11/02/31 | | | | | | | 1,659 | | | | 1,232,637 | |
8.88%, 01/13/33 | | | | | | | 1,785 | | | | 1,725,872 | |
5.88%, 05/28/45 | | | | | | | 1,132 | | | | 736,649 | |
| | |
CONSOLIDATED SCHEDULE OF INVESTMENTS | | 19 |
| | |
Consolidated Schedule of Investments (continued) April 30, 2023 | | BlackRock Global Allocation Fund, Inc. (Percentages shown are based on Net Assets) |
| | | | | | | | | | | | |
| Security | | | | | Par (000) | | | Value | |
| | | |
| Colombia (continued) | | | | | | | | | |
Millicom International Cellular SA, 5.13%, 01/15/28(c) | | | USD | | | | 1,493 | | | $ | 1,317,941 | |
SURA Asset Management SA, 4.88%, 04/17/24(c) | | | | | | | 2,153 | | | | 2,125,011 | |
| | | | | | | | |
| | | |
| | | | | | | | | | | 9,307,160 | |
| | | |
| Dominican Republic — 0.0% | | | | | | | | | |
Aeropuertos Dominicanos Siglo XXI SA, 6.75%, 03/30/29(b) | | | | | | | 1,244 | | | | 1,220,364 | |
| | | | | | | | |
| | | |
| France — 0.1% | | | | | | | | | |
BNP Paribas SA(c) | | | | | | | | | | | | |
3.38%, 01/23/26 | | | GBP | | | | 1,100 | | | | 1,312,060 | |
1.88%, 12/14/27 | | | | | | | 1,100 | | | | 1,181,034 | |
Faurecia SE, 2.75%, 02/15/27(c) | | | EUR | | | | 7,030 | | | | 6,867,272 | |
Sabena Technics Sas, (3-mo. EURIBOR + 5.00%), (Acquired 10/28/22, Cost: $8,143,696), 6.58%, 09/30/29(d)(h) | | | | | | | 8,303 | | | | 9,149,080 | |
Societe Generale SA, 1.88%, 10/03/24(c) | | | GBP | | | | 1,100 | | | | 1,313,348 | |
TotalEnergies Capital International SA, 1.66%, 07/22/26(c) | | | | | | | 1,100 | | | | 1,259,802 | |
| | | | | | | | |
| | | |
| | | | | | | | | | | 21,082,596 | |
| | | |
| Germany — 0.4% | | | | | | | | | |
Adler Pelzer Holding GmbH, 4.13%, 04/01/24(b) | | | EUR | | | | 18,415 | | | | 17,004,274 | |
APCOA Parking Holdings GmbH, (1-mo. EURIBOR + 5.00%),
8.18%, 01/15/27(a)(b) | | | | | | | 9,529 | | | | 10,211,259 | |
Douglas GmbH, 6.00%, 04/08/26(b) | | | | | | | 8,152 | | | | 7,983,368 | |
Kirk Beauty SUN GmbH, (8.25% Cash or 9.00% PIK), 8.25%, 10/01/26(b)(m) | | | | | | | 1,453 | | | | 1,129,049 | |
Project Champion, 10.25%, 03/31/31(d)(i) | | | | | | | 9,500 | | | | 10,167,621 | |
TK Elevator Midco GmbH, 4.38%, 07/15/27(c) | | | | | | | 12,215 | | | | 11,995,970 | |
Volkswagen Bank GmbH, 2.50%, 07/31/26(c) | | | | | | | 6,100 | | | | 6,395,757 | |
Volkswagen Financial Services AG, 0.88%, 01/31/28(c) | | | | | | | 3,928 | | | | 3,729,900 | |
| | | | | | | | |
| | | |
| | | | | | | | | | | 68,617,198 | |
| | | |
| Hong Kong — 0.0% | | | | | | | | | |
AIA Group Ltd.(c) | | | | | | | | | | | | |
4.95%, 04/04/33 | | | USD | | | | 500 | | | | 505,051 | |
(5-year CMT + 1.76%), 2.70%(a)(o) | | | | | | | 1,000 | | | | 872,450 | |
Bank of East Asia Ltd., (5-year CMT + 4.26%), 5.88%(a)(c)(o) | | | | | | | 733 | | | | 668,313 | |
Yango Justice International Ltd.(e)(n) | | | | | | | | | | | | |
10.25%, 09/15/22 | | | | | | | 503 | | | | 10,060 | |
9.25%, 04/15/23(c) | | | | | | | 1,154 | | | | 23,080 | |
7.88%, 09/04/24(c) | | | | | | | 1,223 | | | | 24,460 | |
Yanlord Land HK Co. Ltd., 5.13%, 05/20/26(c) | | | | | | | 464 | | | | 389,267 | |
| | | | | | | | |
| | | | | | | | | | | 2,492,681 | |
| | | |
| India — 0.0% | | | | | | | | | |
Indian Railway Finance Corp. Ltd., 3.25%, 02/13/30(c) | | | | | | | 660 | | | | 584,224 | |
Power Finance Corp. Ltd., 4.50%, 06/18/29(c) | | | | | | | 500 | | | | 476,187 | |
REC Ltd.(c) | | | | | | | | | | | | |
2.75%, 01/13/27 | | | | | | | 500 | | | | 454,938 | |
5.63%, 04/11/28 | | | | | | | 300 | | | | 301,179 | |
REI Agro Ltd.(e)(n) | | | | | | | | | | | | |
5.50%, 11/13/14 | | | | | | | 44,430 | | | | 222,150 | |
5.50%, 11/13/14(d) | | | | | | | 8,271 | | | | 1 | |
| | | | | | | | | | | | |
| Security | | | | | Par (000) | | | Value | |
| | | |
| India (continued) | | | | | | | | | |
ReNew Power Pvt Ltd., 5.88%, 03/05/27(c) | | | USD | | | | 286 | | | $ | 268,536 | |
Shriram Finance Ltd., 4.40%, 03/13/24 | | | | | | | 703 | | | | 680,284 | |
| | | | | | | | |
| | | |
| | | | | | | | | | | 2,987,499 | |
| | | |
| Indonesia(c) — 0.0% | | | | | | | | | |
Bank Negara Indonesia Persero Tbk PT, 3.75%, 03/30/26 | | | | | | | 722 | | | | 665,052 | |
Freeport Indonesia PT, 4.76%, 04/14/27 | | | | | | | 2,217 | | | | 2,185,546 | |
Pertamina Geothermal Energy PT, 5.15%, 04/27/28 | | | | | | | 510 | | | | 511,913 | |
Pertamina Persero PT, 3.65%, 07/30/29 | | | | | | | 2,307 | | | | 2,158,919 | |
Star Energy Geothermal Wayang Windu Ltd., 6.75%, 04/24/33 | | | | | | | 392 | | | | 383,598 | |
Theta Capital Pte. Ltd., 8.13%, 01/22/25 | | | | | | | 666 | | | | 552,281 | |
| | | | | | | | |
| | | |
| | | | | | | | | | | 6,457,309 | |
| | | |
| Isle of Man — 0.0% | | | | | | | | | |
AngloGold Ashanti Holdings PLC, 3.75%, 10/01/30 | | | | | | | 1,869 | | | | 1,638,646 | |
Gohl Capital Ltd., 4.25%, 01/24/27(c) | | | | | | | 1,362 | | | | 1,281,914 | |
| | | | | | | | |
| | | |
| | | | | | | | | | | 2,920,560 | |
| | | |
| Israel(b)(c) — 0.0% | | | | | | | | | |
Bank Leumi Le-Israel BM, (5-year CMT + 3.47%), 7.13%, 07/18/33(a) | | | | | | | 929 | | | | 900,143 | |
Leviathan Bond Ltd., 5.75%, 06/30/23 | | | | | | | 919 | | | | 913,716 | |
| | | | | | | | |
| | | |
| | | | | | | | | | | 1,813,859 | |
| | | |
| Italy(b) — 0.3% | | | | | | | | | |
Castor SpA | | | | | | | | | | | | |
6.00%, 02/15/29 | | | EUR | | | | 2,764 | | | | 2,668,869 | |
(1-mo. EURIBOR + 5.25%), 8.21%, 02/15/29(a) | | | | | | | 8,819 | | | | 9,144,804 | |
Fiber Bidco Spa | | | | | | | | | | | | |
11.00%, 10/25/27 | | | | | | | 4,906 | | | | 5,822,180 | |
(1-mo. EURIBOR + 6.00%), 9.02%, 10/25/27(a) | | | | | | | 3,228 | | | | 3,571,938 | |
Forno d’Asolo SpA, (1-mo. EURIBOR + 5.50%), 8.52%, 04/30/27(a) | | | | | | | 21,390 | | | | 20,505,596 | |
Marcolin SpA, 6.13%, 11/15/26 | | | | | | | 10,346 | | | | 9,457,657 | |
Shiba Bidco SpA, 4.50%, 10/31/28 | | | | | | | 9,744 | | | | 8,912,436 | |
| | | | | | | | |
| | | |
| | | | | | | | | | | 60,083,480 | |
| | | |
| Japan — 0.1% | | | | | | | | | |
Nissan Motor Co. Ltd., 2.65%, 03/17/26(c) | | | | | | | 2,157 | | | | 2,234,091 | |
Rakuten Group, Inc., 10.25%, 11/30/24(b) | | | USD | | | | 1,960 | | | | 1,904,140 | |
Takeda Pharmaceutical Co. Ltd., 5.00%, 11/26/28 | | | | | | | 4,407 | | | | 4,487,514 | |
| | | | | | | | |
| | | |
| | | | | | | | | | | 8,625,745 | |
| | | |
| Jersey — 0.0% | | | | | | | | | |
Aptiv PLC/Aptiv Corp., 3.25%, 03/01/32 | | | | | | | 2,034 | | | | 1,777,255 | |
| | | | | | | | |
| | | |
| Luxembourg — 0.1% | | | | | | | | | |
Atento Luxco 1 SA, 8.00%, 02/10/26(b) | | | | | | | 829 | | | | 217,768 | |
FEL Energy VI SARL, 5.75%, 12/01/40 | | | | | | | 1,757 | | | | 1,482,766 | |
Herens Midco SARL, 5.25%, 05/15/29(b) | | | EUR | | | | 12,016 | | | | 8,806,214 | |
MC Brazil Downstream Trading SARL | | | | | | | | | | | | |
7.25%, 06/30/31(c) | | | USD | | | | 926 | | | | 709,757 | |
7.25%, 06/30/31(b) | | | | | | | 801 | | | | 614,184 | |
| | |
| 20 | | 2 0 2 3 BLACK ROCK ANNUAL REPORT TO SHAREHOLDERS |
| | |
Consolidated Schedule of Investments (continued) April 30, 2023 | | BlackRock Global Allocation Fund, Inc. (Percentages shown are based on Net Assets) |
| | | | | | | | | | | | |
| Security | | | | | Par (000) | | | Value | |
| | | |
| Luxembourg (continued) | | | | | | | | | |
Medtronic Global Holdings SCA, 4.25%, 03/30/28 | | | USD | | | | 4,875 | | | $ | 4,891,886 | |
Sani/Ikos Financial Holdings 1 SARL, 5.63%, 12/15/26(b) | | | EUR | | | | 8,042 | | | | 8,194,781 | |
| | | | | | | | |
| | | |
| | | | | | | | | | | 24,917,356 | |
| | | |
| Macau(c) — 0.0% | | | | | | | | | |
Champion Path Holdings Ltd., 4.50%, 01/27/26 | | | USD | | | | 371 | | | | 326,550 | |
MGM China Holdings Ltd., 5.88%, 05/15/26 | | | | | | | 796 | | | | 759,185 | |
Studio City Finance Ltd., 5.00%, 01/15/29 | | | | | | | 1,334 | | | | 1,045,189 | |
| | | | | | | | |
| | | |
| | | | | | | | | | | 2,130,924 | |
| | | |
| Malaysia(c) — 0.0% | | | | | | | | | |
CIMB Bank Bhd, 2.13%, 07/20/27 | | | | | | | 700 | | | | 639,537 | |
Dua Capital Ltd., 2.78%, 05/11/31 | | | | | | | 1,000 | | | | 856,380 | |
TNB Global Ventures Capital Bhd, 4.85%, 11/01/28 | | | | | | | 1,000 | | | | 1,002,375 | |
| | | | | | | | |
| | | |
| | | | | | | | | | | 2,498,292 | |
| | | |
| Mauritius — 0.0% | | | | | | | | | |
CA Magnum Holdings, 5.38%, 10/31/26(c) | | | | | | | 475 | | | | 416,456 | |
Diamond II Ltd., 7.95%, 07/28/26(b) | | | | | | | 800 | | | | 787,820 | |
HTA Group Ltd., 7.00%, 12/18/25(b) | | | | | | | 459 | | | | 431,116 | |
India Green Energy Holdings,
5.38%, 04/29/24(b) | | | | | | | 829 | | | | 806,202 | |
India Green Power Holdings, 4.00%, 02/22/27(c) | | | | | | | 600 | | | | 523,050 | |
| | | | | | | | |
| | | |
| | | | | | | | | | | 2,964,644 | |
| | | |
| Mexico — 0.1% | | | | | | | | | |
Alpek SAB de CV | | | | | | | | | | | | |
3.25%, 02/25/31(c) | | | | | | | 1,471 | | | | 1,199,141 | |
3.25%, 02/25/31(b) | | | | | | | 379 | | | | 308,956 | |
Braskem Idesa SAPI, 6.99%, 02/20/32(b) | | | | | | | 1,753 | | | | 1,243,315 | |
Comision Federal de Electricidad, 4.88%, 01/15/24 | | | | | | | 2,190 | | | | 2,162,351 | |
Mexico City Airport Trust, 5.50%, 07/31/47(c) | | | | | | | 1,902 | | | | 1,458,358 | |
Petroleos Mexicanos | | | | | | | | | | | | |
6.50%, 03/13/27 | | | | | | | 2,074 | | | | 1,848,764 | |
8.75%, 06/02/29 | | | | | | | 2,221 | | | | 2,033,603 | |
5.95%, 01/28/31 | | | | | | | 2,489 | | | | 1,840,367 | |
6.70%, 02/16/32 | | | | | | | 2,863 | | | | 2,199,142 | |
Trust Fibra Uno, 4.87%, 01/15/30(c) | | | | | | | 1,515 | | | | 1,280,933 | |
| | | | | | | | |
| | | |
| | | | | | | | | | | 15,574,930 | |
| | | |
| MultiNational — 0.2% | | | | | | | | | |
Ardagh Metal Packaging Finance USA LLC/Ardagh Metal Packaging Finance PLC, 2.00%, 09/01/28(c) | | | EUR | | | | 12,215 | | | | 11,171,563 | |
Connect Finco SARL/Connect U.S. Finco LLC, 6.75%, 10/01/26(b) | | | USD | | | | 10,975 | | | | 10,459,757 | |
NXP BV/NXP Funding LLC/NXP USA, Inc. | | | | | | | | | | | | |
4.40%, 06/01/27 | | | | | | | 4,641 | | | | 4,554,468 | |
5.00%, 01/15/33 | | | | | | | 3,728 | | | | 3,637,838 | |
Promigas SA ESP/Gases del Pacifico SAC, 3.75%, 10/16/29(b) | | | | | | | 902 | | | | 731,635 | |
| | | | | | | | |
| | | |
| | | | | | | | | | | 30,555,261 | |
| | | |
| Netherlands — 0.2% | | | | | | | | | |
Braskem Netherlands Finance BV, 7.25%, 02/13/33(b) | | | | | | | 1,500 | | | | 1,429,462 | |
Cooperatieve Rabobank UA, (1-year UK Government Bond + 1.05%), 1.88%, 07/12/28(a)(c) | | | GBP | | | | 1,100 | | | | 1,208,748 | |
| | | | | | | | | | | | |
| Security | | | | | Par (000) | | | Value | |
| | | |
| Netherlands (continued) | | | | | | | | | |
Deutsche Telekom International Finance BV, 2.49%, 09/19/23(b) | | | USD | | | | 1,838 | | | $ | 1,817,584 | |
Equate Petrochemical BV | | | | | | | | | | | | |
4.25%, 11/03/26(c) | | | | | | | 1,097 | | | | 1,069,781 | |
2.63%, 04/28/28(b) | | | | | | | 1,188 | | | | 1,050,489 | |
Greenko Dutch BV, 3.85%, 03/29/26(c) | | | | | | | 470 | | | | 422,647 | |
ING Groep NV, 3.00%, 02/18/26(c) | | | GBP | | | | 1,100 | | | | 1,298,739 | |
MEGlobal BV, 2.63%, 04/28/28(c) | | | USD | | | | 1,053 | | | | 931,115 | |
Metinvest BV, 7.65%, 10/01/27(c) | | | | | | | 829 | | | | 501,027 | |
Minejesa Capital BV, 4.63%, 08/10/30(c) | | | | | | | 1,000 | | | | 881,875 | |
NXP BV/NXP Funding LLC/NXP USA, Inc., 3.40%, 05/01/30 | | | | | | | 2,034 | | | | 1,822,083 | |
Siemens Financieringsmaatschappij NV, 0.65%, 03/11/24(b) | | | | | | | 4,802 | | | | 4,623,254 | |
Teva Pharmaceutical Finance Netherlands II BV | | | | | | | | | | | | |
7.38%, 09/15/29 | | | EUR | | | | 4,935 | | | | 5,501,828 | |
7.88%, 09/15/31 | | | | | | | 3,592 | | | | 4,058,164 | |
Teva Pharmaceutical Finance Netherlands III BV, 8.13%, 09/15/31 | | | USD | | | | 870 | | | | 914,596 | |
Trivium Packaging Finance BV, 5.50%, 08/15/26(b) | | | | | | | 2,265 | | | | 2,198,983 | |
Vivo Energy Investments BV, 5.13%, 09/24/27(b) | | | | | | | 2,292 | | | | 2,075,406 | |
Volkswagen Financial Services NV(c) | | | | | | | | | | | | |
1.88%, 12/03/24 | | | GBP | | | | 600 | | | | 712,660 | |
4.25%, 10/09/25 | | | | | | | 500 | | | | 609,818 | |
Wintershall Dea Finance BV, 0.84%, 09/25/25(c) | | | EUR | | | | 3,600 | | | | 3,668,964 | |
| | | | | | | | |
| | | |
| | | | | | | | | | | 36,797,223 | |
| | | |
| Oman — 0.0% | | | | | | | | | |
OQ SAOC, 5.13%, 05/06/28(b) | | | USD | | | | 829 | | | | 793,788 | |
| | | | | | | | |
| | | |
| Panama — 0.0% | | | | | | | | | |
Aeropuerto Internacional de Tocumen SA, 5.13%, 08/11/61(b) | | | | | | | 829 | | | | 636,931 | |
| | | | | | | | |
| | | |
| Peru — 0.0% | | | | | | | | | |
Inkia Energy Ltd., 5.88%, 11/09/27(c) | | | | | | | 576 | | | | 535,428 | |
| | | | | | | | |
| | | |
| Republic of Korea — 0.1% | | | | | | | | | |
Hanwha Life Insurance Co. Ltd., (5-year CMT + 1.85%), 3.38%, 02/04/32(a)(c) | | | | | | | 600 | | | | 532,987 | |
Kookmin Bank, (5-year CMT + 2.64%), 4.35%(a)(c)(o) | | | | | | | 400 | | | | 385,950 | |
LG Chem Ltd., 2.38%, 07/07/31(c) | | | | | | | 1,100 | | | | 910,800 | |
POSCO(b) | | | | | | | | | | | | |
5.63%, 01/17/26 | | | | | | | 593 | | | | 601,821 | |
5.75%, 01/17/28 | | | | | | | 641 | | | | 665,358 | |
5.88%, 01/17/33 | | | | | | | 200 | | | | 215,500 | |
Shinhan Bank Co. Ltd., 4.50%, 04/12/28(c) | | | | | | | 300 | | | | 299,829 | |
SK Hynix, Inc. | | | | | | | | | | | | |
6.25%, 01/17/26(c) | | | | | | | 400 | | | | 400,076 | |
6.38%, 01/17/28(b) | | | | | | | 2,360 | | | | 2,368,402 | |
6.38%, 01/17/28(c) | | | | | | | 200 | | | | 200,712 | |
2.38%, 01/19/31(c) | | | | | | | 1,000 | | | | 751,437 | |
6.50%, 01/17/33(c) | | | | | | | 250 | | | | 248,094 | |
| | | | | | | | |
| | | |
| | | | | | | | | | | 7,580,966 | |
| | | |
| Singapore — 0.0% | | | | | | | | | |
BOC Aviation Ltd., 3.50%, 09/18/27(c) | | | | | | | 1,000 | | | | 947,375 | |
DBS Group Holdings Ltd., (5-year CMT + 1.92%), 3.30%(a)(c)(o) | | | | | | | 1,000 | | | | 941,438 | |
| | |
CONSOLIDATED SCHEDULE OF INVESTMENTS | | 21 |
| | |
Consolidated Schedule of Investments (continued) April 30, 2023 | | BlackRock Global Allocation Fund, Inc. (Percentages shown are based on Net Assets) |
| | | | | | | | | | | | |
| Security | | | | | Par (000) | | | Value | |
| | | |
| Singapore (continued) | | | | | | | | | |
LLPL Capital Pte. Ltd., 6.88%, 02/04/39(c) | | | USD | | | | 1,216 | | | $ | 1,090,302 | |
Puma International Financing SA, 5.13%, 10/06/24(b) | | | | | | | 1,659 | | | | 1,584,345 | |
TML Holdings Pte. Ltd., 4.35%, 06/09/26(c) | | | | | | | 239 | | | | 219,551 | |
| | | | | | | | |
| | | |
| | | | | | | | | | | 4,783,011 | |
| | | |
| South Africa — 0.0% | | | | | | | | | |
Sasol Financing USA LLC, 6.50%, 09/27/28 | | | | | | | 1,609 | | | | 1,483,096 | |
| | | | | | | | |
| | | |
| Spain(c) — 0.1% | | | | | | | | | |
AI Candelaria Spain SA, 7.50%, 12/15/28 | | | | | | | 1,055 | | | | 963,240 | |
Banco Santander SA(a) | | | | | | | | | | | | |
(1-year EUR Swap + 1.05%), 3.63%, 09/27/26 | | | EUR | | | | 3,300 | | | | 3,604,658 | |
(1-year UK Government Bond + 1.80%), 3.13%, 10/06/26 | | | GBP | | | | 4,000 | | | | 4,680,661 | |
Telefonica Emisiones SA, 5.38%, 02/02/26 | | | | | | | 2,200 | | | | 2,767,378 | |
| | | | | | | | |
| | | |
| | | | | | | | | | | 12,015,937 | |
| | | |
| Sweden — 0.1% | | | | | | | | | |
Swedbank AB, (1-year UK Government Bond + 1.00%), 1.38%, 12/08/27(a)(c) | | | | | | | 1,100 | | | | 1,193,252 | |
Verisure Holding AB | | | | | | | | | | | | |
3.88%, 07/15/26(c) | | | EUR | | | | 2,087 | | | | 2,115,693 | |
3.25%, 02/15/27(c) | | | | | | | 3,810 | | | | 3,679,959 | |
9.25%, 10/15/27(b) | | | | | | | 4,248 | | | | 5,002,599 | |
7.13%, 02/01/28(b) | | | | | | | 2,088 | | | | 2,290,493 | |
Verisure Midholding AB, 5.25%, 02/15/29(c) | | | | | | | 5,294 | | | | 4,695,936 | |
| | | | | | | | |
| | | |
| | | | | | | | | | | 18,977,932 | |
| | | |
| Switzerland — 0.2% | | | | | | | | | |
Credit Suisse AG | | | | | | | | | | | | |
7.95%, 01/09/25 | | | USD | | | | 3,544 | | | | 3,606,941 | |
2.95%, 04/09/25 | | | | | | | 3,890 | | | | 3,621,611 | |
Credit Suisse AG/New York | | | | | | | | | | | | |
3.70%, 02/21/25 | | | | | | | 4,940 | | | | 4,679,168 | |
5.00%, 07/09/27 | | | | | | | 3,861 | | | | 3,722,296 | |
UBS Group AG, (1-year CMT + 0.83%), 1.01%, 07/30/24(a)(b) | | | | | | | 16,347 | | | | 16,118,775 | |
| | | | | | | | |
| | | |
| | | | | | | | | | | 31,748,791 | |
| | | |
| Thailand — 0.0% | | | | | | | | | |
Bangkok Bank PCL | | | | | | | | | | | | |
(5-year CMT + 1.90%), 3.73%, 09/25/34(a)(c) | | | | | | | 832 | | | | 715,156 | |
(5-year CMT + 4.73%), 5.00% | | | | | | | 412 | | | | 384,525 | |
GC Treasury Center Co. Ltd., 2.98%, 03/18/31(c) | | | | | | | 820 | | | | 686,648 | |
Kasikornbank PCL, (5-year CMT + 1.70%), 3.34%, 10/02/31(a)(c) | | | | | | | 369 | | | | 330,670 | |
Krung Thai Bank PCL, (5-year CMT + 3.53%), 4.40%(a)(c)(o) | | | | | | | 396 | | | | 358,454 | |
Muang Thai Life Assurance PCL, (10-year CMT + 2.40%),
3.55%, 01/27/37(a)(c) | | | | | | | 1,000 | | | | 882,375 | |
| | | | | | | | |
| | | |
| | | | | | | | | | | 3,357,828 | |
| | | |
| Turkey — 0.1% | | | | | | | | | |
Bio City Development Co. B.V, 8.00%, 07/06/24(b)(d)(e)(f)(n) | | | | | | | 140,850 | | | | 10,915,875 | |
| | | | | | | | |
| | | | | | | | | | | | |
| Security | | | | | Par (000) | | | Value | |
| | | |
| United Arab Emirates — 0.0% | | | | | | | | | |
Abu Dhabi National Energy Co. PJSC(b) | | | | | | | | | | | | |
4.38%, 01/24/29 | | | USD | | | | 643 | | | $ | 646,215 | |
4.70%, 04/24/33 | | | | | | | 433 | | | | 440,036 | |
DP World Salaam, (5-year CMT + 5.75%), 6.00%(a)(c)(o) | | | | | | | 1,659 | | | | 1,655,371 | |
| | | | | | | | |
| | | |
| | | | | | | | | | | 2,741,622 | |
| | | |
| United Kingdom — 0.8% | | | | | | | | | |
AstraZeneca PLC, 0.70%, 04/08/26 | | | | | | | 7,088 | | | | 6,431,695 | |
Barclays PLC(c) | | | | | | | | | | | | |
3.00%, 05/08/26 | | | GBP | | | | 1,100 | | | | 1,277,040 | |
3.25%, 02/12/27 | | | | | | | 1,100 | | | | 1,262,058 | |
BCP V Modular Services Finance II PLC, 6.13%, 11/30/28(b) | | | | | | | 12,036 | | | | 12,639,492 | |
BCP V Modular Services Finance PLC, 6.75%, 11/30/29(b) | | | EUR | | | | 16,262 | | | | 13,923,861 | |
BG Energy Capital PLC, 5.13%, 12/01/25(c) | | | GBP | | | | 2,009 | | | | 2,534,501 | |
Boparan Finance PLC, 7.63%, 11/30/25(c) | | | | | | | 7,310 | | | | 6,132,219 | |
Deuce Finco PLC, 5.50%, 06/15/27(b) | | | | | | | 23,588 | | | | 25,193,442 | |
HSBC Holdings PLC, 1.75%, 07/24/27(a) | | | | | | | 1,300 | | | | 1,436,415 | |
INEOS Finance PLC | | | | | | | | | | | | |
3.38%, 03/31/26(c) | | | EUR | | | | 4,040 | | | | 4,123,901 | |
6.63%, 05/15/28(b) | | | | | | | 3,871 | | | | 4,231,137 | |
6.75%, 05/15/28(b) | | | USD | | | | 8,135 | | | | 8,037,868 | |
Informa PLC, 3.13%, 07/05/26(c) | | | GBP | | | | 1,100 | | | | 1,279,639 | |
Inspired Entertainment Financing PLC, 7.88%, 06/01/26(b) | | | | | | | 7,442 | | | | 8,849,671 | |
Kane Bidco Ltd.(b) | | | | | | | | | | | | |
5.00%, 02/15/27 | | | EUR | | | | 6,662 | | | | 6,777,229 | |
6.50%, 02/15/27 | | | GBP | | | | 8,008 | | | | 8,856,370 | |
Lloyds Banking Group PLC, 2.25%, 10/16/24(c) | | | | | | | 2,200 | | | | 2,641,616 | |
Marks & Spencer PLC, 3.75%, 05/19/26(c) | | | | | | | 7,361 | | | | 8,418,355 | |
NatWest Group PLC(a)(c) | | | | | | | | | | | | |
(1-year GBP Swap + 1.49%), 2.88%, 09/19/26 | | | | | | | 1,100 | | | | 1,289,585 | |
(1-year GBP Swap + 2.01%), 3.13%, 03/28/27 | | | | | | | 1,100 | | | | 1,280,179 | |
NatWest Markets PLC, 6.38%, 11/08/27(c) | | | | | | | 2,083 | | | | 2,710,555 | |
Santander U.K. Group Holdings PLC, 3.63%, 01/14/26(c) | | | | | | | 1,100 | | | | 1,305,919 | |
Thames Water Utilities Finance PLC, 0.88%, 01/31/28(c) | | | EUR | | | | 3,928 | | | | 3,734,320 | |
Vedanta Resources Finance II PLC, 8.95%, 03/11/25(b) | | | USD | | | | 1,477 | | | | 1,044,977 | |
Virgin Media Secured Finance PLC, 5.00%, 04/15/27(c) | | | GBP | | | | 12,215 | | | | 14,167,934 | |
| | | | | | | | |
| | | |
| | | | | | | | | | | 149,579,978 | |
| | | |
| United States — 5.6% | | | | | | | | | |
AbbVie, Inc., 2.60%, 11/21/24 | | | USD | | | | 11,367 | | | | 10,973,718 | |
Affinity Interactive, 6.88%, 12/15/27(b) | | | | | | | 1,580 | | | | 1,421,191 | |
Alexandria Real Estate Equities, Inc., 1.88%, 02/01/33 | | | | | | | 3,588 | | | | 2,712,288 | |
Allegiant Travel Co.(b) | | | | | | | | | | | | |
8.50%, 02/05/24 | | | | | | | 19,212 | | | | 19,212,000 | |
7.25%, 08/15/27 | | | | | | | 2,340 | | | | 2,311,044 | |
American Express Co., (1-day SOFR + 1.00%), 4.99%, 05/01/26(i) | | | | | | | 4,572 | | | | 4,570,308 | |
| | |
| 22 | | 2 0 2 3 BLACK ROCK ANNUAL REPORT TO SHAREHOLDERS |
| | |
Consolidated Schedule of Investments (continued) April 30, 2023 | | BlackRock Global Allocation Fund, Inc. (Percentages shown are based on Net Assets) |
| | | | | | | | | | | | |
| Security | | | | | Par (000) | | | Value | |
| | | |
| United States (continued) | | | | | | | | | |
American Tower Corp. | | | | | | | | | | | | |
0.45%, 01/15/27 | | | EUR | | | | 8,700 | | | $ | 8,415,922 | |
2.10%, 06/15/30 | | | USD | | | | 2,034 | | | | 1,674,402 | |
2.70%, 04/15/31 | | | | | | | 6,795 | | | | 5,743,084 | |
Amgen, Inc. | | | | | | | | | | | | |
5.50%, 12/07/26(c) | | | GBP | | | | 1,100 | | | | 1,398,871 | |
5.15%, 03/02/28 | | | USD | | | | 12,398 | | | | 12,689,507 | |
2.30%, 02/25/31 | | | | | | | 2,063 | | | | 1,747,839 | |
2.00%, 01/15/32 | | | | | | | 2,034 | | | | 1,648,335 | |
3.35%, 02/22/32 | | | | | | | 6,162 | | | | 5,579,376 | |
Amkor Technology, Inc., 6.63%, 09/15/27(b) | | | | | | | 1,245 | | | | 1,246,235 | |
Anheuser-Busch Cos. LLC/Anheuser-Busch | | | | | | | | | | | | |
InBev Worldwide, Inc., 3.65%, 02/01/26 | | | | | | | 3,695 | | | | 3,632,092 | |
Anheuser-Busch InBev Worldwide, Inc., 3.50%, 06/01/30 | | | | | | | 6,160 | | | | 5,865,148 | |
Astrazeneca Finance LLC, 1.20%, 05/28/26 | | | | | | | 2,004 | | | | 1,834,049 | |
AT&T, Inc. | | | | | | | | | | | | |
1.70%, 03/25/26 | | | | | | | 2,977 | | | | 2,748,788 | |
2.90%, 12/04/26 | | | GBP | | | | 5,155 | | | | 6,002,595 | |
5.50%, 03/15/27(c) | | | | | | | 1,100 | | | | 1,388,322 | |
4.35%, 03/01/29 | | | USD | | | | 2,348 | | | | 2,307,855 | |
Autodesk, Inc., 3.50%, 06/15/27 | | | | | | | 3,799 | | | | 3,677,335 | |
AvalonBay Communities, Inc., 5.00%, 02/15/33 | | | | | | | 2,718 | | | | 2,781,062 | |
Bank of America Corp.(a) | | | | | | | | | | | | |
(1-day SOFR + 1.21%), 2.57%, 10/20/32 | | | | | | | 2,352 | | | | 1,931,363 | |
(1-day SOFR + 1.32%), 2.69%, 04/22/32 | | | | | | | 5,176 | | | | 4,325,208 | |
(1-day SOFR + 1.37%), 1.92%, 10/24/31 | | | | | | | 2,979 | | | | 2,375,924 | |
(1-day SOFR + 1.53%), 1.90%, 07/23/31 | | | | | | | 1,007 | | | | 808,685 | |
(1-day SOFR + 1.63%), 5.20%, 04/25/29 | | | | | | | 13,890 | | | | 13,982,339 | |
(1-day SOFR + 2.15%), 2.59%, 04/29/31 | | | | | | | 3,281 | | | | 2,779,329 | |
(1-mo. EURIBOR + 0.91%), 1.95%, 10/27/26(c) | | | EUR | | | | 3,529 | | | | 3,682,425 | |
(3-mo. LIBOR US + 0.99%), 2.50%, 02/13/31 | | | USD | | | | 4,681 | | | | 3,951,728 | |
Bank of New York Mellon Corp., (1-day SOFR + 1.03%), 4.95%, 04/26/27(a) | | | | | | | 3,698 | | | | 3,724,714 | |
Becton Dickinson & Co., 3.70%, 06/06/27 | | | | | | | 4,631 | | | | 4,486,689 | |
Broadcom Corp./Broadcom Cayman Finance Ltd., 3.88%, 01/15/27 | | | | | | | 2,842 | | | | 2,761,330 | |
Broadcom, Inc. | | | | | | | | | | | | |
1.95%, 02/15/28(b) | | | | | | | 5,274 | | | | 4,629,337 | |
4.11%, 09/15/28 | | | | | | | 6,717 | | | | 6,463,215 | |
4.15%, 11/15/30 | | | | | | | 2,063 | | | | 1,918,773 | |
2.45%, 02/15/31(b) | | | | | | | 2,415 | | | | 1,979,647 | |
4.30%, 11/15/32 | | | | | | | 5,825 | | | | 5,340,952 | |
3.42%, 04/15/33(b) | | | | | | | 8,144 | | | | 6,854,322 | |
Caresyntax, Inc., 15.00%, 12/31/24(d) | | | | | | | 1,102 | | | | 1,215,398 | |
Carrols Restaurant Group, Inc., 5.88%, 07/01/29(b) | | | | | | | 2,751 | | | | 2,277,085 | |
CDI Escrow Issuer, Inc., 5.75%, 04/01/30(b) | | | | | | | 2,252 | | | | 2,171,437 | |
Citigroup, Inc. | | | | | | | | | | | | |
1.75%, 10/23/26 | | | GBP | | | | 1,677 | | | | 1,877,445 | |
(1-day SOFR + 1.15%), 2.67%, 01/29/31(a) | | | USD | | | | 3,830 | | | | 3,282,968 | |
(1-day SOFR + 1.17%), 2.56%, 05/01/32(a) | | | | | | | 2,761 | | | | 2,292,066 | |
(1-day SOFR + 2.11%), 2.57%, 06/03/31(a) | | | | | | | 4,064 | | | | 3,438,934 | |
(3-mo. CME Term SOFR + 1.60%), 3.98%, 03/20/30(a) | | | | | | | 1,032 | | | | 968,205 | |
Cloud Software Group Holdings, Inc., 6.50%, 03/31/29(b) | | | | | | | 3,375 | | | | 3,039,586 | |
Crown Castle, Inc. | | | | | | | | | | | | |
4.45%, 02/15/26 | | | | | | | 3,729 | | | | 3,691,607 | |
4.00%, 03/01/27 | | | | | | | 2,852 | | | | 2,780,881 | |
| | | | | | | | | | | | |
| Security | | | | | Par (000) | | | Value | |
| | | |
| United States (continued) | | | | | | | | | |
Crown Castle, Inc. (continued) | | | | | | | | | | | | |
2.90%, 03/15/27 | | | USD | | | | 3,348 | | | $ | 3,123,059 | |
4.80%, 09/01/28 | | | | | | | 3,810 | | | | 3,815,266 | |
CVS Health Corp. | | | | | | | | | | | | |
3.25%, 08/15/29 | | | | | | | 3,948 | | | | 3,637,360 | |
3.75%, 04/01/30 | | | | | | | 2,063 | | | | 1,932,284 | |
1.75%, 08/21/30 | | | | | | | 5,412 | | | | 4,419,918 | |
2.13%, 09/15/31 | | | | | | | 4,139 | | | | 3,395,656 | |
DAE Funding LLC(c) | | | | | | | | | | | | |
1.55%, 08/01/24 | | | | | | | 979 | | | | 925,339 | |
2.63%, 03/20/25 | | | | | | | 495 | | | | 467,914 | |
Dell International LLC/EMC Corp., 5.25%, 02/01/28 | | | | | | | 3,608 | | | | 3,652,583 | |
Dollar General Corp., 3.88%, 04/15/27 | | | | | | | 3,780 | | | | 3,687,794 | |
Duke Energy Corp., 3.10%, 06/15/28 | | | EUR | | | | 3,474 | | | | 3,650,636 | |
Earthstone Energy Holdings LLC, 8.00%, 04/15/27(b) | | | USD | | | | 8,929 | | | | 8,714,168 | |
Edison International, 6.95%, 11/15/29 | | | | | | | 2,063 | | | | 2,240,781 | |
Elevance Health, Inc. | | | | | | | | | | | | |
4.90%, 02/08/26 | | | | | | | 3,685 | | | | 3,677,976 | |
3.65%, 12/01/27 | | | | | | | 10,292 | | | | 9,991,268 | |
Energy Transfer LP, 4.20%, 09/15/23 | | | | | | | 1,982 | | | | 1,972,733 | |
EQM Midstream Partners LP(b) | | | | | | | | | | | | |
7.50%, 06/01/27 | | | | | | | 810 | | | | 807,100 | |
7.50%, 06/01/30 | | | | | | | 405 | | | | 393,120 | |
Equinix, Inc. | | | | | | | | | | | | |
2.90%, 11/18/26 | | | | | | | 2,931 | | | | 2,737,435 | |
1.55%, 03/15/28 | | | | | | | 4,251 | | | | 3,634,316 | |
Fidelity National Information Services, Inc., 1.50%, 05/21/27 | | | EUR | | | | 3,673 | | | | 3,689,857 | |
Flyr Convertible Notes, 8.00%, 08/10/27(d) | | | USD | | | | 13,195 | | | | 13,008,635 | |
Flyr Secured Notes, 9.72%, 05/10/27(d) | | | | | | | 6,685 | | | | 6,086,500 | |
Freed Corp., 10.00%, 12/07/23(d) | | | | | | | 16,199 | | | | 15,410,017 | |
Freedom Mortgage Corp.(b) | | | | | | | | | | | | |
8.13%, 11/15/24 | | | | | | | 5,170 | | | | 4,978,754 | |
8.25%, 04/15/25 | | | | | | | 1,511 | | | | 1,404,731 | |
FreeWire Technologies, Inc., (3-mo. SOFRTE CME + 9.00%), 14.91%, 04/26/25(d) | | | | | | | 8,788 | | | | 8,377,476 | |
Frontier Communications Holdings LLC(b) | | | | | | | | | | | | |
5.88%, 10/15/27 | | | | | | | 7,630 | | | | 7,023,298 | |
5.00%, 05/01/28 | | | | | | | 1,234 | | | | 1,083,590 | |
8.75%, 05/15/30 | | | | | | | 9,313 | | | | 9,211,497 | |
8.63%, 03/15/31 | | | | | | | 7,330 | | | | 7,142,245 | |
Frontier Florida LLC, Series E, 6.86%, 02/01/28 | | | | | | | 7,660 | | | | 6,928,776 | |
Frontier North, Inc., Series G, 6.73%, 02/15/28 | | | | | | | 5,875 | | | | 5,228,750 | |
Full House Resorts, Inc., 8.25%, 02/15/28(b) | | | | | | | 349 | | | | 321,396 | |
GCI LLC, 4.75%, 10/15/28(b) | | | | | | | 1,436 | | | | 1,227,780 | |
Gen Digital, Inc.(b) | | | | | | | | | | | | |
6.75%, 09/30/27 | | | | | | | 2,535 | | | | 2,554,569 | |
7.13%, 09/30/30 | | | | | | | 5,833 | | | | 5,859,301 | |
General Motors Financial Co., Inc., 5.40%, 04/06/26 | | | | | | | 4,160 | | | | 4,162,216 | |
Gilead Sciences, Inc., 2.95%, 03/01/27 | | | | | | | 4,858 | | | | 4,647,809 | |
Goldman Sachs Group, Inc. | | | | | | | | | | | | |
0.25%, 01/26/28(c) | | | EUR | | | | 4,022 | | | | 3,714,364 | |
7.25%, 04/10/28 | | | GBP | | | | 1,100 | | | | 1,491,822 | |
(1-day SOFR + 1.09%), 1.99%, 01/27/32(a) | | | USD | | | | 4,064 | | | | 3,253,895 | |
(1-day SOFR + 1.25%), 2.38%, 07/21/32(a) | | | | | | | 3,477 | | | | 2,840,387 | |
(1-day SOFR + 1.28%), 2.62%, 04/22/32(a) | | | | | | | 3,095 | | | | 2,582,937 | |
GoTo Group, Inc., 5.50%, 09/01/27(b) | | | | | | | 4,945 | | | | 2,784,084 | |
Green Plains SPE LLC, 11.75%, 02/08/26(b)(d) | | | | | | | 91,561 | | | | 86,873,077 | |
| | |
CONSOLIDATED SCHEDULE OF INVESTMENTS | | 23 |
| | |
Consolidated Schedule of Investments (continued) April 30, 2023 | | BlackRock Global Allocation Fund, Inc. (Percentages shown are based on Net Assets) |
| | | | | | | | | | | | |
| Security | | | | | Par
(000) | | | Value | |
| | | |
| United States (continued) | | | | | | | | | |
Greenland Global Investment Ltd., 6.75%, 09/26/25(c) | | | USD | | | | 349 | | | $ | 90,740 | |
HCA, Inc. | | | | | | | | | | | | |
5.38%, 02/01/25 | | | | | | | 6,374 | | | | 6,377,149 | |
5.88%, 02/15/26 | | | | | | | 2,695 | | | | 2,736,941 | |
5.63%, 09/01/28 | | | | | | | 4,976 | | | | 5,079,476 | |
3.50%, 09/01/30 | | | | | | | 5,232 | | | | 4,709,280 | |
Healthpeak OP LLC, 5.25%, 12/15/32 | | | | | | | 1,200 | | | | 1,210,887 | |
Home Depot, Inc., 3.90%, 12/06/28 | | | | | | | 8,315 | | | | 8,248,648 | |
Homes By West Bay LLC, 9.50%, 04/30/27(d) | | | | | | | 19,399 | | | | 17,895,578 | |
Humana, Inc., 0.65%, 08/03/23 | | | | | | | 1,946 | | | | 1,922,675 | |
JPMorgan Chase & Co.(a) | | | | | | | | | | | | |
0.99%, 04/28/26(c) | | | GBP | | | | 2,800 | | | | 3,229,155 | |
(1-day SOFR + 1.51%), 2.74%, 10/15/30 | | | USD | | | | 3,095 | | | | 2,714,953 | |
(3-mo. CME Term SOFR + 1.11%), 1.76%, 11/19/31 | | | | | | | 4,064 | | | | 3,248,107 | |
(3-mo. LIBOR US + 1.16%), 3.70%, 05/06/30 | | | | | | | 996 | | | | 929,036 | |
Keurig Dr. Pepper, Inc., 4.60%, 05/25/28 | | | | | | | 4,529 | | | | 4,552,804 | |
Kraft Heinz Foods Co. | | | | | | | | | | | | |
4.13%, 07/01/27(c) | | | GBP | | | | 670 | | | | 809,838 | |
6.75%, 03/15/32 | | | USD | | | | 549 | | | | 617,545 | |
Lessen, Inc., 9.67%, 01/04/28(b)(d) | | | | | | | 19,124 | | | | 18,359,340 | |
Lightning eMotors, Inc.,
7.50%, 05/15/24(b)(p) | | | | | | | 3,362 | | | | 1,815,480 | |
Lions Gate Capital Holdings LLC, 5.50%, 04/15/29(b) | | | | | | | 7,545 | | | | 5,496,457 | |
Lowe’s Cos., Inc. | | | | | | | | | | | | |
4.80%, 04/01/26 | | | | | | | 9,237 | | | | 9,303,279 | |
2.63%, 04/01/31 | | | | | | | 2,034 | | | | 1,750,813 | |
3.75%, 04/01/32 | | | | | | | 6,137 | | | | 5,693,884 | |
5.00%, 04/15/33 | | | | | | | 3,866 | | | | 3,908,128 | |
Marvell Technology, Inc., 4.20%, 06/22/23 | | | | | | | 1,225 | | | | 1,222,584 | |
Mauser Packaging Solutions Holding Co., 7.88%, 08/15/26(b) | | | | | | | 17,196 | | | | 17,442,338 | |
Maxar Technologies, Inc., 7.75%, 06/15/27(b) | | | | | | | 4,873 | | | | 5,164,093 | |
MCM Trust, 2.50%, 08/25/28(d) | | | | | | | 10,369 | | | | 9,942,188 | |
Medline Borrower LP, 3.88%, 04/01/29(b) | | | | | | | 1,282 | | | | 1,121,690 | |
Mercedes-Benz Finance North America LLC, 5.25%, 11/29/27(b) | | | | | | | 3,545 | | | | 3,654,694 | |
Microchip Technology, Inc., 0.97%, 02/15/24 | | | | | | | 4,530 | | | | 4,375,424 | |
Morgan Stanley(a) | | | | | | | | | | | | |
(1-day SOFR + 1.14%), 2.70%, 01/22/31 | | | | | | | 420 | | | | 362,481 | |
(1-day SOFR + 1.16%), 3.62%, 04/17/25 | | | | | | | 5,639 | | | | 5,528,202 | |
(1-day SOFR + 1.18%), 2.24%, 07/21/32 | | | | | | | 1,114 | | | | 899,215 | |
(1-mo. EURIBOR + 0.83%), 1.34%, 10/23/26 | | | EUR | | | | 4,468 | | | | 4,607,561 | |
Morgan Stanley Bank NA, 4.75%, 04/21/26 | | | USD | | | | 7,695 | | | | 7,733,242 | |
Nationstar Mortgage Holdings, Inc.(b) | | | | | | | | | | | | |
6.00%, 01/15/27 | | | | | | | 591 | | | | 559,973 | |
5.50%, 08/15/28 | | | | | | | 4,584 | | | | 4,091,220 | |
5.13%, 12/15/30 | | | | | | | 4,013 | | | | 3,287,048 | |
Netflix, Inc. | | | | | | | | | | | | |
4.38%, 11/15/26 | | | | | | | 2,294 | | | | 2,277,760 | |
4.88%, 04/15/28 | | | | | | | 3,689 | | | | 3,712,001 | |
5.88%, 11/15/28 | | | | | | | 2,151 | | | | 2,259,826 | |
New Home Co., Inc., 7.25%, 10/15/25(b) | | | | | | | 2,144 | | | | 1,999,494 | |
Newmont Corp., 2.60%, 07/15/32 | | | | | | | 3,095 | | | | 2,603,531 | |
Northern States Power Co., 4.50%, 06/01/52 | | | | | | | 4,429 | | | | 4,160,473 | |
Olympus Water U.S. Holding Corp., 7.13%, 10/01/27(b) | | | | | | | 2,600 | | | | 2,478,367 | |
Oncor Electric Delivery Co. LLC, 4.10%, 11/15/48 | | | | | | | 2,589 | | | | 2,283,007 | |
ONEOK Partners LP, 4.90%, 03/15/25 | | | | | | | 9,738 | | | | 9,684,933 | |
| | | | | | | | | | | | |
| Security | | | | | Par
(000) | | | Value | |
| | | |
| United States (continued) | | | | | | | | | |
Oracle Corp. | | | | | | | | | | | | |
1.65%, 03/25/26 | | | USD | | | | 7,057 | | | $ | 6,480,011 | |
2.30%, 03/25/28 | | | | | | | 5,101 | | | | 4,563,122 | |
2.95%, 04/01/30 | | | | | | | 3,205 | | | | 2,839,234 | |
4.65%, 05/06/30 | | | | | | | 823 | | | | 806,797 | |
2.88%, 03/25/31 | | | | | | | 7,239 | | | | 6,238,671 | |
Pacific Gas and Electric Co. | | | | | | | | | | | | |
3.85%, 11/15/23 | | | | | | | 4,025 | | | | 3,980,191 | |
3.25%, 02/16/24 | | | | | | | 171 | | | | 167,388 | |
3.30%, 12/01/27 | | | | | | | 4,032 | | | | 3,664,307 | |
6.15%, 01/15/33 | | | | | | | 3,365 | | | | 3,413,887 | |
Paramount Global, (5-year CMT + 4.00%), 6.38%, 03/30/62(a) | | | | | | | 4,100 | | | | 3,516,816 | |
Parker-Hannifin Corp., 3.65%, 06/15/24 | | | | | | | 3,709 | | | | 3,653,705 | |
Periama Holdings LLC, 5.95%, 04/19/26(c) | | | | | | | 891 | | | | 857,409 | |
Pioneer Midco Notes, 10.50%, 11/18/30(d) | | | | | | | 13,052 | | | | 12,823,590 | |
Pitney Bowes, Inc., 6.88%, 03/15/27(b) | | | | | | | 12,648 | | | | 9,729,411 | |
Playtika Holding Corp., 4.25%, 03/15/29(b) | | | | | | | 2,097 | | | | 1,782,450 | |
PPG Industries, Inc., 3.75%, 03/15/28 | | | | | | | 4,811 | | | | 4,653,709 | |
Prologis LP, 2.25%, 01/15/32 | | | | | | | 1,372 | | | | 1,134,713 | |
Rand Parent LLC, 8.50%, 02/15/30(b) | | | | | | | 12,423 | | | | 11,254,786 | |
Regal Rexnord Corp., 6.05%, 02/15/26(b) | | | | | | | 4,640 | | | | 4,705,501 | |
Republic Services, Inc., 4.88%, 04/01/29 | | | | | | | 1,854 | | | | 1,892,225 | |
Sabre Global, Inc.(b) | | | | | | | | | | | | |
9.25%, 04/15/25 | | | | | | | 8,951 | | | | 8,257,298 | |
7.38%, 09/01/25 | | | | | | | 2,490 | | | | 2,212,988 | |
11.25%, 12/15/27 | | | | | | | 3,392 | | | | 2,980,720 | |
Sasol Financing USA LLC | | | | | | | | | | | | |
4.38%, 09/18/26 | | | | | | | 414 | | | | 373,971 | |
8.75%, 05/03/29(b)(i) | | | | | | | 2,283 | | | | 2,292,132 | |
5.50%, 03/18/31 | | | | | | | 974 | | | | 805,863 | |
Service Properties Trust | | | | | | | | | | | | |
4.35%, 10/01/24 | | | | | | | 753 | | | | 718,738 | |
4.50%, 03/15/25 | | | | | | | 2,096 | | | | 1,948,880 | |
7.50%, 09/15/25 | | | | | | | 3,200 | | | | 3,134,016 | |
SK Battery America, Inc., 2.13%, 01/26/26(c) | | | | | | | 1,326 | | | | 1,168,786 | |
Skyworks Solutions, Inc., 0.90%, 06/01/23 | | | | | | | 1,355 | | | | 1,349,584 | |
Sonder Secured Notes, 01/19/27(a)(d)(q) | | | | | | | 21,900 | | | | 18,971,905 | |
Southern California Edison Co. | | | | | | | | | | | | |
1.10%, 04/01/24 | | | | | | | 1,881 | | | | 1,806,709 | |
5.30%, 03/01/28 | | | | | | | 4,484 | | | | 4,605,041 | |
5.95%, 11/01/32 | | | | | | | 2,544 | | | | 2,767,324 | |
3.65%, 02/01/50 | | | | | | | 4,117 | | | | 3,203,103 | |
Spirit AeroSystems, Inc., 7.50%, 04/15/25(b) | | | | | | | 4,894 | | | | 4,862,175 | |
Sprint LLC, 7.88%, 09/15/23 | | | | | | | 7,209 | | | | 7,267,358 | |
Sprint Spectrum Co. LLC/Sprint Spectrum Co. II LLC/Sprint Spectrum Co. III LLC, 4.74%, 03/20/25(b) | | | | | | | 1,967 | | | | 1,954,459 | |
Steel Dynamics, Inc., 5.00%, 12/15/26 | | | | | | | 428 | | | | 429,368 | |
Stem, Inc., 0.50%, 12/01/28(b)(p) | | | | | | | 749 | | | | 385,692 | |
Stillwater Mining Co., 4.00%, 11/16/26(c) | | | | | | | 1,701 | | | | 1,525,903 | |
Tap Rock Resources LLC, 7.00%, 10/01/26(b) | | | | | | | 10,358 | | | | 9,952,070 | |
Texas Capital Bank NA, (3-mo. LIBOR US + 4.50%), 9.66%, 09/30/24(a)(b) | | | | | | | 11,008 | | | | 10,515,148 | |
T-Mobile USA, Inc. | | | | | | | | | | | | |
4.95%, 03/15/28 | | | | | | | 3,202 | | | | 3,236,227 | |
3.88%, 04/15/30 | | | | | | | 1,032 | | | | 971,682 | |
3.50%, 04/15/31 | | | | | | | 3,066 | | | | 2,769,773 | |
2.70%, 03/15/32 | | | | | | | 4,721 | | | | 3,984,162 | |
Topaz Solar Farms LLC, 5.75%, 09/30/39(b) | | | | | | | 5,132 | | | | 5,060,773 | |
Tyson Foods, Inc., 4.00%, 03/01/26 | | | | | | | 5,658 | | | | 5,551,577 | |
| | |
| 24 | | 2 0 2 3 BLACK ROCK ANNUAL REPORT TO SHAREHOLDERS |
| | |
Consolidated Schedule of Investments (continued) April 30, 2023 | | BlackRock Global Allocation Fund, Inc. (Percentages shown are based on Net Assets) |
| | | | | | | | | | | | |
| Security | | | | | Par
(000) | | | Value | |
| | | |
| United States (continued) | | | | | | | | | |
Union Pacific Corp., 3.00%, 04/15/27 | | | USD | | | | 3,774 | | | $ | 3,613,803 | |
UnitedHealth Group, Inc. | | | | | | | | | | | | |
4.25%, 01/15/29 | | | | | | | 12,692 | | | | 12,675,734 | |
5.35%, 02/15/33 | | | | | | | 8,132 | | | | 8,672,299 | |
Uniti Group LP/Uniti Group Finance, Inc./CSL Capital LLC, 10.50%, 02/15/28(b) | | | | | | | 4,951 | | | | 4,737,596 | |
Verizon Communications, Inc. | | | | | | | | | | | | |
4.07%, 06/18/24 | | | GBP | | | | 291 | | | | 361,838 | |
1.13%, 11/03/28 | | | | | | | 1,100 | | | | 1,126,334 | |
3.15%, 03/22/30 | | | USD | | | | 6,190 | | | | 5,599,301 | |
2.55%, 03/21/31 | | | | | | | 13,005 | | | | 11,072,321 | |
Vertiv Group Corp., 4.13%, 11/15/28(b) | | | | | | | 3,791 | | | | 3,422,078 | |
Viasat, Inc., 5.63%, 04/15/27(b) | | | | | | | 5,359 | | | | 4,970,473 | |
VICI Properties LP/VICI Note Co., Inc., 5.63%, 05/01/24(b) | | | | | | | 810 | | | | 806,044 | |
Vistra Operations Co. LLC(b) | | | | | | | | | | | | |
5.13%, 05/13/25 | | | | | | | 2,675 | | | | 2,615,667 | |
5.63%, 02/15/27 | | | | | | | 10,588 | | | | 10,326,452 | |
VMware, Inc., 2.20%, 08/15/31 | | | | | | | 2,034 | | | | 1,612,541 | |
Walmart, Inc., 4.00%, 04/15/26 | | | | | | | 2,456 | | | | 2,456,688 | |
Waste Management, Inc., 1.15%, 03/15/28 | | | | | | | 4,926 | | | | 4,254,665 | |
Wells Fargo & Co. | | | | | | | | | | | | |
1.38%, 10/26/26(c) | | | EUR | | | | 3,666 | | | | 3,700,664 | |
(1-day SOFR + 1.98%), 4.81%, 07/25/28(a) | | | USD | | | | 7,379 | | | | 7,312,863 | |
Western Digital Corp., 1.50%, 02/01/24 | | | | | | | 8,760 | | | | 8,466,540 | |
Wynn Las Vegas LLC/Wynn Las Vegas Capital Corp., 5.50%, 03/01/25(b) | | | | | | | 565 | | | | 557,163 | |
Xerox Holdings Corp., 5.00%, 08/15/25(b) | | | | | | | 12,389 | | | | 11,805,028 | |
| | | | | | | | |
| | | |
| | | | | | | | | | | 1,014,916,405 | |
| | | | | | | | |
| |
Total Corporate Bonds — 9.9%
(Cost: $2,156,628,264) | | | | 1,805,494,191 | |
| | | | | | | | |
| |
Floating Rate Loan Interests(a) | | | | | |
| | | |
| Belgium — 0.1% | | | | | | | | | |
Apollo Finco, 2021 EUR Term Loan B, (3-mo. EURIBOR + 4.85%), 7.60%, 10/01/28 | | | EUR | | | | 14,154 | | | | 9,669,795 | |
| | | | | | | | |
| | | |
| Canada — 0.1% | | | | | | | | | |
KDC/ONE Development Corp., Inc., 2020 EUR Term Loan B, (1-mo. EURIBOR + 5.00%), 8.02%, 12/22/25 | | | | | | | 22,946 | | | | 24,991,624 | |
Kronos Acquisition Holdings, Inc., 2021 1st Lien Term Loan, (3-mo. CME Term SOFR at 1.00% Floor + 6.00%), 11.02%, 12/22/26 | | | USD | | | | 1,905 | | | | 1,870,752 | |
| | | | | | | | |
| | | |
| | | | | | | | | | | 26,862,376 | |
| | | |
| France — 0.2% | | | | | | | | | |
Babilou Group, 2021 EUR Term Loan B, (3-mo. EURIBOR + 4.00%), 7.05%, 11/17/27 | | | EUR | | | | 26,693 | | | | 28,562,698 | |
| | | | | | | | |
| | | |
| Germany — 0.1% | | | | | | | | | |
Iris BidCo GmbH, EUR Term Loan B, (3-mo. EURIBOR + 5.00%), 8.24%, 06/29/28 | | | | | | | 12,289 | | | | 11,710,748 | |
| | | | | | | | |
| | | | | | | | | | | | |
| Security | | | | | Par
(000) | | | Value | |
| | | |
| Jersey(d) — 0.1% | | | | | | | | | |
Vita Global Finco Ltd. | | | | | | | | | | | | |
EUR Term Loan B, (6-mo. EURIBOR + 7.00%), 9.44%, 07/06/27 | | | EUR | | | | 8,658 | | | $ | 8,752,684 | |
GBP Incremental Term Loan, (1-day SONIA + 7.00%), 10.93%, 07/06/27 | | | GBP | | | | 5,194 | | | | 5,989,618 | |
| | | | | | | | |
| | | |
| | | | | | | | | | | 14,742,302 | |
| | | |
| Luxembourg — 0.3% | | | | | | | | | |
Galapagos SA, 2023 EUR Term Loan,
(3-mo. EURIBOR + 3.90%), 6.95%, 03/01/26(d) | | | EUR | | | | 15,708 | | | | 17,308,329 | |
Luxembourg Life Fund(d) | | | | | | | | | | | | |
2021 1st Lien Delayed Draw Term Loan, 05/27/26(q) | | | | | | | 1,971 | | | | 1,951,214 | |
2021 1st Lien Term Loan, (1-mo. LIBOR US + 9.25%), 14.27%, 05/27/26 | | | USD | | | | 12,346 | | | | 10,386,096 | |
Speed Midco 3 SARL, EUR Term Loan B1, 04/26/29(q) | | | EUR | | | | 19,238 | | | | 21,039,493 | |
| | | | | | | | |
| | | |
| | | | | | | | | | | 50,685,132 | |
| | | |
| Netherlands — 0.4% | | | | | | | | | |
Cypher Bidco, EUR Term Loan, (6-mo. EURIBOR + 4.50%), 8.10%, 12/30/28(d) | | | | | | | 19,970 | | | | 20,438,118 | |
Median B V, 2021 EUR Term Loan B, (6-mo. EURIBOR + 5.00%), 7.75%, 10/14/27 | | | | | | | 14,250 | | | | 13,692,215 | |
Ziggo BV, 2019 EUR Term Loan H, (6-mo. EURIBOR + 3.00%), 6.10%, 01/31/29 | | | | | | | 39,843 | | | | 41,645,779 | |
| | | | | | | | |
| | | |
| | | | | | | | | | | 75,776,112 | |
| | | |
| Spain — 0.1% | | | | | | | | | |
Promontoria Challenger I SA, EUR Term Loan, (1-mo. EURIBOR + 3.25%), 5.90%, 12/20/24(d) | | | | | | | 19,692 | | | | 21,347,227 | |
| | | | | | | | |
| | | |
| Sweden — 0.0% | | | | | | | | | |
OptiGroup, EUR Term Loan B1, (3-mo. EURIBOR + 5.25%), 8.23% | | | | | | | 9,165 | | | | 9,565,594 | |
| | | | | | | | |
| | | |
| United Kingdom — 0.3% | | | | | | | | | |
CML Project Horizons, GBP Term Loan,
(1-day SONIA + 3.75%), 7.93%, 03/05/28 | | | GBP | | | | 15,221 | | | | 19,032,809 | |
Mercia(d) | | | | | | | | | | | | |
GBP Term Loan A1, (3-mo. SONIA Compounded + 2.40%), 6.48%, 04/09/26 | | | | | | | 6,259 | | | | 7,793,233 | |
GBP Term Loan A2, (3-mo. SONIA Compounded + 2.40%), 6.48%, 04/09/26 | | | | | | | 19,085 | | | | 23,762,419 | |
GBP Term Loan B1, (3-mo. SONIA Compounded + 2.40%), 6.48%, 04/09/26 | | | | | | | 1,099 | | | | 1,368,794 | |
| | | | | | | | |
| | | |
| | | | | | | | | | | 51,957,255 | |
| | | |
| United States — 2.0% | | | | | | | | | |
Aimbridge Acquisition Co., Inc., 2020 Incremental Term Loan B, (1-mo. LIBOR US at 0.75% Floor + 4.75%), 9.76%, 02/02/26 | | | USD | | | | 9,094 | | | | 8,612,182 | |
Alorica, Inc., 12/21/27(d)(q) | | | | | | | 11,064 | | | | 10,953,756 | |
Altar Bidco, Inc., 2021 2nd Lien Term Loan, (12-mo. CME Term SOFR at 0.50% Floor + 5.60%), 10.49%, 02/01/30 | | | | | | | 9,627 | | | | 8,426,385 | |
American Auto Auction Group, LLC, 2021 Term Loan B, (3-mo. CME Term SOFR at 0.75% Floor + 5.00%), 10.05%, 12/30/27 | | | | | | | 1,721 | | | | 1,496,905 | |
| | |
CONSOLIDATED SCHEDULE OF INVESTMENTS | | 25 |
| | |
Consolidated Schedule of Investments (continued) April 30, 2023 | | BlackRock Global Allocation Fund, Inc. (Percentages shown are based on Net Assets) |
| | | | | | | | | | | | |
| Security | | | | | Par
(000) | | | Value | |
| | | |
| United States (continued) | | | | | | | | | |
Avaya, Inc., 2022 Term Loan, (1-mo. CME Term SOFR at 1.00% Floor + 10.00%), 14.83%, 12/15/27 | | | USD | | | | 428 | | | $ | 98,172 | |
City Brewing Co. LLC, Closing Date Term Loan, (3-mo. LIBOR US at 0.75% Floor + 3.50%), 8.76%, 04/05/28 | | | | | | | 2,643 | | | | 1,039,221 | |
CML Hyatt Lost Pines, Term Loan, (1-mo. LIBOR US + 3.43%), 8.33%, 09/09/26(d) | | | | | | | 16,300 | | | | 15,959,671 | |
CML La Quinta Resort, Term Loan, (3-mo. LIBOR US + 3.20%), 8.46%, 12/09/26(d) | | | | | | | 15,500 | | | | 15,005,114 | |
CML Lake Tahoe Resort Hotel, Term Loan, (2- mo. LIBOR US + 3.01%), 3.16%, 10/25/26(d) | | | | | | | 11,574 | | | | 11,160,880 | |
CML Paradise Plaza, Term Loan, (3-mo. LIBOR US + 3.60%), 8.46%, 12/07/26(d) | | | | | | | 14,855 | | | | 14,387,467 | |
CML ST Regis Aspen, Term Loan, (1-mo. LIBOR US at 1.00% Floor + 2.90%), 7.85%, 02/09/27(d) | | | | | | | 17,543 | | | | 17,882,903 | |
CML Trigrams, Term Loan, (1-mo. LIBOR US + 2.25%), 6.96%, 09/15/24(d) | | | | | | | 27,602 | | | | 27,470,649 | |
Digital Room Holdings, Inc., 2021 Term Loan, (1-mo. LIBOR US at 0.50% Floor + 5.25%), 10.27%, 12/21/28 | | | | | | | 3,596 | | | | 3,211,410 | |
DirecTV Financing LLC, Term Loan, (1-mo. LIBOR US at 0.75% Floor + 5.00%), 10.02%, 08/02/27 | | | | | | | 5,574 | | | | 5,342,394 | |
DS Parent, Inc., Term Loan, (3-mo. LIBOR US at 0.75% Floor + 5.75%), 10.79%, 12/10/28 | | | | | | | 5,523 | | | | 5,391,646 | |
ECL Entertainment LLC, Term Loan, (1-mo. LIBOR US at 0.75% Floor + 7.50%), 12.60%, 05/01/28 | | | | | | | 7,990 | | | | 7,915,212 | |
Emerald Electronics Manufacturing Services, Term Loan, (1-mo. CME Term SOFR at 1.00% Floor + 6.25%), 11.33%, 12/29/27 | | | | | | | 4,272 | | | | 3,967,132 | |
Galaxy Universal LLC, 1st Lien Term Loan, (3- mo. LIBOR US at 1.00% Floor + 5.75%), 10.98%, 11/12/26(d) | | | | | | | 18,641 | | | | 17,965,887 | |
GoTo Group, Inc., Term Loan B, (1-mo. LIBOR US + 4.75%), 9.77%, 08/31/27 | | | | | | | 12,403 | | | | 7,581,072 | |
Green Plains Operating Co. LLC, Term Loan, (3-mo. LIBOR US + 8.00%), 10.51%, 07/20/26(d) | | | | | | | 15,919 | | | | 15,919,000 | |
Hilton Worldwide Finance LLC, 2019 Term Loan B2, (1-mo. CME Term SOFR + 1.75%), 6.82%, 06/22/26 | | | | | | | 19,245 | | | | 19,202,931 | |
Hydrofarm Holdings LLC, 2021 Term Loan, (1- mo. LIBOR US at -4.50% Floor + 5.50%), 10.53%, 09/27/28(d) | | | | | | | 2,718 | | | | 2,364,312 | |
Indy U.S. Holdco LLC, 2023 EUR Incremental Term Loan B, 03/06/28(q) | | | EUR | | | | 28,689 | | | | 28,925,366 | |
J&J Ventures Gaming LLC, Term Loan,
(3-mo. LIBOR US at 0.75% Floor + 4.00%), 9.16%, 04/26/28 | | | USD | | | | 4,093 | | | | 3,983,088 | |
Jack Ohio Finance LLC, Term Loan, (1-mo. LIBOR US at 0.75% Floor + 4.75%), 9.77%, 10/04/28 | | | | | | | 2,110 | | | | 2,020,662 | |
Maverick Gaming LLC, Term Loan B,
(3-mo. LIBOR US at 1.00% Floor + 7.50%), 12.45%, 09/03/26 | | | | | | | 3,507 | | | | 2,701,599 | |
| | | | | | | | | | | | |
| Security | | | | | Par
(000) | | | Value | |
| | | |
| United States (continued) | | | | | | | | | |
Naked Juice LLC, 2nd Lien Term Loan,
(3-mo. CME Term SOFR at 0.50% Floor + 6.00%), 11.00%, 01/24/30 | | | USD | | | | 523 | | | $ | 392,250 | |
Opendoor GP II LLC, Mezzanine Term Loan, 10.00%, 01/23/26(d) | | | | | | | 22,419 | | | | 21,073,972 | |
OVG Business Services LLC, Initial Term Loan, (1-mo. LIBOR US at 1.00% Floor + 6.25%), 11.28%, 10/13/28 | | | | | | | 7,141 | | | | 6,899,866 | |
Profrac Services LLC, 2022 Term Loan,
(3-mo. CME Term SOFR at 1.00% Floor + 7.25%), 12.42%, 03/04/25 | | | | | | | 5,802 | | | | 5,734,618 | |
Quartz Acquireco LLC, Term Loan B, 04/14/30(d)(q) | | | | | | | 3,395 | | | | 3,378,025 | |
Redstone Holdco 2 LP | | | | | | | | | | | | |
2021 2nd Lien Term Loan, (3-mo. LIBOR US at 0.75% Floor + 7.75%), 13.04%, 04/27/29 | | | | | | | 6,772 | | | | 3,985,322 | |
2021 Term Loan, (3-mo. LIBOR US at 0.75% Floor + 4.75%), 10.01%, 04/27/28 | | | | | | | 9,258 | | | | 7,822,901 | |
Roper Industrial Products Investment Co., USD Term Loan, (3-mo. CME Term SOFR + 4.50%), 9.40%, 11/22/29 | | | | | | | 9,500 | | | | 9,433,215 | |
SCIH Salt Holdings, Inc., 2021 Incremental Term Loan B, (1-mo. LIBOR US at 0.75% Floor + 4.00%), 9.02%, 03/16/27 | | | | | | | 5,738 | | | | 5,610,659 | |
Sheraton Austin, CML Term Loan, (1-mo. LIBOR US + 3.48%), 8.33%, 06/01/26(d) | | | | | | | 13,541 | | | | 13,190,554 | |
Signal Parent, Inc., Term Loan B, (1-mo. LIBOR US at 0.75% Floor + 3.50%), 8.58%, 04/03/28 | | | | | | | 4,182 | | | | 2,809,213 | |
Starwood Property Trust, Inc., 2021 Term Loan, (1-mo. LIBOR US at 0.50% Floor + 3.05%), 7.81%, 06/09/26(d) | | | | | | | 18,203 | | | | 17,420,036 | |
Talen Energy Supply LLC, 2022 DIP Term Loan, (3-mo. CME Term SOFR at 0.75% Floor + 4.75%), 9.52%, 11/10/23 | | | | | | | 10,446 | | | | 10,451,223 | |
Vaco Holdings LLC, 2022 Term Loan,
(3-mo. CME Term SOFR + 5.00%), 10.05%, 01/21/29 | | | | | | | 4,271 | | | | 4,245,312 | |
| | | | | | | | |
| | | |
| | | | | | | | | | | 371,432,182 | |
| | | | | | | | |
| |
Total Floating Rate Loan Interests — 3.7%
(Cost: $712,061,037) | | | | 672,311,421 | |
| | | | | | | | |
|
Foreign Government and Agency Obligations | |
| | | |
| Argentina — 0.1% | | | | | | | | | |
Argentine Republic Government International Bond | | | | | | | | | | | | |
0.75%, 07/09/23(r) | | | | | | | 35,805 | | | | 8,700,673 | |
3.63%, 07/09/23(r) | | | | | | | 44,033 | | | | 9,791,988 | |
4.25%, 07/09/23(r) | | | | | | | 14,865 | | | | 4,104,521 | |
1.00%, 07/09/29 | | | | | | | 3,751 | | | | 889,145 | |
| | | | | | | | |
| | | |
| | | | | | | | | | | 23,486,327 | |
| | | |
| Bahrain — 0.0% | | | | | | | | | |
Bahrain Government International Bond, 5.45%, 09/16/32(c) | | | | | | | 1,402 | | | | 1,251,110 | |
| | | | | | | | |
| | |
| 26 | | 2 0 2 3 BLACK ROCK ANNUAL REPORT TO SHAREHOLDERS |
| | |
Consolidated Schedule of Investments (continued) April 30, 2023 | | BlackRock Global Allocation Fund, Inc. (Percentages shown are based on Net Assets) |
| | | | | | | | |
| Security | | Par (000) | | | Value | |
| | |
| Brazil — 0.8% | | | | | | |
Brazil Letras do Tesouro Nacional, 0.00%, 07/01/24(s) | | | 591,234 | | | $ | 103,283,875 | |
Brazil Notas do Tesouro Nacional | | | | |
10.00%, 01/01/25 | | | 124,938 | | | | 24,286,662 | |
Series F, 10.00%, 01/01/27 | | | 55,391 | | | | 10,532,379 | |
| | | | | | | | |
| | |
| | | | | | | 138,102,916 | |
| | |
| Canada — 0.5% | | | | | | |
Canadian Government Bond, 0.25%, 03/01/26 | | | 142,065 | | | | 96,079,078 | |
| | | | | | | | |
| | |
| Chile — 0.0% | | | | | | |
Chile Government International Bond, 4.34%, 03/07/42 | | | 2,267 | | | | 2,059,144 | |
| | | | | | | | |
| | |
| Colombia — 0.2% | | | | | | |
Colombia Government International Bond | | | | | | | | |
4.50%, 01/28/26 | | | 3,572 | | | | 3,386,256 | |
3.88%, 04/25/27 | | | 1,811 | | | | 1,626,844 | |
3.13%, 04/15/31 | | | 4,564 | | | | 3,378,216 | |
8.00%, 04/20/33 | | | 2,105 | | | | 2,096,185 | |
Colombian TES | | | | | | | | |
5.75%, 11/03/27 | | | 27,261,200 | | | | 4,672,093 | |
7.00%, 06/30/32 | | | 114,641,600 | | | | 17,901,342 | |
Series B, 7.00%, 03/26/31 | | | 45,709,300 | | | | 7,397,478 | |
| | | | | | | | |
| | |
| | | | | | | 40,458,414 | |
| | |
| Czech Republic — 0.4% | | | | | | |
Czech Republic Government Bond | | | | | | | | |
5.50%, 12/12/28 | | | 215,160 | | | | 10,481,538 | |
5.00%, 09/30/30 | | | 899,940 | | | | 43,291,086 | |
1.20%, 03/13/31 | | | 518,020 | | | | 18,998,712 | |
| | | | | | | | |
| | |
| | | | | | | 72,771,336 | |
| | |
| Dominican Republic — 0.1% | | | | | | |
Dominican Republic International Bond | | | | | | | | |
6.88%, 01/29/26(c) | | | 1,477 | | | | 1,503,125 | |
5.95%, 01/25/27(c) | | | 2,074 | | | | 2,054,945 | |
5.50%, 02/22/29(b) | | | 1,244 | | | | 1,183,588 | |
4.50%, 01/30/30(b) | | | 2,367 | | | | 2,090,061 | |
7.05%, 02/03/31(b) | | | 655 | | | | 665,030 | |
4.88%, 09/23/32(b) | | | 3,821 | | | | 3,284,388 | |
| | | | | | | | |
| | |
| | | | | | | 10,781,137 | |
| | |
| Egypt(b) — 0.0% | | | | | | |
Egypt Government International Bond | | | | | | | | |
8.50%, 01/31/47 | | | 1,099 | | | | 578,555 | |
7.50%, 02/16/61 | | | 1,244 | | | | 619,512 | |
| | | | | | | | |
| | |
| | | | | | | 1,198,067 | |
| | |
| Guatemala — 0.0% | | | | | | |
Guatemala Government Bond | | | | | | | | |
4.50%, 05/03/26(c) | | | 1,188 | | | | 1,158,523 | |
5.25%, 08/10/29(c) | | | 2,070 | | | | 2,014,757 | |
5.25%, 08/10/29(b) | | | 1,082 | | | | 1,053,124 | |
3.70%, 10/07/33(c) | | | 1,977 | | | | 1,649,312 | |
4.65%, 10/07/41(b) | | | 259 | | | | 211,295 | |
| | | | | | | | |
| | |
| | | | | | | 6,087,011 | |
| | | | | | | | |
| Security | | Par (000) | | | Value | |
| | |
| Hong Kong — 0.0% | | | | | | |
Hong Kong Government International Bond | | | | | | | | |
4.50%, 01/11/28 | | | 250 | | | $ | 256,862 | |
4.63%, 01/11/33(c) | | | 200 | | | | 212,466 | |
| | | | | | | | |
| | |
| | | | | | | 469,328 | |
| | |
| Hungary — 0.0% | | | | | | |
Hungary Government International Bond | | | | | | | | |
5.38%, 03/25/24 | | | 368 | | | | 368,299 | |
5.25%, 06/16/29(b) | | | 2,199 | | | | 2,174,673 | |
| | | | | | | | |
| | |
| | | | | | | 2,542,972 | |
| | |
| Indonesia — 0.4% | | | | | | |
Indonesia Government International Bond | | | | | | | | |
4.55%, 01/11/28 | | | 200 | | | | 200,975 | |
4.65%, 09/20/32 | | | 4,355 | | | | 4,363,982 | |
4.85%, 01/11/33 | | | 200 | | | | 202,850 | |
5.65%, 01/11/53 | | | 200 | | | | 211,038 | |
Indonesia Treasury Bond | | | | | | | | |
8.25%, 05/15/36 | | | 309,590,000 | | | | 23,477,769 | |
7.13%, 06/15/38 | | | 612,456,000 | | | | 42,699,497 | |
Perusahaan Penerbit SBSN Indonesia III, 4.40%, 06/06/27(b) | | | 1,151 | | | | 1,153,374 | |
| | | | | | | | |
| | |
| | | | | | | 72,309,485 | |
| | |
| Ivory Coast — 0.0% | | | | | | |
Ivory Coast Government International Bond, 6.38%, 03/03/28(c) | | | 3,867 | | | | 3,681,626 | |
| | | | | | | | |
| | |
| Japan — 0.2% | | | | | | |
Japan Treasury Discount Bills, (0.35%), 06/05/23(t) | | | 5,255,250 | | | | 38,578,297 | |
| | | | | | | | |
| | |
| Jordan — 0.0% | | | | | | |
Jordan Government International Bond, 4.95%, 07/07/25(c) | | | 852 | | | | 818,346 | |
| | | | | | | | |
| | |
| Mexico — 0.8% | | | | | | |
Mexican Bonos, Series M, 7.75%, 05/29/31 | | | 1,540,218 | | | | 80,519,737 | |
Mexico Bonos | | | | | | | | |
7.50%, 05/26/33 | | | 684,171 | | | | 34,790,563 | |
Series M-20, 8.50%, 05/31/29 | | | 378,206 | | | | 20,752,445 | |
Mexico Government International Bond | | | | | | | | |
3.75%, 01/11/28 | | | 2,037 | | | | 1,966,724 | |
2.66%, 05/24/31 | | | 4,408 | | | | 3,724,209 | |
4.88%, 05/19/33 | | | 871 | | | | 843,400 | |
6.35%, 02/09/35 | | | 395 | | | | 422,724 | |
6.34%, 05/04/53 | | | 385 | | | | 396,935 | |
| | | | | | | | |
| | |
| | | | | | | 143,416,737 | |
| | |
| Morocco — 0.0% | | | | | | |
Morocco Government International Bonds, 5.95%, 03/08/28(b) | | | 964 | | | | 988,582 | |
| | | | | | | | |
| | |
| Nigeria — 0.0% | | | | | | |
Nigeria Government International Bond | | | | | | | | |
8.38%, 03/24/29(b) | | | 1,336 | | | | 1,085,751 | |
7.63%, 11/28/47(c) | | | 2,004 | | | | 1,244,734 | |
| | | | | | | | |
| | |
| | | | | | | 2,330,485 | |
| | |
CONSOLIDATED SCHEDULE OF INVESTMENTS | | 27 |
| | |
Consolidated Schedule of Investments (continued) April 30, 2023 | | BlackRock Global Allocation Fund, Inc. (Percentages shown are based on Net Assets) |
| | | | | | | | |
| Security | | Par (000) | | | Value | |
| | |
| Oman(c) — 0.0% | | | | | | |
Oman Government International Bond | | | | | | | | |
6.50%, 03/08/47 | | | 2,074 | | | $ | 1,940,875 | |
6.75%, 01/17/48 | | | 2,489 | | | | 2,402,352 | |
| | | | | | | | |
| | |
| | | | | | | 4,343,227 | |
| | |
| Panama — 0.1% | | | | | | |
Panama Government International Bond | | | | | | | | |
3.88%, 03/17/28 | | | 2,021 | | | | 1,945,591 | |
3.16%, 01/23/30 | | | 2,690 | | | | 2,376,111 | |
6.40%, 02/14/35 | | | 2,292 | | | | 2,423,503 | |
6.85%, 03/28/54 | | | 1,960 | | | | 2,043,300 | |
| | | | | | | | |
| | |
| | | | | | | 8,788,505 | |
| | |
| Paraguay — 0.0% | | | | | | |
Paraguay Government International Bond | | | | | | | | |
4.95%, 04/28/31(b) | | | 435 | | | | 420,265 | |
5.60%, 03/13/48(c) | | | 1,757 | | | | 1,534,959 | |
5.40%, 03/30/50(c) | | | 2,626 | | | | 2,237,516 | |
| | | | | | | | |
| | |
| | | | | | | 4,192,740 | |
| | |
| Peru — 0.0% | | | | | | |
Corp. Financiera de Desarrollo SA, 4.75%, 07/15/25(c) | | | 2,203 | | | | 2,136,635 | |
Peruvian Government International Bond | | | | | | | | |
2.78%, 01/23/31 | | | 2,043 | | | | 1,768,855 | |
1.86%, 12/01/32 | | | 3,894 | | | | 3,010,062 | |
| | | | | | | | |
| | |
| | | | | | | 6,915,552 | |
| | |
| Philippines — 0.0% | | | | | | |
Philippines Government International Bond, 2.65%, 12/10/45 | | | 1,200 | | | | 832,350 | |
| | | | | | | | |
| | |
| Poland — 0.0% | | | | | | |
Republic of Poland Government International | | | | | | | | |
Bond | | | | | | | | |
4.88%, 10/04/33 | | | 879 | | | | 892,350 | |
4.25%, 02/14/43(c) | | | 1,170 | | | | 1,245,551 | |
5.50%, 04/04/53 | | | 1,345 | | | | 1,396,530 | |
| | | | | | | | |
| | |
| | | | | | | 3,534,431 | |
| | |
| Romania — 0.1% | | | | | | |
Romanian Government International Bond | | | | | | | | |
5.25%, 11/25/27(b) | | | 2,190 | | | | 2,160,983 | |
2.88%, 03/11/29(c) | | | 2,273 | | | | 2,150,529 | |
2.50%, 02/08/30(c) | | | 2,392 | | | | 2,123,917 | |
2.12%, 07/16/31(c) | | | 1,323 | | | | 1,076,778 | |
| | | | | | | | |
| | |
| | | | | | | 7,512,207 | |
| | |
| Saudi Arabia — 0.1% | | | | | | |
Saudi Government International Bond | | | | | | | | |
4.75%, 01/18/28(b) | | | 1,445 | | | | 1,470,558 | |
4.50%, 04/17/30(c) | | | 2,553 | | | | 2,575,818 | |
2.25%, 02/02/33(c) | | | 1,896 | | | | 1,576,406 | |
5.00%, 01/18/53(b) | | | 1,940 | | | | 1,837,301 | |
| | | | | | | | |
| | |
| | | | | | | 7,460,083 | |
| | |
| Senegal — 0.0% | | | | | | |
Senegal Government International Bond, 6.25%, 05/23/33(c) | | | 1,300 | | | | 1,020,337 | |
| | | | | | | | |
| | |
| South Africa — 0.3% | | | | | | |
Republic of South Africa Government International Bond | | | | | | | | |
4.85%, 09/30/29 | | | 1,804 | | | | 1,618,301 | |
8.25%, 03/31/32 | | | 172,088 | | | | 8,015,757 | |
| | | | | | | | |
| Security | | Par (000) | | | Value | |
| | |
| South Africa (continued) | | | | | | |
Republic of South Africa Government International Bond (continued) | | | | | | | | |
5.88%, 04/20/32 | | | 1,742 | | | $ | 1,581,192 | |
9.00%, 01/31/40 | | | 635,107 | | | | 27,554,351 | |
8.75%, 01/31/44 | | | 115,982 | | | | 4,811,088 | |
5.00%, 10/12/46 | | | 2,881 | | | | 1,958,720 | |
Series 2030, 8.00%, 01/31/30 | | | 252,928 | | | | 12,379,315 | |
| | | | | | | | |
| | |
| | | | | | | 57,918,724 | |
| | |
| South Korea — 0.0% | | | | | | |
Korea National Oil Corp. | | | | | | | | |
4.75%, 04/03/26(c) | | | 200 | | | | 199,306 | |
4.88%, 04/03/28 | | | 200 | | | | 202,342 | |
| | | | | | | | |
| | |
| | | | | | | 401,648 | |
| | |
| Spain(b)(c) — 3.1% | | | | | | |
Spain Government Bond | | | | | | | | |
2.55%, 10/31/32 | | | 247,731 | | | | 256,241,538 | |
3.15%, 04/30/33 | | | 214,661 | | | | 232,146,381 | |
3.90%, 07/30/39 | | | 23,177 | | | | 25,961,365 | |
2.90%, 10/31/46 | | | 22,348 | | | | 21,224,620 | |
3.45%, 07/30/66 | | | 24,603 | | | | 24,307,419 | |
| | | | | | | | |
| | |
| | | | | | | 559,881,323 | |
| | |
| Ukraine(e)(n) — 0.0% | | | | | | |
Ukraine Government International Bond | | | | | | | | |
7.75%, 09/01/25(c) | | | 1,244 | | | | 236,593 | |
7.75%, 09/01/26(c) | | | 3,515 | | | | 598,209 | |
7.25%, 03/15/35(b) | | | 3,049 | | | | 494,129 | |
| | | | | | | | |
| | |
| | | | | | | 1,328,931 | |
| | |
| Uruguay — 0.0% | | | | | | |
Uruguay Government International Bond, 5.75%, 10/28/34 | | | 2,256 | | | | 2,504,583 | |
| | | | | | | | |
| | |
Total Foreign Government and Agency Obligations — 7.2%
(Cost: $1,370,280,928) | | | | | | | 1,324,045,039 | |
| | | | | | | | |
| | |
| | | Shares | | | | |
| | |
Investment Companies | | | | | | | | |
| | |
| United States — 2.4% | | | | | | |
Industrial Select Sector SPDR Fund(g) | | | 112,009 | | | | 11,200,900 | |
Invesco QQQ Trust, Series 1(g) | | | 597,700 | | | | 192,794,112 | |
iShares 0-5 Year TIPS Bond ETF(f)(g) | | | 190,821 | | | | 18,921,810 | |
iShares Biotechnology ETF(f)(g) | | | 19,698 | | | | 2,570,786 | |
iShares China Large-Cap ETF(f) | | | 68,909 | | | | 1,952,192 | |
iShares iBoxx $ Investment Grade Corporate Bond ETF(f) | | | 660,826 | | | | 72,644,602 | |
iShares JP Morgan USD Emerging Markets Bond ETF(f) | | | 273,736 | | | | 23,582,357 | |
iShares Latin America 40 ETF(f)(g) | | | 371,046 | | | | 9,124,021 | |
iShares MSCI Brazil ETF(f)(g) | | | 436,853 | | | | 12,349,834 | |
iShares MSCI Emerging Markets ETF(f) | | | 56,435 | | | | 2,208,302 | |
KraneShares CSI China Internet ETF(e) | | | 639,593 | | | | 17,883,020 | |
SPDR Bloomberg High Yield Bond ETF(g) | | | 95,958 | | | | 8,875,156 | |
SPDR Gold Shares, B Shares(e)(k) | | | 228,889 | | | | 42,298,687 | |
| | |
| 28 | | 2 0 2 3 BLACK ROCK ANNUAL REPORT TO SHAREHOLDERS |
| | |
Consolidated Schedule of Investments (continued) April 30, 2023 | | BlackRock Global Allocation Fund, Inc. (Percentages shown are based on Net Assets) |
| | | | | | | | | | | | |
| Security | | | | | Shares | | | Value | |
| | | |
| United States (continued) | | | | | | | | | |
VanEck Semiconductor ETF(e)(g) | | | | | | | 29,977 | | | $ | 7,411,813 | |
VanEck Vectors J.P. Morgan EM Local Currency Bond ETF(g) | | | | | | | 403,122 | | | | 10,134,487 | |
| | | | | | | | |
| |
Total Investment Companies — 2.4%
(Cost: $409,197,659) | | | | 433,952,079 | |
| | | | | | | | |
| | | |
| | | | | | Par (000) | | | | |
| |
Non-Agency Mortgage-Backed Securities | | | | | |
| | | |
| Cayman Islands(a)(b) — 0.0% | | | | | | | | | |
Arbor Realty Commercial Real Estate Notes Ltd., Series 2021-FL4, Class A, (1-mo. LIBOR US + 1.35%), 6.30%, 11/15/36 | | | USD | | | | 656 | | | | 640,754 | |
FS Rialto, Series 2021-FL3, Class A,
(1-mo. LIBOR US + 1.25%), 6.20%, 11/16/36 | | | | | | | 389 | | | | 381,961 | |
Greystone CRE Notes Ltd., Series 2021-FL3, Class A, (1-mo. CME Term SOFR + 1.13%), 6.02%, 07/15/39 | | | | | | | 3,594 | | | | 3,488,607 | |
MF1 Ltd., Series 2021-FL6, Class A, (1-mo. LIBOR US + 1.10%), 6.06%, 07/16/36 | | | | | | | 2,970 | | | | 2,912,817 | |
| | | | | | | | |
| | | |
| | | | | | | | | | | 7,424,139 | |
| | | |
| United States — 3.5% | | | | | | | | | |
1211 Avenue of the Americas Trust, Series 2015-1211, Class D, 4.28%, 08/10/35(a)(b) | | | | | | | 4,330 | | | | 3,625,463 | |
Ajax Mortgage Loan Trust(a)(b) | | | | | | | | | | | | |
Series 2021-E, Class A1, 1.74%, 12/25/60 | | | | | | | 22,771 | | | | 19,747,363 | |
Series 2021-E, Class A2, 2.69%, 12/25/60 | | | | | | | 3,304 | | | | 2,755,805 | |
Series 2021-E, Class B1, 3.73%, 12/25/60 | | | | | | | 2,184 | | | | 1,792,195 | |
Series 2021-E, Class M1, 2.94%, 12/25/60 | | | | | | | 1,332 | | | | 1,076,245 | |
Alen Mortgage Trust, Series 2021-ACEN, Class D, (1-mo. LIBOR US + 3.10%), 8.05%, 04/15/34(a)(b) | | | | | | | 5,222 | | | | 3,817,874 | |
Arbor Multifamily Mortgage Securities Trust, Series E, Class E, 1.75%, 05/15/53(b) | | | | | | | 1,650 | | | | 885,390 | |
Arbor Realty Commercial Real Estate Notes Ltd., Series 2022-FL2, Class A, (1-mo. CME Term SOFR + 1.85%), 6.74%, 05/15/37(a)(b) | | | | | | | 8,034 | | | | 7,907,201 | |
BAMLL Commercial Mortgage Securities Trust(a)(b) | | | | | | | | | | | | |
Class A, (1-mo. LIBOR US + 0.85%), 5.80%, 09/15/34 | | | | | | | 2,468 | | | | 2,446,435 | |
Series 2015-200P, Class D, 3.72%, 04/14/33 | | | | | | | 730 | | | | 648,487 | |
Bank, Series 2017-BNK9, Class A4, 3.54%, 11/15/54 | | | | | | | 1,990 | | | | 1,866,236 | |
Bayview Commercial Asset Trust(a)(b) | | | | | | | | | | | | |
Series 2005-3A, Class M6, (1-mo. LIBOR US + 1.05%), 5.72%, 11/25/35 | | | | | | | 333 | | | | 299,440 | |
Series 2006-3A, Class M1, (1-mo. LIBOR US + 0.51%), 5.53%, 10/25/36 | | | | | | | 377 | | | | 348,539 | |
BBCMS Mortgage Trust(a)(b) | | | | | | | | | | | | |
Series 2017-DELC, Class E, (1-mo. LIBOR US + 2.63%), 7.57%, 08/15/36 | | | | | | | 1,677 | | | | 1,660,050 | |
Series 2018-TALL, Class C, (1-mo. LIBOR US + 1.27%), 6.22%, 03/15/37 | | | | | | | 4,880 | | | | 3,789,590 | |
| | | | | | | | | | | | |
| Security | | | | | Par
(000) | | | Value | |
| | | |
| United States (continued) | | | | | | | | | |
Beast Mortgage Trust(a)(b) | | | | | | | | | | | | |
Series 2021-SSCP, Class A, (1-mo. LIBOR US + 0.75%), 5.70%, 04/15/36 | | | USD | | | | 1,955 | | | $ | 1,860,699 | |
Series 2021-SSCP, Class B, (1-mo. LIBOR US + 1.10%), 6.05%, 04/15/36 | | | | | | | 4,812 | | | | 4,595,330 | |
Series 2021-SSCP, Class C, (1-mo. LIBOR US + 1.35%), 6.30%, 04/15/36 | | | | | | | 5,803 | | | | 5,526,453 | |
Series 2021-SSCP, Class D, (1-mo. LIBOR US + 1.60%), 6.55%, 04/15/36 | | | | | | | 5,329 | | | | 5,018,341 | |
Series 2021-SSCP, Class E, (1-mo. LIBOR US + 2.10%), 7.05%, 04/15/36 | | | | | | | 4,614 | | | | 4,317,339 | |
Series 2021-SSCP, Class F, (1-mo. LIBOR US + 2.90%), 7.85%, 04/15/36 | | | | | | | 4,410 | | | | 4,169,250 | |
Series 2021-SSCP, Class G, (1-mo. LIBOR US + 3.80%), 8.75%, 04/15/36 | | | | | | | 4,993 | | | | 4,717,774 | |
Series 2021-SSCP, Class H, (1-mo. LIBOR US + 4.90%), 9.85%, 04/15/36 | | | | | | | 3,541 | | | | 3,349,435 | |
Benchmark Mortgage Trust | | | | | | | | | | | | |
Series 2021-B23, Class XA, 1.38%, 02/15/54(a) | | | | | | | 54,678 | | | | 3,676,096 | |
Series 2021-B25, Class A5, 2.58%, 04/15/54 | | | | | | | 5,050 | | | | 4,186,068 | |
BHMS Mortgage Trust(a)(b) | | | | | | | | | | | | |
Series 2018-ATLS, Class A, (1-mo. LIBOR US + 1.25%), 6.20%, 07/15/35 | | | | | | | 6,720 | | | | 6,475,879 | |
Series 2018-ATLS, Class C, (1-mo. LIBOR US + 1.90%), 6.85%, 07/15/35 | | | | | | | 1,583 | | | | 1,494,139 | |
BOCA Commercial Mortgage Trust, Series 2022- BOCA, Class A, (1-mo. CME Term SOFR + 1.77%),
6.66%, 05/15/39(a)(b) | | | | | | | 2,411 | | | | 2,377,752 | |
BWAY Mortgage Trust, Series 2013-1515, Class D, 3.63%, 03/10/33(b) | | | | | | | 3,735 | | | | 3,417,027 | |
BX Commercial Mortgage Trust(b) | | | | | | | | | | | | |
Series 2019-XL, Class A, (1-mo. CME Term SOFR + 1.03%), 5.92%, 10/15/36(a) | | | | | | | 2,254 | | | | 2,230,312 | |
Series 2019-XL, Class G, (1-mo. CME Term SOFR + 2.41%), 7.30%, 10/15/36(a) | | | | | | | 8,011 | | | | 7,757,158 | |
Series 2019-XL, Class J, (1-mo. CME Term SOFR + 2.76%), 7.65%, 10/15/36(a) | | | | | | | 10,664 | | | | 10,262,571 | |
Series 2020-VIV4, Class A, 2.84%, 03/09/44 | | | | | | | 1,425 | | | | 1,203,679 | |
Series 2020-VKNG, Class G, (1-mo. CME Term SOFR + 3.36%), 8.25%, 10/15/37(a) | | | | | | | 1,050 | | | | 986,458 | |
Series 2021-NWM, Class A, (1-mo. CME Term SOFR + 1.02%), 5.91%, 02/15/33(a) | | | | | | | 18,808 | | | | 18,235,190 | |
Series 2021-NWM, Class B, (1-mo. CME Term SOFR + 2.26%), 7.15%, 02/15/33(a) | | | | | | | 11,028 | | | | 10,787,049 | |
Series 2021-NWM, Class C, (1-mo. CME Term SOFR + 4.36%), 9.25%, 02/15/33(a) | | | | | | | 7,282 | | | | 7,104,066 | |
Series 2021-SOAR, Class G, (1-mo. LIBOR US + 2.80%), 7.75%, 06/15/38(a) | | | | | | | 8,923 | | | | 8,289,707 | |
Series 2021-VINO, Class F, (1-mo. LIBOR US + 2.80%), 7.75%, 05/15/38(a) | | | | | | | 10,351 | | | | 9,599,070 | |
Series 2021-XL2, Class A, (1-mo. LIBOR US + 0.69%), 5.64%, 10/15/38(a) | | | | | | | 2,809 | | | | 2,707,792 | |
Series 2021-XL2, Class F, (1-mo. LIBOR US + 2.24%), 7.19%, 10/15/38(a) | | | | | | | 15,203 | | | | 14,289,455 | |
BX Trust(a)(b) | | | | | | | | | | | | |
Series 2019-OC11, Class D, 4.08%, 12/09/41 | | | | | | | 8,408 | | | | 7,119,667 | |
Series 2019-OC11, Class E, 4.08%, 12/09/41 | | | | | | | 11,784 | | | | 9,652,775 | |
| | |
CONSOLIDATED SCHEDULE OF INVESTMENTS | | 29 |
| | |
Consolidated Schedule of Investments (continued) April 30, 2023 | | BlackRock Global Allocation Fund, Inc. (Percentages shown are based on Net Assets) |
| | | | | | | | | | | | |
| Security | | | | | Par (000) | | | Value | |
| | | |
| United States (continued) | | | | | | | | | |
BX Trust(a)(b) (continued) | | | | | | | | | | | | |
Series 2021-ARIA, Class E, (1-mo. LIBOR US + 2.24%), 7.19%, 10/15/36 | | | USD | | | | 9,187 | | | $ | 8,499,938 | |
Series 2021-MFM1, Class E, (1-mo. CME Term SOFR + 2.36%), 7.25%, 01/15/34 | | | | | | | 2,857 | | | | 2,717,498 | |
Series 2021-MFM1, Class F, (1-mo. CME Term SOFR + 3.11%), 8.00%, 01/15/34 | | | | | | | 4,431 | | | | 4,152,671 | |
CAMB Commercial Mortgage Trust, Series 2019- LIFE, Class E, (1-mo. LIBOR US + 2.15%),
7.10%, 12/15/37(a)(b) | | | | | | | 1,358 | | | | 1,309,812 | |
CD Mortgage Trust, Series 2017-CD6, Class B, 3.91%, 11/13/50(a) | | | | | | | 864 | | | | 767,560 | |
Citigroup Commercial Mortgage Trust, Series 2018-C6, Class A4, 4.41%, 11/10/51 | | | | | | | 2,000 | | | | 1,936,045 | |
Cold Storage Trust, Class A, (1-mo. LIBOR US + 0.90%), 5.85%, 11/15/37(a)(b) | | | | | | | 6,007 | | | | 5,871,442 | |
Commercial Mortgage Trust, Series 2014-CR21, Class A3, 3.53%, 12/10/47 | | | | | | | 3,705 | | | | 3,575,434 | |
Credit Suisse Mortgage Capital Certificates Trust(b) 4.83%, 02/15/27 | | | | | | | 11,900 | | | | 11,651,776 | |
Series 2019-ICE4, Class B, (1-mo. LIBOR US + 1.23%), 6.18%, 05/15/36(a) | | | | | | | 1,761 | | | | 1,739,457 | |
Series 2019-ICE4, Class C, (1-mo. LIBOR US + 1.43%), 6.38%, 05/15/36(a) | | | | | | | 1,824 | | | | 1,796,760 | |
Series 2019-ICE4, Class D, (1-mo. LIBOR US + 1.60%), 6.55%, 05/15/36(a) | | | | | | | 5,882 | | | | 5,789,752 | |
Series 2019-ICE4, Class E, (1-mo. LIBOR US + 2.15%), 7.10%, 05/15/36(a) | | | | | | | 5,398 | | | | 5,287,890 | |
Series 2019-ICE4, Class F, (1-mo. LIBOR US + 2.65%), 7.60%, 05/15/36(a) | | | | | | | 8,115 | | | | 7,912,063 | |
CSAIL Commercial Mortgage Trust | | | | | | | | | | | | |
Series 2020-C19, Class A3, 2.56%, 03/15/53 | | | | | | | 11,759 | | | | 10,008,076 | |
Series C, Class C5, 4.80%, 11/15/48(a) | | | | | | | 640 | | | | 586,636 | |
Csmc Trust(b) | | | | | | | | | | | | |
Series 2020-FACT, Class E, (1-mo. LIBOR US + 4.86%), 9.81%, 10/15/37(a) | | | | | | | 1,513 | | | | 1,354,553 | |
Series 2020-NET, Class A, 2.26%, 08/15/37 | | | | | | | 3,944 | | | | 3,557,466 | |
DBGS Mortgage Trust(a)(b) | | | | | | | | | | | | |
Series 2018-BIOD, Class A, (1-mo. LIBOR US + 0.80%), 5.75%, 05/15/35 | | | | | | | 786 | | | | 773,962 | |
Series 2018-BIOD, Class D, (1-mo. LIBOR US + 1.30%), 6.25%, 05/15/35 | | | | | | | 1,865 | | | | 1,813,525 | |
Series 2018-BIOD, Class F, (1-mo. LIBOR US + 2.00%), 6.95%, 05/15/35 | | | | | | | 7,767 | | | | 7,415,497 | |
DBWF Mortgage Trust(a)(b) | | | | | | | | | | | | |
Series 2018-GLKS, Class B, (1-mo. LIBOR US + 1.45%), 6.40%, 12/19/30 | | | | | | | 2,175 | | | | 2,122,733 | |
Series 2018-GLKS, Class C, (1-mo. LIBOR US + 1.85%), 6.80%, 12/19/30 | | | | | | | 1,650 | | | | 1,608,599 | |
ELP Commercial Mortgage Trust, Series 2021- ELP, Class F, (1-mo. LIBOR US + 2.67%),
7.62%, 11/15/38(a)(b) | | | | | | | 6,593 | | | | 6,213,488 | |
Extended Stay America Trust(a)(b) | | | | | | | | | | | | |
Series 2021-ESH, Class D, (1-mo. LIBOR US + 2.25%), 7.20%, 07/15/38 | | | | | | | 13,923 | | | | 13,365,525 | |
Series 2021-ESH, Class E, (1-mo. LIBOR US + 2.85%), 7.80%, 07/15/38 | | | | | | | 9,733 | | | | 9,245,183 | |
| | | | | | | | | | | | |
Security | | | | | Par
(000) | | | Value | |
| | | |
| United States (continued) | | | | | | | | | |
Federal Home Loan Mortgage Corp. STACR REMIC Trust, Series 2022-DNA1, Class B1, (30-day Avg SOFR + 3.40%), 8.22%, 01/25/42(a)(b) | | | USD | | | | 2,121 | | | $ | 1,978,121 | |
FS Rialto Issuer LLC, Series 2022-FL6, Class A, (1-mo. CME Term SOFR + 2.58%), 7.50%, 08/17/37(a)(b) | | | | | | | 8,341 | | | | 8,289,210 | |
GCT Commercial Mortgage Trust, Series 2021- GCT D, Class D, (1-mo. LIBOR US + 2.35%), 7.30%, 02/15/38(a)(b) | | | | | | | 810 | | | | 564,346 | |
GS Mortgage Securities Corp. Trust(a)(b) | | | | | | | | | | | | |
Series 2021-DM, Class E, (1-mo. LIBOR US + 2.94%), 7.88%, 11/15/36 | | | | | | | 12,756 | | | | 11,965,875 | |
Series 2021-ROSS, Class A, (1-mo. LIBOR US + 1.15%), 6.10%, 05/15/26 | | | | | | | 1,480 | | | | 1,334,828 | |
Series 2022-ECI, Class A, (1-mo. CME Term SOFR + 2.19%), 7.08%, 08/15/39 | | | | | | | 1,358 | | | | 1,351,274 | |
GS Mortgage Securities Trust | | | | | | | | | | | | |
Series 2020-GC47, Class AS, 2.73%, 05/12/53 | | | | | | | 4,426 | | | | 3,656,601 | |
Series 2020-GSA2, Class XA, 1.84%, 12/12/53(a)(b) | | | | | | | 2,190 | | | | 199,402 | |
Series 2021-IP, Class A, (1-mo. LIBOR US + 0.95%), 5.90%, 10/15/36(a)(b) | | | | | | | 1,493 | | | | 1,398,017 | |
Hudson Yards Mortgage Trust, Series 2016- 10HY, Class E, 3.08%, 08/10/38(a)(b) | | | | | | | 897 | | | | 743,907 | |
Independence Plaza Trust, Series 2018-INDP, Class B, 3.91%, 07/10/35(b) | | | | | | | 2,215 | | | | 2,073,003 | |
JP Morgan Chase Commercial Mortgage Securities Trust(a)(b) | | | | | | | | | | | | |
Series 2018-WPT, Class DFL, (1-mo. LIBOR US + 2.50%), 7.36%, 07/05/33 | | | | | | | 1,253 | | | | 1,089,790 | |
Series 2021-INV5, Class F, (1-mo. LIBOR US + 2.95%), 7.90%, 04/15/38 | | | | | | | 3,330 | | | | 3,122,380 | |
Series 2021-MHC, Class E, (1-mo. LIBOR US + 2.45%), 7.40%, 04/15/38 | | | | | | | 7,630 | | | | 7,209,305 | |
Series 2022-NXSS, Class A, (1-mo. CME Term SOFR + 2.18%), 7.07%, 09/15/39 | | | | | | | 1,795 | | | | 1,790,490 | |
Series 2022-OPO, Class C, 3.56%, 01/05/39 | | | | | | | 3,082 | | | | 2,410,604 | |
JP Morgan Mortgage Trust(a)(b) | | | | | | | | | | | | |
Series 2021-INV7, Class A2A, 2.50%, 12/25/51 | | | | | | | 69,044 | | | | 56,729,100 | |
Series 2021-INV7, Class A3A, 2.50%, 02/25/52 | | | | | | | 27,272 | | | | 23,990,510 | |
Series 2021-INV7, Class A4A, 2.50%, 02/25/52 | | | | | | | 10,574 | | | | 7,259,728 | |
JPMCC Commercial Mortgage Securities Trust, Series 2019-COR4, Class A5, 4.03%, 03/10/52 | | | | | | | 4,308 | | | | 4,091,843 | |
KKR Industrial Portfolio Trust, Series 2021- KDIP, Class A, (1-mo. CME Term SOFR + 0.66%), 5.55%, 12/15/37(a)(b) | | | | | | | 1,900 | | | | 1,845,961 | |
LUXE Trust, Series 2021-TRIP, Class E,
(1-mo. LIBOR US + 2.75%), 7.70%, 10/15/38(a)(b) | | | | | | | 1,215 | | | | 1,150,299 | |
MCM Trust, 3.00%, 08/25/28(d) | | | | | | | 6,479 | | | | 4,263,504 | |
MED Trust(a)(b) | | | | | | | | | | | | |
Series 2021, Class A, (1-mo. LIBOR US + 0.95%), 5.90%, 11/15/38 | | | | | | | 1,587 | | | | 1,539,608 | |
| | |
| 30 | | 2 0 2 3 BLACK ROCK ANNUAL REPORT TO SHAREHOLDERS |
| | |
Consolidated Schedule of Investments (continued) April 30, 2023 | | BlackRock Global Allocation Fund, Inc. (Percentages shown are based on Net Assets) |
| | | | | | | | | | | | |
| Security | | | | | Par (000) | | | Value | |
| |
| | | |
| United States (continued) | | | | | | | | | |
MED Trust(a)(b) (continued) | | | | | | | | | | | | |
Series 2021, Class F, (1-mo. LIBOR US + 4.00%), 8.95%, 11/15/38 | | | USD | | | | 16,361 | | | $ | 15,280,832 | |
Series 2021, Class G, (1-mo. LIBOR US + 5.25%), 10.20%, 11/15/38 | | | | | | | 17,580 | | | | 16,151,418 | |
MF1 Trust, Series 2021-W10, Class F,
(1-mo. CME Term SOFR + 3.37%), 8.26%, 12/15/34(a)(b) | | | | | | | 8,512 | | | | 7,860,985 | |
MHC Commercial Mortgage Trust(a)(b) | | | | | | | | | | | | |
Series 2021-MHC, Class E, (1-mo. CME Term SOFR + 2.22%), 7.11%, 04/15/38 | | | | | | | 11,590 | | | | 11,039,258 | |
Series 2021-MHC, Class F, (1-mo. CME Term SOFR + 2.72%), 7.61%, 04/15/38 | | | | | | | 2,225 | | | | 2,108,145 | |
MHP Trust, Series 2021-STOR, Class G,
(1-mo. LIBOR US + 2.75%), 7.70%, 07/15/38(a)(b) | | | | | | | 3,936 | | | | 3,679,209 | |
Morgan Stanley Bank of America Merrill Lynch Trust | | | | | | | | | | | | |
Series 2015-C24, Class C, 4.47%, 05/15/48(a) | | | | | | | 647 | | | | 590,711 | |
Series 2016-C32, Class A4, 3.72%, 12/15/49 | | | | | | | 3,377 | | | | 3,205,810 | |
Morgan Stanley Capital I Trust | | | | | | | | | | | | |
Series 2018-MP, Class A, 4.42%, 07/11/40(a)(b) | | | | | | | 2,110 | | | | 1,751,732 | |
Series 2020-L4, Class A3, 2.70%, 02/15/53 | | | | | | | 2,855 | | | | 2,460,540 | |
PKHL Commercial Mortgage Trust, Series 2021- MF, Class F, (1-mo. LIBOR US + 3.35%), 8.30%, 07/15/38(a)(b) | | | | | | | 1,881 | | | | 1,730,577 | |
Ready Capital Mortgage Financing LLC, Series 2022-FL10, Class A, (1-mo. CME Term SOFR + 2.55%),
7.53%, 10/25/39(a)(b) | | | | | | | 12,457 | | | | 12,348,022 | |
RIAL Issuer Ltd., Series 2022-FL8, Class A, (1-mo. CME Term SOFR + 2.25%), 7.14%, 01/19/37(a)(b) | | | | | | | 4,557 | | | | 4,477,252 | |
SREIT Trust(a)(b) | | | | | | | | | | | | |
Series 2021-MFP, Class A, (1-mo. LIBOR US + 0.73%), 5.68%, 11/15/38 | | | | | | | 1,605 | | | | 1,549,154 | |
Series 2021-MFP, Class F, (1-mo. LIBOR US + 2.62%), 7.57%, 11/15/38 | | | | | | | 9,828 | | | | 9,182,340 | |
Series 2021-MFP2, Class F, (1-mo. LIBOR US + 2.62%), 7.57%, 11/15/36 | | | | | | | 4,565 | | | | 4,279,378 | |
Starwood Trust, Series 2021-FLWR, Class E, (1-mo. LIBOR US + 1.92%), 6.87%, 07/15/36(a)(b) | | | | | | | 3,290 | | | | 3,059,309 | |
TVC DSCR(d) | | | | | | | | | | | | |
0.00%, 02/01/51 | | | | | | | 6,340 | | | | 5,532,358 | |
2.33%, 02/01/51 | | | | | | | 25,362 | | | | 23,609,130 | |
UBS Commercial Mortgage Trust, Series 2019- C17, Class A4, 2.92%, 10/15/52 | | | | | | | 1,175 | | | | 1,033,119 | |
VNDO Trust, Series 2016-350P, Class D, 4.03%, 01/10/35(a)(b) | | | | | | | 2,150 | | | | 1,878,923 | |
Wells Fargo Commercial Mortgage Trust(a) | | | | | | | | | | | | |
Series 2015-C28, Class AS, 3.87%, 05/15/48 | | | | | | | 3,230 | | | | 3,092,494 | |
Series 2017-C38, Class C, 3.90%, 07/15/50 | | | | | | | 1,305 | | | | 1,092,076 | |
Series 2017-C41, Class B, 4.19%, 11/15/50 | | | | | | | 3,149 | | | | 2,785,839 | |
| | | | | | | | | | | | |
| Security | | | | | Par (000) | | | Value | |
| |
| | | |
| United States (continued) | | | | | | | | | |
Wells Fargo Commercial Mortgage Trust(a) (continued) | | | | | | | | | | | | |
Series 2018-1745, Class A, 3.87%, 06/15/36(b) | | | USD | | | | 2,162 | | | $ | 1,894,679 | |
Series 2020-C58, Class XA, 1.93%, 07/15/53 | | | | | | | 30,377 | | | | 2,989,836 | |
Series 2021-C59, Class XA, 1.66%, 04/15/54 | | | | | | | 24,889 | | | | 2,099,660 | |
| | | | | | | | |
| | | |
| | | | | | | | | | | 635,956,677 | |
| | | | | | | | |
| |
Total Non-Agency Mortgage-Backed
Securities — 3.5%
(Cost: $707,812,579) | | | | 643,380,816 | |
| | | | | | | | |
| | | |
| | | | | | Benefical Interest (000) | | | | |
| |
| | | |
Other Interests | | | | | | | | | | | | |
| | | |
| Canada — 0.1% | | | | | | | | | |
Sprott Private Resource Streaming(d)(u) | | | USD | | | | 21,280 | | | | 23,671,478 | |
| | | | | | | | |
| |
Total Other Interests — 0.1%
(Cost: $21,471,327) | | | | 23,671,478 | |
| | | | | | | | |
| | | |
| | | | | | Par (000) | | | | |
| |
| | | |
Preferred Securities | | | | | | | | | | | | |
| | | |
| Capital Trusts — 0.0%(a)(o) | | | | | | | | | |
| | | |
| Mexico — 0.0% | | | | | | | | | |
Banco Mercantil del Norte SA, 5.88%(b) | | | USD | | | | 1,037 | | | | 898,950 | |
| | | | | | | | |
| | | |
| Philippines — 0.0% | | | | | | | | | |
Rizal Commercial Banking Corp., 6.50%(c) | | | | | | | 1,000 | | | | 886,250 | |
| | | | | | | | |
| | | |
| Thailand — 0.0% | | | | | | | | | |
Kasikornbank PCL, 5.28%(c) | | | | | | | 300 | | | | 278,681 | |
| | | | | | | | |
| | | |
| United States — 0.0% | | | | | | | | | |
USB Capital IX, 6.28% | | | | | | | 3,935 | | | | 3,108,903 | |
| | | | | | | | |
| | | |
| | | | | | | | | | | 5,172,784 | |
| | | |
| | | | | | Shares | | | | |
| |
| | | |
| Preferred Stocks — 2.9% | | | | | | | | | |
| | | |
| Brazil — 0.1% | | | | | | | | | |
Neon Pagamentos SA, Series F(d) | | | | | | | 39,435 | | | | 20,999,926 | |
| | | | | | | | |
| | | |
| China — 0.3% | | | | | | | | | |
ByteDance Ltd., Series E-1, (Acquired 11/11/20, Cost: $33,821,714)(d)(h) | | | | | | | 308,665 | | | | 52,900,498 | |
| | | | | | | | |
| | | |
| Finland — 0.0% | | | | | | | | | |
Aiven, Series D(d) | | | | | | | 86,562 | | | | 6,929,288 | |
| | | | | | | | |
| | |
CONSOLIDATED SCHEDULE OF INVESTMENTS | | 31 |
| | |
Consolidated Schedule of Investments (continued) April 30, 2023 | | BlackRock Global Allocation Fund, Inc. (Percentages shown are based on Net Assets) |
| | | | | | | | | | | | |
| Security | | | | | Shares | | | Value | |
| | | |
| Germany — 0.3% | | | | | | | | | |
Dr Ing hc F Porsche AG(g) | | | | | | | 197,579 | | | $ | 24,740,628 | |
Volkswagen AG, Preference Shares | | | | | | | 10,159 | | | | 1,387,209 | |
Volocopter GmbH, Series D-2, (Acquired 03/03/21, Cost: $22,418,516)(d)(h) | | | | | | | 4,218 | | | | 27,247,683 | |
| | | | | | | | |
| | | |
| | | | | | | | | | | 53,375,520 | |
| | | | | | | | |
| | | |
| India — 0.0% | | | | | | | | | |
Think & Learn Private Ltd., Series F, (Acquired 12/11/20, Cost: $13,030,114)(d)(h) | | | | | | | 4,047 | | | | 6,880,227 | |
| | | | | | | | |
| | | |
| Israel(d)(h) — 0.1% | | | | | | | | | |
Deep Instinct Ltd. | | | | | | | | | | | | |
Series D-2, (Acquired 03/19/21, Cost: $11,638,040) | | | | | | | 1,914,819 | | | | 13,499,474 | |
Series D-4, (Acquired 09/20/22, Cost: $10,933,893) | | | | | | | 1,550,832 | | | | 10,933,365 | |
| | | | | | | | |
| | | |
| | | | | | | | | | | 24,432,839 | |
| | | |
| Sweden — 0.0% | | | | | | | | | |
Volta, Series C, (Acquired 02/22/22, Cost: $3,635,023)(d)(h) | | | | | | | 30,817 | | | | 3,278,914 | |
| | | | | | | | |
| | | |
| United Kingdom — 0.1% | | | | | | | | | |
10X Future Technologies Holdings Ltd., Series D, (Acquired 05/13/21, Cost: $24,142,699)(d)(h) | | | | | | | 637,808 | | | | 8,584,765 | |
| | | | | | | | |
| | | |
| United States — 2.0% | | | | | | | | | |
2020 Cash Mandatory Exchangeable Trust, 06/01/23(b) | | | | | | | 34,289 | | | | 39,931,598 | |
Aptiv PLC, Series A, 06/15/23 | | | | | | | 132,372 | | | | 14,983,187 | |
Boston Scientific Corp., Series A, 06/01/23 | | | | | | | 88,689 | | | | 11,150,868 | |
Breeze Aviation Group, Inc., Series B, (Acquired 07/30/21, Cost: $17,069,096)(d)(h) | | | | | | | 31,603 | | | | 9,540,946 | |
Caresyntax, Inc., Series C-2(d) | | | | | | | 39,141 | | | | 2,690,161 | |
Cruise, Series GClass G, (Acquired 03/25/21,
Cost: $9,841,593)(d)(h) | | | | | | | 373,495 | | | | 5,628,570 | |
Databricks, Inc.(d)(h) | | | | | | | | | | | | |
Series F, (Acquired 10/22/19, Cost: $11,769,837) | | | | | | | 822,138 | | | | 45,669,766 | |
Series G, (Acquired 02/01/21, Cost: $13,141,188) | | | | | | | 222,270 | | | | 12,347,098 | |
Dream Finders Homes, Inc., 9.00%, 12/31/49(d) | | | | | | | 38,156 | | | | 34,578,875 | |
Exo Imaging, Inc., Series C, (Acquired 06/24/21,
Cost: $8,339,244)(d)(h) | | | | | | | 1,423,565 | | | | 3,985,982 | |
Farmer’s Business Network, Inc.(d)(h) | | | | | | | | | | | | |
Series F, (Acquired 07/31/20, Cost: $8,907,002) | | | | | | | 269,447 | | | | 11,607,777 | |
Series G, (Acquired 09/15/21, Cost: $2,533,428) | | | | | | | 40,758 | | | | 1,755,855 | |
Jumpcloud, Inc.(d)(h) | | | | | | | | | | | | |
Series E-1, (Acquired 10/30/20, Cost: $11,778,091) | | | | | | | 6,458,349 | | | | 18,664,628 | |
Series F, (Acquired 09/03/21, Cost: $2,543,928) | | | | | | | 424,788 | | | | 1,227,637 | |
Lessen Nine GmbH(d) | | | | | | | | | | | | |
Series B | | | | | | | 841,086 | | | | 10,892,064 | |
Series C | | | | | | | 259,727 | | | | 3,363,465 | |
Loadsmart, Inc.(d)(h) | | | | | | | | | | | | |
Series C, (Acquired 10/05/20, Cost: $10,694,460) | | | | | | | 1,250,814 | | | | 17,836,608 | |
| | | | | | | | | | | | |
| Security | | | | | Shares | | | Value | |
| | | |
| United States (continued) | | | | | | | | | |
Loadsmart, Inc.(d)(h) (continued) | | | | | | | | | | | | |
Series D, (Acquired 01/27/22, Cost: $2,628,040) | | | | | | | 131,402 | | | $ | 1,873,792 | |
Lookout, Inc., Series F, (Acquired 09/19/14, Cost: $50,945,689)(d)(h) | | | | | | | 4,459,883 | | | | 19,489,689 | |
MNTN Digital, Inc., Series D, (Acquired 11/05/21, Cost: $7,559,970)(d)(h) | | | | | | | 329,191 | | | | 3,377,500 | |
Mythic AI, Inc., Series C, (Acquired 01/26/21, Cost: $6,129,221)(d)(h) | | | | | | | 892,159 | | | | 9 | |
Noodle Partners, Inc., Series C, (Acquired 08/26/21, Cost: $9,816,152)(d)(h) | | | | | | | 1,099,886 | | | | 5,840,395 | |
PsiQuantum Corp., Series E, (Acquired 05/21/21, Cost: $5,269,814)(d)(h) | | | | | | | 200,937 | | | | 4,762,207 | |
Relativity Space, Inc., Series E, (Acquired 05/27/21, Cost: $9,126,025)(d)(h) | | | | | | | 399,649 | | | | 6,230,528 | |
SambaNova Systems, Inc.(d)(h) | | | | | | | | | | | | |
Series C, (Acquired 02/19/20, Cost: $11,739,902) | | | | | | | 220,503 | | | | 13,333,816 | |
Series D, (Acquired 04/09/21, Cost: $6,878,356) | | | | | | | 72,390 | | | | 4,377,423 | |
Sci Ph Parent, Inc., Series F, (Acquired 02/10/23, Cost: $3,949,000), 12.50%, 12/31/79(d)(h) | | | | | | | 3,949 | | | | 3,966,060 | |
Snorkel AI, Inc., Series C, (Acquired 06/30/21,
Cost: $3,799,839)(d)(h) | | | | | | | 252,991 | | | | 1,960,680 | |
Ursa Major Technologies, Inc.(d)(h) | | | | | | | | | | | | |
Series C, (Acquired 09/13/21, Cost: $9,742,600) | | | | | | | 1,633,349 | | | | 10,616,768 | |
Series D, (Acquired 10/14/22, Cost: $1,326,169) | | | | | | | 200,098 | | | | 1,300,637 | |
Verge Genomics, Inc., Series B, (Acquired 11/05/21, Cost: $9,084,160)(d)(h) | | | | | | | 1,705,369 | | | | 8,953,187 | |
Versa Networks, Inc., Series E, (Acquired 10/14/22, Cost: $5,641,940), 12.00%, 10/07/32(d)(h) | | | | | | | 1,933,359 | | | | 5,703,409 | |
Zero Mass Water, Inc.(d)(h) | | | | | | | | | | | | |
Series C-1, (Acquired 05/07/20, Cost: $8,796,956) | | | | | | | 558,055 | | | | 17,048,580 | |
Series D, (Acquired 07/05/22, Cost: $1,648,279) | | | | | | | 40,240 | | | | 1,618,050 | |
| | | | | | | | |
| | | |
| | | | | | | | | | | 356,307,815 | |
| | | | | | | | |
| | | |
| | | | | | | | | | | 533,689,792 | |
| | | |
| Trust Preferreds — 0.2% | | | | | | | | | |
| | | |
| United States — 0.2% | | | | | | | | | |
Citigroup Capital XIII, 10/30/40(a) | | | | | | | 629,905 | | | | 18,374,329 | |
Wells Fargo & Co., Series L(o) | | | | | | | 5,825 | | | | 6,803,775 | |
| | | | | | | | |
| | | |
| | | | | | | | | | | 25,178,104 | |
| | | | | | | | |
| | | |
Total Preferred Securities — 3.1%
(Cost: $551,487,287) | | | | | | | | | | | 564,040,680 | |
| | | | | | | | |
| | | |
| | | | | | Par (000) | | | | |
|
U.S. Government Sponsored Agency Securities | |
| |
| Commercial Mortgage-Backed Securities(a) — 0.1% | | | | |
Fannie Mae, Series 2018-M13,
Class A2, 3.87%, 09/25/30 | | | USD | | | | 1,713 | | | | 1,670,404 | |
| | |
| 32 | | 2 0 2 3 BLACK ROCK ANNUAL REPORT TO SHAREHOLDERS |
| | |
Consolidated Schedule of Investments (continued) April 30, 2023 | | BlackRock Global Allocation Fund, Inc. (Percentages shown are based on Net Assets) |
| | | | | | | | | | | | |
| Security | | | | | Par (000) | | | Value | |
|
| Commercial Mortgage-Backed Securities (continued) | |
Freddie Mac Multifamily Structured Pass-Through Certificates | | | | | | | | | | | | |
Series K105, Class X1, 1.64%, 01/25/30 | | | USD | | | | 35,936 | | | $ | 2,927,895 | |
Series K109, Class X1, 1.70%, 04/25/30 | | | | | | | 15,092 | | | | 1,292,177 | |
Series K110, Class X1, 1.81%, 04/25/30 | | | | | | | 8,651 | | | | 780,339 | |
Series K116, Class X1, 1.53%, 07/25/30 | | | | | | | 7,759 | | | | 608,698 | |
Series K120, Class X1, 1.13%, 10/25/30 | | | | | | | 50,147 | | | | 2,947,077 | |
Series KL06, Class XFX, 1.47%, 12/25/29 | | | | | | | 8,414 | | | | 527,606 | |
Series KW09, Class X1, 0.94%, 05/25/29 | | | | | | | 57,828 | | | | 2,112,921 | |
| | | | | | | | |
| | | |
| | | | | | | | | | | 12,867,117 | |
| |
| Mortgage-Backed Securities(v) — 6.2% | | | | |
Uniform Mortgage-Backed Securities | | | | | | | | | | | | |
3.00%, 02/25/52 | | | | | | | 94,683 | | | | 85,044,248 | |
3.50%, 03/25/52 | | | | | | | 529,094 | | | | 491,602,195 | |
4.50%, 05/12/52 | | | | | | | 581,181 | | | | 568,127,526 | |
| | | | | | | | |
| | | |
| | | | | | | | | | | 1,144,773,969 | |
| | | | | | | | |
| |
Total U.S. Government Sponsored Agency Securities — 6.3%
(Cost: $1,157,736,809) | | | | 1,157,641,086 | |
| | | | | | | | |
| | | |
U.S. Treasury Obligations | | | | | | | | | | | | |
U.S. Treasury Bonds | | | | | | | | | | | | |
2.38%, 02/15/42 | | | | | | | 31,131 | | | | 25,124,906 | |
3.25%, 05/15/42(w)(x) | | | | | | | 74,241 | | | | 68,745,148 | |
3.38%, 08/15/42(j) | | | | | | | 41,130 | | | | 38,733,363 | |
4.00%, 11/15/52(w)(x) | | | | | | | 54,328 | | | | 57,681,269 | |
U.S. Treasury Inflation-Indexed Notes | | | | | | | | | | | | |
0.63%, 01/15/24 - 07/15/32(w) | | | | | | | 382,154 | | | | 373,792,968 | |
0.50%, 04/15/24 | | | | | | | 172,901 | | | | 169,226,621 | |
0.13%, 04/15/27 | | | | | | | 52,325 | | | | 49,731,108 | |
U.S. Treasury Notes, 0.75%, 12/31/23(k) | | | | | | | 39,431 | | | | 38,354,154 | |
| | | | | | | | |
| | |
Total U.S. Treasury Obligations — 4.5%
(Cost: $827,976,486) | | | | | | | | 821,389,537 | |
| | | | | | | | |
| | | |
| | | | | | Shares | | | | |
| | | |
Warrants | | | | | | | | | | | | |
| | | |
| Cayman Islands — 0.0% | | | | | | | | | |
Lavoro Ltd., Class A, (Issued 12/27/22, Exercisable 12/27/23, 1 Share for 1 Warrant, Expires 12/27/27, Strike Price USD 11.50)(e) | | | | | | | 95,675 | | | | 66,973 | |
| | | | | | | | |
| | | |
| Israel(e) — 0.0% | | | | | | | | | |
Deep Instinct Ltd., (Acquired 09/20/22, Cost: $0), (1 Share for 1 Warrant, Expires 09/20/32) (d)(h) | | | | | | | 109,339 | | | | 652,754 | |
Innovid Corp., (Issued/Exercisable 01/28/21, 1 Share for 1 Warrant, Expires 12/31/27, Strike Price USD 11.50) | | | | | | | 49,253 | | | | 4,753 | |
| | | | | | | | |
| | | |
| | | | | | | | | | | 657,507 | |
| | | | | | | | | | | | |
| Security | | | | | Shares | | | Value | |
| | | |
| Switzerland — 0.0% | | | | | | | | | |
Cie Financiere Richemont SA, (Issued 11/27/20, Exercisable 11/22/23, 0.01 Share for 1 Warrant, Expires 11/22/23, Strike Price CHF 67.00)(e) | | | | | | | 4,654 | | | $ | 5,988 | |
| | | | | | | | |
| | | |
| United Kingdom — 0.0% | | | | | | | | | |
Hedosophia European Growth, (Issued 05/13/21, Exercisable 05/13/22, 1 Share for 1 Warrant, Expires 05/13/27, Strike Price EUR 11.50)(e) | | | | | | | 260,415 | | | | 344 | |
| | | | | | | | |
| | | |
| United States(e) — 0.1% | | | | | | | | | |
Cano Health, Inc., (Issued 07/06/20, Exercisable 07/06/21, 1 Share for 1 Warrant, Expires 06/03/26, Strike Price USD 11.50) | | | | | | | 268,681 | | | | 72,221 | |
Crown PropTech Acquisitions, (Issued 02/05/21, 1 Share for 1 Warrant, Expires 02/01/26, Strike Price USD 11.50)(d) | | | | | | | 271,336 | | | | 21,707 | |
Crown PropTech Acquisitions, (Issued/Exercisable 01/25/21, 1 Share for 1 Warrant, Expires 12/31/27, Strike Price USD 11.50) | | | | | | | 162,368 | | | | 16,237 | |
Embark Technology, Inc., (Issued/Exercisable 12/28/20, 0.05 Share for 1 Warrant, Expires 12/31/27, Strike Price USD 230.00) | | | | | | | 126,570 | | | | 2,582 | |
EVgo, Inc., (Issued/Exercisable 11/10/20, 1 Share for 1 Warrant, Expires 09/15/25, Strike Price USD 11.50) | | | | | | | 146,070 | | | | 89,103 | |
Flyr Warrants, (Issued 05/10/22, 1 Share for 1 Warrant, Expires 05/10/32, Strike Price USD 3.95)(d) | | | | | | | 35,428 | | | | 576,768 | |
FreeWire Technologies, Inc., (Issued 04/27/22, 1 Share for 1 Warrant, Expires 04/26/27, Strike Price USD 3.35)(d) | | | | | | | 927,998 | | | | 296,959 | |
Green Plains, Inc., (Issued 02/05/21, 1 Share for 1 Warrant, Expires 04/28/26, Strike Price USD 22.00) | | | | | | | 1,464,976 | | | | 25,481,485 | |
Hippo Holdings, Inc., (Issued/Exercisable 01/04/21, 0.04 Share for 1 Warrant, Expires 08/02/26, Strike Price USD 287.50) | | | | | | | 123,393 | | | | 5,368 | |
Latch, Inc., (Issued/Exercisable 12/29/20, 1 Share for 1 Warrant, Expires 06/04/26, Strike Price USD 11.50)(g) | | | | | | | 111,795 | | | | 6,160 | |
Lightning eMotors, Inc., (Issued/Exercisable 05/13/20, 1 Share for 1 Warrant, Expires 05/18/25, Strike Price USD 11.50) | | | | | | | 292,348 | | | | 11,948 | |
Offerpad Solutions, Inc., (Issued/Exercisable 10/13/20, 1 Share for 1 Warrant, Expires 09/01/26, Strike Price USD 11.50) | | | | | | | 226,443 | | | | 4,868 | |
Proof Acquisition Corp. I, (1 Share for 1 Warrant, Expires 12/23/28, Strike Price USD (d) | | | | | | | 271,281 | | | | 16,277 | |
Rotor Acquisition Corp., (Issued/Exercisable 01/14/21, 1 Share for 1 Warrant, Expires 06/15/27, Strike Price USD | | | | | | | 92,406 | | | | 7,392 | |
| | |
CONSOLIDATED SCHEDULE OF INVESTMENTS | | 33 |
| | |
Consolidated Schedule of Investments (continued) April 30, 2023 | | BlackRock Global Allocation Fund, Inc. (Percentages shown are based on Net Assets) |
| | | | | | | | | | | | |
| Security | | | | | Shares | | | Value | |
| | | |
| United States (continued) | | | | | | | | | |
Sarcos Technology & Robotics Corp., Class A, (Issued/Exercisable 12/21/20, 1 Share for 1 Warrant, Expires 09/24/26, Strike Price USD 11.50) | | | | | | | 254,485 | | | $ | 27,841 | |
Sonder Holdings, Inc., (Issued 11/19/20, Exercisable 01/19/21, 1 Share for 1 Warrant, Expires 11/19/26, Strike Price USD 12.50)(d) | | | | | | | 295,710 | | | | 3 | |
Versa Networks, Inc., (Acquired 10/14/22, Cost: $0), (1 Share for 1 Warrant, Expires 10/07/32) (d)(h) | | | | | | | 238,291 | | | | 652,917 | |
Volta, Inc., Series C, (Issued/Exercisable 10/22/20, 1 Share for 1 Warrant, Expires 08/26/26, Strike Price USD 11.50)(d) | | | | | | | 150,460 | | | | 33,944 | |
| | | | | | | | |
| | | |
| | | | | | | | | | | 27,323,780 | |
| | | | | | | | |
| |
Total Warrants — 0.1%
(Cost: $4,828,469) | | | | 28,054,592 | |
| | | | | | | | |
| |
Total Long-Term Investments — 96.7%
(Cost: $15,782,154,466) | | | | 17,687,123,021 | |
| | | | | | | | |
| | | |
| | | | | | Par
(000) | | | | |
| | | |
Short-Term Securities | | | | | | | | | | | | |
| |
| Certificates of Deposit — 0.2% | | | | |
| |
| United States — 0.2% | | | | |
Citibank N.A., 5.00%, 09/21/23 | | | USD | | | | 29,540 | | | | 29,465,379 | |
| | | | | | | | |
| | | |
| | | | | | | | | | | 29,465,379 | |
| | | | | | | | |
| | | |
| Commercial Paper — 1.1% | | | | | | | | | |
| | | |
| United States(t) — 1.1% | | | | | | | | | |
3M Co., 5.55%, 09/07/23 | | | | | | | 20,019 | | | | 19,647,654 | |
HSBC USA, Inc., 5.62%, 11/20/23 | | | | | | | 7,087 | | | | 6,869,350 | |
Johnson & Johnson, 5.16%, 08/14/23 | | | | | | | 19,932 | | | | 19,641,152 | |
Mercedes-Benz Finance North America LLC, 5.59%, 05/03/23 | | | | | | | 59,310 | | | | 59,270,822 | |
Societe Generale SA, 5.70%, 03/06/24 | | | | | | | 15,007 | | | | 14,257,416 | |
UnitedHealth Group, Inc., 5.31%, 06/01/23 | | | | | | | 79,859 | | | | 79,459,790 | |
| | | | | | | | |
| | | |
| | | | | | | | | | | 199,146,184 | |
| | | | | | | | |
| | | |
| | | | | | Shares | | | | |
| |
| Money Market Funds — 8.8% | | | | |
BlackRock Liquidity Funds, T-Fund, Institutional Class, 4.72%(f)(y) | | | | | | | 1,395,015,218 | | | | 1,395,015,218 | |
SL Liquidity Series, LLC, Money Market Series, 5.02%(f)(y)(z) | | | | | | | 218,614,956 | | | | 218,636,817 | |
| | | | | | | | |
| | | |
| | | | | | | | | | | 1,613,652,035 | |
| | | | | | | | |
| | | | | | | | | | | | |
| Security | | | | | Par (000) | | | Value | |
| |
| | | |
| Time Deposits — 0.1% | | | | | | | | | |
| | | |
| Australia — 0.0% | | | | | | | | | |
Australia & New Zealand Banking Group Ltd., 2.27%, 05/05/23 | | | AUD | | | | 5,491 | | | $ | 3,633,422 | |
Brown Brothers Harriman & Co. | | | | | | | | | | | | |
1.85%, 05/01/23 | | | NOK | | | | 581 | | | | 54,525 | |
3.40%, 05/01/23 | | | NZD | | | | 89 | | | | 54,773 | |
| | | | | | | | |
| | | |
| | | | | | | | | | | 3,742,720 | |
| | | |
| Canada — 0.0% | | | | | | | | | |
Brown Brothers Harriman & Co.,, 3.31%, 05/03/23 | | | CAD | | | | 5,509 | | | | 4,066,295 | |
| | | | | | | | |
| | | |
| Denmark — 0.0% | | | | | | | | | |
Brown Brothers Harriman & Co., 1.60%, 05/01/23 | | | DKK | | | | 370 | | | | 54,706 | |
| | | | | | | | |
| | | |
| Hong Kong — 0.0% | | | | | | | | | |
Hongkong & Shanghai Banking Corp. Ltd., 0.84%, 05/01/23 | | | HKD | | | | 14,243 | | | | 1,814,435 | |
| | | | | | | | |
| | | |
| Japan — 0.0% | | | | | | | | | |
Sumitomo Bank Tokyo, (0.33%), 05/01/23 | | | JPY | | | | 730,310 | | | | 5,360,272 | |
| | | | | | | | |
| | | |
| Singapore — 0.0% | | | | | | | | | |
Hongkong & Shanghai Banking Corp. Ltd., 2.82%, 05/03/23 | | | SGD | | | | 113 | | | | 84,497 | |
| | | | | | | | |
| | | |
| South Africa — 0.0% | | | | | | | | | |
Brown Brothers Harriman & Co., 6.03%, 05/01/23 | | | ZAR | | | | 1,621 | | | | 88,588 | |
| | | | | | | | |
| | | |
| Sweden — 0.0% | | | | | | | | | |
Brown Brothers Harriman & Co., 1.74%, 05/01/23 | | | SEK | | | | 562 | | | | 54,771 | |
| | | | | | | | |
| | | |
| Switzerland — 0.0% | | | | | | | | | |
BNP Paribas, 0.46%, 05/01/23 | | | CHF | | | | 1,233 | | | | 1,379,650 | |
| | | | | | | | |
| | | |
| United Kingdom — 0.0% | | | | | | | | | |
ING Bank NV, 3.17%, 05/01/23 | | | GBP | | | | 2,438 | | | | 3,063,601 | |
| | | | | | | | |
| | | |
| United States — 0.1% | | | | | | | | | |
Citibank, New York, 1.93%, 05/01/23 | | | EUR | | | | 6,197 | | | | 6,828,169 | |
| | | | | | | | |
| | | |
| | | | | | | | | | | 26,537,704 | |
| | | | | | | | |
| |
Total Short-Term Securities — 10.2%
(Cost: $1,868,810,327) | | | | 1,868,801,302 | |
| | | | | | | | |
| |
Options Purchased — 0.4%
(Cost: $94,409,593) | | | | 80,953,870 | |
| | | | | | | | |
| |
Total Investments Before Options
Written — 107.3%
(Cost: $17,745,374,386) | | | | 19,636,878,193 | |
| | | | | | | | |
| | | |
| | | | | | Shares | | | | |
| |
| | | |
Investments Sold Short | | | | | | | | | | | | |
| | | |
Common Stocks | | | | | | | | | | | | |
| | | |
| France — (0.0)% | | | | | | | | | |
Pernod Ricard SA | | | | | | | (31,333 | ) | | | (7,236,327 | ) |
| | | | | | | | |
| | |
| 34 | | 2 0 2 3 BLACK ROCK ANNUAL REPORT TO SHAREHOLDERS |
| | |
Consolidated Schedule of Investments (continued) April 30, 2023 | | BlackRock Global Allocation Fund, Inc. (Percentages shown are based on Net Assets) |
| | | | | | | | | | | | |
| Security | | | | | Shares | | | Value | |
| |
| | | |
| United Kingdom — (0.0)% | | | | | | | | | |
Diageo PLC | | | | | | | (61,205 | ) | | $ | (2,791,933 | ) |
| | | | | | | | |
| | | |
| United States — (0.1)% | | | | | | | | | |
JM Smucker Co | | | | | | | (51,256 | ) | | | (7,914,439 | ) |
| | | | | | | | |
| |
Total Investments Sold Short — (0.1)%
(Proceeds: $(14,810,863)) | | | | (17,942,699 | ) |
| | | | | | | | |
| |
Options Written — (0.4)%
(Premiums Received: $(75,693,423)) | | | | (79,874,033 | ) |
| | | | | | | | |
| |
Total Investments, Net of Options
Written — 106.8%
(Cost: $17,654,870,100) | | | | 19,539,061,461 | |
| | | | | | | | |
| |
Liabilities in Excess of Other Assets — (6.8)% | | | | (1,250,024,422 | ) |
| | | | | | | | |
| |
Net Assets — 100.0% | | | $ | 18,289,037,039 | |
| | | | | | | | | | | | |
| (a) | Variable rate security. Interest rate resets periodically. The rate shown is the effective interest rate as of period end. Security description also includes the reference rate and spread if published and available. |
| (b) | Security exempt from registration pursuant to Rule 144A under the Securities Act of 1933, as amended. These securities may be resold in transactions exempt from registration to qualified institutional investors. |
| (c) | This security may be resold to qualified foreign investors and foreign institutional buyers under Regulation S of the Securities Act of 1933. |
| (d) | Security is valued using significant unobservable inputs and is classified as Level 3 in the fair value hierarchy. |
| (e) | Non-income producing security. |
| (f) | Affiliate of the Fund. |
| (g) | All or a portion of this security is on loan. |
| (h) | Restricted security as to resale, excluding 144A securities. The Fund held restricted securities with a current value of $500,997,810, representing 2.7% of its net assets as of period end, and an original cost of $500,407,900. |
| (i) | When-issued security. |
| (j) | All or a portion of the security has been pledged and/or segregated as collateral in connection with outstanding exchange-traded options written. |
| (k) | All or a portion of the security is held by a wholly-owned subsidiary. See Note 1 of the Notes to Consolidated Financial Statements for details on the wholly-owned subsidiary. |
| (l) | Investment does not issue shares. |
| (m) | Payment-in-kind security which may pay interest/dividends in additional par/shares and/or in cash. Rates shown are the current rate and possible payment rates. |
| (n) | Issuer filed for bankruptcy and/or is in default. |
| (o) | Perpetual security with no stated maturity date. |
| (p) | Convertible security. |
| (q) | Represents an unsettled loan commitment at period end. Certain details associated with this purchase are not known prior to the settlement date, including coupon rate. |
| (r) | Step coupon security. Coupon rate will either increase (step-up bond) or decrease (step- down bond) at regular intervals until maturity. Interest rate shown reflects the rate currently in effect. |
| (t) | Rates are discount rates or a range of discount rates as of period end. |
| (u) | Other interests represent beneficial interests in liquidation trusts and other reorganization or private entities. |
| (v) | Represents or includes a TBA transaction. |
| (w) | All or a portion of the security has been pledged as collateral in connection with outstanding OTC derivatives. |
| (x) | All or a portion of the security has been pledged as collateral in connection with outstanding TBA commitments. |
| (y) | Annualized 7-day yield as of period end. |
| (z) | All or a portion of this security was purchased with the cash collateral from loaned securities. |
Affiliates
Investments in issuers considered to be affiliate(s) of the Fund during the year ended April 30, 2023 for purposes of Section 2(a)(3) of the Investment Company Act of 1940, as amended, were as follows:
| | | | | | | | | | | | | | | | | | | | | | | | | | | | | | | | | | | | | | | | |
| | | | | | | | | | | |
| | | Affiliated Issuer | | Value at 04/30/22 | | | Purchases at Cost | | | Proceeds from Sales | | | Net Realized Gain (Loss) | | | Change in Unrealized Appreciation (Depreciation) | | | Value at 04/30/23 | | | Par/Shares Held at 04/30/23 | | | Income | | | Capital Gain Distributions from Underlying Funds | | | |
| | | | | | | | | | | |
| | Bio City Development Co. BV | | $ | 10,394,730 | | | $ | — | | | $ | — | | | $ | — | | | $ | 521,145 | | | $ | 10,915,875 | | | | 140,850,000 | | | $ | — | | | $ | — | | | |
| | BlackRock Liquidity Funds, T-Fund, Institutional Class | | | 4,077,927,563 | | | | — | | | | (2,682,912,345 | )(a) | | | — | | | | — | | | | 1,395,015,218 | | | | 1,395,015,218 | | | | 29,731,899 | | | | — | | | |
| | iShares 0-5 Year TIPS Bond ETF | | | — | | | | 18,823,538 | | | | — | | | | — | | | | 98,272 | | | | 18,921,810 | | | | 190,821 | | | | 116,895 | | | | — | | | |
| | iShares Biotechnology ETF | | | 2,297,772 | | | | — | | | | — | | | | — | | | | 273,014 | | | | 2,570,786 | | | | 19,698 | | | | 6,994 | | | | — | | | |
| | iShares China Large-Cap ETF | | | 11,232,953 | | | | 19,641,470 | | | | (32,000,734 | ) | | | (1,658,469 | ) | | | 4,736,972 | | | | 1,952,192 | | | | 68,909 | | | | 530,337 | | | | — | | | |
| | iShares iBoxx $ High Yield Corporate Bond ETF(b) | | | 106,879 | | | | 122,127,674 | | | | (120,347,691 | ) | | | (1,886,549 | ) | | | (313 | ) | | | — | | | | — | | | | 1,196,797 | | | | — | | | |
| | iShares iBoxx $ Investment Grade Corporate Bond ETF | | | 3,056,977 | | | | 589,131,892 | | | | (500,356,228 | ) | | | (19,606,434 | ) | | | 418,395 | | | | 72,644,602 | | | | 660,826 | | | | 1,977,731 | | | | — | | | |
| | iShares JP Morgan USD Emerging Markets Bond ETF | | | — | | | | 168,814,591 | | | | (130,368,402 | ) | | | (14,136,037 | ) | | | (727,795 | ) | | | 23,582,357 | | | | 273,736 | | | | 1,499,347 | | | | — | | | |
| | iShares Latin America 40 ETF | | | 9,684,301 | | | | — | | | | — | | | | — | | | | (560,280 | ) | | | 9,124,021 | | | | 371,046 | | | | 1,080,416 | | | | — | | | |
| | iShares MSCI Brazil ETF | | | 14,315,673 | | | | — | | | | — | | | | — | | | | (1,965,839 | ) | | | 12,349,834 | | | | 436,853 | | | | 1,538,089 | | | | — | | | |
| | iShares MSCI Emerging Markets ETF | | | 2,391,715 | | | | — | | | | — | | | | — | | | | (183,413 | ) | | | 2,208,302 | | | | 56,435 | | | | 53,398 | | | | — | | | |
| | iShares Russell 2000 ETF(b) | | | — | | | | 130,483,272 | | | | (138,192,351 | ) | | | 7,709,079 | | | | — | | | | — | | | | — | | | | — | | | | — | | | |
| | Quintis Australia Pty. Ltd. | | | 92,389,186 | | | | — | | | | — | | | | — | | | | 21,891 | | | | 92,389,186 | | | | 92,389,186 | | | | 412,620 | | | | — | | | |
| | Quintis Australia Pty. Ltd. | | | 82,684,528 | | | | — | | | | — | | | | — | | | | (79,545,919 | ) | | | 2,877,422 | | | | 82,684,528 | | | | — | | | | — | | | |
| | |
CONSOLIDATED SCHEDULE OF INVESTMENTS | | 35 |
| | |
Consolidated Schedule of Investments (continued) April 30, 2023 | | BlackRock Global Allocation Fund, Inc. |
| | | | | | | | | | | | | | | | | | | | | | | | | | | | | | | | | | | | | | | | |
| | | | | | | | | | | |
| | | Affiliated Issuer | | Value at 04/30/22 | | | Purchases at Cost | | | Proceeds from Sales | | | Net Realized Gain (Loss) | | | Change in Unrealized Appreciation (Depreciation) | | | Value at 04/30/23 | | | Par/Shares Held at 04/30/23 | | | Income | | | Capital Gain Distributions from Underlying Funds | | | |
| | | | | | | | | | | |
| | Quintis HoldCo. Pty. Ltd. | | $ | 6,458,420 | | | $ | — | | | $ | — | | | $ | — | | | $ | (6,458,131 | ) | | $ | 289 | | | | 43,735,802 | | | $ | — | | | $ | — | | | |
| | SL Liquidity Series, LLC, Money Market Series | | | 174,301,878 | | | | 44,205,864(a | ) | | | — | | | | 84,445 | | | | 44,630 | | | | 218,636,817 | | | | 218,614,956 | | | | 2,361,697(c | ) | | | — | | | |
| | | | | | | | | | | | | | | | | | | | | | | | | | | | | | | | | | | | | | | | |
| | | | | | | | | | | |
| | | | | | | | | | | | | | | | $ | (29,493,965 | ) | | $ | (83,327,371 | ) | | $ | 1,863,188,711 | | | | | | | $ | 40,506,220 | | | $ | — | | | |
| | | | | | | | | | | | | | | | | | | | | | | | | | | | | | | | | | | | | | | | |
| | (a) | Represents net amount purchased (sold). | |
| | (b) | As of period end, the entity is no longer held. | |
| | (c) | All or a portion represents securities lending income earned from the reinvestment of cash collateral from loaned securities, net of fees and collateral investment expenses, and other payments to and from borrowers of securities. | |
Derivative Financial Instruments Outstanding as of Period End
Futures Contracts
| | | | | | | | | | | | | | |
| | | | | |
| Description | | Number of Contracts | | | Expiration Date | | | Notional
Amount (000) | | Value/ Unrealized Appreciation (Depreciation) | |
| | | | |
Long Contracts | | | | | | | | | | | | | | |
Euro BOBL | | | 613 | | | | 06/08/23 | | | $ 79,685 | | $ | 1,870,498 | |
Euro Bund | | | 6,255 | | | | 06/08/23 | | | 934,332 | | | 27,337,811 | |
Euro OAT | | | 445 | | | | 06/08/23 | | | 63,740 | | | 1,995,758 | |
10-Year Australian Treasury Bonds | | | 3,436 | | | | 06/15/23 | | | 278,416 | | | 6,707,009 | |
Euro Stoxx Banks Index | | | 2,036 | | | | 06/16/23 | | | 11,399 | | | (162,110 | ) |
MSCI Emerging Markets Index | | | 699 | | | | 06/16/23 | | | 34,398 | | | 1,077,285 | |
U.S. Long Bond | | | 265 | | | | 06/21/23 | | | 34,947 | | | 1,774,857 | |
Ultra U.S. Treasury Bond | | | 3,976 | | | | 06/21/23 | | | 562,977 | | | 23,367,743 | |
Long Gilt | | | 573 | | | | 06/28/23 | | | 73,063 | | | 145,061 | |
5-Year U.S. Treasury Note | | | 3,427 | | | | 06/30/23 | | | 376,809 | | | (1,053,666 | ) |
3-Month SONIA Index | | | 1,383 | | | | 09/19/23 | | | 413,925 | | | 1,348,598 | |
| | | | | | | | | | | | | | |
| | | | |
| | | | | | | | | | | | | 64,408,844 | |
| | | | | | | | | | | | | | |
| | | | |
Short Contracts | | | | | | | | | | | | | | |
30-Year Euro Buxl Bond | | | 90 | | | | 06/08/23 | | | 13,834 | | | (709,165 | ) |
Euro BTP | | | 594 | | | | 06/08/23 | | | 75,173 | | | (2,249,367 | ) |
Euro-Schatz | | | 947 | | | | 06/08/23 | | | 110,272 | | | (1,056,792 | ) |
Nikkei 225 Yen-Denominated | | | 27 | | | | 06/08/23 | | | 2,880 | | | (105,213 | ) |
SPI 200 Index | | | 35 | | | | 06/15/23 | | | 4,269 | | | (201,069 | ) |
Euro Stoxx 50 Index | | | 619 | | | | 06/16/23 | | | 29,514 | | | (522,944 | ) |
FTSE 100 Index | | | 73 | | | | 06/16/23 | | | 7,214 | | | (239,894 | ) |
NASDAQ 100 E-Mini Index | | | 1,158 | | | | 06/16/23 | | | 308,497 | | | (26,263,476 | ) |
Russell 2000 E-Mini Index | | | 254 | | | | 06/16/23 | | | 22,540 | | | 89,605 | |
S&P 500 E-Mini Index | | | 1,153 | | | | 06/16/23 | | | 241,467 | | | (2,460,456 | ) |
10-Year U.S. Treasury Note | | | 404 | | | | 06/21/23 | | | 46,643 | | | (310,213 | ) |
10-Year U.S. Ultra Long Treasury Note | | | 17,709 | | | | 06/21/23 | | | 2,155,517 | | | (51,455,863 | ) |
2-Year U.S. Treasury Note | | | 5,467 | | | | 06/30/23 | | | 1,127,953 | | | 1,389,624 | |
| | | | | | | | | | | | | | |
| | | | |
| | | | | | | | | | | | | (84,095,223 | ) |
| | | | | | | | | | | | | | |
| | | | |
| | | | | | | | | | | | $ | (19,686,379 | ) |
| | | | | | | | | | | | | | |
Forward Foreign Currency Exchange Contracts
| | | | | | | | | | | | | | | | | | | | |
| | | | | |
| Currency Purchased | | | Currency Sold | | | Counterparty | | Settlement Date | | | Unrealized
Appreciation
(Depreciation) | |
| | | | | | |
USD | | | 165,404,610 | | | HKD | | | 1,293,488,864 | | | BNP Paribas SA | | | 05/16/23 | | | $ | 529,304 | |
BRL | | | 110,793,648 | | | USD | | | 20,983,566 | | | HSBC Bank PLC | | | 06/02/23 | | | | 1,094,485 | |
USD | | | 39,038,613 | | | JPY | | | 5,255,250,000 | | | Deutsche Bank AG | | | 06/05/23 | | | | 269,055 | |
BRL | | | 148,724,251 | | | USD | | | 29,328,387 | | | Barclays Bank PLC | | | 06/14/23 | | | | 245,988 | |
BRL | | | 57,616,500 | | | USD | | | 10,820,000 | | | Citibank N.A. | | | 06/14/23 | | | | 637,257 | |
| | |
| 36 | | 2 0 2 3 BLACK ROCK ANNUAL REPORT TO SHAREHOLDERS |
| | |
Consolidated Schedule of Investments (continued) April 30, 2023 | | BlackRock Global Allocation Fund, Inc. |
Forward Foreign Currency Exchange Contracts (continued)
| | | | | | | | | | | | | | | | | | | | |
| Currency Purchased | | | Currency Sold | | | Counterparty | | Settlement Date | | | Unrealized Appreciation (Depreciation) | |
| | | | | | |
| COP | | | 43,584,640,000 | | | USD | | | 9,020,000 | | | Deutsche Bank AG | | | 06/14/23 | | | $ | 167,687 | |
| CZK | | | 238,309,526 | | | USD | | | 10,820,000 | | | Deutsche Bank AG | | | 06/14/23 | | | | 318,186 | |
| CZK | | | 311,850,000 | | | USD | | | 14,495,212 | | | Morgan Stanley & Co. International PLC | | | 06/14/23 | | | | 80,132 | |
| HUF | | | 4,374,197,210 | | | USD | | | 12,626,861 | | | Citibank N.A. | | | 06/14/23 | | | | 125,806 | |
| IDR | | | 111,042,705,000 | | | USD | | | 7,435,564 | | | JPMorgan Chase Bank N.A. | | | 06/14/23 | | | | 129,680 | |
| IDR | | | 172,722,000,000 | | | USD | | | 11,568,788 | | | UBS AG | | | 06/14/23 | | | | 198,612 | |
| INR | | | 581,440,000 | | | USD | | | 7,047,758 | | | Citibank N.A. | | | 06/14/23 | | | | 50,807 | |
| INR | | | 585,085,000 | | | USD | | | 7,102,537 | | | Citibank N.A. | | | 06/14/23 | | | | 40,528 | |
| INR | | | 1,421,650,000 | | | USD | | | 17,295,012 | | | Citibank N.A. | | | 06/14/23 | | | | 61,335 | |
| MXN | | | 266,460,000 | | | USD | | | 14,353,001 | | | Goldman Sachs International | | | 06/14/23 | | | | 339,458 | |
| THB | | | 301,446,955 | | | USD | | | 8,695,000 | | | BNP Paribas SA | | | 06/14/23 | | | | 169,107 | |
| THB | | | 301,951,265 | | | USD | | | 8,695,000 | | | BNP Paribas SA | | | 06/14/23 | | | | 183,937 | |
| THB | | | 211,925,350 | | | USD | | | 6,110,000 | | | HSBC Bank PLC | | | 06/14/23 | | | | 121,707 | |
| USD | | | 4,869,090 | | | COP | | | 22,982,300,503 | | | Goldman Sachs International | | | 06/14/23 | | | | 24,398 | |
| USD | | | 6,830,559 | | | ZAR | | | 122,532,518 | | | Barclays Bank PLC | | | 06/14/23 | | | | 157,584 | |
| ZAR | | | 265,204,641 | | | USD | | | 14,430,000 | | | Citibank N.A. | | | 06/14/23 | | | | 12,731 | |
| BRL | | | 70,889,943 | | | USD | | | 13,611,740 | | | Citibank N.A. | | | 06/15/23 | | | | 482,649 | |
| BRL | | | 486,358,717 | | | USD | | | 93,198,414 | | | Goldman Sachs International | | | 06/15/23 | | | | 3,499,772 | |
| CHF | | | 295,442,001 | | | USD | | | 325,287,092 | | | UBS AG | | | 06/15/23 | | | | 6,872,147 | |
| DKK | | | 487,413,439 | | | USD | | | 70,436,794 | | | JPMorgan Chase Bank N.A. | | | 06/15/23 | | | | 1,829,569 | |
| EUR | | | 513,962,428 | | | USD | | | 552,753,742 | | | UBS AG | | | 06/15/23 | | | | 14,974,570 | |
| GBP | | | 32,082,115 | | | EUR | | | 36,188,622 | | | JPMorgan Chase Bank N.A. | | | 06/15/23 | | | | 381,679 | |
| GBP | | | 48,365,909 | | | USD | | | 58,657,860 | | | JPMorgan Chase Bank N.A. | | | 06/15/23 | | | | 2,181,497 | |
| HUF | | | 7,136,290,149 | | | USD | | | 19,192,444 | | | HSBC Bank PLC | | | 06/15/23 | | | | 1,607,010 | |
| MXN | | | 2,757,967,677 | | | USD | | | 147,153,610 | | | Barclays Bank PLC | | | 06/15/23 | | | | 4,888,640 | |
| MXN | | | 276,664,549 | | | USD | | | 14,764,025 | | | Goldman Sachs International | | | 06/15/23 | | | | 488,039 | |
| NZD | | | 16,242,870 | | | USD | | | 10,022,013 | | | Deutsche Bank AG | | | 06/15/23 | | | | 20,988 | |
| PLN | | | 122,725,991 | | | USD | | | 27,146,864 | | | Goldman Sachs International | | | 06/15/23 | | | | 2,269,486 | |
| SGD | | | 48,260,157 | | | USD | | | 35,929,108 | | | Citibank N.A. | | | 06/15/23 | | | | 294,578 | |
| USD | | | 88,141,768 | | | CNH | | | 606,064,737 | | | HSBC Bank PLC | | | 06/15/23 | | | | 364,817 | |
| USD | | | 40,273,500 | | | NOK | | | 419,814,834 | | | Deutsche Bank AG | | | 06/15/23 | | | | 796,860 | |
| ZAR | | | 927,744,571 | | | USD | | | 50,413,487 | | | JPMorgan Chase Bank N.A. | | | 06/15/23 | | | | 105,693 | |
| BRL | | | 119,551,239 | | | USD | | | 22,356,473 | | | HSBC Bank PLC | | | 06/21/23 | | | | 1,389,116 | |
| COP | | | 107,708,985,510 | | | USD | | | 22,299,997 | | | Morgan Stanley & Co. International PLC | | | 06/21/23 | | | | 374,274 | |
| HUF | | | 8,110,762,264 | | | USD | | | 22,098,291 | | | Bank of America N.A. | | | 06/21/23 | | | | 1,501,199 | |
| IDR | | | 298,222,829,456 | | | USD | | | 19,901,423 | | | JPMorgan Chase Bank N.A. | �� | | 06/21/23 | | | | 414,076 | |
| MXN | | | 420,398,497 | | | USD | | | 22,324,810 | | | Citibank N.A. | | | 06/21/23 | | | | 823,139 | |
| MXN | | | 911,704,337 | | | USD | | | 47,951,882 | | | Deutsche Bank AG | | | 06/21/23 | | | | 2,248,310 | |
| USD | | | 27,508,320 | | | BRL | | | 136,936,417 | | | Citibank N.A. | | | 06/21/23 | | | | 309,640 | |
| USD | | | 22,873,713 | | | CNH | | | 156,280,069 | | | Goldman Sachs International | | | 06/21/23 | | | | 228,694 | |
| USD | | | 36,716,410 | | | JPY | | | 4,853,321,939 | | | JPMorgan Chase Bank N.A. | | | 06/21/23 | | | | 823,929 | |
| USD | | | 23,052,682 | | | TWD | | | 692,387,304 | | | HSBC Bank PLC | | | 06/21/23 | | | | 451,760 | |
| | | | | | | | | | | | | | | | | | | | |
| | | | | | |
| | | | | | | | | | | | | | | | | | | 54,579,915 | |
| | | | | | | | | | | | | | | | | | | | |
| AUD | | | 433,941,511 | | | USD | | | 302,188,189 | | | HSBC Bank PLC | | | 05/16/23 | | | | (14,881,207 | ) |
| NOK | | | 872,236,587 | | | CHF | | | 78,882,697 | | | HSBC Bank PLC | | | 05/16/23 | | | | (6,482,169 | ) |
| KRW | | | 93,902,946,286 | | | USD | | | 73,820,169 | | | Citibank N.A. | | | 05/17/23 | | | | (3,572,847 | ) |
| KRW | | | 37,029,040,000 | | | USD | | | 28,680,226 | | | JPMorgan Chase Bank N.A. | | | 06/14/23 | | | | (936,757 | ) |
| NOK | | | 133,715,677 | | | USD | | | 12,893,975 | | | JPMorgan Chase Bank N.A. | | | 06/14/23 | | | | (320,833 | ) |
| SGD | | | 17,113,288 | | | USD | | | 12,881,468 | | | JPMorgan Chase Bank N.A. | | | 06/14/23 | | | | (36,876 | ) |
| THB | | | 295,380,000 | | | USD | | | 8,723,310 | | | HSBC Bank PLC | | | 06/14/23 | | | | (37,603 | ) |
| USD | | | 4,043,256 | | | COP | | | 19,251,961,950 | | | Citibank N.A. | | | 06/14/23 | | | | (15,078 | ) |
| USD | | | 4,896,581 | | | COP | | | 23,949,179,635 | | | Citibank N.A. | | | 06/14/23 | | | | (151,930 | ) |
| USD | | | 6,166,381 | | | CZK | | | 132,804,104 | | | Barclays Bank PLC | | | 06/14/23 | | | | (40,660 | ) |
| USD | | | 11,317,549 | | | CZK | | | 249,578,104 | | | Barclays Bank PLC | | | 06/14/23 | | | | (347,311 | ) |
| USD | | | 9,540,788 | | | CZK | | | 211,415,466 | | | HSBC Bank PLC | | | 06/14/23 | | | | (340,415 | ) |
| USD | | | 6,618,093 | | | CZK | | | 141,723,567 | | | JPMorgan Chase Bank N.A. | | | 06/14/23 | | | | (5,828 | ) |
| USD | | | 1,265,091 | | | EUR | | | 1,166,584 | | | BNP Paribas SA | | | 06/14/23 | | | | (23,457 | ) |
| USD | | | 1,050,617 | | | EUR | | | 987,415 | | | HSBC Bank PLC | | | 06/14/23 | | | | (40,031 | ) |
| USD | | | 6,504,827 | | | IDR | | | 97,253,670,441 | | | Barclays Bank PLC | | | 06/14/23 | | | | (120,981 | ) |
| USD | | | 8,292,334 | | | IDR | | | 124,185,990,060 | | | BNP Paribas SA | | | 06/14/23 | | | | (168,350 | ) |
| USD | | | 6,531,920 | | | IDR | | | 98,586,265,437 | | | Deutsche Bank AG | | | 06/14/23 | | | | (184,677 | ) |
| | |
CONSOLIDATED SCHEDULE OF INVESTMENTS | | 37 |
| | |
Consolidated Schedule of Investments (continued) April 30, 2023 | | BlackRock Global Allocation Fund, Inc. |
Forward Foreign Currency Exchange Contracts (continued)
| | | | | | | | | | | | | | | | | | | | |
| Currency Purchased | | | Currency Sold | | | Counterparty | | Settlement Date | | | Unrealized
Appreciation
(Depreciation) | |
| | | | | | |
| USD | | | 6,089,714 | | | IDR | | | 90,742,835,046 | | | JPMorgan Chase Bank N.A. | | | 06/14/23 | | | $ | (92,516 | ) |
| USD | | | 8,594,308 | | | IDR | | | 130,677,305,539 | | | JPMorgan Chase Bank N.A. | | | 06/14/23 | | | | (308,624 | ) |
| USD | | | 10,100,267 | | | MXN | | | 193,944,319 | | | Bank of America N.A. | | | 06/14/23 | | | | (593,717 | ) |
| USD | | | 17,098,388 | | | MXN | | | 313,741,737 | | | Bank of America N.A. | | | 06/14/23 | | | | (201,161 | ) |
| USD | | | 20,080,324 | | | MXN | | | 377,624,712 | | | Deutsche Bank AG | | | 06/14/23 | | | | (741,697 | ) |
| USD | | | 23,500,000 | | | MXN | | | 438,498,250 | | | Goldman Sachs International | | | 06/14/23 | | | | (678,555 | ) |
| USD | | | 12,461,987 | | | MXN | | | 227,795,722 | | | JPMorgan Chase Bank N.A. | | | 06/14/23 | | | | (98,545 | ) |
| USD | | | 13,313,509 | | | MXN | | | 244,858,749 | | | Morgan Stanley & Co. International PLC | | | 06/14/23 | | | | (187,869 | ) |
| USD | | | 5,856,585 | | | ZAR | | | 107,687,327 | | | Deutsche Bank AG | | | 06/14/23 | | | | (7,939 | ) |
| USD | | | 4,700,394 | | | ZAR | | | 86,707,707 | | | Goldman Sachs International | | | 06/14/23 | | | | (21,605 | ) |
| USD | | | 6,920,939 | | | ZAR | | | 127,810,000 | | | Goldman Sachs International | | | 06/14/23 | | | | (39,442 | ) |
| USD | | | 9,518,547 | | | ZAR | | | 176,475,017 | | | Goldman Sachs International | | | 06/14/23 | | | | (92,074 | ) |
| USD | | | 4,216,035 | | | ZAR | | | 77,488,262 | | | Morgan Stanley & Co. International PLC | | | 06/14/23 | | | | (3,884 | ) |
| ZAR | | | 193,180,000 | | | USD | | | 10,758,521 | | | Citibank N.A. | | | 06/14/23 | | | | (238,167 | ) |
| ZAR | | | 233,990,950 | | | USD | | | 12,836,192 | | | Goldman Sachs International | | | 06/14/23 | | | | (93,322 | ) |
| CAD | | | 174,527,114 | | | USD | | | 130,339,360 | | | HSBC Bank PLC | | | 06/15/23 | | | | (1,410,114 | ) |
| JPY | | | 16,836,743,747 | | | EUR | | | 115,329,784 | | | JPMorgan Chase Bank N.A. | | | 06/15/23 | | | | (2,994,006 | ) |
| JPY | | | 172,468,125,392 | | | USD | | | 1,301,842,734 | | | JPMorgan Chase Bank N.A. | | | 06/15/23 | | | | (27,539,378 | ) |
| USD | | | 59,320,184 | | | INR | | | 4,889,970,364 | | | Citibank N.A. | | | 06/15/23 | | | | (376,600 | ) |
| USD | | | 26,130,628 | | | SEK | | | 276,216,079 | | | JPMorgan Chase Bank N.A. | | | 06/15/23 | | | | (863,676 | ) |
| USD | | | 17,932,868 | | | BRL | | | 95,994,642 | | | Barclays Bank PLC | | | 06/21/23 | | | | (1,133,846 | ) |
| USD | | | 36,766,591 | | | BRL | | | 189,605,310 | | | Barclays Bank PLC | | | 06/21/23 | | | | (893,326 | ) |
| USD | | | 17,973,572 | | | BRL | | | 94,558,962 | | | Citibank N.A. | | | 06/21/23 | | | | (807,984 | ) |
| USD | | | 8,971,195 | | | BRL | | | 48,351,960 | | | JPMorgan Chase Bank N.A. | | | 06/21/23 | | | | (632,602 | ) |
| USD | | | 39,425,071 | | | EUR | | | 36,072,361 | | | Bank of America N.A. | | | 06/21/23 | | | | (434,272 | ) |
| USD | | | 92,497,815 | | | EUR | | | 84,386,577 | | | Bank of America N.A. | | | 06/21/23 | | | | (747,911 | ) |
| USD | | | 46,433,978 | | | EUR | | | 42,892,158 | | | Citibank N.A. | | | 06/21/23 | | | | (961,124 | ) |
| USD | | | 68,956,822 | | | EUR | | | 63,829,701 | | | Deutsche Bank AG | | | 06/21/23 | | | | (1,573,908 | ) |
| USD | | | 44,205,921 | | | EUR | | | 40,844,802 | | | HSBC Bank PLC | | | 06/21/23 | | | | (926,888 | ) |
| USD | | | 21,882,554 | | | EUR | | | 20,420,000 | | | JPMorgan Chase Bank N.A. | | | 06/21/23 | | | | (681,197 | ) |
| USD | | | 22,367,196 | | | EUR | | | 21,038,000 | | | JPMorgan Chase Bank N.A. | | | 06/21/23 | | | | (879,435 | ) |
| USD | | | 91,777,646 | | | EUR | | | 83,835,874 | | | Morgan Stanley & Co. International PLC | | | 06/21/23 | | | | (859,562 | ) |
| USD | | | 22,865,707 | | | EUR | | | 20,986,570 | | | UBS AG | | | 06/21/23 | | | | (324,094 | ) |
| USD | | | 22,869,268 | | | GBP | | | 18,592,296 | | | JPMorgan Chase Bank N.A. | | | 06/21/23 | | | | (520,660 | ) |
| USD | | | 17,932,868 | | | MXN | | | 345,189,776 | | | Citibank N.A. | | | 06/21/23 | | | | (1,073,944 | ) |
| USD | | | 36,766,591 | | | MXN | | | 675,512,577 | | | Citibank N.A. | | | 06/21/23 | | | | (428,429 | ) |
| USD | | | 8,971,195 | | | MXN | | | 173,381,800 | | | Goldman Sachs International | | | 06/21/23 | | | | (575,540 | ) |
| USD | | | 17,973,572 | | | MXN | | | 336,903,823 | | | Goldman Sachs International | | | 06/21/23 | | | | (577,000 | ) |
| USD | | | 18,338,880 | | | MXN | | | 336,142,501 | | | Goldman Sachs International | | | 06/21/23 | | | | (169,772 | ) |
| | | | | | | | | | | | | | | | | | | | |
| | | | | | |
| | | | | | | | | | | | | | | | | | | (78,491,395 | ) |
| | | | | | | | | | | | | | | | | | | | |
| | | | | | |
| | | | | | | | | | | | | | | | | | $ | (23,911,480 | ) |
| | | | | | | | | | | | | | | | | | | | |
Interest Rate Caps — Purchased
| | | | | | | | | | | | | | | | | | | | | | | | | | |
| | | | | | | | |
| Description | | Exercise Rate | | | Counterparty | | Expiration Date | | | Notional Amount (000) | | | Value | | | Premiums Paid (Received) | | | Unrealized Appreciation
(Depreciation) | |
| | | | | | | |
Put | | | | | | | | | | | | | | | | | | | | | | | | | | |
5Y-30Y CMS Index Cap | | | 0.07 | % | | Goldman Sachs International | | | 09/27/23 | | | USD | 1,192,388 | | | $ | 1,507,965 | | | $ | 2,086,679 | | | $ | (578,714 | ) |
| | | | | | | | | | | | | | | | | | | | | | | | | | |
Exchange-Traded Options Purchased
| | | | | | | | | | | | | | | | | | | | | | | | |
| | | | | | |
| Description | | Number of Contracts | | | Expiration Date | | | Exercise Price | | | Notional Amount (000) | | | Value | |
| | | | | | | |
Call | | | | | | | | | | | | | | | | | | | | | | | | |
SPDR S&P 500 ETF Trust | | | 4,668 | | | | 05/05/23 | | | USD | | | 415.00 | | | USD | | | 194,156 | | | $ | 1,979,232 | |
SPX Volatility Index | | | 960 | | | | 05/17/23 | | | USD | | | 30.00 | | | USD | | | 1,515 | | | | 18,720 | |
Advanced Micro Devices, Inc. | | | 1,767 | | | | 05/19/23 | | | USD | | | 105.00 | | | USD | | | 15,792 | | | | 79,515 | |
Alphabet Inc., Class C | | | 1,064 | | | | 05/19/23 | | | USD | | | 100.00 | | | USD | | | 11,515 | | | | 973,560 | |
| | |
| 38 | | 2 0 2 3 BLACK ROCK ANNUAL REPORT TO SHAREHOLDERS |
| | |
Consolidated Schedule of Investments (continued) April 30, 2023 | | BlackRock Global Allocation Fund, Inc. |
Exchange-Traded Options Purchased (continued)
| | | | | | | | | | | | | | | | | | | | | | | | |
| | | | | | |
| Description | | Number of Contracts | | | Expiration Date | | | Exercise Price | | | Notional Amount (000) | | | Value | |
| | | | | | | |
Call (continued) | | | | | | | | | | | | | | | | | | | | | | | | |
Amazon.com, Inc. | | | 1,064 | | | | 05/19/23 | | | USD | | | 100.00 | | | USD | | | 11,220 | | | $ | 736,820 | |
Apple, Inc. | | | 853 | | | | 05/19/23 | | | USD | | | 160.00 | | | USD | | | 14,474 | | | | 961,757 | |
Apple, Inc. | | | 1,069 | | | | 05/19/23 | | | USD | | | 170.00 | | | USD | | | 18,139 | | | | 459,670 | |
Charles Schwab Corp. | | | 2,179 | | | | 05/19/23 | | | USD | | | 70.00 | | | USD | | | 11,383 | | | | 4,358 | |
ConocoPhillips | | | 2,697 | | | | 05/19/23 | | | USD | | | 120.00 | | | USD | | | 27,749 | | | | 16,182 | |
ConocoPhillips | | | 1,606 | | | | 05/19/23 | | | USD | | | 110.00 | | | USD | | | 16,524 | | | | 110,011 | |
Daimler AG | | | 2,867 | | | | 05/19/23 | | | EUR | | | 76.00 | | | EUR | | | 20,235 | | | | 83,717 | |
Delta Air Lines, Inc. | | | 5,046 | | | | 05/19/23 | | | USD | | | 35.00 | | | USD | | | 17,313 | | | | 353,220 | |
Euro Stoxx 50 | | | 611 | | | | 05/19/23 | | | EUR | | | 4,300.00 | | | EUR | | | 26,635 | | | | 485,758 | |
Euro Stoxx Banks | | | 3,054 | | | | 05/19/23 | | | EUR | | | 110.00 | | | EUR | | | 15,811 | | | | 79,924 | |
General Dynamics Corp. | | | 678 | | | | 05/19/23 | | | USD | | | 230.00 | | | USD | | | 14,803 | | | | 18,645 | |
InvesCo QQQ Trust, Series 1 | | | 2,360 | | | | 05/19/23 | | | USD | | | 325.00 | | | USD | | | 76,124 | | | | 1,158,760 | |
iShares China Large-Cap ETF | | | 9,352 | | | | 05/19/23 | | | USD | | | 31.00 | | | USD | | | 26,494 | | | | 79,492 | |
Lockheed Martin Corp. | | | 329 | | | | 05/19/23 | | | USD | | | 500.00 | | | USD | | | 15,280 | | | | 5,758 | |
Marathon Oil Corp. | | | 3,196 | | | | 05/19/23 | | | USD | | | 28.00 | | | USD | | | 7,722 | | | | 22,372 | |
Nike, Inc., Class B | | | 1,345 | | | | 05/19/23 | | | USD | | | 125.00 | | | USD | | | 17,044 | | | | 527,912 | |
Northrop Grumman Corp. | | | 123 | | | | 05/19/23 | | | USD | | | 500.00 | | | USD | | | 5,674 | | | | 8,610 | |
NVIDIA Corp. | | | 643 | | | | 05/19/23 | | | USD | | | 295.00 | | | USD | | | 17,843 | | | | 212,190 | |
salesforce.com, Inc. | | | 641 | | | | 05/19/23 | | | USD | | | 200.00 | | | USD | | | 12,716 | | | | 270,822 | |
Schlumberger NV | | | 1,598 | | | | 05/19/23 | | | USD | | | 55.00 | | | USD | | | 7,886 | | | | 33,558 | |
SPDR Gold Shares(a) | | | 10,083 | | | | 05/19/23 | | | USD | | | 195.00 | | | USD | | | 186,334 | | | | 393,237 | |
Tesla, Inc. | | | 1,623 | | | | 05/19/23 | | | USD | | | 180.00 | | | USD | | | 26,668 | | | | 317,296 | |
United Airlines Holdings, Inc. | | | 2,522 | | | | 05/19/23 | | | USD | | | 45.00 | | | USD | | | 11,046 | | | | 249,678 | |
Xtrackers Harvest CSI 300 China A-Shares Fund | | | 11,690 | | | | 05/19/23 | | | USD | | | 31.00 | | | USD | | | 34,123 | | | | 70,140 | |
Abbott Laboratories | | | 836 | | | | 06/16/23 | | | USD | | | 115.00 | | | USD | | | 9,235 | | | | 104,082 | |
AbbVie, Inc. | | | 335 | | | | 06/16/23 | | | USD | | | 170.00 | | | USD | | | 5,063 | | | | 4,188 | |
Advanced Micro Devices, Inc. | | | 711 | | | | 06/16/23 | | | USD | | | 95.00 | | | USD | | | 6,354 | | | | 270,180 | |
Air Products & Chemicals, Inc. | | | 244 | | | | 06/16/23 | | | USD | | | 310.00 | | | USD | | | 7,182 | | | | 101,260 | |
Albemarle Corp. | | | 301 | | | | 06/16/23 | | | USD | | | 200.00 | | | USD | | | 5,582 | | | | 224,245 | |
Alphabet Inc., Class C | | | 1,606 | | | | 06/16/23 | | | USD | | | 110.00 | | | USD | | | 17,380 | | | | 602,250 | |
Alphabet Inc., Class C | | | 3,305 | | | | 06/16/23 | | | USD | | | 115.00 | | | USD | | | 35,767 | | | | 575,070 | |
Amazon.com, Inc. | | | 1,722 | | | | 06/16/23 | | | USD | | | 115.00 | | | USD | | | 18,158 | | | | 274,659 | |
American Tower Corp. | | | 335 | | | | 06/16/23 | | | USD | | | 210.00 | | | USD | | | 6,847 | | | | 177,550 | |
Apple, Inc. | | | 851 | | | | 06/16/23 | | | USD | | | 170.00 | | | USD | | | 14,440 | | | | 548,895 | |
Apple, Inc. | | | 1,104 | | | | 06/16/23 | | | USD | | | 175.00 | | | USD | | | 18,733 | | | | 427,800 | |
Archer-Daniels-Midland Co. | | | 1,159 | | | | 06/16/23 | | | USD | | | 80.00 | | | USD | | | 9,049 | | | | 185,440 | |
Boston Scientific Corp. | | | 2,369 | | | | 06/16/23 | | | USD | | | 55.00 | | | USD | | | 12,347 | | | | 106,605 | |
CF Industries Holdings, Inc. | | | 733 | | | | 06/16/23 | | | USD | | | 77.50 | | | USD | | | 5,247 | | | | 119,112 | |
Charles Schwab Corp. | | | 2,569 | | | | 06/16/23 | | | USD | | | 65.00 | | | USD | | | 13,420 | | | | 34,682 | |
ConocoPhillips | | | 1,546 | | | | 06/16/23 | | | USD | | | 115.00 | | | USD | | | 15,907 | | | | 147,643 | |
Constellation Brands, Inc., Class A | | | 429 | | | | 06/16/23 | | | USD | | | 235.00 | | | USD | | | 9,844 | | | | 165,165 | |
Costco Wholesale Corp. | | | 137 | | | | 06/16/23 | | | USD | | | 535.00 | | | USD | | | 6,894 | | | | 57,197 | |
Deere & Co. | | | 143 | | | | 06/16/23 | | | USD | | | 410.00 | | | USD | | | 5,406 | | | | 68,640 | |
Delta Air Lines, Inc. | | | 3,201 | | | | 06/16/23 | | | USD | | | 35.00 | | | USD | | | 10,983 | | | | 425,733 | |
Edwards Lifesciences Corp. | | | 1,065 | | | | 06/16/23 | | | USD | | | 85.00 | | | USD | | | 9,370 | | | | 580,425 | |
Eli Lilly & Co. | | | 145 | | | | 06/16/23 | | | USD | | | 400.00 | | | USD | | | 5,740 | | | | 206,625 | |
Freeport-McMoRan, Inc. | | | 1,391 | | | | 06/16/23 | | | USD | | | 42.00 | | | USD | | | 5,273 | | | | 98,761 | |
Health Care Select Sector SPDR Fund | | | 1,575 | | | | 06/16/23 | | | USD | | | 138.00 | | | USD | | | 21,031 | | | | 118,125 | |
Humana, Inc. | | | 160 | | | | 06/16/23 | | | USD | | | 530.00 | | | USD | | | 8,488 | | | | 320,800 | |
Intel Corp. | | | 697 | | | | 06/16/23 | | | USD | | | 40.00 | | | USD | | | 2,165 | | | | 2,440 | |
Intel Corp. | | | 434 | | | | 06/16/23 | | | USD | | | 42.50 | | | USD | | | 1,348 | | | | 651 | |
Intuitive Surgical, Inc. | | | 427 | | | | 06/16/23 | | | USD | | | 310.00 | | | USD | | | 12,862 | | | | 311,710 | |
Intuitive Surgical, Inc. | | | 183 | | | | 06/16/23 | | | USD | | | 315.00 | | | USD | | | 5,512 | | | | 96,990 | |
Johnson & Johnson | | | 442 | | | | 06/16/23 | | | USD | | | 165.00 | | | USD | | | 7,236 | | | | 123,981 | |
JPMorgan Chase & Co. | | | 2,140 | | | | 06/16/23 | | | USD | | | 135.00 | | | USD | | | 29,583 | | | | 1,460,550 | |
JPMorgan Chase & Co. | | | 392 | | | | 06/16/23 | | | USD | | | 145.00 | | | USD | | | 5,419 | | | | 60,368 | |
KLA Corp. | | | 426 | | | | 06/16/23 | | | USD | | | 390.00 | | | USD | | | 16,467 | | | | 739,110 | |
Lions Gate Entertainment Corp., Non-Voting Shares | | | 373 | | | | 06/16/23 | | | USD | | | 10.00 | | | USD | | | 398 | | | | 47,558 | |
Lions Gate Entertainment Corp., Non-Voting Shares | | | 303 | | | | 06/16/23 | | | USD | | | 12.50 | | | USD | | | 323 | | | | 9,090 | |
Lockheed Martin Corp. | | | 113 | | | | 06/16/23 | | | USD | | | 495.00 | | | USD | | | 5,248 | | | | 21,188 | |
Mastercard, Inc., Class A | | | 301 | | | | 06/16/23 | | | USD | | | 390.00 | | | USD | | | 11,439 | | | | 211,452 | |
McDonald’s Corp. | | | 208 | | | | 06/16/23 | | | USD | | | 300.00 | | | USD | | | 6,152 | | | | 79,560 | |
| | |
CONSOLIDATED SCHEDULE OF INVESTMENTS | | 39 |
| | |
Consolidated Schedule of Investments (continued) April 30, 2023 | | BlackRock Global Allocation Fund, Inc. |
Exchange-Traded Options Purchased (continued)
| | | | | | | | | | | | | | | | | | | | | | | | |
| | | | | | |
| Description | | Number of Contracts | | | Expiration Date | | | Exercise Price | | | Notional Amount (000) | | | Value | |
| | | | | | | |
Call (continued) | | | | | | | | | | | | | | | | | | | | | | | | |
Merck & Co., Inc. | | | 945 | | | | 06/16/23 | | | USD | | | 120.00 | | | USD | | | 10,912 | | | $ | 132,772 | |
Micron Technology, Inc. | | | 922 | | | | 06/16/23 | | | USD | | | 62.50 | | | USD | | | 5,934 | | | | 428,730 | |
Microsoft Corp. | | | 641 | | | | 06/16/23 | | | USD | | | 300.00 | | | USD | | | 19,695 | | | | 975,922 | |
Microsoft Corp. | | | 325 | | | | 06/16/23 | | | USD | | | 295.00 | | | USD | | | 9,986 | | | | 612,625 | |
Nestle SA | | | 1,694 | | | | 06/16/23 | | | CHF | | | 112.00 | | | CHF | | | 19,400 | | | | 716,375 | |
Nestle SA | | | 847 | | | | 06/16/23 | | | CHF | | | 114.00 | | | CHF | | | 9,700 | | | | 152,561 | |
NextEra Energy, Inc. | | | 1,229 | | | | 06/16/23 | | | USD | | | 82.50 | | | USD | | | 9,418 | | | | 52,232 | |
Nike, Inc., Class B | | | 597 | | | | 06/16/23 | | | USD | | | 125.00 | | | USD | | | 7,565 | | | | 334,320 | |
Northrop Grumman Corp. | | | 181 | | | | 06/16/23 | | | USD | | | 485.00 | | | USD | | | 8,349 | | | | 79,640 | |
NVIDIA Corp. | | | 204 | | | | 06/16/23 | | | USD | | | 285.00 | | | USD | | | 5,661 | | | | 311,100 | |
salesforce.com, Inc. | | | 614 | | | | 06/16/23 | | | USD | | | 200.00 | | | USD | | | 12,180 | | | | 594,045 | |
SPDR Gold Shares(a) | | | 20,167 | | | | 06/16/23 | | | USD | | | 200.00 | | | USD | | | 372,686 | | | | 1,683,944 | |
SPDR Gold Shares(a) | | | 30,389 | | | | 06/16/23 | | | USD | | | 195.00 | | | USD | | | 561,589 | | | | 4,543,155 | |
Starbucks Corp. | | | 843 | | | | 06/16/23 | | | USD | | | 120.00 | | | USD | | | 9,635 | | | | 164,385 | |
Starbucks Corp. | | | 506 | | | | 06/16/23 | | | USD | | | 115.00 | | | USD | | | 5,783 | | | | 203,665 | |
Tesla, Inc. | | | 1,065 | | | | 06/16/23 | | | USD | | | 200.00 | | | USD | | | 17,499 | | | | 189,037 | |
Thermo Fisher Scientific, Inc. | | | 155 | | | | 06/16/23 | | | USD | | | 600.00 | | | USD | | | 8,601 | | | | 53,475 | |
TJX Cos., Inc. | | | 699 | | | | 06/16/23 | | | USD | | | 82.50 | | | USD | | | 5,510 | | | | 74,793 | |
Uber Technologies, Inc. | | | 5,446 | | | | 06/16/23 | | | USD | | | 40.00 | | | USD | | | 16,910 | | | | 73,521 | |
Uber Technologies, Inc. | | | 5,936 | | | | 06/16/23 | | | USD | | | 32.50 | | | USD | | | 18,431 | | | | 905,240 | |
UniCredit SpA | | | 3,414 | | | | 06/16/23 | | | EUR | | | 20.00 | | | EUR | | | 30,624 | | | | 681,842 | |
United Airlines Holdings, Inc. | | | 3,200 | | | | 06/16/23 | | | USD | | | 46.00 | | | USD | | | 14,016 | | | | 460,800 | |
United Parcel Service, Inc., Class B | | | 367 | | | | 06/16/23 | | | USD | | | 185.00 | | | USD | | | 6,599 | | | | 95,053 | |
UnitedHealth Group, Inc. | | | 324 | | | | 06/16/23 | | | USD | | | 510.00 | | | USD | | | 15,944 | | | | 251,100 | |
Valero Energy Corp. | | | 483 | | | | 06/16/23 | | | USD | | | 125.00 | | | USD | | | 5,539 | | | | 92,494 | |
Walmart, Inc. | | | 358 | | | | 06/16/23 | | | USD | | | 160.00 | | | USD | | | 5,405 | | | | 32,220 | |
Walt Disney Co. | | | 2,212 | | | | 06/16/23 | | | USD | | | 105.00 | | | USD | | | 22,673 | | | | 796,320 | |
Waste Management, Inc. | | | 1,551 | | | | 06/16/23 | | | USD | | | 165.00 | | | USD | | | 25,754 | | | | 705,705 | |
Applied Materials, Inc. | | | 1,701 | | | | 07/21/23 | | | USD | | | 115.00 | | | USD | | | 19,226 | | | | 1,216,215 | |
Kroger Co. | | | 3,026 | | | | 07/21/23 | | | USD | | | 50.00 | | | USD | | | 14,715 | | | | 496,264 | |
Micron Technology, Inc. | | | 2,132 | | | | 07/21/23 | | | USD | | | 62.50 | | | USD | | | 13,722 | | | | 1,279,200 | |
Microsoft Corp. | | | 1,062 | | | | 07/21/23 | | | USD | | | 300.00 | | | USD | | | 32,631 | | | | 2,041,695 | |
Microsoft Corp. | | | 527 | | | | 07/21/23 | | | USD | | | 305.00 | | | USD | | | 16,193 | | | | 847,152 | |
Tesla, Inc. | | | 853 | | | | 08/18/23 | | | USD | | | 210.00 | | | USD | | | 14,016 | | | | 452,090 | |
| | | | | | | | | | | | | | | | | | | | | | | | |
| | | | | | | |
| | | | | | | | | | | | | | | | | | | | | | | 40,550,381 | |
| | | | | | | | | | | | | | | | | | | | | | | | |
| | | | | | | |
Put | | | | | | | | | | | | | | | | | | | | | | | | |
Boston Properties, Inc. | | | 617 | | | | 05/19/23 | | | USD | | | 35.00 | | | USD | | | 3,292 | | | | 10,798 | |
Caterpillar, Inc. | | | 599 | | | | 05/19/23 | | | USD | | | 175.00 | | | USD | | | 13,106 | | | | 5,092 | |
ConocoPhillips | | | 2,159 | | | | 05/19/23 | | | USD | | | 100.00 | | | USD | | | 22,214 | | | | 442,595 | |
FedEx Corp. | | | 338 | | | | 05/19/23 | | | USD | | | 210.00 | | | USD | | | 7,699 | | | | 22,139 | |
Frontier Communications Parent Inc. | | | 17 | | | | 05/19/23 | | | USD | | | 20.00 | | | USD | | | 38 | | | | 978 | |
iShares iBoxx $ High Yield Corporate Bond ETF | | | 7,208 | | | | 05/19/23 | | | USD | | | 72.00 | | | USD | | | 54,319 | | | | 57,664 | |
iShares iBoxx $ High Yield Corporate Bond ETF | | | 648 | | | | 05/19/23 | | | USD | | | 74.00 | | | USD | | | 4,883 | | | | 18,144 | |
iShares Preferred and Income Securities ETF | | | 1,780 | | | | 05/19/23 | | | USD | | | 26.00 | | | USD | | | 5,584 | | | | 17,800 | |
iShares Russell 2000 ETF | | | 5,383 | | | | 05/19/23 | | | USD | | | 168.00 | | | USD | | | 94,310 | | | | 575,981 | |
iShares Russell 2000 ETF | | | 455 | | | | 05/19/23 | | | USD | | | 166.00 | | | USD | | | 7,972 | | | | 36,400 | |
iShares Russell 2000 ETF | | | 518 | | | | 05/19/23 | | | USD | | | 170.00 | | | USD | | | 9,075 | | | | 73,556 | |
Sabre Corp. | | | 369 | | | | 05/19/23 | | | USD | | | 3.50 | | | USD | | | 148 | | | | 4,244 | |
Xerox Holdings Corp. | | | 328 | | | | 05/19/23 | | | USD | | | 13.00 | | | USD | | | 514 | | | | 2,460 | |
5-Year U.S. Treasury Note Future | | | 136 | | | | 05/26/23 | | | USD | | | 106.50 | | | USD | | | 14,954 | | | | 3,188 | |
Ally Financial, Inc. | | | 485 | | | | 06/16/23 | | | USD | | | 15.00 | | | USD | | | 1,279 | | | | 3,638 | |
American Airlines Group, Inc. | | | 904 | | | | 06/16/23 | | | USD | | | 11.00 | | | USD | | | 1,233 | | | | 9,944 | |
Caterpillar, Inc. | | | 413 | | | | 06/16/23 | | | USD | | | 180.00 | | | USD | | | 9,036 | | | | 30,562 | |
FedEx Corp. | | | 71 | | | | 06/16/23 | | | USD | | | 165.00 | | | USD | | | 1,617 | | | | 1,527 | |
Ford Motor Co. | | | 789 | | | | 06/16/23 | | | USD | | | 10.00 | | | USD | | | 937 | | | | 11,441 | |
Invesco Senior Loan ETF | | | 2,594 | | | | 06/16/23 | | | USD | | | 19.00 | | | USD | | | 5,416 | | | | 10,376 | |
iShares iBoxx $ High Yield Corporate Bond ETF | | | 615 | | | | 06/16/23 | | | USD | | | 70.00 | | | USD | | | 4,635 | | | | 10,148 | |
iShares iBoxx $ High Yield Corporate Bond ETF | | | 2,268 | | | | 06/16/23 | | | USD | | | 67.00 | | | USD | | | 17,092 | | | | 23,814 | |
iShares iBoxx $ High Yield Corporate Bond ETF | | | 1,166 | | | | 06/16/23 | | | USD | | | 66.00 | | | USD | | | 8,787 | | | | 10,494 | |
Sabre Corp. | | | 580 | | | | 06/16/23 | | | USD | | | 3.00 | | | USD | | | 232 | | | | 6,380 | |
Unit Group, Inc. | | | 115 | | | | 06/16/23 | | | USD | | | 4.00 | | | USD | | | 39 | | | | 8,913 | |
| | |
| 40 | | 2 0 2 3 BLACK ROCK ANNUAL REPORT TO SHAREHOLDERS |
| | |
Consolidated Schedule of Investments (continued) April 30, 2023 | | BlackRock Global Allocation Fund, Inc. |
Exchange-Traded Options Purchased (continued)
| | | | | | | | | | | | | | | | | | | | | | | | |
| |
| | | | | |
| Description | | Number of Contracts | | | Expiration Date | | | Exercise Price | | | Notional Amount (000) | | | Value | |
| |
| | | | | | | |
Put (continued) | | | | | | | | | | | | | | | | | | | | | | | | |
iShares iBoxx $ High Yield Corporate Bond ETF | | | 810 | | | | 07/21/23 | | | USD | | | 71.00 | | | USD | | | 6,104 | | | $ | 38,475 | |
NVIDIA Corp. | | | 533 | | | | 07/21/23 | | | USD | | | 250.00 | | | USD | | | 14,790 | | | | 602,290 | |
Pitney Bowes Inc. | | | 536 | | | | 07/21/23 | | | USD | | | 3.00 | | | USD | | | 188 | | | | 8,040 | |
United Parcel Service, Inc., Class B | | | 349 | | | | 07/21/23 | | | USD | | | 160.00 | | | USD | | | 6,275 | | | | 56,887 | |
Xerox Holdings Corp. | | | 419 | | | | 07/21/23 | | | USD | | | 11.00 | | | USD | | | 657 | | | | 4,190 | |
Frontier Communications Parent Inc. | | | 333 | | | | 08/18/23 | | | USD | | | 20.00 | | | USD | | | 751 | | | | 29,138 | |
iShares iBoxx $ Investment Grade Corporate Bond ETF | | | 907 | | | | 08/18/23 | | | USD | | | 100.00 | | | USD | | | 9,971 | | | | 33,106 | |
Air Transport Services Group, Inc. | | | 98 | | | | 09/15/23 | | | USD | | | 15.00 | | | USD | | | 199 | | | | 2,450 | |
3-Monh SOFR Future | | | 1,975 | | | | 03/15/24 | | | USD | | | 95.75 | | | USD | | | 474,444 | | | | 2,407,031 | |
| | | | | | | | | | | | | | | | | | | | | | | | |
| | | | | | | |
| | | | | | | | | | | | | | | | | | | | | | | 4,579,883 | |
| | | | | | | | | | | | | | | | | | | | | | | | |
| | | | | | | |
| | | | | | | | | | | | | | | | | | | | | | $ | 45,130,264 | |
| | | | | | | | | | | | | | | | | | | | | | | | |
| | (a) | All or a portion of the security is held by a wholly-owned subsidiary. See Note 1 of the Notes to Consolidated Financial Statements for details on the wholly-owned subsidiary. | |
OTC Barrier Options Purchased
| | | | | | | | | | | | | | | | | | | | | | | | | | | | |
| |
| Description | | Type of Option | | Counterparty | | Number of Contracts | | | Expiration Date | | | Exercise Price | | | Barrier Price/Range | | | Notional Amount (000) | | | Value | |
| |
| | | | | | | | |
Put
GBP Currency | | One Touch | | JPMorgan Chase Bank N.A. | | | — | | | | 05/11/23 | | | | USD 1.00 | | | | USD 1.00 | | | | GBP 4,185 | | | $ | 5 | |
| | | | | | | | | | | | | | | | | | | | | | | | | | | | |
OTC Options Purchased
| | | | | | | | | | | | | | | | | | | | | | | | | | | | |
| |
| Description | | Counterparty | | Number of Contracts | | Expiration Date | | | Exercise Price | | | Notional Amount (000) | | | Value | |
| |
| | | | | | | | |
Call | | | | | | | | | | | | | | | | | | | | | | | | | | | | |
ING Groep N.V. | | Goldman Sachs International | | 724,500 | | | 05/19/23 | | | | EUR | | | | 11.50 | | | | EUR | | | | 8,114 | | | $ | 210,136 | |
USD Currency | | Bank of America N.A. | | — | | | 07/13/23 | | | | CNH | | | | 7.40 | | | | USD | | | | 93,139 | | | | 32,971 | |
TOPIX Banks Index | | BNP Paribas SA | | 3,751,722 | | | 07/14/23 | | | | JPY | | | | 218.87 | | | | JPY | | | | 729,485 | | | | 71,284 | |
TOPIX Banks Index | | Goldman Sachs International | | 6,250,370 | | | 07/14/23 | | | | JPY | | | | 226.71 | | | | JPY | | | | 1,215,322 | | | | 72,504 | |
TOPIX Banks Index | | JPMorgan Chase Bank N.A. | | 2,503,649 | | | 07/14/23 | | | | JPY | | | | 227.60 | | | | JPY | | | | 486,810 | | | | 27,411 | |
| | | | | | | | | | | | | | | | | | | | | | | | | | |
| | | | | | | | |
| | | | | | | | | | | | | | | | | | | | | | | | | | | 414,306 | |
| | | | | | | | | | | | | | | | | | | | | | | | | | |
| | | | | | | | |
Put | | | | | | | | | | | | | | | | | | | | | | | | | | | | |
USD Currency | | Deutsche Bank AG | | — | | | 05/04/23 | | | | MXN | | | | 18.00 | | | | USD | | | | 38,515 | | | | 205,708 | |
USD Currency | | Bank of America N.A. | | — | | | 05/25/23 | | | | MXN | | | | 17.85 | | | | USD | | | | 142,520 | | | | 752,793 | |
USD Currency | | Bank of America N.A. | | — | | | 05/29/23 | | | | JPY | | | | 130.00 | | | | USD | | | | 96,720 | | | | 129,121 | |
| | | | | | | | | | | | | | | | | | | | | | | | | | | | |
| | | | | | | | |
| | | | | | | | | | | | | | | | | | | | | | | | | | | 1,087,622 | |
| | | | | | | | | | | | | | | | | | | | | | | | | | | | |
| | | | | | | | |
| | | | | | | | | | | | | | | | | | | | | | | | | | $ | 1,501,928 | |
| | | | | | | | | | | | | | | | | | | | | | | | | | | | |
OTC Dual Binary Options Purchased
| | | | | | | | | | | | | | | | | | | | | | |
| |
| Description(a) | | Counterparty | | Units | | | Expiration Date | | | Notional Amount (000) | | | Value | |
| |
| | | | | | |
Put | | | | | | | | | | | | | | | | | | | | | | |
Payout at expiry if S&P 500 <= 3687.14 and 10-year swap <= 3.33% | | Citibank N.A. | | | 4,025,157 | | | | 05/19/23 | | | | USD | | | | 14,841,317 | | | $ | 12,844 | |
Payout at expiry if S&P 500 <= 3848.02 and 2-year swap >= 4.99%(b) | | Citibank N.A. | | | 3,916,713 | | | | 05/19/23 | | | | USD | | | | 15,071,590 | | | | 893 | |
Payout at expiry if S&P 500 <= 3848.02 and 2-year swap >= 5.09%(b) | | Citibank N.A. | | | 3,916,713 | | | | 05/19/23 | | | | USD | | | | 15,071,590 | | | | 13,638 | |
Payout at expiry if S&P 500 <= 3848.02 and 2-year swap >= 4.92%(b) | | Citibank N.A. | | | 3,916,713 | | | | 06/16/23 | | | | USD | | | | 15,071,590 | | | | 239 | |
Payout at expiry if S&P 500 <= 3848.02 and 2-year swap >= 5.02%(b) | | Citibank N.A. | | | 3,916,713 | | | | 06/16/23 | | | | USD | | | | 15,071,590 | | | | 22,357 | |
| | | | | | | | | | | | | | | | | | | | | | |
| | | | | | |
| | | | | | | | | | | | | | | | | | | | $ | 49,971 | |
| | | | | | | | | | | | | | | | | | | | | | |
| | (a) | Option only pays if both terms are met on the expiration date. | |
| | (b) | Security is valued using significant unobservable inputs and is classified as Level 3 in the fair value hierarchy. | |
| | |
CONSOLIDATED SCHEDULE OF INVESTMENTS | | 41 |
| | |
Consolidated Schedule of Investments (continued) April 30, 2023 | | BlackRock Global Allocation Fund, Inc. |
OTC Credit Default Swaptions Purchased
| | | | | | | | | | | | | | | | | | | | | | | | | | | | | | |
| |
| | | Paid by the Fund | | | Received by the Fund | | | | | | | Expiration Date | | Credit Rating(a) | | | Exercise
Price | | | Notional Amount (000)(b) | | | | |
| Description | | Rate/Reference | | | Rate/Reference | | Frequency | | | Counterparty | | Value | |
| |
| | | | | | | | | |
Put | | | | | | | | | | | | | | | | | | | | | | | | | | | | | | |
Bought Protection 5-Year Credit Default Swap, 06/20/28 | | | 5.00 | % | | CDX.NA.HY.40.V1 | | | Quarterly | | | Barclays Bank PLC | | 05/17/23 | | | N/R | | | USD | 0.95 | | | USD | 14,970 | | | $ | 5,313 | |
Bought Protection 5-Year Credit Default Swap, 06/20/28 | | | 1.00 | % | | CDX.NA.IG.40.V1 | | | Quarterly | | | Citibank N.A. | | 06/21/23 | | | N/R | | | USD | 1.00 | | | USD | 118,630 | | | | 88,257 | |
Bought Protection 5-Year Credit Default Swap, 12/20/27 | | | 5.00 | % | | CDX.NA.HY.39.V1 | | | Quarterly | | | Deutsche Bank AG | | 06/21/23 | | | N/R | | | USD | 0.94 | | | USD | 9,710 | | | | 20,377 | |
Bought Protection 5-Year Credit Default Swap, 06/20/28 | | | 5.00 | % | | CDX.NA.HY.40.V1 | | | Quarterly | | | Morgan Stanley & Co. International PLC | | 06/21/23 | | | N/R | | | USD | 0.95 | | | USD | 12,455 | | | | 34,091 | |
Bought Protection 5-Year Credit Default Swap, 06/20/28 | | | 1.00 | % | | CDX.NA.IG.40.V1 | | | Quarterly | | | Morgan Stanley & Co. International PLC | | 07/19/23 | | | N/R | | | USD | 1.10 | | | USD | 90,705 | | | | 85,256 | |
Bought Protection 5-Year Credit Default Swap, 06/20/28 | | | 5.00 | % | | CDX.NA.HY.40.V1 | | | Quarterly | | | BNP Paribas SA | | 07/19/23 | | | N/R | | | USD | 0.95 | | | USD | 10,715 | | | | 55,854 | |
Bought Protection 5-Year Credit Default Swap, 06/20/28 | | | 5.00 | % | | CDX.NA.HY.40.V1 | | | Quarterly | | | Morgan Stanley & Co. International PLC | | 07/19/23 | | | N/R | | | USD | 0.94 | | | USD | 9,305 | | | | 40,005 | |
| | | | | | | | | | | | | | | | | | | | | | | | | | | | | | |
| | | | | | | | | |
| | | | | | | | | | | | | | | | | | | | | | | | | | | | $ | 329,153 | |
| | | | | | | | | | | | | | | | | | | | | | | | | | | | | | |
| | (a) | Using the rating of the issuer or the underlying securities of the index, as applicable, provided by S&P Global Ratings. | |
| | (b) | The maximum potential amount the Fund may pay should a negative credit event take place as defined under the terms of the agreement. | |
OTC Interest Rate Swaptions Purchased
| | | | | | | | | | | | | | | | | | | | | | | | | | | | | | |
| |
| | | Paid by the Fund | | Received by the Fund | | | | Expiration Date | | | Exercise Rate | | | Notional Amount (000) | | | Value | |
| Description | | Rate | | | Frequency | | Rate | | | Frequency | | Counterparty |
| |
| | | | | | | | | |
Call | | | | | | | | | | | | | | | | | | | | | | | | | | | | | | |
10-Year Interest Rate Swap, 08/09/33 | |
| 1-Day SOFR,
4.81 |
% | | Quarterly | | | 2.85 | % | | Semi-Annual | | Goldman Sachs International | | | 08/07/23 | | | | 2.85 | % | | USD | 98,278 | | | $ | 1,079,231 | |
10-Year Interest Rate Swap, 09/23/33 | |
| 1-Day SOFR,
4.81 |
% | | Quarterly | | | 2.81 | % | | Semi-Annual | | Morgan Stanley & Co. International PLC | | | 09/21/23 | | | | 2.81 | | | USD | 71,287 | | | | 997,710 | |
10-Year Interest Rate Swap, 09/24/33 | |
| 1-Day SOFR,
4.81 |
% | | Quarterly | | | 2.80 | % | | Semi-Annual | | Morgan Stanley & Co. International PLC | | | 09/22/23 | | | | 2.80 | | | USD | 30,538 | | | | 421,288 | |
2-Year Interest Rate Swap, 10/21/23 | |
| 1-Day SOFR,
4.81 |
% | | Quarterly | | | 2.75 | % | | Semi-Annual | | Goldman Sachs International | | | 10/19/23 | | | | 2.75 | | | USD | 139,735 | | | | 999,349 | |
10-Year Interest Rate Swap, 10/26/33 | |
| 1-Day SOFR,
4.81 |
% | | Quarterly | | | 3.05 | % | | Semi-Annual | | Citibank N.A. | | | 10/24/23 | | | | 3.05 | | | USD | 113,447 | | | | 2,845,944 | |
10-Year Interest Rate Swap, 11/01/33 | |
| 1-Day SOFR,
4.81 |
% | | Quarterly | | | 2.90 | % | | Semi-Annual | | JPMorgan Chase Bank N.A. | | | 10/30/23 | | | | 2.90 | | | USD | 113,447 | | | | 2,257,007 | |
10-Year Interest Rate Swap, 11/09/33 | |
| 1-Day SOFR,
4.81 |
% | | Quarterly | | | 2.82 | % | | Semi-Annual | | Goldman Sachs International | | | 11/07/23 | | | | 2.82 | | | USD | 46,851 | | | | 837,662 | |
30-Year Interest Rate Swap, 11/16/53 | |
| 1-Day SOFR,
4.81 |
% | | Quarterly | | | 2.85 | % | | Semi-Annual | | Citibank N.A. | | | 11/14/23 | | | | 2.85 | | | USD | 36,175 | | | | 1,538,727 | |
| | | | | | | | | | | | | | | | | | | | | | | | | | | | | | |
| | | | | | | | | |
| | | | | | | | | | | | | | | | | | | | | | | | | | | | | 10,976,918 | |
| | | | | | | | | | | | | | | | | | | | | | | | | | | | | | |
| | | | | | | | | |
Put | | | | | | | | | | | | | | | | | | | | | | | | | | | | | | |
1-Year Interest Rate Swap, 05/04/24 | | | 1.00 | % | | Annual | |
| 6-mo.
EURIBOR,
3.65 |
% | | Semi-Annual | | Goldman Sachs International | | | 05/02/23 | | | | 1.00 | | | EUR | 706,928 | | | | 21,011,648 | |
10-Year Interest Rate Swap, 10/26/33 | | | 4.55 | % | | Semi-Annual | |
| 1-Day
SOFR,
4.81 |
% | | Quarterly | | Citibank N.A. | | | 10/24/23 | | | | 4.55 | | | USD | 113,447 | | | | 164,077 | |
10-Year Interest Rate Swap, 11/01/33 | | | 4.40 | % | | Semi-Annual | |
| 1-Day
SOFR,
4.81 |
% | | Quarterly | | JPMorgan Chase Bank N.A. | | | 10/30/23 | | | | 4.40 | | | USD | 113,447 | | | | 234,260 | |
10-Year Interest Rate Swap, 11/09/33 | | | 4.82 | % | | Semi-Annual | |
| 1-Day
SOFR,
4.81 |
% | | Quarterly | | Goldman Sachs International | | | 11/07/23 | | | | 4.82 | | | USD | 46,851 | | | | 47,681 | |
| | | | | | | | | | | | | | | | | | | | | | | | | | | | | | |
| | | | | | | | | |
| | | | | | | | | | | | | | | | | | | | | | | | | | | | | 21,457,666 | |
| | | | | | | | | | | | | | | | | | | | | | | | | | | | | | |
| | | | | | | | | |
| | | | | | | | | | | | | | | | | | | | | | | | | | | | $ | 32,434,584 | |
| | | | | | | | | | | | | | | | | | | | | | | | | | | | | | |
| | |
| 42 | | 2 0 2 3 BLACK ROCK ANNUAL REPORT TO SHAREHOLDERS |
| | |
Consolidated Schedule of Investments (continued) April 30, 2023 | | BlackRock Global Allocation Fund, Inc. |
Interest Rate Caps/Floors Sold
| | | | | | | | | | | | | | | | | | | | | | | | | | | | |
| | | | | | | | |
| Description | | Exercise Rate | | | Counterparty | | | Expiration Date | | | Notional Amount (000) | | | Value | | | Premiums Paid (Received) | | | Unrealized Appreciation (Depreciation) | |
| | | | | | | |
Call | | | | | | | | | | | | | | | | | | | | | | | | | | | | |
5Y-30Y CMS Index Cap | | | 0.57 | % | |
| Goldman Sachs
International |
| | | 09/27/23 | | | USD | 1,192,388 | | | $ | (415,213 | ) | | $ | (612,454 | ) | | $ | 197,241 | |
| | | | | | | | | | | | | | | | | | | | | | | | | | | | |
| | | | | | | |
Put | | | | | | | | | | | | | | | | | | | | | | | | | | | | |
5Y-30Y CMS Index Floor | | | (0.68 | %) | |
| Goldman Sachs
International |
| | | 09/27/23 | | | USD | 1,192,388 | | | | (760,684 | ) | | | (1,192,388 | ) | | | 431,704 | |
| | | | | | | | | | | | | | | | | | | | | | | | | | | | |
| | | | | | | |
| | | | | | | | | | | | | | | | | | $ | (1,175,897 | ) | | $ | (1,804,842 | ) | | $ | 628,945 | |
| | | | | | | | | | | | | | | | | | | | | | | | | | | | |
Exchange-Traded Options Written
| | | | | | | | | | | | | | | | | | | | | | | | |
| |
| | | | | |
| Description | | Number of Contracts | | | Expiration Date | | | Exercise Price | | | Notional Amount (000) | | | Value | |
| |
| | | | | | | |
Call | | | | | | | | | | | | | | | | | | | | | | | | |
SPDR S&P 500 ETF Trust | | | 4,668 | | | | 05/05/23 | | | USD | | | 425.00 | | | USD | | | 194,156 | | | $ | (212,394 | ) |
Advanced Micro Devices, Inc. | | | 1,767 | | | | 05/19/23 | | | USD | | | 120.00 | | | USD | | | 15,792 | | | | (13,253 | ) |
Alphabet Inc., Class C | | | 1,064 | | | | 05/19/23 | | | USD | | | 110.00 | | | USD | | | 11,515 | | | | (220,248 | ) |
Amazon.com, Inc. | | | 1,064 | | | | 05/19/23 | | | USD | | | 110.00 | | | USD | | | 11,220 | | | | (159,068 | ) |
Apple, Inc. | | | 853 | | | | 05/19/23 | | | USD | | | 175.00 | | | USD | | | 14,474 | | | | (171,879 | ) |
Bank of America Corp. | | | 3,212 | | | | 05/19/23 | | | USD | | | 31.00 | | | USD | | | 9,405 | | | | (40,150 | ) |
CF Industries Holdings, Inc. | | | 1,498 | | | | 05/19/23 | | | USD | | | 80.00 | | | USD | | | 10,723 | | | | (48,685 | ) |
Charles Schwab Corp. | | | 2,179 | | | | 05/19/23 | | | USD | | | 80.00 | | | USD | | | 11,383 | | | | (2,179 | ) |
ConocoPhillips | | | 1,606 | | | | 05/19/23 | | | USD | | | 125.00 | | | USD | | | 16,524 | | | | (8,030 | ) |
Daimler AG | | | 2,867 | | | | 05/19/23 | | | EUR | | | 82.00 | | | EUR | | | 20,235 | | | | (12,637 | ) |
DexCom, Inc. | | | 799 | | | | 05/19/23 | | | USD | | | 130.00 | | | USD | | | 9,695 | | | | (67,915 | ) |
EQT Corp. | | | 2,780 | | | | 05/19/23 | | | USD | | | 35.00 | | | USD | | | 9,686 | | | | (332,210 | ) |
Freeport-McMoRan, Inc. | | | 2,139 | | | | 05/19/23 | | | USD | | | 42.00 | | | USD | | | 8,109 | | | | (38,502 | ) |
InvesCo QQQ Trust, Series 1 | | | 2,360 | | | | 05/19/23 | | | USD | | | 340.00 | | | USD | | | 76,124 | | | | (136,880 | ) |
iShares iBoxx $ High Yield Corporate Bond ETF | | | 7,208 | | | | 05/19/23 | | | USD | | | 76.00 | | | USD | | | 54,319 | | | | (162,180 | ) |
Marathon Oil Corp. | | | 3,208 | | | | 05/19/23 | | | USD | | | 26.00 | | | USD | | | 7,751 | | | | (93,032 | ) |
Microsoft Corp. | | | 1,067 | | | | 05/19/23 | | | USD | | | 305.00 | | | USD | | | 32,785 | | | | (824,257 | ) |
SPDR Gold Shares(a) | | | 10,083 | | | | 05/19/23 | | | USD | | | 205.00 | | | USD | | | 186,334 | | | | (65,540 | ) |
Starbucks Corp. | | | 918 | | | | 05/19/23 | | | USD | | | 105.00 | | | USD | | | 10,492 | | | | (929,475 | ) |
Xtrackers Harvest CSI 300 China A-Shares Fund | | | 11,690 | | | | 05/19/23 | | | USD | | | 34.00 | | | USD | | | 34,123 | | | | (58,450 | ) |
Abbott Laboratories | | | 1,171 | | | | 06/16/23 | | | USD | | | 110.00 | | | USD | | | 12,936 | | | | (424,487 | ) |
Apple, Inc. | | | 851 | | | | 06/16/23 | | | USD | | | 180.00 | | | USD | | | 14,440 | | | | (179,135 | ) |
Archer-Daniels-Midland Co. | | | 1,238 | | | | 06/16/23 | | | USD | | | 87.50 | | | USD | | | 9,666 | | | | (18,570 | ) |
Charles Schwab Corp. | | | 2,569 | | | | 06/16/23 | | | USD | | | 75.00 | | | USD | | | 13,420 | | | | (6,423 | ) |
Delta Air Lines, Inc. | | | 3,201 | | | | 06/16/23 | | | USD | | | 40.00 | | | USD | | | 10,983 | | | | (52,817 | ) |
DexCom, Inc. | | | 355 | | | | 06/16/23 | | | USD | | | 130.00 | | | USD | | | 4,308 | | | | (89,637 | ) |
Edwards Lifesciences Corp. | | | 1,065 | | | | 06/16/23 | | | USD | | | 90.00 | | | USD | | | 9,370 | | | | (258,262 | ) |
General Motors Co. | | | 2,408 | | | | 06/16/23 | | | USD | | | 40.00 | | | USD | | | 7,956 | | | | (22,876 | ) |
Hilton Worldwide Holdings, Inc. | | | 537 | | | | 06/16/23 | | | USD | | | 155.00 | | | USD | | | 7,734 | | | | (67,125 | ) |
Intuitive Surgical, Inc. | | | 427 | | | | 06/16/23 | | | USD | | | 330.00 | | | USD | | | 12,862 | | | | (69,388 | ) |
JPMorgan Chase & Co. | | | 2,140 | | | | 06/16/23 | | | USD | | | 150.00 | | | USD | | | 29,583 | | | | (113,420 | ) |
KLA Corp. | | | 426 | | | | 06/16/23 | | | USD | | | 420.00 | | | USD | | | 16,467 | | | | (257,730 | ) |
LVMH Moet Hennessy Louis Vuitton SE | | | 193 | | | | 06/16/23 | | | EUR | | | 940.00 | | | EUR | | | 16,810 | | | | (146,208 | ) |
LyondellBasell Industries, NV Ordinary Shares Class | | | 889 | | | | 06/16/23 | | | USD | | | 105.00 | | | USD | | | 8,411 | | | | (28,893 | ) |
Microsoft Corp. | | | 641 | | | | 06/16/23 | | | USD | | | 320.00 | | | USD | | | 19,695 | | | | (306,077 | ) |
Nestle SA | | | 1,694 | | | | 06/16/23 | | | CHF | | | 118.00 | | | CHF | | | 19,400 | | | | (166,775 | ) |
Nestle SA | | | 847 | | | | 06/16/23 | | | CHF | | | 120.00 | | | CHF | | | 9,700 | | | | (70,595 | ) |
salesforce.com, Inc. | | | 614 | | | | 06/16/23 | | | USD | | | 230.00 | | | USD | | | 12,180 | | | | (74,601 | ) |
SPDR Gold Shares(a) | | | 20,167 | | | | 06/16/23 | | | USD | | | 215.00 | | | USD | | | 372,686 | | | | (342,839 | ) |
SPDR Gold Shares(a) | | | 30,389 | | | | 06/16/23 | | | USD | | | 210.00 | | | USD | | | 561,589 | | | | (820,503 | ) |
Tesla, Inc. | | | 1,065 | | | | 06/16/23 | | | USD | | | 230.00 | | | USD | | | 17,499 | | | | (47,925 | ) |
Uber Technologies, Inc. | | | 5,936 | | | | 06/16/23 | | | USD | | | 37.50 | | | USD | | | 18,431 | | | | (186,984 | ) |
UniCredit SpA | | | 3,414 | | | | 06/16/23 | | | EUR | | | 22.00 | | | EUR | | | 30,624 | | | | (225,713 | ) |
United Airlines Holdings, Inc. | | | 3,200 | | | | 06/16/23 | | | USD | | | 52.50 | | | USD | | | 14,016 | | | | (78,400 | ) |
United Parcel Service, Inc., Class B | | | 646 | | | | 06/16/23 | | | USD | | | 210.00 | | | USD | | | 11,616 | | | | (2,261 | ) |
Walt Disney Co. | | | 1,604 | | | | 06/16/23 | | | USD | | | 115.00 | | | USD | | | 16,441 | | | | (132,330 | ) |
Applied Materials, Inc. | | | 1,701 | | | | 07/21/23 | | | USD | | | 130.00 | | | USD | | | 19,226 | | | | (359,761 | ) |
Micron Technology, Inc. | | | 2,132 | | | | 07/21/23 | | | USD | | | 72.50 | | | USD | | | 13,722 | | | | (394,420 | ) |
Microsoft Corp. | | | 1,062 | | | | 07/21/23 | | | USD | | | 330.00 | | | USD | | | 32,631 | | | | (517,725 | ) |
| | |
CONSOLIDATED SCHEDULE OF INVESTMENTS | | 43 |
| | |
Consolidated Schedule of Investments (continued) April 30, 2023 | | BlackRock Global Allocation Fund, Inc. |
Exchange-Traded Options Written (continued)
| | | | | | | | | | | | | | | | | | | | | | | | | | | | |
| |
| | | | | |
| Description | | Number of Contracts | | | Expiration Date | | | Exercise Price | | | Notional Amount (000) | | | Value | |
| |
| | | | | | | |
Call (continued) | | | | | | | | | | | | | | | | | | | | | | | | | | | | |
Microsoft Corp. | | | 527 | | | | 07/21/23 | | | | USD | | | | 325.00 | | | | USD | | | | 16,193 | | | $ | (335,962 | ) |
NVIDIA Corp. | | | 533 | | | | 07/21/23 | | | | USD | | | | 340.00 | | | | USD | | | | 14,790 | | | | (266,500 | ) |
Tesla, Inc. | | | 853 | | | | 08/18/23 | | | | USD | | | | 260.00 | | | | USD | | | | 14,016 | | | | (115,581 | ) |
SPDR S&P 500 ETF Trust | | | 597 | | | | 12/15/23 | | | | USD | | | | 420.00 | | | | USD | | | | 24,831 | | | | (1,579,065 | ) |
| | | | | | | | | | | | | | | | | | | | | | | | |
| | | | | | | |
| | | | | | | | | | | | | | | | | | | | | | | | | | | (11,355,952 | ) |
| | | | | | | | | | | | | | | | | | | | | | | | |
Put | | | | | | | | | | | | | | | | | | | | | | | | | | | | |
SPDR S&P 500 ETF Trust | | | 2,334 | | | | 05/05/23 | | | | USD | | | | 388.00 | | | | USD | | | | 97,078 | | | | (17,505 | ) |
Advanced Micro Devices, Inc. | | | 1,767 | | | | 05/19/23 | | | | USD | | | | 85.00 | | | | USD | | | | 15,792 | | | | (411,711 | ) |
Caterpillar, Inc. | | | 599 | | | | 05/19/23 | | | | USD | | | | 140.00 | | | | USD | | | | 13,106 | | | | (11,381 | ) |
Delta Air Lines, Inc. | | | 5,046 | | | | 05/19/23 | | | | USD | | | | 30.00 | | | | USD | | | | 17,313 | | | | (52,983 | ) |
Euro Stoxx Banks | | | 3,054 | | | | 05/19/23 | | | | EUR | | | | 90.00 | | | | EUR | | | | 15,811 | | | | (71,511 | ) |
FedEx Corp. | | | 338 | | | | 05/19/23 | | | | USD | | | | 195.00 | | | | USD | | | | 7,699 | | | | (7,774 | ) |
InvesCo QQQ Trust, Series 1 | | | 2,360 | | | | 05/19/23 | | | | USD | | | | 275.00 | | | | USD | | | | 76,124 | | | | (31,860 | ) |
iShares China Large-Cap ETF | | | 9,352 | | | | 05/19/23 | | | | USD | | | | 26.00 | | | | USD | | | | 26,494 | | | | (93,520 | ) |
iShares iBoxx $ High Yield Corporate Bond ETF | | | 7,208 | | | | 05/19/23 | | | | USD | | | | 68.00 | | | | USD | | | | 54,319 | | | | (18,020 | ) |
iShares Russell 2000 ETF | | | 5,383 | | | | 05/19/23 | | | | USD | | | | 160.00 | | | | USD | | | | 94,310 | | | | (177,639 | ) |
iShares Russell 2000 ETF | | | 2,691 | | | | 05/19/23 | | | | USD | | | | 152.00 | | | | USD | | | | 47,146 | | | | (33,638 | ) |
iShares Russell 2000 ETF | | | 455 | | | | 05/19/23 | | | | USD | | | | 146.00 | | | | USD | | | | 7,972 | | | | (3,185 | ) |
iShares Russell 2000 ETF | | | 518 | | | | 05/19/23 | | | | USD | | | | 157.00 | | | | USD | | | | 9,075 | | | | (11,396 | ) |
Lockheed Martin Corp. | | | 329 | | | | 05/19/23 | | | | USD | | | | 420.00 | | | | USD | | | | 15,280 | | | | (14,805 | ) |
Marathon Oil Corp. | | | 3,196 | | | | 05/19/23 | | | | USD | | | | 23.00 | | | | USD | | | | 7,722 | | | | (161,398 | ) |
Nice Ltd. | | | 371 | | | | 05/19/23 | | | | USD | | | | 175.00 | | | | USD | | | | 7,569 | | | | (90,895 | ) |
Nike, Inc., Class B | | | 1,345 | | | | 05/19/23 | | | | USD | | | | 105.00 | | | | USD | | | | 17,044 | | | | (8,743 | ) |
Northrop Grumman Corp. | | | 123 | | | | 05/19/23 | | | | USD | | | | 400.00 | | | | USD | | | | 5,674 | | | | (27,368 | ) |
Schlumberger NV | | | 1,598 | | | | 05/19/23 | | | | USD | | | | 47.50 | | | | USD | | | | 7,886 | | | | (144,619 | ) |
United Airlines Holdings, Inc. | | | 2,522 | | | | 05/19/23 | | | | USD | | | | 38.00 | | | | USD | | | | 11,046 | | | | (39,091 | ) |
Alphabet Inc., Class C | | | 3,201 | | | | 06/16/23 | | | | USD | | | | 90.00 | | | | USD | | | | 34,641 | | | | (132,841 | ) |
Apple, Inc. | | | 1,701 | | | | 06/16/23 | | | | USD | | | | 140.00 | | | | USD | | | | 28,863 | | | | (103,761 | ) |
Archer-Daniels-Midland Co. | | | 618 | | | | 06/16/23 | | | | USD | | | | 72.50 | | | | USD | | | | 4,825 | | | | (52,530 | ) |
Caterpillar, Inc. | | | 413 | | | | 06/16/23 | | | | USD | | | | 150.00 | | | | USD | | | | 9,036 | | | | (5,782 | ) |
Charles Schwab Corp. | | | 1,283 | | | | 06/16/23 | | | | USD | | | | 40.00 | | | | USD | | | | 6,702 | | | | (48,113 | ) |
ConocoPhillips | | | 1,546 | | | | 06/16/23 | | | | USD | | | | 92.50 | | | | USD | | | | 15,907 | | | | (230,354 | ) |
Constellation Brands, Inc., Class A | | | 429 | | | | 06/16/23 | | | | USD | | | | 205.00 | | | | USD | | | | 9,844 | | | | (66,495 | ) |
Delta Air Lines, Inc. | | | 3,201 | | | | 06/16/23 | | | | USD | | | | 27.00 | | | | USD | | | | 10,983 | | | | (46,415 | ) |
Edwards Lifesciences Corp. | | | 1,065 | | | | 06/16/23 | | | | USD | | | | 75.00 | | | | USD | | | | 9,370 | | | | (47,925 | ) |
FedEx Corp. | | | 71 | | | | 06/16/23 | | | | USD | | | | 140.00 | | | | USD | | | | 1,617 | | | | (604 | ) |
Health Care Select Sector SPDR Fund | | | 1,575 | | | | 06/16/23 | | | | USD | | | | 120.00 | | | | USD | | | | 21,031 | | | | (75,600 | ) |
Intuitive Surgical, Inc. | | | 427 | | | | 06/16/23 | | | | USD | | | | 220.00 | | | | USD | | | | 12,862 | | | | (19,215 | ) |
JPMorgan Chase & Co. | | | 1,068 | | | | 06/16/23 | | | | USD | | | | 100.00 | | | | USD | | | | 14,764 | | | | (9,612 | ) |
KLA Corp. | | | 211 | | | | 06/16/23 | | | | USD | | | | 310.00 | | | | USD | | | | 8,156 | | | | (42,200 | ) |
LVMH Moet Hennessy Louis Vuitton SE | | | 193 | | | | 06/16/23 | | | | EUR | | | | 800.00 | | | | EUR | | | | 16,810 | | | | (223,300 | ) |
salesforce.com, Inc. | | | 614 | | | | 06/16/23 | | | | USD | | | | 160.00 | | | | USD | | | | 12,180 | | | | (66,312 | ) |
Starbucks Corp. | | | 843 | | | | 06/16/23 | | | | USD | | | | 100.00 | | | | USD | | | | 9,635 | | | | (64,068 | ) |
Tesla, Inc. | | | 1,065 | | | | 06/16/23 | | | | USD | | | | 140.00 | | | | USD | | | | 17,499 | | | | (335,475 | ) |
Uber Technologies, Inc. | | | 5,446 | | | | 06/16/23 | | | | USD | | | | 30.00 | | | | USD | | | | 16,910 | | | | (833,238 | ) |
Uber Technologies, Inc. | | | 5,936 | | | | 06/16/23 | | | | USD | | | | 25.00 | | | | USD | | | | 18,431 | | | | (207,760 | ) |
United Airlines Holdings, Inc. | | | 3,200 | | | | 06/16/23 | | | | USD | | | | 36.00 | | | | USD | | | | 14,016 | | | | (108,800 | ) |
Walt Disney Co. | | | 1,604 | | | | 06/16/23 | | | | USD | | | | 80.00 | | | | USD | | | | 16,441 | | | | (38,496 | ) |
Waste Management, Inc. | | | 1,551 | | | | 06/16/23 | | | | USD | | | | 150.00 | | | | USD | | | | 25,754 | | | | (81,428 | ) |
Applied Materials, Inc. | | | 850 | | | | 07/21/23 | | | | USD | | | | 95.00 | | | | USD | | | | 9,608 | | | | (168,300 | ) |
Micron Technology, Inc. | | | 2,132 | | | | 07/21/23 | | | | USD | | | | 50.00 | | | | USD | | | | 13,722 | | | | (144,976 | ) |
Microsoft Corp. | | | 1,062 | | | | 07/21/23 | | | | USD | | | | 260.00 | | | | USD | | | | 32,631 | | | | (208,152 | ) |
NVIDIA Corp. | | | 801 | | | | 07/21/23 | | | | USD | | | | 200.00 | | | | USD | | | | 22,227 | | | | (197,446 | ) |
Activision Blizzard, Inc. | | | 2,116 | | | | 08/18/23 | | | | USD | | | | 70.00 | | | | USD | | | | 16,443 | | | | (337,502 | ) |
Tesla, Inc. | | | 451 | | | | 08/18/23 | | | | USD | | | | 135.00 | | | | USD | | | | 7,410 | | | | (306,680 | ) |
3-Monh SOFR Future | | | 2,963 | | | | 03/15/24 | | | | USD | | | | 94.75 | | | | USD | | | | 711,787 | | | | (1,129,644 | ) |
| | | | | | | | | | | | | | | | | | | | | | | | | | | | |
| | | | | | | |
| | | | | | | | | | | | | | | | | | | | | | | | | | | (6,762,066 | ) |
| | | | | | | | | | | | | | | | | | | | | | | | | | | | |
| | | | | | | |
| | | | | | | | | | | | | | | | | | | | | | | | | | $ | (18,118,018 | ) |
| | | | | | | | | | | | | | | | | | | | | | | | | | | | |
| | (a) | All or a portion of the security is held by a wholly-owned subsidiary. See Note 1 of the Notes to Consolidated Financial Statements for details on the wholly-owned subsidiary. | |
| | |
| 44 | | 2 0 2 3 BLACK ROCK ANNUAL REPORT TO SHAREHOLDERS |
| | |
Consolidated Schedule of Investments (continued) April 30, 2023 | | BlackRock Global Allocation Fund, Inc. |
OTC Options Written
| | | | | | | | | | | | | | | | | | | | | | | | | | |
| |
| | | | | | |
| Description | | Counterparty | | Number of Contracts | | | Expiration Date | | Exercise Price | | Notional Amount (000) | | | Value | |
| |
| | | | | | | | |
Call | | | | | | | | | | | | | | | | | | | | | | | | | | |
ING Groep N.V. | | Goldman Sachs International | | | 724,500 | | | 05/19/23 | | | EUR | | | 12.50 | | | EUR | | | | 8,114 | | | $ | (27,415 | ) |
USD Currency | | HSBC Bank PLC | | | — | | | 06/14/23 | | | TWD | | | 30.58 | | | TWD | | | | 23,053 | | | | (227,714 | ) |
USD Currency | | Goldman Sachs International | | | — | | | 06/19/23 | | | CNH | | | 6.88 | | | CNH | | | | 22,874 | | | | (203,828 | ) |
| | | | | | | | | | | | | | | | | | | | | | | | | | |
| | | | | | | | |
| | | | | | | | | | | | | | | | | | | | | | | | | (458,957 | ) |
| | | | | | | | | | | | | | | | | | | | | | | | | | |
Put | | | | | | | | | | | | | | | | | | | | | | | | | | |
ING Groep N.V. | | Goldman Sachs International | | | 724,500 | | | 05/19/23 | | | EUR | | | 9.00 | | | EUR | | | | 8,114 | | | | (24,860 | ) |
USD Currency | | Bank of America N.A. | | | — | | | 05/25/23 | | | MXN | | | 17.35 | | | MXN | | | | 190,027 | | | | (99,194 | ) |
USD Currency | | Bank of America N.A. | | | — | | | 05/29/23 | | | JPY | | | 124.00 | | | JPY | | | | 145,079 | | | | (17,119 | ) |
USD Currency | | HSBC Bank PLC | | | — | | | 06/14/23 | | | BRL | | | 5.24 | | | BRL | | | | 22,356 | | | | (1,136,715 | ) |
USD Currency | | Morgan Stanley & Co. International PLC | | | — | | | 06/14/23 | | | COP | | | 4,815.00 | | | COP | | | | 22,300 | | | | (758,802 | ) |
EUR Currency | | UBS AG | | | — | | | 06/19/23 | | | USD | | | 1.08 | | | USD | | | | 20,987 | | | | (76,058 | ) |
GBP Currency | | JPMorgan Chase Bank N.A. | | | — | | | 06/19/23 | | | USD | | | 1.22 | | | USD | | | | 18,592 | | | | (64,794 | ) |
USD Currency | | Bank of America N.A. | | | — | | | 06/19/23 | | | HUF | | | 362.05 | | | HUF | | | | 22,098 | | | | (1,337,543 | ) |
USD Currency | | Citibank N.A. | | | — | | | 06/19/23 | | | MXN | | | 18.67 | | | MXN | | | | 22,325 | | | | (795,254 | ) |
TOPIX Banks Index | | BNP Paribas SA | | | 3,751,722 | | | 07/14/23 | | | JPY | | | 175.10 | | | JPY | | | | 729,485 | | | | (93,747 | ) |
TOPIX Banks Index | | Goldman Sachs International | | | 6,250,370 | | | 07/14/23 | | | JPY | | | 181.37 | | | JPY | | | | 1,215,322 | | | | (242,864 | ) |
TOPIX Banks Index | | JPMorgan Chase Bank N.A. | | | 2,503,649 | | | 07/14/23 | | | JPY | | | 182.08 | | | JPY | | | | 486,810 | | | | (101,863 | ) |
| | | | | | | | | | | | | | | | | | | | | | | | | | |
| | | | | | | | |
| | | | | | | | | | | | | | | | | | | | | | | | | (4,748,813 | ) |
| | | | | | | | | | | | | | | | | | | | | | | | | | |
| | | | | | | | |
| | | | | | | | | | | | | | | | | | | | | | | | $ | (5,207,770 | ) |
| | | | | | | | | | | | | | | | | | | | | | | | | | |
OTC Credit Default Swaptions Written
| | | | | | | | | | | | | | | | | | | | | | | | | | | | | | | | |
| |
| | | Paid by the Fund | | | Received by the Fund | | | | | | Counterparty | | Expiration Date | | Credit Rating(a) | | | Exercise Price | | | Notional Amount (000)(b) | | | Value | |
| Description | | Rate/Reference | | | Rate/Reference | | | Frequency | |
| |
| | | | | | | | | |
Put | | | | | | | | | | | | | | | | | | | | | | | | | | | | | | | | |
Sold Protection 5-Year Credit Default Swap, 06/20/28 | | | CDX.NA.HY.40.V1 | | | | 5.00% | | | | Quarterly | | | Barclays Bank PLC | | 05/17/23 | | | N/R | | | USD | 0.89 | | | USD | 14,970 | | | $ | (2,431 | ) |
Sold Protection 5-Year Credit Default Swap, 06/20/28 | | | CDX.NA.IG.40.V1 | | | | 1.00% | | | | Quarterly | | | Citibank N.A. | | 06/21/23 | | | N/R | | | USD | 1.25 | | | USD | 118,630 | | | | (33,625 | ) |
Sold Protection 5-Year Credit Default Swap, 06/20/28 | | | CDX.NA.IG.40.V1 | | | | 1.00% | | | | Quarterly | | | Morgan Stanley & Co. International PLC | | 07/19/23 | | | N/R | | | USD | 1.40 | | | USD | 90,705 | | | | (35,521 | ) |
Sold Protection 5-Year Credit Default Swap, 06/20/28 | | | CDX.NA.HY.40.V1 | | | | 5.00% | | | | Quarterly | | | Morgan Stanley & Co. International PLC | | 07/19/23 | | | N/R | | | USD | 0.87 | | | USD | 9,305 | | | | (12,991 | ) |
| | | | | | | | | | | | | | | | | | | | | | | | | | | | | | | | |
| | | | | | | | | |
| | | | | | | | | | | | | | | | | | | | | | | | | | | | | | $ | (84,568 | ) |
| | | | | | | | | | | | | | | | | | | | | | | | | | | | | | | | |
| | (a) | Using the rating of the issuer or the underlying securities of the index, as applicable, provided by S&P Global Ratings. | |
| | (b) | The maximum potential amount the Fund may pay should a negative credit event take place as defined under the terms of the agreement. | |
OTC Interest Rate Swaptions Written
| | | | | | | | | | | | | | | | | | | | | | | | | | | | | | | | | | |
| |
| | | Paid by the Fund | | Received by the Fund | | | | Expiration Date | | | Exercise Rate | | | Notional Amount (000) | | | | |
| Description | | Rate | | | Frequency | | Rate | | | Frequency | | Counterparty | | Value | |
| |
| | | | | | | | | | |
Call | | | | | | | | | | | | | | | | | | | | | | | | | | | | | | | | | | |
2-Year Interest Rate Swap, 06/01/25 | | | 3.30 | % | | Semi-Annual | |
| 1-Day SOFR,
4.81 |
% | | Quarterly | | Morgan Stanley & Co. International PLC | | | 05/30/23 | | | | 3.30 | % | | | USD | | | | 469,781 | | | $ | (323,284 | ) |
5-Year Interest Rate Swap, 06/01/28 | | | 2.80 | % | | Semi-Annual | |
| 1-Day SOFR,
4.81 |
% | | Quarterly | | JPMorgan Chase Bank N.A. | | | 05/30/23 | | | | 2.80 | | | | USD | | | | 190,317 | | | | (273,413 | ) |
5-Year Interest Rate Swap, 06/16/28 | | | 2.50 | % | | Semi-Annual | |
| 1-Day SOFR,
4.81 |
% | | Quarterly | | Goldman Sachs International | | | 06/14/23 | | | | 2.50 | | | | USD | | | | 224,129 | | | | (231,725 | ) |
10-Year Interest Rate Swap, 07/21/33 | | | 2.41 | % | | Semi-Annual | |
| 1-Day SOFR,
4.81 |
% | | Quarterly | | Morgan Stanley & Co. International PLC | | | 07/19/23 | | | | 2.41 | | | | USD | | | | 244,572 | | | | (623,323 | ) |
2-Year Interest Rate Swap, 10/21/23 | | | 2.45 | % | | Semi-Annual | |
| 1-Day SOFR,
4.81 |
% | | Quarterly | | Goldman Sachs International | | | 10/19/23 | | | | 2.45 | | | | USD | | | | 139,735 | | | | (671,478 | ) |
2-Year Interest Rate Swap, 10/26/25 | | | 3.09 | % | | Semi-Annual | |
| 1-Day SOFR,
4.81 |
% | | Quarterly | | Citibank N.A. | | | 10/24/23 | | | | 3.09 | | | | USD | | | | 453,788 | | | | (2,639,520 | ) |
| | |
CONSOLIDATED SCHEDULE OF INVESTMENTS | | 45 |
| | |
Consolidated Schedule of Investments (continued) April 30, 2023 | | BlackRock Global Allocation Fund, Inc. |
OTC Interest Rate Swaptions Written (continued)
| | | | | | | | | | | | | | | | | | | | | | | | | | | | | | | | | | |
| |
| | | Paid by the Fund | | Received by the Fund | | | | Expiration | | | Exercise | | | Notional | | | | |
| Description | | Rate | | | Frequency | | Rate | | | Frequency | | Counterparty | | Date | | | Rate | | | Amount (000) | | | Value | |
| |
| | | | | | | | | | |
Call (continued) | | | | | | | | | | | | | | | | | | | | | | | | | | | | | | | | | | |
2-Year Interest Rate Swap, 11/01/25 | | | 2.95% | | | Semi-Annual | |
| 1-Day SOFR,
4.81% |
| | Quarterly | | JPMorgan Chase Bank N.A. | | | 10/30/23 | | | | 2.95 | % | | | USD | | | | 453,788 | | | $ | (2,368,299 | ) |
2-Year Interest Rate Swap, 11/09/25 | | | 3.26% | | | Semi-Annual | |
| 1-Day SOFR,
4.81% |
| | Quarterly | | Goldman Sachs International | | | 11/07/23 | | | | 3.26 | | | | USD | | | | 187,405 | | | | (1,404,630 | ) |
2-Year Interest Rate Swap, 11/16/25 | | | 2.75% | | | Semi-Annual | |
| 1-Day SOFR,
4.81% |
| | Quarterly | | Citibank N.A. | | | 11/14/23 | | | | 2.75 | | | | USD | | | | 361,746 | | | | (1,679,196 | ) |
10-Year Interest Rate Swap, 12/16/33 | | | 2.40% | | | Semi-Annual | |
| 1-Day SOFR,
4.81% |
| | Quarterly | | Morgan Stanley & Co. International PLC | | | 12/14/23 | | | | 2.40 | | | | USD | | | | 61,817 | | | | (613,601 | ) |
| | | | | | | | | | | | | | | | | | | | | | | | | | | | | | | | | | |
| | | | | | | | | | |
| | | | | | | | | | | | | | | | | | | | | | | | | | | | | | | | | (10,828,469 | ) |
| | | | | | | | | | | | | | | | | | | | | | | | | | | | | | | | | | |
Put | | | | | | | | | | | | | | | | | | | | | | | | | | | | | | | | | | |
1-Year Interest Rate Swap, 05/04/24 | |
| 6-mo.
EURIBOR,
3.65% |
| | Semi-Annual | | | 1.75% | | | Annual | | Goldman Sachs International | | | 05/02/23 | | | | 1.75 | | | | EUR | | | | 1,413,856 | | | | (30,687,202 | ) |
5-Year Interest Rate Swap, 06/10/28 | |
| 1-Day SOFR,
4.81% |
| | Quarterly | | | 4.00% | | | Semi-Annual | | JPMorgan Chase Bank N.A. | | | 06/08/23 | | | | 4.00 | | | | USD | | | | 189,499 | | | | (113,139 | ) |
5-Year Interest Rate Swap, 06/16/28 | |
| 1-Day SOFR,
4.81% |
| | Quarterly | | | 3.90% | | | Semi-Annual | | Goldman Sachs International | | | 06/14/23 | | | | 3.90 | | | | USD | | | | 224,129 | | | | (263,228 | ) |
10-Year Interest Rate Swap, 07/05/33 | |
| 1-Day SOFR,
4.81% |
| | Quarterly | | | 3.85% | | | Semi-Annual | | JPMorgan Chase Bank N.A. | | | 07/03/23 | | | | 3.85 | | | | USD | | | | 95,291 | | | | (132,694 | ) |
10-Year Interest Rate Swap, 07/21/33 | |
| 1-Day SOFR,
4.81% |
| | Quarterly | | | 3.61% | | | Semi-Annual | | Morgan Stanley & Co. International PLC | | | 07/19/23 | | | | 3.61 | | | | USD | | | | 244,572 | | | | (1,104,359 | ) |
10-Year Interest Rate Swap, 08/09/33 | |
| 1-Day SOFR,
4.81% |
| | Quarterly | | | 3.75% | | | Semi-Annual | | Goldman Sachs International | | | 08/07/23 | | | | 3.75 | �� | | | USD | | | | 122,848 | | | | (470,641 | ) |
2-Year Interest Rate Swap, 09/23/25 | |
| 1-Day SOFR,
4.81% |
| | Annual | | | 4.73% | | | Semi-Annual | | Morgan Stanley & Co. International PLC | | | 09/21/23 | | | | 4.73 | | | | USD | | | | 703,610 | | | | (912,125 | ) |
2-Year Interest Rate Swap, 09/24/25 | |
| 1-Day SOFR,
4.81% |
| | Quarterly | | | 4.50% | | | Semi-Annual | | Morgan Stanley & Co. International PLC | | | 09/22/23 | | | | 4.50 | | | | USD | | | | 351,650 | | | | (715,914 | ) |
10-Year Interest Rate Swap, 10/04/33 | |
| 1-Day SOFR,
4.81% |
| | Quarterly | | | 3.93% | | | Semi-Annual | | Goldman Sachs International | | | 10/02/23 | | | | 3.93 | | | | USD | | | | 120,542 | | | | (522,025 | ) |
10-Year Interest Rate Swap, 10/15/33 | |
| 1-Day SOFR,
4.81% |
| | Quarterly | | | 3.50% | | | Semi-Annual | | Goldman Sachs International | | | 10/13/23 | | | | 3.50 | | | | USD | | | | 167,168 | | | | (1,889,047 | ) |
2-Year Interest Rate Swap, 10/15/25 | |
| 1-Day SOFR,
4.81% |
| | Quarterly | | | 4.25% | | | Semi-Annual | | Citibank N.A. | | | 10/13/23 | | | | 4.25 | | | | USD | | | | 724,395 | | | | (2,339,274 | ) |
2-Year Interest Rate Swap, 10/19/25 | |
| 1-Day SOFR,
4.81% |
| | Quarterly | | | 4.25% | | | Semi-Annual | | Citibank N.A. | | | 10/17/23 | | | | 4.25 | | | | USD | | | | 335,626 | | | | (1,096,796 | ) |
2-Year Interest Rate Swap, 10/21/23 | |
| 1-Day SOFR,
4.81% |
| | Quarterly | | | 3.30% | | | Semi-Annual | | Goldman Sachs International | | | 10/19/23 | | | | 3.30 | | | | USD | | | | 69,867 | | | | (217,411 | ) |
2-Year Interest Rate Swap, 11/16/25 | |
| 1-Day SOFR,
4.81% |
| | Quarterly | | | 4.75% | | | Semi-Annual | | Citibank N.A. | | | 11/14/23 | | | | 4.75 | | | | USD | | | | 289,397 | | | | (435,369 | ) |
10-Year Interest Rate Swap, 12/16/33 | |
| 1-Day SOFR,
4.81% |
| | Quarterly | | | 3.60% | | | Semi-Annual | | Morgan Stanley & Co. International PLC | | | 12/14/23 | | | | 3.60 | | | | USD | | | | 61,817 | | | | (738,791 | ) |
5-Year Interest Rate Swap, 03/29/29 | |
| 1-Day SOFR,
4.81% |
| | Quarterly | | | 3.79% | | | Semi-Annual | | JPMorgan Chase Bank N.A. | | | 03/27/24 | | | | 3.79 | | | | USD | | | | 350,867 | | | | (2,821,296 | ) |
| | | | | | | | | | | | | | | | | | | | | | | | | | | | | | | | | | |
| | | | | | | | | | |
| | | | | | | | | | | | | | | | | | | | | | | | | | | | | | | | | (44,459,311 | ) |
| | | | | | | | | | | | | | | | | | | | | | | | | | | | | | | | | | |
| | | | | | | | | | |
| | | | | | | | | | | | | | | | | | | | | | | | | | | | | | | | $ | (55,287,780 | ) |
| | | | | | | | | | | | | | | | | | | | | | | | | | | | | | | | | | |
Centrally Cleared Credit Default Swaps — Buy Protection
| | | | | | | | | | | | | | | | | | | | | | | | | | | | | | |
| |
| | | | | | | |
| Reference Obligation/Index | | Financing
Rate Paid by the Fund | | | Payment
Frequency | | | Termination
Date | | Notional Amount (000) | | | Value | | | Upfront
Premium Paid
(Received) | | | Unrealized
Appreciation
(Depreciation) | |
| |
| | | | | | | | |
AVIS Budget Car Rental LLC | | | 5.00 | % | | | Quarterly | | | 12/20/26 | | | USD | | | | 12,271 | | | $ | (692,701 | ) | | $ | (1,295,392 | ) | | $ | 602,691 | |
CDX.NA.HY.37.V3 | | | 5.00 | | | | Quarterly | | | 12/20/26 | | | USD | | | | 155,855 | | | | (6,845,493 | ) | | | (8,013,428 | ) | | | 1,167,935 | |
CDX.NA.IG.39.V1 | | | 1.00 | | | | Quarterly | | | 12/20/27 | | | USD | | | | 18,263 | | | | (228,837 | ) | | | (24,125 | ) | | | (204,712 | ) |
CDX.NA.HY.40.V1 | | | 5.00 | | | | Quarterly | | | 06/20/28 | | | USD | | | | 8,555 | | | | (171,086 | ) | | | (84,313 | ) | | | (86,773 | ) |
iTraxx.XO.39.V1 | | | 5.00 | | | | Quarterly | | | 06/20/28 | | | EUR | | | | 35,885 | | | | (1,278,656 | ) | | | (291,098 | ) | | | (987,558 | ) |
| | | | | | | | | | | | | | | | | | | | | | | | | | | | | | |
| | | | | | | | |
| | | | | | | | | | | | | | | | | | | | $ | (9,216,773 | ) | | $ | (9,708,356 | ) | | $ | 491,583 | |
| | | | | | | | | | | | | | | | | | | | | | | | | | | | | | |
| | |
| 46 | | 2 0 2 3 BLACK ROCK ANNUAL REPORT TO SHAREHOLDERS |
| | |
Consolidated Schedule of Investments (continued) April 30, 2023 | | BlackRock Global Allocation Fund, Inc. |
Centrally Cleared Credit Default Swaps — Sell Protection
| | | | | | | | | | | | | | | | | | | | | | | | | | |
| |
Reference Obligation/Index | |
| Financing
Rate Received
by the Fund |
| | Payment Frequency | |
| Termination
Date |
| | Credit Rating(a) | | Notional Amount (000)(b) | | | Value | | |
| Upfront
Premium Paid (Received) |
| |
| Unrealized
Appreciation (Depreciation) |
|
| |
| | | | | | | | |
CDX.NA.HY.39.V2 | | | 5.00 | % | | Quarterly | | | 12/20/27 | | | B | | USD 22,060 | | $ | 570,794 | | | $ | (80,205 | ) | | $ | 650,999 | |
iTraxx.XO.38.V1 | | | 5.00 | | | Quarterly | | | 12/20/27 | | | B | | EUR 40,907 | | | 1,935,879 | | | | (1,314,118 | ) | | | 3,249,997 | |
| | | | | | | | | | | | | | | | | | | | | | | | | | |
| | | | | | | | |
| | | | | | | | | | | | | | | | $ | 2,506,673 | | | $ | (1,394,323 | ) | | $ | 3,900,996 | |
| | | | | | | | | | | | | | | | | | | | | | | | | | |
| | (a) | Using the rating of the issuer or the underlying securities of the index, as applicable, provided by S&P Global Ratings. | |
| | (b) | The maximum potential amount the Fund may pay should a negative credit event take place as defined under the terms of the agreement. | |
Centrally Cleared Inflation Swaps
| | | | | | | | | | | | | | | | | | | | | | | | | | | | |
| |
| | | | | | |
Paid by the Fund | | Received by the Fund | | | Termination | | | Notional | | | | | | Upfront Premium Paid | | | Unrealized
Appreciation | |
| Reference | | Frequency | | Rate | | Frequency | | | Date | | | Amount (000) | | | Value | | | (Received) | | | (Depreciation) | |
| |
| | | | | | | | |
Eurostat Eurozone HICP Ex Tobacco Unrevised | | Monthly | | 2.69% | | | Monthly | | | | 08/15/32 | | | EUR | 14,565 | | | $ | (187,482 | ) | | $ | 303 | | | $ | (187,785 | ) |
| | | | | | | | | | | | | | | | | | | | | | | | | | | | |
Centrally Cleared Interest Rate Swaps
| | | | | | | | | | | | | | | | | | | | | | | | | | | | | | | | | | |
| |
| | | | | | | |
Paid by the Fund | | Received by the Fund | | Effective | | | Termination | | | Notional | | | | | | Upfront Premium Paid | | | Unrealized Appreciation | |
| Rate | | Frequency | | Rate | | Frequency | | Date | | | Date | | | Amount (000) | | | Value | | | (Received) | | | (Depreciation) | |
| |
| | | | | | | | | | |
3.75% | | Monthly | | 1-Day SOFR,
4.81% | | Monthly | | | N/A | | | | 02/13/24 | | | | USD | | | | 951,740 | | | $ | 11,136,189 | | | $ | 954 | | | $ | 11,135,235 | |
1-Day SOFR, 4.81% | | Monthly | | 4.40% | | Monthly | | | N/A | | | | 02/13/24 | | | | USD | | | | 1,903,481 | | | | (10,107,934 | ) | | | 1,907 | | | | (10,109,841 | ) |
28-Day MXIBTIIE, 11.55% | | Monthly | | 4.68% | | Monthly | | | N/A | | | | 02/27/24 | | | | MXN | | | | 679,790 | | | | (2,082,646 | ) | | | 62 | | | | (2,082,708 | ) |
28-Day MXIBTIIE, 11.55% | | Monthly | | 4.86% | | Monthly | | | N/A | | | | 03/01/24 | | | | MXN | | | | 679,790 | | | | (2,024,841 | ) | | | 62 | | | | (2,024,903 | ) |
1-Day SOFR, 4.81% | | Monthly | | 4.50% | | Monthly | | | N/A | | | | 03/09/24 | | | | USD | | | | 935,485 | | | | (3,829,768 | ) | | | 2,618 | | | | (3,832,386 | ) |
2.47% | | Monthly | | 1-Day
SONIA,
4.18% | | Monthly | | | N/A | | | | 04/03/24 | | | | GBP | | | | 512,248 | | | | 14,441,843 | | | | (25,445 | ) | | | 14,467,288 | |
1-Day SONIA, 4.18% | | Monthly | | 3.22% | | Monthly | | | N/A | | | | 04/03/24 | | | | GBP | | | | 1,024,497 | | | | (19,545,783 | ) | | | 34,508 | | | | (19,580,291 | ) |
1-Day SOFR, 4.81% | | Annual | | 2.65% | | Annual | | | N/A | | | | 05/02/24 | | | | USD | | | | 1,549,701 | | | | (40,811,458 | ) | | | 170,850 | | | | (40,982,308 | ) |
1-Day SOFR, 4.81% | | Monthly | | 4.46% | | Monthly | | | 07/12/23 | (a) | | | 07/12/24 | | | | USD | | | | 941,993 | | | | (801,061 | ) | | | 3,080 | | | | (804,141 | ) |
1-Day SONIA, 4.18% | | Monthly | | 4.26% | | Monthly | | | 09/06/23 | (a) | | | 09/06/24 | | | | GBP | | | | 260,709 | | | | (1,490,739 | ) | | | 826 | | | | (1,491,565 | ) |
28-Day MXIBTIIE, 11.55% | | Monthly | | 9.78% | | Monthly | | | N/A | | | | 02/04/25 | | | | MXN | | | | 2,874,182 | | | | (1,394,122 | ) | | | 594 | | | | (1,394,716 | ) |
28-Day MXIBTIIE, 11.55% | | Monthly | | 9.79% | | Monthly | | | N/A | | | | 02/04/25 | | | | MXN | | | | 1,437,091 | | | | (683,514 | ) | | | 297 | | | | (683,811 | ) |
28-Day MXIBTIIE, 11.55% | | Monthly | | 9.80% | | Monthly | | | N/A | | | | 02/04/25 | | | | MXN | | | | 1,437,091 | | | | (663,193 | ) | | | 297 | | | | (663,490 | ) |
2.00% | | Annual | | 1-Day SOFR,
4.81% | | Annual | | | N/A | | | | 02/17/25 | | | | USD | | | | 148,033 | | | | 6,389,351 | | | | 591 | | | | 6,388,760 | |
1-Day SOFR, 4.81% | | Annual | | 2.60% | | Annual | | | N/A | | | | 02/17/25 | | | | USD | | | | 526,238 | | | | (16,624,167 | ) | | | 2,103 | | | | (16,626,270 | ) |
1-Day SOFR, 4.81% | | Annual | | 2.70% | | Annual | | | N/A | | | | 02/17/25 | | | | USD | | | | 526,238 | | | | (15,609,311 | ) | | | 2,103 | | | | (15,611,414 | ) |
1-Day SOFR, 4.81% | | Annual | | 4.03% | | Annual | | | N/A | | | | 03/10/25 | | | | USD | | | | 945,671 | | | | (2,809,794 | ) | | | 2,200 | | | | (2,811,994 | ) |
2.72% | | Annual | | 1-Day SOFR,
4.81% | | Annual | | | N/A | | | | 05/02/25 | | | | USD | | | | 1,840,036 | | | | 54,395,789 | | | | (355,974 | ) | | | 54,751,763 | |
1-Day SOFR, 4.81% | | Annual | | 3.75% | | Annual | | | N/A | | | | 12/15/25 | | | | USD | | | | 121,426 | | | | (454,422 | ) | | | 818 | | | | (455,240 | ) |
1-Day SOFR, 4.81% | | Annual | | 3.81% | | Annual | | | N/A | | | | 12/19/25 | | | | USD | | | | 129,342 | | | | (255,740 | ) | | | 875 | | | | (256,615 | ) |
28-Day MXIBTIIE, 11.55% | | Monthly | | 6.48% | | Monthly | | | N/A | | | | 08/12/26 | | | | MXN | | | | 580,343 | | | | (2,307,100 | ) | | | 238 | | | | (2,307,338 | ) |
28-Day MXIBTIIE, 11.55% | | Monthly | | 6.47% | | Monthly | | | N/A | | | | 08/13/26 | | | | MXN | | | | 796,887 | | | | (3,178,279 | ) | | | 326 | | | | (3,178,605 | ) |
28-Day MXIBTIIE, 11.55% | | Monthly | | 6.42% | | Monthly | | | N/A | | | | 08/14/26 | | | | MXN | | | | 649,632 | | | | (2,638,028 | ) | | | 264 | | | | (2,638,292 | ) |
28-Day MXIBTIIE, 11.55% | | Monthly | | 6.44% | | Monthly | | | N/A | | | | 08/14/26 | | | | MXN | | | | 394,136 | | | | (1,584,963 | ) | | | 161 | | | | (1,585,124 | ) |
28-Day MXIBTIIE, 11.55% | | Monthly | | 6.42% | | Monthly | | | N/A | | | | 08/17/26 | | | | MXN | | | | 585,216 | | | | (2,487,492 | ) | | | 234 | | | | (2,487,726 | ) |
1-Day SOFR, 4.81% | | Annual | | 3.47% | | Annual | | | 03/10/25 | (a) | | | 03/10/27 | | | | USD | | | | 96,874 | | | | 1,187,178 | | | | 429 | | | | 1,186,749 | |
1-Day SOFR, 4.81% | | Annual | | 2.67% | | Annual | | | N/A | | | | 05/02/27 | | | | USD | | | | 205,746 | | | | (6,803,963 | ) | | | (125,032 | ) | | | (6,678,931 | ) |
1-Day SOFR, 4.81% | | Annual | | 2.91% | | Annual | | | N/A | | | | 10/06/27 | | | | USD | | | | 259,533 | | | | (6,822,320 | ) | | | 2,127 | | | | (6,824,447 | ) |
1-Day SONIA, 4.18% | | Monthly | | 3.18% | | Monthly | | | 02/10/27 | (a) | | | 02/10/28 | | | | GBP | | | | 849,941 | | | | (2,455,599 | ) | | | 4,686 | | | | (2,460,285 | ) |
0.02% | | Annual | | 6-mo.
EURIBOR,
3.65% | | Semi-
Annual | | | N/A | | | | 08/26/31 | | | | EUR | | | | 103,788 | | | | 25,284,016 | | | | 2,008 | | | | 25,282,008 | |
1-Day SOFR, 4.81% | | Annual | | 2.65% | | Annual | | | N/A | | | | 05/02/32 | | | | USD | | | | 839,546 | | | | (38,050,035 | ) | | | 716,118 | | | | (38,766,153 | ) |
2.58% | | Annual | | 1-Day SOFR,
4.81% | | Annual | | | N/A | | | | 05/24/32 | | | | USD | | | | 159,068 | | | | 8,409,397 | | | | (143,790 | ) | | | 8,553,187 | |
2.60% | | Annual | | 1-Day SOFR,
4.81% | | Annual | | | N/A | | | | 05/26/32 | | | | USD | | | | 26,061 | | | | 1,335,290 | | | | 381 | | | | 1,334,909 | |
1-Day SOFR, 4.81% | | Annual | | 3.47% | | Annual | | | N/A | | | | 10/04/32 | | | | USD | | | | 111,214 | | | | 2,239,534 | | | | 1,650 | | | | 2,237,884 | |
1-Day SOFR, 4.81% | | Annual | | 3.42% | | Annual | | | N/A | | | | 10/05/32 | | | | USD | | | | 53,594 | | | | 837,499 | | | | 820 | | | | 836,679 | |
1-Day SOFR, 4.81% | | Annual | | 3.05% | | Annual | | | N/A | | | | 10/28/32 | | | | USD | | | | 118,850 | | | | (1,933,595 | ) | | | 1,829 | | | | (1,935,424 | ) |
1-Day SOFR, 4.81% | | Annual | | 2.88% | | Annual | | | N/A | | | | 11/02/32 | | | | USD | | | | 120,734 | | | | (3,738,544 | ) | | | 1,861 | | | | (3,740,405 | ) |
| | |
CONSOLIDATED SCHEDULE OF INVESTMENTS | | 47 |
| | |
Consolidated Schedule of Investments (continued) April 30, 2023 | | BlackRock Global Allocation Fund, Inc. |
Centrally Cleared Interest Rate Swaps (continued)
| | | | | | | | | | | | | | | | | | | | | | | | | | | | | | | | | | |
| |
Paid by the Fund | | | Received by the Fund | | | Effective | | Termination | | Notional | | | | | | Upfront
Premium
Paid | | | Unrealized
Appreciation | |
| Rate | | Frequency | | | Rate | | Frequency | | | Date | | Date | | Amount (000) | | | Value | | | (Received) | | | (Depreciation) | |
| |
| | | | | | | | | | |
| 1-Day SOFR, 4.81% | | | Annual | | | 2.92% | | | Annual | | | N/A | | 11/04/32 | | | USD | | | | 121,431 | | | $ | (3,337,327 | ) | | $ | 1,873 | | | $ | (3,339,200 | ) |
| 1-Day SOFR, 4.81% | | | Annual | | | 2.90% | | | Annual | | | N/A | | 11/15/32 | | | USD | | | | 193,694 | | | | (5,609,631 | ) | | | 2,995 | | | | (5,612,626 | ) |
| 1-Day SOFR, 4.81% | | | Annual | | | 3.20% | | | Annual | | | N/A | | 11/28/32 | | | USD | | | | 115,865 | | | | (322,347 | ) | | | 1,797 | | | | (324,144 | ) |
| 1-Day ESTR, 1,112.26% | | | Annual | | | 2.34% | | | Annual | | | 01/19/28(a) | | 01/19/33 | | | EUR | | | | 74,318 | | | | (1,227,616 | ) | | | 1,041 | | | | (1,228,657 | ) |
| 3.24% | | | Annual | | | 1-Day SOFR, 4.81% | | | Annual | | | 08/09/23(a) | | 08/09/33 | | | USD | | | | 60,101 | | | | (726,634 | ) | | | 971 | | | | (727,605 | ) |
| 2.61% | | | Annual | | | 1-Day SOFR, 4.81% | | | Annual | | | N/A | | 05/02/42 | | | USD | | | | 19,667 | | | | 1,634,292 | | | | 46,596 | | | | 1,587,696 | |
| 2.43% | | | Annual | | | 1-Day SOFR, 4.81% | | | Annual | | | N/A | | 05/02/52 | | | USD | | | | 577,068 | | | | 65,573,648 | | | | (1,244,010 | ) | | | 66,817,658 | |
| | | | | | | | | | | | | | | | | | | | | | | | | | | | | | | | | | |
| | | | | | | | | | |
| | | | | | | | | | | | | | | | | | | | | | | | $ | (9,547,940 | ) | | $ | (881,101 | ) | | $ | (8,666,839 | ) |
| | | | | | | | | | | | | | | | | | | | | | | | | | | | | | | | | | |
OTC Credit Default Swaps — Buy Protection
| | | | | | | | | | | | | | | | | | | | | | | | | | | | | | |
| |
| | | | | | | | |
| Reference Obligations/Index | | Financing
Rate Paid by the Fund | | | Payment
Frequency | | | Counterparty | | Termination
Date | | Notional Amount (000) | | | Value | | | Upfront Premium Paid
(Received) | | | Unrealized
Appreciation
(Depreciation) | |
| |
| | | | | | | | | |
| Bombardier, Inc. | | | 5.00 | % | | | Quarterly | | | Barclays Bank PLC | | 06/20/23 | | USD | | | 8,698 | | | $ | (101,015 | ) | | $ | 67,014 | | | $ | (168,029 | ) |
| Pitney Bowes, Inc. | | | 1.00 | | | | Quarterly | | | Barclays Bank PLC | | 06/20/24 | | USD | | | 410 | | | | 22,983 | | | | 31,490 | | | | (8,507 | ) |
| Staples Inc. | | | 5.00 | | | | Quarterly | | | Barclays Bank PLC | | 06/20/24 | | USD | | | 790 | | | | 28,081 | | | | 52,791 | | | | (24,710 | ) |
| Pitney Bowes, Inc. | | | 1.00 | | | | Quarterly | | | Goldman Sachs &
Co. LLC | | 06/20/25 | | USD | | | 800 | | | | 112,558 | | | | 179,742 | | | | (67,184 | ) |
| General Electric Co. | | | 1.00 | | | | Quarterly | | | Goldman Sachs &
Co. LLC | | 06/20/27 | | USD | | | 3,320 | | | | (38,842 | ) | | | 56,980 | | | | (95,822 | ) |
| Borgwarner Inc. | | | 1.00 | | | | Quarterly | | | BNP Paribas SA | | 12/20/27 | | USD | | | 1,330 | | | | (19,033 | ) | | | 17,285 | | | | (36,318 | ) |
| Pitney Bowes, Inc. | | | 1.00 | | | | Quarterly | | | Barclays Bank PLC | | 12/20/27 | | USD | | | 480 | | | | 157,460 | | | | 116,291 | | | | 41,169 | |
| Pitney Bowes, Inc. | | | 1.00 | | | | Quarterly | | | Citibank N.A. | | 12/20/27 | | USD | | | 270 | | | | 88,571 | | | | 68,761 | | | | 19,810 | |
| Pitney Bowes, Inc. | | | 1.00 | | | | Quarterly | | | Citibank N.A. | | 12/20/27 | | USD | | | 400 | | | | 131,216 | | | | 104,938 | | | | 26,278 | |
| Pitney Bowes, Inc. | | | 1.00 | | | | Quarterly | | | Goldman Sachs &
Co. LLC | | 12/20/27 | | USD | | | 490 | | | | 160,740 | | | | 118,774 | | | | 41,966 | |
| Pitney Bowes, Inc. | | | 1.00 | | | | Quarterly | | | Goldman Sachs &
Co. LLC | | 12/20/27 | | USD | | | 675 | | | | 221,428 | | | | 167,948 | | | | 53,480 | |
| Xerox Corp. | | | 1.00 | | | | Quarterly | | | Citibank N.A. | | 12/20/27 | | USD | | | 470 | | | | 49,734 | | | | 51,107 | | | | (1,373 | ) |
| Xerox Corp. | | | 1.00 | | | | Quarterly | | | JPMorgan Chase
Bank N.A. | | 12/20/27 | | USD | | | 790 | | | | 83,596 | | | | 86,130 | | | | (2,534 | ) |
| Ford Motor Company | | | 5.00 | | | | Quarterly | | | Morgan Stanley &
Co. International
PLC | | 06/20/28 | | USD | | | 2,415 | | | | (181,731 | ) | | | (123,018 | ) | | | (58,713 | ) |
| MetLife, Inc. | | | 1.00 | | | | Quarterly | | | BNP Paribas SA | | 06/20/28 | | USD | | | 1,165 | | | | 9,266 | | | | 8,971 | | | | 295 | |
| Paramount Global Class B | | | 1.00 | | | | Quarterly | | | Barclays Bank PLC | | 06/20/28 | | USD | | | 425 | | | | 20,788 | | | | 18,491 | | | | 2,297 | |
| Paramount Global Class B | | | 1.00 | | | | Quarterly | | | Barclays Bank PLC | | 06/20/28 | | USD | | | 395 | | | | 19,333 | | | | 17,197 | | | | 2,136 | |
| Paramount Global Class B | | | 1.00 | | | | Quarterly | | | JPMorgan Chase
Bank N.A. | | 06/20/28 | | USD | | | 1,955 | | | | 95,665 | | | | 89,239 | | | | 6,426 | |
| Simon Property Group., LP | | | 1.00 | | | | Quarterly | | | JPMorgan Chase
Bank N.A. | | 06/20/28 | | USD | | | 4,065 | | | | 29,165 | | | | 96,116 | | | | (66,951 | ) |
| Southwest Airlines, Co. | | | 1.00 | | | | Quarterly | | | JPMorgan Chase
Bank N.A. | | 06/20/28 | | USD | | | 4,070 | | | | 36,084 | | | | 63,081 | | | | (26,997 | ) |
| | | | | | | | | | | | | | | | | | | | | | | | | | | | | | |
| | | | | | | | | |
| | | | | | | | | | | | | | | | | | | | $ | 926,047 | | | $ | 1,289,328 | | | $ | (363,281 | ) |
| | | | | | | | | | | | | | | | | | | | | | | | | | | | | | |
OTC Credit Default Swaps — Sell Protection
| | | | | | | | | | | | | | | | | | | | | | | | | | | | | | | | | | | | | | | | | | |
| | | | | | | |
| | | | | | | | | | | |
| | | Reference Obligation/Index | |
| Financing
Rate Received
by the Fund |
| |
| Payment
Frequency |
| | | Counterparty | | |
| Termination
Date |
| |
| Credit
Rating |
(a) | |
| Notional
Amount (000) |
(b) | | | Value | | |
| Upfront
Premium
Paid
(Received) |
| |
| Unrealized
Appreciation
(Depreciation) |
| | | | |
| | | | | | | |
| | | | | | | | | | | |
| | Vistra Operations Company LLC | | | 5.00 | % | | | Quarterly | | |
| JPMorgan
Chase
Bank N.A. |
| | | 06/20/23 | | | | BB | | | | USD 4,250 | | | $ | 47,176 | | | $ | 19,211 | | | $ | 27,965 | | | | | |
| | Vistra Operations Company LLC | | | 5.00 | | | | Quarterly | | |
| JPMorgan
Chase Bank
N.A. |
| | | 12/20/25 | | | | BB | | | | USD 2,125 | | | | 137,728 | | | | 99,546 | | | | 38,182 | | | | | |
| | NRG Energy, Inc. | | | 5.00 | | | | Quarterly | | |
| Barclays
Bank PLC |
| | | 12/20/27 | | | | BB | | | | USD 665 | | | | 57,223 | | | | 39,849 | | | | 17,374 | | | | | |
| | | | | | | | | | | | | | | | | | | | | | | | | | | | | | | | | | | | | | | | | | |
| | | | | | | | | | | |
| | | | | | | | | | | | | | | | | | | | | | | | | | | | $ | 242,127 | | | $ | 158,606 | | | $ | 83,521 | | | | | |
| | | | | | | | | | | | | | | | | | | | | | | | | | | | | | | | | | | | | | | | | | |
| | (a) | Using the rating of the issuer or the underlying securities of the index, as applicable, provided by S&P Global Ratings. | |
| | (b) | The maximum potential amount the Fund may pay should a negative credit event take place as defined under the terms of the agreement. | |
| | |
| 48 | | 2 0 2 3 BLACK ROCK ANNUAL REPORT TO SHAREHOLDERS |
| | |
Consolidated Schedule of Investments (continued) April 30, 2023 | | BlackRock Global Allocation Fund, Inc. |
OTC Interest Rate Swaps
| | | | | | | | | | | | | | | | | | | | | | | | | | | | | | | | | | | | | | | | | | | | | | | | |
| | | | | | | |
| | | Paid by the Fund | | | Received by the Fund | | | | | Effective | | | Termination | | | Notional | | | | | | Upfront
Premium
Paid | | | Unrealized
Appreciation | | | | |
| | | Rate | | Frequency | | | Rate | | | Frequency | | | Counterparty | | Date | | | Date | | | Amount (000) | | | Value | | | (Received) | | | (Depreciation) | | | | |
| | | | | | | | | | | | | | | |
| | | | | | | | | | | | | |
| | | 1-Day BZDIOVER, 0.05% | | | Monthly | | | | 13.25% | | | | Monthly | | | Citibank N.A. | | | N/A | | | | 01/02/24 | | | | BRL | | | | 150,362 | | | $ | (12,084 | ) | | $ | — | | | $ | (12,084 | ) | | | | |
| | 1-Day BZDIOVER, 0.05% | | | Monthly | | | | 12.44% | | | | Monthly | | | Barclays Bank PLC | | | N/A | | | | 07/01/24 | | | | BRL | | | | 27,208 | | | | (10,832 | ) | | | — | | | | (10,832 | ) | | | | |
| | 1-Day BZDIOVER, 0.05% | | | Monthly | | | | 12.48% | | | | Monthly | | | Barclays Bank PLC | | | N/A | | | | 07/01/24 | | | | BRL | | | | 81,202 | | | | (37,621 | ) | | | — | | | | (37,621 | ) | | | | |
| | 1-Day BZDIOVER, 0.05% | | | Monthly | | | | 13.15% | | | | Monthly | | | JPMorgan Chase Bank N.A. | | | N/A | | | | 01/02/25 | | | | BRL | | | | 435,468 | | | | 1,467,992 | | | | — | | | | 1,467,992 | | | | | |
| | 1-Day BZDIOVER, 0.05% | | | Monthly | | | | 13.18% | | | | Monthly | | | JPMorgan Chase Bank N.A. | | | N/A | | | | 01/02/25 | | | | BRL | | | | 435,248 | | | | 1,512,448 | | | | — | | | | 1,512,448 | | | | | |
| | 1-Day BZDIOVER, 0.05% | | | Monthly | | | | 13.22% | | | | Monthly | | | Citibank N.A. | | | N/A | | | | 01/02/25 | | | | BRL | | | | 228,965 | | | | 829,193 | | | | — | | | | 829,193 | | | | | |
| | 1-Day BZDIOVER, 0.05% | | | Monthly | | | | 9.39% | | | | Monthly | | | JPMorgan Chase Bank N.A. | | | N/A | | | | 01/02/25 | | | | BRL | | | | 289,615 | | | | (4,811,813 | ) | | | — | | | | (4,811,813 | ) | | | | |
| | 1-Day BZDIOVER, 0.05% | | | Monthly | | | | 9.42% | | | | Monthly | | | JPMorgan Chase Bank N.A. | | | N/A | | | | 01/02/25 | | | | BRL | | | | 315,948 | | | | (5,182,028 | ) | | | — | | | | (5,182,028 | ) | | | | |
| | 1-Day BZDIOVER, 0.05% | | | Monthly | | | | 11.56% | | | | Monthly | | | Barclays Bank PLC | | | N/A | | | | 01/02/26 | | | | BRL | | | | 27,208 | | | | (17,527 | ) | | | — | | | | (17,527 | ) | | | | |
| | 1-Day BZDIOVER, 0.05% | | | Monthly | | | | 11.76% | | | | Monthly | | | Citibank N.A. | | | N/A | | | | 01/02/26 | | | | BRL | | | | 21,092 | | | | 5,892 | | | | — | | | | 5,892 | | | | | |
| | 1-Day BZDIOVER, 0.05% | | | Monthly | | | | 11.78% | | | | Monthly | | | JPMorgan Chase Bank N.A. | | | N/A | | | | 01/02/26 | | | | BRL | | | | 22,021 | | | | 7,816 | | | | — | | | | 7,816 | | | | | |
| | 1-Day BZDIOVER, 0.05% | | | Monthly | | | | 11.82% | | | | Monthly | | | Barclays Bank PLC | | | N/A | | | | 01/02/26 | | | | BRL | | | | 36,333 | | | | 21,220 | | | | — | | | | 21,220 | | | | | |
| | 1-Day BZDIOVER, 0.05% | | | Monthly | | | | 11.83% | | | | Monthly | | | Morgan Stanley & Co.
International PLC | | | N/A | | | | 01/02/26 | | | | BRL | | | | 38,726 | | | | 24,585 | | | | — | | | | 24,585 | | | | | |
| | | | | | | | | | | | | | | | | | | | | | | | | | | | | | | | | | | | | | | | | | | | | | | | |
| | | | | | | | | | | | | |
| | | | | | | | | | | | | | | | | | | | | | | | | | | | | | | | | | $ | (6,202,759 | ) | | $ | — | | | $ | (6,202,759 | ) | | | | |
| | | | | | | | | | | | | | | | | | | | | | | | | | | | | | | | | | | | | | | | | | | | | | | | |
| | |
CONSOLIDATED SCHEDULE OF INVESTMENTS | | 49 |
| | |
Consolidated Schedule of Investments (continued) April 30, 2023 | | BlackRock Global Allocation Fund, Inc. |
OTC Total Return Swaps
| | | | | | | | | | | | | | | | | | | | | | | | | | | | | | | | | | | | | | | | | | | | | | | | | | |
| | | | | | | |
| | | Paid by the Fund | | | Received by the Fund | | | | | | | | | | | | | | | | | | Upfront
Premium Paid (Received) | | | Unrealized Appreciation (Depreciation) | | | | |
| | | | | | | | | Effective | | | Termination | | | Notional | | | | | | | |
| | | Rate/Reference | | Frequency | | | Rate/Reference | | | Frequency | | | Counterparty | | | Date | | | Date | | | Amount (000) | | | Value | | | | |
| | | | | | | |
| | | | | | | | | | | | | |
| | Pitney Bowes, Inc. | | | Quarterly | | |
| 1-Day SOFR
minus
0.25%,
4.81% |
| | | Quarterly | | | | Citibank N.A. | | | | N/A | | | | 06/13/23 | | | | USD | | | | 81 | | | $ | 2,712 | | | $ | — | | | $ | 2,712 | | | | | |
| | iShares iBoxx $ Investment Grade Corporate Bond ETF | | | Monthly | | |
| 1-Day SOFR
minus
0.40%,
4.81% |
| | | Monthly | | | | BNP Paribas SA | | | | N/A | | | | 06/16/23 | | | | USD | | | | 24,091 | | | | (298,068 | ) | | | (2,777 | ) | | | (295,291 | ) | | | | |
| | iShares iBoxx $ Investment Grade Corporate Bond ETF | | | Monthly | | |
| 1-Day SOFR
minus
0.40%,
4.81% |
| | | Monthly | | | | BNP Paribas SA | | | | N/A | | | | 06/16/23 | | | | USD | | | | 44,050 | | | | (545,012 | ) | | | (5,078 | ) | | | (539,934 | ) | | | | |
| | iShares iBoxx $ Investment Grade Corporate Bond ETF | | | Monthly | | |
| 1-Day SOFR
minus
0.35%,
4.81% |
| | | Monthly | | |
| JPMorgan Chase
Bank N.A. |
| | | N/A | | | | 06/16/23 | | | | USD | | | | 24,091 | | | | (296,528 | ) | | | (2,811 | ) | | | (293,717 | ) | | | | |
| | iShares iBoxx $ Investment Grade Corporate Bond ETF | | | Monthly | | |
| 1-Day SOFR
minus
0.35%,
4.81% |
| | | Monthly | | |
| JPMorgan Chase
Bank N.A. |
| | | N/A | | | | 06/16/23 | | | | USD | | | | 25,030 | | | | (308,090 | ) | | | (2,920 | ) | | | (305,170 | ) | | | | |
| | iShares iBoxx $ Investment Grade Corporate Bond ETF | | | Monthly | | |
| 1-Day SOFR
minus
0.35%,
4.81% |
| | | Monthly | | |
| JPMorgan Chase
Bank N.A. |
| | | N/A | | | | 06/16/23 | | | | USD | | | | 25,057 | | | | (308,415 | ) | | | (2,923 | ) | | | (305,492 | ) | | | | |
| | Fixed, 0.00% | | | Quarterly | | |
| Citi Equity
US 1W
Volatility
Carry Index |
| | | Quarterly | | | | Citibank N.A. | | | | N/A | | | | 09/15/23 | | | | USD | | | | 8,229 | | | | 111,395 | | | | — | | | | 111,395 | | | | | |
| | | | | | | | | | | | | | | | | | | | | | | | | | | | | | | | | | | | | | | | | | | | | | | | | | |
| | | | | | | | | | | | | |
| | | | | | | | | | | | | | | | | | | | | | | | | | | | | | | | | | | | $ | (1,642,006 | ) | | $ | (16,509 | ) | | $ | (1,625,497 | ) | | | | |
| | | | | | | | | | | | | | | | | | | | | | | | | | | | | | | | | | | | | | | | | | | | | | | | | | |
OTC Total Return Swaps
| | | | | | | | | | | | | | | | | | | | | | | | | | | | |
| |
| | | | | | | |
| Reference Entity | | Payment
Frequency | | | Counterparty(a) | | | Termination Date | | | Net Notional | | | Accrued
Unrealized
Appreciation
(Depreciation) | | | Net Value of Reference
Entity | | | Gross
Notional Amount Net Asset Percentage | |
| |
| | | | | | | |
Equity Securities Short | | | Monthly | | | | Citibank N.A.(b) | | | | 05/31/23 – 02/24/28 | | | $ | (146,256,716 | ) | | $ | 573,136 | (c) | | $ | (145,723,096 | ) | | | 0.8% | |
| | | Monthly | | | | JPMorgan Chase Bank N.A.(d) | | | | 02/08/24 – 02/15/24 | | | | (156,614,147 | ) | | | (1,763,501 | )(e) | | | (158,202,630 | ) | | | 0.9 | |
| | | | | | | | | | | | | | | | | | | | | | | | | | | | |
| | | | | | | |
| | | | | | | | | | | | | | | | | | $ | (1,190,365 | ) | | $ | (303,925,726 | ) | | | | |
| | | | | | | | | | | | | | | | | | | | | | | | | | | | |
| | (a) | The Fund receives the total return on a portfolio of long positions underlying the total return swap. The Fund pays the total return on a portfolio of short positions underlying the total return swap. In addition, the Fund pays or receives a variable rate of interest, based on a specified benchmark. The benchmark and spread are determined based upon the country and/or currency of the individual underlying positions. | |
| | (c) | Amount includes $39,516 of net dividends and financing fees. | |
| | (e) | Amount includes $(175,018) of net dividends and financing fees. | |
The following are the specified benchmarks (plus or minus a range) used in determining the variable rate of interest:
| | | | |
| | (b) | | (d) |
Range: | | 15-50 basis points | | 15-195 basis points |
Benchmarks: | | USD - 1D Overnight Bank Funding Rate (OBFR01) | | USD - 1D Overnight Bank Funding Rate (OBFR01) |
| | |
| 50 | | 2 0 2 3 BLACK ROCK ANNUAL REPORT TO SHAREHOLDERS |
| | |
Consolidated Schedule of Investments (continued) April 30, 2023 | | BlackRock Global Allocation Fund, Inc. |
The following table represents the individual short positions and related values of the equity securities underlying the total return swap with Citibank N.A. as of period end, termination dates on May 31, 2023, February 26, 2024, February 27, 2024 and February 24, 2028:
| | | | | | | | | | | | |
| Security | | Shares | | | Value | | | % of Basket Value | |
| | | |
Reference Entity — Short | | | | | | | | | | | | |
| | | |
| Common Stocks | | | | | | | | | |
| | | |
| Brazil | | | | | | | | | |
Cia de Saneamento Basico do Estado de Sao Paulo SABESP | | | (126,360 | ) | | $ | (1,168,649 | ) | | | 0.8 | % |
MercadoLibre, Inc. | | | (1,243 | ) | | | (1,587,920 | ) | | | 1.1 | |
| | | | | | | | | | | | |
| | | |
| | | | | | | (2,756,569 | ) | | | | |
| | | |
| Canada | | | | | | | | | |
Intact Financial Corp. | | | (4,537 | ) | | | (686,285 | ) | | | 0.5 | |
Power Corp. of Canada | | | (84,730 | ) | | | (2,269,514 | ) | | | 1.5 | |
Restaurant Brands International, Inc. | | | (22,102 | ) | | | (1,549,432 | ) | | | 1.1 | |
Shopify, Inc., Class A | | | (9,616 | ) | | | (465,878 | ) | | | 0.3 | |
| | | | | | | | | | | | |
| | | |
| | | | | | | (4,971,109 | ) | | | | |
| | | |
| China | | | | | | | | | |
China Overseas Land & Investment Ltd. | | | (593,500 | ) | | | (1,505,201 | ) | | | 1.0 | |
China Vanke Co., Ltd., Class H | | | (509,022 | ) | | | (795,751 | ) | | | 0.5 | |
Li Ning Co. Ltd. | | | (71,000 | ) | | | (507,765 | ) | | | 0.4 | |
Xiaomi Corp., Class B | | | (545,600 | ) | | | (774,427 | ) | | | 0.5 | |
Zhuzhou CRRC Times Electric Co., Ltd. | | | (247,800 | ) | | | (1,000,119 | ) | | | 0.7 | |
| | | | | | | | | | | | |
| | | |
| | | | | | | (4,583,263 | ) | | | | |
| | | |
| Comoros | | | | | | | | | |
Prosus NV | | | (24,680 | ) | | | (1,846,892 | ) | | | 1.3 | |
| | | | | | | | | | | | |
| | | |
| Denmark | | | | | | | | | |
Vestas Wind Systems A/S | | | (35,183 | ) | | | (973,534 | ) | | | 0.7 | |
| | | | | | | | | | | | |
| | | |
| Finland | | | | | | | | | |
Metso Outotec OYJ | | | (128,765 | ) | | | (1,421,659 | ) | | | 1.0 | |
Nordea Bank Abp | | | (100,022 | ) | | | (1,111,171 | ) | | | 0.7 | |
| | | | | | | | | | | | |
| | | |
| | | | | | | (2,532,830 | ) | | | | |
| | | |
| Germany | | | | | | | | | |
Covestro AG | | | (82,467 | ) | | | (3,617,864 | ) | | | 2.5 | |
LEG Immobilien SE | | | (372 | ) | | | (23,154 | ) | | | 0.0 | |
Siemens Healthineers AG | | | (110,115 | ) | | | (6,862,988 | ) | | | 4.7 | |
| | | | | | | | | | | | |
| | | |
| | | | | | | (10,504,006 | ) | | | | |
| | | |
| Italy | | | | | | | | | |
Nexi SpA | | | (141,959 | ) | | | (1,177,094 | ) | | | 0.8 | |
Telecom Italia SpA | | | (6,177,870 | ) | | | (1,816,990 | ) | | | 1.3 | |
| | | | | | | | | | | | |
| | | |
| | | | | | | (2,994,084 | ) | | | | |
| | | |
| Japan | | | | | | | | | |
Canon, Inc. | | | (114,200 | ) | | | (2,719,941 | ) | | | 1.9 | |
Daiichi Sankyo Co. Ltd. | | | (12,400 | ) | | | (425,501 | ) | | | 0.3 | |
ENEOS Holdings, Inc. | | | (348,800 | ) | | | (1,240,864 | ) | | | 0.9 | |
Fujitsu Ltd. | | | (6,000 | ) | | | (799,663 | ) | | | 0.5 | |
Hitachi Ltd. | | | (63,600 | ) | | | (3,518,010 | ) | | | 2.4 | |
Lasertec Corp. | | | (25,500 | ) | | | (3,469,174 | ) | | | 2.4 | |
MatsukiyoCocokara & Co. | | | (49,800 | ) | | | (2,666,781 | ) | | | 1.8 | |
Olympus Corp. | | | (28,300 | ) | | | (495,432 | ) | | | 0.3 | |
Open House Co. Ltd. | | | (20,100 | ) | | | (803,452 | ) | | | 0.6 | |
Renesas Electronics Corp. | | | (33,600 | ) | | | (437,890 | ) | | | 0.3 | |
Tokyo Electric Power Co. Holdings, Inc. | | | (85,400 | ) | | | (306,194 | ) | | | 0.2 | |
| | | | | | | | | | | | |
| | | |
| | | | | | | (16,882,902 | ) | | | | |
| | | | | | | | | | | | |
| Security | | Shares | | | Value | | | % of Basket Value | |
| | | |
| Mexico | | | | | | | | | |
America Movil SAB de CV, Series B | | | (2,583,650 | ) | | $ | (2,786,338 | ) | | | 1.9 | % |
| | | | | | | | | | | | |
| | | |
| Norway | | | | | | | | | |
Aker ASA, Class A, A Shares | | | (5,860 | ) | | | (358,173 | ) | | | 0.2 | |
Aker BP ASA, Class A | | | (241,523 | ) | | | (5,773,804 | ) | | | 4.0 | |
Salmar ASA | | | (12,872 | ) | | | (571,883 | ) | | | 0.4 | |
| | | | | | | | | | | | |
| | | |
| | | | | | | (6,703,860 | ) | | | | |
| | | |
| Poland | | | | | | | | | |
KGHM Polska Miedz SA | | | (23,139 | ) | | | (665,606 | ) | | | 0.5 | |
| | | | | | | | | | | | |
| | | |
| South Korea | | | | | | | | | |
Kakao Corp. | | | (86,407 | ) | | | (3,783,722 | ) | | | 2.6 | |
| | | | | | | | | | | | |
| | | |
| Sweden | | | | | | | | | |
Fastighets AB Balder, B Shares | | | (678,032 | ) | | | (3,156,792 | ) | | | 2.2 | |
Getinge AB, B Shares | | | (25,917 | ) | | | (657,796 | ) | | | 0.4 | |
Saab AB, Class B | | | (12,351 | ) | | | (693,499 | ) | | | 0.5 | |
Sandvik AB | | | (49,375 | ) | | | (1,005,759 | ) | | | 0.7 | |
Trelleborg AB, B Shares | | | (25,635 | ) | | | (644,159 | ) | | | 0.4 | |
| | | | | | | | | | | | |
| | | |
| | | | | | | (6,158,005 | ) | | | | |
| | | |
| Switzerland | | | | | | | | | |
SIG Group AG | | | (43,756 | ) | | | (1,171,157 | ) | | | 0.8 | |
Straumann Holding AG, Registered Shares | | | (11,786 | ) | | | (1,773,211 | ) | | | 1.2 | |
| | | | | | | | | | | | |
| | | |
| | | | | | | (2,944,368 | ) | | | | |
| | | |
| United States | | | | | | | | | |
Apollo Global Management, Inc. | | | (40,265 | ) | | | (2,552,398 | ) | | | 1.7 | |
Arista Networks, Inc. | | | (12,329 | ) | | | (1,974,613 | ) | | | 1.4 | |
Block, Inc. | | | (57,342 | ) | | | (3,485,820 | ) | | | 2.4 | |
Charles River Laboratories International, Inc. | | | (2,484 | ) | | | (472,258 | ) | | | 0.3 | |
Church & Dwight Co., Inc. | | | (30,565 | ) | | | (2,968,473 | ) | | | 2.0 | |
Constellation Energy Corp. | | | (20,078 | ) | | | (1,554,037 | ) | | | 1.1 | |
Costar Group, Inc. | | | (42,846 | ) | | | (3,297,000 | ) | | | 2.3 | |
Davita, Inc. | | | (7,879 | ) | | | (711,946 | ) | | | 0.5 | |
Discover Financial Services | | | (8,031 | ) | | | (830,968 | ) | | | 0.6 | |
Dominion Energy, Inc. | | | (16,779 | ) | | | (958,752 | ) | | | 0.7 | |
EPAM Systems, Inc. | | | (4,949 | ) | | | (1,397,795 | ) | | | 1.0 | |
Ford Motor Co. | | | (423,003 | ) | | | (5,025,276 | ) | | | 3.4 | |
HCA Healthcare, Inc. | | | (2,409 | ) | | | (692,178 | ) | | | 0.5 | |
Illumina, Inc. | | | (9,175 | ) | | | (1,886,013 | ) | | | 1.3 | |
Iron Mountain, Inc. | | | (24,755 | ) | | | (1,367,466 | ) | | | 0.9 | |
KKR & Co., Inc. | | | (43,767 | ) | | | (2,322,715 | ) | | | 1.6 | |
Lamb Weston Holdings, Inc. | | | (40,444 | ) | | | (4,522,044 | ) | | | 3.1 | |
Newell Brands, Inc. | | | (158,707 | ) | | | (1,928,290 | ) | | | 1.3 | |
Norwegian Cruise Line Holdings Ltd. | | | (224,976 | ) | | | (3,003,430 | ) | | | 2.1 | |
Oracle Corp. | | | (31,610 | ) | | | (2,994,099 | ) | | | 2.1 | |
Paramount Global, Class B | | | (188,446 | ) | | | (4,396,445 | ) | | | 3.0 | |
PerkinElmer, Inc. | | | (5,886 | ) | | | (768,064 | ) | | | 0.5 | |
PPG Industries, Inc. | | | (14,650 | ) | | | (2,054,809 | ) | | | 1.4 | |
PulteGroup, Inc. | | | (9,182 | ) | | | (616,571 | ) | | | 0.4 | |
Quanta Services, Inc. | | | (29,173 | ) | | | (4,948,908 | ) | | | 3.4 | |
Realty Income Corp. | | | (23,942 | ) | | | (1,504,515 | ) | | | 1.0 | |
Republic Services, Inc., Class A | | | (19,303 | ) | | | (2,791,600 | ) | | | 1.9 | |
Take-Two Interactive Software, Inc. | | | (45,908 | ) | | | (5,705,905 | ) | | | 3.9 | |
Teledyne Technologies, Inc. | | | (14,044 | ) | | | (5,819,834 | ) | | | 4.0 | |
Welltower, Inc. | | | (15,151 | ) | | | (1,200,262 | ) | | | 0.8 | |
Zimmer Biomet Holdings, Inc. | | | (6,382 | ) | | | (883,524 | ) | | | 0.6 | |
| | | | | | | | | | | | |
| | | |
| | | | | | | (74,636,008 | ) | | | | |
| | | | | | | | | | | | |
| | |
Net Value of Reference Entity — Citibank N.A. | | | $ | (145,723,096 | ) | | | | |
| | | | | | | | | | | | |
| | |
CONSOLIDATED SCHEDULE OF INVESTMENTS | | 51 |
| | |
Consolidated Schedule of Investments (continued) April 30, 2023 | | BlackRock Global Allocation Fund, Inc. |
The following table represents the individual short positions and related values of the equity securities underlying the total return swap with JPMorgan Chase Bank N.A. as of period end, termination dates on February 8, 2024 and February 15, 2024:
| | | | | | | | | | | | |
| Security | | Shares | | | Value | | | % of
Basket
Value | |
| | | |
Reference Entity — Short | | | | | | | | | | | | |
| | | |
| Common Stocks | | | | | | | | | |
| | | |
| Australia | | | | | | | | | |
AMP Ltd. | | | (1,832,740 | ) | | $ | (1,385,656 | ) | | | 0.9 | % |
Brambles Ltd. | | | (117,610 | ) | | | (1,114,099 | ) | | | 0.7 | |
Commonwealth Bank of Australia | | | (11,100 | ) | | | (734,555 | ) | | | 0.5 | |
Computershare Ltd. | | | (190,071 | ) | | | (2,829,361 | ) | | | 1.8 | |
IDP Education Ltd. | | | (55,312 | ) | | | (1,039,134 | ) | | | 0.6 | |
IGO Ltd. | | | (63,743 | ) | | | (587,002 | ) | | | 0.4 | |
Macquarie Group Ltd. | | | (14,177 | ) | | | (1,729,477 | ) | | | 1.1 | |
Mineral Resources Ltd. | | | (22,158 | ) | | | (1,093,068 | ) | | | 0.7 | |
Santos Ltd. | | | (111,750 | ) | | | (529,370 | ) | | | 0.3 | |
Westpac Banking Corp. | | | (50,475 | ) | | | (755,569 | ) | | | 0.5 | |
| | | | | | | | | | | | |
| | | |
| | | | | | | (11,797,291 | ) | | | | |
| | | |
| Brazil | | | | | | | | | |
Cia Siderurgica Nacional SA | | | (131,281 | ) | | | (374,013 | ) | | | 0.2 | |
Equatorial Energia SA | | | (368,600 | ) | | | (2,020,435 | ) | | | 1.3 | |
Hapvida Participacoes e Investimentos S/A | | | (5,704,122 | ) | | | (3,156,377 | ) | | | 2.0 | |
Localiza Rent a Car SA, (Expires 05/18/23, Strike Price BRL 41.15) | | | (329,562 | ) | | | (3,832,931 | ) | | | 2.4 | |
MercadoLibre, Inc. | | | (448 | ) | | | (572,315 | ) | | | 0.4 | |
| | | | | | | | | | | | |
| | | |
| | | | | | | (9,956,071 | ) | | | | |
| | | |
| Canada | | | | | | | | | |
Canadian Pacific Kansas City Ltd. | | | (43,519 | ) | | | (3,430,512 | ) | | | 2.2 | |
Great-West Lifeco, Inc. | | | (49,705 | ) | | | (1,413,172 | ) | | | 0.9 | |
Power Corp. of Canada | | | (100,683 | ) | | | (2,696,820 | ) | | | 1.7 | |
Restaurant Brands International, Inc. | | | (14,067 | ) | | | (986,149 | ) | | | 0.6 | |
| | | | | | | | | | | | |
| | | |
| | | | | | | (8,526,653 | ) | | | | |
| | | |
| China | | | | | | | | | |
China Southern Airlines Co., Ltd., Class H | | | (2,608,000 | ) | | | (1,826,753 | ) | | | 1.1 | |
Country Garden Holdings Co., Ltd. | | | (6,747,230 | ) | | | (1,738,085 | ) | | | 1.1 | |
Fuyao Glass Industry Group Co., Ltd., Class H | | | (113,600 | ) | | | (462,157 | ) | | | 0.3 | |
Li Ning Co. Ltd. | | | (435,000 | ) | | | (3,110,953 | ) | | | 2.0 | |
Shandong Gold Mining Co. Ltd., Class H | | | (956,250 | ) | | | (2,038,363 | ) | | | 1.3 | |
Xiaomi Corp., Class B | | | (4,447,600 | ) | | | (6,312,939 | ) | | | 4.0 | |
Zhuzhou CRRC Times Electric Co., Ltd. | | | (354,000 | ) | | | (1,428,742 | ) | | | 0.9 | |
| | | | | | | | | | | | |
| | | |
| | | | | | | (16,917,992 | ) | | | | |
| | | |
| Finland | | | | | | | | | |
Fortum OYJ | | | (138,176 | ) | | | (2,063,794 | ) | | | 1.3 | |
Metso Outotec OYJ | | | (125,745 | ) | | | (1,388,316 | ) | | | 0.9 | |
Orion OYJ, Class B | | | (20,010 | ) | | | (939,931 | ) | | | 0.6 | |
| | | | | | | | | | | | |
| | | |
| | | | | | | (4,392,041 | ) | | | | |
| | | |
| Germany | | | | | | | | | |
Delivery Hero SE | | | (57,876 | ) | | | (2,313,372 | ) | | | 1.5 | |
| | | | | | | | | | | | |
| | | |
| Hong Kong | | | | | | | | | |
Sino Biopharmaceutical Ltd. | | | (563,000 | ) | | | (312,522 | ) | | | 0.2 | |
| | | | | | | | | | | | |
| | | |
| Japan | | | | | | | | | |
Canon, Inc. | | | (54,300 | ) | | | (1,293,282 | ) | | | 0.8 | |
Fujitsu General Ltd. | | | (29,900 | ) | | | (769,156 | ) | | | 0.5 | |
Fujitsu Ltd. | | | (29,600 | ) | | | (3,945,006 | ) | | | 2.5 | |
Lasertec Corp. | | | (3,800 | ) | | | (516,975 | ) | | | 0.3 | |
Park24 Co. Ltd. | | | (53,700 | ) | | | (830,045 | ) | | | 0.5 | |
| | | | | | | | | | | | |
| Security | | Shares | | | Value | | | % of
Basket
Value | |
| | | |
| Japan (continued) | | | | | | | | | |
Rakuten Group, Inc. | | | (765,600 | ) | | $ | (3,818,774 | ) | | | 2.4 | % |
RENOVA, Inc. | | | (23,900 | ) | | | (338,529 | ) | | | 0.2 | |
SBI Holdings, Inc. | | | (43,400 | ) | | | (847,635 | ) | | | 0.5 | |
SHIFT, Inc. | | | (2,500 | ) | | | (465,405 | ) | | | 0.3 | |
Square Enix Holdings Co. Ltd. | | | (44,900 | ) | | | (2,209,489 | ) | | | 1.4 | |
Tokyo Electric Power Co. Holdings, Inc. | | | (155,500 | ) | | | (557,532 | ) | | | 0.4 | |
| | | | | | | | | | | | |
| | | |
| | | | | | | (15,591,828 | ) | | | | |
| | | |
| Macau | | | | | | | | | |
Sands China Ltd. | | | (233,200 | ) | | | (835,187 | ) | | | 0.5 | |
| | | | | | | | | | | | |
| | | |
| Netherlands | | | | | | | | | |
Aegon NV, Class A | | | (120,402 | ) | | | (549,361 | ) | | | 0.4 | |
BE Semiconductor Industries NV | | | (5,589 | ) | | | (503,086 | ) | | | 0.3 | |
| | | | | | | | | | | | |
| | | |
| | | | | | | (1,052,447 | ) | | | | |
| | | |
| Poland | | | | | | | | | |
Allegro.eu SA, Class B | | | (74,793 | ) | | | (589,536 | ) | | | 0.4 | |
Bank Polska Kasa Opieki SA | | | (69,950 | ) | | | (1,618,439 | ) | | | 1.0 | |
InPost SA | | | (263,030 | ) | | | (2,823,060 | ) | | | 1.8 | |
| | | | | | | | | | | | |
| | | |
| | | | | | | (5,031,035 | ) | | | | |
| | | |
| South Korea | | | | | | | | | |
Hanwha Solutions Corp. | | | (2,913 | ) | | | (104,818 | ) | | | 0.0 | |
Kakao Corp. | | | (21,531 | ) | | | (942,832 | ) | | | 0.6 | |
Lotte Energy Materials Corp. | | | (18,983 | ) | | | (858,805 | ) | | | 0.5 | |
Newell Brands, Inc. | | | (3,737 | ) | | | (306,875 | ) | | | 0.2 | |
Posco Chemical Co., Ltd. | | | (16,140 | ) | | | (4,062,721 | ) | | | 2.6 | |
SK, Inc. | | | (1,144 | ) | | | (139,511 | ) | | | 0.1 | |
| | | | | | | | | | | | |
| | | |
| | | | | | | (6,415,562 | ) | | | | |
| | | |
| Spain | | | | | | | | | |
CaixaBank SA | | | (400,615 | ) | | | (1,482,919 | ) | | | 0.9 | |
| | | | | | | | | | | | |
| | | |
| Switzerland | | | | | | | | | |
Bachem Holding AG | | | (30,285 | ) | | | (3,308,333 | ) | | | 2.1 | |
SGS SA, Registered Shares | | | (15,550 | ) | | | (1,407,202 | ) | | | 0.9 | |
Tecan Group AG, Registered Shares | | | (6,160 | ) | | | (2,684,359 | ) | | | 1.7 | |
UBS Group AG, Registered Shares | | | (74,665 | ) | | | (1,519,624 | ) | | | 0.9 | |
| | | | | | | | | | | | |
| | | |
| | | | | | | (8,919,518 | ) | | | | |
| | | |
| Taiwan | | | | | | | | | |
Powerchip Semiconductor Manufacturing Corp. | | | (1,000 | ) | | | (972 | ) | | | 0.0 | |
| | | | | | | | | | | | |
| | | |
| United Kingdom | | | | | | | | | |
Centrica PLC | | | (300,429 | ) | | | (431,702 | ) | | | 0.3 | |
Ocado Group PLC | | | (574,020 | ) | | | (3,653,265 | ) | | | 2.3 | |
| | | | | | | | | | | | |
| | | |
| | | | | | | (4,084,967 | ) | | | | |
| | | |
| United States | | | | | | | | | |
Align Technology, Inc., Class A | | | (10,794 | ) | | | (3,511,288 | ) | | | 2.2 | |
Ameriprise Financial, Inc. | | | (2,816 | ) | | | (859,218 | ) | | | 0.5 | |
Analog Devices, Inc. | | | (4,651 | ) | | | (836,622 | ) | | | 0.5 | |
Bank of Hawaii Corp. | | | (5,021 | ) | | | (243,167 | ) | | | 0.2 | |
Block, Inc. | | | (17,001 | ) | | | (1,033,491 | ) | | | 0.7 | |
Boeing Co. | | | (2,887 | ) | | | (596,974 | ) | | | 0.4 | |
Brandywine Realty Trust | | | (5,149 | ) | | | (20,235 | ) | | | 0.0 | |
Charles River Laboratories International, Inc. | | | (14,491 | ) | | | (2,755,029 | ) | | | 1.7 | |
Church & Dwight Co., Inc. | | | (62,771 | ) | | | (6,096,319 | ) | | | 3.9 | |
Costar Group, Inc. | | | (10,574 | ) | | | (813,669 | ) | | | 0.5 | |
Cullen/frost Bankers, Inc. | | | (1,376 | ) | | | (151,704 | ) | | | 0.1 | |
Darden Restaurants, Inc. | | | (5,483 | ) | | | (833,032 | ) | | | 0.5 | |
Devon Energy Corp. | | | (12,224 | ) | | | (653,128 | ) | | | 0.4 | |
DISH Network Corp., Class A | | | (533,532 | ) | | | (4,006,825 | ) | | | 2.5 | |
Dr Horton, Inc. | | | (34,580 | ) | | | (3,797,576 | ) | | | 2.4 | |
| | |
| 52 | | 2 0 2 3 BLACK ROCK ANNUAL REPORT TO SHAREHOLDERS |
| | |
Consolidated Schedule of Investments (continued) April 30, 2023 | | BlackRock Global Allocation Fund, Inc. |
| | | | | | | | | | | | |
| Security | | Shares | | | Value | | | % of
Basket
Value | |
| | | |
| United States (continued) | | | | | | | | | |
Enphase Energy, Inc. | | | (1,587 | ) | | $ | (260,585 | ) | | | 0.2 | % |
Fiserv, Inc. | | | (38,591 | ) | | | (4,712,733 | ) | | | 3.0 | |
Frontier Communications Parent, Inc. | | | (20,781 | ) | | | (468,404 | ) | | | 0.3 | |
International Business Machines Corp. | | | (13,738 | ) | | | (1,736,621 | ) | | | 1.1 | |
Iron Mountain, Inc. | | | (68,382 | ) | | | (3,777,422 | ) | | | 2.4 | |
James Hardie Industries PLC, CDI | | | (34,263 | ) | | | (764,582 | ) | | | 0.5 | |
KKR & Co., Inc. | | | (24,195 | ) | | | (1,284,029 | ) | | | 0.8 | |
Lamb Weston Holdings, Inc. | | | (10,228 | ) | | | (1,143,593 | ) | | | 0.7 | |
Newell Brands, Inc. | | | (62,691 | ) | | | (761,696 | ) | | | 0.5 | |
Oracle Corp. | | | (2,342 | ) | | | (221,834 | ) | | | 0.1 | |
PayPal Holdings, Inc. | | | (6,848 | ) | | | (520,448 | ) | | | 0.3 | |
PerkinElmer, Inc. | | | (31,328 | ) | | | (4,087,991 | ) | | | 2.6 | |
ResMed, Inc. | | | (7,871 | ) | | | (1,896,596 | ) | | | 1.2 | |
Sabre Corp. | | | (10,297 | ) | | | (41,188 | ) | | | 0.0 | |
Simon Property Group, Inc. | | | (9,365 | ) | | | (1,061,242 | ) | | | 0.7 | |
STERIS PLC | | | (23,317 | ) | | | (4,396,420 | ) | | | 2.8 | |
Synovus Financial Corp. | | | (9,726 | ) | | | (299,561 | ) | | | 0.2 | |
T Mobile US, Inc. | | | (21,567 | ) | | | (3,103,491 | ) | | | 2.0 | |
Targa Resources Corp. | | | (14,186 | ) | | | (1,071,469 | ) | | | 0.7 | |
| | | | | | | | | | | | |
| Security | | Shares | | | Value | | | % of Basket Value | |
| | | |
| United States (continued) | | | | | | | | | |
Waste Connections, Inc. | | | (4,160 | ) | | $ | (578,864 | ) | | | 0.4 | % |
Western Alliance Bancorp | | | (13,750 | ) | | | (510,400 | ) | | | 0.3 | |
Xerox Holdings Corp. | | | (15,307 | ) | | | (239,861 | ) | | | 0.1 | |
Zions Bancorp NA | | | (12,548 | ) | | | (349,587 | ) | | | 0.2 | |
| | | | | | | | | | | | |
| | | |
| | | | | | | (59,496,894 | ) | | | | |
| | | | | | | | | | | | |
| | | |
| Preferred Stocks | | | | | | | | | |
| | | |
| Brazil | | | | | | | | | |
Alpargatas SA | | | (371,105 | ) | | | (551,323 | ) | | | 0.4 | |
Petroleo Brasileiro SA | | | (109,605 | ) | | | (520,798 | ) | | | 0.3 | |
| | | | | | | | | | | | |
| | | |
| Rights | | | | | | | | | |
| | | |
| Brazil | | | | | | | | | |
Localiza Rent a Car SA | | | (941 | ) | | | (3,238 | ) | | | 0.0 | |
| | | | | | | | | | | | |
| | |
Net Value of Reference Entity — JPMorgan Chase Bank N.A. | | | $ | (158,202,630 | ) | | | | |
| | | | | | | | | | | | |
Balances Reported in the Consolidated Statement of Assets and Liabilities for Centrally Cleared Swaps, OTC Swaps and Options Written
| | | | | | | | | | | | | | | | | | | | |
| | | | | | |
| Description | | Swap Premiums Paid | | | Swap Premiums Received | | | Unrealized Appreciation | | | Unrealized Depreciation | | | Value | |
Centrally Cleared Swaps(a) | | $ | 1,013,453 | | | $ | (12,996,930 | ) | | $ | 200,251,438 | | | $ | (204,713,483 | ) | | $ | — | |
OTC Swaps | | | 1,570,952 | | | | (139,527 | ) | | | 4,833,767 | | | | (14,132,148 | ) | | | — | |
Options Written | | | N/A | | | | N/A | | | | 31,460,515 | | | | (35,641,125 | ) | | | (79,874,033 | ) |
| | (a) | Includes cumulative appreciation (depreciation) on centrally cleared swaps, as reported in the Consolidated Schedule of Investments. Only current day’s variation margin is reported within the Consolidated Statement of Assets and Liabilities and is net of any previously paid (received) swap premium amounts. | |
Derivative Financial Instruments Categorized by Risk Exposure
As of period end, the fair values of derivative financial instruments located in the Consolidated Statement of Assets and Liabilities were as follows:
| | | | | | | | | | | | | | | | | | | | | | | | | | | | |
| | | | | | | | |
| | | Commodity
Contracts | | | Credit
Contracts | | | Equity
Contracts | | | Foreign
Currency
Exchange
Contracts | | | Interest Rate Contracts | | | Other
Contracts | | | Total | |
Assets — Derivative Financial Instruments | | | | | | | | | | | | | | | | | | | | | | | | | | | | |
Futures contracts | | | | | | | | | | | | | | | | | | | | | | | | | | | | |
Unrealized appreciation on futures contracts(a) | | $ | — | | | $ | — | | | $ | 3,037,388 | | | $ | — | | | $ | 64,066,461 | | | $ | — | | | $ | 67,103,849 | |
Forward foreign currency exchange contracts | | | | | | | | | | | | | | | | | | | | | | | | | | | | |
Unrealized appreciation on forward foreign currency exchange contracts | | | — | | | | — | | | | — | | | | 54,579,915 | | | | — | | | | — | | | | 54,579,915 | |
Options purchased | | | | | | | | | | | | | | | | | | | | | | | | | | | | |
Investments at value — unaffiliated(b) | | | — | | | | 329,153 | | | | 43,101,380 | | | | 1,120,598 | | | | 36,352,768 | | | | 49,971 | | | | 80,953,870 | |
Swaps — centrally cleared | | | | | | | | | | | | | | | | | | | | | | | | | | | | |
Unrealized appreciation on centrally cleared swaps(a) | | | — | | | | 5,671,622 | | | | — | | | | — | | | | 194,579,816 | | | | — | | | | 200,251,438 | |
Swaps — OTC | | | | | | | | | | | | | | | | | | | | | | | | | | | | |
Unrealized appreciation on OTC swaps; Swap premiums paid | | | — | | | | 1,848,330 | | | | 687,243 | | | | — | | | | 3,869,146 | | | | — | | | | 6,404,719 | |
| | | | | | | | | | | | | | | | | | | | | | | | | | | | |
| | | | | | | |
| | $ | — | | | $ | 7,849,105 | | | $ | 46,826,011 | | | $ | 55,700,513 | | | $ | 298,868,191 | | | $ | 49,971 | | | $ | 409,293,791 | |
| | | | | | | | | | | | | | | | | | | | | | | | | | | | |
Liabilities — Derivative Financial Instruments | | | | | | | | | | | | | | | | | | | | | | | | | | | | |
Futures contracts | | | | | | | | | | | | | | | | | | | | | | | | | | | | |
Unrealized depreciation on futures contracts(a) | | $ | — | | | $ | — | | | $ | 29,955,162 | | | $ | — | | | $ | 56,835,066 | | | $ | — | | | $ | 86,790,228 | |
Forward foreign currency exchange contracts | | | | | | | | | | | | | | | | | | | | | | | | | | | | |
Unrealized depreciation on forward foreign currency exchange contracts | | | — | | | | — | | | | — | | | | 78,491,395 | | | | — | | | | — | | | | 78,491,395 | |
| | |
CONSOLIDATED SCHEDULE OF INVESTMENTS | | 53 |
| | |
Consolidated Schedule of Investments (continued) April 30, 2023 | | BlackRock Global Allocation Fund, Inc. |
Derivative Financial Instruments Categorized by Risk Exposure (continued)
| | | | | | | | | | | | | | | | | | | | | | | | | | | | |
| | | | | | | | |
| | | Commodity Contracts | | | Credit Contracts | | | Equity Contracts | | | Foreign Currency Exchange Contracts | | | Interest Rate Contracts | | | Other Contracts | | | Total | |
Options written | | | | | | | | | | | | | | | | | | | | | | | | | | | | |
Options written at value | | $ | — | | | $ | 84,568 | | | $ | 17,479,123 | | | $ | 4,717,021 | | | $ | 57,593,321 | | | $ | — | | | $ | 79,874,033 | |
Swaps — centrally cleared | | | | | | | | | | | | | | | | | | | | | | | | | | | | |
Unrealized depreciation on centrally cleared swaps(a) | | | — | | | | 1,279,043 | | | | — | | | | — | | | | 203,246,655 | | | | 187,785 | | | | 204,713,483 | |
Swaps — OTC | | | | | | | | | | | | | | | | | | | | | | | | | | | | |
Unrealized depreciation on OTC swaps; Swap premiums received | | | — | | | | 680,156 | | | | 3,519,614 | | | | — | | | | 10,071,905 | | | | — | | | | 14,271,675 | |
| | | | | | | | | | | | | | | | | | | | | | | | | | | | |
| | $ | — | | | $ | 2,043,767 | | | $ | 50,953,899 | | | $ | 83,208,416 | | | $ | 327,746,947 | | | $ | 187,785 | | | $ | 464,140,814 | |
| | | | | | | | | | | | | | | | | | | | | | | | | | | | |
| | (a) | Net cumulative unrealized appreciation (depreciation) on futures contracts and centrally cleared swaps, if any, are reported in the Consolidated Schedule of Investments. In the Consolidated Statement of Assets and Liabilities, only current day’s variation margin is reported in receivables or payables and the net cumulative unrealized appreciation (depreciation) is included in accumulated earnings (loss). | |
| | (b) | Includes options purchased at value as reported in the Consolidated Schedule of Investments. | |
For the period ended April 30, 2023, the effect of derivative financial instruments in the Consolidated Statement of Operations was as follows:
| | | | | | | | | | | | | | | | | | | | | | | | | | | | |
| | | | | | | | |
| | | Commodity
Contracts | | | Credit
Contracts | | | Equity
Contracts | | | Foreign
Currency
Exchange
Contracts | | | Interest Rate
Contracts | | | Other
Contracts | | | Total | |
Net Realized Gain (Loss) from: | | | | | | | | | | | | | | | | | | | | | | | | | | | | |
Futures contracts | | $ | (5,349,417 | ) | | $ | — | | | $ | 33,553,289 | | | $ | — | | | $ | (113,294,144 | ) | | $ | — | | | $ | (85,090,272 | ) |
Forward foreign currency exchange contracts | | | — | | | | — | | | | — | | | | (206,956,675 | ) | | | — | | | | — | | | | (206,956,675 | ) |
Options purchased(a) | | | — | | | | (1,187,747 | ) | | | (155,200,703 | ) | | | 8,878,407 | | | | (16,220,487 | ) | | | (1,269,260 | ) | | | (164,999,790 | ) |
Options written | | | — | | | | 646,168 | | | | 154,801,878 | | | | 2,816,220 | | | | 7,537,726 | | | | — | | | | 165,801,992 | |
Swaps | | | — | | | | (15,953,085 | ) | | | 9,295,274 | | | | — | | | | 37,400,063 | | | | (2 | ) | | | 30,742,250 | |
| | | | | | | | | | | | | | | | | | | | | | | | | | | | |
| | | | | | | |
| | $ | (5,349,417 | ) | | $ | (16,494,664 | ) | | $ | 42,449,738 | | | $ | (195,262,048 | ) | | $ | (84,576,842 | ) | | $ | (1,269,262 | ) | | $ | (260,502,495 | ) |
| | | | | | | | | | | | | | | | | | | | | | | | | | | | |
Net Change in Unrealized Appreciation (Depreciation) on: | | | | | | | | | | | | | | | | | | | | | | | | | | | | |
Futures contracts | | $ | 771,723 | | | $ | — | | | $ | (65,220,998 | ) | | $ | — | | | $ | (102,756,999 | ) | | $ | — | | | $ | (167,206,274 | ) |
Forward foreign currency exchange contracts | | | — | | | | — | | | | — | | | | 151,138,203 | | | | — | | | | — | | | | 151,138,203 | |
Options purchased(b) | | | — | | | | (401,998 | ) | | | (3,232,607 | ) | | | (15,059,714 | ) | | | 19,852,429 | | | | (2,035,959 | ) | | | (877,849 | ) |
Options written | | | — | | | | 79,318 | | | | 34,259,147 | | | | 5,579,746 | | | | 13,477,032 | | | | — | | | | 53,395,243 | |
Swaps | | | — | | | | 196,362 | | | | (13,359,453 | ) | | | — | | | | (32,192,081 | ) | | | (187,785 | ) | | | (45,542,957 | ) |
| | | | | | | | | | | | | | | | | | | | | | | | | | | | |
| | | | | | | |
| | $ | 771,723 | | | $ | (126,318 | ) | | $ | (47,553,911 | ) | | $ | 141,658,235 | | | $ | (101,619,619 | ) | | $ | (2,223,744 | ) | | $ | (9,093,634 | ) |
| | | | | | | | | | | | | | | | | | | | | | | | | | | | |
| | (a) | Options purchased are included in net realized gain (loss) from investments — unaffiliated. | |
| | (b) | Options purchased are included in net change in unrealized appreciation (depreciation) on investments — unaffiliated. | |
Average Quarterly Balances of Outstanding Derivative Financial Instruments
| | | | |
| | |
Futures contracts: | | | | |
Average notional value of contracts — long | | $ | 3,991,286,254 | |
Average notional value of contracts — short | | $ | 4,166,308,780 | |
Forward foreign currency exchange contracts: | | | | |
Average amounts purchased — in USD | | $ | 2,319,425,791 | |
Average amounts sold — in USD | | $ | 3,910,800,695 | |
Options: | | | | |
Average value of option contracts purchased | | $ | 61,575,673 | |
Average value of option contracts written | | $ | 40,723,469 | |
Average notional value of swaption contracts purchased | | $ | 3,505,295,632 | |
Average notional value of swaption contracts written | | $ | 12,241,071,312 | |
Credit default swaps: | | | | |
Average notional value — buy protection | | $ | 261,700,461 | |
Average notional value — sell protection | | $ | 150,836,703 | |
Interest rate swaps: | | | | |
Average notional value — pays fixed rate | | $ | 3,475,076,122 | |
Average notional value — receives fixed rate | | $ | 6,745,585,747 | |
| | |
| 54 | | 2 0 2 3 BLACK ROCK ANNUAL REPORT TO SHAREHOLDERS |
| | |
Consolidated Schedule of Investments (continued) April 30, 2023 | | BlackRock Global Allocation Fund, Inc. |
Average Quarterly Balances of Outstanding Derivative Financial Instruments (continued)
| | | | |
| | |
Inflation swaps: | | | | |
Average notional value — receives fixed rate | | $ | 11,569,345 | |
Total return swaps: | | | | |
Average notional value | | $ | 46,473,636 | |
For more information about the Fund’s investment risks regarding derivative financial instruments, refer to the Notes to Consolidated Financial Statements.
Derivative Financial Instruments — Offsetting as of Period End
The Fund’s derivative assets and liabilities (by type) were as follows:
| | | | | | | | |
| | | |
| | | Assets | | | Liabilities | |
Derivative Financial Instruments | | | | | | | | |
Futures contracts | | $ | 23,182,661 | | | $ | 29,131,024 | |
Forward foreign currency exchange contracts | | | 54,579,915 | | | | 78,491,395 | |
Options | | | 80,953,870 | (a) | | | 79,874,033 | |
Swaps — centrally cleared | | | 1,845,143 | | | | — | |
Swaps — OTC(b) | | | 6,404,719 | | | | 14,271,675 | |
| | | | | | | | |
| | |
Total derivative assets and liabilities in the Consolidated Statement of Assets and Liabilities | | | 166,966,308 | | | | 201,768,127 | |
| | | | | | | | |
| | |
Derivatives not subject to a Master Netting Agreement or similar agreement (“MNA”) | | | (70,158,068 | ) | | | (47,249,042 | ) |
| | | | | | | | |
| | |
Total derivative assets and liabilities subject to an MNA | | $ | 96,808,240 | | | $ | 154,519,085 | |
| | | | | | | | |
| | (a) | Includes options purchased at value which is included in Investments at value — unaffiliated in the Consolidated Statement of Assets and Liabilities and reported in the Consolidated Schedule of Investments. | |
| | (b) | Includes unrealized appreciation (depreciation) on OTC swaps and swap premiums (paid/received) in the Consolidated Statement of Assets and Liabilities. | |
The following table presents the Fund’s derivative assets and liabilities by counterparty net of amounts available for offset under an MNA and net of the related collateral received (and pledged) by the Fund:
| | | | | | | | | | | | | | | | | | | | |
| | | | | | |
Counterparty | |
| Derivative
Assets Subject to an MNA by Counterparty |
| |
| Derivatives
Available for Offset |
(a) | |
| Non-Cash
Collateral Received |
| |
| Cash
Collateral Received |
(b) | |
| Net Amount
of Derivative Assets |
(c)(d) |
Bank of America N.A. | | $ | 2,416,084 | | | $ | (2,416,084 | ) | | $ | — | | | $ | — | | | $ | — | |
Barclays Bank PLC | | | 5,724,844 | | | | (2,805,781 | ) | | | — | | | | — | | | | 2,919,063 | |
BNP Paribas SA | | | 1,036,037 | | | | (1,036,037 | ) | | | — | | | | — | | | | — | |
Citibank N.A. | | | 9,318,668 | | | | (9,318,668 | ) | | | — | | | | — | | | | — | |
Deutsche Bank AG | | | 4,047,171 | | | | (2,508,221 | ) | | | — | | | | (470,000 | ) | | | 1,068,950 | |
Goldman Sachs & Co. LLC | | | 618,890 | | | | (163,006 | ) | | | — | | | | — | | | | 455,884 | |
Goldman Sachs International | | | 32,616,023 | | | | (32,616,023 | ) | | | — | | | | — | | | | — | |
HSBC Bank PLC | | | 5,028,895 | | | | (5,028,895 | ) | | | — | | | | — | | | | — | |
JPMorgan Chase Bank N.A. | | | 11,898,958 | | | | (11,898,958 | ) | | | — | | | | — | | | | — | |
Morgan Stanley & Co. International PLC | | | 2,057,341 | | | | (2,057,341 | ) | | | — | | | | — | | | | — | |
UBS AG | | | 22,045,329 | | | | (400,152 | ) | | | — | | | | — | | | | 21,645,177 | |
| | | | | | | | | | | | | | | | | | | | |
| | | | | |
| | $ | 96,808,240 | | | $ | (70,249,166 | ) | | $ | — | | | $ | (470,000 | ) | | $ | 26,089,074 | |
| | | | | | | | | | | | | | | | | | | | |
| | | | | | | | | | | | | | | | | | | | |
| | | | | | |
Counterparty | |
| Derivative
Liabilities Subject to an MNA by Counterparty |
| |
| Derivatives
Available for Offset |
(a) | |
| Non-Cash
Collateral Pledged |
(e) | |
| Cash
Collateral Pledged |
| |
| Net Amount
of Derivative Liabilities |
(c)(f) |
Bank of America N.A. | | $ | 3,430,917 | | | $ | (2,416,084 | ) | | $ | (444,469 | ) | | $ | — | | | $ | 570,364 | |
Barclays Bank PLC | | | 2,805,781 | | | | (2,805,781 | ) | | | — | | | | — | | | | — | |
BNP Paribas SA | | | 1,164,952 | | | | (1,036,037 | ) | | | (128,915 | ) | | | — | | | | — | |
Citibank N.A. | | | 16,658,594 | | | | (9,318,668 | ) | | | (7,339,926 | ) | | | — | | | | — | |
Deutsche Bank AG | | | 2,508,221 | | | | (2,508,221 | ) | | | — | | | | — | | | | — | |
Goldman Sachs & Co. LLC | | | 163,006 | | | | (163,006 | ) | | | — | | | | — | | | | — | |
Goldman Sachs International | | | 40,279,561 | | | | (32,616,023 | ) | | | (7,663,538 | ) | | | — | | | | — | |
HSBC Bank PLC | | | 25,482,856 | | | | (5,028,895 | ) | | | — | | | | — | | | | 20,453,961 | |
JPMorgan Chase Bank N.A. | | | 54,553,288 | | | | (11,898,958 | ) | | | (13,466,736 | ) | | | — | | | | 29,187,594 | |
| | |
CONSOLIDATED SCHEDULE OF INVESTMENTS | | 55 |
| | |
Consolidated Schedule of Investments (continued) April 30, 2023 | | BlackRock Global Allocation Fund, Inc. |
| | | | | | | | | | | | | | | | | | | | |
| | | | | | |
Counterparty | |
| Derivative
Liabilities Subject to an MNA by Counterparty |
| |
| Derivatives
Available for Offset |
(a) | |
| Non-Cash
Collateral Pledged |
(e) | |
| Cash
Collateral Pledged |
| |
| Net Amount
of Derivative Liabilities |
(c)(f) |
Morgan Stanley & Co. International PLC | | $ | 7,071,757 | | | $ | (2,057,341 | ) | | $ | (4,332,571 | ) | | $ | — | | | $ | 681,845 | |
UBS AG | | | 400,152 | | | | (400,152 | ) | | | — | | | | — | | | | — | |
| | | | | | | | | | | | | | | | | | | | |
| | | | | |
| | $ | 154,519,085 | | | $ | (70,249,166 | ) | | $ | (33,376,155 | ) | | $ | — | | | $ | 50,893,764 | |
| | | | | | | | | | | | | | | | | | | | |
| | (a) | The amount of derivatives available for offset is limited to the amount of derivative asset and/or liabilities that are subject to an MNA. | |
| | (b) | Excess of collateral received/pledged, if any, from the individual counterparty is not shown for financial reporting purposes. | |
| | (c) | Net amount may also include forward foreign currency exchange contracts that are not required to be collateralized. | |
| | (d) | Net amount represents the net amount receivable from the counterparty in the event of default. | |
| | (e) | Excess of collateral received/pledged, if any, from the individual counterparty is not shown for financial reporting purposes. | |
| | (f) | Net amount represents the net amount payable due to counterparty in the event of default. Net amount may be offset further by the options written receivable/payable on the Consolidated Statement of Assets and Liabilities. | |
Fair Value Hierarchy as of Period End
Various inputs are used in determining the fair value of financial instruments. For a description of the input levels and information about the Fund’s policy regarding valuation of financial instruments, refer to the Notes to Consolidated Financial Statements.
The following table summarizes the Fund’s financial instruments categorized in the fair value hierarchy. The breakdown of the Fund’s financial instruments into major categories is disclosed in the Consolidated Schedule of Investments above.
| | | | | | | | | | | | | | | | |
| | | | | |
| | | Level 1 | | | Level 2 | | | Level 3 | | | Total | |
Assets | | | | | | | | | | | | | | | | |
Investments | | | | | | | | | | | | | | | | |
Long-Term Investments | | | | | | | | | | | | | | | | |
Asset-Backed Securities | | $ | — | | | $ | 190,877,483 | | | $ | 23,518,416 | | | $ | 214,395,899 | |
Common Stocks | | | | | | | | | | | | | | | | |
Australia | | | — | | | | 69,337,019 | | | | 289 | | | | 69,337,308 | |
Belgium | | | — | | | | 3,157,285 | | | | — | | | | 3,157,285 | |
Brazil | | | 18,013,832 | | | | — | | | | — | | | | 18,013,832 | |
Canada | | | 261,891,495 | | | | — | | | | — | | | | 261,891,495 | |
Cayman Islands | | | 1,106,264 | | | | — | | | | 3,533,613 | | | | 4,639,877 | |
China | | | 4,549,352 | | | | 219,032,717 | | | | — | | | | 223,582,069 | |
Denmark | | | — | | | | 41,295,966 | | | | — | | | | 41,295,966 | |
Finland | | | — | | | | 4,478,235 | | | | — | | | | 4,478,235 | |
France | | | — | | | | 598,429,744 | | | | — | | | | 598,429,744 | |
Germany | | | 8,781,999 | | | | 421,729,496 | | | | — | | | | 430,511,495 | |
Hong Kong | | | — | | | | 61,909,072 | | | | — | | | | 61,909,072 | |
India | | | — | | | | 7,078,251 | | | | 9,724,462 | | | | 16,802,713 | |
Ireland | | | 14,885,188 | | | | 9,485,733 | | | | — | | | | 24,370,921 | |
Israel | | | 48,813,269 | | | | — | | | | — | | | | 48,813,269 | |
Italy | | | — | | | | 66,992,270 | | | | — | | | | 66,992,270 | |
Japan | | | — | | | | 375,223,993 | | | | — | | | | 375,223,993 | |
Jordan | | | — | | | | 743,854 | | | | — | | | | 743,854 | |
Mexico | | | 17,500,390 | | | | — | | | | — | | | | 17,500,390 | |
Netherlands | | | 46,524,791 | | | | 370,002,627 | | | | — | | | | 416,527,418 | |
Norway | | | — | | | | 8,563,541 | | | | — | | | | 8,563,541 | |
Peru | | | 2,616,369 | | | | — | | | | — | | | | 2,616,369 | |
Poland | | | — | | | | 823,933 | | | | — | | | | 823,933 | |
Saudi Arabia | | | — | | | | 2,113,232 | | | | — | | | | 2,113,232 | |
Singapore | | | — | | | | 11,527,755 | | | | — | | | | 11,527,755 | |
South Africa | | | — | | | | 5,803,247 | | | | — | | | | 5,803,247 | |
South Korea | | | — | | | | 33,102,343 | | | | — | | | | 33,102,343 | |
Spain | | | — | | | | 105,361,851 | | | | — | | | | 105,361,851 | |
Sweden | | | — | | | | 42,645,932 | | | | — | | | | 42,645,932 | |
Switzerland | | | 45,966,577 | | | | 293,952,862 | | | | — | | | | 339,919,439 | |
Taiwan | | | — | | | | 78,937,187 | | | | — | | | | 78,937,187 | |
United Arab Emirates | | | — | | | | — | | | | 14 | | | | 14 | |
United Kingdom | | | 30,812,179 | | | | 445,080,685 | | | | — | | | | 475,892,864 | |
United States | | | 6,035,429,703 | | | | 53,351,600 | | | | 95,422,199 | | | | 6,184,203,502 | |
| | |
| 56 | | 2 0 2 3 BLACK ROCK ANNUAL REPORT TO SHAREHOLDERS |
| | |
Consolidated Schedule of Investments (continued) April 30, 2023 | | BlackRock Global Allocation Fund, Inc. |
Fair Value Hierarchy as of Period End (continued)
| | | | | | | | | | | | | | | | |
| | | | | |
| | | Level 1 | | | Level 2 | | | Level 3 | | | Total | |
Corporate Bonds | | $ | — | | | $ | 1,449,738,798 | | | $ | 355,755,393 | | | $ | 1,805,494,191 | |
Floating Rate Loan Interests | | | — | | | | 349,081,463 | | | | 323,229,958 | | | | 672,311,421 | |
Foreign Government and Agency Obligations | | | — | | | | 1,324,045,039 | | | | — | | | | 1,324,045,039 | |
Investment Companies | | | 433,952,079 | | | | — | | | | — | | | | 433,952,079 | |
Non-Agency Mortgage-Backed Securities | | | — | | | | 609,975,824 | | | | 33,404,992 | | | | 643,380,816 | |
Other Interests | | | — | | | | — | | | | 23,671,478 | | | | 23,671,478 | |
Preferred Securities | | | | | | | | | | | | | | | | |
Capital Trusts | | | — | | | | 5,172,784 | | | | — | | | | 5,172,784 | |
Preferred Stocks | | | | | | | | | | | | | | | | |
Germany | | | — | | | | 26,127,837 | | | | 27,247,683 | | | | 53,375,520 | |
United States | | | 26,134,055 | | | | 39,931,598 | | | | 290,242,162 | | | | 356,307,815 | |
Brazil | | | — | | | | — | | | | 20,999,926 | | | | 20,999,926 | |
India | | | — | | | | — | | | | 6,880,227 | | | | 6,880,227 | |
Israel | | | — | | | | — | | | | 24,432,839 | | | | 24,432,839 | |
United Kingdom | | | — | | | | — | | | | 8,584,765 | | | | 8,584,765 | |
China | | | — | | | | — | | | | 52,900,498 | | | | 52,900,498 | |
Sweden | | | — | | | | — | | | | 3,278,914 | | | | 3,278,914 | |
Finland | | | — | | | | — | | | | 6,929,288 | | | | 6,929,288 | |
Trust Preferreds | | | 25,178,104 | | | | — | | | | — | | | | 25,178,104 | |
U.S. Government Sponsored Agency Securities | | | — | | | | 1,157,641,086 | | | | — | | | | 1,157,641,086 | |
U.S. Treasury Obligations | | | — | | | | 821,389,537 | | | | — | | | | 821,389,537 | |
Warrants | | | | | | | | | | | | | | | | |
Cayman Islands | | | 66,973 | | | | — | | | | — | | | | 66,973 | |
Israel | | | 4,753 | | | | — | | | | 652,754 | | | | 657,507 | |
Switzerland | | | 5,988 | | | | — | | | | — | | | | 5,988 | |
United Kingdom | | | 344 | | | | — | | | | — | | | | 344 | |
United States | | | 224,380 | | | | 25,500,825 | | | | 1,598,575 | | | | 27,323,780 | |
Short-Term Securities | | | | | | | | | | | | | | | | |
Certificates of Deposit | | | — | | | | 29,465,379 | | | | — | | | | 29,465,379 | |
Commercial Paper | | | — | | | | 199,146,184 | | | | — | | | | 199,146,184 | |
Money Market Funds | | | 1,395,015,218 | | | | — | | | | — | | | | 1,395,015,218 | |
Time Deposits | | | — | | | | 26,537,704 | | | | — | | | | 26,537,704 | |
Options Purchased | | | | | | | | | | | | | | | | |
Credit Contracts | | | — | | | | 329,153 | | | | — | | | | 329,153 | |
Equity Contracts | | | 42,720,045 | | | | 381,335 | | | | — | | | | 43,101,380 | |
Foreign Currency Exchange Contracts | | | — | | | | 1,120,598 | | | | — | | | | 1,120,598 | |
Interest Rate Contracts | | | 2,410,219 | | | | 33,942,549 | | | | — | | | | 36,352,768 | |
Other Contracts | | | — | | | | 12,844 | | | | 37,127 | | | | 49,971 | |
Liabilities | | | | | | | | | | | | | | | | |
Investments | | | | | | | | | | | | | | | | |
Investments Sold Short | | | | | | | | | | | | | | | | |
Common Stocks | | | | | | | | | | | | | | | | |
France | | | — | | | | (7,236,327 | ) | | | — | | | | (7,236,327 | ) |
United Kingdom | | | — | | | | (2,791,933 | ) | | | — | | | | (2,791,933 | ) |
United States | | | (7,914,439 | ) | | | — | | | | — | | | | (7,914,439 | ) |
Unfunded Floating Rate Loan Interests(a) | | | — | | | | — | | | | (180,511 | ) | | | (180,511 | ) |
| | | | | | | | | | | | | | | | |
| | | | |
| | $ | 8,454,689,127 | | | $ | 9,610,550,190 | | | $ | 1,311,865,061 | | | | 19,377,104,378 | |
| | | | | | | | | | | | | | | | |
| | | | |
Investments Valued at NAV(b) | | | | | | | | | | | | | | | 241,650,605 | |
| | | | | | | | | | | | | | | | |
| | | | |
| | | | | | | | | | | | | | $ | 19,618,754,983 | |
| | | | | | | | | | | | | | | | |
Derivative Financial Instruments(c) | | | | | | | | | | | | | | | | |
Assets | | | | | | | | | | | | | | | | |
Credit Contracts | | $ | — | | | $ | 5,949,000 | | | $ | — | | | $ | 5,949,000 | |
Equity Contracts | | | 3,037,388 | | | | 687,243 | | | | — | | | | 3,724,631 | |
Foreign Currency Exchange Contracts | | | — | | | | 54,579,915 | | | | — | | | | 54,579,915 | |
Interest Rate Contracts | | | 64,066,461 | | | | 198,448,962 | | | | — | | | | 262,515,423 | |
Liabilities | | | | | | | | | | | | | | | | |
Credit Contracts | | | — | | | | (1,920,749 | ) | | | — | | | | (1,920,749 | ) |
Equity Contracts | | | (45,817,519 | ) | | | (5,119,871 | ) | | | — | | | | (50,937,390 | ) |
Foreign Currency Exchange Contracts | | | — | | | | (83,208,416 | ) | | | — | | | | (83,208,416 | ) |
| | |
CONSOLIDATED SCHEDULE OF INVESTMENTS | | 57 |
| | |
Consolidated Schedule of Investments (continued) April 30, 2023 | | BlackRock Global Allocation Fund, Inc. |
Fair Value Hierarchy as of Period End (continued)
| | | | | | | | | | | | | | | | |
| | | | | |
| | | Level 1 | | | Level 2 | | | Level 3 | | | Total | |
Derivative Financial Instruments(c) | | | | | | | | | | | | | | | | |
Interest Rate Contracts | | $ | (57,964,710 | ) | | $ | (269,782,237 | ) | | $ | — | | | $ | (327,746,947 | ) |
Other Contracts | | | — | | | | (187,785 | ) | | | — | | | | (187,785 | ) |
| | | | | | | | | | | | | | | | |
| | | | |
| | $ | (36,678,380 | ) | | $ | (100,553,938 | ) | | $ | — | | | $ | (137,232,318 | ) |
| | | | | | | | | | | | | | | | |
| | (a) | Unfunded floating rate loan interests are valued at the unrealized appreciation (depreciation) on the commitment. | |
| | (b) | Certain investments of the Fund were fair valued using NAV as a practical expedient as no quoted market value is available and therefore have been excluded from the fair value hierarchy. | |
| | (c) | Derivative financial instruments are swaps, futures contracts, forward foreign currency exchange contracts and options written. Swaps, futures contracts and forward foreign currency exchange contracts are valued at the unrealized appreciation (depreciation) on the instrument and options written are shown at value. | |
A reconciliation of Level 3 financial instruments is presented when the Fund had a significant amount of Level 3 investments and derivative financial instruments at the beginning and/or end of the year in relation to net assets. The following table is a reconciliation of Level 3 investments for which significant unobservable inputs were used in determining fair value:
| | | | | | | | | | | | | | | | | | | | | | | | | | | | |
| |
| | | | | | | |
| | | Asset-Backed Securities | | | Common Stocks | | | Corporate Bonds | | | Floating Rate Loan Interests | | | Non-Agency Mortgage-Backed Securities | | | Options Purchased | | | Other Interests | |
| |
Assets/Liabilities | | | | | | | | | | | | | | | | | | | | | | | | | | | | |
Opening balance, as of April 30, 2022 | | $ | 25,242,775 | | | $ | 148,923,964 | | | $ | 361,125,370 | | | $ | 415,107,251 | | | $ | 80,994,599 | | | $ | — | | | $ | 27,182,620 | |
Transfers into Level 3 | | | — | | | | — | | | | — | | | | — | | | | — | | | | — | | | | — | |
Transfers out of Level 3 | | | — | | | | (302,896 | ) | | | — | | | | (17,444,095 | ) | | | (43,509,060 | ) | | | — | | | | — | |
Other(a) | | | — | | | | — | | | | 26,992,803 | | | | (26,992,803 | ) | | | — | | | | — | | | | — | |
Accrued discounts/premiums | | | — | | | | — | | | | 147,164 | | | | 532,871 | | | | 200,818 | | | | — | | | | — | |
Net realized gain (loss) | | | — | | | | — | | | | (41,590,813 | ) | | | (850,165 | ) | | | — | | | | — | | | | — | |
Net change in unrealized appreciation
(depreciation)(b)(c) | | | (1,724,359 | ) | | | (39,940,491 | ) | | | (48,774,163 | ) | | | (3,115,342 | ) | | | (4,281,365 | ) | | | (1,529,559 | ) | | | (3,511,142 | ) |
Purchases | | | — | | | | — | | | | 80,659,807 | | | | 103,718,268 | | | | — | | | | 1,566,686 | | | | — | |
Sales | | | — | | | | — | | | | (22,804,775 | ) | | | (147,726,027 | ) | | | — | | | | — | | | | — | |
| | | | | | | | | | | | | | | | | | | | | | | | | | | | |
| | | | | | | |
Closing balance, as of April 30, 2023 | | $ | 23,518,416 | | | $ | 108,680,577 | | | $ | 355,755,393 | | | $ | 323,229,958 | | | $ | 33,404,992 | | | $ | 37,127 | | | $ | 23,671,478 | |
| | | | | | | | | | | | | | | | | | | | | | | | | | | | |
| | | | | | | |
Net change in unrealized appreciation (depreciation) on investments still held at April 30, 2023(c) | | $ | (1,724,359 | ) | | $ | (39,940,491 | ) | | $ | (89,488,357 | ) | | $ | (3,498,197 | ) | | $ | (4,281,365 | ) | | $ | (1,529,559 | ) | | $ | (3,511,142 | ) |
| | | | | | | | | | | | | | | | | | | | | | | | | | | | |
| | | | | | | | | | | | | | | | | | | | | | | | |
| |
| | | | | | |
| | | Preferred Stocks | | | U.S. Government Sponsored Agency Securities | | | Unfunded Floating Rate Loan Interests | | | Unfunded SPAC PIPE Commitments | | | Warrants | | | Total | |
| |
Assets/Liabilities | | | | | | | | | | | | | | | | | | | | | | | | |
Opening balance, as of April 30, 2022 | | $ | 516,568,839 | | | $ | 2,062,614 | | | $ | (73,694 | ) | | $ | — | | | $ | 263,058 | | | $ | 1,577,397,396 | |
Transfers into Level 3 | | | — | | | | — | | | | — | | | | — | | | | 97,679 | | | | 97,679 | |
Transfers out of Level 3 | | | — | | | | (2,062,614 | ) | | | — | | | | — | | | | — | | | | (63,318,665 | ) |
Other | | | — | | | | — | | | | — | | | | — | | | | — | | | | — | |
Accrued discounts/premiums | | | — | | | | — | | | | — | | | | — | | | | — | | | | 880,853 | |
Net realized gain (loss) | | | 252,883 | | | | — | | | | — | | | | — | | | | — | | | | (42,188,095 | ) |
Net change in unrealized appreciation (depreciation)(b)(c) | | | (111,243,738 | ) | | | — | | | | (106,817 | ) | | | — | | | | 1,890,592 | | | | (212,336,384 | ) |
Purchases | | | 36,582,543 | | | | — | | | | — | | | | — | | | | — | | | | 222,527,304 | |
Sales | | | (664,225 | ) | | | — | | | | — | | | | — | | | | — | | | | (171,195,027 | ) |
| | | | | | | | | | | | | | | | | | | | | | | | |
| | | | | | |
Closing balance, as of April 30, 2023 | | $ | 441,496,302 | | | $ | — | | | $ | (180,511 | ) | | $ | — | | | $ | 2,251,329 | | | $ | 1,311,865,061 | |
| | | | | | | | | | | | | | | | | | | | | | | | |
| | | | | | |
Net change in unrealized appreciation (depreciation) on investments still held at April 30, 2023(c) | | $ | (111,243,738 | ) | | $ | — | | | $ | (142,875 | ) | | $ | — | | | $ | 1,890,592 | | | $ | (253,469,491 | ) |
| | | | | | | | | | | | | | | | | | | | | | | | |
| | (a) | Certain Level 3 investments were re-classified between Corporate Bonds and Floating Rate Loan Interests. | |
| | (b) | Included in the related net change in unrealized appreciation (depreciation) in the Consolidated Statement of Operations. | |
| | (c) | Any difference between net change in unrealized appreciation (depreciation) and net change in unrealized appreciation (depreciation) on investments still held at April 30, 2023 is generally due to investments no longer held or categorized as Level 3 at period end. | |
The following table summarizes the valuation approaches used and unobservable inputs utilized by the BlackRock Valuation Committee (the “Valuation Committee”) to determine the value of certain of the Fund’s Level 3 financial instruments as of period end. The table does not include Level 3 financial instruments with values based upon
| | |
| 58 | | 2 0 2 3 BLACK ROCK ANNUAL REPORT TO SHAREHOLDERS |
| | |
Consolidated Schedule of Investments (continued) April 30, 2023 | | BlackRock Global Allocation Fund, Inc. |
unadjusted third-party pricing information in the amount of $61,803,997. A significant change in third party information could result in a significantly lower or higher value of such Level 3 financial instruments.
| | | | | | | | | | | | | | | | | | |
| | | | | | |
| | | | Value | | |
| Valuation
Approach |
| | Unobservable Inputs | |
| Range of
Unobservable Inputs Utilized |
(a) | |
| Weighted
Average of Unobservable Inputs Based on Fair Value |
|
Assets | | | | | | | | | | | | | | | | | | |
Common Stocks | | $ | 108,680,259 | | | | Market | | | Revenue Multiple | | | 2.00x - 14.00x | | | | 4.23x | |
| | | | | | | | | | Time to Exit | | | 1.1 - 1.8 years | | | | 1.5 years | |
| | | | | | | | | | Volatility | | | 34% - 68% | | | | 43% | |
| | | | | | | | | | Gross Profit Multiple | | | 18.25x | | | | — | |
| | | | | | | Income | | | Discount Rate | | | 16% | | | | — | |
| | | | | |
Asset Backed Securities | | | 23,518,416 | | | | Income | | | Discount Rate | | | 8% | | | | — | |
| | | | | |
Corporate Bonds(b) | | | 332,989,614 | | | | Income | | | Discount Rate | | | 8% - 35% | | | | 15% | |
| | | | | |
Floating Rate Loan Interests(c) | | | 317,487,622 | | | | Income | | | Discount Rate | | | 5% - 14% | | | | 10% | |
| | | | | | | | | | Credit Spread | | | 273 - 715 | | | | 395 | |
| | | | | |
Other Interests | | | 23,671,478 | | | | Income | | | Discount Rate | | | 8% - 10% | | | | 9% | |
| | | | | |
Preferred Stocks | | | 441,496,293 | | | | Income | | | Discount Rate | | | 13% - 14% | | | | 13% | |
| | | | | | | Market | | | Revenue Multiple | | | 0.17x - 28.00x | | | | 12.22x | |
| | | | | | | | | | EBITDAR Multiple | | | 6.75x | | | | — | |
| | | | | | | | | | Time to Exit | | | 1.5 - 5.0 years | | | | 2.5 years | |
| | | | | | | | | | Volatility | | | 34% - 80% | | | | 56% | |
| | | | | | | | | | Gross Profit Multiple | | | 5.76x - 32.00x | | | | 20.99x | |
| | | | | | | | | | Market Adjustment Multiple | | | 0.95x | | | | — | |
| | | | | | | | | | Acquisition Multiple | | | 0.85x | | | | — | |
| | | | | |
Warrants | | | 2,217,382 | | | | Market | | | Revenue Multiple | | | 9.50x - 27.98x | | | | 17.03x | |
| | | | | | | | | | Time to Exit | | | 0.2 - 4.5 years | | | | 4.3 years | |
| | | | | | | | | | Volatility | | | 49% - 65% | | | | 63% | |
| | | | | | | Income | | | Discount Rate | | | 13% -35% | | | | 20% | |
| | | | | | | | | | | | | | | | | | |
| | | | | |
| | $ | 1,250,061,064 | | | | | | | | | | | | | | | |
| | | | | | | | | | | | | | | | | | |
| | (a) | A significant change in unobservable input would have resulted in a correlated (inverse) significant change to value. | |
| | (b) | For the period ended April 30, 2023, the valuation technique for certain investments classified as Corporate Bonds used recent offer prices as inputs within the model used for the approximation of fair value. | |
| | (c) | For the period ended April 30, 2023, the valuation technique for investments classified as Floating Rate Loan Interests amounting to $6,533,239 changed to Discount Cash Flow approach. The investments were previously valued utilizing a prior recent transaction. The change was due to consideration of the information that was available at the time the investments were valued. | |
See notes to financial statements.
| | |
CONSOLIDATED SCHEDULE OF INVESTMENTS | | 59 |
Consolidated Statement of Assets and Liabilities
April 30, 2023
| | | | |
| | | BlackRock Global Allocation Fund, Inc. | |
| |
| |
ASSETS | | | | |
Investments, at value — unaffiliated(a)(b) | | $ | 17,773,689,482 | |
Investments, at value — affiliated(c) | | | 1,863,188,711 | |
Cash held for investments sold short | | | 21,498,691 | |
Cash pledged: | | | | |
Futures contracts | | | 119,438,000 | |
Centrally cleared swaps | | | 112,148,000 | |
Foreign currency, at value(d) | | | 16,756,002 | |
Receivables: | | | | |
Investments sold | | | 66,523,713 | |
Options written | | | 154,100 | |
Securities lending income — affiliated | | | 66,009 | |
Swaps | | | 7,321,767 | |
Capital shares sold | | | 10,301,097 | |
Dividends — unaffiliated | | | 19,540,798 | |
Dividends — affiliated | | | 5,155,480 | |
Interest — unaffiliated | | | 65,421,020 | |
Due from broker | | | 10,105,117 | |
Principal paydowns | | | 6,750 | |
Variation margin on futures contracts | | | 23,182,661 | |
Variation margin on centrally cleared swaps | | | 1,845,143 | |
Swap premiums paid | | | 1,570,952 | |
Unrealized appreciation on: | | | | |
Forward foreign currency exchange contracts | | | 54,579,915 | |
OTC swaps | | | 4,833,767 | |
Prepaid expenses | | | 240,558 | |
| | | | |
| |
Total assets | | | 20,177,567,733 | |
| | | | |
| |
LIABILITIES | | | | |
Investments sold short, at value(e) | | | 17,942,699 | |
Bank overdraft | | | 12,454,441 | |
Cash received: | | | | |
Collateral — OTC derivatives | | | 1,700,000 | |
Collateral — TBA commitments | | | 58,000 | |
Collateral on securities loaned | | | 218,607,146 | |
Options written, at value(f) | | | 79,874,033 | |
Payables: | | | | |
Investments purchased | | | 1,367,516,573 | |
Swaps | | | 14,692,445 | |
Accounting services fees | | | 358,948 | |
Capital gains distributions | | | 45 | |
Capital shares redeemed | | | 23,803,035 | |
Custodian fees | | | 960,874 | |
Deferred foreign capital gain tax | | | 108,094 | |
Dividends on short sales | | | 112,101 | |
Income dividend distributions | | | 70 | |
Investment advisory fees | | | 21,650,482 | |
Directors’ and Officer’s fees | | | 13,039 | |
Options written | | | 539,160 | |
Other accrued expenses | | | 213,268 | |
Professional fees | | | 657,901 | |
Service and distribution fees | | | 2,423,033 | |
Transfer agent fees | | | 2,770,702 | |
Variation margin on futures contracts | | | 29,131,024 | |
Swap premiums received | | | 139,527 | |
Unrealized depreciation on: | | | | |
Forward foreign currency exchange contracts | | | 78,491,395 | |
OTC swaps | | | 14,132,148 | |
Unfunded floating rate loan interests | | | 180,511 | |
| | | | |
| |
Total liabilities | | | 1,888,530,694 | |
| | | | |
| |
NET ASSETS | | $ | 18,289,037,039 | |
| | | | |
| | |
| 60 | | 2 0 2 3 BLACK ROCK ANNUAL REPORT TO SHAREHOLDERS |
Consolidated Statement of Assets and Liabilities (continued)
April 30, 2023
| | | | |
| | | BlackRock Global Allocation Fund, Inc. | |
| |
| |
NET ASSETS CONSIST OF | | | | |
Paid-in capital | | $ | 17,287,492,705 | |
Accumulated earnings | | | 1,001,544,334 | |
| | | | |
| |
NET ASSETS | | $ | 18,289,037,039 | |
| | | | |
| |
(a) Investments, at cost — unaffiliated | | $ | 15,639,469,439 | |
(b) Securities loaned, at value | | $ | 215,119,914 | |
(c) Investments, at cost — affiliated | | $ | 2,105,904,947 | |
(d) Foreign currency, at cost | | $ | 17,315,791 | |
(e) Proceeds received from investments sold short | | $ | 14,810,863 | |
(f) Premiums received | | $ | 75,693,423 | |
| | |
CONSOLIDATED FINANCIAL STATEMENTS | | 61 |
Consolidated Statement of Assets and Liabilities (continued)
April 30, 2023
| | | | |
| | | BlackRock Global Allocation Fund, Inc. | |
| |
| |
NET ASSET VALUE | | | | |
| |
| Institutional | | | |
Net assets | | $ | 7,134,879,891 | |
| | | | |
| |
Shares outstanding | | | 409,734,793 | |
| | | | |
| |
Net asset value | | $ | 17.41 | |
| | | | |
| |
Shares authorized | | | 2 billion | |
| | | | |
| |
Par value | | $ | 0.10 | |
| | | | |
| |
| Investor A | | | |
Net assets | | $ | 9,083,078,033 | |
| | | | |
| |
Shares outstanding | | | 527,349,227 | |
| | | | |
| |
Net asset value | | $ | 17.22 | |
| | | | |
| |
Shares authorized | | | 2 billion | |
| | | | |
| |
Par value | | $ | 0.10 | |
| | | | |
| |
| Investor C | | | |
Net assets | | $ | 517,944,512 | |
| | | | |
| |
Shares outstanding | | | 34,746,238 | |
| | | | |
| |
Net asset value | | $ | 14.91 | |
| | | | |
| |
Shares authorized | | | 2 billion | |
| | | | |
| |
Par value | | $ | 0.10 | |
| | | | |
| |
| Class K | | | |
Net assets | | $ | 1,248,514,784 | |
| | | | |
| |
Shares outstanding | | | 71,689,609 | |
| | | | |
| |
Net asset value | | $ | 17.42 | |
| | | | |
| |
Shares authorized | | | 2 billion | |
| | | | |
| |
Par value | | $ | 0.10 | |
| | | | |
| |
| Class R | | | |
Net assets | | $ | 304,619,819 | |
| | | | |
| |
Shares outstanding | | | 18,986,009 | |
| | | | |
| |
Net asset value | | $ | 16.04 | |
| | | | |
| |
Shares authorized | | | 2 billion | |
| | | | |
| |
Par value | | $ | 0.10 | |
| | | | |
See notes to consolidated financial statements.
| | |
| 62 | | 2 0 2 3 BLACK ROCK ANNUAL REPORT TO SHAREHOLDERS |
Consolidated Statement of Operations
Year Ended April 30, 2023
| | | | |
| | | BlackRock Global Allocation Fund, Inc. | |
| |
| |
INVESTMENT INCOME | | | | |
Dividends — unaffiliated | | $ | 221,725,575 | |
Dividends — affiliated | | | 38,144,523 | |
Interest — unaffiliated | | | 299,317,167 | |
Securities lending income — affiliated — net | | | 2,361,697 | |
Other income — unaffiliated | | | 7,438,712 | |
Foreign taxes withheld | | | (11,728,074 | ) |
Foreign withholding tax claims | | | 7,473,105 | |
| | | | |
| |
Total investment income | | | 564,732,705 | |
| | | | |
| |
EXPENSES | | | | |
Investment advisory | | | 145,325,731 | |
Service and distribution — class specific | | | 31,507,716 | |
Transfer agent — class specific | | | 16,178,095 | |
Professional | | | 1,825,155 | |
Custodian | | | 1,507,967 | |
Accounting services | | | 1,456,443 | |
Registration | | | 339,296 | |
Directors and Officer | | | 179,783 | |
Printing and postage | | | 163,733 | |
Miscellaneous | | | 826,498 | |
| | | | |
| |
Total expenses excluding dividend expense | | | 199,310,417 | |
Dividends expense — unaffiliated | | | 313,618 | |
| | | | |
Total expenses | | | 199,624,035 | |
Less: | | | | |
Fees waived and/or reimbursed by the Manager | | | (8,334,641 | ) |
| | | | |
| |
Total expenses after fees waived and/or reimbursed | | | 191,289,394 | |
| | | | |
| |
Net investment income | | | 373,443,311 | |
| | | | |
| |
REALIZED AND UNREALIZED GAIN (LOSS) | | | | |
Net realized gain (loss) from: | | | | |
Investments — unaffiliated(a) | | | (88,725,827 | ) |
Investments — affiliated | | | (29,493,965 | ) |
Forward foreign currency exchange contracts | | | (206,956,675 | ) |
Foreign currency transactions | | | 22,863,935 | |
Futures contracts | | | (85,090,272 | ) |
Options written | | | 165,801,992 | |
Short sales — unaffiliated | | | 1,060,187 | |
Swaps | | | 30,742,250 | |
| | | | |
| |
| | | (189,798,375 | ) |
| | | | |
Net change in unrealized appreciation (depreciation) on: | | | | |
Investments — unaffiliated(b) | | | (278,943,820 | ) |
Investments — affiliated | | | (83,327,371 | ) |
Forward foreign currency exchange contracts | | | 151,138,203 | |
Foreign currency translations | | | (2,824,215 | ) |
Futures contracts | | | (167,206,274 | ) |
Options written | | | 53,395,243 | |
Short sales — unaffiliated | | | (1,851,687 | ) |
Swaps | | | (45,542,957 | ) |
Unfunded floating rate loan interests | | | (106,817 | ) |
| | | | |
| |
| | | (375,269,695 | ) |
| | | | |
| |
Net realized and unrealized loss | | | (565,068,070 | ) |
| | | | |
| |
NET DECREASE IN NET ASSETS RESULTING FROM OPERATIONS | | $ | (191,624,759 | ) |
| | | | |
| |
(a) Net of foreign capital gain tax and capital gain tax refund, if applicable of | | $ | (26,130 | ) |
(b) Net of reduction in deferred foreign capital gain tax of | | $ | 2,649,944 | |
See notes to consolidated financial statements.
| | |
CONSOLIDATED FINANCIAL STATEMENTS | | 63 |
Consolidated Statements of Changes in Net Assets
| | | | | | | | |
| | | BlackRock Global Allocation Fund, Inc. | |
| | |
| | | Year Ended 04/30/23 | | | Year Ended 04/30/22 | |
| |
| | |
INCREASE (DECREASE) IN NET ASSETS | | | | | | | | |
| | |
OPERATIONS | | | | | | | | |
Net investment income | | $ | 373,443,311 | | | $ | 278,264,475 | |
Net realized gain (loss) | | | (189,798,375 | ) | | | 1,495,191,769 | |
Net change in unrealized appreciation (depreciation) | | | (375,269,695 | ) | | | (4,454,303,117 | ) |
| | | | | | | | |
| | |
Net decrease in net assets resulting from operations | | | (191,624,759 | ) | | | (2,680,846,873 | ) |
| | | | | | | | |
| | |
DISTRIBUTIONS TO SHAREHOLDERS(a) | | | | | | | | |
Institutional | | | (450,892,290 | ) | | | (980,540,274 | ) |
Investor A | | | (553,935,121 | ) | | | (1,242,711,893 | ) |
Investor C | | | (41,577,309 | ) | | | (107,675,473 | ) |
Class K | | | (77,509,183 | ) | | | (177,923,588 | ) |
Class R | | | (17,982,109 | ) | | | (39,866,949 | ) |
| | | | | | | | |
| | |
Decrease in net assets resulting from distributions to shareholders | | | (1,141,896,012 | ) | | | (2,548,718,177 | ) |
| | | | | | | | |
| | |
CAPITAL SHARE TRANSACTIONS | | | | | | | | |
Net increase (decrease) in net assets derived from capital share transactions | | | (2,352,293,221 | ) | | | 141,980,707 | |
| | | | | | | | |
| | |
NET ASSETS | | | | | | | | |
Total decrease in net assets | | | (3,685,813,992 | ) | | | (5,087,584,343 | ) |
Beginning of year | | | 21,974,851,031 | | | | 27,062,435,374 | |
| | | | | | | | |
| | |
End of year | | $ | 18,289,037,039 | | | $ | 21,974,851,031 | |
| | | | | | | | |
| (a) | Distributions for annual periods determined in accordance with U.S. federal income tax regulations. |
See notes to consolidated financial statements.
| | |
| 64 | | 2 0 2 3 BLACK ROCK ANNUAL REPORT TO SHAREHOLDERS |
Consolidated Financial Highlights
(For a share outstanding throughout each period)
| | | | | | | | | | | | | | | | | | | | | | | | | | |
| | | BlackRock Global Allocation Fund, Inc. | |
| | Institutional | |
| | | | | | | |
| | | | | Year Ended 04/30/23 | | | Year Ended
04/30/22 | | | Period from
11/01/20
to 04/30/21 | | | Year Ended
10/31/20 | | | Year Ended
10/31/19 | | | Year Ended
10/31/18 | |
| | | | | | | |
Net asset value, beginning of period | | $ | 18.50 | | | $ | 22.84 | | | $ | 19.93 | | | $ | 19.36 | | | $ | 18.81 | | | $ | 20.39 | |
| | | | | | | | | | | | | | | | | | | | | | | | | | |
Net investment income(a) | | | 0.36 | | | | 0.27 | | | | 0.11 | | | | 0.17 | | | | 0.30 | | | | 0.28 | |
Net realized and unrealized gain (loss) | | | (0.45 | ) | | | (2.45 | ) | | | 3.82 | | | | 1.75 | | | | 1.45 | | | | (0.84 | ) |
| | | | | | | | | | | | | | | | | | | | | | | | | | |
Net increase (decrease) from investment operations | | | (0.09 | ) | | | (2.18 | ) | | | 3.93 | | | | 1.92 | | | | 1.75 | | | | (0.56 | ) |
| | | | | | | | | | | | | | | | | | | | | | | | | | |
| | | | | | |
Distributions(b) | | | | | | | | | | | | | | | | | | | | | | | | |
From net investment income | | | (0.00 | )(c) | | | (0.27 | ) | | | (0.14 | ) | | | (0.12 | ) | | | (0.22 | ) | | | (0.32 | ) |
From net realized gain | | | (1.00 | ) | | | (1.89 | ) | | | (0.88 | ) | | | (1.23 | ) | | | (0.98 | ) | | | (0.70 | ) |
| | | | | | | | | | | | | | | | | | | | | | | | | | |
Total distributions | | | (1.00 | ) | | | (2.16 | ) | | | (1.02 | ) | | | (1.35 | ) | | | (1.20 | ) | | | (1.02 | ) |
| | | | | | | | | | | | | | | | | | | | | | | | | | |
| | | | | | |
Net asset value, end of period | | $ | 17.41 | | | $ | 18.50 | | | $ | 22.84 | | | $ | 19.93 | | | $ | 19.36 | | | $ | 18.81 | |
| | | | | | | | | | | | | | | | | | | | | | | | | | |
| | | | | | |
Total Return(d) | | | | | | | | | | | | | | | | | | | | | | | | |
Based on net asset value | | | (0.12 | )% | | | (10.58 | )% | | | 20.07 | %(e) | | | 10.23 | %(f) | | | 9.96 | % | | | (2.94 | )% |
| | | | | | | | | | | | | | | | | | | | | | | | | | |
| | | | | | |
Ratios to Average Net Assets(g) | | | | | | | | | | | | | | | | | | | | | | | | |
Total expenses | | | 0.87 | % | | | 0.88 | % | | | 0.86 | %(h) | | | 0.86 | % | | | 0.85 | % | | | 0.87 | % |
| | | | | | | | | | | | | | | | | | | | | | | | | | |
Total expenses after fees waived and/or reimbursed | | | 0.83 | % | | | 0.83 | % | | | 0.80 | %(h) | | | 0.81 | % | | | 0.80 | % | | | 0.80 | % |
| | | | | | | | | | | | | | | | | | | | | | | | | | |
Total expenses after fees waived and/or reimbursed and excluding dividend expense and professional fees for foreign withholding tax claims | | | 0.82 | % | | | 0.81 | % | | | 0.80 | %(h) | | | 0.81 | % | | | 0.80 | % | | | 0.79 | % |
| | | | | | | | | | | | | | | | | | | | | | | | | | |
Net investment income | | | 2.09 | % | | | 1.25 | % | | | 1.04 | %(h) | | | 0.91 | % | | | 1.59 | % | | | 1.43 | % |
| | | | | | | | | | | | | | | | | | | | | | | | | | |
| | | | | | |
Supplemental Data | | | | | | | | | | | | | | | | | | | | | | | | |
Net assets, end of period (000) | | $ | 7,134,880 | | | $ | 8,836,844 | | | $ | 9,749,544 | | | $ | 7,907,317 | | | $ | 8,617,256 | | | $ | 12,963,106 | |
| | | | | | | | | | | | | | | | | | | | | | | | | | |
Portfolio turnover rate(i) | | | 174 | % | | | 124 | % | | | 58 | % | | | 193 | % | | | 156 | % | | | 154 | % |
| | | | | | | | | | | | | | | | | | | | | | | | | | |
|
(a) Based on average shares outstanding. (b) Distributions for annual periods determined in accordance with U.S. federal income tax regulations. (c) Amount is greater than $(0.005) per share. (d) Where applicable, assumes the reinvestment of distributions. (e) Not annualized. (f) Includes payment from an affiliate, which had no impact on the Fund’s total return. (g) Excludes fees and expenses incurred indirectly as a result of investments in underlying funds. (h) Annualized. (i) Includes mortgage dollar roll transactions (“MDRs”). Additional information regarding portfolio turnover rate is as follows: | |
| | | | | | | |
| | | | | Year Ended 04/30/23 | | | Year Ended 04/30/22 | | | Period from 11/01/20 to 04/30/21 | | | Year Ended 10/31/20 | | | Year Ended 10/31/19 | | | Year Ended 10/31/18 | |
| | | | | | | |
| | Portfolio turnover rate (excluding MDRs) | | | 139 | % | | | 112 | % | | | 58 | % | | | 193 | % | | | 156 | % | | | 154 | % |
| | | | | | | | | | | | | | | | | | | | | | | | | | |
See notes to consolidated financial statements.
| | |
CONSOLIDATED FINANCIAL HIGHLIGHTS | | 65 |
Consolidated Financial Highlights (continued)
(For a share outstanding throughout each period)
| | | | | | | | | | | | | | | | | | | | | | | | | | |
| | | BlackRock Global Allocation Fund, Inc. (continued) | |
| | Investor A | |
| | | | | | | |
| | | | | Year Ended 04/30/23 | | | Year Ended
04/30/22 | | | Period from
11/01/20
to 04/30/21 | | | Year Ended
10/31/20 | | | Year Ended
10/31/19 | | | Year Ended
10/31/18 | |
| | | | | | | |
Net asset value, beginning of period | | $ | 18.34 | | | $ | 22.65 | | | $ | 19.75 | | | $ | 19.23 | | | $ | 18.68 | | | $ | 20.26 | |
| | | | | | | | | | | | | | | | | | | | | | | | | | |
Net investment income(a) | | | 0.31 | | | | 0.21 | | | | 0.08 | | | | 0.12 | | | | 0.24 | | | | 0.23 | |
Net realized and unrealized gain (loss) | | | (0.45 | ) | | | (2.42 | ) | | | 3.80 | | | | 1.72 | | | | 1.46 | | | | (0.85 | ) |
| | | | | | | | | | | | | | | | | | | | | | | | | | |
Net increase (decrease) from investment operations | | | (0.14 | ) | | | (2.21 | ) | | | 3.88 | | | | 1.84 | | | | 1.70 | | | | (0.62 | ) |
| | | | | | | | | | | | | | | | | | | | | | | | | | |
| | | | | | |
Distributions(b) | | | | | | | | | | | | | | | | | | | | | | | | |
From net investment income | | | (0.00 | )(c) | | | (0.21 | ) | | | (0.10 | ) | | | (0.09 | ) | | | (0.17 | ) | | | (0.26 | ) |
From net realized gain | | | (0.98 | ) | | | (1.89 | ) | | | (0.88 | ) | | | (1.23 | ) | | | (0.98 | ) | | | (0.70 | ) |
| | | | | | | | | | | | | | | | | | | | | | | | | | |
Total distributions | | | (0.98 | ) | | | (2.10 | ) | | | (0.98 | ) | | | (1.32 | ) | | | (1.15 | ) | | | (0.96 | ) |
| | | | | | | | | | | | | | | | | | | | | | | | | | |
| | | | | | |
Net asset value, end of period | | $ | 17.22 | | | $ | 18.34 | | | $ | 22.65 | | | $ | 19.75 | | | $ | 19.23 | | | $ | 18.68 | |
| | | | | | | | | | | | | | | | | | | | | | | | | | |
| | | | | | |
Total Return(d) | | | | | | | | | | | | | | | | | | | | | | | | |
Based on net asset value | | | (0.39 | )% | | | (10.78 | )% | | | 19.95 | %(e) | | | 9.87 | %(f) | | | 9.71 | % | | | (3.24 | )% |
| | | | | | | | | | | | | | | | | | | | | | | | | | |
| | | | | | |
Ratios to Average Net Assets(g) | | | | | | | | | | | | | | | | | | | | | | | | |
Total expenses | | | 1.12 | % | | | 1.13 | % | | | 1.12 | %(h) | | | 1.13 | % | | | 1.13 | % | | | 1.14 | % |
| | | | | | | | | | | | | | | | | | | | | | | | | | |
Total expenses after fees waived and/or reimbursed | | | 1.08 | % | | | 1.08 | % | | | 1.06 | %(h) | | | 1.08 | % | | | 1.08 | % | | | 1.07 | % |
| | | | | | | | | | | | | | | | | | | | | | | | | | |
Total expenses after fees waived and/or reimbursed and excluding dividend expense and professional fees for foreign withholding tax claims | | | 1.07 | % | | | 1.06 | % | | | 1.05 | %(h) | | | 1.08 | % | | | 1.08 | % | | | 1.07 | % |
| | | | | | | | | | | | | | | | | | | | | | | | | | |
Net investment income | | | 1.84 | % | | | 0.98 | % | | | 0.78 | %(h) | | | 0.63 | % | | | 1.29 | % | | | 1.14 | % |
| | | | | | | | | | | | | | | | | | | | | | | | | | |
| | | | | | |
Supplemental Data | | | | | | | | | | | | | | | | | | | | | | | | |
Net assets, end of period (000) | | $ | 9,083,078 | | | $ | 10,557,693 | | | $ | 13,806,271 | | | $ | 11,184,639 | | | $ | 10,601,653 | | | $ | 10,547,464 | |
| | | | | | | | | | | | | | | | | | | | | | | | | | |
Portfolio turnover rate(i) | | | 174 | % | | | 124 | % | | | 58 | % | | | 193 | % | | | 156 | % | | | 154 | % |
| | | | | | | | | | | | | | | | | | | | | | | | | | |
|
(a) Based on average shares outstanding. (b) Distributions for annual periods determined in accordance with U.S. federal income tax regulations. (c) Amount is greater than $(0.005) per share. (d) Where applicable, excludes the effects of any sales charges and assumes the reinvestment of distributions. (e) Not annualized. (f) Includes payment from an affiliate, which had no impact on the Fund’s total return. (g) Excludes fees and expenses incurred indirectly as a result of investments in underlying funds. (h) Annualized. (i) Includes mortgage dollar roll transactions (“MDRs”). Additional information regarding portfolio turnover rate is as follows: | |
| | | | | | | |
| | | | | Year Ended 04/30/23 | | | Year Ended 04/30/22 | | | Period from 11/01/20 to 04/30/21 | | | Year Ended 10/31/20 | | | Year Ended 10/31/19 | | | Year Ended 10/31/18 | |
| | | | | | | |
| | Portfolio turnover rate (excluding MDRs) | | | 139 | % | | | 112 | % | | | 58 | % | | | 193 | % | | | 156 | % | | | 154 | % |
| | | | | | | | | | | | | | | | | | | | | | | | | | |
See notes to consolidated financial statements.
| | |
| 66 | | 2 0 2 3 BLACK ROCK ANNUAL REPORT TO SHAREHOLDERS |
Consolidated Financial Highlights (continued)
(For a share outstanding throughout each period)
| | | | | | | | | | | | | | | | | | | | | | | | | | |
| | | BlackRock Global Allocation Fund, Inc. (continued) | |
| | Investor C | |
| | | | | | | |
| | | | | Year Ended
04/30/23 | | | Year Ended
04/30/22 | | | Period from
11/01/20 to
04/30/21 | | | Year Ended
10/31/20 | | | Year Ended
10/31/19 | | | Year Ended
10/31/18 | |
| | | | | | | |
Net asset value, beginning of period | | $ | 16.08 | | | $ | 20.11 | | | $ | 17.43 | | | $ | 17.17 | | | $ | 16.82 | | | $ | 18.33 | |
| | | | | | | | | | | | | | | | | | | | | | | | | | |
Net investment income (loss)(a) | | | 0.15 | | | | 0.04 | | | | (0.00 | )(b) | | | (0.02 | ) | | | 0.09 | | | | 0.07 | |
Net realized and unrealized gain (loss) | | | (0.39 | ) | | | (2.13 | ) | | | 3.36 | | | | 1.53 | | | | 1.30 | | | | (0.76 | ) |
| | | | | | | | | | | | | | | | | | | | | | | | | | |
Net increase (decrease) from investment operations | | | (0.24 | ) | | | (2.09 | ) | | | 3.36 | | | | 1.51 | | | | 1.39 | | | | (0.69 | ) |
| | | | | | | | | | | | | | | | | | | | | | | | | | |
| | | | | | |
Distributions(c) | | | | | | | | | | | | | | | | | | | | | | | | |
From net investment income | | | (0.00 | )(b) | | | (0.05 | ) | | | (0.00 | )(b) | | | (0.02 | ) | | | (0.06 | ) | | | (0.12 | ) |
From net realized gain | | | (0.93 | ) | | | (1.89 | ) | | | (0.68 | ) | | | (1.23 | ) | | | (0.98 | ) | | | (0.70 | ) |
| | | | | | | | | | | | | | | | | | | | | | | | | | |
Total distributions | | | (0.93 | ) | | | (1.94 | ) | | | (0.68 | ) | | | (1.25 | ) | | | (1.04 | ) | | | (0.82 | ) |
| | | | | | | | | | | | | | | | | | | | | | | | | | |
| | | | | | |
Net asset value, end of period | | $ | 14.91 | | | $ | 16.08 | | | $ | 20.11 | | | $ | 17.43 | | | $ | 17.17 | | | $ | 16.82 | |
| | | | | | | | | | | | | | | | | | | | | | | | | | |
| | | | | | |
Total Return(d) | | | | | | | | | | | | | | | | | | | | | | | | |
Based on net asset value | | | (1.12 | )% | | | (11.50 | )% | | | 19.50 | %(e) | | | 9.06 | %(f) | | | 8.88 | % | | | (3.95 | )% |
| | | | | | | | | | | | | | | | | | | | | | | | | | |
| | | | | | |
Ratios to Average Net Assets(g) | | | | | | | | | | | | | | | | | | | | | | | | |
Total expenses | | | 1.91 | % | | | 1.90 | % | | | 1.90 | %(h) | | | 1.89 | % | | | 1.88 | % | | | 1.88 | % |
| | | | | | | | | | | | | | | | | | | | | | | | | | |
Total expenses after fees waived and/or reimbursed | | | 1.87 | % | | | 1.85 | % | | | 1.84 | %(h) | | | 1.85 | % | | | 1.83 | % | | | 1.81 | % |
| | | | | | | | | | | | | | | | | | | | | | | | | | |
Total expenses after fees waived and/or reimbursed and excluding dividend expense and professional fees for foreign withholding tax claims | | | 1.86 | % | | | 1.84 | % | | | 1.83 | %(h) | | | 1.84 | % | | | 1.82 | % | | | 1.81 | % |
| | | | | | | | | | | | | | | | | | | | | | | | | | |
Net investment income (loss) | | | 1.05 | % | | | 0.21 | % | | | (0.01 | )%(h) | | | (0.13 | )% | | | 0.56 | % | | | 0.38 | % |
| | | | | | | | | | | | | | | | | | | | | | | | | | |
| | | | | | |
Supplemental Data | | | | | | | | | | | | | | | | | | | | | | | | |
Net assets, end of period (000) | | $ | 517,945 | | | $ | 780,451 | | | $ | 1,213,559 | | | $ | 1,547,011 | | | $ | 3,143,501 | | | $ | 5,402,163 | |
| | | | | | | | | | | | | | | | | | | | | | | | | | |
Portfolio turnover rate(i) | | | 174 | % | | | 124 | % | | | 58 | % | | | 193 | % | | | 156 | % | | | 154 | % |
| | | | | | | | | | | | | | | | | | | | | | | | | | |
|
(a) Based on average shares outstanding. (b) Amount is greater than $(0.005) per share. (c) Distributions for annual periods determined in accordance with U.S. federal income tax regulations. (d) Where applicable, excludes the effects of any sales charges and assumes the reinvestment of distributions. (e) Not annualized. (f) Includes payment from an affiliate, which had no impact on the Fund’s total return. (g) Excludes fees and expenses incurred indirectly as a result of investments in underlying funds. (h) Annualized. (i) Includes mortgage dollar roll transactions (“MDRs”). Additional information regarding portfolio turnover rate is as follows: | |
| | | | | | | |
| | | | | Year Ended 04/30/23 | | | Year Ended 04/30/22 | | | Period from 11/01/20 to 04/30/21 | | | Year Ended 10/31/20 | | | Year Ended 10/31/19 | | | Year Ended 10/31/18 | |
| | | | | | | |
| | Portfolio turnover rate (excluding MDRs) | | | 139 | % | | | 112 | % | | | 58 | % | | | 193 | % | | | 156 | % | | | 154 | % |
| | | | | | | | | | | | | | | | | | | | | | | | | | |
See notes to consolidated financial statements.
| | |
CONSOLIDATED FINANCIAL HIGHLIGHTS | | 67 |
Consolidated Financial Highlights (continued)
(For a share outstanding throughout each period)
| | | | | | | | | | | | | | | | | | | | | | | | | | |
| | | BlackRock Global Allocation Fund, Inc. (continued) | |
| | Class K | |
| | | | | | | |
| | | | | Year Ended 04/30/23 | | | Year Ended
04/30/22 | | | Period from
11/01/20
to 04/30/21 | | | Year Ended
10/31/20 | | | Year Ended
10/31/19 | | | Year Ended
10/31/18 | |
| | | | | | | |
Net asset value, beginning of period | | $ | 18.50 | | | $ | 22.84 | | | $ | 19.93 | | | $ | 19.36 | | | $ | 18.80 | | | $ | 20.39 | |
| | | | | | | | | | | | | | | | | | | | | | | | | | |
Net investment income(a) | | | 0.37 | | | | 0.28 | | | | 0.12 | | | | 0.19 | | | | 0.31 | | | | 0.30 | |
Net realized and unrealized gain (loss) | | | (0.44 | ) | | | (2.44 | ) | | | 3.83 | | | | 1.73 | | | | 1.46 | | | | (0.85 | ) |
| | | | | | | | | | | | | | | | | | | | | | | | | | |
Net increase (decrease) from investment operations | | | (0.07 | ) | | | (2.16 | ) | | | 3.95 | | | | 1.92 | | | | 1.77 | | | | (0.55 | ) |
| | | | | | | | | | | | | | | | | | | | | | | | | | |
| | | | | | |
Distributions(b) | | | | | | | | | | | | | | | | | | | | | | | | |
From net investment income | | | (0.00 | )(c) | | | (0.29 | ) | | | (0.16 | ) | | | (0.12 | ) | | | (0.23 | ) | | | (0.34 | ) |
From net realized gain | | | (1.01 | ) | | | (1.89 | ) | | | (0.88 | ) | | | (1.23 | ) | | | (0.98 | ) | | | (0.70 | ) |
| | | | | | | | | | | | | | | | | | | | | | | | | | |
Total distributions | | | (1.01 | ) | | | (2.18 | ) | | | (1.04 | ) | | | (1.35 | ) | | | (1.21 | ) | | | (1.04 | ) |
| | | | | | | | | | | | | | | | | | | | | | | | | | |
| | | | | | |
Net asset value, end of period | | $ | 17.42 | | | $ | 18.50 | | | $ | 22.84 | | | $ | 19.93 | | | $ | 19.36 | | | $ | 18.80 | |
| | | | | | | | | | | | | | | | | | | | | | | | | | |
| | | | | | |
Total Return(d) | | | | | | | | | | | | | | | | | | | | | | | | |
Based on net asset value | | | (0.03 | )% | | | (10.51 | )% | | | 20.16 | %(e) | | | 10.28 | %(f) | | | 10.10 | % | | | (2.91 | )% |
| | | | | | | | | | | | | | | | | | | | | | | | | | |
| | | | | | |
Ratios to Average Net Assets(g) | | | | | | | | | | | | | | | | | | | | | | | | |
Total expenses | | | 0.79 | % | | | 0.80 | % | | | 0.78 | %(h) | | | 0.78 | % | | | 0.78 | % | | | 0.80 | % |
| | | | | | | | | | | | | | | | | | | | | | | | | | |
Total expenses after fees waived and/or reimbursed | | | 0.75 | % | | | 0.75 | % | | | 0.72 | %(h) | | | 0.74 | % | | | 0.73 | % | | | 0.73 | % |
| | | | | | | | | | | | | | | | | | | | | | | | | | |
Total expenses after fees waived and/or reimbursed and excluding dividend expense and professional fees for foreign withholding tax claims | | | 0.74 | % | | | 0.73 | % | | | 0.71 | %(h) | | | 0.73 | % | | | 0.72 | % | | | 0.72 | % |
| | | | | | | | | | | | | | | | | | | | | | | | | | |
Net investment income | | | 2.17 | % | | | 1.31 | % | | | 1.13 | %(h) | | | 0.98 | % | | | 1.67 | % | | | 1.53 | % |
| | | | | | | | | | | | | | | | | | | | | | | | | | |
| | | | | | |
Supplemental Data | | | | | | | | | | | | | | | | | | | | | | | | |
Net assets, end of period (000) | | $ | 1,248,515 | | | $ | 1,470,032 | | | $ | 1,849,652 | | | $ | 1,329,363 | | | $ | 1,146,295 | | | $ | 1,326,617 | |
| | | | | | | | | | | | | | | | | | | | | | | | | | |
Portfolio turnover rate(i) | | | 174 | % | | | 124 | % | | | 58 | % | | | 193 | % | | | 156 | % | | | 154 | % |
| | | | | | | | | | | | | | | | | | | | | | | | | | |
|
(a) Based on average shares outstanding. (b) Distributions for annual periods determined in accordance with U.S. federal income tax regulations. (c) Amount is greater than $(0.005) per share. (d) Where applicable, assumes the reinvestment of distributions. (e) Not annualized. (f) Includes payment from an affiliate, which had no impact on the Fund’s total return. (g) Excludes fees and expenses incurred indirectly as a result of investments in underlying funds. (h) Annualized. (i) Includes mortgage dollar roll transactions (“MDRs”). Additional information regarding portfolio turnover rate is as follows: | |
| | | | | | | |
| | | | | Year Ended 04/30/23 | | | Year Ended 04/30/22 | | | Period from 11/01/20 to 04/30/21 | | | Year Ended 10/31/20 | | | Year Ended 10/31/19 | | | Year Ended 10/31/18 | |
| | | | | | | |
| | Portfolio turnover rate (excluding MDRs) | | | 139 | % | | | 112 | % | | | 58 | % | | | 193 | % | | | 156 | % | | | 154 | % |
| | | | | | | | | | | | | | | | | | | | | | | | | | |
See notes to consolidated financial statements.
| | |
| 68 | | 2 0 2 3 BLACK ROCK ANNUAL REPORT TO SHAREHOLDERS |
Consolidated Financial Highlights (continued)
(For a share outstanding throughout each period)
| | | | | | | | | | | | | | | | | | | | | | | | | | |
| | | BlackRock Global Allocation Fund, Inc. (continued) | |
| | Class R | |
| | | | | | | |
| | | | | Year Ended 04/30/23 | | | Year Ended
04/30/22 | | | Period from
11/01/20
to 04/30/21 | | | Year Ended
10/31/20 | | | Year Ended
10/31/19 | | | Year Ended
10/31/18 | |
| | | | | | | |
Net asset value, beginning of period | | $ | 17.19 | | | $ | 21.37 | | | $ | 18.64 | | | $ | 18.24 | | | $ | 17.77 | | | $ | 19.32 | |
| | | | | | | | | | | | | | | | | | | | | | | | | | |
Net investment income(a) | | | 0.23 | | | | 0.12 | | | | 0.04 | | | | 0.06 | | | | 0.17 | | | | 0.15 | |
Net realized and unrealized gain (loss) | | | (0.42 | ) | | | (2.28 | ) | | | 3.58 | | | | 1.63 | | | | 1.38 | | | | (0.80 | ) |
| | | | | | | | | | | | | | | | | | | | | | | | | | |
Net increase (decrease) from investment operations | | | (0.19 | ) | | | (2.16 | ) | | | 3.62 | | | | 1.69 | | | | 1.55 | | | | (0.65 | ) |
| | | | | | | | | | | | | | | | | | | | | | | | | | |
| | | | | | |
Distributions(b) | | | | | | | | | | | | | | | | | | | | | | | | |
From net investment income | | | (0.00 | )(c) | | | (0.13 | ) | | | (0.01 | ) | | | (0.06 | ) | | | (0.10 | ) | | | (0.20 | ) |
From net realized gain | | | (0.96 | ) | | | (1.89 | ) | | | (0.88 | ) | | | (1.23 | ) | | | (0.98 | ) | | | (0.70 | ) |
| | | | | | | | | | | | | | | | | | | | | | | | | | |
Total distributions | | | (0.96 | ) | | | (2.02 | ) | | | (0.89 | ) | | | (1.29 | ) | | | (1.08 | ) | | | (0.90 | ) |
| | | | | | | | | | | | | | | | | | | | | | | | | | |
| | | | | | |
Net asset value, end of period | | $ | 16.04 | | | $ | 17.19 | | | $ | 21.37 | | | $ | 18.64 | | | $ | 18.24 | | | $ | 17.77 | |
| | | | | | | | | | | | | | | | | | | | | | | | | | |
| | | | | | |
Total Return(d) | | | | | | | | | | | | | | | | | | | | | | | | |
Based on net asset value | | | (0.75 | )% | | | (11.15 | )% | | | 19.74 | %(e) | | | 9.54 | %(f) | | | 9.35 | % | | | (3.56 | )% |
| | | | | | | | | | | | | | | | | | | | | | | | | | |
| | | | | | |
Ratios to Average Net Assets(g) | | | | | | | | | | | | | | | | | | | | | | | | |
Total expenses | | | 1.49 | % | | | 1.50 | % | | | 1.47 | %(h) | | | 1.47 | % | | | 1.46 | % | | | 1.47 | % |
| | | | | | | | | | | | | | | | | | | | | | | | | | |
Total expenses after fees waived and/or reimbursed | | | 1.45 | % | | | 1.46 | % | | | 1.41 | %(h) | | | 1.42 | % | | | 1.41 | % | | | 1.40 | % |
| | | | | | | | | | | | | | | | | | | | | | | | | | |
Total expenses after fees waived and/or reimbursed and excluding dividend expense and professional fees for foreign withholding tax claims | | | 1.44 | % | | | 1.44 | % | | | 1.40 | %(h) | | | 1.41 | % | | | 1.40 | % | | | 1.39 | % |
| | | | | | | | | | | | | | | | | | | | | | | | | | |
Net investment income | | | 1.46 | % | | | 0.62 | % | | | 0.43 | %(h) | | | 0.31 | % | | | 0.98 | % | | | 0.81 | % |
| | | | | | | | | | | | | | | | | | | | | | | | | | |
| | | | | | |
Supplemental Data | | | | | | | | | | | | | | | | | | | | | | | | |
Net assets, end of period (000) | | $ | 304,620 | | | $ | 329,831 | | | $ | 443,409 | | | $ | 405,400 | | | $ | 603,073 | | | $ | 785,653 | |
| | | | | | | | | | | | | | | | | | | | | | | | | | |
Portfolio turnover rate(i) | | | 174 | % | | | 124 | % | | | 58 | % | | | 193 | % | | | 156 | % | | | 154 | % |
| | | | | | | | | | | | | | | | | | | | | | | | | | |
|
(a) Based on average shares outstanding. (b) Distributions for annual periods determined in accordance with U.S. federal income tax regulations. (c) Amount is greater than $(0.005) per share. (d) Where applicable, assumes the reinvestment of distributions. (e) Not annualized. (f) Includes payment from an affiliate, which had no impact on the Fund’s total return. (g) Excludes fees and expenses incurred indirectly as a result of investments in underlying funds. (h) Annualized. (i) Includes mortgage dollar roll transactions (“MDRs”). Additional information regarding portfolio turnover rate is as follows: | |
| | | | | | | |
| | | | | Year Ended 04/30/23 | | | Year Ended 04/30/22 | | | Period from 11/01/20 to 04/30/21 | | | Year Ended 10/31/20 | | | Year Ended 10/31/19 | | | Year Ended 10/31/18 | |
| | | | | | | |
| | Portfolio turnover rate (excluding MDRs) | | | 139 | % | | | 112 | % | | | 58 | % | | | 193 | % | | | 156 | % | | | 154 | % |
| | | | | | | | | | | | | | | | | | | | | | | | | | |
See notes to consolidated financial statements.
| | |
CONSOLIDATED FINANCIAL HIGHLIGHTS | | 69 |
Notes to Consolidated Financial Statements
BlackRock Global Allocation Fund, Inc. (the “Fund”) is registered under the Investment Company Act of 1940, as amended (the “1940 Act”), as an open-end management investment company. The Fund is organized as a Maryland corporation. The Fund is classified as diversified.
The Fund offers multiple classes of shares. All classes of shares have identical voting, dividend, liquidation and other rights and are subject to the same terms and conditions, except that certain classes bear expenses related to the shareholder servicing and distribution of such shares. Institutional and Class K Shares are sold only to certain eligible investors. Investor A, Investor C and Class R Shares bear certain expenses related to shareholder servicing of such shares, and Investor C and Class R Shares also bear certain expenses related to the distribution of such shares. Investor A and Investor C Shares are generally available through financial intermediaries. Class R Shares are sold only to certain employer-sponsored retirement plans. Each class has exclusive voting rights with respect to matters relating to its shareholder servicing and distribution expenditures (except that Investor C shareholders may vote on material changes to the Investor A Shares distribution and service plan).
| | | | | | | | | | |
| | | | |
| Share Class | | Initial Sales Charge | | | CDSC | | | Conversion Privilege |
| | | |
Institutional, Class K and Class R Shares | | | No | | | | No | | | None |
Investor A Shares | | | Yes | | | | No | (a) | | None |
Investor C Shares | | | No | | | | Yes | (b) | | To Investor A Shares after approximately 8 years |
| | (a) | Investor A Shares may be subject to a contingent deferred sales charge (“CDSC”) for certain redemptions where no initial sales charge was paid at the time of purchase. | |
| | (b) | A CDSC of 1.00% is assessed on certain redemptions of Investor C Shares made within one year after purchase. | |
The Fund, together with certain other registered investment companies advised by BlackRock Advisors, LLC (the “Manager”) or its affiliates, is included in a complex of funds referred to as the BlackRock Multi-Asset Complex.
Basis of Consolidation: The accompanying consolidated financial statements of the Fund include the account of BlackRock Cayman Global Allocation Fund I, Ltd. (the “Cayman Subsidiary”), which is a wholly-owned subsidiary of the Fund and primarily invests in commodity-related instruments and other derivatives. The Cayman Subsidiary enables the Fund to hold these commodity-related instruments and satisfy regulated investment company tax requirements. The Fund may invest up to 25% of its total assets in the Cayman Subsidiary. The net assets of the Cayman Subsidiary as of period end were $105,136,877, which is 0.6% of the Fund’s consolidated net assets. Intercompany accounts and transactions, if any, have been eliminated. The Cayman Subsidiary is subject to the same investment policies and restrictions that apply to the Fund, except that the Cayman Subsidiary may invest without limitation in commodity-related instruments.
| 2. | SIGNIFICANT ACCOUNTING POLICIES |
The consolidated financial statements are prepared in conformity with accounting principles generally accepted in the United States of America (“U.S. GAAP”), which may require management to make estimates and assumptions that affect the reported amounts of assets and liabilities in the consolidated financial statements, disclosure of contingent assets and liabilities at the date of the consolidated financial statements and the reported amounts of increases and decreases in net assets from operations during the reporting period. Actual results could differ from those estimates. The Fund is considered an investment company under U.S. GAAP and follows the accounting and reporting guidance applicable to investment companies. Below is a summary of significant accounting policies:
Investment Transactions and Income Recognition: For financial reporting purposes, investment transactions are recorded on the dates the transactions are executed. Realized gains and losses on investment transactions are determined using the specific identification method. Dividend income and capital gain distributions, if any, are recorded on the ex-dividend dates. Non-cash dividends, if any, are recorded on the ex-dividend dates at fair value. Dividends from foreign securities where the ex-dividend dates may have passed are subsequently recorded when the Fund is informed of the ex-dividend dates. Under the applicable foreign tax laws, a withholding tax at various rates may be imposed on capital gains, dividends and interest. Interest income, including amortization and accretion of premiums and discounts on debt securities, is recognized daily on an accrual basis. Income, expenses and realized and unrealized gains and losses are allocated daily to each class based on its relative net assets. For convertible securities, premiums attributable to the debt instrument are amortized, but premiums attributable to the conversion feature are not amortized.
Foreign Currency Translation: The Fund’s books and records are maintained in U.S. dollars. Securities and other assets and liabilities denominated in foreign currencies are translated into U.S. dollars using exchange rates determined as of the close of trading on the New York Stock Exchange (“NYSE”). Purchases and sales of investments are recorded at the rates of exchange prevailing on the respective dates of such transactions. Generally, when the U.S. dollar rises in value against a foreign currency, the investments denominated in that currency will lose value; the opposite effect occurs if the U.S. dollar falls in relative value.
The Fund does not isolate the effect of fluctuations in foreign exchange rates from the effect of fluctuations in the market prices of investments for financial reporting purposes. Accordingly, the effects of changes in exchange rates on investments are not segregated in the Consolidated Statement of Operations from the effects of changes in market prices of those investments, but are included as a component of net realized and unrealized gain (loss) from investments. The Fund reports realized currency gains (losses) on foreign currency related transactions as components of net realized gain (loss) for financial reporting purposes, whereas such components are generally treated as ordinary income for U.S. federal income tax purposes.
Foreign Taxes: The Fund may be subject to foreign taxes (a portion of which may be reclaimable) on income, stock dividends, capital gains on investments, or certain foreign currency transactions. All foreign taxes are recorded in accordance with the applicable foreign tax regulations and rates that exist in the foreign jurisdictions in which the Fund invests. These foreign taxes, if any, are paid by the Fund and are reflected in its Consolidated Statement of Operations as follows: foreign taxes withheld at source are presented as a reduction of income, foreign taxes on securities lending income are presented as a reduction of securities lending income, foreign taxes on stock dividends are presented as “Foreign taxes withheld”, and foreign taxes on capital gains from sales of investments and foreign taxes on foreign currency transactions are included in their respective net realized gain (loss) categories. Foreign taxes payable or deferred as of April 30, 2023, if any, are disclosed in the Consolidated Statement of Assets and Liabilities.
| | |
| 70 | | 2 0 2 3 BLACK ROCK ANNUAL REPORT TO SHAREHOLDERS |
Notes to Consolidated Financial Statements (continued)
The Fund files withholding tax reclaims in certain jurisdictions to recover a portion of amounts previously withheld. The Fund may record a reclaim receivable based on collectability, which includes factors such as the jurisdiction’s applicable laws, payment history and market convention. The Consolidated Statement of Operations includes tax reclaims recorded as well as professional and other fees, if any, associated with recovery of foreign withholding taxes.
Collateralization: If required by an exchange or counterparty agreement, the Fund may be required to deliver/deposit cash and/or securities to/with an exchange, or broker-dealer or custodian as collateral for certain investments.
Distributions: Distributions paid by the Fund are recorded on the ex-dividend dates. Distributions of capital gains are recorded on the ex-dividend dates and made at least annually. The character and timing of distributions are determined in accordance with U.S. federal income tax regulations, which may differ from U.S. GAAP. Net income and realized gains from investments held by the Cayman Subsidiary are treated as ordinary income for tax purposes. If a net loss is realized by the Cayman Subsidiary in any taxable year, the loss will generally not be available to offset the Fund’s ordinary income and/or capital gains for that year.
Indemnifications: In the normal course of business, the Fund enters into contracts that contain a variety of representations that provide general indemnification. The Fund’s maximum exposure under these arrangements is unknown because it involves future potential claims against the Fund, which cannot be predicted with any certainty.
Other: Expenses directly related to the Fund or its classes are charged to the Fund or the applicable class. Expenses directly related to the Fund and other shared expenses prorated to the Fund are allocated daily to each class based on its relative net assets or other appropriate methods. Other operating expenses shared by several funds, including other funds managed by the Manager, are prorated among those funds on the basis of relative net assets or other appropriate methods.
The Fund has an arrangement with its custodian whereby credits are earned on uninvested cash balances, which could be used to reduce custody fees and/or overdraft charges. The Fund may incur charges on overdrafts, subject to certain conditions.
| 3. | INVESTMENT VALUATION AND FAIR VALUE MEASUREMENTS |
Investment Valuation Policies: The Fund’s investments are valued at fair value (also referred to as “market value” within the consolidated financial statements) each day that the Fund is open for business and, for financial reporting purposes, as of the report date. U.S. GAAP defines fair value as the price a fund would receive to sell an asset or pay to transfer a liability in an orderly transaction between market participants at the measurement date. The Board of Directors of the Fund (the “Board”) has approved the designation of the Fund’s Manager as the valuation designee for the Fund. The Fund determines the fair values of its financial instruments using various independent dealers or pricing services under the Manager’s policies. If a security’s market price is not readily available or does not otherwise accurately represent the fair value of the security, the security will be valued in accordance with the Manager’s policies and procedures as reflecting fair value. The Manager has formed a committee (the “Valuation Committee”) to develop pricing policies and procedures and to oversee the pricing function for all financial instruments, with assistance from other BlackRock pricing committees.
Fair Value Inputs and Methodologies: The following methods and inputs are used to establish the fair value of the Fund’s assets and liabilities:
| | • | | Equity investments traded on a recognized securities exchange are valued at that day’s official closing price, as applicable, on the exchange where the stock is primarily traded. Equity investments traded on a recognized exchange for which there were no sales on that day may be valued at the last available bid (long positions) or ask (short positions) price. |
| | • | | Fixed-income investments for which market quotations are readily available are generally valued using the last available bid price or current market quotations provided by independent dealers or third-party pricing services. Floating rate loan interests are valued at the mean of the bid prices from one or more independent brokers or dealers as obtained from a third-party pricing service. Pricing services generally value fixed-income securities assuming orderly transactions of an institutional round lot size, but a fund may hold or transact in such securities in smaller, odd lot sizes. Odd lots may trade at lower prices than institutional round lots. The pricing services may use matrix pricing or valuation models that utilize certain inputs and assumptions to derive values, including transaction data (e.g., recent representative bids and offers), market data, credit quality information, perceived market movements, news, and other relevant information. Certain fixed-income securities, including asset- backed and mortgage related securities may be valued based on valuation models that consider the estimated cash flows of each tranche of the entity, establish a benchmark yield and develop an estimated tranche specific spread to the benchmark yield based on the unique attributes of the tranche. The amortized cost method of valuation may be used with respect to debt obligations with sixty days or less remaining to maturity unless the Manager determines such method does not represent fair value. |
| | • | | Investments in open-end U.S. mutual funds (including money market funds) are valued at that day’s published net asset value (“NAV”). |
| | • | | The Fund values its investment in SL Liquidity Series, LLC, Money Market Series (the “Money Market Series”) at fair value, which is ordinarily based upon its pro rata ownership in the underlying fund’s net assets. |
| | • | | Futures contracts are valued based on that day’s last reported settlement or trade price on the exchange where the contract is traded. |
| | • | | Forward foreign currency exchange contracts are valued at the mean between the bid and ask prices and are determined as of the close of trading on the NYSE based on that day’s prevailing forward exchange rate for the underlying currencies. |
| | • | | Exchange-traded options are valued at the mean between the last bid and ask prices at the close of the options market in which the options trade. An exchange-traded option for which there is no mean price is valued at the last bid (long positions) or ask (short positions) price. If no bid or ask price is available, the prior day’s price will be used, unless it is determined that the prior day’s price no longer reflects the fair value of the option. Over-the-counter (“OTC”) options and options on swaps (“swaptions”) are valued by an independent pricing service using a mathematical model, which incorporates a number of market data factors, such as the trades and prices of the underlying instruments. |
| | |
NOTES TO CONSOLIDATED FINANCIAL STATEMENTS | | 71 |
Notes to Consolidated Financial Statements (continued)
| | • | | Swap agreements are valued utilizing quotes received daily by independent pricing services or through brokers, which are derived using daily swap curves and models that incorporate a number of market data factors, such as discounted cash flows, trades and values of the underlying reference instruments. |
Generally, trading in foreign instruments is substantially completed each day at various times prior to the close of trading on the NYSE. Each business day, the Fund uses current market factors supplied by independent pricing services to value certain foreign instruments (“Systematic Fair Value Price”). The Systematic Fair Value Price is designed to value such foreign securities at fair value as of the close of trading on the NYSE, which follows the close of the local markets.
If events (e.g., market volatility, company announcement or a natural disaster) occur that are expected to materially affect the value of such investment, or in the event that application of these methods of valuation results in a price for an investment that is deemed not to be representative of the market value of such investment, or if a price is not available, the investment will be valued by the Valuation Committee in accordance with the Manager’s policies and procedures as reflecting fair value (“Fair Valued Investments”). The fair valuation approaches that may be used by the Valuation Committee include market approach, income approach and cost approach. Valuation techniques such as discounted cash flow, use of market comparables and matrix pricing are types of valuation approaches and are typically used in determining fair value. When determining the price for Fair Valued Investments, the Valuation Committee seeks to determine the price that the Fund might reasonably expect to receive or pay from the current sale or purchase of that asset or liability in an arm’s-length transaction. Fair value determinations shall be based upon all available factors that the Valuation Committee deems relevant and consistent with the principles of fair value measurement.
For investments in equity or debt issued by privately held companies or funds (“Private Company” or collectively, the “Private Companies”) and other Fair Valued Investments, the fair valuation approaches that are used by the Valuation Committee and third-party pricing services utilized by the Valuation Committee include one or a combination of, but not limited to, the following inputs.
| | | | |
| | | Standard Inputs Generally Considered By The Valuation Committee And Third-Party Pricing Services |
Market approach | | (i) | | recent market transactions, including subsequent rounds of financing, in the underlying investment or comparable issuers; |
| | (ii) | | recapitalizations and other transactions across the capital structure; and |
| | (iii) | | market multiples of comparable issuers. |
Income approach | | (i) | | future cash flows discounted to present and adjusted as appropriate for liquidity, credit, and/or market risks; |
| | (ii) | | quoted prices for similar investments or assets in active markets; and |
| | (iii) | | other risk factors, such as interest rates, yield curves, volatilities, prepayment speeds, loss severities, credit risks, recovery rates, liquidation amounts and/or default rates. |
Cost approach | | (i) | | audited or unaudited financial statements, investor communications and financial or operational metrics issued by the Private Company; |
| | (ii) | | changes in the valuation of relevant indices or publicly traded companies comparable to the Private Company; |
| | (iii) | | relevant news and other public sources; and |
| | | (iv) | | known secondary market transactions in the Private Company’s interests and merger or acquisition activity in companies comparable to the Private Company. |
Investments in series of preferred stock issued by Private Companies are typically valued utilizing market approach in determining the enterprise value of the company. Such investments often contain rights and preferences that differ from other series of preferred and common stock of the same issuer. Enterprise valuation techniques such as an option pricing model (“OPM”), a probability weighted expected return model (“PWERM”), current value method or a hybrid of those techniques are used as deemed appropriate under the circumstances. The use of these valuation techniques involve a determination of the exit scenarios of the investment in order to appropriately allocate the enterprise value of the company among the various parts of its capital structure.
The Private Companies are not subject to the public company disclosure, timing, and reporting standards applicable to other investments held by the Fund. Typically, the most recently available information by a Private Company is as of a date that is earlier than the date the Fund is calculating its NAV. This factor may result in a difference between the value of the investment and the price the Fund could receive upon the sale of the investment.
Fair Value Hierarchy: Various inputs are used in determining the fair value of financial instruments. These inputs to valuation techniques are categorized into a fair value hierarchy consisting of three broad levels for financial reporting purposes as follows:
| | • | | Level 1 – Unadjusted price quotations in active markets/exchanges for identical assets or liabilities that the Fund has the ability to access; |
| | • | | Level 2 – Other observable inputs (including, but not limited to, quoted prices for similar assets or liabilities in markets that are active, quoted prices for identical or similar assets or liabilities in markets that are not active, inputs other than quoted prices that are observable for the assets or liabilities (such as interest rates, yield curves, volatilities, prepayment speeds, loss severities, credit risks and default rates) or other market–corroborated inputs); and |
| | • | | Level 3 – Unobservable inputs based on the best information available in the circumstances, to the extent observable inputs are not available (including the Valuation Committee’s assumptions used in determining the fair value of financial instruments). |
The hierarchy gives the highest priority to unadjusted quoted prices in active markets for identical assets or liabilities (Level 1 measurements) and the lowest priority to unobservable inputs (Level 3 measurements). Accordingly, the degree of judgment exercised in determining fair value is greatest for instruments categorized in Level 3. The inputs used to measure fair value may fall into different levels of the fair value hierarchy. In such cases, for disclosure purposes, the fair value hierarchy classification is determined based on the lowest level input that is significant to the fair value measurement in its entirety. Investments classified within Level 3 have significant unobservable inputs used by the Valuation Committee in determining the price for Fair Valued Investments. Level 3 investments include equity or debt issued by Private Companies that may not have a secondary market and/or may have a limited number of investors. The categorization of a value determined for financial instruments is based on the pricing transparency of the financial instruments and is not necessarily an indication of the risks associated with investing in those securities.
| | |
| 72 | | 2 0 2 3 BLACK ROCK ANNUAL REPORT TO SHAREHOLDERS |
Notes to Consolidated Financial Statements (continued)
As of April 30, 2023, certain investments of the Fund were fair valued using NAV as a practical expedient (or its equivalent) as no quoted market value is available and therefore have been excluded from the fair value hierarchy.
| 4. | SECURITIES AND OTHER INVESTMENTS |
Asset-Backed and Mortgage-Backed Securities: Asset-backed securities are generally issued as pass-through certificates or as debt instruments. Asset-backed securities issued as pass-through certificates represent undivided fractional ownership interests in an underlying pool of assets. Asset-backed securities issued as debt instruments, which are also known as collateralized obligations, are typically issued as the debt of a special purpose entity organized solely for the purpose of owning such assets and issuing such debt. Asset-backed securities are often backed by a pool of assets representing the obligations of a number of different parties. The yield characteristics of certain asset-backed securities may differ from traditional debt securities. One such major difference is that all or a principal part of the obligations may be prepaid at any time because the underlying assets (i.e., loans) may be prepaid at any time. As a result, a decrease in interest rates in the market may result in increases in the level of prepayments as borrowers, particularly mortgagors, refinance and repay their loans. An increased prepayment rate with respect to an asset-backed security will have the effect of shortening the maturity of the security. In addition, a fund may subsequently have to reinvest the proceeds at lower interest rates. If a fund has purchased such an asset-backed security at a premium, a faster than anticipated prepayment rate could result in a loss of principal to the extent of the premium paid.
For mortgage pass-through securities (the “Mortgage Assets”) there are a number of important differences among the agencies and instrumentalities of the U.S. Government that issue mortgage-related securities and among the securities that they issue. For example, mortgage-related securities guaranteed by Ginnie Mae are guaranteed as to the timely payment of principal and interest by Ginnie Mae and such guarantee is backed by the full faith and credit of the United States. However, mortgage-related securities issued by Freddie Mac and Fannie Mae, including Freddie Mac and Fannie Mae guaranteed mortgage pass-through certificates, which are solely the obligations of Freddie Mac and Fannie Mae, are not backed by or entitled to the full faith and credit of the United States, but are supported by the right of the issuer to borrow from the U.S. Treasury.
Non-agency mortgage-backed securities are securities issued by non-governmental issuers and have no direct or indirect government guarantees of payment and are subject to various risks. Non-agency mortgage loans are obligations of the borrowers thereunder only and are not typically insured or guaranteed by any other person or entity. The ability of a borrower to repay a loan is dependent upon the income or assets of the borrower. A number of factors, including a general economic downturn, acts of God, terrorism, social unrest and civil disturbances, may impair a borrower’s ability to repay its loans.
Collateralized Debt Obligations: Collateralized debt obligations (“CDOs”), including collateralized bond obligations (“CBOs”) and collateralized loan obligations (“CLOs”), are types of asset-backed securities. A CDO is an entity that is backed by a diversified pool of debt securities (CBOs) or syndicated bank loans (CLOs). The cash flows of the CDO can be split into multiple segments, called “tranches,” which will vary in risk profile and yield. The riskiest segment is the subordinated or “equity” tranche. This tranche bears the greatest risk of defaults from the underlying assets in the CDO and serves to protect the other, more senior, tranches from default in all but the most severe circumstances. Since it is shielded from defaults by the more junior tranches, a “senior” tranche will typically have higher credit ratings and lower yields than their underlying securities, and often receive investment grade ratings from one or more of the nationally recognized rating agencies. Despite the protection from the more junior tranches, senior tranches can experience substantial losses due to actual defaults, increased sensitivity to future defaults and the disappearance of one or more protecting tranches as a result of changes in the credit profile of the underlying pool of assets.
Inflation-Indexed Bonds: Inflation-indexed bonds (other than municipal inflation-indexed and certain corporate inflation-indexed bonds) are fixed-income securities whose principal value is periodically adjusted according to the rate of inflation. If the index measuring inflation rises or falls, the principal value of inflation-indexed bonds (other than municipal inflation-indexed and certain corporate inflation-indexed bonds) will be adjusted upward or downward, and consequently the interest payable on these securities (calculated with respect to a larger or smaller principal amount) will be increased or reduced, respectively. Any upward or downward adjustment in the principal amount of an inflation-indexed bond is included as interest income in the Consolidated Statement of Operations, even though investors do not receive their principal until maturity. Repayment of the original bond principal upon maturity (as adjusted for inflation) is guaranteed in the case of U.S. Treasury inflation-indexed bonds. For bonds that do not provide a similar guarantee, the adjusted principal value of the bond repaid at maturity may be less than the original principal. With regard to municipal inflation-indexed bonds and certain corporate inflation-indexed bonds, the inflation adjustment is typically reflected in the semi-annual coupon payment. As a result, the principal value of municipal inflation-indexed bonds and such corporate inflation-indexed bonds does not adjust according to the rate of inflation.
Multiple Class Pass-Through Securities: Multiple class pass-through securities, including collateralized mortgage obligations (“CMOs”) and commercial mortgage-backed securities, may be issued by Ginnie Mae, U.S. Government agencies or instrumentalities or by trusts formed by private originators of, or investors in, mortgage loans. In general, CMOs are debt obligations of a legal entity that are collateralized by a pool of residential or commercial mortgage loans or Mortgage Assets. The payments on these are used to make payments on the CMOs or multiple pass-through securities. Multiple class pass-through securities represent direct ownership interests in the Mortgage Assets. Classes of CMOs include interest only (“IOs”), principal only (“POs”), planned amortization classes and targeted amortization classes. IOs and POs are stripped mortgage-backed securities representing interests in a pool of mortgages, the cash flow from which has been separated into interest and principal components. IOs receive the interest portion of the cash flow while POs receive the principal portion. IOs and POs can be extremely volatile in response to changes in interest rates. As interest rates rise and fall, the value of IOs tends to move in the same direction as interest rates. POs perform best when prepayments on the underlying mortgages rise since this increases the rate at which the principal is returned and the yield to maturity on the PO. When payments on mortgages underlying a PO are slower than anticipated, the life of the PO is lengthened and the yield to maturity is reduced. If the underlying Mortgage Assets experience greater than anticipated prepayments of principal, a fund’s initial investment in the IOs may not fully recoup.
Zero-Coupon Bonds: Zero-coupon bonds are normally issued at a significant discount from face value and do not provide for periodic interest payments. These bonds may experience greater volatility in market value than other debt obligations of similar maturity which provide for regular interest payments.
Capital Securities and Trust Preferred Securities: Capital securities, including trust preferred securities, are typically issued by corporations, generally in the form of interest-bearing notes with preferred securities characteristics. In the case of trust preferred securities, an affiliated business trust of a corporation issues these securities, generally in the form of beneficial interests in subordinated debentures or similarly structured securities. The securities can be structured with either a fixed or adjustable
| | |
NOTES TO CONSOLIDATED FINANCIAL STATEMENTS | | 73 |
Notes to Consolidated Financial Statements (continued)
coupon that can have either a perpetual or stated maturity date. For trust preferred securities, the issuing bank or corporation pays interest to the trust, which is then distributed to holders of these securities as a dividend. Dividends can be deferred without creating an event of default or acceleration, although maturity cannot take place unless all cumulative payment obligations have been met. The deferral of payments does not affect the purchase or sale of these securities in the open market. These securities generally are rated below that of the issuing company’s senior debt securities and are freely callable at the issuer’s option.
Preferred Stocks: Preferred stock has a preference over common stock in liquidation (and generally in receiving dividends as well), but is subordinated to the liabilities of the issuer in all respects. As a general rule, the market value of preferred stock with a fixed dividend rate and no conversion element varies inversely with interest rates and perceived credit risk, while the market price of convertible preferred stock generally also reflects some element of conversion value. Because preferred stock is junior to debt securities and other obligations of the issuer, deterioration in the credit quality of the issuer will cause greater changes in the value of a preferred stock than in a more senior debt security with similar stated yield characteristics. Unlike interest payments on debt securities, preferred stock dividends are payable only if declared by the issuer’s board of directors. Preferred stock also may be subject to optional or mandatory redemption provisions.
Warrants: Warrants entitle a fund to purchase a specified number of shares of common stock and are non-income producing. The purchase price and number of shares are subject to adjustment under certain conditions until the expiration date of the warrants, if any. If the price of the underlying stock does not rise above the strike price before the warrant expires, the warrant generally expires without any value and a fund will lose any amount it paid for the warrant. Thus, investments in warrants may involve more risk than investments in common stock. Warrants may trade in the same markets as their underlying stock; however, the price of the warrant does not necessarily move with the price of the underlying stock.
Floating Rate Loan Interests: Floating rate loan interests are typically issued to companies (the “borrower”) by banks, other financial institutions, or privately and publicly offered corporations (the “lender”). Floating rate loan interests are generally non-investment grade, often involve borrowers whose financial condition is troubled or uncertain and companies that are highly leveraged or in bankruptcy proceedings. In addition, transactions in floating rate loan interests may settle on a delayed basis, which may result in proceeds from the sale not being readily available for a fund to make additional investments or meet its redemption obligations. Floating rate loan interests may include fully funded term loans or revolving lines of credit. Floating rate loan interests are typically senior in the corporate capital structure of the borrower. Floating rate loan interests generally pay interest at rates that are periodically determined by reference to a base lending rate plus a premium. Since the rates reset only periodically, changes in prevailing interest rates (and particularly sudden and significant changes) can be expected to cause some fluctuations in the NAV of a fund to the extent that it invests in floating rate loan interests. The base lending rates are generally the lending rate offered by one or more European banks, such as the London Interbank Offered Rate (“LIBOR”), the prime rate offered by one or more U.S. banks or the certificate of deposit rate. Floating rate loan interests may involve foreign borrowers, and investments may be denominated in foreign currencies. These investments are treated as investments in debt securities for purposes of a fund’s investment policies.
When a fund purchases a floating rate loan interest, it may receive a facility fee and when it sells a floating rate loan interest, it may pay a facility fee. On an ongoing basis, a fund may receive a commitment fee based on the undrawn portion of the underlying line of credit amount of a floating rate loan interest. Facility and commitment fees are typically amortized to income over the term of the loan or term of the commitment, respectively. Consent and amendment fees are recorded to income as earned. Prepayment penalty fees, which may be received by a fund upon the prepayment of a floating rate loan interest by a borrower, are recorded as realized gains. A fund may invest in multiple series or tranches of a loan. A different series or tranche may have varying terms and carry different associated risks.
Floating rate loan interests are usually freely callable at the borrower’s option. A fund may invest in such loans in the form of participations in loans (“Participations”) or assignments (“Assignments”) of all or a portion of loans from third parties. Participations typically will result in a fund having a contractual relationship only with the lender, not with the borrower. A fund has the right to receive payments of principal, interest and any fees to which it is entitled only from the lender selling the Participation and only upon receipt by the lender of the payments from the borrower. In connection with purchasing Participations, a fund generally will have no right to enforce compliance by the borrower with the terms of the loan agreement, nor any rights of offset against the borrower. A fund may not benefit directly from any collateral supporting the loan in which it has purchased the Participation. As a result, a fund assumes the credit risk of both the borrower and the lender that is selling the Participation. A fund’s investment in loan participation interests involves the risk of insolvency of the financial intermediaries who are parties to the transactions. In the event of the insolvency of the lender selling the Participation, a fund may be treated as a general creditor of the lender and may not benefit from any offset between the lender and the borrower. Assignments typically result in a fund having a direct contractual relationship with the borrower, and a fund may enforce compliance by the borrower with the terms of the loan agreement.
In connection with floating rate loan interests, the Fund may also enter into unfunded floating rate loan interests (“commitments”). In connection with these commitments, the fund earns a commitment fee, typically set as a percentage of the commitment amount. Such fee income, which is included in interest income in the Consolidated Statement of Operations, is recognized ratably over the commitment period. Unfunded floating rate loan interests are marked-to-market daily, and any unrealized appreciation (depreciation) is included in the Consolidated Statement of Assets and Liabilities and Consolidated Statement of Operations. As of period end, the Fund had the following unfunded floating rate loan interests:
| | | | | | | | | | | | | | | | | | |
| |
| | | | | |
| Fund Name | | Borrower | | Par | | | Commitment Amount | | | Value | | | Unrealized
Appreciation
(Depreciation) | |
| |
| | | | | |
BlackRock Global Allocation Fund, Inc. | | CML Paradise Plaza | | $ | 1,945,000 | | | $ | 1,945,000 | | | $ | 1,883,785 | | | $ | (61,215) | |
| | Sheraton Austin | | | 4,639,000 | | | | 4,603,956 | | | | 4,518,941 | | | | (85,015) | |
| | Starwood Property Trust, Inc. | | | 796,612 | | | | 796,612 | | | | 762,331 | | | | (34,281) | |
| | | | | | | | | | | | | | | | | | |
| | | | | | | | | | | | | | | | | $(180,511 | ) |
| | | | | | | | | | | | | | | | | | |
Forward Commitments, When-Issued and Delayed Delivery Securities: The Fund may purchase securities on a when-issued basis and may purchase or sell securities on a forward commitment basis. Settlement of such transactions normally occurs within a month or more after the purchase or sale commitment is made. The Fund may purchase securities under such conditions with the intention of actually acquiring them but may enter into a separate agreement to sell the securities before the settlement date. Since the value of securities purchased may fluctuate prior to settlement, the Fund may be required to pay more at settlement than the security is worth. In addition, a fund is not entitled to any of the interest earned prior to settlement. When purchasing a security on a delayed delivery basis, the Fund assumes the rights and risks of ownership of the
| | |
| 74 | | 2 0 2 3 BLACK ROCK ANNUAL REPORT TO SHAREHOLDERS |
Notes to Consolidated Financial Statements (continued)
security, including the risk of price and yield fluctuations. In the event of default by the counterparty, the Fund’s maximum amount of loss is the unrealized appreciation of unsettled when-issued transactions.
TBA Commitments: TBA commitments are forward agreements for the purchase or sale of securities, including mortgage-backed securities for a fixed price, with payment and delivery on an agreed upon future settlement date. The specific securities to be delivered are not identified at the trade date. However, delivered securities must meet specified terms, including issuer, rate and mortgage terms. When entering into TBA commitments, a fund may take possession of or deliver the underlying mortgage-backed securities but can extend the settlement or roll the transaction. TBA commitments involve a risk of loss if the value of the security to be purchased or sold declines or increases, respectively, prior to settlement date, if there are expenses or delays in connection with the TBA transactions, or if the counterparty fails to complete the transaction.
In order to better define contractual rights and to secure rights that will help a fund mitigate its counterparty risk, TBA commitments may be entered into by a fund under Master Securities Forward Transaction Agreements (each, an “MSFTA”). An MSFTA typically contains, among other things, collateral posting terms and netting provisions in the event of default and/or termination event. The collateral requirements are typically calculated by netting the mark-to-market amount for each transaction under such agreement and comparing that amount to the value of the collateral currently pledged by a fund and the counterparty. Cash collateral that has been pledged to cover the obligations of a fund and cash collateral received from the counterparty, if any, is reported separately in the Consolidated Statement of Assets and Liabilities as cash pledged as collateral for TBA commitments or cash received as collateral for TBA commitments, respectively. Non-cash collateral pledged by a fund, if any, is noted in the Consolidated Schedule of Investments. Typically, a fund is permitted to sell, re-pledge or use the collateral it receives; however, the counterparty is not permitted to do so. To the extent amounts due to a fund are not fully collateralized, contractually or otherwise, a fund bears the risk of loss from counterparty non-performance.
Mortgage Dollar Roll Transactions: The Fund may sell TBA mortgage-backed securities and simultaneously contract to repurchase substantially similar (i.e., same type, coupon and maturity) securities on a specific future date at an agreed upon price. During the period between the sale and repurchase, a fund is not entitled to receive interest and principal payments on the securities sold. Mortgage dollar roll transactions are treated as purchases and sales and a fund realizes gains and losses on these transactions. Mortgage dollar rolls involve the risk that the market value of the securities that a fund is required to purchase may decline below the agreed upon repurchase price of those securities.
Commitments: Commitments are agreements to acquire an investment at a future date (subject to conditions) in connection with a potential public or non-public offering. Such agreements may obligate a fund to make future cash payments. As of April 30, 2023, the Fund had outstanding commitments of $7,520,000. These commitments are not included in the net assets of the Fund as of April 30, 2023.
Short Sale Transactions: In short sale transactions, a fund sells a security it does not hold in anticipation of a decline in the market price of that security. When a fund makes a short sale, it will borrow the security sold short from a broker/counterparty and deliver the security to the purchaser. To close out a short position, a fund delivers the same security to the broker and records a liability to reflect the obligation to return the security to the broker. The amount of the liability is subsequently marked-to-market to reflect the market value of the short sale. A fund maintains a segregated account of securities or deposits cash with the broker-dealer as collateral for the short sales. Cash deposited with the broker is recorded as an asset in the Consolidated Statement of Assets and Liabilities. Securities segregated as collateral are denoted in the Consolidated Schedule of Investments. A fund may pay a financing fee for the difference between the market value of the short position and the cash collateral deposited with the broker which would be recorded as interest expense. A fund is required to repay the counterparty any dividends received on the security sold short, which, if applicable, is shown as dividend expense in the Consolidated Statement of Operations. A fund may pay a fee on the assets borrowed from the counterparty, which, if applicable, is shown as broker fees and expenses on short sales in the Consolidated Statement of Operations. A fund is exposed to market risk based on the amount, if any, that the market value of the security increases beyond the market value at which the position was sold. Thus, a short sale of a security involves the risk that instead of declining, the price of the security sold short will rise. The short sale of securities involves the possibility of an unlimited loss since there is an unlimited potential for the market price of the security sold short to increase. A gain is limited to the price at which a fund sold the security short. A realized gain or loss is recognized upon the termination of a short sale if the market price is either less than or greater than the proceeds originally received. There is no assurance that a fund will be able to close out a short position at a particular time or at an acceptable price.
Securities Lending: The Fund may lend its securities to approved borrowers, such as brokers, dealers and other financial institutions. The borrower pledges and maintains with the Fund collateral consisting of cash, an irrevocable letter of credit issued by a bank, or securities issued or guaranteed by the U.S. Government. The initial collateral received by the Fund is required to have a value of at least 102% of the current value of the loaned securities for securities traded on U.S. exchanges and a value of at least 105% for all other securities. The collateral is maintained thereafter at a value equal to at least 100% of the current market value of the securities on loan. The market value of the loaned securities is determined at the close of each business day of the Fund and any additional required collateral is delivered to the Fund, or excess collateral returned by the Fund, on the next business day. During the term of the loan, the Fund is entitled to all distributions made on or in respect of the loaned securities, but does not receive interest income on securities received as collateral. Loans of securities are terminable at any time and the borrower, after notice, is required to return borrowed securities within the standard time period for settlement of securities transactions.
As of period end, any securities on loan were collateralized by cash and/or U.S. Government obligations. Cash collateral invested by the securities lending agent, BlackRock Investment Management, LLC (“BIM”), if any, is disclosed in the Consolidated Schedule of Investments. Any non-cash collateral received cannot be sold, re-invested or pledged by the Fund, except in the event of borrower default. The securities on loan, if any, are disclosed in the Fund’s Consolidated Schedule of Investments. The market value of any securities on loan and the value of related collateral, if any, are shown separately in the Consolidated Statement of Assets and Liabilities as a component of investments at value – unaffiliated and collateral on securities loaned, respectively.
Securities lending transactions are entered into by the Fund under Master Securities Lending Agreements (each, an “MSLA”), which provide the right, in the event of default (including bankruptcy or insolvency), for the non-defaulting party to liquidate the collateral and calculate a net exposure to the defaulting party or request additional collateral. In the event that a borrower defaults, the Fund, as lender, would offset the market value of the collateral received against the market value of the securities loaned. When the value of the collateral is greater than that of the market value of the securities loaned, the lender is left with a net amount payable to the defaulting party. However, bankruptcy or insolvency laws of a particular jurisdiction may impose restrictions on or prohibitions against such a right of offset in the event of an MSLA counterparty’s bankruptcy or insolvency. Under the MSLA, absent an event of default, the borrower can resell or re-pledge the loaned securities, and the Fund can reinvest cash collateral received in connection with loaned securities. Upon an event of default, the parties’ obligations to return the securities or collateral to the other party are extinguished, and the parties can
| | |
NOTES TO CONSOLIDATED FINANCIAL STATEMENTS | | 75 |
Notes to Consolidated Financial Statements (continued)
resell or re-pledge the loaned securities or the collateral received in connection with the loaned securities in order to satisfy the defaulting party’s net payment obligation for all transactions under the MSLA. The defaulting party remains liable for any deficiency.
As of period end, the following table is a summary of the Fund’s securities on loan by counterparty which are subject to offset under an MSLA:
| | | | | | | | | | | | | | | | |
| |
Counterparty | |
| Securities
Loaned at Value |
| |
| Cash Collateral
Received |
(a) | |
| Non-Cash Collateral
Received, at Fair Value |
(a) | |
| Net
Amount |
|
| |
| | | | |
Barclays Capital, Inc. | | $ | 5,217,859 | | | $ | (5,217,859 | ) | | $ | — | | | $ | — | |
BofA Securities, Inc. | | | 15,347,215 | | | | (15,347,215 | ) | | | — | | | | — | |
Citigroup Global Markets, Inc. | | | 9,447,664 | | | | (9,447,664 | ) | | | — | | | | — | |
Goldman Sachs & Co. LLC | | | 40,232,985 | | | | (40,232,985 | ) | | | — | | | | — | |
J.P. Morgan Securities LLC | | | 131,838,943 | | | | (131,838,943 | ) | | | — | | | | — | |
Jefferies LLC | | | 3,306,322 | | | | (3,306,322 | ) | | | — | | | | — | |
Morgan Stanley | | | 3,512,427 | | | | (3,512,427 | ) | | | — | | | | — | |
National Financial Services LLC | | | 17,010 | | | | (17,010 | ) | | | — | | | | — | |
SG Americas Securities LLC | | | 2,225,250 | | | | (2,225,250 | ) | | | — | | | | — | |
Toronto-Dominion Bank | | | 3,974,239 | | | | (3,974,239 | ) | | | — | | | | — | |
| | | | | | | | | | | | | | | | |
| | $ | 215,119,914 | | | $ | (215,119,914 | ) | | $ | — | | | $ | — | |
| | | | | | | | | | | | | | | | |
| | (a) | Collateral received, if any, in excess of the market value of securities on loan is not presented in this table. The total cash collateral received by the Fund is disclosed in the Fund’s Consolidated Statement of Assets and Liabilities. | |
The risks of securities lending include the risk that the borrower may not provide additional collateral when required or may not return the securities when due. To mitigate these risks, the Fund benefits from a borrower default indemnity provided by BIM. BIM’s indemnity allows for full replacement of the securities loaned to the extent the collateral received does not cover the value on the securities loaned in the event of borrower default. The Fund could incur a loss if the value of an investment purchased with cash collateral falls below the market value of loaned securities or if the value of an investment purchased with cash collateral falls below the value of the original cash collateral received. Such losses are borne entirely by the Fund.
| 5. | DERIVATIVE FINANCIAL INSTRUMENTS |
The Fund engages in various portfolio investment strategies using derivative contracts both to increase the returns of the Fund and/or to manage its exposure to certain risks such as credit risk, equity risk, interest rate risk, foreign currency exchange rate risk, commodity price risk or other risks (e.g., inflation risk). Derivative financial instruments categorized by risk exposure are included in the Consolidated Schedule of Investments. These contracts may be transacted on an exchange or OTC.
Futures Contracts: Futures contracts are purchased or sold to gain exposure to, or manage exposure to, changes in interest rates (interest rate risk) and changes in the value of equity securities (equity risk), foreign currencies (foreign currency exchange rate risk) or bitcoin (commodity risk).
Futures contracts are exchange-traded agreements between the Fund and a counterparty to buy or sell a specific quantity of an underlying instrument at a specified price and on a specified date. Depending on the terms of a contract, it is settled either through physical delivery of the underlying instrument on the settlement date or by payment of a cash amount on the settlement date. The Fund may invest in cash-settled bitcoin futures that are traded on commodity exchanges registered with the Commodity Futures Trading Commission. Upon entering into a futures contract, the Fund is required to deposit initial margin with the broker in the form of cash or securities in an amount that varies depending on a contract’s size and risk profile. The initial margin deposit must then be maintained at an established level over the life of the contract. Amounts pledged, which are considered restricted, are included in cash pledged for futures contracts in the Consolidated Statement of Assets and Liabilities.
Securities deposited as initial margin are designated in the Consolidated Schedule of Investments and cash deposited, if any, are shown as cash pledged for futures contracts in the Consolidated Statement of Assets and Liabilities. Pursuant to the contract, the Fund agrees to receive from or pay to the broker an amount of cash equal to the daily fluctuation in market value of the contract (“variation margin”). Variation margin is recorded as unrealized appreciation (depreciation) and, if any, shown as variation margin receivable (or payable) on futures contracts in the Consolidated Statement of Assets and Liabilities. When the contract is closed, a realized gain or loss is recorded in the Consolidated Statement of Operations equal to the difference between the notional amount of the contract at the time it was opened and the notional amount at the time it was closed. The use of futures contracts involves the risk of an imperfect correlation in the movements in the price of futures contracts and interest rates, foreign currency exchange rates or underlying assets.
Forward Foreign Currency Exchange Contracts: Forward foreign currency exchange contracts are entered into to gain or reduce exposure to foreign currencies (foreign currency exchange rate risk).
A forward foreign currency exchange contract is an agreement between two parties to buy and sell a currency at a set exchange rate on a specified date. These contracts help to manage the overall exposure to the currencies in which some of the investments held by the Fund are denominated and in some cases, may be used to obtain exposure to a particular market. The contracts are traded OTC and not on an organized exchange.
The contract is marked-to-market daily and the change in market value is recorded as unrealized appreciation (depreciation) in the Consolidated Statement of Assets and Liabilities. When a contract is closed, a realized gain or loss is recorded in the Consolidated Statement of Operations equal to the difference between the value at the time it was opened and the value at the time it was closed. Non-deliverable forward foreign currency exchange contracts are settled with the counterparty in cash without the delivery of foreign currency. The use of forward foreign currency exchange contracts involves the risk that the value of a forward foreign currency exchange contract changes unfavorably due to movements in the value of the referenced foreign currencies, and such value may exceed the amount(s) reflected in the Consolidated Statement of Assets and Liabilities. Cash amounts pledged for forward foreign currency exchange contracts are considered restricted and are included in cash pledged as collateral for OTC
| | |
| 76 | | 2 0 2 3 BLACK ROCK ANNUAL REPORT TO SHAREHOLDERS |
Notes to Consolidated Financial Statements (continued)
derivatives in the Consolidated Statement of Assets and Liabilities. A Fund’s risk of loss from counterparty credit risk on OTC derivatives is generally limited to the aggregate unrealized gain netted against any collateral held by the Fund.
Options: The Fund may purchase and write call and put options to increase or decrease its exposure to the risks of underlying instruments, including equity risk, interest rate risk and/or commodity price risk and/or, in the case of options written, to generate gains from options premiums.
A call option gives the purchaser (holder) of the option the right (but not the obligation) to buy, and obligates the seller (writer) to sell (when the option is exercised) the underlying instrument at the exercise or strike price at any time or at a specified time during the option period. A put option gives the holder the right to sell and obligates the writer to buy the underlying instrument at the exercise or strike price at any time or at a specified time during the option period.
Premiums paid on options purchased and premiums received on options written, as well as the daily fluctuation in market value, are included in investments at value –unaffiliated and options written at value, respectively, in the Consolidated Statement of Assets and Liabilities. When an instrument is purchased or sold through the exercise of an option, the premium is offset against the cost or proceeds of the underlying instrument. When an option expires, a realized gain or loss is recorded in the Consolidated Statement of Operations to the extent of the premiums received or paid. When an option is closed or sold, a gain or loss is recorded in the Consolidated Statement of Operations to the extent the cost of the closing transaction exceeds the premiums received or paid. When the Fund writes a call option, such option is typically “covered,” meaning that it holds the underlying instrument subject to being called by the option counterparty. When the Fund writes a put option, cash is segregated in an amount sufficient to cover the obligation. These amounts, which are considered restricted, are included in cash pledged as collateral for options written in the Consolidated Statement of Assets and Liabilities.
| | • | | Swaptions — The Fund may purchase and write options on swaps (“swaptions”) primarily to preserve a return or spread on a particular investment or portion of the Fund’s holdings, as a duration management technique or to protect against an increase in the price of securities it anticipates purchasing at a later date. The purchaser and writer of a swaption is buying or granting the right to enter into a previously agreed upon interest rate or credit default swap agreement (interest rate risk and/or credit risk) at any time before the expiration of the option. |
| | • | | Interest rate caps — Interest rate caps are entered into to gain or reduce exposure to interest rates (interest rate risk and/or other risk). Caps are agreements whereby one party agrees to make payments to the other, in return for a premium, to the extent that interest rate indexes exceed a specified rate, or “cap.” The maximum potential amount of future payments that the Fund would be required to make under an interest rate cap would be the notional amount times the percentage increase in interest rates determined by the difference between the interest rate index current value and the value at the time the cap was entered into. |
| | • | | Foreign currency options — The Fund may purchase and write foreign currency options, foreign currency futures and options on foreign currency futures to gain or reduce exposure to foreign currencies (foreign currency exchange rate risk). Foreign currency options give the purchaser the right to buy from or sell to the writer a foreign currency at any time before the expiration of the option. |
| | • | | Barrier options – The Fund may purchase and write a variety of options with non-standard payout structures or other features (“barrier options”) that are generally traded OTC. |
The Fund may invest in various types of barrier options, including down-and-out options, down-and-in options, double no-touch options, one-touch options, instant one-touch options, up-and-out options and up-and-in options. Down-and-out options expire worthless to the purchaser if the price of the underlying instrument falls below a specific barrier price level prior to the expiration date. Down-and-in options expire worthless to the purchaser unless the price of the underlying instrument falls below a specific barrier price level prior to the expiration date. Double no-touch options provide the purchaser an agreed-upon payout if the price of the underlying instrument does not reach or surpass predetermined barrier price levels prior to the option’s expiration date. One-touch options and instant one-touch options provide the purchaser an agreed-upon payout if the price of the underlying instrument reaches or surpasses predetermined barrier price levels prior to the expiration date. Up-and-out options expire worthless to the purchaser if the price of the underlying instrument increases beyond a predetermined barrier price level prior to the expiration date. Up-and-in options can only be exercised when the price of the underlying instrument increases beyond a predetermined barrier price level.
In purchasing and writing options, the Fund bears the risk of an unfavorable change in the value of the underlying instrument or the risk that it may not be able to enter into a closing transaction due to an illiquid market. Exercise of a written option could result in the Fund purchasing or selling a security when it otherwise would not, or at a price different from the current market value.
Swaps: Swap contracts are entered into to manage exposure to issuers, markets and securities. Such contracts are agreements between the Fund and a counterparty to make periodic net payments on a specified notional amount or a net payment upon termination. Swap agreements are privately negotiated in the OTC market and may be entered into as a bilateral contract (“OTC swaps”) or centrally cleared (“centrally cleared swaps”).
For OTC swaps, any upfront premiums paid and any upfront fees received are shown as swap premiums paid and swap premiums received, respectively, in the Consolidated Statement of Assets and Liabilities and amortized over the term of the contract. The daily fluctuation in market value is recorded as unrealized appreciation (depreciation) on OTC Swaps in the Consolidated Statement of Assets and Liabilities. Payments received or paid are recorded in the Consolidated Statement of Operations as realized gains or losses, respectively. When an OTC swap is terminated, a realized gain or loss is recorded in the Consolidated Statement of Operations equal to the difference between the proceeds from (or cost of) the closing transaction and the Fund’s basis in the contract, if any. Generally, the basis of the contract is the premium received or paid.
In a centrally cleared swap, immediately following execution of the swap contract, the swap contract is novated to a central counterparty (the “CCP”) and the CCP becomes the Fund’s counterparty on the swap. The Fund is required to interface with the CCP through the broker. Upon entering into a centrally cleared swap, the Fund is required to deposit initial margin with the broker in the form of cash or securities in an amount that varies depending on the size and risk profile of the particular swap. Securities deposited as initial margin are designated in the Consolidated Schedule of Investments and cash deposited is shown as cash pledged for centrally cleared swaps in the Consolidated Statement of Assets and Liabilities. Amounts pledged, which are considered restricted cash, are included in cash pledged for centrally cleared swaps in the
| | |
NOTES TO CONSOLIDATED FINANCIAL STATEMENTS | | 77 |
Notes to Consolidated Financial Statements (continued)
Consolidated Statement of Assets and Liabilities. Pursuant to the contract, the Fund agrees to receive from or pay to the broker variation margin. Variation margin is recorded as unrealized appreciation (depreciation) and shown as variation margin receivable (or payable) on centrally cleared swaps in the Consolidated Statement of Assets and Liabilities. Payments received from (paid to) the counterparty are amortized over the term of the contract and recorded as realized gains (losses) in the Consolidated Statement of Operations, including those at termination.
| | • | | Credit default swaps — Credit default swaps are entered into to manage exposure to the market or certain sectors of the market, to reduce risk exposure to defaults of corporate and/or sovereign issuers or to create exposure to corporate and/or sovereign issuers to which a fund is not otherwise exposed (credit risk). |
The Fund may either buy or sell (write) credit default swaps on single-name issuers (corporate or sovereign), a combination or basket of single-name issuers or traded indexes. Credit default swaps are agreements in which the protection buyer pays fixed periodic payments to the seller in consideration for a promise from the protection seller to make a specific payment should a negative credit event take place with respect to the referenced entity (e.g., bankruptcy, failure to pay, obligation acceleration, repudiation, moratorium or restructuring). As a buyer, if an underlying credit event occurs, the Fund will either (i) receive from the seller an amount equal to the notional amount of the swap and deliver the referenced security or underlying securities comprising the index, or (ii) receive a net settlement of cash equal to the notional amount of the swap less the recovery value of the security or underlying securities comprising the index. As a seller (writer), if an underlying credit event occurs, the Fund will either pay the buyer an amount equal to the notional amount of the swap and take delivery of the referenced security or underlying securities comprising the index or pay a net settlement of cash equal to the notional amount of the swap less the recovery value of the security or underlying securities comprising the index.
| | • | | Total return swaps — Total return swaps are entered into to obtain exposure to a security or market without owning such security or investing directly in such market or to exchange the risk/return of one security or market (e.g., fixed-income) with another security or market (e.g., equity or commodity prices) (equity risk, commodity price risk and/or interest rate risk). |
Total return swaps are agreements in which there is an exchange of cash flows whereby one party commits to make payments based on the total return (distributions plus capital gains/losses) of an underlying instrument, or basket of underlying instruments, in exchange for fixed or floating rate interest payments. If the total return of the instrument(s) or index underlying the transaction exceeds or falls short of the offsetting fixed or floating interest rate obligation, the Fund receives payment from or makes a payment to the counterparty.
Certain total return swaps are designed to function as a portfolio of direct investments in long and short equity positions. This means that the Fund has the ability to trade in and out of these long and short positions within the swap and will receive the economic benefits and risks equivalent to direct investment in these positions, subject to certain adjustments due to events related to the counterparty. Benefits and risks include capital appreciation (depreciation), corporate actions and dividends received and paid, all of which are reflected in the swap’s market value. The market value also includes interest charges and credits (“financing fees”) related to the notional values of the long and short positions and cash balances within the swap. These interest charges and credits are based on a specified benchmark rate plus or minus a specified spread determined based upon the country and/or currency of the positions in the portfolio.
Positions within the swap and financing fees are reset periodically. During a reset, any unrealized appreciation (depreciation) on positions and accrued financing fees become available for cash settlement between the Fund and the counterparty. The amounts that are available for cash settlement are recorded as realized gains or losses in the Consolidated Statement of Operations. Cash settlement in and out of the swap may occur at a reset date or any other date, at the discretion of the Fund and the counterparty, over the life of the agreement. Certain swaps have no stated expiration and can be terminated by either party at any time.
| | • | | Interest rate swaps — Interest rate swaps are entered into to gain or reduce exposure to interest rates or to manage duration, the yield curve or interest rate (interest rate risk). |
Interest rate swaps are agreements in which one party pays a stream of interest payments, either fixed or floating, in exchange for another party’s stream of interest payments, either fixed or floating, on the same notional amount for a specified period of time. In more complex interest rate swaps, the notional principal amount may decline (or amortize) over time.
| | • | | Inflation swaps — Inflation swaps are entered into to gain or reduce exposure to inflation (inflation risk). In an inflation swap, one party makes fixed interest payments on a notional principal amount in exchange for another party’s variable payments based on an inflation index, such as the Consumer Price Index. |
Swap transactions involve, to varying degrees, elements of interest rate, credit and market risks in excess of the amounts recognized in the Consolidated Statement of Assets and Liabilities. Such risks involve the possibility that there will be no liquid market for these agreements, that the counterparty to the agreements may default on its obligation to perform or disagree as to the meaning of the contractual terms in the agreements, and that there may be unfavorable changes in interest rates and/or market values associated with these transactions.
Master Netting Arrangements: In order to define its contractual rights and to secure rights that will help it mitigate its counterparty risk, the Fund may enter into an International Swaps and Derivatives Association, Inc. Master Agreement (“ISDA Master Agreement”) or similar agreement with its counterparties. An ISDA Master Agreement is a bilateral agreement between a Fund and a counterparty that governs certain OTC derivatives and typically contains, among other things, collateral posting terms and netting provisions in the event of a default and/or termination event. Under an ISDA Master Agreement, a Fund may, under certain circumstances, offset with the counterparty certain derivative financial instruments’ payables and/or receivables with collateral held and/or posted and create one single net payment. The provisions of the ISDA Master Agreement typically permit a single net payment in the event of default including the bankruptcy or insolvency of the counterparty. However, bankruptcy or insolvency laws of a particular jurisdiction may impose restrictions on or prohibitions against the right of offset in bankruptcy, insolvency or other events.
Collateral Requirements: For derivatives traded under an ISDA Master Agreement, the collateral requirements are typically calculated by netting the mark-to-market amount for each transaction under such agreement and comparing that amount to the value of any collateral currently pledged by the Fund and the counterparty.
| | |
| 78 | | 2 0 2 3 BLACK ROCK ANNUAL REPORT TO SHAREHOLDERS |
Notes to Consolidated Financial Statements (continued)
Cash collateral that has been pledged to cover obligations of the Fund and cash collateral received from the counterparty, if any, is reported separately in the Consolidated Statement of Assets and Liabilities as cash pledged as collateral and cash received as collateral, respectively. Non-cash collateral pledged by the Fund, if any, is noted in the Consolidated Schedule of Investments. Generally, the amount of collateral due from or to a counterparty is subject to a certain minimum transfer amount threshold before a transfer is required, which is determined at the close of business of the Fund. Any additional required collateral is delivered to/pledged by the Fund on the next business day. Typically, the counterparty is not permitted to sell, re-pledge or use cash and non-cash collateral it receives. The Fund generally agrees not to use non-cash collateral that it receives but may, absent default or certain other circumstances defined in the underlying ISDA Master Agreement, be permitted to use cash collateral received. In such cases, interest may be paid pursuant to the collateral arrangement with the counterparty. To the extent amounts due to the Fund from the counterparties are not fully collateralized, the Fund bears the risk of loss from counterparty non-performance. Likewise, to the extent the Fund has delivered collateral to a counterparty and stands ready to perform under the terms of its agreement with such counterparty, the Fund bears the risk of loss from a counterparty in the amount of the value of the collateral in the event the counterparty fails to return such collateral. Based on the terms of agreements, collateral may not be required for all derivative contracts.
For financial reporting purposes, the Fund does not offset derivative assets and derivative liabilities that are subject to netting arrangements, if any, in the Consolidated Statement of Assets and Liabilities.
| 6. | INVESTMENT ADVISORY AGREEMENT AND OTHER TRANSACTIONS WITH AFFILIATES |
Investment Advisory: The Fund entered into an Investment Advisory Agreement with the Manager, the Fund’s investment adviser and an indirect, wholly-owned subsidiary of BlackRock, Inc. (“BlackRock”), to provide investment advisory and administrative services. The Manager is responsible for the management of the Fund’s portfolio and provides the personnel, facilities, equipment and certain other services necessary to the operations of the Fund.
For such services, the Fund pays the Manager a monthly fee at an annual rate equal to 0.75% of the average daily value of the Fund’s net assets.
The Manager provides investment management and other services to the Cayman Subsidiary. The Manager does not receive separate compensation from the Cayman Subsidiary for providing investment management or administrative services. However, the Fund pays the Manager based on the Fund’s net assets, which includes the assets of the Cayman Subsidiary.
The Manager entered into a sub-advisory agreement with BlackRock (Singapore) Limited (“BSL”), an affiliate of the Manager. The Manager pays BSL for services it provides for that portion of the Fund for which BSL acts as sub-adviser, a monthly fee that is equal to a percentage of the investment advisory fees paid by the Fund to the Manager.
Service and Distribution Fees: The Fund entered into a Distribution Agreement and a Distribution and Service Plan with BlackRock Investments, LLC (“BRIL”), an affiliate of the Manager. Pursuant to the Distribution and Service Plan and in accordance with Rule 12b-1 under the 1940 Act, the Fund pays BRIL ongoing service and distribution fees. The fees are accrued daily and paid monthly at annual rates based upon the average daily net assets of the relevant share class of the Fund as follows:
| | | | |
| | | |
| Share Class | | Service Fees | | Distribution Fees |
| | |
Investor A | | 0.25% | | N/A |
Investor C | | 0.25 | | 0.75% |
Class R | | 0.25 | | 0.25 |
BRIL and broker-dealers, pursuant to sub-agreements with BRIL, provide shareholder servicing and distribution services to the Fund. The ongoing service and/or distribution fee compensates/reimburses BRIL and each broker-dealer for providing shareholder servicing and/or distribution related services to shareholders.
For the year ended April 30, 2023, the following table shows the class specific service and distribution fees borne directly by each share class of the Fund:
| | | | | | | | |
| | | | | |
| | | Investor A | | Investor C | | Class R | | Total |
| | | | |
Service and distribution fees — class specific | | $ 23,796,543 | | $ 6,187,820 | | $ 1,523,353 | | $ 31,507,716 |
Transfer Agent: Pursuant to written agreements, certain financial intermediaries, some of which may be affiliates, provide the Fund with sub-accounting, recordkeeping, sub-transfer agency and other administrative services with respect to servicing of underlying investor accounts. For these services, these entities receive an asset-based fee or an annual fee per shareholder account, which will vary depending on share class and/or net assets. For the year ended April 30, 2023, the Fund did not pay any amounts to affiliates in return for these services.
The Manager maintains a call center that is responsible for providing certain shareholder services to the Fund. Shareholder services include responding to inquiries and processing purchases and sales based upon instructions from shareholders. For the year ended April 30, 2023, the Fund reimbursed the Manager the following amounts for costs incurred in running the call center, which are included in transfer agent — class specific in the Consolidated Statement of Operations:
| | | | | | | | | | | | |
| | | | | | | |
| | | Institutional | | Investor A | | Investor C | | Class K | | Class R | | Total |
| | | | | | |
Reimbursed amounts | | $ 28,572 | | $ 278,418 | | $ 51,019 | | $ 4,264 | | $ 2,055 | | $ 364,328 |
For the year ended April 30, 2023, the following table shows the class specific transfer agent fees borne directly by each share class of the Fund:
| | | | | | | | | | | | |
| | | | | | | |
| | | Institutional | | Investor A | | Investor C | | Class K | | Class R | | Total |
Transfer agent fees — class specific | | $6,536,259 | | $8,173,581 | | $ 766,627 | | $ 63,191 | | $ 638,437 | | $ 16,178,095 |
Other Fees: For the year ended April 30, 2023, affiliates earned underwriting discounts, direct commissions and dealer concessions on sales of the Fund’s Investor A Shares for a total of $58,138.
| | |
NOTES TO CONSOLIDATED FINANCIAL STATEMENTS | | 79 |
Notes to Consolidated Financial Statements (continued)
For the year ended April 30, 2023, affiliates received CDSCs as follows:
| | | | |
| | | |
| Fund Name | | Investor A | | Investor C |
| | |
BlackRock Global Allocation Fund, Inc. | | $ 200,956 | | $ 42,038 |
Expense Waivers and Reimbursements: The Manager contractually agreed to waive a portion of its investment advisory fees payable by the Fund through June 30, 2024, so that the Manager receives such fee as a percentage of average daily net assets of the Fund as follows:
| | |
| | |
| Average Daily Net Assets | | Investment Advisory Fees |
| |
First $10 billion | | 0.75% |
$10 billion — $15 billion | | 0.69 |
$15 billion — $20 billion | | 0.68 |
$20 billion — $25 billion | | 0.67 |
$25 billion — $30 billion | | 0.65 |
$30 billion — $40 billion | | 0.63 |
$40 billion — $60 billion | | 0.62 |
$60 billion — $80 billion | | 0.61 |
Greater than $80 billion | | 0.60 |
The contractual agreement may be terminated upon 90 days’ notice by a majority of the directors who are not “interested persons” of the Fund, as defined in the 1940 Act (“Independent Directors”), or by a vote of a majority of the outstanding voting securities of the Fund. This amount is included in fees waived and/or reimbursed by the Manager in the Consolidated Statement of Operations. For the year ended April 30, 2023, the Manager waived $6,092,383 pursuant to this agreement.
The Manager contractually agreed to waive its investment advisory fees by the amount of investment advisory fees the Fund pays to the Manager indirectly through its investment in affiliated money market funds (the “affiliated money market fund waiver”) through June 30, 2024. The contractual agreement may be terminated upon 90 days’ notice by a majority of the Independent Directors, or by a vote of a majority of the outstanding voting securities of the Fund. This amount is included in fees waived and/or reimbursed by the Manager in the Consolidated Statement of Operations. For the year ended April 30, 2023, the amounts waived were $1,069,209.
The Manager has contractually agreed to waive its investment advisory fee with respect to any portion of the Fund’s assets invested in affiliated equity and fixed-income mutual funds and affiliated exchange-traded funds that have a contractual management fee through June 30, 2024. The contractual agreement may be terminated upon 90 days’ notice by a majority of the Independent Directors, or by a vote of a majority of the outstanding voting securities of the Fund. This amount is included in fees waived and/or reimbursed by the Manager in the Consolidated Statement of Operations. For the year ended April 30, 2023, the Manager waived $1,173,049 in investment advisory fees pursuant to this arrangement.
Securities Lending: The U.S. Securities and Exchange Commission (“SEC”) has issued an exemptive order which permits BIM, an affiliate of the Manager, to serve as securities lending agent for the Fund, subject to applicable conditions. As securities lending agent, BIM bears all operational costs directly related to securities lending. The Fund is responsible for expenses in connection with the investment of cash collateral received for securities on loan (the “collateral investment expenses”). The cash collateral is invested in a private investment company, Money Market Series, managed by the Manager or its affiliates. However, BIM has agreed to cap the collateral investment expenses of the Money Market Series to an annual rate of 0.04%. The investment adviser to the Money Market Series will not charge any advisory fees with respect to shares purchased by the Fund. The Money Market Series may, under certain circumstances, impose a liquidity fee of up to 2% of the value withdrawn or temporarily restrict withdrawals for up to 10 business days during a 90 day period, in the event that the private investment company’s weekly liquid assets fall below certain thresholds. The Money Market Series seeks current income consistent with maintaining liquidity and preserving capital. Although the Money Market Series is not registered under the 1940 Act, its investments may follow the parameters of investments by a money market fund that is subject to Rule 2a-7 under the 1940 Act.
Securities lending income is equal to the total of income earned from the reinvestment of cash collateral, net of fees and other payments to and from borrowers of securities, and less the collateral investment expenses. The Fund retains a portion of securities lending income and remits a remaining portion to BIM as compensation for its services as securities lending agent.
Pursuant to the current securities lending agreement, the Fund retains 82% of securities lending income (which excludes collateral investment expenses), and this amount retained can never be less than 70% of the total of securities lending income plus the collateral investment expenses.
In addition, commencing the business day following the date that the aggregate securities lending income earned across the BlackRock Multi-Asset Complex in a calendar year exceeds a specified threshold, the Fund, pursuant to the securities lending agreement, will retain for the remainder of that calendar year securities lending income in an amount equal to 85% of securities lending income (which excludes collateral investment expenses), and this amount retained can never be less than 70% of the total of securities lending income plus the collateral investment expenses.
The share of securities lending income earned by the Fund is shown as securities lending income — affiliated — net in the Consolidated Statement of Operations. For the year ended April 30, 2023, the Fund paid BIM $478,550 for securities lending agent services.
Interfund Lending: In accordance with an exemptive order (the “Order”) from the SEC, the Fund may participate in a joint lending and borrowing facility for temporary purposes (the “Interfund Lending Program”), subject to compliance with the terms and conditions of the Order, and to the extent permitted by the Fund’s investment policies and restrictions. The Fund is currently permitted to borrow under the Interfund Lending Program.
A lending BlackRock fund may lend in aggregate up to 15% of its net assets but may not lend more than 5% of its net assets to any one borrowing fund through the Interfund Lending Program. A borrowing BlackRock fund may not borrow through the Interfund Lending Program or from any other source more than 33 1/3% of its total assets (or any
| | |
| 80 | | 2 0 2 3 BLACK ROCK ANNUAL REPORT TO SHAREHOLDERS |
Notes to Consolidated Financial Statements (continued)
lower threshold provided for by the fund’s investment restrictions). If a borrowing BlackRock fund’s total outstanding borrowings exceed 10% of its total assets, each of its outstanding interfund loans will be subject to collateralization of at least 102% of the outstanding principal value of the loan. All interfund loans are for temporary or emergency purposes and the interest rate to be charged will be the average of the highest current overnight repurchase agreement rate available to a lending fund and the bank loan rate, as calculated according to a formula established by the Board.
During the year ended April 30, 2023, the Fund did not participate in the Interfund Lending Program.
Directors and Officers: Certain directors and/or officers of the Fund are directors and/or officers of BlackRock or its affiliates. The Fund reimburses the Manager for a portion of the compensation paid to the Fund’s Chief Compliance Officer, which is included in Directors and Officer in the Consolidated Statement of Operations.
Other Transactions: The Fund may purchase securities from, or sell securities to, an affiliated fund provided the affiliation is due solely to having a common investment adviser, common officers, or common directors. For the year ended April 30, 2023, the purchase and sale transactions and any net realized gains (losses) with affiliated funds in compliance with Rule 17a-7 under the 1940 Act were as follows:
| | | | | | |
|
| | | |
| Fund Name | | Purchases | | Sales | | Net Realized Gain (Loss) |
|
BlackRock Global Allocation Fund, Inc. | | $ — | | $ 5,659,268 | | $ (1,438,380) |
|
For the year ended April 30, 2023, purchases and sales of investments, including paydowns/payups and mortgage dollar rolls, excluding short-term securities, were as follows:
| | | | | | | | | | | | | | | | |
| |
| | | U.S. Government Securities | | | Other Securities | |
| | | | |
| Fund Name | | Purchases | | | Sales | | | Purchases | | | Sales | |
| |
BlackRock Global Allocation Fund, Inc. | | $ | 2,687,685,123 | | | $ | 2,161,271,860 | | | $ | 27,811,042,337 | | | $ | 27,553,677,097 | |
| |
For the year ended April 30, 2023, purchases and sales related to mortgage dollar rolls were $5,978,656,861 and $5,978,478,681, respectively.
It is the Fund’s policy to comply with the requirements of the Internal Revenue Code of 1986, as amended, applicable to regulated investment companies, and to distribute substantially all of its taxable income to its shareholders. Therefore, no U.S. federal income tax provision is required.
The Fund files U.S. federal and various state and local tax returns. No income tax returns are currently under examination. The statute of limitations on the Fund’s U.S. federal tax returns generally remains open for a period of three years after they are filed. The statutes of limitations on the Fund’s state and local tax returns may remain open for an additional year depending upon the jurisdiction.
Management has analyzed tax laws and regulations and their application to the Fund as of April 30, 2023, inclusive of the open tax return years, and does not believe that there are any uncertain tax positions that require recognition of a tax liability in the Fund’s consolidated financial statements.
U.S. GAAP requires that certain components of net assets be adjusted to reflect permanent differences between financial and tax reporting. These reclassifications have no effect on net assets or NAVs per share. As of period end, permanent differences attributable to nondeductible expenses and income recognized from the Fund’s wholly owned subsidiary were reclassified to the following accounts:
| | | | | | | | |
| |
| | |
| Fund Name | | Paid-in Capital | | | Accumulated Earnings (Loss) | |
| |
BlackRock Global Allocation Fund, Inc. | | $ | 1,138,649 | | | $ | (1,138,649 | ) |
| |
The tax character of distributions paid was as follows:
| | | | | | | | |
| |
| | |
| Fund Name | | Year Ended 04/30/23 | | | Year Ended 04/30/22 | |
| |
| | |
BlackRock Global Allocation Fund, Inc. | | | | | | | | |
Ordinary income | | $ | 565,090,108 | | | $ | 1,909,259,718 | |
Long-term capital gains | | | 576,805,904 | | | | 639,458,459 | |
| | | | | | | | |
| | |
| | $ | 1,141,896,012 | | | $ | 2,548,718,177 | |
| | | | | | | | |
As of April 30, 2023, the tax components of accumulated earnings (loss) were as follows:
| | | | | | | | | | | | | | | | |
| |
| | | | |
| Fund Name | | Undistributed Ordinary Income | | | Non-Expiring Capital Loss Carryforwards(a) | | | Net Unrealized Gains (Losses)(b) | | | Total | |
| |
BlackRock Global Allocation Fund, Inc. | | $ | 57,347,102 | | | $ | (163,779,780 | ) | | $ | 1,107,977,012 | | | $ | 1,001,544,334 | |
| |
| | (a) | Amounts available to offset future realized capital gains. | |
| | |
NOTES TO CONSOLIDATED FINANCIAL STATEMENTS | | 81 |
Notes to Consolidated Financial Statements (continued)
| | (b) | The difference between basis and tax-basis net unrealized gains was attributable primarily to the tax deferral of losses on wash sales and straddles, amortization methods for premiums and discounts on fixed income securities, the realization for tax purposes of unrealized gains/losses on certain futures and foreign currency contracts, the accrual of income on securities in default, the realization for tax purposes of unrealized gains on investments in passive foreign investment companies, the timing and recognition of partnership income, the accounting for swap agreements and the classification of investments. | |
As of April 30, 2023, gross unrealized appreciation and depreciation based on cost of investments (including short positions and derivatives, if any) for U.S. federal income tax purposes were as follows:
| | | | | | | | | | | | | | | | |
| |
| | | | |
| Fund Name | | Tax Cost | | | Gross Unrealized Appreciation | | | Gross Unrealized Depreciation | | | Net Unrealized Appreciation (Depreciation) | |
| |
BlackRock Global Allocation Fund, Inc. | | $ | 17,862,724,185 | | | $ | 3,385,087,269 | | | $ | (1,613,617,145 | ) | | $ | 1,771,470,124 | |
| |
The Fund, along with certain other funds managed by the Manager and its affiliates (“Participating Funds”), is party to a 364-day, $2.50 billion credit agreement with a group of lenders. Under this agreement, the Fund may borrow to fund shareholder redemptions. Excluding commitments designated for certain individual funds, the Participating Funds, including the Fund, can borrow up to an aggregate commitment amount of $1.75 billion at any time outstanding, subject to asset coverage and other limitations as specified in the agreement. The credit agreement has the following terms: a fee of 0.10% per annum on unused commitment amounts and interest at a rate equal to the higher of (a) Overnight Bank Funding Rate (“OBFR”) (but, in any event, not less than 0.00%) on the date the loan is made plus 0.80% per annum, (b) the Fed Funds rate (but, in any event, not less than 0.00%) in effect from time to time plus 0.80% per annum on amounts borrowed or (c) the sum of (x) Daily Simple Secured Overnight Financing Rate (“SOFR”) (but, in any event, not less than 0.00%) on the date the loan is made plus 0.10% and (y) 0.80% per annum. The agreement expires in April 2024 unless extended or renewed. These fees were allocated among such funds based upon portions of the aggregate commitment available to them and relative net assets of Participating Funds. During the year ended April 30, 2023, the Fund did not borrow under the credit agreement.
In the normal course of business, the Fund invests in securities or other instruments and may enter into certain transactions, and such activities subject the Fund to various risks, including among others, fluctuations in the market (market risk) or failure of an issuer to meet all of its obligations. The value of securities or other instruments may also be affected by various factors, including, without limitation: (i) the general economy; (ii) the overall market as well as local, regional or global political and/or social instability; (iii) regulation, taxation or international tax treaties between various countries; or (iv) currency, interest rate and price fluctuations. Local, regional or global events such as war, acts of terrorism, the spread of infectious illness or other public health issues, recessions, or other events could have a significant impact on the Fund and its investments. The Fund’s prospectus provides details of the risks to which the Fund is subject.
The Fund may be exposed to additional risks when reinvesting cash collateral in money market funds that do not seek to maintain a stable NAV per share of $1.00, which may be subject to redemption gates or liquidity fees under certain circumstances.
Market Risk: The Fund may be exposed to prepayment risk, which is the risk that borrowers may exercise their option to prepay principal earlier than scheduled during periods of declining interest rates, which would force the Fund to reinvest in lower yielding securities. The Fund may also be exposed to reinvestment risk, which is the risk that income from the Fund’s portfolio will decline if the Fund invests the proceeds from matured, traded or called fixed-income securities at market interest rates that are below the Fund portfolio’s current earnings rate.
Infectious Illness Risk: An outbreak of an infectious illness, such as the COVID-19 pandemic, may adversely impact the economies of many nations and the global economy, and may impact individual issuers and capital markets in ways that cannot be foreseen. An infectious illness outbreak may result in, among other things, closed international borders, prolonged quarantines, supply chain disruptions, market volatility or disruptions and other significant economic, social and political impacts.
Valuation Risk: The market values of equities, such as common stocks and preferred securities or equity related investments, such as futures and options, may decline due to general market conditions which are not specifically related to a particular company. They may also decline due to factors which affect a particular industry or industries. The Fund may invest in illiquid investments. An illiquid investment is any investment that the Fund reasonably expects cannot be sold or disposed of in current market conditions in seven calendar days or less without the sale or disposition significantly changing the market value of the investment. The Fund may experience difficulty in selling illiquid investments in a timely manner at the price that it believes the investments are worth. Prices may fluctuate widely over short or extended periods in response to company, market or economic news. Markets also tend to move in cycles, with periods of rising and falling prices. This volatility may cause the Fund’s NAV to experience significant increases or decreases over short periods of time. If there is a general decline in the securities and other markets, the NAV of the Fund may lose value, regardless of the individual results of the securities and other instruments in which the Fund invests.
The price the Fund could receive upon the sale of any particular portfolio investment may differ from the Fund’s valuation of the investment, particularly for securities that trade in thin or volatile markets or that are valued using a fair valuation technique or a price provided by an independent pricing service. Changes to significant unobservable inputs and assumptions (i.e., publicly traded company multiples, growth rate, time to exit) due to the lack of observable inputs may significantly impact the resulting fair value and therefore the Fund’s results of operations. As a result, the price received upon the sale of an investment may be less than the value ascribed by the Fund, and the Fund could realize a greater than expected loss or lesser than expected gain upon the sale of the investment. The Fund’s ability to value its investments may also be impacted by technological issues and/or errors by pricing services or other third-party service providers.
Counterparty Credit Risk: The Fund may be exposed to counterparty credit risk, or the risk that an entity may fail to or be unable to perform on its commitments related to unsettled or open transactions, including making timely interest and/or principal payments or otherwise honoring its obligations. The Fund manages counterparty credit risk by
| | |
| 82 | | 2 0 2 3 BLACK ROCK ANNUAL REPORT TO SHAREHOLDERS |
Notes to Consolidated Financial Statements (continued)
entering into transactions only with counterparties that the Manager believes have the financial resources to honor their obligations and by monitoring the financial stability of those counterparties. Financial assets, which potentially expose the Fund to market, issuer and counterparty credit risks, consist principally of financial instruments and receivables due from counterparties. The extent of the Fund’s exposure to market, issuer and counterparty credit risks with respect to these financial assets is approximately their value recorded in the Consolidated Statement of Assets and Liabilities, less any collateral held by the Fund.
A derivative contract may suffer a mark-to-market loss if the value of the contract decreases due to an unfavorable change in the market rates or values of the underlying instrument. Losses can also occur if the counterparty does not perform under the contract.
For OTC options purchased, the Fund bears the risk of loss in the amount of the premiums paid plus the positive change in market values net of any collateral held by the Fund should the counterparty fail to perform under the contracts. Options written by the Fund do not typically give rise to counterparty credit risk, as options written generally obligate the Fund, and not the counterparty, to perform. The Fund may be exposed to counterparty credit risk with respect to options written to the extent the Fund deposits collateral with its counterparty to a written option.
With exchange-traded options purchased and exchange-traded futures and centrally cleared swaps, there is less counterparty credit risk to the Fund since the exchange or clearinghouse, as counterparty to such instruments, guarantees against a possible default. The clearinghouse stands between the buyer and the seller of the contract; therefore, credit risk is limited to failure of the clearinghouse. While offset rights may exist under applicable law, the Fund does not have a contractual right of offset against a clearing broker or clearinghouse in the event of a default (including the bankruptcy or insolvency). Additionally, credit risk exists in exchange-traded futures and centrally cleared swaps with respect to initial and variation margin that is held in a clearing broker’s customer accounts. While clearing brokers are required to segregate customer margin from their own assets, in the event that a clearing broker becomes insolvent or goes into bankruptcy and at that time there is a shortfall in the aggregate amount of margin held by the clearing broker for all its clients, typically the shortfall would be allocated on a pro rata basis across all the clearing broker’s customers, potentially resulting in losses to the Fund.
Concentration Risk: A diversified portfolio, where this is appropriate and consistent with a fund’s objectives, minimizes the risk that a price change of a particular investment will have a material impact on the NAV of a fund. The investment concentrations within the Fund’s portfolio are disclosed in its Consolidated Schedule of Investments.
The Fund invests a significant portion of its assets in fixed-income securities and/or uses derivatives tied to the fixed-income markets. Changes in market interest rates or economic conditions may affect the value and/or liquidity of such investments. Interest rate risk is the risk that prices of bonds and other fixed-income securities will decrease as interest rates rise and increase as interest rates fall. The Fund may be subject to a greater risk of rising interest rates due to the recent period of historically low interest rates. The Federal Reserve has recently begun to raise the federal funds rate as part of its efforts to address inflation. There is a risk that interest rates will continue to rise, which will likely drive down the prices of bonds and other fixed-income securities, and could negatively impact the Fund’s performance.
The Fund invests a significant portion of its assets in securities of issuers located in the United States. A decrease in imports or exports, changes in trade regulations, inflation and/or an economic recession in the United States may have a material adverse effect on the U.S. economy and the securities listed on U.S. exchanges. Proposed and adopted policy and legislative changes in the United States may also have a significant effect on U.S. markets generally, as well as on the value of certain securities. Governmental agencies project that the United States will continue to maintain elevated public debt levels for the foreseeable future which may constrain future economic growth. Circumstances could arise that could prevent the timely payment of interest or principal on U.S. government debt, such as reaching the legislative “debt ceiling.” Such non-payment would result in substantial negative consequences for the U.S. economy and the global financial system. If U.S. relations with certain countries deteriorate, it could adversely affect issuers that rely on the United States for trade. The United States has also experienced increased internal unrest and discord. If these trends were to continue, they may have an adverse impact on the U.S. economy and the issuers in which the Fund invests.
Significant Shareholder Redemption Risk: Certain shareholders may own or manage a substantial amount of fund shares and/or hold their fund investments for a limited period of time. Large redemptions of fund shares by these shareholders may force a fund to sell portfolio securities, which may negatively impact the fund’s NAV, increase the fund’s brokerage costs, and/or accelerate the realization of taxable income/gains and cause the fund to make additional taxable distributions to shareholders.
LIBOR Transition Risk: The Fund may be exposed to financial instruments that are tied to LIBOR to determine payment obligations, financing terms, hedging strategies or investment value. The United Kingdom’s Financial Conduct Authority, which regulates LIBOR, announced that a majority of USD LIBOR settings will no longer be published after June 30, 2023. All other LIBOR settings and certain other interbank offered rates ceased to be published after December 31, 2021. SOFR has been used increasingly on a voluntary basis in new instruments and transactions. The Federal Reserve Board adopted regulations that provide a fallback mechanism by identifying benchmark rates based on SOFR that will replace LIBOR in certain financial contracts after June 30, 2023. The ultimate effect of the LIBOR transition process on the Fund is uncertain.
| 11. | CAPITAL SHARE TRANSACTIONS |
Transactions in capital shares for each class were as follows:
| | | | | | | | | | | | | | | | |
| |
| | | Year Ended 04/30/23 | | | Year Ended 04/30/22 | |
| | | | | | | | |
| Fund Name / Share Class | | Shares | | | Amounts | | | Shares | | | Amounts | |
| |
| | | | |
BlackRock Global Allocation Fund, Inc. | | | | | | | | | | | | | | | | |
Institutional | | | | | | | | | | | | | | | | |
Shares sold | | | 63,022,515 | | | $ | 1,074,330,298 | | | | 112,206,208 | | | $ | 2,425,678,802 | |
Shares issued in reinvestment of distributions | | | 25,463,597 | | | | 415,056,569 | | | | 42,161,228 | | | | 897,692,084 | |
Shares redeemed | | | (156,310,850 | ) | | | (2,663,044,543 | ) | | | (103,640,373 | ) | | | (2,170,736,899 | ) |
| | | | | | | | | | | | | | | | |
| | | (67,824,738 | ) | | $ | (1,173,657,676 | ) | | | 50,727,063 | | | $ | 1,152,633,987 | |
| | | | | | | | | | | | | | | | |
| | |
NOTES TO CONSOLIDATED FINANCIAL STATEMENTS | | 83 |
Notes to Consolidated Financial Statements (continued)
| | | | | | | | | | | | | | | | |
| |
| | | Year Ended 04/30/23 | | | Year Ended 04/30/22 | |
| | | | | | | | |
| Fund Name / Share Class (continued) | | Shares | | | Amounts | | | Shares | | | Amounts | |
| |
| | | | |
BlackRock Global Allocation Fund, Inc. (continued) | | | | | | | | | | | | | | | | |
Investor A | | | | | | | | | | | | | | | | |
Shares sold and automatic conversion of shares | | | 37,531,384 | | | $ | 635,399,556 | | | | 56,283,602 | | | $ | 1,200,338,507 | |
Shares issued in reinvestment of distributions | | | 31,713,287 | | | | 512,169,376 | | | | 54,435,080 | | | | 1,152,860,845 | |
Shares redeemed | | | (117,521,531 | ) | | | (1,980,916,361 | ) | | | (144,523,875 | ) | | | (3,082,883,351 | ) |
| | | | | | | | | | | | | | | | |
| | | (48,276,860 | ) | | $ | (833,347,429 | ) | | | (33,805,193 | ) | | $ | (729,683,999 | ) |
| | | | | | | | | | | | | | | | |
Investor C | | | | | | | | | | | | | | | | |
Shares sold | | | 2,739,465 | | | $ | 40,258,677 | | | | 5,027,108 | | | $ | 95,141,109 | |
Shares issued in reinvestment of distributions | | | 2,912,778 | | | | 40,982,792 | | | | 5,676,334 | | | | 106,059,115 | |
Shares redeemed and automatic conversion of shares | | | (19,436,416 | ) | | | (286,305,781 | ) | | | (22,527,616 | ) | | | (420,506,402 | ) |
| | | | | | | | | | | | | | | | |
| | | (13,784,173 | ) | | $ | (205,064,312 | ) | | | (11,824,174 | ) | | $ | (219,306,178 | ) |
| | | | | | | | | | | | | | | | |
Class K | | | | | | | | | | | | | | | | |
Shares sold | | | 14,643,208 | | | $ | 250,650,760 | | | | 23,427,639 | | | $ | 506,528,605 | |
Shares issued in reinvestment of distributions | | | 4,736,355 | | | | 77,155,219 | | | | 8,273,872 | | | | 176,619,803 | |
Shares redeemed | | | (27,161,406 | ) | | | (463,551,328 | ) | | | (33,229,989 | ) | | | (713,022,978 | ) |
| | | | | | | | | | | | | | | | |
| | | (7,781,843 | ) | | $ | (135,745,349 | ) | | | (1,528,478 | ) | | $ | (29,874,570 | ) |
| | | | | | | | | | | | | | | | |
Class R | | | | | | | | | | | | | | | | |
Shares sold | | | 3,308,256 | | | $ | 52,413,795 | | | | 2,027,790 | | | $ | 39,703,840 | |
Shares issued in reinvestment of distributions | | | 1,190,477 | | | | 17,964,297 | | | | 2,002,426 | | | | 39,833,702 | |
Shares redeemed | | | (4,697,417 | ) | | | (74,856,547 | ) | | | (5,597,411 | ) | | | (111,326,075 | ) |
| | | | | | | | | | | | | | | | |
| | | (198,684 | ) | | $ | (4,478,455 | ) | | | (1,567,195 | ) | | $ | (31,788,533 | ) |
| | | | | | | | | | | | | | | | |
| | | (137,866,298 | ) | | $ | (2,352,293,221 | ) | | | 2,002,023 | | | $ | 141,980,707 | |
| | | | | | | | | | | | | | | | |
| 12. | FOREIGN WITHHOLDINGS TAX CLAIMS |
The Internal Revenue Service (“IRS”) has issued guidance to address U.S. income tax liabilities attributable to fund shareholders resulting from the recovery of foreign taxes withheld in prior calendar years. These withheld foreign taxes were passed through to shareholders in the form of foreign tax credits in the year the taxes were withheld. Assuming there are sufficient foreign taxes paid which the Fund is able to pass through to shareholders as a foreign tax credit in the current year, the Fund will be able to offset the prior years’ withholding taxes recovered against the foreign taxes paid in the current year. Accordingly, no federal income tax liability is recorded by the Fund.
Management has evaluated the impact of all subsequent events on the Fund through the date the consolidated financial statements were issued and has determined that there were no subsequent events requiring adjustment or additional disclosure in the consolidated financial statements.
| | |
| 84 | | 2 0 2 3 BLACK ROCK ANNUAL REPORT TO SHAREHOLDERS |
Report of Independent Registered Public Accounting Firm
To the Shareholders and Board of Directors of BlackRock Global Allocation Fund, Inc.:
Opinion on the Financial Statements and Financial Highlights
We have audited the accompanying consolidated statement of assets and liabilities of BlackRock Global Allocation Fund, Inc. (the “Fund”), including the consolidated schedule of investments, as of April 30, 2023, the related consolidated statement of operations for the year then ended, the consolidated statements of changes in net assets for each of the two years in the period then ended, the consolidated financial highlights for each of the two years in the period then ended, for the period from November 1, 2020 through April 30, 2021, and for each of the three years in the period ended October 31, 2020, and the related notes. In our opinion, the financial statements and financial highlights present fairly, in all material respects, the financial position of the Fund as of April 30, 2023, and the results of its operations for the year then ended, the changes in its net assets for each of the two years in the period then ended, and the financial highlights for each of the two years in the period then ended, for the period from November 1, 2020 through April 30, 2021, and for each of the three years in the period ended October 31, 2020, in conformity with accounting principles generally accepted in the United States of America.
Basis for Opinion
These financial statements and financial highlights are the responsibility of the Fund’s management. Our responsibility is to express an opinion on the Fund’s financial statements and financial highlights based on our audits. We are a public accounting firm registered with the Public Company Accounting Oversight Board (United States) (PCAOB) and are required to be independent with respect to the Fund in accordance with the U.S. federal securities laws and the applicable rules and regulations of the Securities and Exchange Commission and the PCAOB.
We conducted our audits in accordance with the standards of the PCAOB. Those standards require that we plan and perform the audit to obtain reasonable assurance about whether the financial statements and financial highlights are free of material misstatement, whether due to error or fraud. The Fund is not required to have, nor were we engaged to perform, an audit of its internal control over financial reporting. As part of our audits we are required to obtain an understanding of internal control over financial reporting but not for the purpose of expressing an opinion on the effectiveness of the Fund’s internal control over financial reporting. Accordingly, we express no such opinion.
Our audits included performing procedures to assess the risks of material misstatement of the financial statements and financial highlights, whether due to error or fraud, and performing procedures that respond to those risks. Such procedures included examining, on a test basis, evidence regarding the amounts and disclosures in the financial statements and financial highlights. Our audits also included evaluating the accounting principles used and significant estimates made by management, as well as evaluating the overall presentation of the financial statements and financial highlights. Our procedures included confirmation of securities owned as of April 30, 2023, by correspondence with custodians or counterparties; when replies were not received, we performed other auditing procedures. We believe that our audits provide a reasonable basis for our opinion.
Deloitte & Touche LLP
Boston, Massachusetts
June 22, 2023
We have served as the auditor of one or more BlackRock investment companies since 1992.
| | |
REPORT OF INDEPENDENT REGISTERED PUBLIC ACCOUNTING FIRM | | 85 |
| | |
| Important Tax Information (unaudited) | | |
The following amounts, or maximum amounts allowable by law, are hereby designated as qualified dividend income for individuals for the fiscal year ended April 30, 2023:
| | | | |
| | |
| Fund Name | | Qualified Dividend Income | |
| |
BlackRock Global Allocation Fund, Inc. | | $ | 74,827,398 | |
The following amount, or maximum amount allowable by law, is hereby designated as qualified business income for individuals for the fiscal year ended April 30, 2023:
| | | | |
| | |
| Fund Name | | Qualified Business Income | |
| |
BlackRock Global Allocation Fund, Inc. | | $ | 800,604 | |
The Fund hereby designates the following amount, or maximum amount allowable by law, as capital gain dividends, subject to a long-term capital gains tax rate as noted below, for the fiscal year ended April 30, 2023:
| | | | |
| | |
| Fund Name | | 20% Rate Long-Term Capital Gain Dividends | |
| |
BlackRock Global Allocation Fund, Inc. | | $ | 576,806,712 | |
The Fund hereby designates the following amount, or maximum amount allowable by law, of distributions from direct federal obligation interest for the fiscal year ended April 30, 2023:
| | | | |
| | |
| Fund Name | | Federal Obligation
Interest | |
| |
BlackRock Global Allocation Fund, Inc. | | $ | 12,138,773 | |
The following percentage, or maximum percentage allowable by law, of ordinary income distributions paid during the fiscal year ended April 30, 2023 qualified for the dividends-received deduction for corporate shareholders:
| | | | |
| | |
| Fund Name | | Dividends-Received Deduction | |
| |
BlackRock Global Allocation Fund, Inc. | | | 5.99 | % |
The Fund hereby designates the following amount, or maximum amount allowable by law, as interest income eligible to be treated as a Section 163(j) interest dividend for the fiscal year ended April 30, 2023:
| | | | |
| | |
| Fund Name | | Interest Dividends | |
| |
BlackRock Global Allocation Fund, Inc. | | $ | 117,070,777 | |
The Fund hereby designates the following amount, or maximum amount allowable by law, as interest-related dividends and qualified short-term capital gains eligible for exemption from U.S. withholding tax for nonresident aliens and foreign corporations for the fiscal year ended April 30, 2023:
| | | | | | | | |
| | | |
| Fund Name | | Interest
Related
Dividends | | | Qualified
Short-Term
Capital Gains | |
| | |
BlackRock Global Allocation Fund, Inc. | | $ | 59,820,802 | | | $ | 565,089,300 | |
| | |
| 86 | | 2 0 2 3 BLACK ROCK ANNUAL REPORT TO SHAREHOLDERS |
Statement Regarding Liquidity Risk Management Program
In compliance with Rule 22e-4 under the Investment Company Act of 1940, as amended (the “Liquidity Rule”), BlackRock Global Allocation Fund, Inc. (the “Fund”) has adopted and implemented a liquidity risk management program (the “Program”), which is reasonably designed to assess and manage the Fund’s liquidity risk.
The Board of Directors (the “Board”) of the Fund met on November 8-9, 2022 (the “Meeting”) to review the Program. The Board previously appointed BlackRock Advisors, LLC or BlackRock Fund Advisors (“BlackRock”), each an investment adviser to certain BlackRock funds, as the program administrator for the Fund’s Program, as applicable. BlackRock also previously delegated oversight of the Program to the 40 Act Liquidity Risk Management Committee (the “Committee”). At the Meeting, the Committee, on behalf of BlackRock, provided the Board with a report that addressed the operation of the Program and assessed its adequacy and effectiveness of implementation, including the management of the Fund’s Highly Liquid Investment Minimum (“HLIM”) where applicable, and any material changes to the Program (the “Report”). The Report covered the period from October 1, 2021 through September 30, 2022 (the “Program Reporting Period”).
The Report described the Program’s liquidity classification methodology for categorizing the Fund’s investments (including derivative transactions) into one of four liquidity buckets. It also referenced the methodology used by BlackRock to establish the Fund’s HLIM and noted that the Committee reviews and ratifies the HLIM assigned to the Fund no less frequently than annually. The Report also discussed notable events affecting liquidity over the Program Reporting Period, including the imposition of capital controls in certain countries.
The Report noted that the Program complied with the key factors for consideration under the Liquidity Rule for assessing, managing and periodically reviewing the Fund’s liquidity risk, as follows:
| | a) | The Fund’s investment strategy and liquidity of portfolio investments during both normal and reasonably foreseeable stressed conditions. During the Program Reporting Period, the Committee reviewed whether the Fund’s strategy is appropriate for an open-end fund structure with a focus on funds with more significant and consistent holdings of less liquid and illiquid assets. The Committee also factored a fund’s concentration in an issuer into the liquidity classification methodology by taking issuer position sizes into account. Where a fund participated in borrowings for investment purposes (such as tender option bonds or reverse repurchase agreements), such borrowings were factored into the Program’s calculation of a fund’s liquidity bucketing. A fund’s derivative exposure was also considered in such calculation. |
| | b) | Short-term and long-term cash flow projections during both normal and reasonably foreseeable stressed conditions. During the Program Reporting Period, the Committee reviewed historical redemption activity and used this information as a component to establish the Fund’s reasonably anticipated trading size utilized for liquidity classifications. The Fund has adopted an in-kind redemption policy which may be utilized to meet larger redemption requests. The Committee may also take into consideration a fund’s shareholder ownership concentration (which, depending on product type and distribution channel, may or may not be available), a fund’s distribution channels, and the degree of certainty associated with a fund’s short-term and long-term cash flow projections. |
| | c) | Holdings of cash and cash equivalents, as well as borrowing arrangements. The Committee considered the terms of the credit facility committed to the Fund, the financial health of the institution providing the facility and the fact that the credit facility is shared among multiple funds (including that a portion of the aggregate commitment amount is specifically designated for BlackRock Floating Rate Income Portfolio, a series of BlackRock Funds V, and BlackRock Floating Rate Loan ETF, a series of BlackRock ETF Trust II). The Committee also considered other types of borrowing available to the Fund, such as the ability to use reverse repurchase agreements and interfund lending, as applicable. |
There were no material changes to the Program during the Program Reporting Period other than the enhancement of certain model components in the Program’s classification methodology. The Report provided to the Board stated that the Committee concluded that based on the operation of the functions, as described in the Report, the Program is operating as intended and is effective in implementing the requirements of the Liquidity Rule.
| | |
STATEMENT REGARDING LIQUIDITY RISK MANAGEMENT PROGRAM | | 87 |
Director and Officer Information
| | | | | | | | |
| Independent Directors(a) |
| | | | | |
Name Year of Birth(b) | | Position(s) Held (Length of Service)(c) | | Principal Occupation(s) During Past 5 Years | | Number of BlackRock-Advised Registered Investment Companies (“RICs”) Consisting of Investment Portfolios (“Portfolios”) Overseen | | Public Company and Other Investment Company Directorships Held During Past 5 Years |
| | | | |
Mark Stalnecker 1951 | | Chair of the Board and Director (Since 2019) | | Chief Investment Officer, University of Delaware from 1999 to 2013; Trustee and Chair of the Finance and Investment Committees, Winterthur Museum and Country Estate from 2005 to 2016; Member of the Investment Committee, Delaware Public Employees’ Retirement System since 2002; Member of the Investment Committee, Christiana Care Health System from 2009 to 2017; Member of the Investment Committee, Delaware Community Foundation from 2013 to 2014; Director and Chair of the Audit Committee, SEI Private Trust Co. from 2001 to 2014. | | 28 RICs consisting of 166 Portfolios | | None |
| | | | |
Susan J. Carter 1956 | | Director (Since 2019) | | Trustee, Financial Accounting Foundation from 2017 to 2021; Advisory Board Member, Center for Private Equity and Entrepreneurship at Tuck School of Business from 1997 to 2021; Director, Pacific Pension Institute from 2014 to 2018; Senior Advisor, Commonfund Capital, Inc. (“CCI”) (investment adviser) in 2015; Chief Executive Officer, CCI from 2013 to 2014; President & Chief Executive Officer, CCI from 1997 to 2013; Advisory Board Member, Girls Who Invest from 2015 to 2018 and Board Member thereof from 2018 to 2022; Advisory Board Member, Bridges Fund Management since 2016; Practitioner Advisory Board Member, Private Capital Research Institute (“PCRI”) since 2017; Lecturer in the Practice of Management, Yale School of Management since 2019; Advisor to Finance Committee, Altman Foundation since 2020; Investment Committee Member, Tostan since 2021; Member of the President’s Counsel, Commonfund since 2023. | | 28 RICs consisting of 166 Portfolios | | None |
| | | | |
Collette Chilton 1958 | | Director (Since 2019) | | Chief Investment Officer, Williams College since 2006; Chief Investment Officer, Lucent Asset Management Corporation from 1998 to 2006; Director, Boys and Girls Club of Boston since 2017; Director, B1 Capital since 2018; Director, David and Lucile Packard Foundation since 2020. | | 28 RICs consisting of 166 Portfolios | | None |
| | | | |
Neil A. Cotty 1954 | | Director (Since 2019) | | Bank of America Corporation from 1996 to 2015, serving in various senior finance leadership roles, including Chief Accounting Officer from 2009 to 2015, Chief Financial Officer of Global Banking, Markets and Wealth Management from 2008 to 2009, Chief Accounting Officer from 2004 to 2008, Chief Financial Officer of Consumer Bank from 2003 to 2004, Chief Financial Officer of Global Corporate Investment Bank from 1999 to 2002. | | 28 RICs consisting of 166 Portfolios | | None |
| | | | |
Lena G. Goldberg 1949 | | Director (Since 2016) | | Director, Pioneer Legal Institute since 2023; Director, Charles Stark Draper Laboratory, Inc. from 2013 to 2021; Senior Lecturer, Harvard Business School from 2008 to 2021; FMR LLC/Fidelity Investments (financial services) from 1996 to 2008, serving in various senior roles including Executive Vice President - Strategic Corporate Initiatives and Executive Vice President and General Counsel; Partner, Sullivan & Worcester LLP from 1985 to 1996 and Associate thereof from 1979 to 1985. | | 28 RICs consisting of 166 Portfolios | | None |
| | |
| 88 | | 2 0 2 3 BLACK ROCK ANNUAL REPORT TO SHAREHOLDERS |
Director and Officer Information (continued)
| | | | | | | | |
| Independent Directors(a) (continued) |
| | | | | |
Name Year of Birth(b) | | Position(s) Held (Length of Service)(c) | | Principal Occupation(s) During Past 5 Years | | Number of BlackRock-Advised Registered Investment Companies (“RICs”) Consisting of Investment Portfolios (“Portfolios”) Overseen | | Public Company and Other Investment Company Directorships Held During Past 5 Years |
| | | | |
Henry R. Keizer 1956 | | Director (Since 2016) | | Director, Park Indemnity Ltd. (captive insurer) from 2010 to 2022. | | 28 RICs consisting of 166 Portfolios | | GrafTech International Ltd. (materials manufacturing); Sealed Air Corp. (packaging); WABCO (commercial vehicle safety systems) from 2015 to 2020; Hertz Global Holdings (car rental) from 2015 to 2021 |
| | | | |
Cynthia A. Montgomery 1952 | | Director (Since 2019) | | Professor, Harvard Business School since 1989. | | 28 RICs consisting of 166 Portfolios | | None |
| | | | |
Donald C. Opatrny 1952 | | Director (Since 2015) | | Chair of the Board of Phoenix Art Museum since 2022 and Trustee thereof since 2018; Chair of the Investment Committee of The Arizona Community Foundation since 2022 and trustee thereof since 2020; Director, Athena Capital Advisors LLC (investment management firm) from 2013 to 2020; Trustee, Vice Chair, Member of the Executive Committee and Chair of the Investment Committee, Cornell University from 2004 to 2019; President and Trustee, the Center for the Arts, Jackson Hole from 2011 to 2018; Member of the Board and Investment Committee, University School from 2007 to 2018; Member of Affordable Housing Supply Board of Jackson, Wyoming since 2017; Member, Investment Funds Committee, State of Wyoming since 2017; Trustee, Artstor (a Mellon Foundation affiliate) from 2010 to 2015; Member of the Investment Committee, Mellon Foundation from 2009 to 2015; President, Trustee and Member of the Investment Committee, The Aldrich Contemporary Art Museum from 2007 to 2014; Trustee and Chair of the Investment Committee, Community Foundation of Jackson Hole since 2014. | | 28 RICs consisting of 166 Portfolios | | None |
| | | | |
Kenneth L. Urish 1951 | | Director (Since 2019) | | Managing Partner, Urish Popeck & Co., LLC (certified public accountants and consultants) since 1976; Past- Chairman of the Professional Ethics Committee of the Pennsylvania Institute of Certified Public Accountants and Committee Member thereof since 2007; Member of External Advisory Board, The Pennsylvania State University Accounting Department since 2001, Emeritus since 2022; Principal, UP Strategic Wealth Investment Advisors, LLC since 2013; Trustee, The Holy Family Institute from 2001 to 2010; President and Trustee, Pittsburgh Catholic Publishing Associates from 2003 to 2008; Director, Inter-Tel from 2006 to 2007; Member, Advisory Board, ESG Competent Boards since 2020. | | 28 RICs consisting of 166 Portfolios | | None |
| | |
DIRECTOR AND OFFICER INFORMATION | | 89 |
Director and Officer Information (continued)
| | | | | | | | |
| Independent Directors(a) (continued) |
| | | | | |
Name Year of Birth(b) | | Position(s) Held (Length of Service)(c) | | Principal Occupation(s) During Past 5 Years | | Number of BlackRock-Advised Registered Investment Companies (“RICs”) Consisting of Investment Portfolios (“Portfolios”) Overseen | | Public Company and Other Investment Company Directorships Held During Past 5 Years |
| | | | |
Claire A. Walton 1957 | | Director (Since 2019) | | Advisory Board Member, Grossman School of Business at the University of Vermont since 2023; Advisory Board Member, Scientific Financial Systems since 2022; General Partner of Neon Liberty Capital Management, LLC since 2003; Chief Operating Officer and Chief Financial Officer of Liberty Square Asset Management, LP from 1998 to 2015; Director, Boston Hedge Fund Group from 2009 to 2018; Director, Massachusetts Council on Economic Education from 2013 to 2015; Director, Woodstock Ski Runners from 2013 to 2022. | | 28 RICs consisting of 166 Portfolios | | None |
|
| Interested Directors(a)(d) |
| | | | | |
Name Year of Birth(b) | | Position(s) Held (Length of Service)(c) | | Principal Occupation(s) During Past 5 Years | | Number of BlackRock-Advised (“RICs”) Consisting of Investment Portfolios (“Portfolios”) Overseen | | Public Company and Other Investment Company Directorships Held During Past 5 Years |
| | | | |
Robert Fairbairn 1965 | | Director (Since 2015) | | Vice Chairman of BlackRock, Inc. since 2019; Member of BlackRock’s Global Executive and Global Operating Committees; Co-Chair of BlackRock’s Human Capital Committee; Senior Managing Director of BlackRock, Inc. from 2010 to 2019; oversaw BlackRock’s Strategic Partner Program and Strategic Product Management Group from 2012 to 2019; Member of the Board of Managers of BlackRock Investments, LLC from 2011 to 2018; Global Head of BlackRock’s Retail and iShares® businesses from 2012 to 2016. | | 98 RICs consisting of 266 Portfolios | | None |
| | | | |
John M. Perlowski(e) 1964 | | Director (Since 2015) President and Chief Executive Officer (Since 2010) | | Managing Director of BlackRock, Inc. since 2009; Head of BlackRock Global Accounting and Product Services since 2009; Advisory Director of Family Resource Network (charitable foundation) since 2009. | | 100 RICs consisting of 268 Portfolios | | None |
| (a) | The address of each Director is c/o BlackRock, Inc., 50 Hudson Yards, New York, NY 10001. |
| (b) | Each Independent Director holds office until his or her successor is duly elected and qualifies or until his or her earlier death, resignation, retirement or removal as provided by the Fund’s by-laws or charter or statute, or until December 31 of the year in which he or she turns 75. Directors who are “interested persons,” as defined in the 1940 Act, serve until their successor is duly elected and qualifies or until their earlier death, resignation, retirement or removal as provided by the Fund’s by-laws or statute, or until December 31 of the year in which they turn 72. The Board may determine to extend the terms of Independent Directors on a case-by-case basis, as appropriate. |
| (c) | Following the combination of Merrill Lynch Investment Managers, L.P. (“MLIM”) and BlackRock, Inc. in September 2006, the various legacy MLIM and legacy BlackRock fund boards were realigned and consolidated into three new fund boards in 2007. In addition, effective January 1, 2019, three BlackRock Fund Complexes were realigned and consolidated into two BlackRock Fund Complexes. As a result, although the chart shows the year that each Independent Director joined the Board, certain Independent Directors first became members of the boards of other BlackRock-advised Funds, legacy MLIM funds or legacy BlackRock funds as follows: Susan J. Carter, 2016; Collette Chilton, 2015; Neil A. Cotty, 2016; Cynthia A. Montgomery, 1994; Mark Stalnecker, 2015; Kenneth L. Urish, 1999; Claire A. Walton, 2016. |
| (d) | Mr. Fairbairn and Mr. Perlowski are both “interested persons,” as defined in the 1940 Act, of the Fund based on their positions with BlackRock, Inc. and its affiliates. Mr. Fairbairn and Mr. Perlowski are also board members of the BlackRock Fixed-Income Complex. |
| (e) | Mr. Perlowski is also a trustee of the BlackRock Credit Strategies Fund and BlackRock Private Investments Fund. |
| | |
| 90 | | 2 0 2 3 BLACK ROCK ANNUAL REPORT TO SHAREHOLDERS |
Director and Officer Information (continued)
| | | | |
| Officers Who Are Not Directors(a) |
| | | |
Name Year of Birth(b) | | Position(s) Held (Length of Service) | | Principal Occupation(s) During Past 5 Years |
| | |
Jennifer McGovern 1977 | | Vice President (Since 2014) | | Managing Director of BlackRock, Inc. since 2016; Director of BlackRock, Inc. from 2011 to 2015; Head of Americas Product Development and Governance for BlackRock’s Global Product Group since 2019; Head of Product Structure and Oversight for BlackRock’s U.S. Wealth Advisory Group from 2013 to 2019. |
| | |
Trent Walker 1974 | | Chief Financial Officer (Since 2021) | | Managing Director of BlackRock, Inc. since September 2019; Executive Vice President of PIMCO from 2016 to 2019; Senior Vice President of PIMCO from 2008 to 2015; Treasurer from 2013 to 2019 and Assistant Treasurer from 2007 to 2017 of PIMCO Funds, PIMCO Variable Insurance Trust, PIMCO ETF Trust, PIMCO Equity Series, PIMCO Equity Series VIT, PIMCO Managed Accounts Trust, 2 PIMCO-sponsored interval funds and 21 PIMCO-sponsored closed-end funds. |
| | |
Jay M. Fife 1970 | | Treasurer (Since 2007) | | Managing Director of BlackRock, Inc. since 2007. |
| | |
Charles Park 1967 | | Chief Compliance Officer (Since 2014) | | Anti-Money Laundering Compliance Officer for certain BlackRock-advised Funds from 2014 to 2015; Chief Compliance Officer of BlackRock Advisors, LLC and the BlackRock-advised Funds in the BlackRock Multi-Asset Complex and the BlackRock Fixed-Income Complex since 2014; Principal of and Chief Compliance Officer for iShares® Delaware Trust Sponsor LLC since 2012 and BlackRock Fund Advisors (“BFA”) since 2006; Chief Compliance Officer for the BFA-advised iShares® exchange traded funds since 2006; Chief Compliance Officer for BlackRock Asset Management International Inc. since 2012. |
| | |
Lisa Belle 1968 | | Anti-Money Laundering Compliance Officer (Since 2019) | | Managing Director of BlackRock, Inc. since 2019; Global Financial Crime Head for Asset and Wealth Management of JP Morgan from 2013 to 2019; Managing Director of RBS Securities from 2012 to 2013; Head of Financial Crimes for Barclays Wealth Americas from 2010 to 2012. |
| | |
Janey Ahn 1975 | | Secretary (Since 2019) | | Managing Director of BlackRock, Inc. since 2018; Director of BlackRock, Inc. from 2009 to 2017. |
(a) The address of each Officer is c/o BlackRock, Inc., 50 Hudson Yards, New York, NY 10001. |
|
| (b) Officers of the Fund serve at the pleasure of the Board. |
Further information about the Fund’s Directors and Officers is available in the Fund’s Statement of Additional Information, which can be obtained without charge by calling (800) 441-7762.
Effective December 31, 2022, Joseph P. Platt retired as a Director of the Fund.
| | |
DIRECTOR AND OFFICER INFORMATION | | 91 |
Additional Information
General Information
Quarterly performance, semi-annual and annual reports, current net asset value and other information regarding the Fund may be found on BlackRock’s website, which can be accessed at blackrock.com. Any reference to BlackRock’s website in this report is intended to allow investors public access to information regarding the Fund and does not, and is not intended to, incorporate BlackRock’s website in this report.
Householding
The Fund will mail only one copy of shareholder documents, including prospectuses, annual and semi-annual reports, Rule 30e-3 notices and proxy statements, to shareholders with multiple accounts at the same address. This practice is commonly called “householding” and is intended to reduce expenses and eliminate duplicate mailings of shareholder documents. Mailings of your shareholder documents may be householded indefinitely unless you instruct us otherwise. If you do not want the mailing of these documents to be combined with those for other members of your household, please call the Fund at (800) 441-7762.
Availability of Quarterly Schedule of Investments
The Fund files its complete schedule of portfolio holdings with the SEC for the first and third quarters of each fiscal year as an exhibit to its reports on Form N-PORT. The Fund’s Form N-PORT is available on the SEC’s website at sec.gov. Additionally, the Fund makes its portfolio holdings for the first and third quarters of each fiscal year available at blackrock.com/fundreports.
Availability of Proxy Voting Policies, Procedures and Voting Records
A description of the policies and procedures that the Fund uses to determine how to vote proxies relating to portfolio securities and information about how the Fund voted proxies relating to securities held in the Fund’s portfolio during the most recent 12-month period ended June 30 is available without charge, upon request (1) by calling (800) 441-7762; (2) on the BlackRock website at blackrock.com; and (3) on the SEC’s website at sec.gov.
BlackRock’s Mutual Fund Family
BlackRock offers a diverse lineup of open-end mutual funds crossing all investment styles and managed by experts in equity, fixed-income and tax-exempt investing. Visit blackrock.com for more information.
Shareholder Privileges
Account Information
Call us at (800) 441-7762 from 8:00 AM to 6:00 PM ET on any business day to get information about your account balances, recent transactions and share prices. You can also visit blackrock.com for more information.
Automatic Investment Plans
Investor class shareholders who want to invest regularly can arrange to have $50 or more automatically deducted from their checking or savings account and invested in any of the BlackRock funds.
Systematic Withdrawal Plans
Investor class shareholders can establish a systematic withdrawal plan and receive periodic payments of $50 or more from their BlackRock funds, as long as their account balance is at least $10,000.
Retirement Plans
Shareholders may make investments in conjunction with Traditional, Rollover, Roth, Coverdell, Simple IRAs, SEP IRAs and 403(b) Plans.
BlackRock Privacy Principles
BlackRock is committed to maintaining the privacy of its current and former fund investors and individual clients (collectively, “Clients”) and to safeguarding their non-public personal information. The following information is provided to help you understand what personal information BlackRock collects, how we protect that information and why in certain cases we share such information with select parties.
If you are located in a jurisdiction where specific laws, rules or regulations require BlackRock to provide you with additional or different privacy-related rights beyond what is set forth below, then BlackRock will comply with those specific laws, rules or regulations.
BlackRock obtains or verifies personal non-public information from and about you from different sources, including the following: (i) information we receive from you or, if applicable, your financial intermediary, on applications, forms or other documents; (ii) information about your transactions with us, our affiliates, or others; (iii) information we receive from a consumer reporting agency; and (iv) from visits to our websites.
| | |
| 92 | | 2 0 2 3 BLACK ROCK ANNUAL REPORT TO SHAREHOLDERS |
Additional Information (continued)
BlackRock Privacy Principles (continued)
BlackRock does not sell or disclose to non-affiliated third parties any non-public personal information about its Clients, except as permitted by law or as is necessary to respond to regulatory requests or to service Client accounts. These non-affiliated third parties are required to protect the confidentiality and security of this information and to use it only for its intended purpose.
We may share information with our affiliates to service your account or to provide you with information about other BlackRock products or services that may be of interest to you. In addition, BlackRock restricts access to non-public personal information about its Clients to those BlackRock employees with a legitimate business need for the information. BlackRock maintains physical, electronic and procedural safeguards that are designed to protect the non-public personal information of its Clients, including procedures relating to the proper storage and disposal of such information.
Fund and Service Providers
| | |
Investment Adviser | | Distributor |
BlackRock Advisors, LLC | | BlackRock Investments, LLC |
Wilmington, DE 19809 | | New York, NY 10001 |
| |
Sub-Adviser | | Independent Registered Public Accounting Firm |
BlackRock (Singapore) Limited | | Deloitte & Touche LLP |
079912 Singapore | | Boston, MA 02116 |
| |
Accounting Agent | | Legal Counsel |
State Street Bank and Trust Company | | Sidley Austin LLP |
Boston, MA 02114 | | New York, NY 10019 |
| |
Custodian | | Address of the Fund |
Brown Brothers Harriman & Co. | | 100 Bellevue Parkway |
Boston, MA 02109 | | Wilmington, DE 19809 |
| |
Transfer Agent | | |
BNY Mellon Investment Servicing (US) Inc. | | |
Wilmington, DE 19809 | | |
| | |
ADDITIONAL INFORMATION | | 93 |
Glossary of Terms Used in this Report
| | |
| Currency Abbreviation |
| |
| AUD | | Australian Dollar |
| |
| BRL | | Brazilian Real |
| |
| CAD | | Canadian Dollar |
| |
| CHF | | Swiss Franc |
| |
| CNH | | Chinese Yuan |
| |
| COP | | Colombian Peso |
| |
| CZK | | Czech Koruna |
| |
| DKK | | Danish Krone |
| |
| EUR | | Euro |
| |
| GBP | | British Pound |
| |
| HKD | | Hong Kong Dollar |
| |
| HUF | | Hungarian Forint |
| |
| IDR | | Indonesian Rupiah |
| |
| INR | | Indian Rupee |
| |
| JPY | | Japanese Yen |
| |
| KRW | | South Korean Won |
| |
| MXN | | Mexican Peso |
| |
| NOK | | Norwegian Krone |
| |
| NZD | | New Zealand Dollar |
| |
| PLN | | Polish Zloty |
| |
| SEK | | Swedish Krona |
| |
| SGD | | Singapore Dollar |
| |
| THB | | Thai Baht |
| |
| TWD | | New Taiwan Dollar |
| |
| USD | | United States Dollar |
| |
| ZAR | | South African Rand |
| | |
| Portfolio Abbreviation |
| |
| ADR | | American Depositary Receipt |
| |
| BZDIOVER | | Overnight Brazil Interbank Deposit (CETIP) |
| |
| CDI | | CREST Depository Interest |
| |
| CLO | | Collateralized Loan Obligation |
| |
| CMT | | Constant Maturity Treasury |
| |
| DAC | | Designated Activity Company |
| |
| DIP | | Debtor-In-Possession |
| |
| ESTR | | Euro Short Term Rate |
| |
| ETF | | Exchange-Traded Fund |
| |
| EURIBOR | | Euro Interbank Offered Rate |
| |
| FTSE | | Financial Times Stock Exchange |
| |
| LIBOR | | London Interbank Offered Rate |
| |
| LP | | Limited Partnership |
| |
| MSCI | | Morgan Stanley Capital International |
| |
| MXIBTIIE | | Mexico Interbank TIIE 28-Day |
| |
| PCL | | Public Company Limited |
| |
| PIK | | Payment-in-Kind |
| |
| PJSC | | Public Joint Stock Company |
| |
| REMIC | | Real Estate Mortgage Investment Conduit |
| |
| S&P | | Standard & Poor’s |
| |
| SAB | | Special Assessment Bonds |
| |
| SCA | | Societe en Commandite par Actions |
| |
| SOFR | | Secured Overnight Financing Rate |
| |
| SOFR CME | | Secured Overnight Financing Rate Chicago Mercantile Exchange |
| |
| SOFRTE | | Term Secured Overnight Financing Rate |
| |
| SONIA | | Sterling Overnight Interbank Average Rate |
| |
| SPDR | | Standard & Poor’s Depository Receipt |
| |
| ST | | Special Tax |
| |
| STACR | | Structured Agency Credit Risk |
| | |
| 94 | | 2 0 2 3 BLACK ROCK ANNUAL REPORT TO SHAREHOLDERS |
Want to know more?
blackrock.com | 800-441-7762
This report is intended for current holders. It is not authorized for use as an offer of sale or a solicitation of an offer to buy shares of the Fund unless preceded or accompanied by the Fund’s current prospectus. Past performance results shown in this report should not be considered a representation of future performance. Investment returns and principal value of shares will fluctuate so that shares, when redeemed, may be worth more or less than their original cost. Statements and other information herein are as dated and are subject to change.
GA-04/23-AR
(b) Not Applicable
| Item 2 – | Code of Ethics – The registrant (or the “Fund”) has adopted a code of ethics, as of the end of the period covered by this report, applicable to the registrant’s principal executive officer, principal financial officer, principal accounting officer or controller, or persons performing similar functions. During the period covered by this report, the code of ethics was amended to update certain information and to make other non-material changes. During the period covered by this report, there have been no waivers granted under the code of ethics. The registrant undertakes to provide a copy of the code of ethics to any person upon request, without charge, who calls 1-800-441-7762. |
| Item 3 – | Audit Committee Financial Expert – The registrant’s board of directors (the “board of directors”), has determined that (i) the registrant has the following audit committee financial experts serving on its audit committee and (ii) each audit committee financial expert is independent: |
Neil A. Cotty
Henry R. Keizer
Kenneth L. Urish
Under applicable securities laws, a person determined to be an audit committee financial expert will not be deemed an “expert” for any purpose, including without limitation for the purposes of Section 11 of the Securities Act of 1933, as a result of being designated or identified as an audit committee financial expert. The designation or identification of a person as an audit committee financial expert does not impose on such person any duties, obligations, or liabilities greater than the duties, obligations, and liabilities imposed on such person as a member of the audit committee and board of directors in the absence of such designation or identification. The designation or identification of a person as an audit committee financial expert does not affect the duties, obligations, or liability of any other member of the audit committee or board of directors.
| Item 4 – | Principal Accountant Fees and Services |
The following table presents fees billed by Deloitte & Touche LLP (“D&T”) in each of the last two fiscal years for the services rendered to the Fund:
| | | | | | | | | | | | | | | | |
| | | (a) Audit Fees | | (b) Audit-Related Fees1 | | (c) Tax Fees2 | | (d) All Other Fees |
| Entity Name | | Current
Fiscal Year
End | | Previous Fiscal Year End | | Current Fiscal Year End | | Previous Fiscal Year End | | Current Fiscal Year End | | Previous Fiscal Year End | | Current Fiscal Year End | | Previous Fiscal Year End |
| BlackRock Global Allocation Fund, Inc. | | $83,130 | | $79,968 | | $44 | | $0 | | $34,400 | | $30,000 | | $218 | | $420 |
The following table presents fees billed by D&T that were required to be approved by the registrant’s audit committee (the “Committee”) for services that relate directly to the operations or financial reporting of the Fund and that are rendered on behalf of BlackRock Advisors, LLC (the “Investment Adviser” or “BlackRock”) and entities controlling, controlled by, or under common control with BlackRock (not including any sub-adviser whose role is primarily portfolio management and is subcontracted with or overseen by another investment adviser) that provide ongoing services to the Fund (“Affiliated Service Providers”):
2
| | | | |
| | | Current Fiscal Year End | | Previous Fiscal Year End |
(b) Audit-Related Fees1 | | $0 | | $0 |
(c) Tax Fees2 | | $0 | | $0 |
(d) All Other Fees3 | | $2,154,000 | | $2,098,000 |
1 The nature of the services includes assurance and related services reasonably related to the performance of the audit or review of financial statements not included in Audit Fees, including accounting consultations, agreed-upon procedure reports, attestation reports, comfort letters, out-of-pocket expenses and internal control reviews not required by regulators.
2 The nature of the services includes tax compliance and/or tax preparation, including services relating to the filing or amendment of federal, state or local income tax returns, regulated investment company qualification reviews, taxable income and tax distribution calculations.
3 Non-audit fees of $2,154,000 and $2,098,000 for the current fiscal year and previous fiscal year, respectively, were paid to the Fund’s principal accountant in their entirety by BlackRock, in connection with services provided to the Affiliated Service Providers of the Fund and of certain other funds sponsored and advised by BlackRock or its affiliates for a service organization review and an accounting research tool subscription. These amounts represent aggregate fees paid by BlackRock and were not allocated on a per fund basis.
(e)(1) Audit Committee Pre-Approval Policies and Procedures:
The Committee has adopted policies and procedures with regard to the pre-approval of services. Audit, audit-related and tax compliance services provided to the registrant on an annual basis require specific pre-approval by the Committee. The Committee also must approve other non-audit services provided to the registrant and those non-audit services provided to the Investment Adviser and Affiliated Service Providers that relate directly to the operations and the financial reporting of the registrant. Certain of these non-audit services that the Committee believes are (a) consistent with the SEC’s auditor independence rules and (b) routine and recurring services that will not impair the independence of the independent accountants may be approved by the Committee without consideration on a specific case-by-case basis (“general pre-approval”). The term of any general pre-approval is 12 months from the date of the pre-approval, unless the Committee provides for a different period. Tax or other non-audit services provided to the registrant which have a direct impact on the operations or financial reporting of the registrant will only be deemed pre-approved provided that any individual project does not exceed $10,000 attributable to the registrant or $50,000 per project. For this purpose, multiple projects will be aggregated to determine if they exceed the previously mentioned cost levels.
Any proposed services exceeding the pre-approved cost levels will require specific pre-approval by the Committee, as will any other services not subject to general pre-approval (e.g., unanticipated but permissible services). The Committee is informed of each service approved subject to general pre-approval at the next regularly scheduled in-person board meeting. At this meeting, an analysis of such services is presented to the Committee for ratification. The Committee may delegate to the Committee Chairman the authority to approve the provision of and fees for any specific engagement of permitted non-audit services, including services exceeding pre-approved cost levels.
(e)(2) None of the services described in each of Items 4(b) through (d) were approved by the Committee pursuant to the de minimis exception in paragraph (c)(7)(i)(C) of Rule 2-01 of Regulation S-X.
(f) Not Applicable
(g) The aggregate non-audit fees, defined as the sum of the fees shown under “Audit-Related Fees,”
3
“Tax Fees” and “All Other Fees,” paid to the accountant for services rendered by the accountant to the registrant, the Investment Adviser and the Affiliated Service Providers were:
| | | | | | | | |
| | | Entity Name | | Current Fiscal Year End | | Previous Fiscal Year End | | |
| | BlackRock Global Allocation Fund, Inc. | | $34,662 | | $30,420 | | |
Additionally, the amounts billed by D&T in connection with services provided to the Affiliated Service Providers of the Fund and of other funds sponsored and advised by BlackRock or its affiliates during the current and previous fiscal years for a service organization review and an accounting research tool subscription were:
| | |
Current Fiscal Year End | | Previous Fiscal Year End |
$2,154,000 | | $2,098,000 |
These amounts represent aggregate fees paid by BlackRock and were not allocated on a per fund basis.
(h) The Committee has considered and determined that the provision of non-audit services that were rendered to the Investment Adviser and the Affiliated Service Providers that were not pre-approved pursuant to paragraph (c)(7)(ii) of Rule 2-01 of Regulation S-X is compatible with maintaining the principal accountant’s independence.
(i) – Not Applicable
(j) – Not Applicable
| Item 5 – | Audit Committee of Listed Registrant – Not Applicable |
(a) The registrant’s Schedule of Investments is included as part of the Report to Stockholders filed under Item 1(a) of this Form.
(b) Not Applicable due to no such divestments during the semi-annual period covered since the previous Form N-CSR filing.
| Item 7 – | Disclosure of Proxy Voting Policies and Procedures for Closed-End Management Investment Companies – Not Applicable |
| Item 8 – | Portfolio Managers of Closed-End Management Investment Companies – Not Applicable |
| Item 9 – | Purchases of Equity Securities by Closed-End Management Investment Company and Affiliated Purchasers – Not Applicable |
4
| Item 10 – | Submission of Matters to a Vote of Security Holders – There have been no material changes to these procedures. |
| Item 11 – | Controls and Procedures |
(a) The registrant’s principal executive and principal financial officers, or persons performing similar functions, have concluded that the registrant’s disclosure controls and procedures (as defined in Rule 30a-3(c) under the Investment Company Act of 1940, as amended (the “1940 Act”)) are effective as of a date within 90 days of the filing of this report based on the evaluation of these controls and procedures required by Rule 30a-3(b) under the 1940 Act and Rule 15d-15(b) under the Securities Exchange Act of 1934, as amended.
(b) There were no changes in the registrant’s internal control over financial reporting (as defined in Rule 30a-3(d) under the 1940 Act) that occurred during the period covered by this report that have materially affected, or are reasonably likely to materially affect, the registrant’s internal control over financial reporting.
| Item 12 – | Disclosure of Securities Lending Activities for Closed-End Management Investment Companies – Not Applicable |
| Item 13 – | Exhibits attached hereto |
(a)(1) Code of Ethics – See Item 2
(a)(2) Section 302 Certifications are attached
(a)(3) Any written solicitation to purchase securities under Rule 23c-1 – Not Applicable
(a)(4) Change in Registrant’s independent public accountant – Not Applicable
(b) Section 906 Certifications are attached
5
Pursuant to the requirements of the Securities Exchange Act of 1934 and the Investment Company Act of 1940, the registrant has duly caused this report to be signed on its behalf by the undersigned, thereunto duly authorized.
BlackRock Global Allocation Fund, Inc.
| | | | |
| | By: | | /s/ John M. Perlowski |
| | | | John M. Perlowski |
| | | | Chief Executive Officer (principal executive officer) of |
| | | | BlackRock Global Allocation Fund, Inc. |
Date: June 22, 2023
Pursuant to the requirements of the Securities Exchange Act of 1934 and the Investment Company Act of 1940, this report has been signed below by the following persons on behalf of the registrant and in the capacities and on the dates indicated.
| | | | |
| | By: | | /s/ John M. Perlowski |
| | | | John M. Perlowski |
| | | | Chief Executive Officer (principal executive officer) of |
| | | | BlackRock Global Allocation Fund, Inc. |
Date: June 22, 2023
| | | | |
| | By: | | /s/ Trent Walker |
| | | | Trent Walker |
| | | | Chief Financial Officer (principal financial officer) of |
| | | | BlackRock Global Allocation Fund, Inc. |
Date: June 22, 2023
6