UNITED STATES
SECURITIES AND EXCHANGE COMMISSION
Washington, D.C. 20549
FORM N-CSR
CERTIFIED SHAREHOLDER REPORT OF REGISTERED MANAGEMENT INVESTMENT COMPANIES
Investment Company Act file number: 811-05576
| Name of Fund: | BlackRock Global Allocation Fund, Inc. |
| Fund Address: | 100 Bellevue Parkway, Wilmington, DE 19809 |
Name and address of agent for service: John M. Perlowski, Chief Executive Officer, BlackRock Global Allocation Fund, Inc., 55 East 52nd Street, New York, NY 10055
Registrant’s telephone number, including area code: (800) 441-7762
Date of fiscal year end: 04/30/2021
Date of reporting period: 04/30/2021
Item 1 – Report to Stockholders
(a) The Report to Shareholders is attached herewith.
| APRIL 30, 2021 |

| 2021 Annual Report | ||
BlackRock Global Allocation Fund, Inc.
| Not FDIC Insured • May Lose Value • No Bank Guarantee |
Dear Shareholder,
The 12-month reporting period as of April 30, 2021 reflected a remarkable period of adaptation and recovery, as the global economy dealt with the implications of the coronavirus (or “COVID-19”) pandemic. As the period began, the response to the virus’s spread was well underway, and countries around the world felt the effect of economically disruptive countermeasures. Stay-at-home orders and closures of non-essential businesses were imposed in many parts of the world, workers were laid off, and unemployment claims spiked, causing a global recession.
As May 2020 began, stocks had just begun to recover from the lowest point following the onset of the pandemic. This recovery continued throughout the reporting period, as businesses continued re-opening and governments learned to adapt to life with the virus. Equity prices rose through the summer, fed by strong fiscal and monetary support and improving economic indicators. The implementation of mass vaccination campaigns and passage of an additional $1.9 trillion of fiscal stimulus further boosted stocks, and many equity indices neared or surpassed all-time highs late in the reporting period. In the United States, both large- and small-capitalization stocks posted a significant advance. International equities also gained, as both developed countries and emerging markets rebounded substantially.
The 10-year U.S. Treasury yield (which is inversely related to bond prices) had fallen sharply prior to the beginning of the reporting period, which meant bonds were priced for extreme risk avoidance and economic disruption. Despite expectations of doom and gloom, the economy expanded rapidly, stoking inflation concerns late in the reporting period, which led to higher yields and a negative overall return for most U.S. Treasuries. In the corporate bond market, support from the U.S. Federal Reserve (the “Fed”) assuaged credit concerns and led to substantial returns for high-yield corporate bonds, although investment-grade corporates declined slightly.
The Fed remained committed to accommodative monetary policy by maintaining near zero interest rates and by announcing that inflation could exceed its 2% target for a sustained period without triggering a rate increase. To stabilize credit markets, the Fed also continued purchasing significant quantities of bonds, as did other influential central banks around the world, including the European Central Bank and the Bank of Japan.
Looking ahead, while coronavirus-related disruptions have clearly hindered worldwide economic growth, we believe that the global expansion will continue to accelerate as vaccination efforts ramp up and pent-up consumer demand leads to higher spending. While we expect inflation to increase somewhat as the expansion continues, we believe the recent uptick owes more to temporary supply disruptions than a lasting change in fundamentals. The change in Fed policy also means that moderate inflation is less likely to be followed by interest rate hikes that could threaten the economic expansion.
Overall, we favor a positive stance toward risk, with an overweight in equities. We see U.S. and Asian equities outside of Japan benefiting from structural growth trends in technology, while emerging markets should be particularly helped by a vaccine-led economic expansion. While we are underweight overall on credit, global high-yield and Asian bonds present attractive opportunities. We believe that international diversification and a focus on sustainability can help provide portfolio resilience, and the disruption created by the coronavirus appears to be accelerating the shift toward sustainable investments.
In this environment, our view is that investors need to think globally, extend their scope across a broad array of asset classes, and be nimble as market conditions change. We encourage you to talk with your financial advisor and visit blackrock.com for further insight about investing in today’s markets.
Sincerely,

Rob Kapito
President, BlackRock Advisors, LLC

Rob Kapito
President, BlackRock Advisors, LLC
| Total Returns as of April 30, 2021 | ||||
| 6-Month | 12-Month | |||
U.S. large cap equities | 28.85% | 45.98% | ||
U.S. small cap equities | 48.06 | 74.91 | ||
International equities | 28.84 | 39.88 | ||
Emerging market equities | 22.95 | 48.71 | ||
3-month Treasury bills | 0.05 | 0.11 | ||
U.S. Treasury securities | (6.26) | (7.79) | ||
U.S. investment grade bonds | (1.52) | (0.27) | ||
Tax-exempt municipal bonds | 2.42 | 7.40 | ||
U.S. high yield bonds | 7.98 | 19.57 | ||
Past performance is not an indication of future results. Index performance is shown for illustrative purposes only. You cannot invest directly in an index. | ||||
| 2 | THIS PAGE IS NOT PART OF YOUR FUND REPORT |
| Page | ||||
| 2 | ||||
Annual Report: | ||||
| 4 | ||||
| 7 | ||||
| 7 | ||||
| 8 | ||||
Financial Statements: | ||||
| 9 | ||||
| 57 | ||||
| 60 | ||||
| 62 | ||||
| 63 | ||||
| 68 | ||||
| 84 | ||||
| 85 | ||||
| 86 | ||||
| 87 | ||||
| 91 | ||||
| 93 | ||||

| 3 |
Investment Objective
BlackRock Global Allocation Fund, Inc.’s (the “Fund”) investment objective is to provide high total investment return through a fully managed investment policy utilizing United States and foreign equity securities, debt and money market securities, the combination of which will be varied from time to time both with respect to types of securities and markets in response to changing market and economic trends. Total return means the combination of capital growth and investment income.
On April 7, 2021, the Board of Directors of the Fund approved a change in the fiscal year end of the Fund, effective as of April 30, 2021, from October 31 to April 30.
Portfolio Management Commentary
How did the Fund perform?
For the abbreviated annual reporting period from November 1, 2020 to April 30, 2021, the Fund outperformed its reference benchmark, which is comprised of the S&P 500® Index (36%), FTSE World (ex-U.S.) Index (24%), ICE BofA Current 5-Year U.S. Treasury Index (24%) and FTSE Non-U.S. Dollar World Government Bond Index (16%) (the “Reference Benchmark”), and underperformed the broad-based all-equity benchmark, the FTSE World Index. The Fund invests in both equities and bonds; therefore, Fund management believes that the Reference Benchmark provides a more accurate representation of the Fund’s composition and a more comparable means for measurement. The following discussion of relative performance pertains to the Reference Benchmark. The following commentary (and referenced allocation percentages) are based on the economic exposures of the Fund, which reflect adjustments for futures, swaps, and options (except with respect to fixed income securities), and convertible bonds, and may vary relative to the market value.
What factors influenced performance?
From an equity sector perspective, stock selection in information technology (“IT”), financials and industrials was additive to performance. Stock selection in healthcare also benefited performance although this contribution was partially offset by an overweight to the sector. Within fixed income, exposure to U.S. corporate credit, namely high yield issues, positively impacted performance.
From an equity sector perspective, stock selection within energy and materials negatively impacted returns. Within fixed income, positioning in U.S. Treasuries detracted from performance. Exposure to cash and cash equivalents and to gold-related securities negatively impacted returns. Currency management, notably an underweight to the Australian dollar, weighed on performance as well.
The Fund uses derivatives, which may include options, futures, swaps and forward contracts both to seek to enhance returns of the Fund and to hedge (or protect) against adverse movements in currency exchange rates, interest rates and movements in the securities markets. During the period, the Fund’s use of derivatives modestly detracted from the Fund’s performance.
Describe recent portfolio activity.
During the six-month period, the Fund’s overall equity allocation increased from 64% to 67% of net assets. Within equities, the Fund increased exposure to Europe and decreased exposure to Japan. On a sector basis, the Fund increased exposure to financials, materials, industrials, energy and utilities, and reduced exposure to healthcare and consumer staples.
The Fund’s allocation to fixed income decreased from 28% to 23% of net assets. Within fixed income, the Fund increased exposure to securitized debt and bank loans, and decreased exposure to government bonds, primarily in the United States, and to corporate credit.
The Fund’s exposure to commodity-related securities decreased from 2% to 1% of net assets.
Describe portfolio positioning at period end.
Relative to its Reference Benchmark, the Fund ended the period overweight in equities and underweight in fixed income, with modest exposure to gold-related securities and a larger allocation to cash and cash equivalents. Within equities, the Fund was overweight in Europe, the United States and China, and underweight in Japan and Australia. From a sector perspective, the Fund was overweight in consumer discretionary, materials, industrials, IT, healthcare, financials and communication services, and underweight in real estate and consumer staples.
Within fixed income, the Fund was underweight in U.S. Treasuries, developed European sovereign debt and Japanese government bonds. In addition, the Fund was overweight in corporate credit and securitized debt. With respect to currency exposure, the Fund was overweight in the Chinese yuan and U.S. dollar, and was underweight in the Australian dollar.
The views expressed reflect the opinions of BlackRock as of the date of this report and are subject to change based on changes in market, economic or other conditions. These views are not intended to be a forecast of future events and are no guarantee of future results.
| 4 | 2 0 2 1 BLACK ROCK ANNUAL REPORT TO SHAREHOLDERS |
| Fund Summary as of April 30, 2021 (continued) | BlackRock Global Allocation Fund, Inc. |
TOTAL RETURN BASED ON A $10,000 INVESTMENT
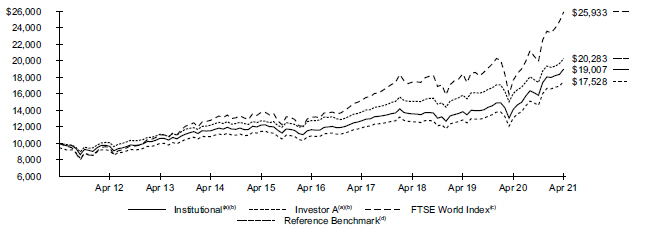
| (a) | Assuming maximum sales charges, if any, transaction costs and other operating expenses including advisory fees. Institutional Shares do not have a sales charge. |
| (b) | The Fund invests in a portfolio of U.S. and foreign equity securities, debt and money market securities, the combination of which will be varied from time to time with respect to types of securities and markets in response to changing market and economic trends. |
| (c) | This unmanaged capitalization-weighted index is comprised of 2,620 equities from 35 countries in 4 regions, including the United States. |
| (d) | The Reference Benchmark is an unmanaged weighted index comprised as follows: 36% S&P 500® Index; 24% FTSE World (ex-U.S.) Index; 24% ICE BofA Current 5-Year U.S. Treasury Index; and 16% FTSE Non-U.S. Dollar World Government Bond Index. |
Performance Summary for the Period Ended April 30, 2021
| Average Annual Total Returns(a) | ||||||||||||||||||||||||||||||||||||||||
| 1 Year | 5 Years | 10 Years | ||||||||||||||||||||||||||||||||||||||
| 6-Month Total Returns | Without Sales Charge | With Sales Charge | Without Sales Charge | With Sales Charge | Without Sales Charge | With Sales Charge | ||||||||||||||||||||||||||||||||||
Institutional | 20.07 | % | 34.57 | % | N/A | 10.27 | % | N/A | 6.63 | % | N/A | |||||||||||||||||||||||||||||
Investor A | 19.95 | 34.20 | 27.15 | % | 9.97 | 8.79 | % | 6.34 | 5.77 | % | ||||||||||||||||||||||||||||||
Investor C | 19.50 | 33.25 | 32.25 | 9.16 | 9.16 | 5.71 | 5.71 | |||||||||||||||||||||||||||||||||
Class K | 20.16 | 34.74 | N/A | 10.36 | N/A | 6.68 | N/A | |||||||||||||||||||||||||||||||||
Class R | 19.74 | 33.79 | N/A | 9.61 | N/A | 5.99 | N/A | |||||||||||||||||||||||||||||||||
FTSE World Index | 30.08 | 46.95 | N/A | 14.52 | N/A | 10.00 | N/A | |||||||||||||||||||||||||||||||||
Reference Benchmark | 16.67 | 26.42 | N/A | 9.70 | N/A | 7.33 | N/A | |||||||||||||||||||||||||||||||||
U.S. Stocks: S&P 500® Index(b) | 28.85 | 45.98 | N/A | 17.42 | N/A | 14.17 | N/A | |||||||||||||||||||||||||||||||||
Non-U.S. Stocks: FTSE World (ex-U.S.) Index(c) | 31.45 | 45.31 | N/A | 10.15 | N/A | 5.37 | N/A | |||||||||||||||||||||||||||||||||
Non-U.S. Bonds: FTSE Non-U.S. Dollar World Government Bond Index(d) | (0.83 | ) | 5.49 | N/A | 1.88 | N/A | 0.85 | N/A | ||||||||||||||||||||||||||||||||
U.S. Bonds: ICE BofA Current 5-Year U.S. Treasury Index(e) | (1.62 | ) | (1.55 | ) | N/A | 2.18 | N/A | 2.53 | N/A | |||||||||||||||||||||||||||||||
| (a) | Assuming maximum sales charges, if any. Average annual total returns with and without sales charges reflect reductions for distribution and service fees. See “About Fund Performance” for a detailed description of share classes, including any related sales charges and fees, and how performance was calculated for certain share classes. |
| (b) | This unmanaged index covers 500 leading companies and captures approximately 80% coverage of available market capitalization. |
| (c) | This unmanaged capitalization-weighted index is comprised of 1,985 equities from 34 countries, excluding the United States. |
| (d) | This unmanaged market capitalization-weighted index tracks 22 government bond indexes, excluding the United States. |
| (e) | This unmanaged index is designed to track the total return of the current coupon five-year U.S. Treasury bond. |
N/A — Not applicable as the share class and index do not have a sales charge.
Past performance is not an indication of future results.
Performance results may include adjustments made for financial reporting purposes in accordance with U.S. generally accepted accounting principles.
FUND SUMMARY | 5 |
| Fund Summary as of April 30, 2021 (continued) | BlackRock Global Allocation Fund, Inc. |
Expense Example
Actual | Hypothetical(a) | |||||||||||||||||||||||||||||||||||||||||||
| Expenses Paid During the Period | Including Dividend Expense and Broker Fees and Expenses on Short Sales | Excluding Dividend Expense and Broker Fees and Expenses on Short Sales | Annualized Expense Ratio | |||||||||||||||||||||||||||||||||||||||||
| Beginning Account Value (11/01/20) |
|
| Ending Account Value (04/30/21) |
| | Including Dividend Expense and Broker Fees and Expenses on Short Sales(b) |
| | Excluding Dividend Expense and Broker Fees and Expenses on Short Sales(b) |
|
| Beginning Account Value (11/01/20) |
|
| Ending Account Value (04/30/21) |
|
| Expenses Paid During the Period(b) |
|
| Ending Account Value (04/30/21) |
|
| Expenses Paid During the Period(b) |
| | Including Dividend Expense and Broker Fees and Expenses on Short Sales |
| | Excluding Dividend Expense and Broker Fees and Expenses on Short Sales |
| ||||||||||||
Institutional | $ | 1,000.00 | $ | 1,200.70 | $ | 4.37 | $ | 4.37 | $ | 1,000.00 | $ | 1,020.83 | $ | 4.01 | $ | 1,020.83 | $ | 4.01 | 0.80 | % | 0.80 | % | ||||||||||||||||||||||
Investor A | 1,000.00 | 1,199.50 | 5.78 | 5.73 | 1,000.00 | 1,019.54 | 5.31 | 1,019.59 | 5.26 | 1.06 | 1.05 | |||||||||||||||||||||||||||||||||
Investor C | 1,000.00 | 1,195.00 | 10.01 | 9.96 | 1,000.00 | 1,015.67 | 9.20 | 1,015.72 | 9.15 | 1.84 | 1.83 | |||||||||||||||||||||||||||||||||
Class K | 1,000.00 | 1,201.60 | 3.93 | 3.88 | 1,000.00 | 1,021.22 | 3.61 | 1,021.27 | 3.56 | 0.72 | 0.71 | |||||||||||||||||||||||||||||||||
Class R | 1,000.00 | 1,197.40 | 7.68 | 7.63 | 1,000.00 | 1,017.80 | 7.05 | 1,017.85 | 7.00 | 1.41 | 1.40 | |||||||||||||||||||||||||||||||||
| (a) | Hypothetical 5% annual return before expenses is calculated by prorating the number of days in the most recent fiscal half year divided by 365. |
| (b) | For each class of the Fund, expenses are equal to the annualized expense ratio for the class, multiplied by the average account value over the period, multiplied by 181/365 (to reflect the six-month period shown). |
See “Disclosure of Expenses” for further information on how expenses were calculated.
Portfolio Information
TEN LARGEST HOLDINGS (EQUITY INVESTMENTS)
| Security | | Percent of Total Investments(a) | | |
Microsoft Corp. | 2% | |||
Apple, Inc. | 2 | |||
Alphabet, Inc. | 2 | |||
Amazon.com, Inc. | 1 | |||
Bank of America Corp. | 1 | |||
JPMorgan Chase & Co. | 1 | |||
Mastercard, Inc. | 1 | |||
Johnson & Johnson | 1 | |||
UnitedHealth Group, Inc. | 1 | |||
Taiwan Semiconductor Manufacturing Co. Ltd. | 1 |
GEOGRAPHIC ALLOCATION
| Percent of | ||||||||||||
| Total Investments(b) | ||||||||||||
| Country/Geographic Region | Long | Short | Total | |||||||||
United States | 61 | % | 1 | % | 62 | % | ||||||
China | 5 | — | (c) | 5 | ||||||||
Germany | 4 | — | 4 | |||||||||
France | 4 | — | 4 | |||||||||
Italy | 3 | — | 3 | |||||||||
United Kingdom | 3 | — | 3 | |||||||||
Netherlands | 3 | — | 3 | |||||||||
Japan | 2 | — | 2 | |||||||||
Australia | 1 | — | 1 | |||||||||
Canada | 1 | — | 1 | |||||||||
Taiwan | 1 | — | 1 | |||||||||
Sweden | 1 | — | 1 | |||||||||
Other# | 10 | — | 10 | |||||||||
| 99 | % | 1 | % | 100 | % | |||||||
|
|
|
|
|
| |||||||
| (a) | Excludes short-term securities. |
| (b) | Total investments include the gross values of long and short equity securities of the underlying derivative contracts utilized by the Fund and exclude short-term securities. |
| (c) | Rounds to less than 1% of total investments. |
| # | Includes holdings within countries/geographic regions that are 1% or less of total investments. Please refer to the Consolidated Schedule of Investments for such countries. |
| 6 | 2 0 2 1 BLACK ROCK ANNUAL REPORT TO SHAREHOLDERS |
Institutional and Class K Shares are not subject to any sales charge. These shares bear no ongoing distribution or service fees and are available only to certain eligible investors. Class K Shares performance shown prior to the Class K Shares inception date of June 8, 2016 is that of Institutional Shares. The performance of the Fund’s Class K Shares would be substantially similar to Institutional Shares because Class K Shares and Institutional Shares invest in the same portfolio of securities and performance would only differ to the extent that Class K Shares and Institutional Shares have different expenses. The actual returns of Class K Shares would have been higher than those of the Institutional Shares because Class K Shares have lower expenses than the Institutional Shares.
Investor A Shares are subject to a maximum initial sales charge (front-end load) of 5.25% and a service fee of 0.25% per year (but no distribution fee). Certain redemptions of these shares may be subject to a contingent deferred sales charge (“CDSC”) where no initial sales charge was paid at the time of purchase. These shares are generally available through financial intermediaries.
Investor C Shares are subject to a 1.00% CDSC if redeemed within one year of purchase. In addition, these shares are subject to a distribution fee of 0.75% per year and a service fee of 0.25% per year. These shares are generally available through financial intermediaries. These shares automatically convert to Investor A Shares after approximately eight years.
Class R Shares are not subject to any sales charge. These shares are subject to a distribution fee of 0.25% per year and a service fee of 0.25% per year. These shares are available only to certain employer-sponsored retirement plans.
Past performance is not an indication of future results. Financial markets have experienced extreme volatility and trading in many instruments has been disrupted. These circumstances may continue for an extended period of time, and may continue to affect adversely the value and liquidity of the fund’s investments. As a result, current performance may be lower or higher than the performance data quoted. Refer to blackrock.com to obtain performance data current to the most recent month-end. Performance results do not reflect the deduction of taxes that a shareholder would pay on Fund distributions or the redemption of Fund shares. Figures shown in the performance table on the previous page assume reinvestment of all distributions, if any, at net asset value (“NAV”) on the ex-dividend date or payable date, as applicable. Investment return and principal value of shares will fluctuate so that shares, when redeemed, may be worth more or less than their original cost. Distributions paid to each class of shares will vary because of the different levels of service, distribution and transfer agency fees applicable to each class, which are deducted from the income available to be paid to shareholders.
BlackRock Advisors, LLC (the “Manager”), the Fund’s investment adviser, has contractually and/or voluntarily agreed to waive and/or reimburse a portion of the Fund’s expenses. Without such waiver(s) and/or reimbursement(s), the Fund’s performance would have been lower. With respect to the Fund’s voluntary waiver(s), if any, the Manager is under no obligation to waive and/or reimburse or to continue waiving and/or reimbursing its fees and such voluntary waiver(s) may be reduced or discontinued at any time. With respect to the Fund’s contractual waiver(s), if any, the Manager is under no obligation to continue waiving and/or reimbursing its fees after the applicable termination date of such agreement. See the Notes to Consolidated Financial Statements for additional information on waivers and/or reimbursements.
Shareholders of the Fund may incur the following charges: (a) transactional expenses, such as sales charges; and (b) operating expenses, including investment advisory fees, service and distribution fees, including 12b-1 fees, acquired fund fees and expenses, and other fund expenses. The expense example shown (which is based on a hypothetical investment of $1,000 invested on November 1, 2020 and held through April 30, 2021) is intended to assist shareholders both in calculating expenses based on an investment in the Fund and in comparing these expenses with similar costs of investing in other mutual funds.
The expense example provides information about actual account values and actual expenses. In order to estimate the expenses a shareholder paid during the period covered by this report, shareholders can divide their account value by $1,000 and then multiply the result by the number corresponding to their share class under the heading entitled “Expenses Paid During the Period.”
The expense example also provides information about hypothetical account values and hypothetical expenses based on the Fund’s actual expense ratio and an assumed rate of return of 5% per year before expenses. In order to assist shareholders in comparing the ongoing expenses of investing in the Fund and other funds, compare the 5% hypothetical example with the 5% hypothetical examples that appear in shareholder reports of other funds.
The expenses shown in the expense example are intended to highlight shareholders’ ongoing costs only and do not reflect transactional expenses, such as sales charges, if any. Therefore, the hypothetical example is useful in comparing ongoing expenses only, and will not help shareholders determine the relative total expenses of owning different funds. If these transactional expenses were included, shareholder expenses would have been higher.
ABOUT FUND PERFORMANCE / DISCLOSURE OF EXPENSES | 7 |
The Fund may invest in various derivative financial instruments. These instruments are used to obtain exposure to a security, commodity, index, market, and/or other assets without owning or taking physical custody of securities, commodities and/or other referenced assets or to manage market, equity, credit, interest rate, foreign currency exchange rate, commodity and/or other risks. Derivative financial instruments may give rise to a form of economic leverage and involve risks, including the imperfect correlation between the value of a derivative financial instrument and the underlying asset, possible default of the counterparty to the transaction or illiquidity of the instrument. The Fund’s successful use of a derivative financial instrument depends on the investment adviser’s ability to predict pertinent market movements accurately, which cannot be assured. The use of these instruments may result in losses greater than if they had not been used, may limit the amount of appreciation the Fund can realize on an investment and/or may result in lower distributions paid to shareholders. The Fund’s investments in these instruments, if any, are discussed in detail in the Notes to Consolidated Financial Statements.
| 8 | 2 0 2 1 BLACK ROCK ANNUAL REPORT TO SHAREHOLDERS |
Consolidated Schedule of Investments April 30, 2021 | BlackRock Global Allocation Fund, Inc. (Percentages shown are based on Net Assets) |
| Security | Par (000) | Value | ||||||||||
Asset-Backed Securities | ||||||||||||
Cayman Islands — 0.4% | ||||||||||||
522 Funding CLO Ltd., Series 2019-4A, Class CR, (3 mo. LIBOR US + 2.40%), 2.59%, 04/20/30(a)(b) | USD | 500 | $ | 498,943 | ||||||||
AGL Core CLO 5 Ltd.(a)(b) | ||||||||||||
Series 2020-5A, Class A2, (3 mo. LIBOR US + 2.35%), 2.54%, 07/20/30 | 1,500 | 1,503,934 | ||||||||||
Series 2020-5A, Class B, (3 mo. LIBOR US + 2.78%), 2.97%, 07/20/30 | 2,025 | 2,029,926 | ||||||||||
ALM Ltd., Series 2020-1A, Class A2, (3 mo. LIBOR US + 1.85%), 2.03%, 10/15/29(a)(b) | 373 | 372,945 | ||||||||||
ALM VII Ltd., Series 2012 - 7A, Class A1A2, (3 mo. LIBOR US + 1.17%), 1.35%, 07/15/29(a)(b) | 250 | 249,885 | ||||||||||
AMMC CLO 22 Ltd., Series 2018-22A, Class B, (3 mo. LIBOR US + 1.45%), 1.63%, 04/25/31(a)(b) | 375 | 375,377 | ||||||||||
Anchorage Capital CLO 2018-10 Ltd., Series 2018-10A, Class A2, (3 mo. LIBOR US + 1.50%), 1.68%, 10/15/31(a)(b) | 250 | 249,610 | ||||||||||
Anchorage Capital CLO 7 Ltd., (3 mo. LIBOR US + 1.09%), 1.27%, 01/28/31(a)(b) | 250 | 250,054 | ||||||||||
Apidos CLO APID, (3 mo. LIBOR US + 1.50%), 1.69%, | 500 | 496,490 | ||||||||||
Apidos CLO XX, Series 2015-20A, Class A2RR, (3 mo. LIBOR US + 1.55%), 1.73%, 07/16/31(a)(b) | 400 | 398,235 | ||||||||||
Apidos CLO XXIII, Series 2015-23A, Class B1R, (3 mo. LIBOR US + 1.60%), 1.78%, 04/15/33(a)(b) | 250 | 249,408 | ||||||||||
Apidos CLO XXXI, Series 2019-31A, Class A2, (3 mo. LIBOR US + 1.65%), 1.83%, 04/15/31(a)(b) | 250 | 250,068 | ||||||||||
Ares XXXVII CLO Ltd., Series 2015-4A, Class A3R, (3 mo. LIBOR US + 1.50%), 1.68%, 10/15/30(a)(b) | 250 | 249,243 | ||||||||||
ASSURANT CLO I Ltd., Series 2017-1A, Class C, (3 mo. LIBOR US + 2.10%), 2.29%, | 458 | 457,713 | ||||||||||
ASSURANT CLO Ltd., Series 2019-5A, Class A2, (3 mo. LIBOR US + 1.75%), 1.93%, 01/15/33(a)(b) | 250 | 251,437 | ||||||||||
Atrium XII, Series 12A, Class BR, (3 mo. LIBOR US + 1.35%), 1.53%, 04/22/27(a)(b) | 695 | 687,905 | ||||||||||
Atrium XIII, Series 13A, Class B, (3 mo. LIBOR US + 1.50%), 1.67%, 11/21/30(a)(b) | 600 | 595,057 | ||||||||||
Bain Capital Credit CLO 2017-1 Ltd., Series 2017-1A, Class B, (3 mo. LIBOR US + 1.80%), 1.99%, 07/20/30(a)(b) | 350 | 350,273 | ||||||||||
Bain Capital Credit CLO 2018-2, Series 2018-2A, | ||||||||||||
Class B, (3 mo. LIBOR US + 1.60%), 1.79%, 07/19/31(a)(b) | 750 | 748,023 | ||||||||||
Bain Capital Credit CLO Ltd.(a)(b) | ||||||||||||
Series 2018-1A, Class A1, (3 mo. LIBOR US + 0.96%), 1.13%, 04/23/31. | 250 | 248,118 | ||||||||||
Series 2020-2A, Class B1, (3 mo. LIBOR US + 2.50%), 2.69%, 07/21/31 | 1,575 | 1,577,944 | ||||||||||
Barings CLO Ltd. 2019-III, Series 2019-3A, Class A2, (3 mo. LIBOR US + 1.75%), 1.94%, 04/20/31(a)(b) | 250 | 250,066 | ||||||||||
| Security | Par (000) | Value | ||||||||||
| Cayman Islands (continued) | ||||||||||||
Battalion CLO Ltd., 1.36%, | USD | 1,848 | $ | 1,847,891 | ||||||||
Battalion CLO VIII Ltd., Series 2015-8A, Class A1R2, (3 mo. LIBOR US + 1.07%), 1.26%, 07/18/30(a)(b) | 500 | 498,488 | ||||||||||
Battalion CLO X Ltd.(a)(b) | ||||||||||||
Series 2016-10A, Class A1R2, (3 mo. LIBOR US + 1.17%), 1.35%, 01/25/35 | 2,212 | 2,202,310 | ||||||||||
Series 2016-10A, Class A2R2, (3 mo. LIBOR US + 1.55%), 1.73%, 01/25/35 | 1,465 | 1,453,789 | ||||||||||
Battalion CLO XI Ltd., Series 2017-11A, Class BR, (3 mo. LIBOR US + 1.72%), 1.90%, 04/24/34(a)(b) | 712 | 710,478 | ||||||||||
Beechwood Park CLO Ltd., Series 2019-1A, Class B2A, (3 mo. LIBOR US + 1.75%), 1.94%, 01/17/33(a)(b) | 500 | 500,360 | ||||||||||
Benefit Street Partners CLO II Ltd., Series 2013-IIA, Class A2R2, (3 mo. LIBOR US + 1.45%), 1.63%, 07/15/29(a)(b) | 1,845 | 1,842,560 | ||||||||||
Benefit Street Partners CLO III Ltd., Series 2013-IIIA, Class A2R2, (3 mo. LIBOR US + 1.65%), 1.83%, 07/20/29(a)(b) | 667 | 667,000 | ||||||||||
Benefit Street Partners CLO VI Ltd., Series 2015-VIA, Class A1R, (3 mo. LIBOR US + 1.24%), 1.43%, 10/18/29(a)(b) | 250 | 250,050 | ||||||||||
Benefit Street Partners CLO VIII Ltd., Series 2015-8A, Class A1AR, (3 mo. LIBOR US + 1.10%), 1.29%, 01/20/31(a)(b) | 1,000 | 998,012 | ||||||||||
Birch Grove CLO Ltd., Series 19X, Class A, (3 mo. LIBOR US + 1.49%), 1.67%, 06/15/31 | 3,342 | 3,342,597 | ||||||||||
BlueMountain CLO Ltd., Series 2014-2A, Class BR2, (3 mo. LIBOR US + 1.75%), 1.94%, 10/20/30(a)(b) | 465 | 465,513 | ||||||||||
BlueMountain CLO XXII Ltd., Series 2018-22A, Class B, (3 mo. LIBOR US + 1.50%), 1.68%, 07/15/31(a)(b) | 1,495 | 1,485,296 | ||||||||||
BlueMountain CLO XXIII Ltd., Series 2018-23A, Class A1, (3 mo. LIBOR US + 1.15%), 1.34%, 10/20/31(a)(b) | 250 | 249,186 | ||||||||||
BlueMountain CLO XXIV Ltd., Series 2019-24A, Class C, (3 mo. LIBOR US + 2.70%), 2.89%, 04/20/31(a)(b) | 1,665 | 1,659,733 | ||||||||||
BlueMountain CLO XXVI Ltd., Series 2019-26A, Class B, (3 mo. LIBOR US + 1.98%), 2.17%, 10/20/32(a)(b) | 250 | 250,512 | ||||||||||
Canyon Capital CLO 2015-1 Ltd., Series 2015-1A, Class AJ, (3 mo. LIBOR US + 1.35%), 1.53%, 04/15/29(a)(b) | 250 | 250,010 | ||||||||||
Canyon Capital CLO Ltd., Series 2016-1A, Class CR, (3 mo. LIBOR US + 1.90%), 2.08%, 07/15/31(a)(b) | 250 | 244,694 | ||||||||||
Canyon CLO 2020-3 Ltd., Series 2020-3A, Class B, (3 mo. LIBOR US + 1.70%), 1.93%, 01/15/34(a)(b) | 250 | 249,365 | ||||||||||
Carlyle C17 CLO Ltd., (3 mo. LIBOR US + 1.03%), 1.24%, 04/30/31(a)(b) | 250 | 249,104 | ||||||||||
Carlyle Global Market Strategies CLO Ltd., (3 mo. LIBOR US + 0.97%), 1.16%, 04/17/31(a)(b) | 748 | 743,462 | ||||||||||
CONSOLIDATED SCHEDULE OF INVESTMENTS | 9 |
Consolidated Schedule of Investments (continued) April 30, 2021 | BlackRock Global Allocation Fund, Inc. (Percentages shown are based on Net Assets) |
| Security | Par (000) | Value | ||||||||||
| Cayman Islands (continued) | ||||||||||||
Catskill Park CLO Ltd., Series 2017-1A, Class A1B, (3 mo. LIBOR US + 1.35%), 1.54%, 04/20/29(a)(b) | USD | 892 | $ | 892,198 | ||||||||
CBAM 2019-9 Ltd., Series 2019-9A, Class B2, (3 mo. LIBOR US + 1.90%), 2.08%, 02/12/30(a)(b) | 450 | 449,485 | ||||||||||
Cedar Funding IV CLO Ltd., Series 2014-4A, Class BR, (3 mo. LIBOR US + 1.60%), 1.77%, | 250 | 249,999 | ||||||||||
Cedar Funding IX CLO Ltd., Series 2018-9A, Class A1, (3 mo. LIBOR US + 0.98%), 1.17%, | 1,050 | 1,045,946 | ||||||||||
Cedar Funding V CLO Ltd., Series 2016-5A, Class A1R, (3 mo. LIBOR US + 1.10%), 1.29%, 07/17/31(a)(b) | 250 | 249,999 | ||||||||||
Cedar Funding VI CLO Ltd., Series 2016-6A, Class ARR, (3 mo. LIBOR US + 1.05%), 1.24%, 04/20/34(a)(b)(d) | 1,700 | 1,700,000 | ||||||||||
Cedar Funding VII Clo Ltd., Series 2018-7A, Class A1, (3 mo. LIBOR US + 1.00%), 1.19%, | 300 | 299,094 | ||||||||||
CIFC Funding Ltd.(a)(b) | ||||||||||||
Series 2013-3RA, Class A1, (3 mo. LIBOR US + 0.98%), 1.16%, 04/24/31 | 450 | 447,105 | ||||||||||
Series 2013-4A, Class BRR, (3 mo. LIBOR US + 1.60%), 1.78%, 04/27/31 | 450 | 447,720 | ||||||||||
Series 2014-5A, Class A1R2, (3 mo. LIBOR US + 1.20%), 1.39%, 10/17/31 | 250 | 249,758 | ||||||||||
Series 2015-3A, Class BR, (3 mo. LIBOR US + 1.15%), 1.34%, 04/19/29 | 712 | 696,118 | ||||||||||
Dryden 45 Senior Loan Fund | ||||||||||||
1.79%, 07/18/30 | 250 | 250,050 | ||||||||||
Series 2016-45A, Class BR, (3 mo. LIBOR US + 1.70%), 1.88%, 10/15/30(a)(b) | 250 | 250,024 | ||||||||||
Elevation CLO 2017-7 Ltd., Series 2017-7A, Class A, (3 mo. LIBOR US + 1.22%), 1.40%, | 250 | 250,013 | ||||||||||
Elmwood CLO II Ltd.(a)(b) | ||||||||||||
Series 2019-2A, Class AR, (3 mo. LIBOR US + 1.15%), 1.34%, 04/20/34 | 650 | 647,589 | ||||||||||
Series 2019-2A, Class BR, (3 mo. LIBOR US + 1.65%), 1.84%, 04/20/34 | 975 | 969,572 | ||||||||||
Elmwood CLO IV Ltd., Series 2020-1A, Class A, (3 mo. LIBOR US + 1.24%), 1.42%, | 300 | 300,480 | ||||||||||
Flatiron CLO 18 Ltd., Series 2018-1A, Class A, (3 mo. LIBOR US + 0.95%), 1.14%, | 437 | 437,712 | ||||||||||
Flatiron CLO 19 Ltd., Series 2019-1A, Class A, (3 mo. LIBOR US + 1.32%), 1.51%, | 500 | 501,762 | ||||||||||
Fort Washington CLO Ltd., Series 2019-1A, Class B, (3 mo. LIBOR US + 2.10%), 2.29%, | 250 | 251,469 | ||||||||||
Galaxy XIX CLO Ltd., Series 2015-19A, Class A1RR, (3 mo. LIBOR US + 0.95%), 1.13%, | 335 | 332,690 | ||||||||||
| Security | Par (000) | Value | ||||||||||
| Cayman Islands (continued) | ||||||||||||
Galaxy XVIII CLO Ltd., Series 2018-28A, Class A1, (3 mo. LIBOR US + 1.10%), 1.28%, 07/15/31(a)(b) | USD | 250 | $ | 249,999 | ||||||||
Galaxy XXII CLO Ltd., Series 2016-22A, Class ARR, (3 mo. LIBOR US + 1.20%), 1.38%, 04/16/34(a)(b)(c) | 1,009 | 1,009,330 | ||||||||||
Goldentree Loan Management US Clo 3 Ltd., Series 2018-3A, Class B1, (3 mo. LIBOR US + 1.55%), 1.74%, 04/20/30(a)(b) | 250 | 249,345 | ||||||||||
GoldenTree Loan Opportunities IX Ltd., Series 2014-9A, Class BR2, (3 mo. LIBOR US + 1.60%), 1.78%, 10/29/29(a)(b) | 500 | 499,999 | ||||||||||
Goldentree Loan Opportunities XI Ltd., Series 2015-11A, Class AR2, (3 mo. LIBOR US + 1.07%), 1.26%, 01/18/31(a)(b) | 250 | 249,688 | ||||||||||
Greywolf CLO III Ltd., Series 2020-3RA, Class A1R, (3 mo. LIBOR US + 1.29%), 1.47%, 04/15/33(a)(b) | 500 | 500,938 | ||||||||||
Gulf Stream Meridian 1 Ltd., , 1.00%, 07/15/34(c) | 5,073 | 5,073,397 | ||||||||||
HPS Loan Management 6-2015 Ltd., Series 6A-2015, Class A1R, (3 mo. LIBOR US + 1.00%), 1.20%, 02/05/31(a)(b) | 497 | 496,995 | ||||||||||
Jamestown CLO XII Ltd., Series 2019-1A, Class A2, (3 mo. LIBOR US + 2.15%), 2.34%, 04/20/32(a)(b) | 442 | 447,482 | ||||||||||
Jamestown CLO XV Ltd., Series 2020-15A, Class A, (3 mo. LIBOR US + 1.34%), 1.52%, 04/15/33(a)(b) | 250 | 250,748 | ||||||||||
Kayne CLO 8 Ltd., Series 2020-8A, Class A1, (3 mo. LIBOR US + 1.70%), 1.88%, 07/15/31(a)(b) | 500 | 501,800 | ||||||||||
KKR Clo 17 Ltd., Series 17, Class AR, (3 mo. LIBOR US + 1.08%), 1.26%, 04/15/34(a)(b) | 500 | 498,216 | ||||||||||
KVK CLO 2018-1 Ltd., Series 2018-1A, Class A, (3 mo. LIBOR US + 0.93%), 1.11%, 05/20/29(a)(b) | 186 | 186,334 | ||||||||||
LCM XVIII LP, Series 18A, Class A1R, (3 mo. LIBOR US + 1.02%), 1.21%, 04/20/31(a)(b) | 250 | 249,275 | ||||||||||
Logan CLO I Ltd. 07/34 1, 0.00%, 07/20/34(e) | 1,848 | 1,848,464 | ||||||||||
Longfellow Place CLO Ltd., Series 2013-1A, Class BR3, (3 mo. LIBOR US + 1.75%), 1.93%, 04/15/29(a)(b) | 500 | 498,964 | ||||||||||
Madison Park Funding XI Ltd., (3 mo. LIBOR US + 0.90%), 1.07%, 07/23/29(a)(b) | 2,467 | 2,464,148 | ||||||||||
Madison Park Funding XXIII Ltd., Series 2017-23A, Class B, (3 mo. LIBOR US + 1.70%), 1.88%, 07/27/30(a)(b) | 250 | 249,672 | ||||||||||
Madison Park Funding XXV Ltd., Series 2017-25A, Class A2R, (3 mo. LIBOR US + 1.65%), 1.74%, 04/25/29(a)(b)(d) | 712 | 712,000 | ||||||||||
Madison Park Funding XXVI Ltd., Series 2007-4A, Class AR, (3 mo. LIBOR US + 1.20%), 1.38%, 07/29/30(a)(b) | 461 | 460,736 | ||||||||||
Madison Park Funding XXXI Ltd., Series 2018-31A, Class B, (3 mo. LIBOR US + 1.70%), 1.87%, 01/23/31(a)(b) | 250 | 249,572 | ||||||||||
Madison Park Funding XXXVI Ltd., Series 2019-36A, Class B1, (3 mo. LIBOR US + 1.85%), 2.03%, 01/15/33(a)(b) | 1,481 | 1,480,021 | ||||||||||
| 10 | 2 0 2 1 BLACK ROCK ANNUAL REPORT TO SHAREHOLDERS |
Consolidated Schedule of Investments (continued) April 30, 2021 | BlackRock Global Allocation Fund, Inc. (Percentages shown are based on Net Assets) |
| Security | Par (000) | Value | ||||||||||
| Cayman Islands (continued) | ||||||||||||
Mariner CLO 2016-3 LLC(a)(b) | ||||||||||||
Series 2016-3A, Class AR2, (3 mo. LIBOR US + 0.99%), 1.16%, 07/23/29 | USD | 250 | $ | 249,192 | ||||||||
Series 2016-3A, Class BR2, (3 mo. LIBOR US + 1.50%), 1.67%, 07/23/29(d) | 500 | 500,000 | ||||||||||
Mariner CLO 8 Ltd., Series 2020-8A, Class A, (3 mo. LIBOR US + 1.27%), 1.46%, | 250 | 250,812 | ||||||||||
Neuberger Berman CLO Ltd. | ||||||||||||
1.21%, 01/28/30 | 250 | 250,200 | ||||||||||
1.00%, 07/15/34 | 250 | 250,000 | ||||||||||
Neuberger Berman CLO XVI-S Ltd., Series 2017-16SA, Class AR, (3 mo. LIBOR US + 1.04%), 1.24%, 04/15/34(a)(b)(d) | 2,990 | 2,989,402 | ||||||||||
Neuberger Berman CLO XXII Ltd., Series 2016-22A, Class BR, (3 mo. LIBOR US + 1.65%), 1.84%, 10/17/30(a)(b) | 250 | 250,213 | ||||||||||
Ocean Trails CLO, Series 2016-6A, Class BRR, (3 mo. LIBOR US + 1.45%), 1.63%, 07/15/28(a)(b) | 800 | 798,448 | ||||||||||
Ocean Trails CLO VI, Series 2016-6A, Class CRR, (3 mo. LIBOR US + 2.25%), 2.43%, 07/15/28(a)(b) | 700 | 697,723 | ||||||||||
OCP CLO 2014-5 Ltd., Series 2014-5A, Class A2R, (3 mo. LIBOR US + 1.40%), 1.58%, 04/26/31(a)(b) | 450 | 443,513 | ||||||||||
OCP CLO Ltd.(a)(b) | ||||||||||||
Series 2016-11A, Class A2R, (3 mo. LIBOR US + 1.75%), 1.93%, 10/26/30 | 500 | 500,356 | ||||||||||
Series 2017-13A, Class A2A, (3 mo. LIBOR US + 1.80%), 1.98%, 07/15/30 | 1,146 | 1,146,958 | ||||||||||
Octagon Investment Partners 18-R Ltd., Series 2018-18A, Class A1A, (3 mo. LIBOR US + 0.96%), 1.14%, 04/16/31(a)(b) | 711 | 706,156 | ||||||||||
Octagon Investment Partners 29 Ltd., Series 2016-1A, Class AR, (3 mo. LIBOR US + 1.18%), 1.36%, 01/24/33(a)(b) | 250 | 250,057 | ||||||||||
Octagon Investment Partners 37 Ltd., Series 2018-2A, Class A2, (3 mo. LIBOR US + 1.58%), 1.76%, 07/25/30(a)(b) | 250 | 250,050 | ||||||||||
Octagon Investment Partners 46 Ltd.(a)(b) | ||||||||||||
Series 2020-2A, Class A, (3 mo. LIBOR US + 1.65%), 1.83%, 07/15/33 | 2,750 | 2,754,671 | ||||||||||
Series 2020-2A, Class B, (3 mo. LIBOR US + 2.20%), 2.38%, 07/15/33 | 800 | 800,921 | ||||||||||
Octagon Investment Partners 48 Ltd., Series 2020-3A, Class C, (3 mo. LIBOR US + 2.55%), 2.74%, 10/20/31(a)(b) | 850 | 853,324 | ||||||||||
Octagon Investment Partners XV Ltd., Series 2013-1A, Class A2R, (3 mo. LIBOR US + 1.35%), 1.54%, 07/19/30(a)(b) | 487 | 487,374 | ||||||||||
Octagon Investment Partners XVII Ltd.(a)(b) | ||||||||||||
Series 2013-1A, Class A1R2, (3 mo. LIBOR US + 1.00%), 1.18%, 01/25/31 | 250 | 250,000 | ||||||||||
Series 2013-1A, Class A2R2, (3 mo. LIBOR US + 1.10%), 1.28%, 01/25/31 | 300 | 299,309 | ||||||||||
| Security | Par (000) | Value | ||||||||||
| Cayman Islands (continued) | ||||||||||||
OHA Credit Funding 7 Ltd., Series 2020-7A, Class A, (3 mo. LIBOR US + 1.25%), 1.44%, 10/19/32(a)(b) | USD | 350 | $ | 350,178 | ||||||||
OHA Credit Funding Ltd., Series 2019-3A, Class B1, (3 mo. LIBOR US + 1.80%), 1.99%, 07/20/32(a)(b) | 922 | 921,994 | ||||||||||
OHA Loan Funding 2016-1 Ltd., Series 2016-1A, Class B1R, (3 mo. LIBOR US + 1.60%), 1.79%, 01/20/33(a)(b) | 250 | 248,357 | ||||||||||
Palmer Square CLO Ltd.(a)(b) | ||||||||||||
Series 2018-1A, Class A1, (3 mo. LIBOR US + 1.03%), 1.22%, 04/18/31 | 250 | 250,062 | ||||||||||
Series 2018-3A, Class B, (3 mo. LIBOR US + 1.90%), 2.09%, 08/15/26 | 930 | 929,732 | ||||||||||
Palmer Square Loan Funding | ||||||||||||
Series 2018-4A, Class A2, (3 mo. LIBOR US + 1.45%), 1.64%, 11/15/26 | 625 | 621,582 | ||||||||||
Series 2018-5A, Class A2, (3 mo. LIBOR US + 1.40%), 1.59%, 01/20/27 | 1,296 | 1,287,365 | ||||||||||
Park Avenue Institutional Advisers CLO Ltd.(a)(b) | ||||||||||||
(3 mo. LIBOR US + 1.20%), 1.38%, 08/23/31 | 500 | 500,141 | ||||||||||
(3 mo. LIBOR US + 1.55%), 1.75%, 02/14/34 | 500 | 495,963 | ||||||||||
Series 2019-1A, Class A2A, (3 mo. LIBOR US + 2.00%), 2.19%, 05/15/32. | 250 | 249,999 | ||||||||||
Pikes Peak CLO 1, (3 mo. LIBOR US + 1.18%), 1.36%, 07/24/31(a)(b) | 555 | 555,599 | ||||||||||
Race Point VIII CLO Ltd., Series 2013-8A, Class AR2, (3 mo. LIBOR US + 1.04%), 1.22%, 02/20/30(a)(b) | 346 | 345,674 | ||||||||||
Recette Clo Ltd., Series 2015-1A, Class BRR, (3 mo. LIBOR US + 1.40%), 1.59%, 04/20/34(a)(b) | 250 | 246,112 | ||||||||||
Regatta XVIII Funding Ltd., Series 2021-1A, Class B, (3 mo. LIBOR US + 1.45%), 1.54%, 01/15/34(a)(b) | 350 | 347,348 | ||||||||||
Rockford Tower CLO 2017-1 Ltd., Series 2017-1A, Class BR2A, (3 mo. LIBOR US + 1.65%), 1.83%, 04/20/34(a)(b) | 500 | 500,000 | ||||||||||
Rockford Tower CLO Ltd.(a)(b) | ||||||||||||
Series 2017-2A, Class BR, (3 mo. LIBOR US + 1.50%), 1.68%, 10/15/29 | 500 | 492,515 | ||||||||||
Series 2018-1A, Class A, (3 mo. LIBOR US + 1.10%), 1.28%, 05/20/31 | 250 | 250,121 | ||||||||||
Romark CLO II Ltd., Series 2018-2A, Class A1, (3 mo. LIBOR US + 1.18%), 1.35%, 07/25/31(a)(b) | 250 | 250,001 | ||||||||||
RR 11 Ltd., Series 2020-11A, Class A2, (3 mo. LIBOR US + 2.10%), 2.28%, 10/15/31(a)(b) | 875 | 880,047 | ||||||||||
Signal Peak CLO 5 Ltd., Series 2018-5A, Class A, (3 mo. LIBOR US + 1.11%), 1.29%, 04/25/31(a)(b) | 300 | 299,513 | ||||||||||
Signal Peak CLO 8 Ltd., Series 2020-8A, Class B, (3 mo. LIBOR US + 1.65%), 1.84%, 04/20/33(a)(b) | 300 | 297,280 | ||||||||||
Sixth Street CLO XVI Ltd., Series 2020-16A, Class B, (3 mo. LIBOR US + 1.85%), 2.04%, 10/20/32(a)(b) | 710 | 713,775 | ||||||||||
CONSOLIDATED SCHEDULE OF INVESTMENTS | 11 |
Consolidated Schedule of Investments (continued) April 30, 2021 | BlackRock Global Allocation Fund, Inc. (Percentages shown are based on Net Assets) |
| Security | Par ( 000) | Value | ||||||||||
| Cayman Islands (continued) | ||||||||||||
Sound Point Clo XV Ltd., Series 2017-1A, Class BR, (3 mo. LIBOR US + 1.50%), 1.69%, | USD | 250 | $ | 248,816 | ||||||||
Sound Point CLO XXVIII Ltd., Series 2020-3A, Class A1, (3 mo. LIBOR US + 1.28%), 1.53%, 01/25/32(a)(b) | 1,186 | 1,187,917 | ||||||||||
Stratus CLO 2020-2 Ltd., Series 2020-2A, Class A, (3 mo. LIBOR US + 1.30%), 1.48%, | 201 | 201,452 | ||||||||||
Symphony CLO XVI Ltd., Series 2015-16A, Class AR, (3 mo. LIBOR US + 1.15%), 1.33%, 10/15/31(a)(b) | 250 | 250,080 | ||||||||||
TCI-Symphony CLO 2017-1 Ltd., Series 2017-1A, Class B, (3 mo. LIBOR US + 1.70%), 1.88%, 07/15/30(a)(b) | 250 | 249,680 | ||||||||||
TCW CLO 2019-1 AMR Ltd., Series 2019-1A, Class B, (3 mo. LIBOR US + 1.68%), 1.87%, | 711 | 711,477 | ||||||||||
TICP CLO LTD TICP 2017 8A B 144A, (3 mo. LIBOR US + 2.15%), 2.34%, 10/20/30(a)(b) | 250 | 250,027 | ||||||||||
TICP CLO VI 2016-2 Ltd.(a)(b) | ||||||||||||
Series 2016-6A, Class AR2, (3 mo. LIBOR US + 1.12%), 1.30%, 01/15/34. | 500 | 499,133 | ||||||||||
Series 2016-6A, Class BR2, (3 mo. LIBOR US + 1.50%), 1.68%, 01/15/34. | 500 | 492,661 | ||||||||||
TICP CLO XII Ltd., Class 12A, (3 mo. LIBOR US + 1.65%), 1.83%, 01/15/31(a)(b) | 1,120 | 1,117,750 | ||||||||||
TICP CLO XIV Ltd.(a)(b) | ||||||||||||
Series 2019-14A, Class A1A, (3 mo. LIBOR US + 1.34%), 1.53%, 10/20/32 | 500 | 500,462 | ||||||||||
Series 2019-14A, Class A1B, (3 mo. LIBOR US + 1.70%), 1.89%, 10/20/32 | 500 | 501,804 | ||||||||||
TRESTLES CLO III Ltd., Series 2020-3A, Class A1, (3 mo. LIBOR US + 1.33%), 1.52%, | 2,489 | 2,494,219 | ||||||||||
TRESTLES CLO Ltd., (3 mo. LIBOR US + 0.99%), 1.93%, | 600 | 598,491 | ||||||||||
Trimaran Cavu Ltd., Class B, (3 mo. LIBOR US + 2.20%), 2.39%, 07/20/32(a)(b) | 500 | 503,451 | ||||||||||
Trinitas CLO XI Ltd., Series 2019-11A, Class C, (3 mo. LIBOR US + 3.15%), 3.33%, | 1,116 | 1,119,376 | ||||||||||
Trinitas CLO XIV Ltd.(a)(b) | ||||||||||||
Series 2020-14A, Class B, (3 mo. LIBOR US + 2.00%), 2.18%, 01/25/34 | 473 | 473,629 | ||||||||||
Series 2020-14A, Class C, (3 mo. LIBOR US + 3.00%), 3.18%, 01/25/34 | 1,023 | 1,027,831 | ||||||||||
Tryon Park CLO Ltd., Series 2013-1A, Class A2R, (3 mo. LIBOR US + 1.50%), 1.68%, 04/15/29(a)(b) | 431 | 429,009 | ||||||||||
Venture XVI CLO Ltd., Series 2014-16A, Class BRR, (3 mo. LIBOR US + 1.25%), 1.43%, 01/15/28(a)(b) | 250 | 247,591 | ||||||||||
Voya CLO 2017-3 Ltd., Series 2017-3A, Class A1R, (3 mo. LIBOR US + 1.04%), 1.23%, 04/20/34(a)(b)(d) | 250 | 250,000 | ||||||||||
| Security | Par (000) | Value | ||||||||||
| Cayman Islands (continued) | ||||||||||||
Voya CLO 2017-4 Ltd., Series 2017-4A, Class B, (3 mo. LIBOR US + 1.45%), 1.63%, 10/15/30(a)(b) | USD | 250 | $ | 249,088 | ||||||||
Voya CLO Ltd., Series 2013-3A, Class A1RR, (3 mo. LIBOR US + 1.15%), 1.34%, 10/18/31(a)(b) | 249 | 249,143 | ||||||||||
Whitebox Clo II Ltd., Series 2020-2A, Class A1, (3 mo. LIBOR US + 1.75%), 1.93%, 10/24/31(a)(b) | 1,285 | 1,289,892 | ||||||||||
York CLO 3 Ltd., Series 2016-1A, Class BR, (3 mo. LIBOR US + 1.75%), 1.94%, 10/20/29(a)(b) | 2,025 | 2,027,481 | ||||||||||
York CLO 6 Ltd., Series 2019-1A, Class A1, (3 mo. LIBOR US + 1.35%), 1.53%, 07/22/32(a)(b) | 3,122 | 3,124,979 | ||||||||||
|
| |||||||||||
| 108,154,446 | ||||||||||||
| Ireland — 0.1% | ||||||||||||
Aqueduct European CLO DAC(a) | ||||||||||||
Series 2019-4A, Class B1, (3 mo. Euribor + 1.80%), 1.80%, 07/15/32(b) | EUR | 475 | 569,115 | |||||||||
Series 2019-4X, Class B1, (3 mo. Euribor + 1.80%), 1.80%, 07/15/32 | 593 | 710,496 | ||||||||||
Arbour CLO II DAC, Series 2014-2X, Class B2R, (3 mo. Euribor + 1.50%), 1.50%, 05/15/30(a) | 375 | 449,960 | ||||||||||
Ares European CLO XI BV, Series 11X, Class B1, (3 mo. Euribor + 1.85%), 1.85%, 04/15/32(a) | 593 | 711,938 | ||||||||||
Avoca CLO XV DAC, Series 15X, Class B2R, (3 mo. Euribor + 1.05%), 1.05%, 04/15/31(a) | 134 | 158,962 | ||||||||||
Avoca CLO XVII Designated Activity Co.(a) | ||||||||||||
Series 17A, Class B1R, (3 mo. Euribor + 1.70%), 1.70%, | 500 | 599,365 | ||||||||||
Series 17X, Class AR, (3 mo. Euribor + 0.96%), 0.96%, 10/15/32 | 406 | 488,193 | ||||||||||
Cairn CLO XII DAC, Series 2020-12A, Class B, (3 mo. Euribor + 2.30%), 2.30%, 04/15/33(a)(b)(d) . | 460 | 556,630 | ||||||||||
CIFC European Funding CLO II DAC, Series 2X, Class B1, (3 mo. Euribor + 1.60%), 1.60%, | 593 | 711,737 | ||||||||||
Harvest CLO XVIII DAC, Series 18X, Class B, 1.20%, 10/15/30 | 662 | 790,220 | ||||||||||
Holland Park CLO DAC, Series 1X, Class A1RR, (3 mo. Euribor + 0.92%), 0.92%, 11/14/32(a) | 390 | 469,584 | ||||||||||
Invesco Euro CLO II DAC, Series 2X, Class B1, (3 mo. Euribor + 1.80%), 1.80%, | 593 | 708,518 | ||||||||||
OAK Hill European Credit Partners V Designated Activity Co., Series 2016-5X, Class B1, (3 mo. Euribor + 1.55%), 1.55%, 02/21/30(a) | 460 | 551,739 | ||||||||||
OAK Hill European Credit Partners VI DAC, Series 2017-6X, Class B1, 0.66%, 01/20/32 | 456 | 543,838 | ||||||||||
OCP Euro CLO DAC, Series 2017-2X, Class B, 1.35%, 01/15/32 | 456 | 546,755 | ||||||||||
Rockford Tower Europe CLO DAC, Series 2018-1X, Class B, (3 mo. Euribor + 1.85%), 1.85%, | 593 | 710,170 | ||||||||||
RRE 2 Loan Management DAC, Series 2A, Class B, (3 mo. Euribor + 1.80%), 1.80%, 01/15/32(a)(b) | 715 | 861,004 | ||||||||||
| 12 | 2 0 2 1 BLACK ROCK ANNUAL REPORT TO SHAREHOLDERS |
Consolidated Schedule of Investments (continued) April 30, 2021 | BlackRock Global Allocation Fund, Inc. (Percentages shown are based on Net Assets) |
| Security | Par (000) | Value | ||||||||||
| Ireland (continued) | ||||||||||||
Sound Point Euro CLO II Funding DAC, Series 2X, Class A, (3 mo. Euribor + 1.11%), 1.11%, 10/26/32(a) | EUR | 460 | $ | 552,175 | ||||||||
Voya Euro CLO II DAC, Series 2X, Class B1, (3 mo. Euribor + 1.90%), 1.90%, 07/15/32(a) | 243 | 292,417 | ||||||||||
|
| |||||||||||
| 10,982,816 | ||||||||||||
| Netherlands — 0.0% | ||||||||||||
Ares European CLO X BV, Series 10X, Class B1, (3 mo. Euribor + 1.70%), 1.70%, 10/15/31(a) | 165 | 198,378 | ||||||||||
|
| |||||||||||
| United States — 0.6% | ||||||||||||
AccessLex Institute, Series 2007-A, Class A3, (3 mo. LIBOR US + 0.30%), 0.49%, 05/25/36(a) | USD | 3,102 | 3,062,031 | |||||||||
AGL CLO 7 Ltd., Series 2020-7A, Class A1, (3 mo. LIBOR US + 1.80%), 1.98%, 07/15/31(a)(b) | 1,530 | 1,532,403 | ||||||||||
AIMCO CLO, Series 2018-AA, Class B, (3 mo. LIBOR US + 1.40%), 1.59%, 04/17/31(a)(b) | 466 | 458,977 | ||||||||||
ALM XVIII Ltd., Series 2016-18A, Class A2R, (3 mo. LIBOR US + 1.65%), 1.83%, 01/15/28(a)(b) | 459 | 458,509 | ||||||||||
Anchorage Capital CLO Ltd.(a)(b) | ||||||||||||
Series 2014-3RA, Class A, (3 mo. LIBOR US + 1.05%), 1.23%, 01/28/31. | 250 | 250,000 | ||||||||||
Series 2014-4RA, Class A, (3 mo. LIBOR US + 1.05%), 1.23%, 01/28/31. | 250 | 250,000 | ||||||||||
Apidos CLO XII, Series 2013-12A, Class AR, (3 mo. LIBOR US + 1.08%), 1.26%, 04/15/31(a)(b) | 550 | 549,456 | ||||||||||
Apidos CLO XV, Series 2013-15A, Class A1RR, (3 mo. LIBOR US + 1.01%), 1.20%, 04/20/31(a)(b) | 1,770 | 1,767,094 | ||||||||||
Ares LV CLO Ltd., Series 2020-55A, Class B, (3 mo. LIBOR US + 2.50%), 2.68%, 04/15/31(a)(b) | 2,750 | 2,761,940 | ||||||||||
Battalion CLO 18 Ltd.(a)(b) | ||||||||||||
Series 2020-18A, Class A1, (3 mo. LIBOR US + 1.80%), 1.98%, 10/15/32. | 787 | 789,191 | ||||||||||
Series 2020-18A, Class B, (3 mo. LIBOR US + 2.30%), 2.48%, 10/15/32. | 787 | 788,929 | ||||||||||
BHG Securitization Trust | ||||||||||||
Series 2021-A, Class A, 1.42%, 11/17/33 | 4,770 | 4,769,836 | ||||||||||
Series 2021-A, Class B, 2.79%, 11/17/33 | 510 | 509,782 | ||||||||||
Series 2021-A, Class C, 3.69%, 11/17/33 | 230 | 229,950 | ||||||||||
BlueMountain CLO XXIX Ltd., Series 2020-29A, Class B, (3 mo. LIBOR US + 2.25%), 2.43%, 07/25/31(a)(b) | 625 | 628,025 | ||||||||||
Brex Commercial Charge Card Master Trust, Series 2021-1, Class A, 2.09%, 07/17/24(b) | 5,560 | 5,568,454 | ||||||||||
Canyon Capital CLO Ltd., Series 2019-1A, Class B, (3 mo. LIBOR US + 2.00%), 2.18%, | 550 | 549,749 | ||||||||||
Chenango Park CLO Ltd., Series 2018-1A, Class A2, (3 mo. LIBOR US + 1.55%), 1.73%, 04/15/30(a)(b) | 1,143 | 1,137,155 | ||||||||||
CIFC Funding Ltd.(a)(b) | ||||||||||||
Series 2017-3A, Class A2, (3 mo. LIBOR US + 1.80%), 1.99%, 07/20/30. | 637 | 636,965 | ||||||||||
| Security | Par (000) | Value | ||||||||||
| United States (continued) | ||||||||||||
CIFC Funding Ltd.(a)(b) (continued) | ||||||||||||
Series 2020-1A, Class B, (3 mo. LIBOR US + 2.30%), 2.48%, 07/15/32. | USD | 2,475 | $ | 2,478,093 | ||||||||
Clear Creek CLO, Series 2015-1A, Class AR, (3 mo. LIBOR US + 1.20%), 1.39%, 10/20/30(a)(b) | 313 | 313,361 | ||||||||||
Cook Park CLO Ltd., Series 2018-1A, Class B, (3 mo. LIBOR US + 1.40%), 1.59%, 04/17/30(a)(b) | 1,148 | 1,133,452 | ||||||||||
Elmwood CLO V Ltd.(a)(b) | ||||||||||||
Series 2020-2A, Class A1, (3 mo. LIBOR US + 1.75%), 1.93%, 07/24/31 | 2,750 | 2,757,053 | ||||||||||
Series 2020-2A, Class B, (3 mo. LIBOR US + 2.20%), 2.38%, 07/24/31 | 375 | 377,232 | ||||||||||
FS RIALTO, Series 2021-FL2, Class A, (1 mo. LIBOR US + 1.22%), 1.33%, 04/16/28(a)(b)(c) | 1,160 | 1,160,000 | ||||||||||
Goldentree Loan Management US Clo 6 Ltd., Series 2019-6A, Class B1, (3 mo. LIBOR US + 1.90%), 2.09%, 01/20/33(a)(b) | 924 | 926,054 | ||||||||||
GRACIE POINT INTERNATIONAL FUN GPIF 2021 1A B 144A, 1.51%, 11/01/23 | 1,240 | 1,240,000 | ||||||||||
GRACIE POINT INTERNATIONAL FUN GPIF 2021 1A C 144A, 2.51%, 11/01/23 | 1,640 | 1,640,000 | ||||||||||
Gulf Stream Meridian 1 Ltd., Series 2020-IA, Class A1, (3 mo. LIBOR US + 1.37%), 1.55%, 04/15/33(a)(b) | 4,718 | 4,730,281 | ||||||||||
Madison Park Funding XII Ltd., Series 2014-12A, Class B1R, (3 mo. LIBOR US + 1.65%), 1.84%, 07/20/26(a)(b) | 140 | 140,236 | ||||||||||
Madison Park Funding XIII Ltd., Series 2014-13A, Class BR2, (3 mo. LIBOR US + 1.50%), 1.69%, 04/19/30(a)(b) | 550 | 546,427 | ||||||||||
Mariner Finance Issuance Trust, Series 2020-AA, Class A, 2.19%, 08/21/34(b) | 5,860 | 5,965,449 | ||||||||||
Mercury Financial Credit Card Master Trust, Series 2021-1A, Class A, 1.54%, 03/20/26(b) | 20,710 | 20,764,807 | ||||||||||
Navient Private Education Refi Loan Trust, Series 2019-A, Class A2A, 3.42%, 01/15/43(b) | 1,558 | 1,599,205 | ||||||||||
Neuberger Berman Loan Advisers CLO 37 Ltd., Series 2020-37A, Class B, (3 mo. LIBOR US + 2.20%), 2.39%, 07/20/31(a)(b)(d) | 375 | 375,862 | ||||||||||
OCP CLO Ltd., Series 2020-19A, Class B, (3 mo. LIBOR US + 2.50%), 2.69%, 07/20/31(a)(b) | 450 | 451,320 | ||||||||||
Oportun Issuance Trust 2021-B(b)(c) | ||||||||||||
Series 2021-B, Class A, 1.47%, 05/08/31 | 7,060 | 7,059,283 | ||||||||||
Series 2021-B, Class B, 1.96%, 05/08/31 | 1,340 | 1,339,615 | ||||||||||
Series 2021-B, Class C, 3.65%, 05/08/31 | 630 | 629,998 | ||||||||||
Palmer Square Loan Funding | ||||||||||||
Series 2019-2A, Class A2, (3 mo. LIBOR US + 1.60%), 1.79%, 04/20/27 | 1,663 | 1,660,303 | ||||||||||
Series 2019-3A, Class A2, (3 mo. LIBOR US + 1.60%), 1.78%, 08/20/27 | 500 | 499,198 | ||||||||||
Series 2020-3A, Class A2, (3 mo. LIBOR US + 2.40%), 2.59%, 07/20/28 | 1,375 | 1,377,399 | ||||||||||
Park Avenue Institutional Advisers CLO Ltd., Series 2016-1A, Class A2R, (3 mo. LIBOR US + 1.80%), 1.98%, 08/23/31(a)(b) | 610 | 612,295 | ||||||||||
CONSOLIDATED SCHEDULE OF INVESTMENTS | 13 |
Consolidated Schedule of Investments (continued) April 30, 2021 | BlackRock Global Allocation Fund, Inc. (Percentages shown are based on Net Assets) |
| Security | Par (000) | Value | ||||||||||
| United States (continued) | ||||||||||||
RR 10 Ltd.(a)(b) | ||||||||||||
Series 2020-10A, Class A2A, (3 mo. LIBOR US + 2.50%), 2.68%, 07/15/33 | USD | 1,875 | $ | 1,883,075 | ||||||||
Series 2020-10A, Class A2B, (3 mo. LIBOR US + 3.00%), 3.18%, 07/15/33 | 1,875 | 1,883,130 | ||||||||||
RR Ltd., Series 2018-3A, Class A1R2, (3 mo. LIBOR US + 1.09%), 1.27%, 01/15/30(a)(b) | 438 | 438,008 | ||||||||||
SLM Private Credit Student Loan Trust(a) | ||||||||||||
Series 2005-B, Class A4, (3 mo. LIBOR US + 0.33%), 0.51%, 06/15/39 | 3,967 | 3,887,860 | ||||||||||
Series 2006-A, Class A5, (3 mo. LIBOR US + 0.29%), 0.47%, 06/15/39 | 6,043 | 5,907,888 | ||||||||||
Series 2007-A, Class A4A, (3 mo. LIBOR US + 0.24%), 0.42%, 12/16/41 | 6,331 | 6,172,128 | ||||||||||
SLM Private Education Loan Trust, Series 2010-C, Class A5, (1 mo. LIBOR US + 4.75%), 4.86%, 10/15/41(a)(b) | 16,108 | 17,707,405 | ||||||||||
SMB Private Education Loan | ||||||||||||
Series 2019-A, Class A2A, 3.44%, 07/15/36 | 5,202 | 5,464,447 | ||||||||||
Series 2020-B, Class B, 2.76%, 07/15/53 | 3,800 | 3,777,161 | ||||||||||
Series 2021-A, Class B, 2.31%, 01/15/53 | 5,870 | 5,865,338 | ||||||||||
Series 2021-A, Class C, 2.99%, 01/15/53 | 14,420 | 14,301,440 | ||||||||||
Series 2021-A, Class D1, 3.86%, 01/15/53 | 7,740 | 7,657,163 | ||||||||||
Series 2021-A, Class D2, 3.86%, 01/15/53 | 4,220 | 4,194,459 | ||||||||||
Sofi Professional Loan Program LLC, Series 2019-A, Class A2FX, 3.69%, | 3,242 | 3,381,828 | ||||||||||
Sofi Professional Loan Program Trust, Series 2018-B, Class A2FX, 3.34%, | 1,219 | 1,250,273 | ||||||||||
Whitebox Clo II Ltd., Series 2020-2A, Class B, (3 mo. LIBOR US + 2.25%), 2.43%, | 700 | 702,721 | ||||||||||
York CLO 1 Ltd., Series 2014-1A, Class BRR, (3 mo. LIBOR US + 1.65%), 1.83%, 10/22/29(a)(b) | 465 | 466,232 | ||||||||||
|
| |||||||||||
| 171,415,925 | ||||||||||||
|
| |||||||||||
Total Asset-Backed Securities — 1.1% |
| 290,751,565 | ||||||||||
|
| |||||||||||
| Shares | ||||||||||||
Common Stocks | ||||||||||||
Argentina(f) — 0.4% | ||||||||||||
Globant SA | 16,867 | 3,865,579 | ||||||||||
MercadoLibre, Inc. | 59,445 | 93,386,906 | ||||||||||
|
| |||||||||||
| 97,252,485 | ||||||||||||
| Australia — 0.2% | ||||||||||||
BHP Group Ltd. | 20,535 | 747,389 | ||||||||||
BHP Group PLC | 605,976 | 18,248,835 | ||||||||||
Brambles Ltd. | 63,276 | 506,899 | ||||||||||
Fortescue Metals Group Ltd. | 99,408 | 1,719,889 | ||||||||||
Goodman Group | 30,240 | 440,977 | ||||||||||
Quintis HoldCo. Pty. Ltd., | 43,735,802 | 37,734,907 | ||||||||||
Telstra Corp. Ltd. | 235,641 | 615,582 | ||||||||||
Wesfarmers Ltd. | 9,249 | 385,554 | ||||||||||
|
| |||||||||||
| 60,400,032 | ||||||||||||
| Security | Shares | Value | ||||||||||
| Belgium — 0.0% | ||||||||||||
KBC Group NV(f) | 7,659 | $ | 594,251 | |||||||||
|
| |||||||||||
| Brazil — 0.1% | ||||||||||||
Ambev SA | 180,425 | 496,230 | ||||||||||
B3 SA - Brasil Bolsa Balcao | 117,473 | 1,113,734 | ||||||||||
Banco do Brasil SA | 183,755 | 1,002,660 | ||||||||||
BB Seguridade Participacoes SA | 210,893 | 866,936 | ||||||||||
Engie Brasil Energia SA | 153,776 | 1,151,328 | ||||||||||
Magazine Luiza SA | 1,251,396 | 4,614,365 | ||||||||||
Petroleo Brasileiro SA, ADR | 117,221 | 994,034 | ||||||||||
Vale SA, ADR | 811,097 | 16,319,272 | ||||||||||
WEG SA | 58,400 | 376,393 | ||||||||||
|
| |||||||||||
| 26,934,952 | ||||||||||||
| Canada — 1.0% | ||||||||||||
Enbridge, Inc.(c) | 5,649,645 | 217,914,550 | ||||||||||
Franco-Nevada Corp. | 7,370 | 1,026,697 | ||||||||||
George Weston Ltd. | 6,020 | 531,547 | ||||||||||
Loblaw Cos. Ltd. | 14,550 | 807,906 | ||||||||||
Lululemon Athletica, Inc.(f) | 3,695 | 1,238,823 | ||||||||||
Nutrien Ltd. | 20,028 | 1,105,561 | ||||||||||
Royal Bank of Canada | 20,162 | 1,924,260 | ||||||||||
Shopify, Inc., Class A(f) | 17,745 | 20,982,812 | ||||||||||
TC Energy Corp. | 65,794 | 3,255,041 | ||||||||||
TELUS Corp. | 34,178 | 709,058 | ||||||||||
Thomson Reuters Corp. | 9,728 | 902,164 | ||||||||||
Wheaton Precious Metals Corp. | 335,618 | 13,922,761 | ||||||||||
|
| |||||||||||
| 264,321,180 | ||||||||||||
| Cayman Islands(f) — 0.3% | ||||||||||||
Diversey Holdings Ltd. | 3,563,332 | 64,139,976 | ||||||||||
Highland Transcend Partners I Corp. | 803,176 | 8,104,046 | ||||||||||
|
| |||||||||||
| 72,244,022 | ||||||||||||
| Chile — 0.0% | ||||||||||||
Sociedad Quimica y Minera de Chile SA, ADR | 45,226 | 2,385,219 | ||||||||||
|
| |||||||||||
| China — 2.4% | ||||||||||||
AAC Technologies Holdings, Inc. | 709,500 | 3,938,561 | ||||||||||
Agricultural Bank of China Ltd., Class H | 1,325,000 | 513,330 | ||||||||||
Aier Eye Hospital Group Co. Ltd., Class A | 718,656 | 8,234,895 | ||||||||||
Alibaba Group Holding Ltd.(f) | 937,900 | 27,112,527 | ||||||||||
Alibaba Group Holding Ltd., ADR(f) | 278,407 | 64,298,097 | ||||||||||
Amoy Diagnostics Co. Ltd., Class A | 320,150 | 4,211,864 | ||||||||||
Anhui Conch Cement Co. Ltd., Class H | 58,000 | 346,182 | ||||||||||
Anhui Gujing Distillery Co. Ltd., Class B | 17,800 | 238,476 | ||||||||||
Anta Sports Products Ltd. | 1,155,000 | 20,603,352 | ||||||||||
Asymchem Laboratories Tianjin Co. Ltd., Class A | 143,503 | 7,264,128 | ||||||||||
Autobio Diagnostics Co. Ltd., Class A | 223,378 | 4,206,642 | ||||||||||
Baidu, Inc., ADR(f) | 7,446 | 1,566,117 | ||||||||||
Bank of China Ltd., Class H | 2,153,000 | 854,198 | ||||||||||
BYD Co. Ltd., Class A | 774,300 | 18,995,208 | ||||||||||
China CITIC Bank Corp. Ltd., Class H | 543,000 | 283,466 | ||||||||||
China Construction Bank Corp., Class H | 1,956,000 | 1,543,952 | ||||||||||
China Feihe Ltd.(b) | 258,000 | 733,082 | ||||||||||
China Galaxy Securities Co. Ltd., Class H | 499,000 | 296,571 | ||||||||||
China Hongqiao Group Ltd. | 240,500 | 379,603 | ||||||||||
China Life Insurance Co. Ltd., Class H | 293,000 | 593,955 | ||||||||||
China Merchants Bank Co. Ltd., Class H | 641,500 | 5,152,792 | ||||||||||
China National Building Material Co. Ltd., Class H | 1,904,000 | 2,749,552 | ||||||||||
China Petroleum & Chemical Corp., Class H | 1,810,000 | 892,702 | ||||||||||
China Resources Cement Holdings Ltd. | 876,000 | 954,247 | ||||||||||
| 14 | 2 0 2 1 BLACK ROCK ANNUAL REPORT TO SHAREHOLDERS |
Consolidated Schedule of Investments (continued) April 30, 2021 | BlackRock Global Allocation Fund, Inc. (Percentages shown are based on Net Assets) |
| Security | Shares | Value | ||||||||||
| China (continued) | ||||||||||||
Contemporary Amperex Technology Co. Ltd., Class A | 798,500 | $ | 47,969,287 | |||||||||
Country Garden Services Holdings Co. Ltd. | 41,298 | 432,632 | ||||||||||
Dali Foods Group Co. Ltd.(b) | 606,500 | 360,726 | ||||||||||
Dongfeng Motor Group Co. Ltd., Class H | 290,000 | 252,038 | ||||||||||
ENN Energy Holdings Ltd | 266,500 | 4,547,708 | ||||||||||
Ganfeng Lithium Co. Ltd., Class H(b) | 518,200 | 6,941,733 | ||||||||||
Glodon Co. Ltd., Class A | 521,830 | 5,864,897 | ||||||||||
GoerTek, Inc., Class A | 351,900 | 2,037,736 | ||||||||||
Guangdong Marubi Biotechnology Co. Ltd., Class A | 305,800 | 2,365,964 | ||||||||||
Guangzhou Automobile Group Co. Ltd., Class H | 448,000 | 382,186 | ||||||||||
Guangzhou Baiyun International Airport Co. Ltd., Class A | 5,069,571 | 9,505,866 | ||||||||||
Haidilao International Holding Ltd.(b) | 574,000 | 3,714,190 | ||||||||||
Haitong Securities Co. Ltd., Class H | 571,600 | 511,171 | ||||||||||
Hangzhou Robam Appliances Co. Ltd., Class A | 618,133 | 3,654,981 | ||||||||||
Hangzhou Tigermed Consulting Co. Ltd., Class H(b)(f) | 168,900 | 3,309,628 | ||||||||||
Han’s Laser Technology Industry Group Co. Ltd., Class A | 1,149,132 | 7,099,301 | ||||||||||
Hansoh Pharmaceutical Group Co. | 4,582,000 | 19,708,545 | ||||||||||
Hengan International Group Co. Ltd. | 103,000 | 665,626 | ||||||||||
Huaneng Power International, Inc., Class H | 1,028,000 | 370,047 | ||||||||||
Huazhu Group Ltd., ADR(f) | 67,583 | 3,984,694 | ||||||||||
Hundsun Technologies, Inc., Class A | 362,571 | 5,125,698 | ||||||||||
Industrial & Commercial Bank of China Ltd., Class H | 4,711,000 | 3,056,928 | ||||||||||
Inner Mongolia Yili Industrial Group Co. Ltd., Class A | 692,914 | 4,366,180 | ||||||||||
JD.com, Inc., ADR(f) | 40,521 | 3,134,705 | ||||||||||
Kingdee International Software Group Co. Ltd. | 7,206,000 | 23,730,510 | ||||||||||
Lenovo Group Ltd. | 354,000 | 483,689 | ||||||||||
Li Auto, Inc., ADR(f) | 1,211,368 | 23,912,404 | ||||||||||
Meituan, Class B(b)(f) | 118,800 | 4,546,985 | ||||||||||
Ming Yuan Cloud Group Holdings Ltd.(f) | 1,028,000 | 4,746,236 | ||||||||||
NetEase, Inc., ADR | 116,219 | 13,023,501 | ||||||||||
New Oriental Education & Technology Group, Inc., ADR(f) | 390,026 | 5,951,797 | ||||||||||
NIO, Inc., ADR(f) | 35,960 | 1,432,646 | ||||||||||
Offcn Education Technology Co. Ltd., Class A | 34,700 | 136,190 | ||||||||||
PetroChina Co. Ltd., Class H | 1,946,000 | 704,001 | ||||||||||
Pharmaron Beijing Co. Ltd., Class H(b) | 18,100 | 373,705 | ||||||||||
PICC Property & Casualty Co. Ltd., Class H | 1,274,000 | 1,247,233 | ||||||||||
Pinduoduo, Inc., ADR(f) | 40,562 | 5,432,469 | ||||||||||
Ping An Insurance Group Co. of China Ltd., Class A | 447,300 | 4,996,883 | ||||||||||
Shanghai International Airport Co. Ltd., Class A | 1,180,217 | 8,939,449 | ||||||||||
Shenzhen Goodix Technology Co. Ltd., Class A | 35,000 | 613,461 | ||||||||||
Shenzhen Inovance Technology Co. Ltd., Class A | 395,000 | 5,433,278 | ||||||||||
Silergy Corp. | 52,000 | 5,344,584 | ||||||||||
TAL Education Group, ADR(f) | 195,780 | 11,149,671 | ||||||||||
Tencent Holdings Ltd. | 1,434,500 | 114,432,921 | ||||||||||
Tingyi Cayman Islands Holding Corp. | 724,000 | 1,300,877 | ||||||||||
Venus MedTech Hangzhou, Inc., Class H(b)(f) | 1,230,500 | 10,889,643 | ||||||||||
Venustech Group, Inc., Class A | 1,034,688 | 4,836,172 | ||||||||||
Vipshop Holdings Ltd., ADR(f) | 5,274 | 162,281 | ||||||||||
Want Want China Holdings Ltd. | 6,083,000 | 4,396,306 | ||||||||||
| Security | Shares | Value | ||||||||||
| China (continued) | ||||||||||||
Wuhan Raycus Fiber Laser Technologies Co. Ltd., Class A | 542,751 | $ | 7,570,698 | |||||||||
Wuhu Sanqi Interactive Entertainment Network | ||||||||||||
Technology Group Co. Ltd., Class A | 230,300 | 784,072 | ||||||||||
WuXi AppTec Co. Ltd., Class A | 225,211 | 5,498,835 | ||||||||||
Wuxi Biologics Cayman, Inc.(b)(f) | 1,698,306 | 23,840,469 | ||||||||||
Yifeng Pharmacy Chain Co. Ltd., Class A | 419,120 | 5,808,627 | ||||||||||
Yihai International Holding Ltd. | 636,000 | 6,186,361 | ||||||||||
Yonyou Network Technology Co. Ltd., Class A | 564,209 | 2,882,485 | ||||||||||
Yum China Holdings, Inc. | 166,072 | 10,449,250 | ||||||||||
|
| |||||||||||
| 636,563,655 | ||||||||||||
| Denmark — 0.2% | ||||||||||||
AP Moeller - Maersk A/S, Class A | 536 | 1,259,425 | ||||||||||
AP Moeller - Maersk A/S, Class B | 564 | 1,403,022 | ||||||||||
Carlsberg AS, Class B | 2,644 | 463,863 | ||||||||||
DSV Panalpina A/S | 146,766 | 32,698,015 | ||||||||||
Genmab A/S(f) | 31,084 | 11,406,648 | ||||||||||
Pandora A/S | 126,160 | 14,287,472 | ||||||||||
|
| |||||||||||
| 61,518,445 | ||||||||||||
| Finland — 0.2% | ||||||||||||
Neste OYJ | 900,843 | 54,474,643 | ||||||||||
Nokia OYJ(f) | 1,889,502 | 8,950,484 | ||||||||||
|
| |||||||||||
| 63,425,127 | ||||||||||||
| France — 3.5% | ||||||||||||
Alstom SA(f) | 2,785,973 | 152,146,426 | ||||||||||
Arkema SA | 606,758 | 75,854,964 | ||||||||||
AXA SA | 35,837 | 1,012,217 | ||||||||||
BNP Paribas SA(f) | 980,422 | 62,862,398 | ||||||||||
Carrefour SA | 107,936 | 2,090,396 | ||||||||||
Cie de Saint-Gobain(f) | 34,257 | 2,161,450 | ||||||||||
Cie Generale des Etablissements Michelin SCA | 2,729 | 394,888 | ||||||||||
Danone SA | 1,512,183 | 106,744,195 | ||||||||||
EssilorLuxottica SA | 429,310 | 71,454,258 | ||||||||||
Faurecia SE(f) | 94 | 5,086 | ||||||||||
Kering SA | 26,153 | 20,956,697 | ||||||||||
LVMH Moet Hennessy Louis Vuitton SE | 124,619 | 93,881,740 | ||||||||||
Orange SA | 70,043 | 872,260 | ||||||||||
Pernod Ricard SA | 8,045 | 1,652,175 | ||||||||||
Safran SA(f) | 1,175,245 | 175,474,243 | ||||||||||
Sanofi | 1,459,115 | 152,976,923 | ||||||||||
Sartorius Stedim Biotech | 731 | 335,738 | ||||||||||
Schneider Electric SE | 20,619 | 3,289,880 | ||||||||||
Societe Generale SA(f) | 520,129 | 14,796,200 | ||||||||||
TOTAL SE | 44,571 | 1,969,938 | ||||||||||
Vivendi SE | 23,713 | 826,647 | ||||||||||
|
| |||||||||||
| 941,758,719 | ||||||||||||
| Germany — 3.1% | ||||||||||||
Adidas AG(f) | 349,393 | 107,913,807 | ||||||||||
Allianz SE, Registered Shares | 662,143 | 171,903,467 | ||||||||||
Auto1 Group SE(b)(f) | 548,011 | 30,965,764 | ||||||||||
Continental AG, Class A(f) | 11,083 | 1,497,749 | ||||||||||
Daimler AG, Registered Shares | 29,783 | 2,650,649 | ||||||||||
Deutsche Boerse AG | 10,633 | 1,832,335 | ||||||||||
Deutsche Post AG, Registered Shares | 8,489 | 499,978 | ||||||||||
Deutsche Telekom AG, Registered Shares | 5,837,689 | 112,346,531 | ||||||||||
E.ON SE | 45,278 | 545,954 | ||||||||||
Evonik Industries AG | 10,436 | 365,355 | ||||||||||
Fresenius Medical Care AG & Co. KGaA | 17,004 | 1,353,965 | ||||||||||
CONSOLIDATED SCHEDULE OF INVESTMENTS | 15 |
Consolidated Schedule of Investments (continued) April 30, 2021 | BlackRock Global Allocation Fund, Inc. (Percentages shown are based on Net Assets) |
| Security | Shares | Value | ||||||||||
| Germany (continued) | ||||||||||||
Fresenius SE & Co. KGaA | 44,248 | $ | 2,174,758 | |||||||||
Henkel AG & Co. KGaA | 3,385 | 336,308 | ||||||||||
Infineon Technologies AG | 599,484 | 24,039,628 | ||||||||||
Puma SE(f) | 562,421 | 59,291,666 | ||||||||||
Rational AG | 8,344 | 6,941,011 | ||||||||||
RWE AG | 284,857 | 10,816,547 | ||||||||||
SAP SE | 5,442 | 761,992 | ||||||||||
Siemens AG | 1,268,567 | 211,641,221 | ||||||||||
Vantage Towers AG(f) | 2,473,975 | 76,618,885 | ||||||||||
Vonovia SE | 235,152 | 15,450,595 | ||||||||||
|
| |||||||||||
| 839,948,165 | ||||||||||||
| Hong Kong — 0.7% | ||||||||||||
AIA Group Ltd. | 10,500,000 | 133,271,994 | ||||||||||
Brilliance China Automotive Holdings Ltd.(d) | 252,000 | 236,825 | ||||||||||
China Resources Power Holdings Co. Ltd. | 468,000 | 614,796 | ||||||||||
CLP Holdings Ltd. | 488,000 | 4,816,908 | ||||||||||
Hang Lung Properties Ltd. | 3,247,000 | 8,858,523 | ||||||||||
Hysan Development Co. Ltd. | 750,000 | 2,823,428 | ||||||||||
Jardine Matheson Holdings Ltd. | 114,500 | 7,688,579 | ||||||||||
JD Health International, Inc., (Acquired 12/01/20, Cost: $21,764,388)(h) | 2,366,550 | 36,464,922 | ||||||||||
Nine Dragons Paper Holdings Ltd. | 446,000 | 611,143 | ||||||||||
SJM Holdings Ltd. | 1,762,000 | 2,275,369 | ||||||||||
Sun Art Retail Group Ltd. | 640,000 | 589,150 | ||||||||||
|
| |||||||||||
| 198,251,637 | ||||||||||||
| India — 0.3% | ||||||||||||
HCL Technologies Ltd. | 134,504 | 1,629,711 | ||||||||||
Housing Development Finance Corp. Ltd. | 14,596 | 475,323 | ||||||||||
Indian Oil Corp. Ltd. | 538,603 | 658,857 | ||||||||||
InterGlobe Aviation Ltd.(b)(f) | 152,195 | 3,369,878 | ||||||||||
Petronet LNG Ltd. | 741,866 | 2,399,709 | ||||||||||
Reliance Industries Ltd. | 1,957,278 | 48,729,310 | ||||||||||
Tata Consultancy Services Ltd. | 15,531 | 635,584 | ||||||||||
Think & Learn Private Ltd., (Acquired 12/11/20, Cost: $8,580,000)(d)(h) | 5,720 | 18,327,475 | ||||||||||
|
| |||||||||||
| 76,225,847 | ||||||||||||
| Indonesia — 0.0% | ||||||||||||
Bank Central Asia Tbk PT | 3,419,500 | 7,569,952 | ||||||||||
|
| |||||||||||
| Ireland — 0.5% | ||||||||||||
Aptiv PLC(f) | 737,931 | 106,180,891 | ||||||||||
Experian PLC | 14,071 | 542,459 | ||||||||||
Flutter Entertainment PLC(f) | 123,980 | 25,406,144 | ||||||||||
Medtronic PLC | 21,941 | 2,872,516 | ||||||||||
Trane Technologies PLC | 4,145 | 720,525 | ||||||||||
|
| |||||||||||
| 135,722,535 | ||||||||||||
| Israel(f) — 0.2% | ||||||||||||
ION Acquisition Corp. 2 Ltd. | 394,029 | 4,038,797 | ||||||||||
Playtika Holding Corp. | 2,115,933 | 58,780,619 | ||||||||||
|
| |||||||||||
| 62,819,416 | ||||||||||||
| Italy — 1.7% | ||||||||||||
Assicurazioni Generali SpA(f) | 1,427,139 | 28,566,223 | ||||||||||
Enel SpA | 21,735,178 | 215,815,689 | ||||||||||
Ferrari NV | 101,401 | 21,721,793 | ||||||||||
Intesa Sanpaolo SpA(f) | 73,519,484 | 204,965,877 | ||||||||||
|
| |||||||||||
| 471,069,582 | ||||||||||||
| Japan — 1.7% | ||||||||||||
Aisin Seiki Co. Ltd. | 49,300 | 1,897,550 | ||||||||||
| Security | Shares | Value | ||||||||||
| Japan (continued) | ||||||||||||
Asahi Kasei Corp. | 48,700 | $ | 513,029 | |||||||||
Astellas Pharma, Inc. | 93,950 | 1,414,048 | ||||||||||
Canon, Inc. | 17,100 | 406,640 | ||||||||||
Daifuku Co. Ltd. | 109,200 | 10,793,587 | ||||||||||
Daikin Industries Ltd. | 2,600 | 524,458 | ||||||||||
Disco Corp. | 51,700 | 16,695,013 | ||||||||||
Eisai Co. Ltd. | 14,400 | 939,195 | ||||||||||
ENEOS Holdings, Inc. | 216,300 | 930,288 | ||||||||||
FANUC Corp. | 93,300 | 21,485,378 | ||||||||||
GMO Payment Gateway, Inc. | 72,600 | 9,230,617 | ||||||||||
Hitachi Ltd. | 24,700 | 1,222,594 | ||||||||||
Honda Motor Co. Ltd. | 39,000 | 1,162,972 | ||||||||||
Hoya Corp. | 841,417 | 95,639,895 | ||||||||||
Japan Tobacco, Inc. | 51,200 | 960,443 | ||||||||||
Kao Corp. | 9,500 | 610,789 | ||||||||||
KDDI Corp. | 289,200 | 8,742,353 | ||||||||||
Keyence Corp. | 71,000 | 34,083,741 | ||||||||||
Kirin Holdings Co. Ltd. | 64,300 | 1,207,505 | ||||||||||
Kose Corp. | 206,800 | 31,130,726 | ||||||||||
Maeda Road Construction Co. Ltd. | 80,100 | 1,540,167 | ||||||||||
Marubeni Corp. | 47,300 | 393,973 | ||||||||||
Mitsubishi Estate Co. Ltd. | 565,000 | 9,299,268 | ||||||||||
Mizuho Financial Group, Inc. | 57,100 | 803,650 | ||||||||||
NEC Corp. | 10,500 | 610,424 | ||||||||||
Nintendo Co. Ltd. | 1,500 | 860,479 | ||||||||||
Nippon Telegraph & Telephone Corp.(c) | 721,600 | 18,193,611 | ||||||||||
Nissan Motor Co. Ltd.(f) | 123,100 | 617,955 | ||||||||||
Nomura Holdings, Inc. | 194,600 | 1,046,005 | ||||||||||
Oracle Corp. Japan | 4,700 | 440,649 | ||||||||||
Oriental Land Co. Ltd. | 145,600 | 20,640,381 | ||||||||||
Otsuka Holdings Co. Ltd. | 8,000 | 306,596 | ||||||||||
Panasonic Corp. | 93,400 | 1,096,703 | ||||||||||
Rakuten, Inc. | 30,600 | 388,992 | ||||||||||
Recruit Holdings Co. Ltd. | 689,200 | 31,074,291 | ||||||||||
Shin-Etsu Chemical Co. Ltd. | 610,940 | 103,127,926 | ||||||||||
Sompo Holdings, Inc. | 11,800 | 438,549 | ||||||||||
Sony Corp. | 251,200 | 25,114,700 | ||||||||||
Sumitomo Mitsui Financial Group, Inc. | 34,600 | 1,215,454 | ||||||||||
Tokyo Electron Ltd. | 1,400 | 635,863 | ||||||||||
Tokyo Gas Co. Ltd. | 70,700 | 1,434,778 | ||||||||||
Toshiba Corp. | 16,600 | 686,099 | ||||||||||
Z Holdings Corp. | 1,313,500 | 6,058,209 | ||||||||||
|
| |||||||||||
| 465,615,543 | ||||||||||||
| Luxembourg — 0.1% | ||||||||||||
ArcelorMittal SA(f) | 521,384 | 15,156,955 | ||||||||||
|
| |||||||||||
| Mexico — 0.0% | ||||||||||||
Grupo Bimbo SAB de CV, Series A | 371,649 | 743,775 | ||||||||||
|
| |||||||||||
| Netherlands — 2.4% | ||||||||||||
Adyen NV(b)(f) | 32,098 | 78,996,168 | ||||||||||
Akzo Nobel NV | 989,087 | 118,758,647 | ||||||||||
ASML Holding NV | 223,133 | 144,844,886 | ||||||||||
Heineken Holding NV | 5,783 | 574,427 | ||||||||||
ING Groep NV | 14,990,125 | 191,498,543 | ||||||||||
ING Groep NV, ADR | 37,895 | 482,782 | ||||||||||
Koninklijke Ahold Delhaize NV | 77,093 | 2,074,720 | ||||||||||
NXP Semiconductors NV | 533,615 | 102,726,224 | ||||||||||
| 16 | 2 0 2 1 BLACK ROCK ANNUAL REPORT TO SHAREHOLDERS |
Consolidated Schedule of Investments (continued) April 30, 2021 | BlackRock Global Allocation Fund, Inc. (Percentages shown are based on Net Assets) |
| Security | Shares | Value | ||||||||||
| Netherlands (continued) | ||||||||||||
Royal Dutch Shell PLC, A Shares | 29,536 | $ | 555,757 | |||||||||
Royal Dutch Shell PLC, B Shares | 21,238 | 380,025 | ||||||||||
|
| |||||||||||
| 640,892,179 | ||||||||||||
| Norway — 0.0% | ||||||||||||
LINK Mobility Group Holding ASA(f) | 742,585 | 3,654,046 | ||||||||||
|
| |||||||||||
| Poland — 0.0% | ||||||||||||
InPost SA(f) | 642,223 | 12,237,981 | ||||||||||
Polski Koncern Naftowy ORLEN SA | 37,835 | 664,700 | ||||||||||
|
| |||||||||||
| 12,902,681 | ||||||||||||
| Portugal — 0.0% | ||||||||||||
Jeronimo Martins SGPS SA | 278,896 | 5,093,247 | ||||||||||
|
| |||||||||||
| Saudi Arabia — 0.0% | ||||||||||||
Dr Sulaiman Al Habib Medical Services Group Co. | 7,143 | 287,219 | ||||||||||
|
| |||||||||||
| Singapore — 0.1% | ||||||||||||
DBS Group Holdings Ltd. | 384,100 | 8,608,083 | ||||||||||
Sea Ltd(f) | 79,440 | 20,061,777 | ||||||||||
United Overseas Bank Ltd. | 437,700 | 8,724,569 | ||||||||||
|
| |||||||||||
| 37,394,429 | ||||||||||||
| South Africa — 0.0% | ||||||||||||
Anglo American Platinum Ltd. | 5,913 | 807,483 | ||||||||||
Kumba Iron Ore Ltd. | 21,312 | 965,799 | ||||||||||
MTN Group Ltd.(f) | 107,372 | 679,312 | ||||||||||
|
| |||||||||||
| 2,452,594 | ||||||||||||
| South Korea — 0.6% | ||||||||||||
Celltrion, Inc.(f) | 592 | 140,921 | ||||||||||
Hana Financial Group, Inc. | 21,655 | 887,625 | ||||||||||
Kakao Corp. | 411,205 | 41,871,669 | ||||||||||
KB Financial Group, Inc. | 19,912 | 980,239 | ||||||||||
LG Chem Ltd. | 62,242 | 51,958,841 | ||||||||||
LG Electronics, Inc. | 2,265 | 318,215 | ||||||||||
NCSoft Corp. | 14,145 | 10,522,144 | ||||||||||
POSCO | 20,914 | 6,835,001 | ||||||||||
Samsung Biologics Co. Ltd.(b)(f) | 1,633 | 1,173,654 | ||||||||||
Samsung Electronics Co. Ltd. | 25,767 | 1,878,040 | ||||||||||
Samsung Fire & Marine Insurance Co. Ltd. | 3,825 | 679,538 | ||||||||||
Samsung SDI Co. Ltd. | 54,064 | 31,556,080 | ||||||||||
SK Holdings Co. Ltd. | 5,409 | 1,336,778 | ||||||||||
|
| |||||||||||
| 150,138,745 | ||||||||||||
| Spain — 0.4% | ||||||||||||
Cellnex Telecom SA(b) | 1,797,012 | 101,646,293 | ||||||||||
Endesa SA | 47,739 | 1,255,617 | ||||||||||
Telefonica SA | 116,824 | 541,400 | ||||||||||
|
| |||||||||||
| 103,443,310 | ||||||||||||
| Sweden — 1.0% | ||||||||||||
Atlas Copco AB, A Shares | 185,553 | 11,251,944 | ||||||||||
H & M Hennes & Mauritz AB, B | 29,054 | 714,943 | ||||||||||
Hexagon AB, B Shares | 275,735 | 26,337,902 | ||||||||||
Sandvik AB | 21,769 | 538,335 | ||||||||||
Svenska Handelsbanken AB, A Shares | 65,346 | 756,724 | ||||||||||
Swedbank AB, A Shares | 560,849 | 9,845,770 | ||||||||||
Telefonaktiebolaget LM Ericsson, B Shares | 1,447,002 | 19,873,311 | ||||||||||
Volvo AB, B Shares | 8,017,134 | 195,782,969 | ||||||||||
|
| |||||||||||
| 265,101,898 | ||||||||||||
| Switzerland — 0.5% | ||||||||||||
ABB Ltd., Registered Shares | 355,864 | 11,559,226 | ||||||||||
| Security | Shares | Value | ||||||||||
| Switzerland (continued) | ||||||||||||
Alcon, Inc.(f) | 173,630 | $ | 13,092,446 | |||||||||
Cie Financiere Richemont SA, Class A, Registered Shares | 106,178 | 10,896,706 | ||||||||||
Kuehne + Nagel International AG, Registered Shares | 2,538 | 758,849 | ||||||||||
Nestle SA, Registered Shares | 169,216 | 20,192,662 | ||||||||||
Novartis AG, Registered Shares | 8,473 | 723,055 | ||||||||||
Roche Holding AG | 2,622 | 855,180 | ||||||||||
Siemens Energy AG(f) | 838,225 | 28,036,060 | ||||||||||
Sika AG, Registered Shares | 97,428 | 29,098,095 | ||||||||||
Straumann Holding AG, Registered Shares | 12,872 | 18,396,303 | ||||||||||
|
| |||||||||||
| 133,608,582 | ||||||||||||
| Taiwan — 1.1% | ||||||||||||
ASE Technology Holding Co. Ltd. | 103,000 | 430,410 | ||||||||||
Asustek Computer, Inc. | 24,000 | 321,447 | ||||||||||
Cathay Financial Holding Co. Ltd. | 2,811,000 | 5,247,672 | ||||||||||
Chunghwa Telecom Co. Ltd. | 1,438,000 | 5,861,756 | ||||||||||
Formosa Chemicals & Fibre Corp. | 1,249,000 | 4,049,265 | ||||||||||
Formosa Plastics Corp. | 1,108,000 | 4,188,630 | ||||||||||
Fubon Financial Holding Co. Ltd. | 3,058,000 | 7,007,198 | ||||||||||
Hon Hai Precision Industry Co. Ltd. | 1,555,760 | 6,395,801 | ||||||||||
MediaTek, Inc. | 381,000 | 15,972,496 | ||||||||||
Nan Ya Plastics Corp. | 1,516,000 | 4,763,992 | ||||||||||
Nanya Technology Corp. | 190,000 | 615,277 | ||||||||||
Taiwan Semiconductor Manufacturing Co. Ltd. | 10,995,000 | 231,550,378 | ||||||||||
Uni-President Enterprises Corp. | 2,070,000 | 5,544,405 | ||||||||||
United Microelectronics Corp. | 302,000 | 602,342 | ||||||||||
Yageo Corp. | 464,000 | 8,936,543 | ||||||||||
|
| |||||||||||
| 301,487,612 | ||||||||||||
| Thailand — 0.0% | ||||||||||||
Intouch Holdings PCL, Class F | 2,781,700 | 5,695,170 | ||||||||||
Thai Beverage PCL | 3,284,400 | 1,763,240 | ||||||||||
|
| |||||||||||
| 7,458,410 | ||||||||||||
| Turkey — 0.0% | ||||||||||||
Turkiye Petrol Rafinerileri A/S(f) | 48,785 | 517,093 | ||||||||||
|
| |||||||||||
| United Arab Emirates(d) — 0.0% | ||||||||||||
Jawbone Health Hub, Inc., (Acquired 01/24/17, Cost: $0), 01/24/17(h) | 1,518,232 | 15 | ||||||||||
NMC Health PLC(f) | 1,077,976 | 15 | ||||||||||
|
| |||||||||||
| 30 | ||||||||||||
| United Kingdom — 2.9% | ||||||||||||
Anglo American PLC | 396,257 | 16,801,465 | ||||||||||
AstraZeneca PLC | 1,460,465 | 155,457,550 | ||||||||||
Auto Trader Group PLC(b)(f) | 1,250,682 | 9,846,112 | ||||||||||
Barclays PLC | 2,046,340 | 4,954,125 | ||||||||||
Berkeley Group Holdings PLC | 255,855 | 16,351,312 | ||||||||||
BP PLC | 132,672 | 555,411 | ||||||||||
BT Group PLC(f) | 159,300 | 363,354 | ||||||||||
Capri Holdings Ltd.(f) | 387,803 | 21,360,189 | ||||||||||
Compass Group PLC(c)(f) | 2,115,557 | 46,022,398 | ||||||||||
Diageo PLC | 72,271 | 3,244,344 | ||||||||||
Farfetch Ltd., Class A(f) | 356,335 | 17,456,852 | ||||||||||
Ferguson PLC | 124,438 | 15,694,869 | ||||||||||
GlaxoSmithKline PLC | 183,941 | 3,399,182 | ||||||||||
Legal & General Group PLC | 496,228 | 1,863,131 | ||||||||||
Linde PLC | 1,744 | 498,505 | ||||||||||
Lloyds Banking Group PLC(c) | 161,400,663 | 101,211,022 | ||||||||||
National Grid PLC | 65,514 | 825,839 | ||||||||||
CONSOLIDATED SCHEDULE OF INVESTMENTS | 17 |
Consolidated Schedule of Investments (continued) April 30, 2021 | BlackRock Global Allocation Fund, Inc. (Percentages shown are based on Net Assets) |
| Security | Shares | Value | ||||||||||
| United Kingdom (continued) | ||||||||||||
Reckitt Benckiser Group PLC. | 5,542 | $ | 493,446 | |||||||||
RELX PLC | 32,540 | 844,265 | ||||||||||
Rio Tinto PLC | 206,859 | 17,325,923 | ||||||||||
The Hut Group, (Acquired 09/16/20, Cost: $24,716,037)(h) | 7,054,033 | 60,400,207 | ||||||||||
THG Holdings Ltd.(f) | 2,346,296 | 20,090,176 | ||||||||||
Unilever PLC | 2,598,709 | 152,224,795 | ||||||||||
Vodafone Group PLC | 56,980,524 | 107,533,567 | ||||||||||
|
| |||||||||||
| 774,818,039 | ||||||||||||
| United States — 44.1% | ||||||||||||
Abbott Laboratories(i) | 892,358 | 107,154,349 | ||||||||||
AbbVie, Inc.(i) | 1,473,022 | 164,241,953 | ||||||||||
ACV Auctions, Inc., Class A(f) | 330,916 | 11,247,836 | ||||||||||
Adobe, Inc.(f) | 5,598 | 2,845,687 | ||||||||||
Advance Auto Parts, Inc. | 42,977 | 8,602,276 | ||||||||||
Advanced Micro Devices, Inc.(f) | 13,086 | 1,068,079 | ||||||||||
Aflac, Inc. | 7,961 | 427,745 | ||||||||||
Air Products & Chemicals, Inc. | 430,336 | 124,143,329 | ||||||||||
Alaska Air Group, Inc.(f) | 95,953 | 6,634,190 | ||||||||||
Alkami Technology, Inc.(f) | 2,832 | 135,058 | ||||||||||
Alphabet, Inc., Class A(f) | 6,857 | 16,137,950 | ||||||||||
Alphabet, Inc., Class C(f)(i) | 184,841 | 445,488,991 | ||||||||||
Altair Engineering, Inc., Class A(f) | 315,599 | 20,513,935 | ||||||||||
Altria Group, Inc. | 12,886 | 615,307 | ||||||||||
Amazon.com, Inc.(f)(i) | 103,839 | 360,053,425 | ||||||||||
American Express Co. | 5,583 | 856,153 | ||||||||||
American Tower Corp. | 694,062 | 176,826,176 | ||||||||||
American Water Works Co., Inc. | 96,591 | 15,067,230 | ||||||||||
Amgen, Inc. | 66,846 | 16,018,975 | ||||||||||
Analog Devices, Inc. | 34,858 | 5,338,851 | ||||||||||
Anthem, Inc. | 261,268 | 99,122,467 | ||||||||||
Aon PLC, Class A | 3,271 | 822,460 | ||||||||||
Apellis Pharmaceuticals, Inc.(f) | 132,284 | 6,702,830 | ||||||||||
Apple, Inc.(i) | 3,612,598 | 474,912,133 | ||||||||||
Applied Materials, Inc. | 806,805 | 107,071,092 | ||||||||||
Aramark | 69,518 | 2,702,165 | ||||||||||
Arrival Ltd., (Acquired 03/25/21, Cost: $31,714,917)(h) | 4,373,837 | 78,099,235 | ||||||||||
Atlassian Corp. PLC, Class A(f) | 66,549 | 15,809,380 | ||||||||||
Autodesk, Inc.(f) | 292,007 | 85,239,763 | ||||||||||
Avalara, Inc.(f) | 71,581 | 10,143,744 | ||||||||||
Bank of America Corp.(i) | 8,337,036 | 337,900,069 | ||||||||||
Bank of New York Mellon Corp. | 37,415 | 1,866,260 | ||||||||||
Baxter International, Inc. | 225,440 | 19,317,954 | ||||||||||
Becton Dickinson and Co. | 205,263 | 51,071,487 | ||||||||||
Berkshire Hathaway, Inc., Class B(f) | 134,694 | 37,034,115 | ||||||||||
Boston Scientific Corp.(f) | 4,626,690 | 201,723,684 | ||||||||||
Bright Horizons Family Solutions, Inc.(f) | 29,696 | 4,300,872 | ||||||||||
Bristol-Myers Squibb Co. | 1,807,439 | 112,820,342 | ||||||||||
Broadcom, Inc. | 37,074 | 16,913,159 | ||||||||||
Brown-Forman Corp., Class B | 29,241 | 2,230,503 | ||||||||||
C.H. Robinson Worldwide, Inc. | 129,719 | 12,593,121 | ||||||||||
C3.AI, Inc., Class A, (Acquired 12/08/20, Cost: $18,913,957)(h) | 710,960 | 46,610,956 | ||||||||||
Cadence Design Systems, Inc.(f) | 85,330 | 11,243,934 | ||||||||||
California Resources Corp.(f) | 231,154 | 5,478,350 | ||||||||||
Capital One Financial Corp. | 1,277,323 | 190,423,313 | ||||||||||
Cerner Corp. | 32,967 | 2,474,173 | ||||||||||
Charles Schwab Corp. | 2,456,377 | 172,928,941 | ||||||||||
Charter Communications, Inc., | 176,917 | 119,144,754 | ||||||||||
| Security | Shares | Value | ||||||||||
| United States (continued) | ||||||||||||
Chubb Ltd. | 321,428 | $ | 55,153,831 | |||||||||
Cigna Corp. | 7,827 | 1,949,001 | ||||||||||
Citigroup, Inc. | 647,504 | 46,128,185 | ||||||||||
Clorox Co. | 1,607 | 293,278 | ||||||||||
Cloudera, Inc.(f) | 141,151 | 1,791,206 | ||||||||||
Cognizant Technology Solutions Corp., Class A | 839,518 | 67,497,247 | ||||||||||
Coinbase Global Inc., Class A(f) | 124,205 | 36,968,376 | ||||||||||
Colgate-Palmolive Co. | 253,169 | 20,430,738 | ||||||||||
Comcast Corp., Class A | 3,361,149 | 188,728,516 | ||||||||||
ConocoPhillips | 1,838,185 | 94,004,781 | ||||||||||
Consolidated Edison, Inc. | 4,991 | 386,353 | ||||||||||
Constellation Brands, Inc., Class A | 6,091 | 1,463,789 | ||||||||||
Corteva, Inc. | 55,776 | 2,719,638 | ||||||||||
Costco Wholesale Corp. | 304,356 | 113,247,824 | ||||||||||
Coupa Software, Inc.(f) | 25,660 | 6,903,566 | ||||||||||
Crowdstrike Holdings, Inc., Class A(f) | 240,803 | 50,209,834 | ||||||||||
Crown PropTech Acquisitions(f) | 487,104 | 4,846,685 | ||||||||||
Crown Proptech Acquisitions Pvt Ltd.(d) | 186,720 | 812 | ||||||||||
Cummins, Inc. | 5,193 | 1,308,844 | ||||||||||
D.R. Horton, Inc. | 1,305,287 | 128,296,659 | ||||||||||
Danimer Scientific, Inc.(f) | 142,774 | 3,647,876 | ||||||||||
Datadog, Inc., Class A(f) | 76,638 | 6,573,241 | ||||||||||
Davidson Kempner Merchant Co-Invest Fund LP, (Acquired 04/01/21, Cost: $26,559,000)(d)(h)(j) | 26,559,000 | 26,559,000 | ||||||||||
Deere & Co. | 38,373 | 14,230,627 | ||||||||||
Dell Technologies, Inc., Class C(f) | 882,464 | 86,772,685 | ||||||||||
Delta Air Lines, Inc.(f) | 113,974 | 5,347,660 | ||||||||||
Devon Energy Corp. | 242,556 | 5,670,959 | ||||||||||
DexCom, Inc.(f) | 4,315 | 1,666,022 | ||||||||||
DocuSign, Inc.(f) | 4,230 | 943,036 | ||||||||||
Dow, Inc. | 147,597 | 9,224,813 | ||||||||||
Dynatrace, Inc.(f) | 363,717 | 18,927,833 | ||||||||||
Eaton Corp. PLC | 17,701 | 2,530,004 | ||||||||||
eBay, Inc. | 22,921 | 1,278,763 | ||||||||||
Ecolab, Inc. | 7,219 | 1,617,922 | ||||||||||
Edwards Lifesciences Corp.(f) | 531,884 | 50,805,560 | ||||||||||
Electronic Arts, Inc. | 11,449 | 1,626,674 | ||||||||||
Emerson Electric Co. | 16,203 | 1,466,209 | ||||||||||
Energy Select Sector SPDR Fund | 138,740 | 6,852,369 | ||||||||||
EPAM Systems, Inc.(f) | 14,823 | 6,785,228 | ||||||||||
Epic Games, Inc., (Acquired 07/02/20, Cost: $23,484,725), 07/02/20(d)(h) | 40,843 | 36,146,055 | ||||||||||
EQT Corp.(f) | 4,400,865 | 84,056,521 | ||||||||||
Equinix, Inc. | 818 | 589,582 | ||||||||||
Exelon Corp. | 10,292 | 462,522 | ||||||||||
Expedia Group, Inc. | 73,690 | 12,986,389 | ||||||||||
Exxon Mobil Corp. | 58,354 | 3,340,183 | ||||||||||
Facebook, Inc., Class A(f)(i) | 356,724 | 115,963,838 | ||||||||||
FedEx Corp. | 8,995 | 2,611,338 | ||||||||||
Fifth Wall Acquisition Corp. I(f) | 985,687 | 10,704,561 | ||||||||||
Ford Motor Co.(f) | 43,179 | 498,286 | ||||||||||
Fortinet, Inc.(f) | 112,871 | 23,051,644 | ||||||||||
Fortive Corp. | 2,104,039 | 149,008,042 | ||||||||||
Fortune Brands Home & Security, Inc. | 133,595 | 14,024,803 | ||||||||||
Fox Corp., Class A | 34,741 | 1,300,008 | ||||||||||
Fox Corp., Class B | 29,870 | 1,086,671 | ||||||||||
FQT Private (d) | 2,439,185 | 2,512,361 | ||||||||||
Freeport-McMoRan, Inc. | 3,546,899 | 133,753,561 | ||||||||||
Gilead Sciences, Inc. | 13,027 | 826,824 | ||||||||||
Global Payments, Inc. | 841,111 | 180,527,654 | ||||||||||
Goldman Sachs Group, Inc. | 32,067 | 11,173,746 | ||||||||||
| 18 | 2 0 2 1 BLACK ROCK ANNUAL REPORT TO SHAREHOLDERS |
Consolidated Schedule of Investments (continued) April 30, 2021 | BlackRock Global Allocation Fund, Inc. (Percentages shown are based on Net Assets) |
| Security | Shares | Value | ||||||||||
| United States (continued) | ||||||||||||
HCA Healthcare, Inc. | 16,228 | $ | 3,262,802 | |||||||||
Health Care Select Sector SPDR Fund | 201,333 | 24,427,733 | ||||||||||
Healthcare Merger Corp., (Acquired 10/30/20, Cost: $8,907,020), | 890,702 | 6,992,011 | ||||||||||
Hilton Worldwide Holdings, Inc.(f) | 288,585 | 37,140,890 | ||||||||||
Home Depot, Inc. | 469,768 | 152,049,809 | ||||||||||
HP, Inc. | 42,320 | 1,443,535 | ||||||||||
Humana, Inc. | 9,077 | 4,041,443 | ||||||||||
IDEXX Laboratories, Inc.(f) | 1,830 | 1,004,652 | ||||||||||
iHeartMedia, Inc., Class A(f) | 10,778 | 206,291 | ||||||||||
Illinois Tool Works, Inc. | 12,294 | 2,833,275 | ||||||||||
Illumina, Inc.(f) | 11,004 | 4,322,811 | ||||||||||
Incyte Corp.(f) | 5,696 | 486,324 | ||||||||||
Insulet Corp.(f) | 16,101 | 4,753,337 | ||||||||||
Intel Corp. | 77,536 | 4,460,646 | ||||||||||
International Flavors & Fragrances, Inc. | 632,504 | 89,923,094 | ||||||||||
International Paper Co. | 35,022 | 2,031,276 | ||||||||||
Intuit, Inc. | 4,822 | 1,987,436 | ||||||||||
Intuitive Surgical, Inc.(f) | 67,048 | 57,996,520 | ||||||||||
Iovance Biotherapeutics, Inc.(f) | 86,575 | 2,721,918 | ||||||||||
IQVIA Holdings, Inc.(f) | 2,025 | 475,247 | ||||||||||
Johnson & Johnson | 1,673,704 | 272,361,852 | ||||||||||
JPMorgan Chase & Co. | 1,993,119 | 306,561,633 | ||||||||||
Khosla Ventures Acquisition Co.(f) | 789,523 | 8,289,992 | ||||||||||
Kroger Co. | 10,549 | 385,460 | ||||||||||
L3Harris Technologies, Inc. | 649,087 | 135,808,473 | ||||||||||
Lam Research Corp. | 1,579 | 979,691 | ||||||||||
Las Vegas Sands Corp. | 280,956 | 17,211,365 | ||||||||||
Liberty Media Acquisition Corp.(f) | 1,579,349 | 16,899,034 | ||||||||||
Liberty Media Corp. - Liberty SiriusXM, | 937,215 | 42,352,746 | ||||||||||
Liberty Media Corp. - Liberty SiriusXM, Class C(f) | 1,178,782 | 53,316,310 | ||||||||||
Lions Gate Entertainment Corp., | 179,067 | 2,591,099 | ||||||||||
Live Nation Entertainment, Inc.(f) | 74,606 | 6,108,739 | ||||||||||
Lookout, Inc., (Acquired 03/04/15, Cost: $2,002,652), 03/04/15(d)(h) | 175,316 | 1,029,105 | ||||||||||
Lowe’s Cos., Inc. | 595,831 | 116,931,834 | ||||||||||
Lyft, Inc., Class A(f) | 595,950 | 33,170,577 | ||||||||||
ManpowerGroup, Inc. | 52,305 | 6,323,151 | ||||||||||
Marathon Oil Corp. | 149,546 | 1,683,888 | ||||||||||
Marriott International, Inc., Class A(f) | 3,826 | 568,238 | ||||||||||
Marsh & McLennan Cos., Inc. | 961,137 | 130,426,291 | ||||||||||
Masco Corp. | 341,796 | 21,833,928 | ||||||||||
Mastercard, Inc., Class A | 730,002 | 278,904,564 | ||||||||||
McDonald’s Corp. | 566,636 | 133,771,427 | ||||||||||
McKesson Corp. | 3,610 | 677,092 | ||||||||||
Medallia, Inc.(f) | 725,067 | 21,382,226 | ||||||||||
Merck & Co., Inc. | 33,167 | 2,470,942 | ||||||||||
Micron Technology, Inc.(f) | 1,375,836 | 118,418,205 | ||||||||||
Microsoft Corp. | 2,390,250 | 602,773,245 | ||||||||||
MongoDB, Inc.(f) | 44,650 | 13,281,589 | ||||||||||
Monster Beverage Corp.(f) | 94,574 | 9,178,407 | ||||||||||
Morgan Stanley | 1,660,248 | 137,053,472 | ||||||||||
Netflix, Inc.(f) | 4,737 | 2,432,307 | ||||||||||
Nevro Corp.(f) | 24,265 | 4,193,235 | ||||||||||
New Relic, Inc.(f) | 137,229 | 8,823,825 | ||||||||||
NextEra Energy, Inc. | 2,766,443 | 214,426,997 | ||||||||||
NIKE, Inc., Class B | 2,841 | 376,773 | ||||||||||
Northern Genesis Acquisition Corp. II(f) | 379,710 | 4,028,723 | ||||||||||
Northern Trust Corp. | 14,578 | 1,658,976 | ||||||||||
Northrop Grumman Corp. | 10,231 | 3,626,276 | ||||||||||
NVIDIA Corp. | 199,218 | 119,606,503 | ||||||||||
| Security | Shares | Value | ||||||||||
| United States (continued) | ||||||||||||
Okta, Inc.(f) | 85,322 | $ | 23,011,343 | |||||||||
Opendoor Technologies Inc.(f) | 744,088 | 15,082,664 | ||||||||||
Otis Worldwide Corp. | 42,504 | 3,309,786 | ||||||||||
Palo Alto Networks, Inc.(f) | 70,061 | 24,758,857 | ||||||||||
Parker-Hannifin Corp. | 2,166 | 679,712 | ||||||||||
PayPal Holdings, Inc.(f) | 545,080 | 142,969,033 | ||||||||||
Peloton Interactive, Inc., Class A(f) | 673,770 | 66,265,279 | ||||||||||
Penn National Gaming, Inc.(f) | 144,042 | 12,837,023 | ||||||||||
PepsiCo, Inc. | 120,734 | 17,405,013 | ||||||||||
Philip Morris International, Inc. | 5,358 | 509,010 | ||||||||||
Pioneer Natural Resources Co. | 6,249 | 961,284 | ||||||||||
PNC Financial Services Group, Inc. | 10,726 | 2,005,226 | ||||||||||
PPG Industries, Inc. | 675,979 | 115,754,644 | ||||||||||
Prologis, Inc. | 17,430 | 2,031,118 | ||||||||||
Proofpoint, Inc.(f) | 50,352 | 8,666,083 | ||||||||||
PTC, Inc.(f) | 740,375 | 96,944,702 | ||||||||||
PubMatic, Inc., Class A(f) | 173,466 | 8,928,295 | ||||||||||
PVH Corp. | 99,520 | 11,263,674 | ||||||||||
Qualcomm, Inc. | 224,209 | 31,120,209 | ||||||||||
Quest Diagnostics, Inc. | 103,916 | 13,704,442 | ||||||||||
Raytheon Technologies Corp. | 10,753 | 895,080 | ||||||||||
Regeneron Pharmaceuticals, Inc.(f) | 1,660 | 798,958 | ||||||||||
Reinvent Technology Partners Z(f) | 616,968 | 6,305,413 | ||||||||||
RingCentral, Inc., Class A(f) | 39,686 | 12,657,850 | ||||||||||
Robert Half International, Inc. | 68,514 | 6,002,512 | ||||||||||
Rockwell Automation, Inc. | 3,575 | 944,730 | ||||||||||
Rotor Acquisition Corp.(f) | 174,690 | 1,818,523 | ||||||||||
Rotor Acqusition Ltd.(d) | 93,752 | 278,443 | ||||||||||
Sabre Corp. | 78,339 | 1,173,518 | ||||||||||
salesforce.com, Inc.(f) | 637,947 | 146,931,953 | ||||||||||
SBA Communications Corp. | 4,737 | 1,419,774 | ||||||||||
Schlumberger NV | 43,425 | 1,174,646 | ||||||||||
Seagen, Inc.(f) | 58,469 | 8,405,503 | ||||||||||
Sempra Energy | 1,006,940 | 138,524,736 | ||||||||||
Sensata Technologies Holding PLC(f) | 78,622 | 4,539,634 | ||||||||||
ServiceNow, Inc.(f) | 157,826 | 79,918,352 | ||||||||||
Silk Road Medical, Inc.(f) | 159,345 | 9,742,353 | ||||||||||
Sonos, Inc.(f) | 1,019,865 | 40,825,196 | ||||||||||
Southern Co. | 19,707 | 1,304,012 | ||||||||||
Southwest Airlines Co. | 903,171 | 56,701,075 | ||||||||||
SPDR Euro Stoxx 50 ETF | 87,685 | 4,074,722 | ||||||||||
Splunk, Inc.(f) | 100,668 | 12,726,449 | ||||||||||
Stanley Black & Decker, Inc. | 4,107 | 849,204 | ||||||||||
Starwood Property Trust, Inc. | 763,010 | 19,700,918 | ||||||||||
Stryker Corp. | 47,361 | 12,438,419 | ||||||||||
Sun Country Airlines Hodings, Inc., (Acquired 03/17/21, | 963,151 | 37,719,347 | ||||||||||
Sunnova Energy International, Inc.(f) | 58,463 | 2,064,913 | ||||||||||
Sysco Corp. | 5,485 | 464,744 | ||||||||||
Target Corp. | 7,425 | 1,538,906 | ||||||||||
Tesla, Inc.(f) | 2,961 | 2,100,652 | ||||||||||
Thermo Fisher Scientific, Inc | 227,193 | 106,832,964 | ||||||||||
Thoma Bravo Advantage, Class A, Class A(f) | 577,054 | 6,307,200 | ||||||||||
TJX Cos., Inc. | 1,630,332 | 115,753,572 | ||||||||||
T-Mobile US, Inc.(f) | 207,893 | 27,468,902 | ||||||||||
Toll Brothers, Inc. | 557,006 | 34,924,276 | ||||||||||
TransDigm Group, Inc.(f) | 44,066 | 27,045,067 | ||||||||||
Twilio, Inc., Class A(f) | 69,403 | 25,526,423 | ||||||||||
U.S. Bancorp | 418,444 | 24,834,651 | ||||||||||
Uber Technologies, Inc.(f) | 46,665 | 2,555,842 | ||||||||||
Ulta Beauty, Inc.(f) | 43,004 | 14,163,367 | ||||||||||
CONSOLIDATED SCHEDULE OF INVESTMENTS | 19 |
Consolidated Schedule of Investments (continued) April 30, 2021 | BlackRock Global Allocation Fund, Inc. (Percentages shown are based on Net Assets) |
| Security | Shares | Value | ||||||||||
| United States (continued) | ||||||||||||
Union Pacific Corp. | 555,442 | $ | 123,358,114 | |||||||||
United Parcel Service, Inc., Class B | 907,416 | 184,985,826 | ||||||||||
United States Steel Corp. | 782,503 | 18,005,394 | ||||||||||
UnitedHealth Group, Inc. | 669,392 | 266,953,530 | ||||||||||
UWM Holdings Corp, (Acquired 01/20/21, Cost: $8,662,920), 01/20/21(h) | 1,378,691 | 8,179,347 | ||||||||||
Vail Resorts, Inc. | 6,882 | 2,237,751 | ||||||||||
Valero Energy Corp. | 867,501 | 64,160,374 | ||||||||||
VeriSign, Inc.(f) | 24,870 | 5,440,810 | ||||||||||
Verizon Communications, Inc. | 39,203 | 2,265,541 | ||||||||||
Vertex Pharmaceuticals, Inc.(f) | 130,641 | 28,505,866 | ||||||||||
Vertiv Holdings Co. | 372,429 | 8,454,138 | ||||||||||
Vertiv Holdings Co., (Acquired 02/04/20, Cost: $51,266,950), 02/04/20(h) | 5,126,695 | 116,375,976 | ||||||||||
VF Corp. | 14,497 | 1,270,807 | ||||||||||
Visa, Inc., Class A | 130,916 | 30,576,741 | ||||||||||
VMware, Inc., Class A(f) | 751,280 | 120,828,362 | ||||||||||
Vulcan Materials Co. | 701,448 | 125,026,092 | ||||||||||
Walmart, Inc. | 532,889 | 74,556,500 | ||||||||||
Walt Disney Co.(f) | 1,068,832 | 198,824,129 | ||||||||||
Wayfair, Inc., Class A(f) | 15,322 | 4,528,724 | ||||||||||
Western Digital Corp. | 229,570 | 16,214,529 | ||||||||||
Weyerhaeuser Co. | 283,125 | 10,976,756 | ||||||||||
Workday, Inc., Class A(f) | 50,045 | 12,361,115 | ||||||||||
Wynn Resorts Ltd.(f) | 198,517 | 25,489,583 | ||||||||||
Xilinx, Inc. | 93,876 | 12,012,373 | ||||||||||
Yum! Brands, Inc. | 5,232 | 625,329 | ||||||||||
Zoetis, Inc. | 92,350 | 15,979,321 | ||||||||||
Zoom Video Communications, Inc., Class A(f) | 8,856 | 2,830,112 | ||||||||||
Zscaler, Inc.(f) | 141,789 | 26,605,288 | ||||||||||
|
| |||||||||||
| 11,929,366,848 | ||||||||||||
|
| |||||||||||
Total Common Stocks — 69.7% |
| 18,869,138,456 | ||||||||||
|
| |||||||||||
Par (000) | ||||||||||||
Corporate Bonds | ||||||||||||
Argentina — 0.0% | ||||||||||||
Genneia SA, 8.75%, 01/20/22(b) | USD | 3,026 | 2,688,979 | |||||||||
|
| |||||||||||
| Australia — 0.6% | ||||||||||||
Quintis Australia Pty. Ltd.(b)(d)(g)(k) | ||||||||||||
(12.00% Cash), 12.00%, 10/01/28 | 82,685 | 82,684,528 | ||||||||||
(7.50% Cash or 8.00% PIK), 8.00%, 10/01/26 | 85,419 | 85,418,997 | ||||||||||
Westpac Banking Corp., 2.96%, 11/16/40 | 1,660 | 1,561,946 | ||||||||||
|
| |||||||||||
| 169,665,471 | ||||||||||||
| Austria — 0.0% | ||||||||||||
Klabin Austria GmbH, 3.20%, 01/12/31(b) | 4,285 | 4,058,698 | ||||||||||
|
| |||||||||||
| Bahamas — 0.0% | ||||||||||||
Intercorp Peru Ltd., 3.88%, | 2,499 | 2,483,069 | ||||||||||
|
| |||||||||||
| Bahrain — 0.0% | ||||||||||||
BBK BSC, 5.50%, 07/09/24 | 2,798 | 2,946,294 | ||||||||||
Oil and Gas Holding Co., 7.63%, 11/07/24 | 2,594 | 2,893,607 | ||||||||||
|
| |||||||||||
| 5,839,901 | ||||||||||||
| Security | Par (000) | Value | ||||||||||
| Bermuda(b) — 0.0% | ||||||||||||
Geopark Ltd., 5.50%, 01/17/27 | USD | 1,345 | $ | 1,377,448 | ||||||||
Investment Energy Resources Ltd., 6.25%, 04/26/29 | 1,775 | 1,887,713 | ||||||||||
Star Energy Geothermal Darajat II/Star Energy Geothermal Salak, 4.85%, 10/14/38 | 4,965 | 5,515,184 | ||||||||||
|
| |||||||||||
| 8,780,345 | ||||||||||||
| Brazil — 0.2% | ||||||||||||
Banco do Brasil SA, 4.75%, 03/20/24 | 1,250 | 1,335,625 | ||||||||||
Itau Unibanco Holding SA/Cayman Island 5.13%, 05/13/23(b) | 762 | 807,387 | ||||||||||
3.25%, 01/24/25 | 2,738 | 2,807,135 | ||||||||||
3.25%, 01/24/25(b) | 1,282 | 1,314,371 | ||||||||||
Oi SA, (10.00% Cash or 8.00% Cash + 4.00% PIK), 4.00%, 07/27/25(k) | 2,416 | 2,525,928 | ||||||||||
Petrobras Global Finance BV | ||||||||||||
5.30%, 01/27/25 | 8,018 | 8,881,438 | ||||||||||
6.00%, 01/27/28 | 1,565 | 1,764,538 | ||||||||||
5.60%, 01/03/31 | 9,475 | 10,221,156 | ||||||||||
Rumo Luxembourg Sarl, 5.88%, 01/18/25(b) | 5,969 | 6,294,310 | ||||||||||
Suzano Austria GmbH, 3.75%, 01/15/31 | 2,629 | 2,681,580 | ||||||||||
Vale Overseas Ltd., 3.75%, 07/08/30 | 3,884 | 4,068,975 | ||||||||||
|
| |||||||||||
| 42,702,443 | ||||||||||||
| Canada — 0.1% | ||||||||||||
1011778 BC ULC/New Red Finance, Inc.(b) | ||||||||||||
4.38%, 01/15/28 | 378 | 382,725 | ||||||||||
4.00%, 10/15/30 | 2,708 | 2,640,300 | ||||||||||
Bausch Health Cos., Inc., 7.00%, 01/15/28(b) | 376 | 408,900 | ||||||||||
Bombardier, Inc., 6.13%, 01/15/23(b) | 174 | 182,401 | ||||||||||
Brookfield Residential Properties, Inc./Brookfield | ||||||||||||
Residential U.S. Corp., 6.25%, 09/15/27(b) | 341 | 361,460 | ||||||||||
Clarios Global LP, 6.75%, 05/15/25(b) | 133 | 142,809 | ||||||||||
First Quantum Minerals Ltd., 6.88%, 10/15/27(b) | 4,329 | 4,729,432 | ||||||||||
GFL Environmental, Inc., 5.13%, 12/15/26(b) | 230 | 240,925 | ||||||||||
Hudbay Minerals, Inc., 6.13%, 04/01/29(b) | 573 | 609,279 | ||||||||||
Mattamy Group Corp.(b) | ||||||||||||
5.25%, 12/15/27 | 131 | 137,222 | ||||||||||
4.63%, 03/01/30 | 4,728 | 4,775,280 | ||||||||||
MEGlobal Canada ULC, 5.88%, 05/18/30 | 2,531 | 3,095,413 | ||||||||||
|
| |||||||||||
| 17,706,146 | ||||||||||||
| Cayman Islands — 0.1% | ||||||||||||
Bioceanico Sovereign Certificate Ltd., 0.00%, 06/05/34(e) | 847 | 617,462 | ||||||||||
Melco Resorts Finance Ltd. | ||||||||||||
4.88%, 06/06/25 | 563 | 576,899 | ||||||||||
5.38%, 12/04/29(b) | 388 | 411,086 | ||||||||||
MGM China Holdings Ltd.(b) | ||||||||||||
5.38%, 05/15/24 | 409 | 420,963 | ||||||||||
5.88%, 05/15/26 | 413 | 435,018 | ||||||||||
Oryx Funding Ltd., 5.80%, 02/03/31(b) | 1,185 | 1,254,323 | ||||||||||
Sable International Finance Ltd., 5.75%, 09/07/27 | 3,382 | 3,546,872 | ||||||||||
Shelf Drilling Holdings Ltd., 8.88%, 11/15/24(b) | 543 | 557,933 | ||||||||||
Vale Overseas Ltd., 6.25%, 08/10/26 | 2,367 | 2,827,529 | ||||||||||
Wynn Macau Ltd.(b) | ||||||||||||
4.88%, 10/01/24 | 459 | 465,197 | ||||||||||
5.13%, 12/15/29 | 391 | 400,653 | ||||||||||
|
| |||||||||||
| 11,513,935 | ||||||||||||
| 20 | 2 0 2 1 BLACK ROCK ANNUAL REPORT TO SHAREHOLDERS |
Consolidated Schedule of Investments (continued) April 30, 2021 | BlackRock Global Allocation Fund, Inc. (Percentages shown are based on Net Assets) |
| Security | Par (000) | Value | ||||||||||
| Chile — 0.1% | ||||||||||||
Corp. Nacional del Cobre de Chile | ||||||||||||
3.75%, 01/15/31(b) | USD | 400 | $ | 431,500 | ||||||||
4.25%, 07/17/42 | 5,401 | 5,867,849 | ||||||||||
Embotelladora Andina SA, 3.95%, 01/21/50(b) | 1,006 | 1,057,432 | ||||||||||
Empresa de Transporte de Pasajeros Metro SA(b) | ||||||||||||
3.65%, 05/07/30 | 200 | 214,750 | ||||||||||
5.00%, 01/25/47 | 1,329 | 1,539,397 | ||||||||||
Empresa Nacional del Petroleo, 4.50%, 09/14/47 | 2,886 | 2,847,400 | ||||||||||
GNL Quintero SA, 4.63%, 07/31/29 | 2,832 | 3,094,491 | ||||||||||
Kenbourne Invest SA, 6.88%, 11/26/24(b) | 5,172 | 5,499,387 | ||||||||||
VTR Comunicaciones SpA, 4.38%, 04/15/29(b) | 2,809 | 2,832,701 | ||||||||||
|
| |||||||||||
| 23,384,907 | ||||||||||||
| China — 0.0% | ||||||||||||
China Milk Products Group Ltd., 0.00%, 01/15/49(e)(f)(l) | 39,500 | 39,500 | ||||||||||
|
| |||||||||||
| Colombia — 0.1% | ||||||||||||
Banco GNB Sudameris SA, (5 year CMT + 6.66%), 7.50%, | 1,007 | 1,031,218 | ||||||||||
Bancolombia SA, 3.00%, 01/29/25 | 1,284 | 1,312,890 | ||||||||||
Ecopetrol SA | ||||||||||||
5.38%, 06/26/26 | 1,833 | 2,056,993 | ||||||||||
6.88%, 04/29/30 | 5,371 | 6,498,642 | ||||||||||
Empresas Publicas de Medellin ESP, 4.25%, 07/18/29(b) | 5,034 | 5,064,833 | ||||||||||
Grupo Aval Ltd., 4.38%, 02/04/30(b) | 3,250 | 3,253,656 | ||||||||||
Millicom International Cellular SA, 5.13%, 01/15/28 | 2,411 | 2,538,888 | ||||||||||
SURA Asset Management SA, 4.88%, 04/17/24(b) |
| 1,787 | 1,942,022 | |||||||||
|
| |||||||||||
| 23,699,142 | ||||||||||||
| Cyprus — 0.0% | ||||||||||||
MHP SE, 7.75%, 05/10/24(b) | 3,612 | 3,801,179 | ||||||||||
|
| |||||||||||
| Dominican Republic — 0.0% | ||||||||||||
Aeropuertos Dominicanos Siglo XXI SA, 6.75%, 03/30/29(b) | 3,841 | 4,045,053 | ||||||||||
|
| |||||||||||
| France(b) — 0.0% | ||||||||||||
Altice France SA | ||||||||||||
7.38%, 05/01/26 | 2,631 | 2,727,821 | ||||||||||
5.50%, 01/15/28 | 546 | 562,489 | ||||||||||
|
| |||||||||||
| 3,290,310 | ||||||||||||
| Germany — 0.2% | ||||||||||||
Deutsche Bank AG, (SOFR + 2.76%), 3.73%, 01/14/32(a) | 3,245 | 3,215,672 | ||||||||||
Douglas GmbH, 6.00%, 04/08/26(b) | EUR | 16,588 | 20,042,632 | |||||||||
Kirk Beauty SUN GmbH, (8.25% Cash or 9.00% PIK), 9.00%, 10/01/26(b)(k) | 8,272 | 9,931,683 | ||||||||||
KME SE, 6.75%, 02/01/23 | 11,892 | 11,380,534 | ||||||||||
|
| |||||||||||
| 44,570,521 | ||||||||||||
| Greece — 0.1% | ||||||||||||
Ellaktor Value PLC, 6.38%, | 14,660 | 16,398,281 | ||||||||||
|
| |||||||||||
| Guatemala(b) — 0.0% | ||||||||||||
Banco Industrial SA, (5 year CMT + 4.44%), 4.88%, 01/29/31(a) | USD | 1,250 | 1,286,563 | |||||||||
Central American Bottling Corp., 5.75%, 01/31/27 | 2,022 | 2,128,155 | ||||||||||
Energuate Trust, 5.88%, 05/03/27(c) | 4,059 | 4,272,097 | ||||||||||
|
| |||||||||||
| 7,686,815 | ||||||||||||
| Security | Par (000) | Value | ||||||||||
| India — 0.0% | ||||||||||||
Muthoot Finance Ltd., 6.13%, 10/31/22(b) | USD | 4,179 | $ | 4,315,601 | ||||||||
REI Agro Ltd.(f)(l) | ||||||||||||
5.50%, 11/13/21 | 44,430 | 426,972 | ||||||||||
5.50%, 11/13/21(d) | 8,271 | 1 | ||||||||||
|
| |||||||||||
| 4,742,574 | ||||||||||||
| Indonesia — 0.0% | ||||||||||||
Pertamina Persero PT | ||||||||||||
3.65%, 07/30/29 | 5,508 | 5,824,022 | ||||||||||
3.10%, 08/27/30 | 1,964 | 1,996,131 | ||||||||||
|
| |||||||||||
| 7,820,153 | ||||||||||||
| Ireland — 0.0% | ||||||||||||
C&W Senior Financing DAC, 6.88%, 09/15/27 | 3,340 | 3,540,400 | ||||||||||
Phosagro OAO Via Phosagro Bond Funding DAC, 3.05%, 01/23/25(b) | 1,598 | 1,641,745 | ||||||||||
|
| |||||||||||
| 5,182,145 | ||||||||||||
| Isle of Man — 0.0% | ||||||||||||
AngloGold Ashanti Holdings PLC, 3.75%, 10/01/30 | 1,270 | 1,317,498 | ||||||||||
|
| |||||||||||
| Israel(b) — 0.1% | ||||||||||||
Bank Leumi Le-Israel BM, (5 year CMT + 1.63%), 3.28%, 01/29/31(a) | 6,019 | 6,203,332 | ||||||||||
Energean Israel Finance Ltd. | ||||||||||||
4.50%, 03/30/24 | 1,370 | 1,405,537 | ||||||||||
4.88%, 03/30/26 | 1,615 | 1,665,549 | ||||||||||
Leviathan Bond Ltd., 5.75%, 06/30/23 | 5,450 | 5,701,301 | ||||||||||
|
| |||||||||||
| 14,975,719 | ||||||||||||
| Italy — 0.1% | ||||||||||||
Forno d’Asolo SpA, (3 mo. Euribor + 5.50%), 5.50%, 04/30/27(a)(b) | EUR | 21,390 | 25,212,084 | |||||||||
|
| |||||||||||
| Japan — 0.0% | ||||||||||||
Nissan Motor Co. Ltd., 3.52%, 09/17/25(b) | USD | 1,964 | 2,100,317 | |||||||||
Takeda Pharmaceutical Co. Ltd., 3.18%, 07/09/50 | 1,151 | 1,094,957 | ||||||||||
|
| |||||||||||
| 3,195,274 | ||||||||||||
| Kazakhstan — 0.0% | ||||||||||||
KazMunayGas National Co. JSC, 3.50%, 04/14/33(b)(c) | 666 | 688,977 | ||||||||||
|
| |||||||||||
| Kuwait — 0.0% | ||||||||||||
NBK Tier 1 Financing Ltd., (6 year USD Swap + 2.88%), 3.63%(a)(b)(m) | 3,499 | 3,491,346 | ||||||||||
|
| |||||||||||
| Luxembourg — 0.2% | ||||||||||||
Altice Financing SA, 5.00%, | 598 | 589,778 | ||||||||||
Atento Luxco 1 SA, 8.00%, | 630 | 684,456 | ||||||||||
Endo Luxembourg Finance Co. I Sarl/Endo US, Inc., 6.13%, 04/01/29(b) | 999 | 989,010 | ||||||||||
FEL Energy VI Sarl, 5.75%, 12/01/40 | 2,587 | 2,689,672 | ||||||||||
Garfunkelux Holdco 3 SA(b) | ||||||||||||
6.75%, 11/01/25 | EUR | 4,916 | 6,131,894 | |||||||||
7.75%, 11/01/25 | GBP | 8,358 | 11,975,436 | |||||||||
Intelsat Jackson Holdings SA, 8.00%, 02/15/24(b) | USD | 22,270 | 23,021,612 | |||||||||
Kenbourne Invest SA, 4.70%, 01/22/28(b) | 770 | 787,325 | ||||||||||
Millicom International Cellular SA(b) | ||||||||||||
5.13%, 01/15/28 | 1,991 | 2,096,312 | ||||||||||
4.50%, 04/27/31 | 4,121 | 4,378,562 | ||||||||||
Puma International Financing SA | ||||||||||||
5.13%, 10/06/24 | 643 | 652,444 | ||||||||||
CONSOLIDATED SCHEDULE OF INVESTMENTS | 21 |
Consolidated Schedule of Investments (continued) April 30, 2021 | BlackRock Global Allocation Fund, Inc. (Percentages shown are based on Net Assets) |
| Security | Par (000) | Value | ||||||||||
| Luxembourg (continued) | ||||||||||||
Puma International Financing | ||||||||||||
5.00%, 01/24/26(b) | USD | 792 | $ | 796,109 | ||||||||
Simpar Europe SA, 5.20%, 01/26/31(b) | 3,172 | 3,195,790 | ||||||||||
|
| |||||||||||
| 57,988,400 | ||||||||||||
| Malaysia — 0.0% | ||||||||||||
Petronas Capital Ltd., 3.50%, | 1,816 | 1,959,646 | ||||||||||
|
| |||||||||||
| Mauritius(b) — 0.0% | ||||||||||||
HTA Group Ltd., 7.00%, 12/18/25 | 3,363 | 3,579,073 | ||||||||||
India Green Energy Holdings, 5.38%, 04/29/24 | 2,961 | 3,086,842 | ||||||||||
|
| |||||||||||
| 6,665,915 | ||||||||||||
| Mexico — 0.2% | ||||||||||||
Alfa SAB de CV | ||||||||||||
6.88%, 03/25/44(b)(c) | 2,019 | 2,556,357 | ||||||||||
6.88%, 03/25/44 | 200 | 253,230 | ||||||||||
Alpek SAB de CV, 3.25%, 02/25/31(b) | 460 | 456,550 | ||||||||||
Cemex SAB de CV | ||||||||||||
5.45%, 11/19/29(c) | 2,756 | 3,018,337 | ||||||||||
5.20%, 09/17/30(b) | 1,550 | 1,686,710 | ||||||||||
3.88%, 07/11/31(b) | 1,481 | 1,460,192 | ||||||||||
Coca-Cola Femsa SAB de C.V., 1.85%, 09/01/32 | 400 | 371,252 | ||||||||||
Controladora Mabe SA de CV, 5.60%, 10/23/28(b) | 3,541 | 4,114,863 | ||||||||||
Cydsa SAB de CV, 6.25%, 10/04/27(b) | 2,092 | 2,181,302 | ||||||||||
Grupo Bimbo SAB de CV, (5 year CMT + 3.28%), 5.95%(a)(b)(m) | 3,623 | 3,830,417 | ||||||||||
Industrias Penoles SAB de CV, 4.75%, 08/06/50(b) | 646 | 663,765 | ||||||||||
Infraestructura Energetica Nova SAB de CV(b) | ||||||||||||
4.88%, 01/14/48 | 1,666 | 1,673,830 | ||||||||||
4.75%, 01/15/51 | 519 | 511,215 | ||||||||||
Kimberly-Clark de Mexico SAB de CV, 2.43%, 07/01/31(b) | 646 | 632,878 | ||||||||||
Mexico City Airport Trust | ||||||||||||
4.25%, 10/31/26(b) | 2,900 | 3,112,606 | ||||||||||
5.50%, 07/31/47 | 2,617 | 2,650,203 | ||||||||||
Operadora de Servicios Mega SA de CV Sofom ER, 8.25%, 02/11/25(b) | 4,199 | 4,023,954 | ||||||||||
Petroleos Mexicanos | ||||||||||||
6.88%, 08/04/26 | 1,147 | 1,238,187 | ||||||||||
6.50%, 03/13/27 | 13,175 | 13,965,500 | ||||||||||
6.84%, 01/23/30 | 2,116 | 2,174,190 | ||||||||||
5.95%, 01/28/31 | 2,588 | 2,498,455 | ||||||||||
6.35%, 02/12/48 | 5,119 | 4,351,150 | ||||||||||
7.69%, 01/23/50 | 2,697 | 2,595,863 | ||||||||||
Trust Fibra Uno, 5.25%, 01/30/26(b) | 2,646 | 2,988,624 | ||||||||||
|
| |||||||||||
| 63,009,630 | ||||||||||||
| MultiNational(b) — 0.0% | ||||||||||||
JBS USA LUX SA/JBS USA Food Co./JBS USA | ||||||||||||
Finance, Inc., 6.50%, 04/15/29 | 832 | 933,928 | ||||||||||
Promigas SA ESP/Gases del Pacifico SAC, 3.75%, 10/16/29 | 704 | 713,592 | ||||||||||
|
| |||||||||||
| 1,647,520 | ||||||||||||
| Netherlands — 0.1% | ||||||||||||
Embraer Netherlands Finance BV, 6.95%, 01/17/28(b) | 2,629 | 2,944,480 | ||||||||||
Equate Petrochemical BV(b) | ||||||||||||
4.25%, 11/03/26 | 1,944 | 2,147,269 | ||||||||||
2.63%, 04/28/28 | 1,824 | 1,826,098 | ||||||||||
Petrobras Global Finance BV, 4.38%, 05/20/23 | 1,019 | 1,080,013 | ||||||||||
| Security | Par (000) | Value | ||||||||||
| Netherlands (continued) | ||||||||||||
VEON Holdings BV(b) | ||||||||||||
4.00%, 04/09/25 | USD | 3,603 | $ | 3,777,520 | ||||||||
3.38%, 11/25/27 | 1,276 | 1,279,828 | ||||||||||
Vivo Energy Investments BV, 5.13%, 09/24/27(b) | 1,960 | 2,090,830 | ||||||||||
Ziggo Bond Co. BV, 6.00%, | 340 | 355,300 | ||||||||||
Ziggo BV(b) | ||||||||||||
5.50%, 01/15/27 | 1,445 | 1,502,916 | ||||||||||
4.88%, 01/15/30 | 227 | 233,292 | ||||||||||
|
| |||||||||||
| 17,237,546 | ||||||||||||
| Oman — 0.0% | ||||||||||||
OQ SAOC, 5.13%, 05/06/28(b)(c) | 2,808 | 2,838,748 | ||||||||||
|
| |||||||||||
| Panama — 0.1% | ||||||||||||
AES Panama Generation Holdings SRL, 4.38%, 05/31/30(b) | 2,156 | 2,227,849 | ||||||||||
Banco Nacional de Panama, 2.50%, 08/11/30(b) | 1,372 | 1,308,202 | ||||||||||
Banistmo SA, 3.65%, 09/19/22 | 2,517 | 2,569,857 | ||||||||||
Carnival Corp., 11.50%, 04/01/23(b) | 4,335 | 4,981,782 | ||||||||||
|
| |||||||||||
| 11,087,690 | ||||||||||||
| Peru — 0.0% | ||||||||||||
Banco de Credito del Peru, (5 year CMT + 3.00%), 3.13%, | 735 | 723,056 | ||||||||||
Banco Internacional del Peru SAA Interbank, 3.25%, 10/04/26(b) | 1,004 | 1,010,928 | ||||||||||
Inkia Energy Ltd., 5.88%, 11/09/27 | 3,840 | 3,840,000 | ||||||||||
InRetail Consumer, 3.25%, | 1,495 | 1,422,717 | ||||||||||
Kallpa Generacion SA, 4.88%, 05/24/26 | 1,897 | 1,965,766 | ||||||||||
Nexa Resources SA, 5.38%, 05/04/27(b) | 719 | 762,859 | ||||||||||
|
| |||||||||||
| 9,725,326 | ||||||||||||
| S.Georgia/S.San — 0.0% | ||||||||||||
Credit Suisse Group Guernsey VII Ltd., Series AR, 3.00%, | CHF | 4,800 | 5,592,577 | |||||||||
|
| |||||||||||
| Saudi Arabia(b) — 0.1% | ||||||||||||
Arabian Centres Sukuk Ltd., 5.63%, 10/07/26 | USD | 4,474 | 4,595,637 | |||||||||
Saudi Arabian Oil Co., 2.25%, 11/24/30 | 12,706 | 12,243,819 | ||||||||||
|
| |||||||||||
| 16,839,456 | ||||||||||||
| Singapore(b) — 0.0% | ||||||||||||
Continuum Energy Levanter Pte Ltd., 4.50%, 02/09/27 | 1,921 | 1,946,934 | ||||||||||
Puma International Financing SA, 5.13%, 10/06/24 | 4,335 | 4,398,670 | ||||||||||
|
| |||||||||||
| 6,345,604 | ||||||||||||
| South Africa — 0.0% | ||||||||||||
Gold Fields Orogen Holdings BVI Ltd., 5.13%, 05/15/24(b) | 3,714 | 4,040,832 | ||||||||||
Sasol Financing USA LLC, 6.50%, 09/27/28 | 2,782 | 3,069,798 | ||||||||||
|
| |||||||||||
| 7,110,630 | ||||||||||||
| South Korea — 0.0% | ||||||||||||
Clark Equipment Co., 5.88%, 06/01/25(b) | 919 | 974,312 | ||||||||||
|
| |||||||||||
| Spain — 0.0% | ||||||||||||
Banco Bilbao Vizcaya Argentaria SA, (5 year USD Swap + 3.87%), 6.13%(a)(m) | 1,800 | 1,923,102 | ||||||||||
|
| |||||||||||
| Turkey — 0.1% | ||||||||||||
Bio City Development Co. BV, 8.00%, 07/06/21(b)(d)(f)(l)(n) | 140,850 | 13,211,730 | ||||||||||
|
| |||||||||||
| 22 | 2 0 2 1 BLACK ROCK ANNUAL REPORT TO SHAREHOLDERS |
Consolidated Schedule of Investments (continued) April 30, 2021 | BlackRock Global Allocation Fund, Inc. (Percentages shown are based on Net Assets) |
| Security | Par (000) | Value | ||||||||||
| United Arab Emirates — 0.0% | ||||||||||||
DP World Ltd., 6.85%, 07/02/37 | USD | 2,210 | $ | 2,926,592 | ||||||||
MAF Sukuk Ltd., 4.64%, 05/14/29 | 3,632 | 4,067,386 | ||||||||||
|
| |||||||||||
| 6,993,978 | ||||||||||||
| United Kingdom — 0.2% | ||||||||||||
Algeco Global Finance PLC, 6.50%, 02/15/23 | EUR | 29,191 | 35,674,847 | |||||||||
Antofagasta PLC, 2.38%, | USD | 617 | 600,033 | |||||||||
Fresnillo PLC, 4.25%, 10/02/50(b) | 1,218 | 1,193,107 | ||||||||||
Liquid Telecommunications Financing PLC, 5.50%, | 2,754 | 2,904,609 | ||||||||||
Royalty Pharma PLC, 3.55%, 09/02/50(b) | 2,214 | 2,096,082 | ||||||||||
Vedanta Resources Finance II PLC, 8.95%, 03/11/25(b) | 2,038 | 2,009,468 | ||||||||||
Virgin Media Finance PLC, 5.00%, 07/15/30(b) | 503 | 501,531 | ||||||||||
Vmed O2 UK Financing I PLC, 4.25%, 01/31/31(b) | 234 | 226,395 | ||||||||||
Vodafone Group PLC, 4.25%, 09/17/50 | 1,927 | 2,142,747 | ||||||||||
|
| |||||||||||
| 47,348,819 | ||||||||||||
| United States — 4.1% | ||||||||||||
7-Eleven, Inc., 2.80%, 02/10/51(b) | 2,332 | 2,111,008 | ||||||||||
AbbVie, Inc., 4.25%, 11/21/49 | 689 | 780,685 | ||||||||||
Acadia Healthcare Co., Inc.(b) | ||||||||||||
5.50%, 07/01/28 | 2,027 | 2,141,019 | ||||||||||
5.00%, 04/15/29 | 702 | 725,693 | ||||||||||
ADT Security Corp., 4.88%, 07/15/32(b) | 190 | 198,866 | ||||||||||
Affinity Gaming, 6.88%, 12/15/27(b) | 2,731 | 2,898,970 | ||||||||||
Air Lease Corp., 3.13%, 12/01/30 | 4,842 | 4,841,183 | ||||||||||
Albertsons Cos., Inc./Safeway, Inc./New Albertsons LP/Albertsons LLC | ||||||||||||
5.75%, 03/15/25 | 318 | 327,938 | ||||||||||
3.50%, 03/15/29(b) | 12,479 | 11,979,840 | ||||||||||
Allegiant Travel Co., 8.50%, 02/05/24(b) | 19,212 | 20,941,080 | ||||||||||
Altria Group, Inc. | ||||||||||||
3.40%, 02/04/41 | 1,194 | 1,094,457 | ||||||||||
3.70%, 02/04/51 | 2,304 | 2,066,897 | ||||||||||
Amazon.com, Inc., 2.50%, 06/03/50 | 2,346 | 2,108,555 | ||||||||||
AMC Networks, Inc. | ||||||||||||
5.00%, 04/01/24 | 215 | 217,903 | ||||||||||
4.75%, 08/01/25 | 429 | 441,870 | ||||||||||
American Builders & Contractors Supply Co., Inc., 4.00%, | 185 | 187,775 | ||||||||||
American Tower Corp. | ||||||||||||
3.10%, 06/15/50 | 1,201 | 1,119,897 | ||||||||||
2.95%, 01/15/51 | 2,381 | 2,164,442 | ||||||||||
AMN Healthcare, Inc., 4.00%, 04/15/29(b) | 855 | 855,000 | ||||||||||
Anheuser-Busch InBev Worldwide, Inc., 4.50%, 06/01/50 | 2,543 | 2,915,439 | ||||||||||
Anthem, Inc., 3.13%, 05/15/50 | 1,146 | 1,102,498 | ||||||||||
Apple, Inc., 2.65%, 02/08/51 | 2,306 | 2,140,471 | ||||||||||
Aramark Services, Inc. | ||||||||||||
4.75%, 06/01/26 | 547 | 559,991 | ||||||||||
5.00%, 02/01/28(b) | 1,255 | 1,313,044 | ||||||||||
AT&T, Inc., 3.30%, 02/01/52 | 2,333 | 2,123,323 | ||||||||||
Avantor Funding, Inc., 4.63%, 07/15/28(b) | 2,956 | 3,096,410 | ||||||||||
Avaya, Inc., 6.13%, 09/15/28(b) | 3,832 | 4,071,500 | ||||||||||
Axalta Coating Systems LLC, 3.38%, 02/15/29(b) | 521 | 506,271 | ||||||||||
B&G Foods, Inc., 5.25%, 09/15/27 | 146 | 151,092 | ||||||||||
Ball Corp., 2.88%, 08/15/30 | 862 | 832,408 | ||||||||||
Bank of America Corp.(a) | ||||||||||||
(3 mo. LIBOR US + 3.15%), 4.08%, 03/20/51 | 974 | 1,093,532 | ||||||||||
(SOFR + 1.22%), 2.65%, 03/11/32 | 13,301 | 13,412,694 | ||||||||||
| Security | Par (000) | Value | ||||||||||
| United States (continued) | ||||||||||||
Bank of America Corp.(a) (continued) | ||||||||||||
(SOFR + 1.32%), 2.69%, 04/22/32 | USD | 4,751 | $ | 4,807,884 | ||||||||
(SOFR + 1.65%), 3.48%, 03/13/52 | 2,048 | 2,098,938 | ||||||||||
BAT Capital Corp., 3.98%, 09/25/50 | 3,410 | 3,144,239 | ||||||||||
Bausch Health Americas, Inc., 9.25%, 04/01/26(b) | 746 | 826,344 | ||||||||||
Bausch Health Cos., Inc.(b) | ||||||||||||
9.00%, 12/15/25 | 772 | 837,774 | ||||||||||
6.25%, 02/15/29 | 1,356 | 1,433,970 | ||||||||||
Blue Racer Midstream LLC/Blue Racer Finance Corp., 7.63%, 12/15/25(b) | 1,075 | 1,162,075 | ||||||||||
Boise Cascade Co., 4.88%, 07/01/30(b) | 466 | 493,960 | ||||||||||
Boyd Gaming Corp., 8.63%, 06/01/25(b) | 1,435 | 1,588,832 | ||||||||||
Bristow Group, Inc., 6.88%, 03/01/28(b) | 4,432 | 4,492,940 | ||||||||||
British Airways 2020-1 Class B Pass Through Trust, Series 20 - 1, Class B, 8.38%, 11/15/28(b) | 406 | 465,038 | ||||||||||
British Airways Pass Through Trust, Series 2020-1, Class A, 4.25%, 05/15/34(b) | 975 | 1,034,209 | ||||||||||
Broadcom, Inc.(b) | ||||||||||||
1.95%, 02/15/28 | 1,280 | 1,261,096 | ||||||||||
3.75%, 02/15/51 | 3,337 | 3,223,389 | ||||||||||
Buckeye Partners LP | ||||||||||||
4.15%, 07/01/23 | 129 | 133,515 | ||||||||||
4.35%, 10/15/24 | 1,170 | 1,221,188 | ||||||||||
4.13%, 03/01/25(b) | 5,777 | 5,921,425 | ||||||||||
Builders FirstSource, Inc., 6.75%, 06/01/27(b) | 315 | 338,751 | ||||||||||
BY Crown Parent LLC/BY Bond Finance, Inc., 4.25%, 01/31/26(b) | 693 | 725,918 | ||||||||||
Caesars Entertainment, Inc.(b) | ||||||||||||
6.25%, 07/01/25 | 15,444 | 16,420,061 | ||||||||||
8.13%, 07/01/27 | 7,996 | 8,884,995 | ||||||||||
Caesars Resort Collection LLC/CRC Finco, Inc., 5.75%, 07/01/25(b) | 3,281 | 3,454,138 | ||||||||||
Calpine Corp.(b) | ||||||||||||
4.50%, 02/15/28 | 626 | 632,698 | ||||||||||
5.13%, 03/15/28 | 1,508 | 1,532,611 | ||||||||||
Carrier Global Corp., 3.58%, 04/05/50 | 4,325 | 4,349,615 | ||||||||||
CCO Holdings LLC/CCO Holdings Capital Corp., 4.75%, 03/01/30(b) | 1,527 | 1,593,806 | ||||||||||
Cedar Fair LP, 5.25%, 07/15/29 | 275 | 282,785 | ||||||||||
Cedar Fair LP/Canada’s Wonderland Co./Magnum Management Corp./Millennium Op | ||||||||||||
5.50%, 05/01/25(b) | 487 | 510,191 | ||||||||||
5.38%, 04/15/27 | 280 | 288,190 | ||||||||||
Centene Corp., 4.25%, 12/15/27 | 1,367 | 1,432,766 | ||||||||||
Centennial Resource Production LLC, 5.38%, 01/15/26(b) | 575 | 538,344 | ||||||||||
Central American Bottling Corp., 5.75%, 01/31/27 | 3,005 | 3,162,762 | ||||||||||
Charter Communications Operating LLC/Charter Communications Operating Capital | ||||||||||||
2.80%, 04/01/31 | 15,705 | 15,563,160 | ||||||||||
3.50%, 06/01/41 | 2,215 | 2,130,736 | ||||||||||
3.70%, 04/01/51 | 828 | 778,984 | ||||||||||
Cheniere Energy Partners LP | ||||||||||||
5.63%, 10/01/26 | 612 | 638,010 | ||||||||||
4.50%, 10/01/29 | 736 | 768,200 | ||||||||||
Cheniere Energy, Inc., 4.63%, 10/15/28(b) | 4,297 | 4,480,267 | ||||||||||
Chesapeake Energy Corp.(b) | ||||||||||||
5.50%, 02/01/26 | 4,991 | 5,265,505 | ||||||||||
5.88%, 02/01/29 | 910 | 980,525 | ||||||||||
CONSOLIDATED SCHEDULE OF INVESTMENTS | 23 |
Consolidated Schedule of Investments (continued) April 30, 2021 | BlackRock Global Allocation Fund, Inc. (Percentages shown are based on Net Assets) |
| Security | Par (000) | Value | ||||||||||
| United States (continued) | ||||||||||||
Chobani LLC/Chobani Finance Corp., Inc., 4.63%, 11/15/28(b) | USD | 615 | $ | 633,450 | ||||||||
CHS/Community Health Systems, Inc., 8.00%, 03/15/26(b) | 1,893 | 2,039,707 | ||||||||||
Churchill Downs, Inc.(b) | ||||||||||||
5.50%, 04/01/27 | 333 | 345,676 | ||||||||||
4.75%, 01/15/28 | 131 | 134,603 | ||||||||||
Citigroup, Inc.(a) | ||||||||||||
(SOFR + 1.17%), 2.56%, 05/01/32(c) | 3,525 | 3,521,162 | ||||||||||
(SOFR + 3.91%), 4.41%, 03/31/31 | 18,188 | 20,812,576 | ||||||||||
(SOFR + 4.55%), 5.32%, 03/26/41 | 1,620 | 2,105,902 | ||||||||||
Clarios Global LP/Clarios US Finance Co., 6.25%, 05/15/26(b) | 265 | 281,082 | ||||||||||
Clean Harbors, Inc., 4.88%, 07/15/27(b) | 294 | 306,128 | ||||||||||
CNX Resources Corp., 7.25%, 03/14/27(b) | 181 | 195,520 | ||||||||||
CommScope Technologies LLC, 6.00%, 06/15/25(b) | 2,170 | 2,207,975 | ||||||||||
CommScope, Inc., 7.13%, | 1,854 | 2,004,637 | ||||||||||
Continental Resources, Inc., 4.38%, 01/15/28 | 248 | 269,700 | ||||||||||
Crown Castle International Corp., 3.25%, 01/15/51 | 837 | 790,521 | ||||||||||
CrownRock LP/CrownRock Finance, Inc., 5.63%, 10/15/25(b) | 886 | 917,010 | ||||||||||
CSC Holdings LLC(b) | ||||||||||||
5.50%, 05/15/26 | 771 | 792,896 | ||||||||||
5.38%, 02/01/28 | 826 | 869,274 | ||||||||||
5.75%, 01/15/30 | 1,144 | 1,216,215 | ||||||||||
4.13%, 12/01/30 | 9,915 | 9,865,425 | ||||||||||
4.63%, 12/01/30 | 18,248 | 17,837,420 | ||||||||||
3.38%, 02/15/31 | 3,518 | 3,295,486 | ||||||||||
CVS Health Corp., 5.05%, 03/25/48 | 628 | 772,247 | ||||||||||
DAE Funding LLC(b) | ||||||||||||
2.63%, 03/20/25(c) | 1,428 | 1,441,209 | ||||||||||
3.38%, 03/20/28 | 4,729 | 4,717,177 | ||||||||||
Darling Ingredients, Inc., 5.25%, 04/15/27(b) | 280 | 294,350 | ||||||||||
DaVita, Inc.(b) | ||||||||||||
4.63%, 06/01/30 | 9,533 | 9,652,162 | ||||||||||
3.75%, 02/15/31 | 15,222 | 14,460,900 | ||||||||||
DCP Midstream Operating LP | ||||||||||||
5.38%, 07/15/25 | 291 | 319,373 | ||||||||||
5.13%, 05/15/29 | 160 | 170,800 | ||||||||||
Dell International LLC/EMC Corp., 8.35%, 07/15/46(b) | 1,384 | 2,168,983 | ||||||||||
DISH DBS Corp., 7.75%, 07/01/26 | 750 | 864,375 | ||||||||||
Elanco Animal Health, Inc. | ||||||||||||
4.91%, 08/27/21 | 272 | 274,521 | ||||||||||
5.90%, 08/28/28 | 372 | 423,001 | ||||||||||
Emergent BioSolutions, Inc., 3.88%, 08/15/28(b) | 399 | 374,063 | ||||||||||
Encompass Health Corp., 4.50%, 02/01/28 | 426 | 441,443 | ||||||||||
Endeavor Energy Resources LP/EER Finance, Inc.(b) | ||||||||||||
6.63%, 07/15/25 | 296 | 315,240 | ||||||||||
5.50%, 01/30/26 | 270 | 279,617 | ||||||||||
5.75%, 01/30/28 | 990 | 1,056,825 | ||||||||||
Energizer Holdings, Inc.(b) | ||||||||||||
4.75%, 06/15/28 | 1,226 | 1,253,585 | ||||||||||
4.38%, 03/31/29 | 766 | 760,255 | ||||||||||
Energy Transfer Operating LP, 5.00%, 05/15/50 | 2,051 | 2,161,461 | ||||||||||
Enterprise Products Operating LLC, 3.20%, 02/15/52 | 3,538 | 3,259,786 | ||||||||||
Equinix, Inc., 2.95%, 09/15/51 | 2,412 | 2,202,789 | ||||||||||
| Security | Par (000) | Value | ||||||||||
| United States (continued) | ||||||||||||
ESH Hospitality, Inc., 4.63%, 10/01/27(b) | USD | 194 | $ | 205,640 | ||||||||
Ford Motor Co. | ||||||||||||
9.00%, 04/22/25 | 1,048 | 1,279,870 | ||||||||||
9.63%, 04/22/30 | 297 | 416,543 | ||||||||||
Ford Motor Credit Co. LLC | ||||||||||||
5.13%, 06/16/25 | 1,421 | 1,552,300 | ||||||||||
4.13%, 08/17/27 | 2,478 | 2,589,783 | ||||||||||
Forestar Group, Inc.(b) | ||||||||||||
8.00%, 04/15/24 | 3,097 | 3,222,738 | ||||||||||
3.85%, 05/15/26 | 1,840 | 1,859,228 | ||||||||||
5.00%, 03/01/28 | 12,057 | 12,509,137 | ||||||||||
Freeport-McMoRan, Inc. | ||||||||||||
5.00%, 09/01/27 | 819 | 869,065 | ||||||||||
4.63%, 08/01/30 | 1,381 | 1,524,279 | ||||||||||
Fresh Market, Inc., 9.75%, | 3,262 | 3,347,627 | ||||||||||
Frontier Communications Corp. | ||||||||||||
10.50%, 09/15/22(f)(l) | 13,388 | 10,174,880 | ||||||||||
11.00%, 09/15/25(f)(l) | 3,170 | 2,417,125 | ||||||||||
5.88%, 10/15/27(b) | 2,170 | 2,305,625 | ||||||||||
5.00%, 05/01/28(b) | 5,269 | 5,380,966 | ||||||||||
6.75%, 05/01/29(b) | 8,434 | 8,884,882 | ||||||||||
Frontier North Inc., 6.73%, 02/15/28 | 5,875 | 6,259,107 | ||||||||||
Full House Resorts, Inc., 8.25%, 02/15/28(b) | 838 | 900,850 | ||||||||||
GCI LLC, 4.75%, 10/15/28(b) | 1,436 | 1,479,080 | ||||||||||
General Electric Co., 4.35%, 05/01/50 | 2,598 | 2,892,656 | ||||||||||
General Motors Co., 5.95%, 04/01/49 | 2,252 | 2,911,566 | ||||||||||
General Motors Financial Co., Inc., 2.70%, 08/20/27 | 8,499 | 8,750,853 | ||||||||||
Genesis Energy LP/Genesis Energy Finance Corp., 8.00%, 01/15/27 | 1,243 | 1,280,563 | ||||||||||
Gilead Sciences, Inc., 2.80%, 10/01/50 | 2,363 | 2,124,939 | ||||||||||
Goldman Sachs Group Inc. (The), (SOFR + 1.28%), 2.62%, | 10,072 | 10,121,147 | ||||||||||
Goldman Sachs Group, Inc., (SOFR + 1.09%), 1.99%, 01/27/32(a) | 14,025 | 13,321,260 | ||||||||||
Graham Packaging Co., Inc., 7.13%, 08/15/28(b) | 364 | 390,390 | ||||||||||
Gray Television, Inc., 7.00%, 05/15/27(b) | 506 | 552,173 | ||||||||||
Great Western Petroleum LLC/Great Western Finance Corp., 12.00%, 09/01/25(b) | 1,148 | 995,890 | ||||||||||
Green Plains SPE LLC 02/26 11.75, 11.75%, 02/09/26(d) | 91,561 | 91,680,029 | ||||||||||
Harsco Corp., 5.75%, 07/31/27(b) | 129 | 136,007 | ||||||||||
Herc Holdings, Inc., 5.50%, | 315 | 333,113 | ||||||||||
Hess Corp., 5.60%, 02/15/41 | 1,836 | 2,151,753 | ||||||||||
Hilton Domestic Operating Co., Inc. | ||||||||||||
4.88%, 01/15/30 | 488 | 520,340 | ||||||||||
4.00%, 05/01/31(b) | 931 | 940,310 | ||||||||||
3.63%, 02/15/32(b) | 14,383 | 14,144,530 | ||||||||||
Hilton Worldwide Finance LLC/Hilton Worldwide Finance Corp., 4.88%, 04/01/27 | 332 | 344,865 | ||||||||||
Hologic, Inc., 3.25%, 02/15/29(b) | 8,571 | 8,421,007 | ||||||||||
Homes By West Bay LLC, 9.50%, 04/30/27 | 19,399 | 19,011,020 | ||||||||||
Howard Hughes Corp.(b) | ||||||||||||
5.38%, 08/01/28 | 7,194 | 7,611,252 | ||||||||||
4.13%, 02/01/29 | 3,624 | 3,587,760 | ||||||||||
4.38%, 02/01/31 | 3,987 | 3,947,130 | ||||||||||
Hughes Satellite Systems Corp., 7.63%, 06/15/21 | 2,510 | 2,527,068 | ||||||||||
iHeartCommunications, Inc. | ||||||||||||
6.38%, 05/01/26 | 758 | 807,476 | ||||||||||
5.25%, 08/15/27(b) | 376 | 389,160 | ||||||||||
| 24 | 2 0 2 1 BLACK ROCK ANNUAL REPORT TO SHAREHOLDERS |
Consolidated Schedule of Investments (continued) April 30, 2021 | BlackRock Global Allocation Fund, Inc. (Percentages shown are based on Net Assets) |
| Security | Par (000) | Value | ||||||||||
| United States (continued) | ||||||||||||
iHeartCommunications, | ||||||||||||
4.75%, 01/15/28(b) | USD | 197 | $ | 202,910 | ||||||||
International Business Machines Corp., 4.25%, 05/15/49 | 1,828 | 2,144,240 | ||||||||||
International Game Technology PLC, 6.50%, 02/15/25(b) | 659 | 729,843 | ||||||||||
IQVIA, Inc., 5.00%, 05/15/27(b) | 613 | 641,351 | ||||||||||
Iron Mountain, Inc.(b) | ||||||||||||
4.88%, 09/15/27 | 527 | 548,080 | ||||||||||
5.25%, 03/15/28 | 435 | 456,315 | ||||||||||
5.25%, 07/15/30 | 9,337 | 9,698,809 | ||||||||||
4.50%, 02/15/31 | 10,376 | 10,347,777 | ||||||||||
Jaguar Holding Co. II/PPD Development LP, 5.00%, 06/15/28(b) | 926 | 1,009,803 | ||||||||||
JBS Investments II GmbH, 7.00%, 01/15/26(b) | 564 | 600,547 | ||||||||||
JBS USA LUX SA/JBS USA Finance, Inc., 6.75%, 02/15/28(b) | 532 | 583,817 | ||||||||||
Joseph T Ryerson & Son, Inc., 8.50%, 08/01/28(b) | 918 | 1,014,344 | ||||||||||
JPMorgan Chase & Co.(a) | ||||||||||||
(SOFR + 1.07%), 1.95%, 02/04/32 | 14,046 | 13,352,708 | ||||||||||
(SOFR + 1.58%), 3.33%, 04/22/52 | 6,694 | 6,695,258 | ||||||||||
(SOFR + 2.44%), 3.11%, 04/22/51 | 2,144 | 2,083,849 | ||||||||||
Kaiser Aluminum Corp., 4.63%, 03/01/28(b) | 152 | 156,180 | ||||||||||
Kinder Morgan, Inc., 3.60%, 02/15/51 | 3,439 | 3,296,903 | ||||||||||
Kraft Heinz Foods Co., 5.00%, 07/15/35 | 451 | 526,728 | ||||||||||
Kroger Co., 3.95%, 01/15/50 | 1,013 | 1,106,042 | ||||||||||
L Brands, Inc. | ||||||||||||
5.25%, 02/01/28 | 530 | 581,013 | ||||||||||
6.63%, 10/01/30(b) | 558 | 643,073 | ||||||||||
Lamar Media Corp. | ||||||||||||
4.88%, 01/15/29 | 579 | 609,398 | ||||||||||
4.00%, 02/15/30 | 215 | 217,150 | ||||||||||
Lamb Weston Holdings, Inc.(b) | ||||||||||||
4.88%, 11/01/26 | 461 | 478,288 | ||||||||||
4.88%, 05/15/28 | 133 | 146,633 | ||||||||||
Legends Hospitality Holding Co. LLC/Legends Hospitality Co-Issuer, Inc., 5.00%, 02/01/26(b) | 443 | 457,398 | ||||||||||
Level 3 Financing, Inc.(b) | ||||||||||||
4.25%, 07/01/28 | 17,778 | 17,913,291 | ||||||||||
3.63%, 01/15/29 | 10,015 | 9,702,031 | ||||||||||
Lions Gate Capital Holdings LLC, 5.50%, 04/15/29(b) | 4,620 | 4,631,550 | ||||||||||
Lowe’s Cos., Inc., 3.00%, 10/15/50 | 1,176 | 1,109,625 | ||||||||||
Lumen Technologies, Inc.(b) | ||||||||||||
5.13%, 12/15/26 | 464 | 486,620 | ||||||||||
4.00%, 02/15/27 | 470 | 478,874 | ||||||||||
LYB International Finance III LLC, 3.63%, 04/01/51 | 777 | 776,875 | ||||||||||
Marriott Ownership Resorts, Inc., 6.13%, 09/15/25(b) | 7,482 | 7,940,272 | ||||||||||
Marriott Ownership Resorts, Inc./ILG LLC, 6.50%, 09/15/26 | 433 | 452,485 | ||||||||||
Masonite International Corp., 5.38%, 02/01/28(b) | 389 | 410,395 | ||||||||||
MasTec, Inc., 4.50%, 08/15/28(b) | 158 | 164,715 | ||||||||||
Mauser Packaging Solutions Holding Co., 7.25%, 04/15/25(b) | 1,329 | 1,292,452 | ||||||||||
McDonald’s Corp., 4.45%, 09/01/48 | 5,587 | 6,626,740 | ||||||||||
Meritor, Inc.(b) | ||||||||||||
6.25%, 06/01/25 | 2,009 | 2,149,359 | ||||||||||
| Security | Par (000) | Value | ||||||||||
| United States (continued) | ||||||||||||
Meritor, Inc.(b) (continued) | USD | 78 | $ | 78,975 | ||||||||
MGM Growth Properties Operating Partnership LP/MGP Finance Co-Issuer, Inc. | ||||||||||||
5.63%, 05/01/24 | 600 | 646,932 | ||||||||||
4.63%, 06/15/25(b) | 1,036 | 1,102,185 | ||||||||||
5.75%, 02/01/27 | 285 | 317,865 | ||||||||||
3.88%, 02/15/29(b) | 3,441 | 3,483,772 | ||||||||||
MGM Resorts International | ||||||||||||
6.75%, 05/01/25 | 358 | 383,955 | ||||||||||
5.50%, 04/15/27 | 472 | 515,070 | ||||||||||
Midwest Gaming Borrower LLC, 4.88%, 05/01/29(b) | 4,686 | 4,684,547 | ||||||||||
Molina Healthcare, Inc., 3.88%, 11/15/30(b) | 1,256 | 1,293,680 | ||||||||||
Morgan Stanley(a) | ||||||||||||
(SOFR + 1.43%), 2.80%, 01/25/52 | 1,198 | 1,107,955 | ||||||||||
(SOFR + 1.49%), 3.22%, 04/22/42 | 2,231 | 2,260,647 | ||||||||||
Motorola Solutions, Inc., 5.50%, 09/01/44 | 1,734 | 2,150,302 | ||||||||||
MPT Operating Partnership LP/MPT Finance Corp. | ||||||||||||
5.00%, 10/15/27 | 778 | 818,845 | ||||||||||
4.63%, 08/01/29 | 561 | 593,959 | ||||||||||
Nationstar Mortgage Holdings, Inc.(b) | ||||||||||||
5.50%, 08/15/28 | 2,103 | 2,124,030 | ||||||||||
5.13%, 12/15/30 | 1,219 | 1,206,396 | ||||||||||
New Home Co., Inc., 7.25%, 10/15/25(b) | 2,594 | 2,725,957 | ||||||||||
Nexstar Broadcasting, Inc.(b) | ||||||||||||
5.63%, 07/15/27 | 723 | 763,669 | ||||||||||
4.75%, 11/01/28 | 3,259 | 3,320,106 | ||||||||||
NRG Energy, Inc. | ||||||||||||
5.75%, 01/15/28 | 461 | 489,813 | ||||||||||
5.25%, 06/15/29(b) | 748 | 801,295 | ||||||||||
NuStar Logistics LP, 5.75%, 10/01/25 | 8,282 | 8,913,502 | ||||||||||
ONEOK Partners LP, 4.90%, 03/15/25 | 9,738 | 10,899,530 | ||||||||||
Oracle Corp., 3.95%, 03/25/51 | 6,995 | 7,277,869 | ||||||||||
Organon Finance 1 LLC, 5.13%, 04/30/31(b) | 1,231 | 1,277,286 | ||||||||||
Outfront Media Capital LLC/Outfront Media Capital Corp.(b) | ||||||||||||
6.25%, 06/15/25 | 546 | 579,443 | ||||||||||
5.00%, 08/15/27 | 460 | 474,375 | ||||||||||
4.63%, 03/15/30 | 123 | 121,770 | ||||||||||
Park Intermediate Holdings LLC/PK Domestic Property LLC/PK Finance Co. Issuer, 7.50%, 06/01/25(b) | 131 | 142,448 | ||||||||||
Park Intermediate Holdings LLC/PK Domestic Property LLC/PK Finance Co.Issuer, 5.88%, 10/01/28(b) | 1,192 | 1,265,010 | ||||||||||
Parsley Energy LLC/Parsley Finance Corp., 5.63%, 10/15/27(b) | 390 | 426,075 | ||||||||||
PBF Holding Co. LLC/PBF Finance Corp., 9.25%, 05/15/25(b) | 1,685 | 1,765,037 | ||||||||||
Peninsula Pacific Entertainment LLC/Peninsula Pacific Entertainment Finance, Inc., 8.50%, 11/15/27(b) | 2,506 | 2,665,131 | ||||||||||
PennyMac Financial Services, Inc., 5.38%, 10/15/25(b) | 129 | 135,934 | ||||||||||
PG&E Corp. | ||||||||||||
5.00%, 07/01/28 | 6,251 | 6,547,922 | ||||||||||
5.25%, 07/01/30 | 1,069 | 1,141,158 | ||||||||||
CONSOLIDATED SCHEDULE OF INVESTMENTS | 25 |
Consolidated Schedule of Investments (continued) April 30, 2021 | BlackRock Global Allocation Fund, Inc. (Percentages shown are based on Net Assets) |
| Security | Par (000) | Value | ||||||||||
| United States (continued) | ||||||||||||
Picasso Finance Sub, Inc., 6.13%, 06/15/25(b) | USD | 1,347 | $ | 1,432,871 | ||||||||
Pilgrim’s Pride Corp., 5.88%, 09/30/27(b) | 478 | 507,278 | ||||||||||
Pitney Bowes, Inc.(b) | ||||||||||||
6.88%, 03/15/27 | 5,678 | 5,791,560 | ||||||||||
7.25%, 03/15/29 | 4,815 | 4,935,375 | ||||||||||
Playtika Holding Corp., 4.25%, 03/15/29(b) | 2,097 | 2,083,894 | ||||||||||
Post Holdings, Inc., 4.63%, 04/15/30(b) | 1,675 | 1,691,750 | ||||||||||
Prime Security Services Borrower LLC/Prime Finance, Inc.(b) | ||||||||||||
3.38%, 08/31/27 | 1,139 | 1,100,559 | ||||||||||
6.25%, 01/15/28 | 502 | 524,590 | ||||||||||
Quicken Loans LLC, 5.25%, 01/15/28(b) | 1,859 | 1,961,245 | ||||||||||
Quicken Loans LLC/Quicken Loans Co.Issuer, Inc., 3.88%, | 12,351 | 12,011,347 | ||||||||||
Quicken Loans LLC/Quicken Loans Co-Issuer, Inc., 3.63%, | 11,371 | 11,058,297 | ||||||||||
Radiate Holdco LLC/Radiate Finance, Inc., 4.50%, 09/15/26(b) | 2,800 | 2,849,000 | ||||||||||
Reynolds Group Issuer, Inc./Reynolds Group Issuer LLC/Reynolds Group Issuer Lu, 4.00%, 10/15/27(b) | 477 | 471,634 | ||||||||||
Rockies Express Pipeline LLC, 4.95%, 07/15/29(b) | 142 | 144,663 | ||||||||||
Sabre GLBL, Inc., 9.25%, | 2,170 | 2,593,150 | ||||||||||
Sasol Financing USA LLC | ||||||||||||
4.38%, 09/18/26 | 1,857 | 1,884,855 | ||||||||||
5.50%, 03/18/31 | 3,048 | 3,096,920 | ||||||||||
Scientific Games International, Inc., 5.00%, 10/15/25(b) | 323 | 333,498 | ||||||||||
SeaWorld Parks & Entertainment, Inc., 9.50%, 08/01/25(b) | 983 | 1,067,361 | ||||||||||
Select Medical Corp., 6.25%, 08/15/26(b) | 19,893 | 21,150,934 | ||||||||||
Service Properties Trust | ||||||||||||
5.00%, 08/15/22 | 11,857 | 12,010,904 | ||||||||||
4.50%, 06/15/23 | 8,652 | 8,826,198 | ||||||||||
4.35%, 10/01/24 | 198 | 197,010 | ||||||||||
7.50%, 09/15/25 | 1,385 | 1,569,775 | ||||||||||
Shea Homes LP/Shea Homes Funding Corp., 4.75%, | 2,701 | 2,729,225 | ||||||||||
Shift4 Payments LLC/Shift4 Payments Finance Sub, Inc., 4.63%, 11/01/26(b) | 400 | 417,000 | ||||||||||
Sirius XM Radio, Inc.(b) | ||||||||||||
5.00%, 08/01/27 | 836 | 875,457 | ||||||||||
5.50%, 07/01/29 | 702 | 758,599 | ||||||||||
4.13%, 07/01/30 | 8,921 | 8,921,000 | ||||||||||
Six Flags Entertainment Corp., 4.88%, 07/31/24(b) | 543 | 546,394 | ||||||||||
Six Flags Theme Parks, Inc., 7.00%, 07/01/25(b) | 192 | 207,431 | ||||||||||
SM Energy Co. | ||||||||||||
1.50%, 07/01/21(n) | 6,032 | 5,957,144 | ||||||||||
10.00%, 01/15/25(b) | 5,648 | 6,424,600 | ||||||||||
Specialty Building Products Holdings LLC/SBP Finance Corp., 6.38%, 09/30/26(b) | 156 | 164,385 | ||||||||||
Spirit Loyalty Cayman Ltd./Spirit IP Cayman Ltd., | ||||||||||||
8.00%, 09/20/25(b) | 1,231 | 1,386,737 | ||||||||||
Standard Industries, Inc.(b) | ||||||||||||
5.00%, 02/15/27 | 257 | 265,031 | ||||||||||
4.38%, 07/15/30 | 1,612 | 1,616,030 | ||||||||||
3.38%, 01/15/31 | 593 | 555,834 | ||||||||||
Steel Dynamics, Inc., 3.25%, 10/15/50 | 2,249 | 2,148,544 | ||||||||||
Stericycle, Inc., 3.88%, 01/15/29(b) | 475 | 473,813 | ||||||||||
Summit Materials LLC/Summit Materials Finance Corp., 5.25%, 01/15/29(b) | 945 | 994,613 | ||||||||||
| Security | Par (000) | Value | ||||||||||
| United States (continued) | ||||||||||||
Sunoco LP/Sunoco Finance Corp. | ||||||||||||
6.00%, 04/15/27 | USD | 332 | $ | 349,115 | ||||||||
4.50%, 05/15/29(b) | 1,259 | 1,271,590 | ||||||||||
Talen Energy Supply LLC, 7.63%, 06/01/28(b) | 8,340 | 8,644,827 | ||||||||||
Targa Resources Partners LP/Targa Resources Partners Finance Corp. | ||||||||||||
5.88%, 04/15/26 | 558 | 584,505 | ||||||||||
5.38%, 02/01/27 | 279 | 289,649 | ||||||||||
6.50%, 07/15/27 | 450 | 489,375 | ||||||||||
6.88%, 01/15/29 | 456 | 511,860 | ||||||||||
4.00%, 01/15/32(b) | 10,587 | 10,401,727 | ||||||||||
Taylor Morrison Communities, Inc., 5.88%, 06/15/27(b) | 103 | 116,905 | ||||||||||
TEGNA, Inc. | ||||||||||||
4.75%, 03/15/26(b) | 1,957 | 2,081,269 | ||||||||||
4.63%, 03/15/28 | 310 | 316,588 | ||||||||||
Teleflex, Inc., 4.63%, 11/15/27 | 275 | 292,457 | ||||||||||
Tenet Healthcare Corp. | ||||||||||||
4.63%, 07/15/24 | 770 | 781,627 | ||||||||||
4.63%, 09/01/24(b) | 328 | 337,840 | ||||||||||
5.13%, 05/01/25 | 756 | 765,072 | ||||||||||
4.88%, 01/01/26(b) | 1,131 | 1,175,109 | ||||||||||
6.25%, 02/01/27(b) | 844 | 885,145 | ||||||||||
4.63%, 06/15/28(b) | 1,104 | 1,140,698 | ||||||||||
Texas Capital Bank NA, (3 mo. LIBOR US + 4.50%), 4.70%, 09/30/24(a)(b) | 11,008 | 10,998,682 | ||||||||||
T-Mobile USA, Inc.(b) | ||||||||||||
4.50%, 04/15/50 | 992 | 1,118,788 | ||||||||||
3.30%, 02/15/51 | 2,273 | 2,119,754 | ||||||||||
TransDigm, Inc. | ||||||||||||
6.25%, 03/15/26(b) | 38,932 | 41,219,255 | ||||||||||
6.38%, 06/15/26 | 477 | 494,589 | ||||||||||
Travel & Leisure Co., 6.63%, 07/31/26(b) | 3,659 | 4,194,129 | ||||||||||
TreeHouse Foods, Inc., 4.00%, 09/01/28 | 132 | 131,340 | ||||||||||
Tri Pointe Homes, Inc., 5.70%, 06/15/28 | 482 | 535,145 | ||||||||||
U.S. Foods, Inc., 6.25%, 04/15/25(b) | 260 | 276,171 | ||||||||||
Uber Technologies, Inc., 6.25%, 01/15/28(b) | 752 | 816,980 | ||||||||||
Under Armour, Inc., 3.25%, 06/15/26 | 154 | 156,218 | ||||||||||
United Airlines Pass-Through Trust | ||||||||||||
Series 2020-1, Class A, 5.88%, 04/15/29 | 20,086 | 22,218,706 | ||||||||||
Series 2020-1, Class B, 4.88%, 07/15/27 | 559 | 583,774 | ||||||||||
United Rentals North America, Inc. | ||||||||||||
5.50%, 05/15/27 | 569 | 606,696 | ||||||||||
4.88%, 01/15/28 | 906 | 959,228 | ||||||||||
3.88%, 02/15/31 | 2,615 | 2,631,684 | ||||||||||
United Shore Financial Services LLC, 5.50%, 11/15/25(b) | 10,584 | 10,994,130 | ||||||||||
UnitedHealth Group, Inc. | ||||||||||||
2.90%, 05/15/50 | 1,157 | 1,108,380 | ||||||||||
3.13%, 05/15/60 | 2,163 | 2,117,555 | ||||||||||
US Concrete, Inc., 5.13%, 03/01/29(b) | 2,054 | 2,120,755 | ||||||||||
Vail Resorts, Inc., 6.25%, 05/15/25(b) | 160 | 169,800 | ||||||||||
Valvoline, Inc., 4.25%, 02/15/30(b) | 155 | 158,872 | ||||||||||
Verizon Communications, Inc. | ||||||||||||
2.88%, 11/20/50 | 2,718 | 2,472,863 | ||||||||||
3.55%, 03/22/51 | 4,542 | 4,614,083 | ||||||||||
3.70%, 03/22/61 | 3,224 | 3,261,167 | ||||||||||
ViacomCBS, Inc., 4.95%, 05/19/50 | 1,785 | 2,086,676 | ||||||||||
ViaSat, Inc., 5.63%, 04/15/27(b) | 158 | 165,505 | ||||||||||
VICI Properties LP/VICI Note Co., Inc.(b) | ||||||||||||
3.50%, 02/15/25 | 3,730 | 3,809,262 | ||||||||||
| 26 | 2 0 2 1 BLACK ROCK ANNUAL REPORT TO SHAREHOLDERS |
Consolidated Schedule of Investments (continued) April 30, 2021 | BlackRock Global Allocation Fund, Inc. (Percentages shown are based on Net Assets) |
| Security | Par (000) | Value | ||||||||||
| United States (continued) | ||||||||||||
VICI Properties LP/VICI Note Co., Inc.(b) (continued) | ||||||||||||
3.75%, 02/15/27 | USD | 3,595 | $ | 3,623,868 | ||||||||
4.13%, 08/15/30 | 4,285 | 4,351,975 | ||||||||||
Vistra Operations Co. LLC(b) | ||||||||||||
5.63%, 02/15/27 | 12,130 | 12,615,200 | ||||||||||
5.00%, 07/31/27 | 721 | 746,978 | ||||||||||
Weekley Homes LLC/Weekley Finance Corp., 4.88%, | 3,022 | 3,120,215 | ||||||||||
WESCO Distribution, Inc., 7.25%, 06/15/28(b) | 924 | 1,025,640 | ||||||||||
William Carter Co., 5.63%, 03/15/27(b) | 281 | 295,401 | ||||||||||
Williams Scotsman International, Inc., 4.63%, 08/15/28(b) | 470 | 479,480 | ||||||||||
WMG Acquisition Corp., 3.88%, 07/15/30(b) | 138 | 139,725 | ||||||||||
WPX Energy, Inc. | ||||||||||||
5.25%, 10/15/27 | 201 | 214,509 | ||||||||||
4.50%, 01/15/30 | 299 | 322,098 | ||||||||||
Wyndham Hotels & Resorts, Inc., 4.38%, 08/15/28(b) | 1,407 | 1,452,305 | ||||||||||
Wynn Las Vegas LLC/Wynn Las Vegas Capital Corp., 5.25%, 05/15/27(b) | 431 | 455,244 | ||||||||||
Wynn Resorts Finance LLC/Wynn Resorts Capital Corp.(b) | ||||||||||||
7.75%, 04/15/25 | 295 | 318,600 | ||||||||||
5.13%, 10/01/29 | 359 | 371,091 | ||||||||||
Xerox Holdings Corp., 5.00%, 08/15/25(b) | 2,629 | 2,760,450 | ||||||||||
XHR LP, 6.38%, 08/15/25(b) | 8,099 | 8,574,816 | ||||||||||
XPO Logistics, Inc., 6.25%, 05/01/25(b) | 1,301 | 1,393,631 | ||||||||||
Yum! Brands, Inc. | ||||||||||||
4.75%, 01/15/30(b) | 401 | 429,070 | ||||||||||
3.63%, 03/15/31 | 3,272 | 3,229,497 | ||||||||||
Zayo Group Holdings, Inc., 4.00%, 03/01/27(b) | 395 | 392,235 | ||||||||||
|
| |||||||||||
| 1,104,191,358 | ||||||||||||
|
| |||||||||||
Total Corporate Bonds — 6.8% |
| 1,841,672,452 | ||||||||||
|
| |||||||||||
| Floating Rate Loan Interests(a) | ||||||||||||
Canada — 0.1% | ||||||||||||
Knowlton Development Corp. Inc., 2020 EUR Term Loan B, (EURIBOR + 5.00%), 5.00%, 12/21/25 | EUR | 23,418 | 28,194,927 | |||||||||
Valeant Pharmaceuticals International, Inc., 2018 Term Loan B, 06/02/25(c)(o) | USD | 2,532 | 2,526,906 | |||||||||
|
| |||||||||||
| 30,721,833 | ||||||||||||
| Chile(d) — 0.1% | ||||||||||||
Latam Airlines Group SA | ||||||||||||
Term Loan 2015-1A, (3 mo. LIBOR + 3.20%, 1.50% Floor), 4.70%, 08/30/29 | 27,809 | 27,948,229 | ||||||||||
Term Loan 2015-1B, (3 mo. LIBOR + 3.20%, 1.50% Floor), 4.70%, 08/30/25 | 4,743 | 4,766,739 | ||||||||||
|
| |||||||||||
| 32,714,968 | ||||||||||||
| France — 0.1% | ||||||||||||
Babilou Group, EUR Term Loan B, (Euribor + 5.00%), 5.00%, 11/17/27 | EUR | 26,693 | 32,151,982 | |||||||||
|
| |||||||||||
| Security | Par (000) | Value | ||||||||||
| Germany — 0.1% | ||||||||||||
HSE24 Trading GmbH, EUR Term Loan, (Euribor + 6.50%), 6.50%, 12/31/25(d) | EUR | 25,846 | $ | 30,880,881 | ||||||||
|
| |||||||||||
| Luxembourg — 0.2% | ||||||||||||
Jazz Financing Lux S.a.r.l., USD Term Loan, 04/22/28(c)(o) | USD | 14,749 | 14,779,678 | |||||||||
Luxembourg Life Fund, 2021 Term Loan, (3 mo. LIBOR + 9.25%), 9.43%, 04/01/23(d) | 16,777 | 16,609,230 | ||||||||||
Pronovias SL | ||||||||||||
EUR Term Loan B1, (Euribor + 4.50%), 4.50%, 10/02/24 | EUR | 7,864 | 6,622,542 | |||||||||
EUR Term Loan B3, (EURIBOR + 4.50%), 4.50%, 10/02/24 | 19,852 | 16,719,205 | ||||||||||
|
| |||||||||||
| 54,730,655 | ||||||||||||
| Netherlands — 0.3% | ||||||||||||
Boels Topholding BV, 2020 EUR Term Loan B, (EURIBOR + 4.00%), 4.00%, 02/06/27 | 31,155 | 37,519,763 | ||||||||||
Ziggo BV, 2019 EUR Term Loan H, (6 mo. LIBOR + 3.00%), 3.00%, 01/31/29 | 39,843 | 47,584,895 | ||||||||||
|
| |||||||||||
| 85,104,658 | ||||||||||||
| United Kingdom — 0.1% | ||||||||||||
BCA Marketplace PLC, 2020 EUR Term Loan, (Euribor + 5.50%), 5.50%, 04/29/23(d) | 20,860 | 24,984,544 | ||||||||||
|
| |||||||||||
| United States — 1.4% | ||||||||||||
Adient US LLC, 2021 Term Loan B, 03/31/28(o) | USD | 1,710 | 1,707,435 | |||||||||
Aimbridge Acquisition Co., Inc., 2020 Incremental Term Loan B, (1 mo. LIBOR + 6.00%, 0.75% Floor), 6.75%, 02/01/26(d) | 9,280 | 9,280,365 | ||||||||||
Applecaramel Buyer LLC, Term Loan B, (3 mo. LIBOR + 4.00%), 4.50%, 10/19/27 | 16,630 | 16,618,290 | ||||||||||
Applied Systems, Inc., 2017 1st Lien Term Loan, (3 mo. LIBOR + 3.00%), 3.50%, 09/19/24 | 1,691 | 1,664,186 | ||||||||||
Athenahealth, Inc., 2021 Term Loan B1, (3 mo. LIBOR + 4.25%), 4.45%, 02/11/26 | 2,663 | 2,669,658 | ||||||||||
Avantor Funding, Inc., 2020 Incremental Term Loan B4, (1 mo. LIBOR + 2.25%, 1.00% Floor), 3.25%, 11/06/27 | 1,849 | 1,848,792 | ||||||||||
Avaya, Inc. | ||||||||||||
2020 Term Loan B, (1 mo. LIBOR + 4.25%), 4.36%, 12/15/27 | 2,827 | 2,829,440 | ||||||||||
2021 Term Loan B2, (1 mo. LIBOR + 4.00%), 4.11%, 12/15/27 | 1,825 | 1,826,624 | ||||||||||
Cablevision Lightpath LLC, Term Loan B, (1 mo. LIBOR + 3.25%, 0.50% Floor), 3.75%, 11/30/27 | 2,373 | 2,362,396 | ||||||||||
Caesars Resort Collection LLC, 2020 Term Loan B1, (1 mo. LIBOR + 4.50%), 4.61%, 07/20/25 | 4,358 | 4,368,080 | ||||||||||
City Brewing Company LLC, 04/05/28(d)(o) | 4,211 | 4,216,264 | ||||||||||
Cypher Bidco, (Euribor + 4.50%), 3.96%, 03/01/28(d) | EUR | 19,970 | 21,848,035 | |||||||||
Douglas Dynamics Holdings, Inc., 2020 Additional Term Loan B, (1 mo. LIBOR + 3.75%, 1.00% Floor), 4.75%, 06/08/26 | USD | 1,248 | 1,244,417 | |||||||||
Dun & Bradstreet Corp., Term Loan, (1 mo. LIBOR + 3.25%), 3.36%, 02/06/26 | 4,133 | 4,108,690 | ||||||||||
ECL Entertainment, LLC, Term Loan, 03/31/28(d)(o) | 6,506 | 6,619,855 | ||||||||||
Flexera Software LLC, 2020 Term Loan B, (3 mo. LIBOR + 3.75%), 4.50%, 03/03/28 | 2,817 | 2,820,569 | ||||||||||
CONSOLIDATED SCHEDULE OF INVESTMENTS | 27 |
Consolidated Schedule of Investments (continued) April 30, 2021 | BlackRock Global Allocation Fund, Inc. (Percentages shown are based on Net Assets) |
| Security | Par (000) | Value | ||||||||||
| United States (continued) | ||||||||||||
Foundation Building Materials Holding Company LLC, 2021 Term Loan, (1 mo. LIBOR + 3.25%, 0.50% Floor), 3.75%, 01/31/28 | USD | 2,498 | $ | 2,475,811 | ||||||||
Frontier Communications Corp., 2021 DIP Term Loan B, | 5,685 | 5,661,294 | ||||||||||
Galaxy Universal LLC, Term Loan, (3 mo. LIBOR + 7.00%), 8.00%, 12/29/26(d) | 9,100 | 9,009,000 | ||||||||||
Gentiva Health Services, Inc., 2020 Term Loan, (1 mo. LIBOR + 2.75%), 2.88%, 07/02/25 | 8,199 | 8,175,326 | ||||||||||
Granite Acquisition Inc., 2021 Term Loan B, 03/25/28(c)(o) | 2,048 | 4,079,780 | ||||||||||
Herschend Entertainment Co. LLC, Term Loan B, (3 mo. LIBOR + 5.75%, 1.00% Floor), 6.75%, 08/25/25(d) | 11,121 | 11,315,735 | ||||||||||
Hilton Worldwide Finance LLC, 2019 Term Loan B2, (1 mo. LIBOR + 1.75%), 1.86%, 06/22/26 | 19,245 | 19,060,710 | ||||||||||
Informatica LLC, 2020 USD Term Loan B, (1 mo. LIBOR + 3.25%), 3.36%, 02/25/27 | 7,484 | 7,412,726 | ||||||||||
IRB Holding Corp, 2020 Fourth Amendment Incremental Term Loan, (3 mo. LIBOR + 3.25%, 1.00% Floor), 4.25%, 12/15/27 | 10,564 | 10,534,726 | ||||||||||
J&J Ventures Gaming, LLC, Term Loan, 04/07/28(d)(o) | 7,112 | 7,094,220 | ||||||||||
LBM Acquisition LLC | ||||||||||||
Delayed Draw Term Loan, 12/18/27(c)(o) | 684 | 682,116 | ||||||||||
Term Loan B, (3 mo. LIBOR + 3.75%, 0.75% Floor), 4.50%, 12/18/27 | 3,078 | 3,069,522 | ||||||||||
Leslie’s Poolmart, Inc., 2021 Term Loan B, (1 mo. LIBOR + 2.75%, 0.50% FLoor), 3.25%, 03/09/28 | 7,931 | 7,884,286 | ||||||||||
LogMeIn, Inc., Term Loan B, (1 mo. LIBOR + 4.75%), 4.85%, 08/31/27 | 9,574 | 9,552,640 | ||||||||||
McAfee LLC, 2018 USD Term Loan B, 09/30/24(o) | 2,815 | 2,812,876 | ||||||||||
Michaels Companies, Inc., 2021 Term Loan B, (3 mo. LIBOR + 4.25%), 5.00%, 04/15/28 | 2,875 | 2,861,229 | ||||||||||
Opendoor GP II LLC, Term Loan, (UNFND), 3.33%, 01/23/26(d) | 7,955 | 7,955,000 | ||||||||||
Organon & Co, USD Term Loan, 04/07/28(o) | 5,960 | 5,942,597 | ||||||||||
Pacific Gas & Electric Co., 2020 Term Loan, (3 mo. LIBOR + 3.00%, 1.00% Floor), 3.50%, 06/23/25 | 6,012 | 5,985,302 | ||||||||||
Park River Holdings, Inc., Term Loan, (3 mo. LIBOR + 3.25%, 0.75% Floor), 4.00%, 12/28/27 | 5,978 | 5,940,638 | ||||||||||
Peraton Holding Corp. | ||||||||||||
2nd Lien Term Loan B1, | 1,749 | 1,775,235 | ||||||||||
Delayed Draw Term Loan B, 02/01/28(o) | 3,980 | 3,975,035 | ||||||||||
Term Loan B, (1 mo. LIBOR + 3.75%), 4.50%, 02/01/28 | 2,261 | 2,258,662 | ||||||||||
Playtika Holding Corp., 2021 Term Loan, (1 mo. LIBOR + 2.75%), 2.86%, 03/11/28 | 15,998 | 15,906,011 | ||||||||||
Project Ruby Ultimate Parent Corp., 2021 Term Loan, (3 mo. LIBOR + 3.25%, 0.75% Floor), 4.00%, 03/10/28 | 11,326 | 11,241,055 | ||||||||||
RealPage, Inc, 1st Lien Term Loan, 04/22/28(c)(o) | 6,695 | 10,503,943 | ||||||||||
Redstone Buyer LLC(o) | ||||||||||||
2021 2nd Lien Delayed Draw Term Loan, 04/15/29 | 2,468 | 2,421,742 | ||||||||||
2021 2nd Lien Term Loan, 04/15/29 | 4,304 | 8,446,565 | ||||||||||
2021 Delayed Draw Term Loan, 04/15/28 | 3,510 | 3,473,367 | ||||||||||
2021 Term Loan, 04/15/28 | 8,968 | 8,874,612 | ||||||||||
| Security | Par (000) | Value | ||||||||||
| United States (continued) | ||||||||||||
SCIH Salt Holdings Inc., 2021 Incremental Term Loan B, 03/16/27(o) | USD | 11,459 | $ | 11,410,299 | ||||||||
Select Medical Corp., 2017 Term Loan B, (1 mo. LIBOR + 2.25%), 2.36%, 03/06/25 | 1,854 | 1,831,883 | ||||||||||
Shearer’s Foods, Inc., 2021 Term Loan, (3 mo. LIBOR + 3.50%, 0.75% Floor), 4.25%, 09/23/27 | 3,778 | 3,770,512 | ||||||||||
Signal Parent, Inc, Term Loan B, (3 mo. LIBOR + 3.50%), 3.69%, 04/01/28 | 6,030 | 5,965,961 | ||||||||||
Surf Holdings, LLC, USD Term Loan, (3 mo. LIBOR + 3.50%), 3.68%, 03/05/27 | 8,492 | 8,405,181 | ||||||||||
The Enterprise Development Authority, Term Loan B, (1 mo. LIBOR + 4.25%), 5.00%, | 14,127 | 14,144,659 | ||||||||||
Tory Burch LLC, Term Loan B, 04/16/28(o) | 3,299 | 3,268,088 | ||||||||||
Triton Water Holdings, Inc, Term Loan, (3 mo. LIBOR + 3.50%), 4.00%, 03/31/28 | 5,880 | 5,857,009 | ||||||||||
Ultimate Software Group, Inc., 2021 Incremental Term Loan, (3 mo. LIBOR + 3.25%, 0.75% Floor), 4.00%, 05/03/26 | 4,506 | 4,507,104 | ||||||||||
VS Buyer LLC, Term Loan B, (1 mo. LIBOR + 3.00%), 3.11%, 02/28/27 | 2,816 | 2,791,250 | ||||||||||
Western Digital Corp., 2018 Term Loan B4, (1 mo. LIBOR + 1.75%), 1.86%, 04/29/23 | 2,215 | 1,907,873 | ||||||||||
Woof Holdings, Inc., 1st Lien Term Loan, (3 mo. LIBOR + 3.75%, 0.75% Floor), 4.50%, 12/21/27 | 1,854 | 1,846,937 | ||||||||||
|
| |||||||||||
| 358,121,613 | ||||||||||||
|
| |||||||||||
Total Floating Rate Loan Interests — 2.4% |
| 649,411,134 | ||||||||||
|
| |||||||||||
| Foreign Agency Obligations | ||||||||||||
| Argentina — 0.1% | ||||||||||||
Argentine Republic Government International Bond | ||||||||||||
1.00%, 07/09/29 | 3,751 | 1,414,240 | ||||||||||
0.13%, 07/09/30(p) | 35,805 | 12,795,897 | ||||||||||
0.13%, 07/09/35(p) | 44,033 | 13,851,343 | ||||||||||
0.13%, 01/09/38(p) | 14,865 | 5,586,347 | ||||||||||
|
| |||||||||||
| 33,647,827 | ||||||||||||
| Australia — 0.6% | ||||||||||||
Australia Government Bond, 3.00%, 03/21/47 | AUD | 181,658 | 150,371,289 | |||||||||
|
| |||||||||||
| Bahrain — 0.1% | ||||||||||||
Bahrain Government International Bond | ||||||||||||
7.00%, 01/26/26 | USD | 1,931 | 2,214,978 | |||||||||
4.25%, 01/25/28(b) | 908 | 908,000 | ||||||||||
6.75%, 09/20/29 | 9,207 | 10,117,917 | ||||||||||
7.38%, 05/14/30 | 858 | 970,237 | ||||||||||
5.25%, 01/25/33(b) | 1,245 | 1,207,650 | ||||||||||
CBB International Sukuk Programme Co. SPC, 6.25%, 11/14/24(b) | 343 | 376,400 | ||||||||||
|
| |||||||||||
| 15,795,182 | ||||||||||||
| Brazil — 0.4% | ||||||||||||
Brazil Letras do Tesouro Nacional, 0.00%, 07/01/24(e) | BRL | 291,078 | 42,285,482 | |||||||||
Brazil Notas do Tesouro Nacional, Serie F, 10.00%, 01/01/27 | 214,393 | 42,005,765 | ||||||||||
Brazilian Government International Bond 6.00%, 04/07/26 | USD | 897 | 1,043,491 | |||||||||
| 28 | 2 0 2 1 BLACK ROCK ANNUAL REPORT TO SHAREHOLDERS |
Consolidated Schedule of Investments (continued) April 30, 2021 | BlackRock Global Allocation Fund, Inc. (Percentages shown are based on Net Assets) |
| Security | Par (000) | Value | ||||||||||
| Brazil (continued) | ||||||||||||
Brazilian Government International Bond (continued) | ||||||||||||
4.63%, 01/13/28 | USD | 6,944 | $ | 7,444,402 | ||||||||
3.88%, 06/12/30 | 5,096 | 5,049,181 | ||||||||||
|
| |||||||||||
| 97,828,321 | ||||||||||||
| Chile — 0.0% | ||||||||||||
Chile Government International Bond | ||||||||||||
3.24%, 02/06/28 | 1,900 | 2,064,231 | ||||||||||
2.45%, 01/31/31 | 1,654 | 1,685,322 | ||||||||||
3.50%, 01/25/50 | 829 | 855,062 | ||||||||||
|
| |||||||||||
| 4,604,615 | ||||||||||||
| China — 3.3% | ||||||||||||
China Government Bond | ||||||||||||
3.29%, 05/23/29 | CNY | 2,085,560 | 323,990,824 | |||||||||
2.68%, 05/21/30 | 2,230,320 | 330,056,353 | ||||||||||
3.27%, 11/19/30(c) | 1,492,810 | 232,562,346 | ||||||||||
|
| |||||||||||
| 886,609,523 | ||||||||||||
| Colombia — 0.1% | ||||||||||||
Colombia Government International Bond | ||||||||||||
8.13%, 05/21/24 | USD | 2,650 | 3,158,138 | |||||||||
4.50%, 01/28/26 | 12,874 | 14,111,513 | ||||||||||
3.88%, 04/25/27 | 2,098 | 2,232,797 | ||||||||||
4.50%, 03/15/29 | 3,150 | 3,428,184 | ||||||||||
3.25%, 04/22/32 | 800 | 782,400 | ||||||||||
4.13%, 05/15/51 | 1,122 | 1,055,241 | ||||||||||
|
| |||||||||||
| 24,768,273 | ||||||||||||
| Dominican Republic — 0.1% | ||||||||||||
Dominican Republic International Bond | ||||||||||||
5.95%, 01/25/27 | 8,323 | 9,446,605 | ||||||||||
4.50%, 01/30/30(b) | 7,822 | 8,109,459 | ||||||||||
4.50%, 01/30/30 | 3,123 | 3,237,770 | ||||||||||
4.88%, 09/23/32(b)(c) | 6,873 | 7,190,876 | ||||||||||
6.40%, 06/05/49 | 3,795 | 4,112,357 | ||||||||||
|
| |||||||||||
| 32,097,067 | ||||||||||||
| Egypt — 0.1% | ||||||||||||
Egypt Government International Bond | ||||||||||||
6.13%, 01/31/22(b) | 1,028 | 1,054,535 | ||||||||||
5.75%, 05/29/24(b) | 6,243 | 6,605,094 | ||||||||||
5.88%, 06/11/25 | 8,058 | 8,550,545 | ||||||||||
5.25%, 10/06/25(b) | 1,759 | 1,827,161 | ||||||||||
7.60%, 03/01/29 | 9,291 | 10,062,153 | ||||||||||
5.88%, 02/16/31(b) | 1,386 | 1,332,292 | ||||||||||
6.38%, 04/11/31(b) | EUR | 1,692 | 2,119,135 | |||||||||
8.50%, 01/31/47(b) | USD | 5,642 | 5,822,897 | |||||||||
7.50%, 02/16/61(b) | 1,210 | 1,117,738 | ||||||||||
|
| |||||||||||
| 38,491,550 | ||||||||||||
| Germany — 0.1% | ||||||||||||
Bundesrepublik Deutschland Bundesanleihe, 0.00%, | EUR | 24,456 | 26,478,848 | |||||||||
|
| |||||||||||
| Ghana — 0.0% | ||||||||||||
Ghana Government International Bond, 8.63%, 04/07/34(b) | USD | 5,095 | 5,246,258 | |||||||||
|
| |||||||||||
| Greece — 0.2% | ||||||||||||
Hellenic Republic Government Bond, 2.00%, 04/22/27(b) | EUR | 43,908 | 57,904,258 | |||||||||
|
| |||||||||||
| Security | Par (000) | Value | ||||||||||
| Indonesia — 0.1% | ||||||||||||
Indonesia Government International Bond | ||||||||||||
4.75%, 01/08/26 | USD | 2,711 | $ | 3,083,424 | ||||||||
3.50%, 01/11/28 | 414 | 447,845 | ||||||||||
4.10%, 04/24/28 | 8,504 | 9,488,869 | ||||||||||
4.75%, 02/11/29 | 628 | 731,689 | ||||||||||
4.20%, 10/15/50 | 2,572 | 2,835,308 | ||||||||||
|
| |||||||||||
| 16,587,135 | ||||||||||||
| Israel — 0.0% | ||||||||||||
Israel Government International Bond, 2.75%, 07/03/30 | 989 | 1,042,159 | ||||||||||
|
| |||||||||||
| Italy — 1.5% | ||||||||||||
Italy Buoni Poliennali Del Tesoro | ||||||||||||
1.35%, 04/01/30 | EUR | 130,316 | 164,701,511 | |||||||||
0.95%, 08/01/30 | 106,289 | 129,577,471 | ||||||||||
3.85%, 09/01/49(b) | 63,691 | 110,083,511 | ||||||||||
|
| |||||||||||
| 404,362,493 | ||||||||||||
| Japan — 0.7% | ||||||||||||
Japan Government Thirty Year Bond, 0.40%, 09/20/49 | JPY | 22,134,350 | 190,220,931 | |||||||||
|
| |||||||||||
| Mexico — 0.1% | ||||||||||||
Mexico Government International Bond | ||||||||||||
3.75%, 01/11/28 | USD | 3,296 | 3,569,568 | |||||||||
4.50%, 04/22/29 | 1,984 | 2,226,172 | ||||||||||
2.66%, 05/24/31 | 13,762 | 13,205,499 | ||||||||||
4.75%, 04/27/32 | 7,140 | 8,024,914 | ||||||||||
4.75%, 03/08/44 | 944 | 999,932 | ||||||||||
4.35%, 01/15/47 | 3,487 | 3,471,309 | ||||||||||
4.50%, 01/31/50 | 1,027 | 1,043,560 | ||||||||||
|
| |||||||||||
| 32,540,954 | ||||||||||||
| Morocco(b) — 0.0% | ||||||||||||
Morocco Government International Bond | ||||||||||||
3.00%, 12/15/32 | 5,304 | 5,037,142 | ||||||||||
4.00%, 12/15/50 | 3,659 | 3,291,957 | ||||||||||
|
| |||||||||||
| 8,329,099 | ||||||||||||
| Oman — 0.0% | ||||||||||||
Oman Government International Bond | ||||||||||||
6.50%, 03/08/47 | 2,585 | 2,515,205 | ||||||||||
6.75%, 01/17/48 | 2,505 | 2,500,773 | ||||||||||
|
| |||||||||||
| 5,015,978 | ||||||||||||
| Panama — 0.1% | ||||||||||||
Banco Latinoamericano de Comercio Exterior SA, 2.38%, 09/14/25(b)(c) | 1,169 | 1,192,380 | ||||||||||
Panama Government International Bond | ||||||||||||
4.00%, 09/22/24 | 1,443 | 1,569,984 | ||||||||||
3.88%, 03/17/28 | 477 | 524,491 | ||||||||||
3.16%, 01/23/30 | 8,122 | 8,496,627 | ||||||||||
2.25%, 09/29/32 | 1,079 | 1,033,682 | ||||||||||
6.70%, 01/26/36 | 2,094 | 2,810,279 | ||||||||||
4.50%, 05/15/47 | 1,869 | 2,066,764 | ||||||||||
4.50%, 04/16/50 | 2,923 | 3,230,463 | ||||||||||
4.50%, 04/01/56 | 521 | 572,384 | ||||||||||
|
| |||||||||||
| 21,497,054 | ||||||||||||
| Paraguay — 0.0% | ||||||||||||
Paraguay Government International Bond | ||||||||||||
5.00%, 04/15/26 | 1,637 | 1,835,793 | ||||||||||
CONSOLIDATED SCHEDULE OF INVESTMENTS | 29 |
Consolidated Schedule of Investments (continued) April 30, 2021 | BlackRock Global Allocation Fund, Inc. (Percentages shown are based on Net Assets) |
| Security | Par (000) | Value | ||||||||||
| Paraguay (continued) | ||||||||||||
Paraguay Government International Bond (continued) | ||||||||||||
4.95%, 04/28/31(b) | USD | 4,686 | $ | 5,260,914 | ||||||||
5.40%, 03/30/50(b) | 4,532 | 5,105,015 | ||||||||||
5.40%, 03/30/50 | 819 | 922,552 | ||||||||||
|
| |||||||||||
| 13,124,274 | ||||||||||||
| Peru — 0.1% | ||||||||||||
Corp. Financiera de Desarrollo SA, 2.40%, 09/28/27(b) | 737 | 700,288 | ||||||||||
Peruvian Government International Bond | ||||||||||||
7.35%, 07/21/25 | 834 | 1,022,849 | ||||||||||
2.39%, 01/23/26 | 1,326 | 1,361,885 | ||||||||||
4.13%, 08/25/27 | 1,208 | 1,336,577 | ||||||||||
2.78%, 01/23/31 | 3,000 | 3,002,437 | ||||||||||
1.86%, 12/01/32 | 5,390 | 4,902,542 | ||||||||||
3.30%, 03/11/41 | 1,939 | 1,897,311 | ||||||||||
|
| |||||||||||
| 14,223,889 | ||||||||||||
| Philippines — 0.0% | ||||||||||||
Philippine Government International Bond | ||||||||||||
3.75%, 01/14/29 | 2,062 | 2,311,116 | ||||||||||
2.95%, 05/05/45 | 1,806 | 1,729,019 | ||||||||||
|
| |||||||||||
| 4,040,135 | ||||||||||||
| Qatar — 0.1% | ||||||||||||
Qatar Government International Bond | ||||||||||||
4.50%, 04/23/28 | 1,827 | 2,128,455 | ||||||||||
4.00%, 03/14/29(b) | 9,887 | 11,221,745 | ||||||||||
4.40%, 04/16/50(b) | 2,796 | 3,243,360 | ||||||||||
|
| |||||||||||
| 16,593,560 | ||||||||||||
| Romania — 0.0% | ||||||||||||
Romanian Government International Bond | ||||||||||||
3.00%, 02/14/31(b)(c) | 1,952 | 1,985,306 | ||||||||||
6.13%, 01/22/44(b) | 2,162 | 2,816,410 | ||||||||||
4.00%, 02/14/51 | 1,008 | 1,001,574 | ||||||||||
|
| |||||||||||
| 5,803,290 | ||||||||||||
| Russia — 0.1% | ||||||||||||
Russian Foreign Bond - Eurobond | ||||||||||||
4.75%, 05/27/26 | 3,600 | 4,061,925 | ||||||||||
4.25%, 06/23/27 | 7,600 | 8,417,000 | ||||||||||
5.25%, 06/23/47 | 2,200 | 2,710,537 | ||||||||||
|
| |||||||||||
| 15,189,462 | ||||||||||||
| Saudi Arabia — 0.0% | ||||||||||||
Saudi Government International Bond | ||||||||||||
4.00%, 04/17/25 | 1,314 | 1,444,825 | ||||||||||
3.63%, 03/04/28 | 975 | 1,064,456 | ||||||||||
4.38%, 04/16/29(b) | 2,952 | 3,369,524 | ||||||||||
4.50%, 04/17/30 | 3,986 | 4,618,279 | ||||||||||
4.63%, 10/04/47 | 2,464 | 2,802,800 | ||||||||||
|
| |||||||||||
| 13,299,884 | ||||||||||||
| South Africa — 0.0% | ||||||||||||
Republic of South Africa Government International Bond, 4.88%, 04/14/26 | 1,029 | 1,096,078 | ||||||||||
|
| |||||||||||
| Ukraine — 0.1% | ||||||||||||
Ukraine Government International Bond | ||||||||||||
7.75%, 09/01/23 | 2,398 | 2,552,821 | ||||||||||
8.99%, 02/01/24 | 6,179 | 6,790,721 | ||||||||||
| Security | Par (000) | Value | ||||||||||
| Ukraine (continued) | ||||||||||||
Ukraine Government International Bond (continued) | ||||||||||||
7.75%, 09/01/25(b) | USD | 2,658 | $ | 2,857,018 | ||||||||
7.75%, 09/01/25 | 1,625 | 1,746,672 | ||||||||||
7.75%, 09/01/27 | 347 | 372,006 | ||||||||||
9.75%, 11/01/28 | 1,276 | 1,477,209 | ||||||||||
7.25%, 03/15/33(b) | 6,963 | 6,977,361 | ||||||||||
|
| |||||||||||
| 22,773,808 | ||||||||||||
| Uruguay — 0.0% | ||||||||||||
Uruguay Government International Bond | ||||||||||||
4.38%, 10/27/27 | 1,757 | 2,005,856 | ||||||||||
5.10%, 06/18/50 | 4,657 | 5,814,481 | ||||||||||
|
| |||||||||||
| 7,820,337 | ||||||||||||
|
| |||||||||||
Total Foreign Agency Obligations — 8.0% |
| 2,167,403,531 | ||||||||||
|
| |||||||||||
| Shares | ||||||||||||
Investment Companies |
| |||||||||||
| United States — 5.1% | ||||||||||||
Consumer Discretionary Select Sector SPDR Fund | 125,045 | 22,373,051 | ||||||||||
Financial Select Sector SPDR Fund | 174,610 | 6,331,359 | ||||||||||
Industrial Select Sector SPDR Fund | 465,101 | 47,407,745 | ||||||||||
InvesCo QQQ Trust, Series 1 | 94,145 | 31,820,069 | ||||||||||
Invesco Senior Loan ETF | 1,163,913 | 25,780,673 | ||||||||||
iShares China Large-Cap ETF(q) | 461,746 | 21,369,605 | ||||||||||
iShares iBoxx $ High Yield Corporate Bond ETF(g)(q) | 1,495,200 | 130,740,288 | ||||||||||
iShares iBoxx $ Investment Grade Corporate Bond ETF(g)(q) | 27,149 | 3,560,591 | ||||||||||
iShares Latin America 40 ETF(g)(q) | 371,046 | 10,530,285 | ||||||||||
iShares MSCI Brazil ETF(g)(q) | 221,560 | 7,878,674 | ||||||||||
iShares MSCI Emerging Markets | 56,435 | 3,046,361 | ||||||||||
iShares Nasdaq Biotechnology ETF(g)(q) | 19,698 | 3,046,099 | ||||||||||
iShares Russell 2000 ETF(g)(q) | 776,645 | 174,659,694 | ||||||||||
iShares S&P 500 Value ETF(g)(q) | 227,346 | 33,281,181 | ||||||||||
KraneShares Bosera MSCI China A ETF | 171,614 | 7,842,760 | ||||||||||
KraneShares CSI China Internet ETF | 131,443 | 9,876,627 | ||||||||||
SPDR Bloomberg Barclays High Yield Bond ETF | 541,536 | 59,141,147 | ||||||||||
SPDR Gold Shares(f)(i)(j) | 378,708 | 62,736,767 | ||||||||||
SPDR S&P 500 ETF Trust | 1,686,100 | 703,609,530 | ||||||||||
SPDR S&P Oil & Gas Exploration & Production ETF | 66,531 | 5,335,786 | ||||||||||
United States Oil Fund LP(j) | 59,194 | 2,561,324 | ||||||||||
|
| |||||||||||
Total Investment Companies — 5.1% |
| 1,372,929,616 | ||||||||||
|
| |||||||||||
| 30 | 2 0 2 1 BLACK ROCK ANNUAL REPORT TO SHAREHOLDERS |
Consolidated Schedule of Investments (continued) April 30, 2021 | BlackRock Global Allocation Fund, Inc. (Percentages shown are based on Net Assets) |
| Security | Par (000) | Value | ||||||||||
Municipal Bonds | ||||||||||||
| Ohio — 0.0% | ||||||||||||
Buckeye Tobacco Settlement Financing Authority, Refunding RB, Series B-2, Class 2, , 5.00%, 06/01/55 | USD | 7,680 | $ | 8,626,406 | ||||||||
|
| |||||||||||
| Puerto Rico — 0.1% | ||||||||||||
Puerto Rico Sales Tax Financing Corp. Sales Tax Revenue, RB | ||||||||||||
Series A-1, Restructured, 4.75%, 07/01/53 | 1,480 | 1,643,052 | ||||||||||
Series A-1, Restructured, 5.00%, 07/01/58 | 22,234 | 24,977,898 | ||||||||||
|
| |||||||||||
| 26,620,950 | ||||||||||||
|
| |||||||||||
Total Municipal Bonds — 0.1% | 35,247,356 | |||||||||||
|
| |||||||||||
Non-Agency Mortgage-Backed Securities |
| |||||||||||
| United States — 1.5% | ||||||||||||
1211 Avenue of the Americas Trust, Series 2015-1211, Class D, 4.28%, 08/10/35(a)(b) | 4,330 | 4,515,165 | ||||||||||
Alen 2021-ACEN Mortgage Trust, Series 2021- ACEN, Class D, (1 mo. LIBOR US + 3.10%), 3.22%, | 5,222 | 5,221,991 | ||||||||||
AOA Mortgage Trust, Series 2015-1177, Class C, 3.11%, | 2,924 | 2,923,145 | ||||||||||
Arbor Multifamily Mortgage Securities Trust, 1.75%, | 1,650 | 1,369,601 | ||||||||||
BAMLL Commercial Mortgage Securities Trust 2015-200P, Series 2015-200P, Class D, 3.72%, 04/14/33(a)(b) | 730 | 770,539 | ||||||||||
BANK 2017-BNK8, Series 2017-BNK8, Class B, 4.06%, 11/15/50(a) | 1,551 | 1,696,954 | ||||||||||
BANK 2017-BNK9, Series 2017-BNK9, Class A4, 3.54%, 11/15/54 | 1,990 | 2,194,996 | ||||||||||
Bayview Commercial Asset Trust(a)(b) | ||||||||||||
Series 2005-3A, Class M6, (1 mo. LIBOR US + 1.05%), 1.16%, 11/25/35 | 445 | 421,692 | ||||||||||
Series 2006-3A, Class M1, (1 mo. LIBOR US + 0.34%), 0.45%, 10/25/36 | 588 | 557,156 | ||||||||||
BBCMS Mortgage Trust(a)(b) | ||||||||||||
Series 2017-DELC, Class E, (1 mo. LIBOR US + 2.50%), 2.61%, 08/15/36 | 1,677 | 1,666,563 | ||||||||||
Series 2018-TALL, Class C, (1 mo. LIBOR US + 1.12%), 1.24%, 03/15/37 | 4,880 | 4,769,867 | ||||||||||
BBCMS Trust, Series 2019-CLP, Class E, (1 mo. LIBOR US + 2.11%), 2.23%, 12/15/31(a)(b) | 2,152 | 2,148,154 | ||||||||||
Beast Mortgage Trust(a)(b) | ||||||||||||
Series 2021-SSCP, Class B, (1 mo. LIBOR US + 1.10%), 1.25%, 04/15/36 | 4,655 | 4,654,999 | ||||||||||
Series 2021-SSCP, Class C, (1 mo. LIBOR US + 1.35%), 1.50%, 04/15/36 | 5,803 | 5,802,998 | ||||||||||
Series 2021-SSCP, Class D, (1 mo. LIBOR US + 1.60%), 1.75%, 04/15/36 | 5,329 | 5,330,670 | ||||||||||
Series 2021-SSCP, Class E, (1 mo. LIBOR US + 2.10%), 2.25%, 04/15/36 | 4,614 | 4,615,448 | ||||||||||
Series 2021-SSCP, Class F, (1 mo. LIBOR US + 2.90%), 3.05%, 04/15/36 | 4,410 | 4,412,755 | ||||||||||
Series 2021-SSCP, Class G, (1 mo. LIBOR US + 3.80%), 3.95%, 04/15/36 | 4,993 | 4,996,113 | ||||||||||
| Security | Par (000) | Value | ||||||||||
| United States (continued) | ||||||||||||
Beast Mortgage Trust(a)(b) (continued) | ||||||||||||
Series 2021-SSCP, Class H, (1 mo. LIBOR US + 4.90%), 5.05%, 04/15/36. | USD | 3,541 | $ | 3,543,212 | ||||||||
Benchmark 2021-B23 Mortgage Trust, Series 2021- B23, Class XA, 1.39%, 02/15/54(a) | 55,086 | 5,286,891 | ||||||||||
Benchmark 2021-B25 Mortgage Trust, Series 2021- B25, Class XA, 1.11%, 04/15/54(a) | 29,170 | 2,558,623 | ||||||||||
Benchmark Mortgage Trust, 2.58%, 04/15/54 | 5,050 | 5,185,593 | ||||||||||
BHMS 2018-ATLS, Series 2018-ATLS, Class C, (1 mo. LIBOR US + 1.90%), 2.01%, 07/15/35(a)(b) | 1,583 | 1,578,013 | ||||||||||
BWAY Mortgage Trust, Series 2013-1515, Class D, 3.63%, 03/10/33(b) | 3,735 | 3,916,139 | ||||||||||
BX 2021-MFM1, Series 2021-MFM1, Class E, (1 mo. LIBOR US + 2.25%), 2.36%, 01/15/34(a)(b) | 3,160 | 3,158,093 | ||||||||||
BX Commercial Mortgage Trust(b) | ||||||||||||
(1 mo. LIBOR US + 0.92%), 1.04%, 10/15/36(a) | 2,276 | 2,278,175 | ||||||||||
(1 mo. LIBOR US + 3.25%), 3.36%, 10/15/37(a) | 1,500 | 1,504,943 | ||||||||||
Series 2018-BIOA, Class D, (1 mo. LIBOR US + 1.32%), 1.44%, 03/15/37(a) | 1,300 | 1,301,317 | ||||||||||
Series 2018-BIOA, Class E, (1 mo. LIBOR US + 1.95%), 2.07%, 03/15/37(a) | 8,820 | 8,832,975 | ||||||||||
Series 2018-BIOA, Class F, (1 mo. LIBOR US + 2.47%), 2.59%, 03/15/37(a) | 7,721 | 7,736,834 | ||||||||||
Series 2018-IND, Class G, (1 mo. LIBOR US + 2.05%), 2.17%, 11/15/35(a) | 3,821 | 3,818,427 | ||||||||||
Series 2019-XL, Class G, (1 mo. LIBOR US + 2.30%), 2.42%, 10/15/36(a) | 8,864 | 8,858,975 | ||||||||||
Series 2019-XL, Class J, (1 mo. LIBOR US + 2.65%), 2.77%, 10/15/36(a) | 14,720 | 14,720,289 | ||||||||||
Series 2020-BXLP, Class D, (1 mo. LIBOR US + 1.25%), 1.37%, 12/15/36(a) | 2,220 | 2,219,513 | ||||||||||
Series 2020-BXLP, Class F, (1 mo. LIBOR US + 2.00%), 2.12%, 12/15/36(a) | 1,946 | 1,944,896 | ||||||||||
Series 2020-BXLP, Class G, (1 mo. LIBOR US + 2.50%), 2.62%, 12/15/36(a) | 3,144 | 3,141,946 | ||||||||||
Series 2020-VIV4, Class A, 2.84%, 03/09/44 | 1,425 | 1,466,947 | ||||||||||
Series 2021-NWM, Class A, (1 mo. LIBOR US + 0.91%), 1.02%, 02/15/33(a)(d) | 22,496 | 22,496,000 | ||||||||||
Series 2021-NWM, Class B, (1 mo. LIBOR US + 2.15%), 2.26%, 02/15/33(a)(d) | 13,191 | 13,191,000 | ||||||||||
Series 2021-NWM, Class C, (1 mo. LIBOR US + 4.25%), 4.36%, 02/15/33(a)(d) | 8,710 | 8,710,000 | ||||||||||
BX Trust(a)(b) | ||||||||||||
Series 2019-OC11, Class D, 4.08%, 12/09/41 | 8,408 | 8,862,815 | ||||||||||
Series 2019-OC11, Class E, 4.08%, 12/09/41 | 11,784 | 11,947,649 | ||||||||||
Series 2021-MFM1, Class F, (1 mo. LIBOR US + 3.00%), 3.11%, 01/15/34 | 4,900 | 4,897,048 | ||||||||||
CD Mortgage Trust, Series 2017-CD6, Class B, 3.91%, 11/13/50(a) | 864 | 923,628 | ||||||||||
CFCRE Commercial Mortgage Trust(b) | ||||||||||||
Series 2018-TAN, Class C, 5.29%, 02/15/33 | 1,060 | 1,106,399 | ||||||||||
Series 2018-TAN, Class E, 6.66%, 02/15/33(a) | 1,178 | 1,220,921 | ||||||||||
Citigroup Commercial Mortgage Trust | ||||||||||||
Series 2014-GC19, Class D, 5.26%, 03/10/47(a)(b) | 1,197 | 1,261,045 | ||||||||||
Series 2014-GC23, Class AS, 3.86%, 07/10/47 | 5,552 | 6,000,556 | ||||||||||
CONSOLIDATED SCHEDULE OF INVESTMENTS | 31 |
Consolidated Schedule of Investments (continued) April 30, 2021 | BlackRock Global Allocation Fund, Inc. (Percentages shown are based on Net Assets) |
| Security | Par (000) | Value | ||||||||||
| United States (continued) | ||||||||||||
Citigroup COmmercial Mortgage Trust, Series 2018-C6, Class A4, 4.41%, 11/10/51 | USD | 2,000 | $ | 2,308,794 | ||||||||
COMM 2014-CCRE17 Mortgage Trust, Series 2014- CR17, Class C, 4.94%, 05/10/47(a) | 1,959 | 2,089,612 | ||||||||||
COMM Mortgage Trust, Series 2014-CR21, Class A3, 3.53%, 12/10/47 | 3,956 | 4,226,727 | ||||||||||
CORE Mortgage Trust, Series 2019-CORE, Class F, (1 mo. LIBOR US + 2.35%), 2.47%, 12/15/31(a)(b) | 1,606 | 1,583,874 | ||||||||||
Credit Suisse Mortgage Capital Certificates(a)(b) | ||||||||||||
(1 mo. LIBOR US + 0.98%), 1.10%, 05/15/36 | 1,103 | 1,105,335 | ||||||||||
Series 2019-ICE4, Class B, (1 mo. LIBOR US + 1.23%), 1.35%, 05/15/36 | 1,765 | 1,770,318 | ||||||||||
Series 2019-ICE4, Class C, (1 mo. LIBOR US + 1.43%), 1.55%, 05/15/36 | 1,829 | 1,831,195 | ||||||||||
Series 2019-ICE4, Class D, (1 mo. LIBOR US + 1.60%), 1.72%, 05/15/36 | 5,897 | 5,902,539 | ||||||||||
Series 2019-ICE4, Class E, (1 mo. LIBOR US + 2.15%), 2.27%, 05/15/36 | 2,100 | 2,103,115 | ||||||||||
CSAIL Commercial Mortgage Trust 4.78%, 11/15/48(a) | 1,260 | 1,358,177 | ||||||||||
Series 2020-C19, Class A3, 2.56%, 03/15/53 | 11,759 | 12,032,478 | ||||||||||
CSMC 2020-NET, Series 2020-NET, Class A, 2.26%, 08/15/37(b) | 4,036 | 4,126,013 | ||||||||||
DBGS 2018-BIOD Mortgage Trust, Series 2018- BIOD, Class D, (1 mo. LIBOR US + 1.30%), 1.41%, 05/15/35(a)(b) | 1,895 | 1,894,458 | ||||||||||
DBWF 2018-GLKS Mortgage Trust, Series 2018- GLKS, Class B, (1 mo. LIBOR US + 1.35%), 1.47%, | 2,175 | 2,173,236 | ||||||||||
DBWF Mortgage Trust, Series 2018-GLKS, Class C, (1 mo. LIBOR US + 1.75%), 1.87%, 12/19/30(a)(b) | 1,650 | 1,647,995 | ||||||||||
Freddie Mac(a)(b) | ||||||||||||
(30 day SOFR + 6.00%), 6.01%, 08/25/33 | 2,151 | 2,167,147 | ||||||||||
Series 2021-DNA2, Class B1, (30 day SOFR + 3.40%), 3.41%, 08/25/33 | 2,381 | 2,397,045 | ||||||||||
Series 2021-DNA3, Class B1, (30 day SOFR + 3.50%), 3.51%, 10/25/33 | 5,537 | 5,609,563 | ||||||||||
Series 2021-HQA1, Class B1, (30 day SOFR + 3.00%), 3.01%, 08/25/33 | 4,104 | 4,026,967 | ||||||||||
Series 2021-HQA1, Class B2, (30 day SOFR + 5.00%), 5.01%, 08/25/33 | 2,457 | 2,306,122 | ||||||||||
GCT Commercial Mortgage Trust, (1 mo. LIBOR US + 2.35%), 2.47%, 02/15/38(a)(b) | 810 | 811,162 | ||||||||||
GS Mortgage Securities Trust | ||||||||||||
Series 2020-GC47, Class AS, 2.73%, 05/12/53 | 4,426 | 4,543,897 | ||||||||||
Series 2020-GSA2, Class XA, 1.85%, 12/12/53(a)(b) | 4,433 | 570,730 | ||||||||||
Hudson Yards Mortgage Trust, Series 2016-10HY, Class E, 3.08%, 08/10/38(a)(b) | 897 | 907,171 | ||||||||||
J.P. Morgan Chase Commercial Mortgage Securities Trust, Series 2019-MFP, Class F, (1 mo. LIBOR US + 3.00%), 3.12%, 07/15/36(a)(b) | 6,311 | 6,217,864 | ||||||||||
JP Morgan Chase Commercial Mortgage Securities Corp.(a)(b) Series 2021-MHC, Class E, (1 mo. LIBOR US + 2.45%), 2.55%, 04/15/38 | 7,630 | 7,637,092 | ||||||||||
| Security | Par (000) | Value | ||||||||||
| United States (continued) | ||||||||||||
JP Morgan Chase Commercial Mortgage Securities Corp.(a)(b) (continued) | ||||||||||||
Series 2021-MHC, Class F, (1 mo. LIBOR US + 2.95%), 3.05%, 04/15/38 | USD | 8,020 | $ | 8,029,965 | ||||||||
JP Morgan Chase Commercial Mortgage Securities Trust(b) | ||||||||||||
Series 2018-WPT, Class DFL, (1 mo. LIBOR US + 2.25%), 2.36%, 07/05/33(a) | 1,253 | 1,254,195 | ||||||||||
Series 2018-WPT, Class DFX, 5.35%, 07/05/33 | 2,168 | 2,280,905 | ||||||||||
JPMCC Commercial Mortgage Securities Trust, Series 2019-COR4, Class A5, 4.03%, 03/10/52 | 4,308 | 4,893,780 | ||||||||||
Life 2021-BMR Mortgage Trust, Series 2021-BMR, Class F, (1 mo. LIBOR US + 2.35%), 2.47%, 03/15/38(a)(b) | 15,217 | 15,241,400 | ||||||||||
MHC Commercial Mortgage Trust 2021-MHC(a)(b) | ||||||||||||
Series 2021-MHC, Class E, (1 mo. LIBOR US + 2.10%), 2.25%, 04/15/38 | 15,980 | 15,970,391 | ||||||||||
Series 2021-MHC, Class F, (1 mo. LIBOR US + 2.60%), 2.75%, 04/15/38 | 12,280 | 12,280,033 | ||||||||||
Morgan Stanley Bank of America Merrill Lynch Trust | ||||||||||||
Series 2015-C24, Class C, 4.49%, 05/15/48(a) | 647 | 687,880 | ||||||||||
Series 2016-C32, Class A4, 3.72%, 12/15/49 | 3,377 | 3,754,585 | ||||||||||
Morgan Stanley Capital I Trust | ||||||||||||
Series 2018-MP, Class A, 4.42%, 07/11/40(a)(b) | 2,110 | 2,363,020 | ||||||||||
Series 2020-L4, Class A3, 2.70%, 02/15/53 | 2,855 | 2,968,962 | ||||||||||
TVC DSCR, 0.00%, 02/01/51(d)(e) | 7,576 | 8,014,541 | ||||||||||
UBS Commercial Mortgage Trust, Series 2019- C17, Class A4, 2.92%, 10/15/52 | 1,175 | 1,232,821 | ||||||||||
UBS-Barclays Commercial Mortgage Trust, Series 2012-C3, Class D, 5.20%, 08/10/49(a)(b) | 1,766 | 1,809,057 | ||||||||||
VNDO Trust, Series 2016-350P, Class D, 4.03%, 01/10/35(a)(b) | 2,150 | 2,197,455 | ||||||||||
Wells Fargo Commercial Mortgage Trust(a) | ||||||||||||
Series 2015-C28, Class AS, 3.87%, 05/15/48 | 3,230 | 3,512,667 | ||||||||||
Series 2017-C38, Class C, 3.90%, 07/15/50 | 1,305 | 1,377,258 | ||||||||||
Series 2017-C41, Class B, 4.19%, 11/15/50 | 3,149 | 3,363,795 | ||||||||||
Series 2018-1745, Class A, 3.87%, 06/15/36(b) | 2,162 | 2,385,599 | ||||||||||
Series 2020-C58, Class XA, 2.01%, 07/15/53 | 31,828 | 4,417,445 | ||||||||||
Series 2021-C59, Class XA, , 04/15/54(c) | 25,225 | 2,986,441 | ||||||||||
|
| |||||||||||
Total Non-Agency Mortgage-Backed Securities — 1.5% |
| 406,108,489 | ||||||||||
|
| |||||||||||
| Benefical Interest (000) | ||||||||||||
Other Interests | ||||||||||||
| Canada — 0.1% | ||||||||||||
Sprott Private Resource Streaming and Royalty, LP(d) | USD | 21,279,646 | 25,501,528 | |||||||||
|
| |||||||||||
Total Other Interests — 0.1% |
| 25,501,528 | ||||||||||
|
| |||||||||||
| 32 | 2 0 2 1 BLACK ROCK ANNUAL REPORT TO SHAREHOLDERS |
Consolidated Schedule of Investments (continued) April 30, 2021 | BlackRock Global Allocation Fund, Inc. (Percentages shown are based on Net Assets) |
| Security | Par (000) | Value | ||||||||||
| Preferred Securities | ||||||||||||
Capital Trusts — 0.2%(a) | ||||||||||||
| Colombia — 0.0% | ||||||||||||
Banco Davivienda SA, 6.65%(b)(m) | USD | 1,545 | $ | 1,570,570 | ||||||||
|
| |||||||||||
| Mexico — 0.0% | ||||||||||||
Banco Mercantil del Norte SA, | 3,560 | 3,724,205 | ||||||||||
BBVA Bancomer SA, 5.13%, 01/18/33 | 4,718 | 4,889,912 | ||||||||||
|
| |||||||||||
| 8,614,117 | ||||||||||||
|
| |||||||||||
| United Kingdom — 0.0% | ||||||||||||
Vodafone Group PLC, 7.00%, 04/04/79 | 391 | 476,597 | ||||||||||
|
| |||||||||||
| United States — 0.2% | ||||||||||||
American Express Co., Series C, 3.47%(m) | 9,039 | 8,988,721 | ||||||||||
Citigroup, Inc., Series Q, 4.29%(m) | 12,482 | 12,494,482 | ||||||||||
General Motors Financial Co., Inc., Series C, 5.70%(m) | 1,575 | 1,760,063 | ||||||||||
Morgan Stanley, Series H, 3.79%(m) | 10,558 | 10,594,953 | ||||||||||
Prudential Financial, Inc. | ||||||||||||
5.63%, 06/15/43 | 5,623 | 6,097,853 | ||||||||||
5.88%, 09/15/42 | 8,044 | 8,522,436 | ||||||||||
USB Capital IX, 3.50%(m) | 3,935 | 3,826,787 | ||||||||||
|
| |||||||||||
| 52,285,295 | ||||||||||||
|
| |||||||||||
| 62,946,579 | ||||||||||||
| Shares | ||||||||||||
| Preferred Stocks — 2.0% | ||||||||||||
| Brazil — 0.1% | ||||||||||||
Itau Unibanco Holding SA, Preference Shares | 997,172 | 5,053,736 | ||||||||||
Neon Payments Ltd.(d) | 29,577 | 10,606,608 | ||||||||||
|
| |||||||||||
| 15,660,344 | ||||||||||||
|
| |||||||||||
| Germany — 0.2% | ||||||||||||
Porsche Automobil Holding SE, Preference Shares . | 126,660 | 13,352,045 | ||||||||||
Volkswagen AG, Preference Shares | 45,862 | 11,940,605 | ||||||||||
Volocopter GMBH, (Acquired 03/03/21, Cost: $22,418,516)(d)(h) | 4,218 | 22,520,098 | ||||||||||
|
| |||||||||||
| 47,812,748 | ||||||||||||
|
| |||||||||||
| India — 0.0% | ||||||||||||
Think & Learn Private Ltd., Series F, (Acquired 12/11/20, Cost: $13,030,114)(d)(h) | 4,047 | 12,967,009 | ||||||||||
|
| |||||||||||
| United Kingdom(d)(h) — 0.1% | ||||||||||||
Exscientia Ltd., (Acquired 04/29/21, Cost: $5,183,212) | 1,480 | 5,183,211 | ||||||||||
Exscientia Ltd., C-1, (Acquired 02/24/21, Cost: $10,369,926) | 5,922 | 10,461,687 | ||||||||||
|
| |||||||||||
| 15,644,898 | ||||||||||||
|
| |||||||||||
| United States — 1.6% | ||||||||||||
Aptiv PLC, Series A, 06/15/23 | 132,372 | 21,616,348 | ||||||||||
Becton Dickinson and Co., Series B, 06/01/23 | 509,265 | 28,126,706 | ||||||||||
Boston Scientific Corp., Series A, 06/01/23 | 88,689 | 10,428,053 | ||||||||||
ByteDance Ltd., Series E-1, (Acquired 11/11/20, | 312,419 | 41,451,315 | ||||||||||
Cash Mandatory Exchangeable Trust, 06/01/23(b) | 34,289 | 40,266,601 | ||||||||||
| Security | Shares | Value | ||||||||||
| United States (continued) | ||||||||||||
CruiseClass G, (Acquired 03/25/21, Cost: $9,841,593)(d)(h) | 373,495 | $ | 9,826,653 | |||||||||
Databricks, Inc.(d)(h) | ||||||||||||
Series F, (Acquired 10/22/19, Cost: $11,769,837) | 274,046 | 46,182,232 | ||||||||||
Series G, (Acquired 02/01/21, Cost: $13,141,188) | 74,090 | 12,485,647 | ||||||||||
Deep Instinct Ltd., Series D-2, (Acquired 03/19/21, Cost: $11,638,040)(d)(h) | 1,914,819 | 11,642,100 | ||||||||||
DoubleVerify Holdings, Inc., Series A, (Acquired 11/18/20, Cost: $6,996,468)(h) | 406,504 | 13,633,149 | ||||||||||
Farmer’s Business Network, Inc., Series F, (Acquired 07/31/20, Cost: $8,907,002)(d)(h) | 269,447 | 10,756,324 | ||||||||||
Grand Rounds, Inc.(d)(h) | ||||||||||||
Series C, (Acquired 03/31/15, Cost: $26,357,523) | 9,493,075 | 35,124,377 | ||||||||||
Series D, (Acquired 05/01/18, Cost: $4,824,038) . | 1,990,402 | 7,304,775 | ||||||||||
Jumpcloud, Inc., Series E-1, (Acquired 10/30/20, Cost: $11,778,091)(d)(h) | 6,458,349 | 12,464,614 | ||||||||||
Loadsmart, Inc., Series C, (Acquired 10/05/20, Cost: $10,694,460)(d)(h) | 1,250,814 | 12,783,319 | ||||||||||
Lookout, Inc., Series F, (Acquired 09/19/14, Cost: $50,945,689)(d)(h) | 4,459,883 | 52,359,026 | ||||||||||
Mount Sinai Genomics, Inc., Series C, (Acquired 07/17/20, Cost: $10,527,582)(d)(h) | 17,155 | 26,182,476 | ||||||||||
Mythic AI Inc. series C, (Acquired 01/26/21, Cost: $6,129,221)(d)(h) | 892,159 | 6,280,799 | ||||||||||
SambaNova Systems, Inc.(d)(h) | ||||||||||||
(Acquired 04/09/21, Cost: $6,878,356) | 72,390 | 6,878,498 | ||||||||||
Series C, (Acquired 02/19/20, Cost: $11,739,902) | 220,503 | 20,952,195 | ||||||||||
Zero Mass Water, Inc., Series C-1, (Acquired 05/07/20, Cost: $8,796,956)(d)(h) | 558,055 | 9,994,765 | ||||||||||
|
| |||||||||||
| 436,739,972 | ||||||||||||
|
| |||||||||||
| 528,824,971 | ||||||||||||
| Trust Preferreds — 0.2% | ||||||||||||
| United States — 0.2% | ||||||||||||
Citigroup Capital XIII, 6.55%, 10/30/40(a) | 629,905 | 17,095,622 | ||||||||||
GMAC Capital Trust I, Series 2, 5.98%, 02/15/40(a) . | 691,942 | 17,741,393 | ||||||||||
Wells Fargo & Co., Series L, | 5,825 | 8,352,001 | ||||||||||
|
| |||||||||||
| 43,189,016 | ||||||||||||
|
| |||||||||||
Total Preferred Securities — 2.4% |
| 634,960,566 | ||||||||||
|
| |||||||||||
Par (000) | ||||||||||||
U.S. Government Sponsored Agency Securities |
| |||||||||||
| Collateralized Mortgage Obligations — 0.0% | ||||||||||||
Uniform Mortgage-Backed Securities, Series 2020- DNA6, Class B1, (30 day SOFR + 3.00%), 3.01%, 12/25/50(a)(b) | USD | 2,200 | 2,183,118 | |||||||||
|
| |||||||||||
| Mortgage-Backed Securities — 0.1% | ||||||||||||
Freddie Mac, Series K116, Class X1, 1.53%, 07/25/30(a) | 7,792 | 864,259 | ||||||||||
CONSOLIDATED SCHEDULE OF INVESTMENTS | 33 |
Consolidated Schedule of Investments (continued) April 30, 2021 | BlackRock Global Allocation Fund, Inc. (Percentages shown are based on Net Assets) |
| Security | Par (000) | Value | ||||||||||
| Mortgage-Backed Securities (continued) | ||||||||||||
Freddie Mac Structured Pass-Through Certificates(a) | ||||||||||||
Series K105, Class X1, 1.64%, 01/25/30 | USD | 36,012 | $ | 4,138,926 | ||||||||
Series K109, Class X1, 1.70%, 04/25/30 | 15,173 | 1,834,039 | ||||||||||
Series K110, Class X1, 1.81%, 04/25/30 | 13,175 | 1,690,962 | ||||||||||
Series K120, Class X1, 1.13%, 10/25/30 | 50,372 | 4,187,617 | ||||||||||
Uniform Mortgage-Backed Securities 1.36%, 12/25/29 | 8,414 | 783,358 | ||||||||||
Class A2, 3.82%, 09/25/30(a) | 2,165 | 2,505,557 | ||||||||||
Series KW09, Class X1, 0.94%, 05/25/29(a) | 58,300 | 3,125,580 | ||||||||||
|
| |||||||||||
| 19,130,298 | ||||||||||||
|
| |||||||||||
Total U.S. Government Sponsored Agency Securities — 0.1% |
| 21,313,416 | ||||||||||
|
| |||||||||||
| U.S. Treasury Obligations | ||||||||||||
U.S. Treasury Bills(r) | ||||||||||||
0.01%, 05/06/21 - 05/13/21 | 350,000 | 349,999,760 | ||||||||||
0.03%, 06/10/21 - 06/17/21 | 297,500 | 297,496,501 | ||||||||||
U.S. Treasury Bonds | ||||||||||||
1.13%, 08/15/40(s)(t) | 124,849 | 104,053,922 | ||||||||||
2.38%, 11/15/49(s) | 145,202 | 147,895,975 | ||||||||||
1.63%, 11/15/50 | 20,173 | 17,257,200 | ||||||||||
U.S. Treasury Inflation Indexed Bonds, 0.13%, 01/15/30(s)(t) | 68,618 | 75,181,284 | ||||||||||
U.S. Treasury Inflation Indexed Bonds - When Issued, 0.13%, 01/15/31(s) | 26,010 | 28,379,694 | ||||||||||
U.S. Treasury Notes(t) | ||||||||||||
2.00%, 11/15/21(j)(s) | 75,000 | 75,785,156 | ||||||||||
1.13%, 02/15/31 | 25,903 | 24,736,983 | ||||||||||
|
| |||||||||||
Total U.S. Treasury Obligations — 4.1% |
| 1,120,786,475 | ||||||||||
|
| |||||||||||
| Shares | ||||||||||||
Warrants | ||||||||||||
| Brazil — 0.0% | ||||||||||||
Neon Payments Ltd. - T2(d) | 9,858 | 103,903 | ||||||||||
|
| |||||||||||
| Cayman Islands(f) — 0.0% | ||||||||||||
Jaws Acquisition Corp., Class A | 122,150 | 438,518 | ||||||||||
TPG Pace Beneficial Finance Corp., Class A | 65,280 | 397,229 | ||||||||||
|
| |||||||||||
| 835,747 | ||||||||||||
| Switzerland — 0.0% | ||||||||||||
Cie Financiere Richemont SA, (Expires 11/22/23)(f) |
| 4,654 | 1,988 | |||||||||
|
| |||||||||||
| United States — 0.1% | ||||||||||||
Climate Change Crisis Real Impact I Acquisition Corp., Class A(f) | 146,070 | 460,120 | ||||||||||
Crown Proptech Acquisitions Pvt Ltd.(d) | 271,336 | 407,004 | ||||||||||
GPRE Warrants | 1,464,976 | 24,330,732 | ||||||||||
Rotor Acqusition Ltd.(d) | 99,523 | 100,518 | ||||||||||
| Security | Shares | Value | ||||||||||
| United States (continued) | ||||||||||||
Tortoise Acquisition Corp. II(f) | 150,460 | $ | 317,471 | |||||||||
TS Innovation Acquisitions Corp., Class A, Class A(f) | 73,229 | 169,891 | ||||||||||
Zero Mass Water, Inc., Series C-1, (Acquired 05/08/20, | 558,055 | 1,328,171 | ||||||||||
|
| |||||||||||
| 27,113,907 | ||||||||||||
|
| |||||||||||
Total Warrants — 0.1% | 28,055,545 | |||||||||||
|
| |||||||||||
Total Long-Term Investments — 101.5% |
| 27,463,280,129 | ||||||||||
|
| |||||||||||
Short-Term Securities |
| |||||||||||
Money Market Funds — 0.7% |
| |||||||||||
BlackRock Liquidity Funds, T-Fund, Institutional Class, 0.02%(g)(q) | 182,812,980 | 182,812,980 | ||||||||||
|
| |||||||||||
Par (000) | ||||||||||||
Time Deposits — 0.3% |
| |||||||||||
Australia — 0.0% |
| |||||||||||
Australia And New Zealand Banking, (0.27%), | ||||||||||||
05/01/21 | AUD | 10 | 7,555 | |||||||||
|
| |||||||||||
| Canada — 0.0% | ||||||||||||
Brown Brothers Harriman & Co., 0.01%, 05/03/21 | CAD | 14,508 | 11,802,944 | |||||||||
|
| |||||||||||
| France — 0.2% | ||||||||||||
Citibank NA, (0.78%), 05/01/21 | EUR | 34,086 | 40,979,328 | |||||||||
|
| |||||||||||
| South Africa — 0.0% | ||||||||||||
Brown Brothers Harriman & Co., 2.92%, 05/01/21 | ZAR | 47 | 3,231 | |||||||||
|
| |||||||||||
| United States — 0.1% | ||||||||||||
Brown Brothers Harriman & Co., (1.37%), 05/01/21 | CHF | 787 | 861,884 | |||||||||
Skandinaviska Enskilda Banken AB, Stockholm, 0.08%, 05/03/21 | 22,954 | 22,953,810 | ||||||||||
|
| |||||||||||
| 23,815,694 | ||||||||||||
|
| |||||||||||
| 76,608,752 | ||||||||||||
| U.S. Treasury Obligations — 0.6% | ||||||||||||
U.S. Treasury Bills(r) 0.01%, 05/18/21 | USD | 100,000 | 99,999,844 | |||||||||
| 34 | 2 0 2 1 BLACK ROCK ANNUAL REPORT TO SHAREHOLDERS |
Consolidated Schedule of Investments (continued) April 30, 2021 | BlackRock Global Allocation Fund, Inc. (Percentages shown are based on Net Assets) |
| Security | Par (000) | Value | ||||||||||
| U.S. Treasury Obligations (continued) | ||||||||||||
U.S. Treasury Bills(r) (continued) 0.16%, 05/20/21 | USD | 50,000 | $ | 49,999,764 | ||||||||
U.S. Treasury Cash Management Bill, 0.06%, 05/04/21(r) | 30,000 | 29,999,998 | ||||||||||
|
| |||||||||||
| 179,999,606 | ||||||||||||
|
| |||||||||||
Total Short-Term Securities — 1.6% |
| 439,421,338 | ||||||||||
|
| |||||||||||
Options Purchased — 0.7% |
| 198,538,440 | ||||||||||
|
| |||||||||||
Total Investments Before Options Written — 103.8% |
| 28,101,239,907 | ||||||||||
|
| |||||||||||
| Shares | ||||||||||||
Investments Sold Short | ||||||||||||
| Common Stocks | ||||||||||||
| United States — (0.7)% | ||||||||||||
Affirm Holdings, Inc.(f) | (202,947 | ) | (14,307,764 | ) | ||||||||
Appian Corp.(f) | (389,457 | ) | (47,194,399 | ) | ||||||||
DoorDash, Inc.(f) | (284,596 | ) | (40,745,609 | ) | ||||||||
Hershey Co. | (48,247 | ) | (7,926,982 | ) | ||||||||
JM Smucker Co. | (51,256 | ) | (6,714,023 | ) | ||||||||
Nordstrom, Inc | (78,442 | ) | (2,877,253 | ) | ||||||||
Snowflake, Inc., Class A(f) | (122,884 | ) | (28,458,706 | ) | ||||||||
Walgreens Boots Alliance, Inc. | (764,669 | ) | (40,603,924 | ) | ||||||||
|
| |||||||||||
Total Investments Sold Short — (0.7)% |
| (188,828,660 | ) | |||||||||
|
| |||||||||||
Options Written — (0.3)% |
| (103,248,986 | ) | |||||||||
|
| |||||||||||
Total Investments, Net of Options Written — 102.8% |
| 27,809,162,261 | ||||||||||
Liabilities in Excess of Other Assets — (2.8)% |
| (746,726,887 | ) | |||||||||
|
| |||||||||||
Net Assets — 100.0% |
| $ | 27,062,435,374 | |||||||||
|
| |||||||||||
(a) | Variable rate security. Interest rate resets periodically. The rate shown is the effective interest rate as of period end. Security description also includes the reference rate and spread if published and available. | |
(b) | Security exempt from registration pursuant to Rule 144A under the Securities Act of 1933, as amended. These securities may be resold in transactions exempt from registration to qualified institutional investors. | |
(c) | When-issued security. | |
(d) | Security is valued using significant unobservable inputs and is classified as Level 3 in the fair value hierarchy. | |
(e) | Zero-coupon bond. | |
(f) | Non-income producing security. | |
(g) | Affiliate of the Fund. | |
(h) | Restricted security as to resale, excluding 144A securities. The Fund held restricted securities with a current value of $939,765,326, representing 3.18% of its net assets as of period end, and an original cost of $576,216,940. | |
(i) | All or a portion of the security has been pledged and/or segregated as collateral in connection with outstanding exchange-traded options written. | |
(j) | All or a portion of the security is held by a wholly-owned subsidiary. See Note 1 of the Notes to Consolidated Financial Statements for details on the wholly-owned subsidiary. | |
(k) | Payment-in-kind security which may pay interest/dividends in additional par/shares and/or in cash. Rates shown are the current rate and possible payment rates. | |
(l) | Issuer filed for bankruptcy and/or is in default. | |
(m) | Perpetual security with no stated maturity date. | |
(n) | Convertible security. | |
(o) | Represents an unsettled loan commitment at period end. Certain details associated with this purchase are not known prior to the settlement date, including coupon rate. | |
(p) | Step-up bond that pays an initial coupon rate for the first period and then a higher coupon rate for the following periods. Rate as of period end. | |
(q) | Annualized 7-day yield as of period end. | |
(r) | Rates are discount rates or a range of discount rates as of period end. | |
(s) | All or a portion of the security has been pledged in connection with outstanding futures contracts. | |
(t) | All or a portion of the security has been pledged as collateral in connection with outstanding OTC derivatives. |
Affiliates
Investments in issuers considered to be affiliate(s) of the Fund during the period ended April 30, 2021 for purposes of Section 2(a)(3) of the Investment Company Act of 1940, as amended, were as follows:
| Affiliated Issuer | Value at 10/31/20 | Purchases at Cost | Proceeds from Sales | Net Realized Gain (Loss) | Change in Unrealized Appreciation (Depreciation) | Value at 04/30/21 | Par/Shares Held at 04/30/21 | Income | Capital Gain Distributions from Underlying Funds | |||||||||||||||||||||||||||
Bio City Development Co. BV | $ | 13,732,875 | $ | — | $ | — | $ | — | $ | (521,145 | ) | $ | 13,211,730 | 140,850,000 | $ | — | $ | — | ||||||||||||||||||
BlackRock Liquidity Funds, T-Fund, | ||||||||||||||||||||||||||||||||||||
Institutional Class | 3,000,470 | 179,812,510 | (a) | — | — | — | 182,812,980 | 182,812,980 | 11,297 | — | ||||||||||||||||||||||||||
iShares China Large-Cap ETF | 10,177,971 | 41,709,756 | (32,363,619 | ) | 1,246,991 | 598,506 | 21,369,605 | 461,746 | 473,228 | — | ||||||||||||||||||||||||||
iShares iBoxx $ Investment Grade | ||||||||||||||||||||||||||||||||||||
Corporate Bond ETF | 131,757,349 | — | (127,849,132 | ) | (1,738,396 | ) | 1,390,770 | 3,560,591 | 27,149 | 1,361,708 | — | |||||||||||||||||||||||||
iShares iBoxx USD High Yield Corporate | ||||||||||||||||||||||||||||||||||||
Bond ETF | 304,841,058 | 46,023,777 | (229,301,909 | ) | 6,337,893 | 2,839,469 | 130,740,288 | 1,495,200 | 6,185,462 | — | ||||||||||||||||||||||||||
iShares Latin America 40 ETF | — | 14,467,669 | (4,914,230 | ) | 139,899 | 836,947 | 10,530,285 | 371,046 | — | — | ||||||||||||||||||||||||||
iShares MSCI Brazil ETF | 8,899,738 | — | (3,523,461 | ) | 156,723 | 2,345,674 | 7,878,674 | 221,560 | 91,536 | — | ||||||||||||||||||||||||||
iShares MSCI Emerging Markets ETF | 3,766,013 | — | (1,468,519 | ) | 227,772 | 521,095 | 3,046,361 | 56,435 | 43,707 | — | ||||||||||||||||||||||||||
iShares Nasdaq Biotechnology ETF | 3,859,429 | — | (1,463,526 | ) | 344,702 | 305,494 | 3,046,099 | 19,698 | 5,807 | — | ||||||||||||||||||||||||||
CONSOLIDATED SCHEDULE OF INVESTMENTS | 35 |
Consolidated Schedule of Investments (continued) April 30, 2021 | BlackRock Global Allocation Fund, Inc. |
| Affiliated Issuer | Value at 10/31/20 | Purchases at Cost | Proceeds from Sales | Net Realized Gain (Loss) | Change in Unrealized Appreciation (Depreciation) | Value at 04/30/21 | Par/Shares Held at 04/30/21 | Income | Capital Gain Distributions from Underlying Funds | |||||||||||||||||||||||||||
iShares Russell 2000 ETF | $ | 89,229,272 | $ | 200,274,335 | $ | (172,891,693 | ) | $ | 10,854,958 | $ | 47,192,822 | $ | 174,659,694 | 776,645 | $ | 654,507 | $ | — | ||||||||||||||||||
iShares S&P 500 Value ETF | 25,096,725 | — | — | — | 8,184,456 | 33,281,181 | 227,346 | 333,903 | — | |||||||||||||||||||||||||||
Quintis Australia Pty. Ltd. | 82,133,651 | 3,285,346 | — | — | 7,868 | 85,418,997 | 85,418,997 | 3,305,879 | — | |||||||||||||||||||||||||||
Quintis Australia Pty. Ltd. | 82,684,528 | — | — | — | 131,495 | 82,684,528 | 82,684,528 | — | — | |||||||||||||||||||||||||||
Quintis HoldCo Pty. Ltd. | 36,275,449 | — | — | — | 1,459,458 | 37,734,907 | 43,735,802 | — | — | |||||||||||||||||||||||||||
SL Liquidity Series, LLC, Money Market Series(b) | 213,007,106 | — | (212,980,359 | )(a) | 59,722 | (86,469 | ) | — | — | 1,986,281 | (c) | — | ||||||||||||||||||||||||
|
|
|
|
|
|
|
|
|
| |||||||||||||||||||||||||||
| $ | 17,630,264 | $ | 65,206,440 | $ | 789,975,920 | $ | 14,453,315 | $ | — | |||||||||||||||||||||||||||
|
|
|
|
|
|
|
|
|
| |||||||||||||||||||||||||||
| (a) | Represents net amount purchased (sold). |
| (b) | As of period end, the entity is no longer held. |
| (c) | All or a portion represents securities lending income earned from the reinvestment of cash collateral from loaned securities, net of fees and collateral investment expenses, and other payments to and from borrowers of securities. |
Derivative Financial Instruments Outstanding as of Period End
Futures Contracts
| Description | Number of Contracts | Expiration Date | Notional Amount (000) | Value/ Unrealized Appreciation (Depreciation) | ||||||||||||
Long Contracts | ||||||||||||||||
Exchange Traded Bitcoin Futures(a) | 80 | 05/28/21 | $ | 22,926 | $ | 880,394 | ||||||||||
Euro BTP | 101 | 06/08/21 | 17,861 | (131,251 | ) | |||||||||||
Euro OAT | 458 | 06/08/21 | 88,371 | (661,252 | ) | |||||||||||
10-Year Australian T-Bond | 708 | 06/15/21 | 76,025 | 398,346 | ||||||||||||
DAX Index | 235 | 06/18/21 | 107,135 | 4,203,729 | ||||||||||||
Euro Stoxx 50 Index | 3,833 | 06/18/21 | 181,564 | 5,440,058 | ||||||||||||
FTSE/MIB Index | 157 | 06/18/21 | 22,566 | (347,546 | ) | |||||||||||
MSCI Emerging Markets Index | 505 | 06/18/21 | 33,749 | (339,724 | ) | |||||||||||
Russell 2000 E-Mini Index | 997 | 06/18/21 | 112,736 | (4,677,675 | ) | |||||||||||
|
| |||||||||||||||
| 4,765,079 | ||||||||||||||||
|
| |||||||||||||||
Short Contracts | ||||||||||||||||
Euro-Bund | 959 | 06/08/21 | 196,003 | 1,113,298 | ||||||||||||
Yen Denom Nikkei Index | 27 | 06/10/21 | 3,564 | (43,336 | ) | |||||||||||
SPI 200 Index | 35 | 06/17/21 | 4,720 | (159,825 | ) | |||||||||||
FTSE 100 Index | 21 | 06/18/21 | 2,012 | (61,234 | ) | |||||||||||
NASDAQ 100 E-Mini Index | 1,905 | 06/18/21 | 527,685 | (30,143,827 | ) | |||||||||||
S&P 500 E-Mini Index | 11,907 | 06/18/21 | 2,485,229 | (93,734,090 | ) | |||||||||||
10-Year U.S. Treasury Note | 83 | 06/21/21 | 10,966 | (11,806 | ) | |||||||||||
10-Year U.S. Ultra Long Treasury Note | 4,233 | 06/21/21 | 616,563 | (4,352,442 | ) | |||||||||||
U.S. Long Treasury Bond | 67 | 06/21/21 | 10,540 | 283,062 | ||||||||||||
U.S. Ultra T-Bond | 369 | 06/21/21 | 68,692 | (1,374,170 | ) | |||||||||||
Long Gilt | 1,258 | 06/28/21 | 221,809 | 286,662 | ||||||||||||
2-Year U.S. Treasury Note | 6,916 | 06/30/21 | 1,526,869 | 787,636 | ||||||||||||
5-Year U.S. Treasury Note | 10,606 | 06/30/21 | 1,314,978 | (2,815,204 | ) | |||||||||||
|
| |||||||||||||||
| (130,225,276 | ) | |||||||||||||||
|
| |||||||||||||||
| $ | (125,460,197 | ) | ||||||||||||||
|
| |||||||||||||||
| (a) | All or a portion of the security is held by a wholly-owned subsidiary. See Note 1 of the Notes to Consolidated Financial Statements for details on the wholly-owned subsidiary. |
Forward Foreign Currency Exchange Contracts
| Currency Purchased | Currency Sold | Counterparty | Settlement Date | Unrealized (Depreciation) | ||||||||||||||||
| GBP | 27,808,860 | USD | 37,973,065 | Citibank N.A. | 05/06/21 | $ | 432,427 | |||||||||||||
| GBP | 28,120,532 | USD | 38,462,738 | Citibank N.A. | 05/06/21 | 373,190 | ||||||||||||||
| 36 | 2 0 2 1 BLACK ROCK ANNUAL REPORT TO SHAREHOLDERS |
Consolidated Schedule of Investments (continued) April 30, 2021 | BlackRock Global Allocation Fund, Inc. |
Forward Foreign Currency Exchange Contracts (continued)
| Currency Purchased | Currency Sold | Counterparty | Settlement Date | Unrealized (Depreciation) | ||||||||||||||||
| MXN | 797,688,000 | USD | 39,125,752 | BNP Paribas S.A. | 05/06/21 | $ | 243,918 | |||||||||||||
| USD | 107,554,062 | HKD | 833,587,000 | Citibank N.A. | 05/06/21 | 239,522 | ||||||||||||||
| USD | 447,195 | HKD | 3,466,000 | Morgan Stanley & Co. International PLC | 05/06/21 | 989 | ||||||||||||||
| USD | 107,271,120 | HKD | 831,437,000 | Citibank N.A. | 05/13/21 | 230,976 | ||||||||||||||
| USD | 1,046,358 | HKD | 8,110,000 | HSBC Bank USA N.A. | 05/13/21 | 2,267 | ||||||||||||||
| USD | 65,808,802 | EUR | 54,178,735 | JPMorgan Chase Bank N.A. | 05/20/21 | 652,191 | ||||||||||||||
| CNH | 694,609,000 | USD | 106,775,860 | Morgan Stanley & Co. International PLC | 06/10/21 | 251,927 | ||||||||||||||
| EUR | 36,912,000 | USD | 44,284,932 | Citibank N.A. | 06/10/21 | 125,194 | ||||||||||||||
| EUR | 54,960,000 | USD | 65,749,472 | Citibank N.A. | 06/10/21 | 374,838 | ||||||||||||||
| EUR | 34,998,000 | USD | 41,999,637 | Citibank N.A. | 06/11/21 | 108,596 | ||||||||||||||
| USD | 16,034,190 | INR | 1,194,026,000 | BNP Paribas S.A. | 06/11/21 | 28,388 | ||||||||||||||
| CNH | 341,878,000 | USD | 52,600,662 | Morgan Stanley & Co. International PLC | 06/17/21 | 52,607 | ||||||||||||||
| EUR | 54,952,000 | USD | 65,699,622 | Deutsche Bank AG | 06/17/21 | 425,037 | ||||||||||||||
| EUR | 52,932,260 | USD | 63,250,335 | JPMorgan Chase Bank N.A. | 06/18/21 | 445,310 | ||||||||||||||
| HUF | 16,116,656,000 | USD | 52,230,992 | Bank of America N.A. | 06/18/21 | 1,560,108 | ||||||||||||||
| CAD | 141,140,000 | USD | 113,069,202 | Goldman Sachs International | 06/25/21 | 1,771,509 | ||||||||||||||
| JPY | 11,017,945,000 | USD | 100,014,433 | BNP Paribas S.A. | 07/08/21 | 853,149 | ||||||||||||||
| JPY | 165,298,000 | USD | 1,500,425 | JPMorgan Chase Bank N.A. | 07/08/21 | 12,852 | ||||||||||||||
| JPY | 11,232,026,000 | USD | 101,629,406 | Bank of America N.A. | 07/09/21 | 1,198,925 | ||||||||||||||
| PLN | 206,723,000 | EUR | 44,828,199 | Morgan Stanley & Co. International PLC | 07/09/21 | 564,141 | ||||||||||||||
| CHF | 123,626,000 | USD | 133,434,792 | Morgan Stanley & Co. International PLC | 07/14/21 | 2,190,389 | ||||||||||||||
| JPY | 8,065,180,475 | USD | 73,490,789 | BNP Paribas S.A. | 07/14/21 | 348,442 | ||||||||||||||
| JPY | 6,499,479,525 | USD | 59,194,881 | Citibank N.A. | 07/14/21 | 309,872 | ||||||||||||||
| JPY | 11,077,690,000 | USD | 100,939,287 | HSBC Bank USA N.A. | 07/15/21 | 481,264 | ||||||||||||||
| EUR | 76,429,158 | USD | 91,688,110 | JPMorgan Chase Bank N.A. | 07/21/21 | 346,503 | ||||||||||||||
| INR | 2,038,701,000 | USD | 26,888,697 | Citibank N.A. | 07/23/21 | 270,483 | ||||||||||||||
| GBP | 44,761,000 | USD | 61,714,260 | Goldman Sachs International | 07/29/21 | 117,176 | ||||||||||||||
| JPY | 49,652,758 | EUR | 377,000 | Goldman Sachs International | 07/30/21 | 587 | ||||||||||||||
| JPY | 12,404,557,589 | EUR | 94,176,000 | Goldman Sachs International | 07/30/21 | 156,878 | ||||||||||||||
|
| |||||||||||||||||||
| 14,169,655 | ||||||||||||||||||||
|
| |||||||||||||||||||
| JPY | 8,358,508,000 | USD | 79,590,300 | Barclays Bank PLC | 05/06/21 | (3,110,219 | ) | |||||||||||||
| USD | 75,806,434 | CNH | 493,064,000 | Barclays Bank PLC | 05/06/21 | (348,159 | ) | |||||||||||||
| USD | 1,483,854 | CNH | 9,651,000 | Goldman Sachs International | 05/06/21 | (6,759 | ) | |||||||||||||
| USD | 38,578,517 | MXN | 797,688,000 | Citibank N.A. | 05/06/21 | (791,153 | ) | |||||||||||||
| JPY | 8,442,467,000 | USD | 80,443,781 | Barclays Bank PLC | 05/07/21 | (3,195,478 | ) | |||||||||||||
| USD | 44,103,949 | CNH | 286,742,000 | BNP Paribas S.A. | 05/07/21 | (180,725 | ) | |||||||||||||
| JPY | 10,345,355,000 | USD | 97,813,635 | BNP Paribas S.A. | 05/13/21 | (3,150,071 | ) | |||||||||||||
| CHF | 47,239,000 | USD | 53,236,412 | JPMorgan Chase Bank N.A. | 05/14/21 | (1,497,058 | ) | |||||||||||||
| JPY | 25,805,000 | USD | 246,695 | JPMorgan Chase Bank N.A. | 05/14/21 | (10,569 | ) | |||||||||||||
| JPY | 10,499,307,000 | USD | 100,375,275 | JPMorgan Chase Bank N.A. | 05/14/21 | (4,302,337 | ) | |||||||||||||
| EUR | 54,178,735 | USD | 65,338,866 | JPMorgan Chase Bank N.A. | 05/20/21 | (182,255 | ) | |||||||||||||
| JPY | 9,280,106,997 | USD | 87,723,826 | Citibank N.A. | 05/21/21 | (2,802,634 | ) | |||||||||||||
| JPY | 5,872,740,000 | USD | 55,082,120 | UBS AG | 06/03/21 | (1,336,144 | ) | |||||||||||||
| USD | 77,098,678 | SEK | 654,429,000 | Bank of America N.A. | 06/03/21 | (226,159 | ) | |||||||||||||
| USD | 51,042,183 | CNH | 334,630,000 | Morgan Stanley & Co. International PLC | 06/09/21 | (522,205 | ) | |||||||||||||
| JPY | 161,271,000 | USD | 1,488,169 | JPMorgan Chase Bank N.A. | 06/10/21 | (12,166 | ) | |||||||||||||
| JPY | 12,977,640,000 | USD | 119,787,887 | Morgan Stanley & Co. International PLC | 06/10/21 | (1,012,412 | ) | |||||||||||||
| USD | 1,025,151 | CNH | 6,725,000 | HSBC Bank USA N.A. | 06/10/21 | (11,061 | ) | |||||||||||||
| USD | 104,863,563 | CNH | 687,884,000 | HSBC Bank USA N.A. | 06/10/21 | (1,128,013 | ) | |||||||||||||
| USD | 52,198,818 | EUR | 43,864,000 | Bank of America N.A. | 06/10/21 | (575,504 | ) | |||||||||||||
| USD | 44,066,739 | EUR | 36,911,939 | Citibank N.A. | 06/10/21 | (343,314 | ) | |||||||||||||
| USD | 666,063 | EUR | 556,000 | Morgan Stanley & Co. International PLC | 06/16/21 | (2,966 | ) | |||||||||||||
| USD | 1,450,170 | EUR | 1,218,000 | UBS AG | 06/16/21 | (15,438 | ) | |||||||||||||
| USD | 52,354,977 | CNH | 341,878,000 | Morgan Stanley & Co. International PLC | 06/17/21 | (298,291 | ) | |||||||||||||
| USD | 26,794,703 | EUR | 22,347,000 | Barclays Bank PLC | 06/17/21 | (95,815 | ) | |||||||||||||
| USD | 4,321,978 | HUF | 1,298,516,556 | Barclays Bank PLC | 06/18/21 | (11,963 | ) | |||||||||||||
| USD | 2,160,874 | HUF | 649,225,838 | BNP Paribas S.A. | 06/18/21 | (5,988 | ) | |||||||||||||
| USD | 21,228,891 | HUF | 6,382,572,088 | Citibank N.A. | 06/18/21 | (73,641 | ) | |||||||||||||
| USD | 21,601,242 | HUF | 6,487,933,094 | Citibank N.A. | 06/18/21 | (52,943 | ) | |||||||||||||
| USD | 4,321,546 | HUF | 1,298,408,424 | Morgan Stanley & Co. International PLC | 06/18/21 | (12,034 | ) | |||||||||||||
| GBP | 40,722,318 | EUR | 47,397,000 | BNP Paribas S.A. | 06/24/21 | (795,186 | ) | |||||||||||||
CONSOLIDATED SCHEDULE OF INVESTMENTS | 37 |
Consolidated Schedule of Investments (continued) April 30, 2021 | BlackRock Global Allocation Fund, Inc. |
Forward Foreign Currency Exchange Contracts (continued)
| Currency Purchased | Currency Sold | Counterparty | Settlement Date | Unrealized Appreciation (Depreciation) | ||||||||||||||||
| GBP | 1,104,720 | EUR | 1,286,000 | Citibank N.A. | 06/24/21 | $ | (21,822 | ) | ||||||||||||
| GBP | 35,895,000 | USD | 49,783,292 | Citibank N.A. | 06/24/21 | (203,923 | ) | |||||||||||||
| GBP | 153,000 | USD | 212,200 | JPMorgan Chase Bank N.A. | 06/24/21 | (871 | ) | |||||||||||||
| USD | 52,515,756 | CNH | 344,141,000 | Morgan Stanley & Co. International PLC | 06/24/21 | (461,411 | ) | |||||||||||||
| JPY | 4,323,785,234 | EUR | 33,214,000 | Citibank N.A. | 06/25/21 | (395,314 | ) | |||||||||||||
| USD | 65,701,981 | CNH | 430,210,000 | Morgan Stanley & Co. International PLC | 06/25/21 | (520,277 | ) | |||||||||||||
| USD | 1,981,908 | CNH | 13,131,000 | BNP Paribas S.A. | 07/08/21 | (37,547 | ) | |||||||||||||
| USD | 102,717,650 | CNH | 680,405,000 | HSBC Bank USA N.A. | 07/08/21 | (1,923,848 | ) | |||||||||||||
| USD | 39,772,000 | BRL | 228,271,394 | Citibank N.A. | 07/13/21 | (1,994,600 | ) | |||||||||||||
| JPY | 7,319,283,876 | EUR | 56,077,000 | HSBC Bank USA N.A. | 07/15/21 | (507,675 | ) | |||||||||||||
| USD | 59,616,303 | BRL | 337,160,000 | BNP Paribas S.A. | 07/15/21 | (2,061,596 | ) | |||||||||||||
| JPY | 9,390,924,000 | USD | 86,049,638 | UBS AG | 07/21/21 | (67,716 | ) | |||||||||||||
| AUD | 38,044,000 | USD | 29,522,680 | Bank of America N.A. | 07/22/21 | (205,431 | ) | |||||||||||||
| GBP | 68,365,000 | USD | 95,310,456 | HSBC Bank USA N.A. | 07/22/21 | (874,634 | ) | |||||||||||||
| GBP | 807,000 | USD | 1,125,042 | JPMorgan Chase Bank N.A. | 07/22/21 | (10,295 | ) | |||||||||||||
| USD | 942,200 | NOK | 7,854,000 | JPMorgan Chase Bank N.A. | 07/22/21 | (1,435 | ) | |||||||||||||
| USD | 66,015,664 | NOK | 550,237,000 | JPMorgan Chase Bank N.A. | 07/22/21 | (93,685 | ) | |||||||||||||
| EUR | 33,512,553 | USD | 40,570,675 | Morgan Stanley & Co. International PLC | 07/23/21 | (213,800 | ) | |||||||||||||
| GBP | 68,328,000 | USD | 95,255,095 | HSBC Bank USA N.A. | 07/23/21 | (870,177 | ) | |||||||||||||
| GBP | 844,000 | USD | 1,176,627 | JPMorgan Chase Bank N.A. | 07/23/21 | (10,767 | ) | |||||||||||||
| JPY | 47,667,000 | USD | 437,540 | JPMorgan Chase Bank N.A. | 07/29/21 | (1,079 | ) | |||||||||||||
| JPY | 7,532,399,000 | USD | 69,140,683 | JPMorgan Chase Bank N.A. | 07/29/21 | (170,471 | ) | |||||||||||||
| JPY | 9,390,924,000 | USD | 86,074,269 | Morgan Stanley & Co. International PLC | 07/29/21 | (86,522 | ) | |||||||||||||
| MXN | 463,000 | USD | 22,924 | Goldman Sachs International | 07/29/21 | (287 | ) | |||||||||||||
| MXN | 1,198,026,000 | USD | 59,306,512 | Goldman Sachs International | 07/29/21 | (732,687 | ) | |||||||||||||
| EUR | 67,139,494 | USD | 81,486,251 | Deutsche Bank AG | 07/30/21 | (623,078 | ) | |||||||||||||
| JPY | 12,133,000 | USD | 112,337 | Bank of America N.A. | 07/30/21 | (1,240 | ) | |||||||||||||
| JPY | 7,524,489,000 | USD | 69,140,287 | Bank of America N.A. | 07/30/21 | (241,918 | ) | |||||||||||||
| JPY | 56,925,000 | USD | 523,071 | JPMorgan Chase Bank N.A. | 07/30/21 | (1,834 | ) | |||||||||||||
| JPY | 8,097,691,000 | USD | 74,983,876 | JPMorgan Chase Bank N.A. | 07/30/21 | (836,954 | ) | |||||||||||||
| JPY | 7,966,385,000 | USD | 73,231,893 | JPMorgan Chase Bank N.A. | 08/05/21 | (283,574 | ) | |||||||||||||
|
| |||||||||||||||||||
| (39,565,128 | ) | |||||||||||||||||||
|
| |||||||||||||||||||
| $ | (25,395,473 | ) | ||||||||||||||||||
|
| |||||||||||||||||||
Exchange-Traded Options Purchased
| Description | Number of Contracts | Expiration Date | Exercise Price | Notional Amount (000) | Value | |||||||||||||||||||||
Call |
| |||||||||||||||||||||||||
SPDR S&P 500 ETF Trust | 17,639 | 05/14/21 | USD | 421.00 | USD | 736,075 | $ | 4,542,042 | ||||||||||||||||||
10-Year U.S. Treasury Note | 4,538 | 05/21/21 | USD | 134.50 | USD | 599,583 | 70,906 | |||||||||||||||||||
Advance Auto Parts, Inc. | 396 | 05/21/21 | USD | 190.00 | USD | 7,926 | 483,120 | |||||||||||||||||||
Alphabet, Inc., Class C | 127 | 05/21/21 | USD | 2,200.00 | USD | 30,609 | 2,751,455 | |||||||||||||||||||
Amazon.com, Inc. | 59 | 05/21/21 | USD | 3,250.00 | USD | 20,458 | 1,409,215 | |||||||||||||||||||
Amazon.com, Inc. | 84 | 05/21/21 | USD | 3,300.00 | USD | 29,126 | 1,656,900 | |||||||||||||||||||
Apple, Inc. | 2,138 | 05/21/21 | USD | 130.00 | USD | 28,106 | 791,060 | |||||||||||||||||||
ConocoPhillips | 3,722 | 05/21/21 | USD | 55.00 | USD | 19,034 | 240,069 | |||||||||||||||||||
DR Horton, Inc. | 1,985 | 05/21/21 | USD | 97.50 | USD | 19,511 | 660,013 | |||||||||||||||||||
DR Horton, Inc. | 2,977 | 05/21/21 | USD | 95.00 | USD | 29,261 | 1,443,845 | |||||||||||||||||||
Edwards Lifesciences Corp. | 818 | 05/21/21 | USD | 85.00 | USD | 7,814 | 867,080 | |||||||||||||||||||
Global Payments, Inc. | 1,361 | 05/21/21 | USD | 205.00 | USD | 29,211 | 1,551,529 | |||||||||||||||||||
Home Depot, Inc. | 724 | 05/21/21 | USD | 280.00 | USD | 23,434 | 3,176,550 | |||||||||||||||||||
Las Vegas Sands Corp. | 3,449 | 05/21/21 | USD | 72.50 | USD | 21,129 | 46,562 | |||||||||||||||||||
Mastercard, Inc., Class A | 394 | 05/21/21 | USD | 395.00 | USD | 15,053 | 143,810 | |||||||||||||||||||
Micron Technology, Inc. | 2,148 | 05/21/21 | USD | 95.00 | USD | 18,488 | 135,324 | |||||||||||||||||||
Microsoft Corp. | 1,098 | 05/21/21 | USD | 250.00 | USD | 27,689 | 642,330 | |||||||||||||||||||
NXP Semiconductors NV | 486 | 05/21/21 | USD | 230.00 | USD | 9,356 | 17,010 | |||||||||||||||||||
NXP Semiconductors NV | 408 | 05/21/21 | USD | 225.00 | USD | 7,854 | 13,872 | |||||||||||||||||||
salesforce.com, Inc. | 429 | 05/21/21 | USD | 260.00 | USD | 9,881 | 16,302 | |||||||||||||||||||
SPDR S&P 500 ETF Trust | 2,968 | 05/21/21 | USD | 395.00 | USD | 123,855 | 7,207,788 | |||||||||||||||||||
| 38 | 2 0 2 1 BLACK ROCK ANNUAL REPORT TO SHAREHOLDERS |
Consolidated Schedule of Investments (continued) April 30, 2021 | BlackRock Global Allocation Fund, Inc. |
Exchange-Traded Options Purchased (continued)
| Description | Number of Contracts | Expiration Date | Exercise Price | Notional Amount (000) | Value | |||||||||||||||||||||
Call (continued) | ||||||||||||||||||||||||||
SPDR S&P 500 ETF Trust | 8,245 | 05/21/21 | USD | 420.00 | USD | 344,064 | $ | 3,590,697 | ||||||||||||||||||
SPDR S&P 500 ETF Trust | 13,363 | 05/21/21 | USD | 422.00 | USD | 557,638 | 4,456,560 | |||||||||||||||||||
VanEck Vectors Gold Miners ETF | 4,374 | 05/21/21 | USD | 240.00 | USD | 106,288 | 3,477,330 | |||||||||||||||||||
Western Digital Corp. | 1,131 | 05/21/21 | USD | 85.00 | USD | 7,988 | 23,186 | |||||||||||||||||||
Western Digital Corp. | 1,532 | 05/21/21 | USD | 75.00 | USD | 10,821 | 182,308 | |||||||||||||||||||
Alibaba Group Holding Ltd., ADR | 2,182 | 06/18/21 | USD | 260.00 | USD | 50,393 | 549,864 | |||||||||||||||||||
Alphabet, Inc., Class C | 65 | 06/18/21 | USD | 2,400.00 | USD | 15,666 | 552,825 | |||||||||||||||||||
Applied Materials, Inc. | 1,080 | 06/18/21 | USD | 150.00 | USD | 14,333 | 209,520 | |||||||||||||||||||
Bank of America Corp. | 3,256 | 06/18/21 | USD | 42.00 | USD | 13,197 | 286,528 | |||||||||||||||||||
Barclays PLC | 3,256 | 06/18/21 | GBP | 2.00 | GBP | 5,714 | 123,659 | |||||||||||||||||||
Barclays PLC | 1,628 | 06/18/21 | GBP | 2.00 | GBP | 2,857 | 3,091,479 | |||||||||||||||||||
BNP Paribas SA | 3,906 | 06/18/21 | EUR | 55.00 | EUR | 20,854 | 697,354 | |||||||||||||||||||
Citigroup, Inc. | 1,301 | 06/18/21 | USD | 75.00 | USD | 9,268 | 192,548 | |||||||||||||||||||
Deere & Co. | 378 | 06/18/21 | USD | 400.00 | USD | 14,018 | 197,505 | |||||||||||||||||||
Deere & Co. | 185 | 06/18/21 | USD | 380.00 | USD | 6,861 | 209,513 | |||||||||||||||||||
Facebook, Inc., Class A | 945 | 06/18/21 | USD | 330.00 | USD | 30,720 | 975,713 | |||||||||||||||||||
Goldman Sachs Group Inc. (The) | 543 | 06/18/21 | USD | 350.00 | USD | 18,921 | 631,238 | |||||||||||||||||||
ING Groep NV | 3,256 | 06/18/21 | EUR | 11.00 | EUR | 3,461 | 88,077 | |||||||||||||||||||
Las Vegas Sands Corp. | 4,900 | 06/18/21 | USD | 65.00 | USD | 30,017 | 889,350 | |||||||||||||||||||
Lions Gate Entertainment Corp., Class A | 348 | 06/18/21 | USD | 20.00 | USD | 504 | 5,220 | |||||||||||||||||||
Lloyds Banking Group PLC | 12,995 | 06/18/21 | GBP | 0.46 | GBP | 5,904 | 278,174 | |||||||||||||||||||
Mastercard, Inc., Class A | 676 | 06/18/21 | USD | 420.00 | USD | 25,827 | 173,056 | |||||||||||||||||||
Monster Beverage Corp. | 1,317 | 06/18/21 | USD | 95.00 | USD | 12,781 | 665,085 | |||||||||||||||||||
Monster Beverage Corp. | 256 | 06/18/21 | USD | 90.00 | USD | 2,484 | 241,920 | |||||||||||||||||||
PVH Corp. | 1,121 | 06/18/21 | USD | 95.00 | USD | 12,687 | 2,253,210 | |||||||||||||||||||
PVH Corp. | 769 | 06/18/21 | USD | 120.00 | USD | 8,704 | 396,035 | |||||||||||||||||||
Societe Generale SA | 3,257 | 06/18/21 | EUR | 23.50 | EUR | 7,709 | 481,634 | |||||||||||||||||||
Unicredit SpA | 635 | 06/18/21 | EUR | 8.80 | EUR | 2,718 | 114,514 | |||||||||||||||||||
Volkswagen AG, Preference Shares | 546 | 06/18/21 | EUR | 265.00 | EUR | 11,832 | 104,372 | |||||||||||||||||||
Walt Disney Co. | 436 | 06/18/21 | USD | 200.00 | USD | 8,110 | 134,070 | |||||||||||||||||||
Western Digital Corp. | 755 | 06/18/21 | USD | 80.00 | USD | 5,333 | 100,415 | |||||||||||||||||||
Alphabet, Inc., Class C | 113 | 07/16/21 | USD | 2,600.00 | USD | 27,234 | 406,800 | |||||||||||||||||||
Amazon.com, Inc. | 76 | 07/16/21 | USD | 3,750.00 | USD | 26,352 | 484,120 | |||||||||||||||||||
Apple, Inc. | 2,048 | 07/16/21 | USD | 140.00 | USD | 26,923 | 594,944 | |||||||||||||||||||
Applied Materials, Inc. | 2,034 | 07/16/21 | USD | 140.00 | USD | 26,993 | 1,215,315 | |||||||||||||||||||
iShares MSCI Emerging Markets ETF | 16,465 | 07/16/21 | USD | 57.00 | USD | 88,878 | 954,970 | |||||||||||||||||||
Mastercard, Inc., Class A | 701 | 07/16/21 | USD | 390.00 | USD | 26,782 | 997,173 | |||||||||||||||||||
Microsoft Corp. | 1,100 | 07/16/21 | USD | 265.00 | USD | 27,740 | 547,250 | |||||||||||||||||||
Sabre Corp. | 472 | 07/16/21 | USD | 20.00 | USD | 707 | 12,508 | |||||||||||||||||||
Mastercard, Inc., Class A | 1,467 | 08/20/21 | USD | 410.00 | USD | 56,048 | 1,643,040 | |||||||||||||||||||
SPDR S&P 500 ETF Trust | 1,235 | 12/17/21 | USD | 360.00 | USD | 51,537 | 8,165,820 | |||||||||||||||||||
|
| |||||||||||||||||||||||||
| 68,261,681 | ||||||||||||||||||||||||||
|
| |||||||||||||||||||||||||
Put | ||||||||||||||||||||||||||
10-Year U.S. Treasury Note | 2,744 | 05/14/21 | USD | 131.50 | USD | 362,551 | 686,000 | |||||||||||||||||||
Bank of America Corp. | 7,051 | 05/21/21 | USD | 38.00 | USD | 28,578 | 155,122 | |||||||||||||||||||
InvesCo QQQ Trust, Series 1 | 8,219 | 05/21/21 | USD | 325.00 | USD | 277,794 | 2,288,991 | |||||||||||||||||||
InvesCo QQQ Trust, Series 1 | 10,979 | 05/21/21 | USD | 330.00 | USD | 371,079 | 4,210,446 | |||||||||||||||||||
iShares iBoxx $ High Yield Corporate Bond ETF | 6,834 | 05/21/21 | USD | 85.00 | USD | 59,756 | 105,927 | |||||||||||||||||||
iShares iBoxx $ High Yield Corporate Bond ETF | 475 | 05/21/21 | USD | 86.00 | USD | 4,153 | 10,925 | |||||||||||||||||||
iShares Russell 2000 ETF | 350 | 05/21/21 | USD | 205.00 | USD | 7,871 | 26,775 | |||||||||||||||||||
JPMorgan Chase & Co. | 1,791 | 05/21/21 | USD | 150.00 | USD | 27,547 | 291,933 | |||||||||||||||||||
Lumen Technologies, Inc. | 1,353 | 05/21/21 | USD | 12.00 | USD | 1,736 | 29,090 | |||||||||||||||||||
Morgan Stanley | 3,342 | 05/21/21 | USD | 82.50 | USD | 27,588 | 645,006 | |||||||||||||||||||
SPDR Bloomberg Barclays High Yield Bond ETF | 357 | 05/21/21 | USD | 108.00 | USD | 3,899 | 11,603 | |||||||||||||||||||
SPDR S&P 500 ETF Trust | 2,422 | 05/21/21 | USD | 380.00 | USD | 101,070 | 168,329 | |||||||||||||||||||
SPDR S&P 500 ETF Trust | 345 | 05/21/21 | USD | 390.00 | USD | 14,397 | 39,503 | |||||||||||||||||||
SPDR S&P 500 ETF Trust | 21,490 | 05/21/21 | USD | 405.00 | USD | 896,778 | 5,608,890 | |||||||||||||||||||
SPDR S&P 500 ETF Trust | 13,150 | 05/21/21 | USD | 402.00 | USD | 548,750 | 2,899,575 | |||||||||||||||||||
SPDR S&P 500 ETF Trust | 499 | 05/21/21 | USD | 403.00 | USD | 20,823 | 116,267 | |||||||||||||||||||
Anthem, Inc. | 711 | 06/18/21 | USD | 340.00 | USD | 26,975 | 209,745 | |||||||||||||||||||
Anthem, Inc. | 353 | 06/18/21 | USD | 350.00 | USD | 13,392 | 157,085 | |||||||||||||||||||
CONSOLIDATED SCHEDULE OF INVESTMENTS | 39 |
Consolidated Schedule of Investments (continued) April 30, 2021 | BlackRock Global Allocation Fund, Inc. |
Exchange-Traded Options Purchased (continued)
| Description | Number of Contracts | Expiration Date | Exercise Price | Notional Amount (000) | Value | |||||||||||||||||||||
Put (continued) | ||||||||||||||||||||||||||
iShares iBoxx $ High Yield Corporate Bond ETF | 26,650 | 06/18/21 | USD | 84.00 | USD | 233,028 | $ | 932,750 | ||||||||||||||||||
Procter & Gamble Co. | 2,497 | 06/18/21 | USD | 130.00 | USD | 33,315 | 474,430 | |||||||||||||||||||
SPDR Bloomberg Barclays High Yield Bond ETF | 400 | 06/18/21 | USD | 106.00 | USD | 4,368 | 19,000 | |||||||||||||||||||
SPDR S&P 500 ETF Trust | 2,727 | 06/18/21 | USD | 400.00 | USD | 113,798 | 1,404,405 | |||||||||||||||||||
Pitney Bowes, Inc. | 214 | 07/16/21 | USD | 7.00 | USD | 160 | 13,910 | |||||||||||||||||||
|
| |||||||||||||||||||||||||
| 20,505,707 | ||||||||||||||||||||||||||
|
| |||||||||||||||||||||||||
| $ | 88,767,388 | |||||||||||||||||||||||||
|
| |||||||||||||||||||||||||
OTC Options Purchased
| Description | Counterparty | Number of Contracts | Expiration Date | Exercise Price | Notional Amount (000) | Value | ||||||||||||||||||||||||
Call | ||||||||||||||||||||||||||||||
GBP Currency | UBS AG | — | 05/06/21 | USD | 1.40 | GBP | 90,559 | $ | 32,767 | |||||||||||||||||||||
USD Currency | Citibank N.A. | — | 05/06/21 | JPY | 110.50 | USD | 253,435 | 64,883 | ||||||||||||||||||||||
USD Currency | Morgan Stanley & Co. International PLC | — | 05/06/21 | CHF | 0.94 | USD | 253,435 | 3,295 | ||||||||||||||||||||||
Adidas AG | Barclays Bank PLC | 42,027 | 05/21/21 | EUR | 310.00 | EUR | 10,795 | 4,541 | ||||||||||||||||||||||
Alibaba Group Holding Ltd., ADR | Nomura International PLC | 52,014 | 05/21/21 | USD | 240.00 | USD | 12,013 | 197,653 | ||||||||||||||||||||||
Euro Stoxx 50 | Credit Suisse International | 15,325 | 05/21/21 | EUR | 4,025.00 | EUR | 60,913 | 430,508 | ||||||||||||||||||||||
SPDR Gold Trust(a) | Morgan Stanley & Co. International PLC | 43,208 | 05/21/21 | USD | 166.00 | USD | 7,158 | 65,587 | ||||||||||||||||||||||
Starbucks Corp. | Citibank N.A. | 127,597 | 05/21/21 | USD | 115.00 | USD | 14,609 | 223,859 | ||||||||||||||||||||||
Autodesk, Inc. | Nomura International PLC | 145,240 | 06/18/21 | USD | 280.00 | USD | 42,397 | 3,137,184 | ||||||||||||||||||||||
Dr. Horton, Inc. | Citibank N.A. | 276,129 | 06/18/21 | USD | 105.00 | USD | 27,141 | 526,578 | ||||||||||||||||||||||
LVMH Moet Hennessy Louis Vuitton SE | Barclays Bank PLC | 25,263 | 06/18/21 | EUR | 630.00 | EUR | 15,820 | 481,671 | ||||||||||||||||||||||
Raytheon Technologies Corp | Goldman Sachs International | 365,234 | 06/18/21 | USD | 77.50 | USD | 30,402 | 2,418,854 | ||||||||||||||||||||||
SPDR Gold Trust(a) | Societe Generale | 86,562 | 06/18/21 | USD | 168.00 | USD | 14,340 | 171,393 | ||||||||||||||||||||||
SPDR S&P 500 ETF Trust | Morgan Stanley & Co. International PLC | 575,800 | 06/18/21 | USD | 360.00 | USD | 240,281 | 33,998,111 | ||||||||||||||||||||||
Euro Stoxx 50 | Credit Suisse International | 15,325 | 07/13/21 | EUR | 4,050.00 | EUR | 60,913 | 1,038,257 | ||||||||||||||||||||||
NXP Semiconductors NV | UBS AG | 138,487 | 07/16/21 | USD | 210.00 | USD | 26,660 | 785,221 | ||||||||||||||||||||||
Euro Stoxx 50 | Credit Suisse International | 15,325 | 09/17/21 | EUR | 4,075.00 | EUR | 60,913 | 1,638,536 | ||||||||||||||||||||||
|
| |||||||||||||||||||||||||||||
| 45,218,898 | ||||||||||||||||||||||||||||||
|
| |||||||||||||||||||||||||||||
Put | ||||||||||||||||||||||||||||||
EUR Currency | Bank of America N.A. | — | 06/03/21 | USD | 1.16 | EUR | 404,026 | 132,121 | ||||||||||||||||||||||
EUR Currency | JPMorgan Chase Bank N.A. | — | 06/07/21 | USD | 1.18 | EUR | 152,318 | 228,905 | ||||||||||||||||||||||
USD Currency | JPMorgan Chase Bank N.A. | — | 07/27/21 | RUB | 74.00 | USD | 53,778 | 761,339 | ||||||||||||||||||||||
EUR Currency | BNP Paribas S.A. | — | 08/02/21 | USD | 1.19 | EUR | 195,147 | 1,460,948 | ||||||||||||||||||||||
Ishares National Muni Bond ETF | Credit Suisse International | 3,487 | 08/20/21 | USD | 113.00 | USD | 407 | 59 | ||||||||||||||||||||||
Ishares National Muni Bond ETF | Credit Suisse International | 3,497 | 08/20/21 | USD | 114.00 | USD | 408 | 261 | ||||||||||||||||||||||
|
| |||||||||||||||||||||||||||||
| 2,583,633 | ||||||||||||||||||||||||||||||
|
| |||||||||||||||||||||||||||||
| $ | 47,802,531 | |||||||||||||||||||||||||||||
|
| |||||||||||||||||||||||||||||
| (a) | All or a portion of the security is held by a wholly-owned subsidiary. See Note 1 of the Notes to Consolidated Financial Statements for details on the wholly-owned subsidiary. |
OTC Credit Default Swaptions Purchased
Description | Paid by the Fund | Received by the Fund | Counterparty | Expiration | Credit | Exercise | Notional | Value | ||||||||||||||||||||||||||||||||
| Rate | Frequency | Rate | Frequency | |||||||||||||||||||||||||||||||||||||
Put | ||||||||||||||||||||||||||||||||||||||||
Sold Protection on 5-Year Credit Default Swap, 06/20/26 | 5.00% | Quarterly | | 3-Month LIBOR | | Quarterly | | Bank of America N.A. | | 05/19/21 | NR | USD 108.00 | USD 11,320 | $14,677 | ||||||||||||||||||||||||||
|
| |||||||||||||||||||||||||||||||||||||||
| (a) | Using the rating of the issuer or the underlying securities of the index, as applicable, provided by S&P Global Ratings. |
| (b) | The maximum potential amount the Fund may pay should a negative credit event take place as defined under the terms of the agreement. |
| 40 | 2 0 2 1 BLACK ROCK ANNUAL REPORT TO SHAREHOLDERS |
Consolidated Schedule of Investments (continued) April 30, 2021 | BlackRock Global Allocation Fund, Inc. |
OTC Interest Rate Swaptions Purchased
Description | Paid by the Fund | Received by the Fund | Counterparty | Expiration | Exercise Rate | Notional | Value | |||||||||||||||||||||||||||
| Rate | Frequency | Rate | Frequency | |||||||||||||||||||||||||||||||
Call | ||||||||||||||||||||||||||||||||||
30-Year Interest Rate Swap, 05/30/51 | | 3-Month LIBOR, 0.18% | | Quarterly | 1.80% | Semi-Annual | Deutsche Bank AG | 05/28/21 | 1.80 | % | USD | 60,279 | $ | 99,089 | ||||||||||||||||||||
30-Year Interest Rate Swap, 06/06/51 | | 3-Month LIBOR, 0.18% | | Quarterly | 1.00% | Semi-Annual | JPMorgan Chase Bank N.A. | 06/04/21 | 1.00 | USD | 101,372 | 94 | ||||||||||||||||||||||
30-Year Interest Rate Swap, 06/13/51 | | 3-Month LIBOR, 0.18% | | Quarterly | 1.00% | Semi-Annual | BNP Paribas S.A. | 06/11/21 | 1.00 | USD | 33,056 | 140 | ||||||||||||||||||||||
30-Year Interest Rate Swap, 08/25/51 | | 3-Month LIBOR, 0.18% | | Quarterly | 1.75% | Semi-Annual | Goldman Sachs International | 08/23/21 | 1.75 | USD | 59,478 | 737,443 | ||||||||||||||||||||||
30-Year Interest Rate Swap, 08/25/51 | | 3-Month LIBOR, 0.18% | | Quarterly | 1.77% | Semi-Annual | Goldman Sachs International | 08/23/21 | 1.77 | USD | 58,937 | 788,456 | ||||||||||||||||||||||
30-Year Interest Rate Swap, 04/22/52 | | 3-Month LIBOR, 0.18% | | Quarterly | 1.60% | Semi-Annual | Goldman Sachs International | 04/20/22 | 0.02 | USD | 51,063 | 1,227,190 | ||||||||||||||||||||||
30-Year Interest Rate Swap, 04/22/52 | | 3-Month LIBOR, 0.18% | | Quarterly | 1.60% | Semi-Annual | Goldman Sachs International | 04/20/22 | 0.02 | USD | 51,062 | 1,227,172 | ||||||||||||||||||||||
10-Year Interest Rate Swap, 04/23/32 | | 3-Month LIBOR, 0.18% | | Quarterly | 1.30% | Semi-Annual | Morgan Stanley & Co. International PLC | 04/21/22 | 0.01 | USD | 108,286 | 951,676 | ||||||||||||||||||||||
1-Year Interest Rate Swap, 03/18/24 | | 3-Month LIBOR, 0.18% | | Quarterly | 0.80% | Semi-Annual | Morgan Stanley & Co. International PLC | 03/16/23 | 0.80 | USD | 1,362,004 | 4,119,872 | ||||||||||||||||||||||
|
| |||||||||||||||||||||||||||||||||
| 9,151,132 | ||||||||||||||||||||||||||||||||||
|
| |||||||||||||||||||||||||||||||||
Put | ||||||||||||||||||||||||||||||||||
5-Year Interest Rate Swap, 05/26/26 | 0.63% | Semi-Annual | | 3-Month LIBOR, 0.18% | | Quarterly | Morgan Stanley & Co. International PLC | 05/24/21 | 0.63 | USD | 731,604 | 12,113,065 | ||||||||||||||||||||||
5-Year Interest Rate Swap, 05/27/26 | 0.64% | Semi-Annual | | 3-Month LIBOR, 0.18% | | Quarterly | Deutsche Bank AG | 05/25/21 | 0.64 | USD | 739,548 | 11,914,631 | ||||||||||||||||||||||
5-Year Interest Rate Swap, 05/27/26 | 0.64% | Semi-Annual | | 3-Month LIBOR, 0.18% | | Quarterly | Nomura International PLC | 05/25/21 | 0.64 | USD | 369,774 | 5,957,315 | ||||||||||||||||||||||
5-Year Interest Rate Swap, 05/27/26 | 0.85% | Semi-Annual | | 3-Month LIBOR, 0.18% | | Quarterly | Goldman Sachs International | 05/25/21 | 0.85 | USD | 369,774 | 2,367,996 | ||||||||||||||||||||||
5-Year Interest Rate Swap, 07/10/26 | 1.37% | Semi-Annual | | 3-Month LIBOR, 0.18% | | Quarterly | Goldman Sachs International | 07/08/21 | 1.37 | USD | 270,565 | 299,421 | ||||||||||||||||||||||
5-Year Interest Rate Swap, 07/10/26 | 1.37% | Semi-Annual | | 3-Month LIBOR, 0.18% 6-Month | | Quarterly | Goldman Sachs International | 07/08/21 | 1.37 | USD | 67,641 | 74,855 | ||||||||||||||||||||||
30-Year Interest Rate Swap, 11/18/51 | 0.48% | Annual | | EURIBOR, (0.52%) 6-Month | | Semi-Annual | JPMorgan Chase Bank N.A. | 11/16/21 | 0.48 | EUR | 99,286 | 7,096,171 | ||||||||||||||||||||||
30-Year Interest Rate Swap, 11/26/51 | 0.49% | Annual | | EURIBOR, (0.52%) 6-Month | | Semi-Annual | Goldman Sachs International | 11/24/21 | 0.49 | EUR | 97,137 | 6,878,363 | ||||||||||||||||||||||
30-Year Interest Rate Swap, 12/11/51 | 0.52% | Annual | | EURIBOR, (0.52%) | | Semi-Annual | Goldman Sachs International | 12/09/21 | 0.52 | EUR | 90,274 | 6,100,895 | ||||||||||||||||||||||
|
| |||||||||||||||||||||||||||||||||
| 52,802,712 | ||||||||||||||||||||||||||||||||||
|
| |||||||||||||||||||||||||||||||||
| $ | 61,953,844 | |||||||||||||||||||||||||||||||||
|
| |||||||||||||||||||||||||||||||||
Exchange-Traded Options Written
| Description | Number of Contracts | Expiration Date | Exercise Price | Notional Amount (000) | Value | |||||||||||||||||||
| Call | ||||||||||||||||||||||||
Alphabet, Inc., Class C | 253 | 05/21/21 | USD | 2,400.00 | USD | 60,976 | $ | (1,311,805 | ) | |||||||||||||||
Amazon.com, Inc. | 169 | 05/21/21 | USD | 3,500.00 | USD | 58,599 | (1,133,990 | ) | ||||||||||||||||
Apple, Inc. | 4,275 | 05/21/21 | USD | 140.00 | USD | 56,199 | (230,850 | ) | ||||||||||||||||
Bank of America Corp. | 7,051 | 05/21/21 | USD | 44.00 | USD | 28,578 | (84,612 | ) | ||||||||||||||||
Global Payments, Inc. | 1,361 | 05/21/21 | USD | 225.00 | USD | 29,211 | (250,208 | ) | ||||||||||||||||
Home Depot, Inc. | 430 | 05/21/21 | USD | 310.00 | USD | 13,918 | (707,350 | ) | ||||||||||||||||
Invesco QQQ Trust, Series 1 | 854 | 05/21/21 | USD | 350.00 | USD | 28,864 | (114,863 | ) | ||||||||||||||||
JPMorgan Chase & Co. | 1,791 | 05/21/21 | USD | 175.00 | USD | 27,547 | (11,642 | ) | ||||||||||||||||
Mastercard, Inc., Class A | 394 | 05/21/21 | USD | 425.00 | USD | 15,053 | (20,882 | ) | ||||||||||||||||
Micron Technology, Inc | 1,730 | 05/21/21 | USD | 100.00 | USD | 14,890 | (42,385 | ) | ||||||||||||||||
CONSOLIDATED SCHEDULE OF INVESTMENTS | 41 |
Consolidated Schedule of Investments (continued) April 30, 2021 | BlackRock Global Allocation Fund, Inc. |
Exchange-Traded Options Written (continued)
| Description | Number of Contracts | Expiration Date | Exercise Price | Notional Amount (000) | Value | |||||||||||||||||||||
Call (continued) | ||||||||||||||||||||||||||
Microsoft Corp. | 2,197 | 05/21/21 | USD | 275.00 | USD | 55,404 | $ | (61,516 | ) | |||||||||||||||||
Morgan Stanley | 3,342 | 05/21/21 | USD | 95.00 | USD | 27,588 | (21,723 | ) | ||||||||||||||||||
NXP Semiconductors NV | 798 | 05/21/21 | USD | 220.00 | USD | 15,362 | (43,491 | ) | ||||||||||||||||||
NXP Semiconductors NV | 486 | 05/21/21 | USD | 260.00 | USD | 9,356 | (36,936 | ) | ||||||||||||||||||
NXP Semiconductors NV | 408 | 05/21/21 | USD | 240.00 | USD | 7,854 | (8,976 | ) | ||||||||||||||||||
ServiceNow, Inc. | 278 | 05/21/21 | USD | 660.00 | USD | 14,077 | (44,480 | ) | ||||||||||||||||||
Toll Brothers, Inc. | 2,237 | 05/21/21 | USD | 60.00 | USD | 14,026 | (838,875 | ) | ||||||||||||||||||
VanEck Vectors Gold Miners ETF | 6,559 | 05/21/21 | USD | 265.00 | USD | 159,384 | (472,248 | ) | ||||||||||||||||||
Western Digital Corp. | 696 | 05/21/21 | USD | 95.00 | USD | 3,072 | (8,352 | ) | ||||||||||||||||||
Western Digital Corp. | 2,298 | 05/21/21 | USD | 80.00 | USD | 16,231 | (102,261 | ) | ||||||||||||||||||
Alibaba Group Holding Ltd., ADR | 3,272 | 06/18/21 | USD | 290.00 | USD | 75,567 | (222,496 | ) | ||||||||||||||||||
Anthem, Inc. | 711 | 06/18/21 | USD | 390.00 | USD | 26,975 | (568,800 | ) | ||||||||||||||||||
Anthem, Inc. | 353 | 06/18/21 | USD | 410.00 | USD | 13,392 | (88,250 | ) | ||||||||||||||||||
Applied Materials, Inc. | 2,160 | 06/18/21 | USD | 175.00 | USD | 28,665 | (48,600 | ) | ||||||||||||||||||
Bank of America Corp. | 6,510 | 06/18/21 | USD | 46.00 | USD | 26,385 | (113,925 | ) | ||||||||||||||||||
Barclays PLC | 6,510 | 06/18/21 | GBP | 2.20 | GBP | 11,425 | (629,344 | ) | ||||||||||||||||||
Barclays PLC | 3,255 | 06/18/21 | GBP | 2.20 | GBP | 5,713 | (4,495,316 | ) | ||||||||||||||||||
BNP Paribas SA | 7,814 | 06/18/21 | EUR | 60.00 | EUR | 41,719 | (333,500 | ) | ||||||||||||||||||
Capital One Financial Corp. | 1,371 | 06/18/21 | USD | 150.00 | USD | 20,439 | (819,172 | ) | ||||||||||||||||||
Citigroup, Inc | 2,604 | 06/18/21 | USD | 85.00 | USD | 18,551 | (50,778 | ) | ||||||||||||||||||
Facebook, Inc., Class A | 1,890 | 06/18/21 | USD | 345.00 | USD | 61,440 | (930,825 | ) | ||||||||||||||||||
Goldman Sachs Group Inc. (The) | 1,084 | 06/18/21 | USD | 380.00 | USD | 37,772 | (311,108 | ) | ||||||||||||||||||
ING Groep NV | 6,510 | 06/18/21 | EUR | 12.00 | EUR | 6,920 | (78,266 | ) | ||||||||||||||||||
iShares iBoxx $ High Yield Corporate Bond ETF | 13,396 | 06/18/21 | USD | 87.00 | USD | 117,135 | (884,136 | ) | ||||||||||||||||||
iShares iBoxx $ Investment Grade Corporate Bond ETF | 10,172 | 06/18/21 | USD | 132.00 | USD | 133,406 | (523,858 | ) | ||||||||||||||||||
iShares iBoxx $ Investment Grade Corporate Bond ETF | 16,420 | 06/18/21 | USD | 133.00 | USD | 215,348 | (303,770 | ) | ||||||||||||||||||
Las Vegas Sands Corp. | 4,900 | 06/18/21 | USD | 72.50 | USD | 30,017 | (235,200 | ) | ||||||||||||||||||
Mastercard, Inc., Class A | 1,352 | 06/18/21 | USD | 450.00 | USD | 51,655 | (97,344 | ) | ||||||||||||||||||
Micron Technology, Inc. | 452 | 06/18/21 | USD | 105.00 | USD | 3,890 | (23,956 | ) | ||||||||||||||||||
NVIDIA Corp. | 67 | 06/18/21 | USD | 640.00 | USD | 4,023 | (119,093 | ) | ||||||||||||||||||
Societe Generale SA | 6,509 | 06/18/21 | EUR | 26.00 | EUR | 15,407 | (305,192 | ) | ||||||||||||||||||
SPDR S&P 500 ETF Trust | 11,771 | 06/18/21 | USD | 400.00 | USD | 491,204 | (26,437,666 | ) | ||||||||||||||||||
SPDR S&P 500 ETF Trust | 11,332 | 06/18/21 | USD | 430.00 | USD | 472,884 | (3,767,890 | ) | ||||||||||||||||||
Unicredit SpA | 1,269 | 06/18/21 | EUR | 10.00 | EUR | 5,433 | (69,417 | ) | ||||||||||||||||||
Alphabet, Inc., Class C | 113 | 07/16/21 | USD | 2,800.00 | USD | 27,234 | (93,225 | ) | ||||||||||||||||||
Amazon.com, Inc. | 76 | 07/16/21 | USD | 4,100.00 | USD | 26,352 | (132,620 | ) | ||||||||||||||||||
Apple, Inc. | 2,048 | 07/16/21 | USD | 155.00 | USD | 26,923 | (150,528 | ) | ||||||||||||||||||
Applied Materials, Inc. | 2,034 | 07/16/21 | USD | 155.00 | USD | 26,993 | (463,752 | ) | ||||||||||||||||||
iShares MSCI Emerging Markets ETF | 16,465 | 07/16/21 | USD | 61.00 | USD | 88,878 | (123,488 | ) | ||||||||||||||||||
Mastercard, Inc., Class A | 701 | 07/16/21 | USD | 440.00 | USD | 26,782 | (159,828 | ) | ||||||||||||||||||
Microsoft Corp. | 1,100 | 07/16/21 | USD | 290.00 | USD | 27,740 | (111,100 | ) | ||||||||||||||||||
NVIDIA Corp. | 251 | 07/16/21 | USD | 660.00 | USD | 15,070 | (485,057 | ) | ||||||||||||||||||
Mastercard, Inc., Class A | 1,467 | 08/20/21 | USD | 450.00 | USD | 56,048 | (513,450 | ) | ||||||||||||||||||
|
| |||||||||||||||||||||||||
| (49,238,395 | ) | |||||||||||||||||||||||||
|
| |||||||||||||||||||||||||
Put | ||||||||||||||||||||||||||
10-Year U.S. Treasury Note | 4,116 | 05/14/21 | USD | 130.50 | USD | 543,827 | (257,250 | ) | ||||||||||||||||||
10-Year U.S. Treasury Note | 4,538 | 05/21/21 | USD | 129.50 | USD | 599,583 | (141,813 | ) | ||||||||||||||||||
Advance Auto Parts, Inc. | 396 | 05/21/21 | USD | 160.00 | USD | 7,926 | (45,540 | ) | ||||||||||||||||||
Bank of America Corp. | 7,051 | 05/21/21 | USD | 34.00 | USD | 28,578 | (35,255 | ) | ||||||||||||||||||
Global Payments, Inc. | 1,361 | 05/21/21 | USD | 170.00 | USD | 29,211 | (142,905 | ) | ||||||||||||||||||
Invesco QQQ Trust, Series 1 | 3,007 | 05/21/21 | USD | 270.00 | USD | 101,634 | (37,588 | ) | ||||||||||||||||||
InvesCo QQQ Trust, Series 1 | 5,212 | 05/21/21 | USD | 300.00 | USD | 176,160 | (247,570 | ) | ||||||||||||||||||
InvesCo QQQ Trust, Series 1 | 10,979 | 05/21/21 | USD | 305.00 | USD | 371,079 | (735,593 | ) | ||||||||||||||||||
iShares iBoxx $ High Yield Corporate Bond ETF | 6,834 | 05/21/21 | USD | 75.00 | USD | 59,756 | (13,668 | ) | ||||||||||||||||||
iShares iBoxx $ High Yield Corporate Bond ETF | 475 | 05/21/21 | USD | 83.00 | USD | 4,153 | (2,613 | ) | ||||||||||||||||||
iShares Russell 2000 ETF | 350 | 05/21/21 | USD | 190.00 | USD | 7,871 | (6,825 | ) | ||||||||||||||||||
JPMorgan Chase & Co. | 1,791 | 05/21/21 | USD | 135.00 | USD | 27,547 | (30,447 | ) | ||||||||||||||||||
Las Vegas Sands Corp. | 1,297 | 05/21/21 | USD | 60.00 | USD | 7,945 | (199,089 | ) | ||||||||||||||||||
Mastercard, Inc., Class A | 196 | 05/21/21 | USD | 340.00 | USD | 7,488 | (12,347 | ) | ||||||||||||||||||
Morgan Stanley | 3,342 | 05/21/21 | USD | 72.50 | USD | 27,588 | (41,775 | ) | ||||||||||||||||||
SPDR Bloomberg Barclays High Yield Bond ETF | 357 | 05/21/21 | USD | 104.00 | USD | 3,899 | (7,140 | ) | ||||||||||||||||||
| 42 | 2 0 2 1 BLACK ROCK ANNUAL REPORT TO SHAREHOLDERS |
Consolidated Schedule of Investments (continued) April 30, 2021 | BlackRock Global Allocation Fund, Inc. |
Exchange-Traded Options Written (continued)
| Description | Number of Contracts | Expiration Date | Exercise Price | Notional Amount (000) | Value | |||||||||||||||||||||
Put (continued) | ||||||||||||||||||||||||||
SPDR S&P 500 ETF Trust | 17,451 | 05/21/21 | USD | 360.00 | USD | 728,230 | $ | (567,157 | ) | |||||||||||||||||
SPDR S&P 500 ETF Trust | 4,538 | 05/21/21 | USD | 385.00 | USD | 189,371 | (401,613 | ) | ||||||||||||||||||
SPDR S&P 500 ETF Trust | 13,150 | 05/21/21 | USD | 382.00 | USD | 548,750 | (1,005,975 | ) | ||||||||||||||||||
SPDR S&P 500 ETF Trust | 345 | 05/21/21 | USD | 370.00 | USD | 14,397 | (15,698 | ) | ||||||||||||||||||
Alphabet, Inc., Class C | 65 | 06/18/21 | USD | 2,100.00 | USD | 15,666 | (73,450 | ) | ||||||||||||||||||
Anthem, Inc. | 711 | 06/18/21 | USD | 300.00 | USD | �� | 26,975 | (55,103 | ) | |||||||||||||||||
Anthem, Inc. | 353 | 06/18/21 | USD | 310.00 | USD | 13,392 | (33,535 | ) | ||||||||||||||||||
Deere & Co. | 378 | 06/18/21 | USD | 350.00 | USD | 14,018 | (289,170 | ) | ||||||||||||||||||
Deere & Co. | 185 | 06/18/21 | USD | 330.00 | USD | 6,861 | (66,600 | ) | ||||||||||||||||||
iShares iBoxx $High Yield Corporate Bond ETF | 13,396 | 06/18/21 | USD | 75.00 | USD | 117,135 | (73,678 | ) | ||||||||||||||||||
iShares iBoxx $ High Yield Corporate Bond ETF | 13,254 | 06/18/21 | USD | 81.00 | USD | 115,893 | (205,437 | ) | ||||||||||||||||||
Lloyds Banking Group PLC | 12,995 | 06/18/21 | GBP | 0.38 | GBP | 5,904 | (448,668 | ) | ||||||||||||||||||
Monster Beverage Corp. | 1,317 | 06/18/21 | USD | 85.00 | USD | 12,781 | (95,483 | ) | ||||||||||||||||||
Monster Beverage Corp. | 256 | 06/18/21 | USD | 80.00 | USD | 2,484 | (8,960 | ) | ||||||||||||||||||
Procter & Gamble Co. | 2,497 | 06/18/21 | USD | 115.00 | USD | 33,315 | (83,650 | ) | ||||||||||||||||||
PVH Corp. | 769 | 06/18/21 | USD | 100.00 | USD | 8,704 | (217,242 | ) | ||||||||||||||||||
salesforce.com, Inc. | 1,606 | 06/18/21 | USD | 200.00 | USD | 36,989 | (294,701 | ) | ||||||||||||||||||
SPDR Bloomberg Barclays High Yield Bond ETF | 400 | 06/18/21 | USD | 100.00 | USD | 4,368 | (8,000 | ) | ||||||||||||||||||
SPDR S&P 500 ETF Trust | 3,544 | 06/18/21 | USD | 370.00 | USD | 147,891 | (666,272 | ) | ||||||||||||||||||
Volkswagen AG, Preference Shares | 546 | 06/18/21 | EUR | 210.00 | EUR | 11,832 | (282,264 | ) | ||||||||||||||||||
Walt Disney Co. | 436 | 06/18/21 | USD | 170.00 | USD | 8,110 | (103,550 | ) | ||||||||||||||||||
Alibaba Group Holding Ltd., ADR | 1,090 | 07/16/21 | USD | 215.00 | USD | 25,174 | (746,650 | ) | ||||||||||||||||||
Alphabet, Inc., Class C | 113 | 07/16/21 | USD | 2,100.00 | USD | 27,234 | (222,045 | ) | ||||||||||||||||||
Amazon.com, Inc. | 76 | 07/16/21 | USD | 3,000.00 | USD | 26,352 | (234,840 | ) | ||||||||||||||||||
Apple, Inc. | 2,048 | 07/16/21 | USD | 115.00 | USD | 26,923 | (252,928 | ) | ||||||||||||||||||
Applied Materials, Inc. | 2,034 | 07/16/21 | USD | 115.00 | USD | 26,993 | (586,809 | ) | ||||||||||||||||||
Mastercard, Inc., Class A | 701 | 07/16/21 | USD | 345.00 | USD | 26,782 | (375,035 | ) | ||||||||||||||||||
Microsoft Corp. | 1,100 | 07/16/21 | USD | 215.00 | USD | 27,740 | (179,850 | ) | ||||||||||||||||||
Mastercard, Inc., Class A | 1,050 | 08/20/21 | USD | 340.00 | USD | 40,116 | (805,875 | ) | ||||||||||||||||||
|
| |||||||||||||||||||||||||
| (10,357,656 | ) | |||||||||||||||||||||||||
|
| |||||||||||||||||||||||||
| $ | (59,596,051 | ) | ||||||||||||||||||||||||
|
| |||||||||||||||||||||||||
OTC Barrier Options Written
| Description | Type of Option | Counterparty | Number of Contracts | Expiration Date | Exercise Price | Barrier Price/Range | Notional Amount (000) | Value | ||||||||||||||||||||||
Put | ||||||||||||||||||||||||||||||
Euro Stoxx 50 | Down-and-in | Credit Suisse International | 30,280 | 12/17/21 | EUR 3,100.00 | EUR 2700.00 | EUR 112,998 | $ | (1,908,578 | ) | ||||||||||||||||||||
|
| |||||||||||||||||||||||||||||
OTC Options Written
| Description | Counterparty | Number of Contracts | Expiration Date | Exercise Price | Notional Amount (000) | Value | ||||||||||||||||||||||||
Call | ||||||||||||||||||||||||||||||
GBP Currency | UBS AG | — | 05/06/21 | USD | 1.42 | GBP | 90,559 | $ | (1,251 | ) | ||||||||||||||||||||
USD Currency | Citibank N.A. | — | 05/06/21 | JPY | 112.00 | USD | 253,450 | (4,562 | ) | |||||||||||||||||||||
USD Currency | Morgan Stanley & Co. International PLC | — | 05/06/21 | CHF | 0.96 | USD | 253,435 | (253 | ) | |||||||||||||||||||||
Disco Corp. | Goldman Sachs International | 6,336 | 05/14/21 | JPY | 36,736.80 | JPY | 224,294 | (25,346 | ) | |||||||||||||||||||||
Hoya Corp. | Morgan Stanley & Co. International PLC | 81,497 | 05/14/21 | JPY | 13,620.00 | JPY | 1,013,415 | (9,142 | ) | |||||||||||||||||||||
Kayence Corp. | UBS AG | 8,858 | 05/14/21 | JPY | 56,618.50 | JPY | 465,222 | (5,755 | ) | |||||||||||||||||||||
Shin-Etsu Chemical Co. Ltd. | Morgan Stanley & Co. International PLC | 80,488 | 05/14/21 | JPY | 19,965.00 | JPY | 1,485,004 | (18,471 | ) | |||||||||||||||||||||
Sony Group Corp. | Goldman Sachs International | 32,834 | 05/14/21 | JPY | 12,358.21 | JPY | 357,891 | (3,306 | ) | |||||||||||||||||||||
Adidas AG | Barclays Bank PLC | 42,027 | 05/21/21 | EUR | 340.00 | EUR | 10,795 | (505 | ) | |||||||||||||||||||||
Alibaba Group Holding Ltd., ADR | Nomura International PLC | 52,014 | 05/21/21 | USD | 260.00 | USD | 12,013 | (46,813 | ) | |||||||||||||||||||||
Dr. Horton, Inc. | BNP Paribas S.A. | 162,617 | 05/21/21 | USD | 87.50 | USD | 15,984 | (1,809,114 | ) | |||||||||||||||||||||
SPDR Gold Trust(a) | Morgan Stanley & Co. International PLC | 86,416 | 05/21/21 | USD | 176.00 | USD | 14,316 | (25,875 | ) | |||||||||||||||||||||
Starbucks Corp. | Citibank N.A. | 127,597 | 05/21/21 | USD | 130.00 | USD | 14,609 | (758 | ) | |||||||||||||||||||||
Walt Disney Co. | Morgan Stanley & Co. International PLC | 214,246 | 05/21/21 | USD | 215.00 | USD | 39,854 | (123,832 | ) | |||||||||||||||||||||
Disco Corp. | Morgan Stanley & Co. International PLC | 6,490 | 06/11/21 | JPY | 42,952.50 | JPY | 229,746 | (5,068 | ) | |||||||||||||||||||||
CONSOLIDATED SCHEDULE OF INVESTMENTS | 43 |
Consolidated Schedule of Investments (continued) April 30, 2021 | BlackRock Global Allocation Fund, Inc. |
OTC Options Written (continued)
| Description | Counterparty | Number of Contracts | Expiration Date | Exercise Price | Notional Amount (000) | Value | ||||||||||||||||||||||||
Call (continued) | ||||||||||||||||||||||||||||||
Fanuc Corp. | Goldman Sachs International | 11,850 | 06/11/21 | JPY | 30,232.09 | JPY | 298,324 | $ | (6,558 | ) | ||||||||||||||||||||
Hoya Corp. | Morgan Stanley & Co. International PLC | 82,953 | 06/11/21 | JPY | 15,806.75 | JPY | 1,031,521 | (2,821 | ) | |||||||||||||||||||||
Keyence Corp. | Goldman Sachs International | 9,029 | 06/11/21 | JPY | 58,269.78 | JPY | 474,203 | (14,881 | ) | |||||||||||||||||||||
Kose Corp. | Goldman Sachs International | 18,622 | 06/11/21 | JPY | 17,944.64 | JPY | 306,518 | (30,807 | ) | |||||||||||||||||||||
Shin-Etsu Chemical Co. Ltd. | Morgan Stanley & Co. International PLC | 82,107 | 06/11/21 | JPY | 22,172.00 | JPY | 1,514,874 | (5,655 | ) | |||||||||||||||||||||
Sony Group Corp. | Goldman Sachs International | 33,012 | 06/11/21 | JPY | 13,593.55 | JPY | 359,831 | (2,913 | ) | |||||||||||||||||||||
Autodesk, Inc. | Nomura International PLC | 208,204 | 06/18/21 | USD | 330.00 | USD | 60,777 | (580,889 | ) | |||||||||||||||||||||
Dr. Horton, Inc. | BNP Paribas S.A. | 162,617 | 06/18/21 | USD | 97.50 | USD | 15,984 | (788,692 | ) | |||||||||||||||||||||
Dr. Horton, Inc. | Citibank N.A. | 276,129 | 06/18/21 | USD | 115.00 | USD | 27,141 | (113,213 | ) | |||||||||||||||||||||
LVMH Moet Hennessy Louis Vuitton SE | Barclays Bank PLC | 25,263 | 06/18/21 | EUR | 680.00 | EUR | 15,820 | (104,737 | ) | |||||||||||||||||||||
Raytheon Technologies Corp. | Goldman Sachs International | 365,234 | 06/18/21 | USD | 90.00 | USD | 30,402 | (244,707 | ) | |||||||||||||||||||||
SPDR Gold Trust(a) | Societe Generale | 173,127 | 06/18/21 | USD | 178.00 | USD | 28,680 | (60,594 | ) | |||||||||||||||||||||
NXP Semiconductors NV | UBS AG | 138,487 | 07/16/21 | USD | 230.00 | USD | 26,660 | (281,129 | ) | |||||||||||||||||||||
|
| |||||||||||||||||||||||||||||
| (4,317,647 | ) | |||||||||||||||||||||||||||||
|
| |||||||||||||||||||||||||||||
Put | ||||||||||||||||||||||||||||||
Adidas AG | Barclays Bank PLC | 31,764 | 05/21/21 | EUR | 260.00 | EUR | 8,159 | (436,372 | ) | |||||||||||||||||||||
SPDR Gold Trust(a) | Morgan Stanley & Co. International PLC | 43,475 | 05/21/21 | USD | 158.00 | USD | 7,202 | (11,737 | ) | |||||||||||||||||||||
EUR Currency | Bank of America N.A. | — | 06/03/21 | USD | 1.14 | EUR | 404,026 | (22,830 | ) | |||||||||||||||||||||
EUR Currency | JPMorgan Chase Bank N.A. | — | 06/07/21 | USD | 1.16 | EUR | 152,318 | (44,499 | ) | |||||||||||||||||||||
Autodesk, Inc. | Nomura International PLC | 145,240 | 06/18/21 | USD | 240.00 | USD | 42,397 | (302,099 | ) | |||||||||||||||||||||
Dr. Horton, Inc. | Citibank N.A. | 276,129 | 06/18/21 | USD | 85.00 | USD | 27,141 | (220,903 | ) | |||||||||||||||||||||
LVMH Moet Hennessy Louis Vuitton SE | Barclays Bank PLC | 21,246 | 06/18/21 | EUR | 540.00 | EUR | 13,304 | (111,946 | ) | |||||||||||||||||||||
Raytheon Technologies Corp. | Goldman Sachs International | 365,234 | 06/18/21 | USD | 62.50 | USD | 30,402 | (29,292 | ) | |||||||||||||||||||||
SPDR Gold Trust(a) | Societe Generale | 117,349 | 06/18/21 | USD | 154.00 | USD | 19,440 | (48,692 | ) | |||||||||||||||||||||
NXP Semiconductors NV | UBS AG | 138,487 | 07/16/21 | USD | 170.00 | USD | 26,660 | (516,557 | ) | |||||||||||||||||||||
USD Currency | JPMorgan Chase Bank N.A. | — | 07/27/21 | RUB | 70.50 | USD | 53,778 | (168,272 | ) | |||||||||||||||||||||
EUR Currency | BNP Paribas S.A. | — | 08/02/21 | USD | 1.15 | EUR | 292,720 | (339,605 | ) | |||||||||||||||||||||
|
| |||||||||||||||||||||||||||||
| (2,252,804 | ) | |||||||||||||||||||||||||||||
|
| |||||||||||||||||||||||||||||
| $ | (6,570,451 | ) | ||||||||||||||||||||||||||||
|
| |||||||||||||||||||||||||||||
| (a) | All or a portion of the security is held by a wholly-owned subsidiary. See Note 1 of the Notes to Consolidated Financial Statements for details on the wholly-owned subsidiary. |
OTC Credit Default Swaptions Written
|
| Paid by the Fund | Received by the Fund | Counterparty | Expiration Date | Credit Rating(a) | Exercise Price | Notional Amount (000)(b) | Value | ||||||||||||||||||||||||||
| Description | Rate | Frequency | Rate | Frequency | ||||||||||||||||||||||||||||||
Put | ||||||||||||||||||||||||||||||||||
Sold Protection on 5-Year Credit Default Swap, 06/20/26 | | 3-Month LIBOR | | Quarterly | 5.00% | Quarterly | Bank of America N.A. | 05/19/21 | NR | USD 105.00 | USD 11,320 | $ | (6,970 | ) | ||||||||||||||||||||
|
| |||||||||||||||||||||||||||||||||
| (a) | Using the rating of the issuer or the underlying securities of the index, as applicable, provided by S&P Global Ratings. |
| (b) | The maximum potential amount the Fund may pay should a negative credit event take place as defined under the terms of the agreement. |
OTC Interest Rate Swaptions Written
|
| Paid by the Fund | Received by the Fund |
| Expiration | Exercise | Notional |
| |||||||||||||||||||||||
| Description | Rate | Frequency | Rate | Frequency | Counterparty | Date | Rate | Amount (000) | Value | |||||||||||||||||||||
Call | ||||||||||||||||||||||||||||||
10-Year Interest Rate Swap, 09/22/31 | 0.55 | % | Semi-Annual | | 3-Month LIBOR, 0.18 | % | Quarterly | Morgan Stanley & Co. International PLC | 09/20/21 | 0.55 | % | USD | 54,644 | $ | (12,854 | ) | ||||||||||||||
1-Year Interest Rate Swap, 03/18/24 | 0.40 | % | Semi-Annual | | 3-Month LIBOR, 0.18 | % | Quarterly | Morgan Stanley & Co. International PLC | 03/16/23 | 0.40 | USD | 1,362,004 | (1,456,132 | ) | ||||||||||||||||
1-Year Interest Rate Swap, 03/18/24 | 0.60 | % | Semi-Annual | | 3-Month LIBOR, 0.18 | % | Quarterly | Morgan Stanley & Co. International PLC | 03/16/23 | 0.60 | USD | 1,362,004 | (2,581,543 | ) | ||||||||||||||||
|
| |||||||||||||||||||||||||||||
| (4,050,529 | ) | |||||||||||||||||||||||||||||
|
| |||||||||||||||||||||||||||||
Put | ||||||||||||||||||||||||||||||
5-Year Interest Rate Swap, 05/27/26 | | 3-Month LIBOR, 0.18 | % | Quarterly | 1.00 | % | Semi-Annual | Goldman Sachs International | 05/25/21 | 1.00 | USD | 369,774 | (786,528 | ) | ||||||||||||||||
| 44 | 2 0 2 1 BLACK ROCK ANNUAL REPORT TO SHAREHOLDERS |
Consolidated Schedule of Investments (continued) April 30, 2021 | BlackRock Global Allocation Fund, Inc. |
OTC Interest Rate Swaptions Written (continued)
|
| Paid by the Fund | Received by the Fund |
| Expiration Date | Exercise Rate | Notional |
| |||||||||||||||||||||||||||
| Description | Rate | Frequency | Rate | Frequency | Counterparty | Value | ||||||||||||||||||||||||||||
Put (continued) | ||||||||||||||||||||||||||||||||||
5-Year Interest Rate Swap, 05/27/26 | | 3-Month LIBOR, 0.18% | | Quarterly | 1.00% | Semi-Annual | Deutsche Bank AG | 05/25/21 | 1.00 | % | USD | 369,774 | $ | (786,528 | ) | |||||||||||||||||||
10-Year Interest Rate Swap, 07/10/31 | | 3-Month LIBOR, 0.18% | | Quarterly | 2.15% | Semi-Annual | Goldman Sachs International | 07/08/21 | 2.15 | USD | 70,888 | (125,390 | ) | |||||||||||||||||||||
30-Year Interest Rate Swap, 07/10/51 | | 3-Month LIBOR, 0.18% | | Quarterly | 2.53% | Semi-Annual | Goldman Sachs International | 07/08/21 | 2.53 | USD | 27,056 | (89,244 | ) | |||||||||||||||||||||
30-Year Interest Rate Swap, 07/10/51 | | 3-Month LIBOR, 0.18% | | Quarterly | 2.53% | Semi-Annual | Goldman Sachs International | 07/08/21 | 2.53 | USD | 27,057 | (89,247 | ) | |||||||||||||||||||||
30-Year Interest Rate Swap, 08/25/51 | | 3-Month LIBOR, 0.18% | | Quarterly | 2.25% | Semi-Annual | Goldman Sachs International | 08/23/21 | 2.25 | USD | 59,478 | (1,315,982 | ) | |||||||||||||||||||||
30-Year Interest Rate Swap, 08/25/51 | | 3-Month LIBOR, 0.18% | | Quarterly | 2.27% | Semi-Annual | Goldman Sachs International | 08/23/21 | 2.27 | USD | 58,937 | (1,221,604 | ) | |||||||||||||||||||||
10-Year Interest Rate Swap, 09/22/31 | | 3-Month LIBOR, 0.18% 6-Month |
| Quarterly | 1.40% | Semi-Annual | Morgan Stanley & Co. International PLC | 09/20/21 | 1.40 | USD | 109,287 | (3,927,475 | ) | |||||||||||||||||||||
30-Year Interest Rate Swap, 11/18/51 | | EURIBOR, (0.52%) 6-Month | | Semi-Annual | 0.78% | Annual | JPMorgan Chase Bank N.A. | 11/16/21 | 0.78 | EUR | 99,286 | (2,856,943 | ) | |||||||||||||||||||||
30-Year Interest Rate Swap, 11/26/51 | | EURIBOR, (0.52%) | | Semi-Annual | 0.79% | Annual | Goldman Sachs International | 11/24/21 | 0.79 | EUR | 97,137 | (2,815,441 | ) | |||||||||||||||||||||
30-Year Interest Rate Swap, 12/11/51 | | 6-Month EURIBOR, (0.52%) | | Semi-Annual | 0.82% | Annual | Goldman Sachs International | 12/09/21 | 0.82 | EUR | 90,274 | (2,563,211 | ) | |||||||||||||||||||||
10-Year Interest Rate Swap, 01/28/32 | | 3-Month LIBOR, 0.18% | | Quarterly | 1.76% | Semi-Annual | Goldman Sachs International | 01/26/22 | 1.76 | USD | 129,147 | (3,388,483 | ) | |||||||||||||||||||||
10-Year Interest Rate Swap, 01/28/32 | | 3-Month LIBOR, 0.18% | | Quarterly | 1.76% | Semi-Annual | Goldman Sachs International | 01/26/22 | 1.76 | USD | 258,294 | (6,776,965 | ) | |||||||||||||||||||||
30-Year Interest Rate Swap, 04/22/52 | | 3-Month LIBOR, 0.18% | | Quarterly | 2.60% | Semi-Annual | Goldman Sachs International | 04/20/22 | 0.03 | USD | 51,063 | (1,434,599 | ) | |||||||||||||||||||||
30-Year Interest Rate Swap, 04/22/52 | | 3-Month LIBOR, 0.18% | | Quarterly | 2.60% | Semi-Annual | Goldman Sachs International | 04/20/22 | 0.03 | USD | 51,062 | (1,434,578 | ) | |||||||||||||||||||||
10-Year Interest Rate Swap, 04/23/32 | | 3-Month LIBOR, 0.18% | | Quarterly | 2.30% | Semi-Annual | Morgan Stanley & Co. International PLC | 04/21/22 | 0.02 | USD | 108,285 | (1,504,189 | ) | |||||||||||||||||||||
|
| |||||||||||||||||||||||||||||||||
| (31,116,407 | ) | |||||||||||||||||||||||||||||||||
|
| |||||||||||||||||||||||||||||||||
| $ | (35,166,936 | ) | ||||||||||||||||||||||||||||||||
|
| |||||||||||||||||||||||||||||||||
Centrally Cleared Credit Default Swaps — Buy Protection
| Reference Obligation/Index | Financing Rate Paid by the Fund | Payment Frequency | Termination Date | Notional | Value | Upfront Premium Paid (Received) | Unrealized Appreciation (Depreciation) | |||||||||||||||||||
CDX.NA.IG.33.V1 | 1.00 | % | Quarterly | 12/20/24 | USD | 885,749 | $(18,267,783) | $ | (14,309,407 | ) | $ | (3,958,376 | ) | |||||||||||||
CDX.NA.HY.34.V9. | 5.00 | Quarterly | 06/20/25 | USD | 97,490 | (10,216,170) | 2,300,073 | (12,516,243 | ) | |||||||||||||||||
CDX.NA.IG.36.V1 | 1.00 | Quarterly | 06/20/26 | USD | 122,953 | (3,195,194) | (2,563,586) | (631,608 | ) | |||||||||||||||||
|
|
|
|
| ||||||||||||||||||||||
| $(31,679,147) | $ | (14,572,920 | ) | $ | (17,106,227 | ) | ||||||||||||||||||||
|
|
|
|
| ||||||||||||||||||||||
Centrally Cleared Credit Default Swaps — Sell Protection
| Reference Obligation/Index | Financing Rate Received by the Fund | Payment Frequency | Termination Date | Credit Rating(a) | Notional Amount (000)(b) | Value | Upfront Premium Paid (Received) | Unrealized Appreciation (Depreciation) | ||||||||||||||||||||||||||
ITRAXX.XO.34.V1 | 5.00 | % | Quarterly | 12/20/25 | B | EUR | 70,879 | $ | 10,984,099 | $ | 5,819,401 | $ | 5,164,698 | |||||||||||||||||||||
|
|
|
|
|
| |||||||||||||||||||||||||||||
| (a) | Using the rating of the issuer or the underlying securities of the index, as applicable, provided by S&P Global Ratings. |
| (b) | The maximum potential amount the Fund may pay should a negative credit event take place as defined under the terms of the agreement. |
CONSOLIDATED SCHEDULE OF INVESTMENTS | 45 |
Consolidated Schedule of Investments (continued) April 30, 2021 | BlackRock Global Allocation Fund, Inc. |
Centrally Cleared Interest Rate Swaps
Paid by the Fund | Received by the Fund | Effective | Termination | Notional |
| Upfront Premium Paid | Unrealized Appreciation | |||||||||||||||||||||||||
| Rate | Frequency | Rate | Frequency | Date | Date | Amount (000) | Value | (Received) | (Depreciation) | |||||||||||||||||||||||
6-Month CAD BA, 1.91% | Semi-Annual | 1.91% | Semi-Annual | N/A | 07/09/21 | CAD | 687,584 | $ | 3,973,120 | $ | 544 | $ | 3,972,576 | |||||||||||||||||||
1.06% | Semi-Annual | 3-Month LIBOR, 1.18% | Quarterly | N/A | 03/28/22 | USD | 1,037,451 | (8,791,400 | ) | 3,741 | (8,795,141 | ) | ||||||||||||||||||||
0.88% | Semi-Annual | 3-Month LIBOR, 1.18% | Quarterly | N/A | 08/17/22 | USD | 577,868 | (5,778,127 | ) | 2,956 | (5,781,083 | ) | ||||||||||||||||||||
1-Month MXIBOR, 4.29% | Monthly | 4.42% | Monthly | N/A | 02/28/23 | MXN | 958,091 | (476,856 | ) | 332 | (477,188 | ) | ||||||||||||||||||||
1-Month MXIBOR, 4.29% | Monthly | 4.50% | Monthly | N/A | 03/03/23 | MXN | 957,790 | (414,753 | ) | 333 | (415,086 | ) | ||||||||||||||||||||
1-Month MXIBOR, 4.29% | Monthly | 4.68% | Monthly | N/A | 02/27/24 | MXN | 679,790 | (646,562 | ) | 243 | (646,805 | ) | ||||||||||||||||||||
1-Month MXIBOR, 4.29% | Monthly | 4.86% | Monthly | N/A | 03/01/24 | MXN | 679,789 | (494,710 | ) | 244 | (494,954 | ) | ||||||||||||||||||||
0.40% | Semi-Annual | 3-Month LIBOR, 1.18% | Quarterly | N/A | 03/08/24 | USD | 861,070 | 716,444 | 6,491 | 709,953 | ||||||||||||||||||||||
0.53% | Semi-Annual | 3-Month LIBOR, 1.18% | Quarterly | 06/06/22 | (a) | 06/06/24 | USD | 204,209 | 512,656 | 1,593 | 511,063 | |||||||||||||||||||||
1.60% | Semi-Annual | 3-Month LIBOR, 1.18% | Quarterly | N/A | 01/24/25 | USD | 413,546 | (16,328,967 | ) | 8,148 | (16,337,115 | ) | ||||||||||||||||||||
0.35% | Semi-Annual | 3-Month LIBOR, 1.18% | Quarterly | N/A | 08/27/25 | USD | 156,818 | 2,902,601 | 1,681 | 2,900,920 | ||||||||||||||||||||||
6-Month LIBOR, 0.20% | Quarterly | 0.37% | Semi-Annual | N/A | 10/29/25 | USD | 453,717 | (9,263,033 | ) | 5,125 | (9,268,158 | ) | ||||||||||||||||||||
6-Month LIBOR, 0.20% | Quarterly | 0.46% | Semi-Annual | N/A | 11/24/25 | USD | 125,902 | (2,012,909 | ) | 1,581 | (2,014,490 | ) | ||||||||||||||||||||
6-Month LIBOR, 0.20% | Quarterly | 0.39% | Semi-Annual | N/A | 02/10/26 | USD | 317,693 | (7,501,254 | ) | 3,787 | (7,505,041 | ) | ||||||||||||||||||||
0.68% | Semi-Annual | 3-Month LIBOR, 1.18% | Quarterly | N/A | 02/19/26 | USD | 158,475 | 1,472,357 | 1,899 | 1,470,458 | ||||||||||||||||||||||
0.70% | Semi-Annual | 3-Month LIBOR, 1.18% | Quarterly | N/A | 02/23/26 | USD | 43,310 | 371,647 | 520 | 371,127 | ||||||||||||||||||||||
6-Month LIBOR, 0.20% | Quarterly | 0.83% | Semi-Annual | N/A | 03/09/26 | USD | 528,370 | (1,372,128 | ) | 6,396 | (1,378,524 | ) | ||||||||||||||||||||
0.60% | Semi-Annual | 3-Month LIBOR, 1.18% | Quarterly | N/A | 04/08/26 | USD | 749,954 | 11,781,620 | 9,300 | 11,772,320 | ||||||||||||||||||||||
0.62% | Semi-Annual | 3-Month LIBOR, 1.18% | Quarterly | N/A | 04/08/26 | USD | 308,804 | 4,545,662 | 3,829 | 4,541,833 | ||||||||||||||||||||||
6-Month LIBOR, 0.20% | Quarterly | 0.85% | Semi-Annual | N/A | 04/08/26 | USD | 749,954 | (2,504,689 | ) | 9,300 | (2,513,989 | ) | ||||||||||||||||||||
6-Month LIBOR, 0.20% | Quarterly | 0.87% | Semi-Annual | N/A | 04/08/26 | USD | 308,804 | (725,750 | ) | 3,829 | (729,579 | ) | ||||||||||||||||||||
0.69% | Semi-Annual | 3-Month LIBOR, 1.18% | Quarterly | N/A | 06/24/30 | USD | 49,810 | 3,647,049 | 812 | 3,646,237 | ||||||||||||||||||||||
3-Month LIBOR, 1.18% | Quarterly | 1.08% | Semi-Annual | N/A | 08/19/30 | USD | 115,494 | (4,775,498 | ) | 1,940 | (4,777,438 | ) | ||||||||||||||||||||
6-Month LIBOR, 0.20% | Quarterly | 0.64% | Semi-Annual | N/A | 08/21/30 | USD | 54,006 | (4,407,890 | ) | 909 | (4,408,799 | ) | ||||||||||||||||||||
6-Month LIBOR, 0.20% | Quarterly | 0.68% | Semi-Annual | N/A | 09/16/30 | USD | 20,212 | (1,613,388 | ) | 342 | (1,613,730 | ) | ||||||||||||||||||||
6-Month LIBOR, 0.20% | Quarterly | 0.66% | Semi-Annual | N/A | 09/25/30 | USD | 30,500 | (2,494,041 | ) | 518 | (2,494,559 | ) | ||||||||||||||||||||
0.71% | Semi-Annual | 3-Month LIBOR, 1.18% | Quarterly | N/A | 09/25/30 | USD | 30,500 | 2,356,891 | 518 | 2,356,373 | ||||||||||||||||||||||
6-Month LIBOR, 0.20% | Quarterly | 0.69% | Semi-Annual | N/A | 09/30/30 | USD | 24,400 | (1,928,214 | ) | 414 | (1,928,628 | ) | ||||||||||||||||||||
0.76% | Semi-Annual | 3-Month LIBOR, 1.18% | Quarterly | N/A | 09/30/30 | USD | 24,400 | 1,770,819 | 414 | 1,770,405 | ||||||||||||||||||||||
0.81% | Semi-Annual | 3-Month LIBOR, 1.18% | Quarterly | N/A | 11/25/30 | USD | 83,001 | 5,641,475 | 1,521 | 5,639,954 | ||||||||||||||||||||||
1.17% | Semi-Annual | 3-Month LIBOR, 1.18% | Quarterly | N/A | 02/04/31 | USD | 55,705 | 2,117,585 | 989 | 2,116,596 | ||||||||||||||||||||||
1.20% | Semi-Annual | 3-Month LIBOR, 1.18% | Quarterly | N/A | 02/05/31 | USD | 32,825 | 1,179,489 | 583 | 1,178,906 | ||||||||||||||||||||||
6-Month LIBOR, 0.20% | Quarterly | 1.40% | Semi-Annual | N/A | 04/07/31 | USD | 243,174 | (4,873,789 | ) | 4,428 | (4,878,217 | ) | ||||||||||||||||||||
6-Month LIBOR, 0.20% | Quarterly | 1.42% | Semi-Annual | N/A | 04/08/31 | USD | 140,053 | (2,546,901 | ) | 2,551 | (2,549,452 | ) | ||||||||||||||||||||
0.89% | Semi-Annual | 3-Month LIBOR, 1.18% | Quarterly | N/A | 07/05/50 | USD | 37,022 | 9,851,808 | 1,179 | 9,850,629 | ||||||||||||||||||||||
0.88% | Semi-Annual | 3-Month LIBOR, 1.18% | Quarterly | N/A | 07/21/50 | USD | 24,341 | 6,549,467 | 789 | 6,548,678 | ||||||||||||||||||||||
6-Month LIBOR, 0.20% | Quarterly | 1.08% | Semi-Annual | N/A | 09/28/50 | USD | 12,366 | (2,773,474 | ) | 403 | (2,773,877 | ) | ||||||||||||||||||||
6-Month LIBOR, 0.20% | Quarterly | 1.08% | Semi-Annual | N/A | 09/28/50 | USD | 53,050 | (11,960,214 | ) | 1,728 | (11,961,942 | ) | ||||||||||||||||||||
6-Month LIBOR, 0.20% | Quarterly | 1.07% | Semi-Annual | N/A | 10/21/50 | USD | 36,511 | (8,306,756 | ) | 1,217 | (8,307,973 | ) | ||||||||||||||||||||
1.27% | Semi-Annual | 3-Month LIBOR, 1.18% | Quarterly | N/A | 10/24/50 | USD | 77,818 | 14,079,074 | 2,594 | 14,076,480 | ||||||||||||||||||||||
6-Month LIBOR, 0.20% | Quarterly | 0.97% | Semi-Annual | N/A | 10/28/50 | USD | 29,589 | (7,429,935 | ) | 966 | (7,430,901 | ) | ||||||||||||||||||||
1.17% | Semi-Annual | 3-Month LIBOR, 1.18% | Quarterly | N/A | 10/28/50 | USD | 30,946 | 6,327,505 | 1,032 | 6,326,473 | ||||||||||||||||||||||
0.98% | Semi-Annual | 3-Month LIBOR, 1.18% | Quarterly | N/A | 10/31/50 | USD | 89,637 | 22,295,418 | 2,989 | 22,292,429 | ||||||||||||||||||||||
1.30% | Semi-Annual | 3-Month LIBOR, 1.18% | Quarterly | N/A | 11/21/50 | USD | 69,157 | 11,690,376 | 2,339 | 11,688,037 | ||||||||||||||||||||||
1.22% | Semi-Annual | 3-Month LIBOR, 1.18% | Quarterly | N/A | 11/28/50 | USD | 30,946 | 5,831,247 | 1,047 | 5,830,200 | ||||||||||||||||||||||
1.45% | Semi-Annual | 3-Month LIBOR, 1.18% | Quarterly | N/A | 12/12/50 | USD | 23,045 | 3,095,131 | 771 | 3,094,360 | ||||||||||||||||||||||
6-Month LIBOR, 0.20% | Quarterly | 1.20% | Semi-Annual | N/A | 12/22/50 | USD | 119,778 | (23,260,668 | ) | 4,012 | (23,264,680 | ) | ||||||||||||||||||||
1.27% | Semi-Annual | 3-Month LIBOR, 1.18% | Quarterly | N/A | 12/30/50 | USD | 30,946 | 5,503,620 | 1,037 | 5,502,583 | ||||||||||||||||||||||
1.45% | Semi-Annual | 3-Month LIBOR, 1.18% | Quarterly | N/A | 01/09/51 | USD | 75,484 | 10,322,561 | 2,505 | 10,320,056 | ||||||||||||||||||||||
1.52% | Semi-Annual | 3-Month LIBOR, 1.18% | Quarterly | N/A | 01/09/51 | USD | 25,851 | 3,075,494 | 858 | 3,074,636 | ||||||||||||||||||||||
1.63% | Semi-Annual | 3-Month LIBOR, 1.18% | Quarterly | N/A | 01/25/51 | USD | 55,179 | 5,228,629 | 1,834 | 5,226,795 | ||||||||||||||||||||||
1.48% | Semi-Annual | 3-Month LIBOR, 1.18% | Quarterly | N/A | 01/30/51 | USD | 97,002 | 12,544,588 | 3,224 | 12,541,364 | ||||||||||||||||||||||
1.58% | Semi-Annual | 3-Month LIBOR, 1.18% | Quarterly | N/A | 02/01/51 | USD | 56,803 | 6,104,386 | 1,889 | 6,102,497 | ||||||||||||||||||||||
1.66% | Semi-Annual | 3-Month LIBOR, 1.18% | Quarterly | N/A | 02/06/51 | USD | 31,709 | 2,772,325 | 1,055 | 2,771,270 | ||||||||||||||||||||||
1.68% | Semi-Annual | 3-Month LIBOR, 1.18% | Quarterly | N/A | 02/06/51 | USD | 32,825 | 2,715,756 | 1,092 | 2,714,664 | ||||||||||||||||||||||
0.89% | Semi-Annual | 3-Month LIBOR, 1.18% | Quarterly | N/A | 02/10/51 | USD | 57,762 | 15,640,349 | 1,922 | 15,638,427 | ||||||||||||||||||||||
| 46 | 2 0 2 1 BLACK ROCK ANNUAL REPORT TO SHAREHOLDERS |
Consolidated Schedule of Investments (continued) April 30, 2021 | BlackRock Global Allocation Fund, Inc. |
Centrally Cleared Interest Rate Swaps (continued)
Paid by the Fund | Received by the Fund | Effective | Termination | Notional |
| Upfront Premium Paid | Unrealized Appreciation | |||||||||||||||||||||||||
| Rate | Frequency | Rate | Frequency | Date | Date | Amount (000) | Value | (Received) | (Depreciation) | |||||||||||||||||||||||
6-Month LIBOR, 0.20% | Quarterly | 1.24% | Semi-Annual | N/A | 02/10/51 | USD | 86,644 | $ | (16,273,997 | ) | $ | 2,883 | $ | (16,276,880 | ) | |||||||||||||||||
1.91% | Semi-Annual | 3-Month LIBOR, 1.18% | Quarterly | N/A | 02/22/51 | USD | 12,870 | 367,315 | 429 | 366,886 | ||||||||||||||||||||||
|
|
|
|
|
| |||||||||||||||||||||||||||
| $ | 38,028,561 | $ | 127,605 | $ | 37,900,956 | |||||||||||||||||||||||||||
|
|
|
|
|
| |||||||||||||||||||||||||||
| (a) | Forward Swap. |
OTC Credit Default Swaps — Buy Protection
| Reference Obligations/Index | Financing Rate Paid by the Fund | Payment Frequency | Counterparty | Termination Date | Notional Amount (000) | Value | Upfront Premium Paid (Received) | Unrealized Appreciation (Depreciation) | ||||||||||||||||
Bombardier Inc. | 5.00% | Quarterly | Barclays Bank PLC | 06/20/23 | USD | 8,698 | $ (415,105) | $ | 1,261,250 | $ | (1,676,355 | ) | ||||||||||||
|
|
|
|
| ||||||||||||||||||||
OTC Credit Default Swaps — Sell Protection
| Reference Obligation/Index | Financing Rate Received by the Fund | Payment Frequency | Counterparty | Termination Date | Credit Rating(a) | Notional Amount (000)(b) | Value | Upfront Premium Paid (Received) | Unrealized Appreciation (Depreciation) | |||||||||||||||||||||||||||
Bombardier Inc. | 5.00 | % | Quarterly | Barclays Bank PLC | 12/20/21 | CCC | USD | 13,050 | $ | 374,397 | $ | (652,500 | ) | $ | 1,026,897 | |||||||||||||||||||||
|
|
|
|
|
| |||||||||||||||||||||||||||||||
| (a) | Using the rating of the issuer or the underlying securities of the index, as applicable, provided by S&P Global Ratings. |
| (b) | The maximum potential amount the Fund may pay should a negative credit event take place as defined under the terms of the agreement. |
OTC Total Return Swaps — Future
| Reference Entity | Fixed Amount Paid by the Fund(a) | Counterparty | Termination Date | Notional Amount (000) | Value | Upfront Premium Paid (Received) | Unrealized Appreciation (Depreciation) | |||||||||||||||||
S&P 500 Index Annual Dividend Future December 2021 | USD | 7,937,925 | BNP Paribas S.A. | 12/17/21 | USD | 7,938 | $ | 1,700,400 | $ | — | | $ | 1,700,400 | |||||||||||
|
|
|
|
|
| |||||||||||||||||||
| (a) | At termination, the fixed amount paid (received) will be exchanged for the total return of the reference entity. |
CONSOLIDATED SCHEDULE OF INVESTMENTS | 47 |
Consolidated Schedule of Investments (continued) April 30, 2021 | BlackRock Global Allocation Fund, Inc. |
OTC Total Return Swaps
Paid by the Fund | Received by the Fund |
|
|
|
|
|
| Upfront Premium | Unrealized | |||||||||||||||||||||||||
| Rate/Reference | Frequency | Rate/Reference | Frequency | Counterparty | Effective Date | Termination Date | Notional Amount (000) | Value | Paid (Received) | Appreciation Depreciation | ||||||||||||||||||||||||
Markit iBoxx USD Liquid Leveraged, 0.00% | Quarterly | 3-Month LIBOR | Quarterly | Goldman Sachs International | N/A | 06/20/21 | USD | 14,855 | $ | (16,298 | ) | $ | — | $ | (16,298 | ) | ||||||||||||||||||
Markit iBoxx USD Liquid Leveraged, 0.00% | Quarterly | 3-Month LIBOR | Quarterly | Goldman Sachs International | N/A | 06/20/21 | USD | 16,016 | 17,735 | (166 | ) | 17,901 | ||||||||||||||||||||||
Markit iBoxx USD Liquid Leveraged, 0.00% | Quarterly | 3-Month LIBOR | Quarterly | Goldman Sachs International | N/A | 06/20/21 | USD | 32,952 | (90,426 | ) | (3,929 | ) | (86,497 | ) | ||||||||||||||||||||
Markit iBoxx USD Liquid Leveraged, 0.00% | Quarterly | 3-Month LIBOR | Quarterly | Goldman Sachs International | N/A | 06/20/21 | USD | 14,184 | (31,144 | ) | (2,132 | ) | (29,012 | ) | ||||||||||||||||||||
Markit iBoxx USD Liquid Leveraged, 0.00% | Quarterly | 3-Month LIBOR | Quarterly | Goldman Sachs International | N/A | 06/20/21 | USD | 19,361 | (47,822 | ) | (3,011 | ) | (44,811 | ) | ||||||||||||||||||||
SHELL: GSCBBL8X (GSCBBL8X), plus 0.10% 0.00% | Quarterly | 3-Month LIBOR | Quarterly | Goldman Sachs International | N/A | 02/22/22 | USD | 6,058 | (636,397 | ) | — | (636,397 | ) | |||||||||||||||||||||
|
|
|
|
|
| |||||||||||||||||||||||||||||
| $ | (804,352 | ) | $ | (9,238 | ) | $ | (795,114 | ) | ||||||||||||||||||||||||||
|
|
|
|
|
| |||||||||||||||||||||||||||||
OTC Total Return Swaps
| Reference Entity | Payment Frequency | Counterparty(a) | Termination Date | Net Notional | Accrued Unrealized Appreciation (Depreciation) | Net Value of Reference Entity | Gross Notional Amount Net Asset Percentage | |||||||||||||||
Equity Securities Long/Short | Monthly | Citibank N.A.(b) | 01/26/22 – 02/24/23 | $ | 14,544,692 | $ | (1,886,248 | )(c) | $ | 12,777,608 | 0.4 | % | ||||||||||
| Monthly | JPMorgan Chase Bank N.A.(d) | 02/08/23 | (47,072,516 | ) | (1,373,334 | )(e) | (48,311,780 | ) | 0.2 | |||||||||||||
|
|
|
| |||||||||||||||||||
| $ | (3,259,582 | ) | $ | (35,534,172 | ) | |||||||||||||||||
|
|
|
| |||||||||||||||||||
| (a) | The Fund receives the total return on a portfolio of long positions underlying the total return swap. The Fund pays the total return on a portfolio of short positions underlying the total return swap. In addition, the Fund pays or receives a variable rate of interest, based on a specified benchmark. The benchmark and spread are determined based upon the country and/or currency of the individual underlying positions. |
| (c) | Amount includes $(119,164) of net dividends and financing fees. |
| (e) | Amount includes $(134,070) of net dividends and financing fees. |
| The | following are the specified benchmarks (plus or minus a range) used in determining the variable rate of interest: |
| (b) | (d) | |||
| Range: | 5-175 basis points | 18-145 basis points | ||
| Benchmarks: | USD - 1M US Dollar LIBOR BBA | USD - 1D Overnight Bank Funding Rate (OBFR01) | ||
| USD - 1W US Dollar LIBOR BBA | USD - 1M US Dollar LIBOR BBA |
| 48 | 2 0 2 1 BLACK ROCK ANNUAL REPORT TO SHAREHOLDERS |
Consolidated Schedule of Investments (continued) April 30, 2021 | BlackRock Global Allocation Fund, Inc. |
The following table represents the individual long and short positions and related values of the equity securities underlying the total return swap with Citibank N.A. as of period end, termination dates January 26, 2022 and February 24, 2023:
| Security | Shares | Value | % of Basket Value | |||||||||
Reference Entity — Long |
| |||||||||||
| Common Stocks | ||||||||||||
| Italy | ||||||||||||
Leonardo SpA | 7,038,610 | $ | 57,491,959 | 449.9 | % | |||||||
|
|
|
| |||||||||
Total Reference Entity — Long |
| 57,491,959 | ||||||||||
|
| |||||||||||
Reference Entity — Short |
| |||||||||||
| Common Stocks | ||||||||||||
| Canada | ||||||||||||
Power Corp. Of Canada | (31,807 | ) | (926,405 | ) | (7.2 | ) | ||||||
|
|
|
| |||||||||
| China | ||||||||||||
BeiGene Ltd., ADR | (1,858 | ) | (638,297 | ) | (5.0 | ) | ||||||
China Conch Venture Holdings Ltd. | (453,000 | ) | (2,137,391 | ) | (16.7 | ) | ||||||
China Literature Ltd. | (33,200 | ) | (345,766 | ) | (2.7 | ) | ||||||
China Molybdenum Co. Ltd., Class H | (861,000 | ) | (581,568 | ) | (4.6 | ) | ||||||
China Vanke Co. Ltd., Class H | (251,900 | ) | (880,871 | ) | (6.9 | ) | ||||||
Cosco Shipping Holdings Co. Ltd., Class H | (173,000 | ) | (308,213 | ) | (2.4 | ) | ||||||
Gsx Techedu, Inc., ADR | (8,138 | ) | (260,009 | ) | (2.0 | ) | ||||||
Longfor Group Holdings Ltd. | (228,000 | ) | (1,416,215 | ) | (11.1 | ) | ||||||
Microport Scientific Corp. | (225,000 | ) | (1,622,456 | ) | (12.7 | ) | ||||||
Shanghai Fosun Pharmaceutical Group Co. Ltd., Class H | (178,000 | ) | (1,129,079 | ) | (8.9 | ) | ||||||
Travelsky Technology Ltd., Class H | (130,000 | ) | (284,431 | ) | (2.2 | ) | ||||||
Zijin Mining Group Co. Ltd., Class H | (502,000 | ) | (701,376 | ) | (5.5 | ) | ||||||
|
|
|
| |||||||||
| (10,305,672 | ) | |||||||||||
| Comoros | ||||||||||||
China Longyuan Power Group Corp. Ltd., Class H | (539,000 | ) | (792,616 | ) | (6.2 | ) | ||||||
Sunny Optical Tech | (27,100 | ) | (656,962 | ) | (5.1 | ) | ||||||
|
|
|
| |||||||||
| (1,449,578 | ) | |||||||||||
| Finland | ||||||||||||
Sampo Oyj, A Shares | (58,116 | ) | (2,756,710 | ) | (21.6 | ) | ||||||
|
|
|
| |||||||||
| France | ||||||||||||
Air Liquide Sa | (9,065 | ) | (1,527,083 | ) | (12.0 | ) | ||||||
Airbus SE | (15,117 | ) | (1,816,351 | ) | (14.2 | ) | ||||||
Bouygues SA | (16,807 | ) | (720,149 | ) | (5.6 | ) | ||||||
Vinci SA | (6,373 | ) | (700,301 | ) | (5.5 | ) | ||||||
|
|
|
| |||||||||
| (4,763,884 | ) | |||||||||||
| Hong Kong | ||||||||||||
China Resources Gas Group Ltd. | (90,000 | ) | (486,952 | ) | (3.8 | ) | ||||||
Sino Biopharmaceutical Ltd. | (591,000 | ) | (634,213 | ) | (5.0 | ) | ||||||
|
|
|
| |||||||||
| (1,121,165 | ) | |||||||||||
| Italy | ||||||||||||
Atlantia SpA | (43,742 | ) | (853,253 | ) | (6.7 | ) | ||||||
|
|
|
| |||||||||
| Japan | ||||||||||||
Vestas Wind Systems A/s | (39,821 | ) | (1,662,266 | ) | (13.0 | ) | ||||||
|
|
|
| |||||||||
| Security | Shares | Value | % of Basket Value | |||||||||
| South Korea | ||||||||||||
Celltrion Healthcare Co. Ltd. | (7,608 | ) | $ | (764,818 | ) | (6.0 | )% | |||||
Korea Shipbuilding & Offshore Engineering Co. Ltd. | (7,231 | ) | (997,850 | ) | (7.8 | ) | ||||||
|
|
|
| |||||||||
| (1,762,668 | ) | |||||||||||
| Spain | ||||||||||||
Grifols SA | (12,915 | ) | (349,818 | ) | (2.7 | ) | ||||||
|
|
|
| |||||||||
| Sweden | ||||||||||||
Telia Co. AB | (185,571 | ) | (768,102 | ) | (6.0 | ) | ||||||
|
|
|
| |||||||||
| Taiwan | ||||||||||||
E.sun Financial Holding Co. | (293,000 | ) | (282,689 | ) | (2.2 | ) | ||||||
|
|
|
| |||||||||
| United Kingdom | ||||||||||||
HSBC Holdings PLC | (214,808 | ) | (1,343,279 | ) | (10.5 | ) | ||||||
Prudential PLC | (87,218 | ) | (1,848,342 | ) | (14.5 | ) | ||||||
SSE PLC | (54,082 | ) | (1,096,448 | ) | (8.6 | ) | ||||||
Tesco PLC | (415,441 | ) | (1,267,975 | ) | (9.9 | ) | ||||||
|
|
|
| |||||||||
| (5,556,044 | ) | |||||||||||
| United States | ||||||||||||
Amerisourcebergen Corp. | (5,810 | ) | (701,848 | ) | (5.5 | ) | ||||||
Archer Daniels Midland Co. | (11,120 | ) | (702,006 | ) | (5.5 | ) | ||||||
Boeing Co. | (8,489 | ) | (1,989,058 | ) | (15.6 | ) | ||||||
Chipotle Mexican Grill, Inc. | (535 | ) | (798,236 | ) | (6.2 | ) | ||||||
Honeywell International, Inc. | (5,912 | ) | (1,318,612 | ) | (10.3 | ) | ||||||
Intercontinental Exchange, Inc. | (6,785 | ) | (798,662 | ) | (6.2 | ) | ||||||
Keurig Dr Pepper, Inc. | (48,677 | ) | (1,745,070 | ) | (13.7 | ) | ||||||
Liberty Broadband Corp. | (2,622 | ) | (413,411 | ) | (3.2 | ) | ||||||
Moderna, Inc. | (7,331 | ) | (1,310,929 | ) | (10.3 | ) | ||||||
Oracle Corp. | (14,497 | ) | (1,098,728 | ) | (8.6 | ) | ||||||
Paychex, Inc. | (4,230 | ) | (412,383 | ) | (3.2 | ) | ||||||
Simon Property Group, Inc. | (7,123 | ) | (867,154 | ) | (6.8 | ) | ||||||
|
|
|
| |||||||||
| (12,156,097 | ) | |||||||||||
|
| |||||||||||
Total Reference Entity — Short |
| (44,714,351 | ) | |||||||||
|
| |||||||||||
Net Value of Reference Entity — Citibank N.A. |
| $ | 12,777,608 | |||||||||
|
| |||||||||||
The following table represents the individual short positions and related values of the equity securities underlying the total return swap with JPMorgan Chase Bank N.A. as of period end, termination date February 8, 2023:
| Security | Shares | Value | % of Basket Value | |||||||||
Reference Entity — Short |
| |||||||||||
| Common Stocks | ||||||||||||
| Australia | ||||||||||||
Afterpay Ltd. | (10,210 | ) | $ | (919,568 | ) | 1.9 | % | |||||
Macquarie Group Ltd. | (2,397 | ) | (295,460 | ) | 0.6 | |||||||
National Australia Bank Ltd. | (25,972 | ) | (531,496 | ) | 1.1 | |||||||
Scentre Group | (135,481 | ) | (283,560 | ) | 0.6 | |||||||
Westpac Banking Corp. | (55,659 | ) | (1,072,586 | ) | 2.2 | |||||||
|
|
|
| |||||||||
| (3,102,670 | ) | |||||||||||
| Belgium | ||||||||||||
UCB SA | (7,559 | ) | (699,948 | ) | 1.5 | |||||||
|
|
|
| |||||||||
CONSOLIDATED SCHEDULE OF INVESTMENTS | 49 |
Consolidated Schedule of Investments (continued) April 30, 2021 | BlackRock Global Allocation Fund, Inc. |
| Security | Shares | Value | % of Basket Value | |||||||||
| Brazil | ||||||||||||
Hapvida Participacoes e Investimentos SA | (524,069 | ) | $ | (1,393,131 | ) | 2.9 | % | |||||
Raia Drogasil SA | (185,966 | ) | (900,379 | ) | 1.8 | |||||||
|
|
|
| |||||||||
| (2,293,510 | ) | |||||||||||
| Canada | ||||||||||||
Bank Of Montreal | (9,685 | ) | (914,092 | ) | 1.9 | |||||||
Canadian Pacific Railway Ltd. | (2,228 | ) | (831,474 | ) | 1.7 | |||||||
Pembina Pipeline Corp. | (20,197 | ) | (623,418 | ) | 1.3 | |||||||
Shaw Communications, Inc., Class B | (96,634 | ) | (2,798,821 | ) | 5.8 | |||||||
|
|
|
| |||||||||
| (5,167,805 | ) | |||||||||||
| China | ||||||||||||
China Southern Airlines Co. Ltd., Class H | (1,358,000 | ) | (919,608 | ) | 1.9 | |||||||
Chocoladefabriken Lindt & Spruengli AG | (196 | ) | (1,817,815 | ) | 3.8 | |||||||
Credit Suisse Group AG | (554,913 | ) | (6 | ) | 0.0 | |||||||
Credit Suisse Group AG | (554,913 | ) | (5,800,383 | ) | 12.0 | |||||||
Great Wall Motor Co. Ltd., Class H | (330,500 | ) | (820,490 | ) | 1.7 | |||||||
Innovent Biologics, Inc. | (48,000 | ) | (520,646 | ) | 1.1 | |||||||
iQIYI, Inc., ADR | (92,340 | ) | (1,358,321 | ) | 2.8 | |||||||
Shenzhou International Group Holdings Ltd. | (22,300 | ) | (490,578 | ) | 1.0 | |||||||
|
|
|
| |||||||||
| (11,727,847 | ) | |||||||||||
| Comoros | ||||||||||||
Fuyao Glass Industry Group Co. Ltd., Class H | (80,000 | ) | (463,156 | ) | 1.0 | |||||||
GDS Holdings Ltd. ADR | (8,882 | ) | (736,940 | ) | 1.5 | |||||||
Kunlun Energy Co. Ltd. | (426,000 | ) | (455,493 | ) | 0.9 | |||||||
Ping An Healthcare and Technology Co. Ltd. | (29,400 | ) | (343,035 | ) | 0.7 | |||||||
Shandong Gold Mining Co. Ltd. | (338,750 | ) | (618,585 | ) | 1.3 | |||||||
Tencent Music Entertainment Group, ADR | (41,070 | ) | (715,440 | ) | 1.5 | |||||||
Weibo Corp., ADR | (6,166 | ) | (310,766 | ) | 0.6 | |||||||
Zai Lab Ltd. ADR | (1,354 | ) | (225,048 | ) | 0.5 | |||||||
|
|
|
| |||||||||
| (3,868,463 | ) | |||||||||||
| Hong Kong | ||||||||||||
Geely Automobile Holdings Ltd. | (335,000 | ) | (872,572 | ) | 1.8 | |||||||
Link REIT | (59,838 | ) | (564,455 | ) | 1.2 | |||||||
Shimano, Inc. | (5,600 | ) | (1,282,789 | ) | 2.6 | |||||||
|
|
|
| |||||||||
| (2,719,816 | ) | |||||||||||
| Japan | ||||||||||||
Chugai Pharmaceutical Co. Ltd. | (13,100 | ) | (491,565 | ) | 1.0 | |||||||
Nippon Paint Holdings Co. Ltd. | (21,000 | ) | (300,137 | ) | 0.6 | |||||||
ORIX Corp. | (37,600 | ) | (604,648 | ) | 1.3 | |||||||
| Security | Shares | Value | % of Basket Value | |||||||||
| Japan (continued) | ||||||||||||
Secom Co. Ltd. | (9,500 | ) | $ | (788,929 | ) | 1.6 | % | |||||
Seven & i Holdings Co. Ltd. | (10,100 | ) | (434,257 | ) | 0.9 | |||||||
Softbank Group Corp. | (10,800 | ) | (976,832 | ) | 2.0 | |||||||
Sysmex Corp. | (2,700 | ) | (269,901 | ) | 0.6 | |||||||
|
|
|
| |||||||||
| (3,866,269 | ) | |||||||||||
| Mexico | ||||||||||||
Walmart De Mexico Sab De Cv | (200,928 | ) | (657,725 | ) | 1.4 | |||||||
|
|
|
| |||||||||
| South Africa | ||||||||||||
Capitec Bank Holdings Ltd. | (11,475 | ) | (1,176,103 | ) | 2.4 | |||||||
|
|
|
| |||||||||
| South Korea | ||||||||||||
Amorepacific Group | (1,070 | ) | (43,287 | ) | 0.1 | |||||||
Samsung C&T Corp. | (2,344 | ) | (286,586 | ) | 0.6 | |||||||
|
|
|
| |||||||||
| (329,873 | ) | |||||||||||
| Spain | ||||||||||||
Aena SME SA | (5,358 | ) | (931,197 | ) | 1.9 | |||||||
|
|
|
| |||||||||
| Switzerland | ||||||||||||
Schindler Holding AG | (4,428 | ) | (1,259,671 | ) | 2.6 | |||||||
|
|
|
| |||||||||
| United Kingdom | ||||||||||||
Aviva PLC | (127,145 | ) | (702,901 | ) | 1.5 | |||||||
|
|
|
| |||||||||
| United States | ||||||||||||
Allstate Corp. | (4,758 | ) | (603,315 | ) | 1.3 | |||||||
AvalonBay Communities, Inc. | (2,876 | ) | (552,192 | ) | 1.2 | |||||||
General Dynamics Corp. | (9,966 | ) | (1,895,832 | ) | 3.9 | |||||||
General Motors Co. | (6,926 | ) | (396,306 | ) | 0.8 | |||||||
Hershey Co. | (7,765 | ) | (1,275,790 | ) | 2.6 | |||||||
Liberty Broadband Corp., Class C | (8,403 | ) | (1,367,336 | ) | 2.8 | |||||||
Mondelez International, Inc., Class A | (10,388 | ) | (631,694 | ) | 1.3 | |||||||
Norfolk Southern Corp. | (4,364 | ) | (1,218,603 | ) | 2.5 | |||||||
Roper Technologies, Inc. | (3,209 | ) | (1,432,626 | ) | 3.0 | |||||||
Xcel Energy, Inc. | (6,091 | ) | (434,288 | ) | 0.9 | |||||||
|
|
|
| |||||||||
| (9,807,982 | ) | |||||||||||
|
| |||||||||||
| (48,311,780 | ) | |||||||||||
|
| |||||||||||
Net Value of Reference Entity — JPMorgan Chase Bank N.A |
| $ | (48,311,780 | ) | ||||||||
|
| |||||||||||
Balances Reported in the Consolidated Statement of Assets and Liabilities for Centrally Cleared Swaps, OTC Swaps and Options Written
| Description | Swap Premiums Paid | Swap Premiums Received | Unrealized Appreciation | Unrealized Depreciation | Value | |||||||||||||||
Centrally Cleared Swaps(a) | $ | 8,247,079 | $ | (16,872,993 | ) | $ | 192,089,883 | $ | (166,130,456 | ) | $ | — | ||||||||
OTC Swaps | 1,261,250 | (661,738 | ) | 2,745,198 | (5,748,952 | ) | — | |||||||||||||
Options Written | N/A | N/A | 34,486,930 | (45,948,541 | ) | (103,248,986 | ) | |||||||||||||
| (a) | Includes cumulative appreciation (depreciation) on centrally cleared swaps, as reported in the Consolidated Schedule of Investments. Only current day’s variation margin is reported within the Consolidated Statement of Assets and Liabilities and is net of any previously paid (received) swap premium amounts. |
| 50 | 2 0 2 1 BLACK ROCK ANNUAL REPORT TO SHAREHOLDERS |
Consolidated Schedule of Investments (continued) April 30, 2021 | BlackRock Global Allocation Fund, Inc. |
Derivative Financial Instruments Categorized by Risk Exposure
As of period end, the fair values of derivative financial instruments located in the Consolidated Statement of Assets and Liabilities were as follows:
| Commodity Contracts | Credit Contracts | Equity Contracts | Foreign Currency Exchange Contracts | Interest Rate Contracts | Other Contracts | Total | ||||||||||||||||||||||
| Assets — Derivative Financial Instruments | ||||||||||||||||||||||||||||
Futures contracts | ||||||||||||||||||||||||||||
Unrealized appreciation on futures contracts(a) | $ | 880,394 | $ | — | $ | 9,643,787 | $ | — | $ | 2,869,004 | $ | — | $ | 13,393,185 | ||||||||||||||
Forward foreign currency exchange contracts | ||||||||||||||||||||||||||||
Unrealized appreciation on forward foreign currency exchange contracts | — | — | — | 14,169,655 | — | — | 14,169,655 | |||||||||||||||||||||
Options purchased | ||||||||||||||||||||||||||||
Investments at value — unaffiliated(b) | — | 14,677 | 133,128,755 | 2,684,258 | 62,710,750 | — | 198,538,440 | |||||||||||||||||||||
Swaps — centrally cleared | ||||||||||||||||||||||||||||
Unrealized appreciation on centrally cleared swaps(a) | — | 5,164,698 | — | — | 186,925,185 | — | 192,089,883 | |||||||||||||||||||||
Swaps — OTC | ||||||||||||||||||||||||||||
Unrealized appreciation on OTC swaps; Swap premiums paid | — | 2,288,147 | 1,700,400 | — | 17,901 | — | 4,006,448 | |||||||||||||||||||||
|
|
|
|
|
|
|
|
|
|
|
|
|
| |||||||||||||||
| $ | 880,394 | $ | 7,467,522 | $ | 144,472,942 | $ | 16,853,913 | $ | 252,522,840 | $ | — | $ | 422,197,611 | |||||||||||||||
|
|
|
|
|
|
|
|
|
|
|
|
|
| |||||||||||||||
| Liabilities — Derivative Financial Instruments | ||||||||||||||||||||||||||||
Futures contracts | ||||||||||||||||||||||||||||
Unrealized depreciation on futures contracts(a) | $ | — | $ | — | $ | 129,507,257 | $ | — | $ | 9,346,125 | $ | — | $ | 138,853,382 | ||||||||||||||
Forward foreign currency exchange contracts | ||||||||||||||||||||||||||||
Unrealized depreciation on forward foreign currency exchange contracts | — | — | — | 39,565,128 | — | — | 39,565,128 | |||||||||||||||||||||
Options written | ||||||||||||||||||||||||||||
Options written at value | — | 6,970 | 67,094,745 | 581,272 | 35,565,999 | — | 103,248,986 | |||||||||||||||||||||
Swaps — centrally cleared | ||||||||||||||||||||||||||||
Unrealized depreciation on centrally cleared swaps(a) | — | 17,106,227 | — | — | 149,024,229 | — | 166,130,456 | |||||||||||||||||||||
Swaps — OTC | ||||||||||||||||||||||||||||
Unrealized depreciation on OTC swaps; Swap premiums received | — | 2,328,855 | 3,895,979 | — | 185,856 | — | 6,410,690 | |||||||||||||||||||||
|
|
|
|
|
|
|
|
|
|
|
|
|
| |||||||||||||||
| $ | — | $ | 19,442,052 | $ | 200,497,981 | $ | 40,146,400 | $ | 194,122,209 | $ | — | $ | 454,208,642 | |||||||||||||||
|
|
|
|
|
|
|
|
|
|
|
|
|
| |||||||||||||||
| (a) | Net cumulative unrealized appreciation (depreciation) on futures contracts and centrally cleared swaps, if any, are reported in the Consolidated Schedule of Investments. In the Consolidated Statement of Assets and Liabilities, only current day’s variation margin is reported in receivables or payables and the net cumulative unrealized appreciation (depreciation) is included in accumulated earnings (loss). |
| (b) | Includes options purchased at value as reported in the Consolidated Schedule of Investments. |
For the period ended April 30, 2021, the effect of derivative financial instruments in the Consolidated Statement of Operations was as follows:
| Commodity Contracts | Credit Contracts | Equity Contracts | Foreign Currency Exchange Contracts | Interest Rate Contracts | Other Contracts | Total | ||||||||||||||||||||||
| Net Realized Gain (Loss) from | ||||||||||||||||||||||||||||
Futures contracts | $ | 3,791,223 | $ | — | $ | (486,395,378 | ) | $ | — | $ | (88,152,081 | ) | $ | 32,832,856 | $ | (537,923,380 | ) | |||||||||||
Forward foreign currency exchange contracts | — | — | — | (12,937,790 | ) | — | — | (12,937,790 | ) | |||||||||||||||||||
Options purchased(a) | — | (167,453 | ) | 14,981,082 | (18,863,536 | ) | (29,176,246 | ) | (668,604 | ) | (33,894,757 | ) | ||||||||||||||||
Options written | — | 49,467 | 151,405,288 | 5,692,479 | 16,902,743 | — | 174,049,977 | |||||||||||||||||||||
Swaps | — | (10,310,952 | ) | 23,894,259 | — | (6,092,827 | ) | — | 7,490,480 | |||||||||||||||||||
|
|
|
|
|
|
|
|
|
|
|
|
|
| |||||||||||||||
| $ | 3,791,223 | $ | (10,428,938 | ) | $ | (296,114,749 | ) | $ | (26,108,847 | ) | $ | (106,518,411 | ) | $ | 32,164,252 | $ | (403,215,470 | ) | ||||||||||
|
|
|
|
|
|
|
|
|
|
|
|
|
| |||||||||||||||
| Net Change in Unrealized Appreciation (Depreciation) on | ||||||||||||||||||||||||||||
Futures contracts | $ | 880,394 | $ | — | $ | (172,815,852 | ) | $ | — | $ | (6,980,465 | ) | $ | — | $ | (178,915,923 | ) | |||||||||||
Forward foreign currency exchange contracts | — | — | — | (31,934,155 | ) | — | — | (31,934,155 | ) | |||||||||||||||||||
Options purchased(b) | — | (38,722 | ) | 86,339,762 | 1,802,770 | 19,622,633 | — | | 107,726,443 | | ||||||||||||||||||
CONSOLIDATED SCHEDULE OF INVESTMENTS | 51 |
Consolidated Schedule of Investments (continued) April 30, 2021 | BlackRock Global Allocation Fund, Inc. |
| Commodity Contracts | Credit Contracts | Equity Contracts | Foreign Currency Exchange Contracts | Interest Rate Contracts | Other Contracts | Total | ||||||||||||||||||||||
Options written | $ | — | $ | 15,580 | $ | (22,069,989 | ) | $ | 628,920 | $ | (7,230,565 | ) | $ | — | $ | (28,656,054) | ||||||||||||
Swaps | — | (13,079,353 | ) | 6,372,917 | — | 67,004,193 | — | 60,297,757 | ||||||||||||||||||||
|
|
|
|
|
|
|
|
|
|
|
|
|
| |||||||||||||||
| $ | 880,394 | $ | (13,102,495) | $ | (102,173,162) | $ | (29,502,465) | $ | 72,415,796 | $ | — | $ | (71,481,932) | |||||||||||||||
|
|
|
|
|
|
|
|
|
|
|
|
|
| |||||||||||||||
| (a) | Options purchased are included in net realized gain (loss) from investments — unaffiliated. |
| (b) | Options purchased are included in net change in unrealized appreciation (depreciation) on investments — unaffiliated. |
Average Quarterly Balances of Outstanding Derivative Financial Instruments
Futures contracts | ||||
Average notional value of contracts — long | $ | 2,075,198,119 | ||
Average notional value of contracts — short | $ | 6,323,783,537 | ||
Forward foreign currency exchange contracts | ||||
Average amounts purchased — in USD | $ | 3,160,279,334 | ||
Average amounts sold — in USD | $ | 1,610,238,189 | ||
Options | ||||
Average value of option contracts purchased | $ | 125,783,012 | ||
Average value of option contracts written | $ | 65,902,678 | ||
Average notional value of swaption contracts purchased | $ | 4,661,563,146 | ||
Average notional value of swaption contracts written | $ | 3,419,611,150 | ||
Credit default swaps | ||||
Average notional value — buy protection. | $ | 1,129,910,187 | ||
Average notional value — sell protection | $ | 98,664,886 | ||
Interest rate swaps | ||||
Average notional value — pays fixed rate | $ | 4,474,434,867 | ||
Average notional value — receives fixed rate | $ | 2,892,268,060 | ||
Total return swaps | ||||
Average notional value | $ | 82,640,801 |
For more information about the Fund’s investment risks regarding derivative financial instruments, refer to the Notes to Consolidated Financial Statements.
Derivative Financial Instruments — Offsetting as of Period End
The Fund’s derivative assets and liabilities (by type) were as follows:
| Assets | Liabilities | |||||||
Derivative Financial Instruments | ||||||||
Futures contracts | $ | 22,688,312 | $ | 6,614,115 | ||||
Forward foreign currency exchange contracts | 14,169,655 | 39,565,128 | ||||||
Options | 198,538,440 | (a) | 103,248,986 | |||||
Swaps — centrally cleared | — | 1,301,977 | ||||||
Swaps — OTC(b) | 4,006,448 | 6,410,690 | ||||||
|
|
|
| |||||
Total derivative assets and liabilities in the Consolidated Statement of Assets and Liabilities | 239,402,855 | 157,140,896 | ||||||
|
|
|
| |||||
Derivatives not subject to a Master Netting Agreement or similar agreement (“MNA”) | (111,455,700 | ) | (67,512,143 | ) | ||||
|
|
|
| |||||
Total derivative assets and liabilities subject to an MNA | $ | 127,947,155 | $ | 89,628,753 | ||||
|
|
|
| |||||
| (a) | Includes options purchased at value which is included in Investments at value — unaffiliated in the Consolidated Statement of Assets and Liabilities and reported in the Consolidated Schedule of Investments. |
| (b) | Includes unrealized appreciation (depreciation) on OTC swaps and swap premiums (paid/received) in the Consolidated Statement of Assets and Liabilities. |
The following table presents the Fund’s derivative assets and liabilities by counterparty net of amounts available for offset under an MNA and net of the related collateral received (and pledged) by the Fund:
| Counterparty | | Derivative Assets Subject to an MNA by Counterparty | | | Derivatives Available for Offset | (a) | | Non-Cash Collateral Received | | | Cash Collateral Received | (b) | | Net Amount of Derivative Assets | (c)(d) | |||||
Bank of America N.A | $ | 2,905,831 | $ | (1,280,052 | ) | $ | — | $ | (240,000 | ) | $ | 1,385,779 | ||||||||
Barclays Bank PLC | 2,774,359 | (2,774,359 | ) | — | — | — |
| 52 | 2 0 2 1 BLACK ROCK ANNUAL REPORT TO SHAREHOLDERS |
Consolidated Schedule of Investments (continued) April 30, 2021 | BlackRock Global Allocation Fund, Inc. |
| Counterparty | | Derivative Assets Subject to an MNA by Counterparty | | | Derivatives Available for Offset | (a) | | Non-Cash Collateral Received | | | Cash Collateral Received | (b) | | Net Amount of Derivative Assets | (c)(d) | |||||
BNP Paribas S.A | $ | 4,635,385 | $ | (4,635,385 | ) | $ | — | $ | — | $ | — | |||||||||
Citibank N.A | 3,280,418 | (3,280,418 | ) | — | — | — | ||||||||||||||
Credit Suisse International | 3,107,621 | (1,908,578 | ) | — | (1,199,043 | ) | — | |||||||||||||
Deutsche Bank AG | 12,438,757 | (1,409,606 | ) | — | (11,029,151 | ) | — | |||||||||||||
Goldman Sachs International | 24,184,696 | (23,961,068 | ) | — | — | 223,628 | ||||||||||||||
HSBC Bank USA N.A | 483,531 | (483,531 | ) | — | — | — | ||||||||||||||
JPMorgan Chase Bank N.A | 9,543,365 | (9,543,365 | ) | — | — | — | ||||||||||||||
Morgan Stanley & Co. International PLC | 54,311,659 | (12,814,965 | ) | — | (41,496,694 | ) | — | |||||||||||||
Nomura International PLC | 9,292,152 | (929,801 | ) | — | (8,362,351 | ) | — | |||||||||||||
Societe Generale | 171,393 | (109,286 | ) | — | — | 62,107 | ||||||||||||||
UBS AG | 817,988 | (817,988 | ) | — | — | — | ||||||||||||||
|
|
|
|
|
|
|
|
|
| |||||||||||
| $ | 127,947,155 | $ | (63,948,402 | ) | $ | — | $ | (62,327,239 | ) | $ | 1,671,514 | |||||||||
|
|
|
|
|
|
|
|
|
| |||||||||||
| ||||||||||||||||||||
| Counterparty | | Derivative Liabilities Subject to an MNA by | | | Derivatives Available for Offset | (a) | | Non-Cash Collateral Pledged | (e) | | Cash Collateral Pledged | | | Net Amount of Derivative | | |||||
Bank of America N.A | $ | 1,280,052 | $ | (1,280,052 | ) | $ | — | $ | — | $ | — | |||||||||
Barclays Bank PLC | 9,744,049 | (2,774,359 | ) | — | — | 6,969,690 | ||||||||||||||
BNP Paribas S.A | 9,168,524 | (4,635,385 | ) | (2,701,026 | ) | — | 1,832,113 | |||||||||||||
Citibank N.A | 8,905,028 | (3,280,418 | ) | (5,624,610 | ) | — | — | |||||||||||||
Credit Suisse International | 1,908,578 | (1,908,578 | ) | — | — | — | ||||||||||||||
Deutsche Bank AG | 1,409,606 | (1,409,606 | ) | — | — | — | ||||||||||||||
Goldman Sachs International | 23,961,068 | (23,961,068 | ) | — | — | — | ||||||||||||||
HSBC Bank USA N.A | 5,315,408 | (483,531 | ) | — | — | 4,831,877 | ||||||||||||||
JPMorgan Chase Bank N.A | 11,858,398 | (9,543,365 | ) | (200,073 | ) | — | 2,114,960 | |||||||||||||
Morgan Stanley & Co. International PLC | 12,814,965 | (12,814,965 | ) | — | — | — | ||||||||||||||
Nomura International PLC | 929,801 | (929,801 | ) | — | — | — | ||||||||||||||
Societe Generale | 109,286 | (109,286 | ) | — | — | — | ||||||||||||||
UBS AG | 2,223,990 | (817,988 | ) | — | — | 1,406,002 | ||||||||||||||
|
|
|
|
|
|
|
|
|
| |||||||||||
| $ | 89,628,753 | $ | (63,948,402 | ) | $ | (8,525,709 | ) | $ | — | $ | 17,154,642 | |||||||||
|
|
|
|
|
|
|
|
|
|
| (a) | The amount of derivatives available for offset is limited to the amount of derivative asset and/or liabilities that are subject to an MNA. |
| (b) | Excess of collateral received from the individual counterparty is not shown for financial reporting purposes. |
| (c) | Net amount may also include forward foreign currency exchange contracts that are not required to be collateralized. |
| (d) | Net amount represents the net amount receivable from the counterparty in the event of default. |
| (e) | Net amount represents the net amount payable due to counterparty in the event of default. Net amount may be offset further by the options written receivable/payable on the Consolidated Statement of Assets and Liabilities. |
Fair Value Hierarchy as of Period End
Various inputs are used in determining the fair value of financial instruments. For a description of the input levels and information about the Fund’s policy regarding valuation of financial instruments, refer to the Notes to Consolidated Financial Statements.
The following tables summarize the Fund’s financial instruments categorized in the fair value hierarchy. The breakdown of the Fund’s investments into major categories is disclosed in the Consolidated Schedule of Investments above.
| Level 1 | Level 2 | Level 3 | Total | |||||||||||||
Assets | ||||||||||||||||
Investments | ||||||||||||||||
Long-Term Investments | ||||||||||||||||
Asset-Backed Securities | $ | — | $ | 283,367,191 | $ | 7,384,374 | $ | 290,751,565 | ||||||||
Common Stocks | ||||||||||||||||
Argentina | 97,252,485 | — | — | 97,252,485 | ||||||||||||
Australia | — | 22,665,125 | 37,734,907 | 60,400,032 | ||||||||||||
Belgium | — | 594,251 | — | 594,251 | ||||||||||||
Brazil | 26,934,952 | — | — | 26,934,952 | ||||||||||||
CONSOLIDATED SCHEDULE OF INVESTMENTS | 53 |
Consolidated Schedule of Investments (continued) April 30, 2021 | BlackRock Global Allocation Fund, Inc. |
Fair Value Hierarchy as of Period End (continued)
| Level 1 | Level 2 | Level 3 | Total | |||||||||||||
Common Stocks (continued) | ||||||||||||||||
Canada | $ | 264,321,180 | $ | — | $ | — | $ | 264,321,180 | ||||||||
Cayman Islands | 72,244,022 | — | — | 72,244,022 | ||||||||||||
Chile | 2,385,219 | — | — | 2,385,219 | ||||||||||||
China | 144,858,358 | 491,705,297 | — | 636,563,655 | ||||||||||||
Denmark | — | 61,518,445 | — | 61,518,445 | ||||||||||||
Finland | — | 63,425,127 | — | 63,425,127 | ||||||||||||
France | — | 941,758,719 | — | 941,758,719 | ||||||||||||
Germany | 107,584,649 | 732,363,516 | — | 839,948,165 | ||||||||||||
Hong Kong | — | 198,014,812 | 236,825 | 198,251,637 | ||||||||||||
India | — | 57,898,372 | 18,327,475 | 76,225,847 | ||||||||||||
Indonesia | — | 7,569,952 | — | 7,569,952 | ||||||||||||
Ireland | 109,773,932 | 25,948,603 | — | 135,722,535 | ||||||||||||
Israel | 62,819,416 | — | — | 62,819,416 | ||||||||||||
Italy | — | 471,069,582 | — | 471,069,582 | ||||||||||||
Japan | — | 465,615,543 | — | 465,615,543 | ||||||||||||
Luxembourg | — | 15,156,955 | — | 15,156,955 | ||||||||||||
Mexico | 743,775 | — | — | 743,775 | ||||||||||||
Netherlands | 103,209,006 | 537,683,173 | — | 640,892,179 | ||||||||||||
Norway | 3,654,046 | — | — | 3,654,046 | ||||||||||||
Poland | 12,237,981 | 664,700 | — | 12,902,681 | ||||||||||||
Portugal | 5,093,247 | — | — | 5,093,247 | ||||||||||||
Saudi Arabia | — | 287,219 | — | 287,219 | ||||||||||||
Singapore | 20,061,777 | 17,332,652 | — | 37,394,429 | ||||||||||||
South Africa | — | 2,452,594 | — | 2,452,594 | ||||||||||||
South Korea | — | 150,138,745 | — | 150,138,745 | ||||||||||||
Spain | — | 103,443,310 | — | 103,443,310 | ||||||||||||
Sweden | — | 265,101,898 | — | 265,101,898 | ||||||||||||
Switzerland | 12,041,947 | 121,566,635 | — | 133,608,582 | ||||||||||||
Taiwan | — | 301,487,612 | — | 301,487,612 | ||||||||||||
Thailand | 5,695,170 | 1,763,240 | — | 7,458,410 | ||||||||||||
Turkey | 517,093 | — | — | 517,093 | ||||||||||||
United Arab Emirates | — | — | 30 | 30 | ||||||||||||
United Kingdom | 59,405,722 | 715,412,317 | — | 774,818,039 | ||||||||||||
United States | 11,568,864,200 | 293,976,872 | 66,525,776 | 11,929,366,848 | ||||||||||||
Corporate Bonds | — | 1,563,084,590 | 278,587,862 | 1,841,672,452 | ||||||||||||
Floating Rate Loan Interests | — | 450,963,143 | 198,447,991 | 649,411,134 | ||||||||||||
Foreign Agency Obligations | — | 2,167,403,531 | — | 2,167,403,531 | ||||||||||||
Investment Companies | 1,372,929,616 | — | — | 1,372,929,616 | ||||||||||||
Municipal Bonds | — | 35,247,356 | — | 35,247,356 | ||||||||||||
Non-Agency Mortgage-Backed Securities | — | 353,696,948 | 52,411,541 | 406,108,489 | ||||||||||||
Other Interests | — | — | 25,501,528 | 25,501,528 | ||||||||||||
Preferred Securities | ||||||||||||||||
Capital Trusts | — | 62,946,579 | — | 62,946,579 | ||||||||||||
Preferred Stocks | ||||||||||||||||
Brazil | 5,053,736 | — | 10,606,608 | 15,660,344 | ||||||||||||
Germany | — | 25,292,650 | 22,520,098 | 47,812,748 | ||||||||||||
United States | 60,171,107 | 53,899,750 | 322,669,115 | 436,739,972 | ||||||||||||
India | — | — | 12,967,009 | 12,967,009 | ||||||||||||
United Kingdom | — | — | 15,644,898 | 15,644,898 | ||||||||||||
Trust Preferreds | 43,189,016 | — | — | 43,189,016 | ||||||||||||
U.S. Government Sponsored Agency Securities | — | 21,313,416 | — | 21,313,416 | ||||||||||||
U.S. Treasury Obligations | — | 1,120,786,475 | — | 1,120,786,475 | ||||||||||||
Warrants | ||||||||||||||||
Brazil | — | — | 103,903 | 103,903 | ||||||||||||
Cayman Islands | 835,747 | — | — | 835,747 | ||||||||||||
Switzerland | 1,988 | — | — | 1,988 | ||||||||||||
United States | 947,482 | 24,330,732 | 1,835,693 | 27,113,907 | ||||||||||||
Short-Term Securities | ||||||||||||||||
Money Market Funds | 182,812,980 | — | — | 182,812,980 | ||||||||||||
Time Deposits | — | 76,608,752 | — | 76,608,752 | ||||||||||||
U.S. Treasury Obligations | — | 179,999,606 | — | 179,999,606 | ||||||||||||
| 54 | 2 0 2 1 BLACK ROCK ANNUAL REPORT TO SHAREHOLDERS |
Consolidated Schedule of Investments (continued) April 30, 2021 | BlackRock Global Allocation Fund, Inc. |
Fair Value Hierarchy as of Period End (continued)
| Level 1 | Level 2 | Level 3 | Total | |||||||||||||
Options Purchased | ||||||||||||||||
Credit Contracts | $ | — | $ | 14,677 | $ | — | $ | 14,677 | ||||||||
Equity Contracts | 86,315,143 | 46,813,612 | — | 133,128,755 | ||||||||||||
Foreign Currency Exchange Contracts | — | 2,684,258 | — | 2,684,258 | ||||||||||||
Interest Rate Contracts | 756,906 | 61,953,844 | — | 62,710,750 | ||||||||||||
Unfunded Floating Rate Loan Interests(a) | — | — | — | — | ||||||||||||
Liabilities | ||||||||||||||||
Investments | ||||||||||||||||
Investments Sold Short | ||||||||||||||||
Common Stocks | (188,828,660 | ) | — | — | (188,828,660 | ) | ||||||||||
|
|
|
|
|
|
|
| |||||||||
| $ | 14,243,883,238 | $ | 12,597,022,376 | $ | 1,071,505,633 | $ | 27,912,411,247 | |||||||||
|
|
|
|
|
|
|
| |||||||||
Derivative Financial Instruments(b) | ||||||||||||||||
Assets | ||||||||||||||||
Commodity Contracts. | $ | 880,394 | $ | — | $ | — | $ | 880,394 | ||||||||
Credit Contracts | — | 6,191,595 | — | 6,191,595 | ||||||||||||
Equity Contracts | 9,643,787 | 1,700,400 | — | 11,344,187 | ||||||||||||
Foreign Currency Exchange Contracts | — | 14,169,655 | — | 14,169,655 | ||||||||||||
Interest Rate Contracts | 2,869,004 | 186,943,086 | — | 189,812,090 | ||||||||||||
Liabilities | ||||||||||||||||
Credit Contracts | — | (18,789,552 | ) | — | (18,789,552 | ) | ||||||||||
Equity Contracts | (188,420,808 | ) | (12,077,173 | ) | — | (200,497,981 | ) | |||||||||
Foreign Currency Exchange Contracts | — | (40,146,400 | ) | — | (40,146,400 | ) | ||||||||||
Interest Rate Contracts | (9,745,188 | ) | (184,367,783 | ) | — | (194,112,971 | ) | |||||||||
|
|
|
|
|
|
|
| |||||||||
| $ | (184,772,811 | ) | $ | (46,376,172 | ) | $ | — | $ | (231,148,983 | ) | ||||||
|
|
|
|
|
|
|
| |||||||||
| (a) | Unfunded floating rate loan interests are valued at the unrealized appreciation (depreciation) on the commitment. |
| (b) | Derivative financial instruments are swaps, futures contracts, forward foreign currency exchange contracts and options written. Swaps, futures contracts and forward foreign currency exchange contracts are valued at the unrealized appreciation (depreciation) on the instrument and options written are shown at value. |
A reconciliation of Level 3 financial instruments is presented when the Fund had a significant amount of Level 3 investments at the beginning and/or end of the period in relation to net assets. The following table is a reconciliation of Level 3 investments for which significant unobservable inputs were used in determining fair value:
| Asset-Backed Securities | Common Stocks | Corporate Bonds | Floating Rate Loan Interests | Non-Agency Mortgage-Backed Securities | Other Interests | Preferred Stocks | Warrants | Total | ||||||||||||||||||||||||||||
Assets | ||||||||||||||||||||||||||||||||||||
Opening balance, as of October 31, 2020 | $ | 910,739 | $ | 60,663,099 | $ | 178,551,055 | $ | 95,288,584 | $ | — | $ | — | $ | 240,659,572 | $ | 922,133 | $ | 576,995,182 | ||||||||||||||||||
Transfers into Level 3 | — | 2,757,097 | — | 32,552,207 | — | — | — | — | 35,309,304 | |||||||||||||||||||||||||||
Transfers out of Level 3 | — | — | — | (31,592,648 | ) | — | — | (61,825,975 | ) | — | (93,418,623 | ) | ||||||||||||||||||||||||
Accrued discounts/premiums | (27 | ) | — | (139,362 | ) | 243,998 | — | — | — | — | 104,609 | |||||||||||||||||||||||||
Net realized gain (loss) | — | (635,409 | ) | — | 233,857 | — | — | 8,177,286 | — | 7,775,734 | ||||||||||||||||||||||||||
Net change in unrealized appreciation (depreciation)(a)(b) | 20,212 | 24,998,428 | 73,870 | 2,594,216 | 60 | 4,030,201 | 74,486,724 | 510,936 | 106,714,647 | |||||||||||||||||||||||||||
Purchases | 6,453,450 | 38,196,779 | 100,102,299 | 115,326,013 | 52,411,481 | 21,471,327 | 136,373,420 | 506,527 | 470,841,296 | |||||||||||||||||||||||||||
Sales | — | (3,154,981 | ) | — | (16,198,236 | ) | — | — | (13,463,299 | ) | — | (32,816,516 | ) | |||||||||||||||||||||||
|
|
|
|
|
|
|
|
|
|
|
|
|
|
|
|
|
| |||||||||||||||||||
Closing balance, as of April 30, 2021 | $ | 7,384,374 | $ | 122,825,013 | $ | 278,587,862 | $ | 198,447,991 | $ | 52,411,541 | $ | 25,501,528 | $ | 384,407,728 | $ | 1,939,596 | $ | 1,071,505,633 | ||||||||||||||||||
|
|
|
|
|
|
|
|
|
|
|
|
|
|
|
|
|
| |||||||||||||||||||
Net change in unrealized appreciation (depreciation) on investments still held at April 30, 2021(b) | $ | 20,212 | $ | 24,998,446 | $ | 73,870 | $ | 2,623,081 | $ | 60 | $ | 4,030,201 | $ | 74,474,616 | $ | 726,463 | $ | 106,946,949 | ||||||||||||||||||
|
|
|
|
|
|
|
|
|
|
|
|
|
|
|
|
|
| |||||||||||||||||||
| (a) | Included in the related net change in unrealized appreciation (depreciation) in the Consolidated Statement of Operations. |
| (b) | Any difference between net change in unrealized appreciation (depreciation) and net change in unrealized appreciation (depreciation) on investments still held at April 30, 2021 is generally due to investments no longer held or categorized as Level 3 at period end. |
The following table summarizes the valuation approaches used and unobservable inputs utilized by the BlackRock Global Valuation Methodologies Committee (the “Global Valuation Committee”) to determine the value of certain of the Fund’s Level 3 financial instruments as of period end. The table does not include Level 3 financial instruments
CONSOLIDATED SCHEDULE OF INVESTMENTS | 55 |
Consolidated Schedule of Investments (continued) April 30, 2021 | BlackRock Global Allocation Fund, Inc. |
with values based upon unadjusted third party pricing information in the amount of $145,056,225. A significant change in third party information could result in a significantly lower or higher value of such Level 3 financial instruments.
| Value | | Valuation Approach | | Unobservable Inputs | | Range of Unobservable Inputs Utilized | (a) | | Weighted Average of Unobservable Inputs Based on Fair Value | | ||||||||||
Assets | ||||||||||||||||||||
Common Stocks | $ | 122,588,158 | Market | | Revenue Multiple Time to Exit Volatility Recent Transactions | | | 16.50x 1.1 - 1.3 years 49% - 58% — |
| | — 1.1 years — |
| ||||||||
| Income | Discount Rate | 13% - 16% | 16% | |||||||||||||||||
Corporate Bonds | 272,995,284 | Income | Discount Rate | 12% - 29% | 15% | |||||||||||||||
Floating Rate Loan Interests(b) | 119,017,114 | Income | Discount Rate | 3% - 11% | 6% | |||||||||||||||
| Market | Recent Transactions | — | — | |||||||||||||||||
Other Interests | 25,501,528 | Income | Discount Rate | 5% | — | |||||||||||||||
Preferred Stocks(c)(d) | 384,407,728 | Market | Revenue Multiple | 2.70x - 44.50x | 16.83x | |||||||||||||||
| Time to Exit | 0.4 years - 2.8 years | 1.3 years | ||||||||||||||||||
| Volatility | 42% - 60% | 55% | ||||||||||||||||||
| Recent Transactions | — | — | ||||||||||||||||||
| Income | Discount Rate | 28% | — | |||||||||||||||||
Warrants | 1,939,596 | Market | | Revenue Multiple Time to Exit Volatility | | | 9.00x - 11.91x 0.3 years - 2.0 years 32% - 52% | | | 9.21x 1.8 years 50% | | |||||||||
| Recent Transactions | — | — | ||||||||||||||||||
|
| |||||||||||||||||||
| $ | 926,449,408 | |||||||||||||||||||
|
| |||||||||||||||||||
| (a) | A significant change in unobservable input would have resulted in a correlated (inverse) significant change to value. |
| (b) | For the period ended April 30, 2021, the valuation technique for investments classified as Floating Rate Interests amounting to $32,714,968 changed to Discounted Cash Flow. The investments were previously valued utilizing Transaction Price approach. The change was due to consideration of the information that was available at the time the investments were valued. |
| (c) | For the period ended April 30, 2021, the valuation technique for investments classified as Preferred Stocks amounting to $78,433,409 changed to Current Value Method. The investments were previously valued utilizing Transaction Price approach. The change was due to consideration of the information that was available at the time the investments were valued. |
| (d) | For the period ended April 30, 2021, the valuation technique for investments classified as Preferred Stocks amounting to $27,830,693 changed to Transaction Price Approach. The investments were previously valued utilizing Current Value Method. The change was due to consideration of the information that was available at the time the investments were valued. |
| 56 | 2 0 2 1 BLACK ROCK ANNUAL REPORT TO SHAREHOLDERS |
Consolidated Statement of Assets and Liabilities
April 30, 2021
| BlackRock Global Allocation Fund, Inc. | ||||
ASSETS | ||||
Investments at value — unaffiliated(a) | $ | 27,311,263,987 | ||
Investments at value — affiliated(b) | 789,975,920 | |||
Cash | 231,676,218 | |||
Cash pledged: | ||||
Collateral — exchange-traded options written | 7,290,000 | |||
Centrally cleared swaps | 78,755,000 | |||
Receivables: | ||||
Investments sold | 282,065,568 | |||
Options written | 8,104,140 | |||
Securities lending income — affiliated | 81,601 | |||
Swaps | 2,133,925 | |||
Capital shares sold | 36,873,239 | |||
Dividends — unaffiliated | 21,082,692 | |||
Dividends — affiliated | 709,901 | |||
Interest — unaffiliated | 48,914,659 | |||
From affiliate | 94,169 | |||
Principal paydowns | 1,356,326 | |||
Variation margin on futures contracts | 22,688,312 | |||
Swap premiums paid | 1,261,250 | |||
Unrealized appreciation on: | ||||
Forward foreign currency exchange contracts | 14,169,655 | |||
OTC swaps | 2,745,198 | |||
Prepaid expenses | 519,500 | |||
|
| |||
Total assets | 28,861,761,260 | |||
|
| |||
LIABILITIES | ||||
Investments sold short at value(c) | 188,828,660 | |||
Foreign bank overdraft(d) | 3,052,086 | |||
Cash received as collateral for OTC derivatives | 68,185,000 | |||
Options written at value(e) | 103,248,986 | |||
Payables: | ||||
Investments purchased | 1,294,024,493 | |||
Swaps | 7,482,595 | |||
Capital shares redeemed | 42,460,209 | |||
Deferred foreign capital gain tax | 1,543,761 | |||
Investment advisory fees | 15,304,210 | |||
Directors’ and Officer’s fees | 27,346 | |||
Options written | 10,241,195 | |||
Other accrued expenses | 6,925,615 | |||
Other affiliates | 136,778 | |||
Service and distribution fees | 3,973,042 | |||
Variation margin on futures contracts | 6,614,115 | |||
Variation margin on centrally cleared swaps | 1,301,977 | |||
Swap premiums received | 661,738 | |||
Unrealized depreciation on: | ||||
Forward foreign currency exchange contracts | 39,565,128 | |||
OTC swaps | 5,748,952 | |||
|
| |||
Total liabilities | 1,799,325,886 | |||
|
| |||
NET ASSETS | $ | 27,062,435,374 | ||
|
| |||
CONSOLIDATED FINANCIAL STATEMENTS | 57 |
Consolidated Statement of Assets and Liabilities (continued)
April 30, 2021
BlackRock Global Allocation Fund, Inc. | ||||
NET ASSETS CONSIST OF |
| |||
Paid-in capital | $ | 19,446,575,792 | ||
Accumulated earnings | 7,615,859,582 | |||
|
| |||
NET ASSETS | $ | 27,062,435,374 | ||
|
| |||
(a) Investments at cost — unaffiliated | $ | 20,483,248,863 | ||
(b) Investments at cost — affiliated | $ | 840,344,298 | ||
(c) Proceeds from investments sold short | $ | 206,983,842 | ||
(d) Foreign bank overdraft at cost | $ | 3,022,296 | ||
(e) Premiums received | $ | 91,787,375 | ||
| 58 | 2 0 2 1 BLACK ROCK ANNUAL REPORT TO SHAREHOLDERS |
Consolidated Statement of Assets and Liabilities (continued)
April 30, 2021
| BlackRock Global Allocation Fund, Inc. | ||||
NET ASSET VALUE |
| |||
Institutional | ||||
Net assets | $ | 9,749,543,822 | ||
|
| |||
Shares outstanding | 426,832,468 | |||
|
| |||
Net asset value | $ | 22.84 | ||
|
| |||
Shares authorized | 2 billion | |||
|
| |||
Par value | $ | 0.10 | ||
|
| |||
Investor A | ||||
Net assets | $ | 13,806,270,697 | ||
|
| |||
Shares outstanding | 609,431,280 | |||
|
| |||
Net asset value | $ | 22.65 | ||
|
| |||
Shares authorized | 2 billion | |||
|
| |||
Par value | $ | 0.10 | ||
|
| |||
Investor C | ||||
Net assets | $ | 1,213,559,100 | ||
|
| |||
Shares outstanding | 60,354,585 | |||
|
| |||
Net asset value | $ | 20.11 | ||
|
| |||
Shares authorized | 2 billion | |||
|
| |||
Par value | $ | 0.10 | ||
|
| |||
Class K | ||||
Net assets | $ | 1,849,652,364 | ||
|
| |||
Shares outstanding | 80,999,930 | |||
|
| |||
Net asset value | $ | 22.84 | ||
|
| |||
Shares authorized | 2 billion | |||
|
| |||
Par value | $ | 0.10 | ||
|
| |||
Class R | ||||
Net assets | $ | 443,409,391 | ||
|
| |||
Shares outstanding | 20,751,888 | |||
|
| |||
Net asset value | $ | 21.37 | ||
|
| |||
Shares authorized | 2 billion | |||
|
| |||
Par value | $ | 0.10 | ||
|
| |||
See notes to consolidated financial statements.
CONSOLIDATED FINANCIAL STATEMENTS | 59 |
Consolidated Statements of Operations
April 30, 2021
| BlackRock Global Allocation Fund, Inc. | ||||||||
| Period from 11/01/20 to 04/30/21 | Year Ended 10/31/20 | |||||||
INVESTMENT INCOME | ||||||||
Dividends — unaffiliated | $ | 142,392,396 | $ | 222,636,974 | ||||
Dividends — affiliated | 12,467,034 | 14,771,735 | ||||||
Interest — unaffiliated | 83,808,913 | 155,218,314 | ||||||
Securities lending income — affiliated — net | 1,986,281 | 2,230,310 | ||||||
Other income | 303,197 | 777,583 | ||||||
Other income — affiliated | — | 16,428 | ||||||
Foreign withholding tax claims | 751,005 | — | ||||||
Foreign taxes withheld | (7,617,603 | ) | (9,086,205 | ) | ||||
|
|
|
| |||||
Total investment income | 234,091,223 | 386,565,139 | ||||||
|
|
|
| |||||
EXPENSES |
| |||||||
Investment advisory | 95,386,560 | 168,840,350 | ||||||
Service and distribution — class specific | 23,962,465 | 52,586,710 | ||||||
Transfer agent — class specific | 11,109,573 | 20,953,607 | ||||||
Accounting services | 1,035,257 | 1,848,261 | ||||||
Custodian | 682,634 | 1,106,168 | ||||||
Professional | 256,958 | 369,479 | ||||||
Registration | 192,361 | 266,159 | ||||||
Directors and Officer | 139,632 | 317,653 | ||||||
Printing and postage | 92,798 | 268,493 | ||||||
Miscellaneous | 257,267 | 371,414 | ||||||
|
|
|
| |||||
Total expenses excluding dividends expense and fees | 133,115,505 | 246,928,294 | ||||||
Dividends expense — unaffiliated | 786,811 | 1,261,126 | ||||||
Stock loan fees | 13,958 | 7,353 | ||||||
|
|
|
| |||||
Total expenses | 133,916,274 | 248,196,773 | ||||||
Less: | ||||||||
Fees paid indirectly | (8,996 | ) | (31,220 | ) | ||||
Fees waived and/or reimbursed by the Manager | (7,539,588 | ) | (10,276,760 | ) | ||||
|
|
|
| |||||
Total expenses after fees waived and/or reimbursed | 126,367,690 | 237,888,793 | ||||||
|
|
|
| |||||
Net investment income | 107,723,533 | 148,676,346 | ||||||
|
|
|
| |||||
REALIZED AND UNREALIZED GAIN (LOSS) | ||||||||
Net realized gain (loss) from: | ||||||||
Investments — unaffiliated(a) | 1,905,360,614 | 1,189,305,214 | ||||||
Investments — affiliated | 17,630,264 | 9,318,784 | ||||||
Capital gain distributions from investment companies — affiliated | — | 156 | ||||||
Foreign currency transactions | 687,375 | (7,662,060 | ) | |||||
Forward foreign currency exchange contracts | (12,937,790 | ) | (72,908,192 | ) | ||||
Futures contracts | (537,923,380 | ) | 156,795,345 | |||||
Options written | 174,049,977 | 136,483,725 | ||||||
Short sales — unaffiliated | (16,068,394 | ) | 19,841,739 | |||||
Swaps | 7,490,480 | 17,303,855 | ||||||
|
|
|
| |||||
| 1,538,289,146 | 1,448,478,566 | |||||||
|
|
|
| |||||
| 60 | 2 0 2 1 BLACK ROCK ANNUAL REPORT TO SHAREHOLDERS |
Consolidated Statements of Operations (continued)
April 30, 2021
| BlackRock Global Allocation Fund, Inc. | ||||||||
| Period from 11/01/20 to 04/30/21 | Year Ended 10/31/20 | |||||||
Net change in unrealized appreciation (depreciation) on: | ||||||||
Investments — unaffiliated(b) | $ | 2,934,082,413 | $ | 393,958,996 | ||||
Investments — affiliated | 65,206,440 | 11,100,871 | ||||||
Foreign currency translations | (2,503,021 | ) | 1,724,643 | |||||
Forward foreign currency exchange contracts | (31,934,155 | ) | (8,988,431 | ) | ||||
Futures contracts | (178,915,923 | ) | 97,058,370 | |||||
Options written | (28,656,054 | ) | (12,392,077 | ) | ||||
Short sales — unaffiliated | 17,148,260 | 1,006,922 | ||||||
Swaps | 60,297,757 | (35,149,638 | ) | |||||
|
|
|
| |||||
| 2,834,725,717 | 448,319,656 | |||||||
|
|
|
| |||||
Net realized and unrealized gain | 4,373,014,863 | 1,896,798,222 | ||||||
|
|
|
| |||||
NET INCREASE IN NET ASSETS RESULTING FROM OPERATIONS | $ | 4,480,738,396 | $ | 2,045,474,568 | ||||
|
|
|
| |||||
(a) Net of foreign capital gain tax of | $ | 1,579,085 | $ | 2,690,775 | ||||
(b) Net of deferred foreign capital gain tax of | $ | 1,822,410 | $ | 1,068,013 | ||||
See notes to consolidated financial statements.
CONSOLIDATED FINANCIAL STATEMENTS | 61 |
Consolidated Statements of Changes in Net Assets
| BlackRock Global Allocation Fund, Inc. | ||||||||||||
| Period from 11/01/20 to 04/30/21 | Year Ended October 31, | |||||||||||
| 2020 | 2019 | |||||||||||
INCREASE (DECREASE) IN NET ASSETS | ||||||||||||
OPERATIONS | ||||||||||||
Net investment income. | $ | 107,723,533 | $ | 148,676,346 | $ | 359,384,978 | ||||||
Net realized gain | 1,538,289,146 | 1,448,478,566 | 1,657,511,891 | |||||||||
Net change in unrealized appreciation | 2,834,725,717 | 448,319,656 | 460,854,493 | |||||||||
|
|
|
|
|
| |||||||
Net increase in net assets resulting from operations | 4,480,738,396 | 2,045,474,568 | 2,477,751,362 | |||||||||
|
|
|
|
|
| |||||||
DISTRIBUTIONS TO SHAREHOLDERS(a) | ||||||||||||
Institutional | (408,361,228 | ) | (554,927,544 | ) | (740,960,412 | ) | ||||||
Investor A | (573,407,320 | ) | (702,910,993 | ) | (660,060,342 | ) | ||||||
Investor C | (44,858,588 | ) | (190,636,849 | ) | (268,550,116 | ) | ||||||
Class K | (72,126,650 | ) | (83,133,683 | ) | (81,596,844 | ) | ||||||
Class R | (19,022,703 | ) | (35,376,625 | ) | (44,354,639 | ) | ||||||
|
|
|
|
|
| |||||||
Decrease in net assets resulting from distributions to shareholders | (1,117,776,489 | ) | (1,566,985,694 | ) | (1,795,522,353 | ) | ||||||
|
|
|
|
|
| |||||||
CAPITAL SHARE TRANSACTIONS | ||||||||||||
Net increase (decrease) in net assets derived from capital share transactions | 1,325,743,653 | (2,216,536,634 | ) | (7,595,454,785 | ) | |||||||
|
|
|
|
|
| |||||||
NET ASSETS | ||||||||||||
Total increase (decrease) in net assets | 4,688,705,560 | (1,738,047,760 | ) | (6,913,225,776 | ) | |||||||
Beginning of period | 22,373,729,814 | 24,111,777,574 | 31,025,003,350 | |||||||||
|
|
|
|
|
| |||||||
End of period | $ | 27,062,435,374 | $ | 22,373,729,814 | $ | 24,111,777,574 | ||||||
|
|
|
|
|
| |||||||
(a) Distributions for annual periods determined in accordance with U.S. federal income tax regulations.
See notes to consolidated financial statements.
| 62 | 2 0 2 1 BLACK ROCK ANNUAL REPORT TO SHAREHOLDERS |
Consolidated Financial Highlights
(For a share outstanding throughout each period)
| BlackRock Global Allocation Fund, Inc. | ||||||||||||||||||||||||
| Institutional | ||||||||||||||||||||||||
| Period from 11/01/20 to 04/30/21 | Year Ended October 31, | |||||||||||||||||||||||
| 2020 | 2019 | 2018 | 2017 | 2016 | ||||||||||||||||||||
Net asset value, beginning of period | $ | 19.93 | $ | 19.36 | $ | 18.81 | $ | 20.39 | $ | 18.43 | $ | 19.88 | ||||||||||||
|
|
|
|
|
|
|
|
|
|
|
| |||||||||||||
Net investment income(a) | 0.11 | 0.17 | 0.30 | 0.28 | 0.25 | 0.25 | ||||||||||||||||||
Net realized and unrealized gain (loss) | 3.82 | 1.75 | 1.45 | (0.84 | ) | 2.12 | (0.05 | ) | ||||||||||||||||
|
|
|
|
|
|
|
|
|
|
|
| |||||||||||||
Net increase (decrease) from investment operations | 3.93 | 1.92 | 1.75 | (0.56 | ) | 2.37 | 0.20 | |||||||||||||||||
|
|
|
|
|
|
|
|
|
|
|
| |||||||||||||
Distributions(b) | ||||||||||||||||||||||||
From net investment income | (0.14 | ) | (0.12 | ) | (0.22 | ) | (0.32 | ) | (0.26 | ) | (0.15 | ) | ||||||||||||
From net realized gain | (0.88 | ) | (1.23 | ) | (0.98 | ) | (0.70 | ) | (0.15 | ) | (1.50 | ) | ||||||||||||
|
|
|
|
|
|
|
|
|
|
|
| |||||||||||||
Total distributions | (1.02 | ) | (1.35 | ) | (1.20 | ) | (1.02 | ) | (0.41 | ) | (1.65 | ) | ||||||||||||
|
|
|
|
|
|
|
|
|
|
|
| |||||||||||||
Net asset value, end of period | $ | 22.84 | $ | 19.93 | $ | 19.36 | $ | 18.81 | $ | 20.39 | $ | 18.43 | ||||||||||||
|
|
|
|
|
|
|
|
|
|
|
| |||||||||||||
Total Return(c) | ||||||||||||||||||||||||
Based on net asset value | 20.07 | %(d) | 10.23 | %(e) | 9.96 | % | (2.94 | )% | 13.10 | % | 1.34 | % | ||||||||||||
|
|
|
|
|
|
|
|
|
|
|
| |||||||||||||
Ratios to Average Net Assets(f) | ||||||||||||||||||||||||
Total expenses. | 0.86 | %(g) | 0.86 | % | 0.85 | % | 0.87 | % | 0.90 | % | 0.88 | % | ||||||||||||
|
|
|
|
|
|
|
|
|
|
|
| |||||||||||||
Total expenses after fees waived and/or reimbursed | 0.80 | %(g) | 0.81 | % | 0.80 | % | 0.80 | % | 0.82 | % | 0.80 | % | ||||||||||||
|
|
|
|
|
|
|
|
|
|
|
| |||||||||||||
Total expenses after fees waived and/or reimbursed and excluding interest expense | 0.80 | %(g) | 0.81 | % | 0.80 | % | 0.79 | % | 0.80 | % | 0.79 | % | ||||||||||||
|
|
|
|
|
|
|
|
|
|
|
| |||||||||||||
Net investment income | 1.04 | %(g) | 0.91 | % | 1.59 | % | 1.43 | % | 1.28 | % | 1.39 | % | ||||||||||||
|
|
|
|
|
|
|
|
|
|
|
| |||||||||||||
Supplemental Data | ||||||||||||||||||||||||
Net assets, end of period (000) | $ | 9,749,544 | $ | 7,907,317 | $ | 8,617,256 | $ | 12,963,106 | $ | 16,164,754 | $ | 16,122,793 | ||||||||||||
|
|
|
|
|
|
|
|
|
|
|
| |||||||||||||
Portfolio turnover rate | 58 | % | 193 | % | 156 | % | 154 | % | 110 | % | 131 | % | ||||||||||||
|
|
|
|
|
|
|
|
|
|
|
| |||||||||||||
| (a) | Based on average shares outstanding. |
| (b) | Distributions for annual periods determined in accordance with U.S. federal income tax regulations. |
| (c) | Where applicable, assumes the reinvestment of distributions. |
| (d) | Aggregate total return. |
| (e) | Includes payment received from an affiliate, which had no impact on the Fund’s total return. |
| (f) | Excludes expenses incurred indirectly as a result of investments in underlying funds as follows: |
| Period from 11/01/20 to 04/30/21 | Year Ended October 31, | |||||||||||||||||||||||
| 2020 | 2019 | 2018 | 2017 | 2016 | ||||||||||||||||||||
Investments in underlying funds | 0.02 | % | 0.02 | % | — | % | 0.01 | % | 0.01 | % | 0.01 | % | ||||||||||||
|
|
|
|
|
|
|
|
|
|
|
| |||||||||||||
| (g) | Annualized. |
See notes to consolidated financial statements.
CONSOLIDATED FINANCIAL HIGHLIGHTS | 63 |
Consolidated Financial Highlights (continued)
(For a share outstanding throughout each period)
| BlackRock Global Allocation Fund, Inc. (continued) | ||||||||||||||||||||||||
| Investor A | ||||||||||||||||||||||||
| Period from 11/01/20 to 04/30/21 | Year Ended October 31, | |||||||||||||||||||||||
| 2020 | 2019 | 2018 | 2017 | 2016 | ||||||||||||||||||||
Net asset value, beginning of period | $ | 19.75 | $ | 19.23 | $ | 18.68 | $ | 20.26 | $ | 18.29 | $ | 19.76 | ||||||||||||
|
|
|
|
|
|
|
|
|
|
|
| |||||||||||||
Net investment income(a) | 0.08 | 0.12 | 0.24 | 0.23 | 0.19 | 0.20 | ||||||||||||||||||
Net realized and unrealized gain (loss) | 3.80 | 1.72 | 1.46 | (0.85 | ) | 2.11 | (0.04 | ) | ||||||||||||||||
|
|
|
|
|
|
|
|
|
|
|
| |||||||||||||
Net increase (decrease) from investment operations | 3.88 | 1.84 | 1.70 | (0.62 | ) | 2.30 | 0.16 | |||||||||||||||||
|
|
|
|
|
|
|
|
|
|
|
| |||||||||||||
Distributions(b) | ||||||||||||||||||||||||
From net investment income | (0.10 | ) | (0.09 | ) | (0.17 | ) | (0.26 | ) | (0.18 | ) | (0.13 | ) | ||||||||||||
From net realized gain | (0.88 | ) | (1.23 | ) | (0.98 | ) | (0.70 | ) | (0.15 | ) | (1.50 | ) | ||||||||||||
|
|
|
|
|
|
|
|
|
|
|
| |||||||||||||
Total distributions | (0.98 | ) | (1.32 | ) | (1.15 | ) | (0.96 | ) | (0.33 | ) | (1.63 | ) | ||||||||||||
|
|
|
|
|
|
|
|
|
|
|
| |||||||||||||
Net asset value, end of period | $ | 22.65 | $ | 19.75 | $ | 19.23 | $ | 18.68 | $ | 20.26 | $ | 18.29 | ||||||||||||
|
|
|
|
|
|
|
|
|
|
|
| |||||||||||||
Total Return(c) | ||||||||||||||||||||||||
Based on net asset value | 19.95 | %(d) | 9.87 | %(e) | 9.71 | % | (3.24 | )% | 12.77 | % | 1.08 | % | ||||||||||||
|
|
|
|
|
|
|
|
|
|
|
| |||||||||||||
Ratios to Average Net Assets(f) | ||||||||||||||||||||||||
Total expenses | 1.12 | %(g) | 1.13 | % | 1.13 | % | 1.14 | % | 1.18 | % | 1.15 | % | ||||||||||||
|
|
|
|
|
|
|
|
|
|
|
| |||||||||||||
Total expenses after fees waived and/or reimbursed | 1.06 | %(g) | 1.08 | % | 1.08 | % | 1.07 | % | 1.10 | % | 1.08 | % | ||||||||||||
|
|
|
|
|
|
|
|
|
|
|
| |||||||||||||
Total expenses after fees waived and/or reimbursed and excluding interest expense | 1.05 | %(g) | 1.08 | % | 1.08 | % | 1.07 | % | 1.07 | % | 1.07 | % | ||||||||||||
|
|
|
|
|
|
|
|
|
|
|
| |||||||||||||
Net investment income | 0.78 | %(g) | 0.63 | % | 1.29 | % | 1.14 | % | 1.00 | % | 1.10 | % | ||||||||||||
|
|
|
|
|
|
|
|
|
|
|
| |||||||||||||
Supplemental Data | ||||||||||||||||||||||||
Net assets, end of period (000) | $ | 13,806,271 | $ | 11,184,639 | $ | 10,601,653 | $ | 10,547,464 | $ | 12,809,356 | $ | 13,447,603 | ||||||||||||
|
|
|
|
|
|
|
|
|
|
|
| |||||||||||||
Portfolio turnover rate | 58 | % | 193 | % | 156 | % | 154 | % | 110 | % | 131 | % | ||||||||||||
|
|
|
|
|
|
|
|
|
|
|
| |||||||||||||
| (a) | Based on average shares outstanding. |
| (b) | Distributions for annual periods determined in accordance with U.S. federal income tax regulations. |
| (c) | Where applicable, excludes the effects of any sales charges and assumes the reinvestment of distributions. |
| (d) | Aggregate total return. |
| (e) | Includes payment received from an affiliate, which had no impact on the Fund’s total return. |
| (f) | Excludes expenses incurred indirectly as a result of investments in underlying funds as follows: |
| Period from 11/01/20 to 04/30/21 | Year Ended October 31, | |||||||||||||||||||||||
| 2020 | 2019 | 2018 | 2017 | 2016 | ||||||||||||||||||||
Investments in underlying funds | 0.02 | % | 0.02 | % | — | % | 0.01 | % | 0.01 | % | 0.01 | % | ||||||||||||
|
|
|
|
|
|
|
|
|
|
|
| |||||||||||||
| (g) | Annualized. |
See notes to consolidated financial statements.
| 64 | 2 0 2 1 BLACK ROCK ANNUAL REPORT TO SHAREHOLDERS |
Consolidated Financial Highlights (continued)
(For a share outstanding throughout each period)
| BlackRock Global Allocation Fund, Inc. (continued) | ||||||||||||||||||||||||
| Investor C | ||||||||||||||||||||||||
Period from 11/01/20 | Year Ended October 31, | |||||||||||||||||||||||
| 2020 | 2019 | 2018 | 2017 | 2016 | ||||||||||||||||||||
Net asset value, beginning of period | $ | 17.43 | $ | 17.17 | $ | 16.82 | $ | 18.33 | $ | 16.57 | $ | 18.11 | ||||||||||||
|
|
|
|
|
|
|
|
|
|
|
| |||||||||||||
Net investment income (loss)(a) | (0.00 | )(b) | (0.02 | ) | 0.09 | 0.07 | 0.04 | 0.06 | ||||||||||||||||
Net realized and unrealized gain (loss) | 3.36 | 1.53 | 1.30 | (0.76 | ) | 1.91 | (0.04 | ) | ||||||||||||||||
|
|
|
|
|
|
|
|
|
|
|
| |||||||||||||
Net increase (decrease) from investment operations | 3.36 | 1.51 | 1.39 | (0.69 | ) | 1.95 | 0.02 | |||||||||||||||||
|
|
|
|
|
|
|
|
|
|
|
| |||||||||||||
Distributions(c) | ||||||||||||||||||||||||
From net investment income | (0.00 | )(b) | (0.02 | ) | (0.06 | ) | (0.12 | ) | (0.04 | ) | (0.06 | ) | ||||||||||||
From net realized gain | (0.68 | ) | (1.23 | ) | (0.98 | ) | (0.70 | ) | (0.15 | ) | (1.50 | ) | ||||||||||||
|
|
|
|
|
|
|
|
|
|
|
| |||||||||||||
Total distributions | (0.68 | ) | (1.25 | ) | (1.04 | ) | (0.82 | ) | (0.19 | ) | (1.56 | ) | ||||||||||||
|
|
|
|
|
|
|
|
|
|
|
| |||||||||||||
Net asset value, end of period | $ | 20.11 | $ | 17.43 | $ | 17.17 | $ | 16.82 | $ | 18.33 | $ | 16.57 | ||||||||||||
|
|
|
|
|
|
|
|
|
|
|
| |||||||||||||
Total Return(d) | ||||||||||||||||||||||||
Based on net asset value | 19.50 | %(e) | 9.06 | %(f) | 8.88 | % | (3.95 | )% | 11.92 | % | 0.36 | % | ||||||||||||
|
|
|
|
|
|
|
|
|
|
|
| |||||||||||||
Ratios to Average Net Assets(g) | ||||||||||||||||||||||||
Total expenses | 1.90 | %(h) | 1.89 | % | 1.88 | % | 1.88 | % | 1.92 | % | 1.89 | % | ||||||||||||
|
|
|
|
|
|
|
|
|
|
|
| |||||||||||||
Total expenses after fees waived and/or reimbursed | 1.84 | %(h) | 1.85 | % | 1.83 | % | 1.81 | % | 1.84 | % | 1.82 | % | ||||||||||||
|
|
|
|
|
|
|
|
|
|
|
| |||||||||||||
Total expenses after fees waived and/or reimbursed and excluding interest expense | 1.83 | %(h) | 1.84 | % | 1.82 | % | 1.81 | % | 1.82 | % | 1.82 | % | ||||||||||||
|
|
|
|
|
|
|
|
|
|
|
| |||||||||||||
Net investment income (loss) | (0.01 | )%(h) | (0.13 | )% | 0.56 | % | 0.38 | % | 0.27 | % | 0.37 | % | ||||||||||||
|
|
|
|
|
|
|
|
|
|
|
| |||||||||||||
Supplemental Data | ||||||||||||||||||||||||
Net assets, end of period (000) | $ | 1,213,559 | $ | 1,547,011 | $ | 3,143,501 | $ | 5,402,163 | $ | 7,545,249 | $ | 11,029,706 | ||||||||||||
|
|
|
|
|
|
|
|
|
|
|
| |||||||||||||
Portfolio turnover rate | 58 | % | 193 | % | 156 | % | 154 | % | 110 | % | 131 | % | ||||||||||||
|
|
|
|
|
|
|
|
|
|
|
| |||||||||||||
| (a) | Based on average shares outstanding. |
| (b) | Amount is greater than $(0.005) per share. |
| (c) | Distributions for annual periods determined in accordance with U.S. federal income tax regulations. |
| (d) | Where applicable, excludes the effects of any sales charges and assumes the reinvestment of distributions. |
| (e) | Aggregate total return. |
| (f) | Includes payment received from an affiliate, which had no impact on the Fund’s total return. |
| (g) | Excludes expenses incurred indirectly as a result of investments in underlying funds as follows: |
Period from to 04/30/21 | Year Ended October 31, | |||||||||||||||||||||||
| 2020 | 2019 | 2018 | 2017 | 2016 | ||||||||||||||||||||
Investments in underlying funds | 0.02 | % | 0.02 | % | — | % | 0.01 | % | 0.01 | % | 0.01 | % | ||||||||||||
|
|
|
|
|
|
|
|
|
|
|
| |||||||||||||
| (h) | Annualized. |
See notes to consolidated financial statements.
CONSOLIDATED FINANCIAL HIGHLIGHTS | 65 |
Consolidated Financial Highlights (continued)
(For a share outstanding throughout each period)
| BlackRock Global Allocation Fund, Inc. (continued) | ||||||||||||||||||||||||
| Class K | ||||||||||||||||||||||||
Period from 11/01/20 to 04/30/21 | Year Ended October 31, | Period from 06/08/16(a) to 10/31/16 | ||||||||||||||||||||||
| 2020 | 2019 | 2018 | 2017 | |||||||||||||||||||||
Net asset value, beginning of period | $ | 19.93 | $ | 19.36 | $ | 18.80 | $ | 20.39 | $ | 18.44 | $ | 18.23 | ||||||||||||
|
|
|
|
|
|
|
|
|
|
|
| |||||||||||||
Net investment income(b) | 0.12 | 0.19 | 0.31 | 0.30 | 0.27 | 0.08 | ||||||||||||||||||
Net realized and unrealized gain (loss) | 3.83 | 1.73 | 1.46 | (0.85 | ) | 2.12 | 0.13 | |||||||||||||||||
|
|
|
|
|
|
|
|
|
|
|
| |||||||||||||
Net increase (decrease) from investment operations | 3.95 | 1.92 | 1.77 | (0.55 | ) | 2.39 | 0.21 | |||||||||||||||||
|
|
|
|
|
|
|
|
|
|
|
| |||||||||||||
Distributions(c) | ||||||||||||||||||||||||
From net investment income | (0.16 | ) | (0.12 | ) | (0.23 | ) | (0.34 | ) | (0.29 | ) | — | |||||||||||||
From net realized gain | (0.88 | ) | (1.23 | ) | (0.98 | ) | (0.70 | ) | (0.15 | ) | — | |||||||||||||
|
|
|
|
|
|
|
|
|
|
|
| |||||||||||||
Total distributions | (1.04 | ) | (1.35 | ) | (1.21 | ) | (1.04 | ) | (0.44 | ) | — | |||||||||||||
|
|
|
|
|
|
|
|
|
|
|
| |||||||||||||
Net asset value, end of period | $ | 22.84 | $ | 19.93 | $ | 19.36 | $ | 18.80 | $ | 20.39 | $ | 18.44 | ||||||||||||
|
|
|
|
|
|
|
|
|
|
|
| |||||||||||||
Total Return(d) | ||||||||||||||||||||||||
Based on net asset value | 20.16 | %(e) | 10.28 | %(f) | 10.10 | % | (2.91 | )% | 13.20 | % | 1.15 | %(e) | ||||||||||||
|
|
|
|
|
|
|
|
|
|
|
| |||||||||||||
Ratios to Average Net Assets(g) | ||||||||||||||||||||||||
Total expenses | 0.78 | %(h) | 0.78 | % | 0.78 | % | 0.80 | % | 0.82 | % | 0.79 | %(h) | ||||||||||||
|
|
|
|
|
|
|
|
|
|
|
| |||||||||||||
Total expenses after fees waived and/or reimbursed | 0.72 | %(h) | 0.74 | % | 0.73 | % | 0.73 | % | 0.74 | % | 0.71 | %(h) | ||||||||||||
|
|
|
|
|
|
|
|
|
|
|
| |||||||||||||
Total expenses after fees waived and/or reimbursed and excluding interest expense | 0.71 | %(h) | 0.73 | % | 0.72 | % | 0.72 | % | 0.72 | % | 0.71 | %(h) | ||||||||||||
|
|
|
|
|
|
|
|
|
|
|
| |||||||||||||
Net investment income | 1.13 | %(h) | 0.98 | % | 1.67 | % | 1.53 | % | 1.39 | % | 1.06 | %(h) | ||||||||||||
|
|
|
|
|
|
|
|
|
|
|
| |||||||||||||
Supplemental Data | ||||||||||||||||||||||||
Net assets, end of period (000) | $ | 1,849,652 | $ | 1,329,363 | $ | 1,146,295 | $ | 1,326,617 | $ | 1,341,925 | $ | 604,611 | ||||||||||||
|
|
|
|
|
|
|
|
|
|
|
| |||||||||||||
Portfolio turnover rate | 58 | % | 193 | % | 156 | % | 154 | % | 110 | % | 131 | %(i) | ||||||||||||
|
|
|
|
|
|
|
|
|
|
|
| |||||||||||||
| (a) | Commencement of operations. |
| (b) | Based on average shares outstanding. |
| (c) | Distributions for annual periods determined in accordance with U.S. federal income tax regulations. |
| (d) | Where applicable, assumes the reinvestment of distributions. |
| (e) | Aggregate total return. |
| (f) | Includes payment received from an affiliate, which had no impact on the Fund’s total return. |
| (g) | Excludes expenses incurred indirectly as a result of investments in underlying funds as follows: |
Period from 11/01/20 to 04/30/21 | Year Ended October 31, | Period from 06/08/16(a) to 10/31/16 | ||||||||||||||||||||||
| 2020 | 2019 | 2018 | 2017 | |||||||||||||||||||||
Investments in underlying funds | 0.02 | % | 0.02 | % | — | % | 0.01 | % | 0.01 | % | 0.01 | % | ||||||||||||
|
|
|
|
|
|
|
|
|
|
|
| |||||||||||||
| (h) | Annualized. |
| (i) | Portfolio turnover rate is representative of the Fund for the entire year. |
See notes to consolidated financial statements.
| 66 | 2 0 2 1 BLACK ROCK ANNUAL REPORT TO SHAREHOLDERS |
Consolidated Financial Highlights (continued)
(For a share outstanding throughout each period)
| BlackRock Global Allocation Fund, Inc. (continued) | ||||||||||||||||||||||||
| Class R | ||||||||||||||||||||||||
Period from 11/01/20 to 04/30/21 | Year Ended October 31, | |||||||||||||||||||||||
| 2020 | 2019 | 2018 | 2017 | 2016 | ||||||||||||||||||||
Net asset value, beginning of period | $ | 18.64 | $ | 18.24 | $ | 17.77 | $ | 19.32 | $ | 17.46 | $ | 18.96 | ||||||||||||
|
|
|
|
|
|
|
|
|
|
|
| |||||||||||||
Net investment income(a) | 0.04 | 0.06 | 0.17 | 0.15 | 0.13 | 0.14 | ||||||||||||||||||
Net realized and unrealized gain (loss) | 3.58 | 1.63 | 1.38 | (0.80 | ) | 2.01 | (0.04 | ) | ||||||||||||||||
|
|
|
|
|
|
|
|
|
|
|
| |||||||||||||
Net increase (decrease) from investment operations | 3.62 | 1.69 | 1.55 | (0.65 | ) | 2.14 | 0.10 | |||||||||||||||||
|
|
|
|
|
|
|
|
|
|
|
| |||||||||||||
Distributions(b) | ||||||||||||||||||||||||
From net investment income | (0.01 | ) | (0.06 | ) | (0.10 | ) | (0.20 | ) | (0.13 | ) | (0.10 | ) | ||||||||||||
From net realized gain | (0.88 | ) | (1.23 | ) | (0.98 | ) | (0.70 | ) | (0.15 | ) | (1.50 | ) | ||||||||||||
|
|
|
|
|
|
|
|
|
|
|
| |||||||||||||
Total distributions | (0.89 | ) | (1.29 | ) | (1.08 | ) | (0.90 | ) | (0.28 | ) | (1.60 | ) | ||||||||||||
|
|
|
|
|
|
|
|
|
|
|
| |||||||||||||
Net asset value, end of period | $ | 21.37 | $ | 18.64 | $ | 18.24 | $ | 17.77 | $ | 19.32 | $ | 17.46 | ||||||||||||
|
|
|
|
|
|
|
|
|
|
|
| |||||||||||||
Total Return(c) | ||||||||||||||||||||||||
Based on net asset value | 19.74 | %(d) | 9.54 | %(e) | 9.35 | % | (3.56 | )% | 12.42 | % | 0.79 | % | ||||||||||||
|
|
|
|
|
|
|
|
|
|
|
| |||||||||||||
Ratios to Average Net Assets(f) | ||||||||||||||||||||||||
Total expenses | 1.47 | %(g) | 1.47 | % | 1.46 | % | 1.47 | % | 1.50 | % | 1.47 | % | ||||||||||||
|
|
|
|
|
|
|
|
|
|
|
| |||||||||||||
Total expenses after fees waived and/or reimbursed | 1.41 | %(g) | 1.42 | % | 1.41 | % | 1.40 | % | 1.42 | % | 1.39 | % | ||||||||||||
|
|
|
|
|
|
|
|
|
|
|
| |||||||||||||
Total expenses after fees waived and/or reimbursed and excluding interest expense | 1.40 | %(g) | 1.41 | % | 1.40 | % | 1.39 | % | 1.40 | % | 1.39 | % | ||||||||||||
|
|
|
|
|
|
|
|
|
|
|
| |||||||||||||
Net investment income | 0.43 | %(g) | 0.31 | % | 0.98 | % | 0.81 | % | 0.68 | % | 0.79 | % | ||||||||||||
|
|
|
|
|
|
|
|
|
|
|
| |||||||||||||
Supplemental Data | ||||||||||||||||||||||||
Net assets, end of period (000) | $ | 443,409 | $ | 405,400 | $ | 603,073 | $ | 785,653 | $ | 1,060,273 | $ | 1,131,647 | ||||||||||||
|
|
|
|
|
|
|
|
|
|
|
| |||||||||||||
Portfolio turnover rate | 58 | % | 193 | % | 156 | % | 154 | % | 110 | % | 131 | % | ||||||||||||
|
|
|
|
|
|
|
|
|
|
|
| |||||||||||||
| (a) | Based on average shares outstanding. |
| (b) | Distributions for annual periods determined in accordance with U.S. federal income tax regulations. |
| (c) | Where applicable, assumes the reinvestment of distributions. |
| (d) | Aggregate total return. |
| (e) | Includes payment received from an affiliate, which had no impact on the Fund’s total return. |
| (f) | Excludes expenses incurred indirectly as a result of investments in underlying funds as follows: |
Period from 11/01/20 to 04/30/21 | Year Ended October 31, | |||||||||||||||||||||||
| 2020 | 2019 | 2018 | 2017 | 2016 | ||||||||||||||||||||
Investments in underlying funds | 0.02 | % | 0.02 | % | — | % | 0.01 | % | 0.01 | % | 0.01 | % | ||||||||||||
|
|
|
|
|
|
|
|
|
|
|
| |||||||||||||
| (g) | Annualized. |
See notes to consolidated financial statements.
CONSOLIDATED FINANCIAL HIGHLIGHTS | 67 |
Notes to Consolidated Financial Statements
| 1. | ORGANIZATION |
BlackRock Global Allocation Fund, Inc. (the “Fund”) is registered under the Investment Company Act of 1940, as amended (the “1940 Act”), as an open-end management investment company. The Fund is organized as a Maryland corporation. The Fund is classified as diversified.
The Fund offers multiple classes of shares. All classes of shares have identical voting, dividend, liquidation and other rights and are subject to the same terms and conditions, except that certain classes bear expenses related to the shareholder servicing and distribution of such shares. Institutional and Class K Shares are sold only to certain eligible investors. Investor A, Investor C and Class R Shares bear certain expenses related to shareholder servicing of such shares, and Investor C and Class R Shares also bear certain expenses related to the distribution of such shares. Class R Shares are sold only to certain employer-sponsored retirement plans. Investor A and Investor C Shares are generally available through financial intermediaries. Each class has exclusive voting rights with respect to matters relating to its shareholder servicing and distribution expenditures (except that Investor C shareholders may vote on material changes to the Investor A Shares distribution and service plan).
| Share Class | Initial Sales Charge | CDSC | Conversion Privilege | |||||||
Institutional, Class K and Class R Shares | No | No | None | |||||||
Investor A Shares | Yes | No | (a) | None | ||||||
Investor C Shares | No | Yes | (b) | To Investor A Shares after approximately 8 years | ||||||
| (a) | Investor A Shares may be subject to a contingent deferred sales charge (“CDSC”) for certain redemptions where no initial sales charge was paid at the time of purchase. |
| (b) | A CDSC of 1.00% is assessed on certain redemptions of Investor C Shares made within one year after purchase. |
On April 7, 2021, the Board of Directors of the Fund approved a change in the fiscal year end of the Fund, effective as of April 30, 2021, from October 31 to April 30.
The Fund, together with certain other registered investment companies advised by BlackRock Advisors, LLC (the “Manager”) or its affiliates, is included in a complex of equity, multi-asset, index and money market funds referred to as the BlackRock Multi-Asset Complex.
Basis of Consolidation: The accompanying consolidated financial statements of the Fund include the account of BlackRock Cayman Global Allocation Fund I, Ltd. (the “Subsidiary”), which is a wholly-owned subsidiary of the Fund and primarily invests in commodity-related instruments and other derivatives. The Subsidiary enables the Fund to hold these commodity-related instruments and satisfy regulated investment company tax requirements. The Fund may invest up to 25% of its total assets in the Subsidiary. The net assets of the Subsidiary as of period end were $169,264,779, which is 0.6% of the Fund’s consolidated net assets. Intercompany accounts and transactions, if any, have been eliminated. The Subsidiary is subject to the same investment policies and restrictions that apply to the Fund, except that the Subsidiary may invest without limitation in commodity-related instruments.
| 2. | SIGNIFICANT ACCOUNTING POLICIES |
The consolidated financial statements are prepared in conformity with accounting principles generally accepted in the United States of America (“U.S. GAAP”), which may require management to make estimates and assumptions that affect the reported amounts of assets and liabilities in the consolidated financial statements, disclosure of contingent assets and liabilities at the date of the consolidated financial statements and the reported amounts of increases and decreases in net assets from operations during the reporting period. Actual results could differ from those estimates. The Fund is considered an investment company under U.S. GAAP and follows the accounting and reporting guidance applicable to investment companies. Below is a summary of significant accounting policies:
Investment Transactions and Income Recognition: For financial reporting purposes, investment transactions are recorded on the dates the transactions are executed. Realized gains and losses on investment transactions are determined using the specific identification method. Dividend income and capital gain distributions, if any, are recorded on the ex-dividend dates. Non-cash dividends, if any, are recorded on the ex-dividend dates at fair value. Dividends from foreign securities where the ex-dividend dates may have passed are subsequently recorded when the Fund is informed of the ex-dividend dates. Under the applicable foreign tax laws, a withholding tax at various rates may be imposed on capital gains, dividends and interest. Upon notification from issuers, a portion of the dividend income received from a real estate investment trust may be redesignated as a reduction of cost of the related investment and/or realized gain. Interest income, including amortization and accretion of premiums and discounts on debt securities, is recognized daily on an accrual basis. Income, expenses and realized and unrealized gains and losses are allocated daily to each class based on its relative net assets. For convertible securities, premiums attributable to the debt instrument are amortized, but premiums attributable to the conversion feature are not amortized.
Foreign Currency Translation: The Fund’s books and records are maintained in U.S. dollars. Securities and other assets and liabilities denominated in foreign currencies are translated into U.S. dollars using exchange rates determined as of the close of trading on the New York Stock Exchange (“NYSE”). Purchases and sales of investments are recorded at the rates of exchange prevailing on the respective dates of such transactions. Generally, when the U.S. dollar rises in value against a foreign currency, the investments denominated in that currency will lose value; the opposite effect occurs if the U.S. dollar falls in relative value.
The Fund does not isolate the effect of fluctuations in foreign exchange rates from the effect of fluctuations in the market prices of investments for financial reporting purposes. Accordingly, the effects of changes in exchange rates on investments are not segregated in the Consolidated Statements of Operations from the effects of changes in market prices of those investments, but are included as a component of net realized and unrealized gain (loss) from investments. The Fund reports realized currency gains (losses) on foreign currency related transactions as components of net realized gain (loss) for financial reporting purposes, whereas such components are generally treated as ordinary income for U.S. federal income tax purposes.
Foreign Taxes: The Fund may be subject to foreign taxes (a portion of which may be reclaimable) on income, stock dividends, capital gains on investments, or certain foreign currency transactions. All foreign taxes are recorded in accordance with the applicable foreign tax regulations and rates that exist in the foreign jurisdictions in which the Fund invests. These foreign taxes, if any, are paid by the Fund and are reflected in its Consolidated Statements of Operations as follows: foreign taxes withheld at source are presented as a reduction of income, foreign taxes on securities lending income are presented as a reduction of securities lending income, foreign taxes on stock dividends are
| 68 | 2 0 2 1 BLACK ROCK ANNUAL REPORT TO SHAREHOLDERS |
Notes to Consolidated Financial Statements (continued)
presented as “Foreign taxes withheld”, and foreign taxes on capital gains from sales of investments and foreign taxes on foreign currency transactions are included in their respective net realized gain (loss) categories. Foreign taxes payable or deferred as of April 30, 2021, if any, are disclosed in the Consolidated Statement of Assets and Liabilities.
The Fund files withholding tax reclaims in certain jurisdictions to recover a portion of amounts previously withheld. The Fund may record a reclaim receivable based on collectability, which includes factors such as the jurisdiction’s applicable laws, payment history and market convention. The Consolidated Statements of Operations includes tax reclaims recorded as well as professional and other fees, if any, associated with recovery of foreign withholding taxes.
Segregation and Collateralization: In cases where the Fund enters into certain investments (e.g., futures contracts, forward foreign currency exchange contracts, options written, swaps and short sales) that would be treated as “senior securities” for 1940 Act purposes, the Fund may segregate or designate on its books and records cash or liquid assets having a market value at least equal to the amount of its future obligations under such investments. Doing so allows the investment to be excluded from treatment as a “senior security.” Furthermore, if required by an exchange or counterparty agreement, the Fund may be required to deliver/deposit cash and/or securities to/with an exchange, or broker-dealer or custodian as collateral for certain investments or obligations.
Distributions: Distributions paid by the Fund are recorded on the ex-dividend dates. Distributions of capital gains are recorded on the ex-dividend dates and made at least annually. The character and timing of distributions are determined in accordance with U.S. federal income tax regulations, which may differ from U.S. GAAP. Net income and realized gains from investments held by the Subsidiary are treated as ordinary income for tax purposes. If a net loss is realized by the Subsidiary in any taxable year, the loss will generally not be available to offset the Fund’s ordinary income and/or capital gains for that year.
Indemnifications: In the normal course of business, the Fund enters into contracts that contain a variety of representations that provide general indemnification. The Fund’s maximum exposure under these arrangements is unknown because it involves future potential claims against the Fund, which cannot be predicted with any certainty.
Other: Expenses directly related to the Fund or its classes are charged to the Fund or the applicable class. Expenses directly related to the Fund and other shared expenses prorated to the Fund are allocated daily to each class based on its relative net assets or other appropriate methods. Other operating expenses shared by several funds, including other funds managed by the Manager, are prorated among those funds on the basis of relative net assets or other appropriate methods.
The Fund has an arrangement with its custodian whereby credits are earned on uninvested cash balances, which could be used to reduce custody fees and/or overdraft charges. The Fund may incur charges on overdrafts, subject to certain conditions.
| 3. | INVESTMENT VALUATION AND FAIR VALUE MEASUREMENTS |
Investment Valuation Policies: The Fund’s investments are valued at fair value (also referred to as “market value” within the financial statements) each day that the Fund is open for business and, for financial reporting purposes, as of the report date. U.S. GAAP defines fair value as the price a fund would receive to sell an asset or pay to transfer a liability in an orderly transaction between market participants at the measurement date. The Fund determines the fair values of its financial instruments using various independent dealers or pricing services under policies approved by the Board of Directors of the Fund (the “Board”). If a security’s market price is not readily available or does not otherwise accurately represent the fair value of the security, the security will be valued in accordance with a policy approved by the Board as reflecting fair value. The BlackRock Global Valuation Methodologies Committee (the “Global Valuation Committee”) is the committee formed by management to develop global pricing policies and procedures and to oversee the pricing function for all financial instruments.
Fair Value Inputs and Methodologies: The following methods and inputs are used to establish the fair value of the Fund’s assets and liabilities:
| • | Equity investments traded on a recognized securities exchange are valued at that day’s official closing price, as applicable, on the exchange where the stock is primarily traded. Equity investments traded on a recognized exchange for which there were no sales on that day may be valued at the last available bid (long positions) or ask (short positions) price. |
Generally, trading in foreign instruments is substantially completed each day at various times prior to the close of trading on the NYSE. Occasionally, events affecting the values of such instruments may occur between the foreign market close and the close of trading on the NYSE that may not be reflected in the computation of the Fund’s net assets. Each business day, the Fund uses a pricing service to assist with the valuation of certain foreign exchange-traded equity securities and foreign exchange-traded and over-the-counter (“OTC”) options (the “Systematic Fair Value Price”). Using current market factors, the Systematic Fair Value Price is designed to value such foreign securities and foreign options at fair value as of the close of trading on the NYSE, which follows the close of the local markets.
| • | Fixed-income investments for which market quotations are readily available are generally valued using the last available bid price or current market quotations provided by independent dealers or third party pricing services. Floating rate loan interests are valued at the mean of the bid prices from one or more independent brokers or dealers as obtained from a third party pricing service. Pricing services generally value fixed-income securities assuming orderly transactions of an institutional round lot size, but a fund may hold or transact in such securities in smaller, odd lot sizes. Odd lots may trade at lower prices than institutional round lots. The pricing services may use matrix pricing or valuation models that utilize certain inputs and assumptions to derive values, including transaction data (e.g., recent representative bids and offers), market data, credit quality information, perceived market movements, news, and other relevant information. Certain fixed-income securities, including asset-backed and mortgage related securities may be valued based on valuation models that consider the estimated cash flows of each tranche of the entity, establish a benchmark yield and develop an estimated tranche specific spread to the benchmark yield based on the unique attributes of the tranche. The amortized cost method of valuation may be used with respect to debt obligations with sixty days or less remaining to maturity unless the Manager determines such method does not represent fair value. |
| • | Investments in open-end U.S. mutual funds (including money market funds) are valued at that day’s published net asset value (“NAV”). |
NOTES TO CONSOLIDATED FINANCIAL STATEMENTS | 69 |
Notes to Consolidated Financial Statements (continued)
| • | Futures contracts are valued based on that day’s last reported settlement or trade price on the exchange where the contract is traded. |
| • | Forward foreign currency exchange contracts are valued at the mean between the bid and ask prices and are determined as of the close of trading on the NYSE based on that day’s prevailing forward exchange rate for the underlying currencies. |
| • | Exchange-traded options are valued at the mean between the last bid and ask prices at the close of the options market in which the options trade. An exchange-traded option for which there is no mean price is valued at the last bid (long positions) or ask (short positions) price. If no bid or ask price is available, the prior day’s price will be used, unless it is determined that the prior day’s price no longer reflects the fair value of the option. OTC options and options on swaps (“swaptions”) are valued by an independent pricing service using a mathematical model, which incorporates a number of market data factors, such as the trades and prices of the underlying instruments. |
| • | Swap agreements are valued utilizing quotes received daily by independent pricing services or through brokers, which are derived using daily swap curves and models that incorporate a number of market data factors, such as discounted cash flows, trades and values of the underlying reference instruments. |
If events (e.g., a market closure, market volatility, company announcement or a natural disaster) occur that are expected to materially affect the value of such investment, or in the event that application of these methods of valuation results in a price for an investment that is deemed not to be representative of the market value of such investment, or if a price is not available, the investment will be valued by the Global Valuation Committee, or its delegate, in accordance with a policy approved by the Board as reflecting fair value (“Fair Valued Investments”). The fair valuation approaches that may be used by the Global Valuation Committee include market approach, income approach and cost approach. Valuation techniques such as discounted cash flow, use of market comparables and matrix pricing are types of valuation approaches and are typically used in determining fair value. When determining the price for Fair Valued Investments, the Global Valuation Committee, or its delegate, seeks to determine the price that the Fund might reasonably expect to receive or pay from the current sale or purchase of that asset or liability in an arm’s-length transaction. Fair value determinations shall be based upon all available factors that the Global Valuation Committee, or its delegate, deems relevant and consistent with the principles of fair value measurement. The pricing of all Fair Valued Investments is subsequently reported to the Board or a committee thereof on a quarterly basis.
For investments in equity or debt issued by privately held companies or funds (“Private Company” or collectively, the “Private Companies”) and other Fair Valued Investments, the fair valuation approaches that are used by the Global Valuation Committee and third party pricing services utilize one or a combination of, but not limited to, the following inputs.
| Standard Inputs Generally Considered By Third Party Pricing Services | ||
Market approach | (i) recent market transactions, including subsequent rounds of financing, in the underlying investment or comparable issuers; (ii) recapitalizations and other transactions across the capital structure; and (iii) market multiples of comparable issuers. | |
Income approach | (i) future cash flows discounted to present and adjusted as appropriate for liquidity, credit, and/or market risks; (ii) quoted prices for similar investments or assets in active markets; and (iii) other risk factors, such as interest rates, yield curves, volatilities, prepayment speeds, loss severities, credit risks, recovery rates, liquidation amounts and/or default rates. | |
Cost approach | (i) audited or unaudited financial statements, investor communications and financial or operational metrics issued by the Private Company; (ii) changes in the valuation of relevant indices or publicly traded companies comparable to the Private Company; (iii) relevant news and other public sources; and (iv) known secondary market transactions in the Private Company’s interests and merger or acquisition activity in companies comparable to the Private Company. |
Investments in series of preferred stock issued by Private Companies are typically valued utilizing market approach in determining the enterprise value of the company. Such investments often contain rights and preferences that differ from other series of preferred and common stock of the same issuer. Enterprise valuation techniques such as an option pricing model (“OPM”), a probability weighted expected return model (“PWERM”), current value method or a hybrid of those techniques are used, as deemed appropriate under the circumstances. The use of these valuation techniques involve a determination of the exit scenarios of the investment in order to appropriately allocate the enterprise value of the company among the various parts of its capital structure.
The Private Companies are not subject to the public company disclosure, timing, and reporting standards applicable to other investments held by the Fund. Typically, the most recently available information by a Private Company is as of a date that is earlier than the date the Fund is calculating its NAV. This factor may result in a difference between the value of the investment and the price the Fund could receive upon the sale of the investment.
Fair Value Hierarchy: Various inputs are used in determining the fair value of financial instruments. These inputs to valuation techniques are categorized into a fair value hierarchy consisting of three broad levels for financial reporting purposes as follows:
| • | Level 1 – Unadjusted price quotations in active markets/exchanges for identical assets or liabilities that the Fund has the ability to access; |
| • | Level 2 – Other observable inputs (including, but not limited to, quoted prices for similar assets or liabilities in markets that are active, quoted prices for identical or similar assets or liabilities in markets that are not active, inputs other than quoted prices that are observable for the assets or liabilities (such as interest rates, yield curves, volatilities, prepayment speeds, loss severities, credit risks and default rates) or other market–corroborated inputs); and |
| • | Level 3 – Unobservable inputs based on the best information available in the circumstances, to the extent observable inputs are not available (including the Global Valuation Committee’s assumptions used in determining the fair value of financial instruments). |
| 70 | 2 0 2 1 BLACK ROCK ANNUAL REPORT TO SHAREHOLDERS |
Notes to Consolidated Financial Statements (continued)
The hierarchy gives the highest priority to unadjusted quoted prices in active markets for identical assets or liabilities (Level 1 measurements) and the lowest priority to unobservable inputs (Level 3 measurements). Accordingly, the degree of judgment exercised in determining fair value is greatest for instruments categorized in Level 3. The inputs used to measure fair value may fall into different levels of the fair value hierarchy. In such cases, for disclosure purposes, the fair value hierarchy classification is determined based on the lowest level input that is significant to the fair value measurement in its entirety. Investments classified within Level 3 have significant unobservable inputs used by the Global Valuation Committee in determining the price for Fair Valued Investments. Level 3 investments include equity or debt issued by Private Companies that may not have a secondary market and/or may have a limited number of investors. The categorization of a value determined for financial instruments is based on the pricing transparency of the financial instruments and is not necessarily an indication of the risks associated with investing in those securities.
| 4. | SECURITIES AND OTHER INVESTMENTS |
Asset-Backed and Mortgage-Backed Securities: Asset-backed securities are generally issued as pass-through certificates or as debt instruments. Asset-backed securities issued as pass-through certificates represent undivided fractional ownership interests in an underlying pool of assets. Asset-backed securities issued as debt instruments, which are also known as collateralized obligations, are typically issued as the debt of a special purpose entity organized solely for the purpose of owning such assets and issuing such debt. Asset-backed securities are often backed by a pool of assets representing the obligations of a number of different parties. The yield characteristics of certain asset-backed securities may differ from traditional debt securities. One such major difference is that all or a principal part of the obligations may be prepaid at any time because the underlying assets (i.e., loans) may be prepaid at any time. As a result, a decrease in interest rates in the market may result in increases in the level of prepayments as borrowers, particularly mortgagors, refinance and repay their loans. An increased prepayment rate with respect to an asset-backed security will have the effect of shortening the maturity of the security. In addition, a fund may subsequently have to reinvest the proceeds at lower interest rates. If a fund has purchased such an asset-backed security at a premium, a faster than anticipated prepayment rate could result in a loss of principal to the extent of the premium paid.
For mortgage pass-through securities (the “Mortgage Assets”) there are a number of important differences among the agencies and instrumentalities of the U.S. Government that issue mortgage-related securities and among the securities that they issue. For example, mortgage-related securities guaranteed by Ginnie Mae are guaranteed as to the timely payment of principal and interest by Ginnie Mae and such guarantee is backed by the full faith and credit of the United States. However, mortgage-related securities issued by Freddie Mac and Fannie Mae, including Freddie Mac and Fannie Mae guaranteed mortgage pass-through certificates, which are solely the obligations of Freddie Mac and Fannie Mae, are not backed by or entitled to the full faith and credit of the United States, but are supported by the right of the issuer to borrow from the U.S. Treasury.
Non-agency mortgage-backed securities are securities issued by non-governmental issuers and have no direct or indirect government guarantees of payment and are subject to various risks. Non-agency mortgage loans are obligations of the borrowers thereunder only and are not typically insured or guaranteed by any other person or entity. The ability of a borrower to repay a loan is dependent upon the income or assets of the borrower. A number of factors, including a general economic downturn, acts of God, terrorism, social unrest and civil disturbances, may impair a borrower’s ability to repay its loans.
Inflation-Indexed Bonds: Inflation-indexed bonds (other than municipal inflation-indexed and certain corporate inflation-indexed bonds) are fixed-income securities whose principal value is periodically adjusted according to the rate of inflation. If the index measuring inflation rises or falls, the principal value of inflation-indexed bonds (other than municipal inflation-indexed and certain corporate inflation-indexed bonds) will be adjusted upward or downward, and consequently the interest payable on these securities (calculated with respect to a larger or smaller principal amount) will be increased or reduced, respectively. Any upward or downward adjustment in the principal amount of an inflation-indexed bond is included as interest income in the Consolidated Statements of Operations, even though investors do not receive their principal until maturity. Repayment of the original bond principal upon maturity (as adjusted for inflation) is guaranteed in the case of U.S. Treasury inflation-indexed bonds. For bonds that do not provide a similar guarantee, the adjusted principal value of the bond repaid at maturity may be less than the original principal. With regard to municipal inflation-indexed bonds and certain corporate inflation-indexed bonds, the inflation adjustment is typically reflected in the semi-annual coupon payment. As a result, the principal value of municipal inflation-indexed bonds and such corporate inflation-indexed bonds does not adjust according to the rate of inflation.
Multiple Class Pass-Through Securities: Multiple class pass-through securities, including collateralized mortgage obligations (“CMOs”) and commercial mortgage-backed securities, may be issued by Ginnie Mae, U.S. Government agencies or instrumentalities or by trusts formed by private originators of, or investors in, mortgage loans. In general, CMOs are debt obligations of a legal entity that are collateralized by a pool of residential or commercial mortgage loans or Mortgage Assets. The payments on these are used to make payments on the CMOs or multiple pass-through securities. Multiple class pass-through securities represent direct ownership interests in the Mortgage Assets. Classes of CMOs include interest only (“IOs”), principal only (“POs”), planned amortization classes and targeted amortization classes. IOs and POs are stripped mortgage-backed securities representing interests in a pool of mortgages, the cash flow from which has been separated into interest and principal components. IOs receive the interest portion of the cash flow while POs receive the principal portion. IOs and POs can be extremely volatile in response to changes in interest rates. As interest rates rise and fall, the value of IOs tends to move in the same direction as interest rates. POs perform best when prepayments on the underlying mortgages rise since this increases the rate at which the principal is returned and the yield to maturity on the PO. When payments on mortgages underlying a PO are slower than anticipated, the life of the PO is lengthened and the yield to maturity is reduced. If the underlying Mortgage Assets experience greater than anticipated prepayments of principal, a fund’s initial investment in the IOs may not fully recoup.
Zero-Coupon Bonds: Zero-coupon bonds are normally issued at a significant discount from face value and do not provide for periodic interest payments. These bonds may experience greater volatility in market value than other debt obligations of similar maturity which provide for regular interest payments.
Capital Securities and Trust Preferred Securities: Capital securities, including trust preferred securities, are typically issued by corporations, generally in the form of interest-bearing notes with preferred securities characteristics. In the case of trust preferred securities, an affiliated business trust of a corporation issues these securities, generally in the form of beneficial interests in subordinated debentures or similarly structured securities. The securities can be structured with either a fixed or adjustable coupon that can have either a perpetual or stated maturity date. For trust preferred securities, the issuing bank or corporation pays interest to the trust, which is then distributed to holders of these securities as a dividend. Dividends can be deferred without creating an event of default or acceleration, although maturity cannot take place unless all cumulative payment obligations have been met. The deferral of payments does not affect the purchase or sale of these securities in the open market. These securities generally are rated below that of the issuing company’s senior debt securities and are freely callable at the issuer’s option.
NOTES TO CONSOLIDATED FINANCIAL STATEMENTS | 71 |
Notes to Consolidated Financial Statements (continued)
Preferred Stocks: Preferred stock has a preference over common stock in liquidation (and generally in receiving dividends as well), but is subordinated to the liabilities of the issuer in all respects. As a general rule, the market value of preferred stock with a fixed dividend rate and no conversion element varies inversely with interest rates and perceived credit risk, while the market price of convertible preferred stock generally also reflects some element of conversion value. Because preferred stock is junior to debt securities and other obligations of the issuer, deterioration in the credit quality of the issuer will cause greater changes in the value of a preferred stock than in a more senior debt security with similar stated yield characteristics. Unlike interest payments on debt securities, preferred stock dividends are payable only if declared by the issuer’s board of directors. Preferred stock also may be subject to optional or mandatory redemption provisions.
Warrants: Warrants entitle a fund to purchase a specified number of shares of common stock and are non-income producing. The purchase price and number of shares are subject to adjustment under certain conditions until the expiration date of the warrants, if any. If the price of the underlying stock does not rise above the strike price before the warrant expires, the warrant generally expires without any value and a fund will lose any amount it paid for the warrant. Thus, investments in warrants may involve more risk than investments in common stock. Warrants may trade in the same markets as their underlying stock; however, the price of the warrant does not necessarily move with the price of the underlying stock.
Floating Rate Loan Interests: Floating rate loan interests are typically issued to companies (the “borrower”) by banks, other financial institutions, or privately and publicly offered corporations (the “lender”). Floating rate loan interests are generally non-investment grade, often involve borrowers whose financial condition is troubled or uncertain and companies that are highly leveraged or in bankruptcy proceedings. In addition, transactions in floating rate loan interests may settle on a delayed basis, which may result in proceeds from the sale not being readily available for a fund to make additional investments or meet its redemption obligations. Floating rate loan interests may include fully funded term loans or revolving lines of credit. Floating rate loan interests are typically senior in the corporate capital structure of the borrower. Floating rate loan interests generally pay interest at rates that are periodically determined by reference to a base lending rate plus a premium. Since the rates reset only periodically, changes in prevailing interest rates (and particularly sudden and significant changes) can be expected to cause some fluctuations in the NAV of a fund to the extent that it invests in floating rate loan interests. The base lending rates are generally the lending rate offered by one or more European banks, such as the London Interbank Offered Rate (“LIBOR”), the prime rate offered by one or more U.S. banks or the certificate of deposit rate. Floating rate loan interests may involve foreign borrowers, and investments may be denominated in foreign currencies. These investments are treated as investments in debt securities for purposes of a fund’s investment policies.
When a fund purchases a floating rate loan interest, it may receive a facility fee and when it sells a floating rate loan interest, it may pay a facility fee. On an ongoing basis, a fund may receive a commitment fee based on the undrawn portion of the underlying line of credit amount of a floating rate loan interest. Facility and commitment fees are typically amortized to income over the term of the loan or term of the commitment, respectively. Consent and amendment fees are recorded to income as earned. Prepayment penalty fees, which may be received by a fund upon the prepayment of a floating rate loan interest by a borrower, are recorded as realized gains. A fund may invest in multiple series or tranches of a loan. A different series or tranche may have varying terms and carry different associated risks.
Floating rate loan interests are usually freely callable at the borrower’s option. A fund may invest in such loans in the form of participations in loans (“Participations”) or assignments (“Assignments”) of all or a portion of loans from third parties. Participations typically will result in a fund having a contractual relationship only with the lender, not with the borrower. A fund has the right to receive payments of principal, interest and any fees to which it is entitled only from the lender selling the Participation and only upon receipt by the lender of the payments from the borrower. In connection with purchasing Participations, a fund generally will have no right to enforce compliance by the borrower with the terms of the loan agreement, nor any rights of offset against the borrower. A fund may not benefit directly from any collateral supporting the loan in which it has purchased the Participation. As a result, a fund assumes the credit risk of both the borrower and the lender that is selling the Participation. A fund’s investment in loan participation interests involves the risk of insolvency of the financial intermediaries who are parties to the transactions. In the event of the insolvency of the lender selling the Participation, a fund may be treated as a general creditor of the lender and may not benefit from any offset between the lender and the borrower. Assignments typically result in a fund having a direct contractual relationship with the borrower, and a fund may enforce compliance by the borrower with the terms of the loan agreement.
In connection with floating rate loan interests, the Fund may enter into unfunded floating rate loan interests (“commitments”). In connection with these commitments, the fund earns a commitment fee, typically set as a percentage of the commitment amount. Such fee income, which is included in interest income in the Consolidated Statements of Operations, is recognized ratably over the commitment period. Unfunded floating rate loan interests are marked-to-market daily, and any unrealized appreciation (depreciation) is included in the Consolidated Statement of Assets and Liabilities and Consolidated Statements of Operations. As of period end, the Fund had the following unfunded floating rate loan interests:
| Fund Name | Borrower | Par | Commitment Amount | Value | Unrealized Appreciation (Depreciation) | |||||
BlackRock Global Allocation Fund, Inc. | Opendoor GP II LLC | $ 15,910,000 | $ 15,910,000 | $ 15,910,000 | $ — |
Forward Commitments, When-Issued and Delayed Delivery Securities: The Fund may purchase securities on a when-issued basis and may purchase or sell securities on a forward commitment basis. Settlement of such transactions normally occurs within a month or more after the purchase or sale commitment is made. The Fund may purchase securities under such conditions with the intention of actually acquiring them, but may enter into a separate agreement to sell the securities before the settlement date. Since the value of securities purchased may fluctuate prior to settlement, the Fund may be required to pay more at settlement than the security is worth. In addition, the Fund is not entitled to any of the interest earned prior to settlement. When purchasing a security on a delayed delivery basis, the Fund assumes the rights and risks of ownership of the security, including the risk of price and yield fluctuations. In the event of default by the counterparty, the Fund’s maximum amount of loss is the unrealized appreciation of unsettled when-issued transactions.
Commitments: Commitments are agreements to acquire an investment at a future date (subject to conditions) in connection with a potential public or non-public offering. Such agreements may obligate the Fund to make future cash payments. As of April 30, 2021, the Fund had outstanding commitments of $172,624,375. These commitments are not included in the net assets of the Fund as of April 30, 2021.
| 72 | 2 0 2 1 BLACK ROCK ANNUAL REPORT TO SHAREHOLDERS |
Notes to Consolidated Financial Statements (continued)
Short Sale Transactions: In short sale transactions, a fund sells a security it does not hold in anticipation of a decline in the market price of that security. When a fund makes a short sale, it will borrow the security sold short from a broker/counterparty and deliver the security to the purchaser. To close out a short position, a fund delivers the same security to the broker and records a liability to reflect the obligation to return the security to the broker. The amount of the liability is subsequently marked-to-market to reflect the market value of the short sale. A fund maintains a segregated account of securities or deposits cash with the broker-dealer as collateral for the short sales. Cash deposited with the broker is recorded as an asset in the Consolidated Statement of Assets and Liabilities. Securities segregated as collateral are denoted in the Consolidated Schedule of Investments. A fund may pay a financing fee for the difference between the market value of the short position and the cash collateral deposited with the broker which would be recorded as interest expense. A fund is required to repay the counterparty any dividends received on the security sold short, which, if applicable, is shown as dividend expense in the Consolidated Statements of Operations. A fund may pay a fee on the assets borrowed from the counterparty, which, if applicable, is shown as broker fees and expenses on short sales in the Consolidated Statements of Operations. A fund is exposed to market risk based on the amount, if any, that the market value of the security increases beyond the market value at which the position was sold. Thus, a short sale of a security involves the risk that instead of declining, the price of the security sold short will rise. The short sale of securities involves the possibility of an unlimited loss since there is an unlimited potential for the market price of the security sold short to increase. A gain, limited to the price at which a fund sold the security short. A realized gain or loss is recognized upon the termination of a short sale if the market price is either less than or greater than the proceeds originally received. There is no assurance that a fund will be able to close out a short position at a particular time or at an acceptable price.
Securities Lending: The Fund may lend its securities to approved borrowers, such as brokers, dealers and other financial institutions. The borrower pledges and maintains with the Fund collateral consisting of cash, an irrevocable letter of credit issued by a bank, or securities issued or guaranteed by the U.S. Government. The initial collateral received by the Fund is required to have a value of at least 102% of the current value of the loaned securities for securities traded on U.S. exchanges and a value of at least 105% for all other securities. The collateral is maintained thereafter at a value equal to at least 100% of the current market value of the securities on loan. The market value of the loaned securities is determined at the close of each business day of the Fund and any additional required collateral is delivered to the Fund, or excess collateral returned by the Fund, on the next business day. During the term of the loan, the Fund is entitled to all distributions made on or in respect of the loaned securities, but does not receive interest income on securities received as collateral. Loans of securities are terminable at any time and the borrower, after notice, is required to return borrowed securities within the standard time period for settlement of securities transactions.
As of period end, any securities on loan were collateralized by cash and/or U.S. Government obligations. Cash collateral invested by the securities lending agent, BlackRock Investment Management, LLC (“BIM”), if any, is disclosed in the Consolidated Schedule of Investments. Any non-cash collateral received cannot be sold, re-invested or pledged by the Fund, except in the event of borrower default. The securities on loan, if any, are disclosed in the Fund’s Consolidated Schedule of Investments. The market value of any securities on loan and the value of any related collateral are shown separately in the Consolidated Statement of Assets and Liabilities as a component of investments at value – affiliated and collateral on securities loaned at value, respectively.
Securities lending transactions are entered into by the Fund under Master Securities Lending Agreements (each, an “MSLA”), which provide the right, in the event of default (including bankruptcy or insolvency), for the non-defaulting party to liquidate the collateral and calculate a net exposure to the defaulting party or request additional collateral. In the event that a borrower defaults, the Fund, as lender, would offset the market value of the collateral received against the market value of the securities loaned. When the value of the collateral is greater than that of the market value of the securities loaned, the lender is left with a net amount payable to the defaulting party. However, bankruptcy or insolvency laws of a particular jurisdiction may impose restrictions on or prohibitions against such a right of offset in the event of an MSLA counterparty’s bankruptcy or insolvency. Under the MSLA, absent an event of default, the borrower can resell or re-pledge the loaned securities, and the Fund can reinvest cash collateral received in connection with loaned securities. Upon an event of default, the parties’ obligations to return the securities or collateral to the other party are extinguished, and the parties can resell or re-pledge the loaned securities or the collateral received in connection with the loaned securities in order to satisfy the defaulting party’s net payment obligation for all transactions under the MSLA. The defaulting party remains liable for any deficiency.
The risks of securities lending include the risk that the borrower may not provide additional collateral when required or may not return the securities when due. To mitigate these risks, the Fund benefits from a borrower default indemnity provided by BIM. BIM’s indemnity allows for full replacement of the securities loaned to the extent the collateral received does not cover the value on the securities loaned in the event of borrower default. The Fund could incur a loss if the value of an investment purchased with cash collateral falls below the market value of loaned securities or if the value of an investment purchased with cash collateral falls below the value of the original cash collateral received. Such losses are borne entirely by the Fund.
5. DERIVATIVE FINANCIAL INSTRUMENTS
The Fund engages in various portfolio investment strategies using derivative contracts both to increase the returns of the Fund and/or to manage its exposure to certain risks such as credit risk, equity risk, interest rate risk, foreign currency exchange rate risk, commodity price risk or other risks (e.g., inflation risk). Derivative financial instruments categorized by risk exposure are included in the Consolidated Schedule of Investments. These contracts may be transacted on an exchange or OTC.
Futures Contracts: Futures contracts are purchased or sold to gain exposure to, or manage exposure to, changes in interest rates (interest rate risk) and changes in the value of equity securities (equity risk), foreign currencies (foreign currency exchange rate risk) or bitcoin (commodity risk).
Futures contracts are exchange-traded agreements between the Fund and a counterparty to buy or sell a specific quantity of an underlying instrument at a specified price and on a specified date. Depending on the terms of a contract, it is settled either through physical delivery of the underlying instrument on the settlement date or by payment of a cash amount on the settlement date. The Fund may invest in cash-settled bitcoin futures that are traded on commodity exchanges registered with the CFTC. Upon entering into a futures contract, the Fund is required to deposit initial margin with the broker in the form of cash or securities in an amount that varies depending on a contract’s size and risk profile. The initial margin deposit must then be maintained at an established level over the life of the contract. Amounts pledged, which are considered restricted, are included in cash pledged for futures contracts in the Consolidated Statement of Assets and Liabilities.
Securities deposited as initial margin are designated in the Consolidated Schedule of Investments and cash deposited, if any, are shown as cash pledged for futures contracts in the Consolidated Statement of Assets and Liabilities. Pursuant to the contract, the Fund agrees to receive from or pay to the broker an amount of cash equal to the daily
NOTES TO CONSOLIDATED FINANCIAL STATEMENTS | 73 |
Notes to Consolidated Financial Statements (continued)
fluctuation in market value of the contract (“variation margin”). Variation margin is recorded as unrealized appreciation (depreciation) and, if any, shown as variation margin receivable (or payable) on futures contracts in the Consolidated Statement of Assets and Liabilities. When the contract is closed, a realized gain or loss is recorded in the Consolidated Statements of Operations equal to the difference between the notional amount of the contract at the time it was opened and the notional amount at the time it was closed. The use of futures contracts involves the risk of an imperfect correlation in the movements in the price of futures contracts and interest rates, foreign currency exchange rates or underlying assets.
Forward Foreign Currency Exchange Contracts: Forward foreign currency exchange contracts are entered into to gain or reduce exposure to foreign currencies (foreign currency exchange rate risk).
A forward foreign currency exchange contract is an agreement between two parties to buy and sell a currency at a set exchange rate on a specified date. These contracts help to manage the overall exposure to the currencies in which some of the investments held by the Fund are denominated and in some cases, may be used to obtain exposure to a particular market. The contracts are traded OTC and not on an organized exchange.
The contract is marked-to-market daily and the change in market value is recorded as unrealized appreciation (depreciation) in the Consolidated Statement of Assets and Liabilities. When a contract is closed, a realized gain or loss is recorded in the Consolidated Statements of Operations equal to the difference between the value at the time it was opened and the value at the time it was closed. Non-deliverable forward foreign currency exchange contracts are settled with the counterparty in cash without the delivery of foreign currency. The use of forward foreign currency exchange contracts involves the risk that the value of a forward foreign currency exchange contract changes unfavorably due to movements in the value of the referenced foreign currencies, and such value may exceed the amount(s) reflected in the Consolidated Statement of Assets and Liabilities. Cash amounts pledged for forward foreign currency exchange contracts are considered restricted and are included in cash pledged as collateral for OTC derivatives in the Consolidated Statement of Assets and Liabilities. A Fund’s risk of loss from counterparty credit risk on OTC derivatives is generally limited to the aggregate unrealized gain netted against any collateral held by the Fund.
Options: The Fund may purchase and write call and put options to increase or decrease its exposure to the risks of underlying instruments, including equity risk, interest rate risk and/or commodity price risk and/or, in the case of options written, to generate gains from options premiums.
A call option gives the purchaser (holder) of the option the right (but not the obligation) to buy, and obligates the seller (writer) to sell (when the option is exercised) the underlying instrument at the exercise or strike price at any time or at a specified time during the option period. A put option gives the holder the right to sell and obligates the writer to buy the underlying instrument at the exercise or strike price at any time or at a specified time during the option period.
Premiums paid on options purchased and premiums received on options written, as well as the daily fluctuation in market value, are included in investments at value –unaffiliated and options written at value, respectively, in the Consolidated Statement of Assets and Liabilities. When an instrument is purchased or sold through the exercise of an option, the premium is offset against the cost or proceeds of the underlying instrument. When an option expires, a realized gain or loss is recorded in the Consolidated Statements of Operations to the extent of the premiums received or paid. When an option is closed or sold, a gain or loss is recorded in the Consolidated Statements of Operations to the extent the cost of the closing transaction exceeds the premiums received or paid. When the Fund writes a call option, such option is typically “covered,” meaning that it holds the underlying instrument subject to being called by the option counterparty. When the Fund writes a put option, cash is segregated in an amount sufficient to cover the obligation. These amounts, which are considered restricted, are included in cash pledged as collateral for options written in the Consolidated Statement of Assets and Liabilities.
| • | Swaptions — The Fund purchases and writes options on swaps (“swaptions”) primarily to preserve a return or spread on a particular investment or portion of the Fund’s holdings, as a duration management technique or to protect against an increase in the price of securities it anticipates purchasing at a later date. The purchaser and writer of a swaption is buying or granting the right to enter into a previously agreed upon interest rate or credit default swap agreement (interest rate risk and/or credit risk) at any time before the expiration of the option. |
| • | Foreign currency options — The Fund purchases and writes foreign currency options, foreign currency futures and options on foreign currency futures to gain or reduce exposure to foreign currencies (foreign currency exchange rate risk). Foreign currency options give the purchaser the right to buy from or sell to the writer a foreign currency at any time before the expiration of the option. |
| • | Barrier options – The Fund may purchase and write a variety of options with non-standard payout structures or other features (“barrier options”) that are generally traded OTC. |
The Fund may invest in various types of barrier options, including down-and-out options, down-and-in options, double no-touch options, one-touch options, up-and-out options and up-and-in options. Down-and-out options expire worthless to the purchaser if the price of the underlying instrument falls below a specific barrier price level prior to the expiration date. Down-and-in options expire worthless to the purchaser unless the price of the underlying instrument falls below a specific barrier price level prior to the expiration date. Double no-touch options provide the purchaser an agreed-upon payout if the price of the underlying instrument does not reach or surpass predetermined barrier price levels prior to the option’s expiration date. One-touch options provide the purchaser an agreed-upon payout if the price of the underlying instrument reaches or surpasses predetermined barrier price levels prior to the expiration date. Up-and-out options expire worthless to the purchaser if the price of the underlying instrument increases beyond a predetermined barrier price level prior to the expiration date. Up-and-in options can only be exercised when the price of the underlying instrument increases beyond a predetermined barrier price level.
In purchasing and writing options, the Fund bears the risk of an unfavorable change in the value of the underlying instrument or the risk that it may not be able to enter into a closing transaction due to an illiquid market. Exercise of a written option could result in the Fund purchasing or selling a security when it otherwise would not, or at a price different from the current market value.
| 74 | 2 0 2 1 BLACK ROCK ANNUAL REPORT TO SHAREHOLDERS |
Notes to Consolidated Financial Statements (continued)
Swaps: Swap contracts are entered into to manage exposure to issuers, markets and securities. Such contracts are agreements between the Fund and a counterparty to make periodic net payments on a specified notional amount or a net payment upon termination. Swap agreements are privately negotiated in the OTC market and may be entered into as a bilateral contract (“OTC swaps”) or centrally cleared (“centrally cleared swaps”).
For OTC swaps, any upfront premiums paid and any upfront fees received are shown as swap premiums paid and swap premiums received, respectively, in the Consolidated Statement of Assets and Liabilities and amortized over the term of the contract. The daily fluctuation in market value is recorded as unrealized appreciation (depreciation) on OTC Swaps in the Consolidated Statement of Assets and Liabilities. Payments received or paid are recorded in the Consolidated Statements of Operations as realized gains or losses, respectively. When an OTC swap is terminated, a realized gain or loss is recorded in the Consolidated Statements of Operations equal to the difference between the proceeds from (or cost of) the closing transaction and the Fund’s basis in the contract, if any. Generally, the basis of the contract is the premium received or paid.
In a centrally cleared swap, immediately following execution of the swap contract, the swap contract is novated to a central counterparty (the “CCP”) and the CCP becomes the Fund’s counterparty on the swap. The Fund is required to interface with the CCP through the broker. Upon entering into a centrally cleared swap, the Fund is required to deposit initial margin with the broker in the form of cash or securities in an amount that varies depending on the size and risk profile of the particular swap. Securities deposited as initial margin are designated in the Consolidated Schedule of Investments and cash deposited is shown as cash pledged for centrally cleared swaps in the Consolidated Statement of Assets and Liabilities. Amounts pledged, which are considered restricted cash, are included in cash pledged for centrally cleared swaps in the Consolidated Statement of Assets and Liabilities. Pursuant to the contract, the Fund agrees to receive from or pay to the broker an amount of cash equal to the daily fluctuation in market value of the contract (“variation margin”). Variation margin is recorded as unrealized appreciation (depreciation) and shown as variation margin receivable (or payable) on centrally cleared swaps in the Consolidated Statement of Assets and Liabilities. Payments received from (paid to) the counterparty are amortized over the term of the contract and recorded as realized gains (losses) in the Consolidated Statements of Operations, including those at termination.
| • | Credit default swaps — Credit default swaps are entered into to manage exposure to the market or certain sectors of the market, to reduce risk exposure to defaults of corporate and/or sovereign issuers or to create exposure to corporate and/or sovereign issuers to which a fund is not otherwise exposed (credit risk). |
The Fund may either buy or sell (write) credit default swaps on single-name issuers (corporate or sovereign), a combination or basket of single-name issuers or traded indexes. Credit default swaps are agreements in which the protection buyer pays fixed periodic payments to the seller in consideration for a promise from the protection seller to make a specific payment should a negative credit event take place with respect to the referenced entity (e.g., bankruptcy, failure to pay, obligation acceleration, repudiation, moratorium or restructuring). As a buyer, if an underlying credit event occurs, the Fund will either (i) receive from the seller an amount equal to the notional amount of the swap and deliver the referenced security or underlying securities comprising the index, or (ii) receive a net settlement of cash equal to the notional amount of the swap less the recovery value of the security or underlying securities comprising the index. As a seller (writer), if an underlying credit event occurs, the Fund will either pay the buyer an amount equal to the notional amount of the swap and take delivery of the referenced security or underlying securities comprising the index or pay a net settlement of cash equal to the notional amount of the swap less the recovery value of the security or underlying securities comprising the index.
| • | Total return swaps — Total return swaps are entered into to obtain exposure to a security or market without owning such security or investing directly in such market or to exchange the risk/return of one security or market (e.g., fixed-income) with another security or market (e.g., equity or commodity prices) (equity risk, commodity price risk and/or interest rate risk). |
Total return swaps are agreements in which there is an exchange of cash flows whereby one party commits to make payments based on the total return (distributions plus capital gains/losses) of an underlying instrument, or basket of underlying instruments, in exchange for fixed or floating rate interest payments. If the total return of the instrument(s) or index underlying the transaction exceeds or falls short of the offsetting fixed or floating interest rate obligation, the Fund receives payment from or makes a payment to the counterparty.
Certain total return swaps are designed to function as a portfolio of direct investments in long and short equity positions. This means that the Fund has the ability to trade in and out of these long and short positions within the swap and will receive the economic benefits and risks equivalent to direct investment in these positions, subject to certain adjustments due to events related to the counterparty. Benefits and risks include capital appreciation (depreciation), corporate actions and dividends received and paid, all of which are reflected in the swap’s market value. The market value also includes interest charges and credits (“financing fees”) related to the notional values of the long and short positions and cash balances within the swap. These interest charges and credits are based on a specified benchmark rate plus or minus a specified spread determined based upon the country and/or currency of the positions in the portfolio.
Positions within the swap and financing fees are reset periodically. During a reset, any unrealized appreciation (depreciation) on positions and accrued financing fees become available for cash settlement between the Fund and the counterparty. The amounts that are available for cash settlement are recorded as realized gains or losses in the Consolidated Statements of Operations. Cash settlement in and out of the swap may occur at a reset date or any other date, at the discretion of the Fund and the counterparty, over the life of the agreement. Certain swaps have no stated expiration and can be terminated by either party at any time.
| • | Interest rate swaps — Interest rate swaps are entered into to gain or reduce exposure to interest rates or to manage duration, the yield curve or interest rate (interest rate risk). |
Interest rate swaps are agreements in which one party pays a stream of interest payments, either fixed or floating, in exchange for another party’s stream of interest payments, either fixed or floating, on the same notional amount for a specified period of time. In more complex interest rate swaps, the notional principal amount may decline (or amortize) over time.
| • | Currency swaps — Currency swaps are entered into to gain or reduce exposure to foreign currencies (foreign currency exchange rate risk). |
Currency swaps are interest rate swaps in which one party pays a stream of interest payments, either fixed or floating, in exchange for another party’s stream of interest payments, either fixed or floating, based on the notional amounts of two different currencies. The notional amounts are typically determined based on the spot exchange
NOTES TO CONSOLIDATED FINANCIAL STATEMENTS | 75 |
Notes to Consolidated Financial Statements (continued)
rates at the inception of the trade. Currency swaps may also involve an exchange of notional amounts at the start, during and/or at expiration of the contract, either at the current spot rate or another specified rate.
Swap transactions involve, to varying degrees, elements of interest rate, credit and market risk in excess of the amounts recognized in the Consolidated Statement of Assets and Liabilities. Such risks involve the possibility that there will be no liquid market for these agreements, that the counterparty to the agreements may default on its obligation to perform or disagree as to the meaning of the contractual terms in the agreements, and that there may be unfavorable changes in interest rates and/or market values associated with these transactions.
Master Netting Arrangements: In order to define its contractual rights and to secure rights that will help it mitigate its counterparty risk, the Fund may enter into an International Swaps and Derivatives Association, Inc. Master Agreement (“ISDA Master Agreement”) or similar agreement with its counterparties. An ISDA Master Agreement is a bilateral agreement between a Fund and a counterparty that governs certain OTC derivatives and typically contains, among other things, collateral posting terms and netting provisions in the event of a default and/or termination event. Under an ISDA Master Agreement, a Fund may, under certain circumstances, offset with the counterparty certain derivative financial instruments’ payables and/or receivables with collateral held and/or posted and create one single net payment. The provisions of the ISDA Master Agreement typically permit a single net payment in the event of default including the bankruptcy or insolvency of the counterparty. However, bankruptcy or insolvency laws of a particular jurisdiction may impose restrictions on or prohibitions against the right of offset in bankruptcy, insolvency or other events.
Collateral Requirements: For derivatives traded under an ISDA Master Agreement, the collateral requirements are typically calculated by netting the mark-to-market amount for each transaction under such agreement and comparing that amount to the value of any collateral currently pledged by the Fund and the counterparty.
Cash collateral that has been pledged to cover obligations of the Fund and cash collateral received from the counterparty, if any, is reported separately in the Consolidated Statement of Assets and Liabilities as cash pledged as collateral and cash received as collateral, respectively. Non-cash collateral pledged by the Fund, if any, is noted in the Consolidated Schedule of Investments. Generally, the amount of collateral due from or to a counterparty is subject to a certain minimum transfer amount threshold before a transfer is required, which is determined at the close of business of the Fund. Any additional required collateral is delivered to/pledged by the Fund on the next business day. Typically, the counterparty is not permitted to sell, re-pledge or use cash and non-cash collateral it receives. The Fund generally agrees not to use non-cash collateral that it receives but may, absent default or certain other circumstances defined in the underlying ISDA Master Agreement, be permitted to use cash collateral received. In such cases, interest may be paid pursuant to the collateral arrangement with the counterparty. To the extent amounts due to the Fund from the counterparties are not fully collateralized, the Fund bears the risk of loss from counterparty non-performance. Likewise, to the extent the Fund has delivered collateral to a counterparty and stands ready to perform under the terms of its agreement with such counterparty, the Fund bears the risk of loss from a counterparty in the amount of the value of the collateral in the event the counterparty fails to return such collateral. Based on the terms of agreements, collateral may not be required for all derivative contracts.
For financial reporting purposes, the Fund does not offset derivative assets and derivative liabilities that are subject to netting arrangements, if any, in the Consolidated Statement of Assets and Liabilities.
| 6. | INVESTMENT ADVISORY AGREEMENT AND OTHER TRANSACTIONS WITH AFFILIATES |
Investment Advisory: The Fund entered into an Investment Advisory Agreement with the Manager, the Fund’s investment adviser and an indirect, wholly-owned subsidiary of BlackRock, Inc. (“BlackRock”), to provide investment advisory and administrative services. The Manager is responsible for the management of the Fund’s portfolio and provides the personnel, facilities, equipment and certain other services necessary to the operations of the Fund.
For such services, the Fund pays the Manager a monthly fee at an annual rate equal to 0.75% of the average daily value of the Fund’s net assets.
The Fund reimbursed the Manager for certain accounting services, which is included in accounting services in the Consolidated Statements of Operations. The reimbursements were as follows:
| Amounts Reimbursed | ||||||||
| Fund Name | Period from to 04/30/21 | Year Ended 10/31/20 | ||||||
BlackRock Global Allocation Fund, Inc. | $ | 138,925 | $ | 252,067 | ||||
The Manager provides investment management and other services to the Subsidiary. The Manager does not receive separate compensation from the Subsidiary for providing investment management or administrative services. However, the Fund pays the Manager based on the Fund’s net assets, which includes the assets of the Subsidiary.
Service and Distribution Fees: The Fund entered into a Distribution Agreement and a Distribution and Service Plan with BlackRock Investments, LLC (“BRIL”), an affiliate of the Manager. Pursuant to the Distribution and Service Plan and in accordance with Rule 12b-1 under the 1940 Act, the Fund pays BRIL ongoing service and distribution fees.
The fees are accrued daily and paid monthly at annual rates based upon the average daily net assets of the relevant share class of the Fund as follows:
| Share Class | Service Fees | Distribution Fees | ||||||
Investor A | 0.25 | % | N/A | |||||
Investor C | 0.25 | 0.75 | % | |||||
Class R | 0.25 | 0.25 | ||||||
BRIL and broker-dealers, pursuant to sub-agreements with BRIL, provide shareholder servicing and distribution services to the Fund. The ongoing service and/or distribution fee compensates/reimburses BRIL and each broker-dealer for providing shareholder servicing and/or distribution related services to shareholders.
| 76 | 2 0 2 1 BLACK ROCK ANNUAL REPORT TO SHAREHOLDERS |
Notes to Consolidated Financial Statements (continued)
The following table shows the class specific service and distribution fees borne directly by each share class of the Fund:
| Service and distribution — class specific | ||||||||
| Fund Name/Share Class | Period from to 04/30/21 | Year Ended 10/31/20 | ||||||
BlackRock Global Allocation Fund, Inc. | ||||||||
Investor A | $ | 16,228,650 | $ | 26,163,358 | ||||
Investor C | 6,642,789 | 24,019,828 | ||||||
Class R | 1,091,026 | 2,403,524 | ||||||
|
|
|
| |||||
| $ | 23,962,465 | $ | 52,586,710 | |||||
|
|
|
| |||||
Transfer Agent: Pursuant to written agreements, certain financial intermediaries, some of which may be affiliates, provide the Fund with sub-accounting, recordkeeping, sub-transfer agency and other administrative services with respect to servicing of underlying investor accounts. For these services, these entities receive an asset-based fee or an annual fee per shareholder account, which will vary depending on share class and/or net assets. The Fund paid the following amounts to affiliates of BlackRock in return for these services, which are included in transfer agent — class specific in the Consolidated Statements of Operations:
| Amounts paid to affiliates | ||||||||
| Fund Name/Share Class | Period from to 04/30/21 | Year Ended 10/31/20 | ||||||
BlackRock Global Allocation Fund, Inc. | ||||||||
Institutional | $ | 10,867 | $ | 56,923 | ||||
Investor A | 357 | 96 | ||||||
|
|
|
| |||||
| $ | 11,224 | $ | 57,019 | |||||
|
|
|
| |||||
The Manager maintains a call center that is responsible for providing certain shareholder services to the Fund. Shareholder services include responding to inquiries and processing purchases and sales based upon instructions from shareholders. The Fund reimbursed the Manager the following amounts for costs incurred in running the call center, which are included in transfer agent — class specific in the Consolidated Statements of Operations:
| Amounts Reimbursed | ||||||||
| Fund Name/Share Class | Period from to 04/30/21 | Year Ended 10/31/20 | ||||||
BlackRock Global Allocation Fund, Inc. | ||||||||
Institutional | $ | 12,432 | $ | 19,830 | ||||
Investor A | 104,244 | 199,240 | ||||||
Investor C | 47,326 | 93,985 | ||||||
Class K | 1,180 | 5,775 | ||||||
Class R | 1,736 | 3,056 | ||||||
|
|
|
| |||||
| $ | 166,918 | $ | 321,886 | |||||
|
|
|
| |||||
The following table shows the class specific transfer agent fees borne directly by each share class of the Fund:
Transfer agent fees — class specific | ||||||||
| Fund Name/Share Class | Period from to 04/30/21 | Year Ended 10/31/20 | ||||||
BlackRock Global Allocation Fund, Inc. | ||||||||
Institutional | $ | 3,891,142 | $ | 6,491,811 | ||||
Investor A | 5,974,083 | 10,654,941 | ||||||
Investor C | 803,159 | 2,817,602 | ||||||
Class K | 19,975 | 81,539 | ||||||
Class R | 421,214 | 907,714 | ||||||
|
|
|
| |||||
| $ | 11,109,573 | $ | 20,953,607 | |||||
|
|
|
| |||||
NOTES TO CONSOLIDATED FINANCIAL STATEMENTS | 77 |
Notes to Consolidated Financial Statements (continued)
Other Fees: Affiliates earned underwriting discounts, direct commissions and dealer concessions on sales of the Fund’s Investor A Shares are as follows:
| Amounts Earned | ||||||||
| Fund Name/Share Class | Period from to 04/30/21 | Year Ended 10/31/20 | ||||||
BlackRock Global Allocation Fund, Inc. | ||||||||
Investor A | $ | 124,906 | $ | 128,219 | ||||
Affiliates received CDSCs as follows:
| CDSC | ||||||||
| Fund Name/Share Class | Period from to 04/30/21 | Year Ended 10/31/20 | ||||||
BlackRock Global Allocation Fund, Inc. | ||||||||
Investor A | $ | 28,435 | $ | 74,341 | ||||
Investor C | 27,861 | 57,697 | ||||||
|
|
|
| |||||
| $ | 56,296 | $ | 132,038 | |||||
|
|
|
| |||||
Expense Waivers and Reimbursements: The Manager contractually agreed to waive a portion of its investment advisory fees payable by the Fund through February 28, 2022, so that the Manager receives such fees as a percentage of average daily net assets of the Fund as follows:
| Average Daily Net Assets | Investment Advisory Fees | |
First $10 billion | 0.75% | |
$10 billion — $15 billion | 0.69 | |
$15 billion — $20 billion | 0.68 | |
$20 billion — $25 billion | 0.67 | |
$25 billion — $30 billion | 0.65 | |
$30 billion — $40 billion | 0.63 | |
$40 billion — $60 billion | 0.62 | |
$60 billion — $80 billion | 0.61 | |
Greater than $80 billion. | 0.60 |
This contractual agreement may be terminated upon 90 days’ notice by a majority of the directors who are not “interested persons” of the Fund as defined in the 1940 Act (the “Independent Directors”), or by a vote of a majority of the outstanding voting securities of the Fund. This amount is included in fees waived and/or reimbursed by the Manager in the Consolidated Statements of Operations. The amounts waived pursuant to this agreement were as follows:
| Amounts Waived | ||||||||
| Fund Name | Period from to 04/30/21 | Year Ended 10/31/20 | ||||||
BlackRock Global Allocation Fund, Inc. | $ | 5,546,027 | $ | 8,515,091 | ||||
The Manager contractually agreed to waive its investment advisory fees by the amount of investment advisory fees the Fund pays to the Manager indirectly through its investment in affiliated money market funds (the “affiliated money market fund waiver”) through February 28, 2022. The contractual agreement may be terminated upon 90 days’ notice by a majority of the Independent Directors or by a vote of a majority of the outstanding voting securities of the Fund. Prior to February 28, 2020, this waiver was voluntary. This amount is included in fees waived and/or reimbursed by the Manager in the Consolidated Statements of Operations. The amounts waived were as follows:
| Amounts Waived | ||||||||
| Fund Name | Period from 11/01/20 to 04/30/21 | Year Ended 10/31/20 | ||||||
BlackRock Global Allocation Fund, Inc. | $ | 26,282 | $ | 31,383 | ||||
The Manager has contractually agreed to waive its investment advisory fee with respect to any portion of the Fund’s assets invested in affiliated equity and fixed-income mutual funds and affiliated exchange-traded funds that have a contractual management fee through February 28, 2022. The contractual agreement may be terminated upon 90 days’
| 78 | 2 0 2 1 BLACK ROCK ANNUAL REPORT TO SHAREHOLDERS |
Notes to Consolidated Financial Statements (continued)
notice by a majority of the Independent Directors, or by a vote of a majority of the outstanding voting securities of the Fund. The amounts waived in investment advisory fees pursuant to these arrangements were as follows:
| Amounts Waived | ||||||||
| Fund Name | Period from to 04/30/21 | Year Ended 10/31/20 | ||||||
BlackRock Global Allocation Fund, Inc. | $ | 1,967,279 | $ | 1,730,286 | ||||
Securities Lending: The U.S. Securities and Exchange Commission (“SEC”) has issued an exemptive order which permits BlackRock Investment Management, LLC (“BIM”), an affiliate of the Manager, to serve as securities lending agent for the Fund, subject to applicable conditions. As securities lending agent, BIM bears all operational costs directly related to securities lending. The Fund is responsible for expenses in connection with the investment of cash collateral received for securities on loan (the “collateral investment expenses”). The cash collateral is invested in a private investment company, SL Liquidity Series, LLC, Money Market Series (the “Money Market Series”), managed by the Manager or its affiliates. However, BIM has agreed to cap the collateral investment expenses of the Money Market Series to an annual rate of 0.04%. The investment adviser to the Money Market Series will not charge any advisory fees with respect to shares purchased by the Fund. The Money Market Series may, under certain circumstances, impose a liquidity fee of up to 2% of the value withdrawn or temporarily restrict withdrawals for up to 10 business days during a 90 day period, in the event that the private investment company’s weekly liquid assets fall below certain thresholds. The Money Market Series seeks current income consistent with maintaining liquidity and preserving capital. Although the Money Market Series is not registered under the 1940 Act, its investments may follow the parameters of investments by a money market fund that is subject to Rule 2a-7 under the 1940 Act.
Securities lending income is equal to the total of income earned from the reinvestment of cash collateral, net of fees and other payments to and from borrowers of securities, and less the collateral investment expenses. The Fund retains a portion of securities lending income and remits a remaining portion to BIM as compensation for its services as securities lending agent.
Pursuant to the current securities lending agreement, the Fund retains 82% of securities lending income (which excludes collateral investment expenses), and this amount retained can never be less than 70% of the total of securities lending income plus the collateral investment expenses.
In addition, commencing the business day following the date that the aggregate securities lending income earned across the BlackRock Multi-Asset Complex in a calendar year exceeds a specified threshold, the Fund, pursuant to the securities lending agreement, will retain for the remainder of that calendar year securities lending income in an amount equal to 85% of securities lending income (which excludes collateral investment expenses), and this amount retained can never be less than 70% of the total of securities lending income plus the collateral investment expenses.
The share of securities lending income earned by the Fund is shown as securities lending income — affiliated – net in the Consolidated Statements of Operations. The Fund paid BIM for securities lending agent services as follows:
| Amounts | ||||||||
| Fund Name | Period from to 04/30/21 | Year Ended 10/31/20 | ||||||
BlackRock Global Allocation Fund, Inc. | $ | 418,877 | $ | 452,570 | ||||
Interfund Lending: In accordance with an exemptive order (the “Order”) from the SEC, the Fund may participate in a joint lending and borrowing facility for temporary purposes (the “Interfund Lending Program”), subject to compliance with the terms and conditions of the Order, and to the extent permitted by the Fund’s investment policies and restrictions. The Fund is currently permitted to borrow under the Interfund Lending Program.
A lending BlackRock fund may lend in aggregate up to 15% of its net assets, but may not lend more than 5% of its net assets to any one borrowing fund through the Interfund Lending Program. A borrowing BlackRock fund may not borrow through the Interfund Lending Program or from any other source more than 33 1/3% of its total assets (or any lower threshold provided for by the fund’s investment restrictions). If a borrowing BlackRock fund’s total outstanding borrowings exceed 10% of its total assets, each of its outstanding interfund loans will be subject to collateralization of at least 102% of the outstanding principal value of the loan. All interfund loans are for temporary or emergency purposes and the interest rate to be charged will be the average of the highest current overnight repurchase agreement rate available to a lending fund and the bank loan rate, as calculated according to a formula established by the Board.
During the period ended April 30, 2021, the Fund did not participate in the Interfund Lending Program.
Directors and Officers: Certain directors and/or officers of the Fund are directors and/or officers of BlackRock or its affiliates. The Fund reimburses the Manager for a portion of the compensation paid to the Fund’s Chief Compliance Officer, which is included in Directors and Officer in the Consolidated Statements of Operations.
Other Transactions: The Fund may purchase securities from, or sell securities to, an affiliated fund provided the affiliation is due solely to having a common investment adviser, common officers, or common directors. For the period ended April 30, 2021, the purchase and sale transactions and any net realized gains (losses) with affiliated funds in compliance with Rule 17a-7 under the 1940 Act were as follows:
| Fund Name | Purchases | Sales | Net Realized Gain (Loss) | |||
BlackRock Global Allocation Fund, Inc. | $ 2,819,910 | $ 30,369 | $ 118 |
NOTES TO CONSOLIDATED FINANCIAL STATEMENTS | 79 |
Notes to Consolidated Financial Statements (continued)
| 7. | PURCHASES AND SALES |
For the period ended April 30, 2021, purchases and sales of investments, including paydowns/payups and excluding short-term investments, were as follows:
| U.S. Government Securities | Other Securities | |||||||
| Fund Name | Purchases | Sales | Purchases | Sales | ||||
BlackRock Global Allocation Fund, Inc. | $ 277,598,679 | $ 1,467,175,036 | $ 14,232,193,903 | $ 12,827,864,583 | ||||
| 8. | INCOME TAX INFORMATION |
It is the Fund’s policy to comply with the requirements of the Internal Revenue Code of 1986, as amended, applicable to regulated investment companies, and to distribute substantially all of its taxable income to its shareholders. Therefore, no U.S. federal income tax provision is required.
The Fund files U.S. federal and various state and local tax returns. No income tax returns are currently under examination. The statute of limitations on the Fund’s U.S. federal tax returns generally remains open for a period of three fiscal years after they are filed. The statutes of limitations on the Fund’s state and local tax returns may remain open for an additional year depending upon the jurisdiction.
Management has analyzed tax laws and regulations and their application to the Fund as of April 30, 2021, inclusive of the open tax return years, and does not believe that there are any uncertain tax positions that require recognition of a tax liability in the Fund’s consolidated financial statements.
U.S. GAAP requires that certain components of net assets be adjusted to reflect permanent differences between financial and tax reporting. These reclassifications have no effect on net assets or NAVs per share. As of period end, the following permanent differences attributable to income recognized from wholly owned subsidiary and certain deemed distributions were reclassified to the following accounts:
| Fund Name | Paid-in Capital | Accumulated Earnings (Loss) | ||
BlackRock Global Allocation Fund, Inc. | $ 54,204,151 | $ (54,204,151) |
The tax character of distributions paid was as follows:
| Fund Name | Period from to 04/30/21 | Year Ended 10/31/20 | Year Ended 10/31/19 | |||
BlackRock Global Allocation Fund, Inc. | ||||||
Ordinary income(a) | $ 828,015,381 | $ 701,602,430 | $ 301,805,775 | |||
Long-term capital gains(a) | 324,273,863 | 1,005,848,390 | 1,673,336,233 | |||
|
|
| ||||
| $ 1,152,289,244 | $ 1,707,450,820 | $ 1,975,142,008 | ||||
|
|
|
| (a) | Distribution amounts may include a portion of the proceeds from redeemed shares. |
As of period end, the tax components of accumulated earnings (loss) were as follows:
| Fund Name | Undistributed Ordinary Income | Undistributed Long-Term Capital Gains | Net Unrealized Gains (Losses)(a) | Total | ||||
BlackRock Global Allocation Fund, Inc. | $1,154,181,276 | $267,724,703 | $6,193,953,603 | $7,615,859,582 |
| (a) | The difference between book-basis and tax-basis net unrealized gains was attributable primarily to the tax deferral of losses on wash sales and straddles, the realization for tax purposes of unrealized gains/losses on certain futures, options and foreign currency contracts, the realization for tax purposes of unrealized gains on investments in passive foreign investment companies, amortization methods for premiums and discounts on fixed income securities, the accounting for swap agreements and the classification of investment. |
As of April 30, 2021, gross unrealized appreciation and depreciation based on cost of investments (including short positions and derivatives, if any) for U.S. federal income tax purposes were as follows:
| Fund Name | Tax Cost | Gross Unrealized Appreciation | Gross Unrealized Depreciation | Net Unrealized Appreciation (Depreciation) | ||||
BlackRock Global Allocation Fund, Inc. | $21,486,653,801 | $ 7,366,225,471 | $ (712,326,547) | $6,653,898,924 |
| 9. | BANK BORROWINGS |
The Fund, along with certain other funds managed by the Manager and its affiliates (“Participating Funds”), is a party to a 364-day, $2.25 billion credit agreement with a group of lenders. Under this agreement, the Fund may borrow to fund shareholder redemptions. Excluding commitments designated for certain individual funds, the Participating Funds, including the Fund, can borrow up to an aggregate commitment amount of $1.75 billion at any time outstanding, subject to asset coverage and other limitations as specified in the agreement. The credit agreement has the following terms: a fee of 0.10% per annum on unused commitment amounts and interest at a rate equal to the higher
| 80 | 2 0 2 1 BLACK ROCK ANNUAL REPORT TO SHAREHOLDERS |
Notes to Consolidated Financial Statements (continued)
of (a) one-month LIBOR (but, in any event, not less than 0.00%) on the date the loan is made plus 0.80% per annum or (b) the Fed Funds rate (but, in any event, not less than 0.00%) in effect from time to time plus 0.80% per annum on amounts borrowed. The agreement expires in April 2022 unless extended or renewed.
These fees were allocated among such funds based upon portions of the aggregate commitment available to them and relative net assets of Participating Funds. During the period ended April 30, 2021, the Fund did not borrow under the credit agreement.
| 10. | PRINCIPAL RISKS |
In the normal course of business, the Fund invests in securities or other instruments and may enter into certain transactions, and such activities subject the Fund to various risks, including among others, fluctuations in the market (market risk) or failure of an issuer to meet all of its obligations. The value of securities or other instruments may also be affected by various factors, including, without limitation: (i) the general economy; (ii) the overall market as well as local, regional or global political and/or social instability; (iii) regulation, taxation or international tax treaties between various countries; or (iv) currency, interest rate and price fluctuations. Local, regional or global events such as war, acts of terrorism, the spread of infectious illness or other public health issues, recessions, or other events could have a significant impact on the Fund and its investments. The Fund’s prospectus provides details of the risks to which the Fund is subject.
The Fund may be exposed to additional risks when reinvesting cash collateral in money market funds that do not seek to maintain a stable NAV per share of $1.00, which may be subject to redemption gates or liquidity fees under certain circumstances.
Market Risk: The Fund may be exposed to prepayment risk, which is the risk that borrowers may exercise their option to prepay principal earlier than scheduled during periods of declining interest rates, which would force the Fund to reinvest in lower yielding securities. The Fund may also be exposed to reinvestment risk, which is the risk that income from the Fund’s portfolio will decline if the Fund invests the proceeds from matured, traded or called fixed-income securities at market interest rates that are below the Fund portfolio’s current earnings rate.
Municipal securities are subject to the risk that litigation, legislation or other political events, local business or economic conditions, credit rating downgrades, or the bankruptcy of the issuer could have a significant effect on an issuer’s ability to make payments of principal and/or interest or otherwise affect the value of such securities. Municipal securities can be significantly affected by political or economic changes, including changes made in the law after issuance of the securities, as well as uncertainties in the municipal market related to, taxation, legislative changes or the rights of municipal security holders, including in connection with an issuer insolvency. Municipal securities backed by current or anticipated revenues from a specific project or specific assets can be negatively affected by the discontinuance of the tax benefits supporting the project or assets or the inability to collect revenues for the project or from the assets. Municipal securities may be less liquid than taxable bonds, and there may be less publicly available information on the financial condition of municipal security issuers than for issuers of other securities.
An outbreak of respiratory disease caused by a novel coronavirus has developed into a global pandemic and has resulted in closing borders, quarantines, disruptions to supply chains and customer activity, as well as general concern and uncertainty. The impact of this pandemic, and other global health crises that may arise in the future, could affect the economies of many nations, individual companies and the market in general in ways that cannot necessarily be foreseen at the present time. This pandemic may result in substantial market volatility and may adversely impact the prices and liquidity of a fund’s investments. The duration of this pandemic and its effects cannot be determined with certainty.
Valuation Risk: The market values of equities, such as common stocks and preferred securities or equity related investments, such as futures and options, may decline due to general market conditions which are not specifically related to a particular company. They may also decline due to factors which affect a particular industry or industries. The Fund may invest in illiquid investments. An illiquid investment is any investment that the Fund reasonably expects cannot be sold or disposed of in current market conditions in seven calendar days or less without the sale or disposition significantly changing the market value of the investment. The Fund may experience difficulty in selling illiquid investments in a timely manner at the price that it believes the investments are worth. Prices may fluctuate widely over short or extended periods in response to company, market or economic news. Markets also tend to move in cycles, with periods of rising and falling prices. This volatility may cause the Fund’s NAV to experience significant increases or decreases over short periods of time. If there is a general decline in the securities and other markets, the NAV of the Fund may lose value, regardless of the individual results of the securities and other instruments in which the Fund invests.
The price the Fund could receive upon the sale of any particular portfolio investment may differ from the Fund’s valuation of the investment, particularly for securities that trade in thin or volatile markets or that are valued using a fair valuation technique or a price provided by an independent pricing service. Changes to significant unobservable inputs and assumptions (i.e., publicly traded company multiples, growth rate, time to exit) due to the lack of observable inputs may significantly impact the resulting fair value and therefore the Fund’s results of operations. As a result, the price received upon the sale of an investment may be less than the value ascribed by the Fund, and the Fund could realize a greater than expected loss or lesser than expected gain upon the sale of the investment. The Fund’s ability to value its investments may also be impacted by technological issues and/or errors by pricing services or other third party service providers.
Counterparty Credit Risk: The Fund may be exposed to counterparty credit risk, or the risk that an entity may fail to or be unable to perform on its commitments related to unsettled or open transactions, including making timely interest and/or principal payments or otherwise honoring its obligations. The Fund manages counterparty credit risk by entering into transactions only with counterparties that the Manager believes have the financial resources to honor their obligations and by monitoring the financial stability of those counterparties. Financial assets, which potentially expose the Fund to market, issuer and counterparty credit risks, consist principally of financial instruments and receivables due from counterparties. The extent of the Fund’s exposure to market, issuer and counterparty credit risks with respect to these financial assets is approximately their value recorded in the Consolidated Statement of Assets and Liabilities, less any collateral held by the Fund.
A derivative contract may suffer a mark-to-market loss if the value of the contract decreases due to an unfavorable change in the market rates or values of the underlying instrument. Losses can also occur if the counterparty does not perform under the contract.
NOTES TO CONSOLIDATED FINANCIAL STATEMENTS | 81 |
Notes to Consolidated Financial Statements (continued)
For OTC options purchased, the Fund bears the risk of loss in the amount of the premiums paid plus the positive change in market values net of any collateral held by the Fund should the counterparty fail to perform under the contracts. Options written by the Fund do not typically give rise to counterparty credit risk, as options written generally obligate the Fund, and not the counterparty, to perform. The Fund may be exposed to counterparty credit risk with respect to options written to the extent the Fund deposits collateral with its counterparty to a written option.
With exchange-traded options purchased and futures and centrally cleared swaps, there is less counterparty credit risk to the Fund since the exchange or clearinghouse, as counterparty to such instruments, guarantees against a possible default. The clearinghouse stands between the buyer and the seller of the contract; therefore, credit risk is limited to failure of the clearinghouse. While offset rights may exist under applicable law, the Fund does not have a contractual right of offset against a clearing broker or clearinghouse in the event of a default (including the bankruptcy or insolvency). Additionally, credit risk exists in exchange-traded futures and centrally cleared swaps with respect to initial and variation margin that is held in a clearing broker’s customer accounts. While clearing brokers are required to segregate customer margin from their own assets, in the event that a clearing broker becomes insolvent or goes into bankruptcy and at that time there is a shortfall in the aggregate amount of margin held by the clearing broker for all its clients, typically the shortfall would be allocated on a pro rata basis across all the clearing broker’s customers, potentially resulting in losses to the Fund.
Concentration Risk: A diversified portfolio, where this is appropriate and consistent with a fund’s objectives, minimizes the risk that a price change of a particular investment will have a material impact on the NAV of a fund. The investment concentrations within the Fund’s portfolio are disclosed in its Consolidated Schedule of Investments.
The Fund invests a significant portion of its assets in fixed-income securities and/or uses derivatives tied to the fixed-income markets. Changes in market interest rates or economic conditions may affect the value and/or liquidity of such investments. Interest rate risk is the risk that prices of bonds and other fixed-income securities will increase as interest rates fall and decrease as interest rates rise. The Fund may be subject to a greater risk of rising interest rates due to the current period of historically low rates.
The Fund invests a substantial amount of its assets in issuers located in a single country or a limited number of countries. When a Fund concentrates its investments in this manner, it assumes the risk that economic, regulatory, political and social conditions in those countries may have a significant impact on their investment performance and could affect the income from, or the value or liquidity of, the Fund’s portfolio. Foreign issuers may not be subject to the same uniform accounting, auditing and financial reporting standards and practices as used in the United States. Foreign securities markets may also be more volatile and less liquid than U.S. securities and may be less subject to governmental supervision not typically associated with investing in U.S. securities. Investment percentages in specific countries are presented in the Consolidated Schedule of Investments.
LIBOR Transition Risk: The United Kingdom’s Financial Conduct Authority announced a phase out of the London Interbank Offered Rate (“LIBOR”). Although many LIBOR rates will be phased out by the end of 2021, a selection of widely used USD LIBOR rates will continue to be published through June 2023 in order to assist with the transition. The Fund may be exposed to financial instruments tied to LIBOR to determine payment obligations, financing terms, hedging strategies or investment value. The transition process away from LIBOR might lead to increased volatility and illiquidity in markets for, and reduce the effectiveness of new hedges placed against, instruments whose terms currently include LIBOR. The ultimate effect of the LIBOR transition process on the Fund is uncertain.
| 11. | CAPITAL SHARE TRANSACTIONS |
Transactions in capital shares for each class were as follows:
| Period from 11/01/20 to 04/30/21 | Year Ended 10/31/20 | Year Ended 10/31/19 | ||||||||||||||||||||||
| Fund Name / Share Class | Shares | Amounts | Shares | Amounts | Shares | Amounts | ||||||||||||||||||
BlackRock Global Allocation Fund, Inc. | ||||||||||||||||||||||||
Institutional | ||||||||||||||||||||||||
Shares sold | 52,184,951 | $ | 1,147,477,917 | 60,012,764 | $ | 1,165,102,853 | 65,547,601 | $ | 1,211,921,527 | |||||||||||||||
Shares issued in reinvestment of distributions | 17,333,353 | 372,320,424 | 26,172,269 | 505,101,847 | 38,223,294 | 679,170,797 | ||||||||||||||||||
Shares redeemed | (39,492,853 | ) | (868,663,017 | ) | (134,369,913 | ) | (2,548,330,718 | ) | (348,120,063 | ) | (6,489,291,802 | ) | ||||||||||||
|
|
|
|
|
|
|
|
|
|
|
| |||||||||||||
| 30,025,451 | $ | 651,135,324 | (48,184,880 | ) | $ | (878,126,018 | ) | (244,349,168 | ) | $ | (4,598,199,478 | ) | ||||||||||||
|
|
|
|
|
|
|
|
|
|
|
| |||||||||||||
Investor A | ||||||||||||||||||||||||
Shares sold and automatic conversion of shares | 63,193,306 | $ | 1,383,070,747 | 106,473,620 | $ | 2,061,125,684 | 114,513,713 | $ | 2,131,384,710 | |||||||||||||||
Shares issued in reinvestment of distributions | 24,962,356 | 532,197,425 | 34,097,475 | 653,789,198 | 34,806,478 | 615,764,480 | ||||||||||||||||||
Shares redeemed | (44,931,575 | ) | (981,580,809 | ) | (125,629,074 | ) | (2,384,215,581 | ) | (162,648,789 | ) | (3,008,794,310 | ) | ||||||||||||
|
|
|
|
|
|
|
|
|
|
|
| |||||||||||||
| 43,224,087 | $ | 933,687,363 | 14,942,021 | $ | 330,699,301 | (13,328,598 | ) | $ | (261,645,120 | ) | ||||||||||||||
|
|
|
|
|
|
|
|
|
|
|
| |||||||||||||
Investor C | ||||||||||||||||||||||||
Shares sold | 4,665,375 | $ | 90,681,638 | 5,032,820 | $ | 85,563,106 | 7,512,871 | $ | 123,175,408 | |||||||||||||||
Shares issued in reinvestment of distributions | 2,323,190 | 44,094,135 | 10,648,558 | 181,375,674 | 16,253,238 | 256,393,304 | ||||||||||||||||||
Shares redeemed and automatic conversion of shares | (35,378,800 | ) | (686,739,602 | ) | (109,980,242 | ) | (1,877,176,344 | ) | (161,893,916 | ) | (2,696,127,334 | ) | ||||||||||||
|
|
|
|
|
|
|
|
|
|
|
| |||||||||||||
| (28,390,235 | ) | $ | (551,963,829 | ) | (94,298,864 | ) | $ | (1,610,237,564 | ) | (138,127,807 | ) | $ | (2,316,558,622 | ) | ||||||||||
|
|
|
|
|
|
|
|
|
|
|
| |||||||||||||
Class K | ||||||||||||||||||||||||
Shares sold | 18,219,996 | $ | 402,547,780 | 22,010,657 | $ | 426,992,355 | 15,405,222 | $ | 288,087,479 | |||||||||||||||
Shares issued in reinvestment of distributions | 3,345,444 | 71,826,686 | 4,276,611 | 82,541,947 | 4,551,509 | 80,871,066 | ||||||||||||||||||
Shares redeemed | (7,276,430 | ) | (160,853,349 | ) | (18,785,979 | ) | (368,238,193 | ) | (31,310,151 | ) | (589,431,669 | ) | ||||||||||||
|
|
|
|
|
|
|
|
|
|
|
| |||||||||||||
| 14,289,010 | $ | 313,521,117 | 7,501,289 | $ | 141,296,109 | (11,353,420 | ) | $ | (220,473,124 | ) | ||||||||||||||
|
|
|
|
|
|
|
|
|
|
|
| |||||||||||||
| 82 | 2 0 2 1 BLACK ROCK ANNUAL REPORT TO SHAREHOLDERS |
Notes to Consolidated Financial Statements (continued)
| Period from 11/01/20 to 04/30/21 | Year Ended 10/31/20 | Year Ended 10/31/19 | ||||||||||||||||||||||
| Fund Name / Share Class (continued) | Shares | Amounts | Shares | Amounts | Shares | Amounts | ||||||||||||||||||
BlackRock Global Allocation Fund, Inc. (continued) |
| |||||||||||||||||||||||
Class R | ||||||||||||||||||||||||
Shares sold | 1,261,227 | $ | 26,068,999 | 2,333,994 | $ | 42,200,269 | 4,070,448 | $ | 71,438,095 | |||||||||||||||
Shares issued in reinvestment of distributions | 942,598 | 18,983,922 | 1,949,910 | 35,361,742 | 2,644,412 | 44,332,192 | ||||||||||||||||||
Shares redeemed | (3,202,736 | ) | (65,689,243 | ) | (15,591,980 | ) | (277,730,473 | ) | (17,862,274 | ) | (314,348,728 | ) | ||||||||||||
|
|
|
|
|
|
|
|
|
|
|
| |||||||||||||
| (998,911 | ) | $ | (20,636,322 | ) | (11,308,076 | ) | $ | (200,168,462 | ) | (11,147,414 | ) | $ | (198,578,441 | ) | ||||||||||
|
|
|
|
|
|
|
|
|
|
|
| |||||||||||||
| 58,149,402 | $ | 1,325,743,653 | (131,348,510 | ) | $ | (2,216,536,634 | ) | (418,306,407 | ) | $ | (7,595,454,785 | ) | ||||||||||||
|
|
|
| �� |
|
|
|
|
|
|
|
| ||||||||||||
| 12. | SUBSEQUENT EVENTS |
Management has evaluated the impact of all subsequent events on the Fund through the date the consolidated financial statements were issued and has determined that there were no subsequent events requiring adjustment or additional disclosure in the consolidated financial statements.
NOTES TO CONSOLIDATED FINANCIAL STATEMENTS | 83 |
Report of Independent Registered Public Accounting Firm
To the Shareholders and Board of Directors of BlackRock Global Allocation Fund, Inc.:
Opinion on the Financial Statements and Financial Highlights
We have audited the accompanying consolidated statement of assets and liabilities of BlackRock Global Allocation Fund, Inc. (the “Fund”), including the consolidated schedule of investments, as of April 30, 2021, the related consolidated statements of operations for the period from November 1, 2020 through April 30, 2021 and for the year ended October 31, 2020, the consolidated statements of changes in net assets for the period from November 1, 2020 through April 30, 2021 and for each of the two years in the period ended October 31, 2020, the consolidated financial highlights for the period from November 1, 2020 through April 30, 2021 and for each of the five years in the period ended October 31, 2020, and the related notes. In our opinion, the financial statements and financial highlights present fairly, in all material respects, the financial position of the Fund as of April 30, 2021, and the results of its operations for the period from November 1, 2020 through April 30, 2021 and for the year ended October 31, 2020, the changes in its net assets for the period from November 1, 2020 through April 30, 2021 and for each of the two years in the period ended October 31, 2020, and the financial highlights for the period from November 1, 2020 through April 30, 2021 and for each of the five years in the period ended October 31, 2020, in conformity with accounting principles generally accepted in the United States of America.
Basis for Opinion
These financial statements and financial highlights are the responsibility of the Fund’s management. Our responsibility is to express an opinion on the Fund’s financial statements and financial highlights based on our audits. We are a public accounting firm registered with the Public Company Accounting Oversight Board (United States) (PCAOB) and are required to be independent with respect to the Fund in accordance with the U.S. federal securities laws and the applicable rules and regulations of the Securities and Exchange Commission and the PCAOB.
We conducted our audits in accordance with the standards of the PCAOB. Those standards require that we plan and perform the audit to obtain reasonable assurance about whether the financial statements and financial highlights are free of material misstatement, whether due to error or fraud. The Fund is not required to have, nor were we engaged to perform, an audit of its internal control over financial reporting. As part of our audits we are required to obtain an understanding of internal control over financial reporting but not for the purpose of expressing an opinion on the effectiveness of the Fund’s internal control over financial reporting. Accordingly, we express no such opinion.
Our audits included performing procedures to assess the risks of material misstatement of the financial statements and financial highlights, whether due to error or fraud, and performing procedures that respond to those risks. Such procedures included examining, on a test basis, evidence regarding the amounts and disclosures in the financial statements and financial highlights. Our audits also included evaluating the accounting principles used and significant estimates made by management, as well as evaluating the overall presentation of the financial statements and financial highlights. Our procedures included confirmation of securities owned as of April 30, 2021, by correspondence with the custodian, agent banks and brokers; when replies were not received from agent banks or brokers, we performed other auditing procedures. We believe that our audits provide a reasonable basis for our opinion.
Deloitte & Touche LLP
Boston, Massachusetts
June 22, 2021
We have served as the auditor of one or more BlackRock investment companies since 1992.
| 84 | 2 0 2 1 BLACK ROCK ANNUAL REPORT TO SHAREHOLDERS |
Important Tax Information (unaudited)
For corporate shareholders, the percentage of ordinary income distributions paid during the fiscal period ended April 30, 2021 that qualified for the dividends-received deduction were as follows:
| Fund Name | Dividends-Received Deduction | |||
BlackRock Global Allocation Fund, Inc. | 5.50 | % | ||
The following maximum amounts are hereby designated as qualified dividend income for individuals for the fiscal period ended April 30, 2021:
| Fund Name | Qualified Dividend Income | |||
BlackRock Global Allocation Fund, Inc. | $ | 123,488,167 | ||
For the fiscal period ended April 30, 2021, the Fund hereby designates the following maximum amounts allowable as interest income eligible to be treated as a section 163(j) interest dividend:
| Fund Name | Interest Dividend | |||
BlackRock Global Allocation Fund, Inc. | $ | 39,286,395 | ||
The Fund hereby designates the following amount of distributions from direct federal obligation interest for the fiscal period ended April 30, 2021:
| Fund Name | Federal Obligation Interest | |||
BlackRock Global Allocation Fund, Inc. | $ | 2,589,555 | ||
The law varies in each state as to whether and what percent of ordinary income dividends attributable to federal obligations is exempt from state income tax. Shareholders are advised to check with their tax advisers to determine if any portion of the dividends received is exempt from state income tax.
For the fiscal period ended April 30, 2021, the Fund hereby designates the following maximum amounts allowable as interest-related and qualified short-term gains eligible for exemption from U.S. withholding tax for nonresident aliens and foreign corporations:
| Fund Name | Interest-Related Dividends | Qualified Short-Term Gains | ||||||
BlackRock Global Allocation Fund, Inc. | $ | 18,793,546 | $ | 675,343,209 | ||||
IMPORTANT TAX INFORMATION | 85 |
Statement Regarding Liquidity Risk Management Program
In compliance with Rule 22e-4 under the Investment Company Act of 1940, as amended (the “Liquidity Rule”), BlackRock Global Allocation Fund, Inc. (the “Fund”) has adopted and implemented a liquidity risk management program (the “Program”), which is reasonably designed to assess and manage the Fund’s liquidity risk.
The Board of Directors (the “Board”) of the Fund met on November 10-11, 2020 (the “Meeting”) to review the Program. The Board previously appointed BlackRock Advisors, LLC or BlackRock Fund Advisors (“BlackRock”), each an investment adviser to certain funds, as the program administrator for the Fund’s Program, as applicable. BlackRock also previously delegated oversight of the Program to the 40 Act Liquidity Risk Management Committee (the “Committee”). At the Meeting, the Committee, on behalf of BlackRock, provided the Board with a report that addressed the operation of the Program and assessed its adequacy and effectiveness of implementation, including the management of the Fund’s Highly Liquid Investment Minimum (“HLIM”) where applicable, and any material changes to the Program (the “Report”). The Report covered the period from October 1, 2019 through September 30, 2020 (the “Program Reporting Period”).
The Report described the Program’s liquidity classification methodology for categorizing a Fund’s investments (including derivative transactions) into one of four liquidity buckets. It also referenced the methodology used by BlackRock to establish a Fund’s HLIM and noted that the Committee reviews and ratifies the HLIM assigned to the Fund no less frequently than annually. The Report also discussed notable events affecting liquidity over the Program Reporting Period, including the impact of the coronavirus outbreak on the Fund and the overall market.
The Report noted that the Program complied with the key factors for consideration under the Liquidity Rule for assessing, managing and periodically reviewing a Fund’s liquidity risk, as follows:
| a) | The Fund’s investment strategy and liquidity of portfolio investments during both normal and reasonably foreseeable stressed conditions. During the Program Reporting Period, the Committee reviewed whether each Fund’s strategy is appropriate for an open-end fund structure with a focus on Funds with more significant and consistent holdings of less liquid and illiquid assets. The Committee also factored a Fund’s concentration in an issuer into the liquidity classification methodology by taking issuer position sizes into account. Where a Fund participated in borrowings for investment purposes (such as tender option bonds and reverse repurchase agreements), such borrowings were factored into the Program’s calculation of a Fund’s liquidity bucketing. Derivative exposure was also considered in such calculation. |
| b) | Short-term and long-term cash flow projections during both normal and reasonably foreseeable stressed conditions. During the Program Reporting Period, the Committee reviewed historical net redemption activity and used this information as a component to establish each Fund’s reasonably anticipated trading size (“RATS”). Each Fund has adopted an in-kind redemption policy which may be utilized to meet larger redemption requests. The Committee may also take into consideration a Fund’s shareholder ownership concentration (which, depending on product type and distribution channel, may or may not be available), a Fund’s distribution channels, and the degree of certainty associated with a Fund’s short-term and long-term cash flow projections. |
| c) | Holdings of cash and cash equivalents, as well as borrowing arrangements. The Committee considered the terms of the credit facility committed to the Funds, the financial health of the institution providing the facility and the fact that the credit facility is shared among multiple Funds (including that a portion of the aggregate commitment amount is specifically designated for BlackRock Floating Rate Income Portfolio, a series of BlackRock Funds V). The Committee also considered other types of borrowing available to the Funds, such as the ability to use reverse repurchase agreements and interfund lending, as applicable. |
There were no material changes to the Program during the Program Reporting Period. The Report provided to the Board stated that the Committee concluded that based on the operation of the functions, as described in the Report, the Program is operating as intended and is effective in implementing the requirements of the Liquidity Rule.
| 86 | 2 0 2 1 BLACK ROCK ANNUAL REPORT TO SHAREHOLDERS |
Director and Officer Information
| Independent Directors(a) | ||||||||
Name Year of Birth(b) | Position(s) Held (Length of Service)(c) | Principal Occupation(s) During Past Five Years | Number of BlackRock-Advised Investment Portfolios (“Portfolios”) Overseen | Public Company Past Five Years | ||||
Mark Stalnecker 1951 | Chair of the Board and Director (Since 2019) | Chief Investment Officer, University of Delaware from 1999 to 2013; Trustee and Chair of the Finance and Investment Committees, Winterthur Museum and Country Estate from 2005 to 2016; Member of the Investment Committee, Delaware Public Employees’ Retirement System since 2002; Member of the Investment Committee, Christiana Care Health System from 2009 to 2017; Member of the Investment Committee, Delaware Community Foundation from 2013 to 2014; Director and Chair of the Audit Committee, SEI Private Trust Co. from 2001 to 2014. | 30 RICs consisting of 152 Portfolios | None | ||||
Bruce R. Bond 1946 | Director (Since 2007) | Board Member, Amsphere Limited (software) since 2018; Trustee and Member of the Governance Committee, State Street Research Mutual Funds from 1997 to 2005; Board Member of Governance, Audit and Finance Committee, Avaya Inc. (computer equipment) from 2003 to 2007. | 30 RICs consisting of 152 Portfolios | None | ||||
Susan J. Carter 1956 | Director (Since 2019) | Director, Pacific Pension Institute from 2014 to 2018; Advisory Board Member, Center for Private Equity and Entrepreneurship at Tuck School of Business since 1997; Senior Advisor, Commonfund Capital, Inc. (“CCI”) (investment adviser) in 2015; Chief Executive Officer, CCI from 2013 to 2014; President & Chief Executive Officer, CCI from 1997 to 2013; Advisory Board Member, Girls Who Invest from 2015 to 2018 and Board Member thereof since 2018; Advisory Board Member, Bridges Fund Management since 2016; Trustee, Financial Accounting Foundation since 2017; Practitioner Advisory Board Member, Private Capital Research Institute (“PCRI”) since 2017; Lecturer in the Practice of Management, Yale School of Management since 2019; Advisor to Finance Committee, Altman Foundation since 2020. | 30 RICs consisting of 152 Portfolios | None | ||||
Collette Chilton 1958 | Director (Since 2019) | Chief Investment Officer, Williams College since 2006; Chief Investment Officer, Lucent Asset Management Corporation from 1998 to 2006; Director, Boys and Girls Club of Boston since 2017; Director, B1 Capital since 2018; Director, David and Lucile Packard Foundation since 2020. | 30 RICs consisting of 152 Portfolios | None | ||||
Neil A. Cotty 1954 | Director (Since 2019) | Bank of America Corporation from 1996 to 2015, serving in various senior finance leadership roles, including Chief Accounting Officer from 2009 to 2015, Chief Financial Officer of Global Banking, Markets and Wealth Management from 2008 to 2009, Chief Accounting Officer from 2004 to 2008, Chief Financial Officer of Consumer Bank from 2003 to 2004, Chief Financial Officer of Global Corporate Investment Bank from 1999 to 2002. | 30 RICs consisting of 152 Portfolios | None | ||||
Lena G. Goldberg 1949 | Director (Since 2016) | Senior Lecturer, Harvard Business School, since 2008; Director, Charles Stark Draper Laboratory, Inc. since 2013; FMR LLC/Fidelity Investments (financial services) from 1996 to 2008, serving in various senior roles including Executive Vice President - Strategic Corporate Initiatives and Executive Vice President and General Counsel; Partner, Sullivan & Worcester LLP from 1985 to 1996 and Associate thereof from 1979 to 1985. | 30 RICs consisting of 152 Portfolios | None | ||||
DIRECTOR AND OFFICER INFORMATION | 87 |
Director and Officer Information (continued)
| Independent Directors(a) (continued) | ||||||||
Name Year of Birth(b) | Position(s) Held (Length of Service)(c) | Principal Occupation(s) During Past Five Years | Number of BlackRock-Advised Investment Portfolios (“Portfolios”) Overseen | Public Company Past Five Years | ||||
Henry R. Keizer 1956 | Director (Since 2016) | Director, Park Indemnity Ltd. (captive insurer) since 2010; Director, MUFG Americas Holdings Corporation and MUFG Union Bank, N.A. (financial and bank holding company) from 2014 to 2016; Director, American Institute of Certified Public Accountants from 2009 to 2011; Director, KPMG LLP (audit, tax and advisory services) from 2004 to 2005 and 2010 to 2012; Director, KPMG International in 2012, Deputy Chairman and Chief Operating Officer thereof from 2010 to 2012 and U.S. Vice Chairman of Audit thereof from 2005 to 2010; Global Head of Audit, KPMGI (consortium of KPMG firms) from 2006 to 2010; Director, YMCA of Greater New York from 2006 to 2010. | 30 RICs consisting of 152 Portfolios | Hertz Global Holdings (car rental); WABCO (commercial vehicle safety systems) from 2015 to 2020; Montpelier Re Holdings, Ltd. (publicly held property and casualty reinsurance) from 2013 until 2015; Sealed Air Corp. (packaging) | ||||
Cynthia A. Montgomery 1952 | Director (Since 2019) | Professor, Harvard Business School since 1989. | 30 RICs consisting of 152 Portfolios | Newell Rubbermaid, Inc. (manufacturing) from 1995 to 2016. | ||||
Donald C. Opatrny 1952 | Director (Since 2015) | Trustee, Vice Chair, Member of the Executive Committee and Chair of the Investment Committee, Cornell University from 2004 to 2019; President, Trustee and Member of the Investment Committee, The Aldrich Contemporary Art Museum from 2007 to 2014; Member of the Board and Investment Committee, University School from 2007 to 2018; Member of the Investment Committee, Mellon Foundation from 2009 to 2015; Trustee, Artstor (a Mellon Foundation affiliate) from 2010 to 2015; President and Trustee, the Center for the Arts, Jackson Hole from 2011 to 2018; Director, Athena Capital Advisors LLC (investment management firm) since 2013; Trustee and Chair of the Investment Committee, Community Foundation of Jackson Hole since 2014; Member of Affordable Housing Supply Board of Jackson, Wyoming since 2017; Member, Investment Funds Committee, State of Wyoming since 2017; Trustee, Phoenix Art Museum since 2018; Trustee, Arizona Community Foundation and Member of Investment Committee since 2020. | 30 RICs consisting of 152 Portfolios | None | ||||
Joseph P. Platt 1947 | Director (Since 2019) | General Partner, Thorn Partners, LP (private investments) since 1998; Director, WQED Multi-Media (public broadcasting not-for-profit) since 2001; Chair, Basic Health International (non-profit) since 2015. | 30 RICs consisting of 152 Portfolios | Greenlight Capital Re, Ltd. (reinsurance company); Consol Energy Inc. | ||||
Kenneth L. Urish 1951 | Director (Since 2019) | Managing Partner, Urish Popeck & Co., LLC (certified public accountants and consultants) since 1976; Past- Chairman of the Professional Ethics Committee of the Pennsylvania Institute of Certified Public Accountants and Committee Member thereof since 2007; Member of External Advisory Board, The Pennsylvania State University Accounting Department since founding in 2001; Principal, UP Strategic Wealth Investment Advisors, LLC since 2013; Trustee, The Holy Family Institute from 2001 to 2010; President and Trustee, Pittsburgh Catholic Publishing Associates from 2003 to 2008; Director, Inter- Tel from 2006 to 2007; Member Advisory Board, ESG Competent Boards since 2020. | 30 RICs consisting of 152 Portfolios | None | ||||
| 88 | 2 0 2 1 BLACK ROCK ANNUAL REPORT TO SHAREHOLDERS |
Director and Officer Information (continued)
| Independent Directors(a) (continued) | ||||||||
Name Year of Birth(b) | Position(s) Held (Length of Service)(c) | Principal Occupation(s) During Past Five Years | Number of BlackRock-Advised Investment Portfolios (“Portfolios”) Overseen | Public Company Past Five Years | ||||
Claire A. Walton 1957 | Director (Since 2019) | Chief Operating Officer and Chief Financial Officer of Liberty Square Asset Management, LP from 1998 to 2015; General Partner of Neon Liberty Capital Management, LLC since 2003; Director, Boston Hedge Fund Group from 2009 to 2018; Director, Woodstock Ski Runners since 2013; Director, Massachusetts Council on Economic Education from 2013 to 2015. | 30 RICs consisting of 152 Portfolios | None | ||||
| Interested Directors(a)(d) | ||||||||
Name Year of Birth(b) | Position(s) Held (Length of Service)(c) | Principal Occupation(s) During Past Five Years | Number of BlackRock-Advised Investment Portfolios (“Portfolios”) Overseen | Public Company Past Five Years | ||||
Robert Fairbairn 1965 | Director (Since 2015) | Vice Chairman of BlackRock, Inc. since 2019; Member of BlackRock’s Global Executive and Global Operating Committees; Co-Chair of BlackRock’s Human Capital Committee; Senior Managing Director of BlackRock, Inc. from 2010 to 2019; oversaw BlackRock’s Strategic Partner Program and Strategic Product Management Group from 2012 to 2019; Member of the Board of Managers of BlackRock Investments, LLC from 2011 to 2018; Global Head of BlackRock’s Retail and iShares® businesses from 2012 to 2016. | 103 RICs consisting of 250 Portfolios | None | ||||
John M. 1964 | Director (Since 2015) President and Chief Executive Officer (Since 2010) | Managing Director of BlackRock, Inc. since 2009; Head of BlackRock Global Accounting and Product Services since 2009; Advisory Director of Family Resource Network (charitable foundation) since 2009. | 105 RICs consisting of 252 Portfolios | None | ||||
| (a) | The address of each Director is c/o BlackRock, Inc., 55 East 52nd Street, New York, New York 10055. |
| (b) | Each Independent Director holds office until his or her successor is duly elected and qualifies or until his or her earlier death, resignation, retirement or removal as provided by the Fund’s by-laws or charter or statute, or until December 31 of the year in which he or she turns 75. Directors who are “interested persons,” as defined in the 1940 Act, serve until their successor is duly elected and qualifies or until their earlier death, resignation, retirement or removal as provided by the Fund’s by-laws or statute, or until December 31 of the year in which they turn 72. The Board may determine to extend the terms of Independent Directors on a case-by-case basis, as appropriate. |
| (c) | Following the combination of Merrill Lynch Investment Managers, L.P. (“MLIM”) and BlackRock, Inc. in September 2006, the various legacy MLIM and legacy BlackRock fund boards were realigned and consolidated into three new fund boards in 2007. In addition, effective January 1, 2019, three BlackRock Fund Complexes were realigned and consolidated into two BlackRock Fund Complexes. As a result, although the chart shows the year that each Independent Director joined the Board, certain Independent Directors first became members of the boards of other BlackRock-advised Funds, legacy MLIM funds or legacy BlackRock funds as follows: Bruce R. Bond, 2005; Susan J. Carter, 2016; Collette Chilton, 2015; Neil A. Cotty, 2016; Cynthia A. Montgomery, 1994; Joseph P. Platt, 1999; Mark Stalnecker, 2015; Kenneth L. Urish, 1999; Claire A. Walton, 2016. |
| (d) | Mr. Fairbairn and Mr. Perlowski are both “interested persons,” as defined in the 1940 Act, of the Fund based on their positions with BlackRock, Inc. and its affiliates. Mr. Fairbairn and Mr. Perlowski are also board members of the BlackRock Fixed-Income Complex. |
| (e) | Mr. Perlowski is also a trustee of the BlackRock Credit Strategies Fund and BlackRock Private Investments Fund. |
DIRECTOR AND OFFICER INFORMATION | 89 |
Director and Officer Information (continued)
| Officers Who Are Not Directors(a) | ||||
Name Year of Birth(b) | Position(s) Held (Length of Service) | Principal Occupation(s) During Past Five Years | ||
Jennifer McGovern 1977 | Vice President (Since 2014) | Managing Director of BlackRock, Inc. since 2016; Director of BlackRock, Inc. from 2011 to 2015; Head of Americas Product Development and Governance for BlackRock’s Global Product Group since 2019; Head of Product Structure and Oversight for BlackRock’s U.S. Wealth Advisory Group from 2013 to 2019. | ||
Trent Walker 1974 | Chief Financial Officer (Since 2021) | Managing Director of BlackRock, Inc. since September 2019; Executive Vice President of PIMCO from 2016 to 2019; Senior Vice President of PIMCO from 2008 to 2015; Treasurer from 2013 to 2019 and Assistant Treasurer from 2007 to 2017 of PIMCO Funds, PIMCO Variable Insurance Trust, PIMCO ETF Trust, PIMCO Equity Series, PIMCO Equity Series VIT, PIMCO Managed Accounts Trust, 2 PIMCO-sponsored interval funds and 21 PIMCO-sponsored closed-end funds. | ||
Jay M. Fife 1970 | Treasurer (Since 2007) | Managing Director of BlackRock, Inc. since 2007. | ||
Charles Park 1967 | Chief Compliance Officer (Since 2014) | Anti-Money Laundering Compliance Officer for certain BlackRock-advised Funds from 2014 to 2015; Chief Compliance Officer of BlackRock Advisors, LLC and the BlackRock-advised Funds in the BlackRock Multi-Asset Complex and the BlackRock Fixed-Income Complex since 2014; Principal of and Chief Compliance Officer for iShares (@) Delaware Trust Sponsor LLC since 2012 and BlackRock Fund Advisors (“BFA”) since 2006; Chief Compliance Officer for the BFA-advised iShares (@) exchange traded funds since 2006; Chief Compliance Officer for BlackRock Asset Management International Inc. since 2012. | ||
Lisa Belle 1968 | Anti-Money Laundering Compliance Officer (Since 2019) | Managing Director of BlackRock, Inc. since 2019; Global Financial Crime Head for Asset and Wealth Management of JP Morgan from 2013 to 2019; Managing Director of RBS Securities from 2012 to 2013; Head of Financial Crimes for Barclays Wealth Americas from 2010 to 2012. | ||
Janey Ahn 1975 | Secretary (Since 2019) | Managing Director of BlackRock, Inc. since 2018; Director of BlackRock, Inc. from 2009 to 2017. | ||
| (a) | The address of each Officer is c/o BlackRock, Inc., 55 East 52nd Street, New York, New York 10055. |
| (b) | Officers of the Fund serve at the pleasure of the Board. |
Further information about the Fund’s Directors and Officers is available in the Fund’s Statement of Additional Information, which can be obtained without charge by calling (800) 441-7762.
Neal J. Andrews retired as the Chief Financial Officer effective December 31, 2020, and Trent Walker was elected as the Chief Financial Officer effective January 1, 2021. |
| 90 | 2 0 2 1 BLACK ROCK ANNUAL REPORT TO SHAREHOLDERS |
Regulation Regarding Derivatives
On October 28, 2020, the Securities and Exchange Commission (the “SEC”) adopted new regulations governing the use of derivatives by registered investment companies (“Rule 18f-4”). The Fund will be required to implement and comply with Rule 18f-4 by August 19, 2022. Once implemented, Rule 18f-4 will impose limits on the amount of derivatives a fund can enter into, eliminate the asset segregation framework currently used by funds to comply with Section 18 of the 1940 Act, treat derivatives as senior securities and require funds whose use of derivatives is more than a limited specified exposure amount to establish and maintain a comprehensive derivatives risk management program and appoint a derivatives risk manager.
General Information
Quarterly performance, semi-annual and annual reports, current net asset value and other information regarding the Fund may be found on BlackRock’s website, which can be accessed at blackrock.com. Any reference to BlackRock’s website in this report is intended to allow investors public access to information regarding the Fund and does not, and is not intended to, incorporate BlackRock’s website in this report.
Householding
The Fund will mail only one copy of shareholder documents, including prospectuses, annual and semi-annual reports, Rule 30e-3 notices and proxy statements, to shareholders with multiple accounts at the same address. This practice is commonly called “householding” and is intended to reduce expenses and eliminate duplicate mailings of shareholder documents. Mailings of your shareholder documents may be householded indefinitely unless you instruct us otherwise. If you do not want the mailing of these documents to be combined with those for other members of your household, please call the Fund at (800) 441-7762.
Availability of Quarterly Schedule of Investments
The Fund files its complete schedule of portfolio holdings with the SEC for the first and third quarters of each fiscal year as an exhibit to its reports on Form N-PORT. The Fund’s Form N-PORT is available on the SEC’s website at sec.gov. Additionally, the Fund makes its portfolio holdings for the first and third quarters of each fiscal year available at blackrock.com/fundreports.
Availability of Proxy Voting Policies, Procedures and Voting Records
A description of the policies and procedures that the Fund uses to determine how to vote proxies relating to portfolio securities and information about how the Fund voted proxies relating to securities held in the Fund’s portfolio during the most recent 12-month period ended June 30 is available without charge, upon request (1) by calling (800) 441-7762; (2) on the BlackRock website at blackrock.com; and (3) on the SEC’s website at sec.gov.
BlackRock’s Mutual Fund Family
BlackRock offers a diverse lineup of open-end mutual funds crossing all investment styles and managed by experts in equity, fixed-income and tax-exempt investing. Visit blackrock.com for more information.
Shareholder Privileges
Account Information
Call us at (800) 441-7762 from 8:00 AM to 6:00 PM ET on any business day to get information about your account balances, recent transactions and share prices. You can also visit blackrock.com for more information.
Automatic Investment Plans
Investor class shareholders who want to invest regularly can arrange to have $50 or more automatically deducted from their checking or savings account and invested in any of the BlackRock funds.
Systematic Withdrawal Plans
Investor class shareholders can establish a systematic withdrawal plan and receive periodic payments of $50 or more from their BlackRock funds, as long as their account balance is at least $10,000.
Retirement Plans
Shareholders may make investments in conjunction with Traditional, Rollover, Roth, Coverdell, Simple IRAs, SEP IRAs and 403(b) Plans.
ADDITIONAL INFORMATION | 91 |
Additional Information (continued)
BlackRock Privacy Principles
BlackRock is committed to maintaining the privacy of its current and former fund investors and individual clients (collectively, “Clients”) and to safeguarding their non-public personal information. The following information is provided to help you understand what personal information BlackRock collects, how we protect that information and why in certain cases we share such information with select parties.
If you are located in a jurisdiction where specific laws, rules or regulations require BlackRock to provide you with additional or different privacy-related rights beyond what is set forth below, then BlackRock will comply with those specific laws, rules or regulations.
BlackRock obtains or verifies personal non-public information from and about you from different sources, including the following: (i) information we receive from you or, if applicable, your financial intermediary, on applications, forms or other documents; (ii) information about your transactions with us, our affiliates, or others; (iii) information we receive from a consumer reporting agency; and (iv) from visits to our websites.
BlackRock does not sell or disclose to non-affiliated third parties any non-public personal information about its Clients, except as permitted by law or as is necessary to respond to regulatory requests or to service Client accounts. These non-affiliated third parties are required to protect the confidentiality and security of this information and to use it only for its intended purpose.
We may share information with our affiliates to service your account or to provide you with information about other BlackRock products or services that may be of interest to you. In addition, BlackRock restricts access to non-public personal information about its Clients to those BlackRock employees with a legitimate business need for the information. BlackRock maintains physical, electronic and procedural safeguards that are designed to protect the non-public personal information of its Clients, including procedures relating to the proper storage and disposal of such information.
Fund and Service Providers
Investment Adviser | Distributor | |
BlackRock Advisors, LLC | BlackRock Investments, LLC | |
Wilmington, DE 19809 | New York, NY 10022 | |
Accounting Agent | Independent Registered Public Accounting Firm | |
State Street Bank and Trust Company | Deloitte & Touche LLP | |
Boston, MA 02111 | Boston, MA 02116 | |
Custodian | Legal Counsel | |
Brown Brothers Harriman & Co. | Sidley Austin LLP | |
Boston, MA 02109 | New York, NY 10019 | |
Transfer Agent | Address of the Fund | |
BNY Mellon Investment Servicing (US) Inc. | 100 Bellevue Parkway | |
Wilmington, DE 19809 | Wilmington, DE 19809 | |
| 92 | 2 0 2 1 BLACK ROCK ANNUAL REPORT TO SHAREHOLDERS |
Glossary of Terms Used in this Report
Currency Abbreviation
| AUD | Australian Dollar | |
| BRL | Brazilian Real | |
| CAD | Canadian Dollar | |
| CHF | Swiss Franc | |
| CNH | Chinese Yuan | |
| CNY | Chinese Yuan | |
| EUR | Euro | |
| GBP | British Pound | |
| HKD | Hong Kong Dollar | |
| HUF | Hungarian Forint | |
| INR | Indian Rupee | |
| JPY | Japanese Yen | |
| MXN | Mexican Peso | |
| NOK | Norwegian Krone | |
| PLN | Polish Zloty | |
| RUB | New Russian Ruble | |
| SEK | Swedish Krona | |
| USD | United States Dollar | |
| ZAR | South African Rand | |
Portfolio Abbreviation
| ADR | American Depositary Receipt | |
| CD | Certificate of Deposit | |
| CLO | Collateralized Loan Obligation | |
| CMT | Constant Maturity Treasury | |
| CR | Custodian Receipt | |
| DAC | Designated Activity Company | |
| DIP | Debtor-In-Possession | |
| ETF | Exchange-Traded Fund | |
| EURIBOR | Euro Interbank Offered Rate | |
| FTSE | Financial Times Stock Exchange | |
| JSC | Joint Stock Company | |
| LIBOR | London Interbank Offered Rate | |
| MSCI | Morgan Stanley Capital International | |
| MTN | Medium-Term Note | |
| MXIBOR | Mexico Interbank Offered Rate | |
| PCL | Public Company Limited | |
| PIK | Payment-in-Kind | |
| RB | Revenue Bond | |
| REIT | Real Estate Investment Trust | |
| S&P | Standard & Poor’s | |
| SAB | Special Assessment Bonds | |
| SOFR | Secured Overnight Financing Rate | |
| SPDR | Standard & Poor’s Depository Receipt | |
| TAN | Tax Anticipation Notes | |
GLOSSARY OF TERMS USED IN THIS REPORT | 93 |
Want to know more?
blackrock.com | 800-441-7762
This report is intended for current holders. It is not authorized for use as an offer of sale or a solicitation of an offer to buy shares of the Fund unless preceded or accompanied by the Fund’s current prospectus. Past performance results shown in this report should not be considered a representation of future performance. Investment returns and principal value of shares will fluctuate so that shares, when redeemed, may be worth more or less than their original cost. Statements and other information herein are as dated and are subject to change.
GA-04/21-AR
|  |
(b) Not Applicable
| Item 3 – | Audit Committee Financial Expert – The registrant’s board of directors (the “board of directors”), has determined that (i) the registrant has the following audit committee financial experts serving on its audit committee and (ii) each audit committee financial expert is independent: |
Neil A. Cotty
Henry R. Keizer
Kenneth L. Urish
Under applicable securities laws, a person determined to be an audit committee financial expert will not be deemed an “expert” for any purpose, including without limitation for the purposes of Section 11 of the Securities Act of 1933, as a result of being designated or identified as an audit committee financial expert. The designation or identification of a person as an audit committee financial expert does not impose on such person any duties, obligations, or liabilities greater than the duties, obligations, and liabilities imposed on such person as a member of the audit committee and board of directors in the absence of such designation or identification. The designation or identification of a person as an audit committee financial expert does not affect the duties, obligations, or liability of any other member of the audit committee or board of directors.
| Item 4 – | Principal Accountant Fees and Services |
The following table presents fees billed by Deloitte & Touche LLP (“D&T”) in each of the last two fiscal years for the services rendered to the Fund:
| (a) Audit Fees | (b) Audit-Related Fees1 | (c) Tax Fees2 | (d) All Other Fees | |||||||||||||
| Entity Name | Current Fiscal Year End3 | Previous Fiscal Year End | Current Fiscal Year End3 | Previous Fiscal Year End | Current Fiscal Year End3 | Previous Fiscal Year End | Current Fiscal Year End3 | Previous Fiscal Year End | ||||||||
BlackRock Global Allocation Fund, Inc. | $79,184 | $97,002 | $0 | $0 | $20,000 | $26,300 | $0 | $0 | ||||||||
The following table presents fees billed by D&T that were required to be approved by the registrant’s audit committee (the “Committee”) for services that relate directly to the operations or financial reporting of the Fund and that are rendered on behalf of BlackRock Advisors, LLC (the “Investment Adviser” or “BlackRock”) and entities controlling, controlled by, or under common control with BlackRock (not including any sub-adviser whose role is primarily portfolio management and is subcontracted with or overseen by another investment adviser) that provide ongoing services to the Fund (“Affiliated Service Providers”):
2
| Current Fiscal Year End3 | Previous Fiscal Year End | |||
(b) Audit-Related Fees1 | $0 | $0 | ||
(c) Tax Fees2 | $0 | $0 | ||
(d) All Other Fees4 | $2,032,000 | $1,984,000 |
| 1 | The nature of the services includes assurance and related services reasonably related to the performance of the audit or review of financial statements not included in Audit Fees, including accounting consultations, agreed-upon procedure reports, attestation reports, comfort letters, out-of-pocket expenses and internal control reviews not required by regulators. |
| 2 | The nature of the services includes tax compliance and/or tax preparation, including services relating to the filing or amendment of federal, state or local income tax returns, regulated investment company qualification reviews, taxable income and tax distribution calculations. |
| 3 | The registrant changed its fiscal year end from October 31 to April 30 effective April 30, 2021 whereby this fiscal year consists of the six months ended April 30, 2020. |
| 4 | Non-audit fees of $2,032,000 and $1,984,000 for the current fiscal year and previous fiscal year, respectively, were paid to the Fund’s principal accountant in their entirety by BlackRock, in connection with services provided to the Affiliated Service Providers of the Fund and of certain other funds sponsored and advised by BlackRock or its affiliates for a service organization review and an accounting research tool subscription. These amounts represent aggregate fees paid by BlackRock and were not allocated on a per fund basis. |
(e)(1) Audit Committee Pre-Approval Policies and Procedures:
The Committee has adopted policies and procedures with regard to the pre-approval of services. Audit, audit-related and tax compliance services provided to the registrant on an annual basis require specific pre-approval by the Committee. The Committee also must approve other non-audit services provided to the registrant and those non-audit services provided to the Investment Adviser and Affiliated Service Providers that relate directly to the operations and the financial reporting of the registrant. Certain of these non-audit services that the Committee believes are (a) consistent with the SEC’s auditor independence rules and (b) routine and recurring services that will not impair the independence of the independent accountants may be approved by the Committee without consideration on a specific case-by-case basis (“general pre-approval”). The term of any general pre-approval is 12 months from the date of the pre-approval, unless the Committee provides for a different period. Tax or other non-audit services provided to the registrant which have a direct impact on the operations or financial reporting of the registrant will only be deemed pre-approved provided that any individual project does not exceed $10,000 attributable to the registrant or $50,000 per project. For this purpose, multiple projects will be aggregated to determine if they exceed the previously mentioned cost levels.
Any proposed services exceeding the pre-approved cost levels will require specific pre-approval by the Committee, as will any other services not subject to general pre-approval (e.g., unanticipated but permissible services). The Committee is informed of each service approved subject to general pre-approval at the next regularly scheduled in-person board meeting. At this meeting, an analysis of such services is presented to the Committee for ratification. The Committee may delegate to the Committee Chairman the authority to approve the provision of and fees for any specific engagement of permitted non-audit services, including services exceeding pre-approved cost levels.
(e)(2) None of the services described in each of Items 4(b) through (d) were approved by the Committee pursuant to the de minimis exception in paragraph (c)(7)(i)(C) of Rule 2-01 of Regulation S-X.
(f) Not Applicable
(g) The aggregate non-audit fees, defined as the sum of the fees shown under “Audit-Related Fees,”
3
“Tax Fees” and “All Other Fees,” paid to the accountant for services rendered by the accountant to the registrant, the Investment Adviser and the Affiliated Service Providers were:
| Entity Name | Current Fiscal Year End1 | Previous Fiscal Year End | ||
BlackRock Global Allocation Fund, Inc. | $20,000 | $26,300 |
| 1 | The registrant changed its fiscal year end from October 31 to April 30 effective April 30, 2021 whereby this fiscal year consists of the six months ended April 30, 2020. |
Additionally, the amounts billed by D&T in connection with services provided to the Affiliated Service Providers of the Fund and of other funds sponsored and advised by BlackRock or its affiliates during the current and previous fiscal years for a service organization review and an accounting research tool subscription were:
| Current Fiscal Year End1 | Previous Fiscal Year End | |
| $2,032,000 | $1,984,000 |
| 1 | The registrant changed its fiscal year end from October 31 to April 30 effective April 30, 2021 whereby this fiscal year consists of the six months ended April 30, 2020. |
These amounts represent aggregate fees paid by BlackRock and were not allocated on a per fund basis.
(h) The Committee has considered and determined that the provision of non-audit services that were rendered to the Investment Adviser and the Affiliated Service Providers that were not pre-approved pursuant to paragraph (c)(7)(ii) of Rule 2-01 of Regulation S-X is compatible with maintaining the principal accountant’s independence.
| Item 5 – | Audit Committee of Listed Registrant – Not Applicable |
| Item 6 – | Investments |
(a) The registrant’s Schedule of Investments is included as part of the Report to Stockholders filed under Item 1 of this Form.
(b) Not Applicable due to no such divestments during the semi-annual period covered since the previous Form N-CSR filing.
| Item 7 – | Disclosure of Proxy Voting Policies and Procedures for Closed-End Management Investment Companies – Not Applicable |
| Item 8 – | Portfolio Managers of Closed-End Management Investment Companies – Not Applicable |
| Item 9 – | Purchases of Equity Securities by Closed-End Management Investment Company and Affiliated Purchasers – Not Applicable |
| Item 10 – | Submission of Matters to a Vote of Security Holders – There have been no material changes to these procedures. |
4
| Item 11 – | Controls and Procedures |
(a) The registrant’s principal executive and principal financial officers, or persons performing similar functions, have concluded that the registrant’s disclosure controls and procedures (as defined in Rule 30a-3(c) under the Investment Company Act of 1940, as amended (the “1940 Act”)) are effective as of a date within 90 days of the filing of this report based on the evaluation of these controls and procedures required by Rule 30a-3(b) under the 1940 Act and Rule 15d-15(b) under the Securities Exchange Act of 1934, as amended.
(b) There were no changes in the registrant’s internal control over financial reporting (as defined in Rule 30a-3(d) under the 1940 Act) that occurred during the period covered by this report that have materially affected, or are reasonably likely to materially affect, the registrant’s internal control over financial reporting.
| Item 12 – | Disclosure of Securities Lending Activities for Closed-End Management Investment Companies – Not Applicable |
| Item 13 – | Exhibits attached hereto |
(a)(1) Code of Ethics – See Item 2
(a)(2) Section 302 Certifications are attached
(a)(3) Not Applicable
(a)(4) Not Applicable
(b) Section 906 Certifications are attached
5
Pursuant to the requirements of the Securities Exchange Act of 1934 and the Investment Company Act of 1940, the registrant has duly caused this report to be signed on its behalf by the undersigned, thereunto duly authorized.
BlackRock Global Allocation Fund, Inc.
| By: | /s/ John M. Perlowski | |||
| John M. Perlowski | ||||
| Chief Executive Officer (principal executive officer) of | ||||
| BlackRock Global Allocation Fund, Inc. |
Date: July 6, 2021
Pursuant to the requirements of the Securities Exchange Act of 1934 and the Investment Company Act of 1940, this report has been signed below by the following persons on behalf of the registrant and in the capacities and on the dates indicated.
| By: | /s/ John M. Perlowski | |||
| John M. Perlowski | ||||
| Chief Executive Officer (principal executive officer) of | ||||
| BlackRock Global Allocation Fund, Inc. |
Date: July 6, 2021
| By: | /s/ Trent Walker | |||
| Trent Walker | ||||
| Chief Financial Officer (principal financial officer) of | ||||
| BlackRock Global Allocation Fund, Inc. |
Date: July 6, 2021
6