UNITED STATES
SECURITIES AND EXCHANGE COMMISSION
Washington, DC 20549
FORM N-CSR
CERTIFIED SHAREHOLDER REPORT OF REGISTERED
MANAGEMENT INVESTMENT COMPANIES
Investment Company Act File Number: 811-05577
The Glenmede Fund, Inc.
(Exact Name of Registrant as Specified in Charter)
100 Summer Street, Floor 7
SUM0703
Boston, MA 02111
(Address of Principal Executive Offices)(Zip Code)
Michael P. Malloy, Esq.
Secretary
Drinker Biddle & Reath LLP
One Logan Square
Suite 2000
Philadelphia, PA 19103-6996
(Name and Address of Agent for Service)
Registrant’s Telephone Number, including Area Code: 1-800-442-8299
Date of Fiscal Year End: October 31, 2016
Date of Reporting Period: October 31, 2016
Item 1. Reports to Stockholders.

The Glenmede Fund, Inc.
The Glenmede Portfolios
Annual Report
October 31, 2016
The performance for the portfolios shown on pages 2, 3 and 5 to 22 represents past performance and is not a guarantee of future results. A portfolio’s share price and investment return will vary with market conditions, and the principal value of shares, when redeemed, may be more or less than their original cost.
An investment in a portfolio is neither insured nor guaranteed by the U.S. Government, the Federal Deposit Insurance Corporation, the Federal Reserve Board or any other governmental agency or bank.
Unlike actual fund performance, performance of an index does not reflect any expenses or transaction costs. A direct investment in an unmanaged index is not possible.
The reports concerning the portfolios included in this shareholder report may contain certain forward-looking statements about the factors that may affect the performance of the portfolios in the future. These statements are based on the adviser’s predictions and expectations concerning certain future events and their expected impact on the portfolios, such as performance of the economy as a whole and of specific industry sectors, changes in the levels of interest rates, the impact of developing world events and other factors that may influence the future performance of the portfolios. The adviser believes these forward-looking statements to be reasonable, although they are inherently uncertain and difficult to predict. Actual events may cause adjustments in portfolio management strategies from those currently expected to be employed.
THE GLENMEDE FUND, INC.
THE GLENMEDE PORTFOLIOS
TABLE OF CONTENTS
THE GLENMEDE FUND, INC. AND THE GLENMEDE PORTFOLIOS
PRESIDENT’S LETTER
Dear Shareholder:
We are pleased to present the annual report of the Glenmede family of funds for the fiscal year ended October 31, 2016. Domestic equity markets were volatile during the fiscal year ended October 31, 2016, beginning with the first increase in short term interest rates for many years in early December of 2015. When there were no further increases, market sentiment improved. Markets were again volatile in June of 2016 immediately following the Brexit vote but rebounded nicely for the balance of the fiscal year. International developed equity returns were negative in local currencies and were brought down further by the strong U.S. dollar. However, emerging market equities were the best performing equity sector. They were helped by stronger currencies, improving earnings and stabilized commodity prices. The U.S. Government yield curve flattened after the first increase in the Fed Funds target. Money market fund yields also rose because of the increase in the Fed Funds target and the increase in supply due to money market regulation changes.
At the fiscal year end on October 31, 2016, The Glenmede Fund, Inc. and The Glenmede Portfolios (collectively the “Glenmede Funds”) consisted of eighteen portfolios with total assets of $10.3 billion. During the fiscal year, four new portfolios were launched: The Glenmede High Yield Municipal Portfolio, The Glenmede Responsible ESG U.S. Equity Portfolio, The Glenmede Women in Leadership U.S Equity Portfolio and The Glenmede Short Term Tax Aware Fixed Income Portfolio. The two Glenmede money market portfolios were liquidated after increased regulation by the SEC centralized the money market industry.
This fiscal year ended October 31, 2016 showed modest returns across domestic equity asset classes in response to moderate growth in the U.S. economy. The S&P 500 Index1 gained 4.51%. Small cap stocks did almost as well as large cap stocks with the Russell 2000 Index1 returning 4.11% versus a return of 4.26% on the Russell 1000 Index1 for the fiscal year ended October 31, 2016. Short term Interest rates increased slightly and longer rates decreased, flattening the curve. The Bloomberg Barclays Capital U.S. Aggregate Bond Index1 gained 4.37% and the Bloomberg Barclays Capital Municipal 1-10 Year Blend Index1 gained 2.40% for the fiscal year ended October 31, 2016. The MSCI EAFE Index1 did not perform as well as domestic stocks for the fiscal year, losing -3.23%.
The Glenmede Large Cap Core Portfolio achieved a five star («««««)Overall Morningstar Rating™2 among 1,384 Large Blend Equity Funds for the period ended October 31, 2016 (based on risk adjusted returns). The Glenmede Large Cap Growth Portfolio achieved a five star («««««)Overall Morningstar Rating™2 among 1,439 Large Growth Equity Funds for the period ended October 31, 2016 (based on risk adjusted returns). The Glenmede Large Cap Value Portfolio achieved a four star (««««) Overall Morningstar Rating™2 among 1184 Large Value Equity Funds for the period ended October 31, 2016 (based on risk adjusted returns). The Glenmede Secured Options Portfolio achieved a five star («««««) Overall Morningstar Rating™2 among 75 Option Writing Funds for the period ended October 31, 2016 (based on risk adjusted returns).
The Federal Reserve finally raised short term rates in December 16, 2015 for the first time since December 16, 2008. In anticipation of rising short-term rates in 2016 and continued geopolitical concerns, the yield curve flattened during the current fiscal year. One year maturity treasuries rose 32 basis points3 and 30 year treasury yields decreased 34 basis points3 as global economic growth remained sluggish and there were no additional short term rate increases.
The Glenmede bond portfolios all have a high quality bias. The Muni Intermediate Portfolio achieved a four star (««««) Overall Morningstar Rating™2 among 193 Muni National Short Funds for the period ended October 31, 2016 (based on risk-adjusted returns). The Overall Morningstar Rating™ for a fund is derived from a weighted average of the performance figures associated with its three-, five- and ten-year (if applicable) Morningstar Rating metric.
We have featured the Responsible ESG U.S. Equity and Women in Leadership U.S. Equity Portfolios and included Portfolio Highlights for each individual fund in this report. We welcome any questions about the Glenmede Funds and thank our shareholders for their continued support.
Sincerely,
Mary Ann B. Wirts
President
December 09, 2016
| | Past performance is no guarantee of future results. |
| | Mutual fund investing involves risks. Principal loss is possible. The Portfolios may invest in foreign securities which, especially in emerging markets, will involve greater volatility and political, economic and currency risks and differences in accounting methods. The Small Cap Equity Portfolio, U.S. Emerging Growth Portfolio and Mid Cap Equity Portfolio invest in smaller companies, which will involve additional risks such as limited liquidity and greater volatility than larger companies. Short sales by the Long/Short Portfolio and Total Market Portfolio involve leverage risk, credit exposure to brokers that execute the short sales and have potentially unlimited losses. Use of derivatives by the Secured Options Portfolio and the International Secured Options Portfolio may involve greater liquidity, counterparty, credit and pricing risks. The Muni Intermediate Portfolio, High Yield Municipal Portfolio and Short Term Tax Aware Fixed Income Portfolio invest in debt instruments of municipal issuers whose ability to meet their obligations may be affected by political and economic factors in the Issuer’s region. Investments in debt securities typically decrease in value when interest rates rise. This risk is usually greater for longer-term debt securities. Income from tax-exempt funds may be subject to state and local taxes and a portion of income may be subject to the federal alternative minimum tax for certain investors. Federal income tax rules will apply to any capital gains distributions. Investments in asset backed and mortgage backed securities include additional risks that investors should be aware of such as credit risk, prepayment risk, possible illiquidity and default, as well as increased susceptibility to adverse economic developments. The High Yield Municipal Portfolio invests in “Junk Bonds” which are securities rated below investment grade and are high risk investments that have greater credit risk, are less liquid and have more volatile prices than investment grade bonds. The Secured Options Portfolio and the International Secured Options Portfolio invest in options which have risks of unlimited losses of the underlying holdings due to unanticipated market movements and failure to correctly predict the direction of the securities prices, interest rates and currency exchange rates. Covered call writing may limit the upside of an underlying security. This investment may not be suitable for all investors. The application of the social, governance and/or environmental standards of the Responsible ESG U.S. Equity Portfolio and the Women in Leadership criteria of the Women in Leadership U.S. Equity Portfolio will affect each Portfolio’s exposure to certain Issuers, industries, sectors, regions and countries and may impact the relative performance of these Portfolios, either positively or negatively, depending on whether such investments are in or out of favor. |
| | Diversification does not assure a profit or protect against a loss in a declining market. |
| | An investment in a Portfolio is neither insured nor guaranteed by the Federal Deposit Insurance Corporation, any other government agency or bank. |
| 1 | The indices are defined on pages 23 to 24. |
| 2 | ©2016 Morningstar, Inc. All Rights Reserved. The information contained herein: (1) is proprietary to Morningstar and/or its content providers; (2) may not be copied or distributed; and (3) is not warranted to be accurate, complete or timely. Neither Morningstar nor its content providers are responsible for any damages or losses arising from any use of this information. Past performance is no guarantee of future results. |
| | For each fund with at least a three-year history, Morningstar calculates a Overall Morningstar Rating™1, (based on a Morningstar Risk-Adjusted Return measure that accounts for variation in a fund’s monthly performance, (including the effects of sales charges, loads, and redemption fees), placing more emphasis on downward variations and rewarding consistent performance. The top 10% of funds in each category receive 5 stars, the next 22.5% receive 4 stars, the next 35% receive 3 stars, the next 22.5% receive 2 stars and the bottom 10% receive 1 star. (Each share class is counted as a fraction of one fund within this scale and rated separately, which may cause slight variations in the distribution percentages). The Large Cap Core Portfolio was rated against the following numbers of U.S.-domiciled Large Blend Equity funds over the following time periods: 1,384 funds overall, 1,384 funds in the last three years, 1,216 funds in the last five years, and 912 funds in the last ten years. With respect to these Large Blend Equity funds, the Large Cap Core Portfolio received an Overall Morningstar Rating™ of ««««« stars and a Morningstar Rating™ of ««««« stars, «««««, and «««« for the three-, five- and ten-year periods, respectively. The Large Cap Growth Portfolio was rated against the following numbers of U.S.-domiciled Large Growth Equity funds over the following time periods: 1,439 funds overall, 1,439 funds in the last three years, 1,252 funds in the last five years and 896 funds in the last ten years. With respect to these Large Growth Equity funds, the Large Cap Growth Portfolio received an Overall Morningstar Rating™ of ««««« stars and a Morningstar Rating™ of ««««« stars, ««««« stars, and «««« for the three-, five and ten-year periods, respectively. The Secured Options Portfolio Advisor Class was rated against the following numbers of Option Writing funds over the following time periods: 75 funds overall, 75 funds in the last three years, and 31 funds in the last five years. With respect to these Option Writing funds, the Secured Options Portfolio Advisor Class received an Overall Morningstar Rating™ of ««««« stars and a Morningstar Rating™ of ««««« stars and ««««« stars for the three- and five year periods, respectively. The Muni Intermediate Portfolio was rated against the following numbers of U.S.-domiciled Muni National Short funds over the following time periods: 193 funds overall, 193 funds in the last three years, 175 funds in the last five years, and 118 funds in the last ten years. With respect to these Muni Short funds, the Muni Intermediate Portfolio received an Overall Morningstar Rating™ of «««« stars and a Morningstar Rating™ of «««« stars, «««« stars, and «««« stars for the three-, five- and ten-year periods, respectively. The Large Cap Value Portfolio was rated against the following numbers of Large Value funds over the following time periods: 1,184 funds overall, 1,184 funds in the last three years, 1,040 funds in the last five years, and 761 funds in the last ten years. With respect to these Large Value funds, the Large Cap Value Portfolio received an Overall Morningstar Rating™ of «««« stars and a Morningstar Rating™ of «««« stars, «««« stars, and «««« stars for the three-, five- and ten-year periods, respectively. Past performance is no guarantee of future results. |
| 3 | A basis point equals .01%. |
| | This material must be preceded or accompanied by a current prospectus. |
| | The Glenmede Fund, Inc. and The Glenmede Portfolios are distributed by Quasar Distributors, LLC. 12/16. |
THE GLENMEDE FUND, INC.

On December 22, 2015, the Glenmede Investment Management Quantitative Research Group introduced two new impact investing funds: the Women in Leadership U.S. Equity Portfolio and the Responsible ESG U.S. Equity Portfolio. The Group has been managing environmentally sensitive and socially responsible portfolios for Glenmede clients since 2002 and 2008, respectively. The two new funds provide an opportunity for more investors to participate in our disciplined strategies which are integrated with responsible criteria. Similar to the other six Glenmede quantitatively-based mutual funds, these two new funds are managed on a tax sensitive basis.
Women in Leadership U.S. Equity
The Women in Leadership U.S. Equity Portfolio promotes workplace diversity by investing in large cap companies with significant female representation in leadership. For eligibility, a com
pany needs to have women in significant roles including, but not limited to, a chairwoman, female board members, a female chief executive officer or women in management positions. The portfolio process is based on proprietary, multi-factor models to rank stocks within each sector. Downside screens are utilized to avoid stocks with greater risk potential of underperformance. The portfolio is refreshed on a monthly basis to maintain what we believe to be favorable return/risk attributes and to provide broad diversification across sectors, industries and individual companies. Candidates are domestic stocks with a capitalization range of any stock in the Russel 1000® Index. The portfolio holdings are monitored on an ongoing basis for significant female representation.
Responsible ESG U.S. Equity
The Responsible ESG U.S. Equity Portfolio Invests in large cap companies with an attractive combination of valuation, fundamental, earnings and technical characteristics as well as integrating positive and negative screening techniques based on ESG (environmental, socially responsible and governance) ratings. Company ESG scores are industry-adjusted and determined on a variety of environmental, socially responsible and corporate governance criteria. The portfolio process is based on proprietary, multi-factor models to rank stocks within each sector. The portfolio is refreshed on a monthly basis to maintain what we believe to be favorable return/risk attributes, ESG ratings and to provide broad diversification across sectors, industries and individual companies. Candidates are domestic stocks within the market capitalization range of any stock in the Russell 1000® Index.
Glenmede Approach
Glenmede’s quantitatively based strategies benefit from a multidisciplinary approach that ranks stocks within sectors based on a variety of factors. The objective is to create portfolios that look like the “ideal stock,” with below-market valuations, strong fundamentals, favorable earnings/revenue growth trends, positive momentum and good liquidity. While it is rare to find a single stock with all these characteristics, quantitative tools allow us to aim to construct portfolios with the same favorable characteristics. In addition, we use downside risk screens in an effort to avoid stocks with negative earnings surprise signals, sell rankings and poor quality. On an ongoing basis, the quantitative research team works with Glenmede’s internal portfolio managers and analysts as well as maintaining active dialogue with street research sources to help identify new factors and process improvements.
Glenmede Team
Glenmede’s Quantitative Research Team is led by Vladimir (“Val”) de Vassal, CFA. Val joined Glenmede in 1998 and has over 30 years of asset management experience. Val is supported in portfolio management by Paul Sullivan, CFA, who has been with Glenmede for over 20 years and Alex Atanasiu, CFA, who joined Glenmede over 11 years ago. Recently, the team has expanded with two research analysts, David Marcucci and Jacob Adamcik. Today, the team manages over $7 billion of equity assets on a quantitatively oriented basis, including domestic large cap core, large cap growth, long/short and international ADR strategies. These strategies seek to create strong return performance with broad diversification and limited downside risk. We believe our proprietary, quantitatively based and disciplined investment process should create successful portfolios for the long term.
THE GLENMEDE FUND, INC.
Core Fixed Income Portfolio
PORTFOLIO HIGHLIGHTS
October 31, 2016
| | | | | | | | | | | | |
| Average Annual Total Return | |
| Core Fixed Income Portfolio | | | | | Bloomberg
Barclays Capital
U.S. Aggregate
Bond Index | | | Morningstar
Intermediate-Term
Bond Average | |
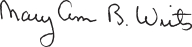
Year ended 10/31/16 | | | 3.15% | | | | 4.37% | | | | 4.33% | |
Five Years ended 10/31/16 | | | 2.32% | | | | 2,90% | | | | 3.18% | |
Ten Years ended 10/31/16 | | | 4.23% | | | | 4.64% | | | | 4.16% | |
Inception (11/17/88) through 10/31/161 | | | 6.06% | | | | 6.52% | | | | 5.85% | |
The Core Fixed Income Portfolio returned 3.15% for the year ended October 31, 2016. The benchmark, the Bloomberg Barclays Capital U.S. Aggregate Bond Index, returned 4.37% for the year and the Portfolio’s peer group, the Morningstar Intermediate-Term Bond Average, returned 4.33% for the year. The Portfolio’s underperformance versus the Bloomberg Barclays Capital U.S. Aggregate Bond Index can be attributed to the lower overall duration relative to the Index, and the Portfolio’s bias towards higher credit quality. The lower tier credits, namely the triple B component of the Index rallied throughout the year returning 10.12% versus the double A component returning 4.97%. Our higher quality bias, contributed negatively to the Portfolio’s performance. The Portfolio’s underperformance versus its peer group can also be attributed to the Portfolio’s high credit quality bias and low risk themes.
The Portfolio seeks to add value by monitoring yield curve exposure while utilizing sector and security selection. Diversification, liquidity, and low risk themes dominate the Portfolio’s investment discipline. The Portfolio’s gross annual operating expense ratio, as stated in the February 29, 2016 Prospectus is 0.53 %. This ratio can fluctuate and may differ from the expense ratio disclosed in the Financial Highlights section of this report.
| * | Assumes the reinvestment of all dividends and distributions. |
Performance data quoted represents past performance; past performance does not guarantee future results. The investment return and principal value of an investment will fluctuate so that an investor’s shares, when redeemed, may be worth more or less than their original cost. Current performance may be higher or lower than the total return shown. Please call the Fund at 1-800-442-8299 to obtain the most recent month-end returns. Returns do not reflect taxes that the shareholder may pay on fund distributions or the redemption of fund shares.
| 1 | Benchmark returns are for the periods beginning November 30, 1988 for Bloomberg Barclays Capital U.S. Aggregate Bond Index and December 1, 1988 for Morningstar Intermediate-Term Bond Average. |
| | The indices and certain terms are defined on pages 23 to 24. |
THE GLENMEDE FUND, INC.
Strategic Equity Portfolio
PORTFOLIO HIGHLIGHTS
October 31, 2016
| | | | | | | | | | | | | | | | | | | | |
| Average Annual Total Return | |
| | | | | | Return After Taxes on | | | | | | | |
| Strategic Equity Portfolio | | Return
Before
Taxes | | | Distributions | | | Distributions
and Sales of
Fund Shares | | | S&P 500
Index | | | Morningstar
Large
Growth Average | |
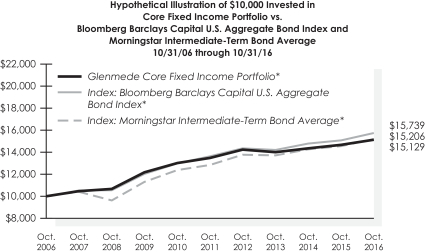
Year ended 10/31/16 | | | 5.22% | | | | 2.89% | | | | 4.45% | | | | 4.51% | | | | -0.07% | |
Five Years ended 10/31/16 | | | 12.17% | | | | 10.22% | | | | 9.48% | | | | 13.57% | | | | 11.67% | |
Ten Years ended 10/31/16 | | | 6.38% | | | | 5.33% | | | | 5.02% | | | | 6.70% | | | | 6.34% | |
Inception (07/20/89) through 10/31/161 | | | 8.31% | | | | 6.92% | | | | 6.69% | | | | 9.33% | | | | 7.91% | |
For the year ended October 31, 2016, the Strategic Equity Portfolio returned 5.22%. The S&P 500 Index returned 4.51% for the same period. The Portfolio’s performance versus the S&P 500 Index was helped by strong stock selection in the Consumer Discretionary, Energy and Health Care sectors, while partially offset by underperformance of its holdings within the Technology sector. The Portfolio’s focus on owning companies that demonstrate strong profitability aided performance during this period, while its underweights to the Utility and Telecommunications sectors and overweight within the Financials sector were a moderate drag. The Portfolio expects to generate outperformance over time by seeking to invest in companies that consistently demonstrate strong profitability and whose shares are trading at what we believe are attractive valuations. The Portfolio’s gross annual operating expense ratio as stated in the February 29, 2016 Prospectus is .84%. This ratio can fluctuate and may differ from the expense ratio disclosed in the Financial Highlights section of this report.
| * | Assumes the reinvestment of all dividends and distributions. |
Performance data quoted represents past performance; past performance does not guarantee future results. The investment return and principal value of an investment will fluctuate so that an investor’s shares, when redeemed, may be worth more or less than their original cost. Current performance may be higher or lower than the total return shown. Please call the Fund at 1-800-442-8299 to obtain the most recent month-end returns. Returns, other than after-tax returns, do not reflect taxes that the shareholder may pay on fund distributions or the redemption of fund shares. After-tax returns are calculated using the historical highest individual federal marginal income tax rates, do not reflect the impact of state and local taxes and are not relevant to investors who hold their shares through tax-deferred arrangements such as 401(k) plans or IRAs. Actual after-tax returns depend on the investor’s tax situation and may differ from those shown.
| 1 | Benchmark returns are for the period beginning July 31, 1989. |
| | The indices and certain terms are defined on pages 23 to 24. |
THE GLENMEDE FUND, INC.
Small Cap Equity Portfolio
PORTFOLIO HIGHLIGHTS
October 31, 2016
| | | | | | | | | | | | | | | | | | | | |
| Average Annual Total Return | |
| Small Cap Equity Portfolio - Advisor Class | | | | | Russell 2000
Index | | | Russell 2000
Value Index | | | S&P 500
Index | | | Morningstar
Small
Blend Average | |
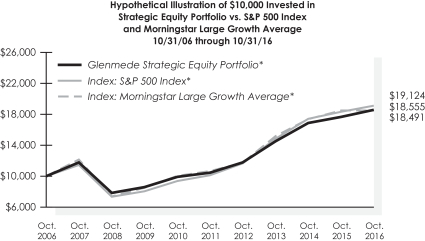
Year ended 10/31/16 | | | -0.43% | | | | 4.11% | | | | 8.81% | | | | 4.51% | | | | 2.91% | |
Five Years ended 10/31/16 | | | 11.73% | | | | 11.51% | | | | 11.63% | | | | 13.57% | | | | 10.54% | |
Ten Years ended 10/31/16 | | | 7.23% | | | | 5.96% | | | | 4.91% | | | | 6.70% | | | | 5.36% | |
Inception (03/01/91) through 10/31/161 | | | 10.34% | | | | 9.65% | | | | 11.21% | | | | 9.32% | | | | 9.98% | |
| | | | | | |
| Small Cap Equity Portfolio - Institutional Class | | | | | | | | | | | | | | | |
Year ended 10/31/16 | | | -0.25% | | | | 4.11% | | | | 8.81% | | | | 4.51% | | | | 2.91% | |
Five Years ended 10/31/16 | | | 11.95% | | | | 11.51% | | | | 11.63% | | | | 13.57% | | | | 10.54% | |
Ten Years ended 10/31/16 | | | 7.49% | | | | 5.96% | | | | 4.91% | | | | 6.70% | | | | 5.36% | |
Inception (01/02/98) through 10/31/162 | | | 10.52% | | | | 9.65% | | | | 8.81% | | | | 9.32% | | | | 9.98% | |
For the fiscal year ended October 31, 2016, the Small Cap Equity Portfolio Advisor Class returned -0.43% and the Small Cap Equity Portfolio Institutional Class returned -0.25%, compared to the Russell 2000 Index return of 4.11% and the Morningstar Small Blend Average return of 2.91%. The basic industry sector accounted for the majority of the underperformance, followed by the financial services and technology sectors. The health care sector was the best performing sector on a relative basis. The Portfolio’s gross annual operating expense ratios, as stated in the February 29, 2016 Prospectuses are 0.91% and 0.71% for the Advisor and Institutional Class shares, respectively. These ratios can fluctuate and may differ from the expense ratios disclosed in the Financial Highlights sections of this report.
| * | Assumes the reinvestment of all dividends and distributions. |
Performance data quoted represents past performance; past performance does not guarantee future results. The investment return and principal value of an investment will fluctuate so that an investor’s shares, when redeemed, may be worth more or less than their original cost. Current performance may be higher or lower than the total return shown. Please call the Fund at 1-800-442-8299 to obtain the most recent month-end returns. Returns do not reflect taxes that the shareholder may pay on fund distributions or the redemption of fund shares. Performance of the Institutional Class will vary from the Advisor Class due to differences in fees.
| 1 | Benchmark returns are for the Advisor Class inception period beginning February 28, 1991 for both Russell 2000 Indices and the S&P 500 Index and April 1, 1991 for the Morningstar Small Blend Average. |
| 2 | Average annual total return for the Institutional Class includes the period from 03/01/91 through 10/31/16. Prior to the inception of the Institutional Class on 01/02/98, performance for the Institutional Class is based on the average annual total return of the Advisor Class. |
| | The indices and certain terms are defined on pages 23 to 24. |
THE GLENMEDE FUND, INC.
Mid Cap Equity Portfolio
PORTFOLIO HIGHLIGHTS
October 31, 2016
| | | | | | | | |
| Average Annual Total Return | |
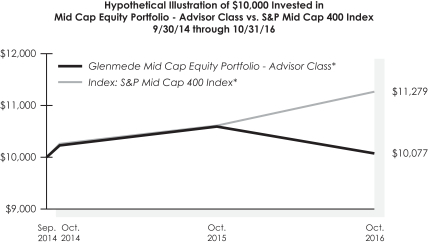
| Mid Cap Equity Portfolio - Advisor Class | | | | | S&P Mid
Cap 400
Index | |
Year ended 10/31/16 | | | -4.94% | | | | 6.26% | |
Since Inception (9/30/14) through 10/31/16 | | | 0.37% | | | | 6.40% | |
For the fiscal year ended October 31, 2016, the Mid Cap Equity Portfolio Advisor Class returned -4.94% compared to the S&P Mid Cap 400 Index return of 6.26%. The basic industry sector accounted for the majority of the underperformance, followed by the consumer and real estate sectors. The technology sector was the best performing sector on a relative basis. The Portfolio’s gross annual operating expense ratio, as stated in the February 29, 2016 Prospectus is 1.44% for the Advisor Class shares. This ratio can fluctuate and may differ from the expense ratio disclosed in the Financial Highlights section of this report.
| * | Assumes the reinvestment of all dividends and distributions. |
Performance data quoted represents past performance; past performance does not guarantee future results. The investment return and principal value of an investment will fluctuate so that an investor’s shares, when redeemed, may be worth more or less than their original cost. The performance quoted reflects fee waivers and/or expense reimbursements in effect and would have been lower in their absence. Current performance may be higher or lower than the total return shown. Please call the Fund at 1-800-442-8299 to obtain the most recent month-end returns. Returns shown do not reflect taxes that a shareholder may pay on fund distributions or redemption of fund shares.
| | The indices and certain terms are defined on pages 23 to 24. |
THE GLENMEDE FUND, INC.
Large Cap Value Portfolio
PORTFOLIO HIGHLIGHTS
October 31, 2016
| | | | | | | | | | | | | | | | |
| Average Annual Total Return | |
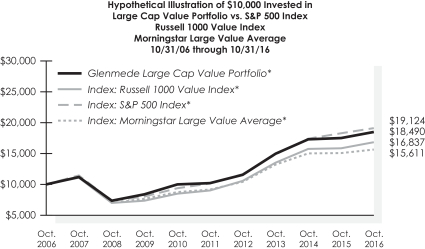
| Large Cap Value Portfolio | | | | | Russell 1000
Value Index | | | S&P 500
Index | | | Morningstar
Large
Value Average | |
Year ended 10/31/16 | | | 5.58% | | | | 6.37% | | | | 4.51% | | | | 3.72% | |
Five Years ended 10/31/16 | | | 12.61% | | | | 13.31% | | | | 13.57% | | | | 11.18% | |
Ten Years ended 10/31/16 | | | 6.34% | | | | 5.35% | | | | 6.70% | | | | 4.52% | |
Inception (01/04/93) through 10/31/161 | | | 8.95% | | | | 9.61% | | | | 9.03% | | | | 7.87% | |
For the fiscal year ended October 31, 2016, the Glenmede Large Cap Value Portfolio returned 5.58% versus 6.37% for its benchmark, the Russell 1000 Value Index. The Portfolio’s under-performance versus the benchmark was driven by negative stock selection, partially offset by strong sector allocation. Our strongest sector contributions for the year were Technology, Materials, and Utilities, with Consumer Staples being the only sector in which we trailed the benchmark. We saw a negative overall contribution from stock selection in the Financials, Health Care, and Real Estate sectors. This was partially offset by positive stock selection results in the Technology, Consumer Discretionary, and Consumer Staples sectors. The Portfolio’s gross annual operating expense ratio, as stated in the February 29, 2016 Prospectus is 0.91%. This ratio can fluctuate and may differ from the expense ratio disclosed in the Financial Highlights section of this report.
| * | Assumes the reinvestment of all dividends and distributions. |
Performance data quoted represents past performance; past performance does not guarantee future results. The investment return and principal value of an investment will fluctuate so that an investor’s shares, when redeemed, may be worth more or less than their original cost. Current performance may be higher or lower than the total return shown. Please call the Fund at 1-800-442-8299 to obtain the most recent month-end returns. Returns do not reflect taxes that the shareholder may pay on fund distributions or the redemption of fund shares.
| 1 | Benchmark returns are for the period beginning December 31, 1992. |
| | The indices and certain terms are defined on pages 23 to 24. |
THE GLENMEDE FUND, INC.
U.S. Emerging Growth Portfolio
PORTFOLIO HIGHLIGHTS
October 31, 2016
| | | | | | | | | | | | | | | | | | | | | | | | |
| Average Annual Total Return | |
| | | | | | Return After Taxes on | | | | | | | | | | |
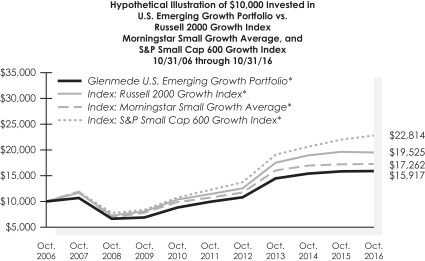
| U.S. Emerging Growth Portfolio | | Return
Before
Taxes | | | Distributions | | | Distributions
and Sale of
Fund Shares | | | S&P Small
Cap 600
Growth Index | | | Russell 2000
Growth Index | | | Morningstar
Small
Growth Average | |
Year ended 10/31/16 | | | 0.72% | | | | 0.46% | | | | 0.58% | | | | 3.66% | | | | -0.49% | | | | 0.35% | |
Five Years ended 10/31/16 | | | 9.94% | | | | 9.26% | | | | 7.86% | | | | 13.25% | | | | 11.34% | | | | 9.96% | |
Ten Years ended 10/31/16 | | | 4.76% | | | | 4.33% | | | | 3.79% | | | | 8.60% | | | | 6.92% | | | | 5.61% | |
Inception (12/29/99) through 10/31/161 | | | 0.93% | | | | 0.68% | | | | 0.72% | | | | 8.94% | | | | 4.06% | | | | 4.26% | |
For the fiscal year ended October 31, 2016, the Portfolio underperformed the S&P SmallCap 600 Growth Index by 2.94% but outperformed the Russell 2000 Growth Index by 1.21% and the Morningstar Small Growth Average by .37%, respectively. In the past year, the Portfolio’s performance had mixed effects from multifactor ranking models which biased the Portfolio towards stocks with lower valuations, favorable fundamentals, positive earnings/revenue estimate trends and technicals. Avoiding stocks based on downside risk screens (including sell rankings, earnings surprise indicators and earnings quality measures) had a favorable impact. The Portfolio had positive relative stock performance in four of eleven sectors versus the S&P 600 Growth Index. Most favorable contributions from stock selection came in materials and financial sectors. Most negative relative performances from stock selection were in health care and energy sectors. The Portfolio was negatively impacted from holdings included in Russell 2000 Growth Index but not in S&P 600 Growth Index. The Portfolio’s gross annual operating expense ratio, as stated in the February 29, 2016 Prospectus, is .94%. This ratio can fluctuate and may differ from the expense ratio disclosed in the Financial Highlights section of this report.
| * | Assumes the reinvestment of all dividends and distributions. |
Performance data quoted represents past performance; past performance does not guarantee future results. The investment return and principal value of an investment will fluctuate so that an investor’s shares, when redeemed, may be worth more or less than their original cost. Current performance may be higher or lower than the total return shown. Please call the Fund at 1-800-442-8299 to obtain the most recent month-end returns. Returns, other than after-tax returns, do not reflect taxes that the shareholder may pay on fund distributions or the redemption of fund shares. After-tax returns are calculated using the historical highest individual federal marginal income tax rates, do not reflect the impact of state and local taxes and are not relevant to investors who hold their shares through tax-deferred arrangements such as 401(k) plans or IRAs. Actual after-tax returns depend on the investor’s tax situation and may differ from those shown.
| 1 | Benchmark returns are for the period beginning December 31, 1999. |
| | The indices and certain terms are defined on pages 23 to 24. |
THE GLENMEDE FUND, INC.
Large Cap Core Portfolio
PORTFOLIO HIGHLIGHTS
October 31, 2016
| | | | | | | | | | | | | | | | | | | | |
| Average Annual Total Return | |
| | | | | | Return After Taxes on | | | | | | | |
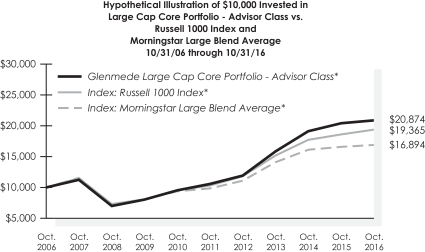
| Large Cap Core Portfolio - Advisor Class | | Return
Before
Taxes | | | Distributions | | | Distributions
and Sale of
Fund Shares | | | Russell 1000
Index | | | Morningstar
Large
Blend Average | |
Year ended 10/31/16 | | | 2.34% | | | | 1.63% | | | | 1.57% | | | | 4.26% | | | | 2.12% | |
Five Years ended 10/31/16 | | | 14.66% | | | | 14.05% | | | | 11.73% | | | | 13.51% | | | | 11.31% | |
Ten Years ended 10/31/16 | | | 7.64% | | | | 7.23% | | | | 6.16% | | | | 6.83% | | | | 5.33% | |
Inception (2/27/04) through 10/31/161 | | | 8.49% | | | | 8.11% | | | | 7.02% | | | | 7.42% | | | | 6.01% | |
| | | | | | |
| Large Cap Core Portfolio - Institutional Class | | | | | | | | | | | | | | | |
Since Inception (12/30/15) through 10/31/162 | | | 3.41% | | | | 8.30% | | | | 7.18% | | | | 7.42% | | | | 6.01% | |
For the fiscal year ended October 31, 2016, the Portfolio’s Advisor Class underperformed the Russell 1000 Index by 1.92% and outperformed the Morningstar Large Cap Blend Average by .22%. In the past year, the Portfolio’s performance was negatively impacted from multifactor ranking models which biased the Portfolio towards stocks with lower valuations, favorable fundamentals, positive earnings/revenue estimate trends and technicals. Avoiding stocks based on downside risk screens (including sell rankings, earnings surprise indicators and earnings quality measures) had a favorable effect. Leading industry group indicators were neutral to performance, including a relative overweighting in technology offset by underweighting of industrial stocks. The Portfolio had positive relative stock performance in five of eleven sectors. The most favorable contributions from stock selection came in the consumer staples and technology sectors. The most negative relative performance from stock selection came in the consumer discretionary and energy sectors. The Portfolio’s gross annual operating expense ratios, as stated in the February 29, 2016 Prospectuses, are .87% and .65% for the Advisor Class shares and the Institutional Class shares, respectively. These ratios can fluctuate and may differ from the expense ratios disclosed in the Financial Highlights sections of this report.
| * | Assumes the reinvestment of all dividends and distributions. |
Performance data quoted represents past performance; past performance does not guarantee future results. The investment return and principal value of an investment will fluctuate so that an investor’s shares, when redeemed, may be worth more or less than their original cost. Current performance may be higher or lower than the total return shown. Please call the Fund at 1-800-442-8299 to obtain the most recent month-end returns. Returns, other than after-tax returns, do not reflect taxes that the shareholder may pay on fund distributions or the redemption of fund shares. After-tax returns are calculated using the historical highest individual federal marginal income tax rates, do not reflect the impact of state and local taxes and are not relevant to investors who hold their shares through tax-deferred arrangements such as 401(k) plans or IRAs. Actual after-tax returns depend on the investor’s tax situation and may differ from those shown.
| 1 | Benchmark returns are for the period beginning February 28, 2004. |
| 2 | Average annual total return for the Institutional Class includes the period from 02/27/04 through 10/31/16. Prior to the inception of the Institutional Class on 12/30/15, performance for the Institutional Class is based on the average annual total return of the Advisor Class. |
| | The indices and certain terms are defined on pages 23 to 24. |
THE GLENMEDE FUND, INC.
Large Cap Growth Portfolio
PORTFOLIO HIGHLIGHTS
October 31, 2016
| | | | | | | | | | | | | | | | | | | | |
| Average Annual Total Return | |
| | | | Return After Taxes on | | | | | | | |
| Large Cap Growth Portfolio - Advisor Class | | Return
Before
Taxes | | | Distributions | | | Distributions
and Sale of
Fund Shares | | | Russell 1000
Growth Index | | | Morningstar
Large
Growth Average | |
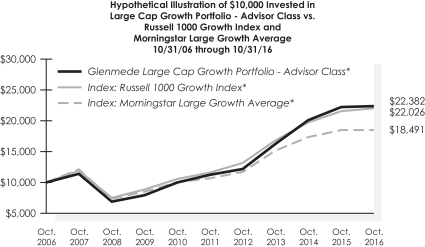
Year ended 10/31/16 | | | 0.87% | | | | 0.64% | | | | 0.53% | | | | 2.28% | | | | -0.07% | |
Five Years ended 10/31/16 | | | 14.81% | | | | 14.26% | | | | 11.84% | | | | 13.65% | | | | 11.67% | |
Ten Years ended 10/31/16 | | | 8.39% | | | | 8.04% | | | | 6.81% | | | | 8.22% | | | | 6.34% | |
Inception (2/27/04) through 10/31/161 | | | 8.88% | | | | 8.58% | | | | 7.37% | | | | 7.68% | | | | 6.29% | |
| | | | | | |
| Large Cap Growth Portfolio - Institutional Class | | | | | | | | | | | | | | | |
Since Inception (11/05/15) through 10/31/162 | | | 0.60% | | | | 8.78% | | | | 7.55% | | | | 7.68% | | | | 6.29% | |
For the fiscal year ended October 31, 2016, the Portfolio’s Advisor Class underperformed the Russell 1000 Growth Index by 1.41% and outperformed the Morningstar Large Cap Growth Average by .94%. In the past year, the Portfolio’s performance was negatively impacted from multifactor ranking models which biased the Portfolio towards stocks with lower valuations, favorable fundamentals, positive earnings/revenue estimate trends and technicals. Avoiding stocks based on downside risk screens (including sell rankings, earnings surprise indicators and earnings quality measures) had a favorable effect. Leading industry group indicators were neutral to performance, including a relative overweighting in technology offset by underweighting of real estate stocks. The Portfolio had positive relative stock performance in five of ten sectors. The most favorable contributions from stock selection came in consumer discretionary and financial sectors. The most negative relative performance from stock selection came in consumer staples and real estate sectors. The Portfolio’s gross annual operating expense ratios, as stated in the February 29, 2016 Prospectuses, are .87% and .67% for the Advisor Class shares and the Institutional Class shares, respectively These ratios can fluctuate and may differ from the expense ratios disclosed in the Financial Highlights sections of this report.
| * | Assumes the reinvestment of all dividends and distributions. |
Performance data quoted represents past performance; past performance does not guarantee future results. The investment return and principal value of an investment will fluctuate so that an investor’s shares, when redeemed, may be worth more or less than their original cost. Current performance may be higher or lower than the total return shown. Please call the Fund at 1-800-442-8299 to obtain the most recent month-end returns. Returns, other than after-tax returns, do not reflect taxes that the shareholder may pay on fund distributions or the redemption of fund shares. After-tax returns are calculated using the historical highest individual federal marginal income tax rates, do not reflect the impact of state and local taxes and are not relevant to investors who hold their shares through tax-deferred arrangements such as 401(k) plans or IRAs. Actual after-tax returns depend on the investor’s tax situation and may differ from those shown.
| 1 | Benchmark returns are for the period beginning February 28, 2004. |
| 2 | Average annual total return for the Institutional Class includes the period from 02/27/04 through 10/31/16. Prior to the inception of the Institutional Class on 11/05/15, performance for the Institutional Class is based on the average annual total return of the Advisor Class. |
| | The indices and certain terms are defined on pages 23 to 24. |
THE GLENMEDE FUND, INC.
Long/Short Portfolio
PORTFOLIO HIGHLIGHTS
October 31, 2016
| | | | | | | | | | | | | | | | |
| Average Annual Total Return | |
| Long/Short Portfolio | | | | | Bloomberg
Barclays Capital
U.S. Treasury
Bellwether
3-Month Index | | | Russell 3000
Index | | | Morningstar
Long/Short
Average | |
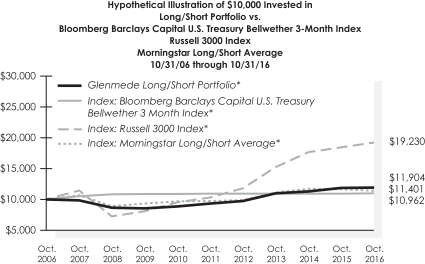
Year ended 10/31/16 | | | 0.62% | | | | 0.32% | | | | 4.42% | | | | -2.25% | |
Five Years ended 10/31/16 | | | 5.06% | | | | 0.12% | | | | 13.35% | | | | 3.22% | |
Ten Years ended 10/31/16 | | | 1.76% | | | | 0.92% | | | | 6.76% | | | | 1.29% | |
Inception (09/29/06) through 10/31/161 | | | 1.73% | | | | 0.95% | | | | 7.04% | | | | 1.39% | |
For the fiscal year ended October 31, 2016, the Portfolio outperformed the Barclays Capital U.S. Treasury Bellwether 3-Month Index by .30% and outperformed Morningstar Long/Short Average by 2.87%, respectively. Over the past year, average net equity exposure for the Portfolio was about 30%. The Portfolio’s performance had positive contributions from multifactor ranking models with biases towards stocks with lower valuations, favorable fundamentals, positive earnings/revenue estimate trends and technicals. The Portfolio’s long stock positions (+4.8%) outperformed short positions (+3.6%) by about 1.2%. Overall, the Portfolio had positive relative stock performance in six of eleven sectors. The most favorable contributions from stock selection came in consumer discretionary and health care sectors. Most negative relative performance from stock selection came in industrials and consumer staples sectors. Portfolio’s gross annual operating expense ratio, as stated in the February 29, 2016 Prospectus, is 2.64%. This ratio can fluctuate and may differ from the expense ratio disclosed in the Financial Highlights section of this report.
| * | Assumes the reinvestment of all dividends and distributions. |
Performance data quoted represents past performance; past performance does not guarantee future results. The investment return and principal value of an investment will fluctuate so that an investor’s shares, when redeemed, may be worth more or less than their original cost. The performance quoted reflects fee waivers and/or expense reimbursements in effect and would have been lower in their absence. Current performance may be higher or lower than the total return shown. Please call the Fund at 1-800-442-8299 to obtain the most recent month-end returns. Returns do not reflect taxes that the shareholder may pay on fund distributions or the redemption of fund shares.
| 1 | Benchmark returns are for the periods beginning September 30, 2006 for the Russell 3000 Index and October 1, 2006 for Morningstar Long/Short Average. |
| | The indices and certain terms are defined on pages 23 to 24. |
THE GLENMEDE FUND, INC.
Total Market Portfolio
PORTFOLIO HIGHLIGHTS
October 31, 2016
| | | | | | | | | | | | |
| Average Annual Total Return | |
| Total Market Portfolio | | | | | Russell 3000
Index | | | Morningstar
Mid-Cap
Value Average | |
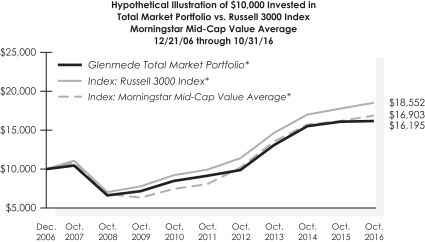
Year ended 10/31/16 | | | 0.37% | | | | 4.24% | | | | 4.25% | |
Five Years ended 10/31/16 | | | 12.14% | | | | 13.35% | | | | 11.88% | |
Inception (12/21/06) through 10/31/161 | | | 5.01% | | | | 6.47% | | | | 5.88% | |
The goal of the Total Market Portfolio is to provide additional return relative to a long only equity strategy by investing in incremental long positions of attractive stocks (approximately 100% to 150% of net portfolio value) and shorting unattractive stocks (about 0% to 50% of net portfolio value). For fiscal year ended October 31, 2016, the Portfolio underperformed the Russell 3000 Index by 3.87% and the Morningstar Mid-Cap Value Average by 3.88%. The Portfolio’s performance had mixed effects from multifactor ranking models with biases towards stocks with lower valuations, favorable fundamentals, positive earnings/revenue estimate trends and technicals. The Portfolio’s long stock positions (+2.4%) underperformed the short positions (+2.7%) by about .3%. Short positions had lower weighted average market capitalizations relative to long positions. Overall, the Portfolio had positive relative stock performance in four of eleven sectors relative to Russell 3000 index. Most favorable contributions from stock selection came in technology and health care sectors. Most negative relative performance from stock selection came in consumer staples and energy sectors. Portfolio’s gross annual operating expense ratio, as stated in the February 29, 2016 Prospectus, is 2.29%. This ratio can fluctuate and may differ from the expense ratio disclosed in the Financial Highlights section of this report.
| * | Assumes the reinvestment of all dividends and distributions. |
Performance data quoted represents past performance; past performance does not guarantee future results. The investment return and principal value of an investment will fluctuate so that an investor’s shares, when redeemed, may be worth more or less than their original cost. The performance quoted reflects fee waivers and/or expense reimbursements in effect and would have been lower in their absence. Current performance may be higher or lower than the total return shown. Please call the Fund at 1-800-442-8299 to obtain the most recent month-end returns. Returns do not reflect taxes that the shareholder may pay on fund distributions or the redemption of fund shares.
| 1 | Benchmark returns are for the periods beginning December 31, 2006 for the Russell 3000 Index and January 1, 2007 for Morningstar Mid-Cap Value Average. |
| | The indices and certain terms are defined on pages 23 to 24. |
THE GLENMEDE FUND, INC.
High Yield Municipal Portfolio
PORTFOLIO HIGHLIGHTS
October 31, 2016
| | | | | | | | | | | | | | | | | | | | |
| Average Annual Total Return | |
| High Yield Municipal Portfolio | | | | | Bloomberg Barclays
Municipal Bond
Index | | | Bloomberg
Barclays
Muni BBB
Index | | | Bloomberg
Barclays
Muni High Yield 5%
Tobacco Cap 2%
Issuer Cap Index | | | Morningstar
High Yield
Muni
Average | |
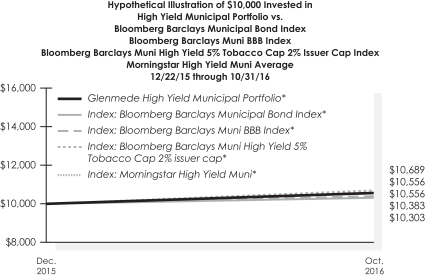
Inception (12/22/15) through 10/31/161 | | | 5.56% | | | | 3.03% | | | | 3.83% | | | | 6.89% | | | | 5.56% | |
The Glenmede High Yield Municipal Portfolio trailed the Bloomberg Barclays Municipal High Yield 5% Tobacco Cap, 2% Issuer Cap Index, from inception on December 22, 2015 through October 31, 2016. The Portfolio’s duration and yield curve positioning were detractors, while allocations to tobacco, utilities and health care were additive. The Portfolio continued to maintain exposure to higher credit quality, so as to be consistent with the Portfolio’s goal of a high level of current income exempt from regular federal income tax. The Portfolio’s gross annual operating expense ratio, as stated in the February 29, 2016 prospectus is 1.18%. This ratio can fluctuate and may differ from the expense ratio disclosed in the Financial Highlights section of this report.
| * | Assumes the reinvestment of all dividends and distributions. |
Performance data quoted represents past performance; past performance does not guarantee future results. The investment return and principal value of an investment will fluctuate so that an investor’s shares, when redeemed, may be worth more or less than their original cost. The performance quoted reflects fee waivers and/or expense reimbursements in effect and would have been lower in their absence. Current performance may be higher or lower than the total return shown. Please call the Fund at 1-800-442-8299 to obtain the most recent month-end returns. Returns do not reflect taxes that the shareholder may pay on fund distributions or the redemption of fund shares.
| 1 | Benchmark returns are for the periods beginning December 22, 2015 for the Bloomberg Barclays Municipal Bond Index, Bloomberg Barclays Muni BBB Index, and Morningstar High Yield Muni Average. |
| | The indices and certain terms are defined on pages 23 to 24. |
THE GLENMEDE FUND, INC.
Responsible ESG U.S. Equity Portfolio
PORTFOLIO HIGHLIGHTS
October 31, 2016
| | | | | | | | | | | | |
| Average Annual Total Return | |
| Responsible ESG U.S. Equity Portfolio | | | | | Russell 1000
Index | | | Morningstar
Large Blend
Average | |
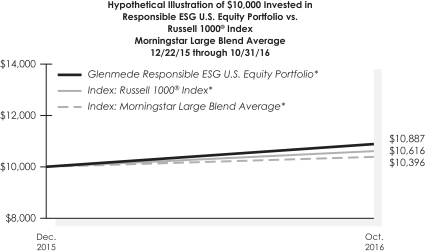
Since Inception (12/22/15) through 10/31/161 | | | 8.87% | | | | 6.16% | | | | 3.96% | |
Since its inception date of December 22, 2015, the Portfolio outperformed the Russell 1000 Index by 2.71% and the Morningstar Large Cap Blend Average by 4.91%. The Portfolio selects stocks based on combination of multi-factor models and ESG ratings (environmental, socially responsible and governance). The Portfolio’s performance had mixed effects from biases towards stocks with lower valuations, favorable fundamentals, positive earnings/revenue estimate trends and technicals. Portfolio holdings with better ESG ratings had positive impact on performance. Avoiding stocks based on downside risk screens (sell rankings, earnings surprise indicators and earnings quality measures) had favorable effect. The Portfolio had positive relative stock performance in seven of eleven sectors. Most favorable contributions from stock selection came in information technology and financial sectors. Most negative relative performance from stock selection came in health care and consumer staples sectors. The Portfolio’s gross annual operating expense ratio, as stated in February 29, 2016 Prospectus, is 1.75%. This ratio can fluctuate and may differ from expense ratio disclosed in Financial Highlights section of this report.
| * | Assumes the reinvestment of all dividends and distributions. |
Performance data quoted represents past performance; past performance does not guarantee future results. The investment return and principal value of an investment will fluctuate so that an investor’s shares, when redeemed, may be worth more or less than their original cost. The performance quoted reflects fee waivers and/or expense reimbursements in effect and would have been lower in their absence. Current performance may be higher or lower than the total return shown. Please call the Fund at 1-800-442-8299 to obtain the most recent month-end returns. Returns do not reflect taxes that the shareholder may pay on fund distributions or the redemption of fund shares.
| 1 | Benchmark returns are for the periods beginning December 22, 2015 for the Russell 1000 Index and January 1, 2016 for Morningstar Large Blended Average. |
| | The indices and certain terms are defined on pages 23 to 24. |
THE GLENMEDE FUND, INC.
Women in Leadership U.S. Equity Portfolio
PORTFOLIO HIGHLIGHTS
October 31, 2016
| | | | | | | | | | | | |
| Average Annual Total Return | |
| Women in Leadership U.S. Equity Portfolio | | | | | Russell 1000
Index | | | Morningstar
Large Blend
Average | |
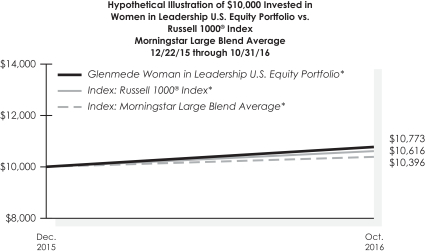
Since Inception (12/22/15) through 10/31/161 | | | 7.73% | | | | 7.09% | | | | 3.96% | |
Since its inception date of December 22, 2015, the Portfolio outperformed the Russell 1000 Index by .64% and the Morningstar Large Cap Blend Average by 3.77%. The Portfolio selects stocks based on companies that meet specific women in leadership criteria (Chairwoman, female CEO, 20% of Board or 25% of management). The Portfolio’s performance had mixed effects from biases towards stocks with lower valuations, favorable fundamentals, positive earnings/revenue estimate trends and technicals. Avoiding stocks based on downside risk screens (sell rankings, earnings surprise indicators and earnings quality measures) had positive impact on performance. The Portfolio had positive relative stock performance in seven of eleven sectors. Most favorable contributions from stock selection came in information technology and consumer staples sectors. Most negative relative performance from stock selection came in health care and consumer discretionary sectors. The Portfolio’s gross annual operating expense ratio, as stated in February 29, 2016 Prospectus, is 1.75%. This ratio can fluctuate and may differ from expense ratio disclosed in Financial Highlights section of this report.
| * | Assumes the reinvestment of all dividends and distributions. |
Performance data quoted represents past performance; past performance does not guarantee future results. The investment return and principal value of an investment will fluctuate so that an investor’s shares, when redeemed, may be worth more or less than their original cost. The performance quoted reflects fee waivers and/or expense reimbursements in effect and would have been lower in their absence. Current performance may be higher or lower than the total return shown. Please call the Fund at 1-800-442-8299 to obtain the most recent month-end returns. Returns do not reflect taxes that the shareholder may pay on fund distributions or the redemption of fund shares.
| 1 | Benchmark returns are for the periods beginning December 22, 2015 for the Russell 1000 Index and January 1, 2016 for Morningstar Large Blended Average. |
| | The indices and certain terms are defined on pages 23 to 24. |
THE GLENMEDE FUND, INC.
Short Term Tax Aware Fixed Income Portfolio
PORTFOLIO HIGHLIGHTS
October 31, 2016
| | | | | | | | | | | | | | | | |
| Average Annual Total Return | |
| | | | | | Return After Taxes on | | | | |
| Short Term Tax Aware Fixed Income Portfolio | | Return
Before
Taxes | | | Distributions | | | Distributions
and Sale of
Fund Shares | | | BofA
Merrill Lynch
1-3 year
US Municipal
Securities
Index | |
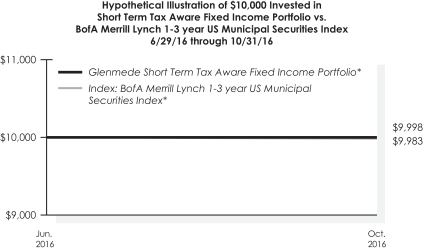
Since Inception (6/29/16) through 10/31/161 | | | -0.02% | | | | -0.05% | | | | -0.01% | | | | -0.17% | |
The Short Term Tax Aware Fixed Income Portfolio outperformed its primary benchmark, the BofA Merrill Lynch 1-3 Year US Municipal Securities Index, since its inception on June 29, 2016. The Portfolio’s duration was kept in-line with the benchmark duration consistently over the period. The Portfolio saw strong performance through security selection as well as benefitting from its allocation to taxable securities as a tactical, relative value investment. This was consistent with the Portfolio’s goals of generating after-tax total return with reasonable preservation of capital. The Portfolio’s gross annual operating expense ratio, as stated in its June 29, 2016 Prospectus, is 1.06%. This ratio can fluctuate and may differ from the expense ratio disclosed in the Financial Highlights in this report.
| * | Assumes the reinvestment of all dividends and distributions. |
Performance data quoted represents past performance; past performance does not guarantee future results. The investment return and principal value of an investment will fluctuate so that an investor’s shares, when redeemed, may be worth more or less than their original cost. The performance quoted reflects fee waivers and/or expense reimbursements in effect and would have been lower in their absence. Current performance may be higher or lower than the total return shown. Please call the Fund at 1-800-442-8299 to obtain the most recent month-end returns. Returns, other than after-tax returns, do not reflect taxes that the shareholder may pay on fund distributions or the redemption of fund shares. After-tax returns are calculated using the historical highest individual federal marginal income tax rates, do not reflect the impact of state and local taxes and are not relevant to investors who hold their shares through tax-deferred arrangements such as 401(k) plans or IRAs. Actual after-tax returns depend on the investor’s tax situation and may differ from those shown. Returns do not reflect taxes that the shareholder may pay on fund distributions or the redemption of fund shares.
| 1 | Benchmark returns are for the periods beginning June 29, 2016 for the Merrill Lynch 1-3 Year US Municipal Securities Index. |
| | The indices and certain terms are defined on pages 23 to 24. |
THE GLENMEDE FUND, INC.
Secured Options Portfolio
PORTFOLIO HIGHLIGHTS
October 31, 2016
| | | | | | | | | | | | |
| Average Annual Total Return | |
| Secured Options Portfolio - Advisor Class | | | | | S&P 500
Index | | | CBOE S&P 500
Buy-Write
Index | |
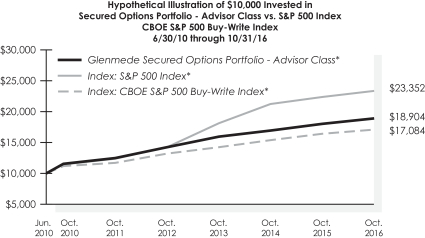
Year ended 10/31/16 | | | 5.08% | | | | 4.51% | | | | 4.27% | |
Five years ended 10/31/16 | | | 8.72% | | | | 13.57% | | | | 7.89% | |
Inception (6/30/10) through 10/31/16 | | | 10.57% | | | | 14.51% | | | | 8.82% | |
For the fiscal year ended October 31, 2016, the Secured Options Portfolio wrote put and call options in an effort to reduce share price volatility, obtain option premiums and provide more stable returns. For this period, the Portfolio had a total return of 5.08% while its benchmark, the CBOE S&P 500 Buy-Write Index, returned 4.27% and the S&P 500 Index returned 4.51%. The Portfolio’s outperformance relative to the CBOE S&P 500 Buy-Write Index was driven primarily by strong option selection. Our strategy tends to work well on a relative basis when the underlying index’s price movement shows significant mean reversion, which was often the case during the most recent fiscal year. In addition to enhancing return, the written call and put options generally helped to reduce share price volatility when compared to the S&P 500 Index. The Portfolio’s gross annual operating expense ratio, as stated in the February 29, 2016 prospectus is 0.84%. This ratio can fluctuate and may differ from the expense ratio disclosed in the Financial Highlights section of this report.
| * | Assumes the reinvestment of all dividends and distributions. |
Performance data quoted represents past performance; past performance does not guarantee future results. The investment return and principal value of an investment will fluctuate so that an investor’s shares, when redeemed, may be worth more or less than their original cost. Current performance may be higher or lower than the total return shown. Please call the Fund at 1-800-442-8299 to obtain the most recent month-end returns. Returns do not reflect taxes that the shareholder may pay on fund distributions or the redemption of fund shares.
| | The indices and certain terms are defined on pages 23 to 24. |
THE GLENMEDE FUND, INC.
International Secured Options Portfolio
PORTFOLIO HIGHLIGHTS
October 31, 2016
| | | | | | | | |
| Average Annual Total Return | |
| International Secured Options Portfolio | | | | | MSCI EAFE
Index | |
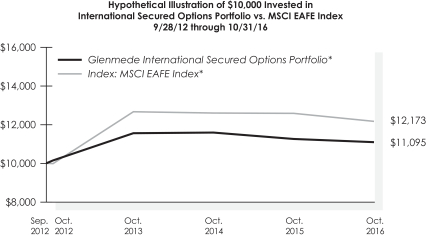
Year ended 10/31/16 | | | -1.47% | | | | -3.23% | |
Since Inception 9/28/12 through 10/31/16 | | | 2.57% | | | | 4.92% | |
For the fiscal year ended October 31, 2016, the International Secured Options Portfolio wrote put and call options in an effort to reduce share price volatility, obtain option premiums and provide more stable returns. For this period, the Portfolio had a total return of -1.47% while its benchmark, the MSCI EAFE Index, returned -3.23%. With the underlying Index down for this 12 month period, the premiums we received for selling options provided downside protection for the Portfolio. The Portfolio’s gross annual operating expense ratio, as stated in the February 29, 2016 prospectus is 0.89%. This ratio can fluctuate and may differ from the expense ratio disclosed in the Financial Highlights section of this report.
| * | Assumes the reinvestment of all dividends and distributions excluding withholding taxes. |
Performance data quoted represents past performance; past performance does not guarantee future results. The investment return and principal value of an investment will fluctuate so that an investor’s shares, when redeemed, may be worth more or less than their original cost. The since inception performance quoted above reflects expense reimbursements in effect that would have been lower in their absence. Current performance may be higher or lower than the total return shown. Please call the Fund at 1-800-442-8299 to obtain the most recent month-end returns. Returns do not reflect taxes that the shareholder may pay on fund distributions or the redemption of fund shares.
| | The indices and certain terms are defined on pages 23 to 24. |
THE GLENMEDE FUND, INC.
International Portfolio
PORTFOLIO HIGHLIGHTS
October 31, 2016
| | | | | | | | | | | | | | | | | | | | |
| Average Annual Total Return | |
| | | | | | Return After Taxes on | | | | | | | |
| International Portfolio | | Return
Before
Taxes | | | Distributions | | | Distributions
and Sale of
Fund Shares | | | MSCI EAFE
Index | | | Morningstar
Foreign Large
Value Average | |
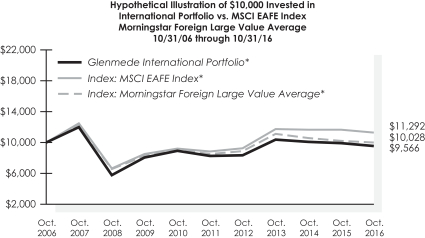
Year ended 10/31/16 | | | -3.44% | | | | -4.16% | | | | -1.94% | | | | -3.23% | | | | -1.81% | |
Five Years ended 10/31/16 | | | 2.97% | | | | 2.60% | | | | 2.34% | | | | 4.99% | | | | 4.30% | |
Ten Years ended 10/31/16 | | | -0.44% | | | | -1.00% | | | | 0.01% | | | | 1.22% | | | | 0.49% | |
Inception (11/17/88) through 10/31/161 | | | 6.48% | | | | 5.16% | | | | 5.24% | | | | 4.20% | | | | 6.20% | |
For fiscal year ended October 31, 2016, the Portfolio underperformed the MSCI EAFE Index by .21% and Morningstar Foreign Large Value Average by 1.63%. The Portfolio’s performance had positive impacts from multifactor ranking models that biased Portfolio towards stocks with lower valuations, favorable fundamentals, positive earnings/revenue estimate trends and technicals. The performance benefitted from leading country/region indicators with relative overweightings in Pacific Rim stocks and underweightings of Italian/Spanish stocks, respectively. The Portfolio had positive relative stock performance in seven of eleven sectors. Most favorable contributions from stock selection came in the telecommunications services and health care sectors. Most negative relative performance from stock selection came in the industrials and consumer discretionary sectors. The Portfolio’s gross annual operating expense ratio, as stated in the February 29, 2016 Prospectus, is 1.24%. This ratio can fluctuate and may differ from the expense ratio disclosed in the Financial Highlights section of this report.
| * | Assumes the reinvestment of all dividends and distributions excluding withholding taxes. |
Performance data quoted represents past performance; past performance does not guarantee future results. The investment return and principal value of an investment will fluctuate so that an investor’s shares, when redeemed, may be worth more or less than their original cost. The performance quoted above reflects fee waivers in effect during the fiscal years ended October 31, 2015 and October 31,2016 that would have been lower in their absence. Current performance may be higher or lower than the total return shown. Please call the Fund at 1-800-442-8299 to obtain the most recent month-end returns. Returns other than after tax returns, do not reflect taxes that the shareholder may pay on fund distributions or the redemption of fund shares. After-tax returns are calculated using the historical highest individual federal marginal income tax rates, do not reflect the impact of state and local taxes and are not relevant to investors who hold their shares through tax-deferred arrangements such as 401(k) plans or IRAs. Actual after-tax returns depend on the investor’s tax situation and may differ from those shown.
| 1 | Benchmark returns are for the period beginning November 30, 1988. |
| | The indices and certain terms are defined on pages 23 to 24. |
THE GLENMEDE PORTFOLIOS
Muni Intermediate Portfolio
PORTFOLIO HIGHLIGHTS
October 31, 2016
| | | | | | | | | | | | |
| Average Annual Total Return | |
| Muni Intermediate Portfolio | | | | | Bloomberg
Barclays Capital
Municipal
1-10 Year Blend
Index | | | Morningstar
Muni National
Short Average | |
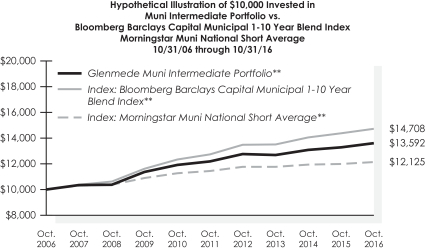
Year ended 10/31/16 | | | 2.45% | | | | 2.40% | | | | 1.10% | |
Five Years ended 10/31/16 | | | 2.21% | | | | 2.92% | | | | 1.16% | |
Ten Years ended 10/31/16 | | | 3.12% | | | | 3.93% | | | | 1.94% | |
Inception (06/05/92) through 10/31/16 | | | 4.14% | | | | N/A* | | | | 3.05% | |
Muni Intermediate Portfolio outperformed its primary benchmark, the Bloomberg Barclays Capital Municipal 1-10 Year Blend Index, over the past year. The Portfolio’s duration was kept marginally below the benchmark duration consistently throughout the year in anticipation of the Federal Reserve hiking short-term rates. That expectation came to fruition in December 2015 with a single increase that was not followed with additional hikes. As economic data softened, rates moved lower and the yield curve flattened early in the year, the Portfolio benefitted from its barbell structure having elevated exposure in longer maturities within the benchmark maturities. While maintaining consistent duration levels, the Portfolio’s structure was adjusted to have less exposure to longer-dated maturities in the second half of the fiscal year. The Portfolio continued to maintain exposure to higher credit quality, so as to be consistent with the Portfolio’s goals of preservation of capital and high current Federal tax exempt interest income generation. The Portfolio’s gross annual operating expense ratio, as stated in the February 29, 2016 Prospectus, is 0.23%. This ratio can fluctuate and may differ from the expense ratio disclosed in the Financial Highlights in this report.
| * | Index commenced 6/30/93. Thus Portfolio inception comparisons are not provided. |
| ** | Assumes the reinvestment of all dividends and distributions. |
Performance data quoted represents past performance; past performance does not guarantee future results. The investment return and principal value of an investment will fluctuate so that an investor’s shares, when redeemed, may be worth more or less than their original cost. Current performance may be higher or lower than the total return shown. Please call the Fund at 1-800-442-8299 to obtain the most recent month-end returns. Returns shown do not reflect taxes that a shareholder may pay on fund distributions or redemption of fund shares.
| | The indices and certain terms are defined on pages 23 to 24. |
THE GLENMEDE FUND, INC.
THE GLENMEDE PORTFOLIOS
Glossary of Indices & Terms
Indices — It is not possible to invest directly in an index.
Bloomberg Barclays Capital Municipal 1-10 Year Blend Index is a composite index made up of several different broad sub-indices: the Barclays Capital Municipal 1-Year Index; Barclays Capital Municipal 3-Year Index; Barclays Capital Municipal 5-Year Index; Barclays Capital Municipal 7-Year Index and the Barclays Capital Municipal 10-Year Index. The total of all these indices represents all maturities between 1-10 Years.
Bloomberg Barclays Capital U.S. Treasury Bellwether 3-Month Index is a market value-weighted index of investment-grade fixed-rate public obligations of the U.S. Treasury with maturities of 3 months, excluding zero coupon strips.
Bloomberg Barclays Capital U.S. Aggregate Bond Index represents securities that are SEC-registered, taxable, and dollar denominated. The index covers the U.S. investment grade fixed rate bond market, with index components for government and corporate securities, mortgage pass-through securities, and asset-backed securities. These major sectors are subdivided into more specific indices that are calculated and reported on a regular basis. Indexes are rebalanced by market capitalization each month.
Bloomberg Barclays Muni High Yield 5% Tobacco 2% Issuer Cap Index is an issuer constrained sub-index of the Bloomberg Barclays US Municipal High Yield Index that caps issuer exposure to 2% and tobacco stocks to 5%.
Bloomberg Barclays Municipal Bond Index is an unmanaged index of municipal bonds with maturities greater than two years.
The BofA Merrill Lynch 1-3 Year US Municipal Securities Index is a subset of The BofA Merrill Lynch US Municipal Securities Index including all securities with a remaining term to final maturity less than 3 years.
CBOE S&P 500 Buy-Write Index is an index designed to track the performance of a hypothetical covered call strategy on the S&P 500 Index.
MSCI EAFE Index is an unmanaged capitalization weighted composite portfolio consisting of equity total returns of countries in Australia, New Zealand, Europe and the Far East.
Russell 1000 Index is an unmanaged market capitalization weighted total return index which is comprised of the 1,000 largest companies in the Russell 3000 Index.
Russell 1000 Growth Index is an unmanaged capitalization weighted total return index which is comprised of securities in the Russell 1000 Index with greater than average growth orientation.
Russell 1000 Value Index is an unmanaged capitalization weighted total return index which is comprised of those securities in the Russell 1000 Index with a less than average growth orientation.
Russell 2000 Growth Index is an unmanaged capitalization weighted total return index which is comprised of those securities in the Russell 2000 Index with greater than average growth orientation.
Russell 2000 Index is an unmanaged market capitalization weighted total return index which measures the performance of the 2,000 smallest companies in the Russell 3000 Index.
Russell 2000 Value Index is an index measuring the performance approximately 2,000 small-cap companies in the Russell 3000 Index, which is made up of 3,000 of the biggest U.S. stocks. The Russell 2000 Value Index serves as a benchmark for small-cap stocks in the United States.
Russell 3000 Index is an unmanaged capitalization weighted total return index which is comprised of the 3,000 largest U.S. companies based on total market capitalization. The Index re-balances annually.
S&P 500 Index is a market capitalization weighted index comprised of 500 widely held common stocks.
S&P SmallCap 600 Growth Index is comprised of the S&P 600 Index, a market capitalization weighted index of U.S. small cap stocks with capitalizations ranging from about $300 million to $2 billion, that exhibit the strongest growth characteristics.
The S&P MidCap 400 Index is a capitalization weighted index of mid cap stocks with capitalizations ranging from about $750 million to $3 billion.
Morningstar Foreign Large Value Average funds invest mainly in big international stocks that are less expensive than the market as a whole. Most of these funds divide their assets among a dozen or more developed markets, including Japan, Britain, France, and Germany. They tend to invest the rest in emerging markets such as Hong Kong, Brazil, Mexico and Thailand. These funds typically will have less than 20% of assets invested in U.S. stocks.
Morningstar High Yield Muni Average funds invest at least 50% of assets in high-income municipal securities that are not rated or that are rated by a major agency such as S&P Global Ratings or Moody’s Investor Services at the level of BBB (considered speculative in the municipal industry) and below.
THE GLENMEDE FUND, INC.
THE GLENMEDE PORTFOLIOS
Glossary of Indices & Terms — (Concluded)
Morningstar Intermediate-Term Bond Average contains bond funds that have average durations of greater than 3.5 years and less than 6 years. Most of the funds rotate among a variety of sectors in the bond market, based upon that which appears to offer better values.
Morningstar Large Blend Average funds are fairly representative of the overall U.S. Stock market in size, growth rates, and price. The blend style is assigned to funds where neither growth nor value characteristics predominate. These funds tend to invest across the spectrum of U.S. industries, and owing to their broad exposure, the funds returns are often similar to those of the S&P 500 Index.
Morningstar Large Growth Average funds invest in big U.S. companies that are projected to grow faster than other large-cap stocks. This classification consists of stocks in the top 70% of the capitalization of the U.S. equity market defined as large-cap. Growth is defined based on fast growth (high growth rates for earnings, sales, book value, and cash flow) and high valuations (high price ratios and low dividend yields). Most of these funds focus on companies in rapidly expanding industries.
Morningstar Large Value Average funds focus on big companies that are less expensive or growing more slowly than other large-cap stocks. These funds often feature investments in energy, financial, or manufacturing sectors.
Morningstar Long/Short Average funds aim to deliberately exploit market movements through the use of a variety of derivative instruments. These can include (but are not limited to) futures, options, swaps, short sells along with physical positions.
Morningstar Mid-Cap Value Average funds invest primarily in mid-cap U.S. stocks that are value-oriented. Midcap stocks collectively represent 20% of the total capitalization of the U.S. equity market (large-cap stocks represent the top 70%). The mid-cap range for market capitalization typically falls between $1-$8 billion. Value is defined based on low valuations (low price ratios and high dividend yields) and slow growth (low growth rates for earnings, sales, book value, and cash flow).
Morningstar Muni National Short Average invests in bonds with an average duration of less than 4.5 years issued by state and local governments to fund projects. Such bonds are free from federal taxes and from state taxes in the issuing state.
Morningstar Small Blend Average funds favor firms at the smaller end of the market-capitalization range, and are flexible in the types of small caps they buy. Some aim to own an array of value and growth stocks while others employ a discipline that leads to holdings with valuations and growth rates close to the small-cap averages.
Morningstar Small Growth Average funds invest in faster-growing companies whose shares are at the lower end of the market capitalization range. This classification consists of favored companies in up-and-coming industries or young firms in their early growth stages. Because these businesses are fast growing and often richly valued, their stocks tend to be volatile. Stocks in the bottom 10% of the capitalization of the U.S. equity market are defined as small-cap. Growth is defined based on fast growth (high growth rates for earnings, sales, book value, and cash flow) and high valuations (high price ratios and low dividend yields).
Terms
Current Yield: also referred to as the “SEC Yield,” refers to the income generated by an investment in the Portfolio over a 7-day period. This income is then “annualized.” The “effective yield” is calculated similarly but, when annualized, the income earned by an investment in the Portfolio is assumed to be reinvested. The “effective yield” will be slightly higher than the “current yield” because of the compounding effect of this assumed reinvestment. The yield quotation more closely reflects the current earnings of the Portfolio than the total return quotation.
Cash flow: measures the cash generating capability of a company by adding non-cash charges (e.g. depreciation) and interest expense to pretax income.
Duration: is a commonly used measure of the potential volatility of the price of a debt security, or the aggregate market value of a portfolio of debt securities, prior to maturity. Securities with a longer duration generally have more volatile prices than securities of comparable quality with a shorter duration.
Market Capitalization: is the market price of an entire company, calculated by multiplying the number of shares outstanding by the price per share.
Total return: consists of price appreciation/depreciation and income as a percentage of the original investment.
THE GLENMEDE FUND, INC.
Shareholder Expenses (Unaudited)
As a shareholder of a Glenmede Portfolio, you incur ongoing costs, including management fees and/or shareholder servicing fees and other portfolio expenses. The following example is intended to help you understand your ongoing costs (in dollars and cents) of investing in a Glenmede Portfolio and to compare these costs with the ongoing costs of investing in other mutual funds.
The example is based on an investment of $1,000 invested at the beginning of the period and held for the entire period from May 1, 2016 to October 31, 2016.
Actual Expenses
The first line under each Portfolio in the table below provides information about actual account values and actual expenses. You may use the information in this line, together with the amount you invested, to estimate the expenses that you paid over the period. Simply divide your account value by $1,000 (for example, an $8,600 account value divided by $1,000 = 8.6), then multiply the result by the number in the first line for your Portfolio under the heading entitled “Expenses Paid During Period” to estimate the expenses you paid on your account during this period.
Hypothetical Example for Comparison Purposes
The second line under each Portfolio in the table below provides information about hypothetical account values and hypothetical expenses based on each Portfolio’s actual expense ratio and an assumed rate of return of 5% per year before expenses, which is not the Portfolio’s actual return. The hypothetical account values and expenses may not be used to estimate the actual ending account balance or expenses you paid for the period. You may use this information to compare the ongoing costs of investing in your Portfolio and other funds. To do so, compare this 5% hypothetical example with the 5% hypothetical examples that appear in the shareholder reports of the other funds.
| | | | | | | | | | | | | | | | |
| | | Beginning
Account
Value
(May 1, 2016) | | | Ending
Account
Value
(October 31, 2016) | | | Annualized
Expense
Ratio | | | Expenses
Paid During
Period*
(May 1 to
October 31, 2016) | |
Core Fixed Income Portfolio | | | | | | | | | | | | | | | | |
Actual | | $ | 1,000.00 | | | $ | 1,008.10 | | | | 0.54 | % | | $ | 2.73 | |
Hypothetical (5% return less expenses) | | | 1,000.00 | | | | 1,022.40 | | | | 0.54 | | | | 2.75 | |
Strategic Equity Portfolio | | | | | | | | | | | | | | | | |
Actual | | | 1,000.00 | | | | 1,020.70 | | | | 0.84 | | | | 4.27 | |
Hypothetical (5% return less expenses) | | | 1,000.00 | | | | 1,020.90 | | | | 0.84 | | | | 4.27 | |
Small Cap Equity Portfolio - Advisor | | | | | | | | | | | | | | | | |
Actual | | | 1,000.00 | | | | 1,013.20 | | | | 0.90 | | | | 4.55 | |
Hypothetical (5% return less expenses) | | | 1,000.00 | | | | 1,020.60 | | | | 0.90 | | | | 4.57 | |
Small Cap Equity Portfolio - Institutional | | | | | | | | | | | | | | | | |
Actual | | | 1,000.00 | | | | 1,013.90 | | | | 0.70 | | | | 3.54 | |
Hypothetical (5% return less expenses) | | | 1,000.00 | | | | 1,021.60 | | | | 0.70 | | | | 3.56 | |
Mid Cap Equity Portfolio - Advisor | | | | | | | | | | | | | | | | |
Actual | | | 1,000.00 | | | | 989.60 | | | | 1.00 | | | | 5.00 | |
Hypothetical (5% return less expenses) | | | 1,000.00 | | | | 1,020.10 | | | | 1.00 | | | | 5.08 | |
Large Cap Value Portfolio | | | | | | | | | | | | | | | | |
Actual | | | 1,000.00 | | | | 1,049.00 | | | | 0.90 | | | | 4.64 | |
Hypothetical (5% return less expenses) | | | 1,000.00 | | | | 1,020.60 | | | | 0.90 | | | | 4.57 | |
U.S. Emerging Growth Portfolio | | | | | | | | | | | | | | | | |
Actual | | | 1,000.00 | | | | 1,041.40 | | | | 0.92 | | | | 4.72 | |
Hypothetical (5% return less expenses) | | | 1,000.00 | | | | 1,020.50 | | | | 0.92 | | | | 4.67 | |
Large Cap Core Portfolio - Advisor | | | | | | | | | | | | | | | | |
Actual | | | 1,000.00 | | | | 1,038.00 | | | | 0.87 | | | | 4.46 | |
Hypothetical (5% return less expenses) | | | 1,000.00 | | | | 1,020.80 | | | | 0.87 | | | | 4.42 | |
Large Cap Core Portfolio - Institutional | | | | | | | | | | | | | | | | |
Actual | | | 1,000.00 | | | | 1,039.60 | | | | 0.67 | | | | 3.43 | |
Hypothetical (5% return less expenses) | | | 1,000.00 | | | | 1,021.80 | | | | 0.67 | | | | 3.41 | |
Large Cap Growth Portfolio - Advisor | | | | | | | | | | | | | | | | |
Actual | | | 1,000.00 | | | | 1,023.20 | | | | 0.88 | | | | 4.48 | |
Hypothetical (5% return less expenses) | | | 1,000.00 | | | | 1,020.70 | | | | 0.88 | | | | 4.47 | |
Large Cap Growth Portfolio - Institutional | | | | | | | | | | | | | | | | |
Actual | | | 1,000.00 | | | | 1,024.60 | | | | 0.68 | | | | 3.46 | |
Hypothetical (5% return less expenses) | | | 1,000.00 | | | | 1,021.70 | | | | 0.68 | | | | 3.46 | |
Long/Short Portfolio | | | | | | | | | | | | | | | | |
Actual | | | 1,000.00 | | | | 998.20 | | | | 1.17 | | | | 5.88 | |
Hypothetical (5% return less expenses) | | | 1,000.00 | | | | 1,019.30 | | | | 1.17 | | | | 5.94 | |
Total Market Portfolio | | | | | | | | | | | | | | | | |
Actual | | | 1,000.00 | | | | 1,018.60 | | | | 1.25 | | | | 6.34 | |
Hypothetical (5% return less expenses) | | | 1,000.00 | | | | 1,018.90 | | | | 1.25 | | | | 6.34 | |
THE GLENMEDE FUND, INC.
Shareholder Expenses (Unaudited) — (Continued)
| | | | | | | | | | | | | | | | |
| | | Beginning
Account
Value
(May 1, 2016) | | | Ending
Account
Value
(October 31, 2016) | | | Annualized
Expense
Ratio | | | Expenses
Paid During
Period*
(May 1 to
October 31, 2016) | |
High Yield Municipal Portfolio | | | | | | | | | | | | | | | | |
Actual | | $ | 1,000.00 | | | $ | 1,020.70 | | | | 1.00 | % | | $ | 5.08 | |
Hypothetical (5% return less expenses) | | | 1,000.00 | | | | 1,020.10 | | | | 1.00 | | | | 5.08 | |
Responsible ESG U.S. Equity Portfolio | | | | | | | | | | | | | | | | |
Actual | | | 1,000.00 | | | | 1,057.40 | | | | 1.00 | | | | 5.17 | |
Hypothetical (5% return less expenses) | | | 1,000.00 | | | | 1,020.10 | | | | 1.00 | | | | 5.08 | |
Women in Leadership U.S. Equity Portfolio | | | | | | | | | | | | | | | | |
Actual | | | 1,000.00 | | | | 1,047.90 | | | | 1.00 | | | | 5.15 | |
Hypothetical (5% return less expenses) | | | 1,000.00 | | | | 1,020.10 | | | | 1.00 | | | | 5.08 | |
Short Term Tax Aware Fixed Income Portfolio** | | | | | | | | | | | | | | | | |
Actual | | | 1,000.00 | | | | 999.80 | | | | 0.55 | | | | 1.86 | |
Hypothetical (5% return less expenses) | | | 1,000.00 | | | | 1,015.10 | | | | 0.55 | | | | 1.88 | |
Secured Options Portfolio - Advisor | | | | | | | | | | | | | | | | |
Actual | | | 1,000.00 | | | | 1,069.60 | | | | 0.85 | | | | 4.42 | |
Hypothetical (5% return less expenses) | | | 1,000.00 | | | | 1,020.90 | | | | 0.85 | | | | 4.32 | |
International Secured Options Portfolio | | | | | | | | | | | | | | | | |
Actual | | | 1,000.00 | | | | 1,026.80 | | | | 0.87 | | | | 4.43 | |
Hypothetical (5% return less expenses) | | | 1,000.00 | | | | 1,020.80 | | | | 0.87 | | | | 4.42 | |
International Portfolio | | | | | | | | | | | | | | | | |
Actual | | | 1,000.00 | | | | 985.30 | | | | 1.00 | | | | 4.99 | |
Hypothetical (5% return less expenses) | | | 1,000.00 | | | | 1,020.10 | | | | 1.00 | | | | 5.08 | |
| * | Expenses are calculated using the Portfolio’s annualized expense ratio (as disclosed in the table), which is net of fee waivers, dividends on securities sold short and expense reimbursements, if any, multiplied by the average account value for the period, multiplied by the number of days in the period (184 days), and divided by the number of days in the calendar year (366 days). |
| ** | The Short Term Tax Aware Fixed Income Portfolio commenced operations on June 29, 2016. Expenses are calculated using the Portfolio’s annualized expense ratio (as disclosed in the table), multiplied by the average account value for the period, multiplied by the number of days in the period (124 days) (the Portfolio began accruing expenses on June 29, 2016), and divided by the number of days in the calendar year (366 days). |
THE GLENMEDE PORTFOLIOS
Shareholder Expenses (Unaudited)
As a shareholder of the Glenmede Muni Intermediate Portfolio, you incur ongoing costs, including shareholder servicing fees and other portfolio expenses. The following example is intended to help you understand your ongoing costs (in dollars and cents) of investing in the Glenmede Muni Intermediate Portfolio and to compare these costs with the ongoing costs of investing in other mutual funds.
The example is based on an investment of $1,000 invested at the beginning of the period and held for the entire period from May 1, 2016 to October 31, 2016.
Actual Expenses
The first line under the Portfolio in the table below provides information about actual account values and actual expenses. You may use the information in this line, together with the amount you invested, to estimate the expenses that you paid over the period. Simply divide your account value by $1,000 (for example, an $8,600 account value divided by $1,000 = 8.6), then multiply the result by the number in the first line for the Portfolio under the heading entitled “Expenses Paid During Period” to estimate the expenses you paid on your account during this period.
Hypothetical Example for Comparison Purposes
The second line under the Portfolio in the table below provides information about hypothetical account values and hypothetical expenses based on the Portfolio’s actual expense ratio and an assumed rate of return of 5% per year before expenses, which is not the Portfolio’s actual return. The hypothetical account values and expenses may not be used to estimate the actual ending account balance or expenses you paid for the period. You may use this information to compare the ongoing costs of investing in the Portfolio and other funds. To do so, compare this 5% hypothetical example with the 5% hypothetical examples that appear in the shareholder reports of the other funds.
Please note that the expenses shown in the table are meant to highlight your ongoing costs only. As a shareholder of the Glenmede Muni Intermediate Portfolio, you do not incur any transaction costs, such as sales charges (loads), redemption fees or exchange fees, but shareholders of other funds may incur such costs. Therefore, the second line under the Portfolio in the table is useful in comparing ongoing costs only, and will not help you determine the relative total costs of owning different funds whose shareholders may incur transaction costs.
| | | | | | | | | | | | | | | | |
| | | Beginning
Account
Value
(May 1, 2016) | | | Ending
Account
Value
(October 31, 2016) | | | Annualized
Expense
Ratio | | | Expenses
Paid During
Period*
(May 1 to
October 31, 2016) | |
Muni Intermediate Portfolio | | | | | | | | | |
Actual | | $ | 1,000.00 | | | $ | 1,002.90 | | | | 0.24 | % | | $ | 1.21 | |
Hypothetical (5% return less expenses) | | | 1,000.00 | | | | 1,023.90 | | | | 0.24 | | | | 1.22 | |
| * | Expenses are calculated using the Portfolio’s annualized expense ratio (as disclosed in the table), multiplied by the average account value for the period, multiplied by the number of days in the period (184 days), and divided by the number of days in the calendar year (366 days). |
THE GLENMEDE FUND, INC.
STATEMENTS OF ASSETS AND LIABILITIES
October 31, 2016
| | | | | | | | | | | | |
| | | Core
Fixed
Income
Portfolio | | | Strategic
Equity
Portfolio | | | Small
Cap
Equity
Portfolio | |
Assets: | | | | | | | | | | | | |
Investments1: | | | | | | | | | | | | |
Investments at value2 | | $ | 482,323,057 | | | $ | 176,407,294 | | | $ | 2,585,681,584 | |
Repurchase agreements at value | | | 7,178,355 | | | | 3,785,105 | | | | 78,969,763 | |
| | | | | | | | | | | | |
Total investments | | | 489,501,412 | | | | 180,192,399 | | | | 2,664,651,347 | |
| | | | | | | | | | | | |
Receivable for securities sold | | | — | | | | — | | | | 19,131,701 | |
Receivable for fund shares sold | | | 263,187 | | | | 252,869 | | | | 11,535,824 | |
Dividends receivable | | | — | | | | 139,989 | | | | 602,995 | |
Interest receivable | | | 3,976,396 | | | | 1 | | | | 22 | |
Securities lending receivable | | | 479 | | | | 314 | | | | 43,967 | |
Prepaid expenses | | | 2,075 | | | | 695 | | | | 45,226 | |
| | | | | | | | | | | | |
Total assets | | | 493,743,549 | | | | 180,586,267 | | | | 2,696,011,082 | |
| | | | | | | | | | | | |
Liabilities: | | | | | | | | | | | | |
Payable for securities purchased | | | — | | | | — | | | | 22,353,576 | |
Obligation to return securities lending collateral | | | 6,361,580 | | | | 3,551,054 | | | | 36,102,827 | |
Payable for fund shares redeemed | | | 173,970 | | | | 1,098 | | | | 3,213,129 | |
Payable for Management fees | | | 144,201 | | | | 83,005 | | | | 1,261,665 | |
Payable for Directors’ fees | | | 6,763 | | | | 2,537 | | | | 40,994 | |
Payable to Affiliate | | | 41,200 | | | | 30,184 | | | | 354,638 | |
Accrued expenses | | | 144,066 | | | | 54,432 | | | | 772,304 | |
| | | | | | | | | | | | |
Total liabilities | | | 6,871,780 | | | | 3,722,310 | | | | 64,099,133 | |
| | | | | | | | | | | | |
Net Assets | | $ | 486,871,769 | | | $ | 176,863,957 | | | $ | 2,631,911,949 | |
| | | | | | | | | | | | |
Net Assets consist of: | | | | | | | | | | | | |
Par value ($0.001 of shares outstanding) | | $ | 43,223 | | | $ | 8,445 | | | $ | 100,811 | |
Paid-in capital in excess of par value | | | 473,372,282 | | | | 116,164,930 | | | | 2,435,430,442 | |
Undistributed net investment income | | | 771,361 | | | | 224,912 | | | | 401,702 | |
Accumulated net realized gain from investment transactions | | | 3,221,283 | | | | 11,524,103 | | | | 39,355,866 | |
Net unrealized appreciation on investments | | | 9,463,620 | | | | 48,941,567 | | | | 156,623,128 | |
Total Net Assets | | $ | 486,871,769 | | | $ | 176,863,957 | | | $ | 2,631,911,949 | |
| | | | | | | | | | | | |
Shares Outstanding3 | | | 43,222,646 | | | | 8,445,083 | | | | 100,811,020 | |
| | | | | | | | | | | | |
Net Asset Value Per Share | | $ | 11.26 | | | $ | 20.94 | | | $ | — | |
| | | | | | | | | | | | |
Advisor Class — based on net assets of $1,367,160,070, and shares outstanding of 53,391,056 | | | — | | | | — | | | | 25.61 | |
| | | | | | | | | | | | |
Institutional Class — based on net assets of $1,264,751,879 and shares outstanding of 47,419,964 | | | — | | | | — | | | | 26.67 | |
| | | | | | | | | | | | |
| | | | | | | | | | | | |
1 Investment at cost | | $ | 480,037,792 | | | $ | 131,250,832 | | | $ | 2,508,028,219 | |
2 Market value of securities on loan | | $ | 6,235,162 | | | $ | 3,416,893 | | | $ | 34,255,630 | |
3 Authorized shares | | | 160,000,000 | | | | 150,000,000 | | | | — | |
Authorized shares - Advisor Class | | | — | | | | — | | | | 180,000,000 | |
Authorized shares - Institutional Class | | | — | | | | — | | | | 135,000,000 | |
See Notes to Financial Statements.
THE GLENMEDE FUND, INC.
STATEMENTS OF ASSETS AND LIABILITIES — (Continued)
October 31, 2016
| | | | | | | | | | | | |
| | | Mid
Cap
Equity
Portfolio | | | Large
Cap
Value
Portfolio | | | U.S.
Emerging
Growth
Portfolio | |
Assets: | | | | | | | | | | | | |
Investments1: | | | | | | | | | | | | |
Investments at value2 | | $ | 18,270,632 | | | $ | 71,811,050 | | | $ | 54,645,109 | |
Repurchase agreements at value | | | 311,752 | | | | 320,660 | | | | 412,997 | |
| | | | | | | | | | | | |
Total investments | | | 18,582,384 | | | | 72,131,710 | | | | 55,058,106 | |
| | | | | | | | | | | | |
Cash | | | 2,731 | | | | — | | | | — | |
Receivable for fund shares sold | | | — | | | | 1,186 | | | | 2,308 | |
Dividends receivable | | | 8,900 | | | | 176,375 | | | | 5,120 | |
Securities lending receivable | | | 383 | | | | — | | | | 1,505 | |
Prepaid expenses | | | 396 | | | | 294 | | | | 204 | |
| | | | | | | | | | | | |
Total assets | | | 18,594,794 | | | | 72,309,565 | | | | 55,067,243 | |
| | | | | | | | | | | | |
Liabilities: | | | | | | | | | | | | |
Payable for securities purchased | | | 66,378 | | | | 77,362 | | | | — | |
Obligation to return securities lending collateral | | | 446,056 | | | | — | | | | 1,496,136 | |
Payable for fund shares redeemed | | | — | | | | 29 | | | | 17,225 | |
Payable for Management fees | | | 8,573 | | | | 33,649 | | | | 25,413 | |
Payable for Directors’ fees | | | 369 | | | | 1,074 | | | | 743 | |
Payable to Affiliate | | | 3,888 | | | | 12,236 | | | | 11,552 | |
Accrued expenses | | | 20,986 | | | | 30,900 | | | | 21,093 | |
| | | | | | | | | | | | |
Total liabilities | | | 546,250 | | | | 155,250 | | | | 1,572,162 | |
| | | | | | | | | | | | |
Net Assets | | $ | 18,048,544 | | | $ | 72,154,315 | | | $ | 53,495,081 | |
| | | | | | | | | | | | |
Net Assets consist of: | | | | | | | | | | | | |
Par value ($0.001 of shares outstanding) | | $ | 1,822 | | | $ | 7,061 | | | $ | 5,621 | |
Paid-in capital in excess of par value | | | 19,774,317 | | | | 62,057,628 | | | | 46,235,709 | |
Undistributed net investment income | | | 11,382 | | | | 197,031 | | | | 11,278 | |
Accumulated net realized gain (loss) from investment transactions | | | (2,620,691 | ) | | | 5,131,032 | | | | (432,058 | ) |
Net unrealized appreciation on investments | | | 881,714 | | | | 4,761,563 | | | | 7,674,531 | |
Total Net Assets | | $ | 18,048,544 | | | $ | 72,154,315 | | | $ | 53,495,081 | |
| | | | | | | | | | | | |
Shares Outstanding3 | | | 1,822,446 | | | | 7,061,020 | | | | 5,621,111 | |
| | | | | | | | | | | | |
Net Asset Value Per Share | | $ | — | | | $ | 10.22 | | | $ | 9.52 | |
| | | | | | | | | | | | |
Advisor Class — based on net assets of $18,048,544, and shares outstanding of 1,822,446 | | | 9.90 | | | | — | | | | — | |
| | | | | | | | | | | | |
| | | | | | | | | | | | |
1 Investment at cost | | $ | 17,700,670 | | | $ | 67,370,147 | | | $ | 47,383,575 | |
2 Market value of securities on loan | | $ | 409,964 | | | $ | — | | | $ | 1,480,071 | |
3 Authorized shares | | | — | | | | 175,000,000 | | | | 140,000,000 | |
Authorized shares - Advisor Class | | | 120,000,000 | | | | — | | | | — | |
Authorized shares - Institutional Class | | | 120,000,000 | | | | — | | | | — | |
See Notes to Financial Statements.
THE GLENMEDE FUND, INC.
STATEMENTS OF ASSETS AND LIABILITIES — (Continued)
October 31, 2016
| | | | | | | | | | | | |
| | | Large
Cap
Core
Portfolio | | | Large
Cap
Growth
Portfolio | | | Long/Short
Portfolio | |
Assets: | | | | | | | | | | | | |
Investments1: | | | | | | | | | | | | |
Investments at value2 | | $ | 1,972,678,963 | | | $ | 3,008,343,419 | | | $ | 234,974,156 | |
Repurchase agreements at value | | | 14,223,371 | | | | 18,094,528 | | | | 5,813,985 | |
| | | | | | | | | | | | |
Total investments | | | 1,986,902,334 | | | | 3,026,437,947 | | | | 240,788,141 | |
| | | | | | | | | | | | |
Receivable for fund shares sold | | | 2,391,707 | | | | 3,423,615 | | | | 190,124 | |
Dividends receivable | | | 1,419,339 | | | | 2,403,301 | | | | 152,983 | |
Interest receivable | | | 4 | | | | 5 | | | | 2 | |
Securities lending receivable | | | 35,829 | | | | 1,239 | | | | 329 | |
Cash collateral on deposit at broker (Note 1) | | | — | | | | — | | | | 161,256,352 | |
Prepaid expenses | | | 39,282 | | | | 41,189 | | | | 1,004 | |
| | | | | | | | | | | | |
Total assets | | | 1,990,788,495 | | | | 3,032,307,296 | | | | 402,388,935 | |
| | | | | | | | | | | | |
Liabilities: | | | | | | | | | | | | |
Obligation to return securities lending collateral | | | 19,850,223 | | | | — | | | | 4,252,730 | |
Payable for fund shares redeemed | | | 2,176,591 | | | | 5,990,075 | | | | 68,026 | |
Dividend payable on securities sold short | | | — | | | | — | | | | 112,098 | |
Payable for securities sold short, at value3 | | | — | | | | — | | | | 158,239,255 | |
Payable for Management fees | | | 928,106 | | | | 1,435,154 | | | | 172,350 | |
Payable for Directors’ fees | | | 33,465 | | | | 36,518 | | | | 3,405 | |
Payable to Affiliate | | | 289,255 | | | | 515,783 | | | | 40,553 | |
Accrued expenses | | | 727,145 | | | | 873,400 | | | | 87,065 | |
| | | | | | | | | | | | |
Total liabilities | | | 24,004,785 | | | | 8,850,930 | | | | 162,975,482 | |
| | | | | | | | | | | | |
Net Assets | | $ | 1,966,783,710 | | | $ | 3,023,456,366 | | | $ | 239,413,453 | |
| | | | | | | | | | | | |
Net Assets consist of: | | | | | | | | | | | | |
Par value ($0.001 of shares outstanding) | | $ | 87,951 | | | $ | 122,096 | | | $ | 21,016 | |
Paid-in capital in excess of par value | | | 1,757,195,707 | | | | 2,842,307,327 | | | | 231,423,230 | |
Undistributed (distributions in excess of) net investment income | | | 1,568,955 | | | | 917,908 | | | | (795,240 | ) |
Accumulated net realized loss from investment transactions | | | (1,514,945 | ) | | | (21,694,349 | ) | | | (18,467,451 | ) |
Net unrealized appreciation on investments | | | 209,446,042 | | | | 201,803,384 | | | | 21,253,865 | |
Net unrealized appreciation on securities sold short | | | — | | | | — | | | | 5,978,033 | |
Total Net Assets | | $ | 1,966,783,710 | | | $ | 3,023,456,366 | | | $ | 239,413,453 | |
| | | | | | | | | | | | |
Shares Outstanding4 | | | 87,950,634 | | | | 122,095,538 | | | | 21,016,267 | |
| | | | | | | | | | | | |
Net Asset Value Per Share | | $ | — | | | $ | — | | | $ | 11.39 | |
| | | | | | | | | | | | |
Advisor Class — based on net assets of $1,691,801,874 and $2,988,342,049, respectively, and shares outstanding of 75,656,148 and 120,677,789, respectively | | | 22.36 | | | | 24.76 | | | | — | |
| | | | | | | | | | | | |
Institutional Class — based on net assets of $274,981,836 and $35,114,317, respectively and shares outstanding of 12,294,486 and 1,417,749, respectively | | | 22.37 | | | | 24.77 | | | | — | |
| | | | | | | | | | | | |
| | | | | | | | | | | | |
1 Investment at cost | | $ | 1,777,456,292 | | | $ | 2,824,634,563 | | | $ | 219,534,276 | |
2 Market value of securities on loan | | $ | 19,687,414 | | | $ | — | | | $ | 4,265,614 | |
3 Proceeds from securities sold short | | $ | — | | | $ | — | | | $ | 164,217,288 | |
4 Authorized shares | | | — | | | | — | | | | 120,000,000 | |
Authorized shares - Advisor Class | | | 155,000,000 | | | | 140,000,000 | | | | — | |
Authorized shares - Institutional Class | | | 155,000,000 | | | | 140,000,000 | | | | — | |
See Notes to Financial Statements.
THE GLENMEDE FUND, INC.
STATEMENTS OF ASSETS AND LIABILITIES — (Continued)
October 31, 2016
| | | | | | | | | | | | |
| | | Total
Market
Portfolio | | | High Yield
Municipal
Portfolio1 | | | Responsible
ESG U.S.
Equity
Portfolio1 | |
Assets: | | | | | | | | | | | | |
Investments2: | | | | | | | | | | | | |
Investments at value | | $ | 77,712,890 | | | $ | 151,232,487 | | | $ | 6,510,028 | |
Repurchase agreements at value | | | 201,551 | | | | — | | | | 106,445 | |
| | | | | | | | | | | | |
Total investments | | | 77,914,441 | | | | 151,232,487 | | | | 6,616,473 | |
| | | | | | | | | | | | |
Cash | | | — | | | | 5,868,961 | | | | — | |
Receivable from Advisor | | | — | | | | 10,394 | | | | — | |
Receivable for securities sold | | | — | | | | 149,545 | | | | — | |
Receivable for fund shares sold | | | 12,504 | | | | 440,403 | | | | — | |
Dividends receivable | | | 38,368 | | | | — | | | | 4,107 | |
Interest receivable | | | — | | | | 1,599,197 | | | | — | |
Prepaid expenses | | | 318 | | | | 1,886 | | | | 90 | |
| | | | | | | | | | | | |
Total assets | | | 77,965,631 | | | | 159,302,873 | | | | 6,620,670 | |
| | | | | | | | | | | | |
Liabilities: | | | | | | | | | | | | |
Payable for securities purchased | | | — | | | | 2,384 | | | | 32,936 | |
Payable for when-issued securities | | | — | | | | 5,224,713 | | | | — | |
Payable to Advisor | | | — | | | | — | | | | 12,929 | |
Payable for fund shares redeemed | | | 19,363 | | | | 9,133 | | | | — | |
Dividend payable on securities sold short | | | 12,900 | | | | — | | | | — | |
Payable for securities sold short, at value3 | | | 16,737,338 | | | | — | | | | — | |
Payable for Management fees | | | 44,903 | | | | 82,434 | | | | 3,058 | |
Payable for Directors’ fees | | | 1,082 | | | | 1,426 | | | | 55 | |
Payable to Affiliate | | | 10,567 | | | | 31,705 | | | | 1,112 | |
Accrued expenses | | | 56,884 | | | | 60,778 | | | | 10,019 | |
| | | | | | | | | | | | |
Total liabilities | | | 16,883,037 | | | | 5,412,573 | | | | 60,109 | |
| | | | | | | | | | | | |
Net Assets | | $ | 61,082,594 | | | $ | 153,890,300 | | | $ | 6,560,561 | |
| | | | | | | | | | | | |
Net Assets consist of: | | | | | | | | | | | | |
Par value ($0.001 of shares outstanding) | | $ | 4,169 | | | $ | 14,812 | | | $ | 605 | |
Paid-in capital in excess of par value | | | 48,431,785 | | | | 151,669,983 | | | | 6,202,769 | |
Undistributed net investment income | | | 18,311 | | | | 307,166 | | | | 4,238 | |
Accumulated net realized gain (loss) from investment transactions | | | (1,097,026 | ) | | | 604,722 | | | | (35,376 | ) |
Net unrealized appreciation on investments | | | 12,010,538 | | | | 1,293,617 | | | | 388,325 | |
Net unrealized appreciation on securities sold short | | | 1,714,817 | | | | — | | | | — | |
Total Net Assets | | $ | 61,082,594 | | | $ | 153,890,300 | | | $ | 6,560,561 | |
| | | | | | | | | | | | |
Shares Outstanding4 | | | 4,169,258 | | | | 14,811,686 | | | | 605,031 | |
| | | | | | | | | | | | |
Net Asset Value Per Share | | $ | 14.65 | | | $ | 10.39 | | | $ | 10.84 | |
| | | | | | | | | | | | |
1 Portfolio commenced operations on December 22, 2015. | | | | | | | | | | | | |
2 Investment at cost | | $ | 65,903,903 | | | $ | 149,938,870 | | | $ | 6,228,148 | |
3 Proceeds from securities sold short | | $ | 18,452,155 | | | $ | — | | | $ | — | |
4 Authorized shares | | | 120,000,000 | | | | 80,000,000 | | | | 80,000,000 | |
See Notes to Financial Statements.
THE GLENMEDE FUND, INC.
STATEMENTS OF ASSETS AND LIABILITIES — (Continued)
October 31, 2016
| | | | | | | | | | | | |
| | | Women in
Leadership
U.S. Equity
Portfolio1 | | | Short Term
Tax Aware
Fixed
Income
Portfolio2 | | | Secured
Options
Portfolio | |
Assets: | | | | | | | | | | | | |
Investments3: | | | | | | | | | | | | |
Investments at value | | $ | 6,473,592 | | | $ | 31,339,631 | | | $ | 520,058,655 | |
Repurchase agreements at value | | | 107,886 | | | | — | | | | 41,080,677 | |
| | | | | | | | | | | | |
Total investments | | | 6,581,478 | | | | 31,339,631 | | | | 561,139,332 | |
| | | | | | | | | | | | |
Cash | | | — | | | | 39,476 | | | | — | |
Receivable from Advisor | | | — | | | | 12,833 | | | | — | |
Receivable for fund shares sold | | | — | | | | — | | | | 336,519 | |
Dividends receivable | | | 5,590 | | | | 143 | | | | — | |
Interest receivable | | | — | | | | 274,249 | | | | 11 | |
Cash collateral on deposit at broker (Note 1) | | | — | | | | — | | | | 22,475,062 | |
Prepaid expenses | | | 82 | | | | 21,695 | | | | 8,485 | |
| | | | | | | | | | | | |
Total assets | | | 6,587,150 | | | | 31,688,027 | | | | 583,959,409 | |
| | | | | | | | | | | | |
Liabilities: | | | | | | | | | | | | |
Payable for securities purchased | | | 45,473 | | | | — | | | | — | |
Payable for when-issued securities | | | — | | | | 1,586,545 | | | | — | |
Payable to Advisor | | | 12,095 | | | | — | | | | — | |
Payable for fund shares redeemed | | | — | | | | — | | | | 140,322 | |
Options written, at value4 | | | — | | | | — | | | | 9,086,075 | |
Payable for Management fees | | | 3,034 | | | | 8,949 | | | | 265,948 | |
Payable for Directors’ fees | | | 50 | | | | 302 | | | | 6,782 | |
Payable to Affiliate | | | 1,103 | | | | 2,557 | | | | 96,708 | |
Accrued expenses | | | 8,737 | | | | 13,228 | | | | 163,735 | |
| | | | | | | | | | | | |
Total liabilities | | | 70,492 | | | | 1,611,581 | | | | 9,759,570 | |
| | | | | | | | | | | | |
Net Assets | | $ | 6,516,658 | | | $ | 30,076,446 | | | $ | 574,199,839 | |
| | | | | | | | | | | | |
Net Assets consist of: | | | | | | | | | | | | |
Par value ($0.001 of shares outstanding) | | $ | 612 | | | $ | 3,011 | | | $ | 46,124 | |
Paid-in capital in excess of par value | | | 6,280,567 | | | | 30,150,028 | | | | 541,675,584 | |
Undistributed net investment income | | | 8,760 | | | | 12,343 | | | | (23,727 | ) |
Accumulated net realized gain (loss) from investment transactions | | | (9,549 | ) | | | (130 | ) | | | 29,092,583 | |
Net unrealized appreciation (depreciation) on investments | | | 236,268 | | | | (88,806 | ) | | | 4,383,835 | |
Net unrealized appreciation (depreciation) on options written | | | — | | | | — | | | | (974,560 | ) |
Total Net Assets | | $ | 6,516,658 | | | $ | 30,076,446 | | | $ | 574,199,839 | |
| | | | | | | | | | | | |
Shares Outstanding5 | | | 611,683 | | | | 3,011,382 | | | | 46,124,459 | |
| | | | | | | | | | | | |
Net Asset Value Per Share | | $ | 10.65 | | | $ | 9.99 | | | $ | — | |
| | | | | | | | | | | | |
Advisor Class — based on net assets of $574,199,839, and shares outstanding of 46,124,459 | | | — | | | | — | | | | 12.45 | |
| | | | | | | | | | | | |
| | | | | | | | | | | | |
1 Portfolio commenced operations on December 22, 2015. | | | | | | | | | | | | |
2 The Short Term Tax Aware Fixed Income Portfolio commenced operations on June 29, 2016. | | | | | | | | | | | | |
3 Investment at cost | | $ | 6,345,210 | | | $ | 31,428,437 | | | $ | 556,755,497 | |
4 Premiums received from options written | | $ | — | | | $ | — | | | $ | 8,111,515 | |
5 Authorized shares | | | 80,000,000 | | | | 80,000,000 | | | | — | |
Authorized shares - Advisor Class | | | — | | | | — | | | | 160,000,000 | |
Authorized shares - Institutional Class | | | — | | | | — | | | | 160,000,000 | |
See Notes to Financial Statements.
THE GLENMEDE FUND, INC.
STATEMENTS OF ASSETS AND LIABILITIES — (Continued)
October 31, 2016
| | | | | | | | |
| | | International
Secured
Options
Portfolio | | | International
Portfolio | |
Assets: | | | | | | | | |
Investments1: | | | | | | | | |
Investments at value | | $ | 24,597,137 | | | $ | 437,017,936 | |
Repurchase agreements at value | | | 2,257,479 | | | | 4,196,979 | |
| | | | | | | | |
Total investments | | | 26,854,616 | | | | 441,214,915 | |
| | | | | | | | |
Receivable from Advisor | | | — | | | | 45,007 | |
Receivable for securities sold | | | 25 | | | | 39,328,626 | |
Receivable for fund shares sold | | | 17,358 | | | | 290,385 | |
Dividends receivable | | | 30,388 | | | | 435,390 | |
Securities lending receivable | | | — | | | | 30 | |
Cash collateral on deposit at broker (Note 1) | | | 1,993,324 | | | | — | |
Foreign tax reclaims receivable | | | 61,497 | | | | 248,440 | |
Prepaid expenses | | | 135 | | | | 1,560 | |
| | | | | | | | |
Total assets | | | 28,957,343 | | | | 481,564,353 | |
| | | | | | | | |
Liabilities: | | | | | | | | |
Payable for securities purchased | | | — | | | | 39,696,592 | |
Payable for fund shares redeemed | | | — | | | | 28,102 | |
Options written, at value2 | | | 101,530 | | | | — | |
Payable for Management fees | | | 13,472 | | | | 281,335 | |
Payable for Directors’ fees | | | 565 | | | | 5,618 | |
Payable to Affiliate | | | 4,899 | | | | 93,778 | |
Accrued expenses | | | 18,693 | | | | 174,656 | |
| | | | | | | | |
Total liabilities | | | 139,159 | | | | 40,280,081 | |
| | | | | | | | |
Net Assets | | $ | 28,818,184 | | | $ | 441,284,272 | |
| | | | | | | | |
Net Assets consist of: | | | | | | | | |
Par value ($0.001 of shares outstanding) | | $ | 3,003 | | | $ | 34,596 | |
Paid-in capital in excess of par value | | | 35,950,930 | | | | 509,368,007 | |
Undistributed net investment income | | | 23,622 | | | | 65,797 | |
Accumulated net realized loss from investment transactions | | | (7,645,542 | ) | | | (81,660,891 | ) |
Net unrealized appreciation on investments | | | 395,320 | | | | 13,477,024 | |
Net unrealized appreciation on options written | | | 90,851 | | | | — | |
Net unrealized appreciation (depreciation) on foreign currencies | | | — | | | | (261 | ) |
Total Net Assets | | $ | 28,818,184 | | | $ | 441,284,272 | |
| | | | | | | | |
Shares Outstanding3 | �� | | 3,002,897 | | | | 34,595,576 | |
| | | | | | | | |
Net Asset Value Per Share | | $ | 9.60 | | | $ | 12.76 | |
| | | | | | | | |
| | | | | | | | |
1 Investment at cost | | $ | 26,459,296 | | | $ | 427,737,891 | |
2 Premiums received from options written | | $ | 192,381 | | | $ | — | |
3 Authorized shares | | | 120,000,000 | | | | 120,000,000 | |
See Notes to Financial Statements.
THE GLENMEDE FUND, INC.
STATEMENTS OF OPERATIONS
For the Year Ended October 31, 2016
| | | | | | | | | | | | |
| | | Core
Fixed
Income
Portfolio | | | Strategic
Equity
Portfolio | | | Small
Cap
Equity
Portfolio | |
Investment income: | | | | | | | | | | | | |
Dividends | | $ | — | | | $ | 3,109,843 | | | $ | 25,298,180 | |
Interest | | | 10,725,769 | | | | 226 | | | | 5,878 | |
Income from security lending | | | 17,356 | | | | 5,593 | | | | 337,259 | |
| | | | | | | | | | | | |
Total investment income | | | 10,743,125 | | | | 3,115,662 | | | | 25,641,317 | |
| | | | | | | | | | | | |
Expenses: | | | | | | | | | | | | |
Management fees | | | 1,581,150 | | | | 930,279 | | | | 13,757,093 | |
Administration, transfer agent and custody fees | | | 260,667 | | | | 96,812 | | | | 1,756,398 | |
Professional fees | | | 46,422 | | | | 17,076 | | | | 267,858 | |
Shareholder report expenses | | | 52,807 | | | | 21,505 | | | | 408,917 | |
Shareholder servicing fees | | | 451,757 | | | | 338,283 | | | | — | |
Shareholder servicing fees (Advisor Class) | | | — | | | | — | | | | 3,491,229 | |
Shareholder servicing fees (Institutional Class) | | | — | | | | — | | | | 552,399 | |
Directors’ fees and expenses | | | 23,168 | | | | 8,677 | | | | 130,883 | |
Registration and filing fees | | | 7,677 | | | | 7,147 | | | | 52,571 | |
Other expenses | | | 19,958 | | | | 7,322 | | | | 192,549 | |
| | | | | | | | | | | | |
Total expenses | | | 2,443,606 | | | | 1,427,101 | | | | 20,609,897 | |
| | | | | | | | | | | | |
Net expenses | | | 2,443,606 | | | | 1,427,101 | | | | 20,609,897 | |
| | | | | | | | | | | | |
Net investment income | | | 8,299,519 | | | | 1,688,561 | | | | 5,031,420 | |
| | | | | | | | | | | | |
Realized and unrealized gain (loss): | | | | | | | | | | | | |
Net realized gain on:
Investment transactions | | | 4,002,597 | | | | 11,529,759 | | | | 45,618,145 | |
| | | | | | | | | | | | |
Net change in unrealized gain (loss) of:
Investments | | | 1,587,602 | | | | (4,959,292 | ) | | | (46,930,013 | ) |
| | | | | | | | | | | | |
Net realized and unrealized gain (loss) | �� | | 5,590,199 | | | | 6,570,467 | | | | (1,311,868 | ) |
| | | | | | | | | | | | |
Net increase in net assets resulting from operations | | $ | 13,889,718 | | | $ | 8,259,028 | | | $ | 3,719,552 | |
| | | | | | | | | | | | |
See Notes to Financial Statements.
THE GLENMEDE FUND, INC.
STATEMENTS OF OPERATIONS — (Continued)
For the Year Ended October 31, 2016
| | | | | | | | | | | | |
| | | Mid
Cap
Equity
Portfolio | | | Large
Cap
Value
Portfolio | | | U.S.
Emerging
Growth
Portfolio | |
Investment income: | | | | | | | | | | | | |
Dividends | | $ | 390,049 | | | $ | 1,939,839 | | | $ | 587,558 | |
Interest | | | 55 | | | | 32 | | | | 35 | |
Income from security lending | | | 10,704 | | | | 14,386 | | | | 35,709 | |
| | | | | | | | | | | | |
Total investment income | | | 400,808 | | | | 1,954,257 | | | | 623,302 | |
| | | | | | | | | | | | |
Expenses: | | | | | | | | | | | | |
Management fees | | | 132,508 | | | | 392,705 | | | | 273,207 | |
Administration, transfer agent and custody fees | | | 39,047 | | | | 71,130 | | | | 44,030 | |
Professional fees | | | 2,666 | | | | 6,603 | | | | 4,916 | |
Shareholder report expenses | | | 4,583 | | | | 10,147 | | | | 6,668 | |
Shareholder servicing fees | | | — | | | | 142,802 | | | | 124,185 | |
Shareholder servicing fees (Advisor Class) | | | 60,231 | | | | — | | | | — | |
Directors’ fees and expenses | | | 1,325 | | | | 3,712 | | | | 2,517 | |
Registration and filing fees | | | 33,236 | | | | 16,887 | | | | 8,066 | |
Other expenses | | | 4,147 | | | | 3,644 | | | | 3,963 | |
| | | | | | | | | | | | |
Total expenses | | | 277,743 | | | | 647,630 | | | | 467,552 | |
| | | | | | | | | | | | |
Less expenses waived/reimbursed | | | (36,820 | ) | | | — | | | | — | |
| | | | | | | | | | | | |
Net expenses | | | 240,923 | | | | 647,630 | | | | 467,552 | |
| | | | | | | | | | | | |
Net investment income | | | 159,885 | | | | 1,306,627 | | | | 155,750 | |
| | | | | | | | | | | | |
Realized and unrealized gain (loss): | | | | | | | | | | | | |
Net realized gain (loss) on: | | | | | | | | | | | | |
Investment transactions | | | (2,499,920 | ) | | | 5,238,363 | | | | (318,278 | ) |
| | | | | | | | | | | | |
Net change in unrealized gain (loss) of:
Investments | | | 756,464 | | | | (3,024,298 | ) | | | 920,544 | |
| | | | | | | | | | | | |
Net realized and unrealized gain (loss) | | | (1,743,456 | ) | | | 2,214,065 | | | | 602,266 | |
| | | | | | | | | | | | |
Net increase (decrease) in net assets resulting from operations | | $ | (1,583,571 | ) | | $ | 3,520,692 | | | $ | 758,016 | |
| | | | | | | | | | | | |
See Notes to Financial Statements.
THE GLENMEDE FUND, INC.
STATEMENTS OF OPERATIONS — (Continued)
For the Year Ended October 31, 2016
| | | | | | | | | | | | |
| | | Large
Cap
Core
Portfolio | | | Large
Cap
Growth
Portfolio | | | Long/Short
Portfolio | |
Investment income: | | | | | | | | | | | | |
Dividends | | $ | 41,316,265 | | | $ | 35,170,592 | | | $ | 4,418,339 | |
Interest | | | 1,744 | | | | 2,009 | | | | 1,041 | |
Income from security lending | | | 302,034 | | | | 357,605 | | | | 35,834 | |
| | | | | | | | | | | | |
Total investment income | | | 41,620,043 | | | | 35,530,206 | | | | 4,455,214 | |
| | | | | | | | | | | | |
Expenses: | | | | | | | | | | | | |
Management fees | | | 11,364,061 | | | | 12,653,691 | | | | 2,724,661 | |
Administration, transfer agent and custody fees | | | 1,680,943 | | | | 2,026,438 | | | | 176,715 | |
Professional fees | | | 227,776 | | | | 245,954 | | | | 23,554 | |
Shareholder report expenses | | | 322,897 | | | | 348,747 | | | | 31,685 | |
Shareholder servicing fees | | | — | | | | — | | | | 454,110 | |
Shareholder servicing fees (Advisor Class) | | | 3,685,860 | | | | 4,572,522 | | | | — | |
Dividends on securities sold short | | | — | | | | — | | | | 2,730,862 | |
Directors’ fees and expenses | | | 107,758 | | | | 117,912 | | | | 11,728 | |
Registration and filing fees | | | 83,845 | | | | 126,261 | | | | 21,089 | |
Other expenses | | | 229,077 | | | | 189,426 | | | | 15,890 | |
| | | | | | | | | | | | |
Total expenses | | | 17,702,217 | | | | 20,280,951 | | | | 6,190,294 | |
| | | | | | | | | | | | |
Less expenses waived/reimbursed | | | — | | | | — | | | | (794,693 | ) |
| | | | | | | | | | | | |
Net expenses | | | 17,702,217 | | | | 20,280,951 | | | | 5,395,601 | |
| | | | | | | | | | | | |
Net investment income (loss) | | | 23,917,826 | | | | 15,249,255 | | | | (940,387 | ) |
| | | | | | | | | | | | |
Realized and unrealized gain (loss): | | | | | | | | | | | | |
Net realized gain (loss) on: | | | | | | | | | | | | |
Investment transactions | | | (1,338,440 | ) | | | (4,531,961 | ) | | | (1,826,086 | ) |
Securities sold short | | | — | | | | — | | | | (1,494,968 | ) |
| | | | | | | | | | | | |
Net realized loss | | | (1,338,440 | ) | | | (4,531,961 | ) | | | (3,321,054 | ) |
| | | �� | | | | | | | | | |
Net change in unrealized gain (loss) of: | | | | | | | | | | | | |
Investments | | | 68,724,402 | | | | 31,738 | | | | 10,007,001 | |
Securities sold short | | | — | | | | — | | | | (4,273,799 | ) |
| | | | | | | | | | | | |
Net change in unrealized gain | | | 68,724,402 | | | | 31,738 | | | | 5,733,202 | |
| | | | | | | | | | | | |
Net realized and unrealized gain (loss) | | | 67,385,962 | | | | (4,500,223 | ) | | | 2,412,148 | |
| | | | | | | | | | | | |
Net increase in net assets resulting from operations | | $ | 91,303,788 | | | $ | 10,749,032 | | | $ | 1,471,761 | |
| | | | | | | | | | | | |
See Notes to Financial Statements.
THE GLENMEDE FUND, INC.
STATEMENTS OF OPERATIONS — (Continued)
For the Year Ended October 31, 2016
| | | | | | | | | | | | |
| | | Total
Market
Portfolio | | | High Yield
Municipal
Portfolio1 | | | Responsible
ESG U.S.
Equity
Portfolio1 | |
Investment income: | | | | | | | | | | | | |
Dividends | | $ | 1,926,391 | | | $ | — | | | $ | 59,083 | |
Interest | | | 18 | | | | 2,926,738 | | | | 5 | |
Income from security lending | | | 10,986 | | | | — | | | | — | |
| | | | | | | | | | | | |
Total investment income | | | 1,937,395 | | | | 2,926,738 | | | | 59,088 | |
| | | | | | | | | | | | |
Expenses: | | | | | | | | | | | | |
Management fees | | | 854,570 | | | | 552,089 | | | | 18,425 | |
Administration, transfer agent and custody fees | | | 142,317 | | | | 69,142 | | | | 19,855 | |
Professional fees | | | 7,575 | | | | 17,013 | | | | 733 | |
Shareholder report expenses | | | 13,358 | | | | 19,050 | | | | 3,215 | |
Shareholder servicing fees | | | 142,428 | | | | 212,342 | | | | 6,700 | |
Dividends on securities sold short | | | 504,485 | | | | — | | | | — | |
Directors’ fees and expenses | | | 3,917 | | | | 4,089 | | | | 149 | |
Short position flex fees | | | 146,411 | | | | — | | | | — | |
Offering expenses | | | — | | | | 30,384 | | | | 19,647 | |
Registration and filing fees | | | 22,347 | | | | 3,874 | | | | 3,722 | |
Other expenses | | | 3,765 | | | | 15,414 | | | | 1,777 | |
| | | | | | | | | | | | |
Total expenses | | | 1,841,173 | | | | 923,397 | | | | 74,223 | |
| | | | | | | | | | | | |
Less expenses waived/reimbursed | | | (300,101 | ) | | | (74,030 | ) | | | (40,724 | ) |
| | | | | | | | | | | | |
Net expenses | | | 1,541,072 | | | | 849,367 | | | | 33,499 | |
| | | | | | | | | | | | |
Net investment income | | | 396,323 | | | | 2,077,371 | | | | 25,589 | |
| | | | | | | | | | | | |
Realized and unrealized gain (loss): | | | | | | | | | | | | |
Net realized gain (loss) on: | | | | | | | | | | | | |
Investment transactions | | | (751,552 | ) | | | 597,983 | | | | (37,331 | ) |
Securities sold short | | | 621,987 | | | | — | | | | — | |
| | | | | | | | | | | | |
Net realized gain (loss) | | | (129,565 | ) | | | 597,983 | | | | (37,331 | ) |
| | | | | | | | | | | | |
Net change in unrealized gain (loss) of: | | | | | | | | | | | | |
Investments | | | (262,089 | ) | | | 1,293,617 | | | | 388,325 | |
Securities sold short | | | (694,316 | ) | | | — | | | | — | |
| | | | | | | | | | | | |
Net change in unrealized gain (loss) | | | (956,405 | ) | | | 1,293,617 | | | | 388,325 | |
| | | | | | | | | | | | |
Net realized and unrealized gain (loss) | | | (1,085,970 | ) | | | 1,891,600 | | | | 350,994 | |
| | | | | | | | | | | | |
Net increase (decrease) in net assets resulting from operations | | $ | (689,647 | ) | | $ | 3,968,971 | | | $ | 376,583 | |
| | | | | | | | | | | | |
| 1 | Portfolio commenced operations on December 22, 2015. |
See Notes to Financial Statements.
THE GLENMEDE FUND, INC.
STATEMENTS OF OPERATIONS — (Continued)
For the Year Ended October 31, 2016
| | | | | | | | | | | | |
| | | Women in
Leadership
U.S. Equity
Portfolio1 | | | Short Term
Tax Aware
Fixed
Income
Portfolio2 | | | Secured
Options
Portfolio | |
Investment income: | | | | | | | | | | | | |
Dividends | | $ | 71,070 | | | $ | 12,400 | | | $ | 223,427 | |
Interest | | | 5 | | | | 62,891 | | | | 208,489 | |
| | | | | | | | | | | | |
Total investment income | | | 71,075 | | | | 75,291 | | | | 431,916 | |
| | | | | | | | | | | | |
Expenses: | | | | | | | | | | | | |
Management fees | | | 16,856 | | | | 26,017 | | | | 2,522,624 | |
Administration, transfer agent and custody fees | | | 16,388 | | | | 11,086 | | | | 275,852 | |
Professional fees | | | 711 | | | | 2,109 | | | | 54,345 | |
Shareholder report expenses | | | 2,492 | | | | 889 | | | | 53,547 | |
Shareholder servicing fees | | | 6,129 | | | | 7,433 | | | | — | |
Shareholder servicing fees (Advisor Class) | | | — | | | | — | | | | 917,318 | |
Directors’ fees and expenses | | | 133 | | | | 403 | | | | 22,498 | |
Offering expenses | | | 19,647 | | | | 17,184 | | | | — | |
Registration and filing fees | | | 4,298 | | | | 172 | | | | 24,566 | |
Other expenses | | | 1,744 | | | | 2,381 | | | | 33,909 | |
| | | | | | | | | | | | |
Total expenses | | | 68,398 | | | | 67,674 | | | | 3,904,659 | |
| | | | | | | | | | | | |
Less expenses waived/reimbursed | | | (37,751 | ) | | | (26,790 | ) | | | — | |
| | | | | | | | | | | | |
Net expenses | | | 30,647 | | | | 40,884 | | | | 3,904,659 | |
| | | | | | | | | | | | |
Net investment income (loss) | | | 40,428 | | | | 34,407 | | | | (3,472,743 | ) |
| | | | | | | | | | | | |
Realized and unrealized gain (loss): | | | | | | | | | | | | |
Net realized gain (loss) on: | | | | | | | | | | | | |
Investment transactions | | | (9,578 | ) | | | (130 | ) | | | 264,711 | |
Options written | | | — | | | | — | | | | 36,051,561 | |
| | | | | | | | | | | | |
Net realized gain (loss) | | | (9,578 | ) | | | (130 | ) | | | 36,316,272 | |
| | | | | | | | | | | | |
Net change in unrealized gain (loss) of: | | | | | | | | | | | | |
Investments | | | 236,268 | | | | (88,806 | ) | | | 244,394 | |
Options written | | | — | | | | — | | | | (4,695,056 | ) |
| | | | | | | | | | | | |
Net change in unrealized gain (loss) | | | 236,268 | | | | (88,806 | ) | | | (4,450,662 | ) |
| | | | | | | | | | | | |
Net realized and unrealized gain (loss) | | | 226,690 | | | | (88,936 | ) | | | 31,865,610 | |
| | | | | | | | | | | | |
Net increase (decrease) in net assets resulting from operations | | $ | 267,118 | | | $ | (54,529 | ) | | $ | 28,392,867 | |
| | | | | | | | | | | | |
| 1 | Portfolio commenced operations on December 22, 2015. |
| 2 | The Short Term Tax Aware Fixed Income Portfolio commenced operations on June 29, 2016. |
See Notes to Financial Statements.
THE GLENMEDE FUND, INC.
STATEMENTS OF OPERATIONS — (Continued)
For the Year Ended October 31, 2016
| | | | | | | | |
| | | International
Secured
Options
Portfolio | | | International
Portfolio | |
Investment income: | | | | | | | | |
Dividends1 | | $ | 933,361 | | | $ | 11,027,663 | |
Interest | | | 753 | | | | 426 | |
Income from security lending | | | — | | | | 346 | |
| | | | | | | | |
Total investment income | | | 934,114 | | | | 11,028,435 | |
| | | | | | | | |
Expenses: | | | | | | | | |
Management fees | | | 203,207 | | | | 2,833,326 | |
Administration, transfer agent and custody fees | | | 37,180 | | | | 285,410 | |
Professional fees | | | 3,538 | | | | 38,518 | |
Shareholder report expenses | | | 5,695 | | | | 41,230 | |
Shareholder servicing fees | | | 73,894 | | | | 944,442 | |
Directors’ fees and expenses | | | 1,971 | | | | 18,436 | |
Interest expense | | | 3,389 | | | | — | |
Registration and filing fees | | | 4,279 | | | | 18,566 | |
Other expenses | | | 6,728 | | | | 48,315 | |
| | | | | | | | |
Total expenses | | | 339,881 | | | | 4,228,243 | |
| | | | | | | | |
Less expenses waived/reimbursed | | | — | | | | (317,958 | ) |
| | | | | | | | |
Net expenses | | | 339,881 | | | | 3,910,285 | |
| | | | | | | | |
Net investment income | | | 594,233 | | | | 7,118,150 | |
| | | | | | | | |
Realized and unrealized gain (loss): | | | | | | | | |
Net realized gain (loss) on: | | | | | | | | |
Investment transactions | | | (3,203,812 | ) | | | (25,769,702 | ) |
Options written | | | 1,313,495 | | | | — | |
Foreign currency transactions | | | — | | | | (3,457 | ) |
| | | | | | | | |
Net realized loss | | | (1,890,317 | ) | | | (25,773,159 | ) |
| | | | | | | | |
Net change in unrealized gain (loss) of: | | | | | | | | |
Investments | | | (27,408 | ) | | | 9,945,309 | |
Options written | | | (308,329 | ) | | | — | |
Foreign currency translation | | | — | | | | 3,569 | |
| | | | | | | | |
Net change in unrealized gain (loss) | | | (335,737 | ) | | | 9,948,878 | |
| | | | | | | | |
Net realized and unrealized loss | | | (2,226,054 | ) | | | (15,824,281 | ) |
| | | | | | | | |
Net decrease in net assets resulting from operations | | $ | (1,631,821 | ) | | $ | (8,706,131 | ) |
| | | | | | | | |
| 1 | The International Secured Options Portfolio and International Portfolio had foreign dividend withholding taxes of $83,998 and $962,220, respectively. |
See Notes to Financial Statements.
THE GLENMEDE FUND, INC.
STATEMENTS OF CHANGES IN NET ASSETS
For the Year Ended October 31, 2016
| | | | | | | | | | | | |
| | | Core
Fixed
Income
Portfolio | | | Strategic
Equity
Portfolio | | | Small
Cap
Equity
Portfolio | |
Increase (decrease) in net assets | | | | | | | | | | | | |
Operations: | | | | | | | | | | | | |
Net investment income | | $ | 8,299,519 | | | $ | 1,688,561 | | | $ | 5,031,420 | |
Net realized gain on: | | | | | | | | | | | | |
Investment transactions | | | 4,002,597 | | | | 11,529,759 | | | | 45,618,145 | |
Net change in unrealized gain (loss) of: | | | | | | | | | | | | |
Investments | | | 1,587,602 | | | | (4,959,292 | ) | | | (46,930,013 | ) |
| | | | | | | | | | | | |
Net increase in net assets resulting from operations | | | 13,889,718 | | | | 8,259,028 | | | | 3,719,552 | |
Distributions to shareholders from: | | | | | | | | | | | | |
Net investment income: | | | | | | | | | | | | |
Net investment income | | | (9,014,871 | ) | | | (1,637,895 | ) | | | — | |
Advisor Class | | | — | | | | — | | | | (2,474,096 | ) |
Institutional Class | | | — | | | | — | | | | (3,200,553 | ) |
Net realized gain on investments: | | | | | | | | | | | | |
Net realized gain on investments | | | (2,439,232 | ) | | | (13,128,265 | ) | | | — | |
Advisor Class | | | — | | | | — | | | | (13,378,586 | ) |
Institutional Class | | | — | | | | — | | | | (8,784,493 | ) |
Net increase in net assets from capital share transactions (See note 5) | | | 51,349,802 | | | | 8,962,341 | | | | 293,017,683 | |
| | | | | | | | | | | | |
Net increase in net assets | | | 53,785,417 | | | | 2,455,209 | | | | 268,899,507 | |
| | | | | | | | | | | | |
| | | |
NET ASSETS: | | | | | | | | | | | | |
Beginning of year | | | 433,086,352 | | | | 174,408,748 | | | | 2,363,012,442 | |
| | | | | | | | | | | | |
End of year | | $ | 486,871,769 | | | $ | 176,863,957 | | | $ | 2,631,911,949 | |
| | | | | | | | | | | | |
Undistributed net investment income included in net assets at end of year | | $ | 771,361 | | | $ | 224,912 | | | $ | 401,702 | |
For the Year Ended October 31, 2015
| | | | | | | | | | | | |
| | | Core
Fixed
Income
Portfolio | | | Strategic
Equity
Portfolio | | | Small
Cap
Equity
Portfolio | |
Increase (decrease) in net assets | | | | | | | | | | | | |
Operations: | | | | | | | | | | | | |
Net investment income | | $ | 8,961,067 | | | $ | 1,845,569 | | | $ | 2,791,245 | |
Net realized gain on: | | | | | | | | | | | | |
Investment transactions | | | 4,825,719 | | | | 13,133,258 | | | | 18,859,276 | |
Net change in unrealized gain (loss) of: | | | | | | | | | | | | |
Investments | | | (4,577,284 | ) | | | (7,098,768 | ) | | | 23,549,472 | |
| | | | | | | | | | | | |
Net increase in net assets resulting from operations | | | 9,209,502 | | | | 7,880,059 | | | | 45,199,993 | |
Distributions to shareholders from: | | | | | | | | | | | | |
Net investment income: | | | | | | | | | | | | |
Net investment income | | | (9,615,897 | ) | | | (1,864,778 | ) | | | — | |
Advisor Class | | | — | | | | — | | | | (828,513 | ) |
Institutional Class | | | — | | | | — | | | | (679,541 | ) |
Net realized gain on investments: | | | | | | | | | | | | |
Net realized gain on investments | | | — | | | | (21,336,630 | ) | | | — | |
Advisor Class | | | — | | | | — | | | | (44,608,930 | ) |
Institutional Class | | | — | | | | — | | | | (21,724,086 | ) |
Net increase in net assets from capital share transactions (See note 5) | | | 6,964,988 | | | | 5,362,552 | | | | 714,527,544 | |
| | | | | | | | | | | | |
Net increase (decrease) in net assets | | | 6,558,593 | | | | (9,958,797 | ) | | | 691,886,467 | |
| | | | | | | | | | | | |
| | | |
NET ASSETS: | | | | | | | | | | | | |
Beginning of year | | | 426,527,759 | | | | 184,367,545 | | | | 1,671,125,975 | |
| | | | | | | | | | | | |
End of year | | $ | 433,086,352 | | | $ | 174,408,748 | | | $ | 2,363,012,442 | |
| | | | | | | | | | | | |
Undistributed net investment income included in net assets at end of year | | $ | 742,264 | | | $ | 198,345 | | | $ | 537,455 | |
See Notes to Financial Statements.
THE GLENMEDE FUND, INC.
STATEMENTS OF CHANGES IN NET ASSETS — (Continued)
For the Year Ended October 31, 2016
| | | | | | | | | | | | |
| | | Mid
Cap
Equity
Portfolio | | | Large
Cap
Value
Portfolio | | | U.S.
Emerging
Growth
Portfolio | |
Increase (decrease) in net assets | | | | | | | | | | | | |
Operations: | | | | | | | | | | | | |
Net investment income | | $ | 159,885 | | | $ | 1,306,627 | | | $ | 155,750 | |
Net realized loss on: | | | | | | | | | | | | |
Investment transactions | | | (2,499,920 | ) | | | 5,238,363 | | | | (318,278 | ) |
Net change in unrealized gain (loss) of: | | | | | | | | | | | | |
Investments | | | 756,464 | | | | (3,024,298 | ) | | | 920,544 | |
| | | | | | | | | | | | |
Net increase (decrease) in net assets resulting from operations | | | (1,583,571 | ) | | | 3,520,692 | | | | 758,016 | |
Distributions to shareholders from: | | | | | | | | | | | | |
Net investment income: | | | | | | | | | | | | |
Net investment income | | | — | | | | (1,197,701 | ) | | | (156,347 | ) |
Advisor Class | | | (174,492 | ) | | | — | | | | — | |
Net realized gain on investments: | | | | | | | | | | | | |
Net realized gain on investments | | | — | | | | (8,668,626 | ) | | | (312,897 | ) |
Advisor Class | | | (229,576 | ) | | | — | | | | — | |
Net increase (decrease) in net assets from capital share transactions (See note 5) | | | (9,943,336 | ) | | | (4,564,658 | ) | | | 7,939,249 | |
| | | | | | | | | | | | |
Net increase (decrease) in net assets | | | (11,930,975 | ) | | | (10,910,293 | ) | | | 8,228,021 | |
| | | | | | | | | | | | |
| | | |
NET ASSETS: | | | | | | | | | | | | |
Beginning of year | | | 29,979,519 | | | | 83,064,608 | | | | 45,267,060 | |
| | | | | | | | | | | | |
End of year | | $ | 18,048,544 | | | $ | 72,154,315 | | | $ | 53,495,081 | |
| | | | | | | | | | | | |
Undistributed net investment income included in net assets at end of year | | $ | 11,382 | | | $ | 197,031 | | | $ | 11,278 | |
For the Year Ended October 31, 2015
| | | | | | | | | | | | |
| | | Mid
Cap
Equity
Portfolio | | | Large
Cap
Value
Portfolio | | | U.S.
Emerging
Growth
Portfolio | |
Increase (decrease) in net assets | | | | | | | | | | | | |
Operations: | | | | | | | | | | | | |
Net investment income | | $ | 93,626 | | | $ | 935,267 | | | $ | 123,867 | |
Net realized gain on: | | | | | | | | | | | | |
Investment transactions | | | 110,976 | | | | 8,611,817 | | | | 228,228 | |
Net change in unrealized gain (loss) of: | | | | | | | | | | | | |
Investments | | | (341,355 | ) | | | (7,977,740 | ) | | | 334,410 | |
| | | | | | | | | | | | |
Net increase (decrease) in net assets resulting from operations | | | (136,753 | ) | | | 1,569,344 | | | | 686,505 | |
Distributions to shareholders from: | | | | | | | | | | | | |
Net investment income: | | | | | | | | | | | | |
Net investment income | | | — | | | | (815,155 | ) | | | (79,896 | ) |
Advisor Class | | | (61,611 | ) | | | — | | | | — | |
Net realized gain on investments | | | — | | | | (13,144,370 | ) | | | (3,631,479 | ) |
Net increase (decrease) in net assets from capital share transactions (See note 5) | | | 20,912,955 | | | | (3,187,062 | ) | | | 9,806,458 | |
| | | | | | | | | | | | |
Net increase (decrease) in net assets | | | 20,714,591 | | | | (15,577,243 | ) | | | 6,781,588 | |
| | | | | | | | | | | | |
| | | |
NET ASSETS: | | | | | | | | | | | | |
Beginning of year | | | 9,264,928 | | | | 98,641,851 | | | | 38,485,472 | |
| | | | | | | | | | | | |
End of year | | $ | 29,979,519 | | | $ | 83,064,608 | | | $ | 45,267,060 | |
| | | | | | | | | | | | |
Undistributed net investment income included in net assets at end of year | | $ | 32,417 | | | $ | 93,014 | | | $ | 16,178 | |
See Notes to Financial Statements.
THE GLENMEDE FUND, INC.
STATEMENTS OF CHANGES IN NET ASSETS — (Continued)
For the Year Ended October 31, 2016
| | | | | | | | | | | | |
| | | Large
Cap
Core
Portfolio | | | Large
Cap
Growth
Portfolio | | | Long/Short
Portfolio | |
Increase (decrease) in net assets | | | | | | | | | | | | |
Operations: | | | | | | | | | | | | |
Net investment income (loss) | | $ | 23,917,826 | | | $ | 15,249,255 | | | $ | (940,387 | ) |
Net realized loss on: | | | | | | | | | | | | |
Investment transactions | | | (1,338,440 | ) | | | (4,531,961 | ) | | | (1,826,086 | ) |
Securities sold short | | | — | | | | — | | | | (1,494,968 | ) |
Net change in unrealized gain (loss) of: | | | | | | | | | | | | |
Investments | | | 68,724,402 | | | | 31,738 | | | | 10,007,001 | |
Securities sold short | | | — | | | | — | | | | (4,273,799 | ) |
| | | | | | | | | | | | |
Net increase in net assets resulting from operations | | | 91,303,788 | | | | 10,749,032 | | | | 1,471,761 | |
Distributions to shareholders from: | | | | | | | | | | | | |
Net investment income: | | | | | | | | | | | | |
Advisor Class | | | (20,214,714 | ) | | | (14,728,311 | ) | | | — | |
Institutional Class | | | (2,902,174 | ) | | | (108,903 | ) | | | — | |
Net realized gain on investments: | | | | | | | | | | | | |
Advisor Class | | | (17,780,806 | ) | | | — | | | | — | |
Net increase in net assets from capital share transactions (See note 5) | | | 273,099,412 | | | | 1,068,373,832 | | | | 44,461,487 | |
| | | | | | | | | | | | |
Net increase in net assets | | | 323,505,506 | | | | 1,064,285,650 | | | | 45,933,248 | |
| | | | | | | | | | | | |
| | | |
NET ASSETS: | | | | | | | | | | | | |
Beginning of year | | | 1,643,278,204 | | | | 1,959,170,716 | | | | 193,480,205 | |
| | | | | | | | | | | | |
End of year | | $ | 1,966,783,710 | | | $ | 3,023,456,366 | | | $ | 239,413,453 | |
| | | | | | | | | | | | |
Undistributed (distributions in excess of) net investment income included in net assets at end of year | | $ | 1,568,955 | | | $ | 917,908 | | | $ | (795,240 | ) |
For the Year Ended October 31, 2015
| | | | | | | | | | | | |
| | | Large
Cap
Core
Portfolio | | | Large
Cap
Growth
Portfolio | | | Long/Short
Portfolio | |
Increase (decrease) in net assets | | | | | | | | | | | | |
Operations: | | | | | | | | | | | | |
Net investment income (loss) | | $ | 11,739,691 | | | $ | 8,570,847 | | | $ | (1,097,577 | ) |
Net realized gain (loss) on: | | | | | | | | | | | | |
Investment transactions | | | 17,542,419 | | | | (17,124,435 | ) | | | 2,976,822 | |
Securities sold short | | | — | | | | — | | | | (7,339,903 | ) |
Net change in unrealized gain of: | | | | | | | | | | | | |
Investments | | | 25,398,817 | | | | 118,880,584 | | | | 269,140 | |
Securities sold short | | | — | | | | — | | | | 11,284,039 | |
| | | | | | | | | | | | |
Net increase in net assets resulting from operations | | | 54,680,927 | | | | 110,326,996 | | | | 6,092,521 | |
Distributions to shareholders from: | | | | | | | | | | | | |
Net investment income: | | | | | | | | | | | | |
Advisor Class | | | (11,254,628 | ) | | | (8,095,027 | ) | | | — | |
Net realized gain on investments: | | | | | | | | | | | | |
Advisor Class | | | (23,130,256 | ) | | | (19,355,767 | ) | | | — | |
Net increase in net assets from capital share transactions (See note 5) | | | 898,893,382 | | | | 1,245,932,169 | | | | 77,422,720 | |
| | | | | | | | | | | | |
Net increase in net assets | | | 919,189,425 | | | | 1,328,808,371 | | | | 83,515,241 | |
| | | | | | | | | | | | |
| | | |
NET ASSETS: | | | | | | | | | | | | |
Beginning of year | | | 724,088,779 | | | | 630,362,345 | | | | 109,964,964 | |
| | | | | | | | | | | | |
End of year | | $ | 1,643,278,204 | | | $ | 1,959,170,716 | | | $ | 193,480,205 | |
| | | | | | | | | | | | |
Undistributed (distributions in excess of) net investment income included in net assets at end of year | | $ | 874,757 | | | $ | 701,315 | | | $ | (1,134,949 | ) |
See Notes to Financial Statements.
THE GLENMEDE FUND, INC.
STATEMENTS OF CHANGES IN NET ASSETS — (Continued)
For the Year Ended October 31, 2016
| | | | | | | | | | | | |
| | | Total
Market
Portfolio | | | High
Yield
Municipal
Portfolio1 | | | Responsible
ESG U.S.
Equity
Portfolio1 | |
Increase (decrease) in net assets | | | | | | | | | | | | |
Operations: | | | | | | | | | | | | |
Net investment income | | $ | 396,323 | | | $ | 2,077,371 | | | $ | 25,589 | |
Net realized gain (loss) on: | | | | | | | | | | | | |
Investment transactions | | | (751,552 | ) | | | 597,983 | | | | (37,331 | ) |
Securities sold short | | | 621,987 | | | | — | | | | — | |
Net change in unrealized gain (loss) of: | | | | | | | | | | | | |
Investments | | | (262,089 | ) | | | 1,293,617 | | | | 388,325 | |
Securities sold short | | | (694,316 | ) | | | — | | | | — | |
| | | | | | | | | | | | |
Net increase (decrease) in net assets resulting from operations | | | (689,647 | ) | | | 3,968,971 | | | | 376,583 | |
Distributions to shareholders from: | | | | | | | | | | | | |
Net investment income | | | (408,601 | ) | | | (1,770,974 | ) | | | (20,176 | ) |
Net increase (decrease) in net assets from capital share transactions (See note 5) | | | (26,552,825 | ) | | | 151,692,303 | | | | 6,204,154 | |
| | | | | | | | | | | | |
Net increase (decrease) in net assets | | | (27,651,073 | ) | | | 153,890,300 | | | | 6,560,561 | |
| | | | | | | | | | | | |
| | | |
NET ASSETS: | | | | | | | | | | | | |
Beginning of year | | | 88,733,667 | | | | — | | | | — | |
| | | | | | | | | | | | |
End of year | | $ | 61,082,594 | | | $ | 153,890,300 | | | $ | 6,560,561 | |
| | | | | | | | | | | | |
Undistributed net investment income included in net assets at end of year | | $ | 18,311 | | | $ | 307,166 | | | $ | 4,238 | |
| 1 | Portfolio commenced operations on December 22, 2015. |
For the Year Ended October 31, 2015
| | | | | | | | | | | | |
| | | Total
Market
Portfolio | | | | | | | |
Increase (decrease) in net assets | | | | | | | | | | | | |
Operations: | | | | | | | | | | | | |
Net investment income | | $ | 483,279 | | | | | | | | | |
Net realized gain (loss) on: | | | | | | | | | | | | |
Investment transactions | | | 339,303 | | | | | | | | | |
Securities sold short | | | (1,160,146 | ) | | | | | | | | |
Net change in unrealized gain (loss) of: | | | | | | | | | | | | |
Investments | | | (1,472,287 | ) | | | | | | | | |
Securities sold short | | | 2,596,911 | | | | | | | | | |
| | | | | | | | | | | | |
Net increase in net assets resulting from operations | | | 787,060 | | | | | | | | | |
Distributions to shareholders from: | | | | | | | | | | | | |
Net investment income | | | (489,998 | ) | | | | | | | | |
Net realized gain on investments | | | (3,732,092 | ) | | | | | | | | |
Net increase in net assets from capital share transactions (See note 5) | | | 30,701,966 | | | | | | | | | |
| | | | | | | | | | | | |
Net increase in net assets | | | 27,266,936 | | | | | | | | | |
| | | | | | | | | | | | |
| | | |
NET ASSETS: | | | | | | | | | | | | |
Beginning of year | | | 61,466,731 | | | | | | | | | |
| | | | | | | | | | | | |
End of year | | $ | 88,733,667 | | | | | | | | | |
| | | | | | | | | | | | |
Undistributed net investment income included in net assets at end of year | | $ | 43,503 | | | | | | | | | |
See Notes to Financial Statements.
THE GLENMEDE FUND, INC.
STATEMENTS OF CHANGES IN NET ASSETS — (Continued)
For the Year Ended October 31, 2016
| | | | | | | | | | | | |
| | | Women in
Leadership
U.S. Equity
Portfolio1 | | | Short Term
Tax Aware
Fixed Income
Portfolio2 | | | Secured
Options
Portfolio | |
Increase (decrease) in net assets | | | | | | | | | | | | |
Operations: | | | | | | | | | | | | |
Net investment income (loss) | | $ | 40,428 | | | $ | 34,407 | | | $ | (3,472,743 | ) |
Net realized gain (loss) on: | | | | | | | | | | | | |
Investment transactions | | | (9,578 | ) | | | (130 | ) | | | 264,711 | |
Options written | | | — | | | | — | | | | 36,051,561 | |
Net change in unrealized gain (loss) of: | | | | | | | | | | | | |
Investments | | | 236,268 | | | | (88,806 | ) | | | 244,394 | |
Options Written | | | — | | | | — | | | | (4,695,056 | ) |
| | | | | | | | | | | | |
Net increase in net assets resulting from operations | | | 267,118 | | | | (54,529 | ) | | | 28,392,867 | |
Distributions to shareholders from: | | | | | | | | | | | | |
Net investment income: | | | | | | | | | | | | |
Net investment income | | | (32,425 | ) | | | (22,071 | ) | | | — | |
Advisor Class | | | — | | | | — | | | | (76 | ) |
Net realized gain on investments: | | | | | | | | | | | | |
Advisor Class | | | — | | | | — | | | | (22,625,122 | ) |
Net increase in net assets from capital share transactions (See note 5) | | | 6,281,965 | | | | 30,153,046 | | | | 173,269,283 | |
| | | | | | | | | | | | |
Net increase in net assets | | | 6,516,658 | | | | 30,076,446 | | | | 179,036,952 | |
| | | | | | | | | | | | |
| | | |
NET ASSETS: | | | | | | | | | | | | |
Beginning of year | | | — | | | | — | | | | 395,162,887 | |
| | | | | | | | | | | | |
End of year | | $ | 6,516,658 | | | $ | 30,076,446 | | | $ | 574,199,839 | |
| | | | | | | | | | | | |
Undistributed (distributions in excess of) net investment income included in net assets at end of year | | $ | 8,760 | | | $ | 12,343 | | | $ | (23,727 | ) |
| 1 | Portfolio commenced operations on December 22, 2015. |
| 2 | The Short Term Tax Aware Fixed Income Portfolio commenced operations on June 29, 2016. |
For the Year Ended October 31, 2015
| | | | | | | | | | | | |
| | | | | | | | | Secured
Options
Portfolio | |
Increase (decrease) in net assets | | | | | | | | | | | | |
Operations: | | | | | | | | | | | | |
Net investment loss | | | | | | | | | | $ | (2,821,215 | ) |
Net realized gain on: | | | | | | | | | | | | |
Investment transactions | | | | | | | | | | | 61 | |
Options written | | | | | | | | | | | 32,023,291 | |
Net change in unrealized gain of: | | | | | | | | | | | | |
Investments | | | | | | | | | | | 315,054 | |
Options Written | | | | | | | | | | | (6,574,877 | ) |
| | | | | | | | | | | | |
Net increase in net assets resulting from operations | | | | | | | | | | | 22,942,314 | |
Distributions to shareholders from: | | | | | | | | | | | | |
Net realized gain on investments | | | | | | | | | | | (18,838,627 | ) |
Net increase in net assets from capital share transactions (See note 5) | | | | | | | | | | | 25,383,991 | |
| | | | | | | | | | | | |
Net increase in net assets | | | | | | | | | | | 29,487,678 | |
| | | | | | | | | | | | |
| | | |
NET ASSETS: | | | | | | | | | | | | |
Beginning of year | | | | | | | | | | | 365,675,209 | |
| | | | | | | | | | | | |
End of year | | | | | | | | | | $ | 395,162,887 | |
| | | | | | | | | | | | |
Distributions in excess of net investment included in net assets at end of year | | | | | | | | | | $ | (26,398 | ) |
See Notes to Financial Statements.
THE GLENMEDE FUND, INC.
STATEMENTS OF CHANGES IN NET ASSETS — (Continued)
For the Year Ended October 31, 2016
| | | | | | | | |
| | | International
Secured
Options
Portfolio | | | International
Portfolio | |
Increase (decrease) in net assets | | | | | | | | |
Operations: | | | | | | | | |
Net investment income | | $ | 594,233 | | | $ | 7,118,150 | |
Net realized loss on: | | | | | | | | |
Investment transactions | | | (3,203,812 | ) | | | (25,769,702 | ) |
Options written | | | 1,313,495 | | | | — | |
Foreign currency transactions | | | — | | | | (3,457 | ) |
Net change in unrealized gain (loss) of: | | | | | | | | |
Investments | | | (27,408 | ) | | | 9,945,309 | |
Options Written | | | (308,329 | ) | | | — | |
Foreign currency translation | | | — | | | | 3,569 | |
| | | | | | | | |
Net decrease in net assets resulting from operations | | | (1,631,821 | ) | | | (8,706,131 | ) |
Distributions to shareholders from: | | | | | | | | |
Net investment income | | | (711,091 | ) | | | (7,301,630 | ) |
Net increase (decrease) in net assets from capital share transactions (See note 5) | | | (57,316,577 | ) | | | 213,888,933 | |
| | | | | | | | |
Net increase (decrease) in net assets | | | (59,659,489 | ) | | | 197,881,172 | |
| | | | | | | | |
| | |
NET ASSETS: | | | | | | | | |
Beginning of year | | | 88,477,673 | | | | 243,403,100 | |
| | | | | | | | |
End of year | | $ | 28,818,184 | | | $ | 441,284,272 | |
| | | | | | | | |
Undistributed net investment income included in net assets at end of year | | $ | 23,622 | | | $ | 65,797 | |
For the Year Ended October 31, 2015
| | | | | | | | |
| | | International
Secured
Options
Portfolio | | | International
Portfolio | |
Increase (decrease) in net assets | | | | | | | | |
Operations: | | | | | | | | |
Net investment income | | $ | 1,736,274 | | | $ | 1,088,678 | |
Net realized loss on: | | | | | | | | |
Investment transactions | | | (4,168,525 | ) | | | (413,475 | ) |
Affiliated investment transactions | | | — | | | | (198,427 | ) |
Options written | | | (1,019,940 | ) | | | — | |
Securities sold short | | | (428,390 | ) | | | — | |
Foreign currency transactions | | | — | | | | (48,004 | ) |
Net change in unrealized gain (loss) of: | | | | | | | | |
Investments | | | 349,967 | | | | (1,102,931 | ) |
Investments in affiliates | | | — | | | | 114,573 | |
Options Written | | | 1,055,749 | | | | — | |
Foreign currency translation | | | — | | | | 4,862 | |
| | | | | | | | |
Net decrease in net assets resulting from operations | | | (2,474,865 | ) | | | (554,724 | ) |
Distributions to shareholders from: | | | | | | | | |
Net investment income | | | (1,869,953 | ) | | | (907,264 | ) |
Net realized gain on investments | | | (1,163,576 | ) | | | — | |
Net increase (decrease) in net assets from capital share transactions (See note 5) | | | (6,566,182 | ) | | | 207,345,256 | |
| | | | | | | | |
Net increase (decrease) in net assets | | | (12,074,576 | ) | | | 205,883,268 | |
| | | | | | | | |
| | |
NET ASSETS: | | | | | | | | |
Beginning of year | | | 100,552,249 | | | | 37,519,832 | |
| | | | | | | | |
End of year | | $ | 88,477,673 | | | $ | 243,403,100 | |
| | | | | | | | |
Undistributed net investment income included in net assets at end of year | | $ | 132,185 | | | $ | 252,734 | |
See Notes to Financial Statements.
THE GLENMEDE FUND, INC.
STATEMENT OF CASH FLOWS
For the Year Ended October 31, 2016
| | | | |
| | | Long/Short
Portfolio | |
Cash Flows from operating activities | | | | |
Net increase in net assets resulting from operations | | $ | 1,471,761 | |
Investments purchased | | | (160,541,780 | ) |
Investments sold | | | 121,743,733 | |
Purchases to cover securities sold short | | | (218,189,117 | ) |
Securities sold short | | | 246,769,774 | |
(Purchase)/Sale of short term investments, net | | | 20,134,952 | |
Decrease in Interest receivable | | | 2 | |
Decrease in Cash collateral on deposit at broker | | | (34,029,561 | ) |
Increase in Securities lending receivable | | | 3,399 | |
(Increase) in Dividends receivable | | | (123,984 | ) |
Decrease in Prepaid expenses | | | 1,711 | |
(Decrease) in Obligation to return securities lending collateral | | | (19,315,366 | ) |
Increase in Dividends payable for securities sold short | | | 18,147 | |
Increase in Investment Advisory fees | | | 34,983 | |
Increase in Directors fees | | | 867 | |
Increase in Payable to Affiliate | | | 8,231 | |
Increase in Accrued expenses | | | 34,213 | |
Net change in unrealized gain (loss) on investments | | | (10,007,001 | ) |
Net realized loss from investments | | | 1,826,086 | |
Net change in unrealized gain (loss) on securities sold short | | | 4,273,799 | |
Net realized loss from securities sold short | | | 1,494,968 | |
| | | | |
Net cash provided by (used in) operating activities | | | (44,390,183 | ) |
| | | | |
| |
Cash flows from financing activities | | | | |
Proceeds from shares sold | | | 86,307,703 | |
Payments on shares redeemed | | | (41,931,993 | ) |
| | | | |
Net cash provided by (used in) financing activities | | | 44,375,710 | |
| | | | |
| |
Net increase (decrease) in cash | | | (14,473 | ) |
Cash at beginning of period | | | 14,473 | |
| | | | |
Cash at end of period | | $ | — | |
| | | | |
See Notes to Financial Statements.
THE GLENMEDE FUND, INC.
STATEMENT OF CASH FLOWS — (Continued)
For the Year Ended October 31, 2016
| | | | |
| | | Total
Market
Portfolio | |
Cash Flows from operating activities | | | | |
Net Decrease in net assets resulting from operations | | $ | (689,647 | ) |
Investments purchased | | | (57,034,986 | ) |
Investments sold | | | 89,898,743 | |
Purchases to cover securities sold short | | | (47,774,607 | ) |
Securities sold short | | | 41,172,690 | |
(Purchase)/Sale of short term investments, net | | | 281,110 | |
Decrease in Receivable from Investment Advisor | | | 3,579 | |
Increase in Cash collateral on deposit at broker | | | 26,800,311 | |
Increase in Securities lending receivable | | | 1,606 | |
Decrease in Dividends receivable | | | 25,406 | |
Decrease in Prepaid expenses | | | 1,154 | |
(Decrease) in Obligation to return securities lending collateral | | | (26,800,311 | ) |
(Decrease) in Dividends payable for securities sold short | | | (13,867 | ) |
(Decrease) in Investment Advisory fees | | | (22,343 | ) |
(Decrease) in Directors fees | | | (180 | ) |
(Decrease) in Payable to Affiliate | | | (5,256 | ) |
(Decrease) in Accrued expenses | | | (7,682 | ) |
Net change in unrealized gain (loss) on investments | | | 262,089 | |
Net realized gain from investments | | | 751,552 | |
Net change in unrealized gain (loss) on securities sold short | | | 694,316 | |
Net realized loss from securities sold short | | | (621,987 | ) |
| | | | |
Net cash provided by (used in) operating activities | | | 26,921,690 | |
| | | | |
| |
Cash flows from financing activities | | | | |
Proceeds from shares sold | | | 11,773,985 | |
Payments on shares redeemed | | | (38,490,321 | ) |
Cash distributions paid | | | (217,198 | ) |
| | | | |
Net cash provided by (used in) financing activities | | | (26,933,534 | ) |
| | | | |
| |
Net increase (decrease) in cash | | | (11,844 | ) |
Cash at beginning of period | | | 11,844 | |
| | | | |
Cash at end of period | | $ | — | |
| | | | |
Non-cash financing activities not included herein consist of a reinvestment of dividends of $191,403
See Notes to Financial Statements.
THE GLENMEDE FUND, INC.
FINANCIAL HIGHLIGHTS
For a share outstanding throughout each year
| | | | | | | | | | | | | | | | | | | | |
| | | Core Fixed Income Portfolio | |
| | | For the Years Ended October 31, | |
| | | 2016 | | | 2015 | | | 2014 | | | 2013 | | | 2012 | |
| | | | | |
Net asset value, beginning of year | | $ | 11.20 | | | $ | 11.21 | | | $ | 11.22 | | | $ | 11.75 | | | $ | 11.67 | |
| | | | | | | | | | | | | | | | | | | | |
Income from investment operations: | | | | | | | | | | | | | | | | | | | | |
Net investment income | | | 0.21 | | | | 0.23 | | | | 0.25 | | | | 0.26 | | | | 0.30 | |
Net realized and unrealized gain (loss) on investments | | | 0.14 | | | | 0.01 | | | | 0.02 | | | | (0.45 | ) | | | 0.32 | |
| | | | | | | | | | | | | | | | | | | | |
| | | | | |
Total from investment operations | | | 0.35 | | | | 0.24 | | | | 0.27 | | | | (0.19 | ) | | | 0.62 | |
| | | | | | | | | | | | | | | | | | | | |
Distributions to shareholders from: | | | | | | | | | | | | | | | | | | | | |
Net investment income | | | (0.23 | ) | | | (0.25 | ) | | | (0.26 | ) | | | (0.31 | ) | | | (0.34 | ) |
Net realized capital gains | | | (0.06 | ) | | | — | | | | (0.02 | ) | | | (0.03 | ) | | | (0.20 | ) |
| | | | | | | | | | | | | | | | | | | | |
| | | | | |
Total distributions | | | (0.29 | ) | | | (0.25 | ) | | | (0.28 | ) | | | (0.34 | ) | | | (0.54 | ) |
| | | | | | | | | | | | | | | | | | | | |
| | | | | |
Net asset value, end of year | | $ | 11.26 | | | $ | 11.20 | | | $ | 11.21 | | | $ | 11.22 | | | $ | 11.75 | |
| | | | | | | | | | | | | | | | | | | | |
| | | | | |
Total return | | | 3.15 | % | | | 2.20 | % | | | 2.52 | % | | | (1.64 | )% | | | 5.51 | % |
| | | | | | | | | | | | | | | | | | | | |
Ratios to average net assets/ Supplemental data: | | | | | | | | | | | | | | | | | | | | |
Net assets, end of year (in 000s) | | $ | 486,872 | | | $ | 433,086 | | | $ | 426,528 | | | $ | 398,930 | | | $ | 480,499 | |
Ratio of operating expenses to average net assets | | | 0.54 | % | | | 0.53 | % | | | 0.56 | % | | | 0.56 | % | | | 0.57 | % |
Ratio of net investment income to average net assets | | | 1.84 | % | | | 2.11 | % | | | 2.23 | % | | | 2.29 | % | | | 2.61 | % |
Portfolio turnover rate | | | 24 | % | | | 27 | % | | | 18 | % | | | 19 | % | | | 22 | % |
| | | | | | | | | | | | | | | | | | | | |
| | | Strategic Equity Portfolio | |
| | | For the Years Ended October 31, | |
| | | 2016 | | | 2015 | | | 2014 | | | 2013 | | | 2012 | |
| | | | | |
Net asset value, beginning of year | | $ | 21.80 | | | $ | 23.89 | | | $ | 23.14 | | | $ | 19.20 | | | $ | 17.19 | |
| | | | | | | | | | | | | | | | | | | | |
Income from investment operations: | | | | | | | | | | | | | | | | | | | | |
Net investment income | | | 0.21 | | | | 0.23 | | | | 0.23 | | | | 0.25 | | | | 0.18 | |
Net realized and unrealized gain on investments | | | 0.81 | | | | 0.76 | | | | 3.20 | | | | 4.10 | | | | 2.00 | |
| | | | | | | | | | | | | | | | | | | | |
| | | | | |
Total from investment operations | | | 1.02 | | | | 0.99 | | | | 3.43 | | | | 4.35 | | | | 2.18 | |
| | | | | | | | | | | | | | | | | | | | |
Distributions to shareholders from: | | | | | | | | | | | | | | | | | | | | |
Net investment income | | | (0.20 | ) | | | (0.24 | ) | | | (0.24 | ) | | | (0.23 | ) | | | (0.17 | ) |
Net realized capital gains | | | (1.68 | ) | | | (2.84 | ) | | | (2.44 | ) | | | (0.18 | ) | | | — | |
| | | | | | | | | | | | | | | | | | | | |
| | | | | |
Total distributions | | | (1.88 | ) | | | (3.08 | ) | | | (2.68 | ) | | | (0.41 | ) | | | (0.17 | ) |
| | | | | | | | | | | | | | | | | | | | |
| | | | | |
Net asset value, end of year | | $ | 20.94 | | | $ | 21.80 | | | $ | 23.89 | | | $ | 23.14 | | | $ | 19.20 | |
| | | | | | | | | | | | | | | | | | | | |
| | | | | |
Total return | | | 5.22 | % | | | 4.49 | % | | | 16.48 | % | | | 23.08 | % | | | 12.68 | % |
| | | | | | | | | | | | | | | | | | | | |
Ratios to average net assets/ Supplemental data: | | | | | | | | | | | | | | | | | | | | |
Net assets, end of year (in 000s) | | $ | 176,864 | | | $ | 174,409 | | | $ | 184,368 | | | $ | 179,684 | | | $ | 170,580 | |
Ratio of operating expenses to average net assets | | | 0.84 | % | | | 0.84 | % | | | 0.86 | % | | | 0.86 | % | | | 0.87 | % |
Ratio of net investment income to average net assets | | | 1.00 | % | | | 1.03 | % | | | 1.04 | % | | | 1.21 | % | | | 0.99 | % |
Portfolio turnover rate | | | 22 | % | | | 23 | % | | | 22 | % | | | 46 | % | | | 37 | % |
See Notes to Financial Statements.
THE GLENMEDE FUND, INC.
FINANCIAL HIGHLIGHTS — (Continued)
For a share outstanding throughout each year
| | | | | | | | | | | | | | | | | | | | |
| | | Small Cap Equity Portfolio Advisor Shares | |
| | | For the Years Ended October 31, | |
| | | 2016 | | | 2015 | | | 20141 | | | 20131 | | | 2012 | |
| | | | | |
Net asset value, beginning of year | | $ | 26.02 | | | $ | 26.30 | | | $ | 26.12 | | | $ | 18.24 | | | $ | 16.64 | |
| | | | | | | | | | | | | | | | | | | | |
Income from investment operations: | | | | | | | | | | | | | | | | | | | | |
Net investment income (loss) | | | 0.03 | | | | 0.02 | | | | (0.02 | ) | | | 0.14 | | | | 0.08 | |
Net realized and unrealized gain (loss) on investments | | | (0.15 | ) | | | 0.74 | | | | 1.49 | | | | 8.05 | | | | 1.60 | |
| | | | | | | | | | | | | | | | | | | | |
| | | | | |
Total from investment operations | | | (0.12 | ) | | | 0.76 | | | | 1.47 | | | | 8.19 | | | | 1.68 | |
| | | | | | | | | | | | | | | | | | | | |
Distributions to shareholders from: | | | | | | | | | | | | | | | | | | | | |
Net investment income | | | (0.05 | ) | | | (0.02 | ) | | | (0.10 | ) | | | (0.12 | ) | | | (0.08 | ) |
Net realized capital gains | | | (0.24 | ) | | | (1.02 | ) | | | (1.19 | ) | | | (0.19 | ) | | | — | |
| | | | | | | | | | | | | | | | | | | | |
| | | | | |
Total distributions | | | (0.29 | ) | | | (1.04 | ) | | | (1.29 | ) | | | (0.31 | ) | | | (0.08 | ) |
| | | | | | | | | | | | | | | | | | | | |
| | | | | |
Net asset value, end of year | | $ | 25.61 | | | $ | 26.02 | | | $ | 26.30 | | | $ | 26.12 | | | $ | 18.24 | |
| | | | | | | | | | | | | | | | | | | | |
| | | | | |
Total return | | | (0.43 | )% | | | 3.03 | % | | | 5.86 | % | | | 45.63 | % | | | 10.10 | %2 |
| | | | | | | | | | | | | | | | | | | | |
Ratios to average net assets/ Supplemental data: | | | | | | | | | | | | | | | | | | | | |
Net assets, end of year (in 000s) | | $ | 1,367,160 | | | $ | 1,399,042 | | | $ | 1,139,273 | | | $ | 639,021 | | | $ | 363,561 | |
Ratio of operating expenses to average net assets | | | 0.91 | % | | | 0.91 | % | | | 0.94 | % | | | 0.91 | % | | | 0.93 | % |
Ratio of net investment income (loss) (expenses in excess of income) to average net assets | | | 0.12 | % | | | 0.07 | % | | | (0.07 | )% | | | 0.63 | % | | | 0.47 | % |
Portfolio turnover rate3 | | | 58 | % | | | 53 | % | | | 45 | % | | | 55 | % | | | 49 | % |
| 1 | Per share net investment income (loss) has been calculated using the average shares outstanding during the period. |
| 2 | Includes adjustments in accordance with accounting principles generally accepted in the United States of America and as such, the net asset value for financial reporting purposes and the returns based upon those net asset values may differ from the net asset value and returns for shareholder transactions as shown in the management discussion and analysis and as otherwise reported to shareholders. |
| 3 | Portfolio turnover is calculated at the fund level. |
| | | | | | | | | | | | | | | | | | | | |
| | | Small Cap Equity Portfolio Institutional Shares | |
| | | For the Years Ended October 31, | |
| | | 2016 | | | 2015 | | | 20141 | | | 20131 | | | 20121 | |
| | | | | |
Net asset value, beginning of year | | $ | 27.07 | | | $ | 27.28 | | | $ | 27.00 | | | $ | 18.86 | | | $ | 17.16 | |
| | | | | | | | | | | | | | | | | | | | |
Income from investment operations: | | | | | | | | | | | | | | | | | | | | |
Net investment income | | | 0.08 | | | | 0.08 | | | | 0.01 | | | | 0.11 | | | | 0.13 | |
Net realized and unrealized gain (loss) on investments | | | (0.16 | ) | | | 0.76 | | | | 1.57 | | | | 8.39 | | | | 1.65 | |
| | | | | | | | | | | | | | | | | | | | |
| | | | | |
Total from investment operations | | | (0.08 | ) | | | 0.84 | | | | 1.58 | | | | 8.50 | | | | 1.78 | |
| | | | | | | | | | | | | | | | | | | | |
Distributions to shareholders from: | | | | | | | | | | | | | | | | | | | | |
Net investment income | | | (0.08 | ) | | | (0.03 | ) | | | (0.11 | ) | | | (0.17 | ) | | | (0.08 | ) |
Net realized capital gains | | | (0.24 | ) | | | (1.02 | ) | | | (1.19 | ) | | | (0.19 | ) | | | — | |
| | | | | | | | | | | | | | | | | | | | |
| | | | | |
Total distributions | | | (0.32 | ) | | | (1.05 | ) | | | (1.30 | ) | | | (0.36 | ) | | | (0.08 | ) |
| | | | | | | | | | | | | | | | | | | | |
| | | | | |
Net asset value, end of year | | $ | 26.67 | | | $ | 27.07 | | | $ | 27.28 | | | $ | 27.00 | | | $ | 18.86 | |
| | | | | | | | | | | | | | | | | | | | |
| | | | | |
Total return | | | (0.25 | )% | | | 3.24 | % | | | 6.10 | % | | | 45.82 | % | | | 10.38 | % |
| | | | | | | | | | | | | | | | | | | | |
Ratios to average net assets/ Supplemental data: | | | | | | | | | | | | | | | | | | | | |
Net assets, end of year (in 000s) | | $ | 1,264,752 | | | $ | 963,970 | | | $ | 531,853 | | | $ | 154,993 | | | $ | 14,305 | |
Ratio of operating expenses to average net assets | | | 0.71 | % | | | 0.71 | % | | | 0.74 | % | | | 0.75 | % | | | 0.73 | % |
Ratio of net investment income to average net assets | | | 0.30 | % | | | 0.26 | % | | | 0.03 | % | | | 0.48 | % | | | 0.71 | % |
Portfolio turnover rate2 | | | 58 | % | | | 53 | % | | | 45 | % | | | 55 | % | | | 49 | % |
| 1 | Per share net investment income (loss) has been calculated using the average shares outstanding during the period. |
| 2 | Portfolio turnover is calculated at the fund level. |
See Notes to Financial Statements.
THE GLENMEDE FUND, INC.
FINANCIAL HIGHLIGHTS — (Continued)
For a share outstanding throughout each year
| | | | | | | | | | | | |
| | | Mid Cap Equity Portfolio Advisor Shares | |
| | | For the
Years
Ended October 31, | | | For the
Period
September 30,
20141
through
October 31,
20142 | |
| | | 2016 | | | 20152 | | |
| | | |
Net asset value, beginning of year | | $ | 10.57 | | | $ | 10.23 | | | $ | 10.00 | |
| | | | | | | | | | | | |
Income from investment operations: | | | | | | | | | | | | |
Net investment income (loss) | | | 0.08 | | | | 0.05 | | | | (0.01 | ) |
Net realized and unrealized gain (loss) on investments | | | (0.60 | ) | | | 0.32 | 3 | | | 0.24 | |
| | | | | | | | | | | | |
| | | |
Total from investment operations | | | (0.52 | ) | | | 0.37 | | | | 0.23 | |
| | | | | | | | | | | | |
Distributions to shareholders from: | | | | | | | | | | | | |
Net investment income | | | (0.07 | ) | | | (0.03 | ) | | | — | |
Net realized capital gains | | | (0.08 | ) | | | — | | | | — | |
| | | | | | | | | | | | |
| | | |
Total distributions | | | (0.15 | ) | | | (0.03 | ) | | | — | |
| | | | | | | | | | | | |
| | | |
Net asset value, end of year | | $ | 9.90 | | | $ | 10.57 | | | $ | 10.23 | |
| | | | | | | | | | | | |
| | | |
Total return5 | | | (4.94 | )% | | | 3.62 | % | | | 2.30 | %4 |
| | | | | | | | | | | | |
Ratios to average net assets/ Supplemental data: | | | | | | | | | | | | |
Net assets, end of period (in 000s) | | $ | 18,049 | | | $ | 29,980 | | | $ | 9,262 | |
Ratio of operating expenses before waiver to net assets | | | 1.15 | % | | | 1.44 | % | | | 1.58 | %6 |
Ratio of operating expenses after waiver/reimbursement to average net assets | | | 1.00 | % | | | 1.00 | % | | | 1.00 | %6 |
Ratio of net investment income (loss) (expenses in excess of income) to average net assets | | | 0.66 | % | | | 0.43 | % | | | (0.30 | )%6 |
Portfolio turnover rate | | | 84 | % | | | 54 | % | | | 3 | %7 |
| 1 | Commencement of operations. |
| 2 | Per share net investment income (loss) has been calculated using the average shares outstanding during the period. |
| 3 | The amount shown for a share outstanding does not correspond with the aggregate net realized and unrealized loss for the period due to the timing of purchases and redemptions of Portfolio shares in relation to the fluctuating net asset value per share of the Portfolio. |
| 4 | Total return calculation is not annualized. |
| 5 | The Total Return reflects fee waivers and/or expense reimbursements in effect and would have been lower in their absence. |
| 7 | Calculation represents portfolio turnover for the Portfolio for the period of September 30, 2014 through October 31, 2014. |
| | | | | | | | | | | | | | | | | | | | |
| | | Large Cap Value Portfolio | |
| | | For the Years Ended October 31, | |
| | | 2016 | | | 20151 | | | 2014 | | | 20131 | | | 2012 | |
| | | | | |
Net asset value, beginning of year | | $ | 11.15 | | | $ | 12.85 | | | $ | 12.96 | | | $ | 10.56 | | | $ | 9.46 | |
| | | | | | | | | | | | | | | | | | | | |
Income from investment operations: | | | | | | | | | | | | | | | | | | | | |
Net investment income | | | 0.19 | | | | 0.12 | | | | 0.03 | | | | 0.08 | | | | 0.13 | |
Net realized and unrealized gain on investments | | | 0.30 | | | | 0.06 | | | | 1.72 | | | | 2.92 | | | | 1.08 | |
| | | | | | | | | | | | | | | | | | | | |
| | | | | |
Total from investment operations | | | 0.49 | | | | 0.18 | | | | 1.75 | | | | 3.00 | | | | 1.21 | |
| | | | | | | | | | | | | | | | | | | | |
Distributions to shareholders from: | | | | | | | | | | | | | | | | | | | | |
Net investment income | | | (0.17 | ) | | | (0.11 | ) | | | (0.05 | ) | | | (0.10 | ) | | | (0.11 | ) |
Net realized capital gains | | | (1.25 | ) | | | (1.77 | ) | | | (1.81 | ) | | | (0.50 | ) | | | — | |
| | | | | | | | | | | | | | | | | | | | |
| | | | | |
Total distributions | | | (1.42 | ) | | | (1.88 | ) | | | (1.86 | ) | | | (0.60 | ) | | | (0.11 | ) |
| | | | | | | | | | | | | | | | | | | | |
| | | | | |
Net asset value, end of year | | $ | 10.22 | | | $ | 11.15 | | | $ | 12.85 | | | $ | 12.96 | | | $ | 10.56 | |
| | | | | | | | | | | | | | | | | | | | |
| | | | | |
Total return | | | 5.58 | % | | | 1.28 | % | | | 15.48 | % | | | 29.90 | % | | | 12.86 | % |
| | | | | | | | | | | | | | | | | | | | |
Ratios to average net assets/ Supplemental data: | | | | | | | | | | | | | | | | | | | | |
Net assets, end of year (in 000s) | | $ | 72,154 | | | $ | 83,065 | | | $ | 98,642 | | | $ | 95,748 | | | $ | 77,107 | |
Ratio of operating expenses to average net assets | | | 0.91 | % | | | 0.91 | % | | | 0.92 | % | | | 0.90 | % | | | 0.91 | % |
Ratio of net investment income to average net assets | | | 1.83 | % | | | 1.03 | % | | | 0.28 | % | | | 0.73 | % | | | 1.26 | % |
Portfolio turnover rate | | | 110 | % | | | 106 | % | | | 106 | % | | | 147 | % | | | 157 | % |
| 1 | Per share net investment income (loss) has been calculated using the average shares outstanding during the period. |
See Notes to Financial Statements.
THE GLENMEDE FUND, INC.
FINANCIAL HIGHLIGHTS — (Continued)
For a share outstanding throughout each year
| | | | | | | | | | | | | | | | | | | | |
| | | U.S. Emerging Growth Portfolio | |
| | | For the Years Ended October 31, | |
| | | 2016 | | | 20151 | | | 2014 | | | 2013 | | | 20121 | |
Net asset value, beginning of year | | $ | 9.55 | | | $ | 10.33 | | | $ | 9.77 | | | $ | 7.36 | | | $ | 6.78 | |
| | | | | | | | | | | | | | | | | | | | |
Income from investment operations: | | | | | | | | | | | | | | | | | | | | |
Net investment income | | | 0.04 | | | | 0.03 | | | | 0.00 | 2 | | | 0.07 | | | | 0.01 | |
Net realized and unrealized gain on investments | | | 0.03 | | | | 0.21 | | | | 0.65 | | | | 2.41 | | | | 0.58 | |
| | | | | | | | | | | | | | | | | | | | |
| | | | | |
Total from investment operations | | | 0.07 | | | | 0.24 | | | | 0.65 | | | | 2.48 | | | | 0.59 | |
| | | | | | | | | | | | | | | | | | | | |
Distributions to shareholders from: | | | | | | | | | | | | | | | | | | | | |
Net investment income | | | (0.03 | ) | | | (0.02 | ) | | | (0.01 | ) | | | (0.07 | ) | | | (0.01 | ) |
Net realized capital gains | | | (0.07 | ) | | | (1.00 | ) | | | (0.08 | ) | | | — | | | | — | |
| | | | | | | | | | | | | | | | | | | | |
| | | | | |
Total distributions | | | (0.10 | ) | | | (1.02 | ) | | | (0.09 | ) | | | (0.07 | ) | | | (0.01 | ) |
| | | | | | | | | | | | | | | | | | | | |
| | | | | |
Net asset value, end of year | | $ | 9.52 | | | $ | 9.55 | | | $ | 10.33 | | | $ | 9.77 | | | $ | 7.36 | |
| | | | | | | | | | | | | | | | | | | | |
| | | | | |
Total return | | | 0.72 | % | | | 2.58 | % | | | 6.69 | % | | | 33.94 | % | | | 8.77 | % |
| | | | | | | | | | | | | | | | | | | | |
Ratios to average net assets/ Supplemental data: | | | | | | | | | | | | | | | | | | | | |
Net assets, end of year (in 000s) | | $ | 53,495 | | | $ | 45,267 | | | $ | 38,485 | | | $ | 37,481 | | | $ | 27,385 | |
Ratio of operating expenses to average net assets | | | 0.94 | % | | | 0.94 | % | | | 0.96 | % | | | 0.96 | % | | | 1.00 | % |
Ratio of net investment income to average net assets | | | 0.31 | % | | | 0.30 | % | | | 0.01 | % | | | 0.84 | % | | | 0.17 | % |
Portfolio turnover rate | | | 100 | % | | | 135 | % | | | 127 | % | | | 134 | % | | | 120 | % |
| 1 | Per share net investment income (loss) has been calculated using the average shares outstanding during the period. |
| 2 | Amount rounds to less than $0.01 per share. |
| | | | | | | | | | | | | | | | | | | | |
| | | Large Cap Core Portfolio Advisor Shares | |
| | | For the Years Ended October 31, | |
| | | 20161 | | | 2015 | | | 2014 | | | 2013 | | | 2012 | |
Net asset value, beginning of year | | $ | 22.34 | | | $ | 21.76 | | | $ | 18.57 | | | $ | 14.10 | | | $ | 12.62 | |
| | | | | | | | | | | | | | | | | | | | |
Income from investment operations: | | | | | | | | | | | | | | | | | | | | |
Net investment income | | | 0.25 | | | | 0.22 | | | | 0.18 | | | | 0.17 | | | | 0.17 | |
Net realized and unrealized gain on investments | | | 0.25 | | | | 1.23 | | | | 3.54 | | | | 4.46 | | | | 1.48 | |
| | | | | | | | | | | | | | | | | | | | |
| | | | | |
Total from investment operations | | | 0.50 | | | | 1.45 | | | | 3.72 | | | | 4.63 | | | | 1.65 | |
| | | | | | | | | | | | | | | | | | | | |
Distributions to shareholders from: | | | | | | | | | | | | | | | | | | | | |
Net investment income | | | (0.25 | ) | | | (0.22 | ) | | | (0.19 | ) | | | (0.16 | ) | | | (0.17 | ) |
Net realized capital gains | | | (0.23 | ) | | | (0.65 | ) | | | (0.34 | ) | | | — | | | | — | |
| | | | | | | | | | | | | | | | | | | | |
| | | | | |
Total distributions | | | (0.48 | ) | | | (0.87 | ) | | | (0.53 | ) | | | (0.16 | ) | | | (0.17 | ) |
| | | | | | | | | | | | | | | | | | | | |
| | | | | |
Net asset value, end of year | | $ | 22.36 | | | $ | 22.34 | | | $ | 21.76 | | | $ | 18.57 | | | $ | 14.10 | |
| | | | | | | | | | | | | | | | | | | | |
| | | | | |
Total return | | | 2.34 | % | | | 6.83 | % | | | 20.46 | % | | | 33.02 | % | | | 13.14 | % |
| | | | | | | | | | | | | | | | | | | | |
Ratios to average net assets/ Supplemental data: | | | | | | | | | | | | | | | | | | | | |
Net assets, end of year (in 000s) | | $ | 1,691,802 | | | $ | 1,643,278 | | | $ | 724,089 | | | $ | 287,542 | | | $ | 115,204 | |
Ratio of operating expenses to average net assets | | | 0.88 | % | | | 0.87 | % | | | 0.87 | % | | | 0.86 | % | | | 0.88 | % |
Ratio of net investment income to average net assets | | | 1.14 | % | | | 1.05 | % | | | 1.00 | % | | | 1.07 | % | | | 1.23 | % |
Portfolio turnover rate | | | 111 | % | | | 122 | % | | | 73 | % | | | 90 | % | | | 104 | % |
| 1 | Per share net investment income (loss) has been calculated using the average shares outstanding during the period. |
See Notes to Financial Statements.
THE GLENMEDE FUND, INC.
FINANCIAL HIGHLIGHTS — (Continued)
For a share outstanding throughout each year
| | | | |
| | | Large Cap
Core Portfolio
Institutional
Shares | |
| | | For the
Period
December 30,
20151
through
October 31,
20162 | |
| |
Net asset value, beginning of period | | $ | 21.85 | |
| | | | |
Income from investment operations: | | | | |
Net investment income | | | 0.29 | |
Net realized and unrealized gain on investments | | | 0.45 | |
| | | | |
| |
Total from investment operations | | | 0.74 | |
| | | | |
Distributions to shareholders from: | | | | |
Net investment income | | | (0.22 | ) |
| | | | |
| |
Total distributions | | | (0.22 | ) |
| | | | |
| |
Net asset value, end of period | | $ | 22.37 | |
| | | | |
| |
Total return | | | 3.41 | %3 |
| | | | |
Ratios to average net assets/ Supplemental data: | | | | |
Net assets, end of period (in 000s) | | $ | 274,982 | |
Ratio of operating expenses to average net assets | | | 0.68 | %4 |
Ratio of net investment income to average net assets | | | 1.31 | %4 |
Portfolio turnover rate | | | 111 | % |
| 1 | Commencement of operations. |
| 2 | Per share net investment income (loss) has been calculated using the average shares outstanding during the period. |
| 3 | Total return calculation is not annualized. |
| | | | | | | | | | | | | | | | | | | | |
| | | Large Cap Growth Portfolio Advisor Shares | |
| | | For the Years Ended October 31, | |
| | | 20161 | | | 2015 | | | 2014 | | | 2013 | | | 2012 | |
| | | | | |
Net asset value, beginning of year | | $ | 24.70 | | | $ | 23.05 | | | $ | 19.65 | | | $ | 14.81 | | | $ | 13.73 | |
| | | | | | | | | | | | | | | | | | | | |
Income from investment operations: | | | | | | | | | | | | | | | | | | | | |
Net investment income | | | 0.16 | | | | 0.13 | | | | 0.14 | | | | 0.14 | | | | 0.07 | |
Net realized and unrealized gain on investments | | | 0.05 | 2 | | | 2.26 | | | | 4.26 | | | | 4.83 | | | | 1.08 | |
| | | | | | | | | | | | | | | | | | | | |
| | | | | |
Total from investment operations | | | 0.21 | | | | 2.39 | | | | 4.40 | | | | 4.97 | | | | 1.15 | |
| | | | | | | | | | | | | | | | | | | | |
Net investment income | | | (0.15 | ) | | | (0.13 | ) | | | (0.14 | ) | | | (0.13 | ) | | | (0.07 | ) |
Net realized capital gains | | | — | | | | (0.61 | ) | | | (0.86 | ) | | | — | | | | — | |
| | | | | | | | | | | | | | | | | | | | |
| | | | | |
Total distributions | | | (0.15 | ) | | | (0.74 | ) | | | (1.00 | ) | | | (0.13 | ) | | | (0.07 | ) |
| | | | | �� | | | | | | | | | | | | | | | |
| | | | | |
Net asset value, end of year | | $ | 24.76 | | | $ | 24.70 | | | $ | 23.05 | | | $ | 19.65 | | | $ | 14.81 | |
| | | | | | | | | | | | | | | | | | | | |
| | | | | |
Total return | | | 0.87 | % | | | 10.60 | % | | | 23.36 | % | | | 33.65 | % | | | 8.44 | % |
| | | | | | | | | | | | | | | | | | | | |
Ratios to average net assets/ Supplemental data: | | | | | | | | | | | | | | | | | | | | |
Net assets, end of year (in 000s) | | $ | 2,988,342 | | | $ | 1,959,171 | | | $ | 630,362 | | | $ | 184,552 | | | $ | 93,527 | |
Ratio of operating expenses to average net assets | | | 0.88 | % | | | 0.87 | % | | | 0.88 | % | | | 0.87 | % | | | 0.89 | % |
Ratio of net investment income to average net assets | | | 0.66 | % | | | 0.59 | % | | | 0.70 | % | | | 0.85 | % | | | 0.52 | % |
Portfolio turnover rate | | | 88 | % | | | 95 | % | | | 76 | % | | | 99 | % | | | 111 | % |
| 1 | Per share net investment income (loss) has been calculated using the average shares outstanding during the period. |
| 2 | The amount shown for a share outstanding does not correspond with the aggregate net realized and unrealized loss for the period due to the timing of purchases and redemptions of Portfolio shares in relation to the fluctuating net asset value per share of the Portfolio. |
See Notes to Financial Statements.
THE GLENMEDE FUND, INC.
FINANCIAL HIGHLIGHTS — (Continued)
For a share outstanding throughout each year
| | | | |
| | | Large Cap
Growth
Portfolio
Institutional
Shares | |
| | | For the
Period
November 5,
20151
through
October 31,
20162 | |
| |
Net asset value, beginning of period | | $ | 24.83 | |
| | | | |
Income from investment operations: | | | | |
Net investment income | | | 0.22 | |
Net realized and unrealized loss on investments | | | (0.08 | ) |
| | | | |
| |
Total from investment operations | | | 0.14 | |
| | | | |
Distributions to shareholders from: | | | | |
Net investment income | | | (0.20 | ) |
| | | | |
| |
Total distributions | | | (0.20 | ) |
| | | | |
| |
Net asset value, end of period | | $ | 24.77 | |
| | | | |
| |
Total return | | | 0.60 | %3 |
| | | | |
Ratios to average net assets/ Supplemental data: | | | | |
Net assets, end of period (in 000s) | | $ | 35,114 | |
Ratio of operating expenses to average net assets | | | 0.68 | %4 |
Ratio of net investment income to average net assets | | | 0.90 | %4 |
Portfolio turnover rate | | | 88 | % |
| 1 | Commencement of operations. |
| 2 | Per share net investment income (loss) has been calculated using the average shares outstanding during the period. |
| 3 | Total return calculation is not annualized. |
See Notes to Financial Statements.
THE GLENMEDE FUND, INC.
FINANCIAL HIGHLIGHTS — (Continued)
For a share outstanding throughout each year
| | | | | | | | | | | | | | | | | | | | |
| | | Long/Short Portfolio | |
| | | For the Years Ended October 31, | |
| | | 20161 | | | 20151 | | | 20141 | | | 20131 | | | 20121 | |
| | | | | |
Net asset value, beginning of year | | $ | 11.32 | | | $ | 10.80 | | | $ | 10.50 | | | $ | 9.29 | | | $ | 8.90 | |
| | | | | | | | | | | | | | | | | | | | |
Income from investment operations: | | | | | | | | | | | | | | | | | | | | |
Net investment loss | | | (0.03 | ) | | | (0.07 | ) | | | (0.07 | ) | | | (0.05 | ) | | | (0.08 | ) |
Net realized and unrealized gain on investments | | | 0.10 | | | | 0.59 | | | | 0.37 | | | | 1.26 | | | | 0.47 | |
| | | | | | | | | | | | | | | | | | | | |
| | | | | |
Total from investment operations | | | 0.07 | | | | 0.52 | | | | 0.30 | | | | 1.21 | | | | 0.39 | |
| | | | | | | | | | | | | | | | | | | | |
| | | | | | | | | | | | | | | | | | | | |
Net asset value, end of year | | $ | 11.39 | | | $ | 11.32 | | | $ | 10.80 | | | $ | 10.50 | | | $ | 9.29 | |
| | | | | | | | | | | | | | | | | | | | |
| | | | | |
Total return3 | | | 0.62 | % | | | 4.81 | %2 | | | 2.86 | %2 | | | 13.02 | % | | | 4.38 | % |
| | | | | | | | | | | | | | | | | | | | |
Ratios to average net assets/ Supplemental data: | | | | | | | | | | | | | | | | | | | | |
Net assets, end of year (in 000s) | | $ | 239,413 | | | $ | 193,480 | | | $ | 109,965 | | | $ | 29,108 | | | $ | 13,752 | |
Ratio of operating expenses before waiver/reimbursement to average net assets | | | 2.73 | % | | | 2.64 | % | | | 2.48 | % | | | 2.62 | % | | | 3.20 | % |
Ratio of operating expenses after waiver/reimbursement to average net assets | | | 2.38 | % | | | 2.29 | % | | | 2.13 | % | | | 2.27 | % | | | 2.80 | % |
Ratio of operating expenses after waiver/reimbursement excluding dividends on securities sold short | | | 1.17 | % | | | 1.16 | % | | | 1.22 | % | | | 1.25 | % | | | 1.25 | % |
Ratio of net expenses in excess of income to average net assets | | | (0.41 | )% | | | (0.67 | )% | | | (0.63 | )% | | | (0.53 | )% | | | (0.83 | )% |
Portfolio turnover rate4 | | | 98 | % | | | 119 | % | | | 150 | % | | | 154 | % | | | 128 | % |
| 1 | Per share net investment income (loss) has been calculated using the average shares outstanding during the period. |
| 2 | Includes adjustments in accordance with accounting principles generally accepted in the United States of America and as such, the net asset value for financial reporting purposes and the returns based upon those net asset values may differ from the net asset value and returns for shareholder transactions as shown in the management discussion and analysis and as otherwise reported to shareholders. |
| 3 | The Total Return reflects fee waivers and/or expense reimbursements in effect and would have been lower in their absence. |
| 4 | The calculation of the portfolio turnover rate reflects the absolute value of the long and short positions. |
See Notes to Financial Statements.
THE GLENMEDE FUND, INC.
FINANCIAL HIGHLIGHTS — (Continued)
For a share outstanding throughout each year
| | | | | | | | | | | | | | | | | | | | |
| | | Total Market Portfolio | |
| | | For the Years Ended October 31, | |
| | | 2016 | | | 2015 | | | 2014 | | | 2013 | | | 2012 | |
| | | | | |
Net asset value, beginning of year | | $ | 14.68 | | | $ | 15.07 | | | $ | 12.78 | | | $ | 9.68 | | | $ | 9.01 | |
| | | | | | | | | | | | | | | | | | | | |
Income from investment operations: | | | | | | | | | | | | | | | | | | | | |
Net investment income | | | 0.09 | | | | 0.08 | | | | 0.06 | | | | 0.09 | | | | 0.03 | |
Net realized and unrealized gain (loss) on investments | | | (0.04 | ) | | | 0.49 | | | | 2.29 | | | | 3.09 | | | | 0.68 | |
| | | | | | | | | | | | | | | | | | | | |
| | | | | |
Total from investment operations | | | 0.05 | | | | 0.57 | | | | 2.35 | | | | 3.18 | | | | 0.71 | |
| | | | | | | | | | | | | | | | | | | | |
Distributions to shareholders from: | | | | | | | | | | | | | | | | | | | | |
Net investment income | | | (0.08 | ) | | | (0.08 | ) | | | (0.06 | ) | | | (0.08 | ) | | | (0.04 | ) |
Net realized capital gains | | | — | | | | (0.88 | ) | | | (0.00 | )1 | | | — | | | | — | |
| | | | | | | | | | | | | | | | | | | | |
| | | | | |
Total distributions | | | (0.08 | ) | | | (0.96 | ) | | | (0.06 | ) | | | (0.08 | ) | | | (0.04 | ) |
| | | | | | | | | | | | | | | | | | | | |
| | | | | |
Net asset value, end of year | | $ | 14.65 | | | $ | 14.68 | | | $ | 15.07 | | | $ | 12.78 | | | $ | 9.68 | |
| | | | | | | | | | | | | | | | | | | | |
| | | | | |
Total return2 | | | 0.37 | % | | | 3.94 | % | | | 18.43 | % | | | 33.01 | % | | | 7.93 | % |
| | | | | | | | | | | | | | | | | | | | |
Ratios to average net assets/ Supplemental data: | | | | | | | | | | | | | | | | | | | | |
Net assets, end of year (in 000s) | | $ | 61,083 | | | $ | 88,734 | | | $ | 61,467 | | | $ | 38,426 | | | $ | 44,619 | |
Ratio of operating expenses before waiver/reimbursement to average net assets | | | 2.59 | % | | | 2.29 | % | | | 2.23 | % | | | 2.29 | % | | | 2.48 | % |
Ratio of operating expenses after waiver/reimbursement to average net assets | | | 2.16 | % | | | 1.93 | % | | | 1.85 | % | | | 1.94 | % | | | 2.09 | % |
Ratio of operating expenses after waiver/reimbursement excluding dividends on securities sold short and flex fees | | | 1.25 | % | | | 1.25 | % | | | 1.25 | % | | | 1.20 | % | | | 1.25 | % |
Ratio of net investment income to average net assets | | | 0.56 | % | | | 0.55 | % | | | 0.41 | % | | | 0.83 | % | | | 0.29 | % |
Portfolio turnover rate3 | | | 88 | % | | | 129 | % | | | 117 | % | | | 138 | % | | | 135 | % |
| 1 | Amount rounds to less than $0.01 per share. |
| 2 | The Total Return reflects fee waivers and/or expense reimbursements in effect and would have been lower in their absence. |
| 3 | The calculation of the portfolio turnover rate reflects the absolute value of the long and short positions. |
See Notes to Financial Statements.
THE GLENMEDE FUND, INC.
FINANCIAL HIGHLIGHTS — (Continued)
For a share outstanding throughout each year
| | | | |
| | | High Yield
Municipal
Portfolio | |
| | | For the
Period
December 22,
20151
through
October 31,
20162 | |
| |
Net asset value, beginning of period | | $ | 10.00 | |
| | | | |
Income from investment operations: | | | | |
Net investment income | | | 0.22 | |
Net realized and unrealized gain on investments | | | 0.34 | |
| | | | |
| |
Total from investment operations | | | 0.56 | |
| | | | |
Distributions to shareholders from: | | | | |
Net investment income | | | (0.17 | ) |
| | | | |
| |
Total distributions | | | (0.17 | ) |
| | | | |
| |
Net asset value, end of period | | $ | 10.39 | |
| | | | |
| |
Total return3 | | | 5.56 | %4 |
| | | | |
Ratios to average net assets/ Supplemental data: | | | | |
Net assets, end of period (in 000s) | | $ | 153,893 | |
Ratio of operating expenses before waiver to net assets | | | 1.08 | %5 |
Ratio of operating expenses after waiver to average net assets | | | 1.00 | %5 |
Ratio of net investment income to average net assets | | | 2.44 | %5 |
Portfolio turnover rate | | | 73 | % |
| 1 | Commencement of operations. |
| 2 | Per share net investment income (loss) has been calculated using the average shares outstanding during the period. |
| 3 | The Total Return reflects fee waivers and/or expense reimbursements in effect and would have been lower in their absence. |
| 4 | Total return calculation is not annualized. |
See Notes to Financial Statements.
THE GLENMEDE FUND, INC.
FINANCIAL HIGHLIGHTS — (Continued)
For a share outstanding throughout each year
| | | | |
| | | Responsible
ESG U.S.
Equity
Portfolio | |
| | | For the
Period
December 22,
20151
through
October 31,
20162 | |
| |
Net asset value, beginning of period | | $ | 10.00 | |
| | | | |
Income from investment operations: | | | | |
Net investment income | | | 0.07 | |
Net realized and unrealized gain on investments | | | 0.82 | |
| | | | |
| |
Total from investment operations | | | 0.89 | |
| | | | |
Distributions to shareholders from: | | | | |
Net investment income | | | (0.05 | ) |
| | | | |
| |
Total distributions | | | (0.05 | ) |
| | | | |
| |
Net asset value, end of period | | $ | 10.84 | |
| | | | |
| |
Total return | | | 8.87 | %3 |
| | | | |
Ratios to average net assets/ Supplemental data: | | | | |
Net assets, end of period (in 000s) | | $ | 6,561 | |
Ratio of operating expenses before waiver to net assets | | | 2.21 | %4 |
Ratio of operating expenses after waiver to average net assets | | | 1.00 | %4 |
Ratio of net investment income to average net assets | | | 0.76 | %4 |
Portfolio turnover rate | | | 65 | % |
| 1 | Commencement of operations. |
| 2 | Per share net investment income (loss) has been calculated using the average shares outstanding during the period. |
| 3 | Total return calculation is not annualized. |
See Notes to Financial Statements.
THE GLENMEDE FUND, INC.
FINANCIAL HIGHLIGHTS — (Continued)
For a share outstanding throughout each year
| | | | |
| | | Women in
Leadership
U.S. Equity
Portfolio | |
| | | For the
Period
December 22,
20151
through
October 31,
20162 | |
| |
Net asset value, beginning of period | | $ | 10.00 | |
| | | | |
Income from investment operations: | | | | |
Net investment income | | | 0.14 | |
Net realized and unrealized gain on investments | | | 0.63 | |
| | | | |
| |
Total from investment operations | | | 0.77 | |
| | | | |
Distributions to shareholders from: | | | | |
Net investment income | | | (0.12 | ) |
| | | | |
| |
Total distributions | | | (0.12 | ) |
| | | | |
| |
Net asset value, end of period | | $ | 10.65 | |
| | | | |
| |
Total return | | | 7.73 | %3 |
| | | | |
Ratios to average net assets/ Supplemental data: | | | | |
Net assets, end of period (in 000s) | | $ | 6,517 | |
Ratio of operating expenses before waiver/reimbursement to average net assets | | | 2.22 | %4 |
Ratio of operating expenses after waiver/reimbursement to average net assets | | | 1.00 | %4 |
Ratio of net investment income to average net assets | | | 1.31 | %4 |
Portfolio turnover rate | | | 81 | % |
| 1 | Commencement of operations. |
| 2 | Per share net investment income (loss) has been calculated using the average shares outstanding during the period. |
| 3 | Total return calculation is not annualized. |
See Notes to Financial Statements.
THE GLENMEDE FUND, INC.
FINANCIAL HIGHLIGHTS — (Continued)
For a share outstanding throughout each year
| | | | |
| | | Short Term
Tax Aware
Fixed Income
Portfolio | |
| | | For the
Period
June 29,
20161
through
October 31,
20162 | |
| |
Net asset value, beginning of period | | $ | 10.00 | |
| | | | |
Income from investment operations: | | | | |
Net investment income | | | 0.02 | |
Net realized and unrealized loss on investments | | | (0.02 | ) |
| | | | |
Total from investment operations | | | 0.00 | |
| | | | |
Distributions to shareholders from: | | | | |
Net investment income | | | (0.01 | ) |
| | | | |
| |
Total distributions | | | (0.01 | ) |
| | | | |
| |
Net asset value, end of period | | $ | 9.99 | |
| | | | |
| |
Total return | | | (0.02 | )%3 |
| | | | |
Ratios to average net assets/ Supplemental data: | | | | |
Net assets, end of period (in 000s) | | $ | 30,076 | |
Ratio of operating expenses before waiver/reimbursement to average net assets | | | 0.90 | %4 |
Ratio of operating expenses after waiver/reimbursement to average net assets | | | 0.55 | %4 |
Ratio of net investment income to average net assets | | | 0.46 | %4 |
Portfolio turnover rate | | | 35 | % |
| 1 | Commencement of operations. |
| 2 | Per share net investment income (loss) has been calculated using the average shares outstanding during the period. |
| 3 | Total return calculation is not annualized. |
| | | | | | | | | | | | | | | | | | | | |
| | | Secured Options Portfolio Advisor Shares | |
| | | For the Years Ended October 31, | |
| | | 20161 | | | 20151 | | | 20141 | | | 20131 | | | 20121 | |
| | | | | |
Net asset value, beginning of year | | $ | 12.57 | | | $ | 12.47 | | | $ | 13.24 | | | $ | 13.28 | | | $ | 12.03 | |
| | | | | | | | | | | | | | | | | | | | |
Income from investment operations: | | | | | | | | | | | | | | | | | | | | |
Net investment loss | | | (0.09 | ) | | | (0.09 | ) | | | (0.11 | ) | | | (0.11 | ) | | | (0.10 | ) |
Net realized and unrealized gain on investments | | | 0.68 | | | | 0.84 | | | | 0.85 | | | | 1.51 | | | | 1.78 | |
| | | | | | | | | | | | | | | | | | | | |
| | | | | |
Total from investment operations | | | 0.59 | | | | 0.75 | | | | 0.74 | | | | 1.40 | | | | 1.68 | |
| | | | | | | | | | | | | | | | | | | | |
Distributions to shareholders from: | | | | | | | | | | | | | | | | | | | | |
Net realized capital gains | | | (0.71 | ) | | | (0.65 | ) | | | (1.51 | ) | | | (1.44 | ) | | | (0.43 | ) |
| | | | | | | | | | | | | | | | | | | | |
| | | | | |
Total distributions | | | (0.71 | ) | | | (0.65 | ) | | | (1.51 | ) | | | (1.44 | ) | | | (0.43 | ) |
| | | | | | | | | | | | | | | | | | | | |
| | | | | |
Net asset value, end of year | | $ | 12.45 | | | $ | 12.57 | | | $ | 12.47 | | | $ | 13.24 | | | $ | 13.28 | |
| | | | | | | | | | | | | | | | | | | | |
| | | | | |
Total return | | | 5.08 | % | | | 6.37 | % | | | 6.22 | % | | | 11.90 | % | | | 14.34 | % |
| | | | | | | | | | | | | | | | | | | | |
Ratios to average net assets/ Supplemental data: | | | | | | | | | | | | | | | | | | | | |
Net assets, end of year (in 000s) | | $ | 574,200 | | | $ | 395,163 | | | $ | 365,675 | | | $ | 381,546 | | | $ | 375,175 | |
Ratio of operating expenses to average net assets2 | | | 0.85 | % | | | 0.84 | % | | | 0.87 | % | | | 0.86 | % | | | 0.88 | % |
Ratio of net expenses in excess of income to average net assets2 | | | (0.76 | )% | | | (0.77 | )% | | | (0.81 | )% | | | (0.81 | )% | | | (0.85 | )% |
Portfolio turnover rate | | | — | %3 | | | — | %3 | | | 1,108 | % | | | 1,120 | % | | | 1,130 | % |
| 1 | Per share net investment income (loss) has been calculated using the average shares outstanding during the period. |
| 2 | This ratio does not include the expenses of the Exchange-Traded Fund held in the Portfolio. |
| 3 | All trading activity in the Portfolio during the year was short term and is excluded for portfolio turnover calculations resulting in zero portfolio turnover percentage. |
See Notes to Financial Statements.
THE GLENMEDE FUND, INC.
FINANCIAL HIGHLIGHTS — (Continued)
For a share outstanding throughout each year
| | | | | | | | | | | | | | | | | | | | |
| | | International Secured Options Portfolio | |
| | | For the Years Ended October 31, | | | For the
Period
September 28,
20121
through
October 31,
20122 | |
| | | 20162 | | | 20152 | | | 20142 | | | 20132 | | |
| | | | | |
Net asset value, beginning of year | | $ | 9.96 | | | $ | 10.58 | | | $ | 11.52 | | | $ | 10.15 | | | $ | 10.00 | |
| | | | | | | | | | | | | | | | | | | | |
Income from investment operations: | | | | | | | | | | | | | | | | | | | | |
Net investment income (loss)3 | | | 0.15 | | | | 0.19 | | | | 0.13 | | | | (0.08 | ) | | | (0.01 | ) |
Net realized and unrealized gain (loss) on investments | | | (0.30 | ) | | | (0.48 | ) | | | (0.11 | ) | | | 1.48 | | | | 0.16 | |
| | | | | | | | | | | | | | | | | | | | |
| | | | | |
Total from investment operations | | | (0.15 | ) | | | (0.29 | ) | | | 0.02 | | | | 1.40 | | | | 0.15 | |
| | | | | | | | | | | | | | | | | | | | |
Distributions to shareholders from: | | | | | | | | | | | | | | | | | | | | |
Net investment income | | | (0.21 | ) | | | (0.21 | ) | | | (0.11 | ) | | | — | | | | — | |
Net realized capital gains | | | — | | | | (0.12 | ) | | | (0.85 | ) | | | (0.03 | ) | | | — | |
| | | | | | | | | | | | | | | | | | | | |
| | | | | |
Total distributions | | | (0.21 | ) | | | (0.33 | ) | | | (0.96 | ) | | | (0.03 | ) | | | — | |
| | | | | | | | | | | | | | | | | | | | |
| | | | | |
Net asset value, end of year | | $ | 9.60 | | | $ | 9.96 | | | $ | 10.58 | | | $ | 11.52 | | | $ | 10.15 | |
| | | | | | | | | | | | | | | | | | | | |
| | | | | |
Total return | | | (1.47 | )% | | | (2.78 | )% | | | 0.30 | % | | | 13.78 | % | | | 1.50 | %4,5 |
| | | | | | | | | | | | | | | | | | | | |
Ratios to average net assets/ Supplemental data: | | | | | | | | | | | | | | | | | | | | |
Net assets, end of period (in 000s) | | $ | 28,818 | | | $ | 88,478 | | | $ | 100,552 | | | $ | 98,182 | | | $ | 21,115 | |
Ratio of operating expenses before waiver/reimbursement to average net assets3 | | | 0.91 | % | | | 0.84 | % | | | 0.87 | % | | | 0.95 | % | | | 3.68 | %6 |
Ratio of operating expenses after waiver/reimbursement to average net assets3 | | | 0.91 | % | | | 0.84 | % | | | 0.87 | % | | | 0.95 | % | | | 1.00 | %6 |
Ratio of net investment income to average net assets3 | | | 1.61 | % | | | 1.83 | % | | | 1.20 | % | | | (0.74 | )% | | | (1.00 | )%6 |
Portfolio turnover rate | | | 70 | % | | | 106 | % | | | 81 | % | | | 7 | % | | | 0 | %7,8 |
| 1 | Commencement of operations. |
| 2 | Per share net investment income (loss) has been calculated using the average shares outstanding during the period. |
| 3 | This ratio does not include the expenses of the Exchange-Traded Fund held in the Portfolio. |
| 4 | Total return calculation is not annualized. |
| 5 | The Total Return reflects fee waivers and/or expense reimbursements in effect and would have been lower in their absence. |
| 7 | Amount rounds to less than 0.01% per share. |
| 8 | Calculation represents portfolio turnover for the Portfolio for the period of September 28, 2012 through October 31, 2012. |
See Notes to Financial Statements.
THE GLENMEDE FUND, INC.
FINANCIAL HIGHLIGHTS — (Concluded)
For a share outstanding throughout each year
| | | | | | | | | | | | | | | | | | | | |
| | | International Portfolio | |
| | | For the Years Ended October 31, | |
| | | 20161 | | | 20151 | | | 20141 | | | 20131 | | | 20121 | |
| | | | | |
Net asset value, beginning of year | | $ | 13.45 | | | $ | 13.83 | | | $ | 14.52 | | | $ | 11.88 | | | $ | 12.06 | |
| | | | | | | | | | | | | | | | | | | | |
Income from investment operations: | | | | | | | | | | | | | | | | | | | | |
Net investment income | | | 0.24 | | | | 0.15 | | | | 0.24 | | | | 0.25 | | | | 0.29 | |
Net realized and unrealized gain (loss) on investments | | | (0.71 | ) | | | (0.40 | ) | | | (0.65 | ) | | | 2.59 | | | | (0.15 | ) |
| | | | | | | | | | | | | | | | | | | | |
| | | | | |
Total from investment operations | | | (0.47 | ) | | | (0.25 | ) | | | (0.41 | ) | | | 2.84 | | | | 0.14 | |
| | | | | | | | | | | | | | | | | | | | |
Distributions to shareholders from: | | | | | | | | | | | | | | | | | | | | |
Net investment income | | | (0.22 | ) | | | (0.13 | ) | | | (0.28 | ) | | | (0.20 | ) | | | (0.31 | ) |
Tax return of capital | | | — | | | | — | | | | — | | | | — | | | | (0.01 | ) |
| | | | | | | | | | | | | | | | | | | | |
| | | | | |
Total distributions | | | (0.22 | ) | | | (0.13 | ) | | | (0.28 | ) | | | (0.20 | ) | | | (0.32 | ) |
| | | | | | | | | | | | | | | | | | | | |
| | | | | |
Net asset value, end of year | | $ | 12.76 | | | $ | 13.45 | | | $ | 13.83 | | | $ | 14.52 | | | $ | 11.88 | |
| | | | | | | | | | | | | | | | | | | | |
| | | | | |
Total return | | | (3.44 | )%2 | | | (1.83 | )%2 | | | (2.94 | )%2 | | | 24.21 | % | | | 1.28 | % |
| | | | | | | | | | | | | | | | | | | | |
Ratios to average net assets/ Supplemental data: | | | | | | | | | | | | | | | | | | | | |
Net assets, end of year (in 000s) | | $ | 441,284 | | | $ | 243,403 | | | $ | 37,520 | | | $ | 63,344 | | | $ | 156,046 | |
Ratio of operating expenses to average net assets | | | — | % | | | — | % | | | — | % | | | 1.15 | % | | | 1.14 | % |
Ratio of operating expenses before waiver/reimbursement to average net assets | | | 1.12 | % | | | 1.24 | % | | | 1.24 | % | | | — | % | | | — | % |
Ratio of operating expenses after waiver/reimbursement to average net assets | | | 1.04 | % | | | 1.24 | % | | | 1.23 | % | | | — | % | | | — | % |
Ratio of net investment income to average net assets | | | 1.88 | % | | | 1.10 | % | | | 1.64 | % | | | 1.91 | % | | | 2.47 | % |
Portfolio turnover rate | | | 121 | % | | | 148 | % | | | 47 | % | | | 43 | % | | | 45 | % |
| 1 | Per share net investment income (loss) has been calculated using the average shares outstanding during the period. |
| 2 | The Total Return reflects fee waivers in effect and would have been lower in their absence. |
See Notes to Financial Statements.
THE GLENMEDE FUND, INC.
Core Fixed Income Portfolio
SCHEDULE OF PORTFOLIO INVESTMENTS
October 31, 2016
| | | | | | | | |
Face
Amount | | | | | Value | |
| |
| AGENCY NOTES* — 14.6% | | | |
| | | | Federal Home Loan Bank — 5.1% | |
| $ | 19,000,000 | | | 5.000% due 11/17/17 | | $ | 19,845,025 | |
| | 4,500,000 | | | 4.125% due 12/13/19 | | | 4,902,557 | |
| | | | | | | | |
| | | | | | | 24,747,582 | |
| | | | | | | | |
| |
| | | | Federal Home Loan Mortgage Corporation — 4.3% | |
| | 10,000,000 | | | 3.750% due 3/27/19 | | | 10,651,750 | |
| | 10,000,000 | | | 2.375% due 1/13/22 | | | 10,446,060 | |
| | | | | | | | |
| | | | | | | 21,097,810 | |
| | | | | | | | |
| |
| | | | Federal National Mortgage Association — 5.2% | |
| | 5,000,000 | | | 5.000% due 5/11/17 | | | 5,117,920 | |
| | 9,650,000 | | | 1.250% due 5/6/21 | | | 9,588,095 | |
| | 10,000,000 | | | 2.625% due 9/6/24 | | | 10,545,490 | |
| | | | | | | | |
| | | | | | | 25,251,505 | |
| | | | | | | | |
| | |
| | | | TOTAL AGENCY NOTES
(Cost $70,638,047) | | | 71,096,897 | |
| | | | | | | | |
| |
| MORTGAGE-BACKED SECURITIES*,1 — 25.9% | | | |
| | | | Federal Home Loan Mortgage Corporation — 8.3% | | | |
| | 7 | | | # G00807, 9.500% due 3/1/21 | | | 7 | �� |
| | 210,862 | | | # G12342, 5.500% due 8/1/21 | | | 223,366 | |
| | 47,013 | | | # J03604, 5.500% due 10/1/21 | | | 49,735 | |
| | 31,060 | | | # J03649, 5.500% due 10/1/21 | | | 33,024 | |
| | 85,141 | | | # G12442, 6.000% due 11/1/21 | | | 91,623 | |
| | 112,440 | | | # J03536, 5.500% due 11/1/21 | | | 118,583 | |
| | 69,946 | | | # G18163, 5.500% due 1/1/22 | | | 74,716 | |
| | 261,727 | | | # G13396, 5.500% due 12/1/23 | | | 281,820 | |
| | 55,476 | | | # D78677, 8.000% due 3/1/27 | | | 57,754 | |
| | 193,819 | | | # C00742, 6.500% due 4/1/29 | | | 224,109 | |
| | 70,693 | | | # A57845, 7.000% due 2/1/37 | | | 76,649 | |
| | 56,488 | | | # A68937, 6.000% due 11/1/37 | | | 64,574 | |
| | 44,729 | | | # A68332, 5.500% due 11/1/37 | | | 50,524 | |
| | 297,723 | | | # A70446, 5.000% due 12/1/37 | | | 329,080 | |
| | 521,220 | | | # A69653, 5.500% due 12/1/37 | | | 591,516 | |
| | 503,512 | | | # A73370, 5.000% due 2/1/38 | | | 556,445 | |
| | 584,949 | | | # A90421, 4.500% due 12/1/39 | | | 639,843 | |
| | 635,184 | | | # A92890, 4.500% due 7/1/40 | | | 693,724 | |
| | 2,478,335 | | | # A97620, 4.500% due 3/1/41 | | | 2,715,473 | |
| | 3,628,681 | | | # C03770, 3.500% due 2/1/42 | | | 3,820,110 | |
| | 2,497,973 | | | # Q07651, 3.500% due 4/1/42 | | | 2,644,625 | |
| | 9,954,351 | | | # G08671, 3.500% due 10/1/45 | | | 10,444,957 | |
| | 10,743,939 | | | # G08687, 3.500% due 1/1/46 | | | 11,275,655 | |
| | 4,911,769 | | | # Q41208, 3.500% due 6/1/46 | | | 5,163,447 | |
| | | | | | | | |
| | | | | | | 40,221,359 | |
| | | | | | | | |
| |
| | | | Federal National Mortgage Association — 17.0% | |
| | 1,311 | | | # 625990, 5.500% due 12/1/16 | | | 1,312 | |
| | 841 | | | # 643340, 6.500% due 3/1/17 | | | 843 | |
| | 1,584 | | | # 555016, 6.500% due 10/1/17 | | | 1,600 | |
| | 25,053 | | | # 686230, 5.500% due 2/1/18 | | | 25,458 | |
| | 39,963 | | | # 254685, 5.000% due 4/1/18 | | | 40,979 | |
| | 66,484 | | | # 740449, 5.500% due 9/1/18 | | | 68,069 | |
| | 35,097 | | | # 768557, 5.500% due 2/1/19 | | | 36,067 | |
| | 29,625 | | | # 255159, 5.500% due 3/1/19 | | | 30,653 | |
| | 113 | | | # 313796, 9.500% due 2/1/21 | | | 113 | |
| | 1,544 | | | # 125275, 7.000% due 3/1/24 | | | 1,695 | |
| | 4,955 | | | # 313795, 9.500% due 1/1/25 | | | 5,043 | |
See Notes to Financial Statements.
THE GLENMEDE FUND, INC.
Core Fixed Income Portfolio
SCHEDULE OF PORTFOLIO INVESTMENTS — (Continued)
October 31, 2016
| | | | | | | | |
Face
Amount | | | | | Value | |
| |
| MORTGAGE-BACKED SECURITIES*,1 — (Continued) | | | |
| | | | Federal National Mortgage Association — (Continued) | |
| $ | 1,224,736 | | | # AH6827, 4.000% due 3/1/26 | | $ | 1,308,320 | |
| | 1,004,399 | | | # AI1657, 4.000% due 4/1/26 | | | 1,075,513 | |
| | 1,628,373 | | | # AB3900, 3.000% due 11/1/26 | | | 1,704,795 | |
| | 23,561 | | | # 373328, 8.000% due 3/1/27 | | | 23,640 | |
| | 2,178,132 | | | # AK4751, 3.000% due 4/1/27 | | | 2,285,412 | |
| | 18,879 | | | # 390895, 8.000% due 6/1/27 | | | 19,210 | |
| | 4,618,090 | | | # AO0533, 3.000% due 6/1/27 | | | 4,834,823 | |
| | 104,659 | | | # 397602, 8.000% due 8/1/27 | | | 117,465 | |
| | 2,093 | | | # 499335, 6.500% due 8/1/29 | | | 2,407 | |
| | 7,723 | | | # 252806, 7.500% due 10/1/29 | | | 8,960 | |
| | 388 | | | # 523497, 7.500% due 11/1/29 | | | 440 | |
| | 2,363 | | | # 588945, 7.000% due 6/1/31 | | | 2,623 | |
| | 72,306 | | | # 607862, 7.000% due 9/1/31 | | | 78,178 | |
| | 8,957 | | | # 656872, 6.500% due 8/1/32 | | | 10,301 | |
| | 18,845 | | | # 687575, 7.000% due 2/1/33 | | | 19,113 | |
| | 386,501 | | | # 789856, 6.000% due 8/1/34 | | | 444,176 | |
| | 104,987 | | | # 820811, 6.000% due 4/1/35 | | | 120,178 | |
| | 85,730 | | | # 829202, 5.000% due 7/1/35 | | | 95,043 | |
| | 197,114 | | | # 826586, 5.000% due 8/1/35 | | | 218,852 | |
| | 55,810 | | | # 867021, 7.000% due 3/1/36 | | | 57,385 | |
| | 40,293 | | | # 256216, 7.000% due 4/1/36 | | | 45,469 | |
| | 192,199 | | | # 898412, 5.000% due 10/1/36 | | | 213,099 | |
| | 37,310 | | | # 910894, 5.000% due 2/1/37 | | | 41,369 | |
| | 48,146 | | | # 912456, 6.500% due 3/1/37 | | | 55,367 | |
| | 80,682 | | | # 959877, 5.000% due 11/1/37 | | | 89,232 | |
| | 553,723 | | | #973241, 5.000% due 3/1/38 | | | 612,404 | |
| | 191,087 | | | # 975593, 5.000% due 6/1/38 | | | 211,337 | |
| | 198,914 | | | # 257573, 5.500% due 2/1/39 | | | 224,815 | |
| | 787,151 | | | # AD7128, 4.500% due 7/1/40 | | | 861,115 | |
| | 6,791,541 | | | # AH1568, 4.500% due 12/1/40 | | | 7,477,684 | |
| | 3,325,899 | | | # AH6991, 4.000% due 1/1/41 | | | 3,571,965 | |
| | 2,365,773 | | | # AH4004, 4.500% due 3/1/41 | | | 2,594,276 | |
| | 2,005,105 | | | # AH8351, 4.000% due 3/1/41 | | | 2,154,542 | |
| | 1,374,286 | | | # AJ1315, 4.000% due 9/1/41 | | | 1,492,830 | |
| | 1,997,588 | | | # AI8779, 4.000% due 11/1/41 | | | 2,147,214 | |
| | 3,396,204 | | | # AJ5958, 4.000% due 12/1/41 | | | 3,649,206 | |
| | 1,328,862 | | | # AK5070, 3.500% due 3/1/42 | | | 1,403,468 | |
| | 5,294,331 | | | # AK5426, 3.500% due 3/1/42 | | | 5,580,077 | |
| | 9,124,193 | | | # AT7682, 3.500% due 6/1/43 | | | 9,687,189 | |
| | 7,862,508 | | | # AS6326, 3.500% due 12/1/45 | | | 8,252,406 | |
| | 8,975,428 | | | # AS6881, 3.500% due 3/1/46 | | | 9,420,514 | |
| | 10,000,000 | | | # BC4729, 3.000% due 10/1/46 | | | 10,304,182 | |
| | | | | | | | |
| | | | | | | 82,728,426 | |
| | | | | | | | |
| |
| | | | Government National Mortgage Association — 0.6% | |
| | 13,060 | | | # 460389, 7.000% due 5/15/28 | | | 13,173 | |
| | 8,899 | | | # 464049, 7.000% due 7/15/28 | | | 9,689 | |
| | 14,709 | | | # 476259, 7.000% due 8/15/28 | | | 14,756 | |
| | 10,961 | | | # 485264, 7.500% due 2/15/31 | | | 11,261 | |
| | 22,109 | | | # 559304, 7.000% due 9/15/31 | | | 24,692 | |
| | 302,157 | | | # 652486, 5.500% due 4/15/36 | | | 344,976 | |
| | 409,864 | | | # 651859, 5.000% due 6/15/36 | | | 459,851 | |
| | 294,740 | | | # 782150, 5.500% due 4/15/37 | | | 335,458 | |
| | 73,316 | | | # 662521, 6.000% due 8/15/37 | | | 85,226 | |
| | 126,221 | | | # 677545, 6.000% due 11/15/37 | | | 144,386 | |
| | 155,449 | | | # 676291, 6.000% due 12/15/37 | | | 177,820 | |
| | 34,102 | | | # 678831, 5.000% due 1/15/38 | | | 37,891 | |
| | 131,309 | | | # 685836, 5.500% due 4/15/38 | | | 148,884 | |
See Notes to Financial Statements.
THE GLENMEDE FUND, INC.
Core Fixed Income Portfolio
SCHEDULE OF PORTFOLIO INVESTMENTS — (Continued)
October 31, 2016
| | | | | | | | |
Face
Amount | | | | | Value | |
| |
| MORTGAGE-BACKED SECURITIES*,1 — (Continued) | | | |
| | | | Government National Mortgage Association — (Continued) | |
| $ | 645,270 | | | # 698235, 5.000% due 6/15/39 | | $ | 719,406 | |
| | 442,305 | | | # 716655, 5.000% due 8/15/39 | | | 491,448 | |
| | | | | | | | |
| | | | | | | 3,018,917 | |
| | | | | | | | |
| | |
| | | | TOTAL MORTGAGE-BACKED SECURITIES
(Cost $123,469,069) | | | 125,968,702 | |
| | | | | | | | |
| |
| CORPORATE NOTES* — 39.2% | | | |
| | | | Communications — 4.2% | | | |
| | 8,954,000 | | | Amazon.com, Inc.,
2.600% due 12/5/19 | | | 9,253,261 | |
| | 10,000,000 | | | Amazon.com, Inc.,
4.800% due 12/5/34 | | | 11,414,190 | |
| | | | | | | | |
| | | | | | | 20,667,451 | |
| | | | | | | | |
| |
| | | | Computer Software & Processing — 3.0% | |
| | 6,500,000 | | | Microsoft Corp.,
3.125% due 11/3/25 | | | 6,810,544 | |
| | 8,000,000 | | | Microsoft Corp.,
3.450% due 8/8/36 | | | 7,897,656 | |
| | | | | | | | |
| | | | | | | 14,708,200 | |
| | | | | | | | |
| |
| | | | Consumer, Cyclical — 7.7% | |
| | 7,000,000 | | | American Honda Finance Corp.,
1.600% due 7/13/18 | | | 7,041,909 | |
| | 9,344,000 | | | Toyota Motor Credit Corp.,
2.000% due 10/24/18 | | | 9,460,127 | |
| | 9,335,000 | | | Wal-Mart Stores, Inc.,
7.550% due 2/15/30 | | | 13,940,002 | |
| | 5,000,000 | | | Wal-Mart Stores, Inc.,
6.500% due 8/15/37 | | | 7,138,945 | |
| | | | | | | | |
| | | | | | | 37,580,983 | |
| | | | | | | | |
| |
| | | | Consumer, Non-Cyclical — 7.4% | |
| | 10,650,000 | | | Coca-Cola Co. (The),
3.300% due 9/1/21 | | | 11,402,497 | |
| | 11,850,000 | | | PepsiCo, Inc.,
7.900% due 11/1/18 | | | 13,369,952 | |
| | 8,114,000 | | | Procter & Gamble Co. (The),
5.550% due 3/5/37 | | | 11,037,994 | |
| | | | | | | | |
| | | | | | | 35,810,443 | |
| | | | | | | | |
| |
| | | | Financial — 7.3% | |
| | 10,000,000 | | | Berkshire Hathaway Finance Corp.,
4.250% due 1/15/212 | | | 10,999,080 | |
| | 5,000,000 | | | GE Capital International Funding Co. Unlimited,
4.418% due 11/15/35 | | | 5,453,785 | |
| | 5,000,000 | | | JPMorgan Chase & Co.,
6.000% due 1/15/18 | | | 5,264,050 | |
| | 4,418,000 | | | JPMorgan Chase & Co.,
4.950% due 3/25/20 | | | 4,836,433 | |
| | 8,800,000 | | | Wells Fargo & Co.,
2.100% due 7/26/21 | | | 8,754,592 | |
| | | | | | | | |
| | | | | | | 35,307,940 | |
| | | | | | | | |
| |
| | | | Financial Services — 1.3% | |
| | 6,000,000 | | | Bear Stearns Cos. LLC (The),
7.250% due 2/1/18 | | | 6,416,784 | |
| | | | | | | | |
| | | | | | | 6,416,784 | |
| | | | | | | | |
See Notes to Financial Statements.
THE GLENMEDE FUND, INC.
Core Fixed Income Portfolio
SCHEDULE OF PORTFOLIO INVESTMENTS — (Continued)
October 31, 2016
| | | | | | | | |
Face
Amount | | | | | Value | |
| |
| CORPORATE NOTES* — (Continued) | | | |
| | | | Industrial — 4.8% | |
| $ | 10,000,000 | | | Caterpillar Financial Services Corp.,
7.050% due 10/1/18 | | $ | 11,069,830 | |
| | 8,900,000 | | | General Electric Co.,
6.750% due 3/15/32 | | | 12,240,757 | |
| | | | | | | | |
| | | | | | | 23,310,587 | |
| | | | | | | | |
| |
| | | | Pharmaceuticals — 1.8% | |
| | 7,000,000 | | | Johnson & Johnson,
4.850% due 5/15/41 | | | 8,836,219 | |
| | | | | | | | |
| | | | | | | 8,836,219 | |
| | | | | | | | |
| |
| | | | Technology — 1.7% | |
| | 8,000,000 | | | Intel Corp.,
3.300% due 10/1/21 | | | 8,520,944 | |
| | | | | | | | |
| | | | | | | 8,520,944 | |
| | | | | | | | |
| | |
| | | | TOTAL CORPORATE NOTES
(Cost $185,690,437) | | | 191,159,551 | |
| | | | | | | | |
| |
| U.S. TREASURY NOTES/BONDS* — 16.8% | | | |
| | 6,000,000 | | | U.S. Treasury Bonds,
7.500% due 11/15/162 | | | 6,016,692 | |
| | 20,000,000 | | | U.S. Treasury Bonds,
6.250% due 8/15/23 | | | 26,029,680 | |
| | 5,000,000 | | | U.S. Treasury Bonds,
6.625% due 2/15/27 | | | 7,241,405 | |
| | 5,000,000 | | | U.S. Treasury Bonds,
3.125% due 11/15/41 | | | 5,560,350 | |
| | 15,000,000 | | | U.S. Treasury Notes,
1.250% due 10/31/18 | | | 15,106,050 | |
| | 7,000,000 | | | U.S. Treasury Notes,
1.375% due 11/30/18 | | | 7,068,089 | |
| | 14,500,000 | | | U.S. Treasury Notes,
1.250% due 10/31/19 | | | 14,603,080 | |
| | | | | | | | |
| | |
| | | | TOTAL U.S. TREASURY NOTES/BONDS
(Cost $80,665,304) | | | 81,625,346 | |
| | | | | | | | |
| |
| MUNICIPAL BONDS* — 1.2% | | | |
| | 6,035,000 | | | Mississippi, General Obligation Unlimited, Series C,
2.227% due 10/1/17 | | | 6,110,981 | |
| | | | | | | | |
| | |
| | | | TOTAL MUNICIPAL BONDS
(Cost $6,035,000) | | | 6,110,981 | |
| | | | | | | | |
| |
| REPURCHASE AGREEMENTS* — 1.5% | | | |
| | 7,178,355 | | | With Fixed Income Clearing Corp., dated 10/31/16, 0.01%, principal and interest in the amount of $7,178,356, due 11/1/16, (collateralized by a U.S. Treasury Bond with a par value of $6,690,000, coupon rate of 3.000%, due 5/15/45, market value of $7,325,550) | | | 7,178,355 | |
| | | | | | | | |
| | |
| | | | TOTAL REPURCHASE AGREEMENTS
(Cost $7,178,355) | | | 7,178,355 | |
| | | | | | | | |
See Notes to Financial Statements.
THE GLENMEDE FUND, INC.
Core Fixed Income Portfolio
SCHEDULE OF PORTFOLIO INVESTMENTS — (Continued)
October 31, 2016
| | | | | | | | |
| | |
| Shares | | | | | Value | |
|
| INVESTMENT OF SECURITY LENDING COLLATERAL* — 1.3% | |
| | 6,361,580 | | | State Street Navigator Securities Lending Government Money Market Portfolio | | $ | 6,361,580 | |
| | | | | | | | |
| | |
| | | | TOTAL INVESTMENT OF SECURITY LENDING COLLATERAL
(Cost $6,361,580) | | | 6,361,580 | |
| | | | | | | | |
| | | | | | | | | | |
| | |
TOTAL INVESTMENTS
(Cost $480,037,792)3 | | | 100.5 | % | | $ | 489,501,412 | |
| | |
LIABILITIES IN EXCESS OF OTHER ASSETS | | | (0.5 | ) | | | (2,629,643 | ) |
| | | | | | | | | | |
| | |
NET ASSETS | | | 100.0 | % | | $ | 486,871,769 | |
| | | | | | | | | | |
| * | Percentages indicated are based on net assets. |
| 1 | Represents current face amount at October 31, 2016. |
| 2 | Securities or partial securities on loan. See Note 1. |
| 3 | Aggregate cost for federal tax purposes was $480,037,792. |
See Notes to Financial Statements.
THE GLENMEDE FUND, INC.
Core Fixed Income Portfolio
SCHEDULE OF PORTFOLIO INVESTMENTS — (Concluded)
October 31, 2016
SECTOR DIVERSIFICATION
On October 31, 2016, sector diversification of the Portfolio was as follows:
| | | | | | | | |
| | | % of
Net Assets | | | Value | |
SECTOR: | | | | | | | | |
Corporate | | | 39.2 | % | | $ | 191,159,551 | |
Federal National Mortgage Association | | | 22.2 | | | | 107,979,931 | |
U.S. Treasury Notes/Bonds | | | 16.8 | | | | 81,625,346 | |
Federal Home Loan Mortgage Corporation | | | 12.6 | | | | 61,319,169 | |
Federal Home Loan Bank | | | 5.1 | | | | 24,747,582 | |
Municipal Bonds | | | 1.2 | | | | 6,110,981 | |
Government National Mortgage Association | | | 0.6 | | | | 3,018,917 | |
| | | | | | | | |
TOTAL | | | 97.7 | % | | $ | 475,961,477 | |
| | |
REPURCHASE AGREEMENTS | | | 1.5 | | | | 7,178,355 | |
| | |
INVESTMENTS OF SECURITY LENDING COLLATERAL | | | 1.3 | | | | 6,361,580 | |
| | | | | | | | |
TOTAL INVESTMENTS | | | 100.5 | % | | $ | 489,501,412 | |
| | | | | | | | |
See Notes to Financial Statements.
THE GLENMEDE FUND, INC.
Strategic Equity Portfolio
SCHEDULE OF PORTFOLIO INVESTMENTS
October 31, 2016
| | | | | | | | |
| Shares | | | | | Value | |
| |
| COMMON STOCKS* — 97.7% | | | |
| | | | Aerospace & Defense — 7.0% | | | |
| | 42,395 | | | Boeing Co. (The) | | $ | 6,038,320 | |
| | 46,110 | | | Raytheon Co. | | | 6,299,087 | |
| | | | | | | | |
| | | | | | | 12,337,407 | |
| | | | | | | | |
| | |
| | | | Banks — 8.6% | | | |
| | 92,220 | | | JPMorgan Chase & Co. | | | 6,387,157 | |
| | 52,165 | | | PNC Financial Services Group, Inc. (The) | | | 4,986,974 | |
| | 82,305 | | | Wells Fargo & Co. | | | 3,786,853 | |
| | | | | | | | |
| | | | | | | 15,160,984 | |
| | | | | | | | |
| | |
| | | | Beverages — 3.8% | | | |
| | 42,765 | | | Dr Pepper Snapple Group, Inc. | | | 3,754,339 | |
| | 28,505 | | | PepsiCo, Inc. | | | 3,055,736 | |
| | | | | | | | |
| | | | | | | 6,810,075 | |
| | | | | | | | |
| | |
| | | | Biotechnology — 3.6% | | | |
| | 10,710 | | | Biogen, Inc.1 | | | 3,000,728 | |
| | 45,685 | | | Gilead Sciences, Inc. | | | 3,363,786 | |
| | | | | | | | |
| | | | | | | 6,364,514 | |
| | | | | | | | |
| | |
| | | | Capital Markets — 3.9% | | | |
| | 147,110 | | | Invesco, Ltd. | | | 4,132,320 | |
| | 39,025 | | | Northern Trust Corp. | | | 2,826,190 | |
| | | | | | | | |
| | | | | | | 6,958,510 | |
| | | | | | | | |
| | |
| | | | Communications Equipment — 2.9% | | | |
| | 169,575 | | | Cisco Systems, Inc. | | | 5,202,561 | |
| | | | | | | | |
| | |
| | | | Consumer Finance — 3.1% | | | |
| | 26,820 | | | American Express Co. | | | 1,781,384 | |
| | 65,290 | | | Discover Financial Services | | | 3,677,786 | |
| | | | | | | | |
| | | | | | | 5,459,170 | |
| | | | | | | | |
| | |
| | | | Electrical Equipment — 1.9% | | | |
| | 78,100 | | | AMETEK, Inc. | | | 3,444,210 | |
| | | | | | | | |
| | |
| | | | Electronic Equipment, Instruments & Components — 2.1% | | | |
| | 56,385 | | | Amphenol Corp. — Class A | | | 3,717,463 | |
| | | | | | | | |
| | |
| | | | Energy Equipment & Services — 4.5% | | | |
| | 69,845 | | | Halliburton Co. | | | 3,212,870 | |
| | 59,870 | | | Schlumberger, Ltd. | | | 4,683,630 | |
| | | | | | | | |
| | | | | | | 7,896,500 | |
| | | | | | | | |
| | |
| | | | Food & Staples Retailing — 2.9% | | | |
| | 36,935 | | | Wal-Mart Stores, Inc. | | | 2,586,189 | |
| | 90,965 | | | Whole Foods Market, Inc. | | | 2,573,400 | |
| | | | | | | | |
| | | | | | | 5,159,589 | |
| | | | | | | | |
| | |
| | | | Food Products — 2.0% | | | |
| | 63,870 | | | Campbell Soup Co. | | | 3,470,696 | |
| | | | | | | | |
| | |
| | | | Health Care Equipment & Supplies — 4.8% | | | |
| | 69,525 | | | Baxter International, Inc. | | | 3,308,695 | |
| | 108,790 | | | Smith & Nephew PLC, Sponsored ADR | | | 3,182,108 | |
| | 25,135 | | | St Jude Medical, Inc. | | | 1,956,508 | |
| | | | | | | | |
| | | | | | | 8,447,311 | |
| | | | | | | | |
See Notes to Financial Statements.
THE GLENMEDE FUND, INC.
Strategic Equity Portfolio
SCHEDULE OF PORTFOLIO INVESTMENTS — (Continued)
October 31, 2016
| | | | | | | | |
| Shares | | | | | Value | |
| |
| COMMON STOCKS* — (Continued) | | | |
| | | | Health Care Providers & Services — 4.1% | | | |
| | 32,605 | | | Laboratory Corp. of America Holdings1 | | $ | 4,086,711 | |
| | 76,000 | | | Patterson Cos., Inc. | | | 3,245,960 | |
| | | | | | | | |
| | | | | | | 7,332,671 | |
| | | | | | | | |
| | |
| | | | Hotels, Restaurants & Leisure — 2.0% | | | |
| | 18,166 | | | Panera Bread Co. — Class A1,2 | | | 3,465,346 | |
| | | | | | | | |
| | |
| | | | Insurance — 2.0% | | | |
| | 28,530 | | | Chubb, Ltd. | | | 3,623,310 | |
| | | | | | | | |
| | |
| | | | Internet & Catalog Retail — 2.8% | | | |
| | 3,418 | | | Priceline Group, Inc. (The)1 | | | 5,038,918 | |
| | | | | | | | |
| | |
| | | | Internet Software & Services — 1.7% | | | |
| | 3,835 | | | Alphabet, Inc. — Class C1 | | | 3,008,711 | |
| | | | | | | | |
| | |
| | | | IT Services — 9.9% | | | |
| | 30,598 | | | Accenture PLC — Class A | | | 3,556,712 | |
| | 71,393 | | | Cognizant Technology Solutions Corp. — Class A1 | | | 3,666,031 | |
| | 31,560 | | | Gartner, Inc.1 | | | 2,715,422 | |
| | 57,675 | | | Global Payments, Inc. | | | 4,182,591 | |
| | 31,500 | | | Mastercard, Inc. — Class A | | | 3,371,130 | |
| | | | | | | | |
| | | | | | | 17,491,886 | |
| | | | | | | | |
| | |
| | | | Life Sciences Tools & Services — 2.0% | | | |
| | 25,433 | | | Waters Corp.1 | | | 3,538,748 | |
| | | | | | | | |
| | |
| | | | Machinery — 1.3% | | | |
| | 19,020 | | | Parker-Hannifin Corp. | | | 2,334,705 | |
| | | | | | | | |
| | |
| | | | Media — 2.3% | | | |
| | 51,470 | | | Omnicom Group, Inc. | | | 4,108,335 | |
| | | | | | | | |
| | |
| | | | Multi-line Retail — 3.4% | | | |
| | 46,290 | | | Dollar General Corp. | | | 3,198,176 | |
| | 36,795 | | | Dollar Tree, Inc.1 | | | 2,779,862 | |
| | | | | | | | |
| | | | | | | 5,978,038 | |
| | | | | | | | |
| | |
| | | | Oil, Gas & Consumable Fuels — 1.9% | | | |
| | 31,540 | | | Chevron Corp. | | | 3,303,815 | |
| | | | | | | | |
| | |
| | | | Pharmaceuticals — 2.6% | | | |
| | 60,310 | | | Abbott Laboratories | | | 2,366,564 | |
| | 29,220 | | | Eli Lilly & Co. | | | 2,157,605 | |
| | | | | | | | |
| | | | | | | 4,524,169 | |
| | | | | | | | |
| | |
| | | | Software — 2.9% | | | |
| | 132,865 | | | Oracle Corp. | | | 5,104,673 | |
| | | | | | | | |
| | |
| | | | Specialty Retail — 2.2% | | | |
| | 31,595 | | | Home Depot, Inc. | | | 3,854,906 | |
| | | | | | | | |
| | |
| | | | Technology Hardware, Storage & Peripherals — 4.3% | | | |
| | 66,390 | | | Apple, Inc. | | | 7,537,921 | |
| | | | | | | | |
| | |
| | | | Trading Companies & Distributors — 1.2% | | | |
| | 10,480 | | | WW Grainger, Inc. | | | 2,181,098 | |
| | | | | | | | |
| | |
| | | | TOTAL COMMON STOCKS
(Cost $123,914,673) | | | 172,856,240 | |
| | | | | | | | |
See Notes to Financial Statements.
THE GLENMEDE FUND, INC.
Strategic Equity Portfolio
SCHEDULE OF PORTFOLIO INVESTMENTS — (Continued)
October 31, 2016
| | | | | | | | | | | | |
Face
Amount | | | | | | | | Value | |
| |
| REPURCHASE AGREEMENT* — 2.2% | | | |
| $ | 3,785,105 | | | | | | | With Fixed Income Clearing Corp., dated 10/31/16, 0.01%, principal and interest in the amount of $3,785,106, due 11/1/16, (collateralized by a U.S. Treasury Bond with a par value of $3,530,000, coupon rate of 3.000%, due 5/15/45, market value of $3,865,350) | | $ | 3,785,105 | |
| | | | | | | | | | | | |
| | | |
| | | | | | | | TOTAL REPURCHASE AGREEMENT
(Cost $3,785,105) | | | 3,785,105 | |
| | | | | | | | | | | | |
| | | |
| Shares | | | | | | | | | |
|
| INVESTMENT OF SECURITY LENDING COLLATERAL* — 2.0% | |
| | 3,551,054 | | | | | | | State Street Navigator Securities Lending Government Money Market Portfolio | | | 3,551,054 | |
| | | | | | | | | | | | |
| | | |
| | | | | | | | TOTAL INVESTMENT OF SECURITY LENDING COLLATERAL
(Cost $3,551,054) | | | 3,551,054 | |
| | | | | | | | | | | | |
| | | | | | | | | | |
| | |
TOTAL INVESTMENTS
(Cost $131,250,832)3 | | | 101.9 | % | | $ | 180,192,399 | |
| | |
LIABILITIES IN EXCESS OF OTHER ASSETS | | | (1.9 | ) | | | (3,328,442 | ) |
| | | | | | | | | | |
| | |
NET ASSETS | | | 100.0 | % | | $ | 176,863,957 | |
| | | | | | | | | | |
| * | Percentages indicated are based on net assets. |
| 1 | Non income-producing security. |
| 2 | Securities or partial securities on loan. See Note 1. |
| 3 | Aggregate cost for federal tax purposes was $131,280,568. |
Abbreviations:
ADR — American Depositary Receipt
See Notes to Financial Statements.
THE GLENMEDE FUND, INC.
Strategic Equity Portfolio
SCHEDULE OF PORTFOLIO INVESTMENTS — (Concluded)
October 31, 2016
INDUSTRY DIVERSIFICATION
On October 31, 2016, industry diversification of the Portfolio was as follows:
| | | | | | | | |
| | | % of
Net Assets | | | Value | |
INDUSTRIES: | | | | | | | | |
IT Services | | | 9.9 | % | | $ | 17,491,886 | |
Banks | | | 8.6 | | | | 15,160,984 | |
Aerospace & Defense | | | 7.0 | | | | 12,337,407 | |
Health Care Equipment & Supplies | | | 4.8 | | | | 8,447,311 | |
Energy Equipment & Services | | | 4.5 | | | | 7,896,500 | |
Technology Hardware, Storage & Peripherals | | | 4.3 | | | | 7,537,921 | |
Health Care Providers & Services | | | 4.1 | | | | 7,332,671 | |
Capital Markets | | | 3.9 | | | | 6,958,510 | |
Beverages | | | 3.8 | | | | 6,810,075 | |
Biotechnology | | | 3.6 | | | | 6,364,514 | |
Multi-line Retail | | | 3.4 | | | | 5,978,038 | |
Consumer Finance | | | 3.1 | | | | 5,459,170 | |
Communications Equipment | | | 2.9 | | | | 5,202,561 | |
Food & Staples Retailing | | | 2.9 | | | | 5,159,589 | |
Software | | | 2.9 | | | | 5,104,673 | |
Internet & Catalog Retail | | | 2.8 | | | | 5,038,918 | |
Pharmaceuticals | | | 2.6 | | | | 4,524,169 | |
Media | | | 2.3 | | | | 4,108,335 | |
Specialty Retail | | | 2.2 | | | | 3,854,906 | |
Electronic Equipment, Instruments & Components | | | 2.1 | | | | 3,717,463 | |
Insurance | | | 2.0 | | | | 3,623,310 | |
Life Sciences Tools & Services | | | 2.0 | | | | 3,538,748 | |
Food Products | | | 2.0 | | | | 3,470,696 | |
Hotels, Restaurants & Leisure | | | 2.0 | | | | 3,465,346 | |
Electrical Equipment | | | 1.9 | | | | 3,444,210 | |
Oil, Gas & Consumable Fuels | | | 1.9 | | | | 3,303,815 | |
Internet Software & Services | | | 1.7 | | | | 3,008,711 | |
Machinery | | | 1.3 | | | | 2,334,705 | |
Trading Companies & Distributors | | | 1.2 | | | | 2,181,098 | |
| | | | | | | | |
TOTAL COMMON STOCKS | | | 97.7 | % | | $ | 172,856,240 | |
| | |
REPURCHASE AGREEMENT | | | 2.2 | | | | 3,785,105 | |
| | |
INVESTMENT OF SECURITY LENDING COLLATERAL | | | 2.0 | | | | 3,551,054 | |
| | | | | | | | |
TOTAL INVESTMENTS | | | 101.9 | % | | $ | 180,192,399 | |
| | | | | | | | |
See Notes to Financial Statements.
THE GLENMEDE FUND, INC.
Small Cap Equity Portfolio
SCHEDULE OF PORTFOLIO INVESTMENTS
October 31, 2016
| | | | | | | | |
| Shares | | | | | Value | |
| |
| COMMON STOCKS* — 96.8% | | | |
| | | | Aerospace & Defense — 1.5% | | | |
| | 521,740 | | | Orbital ATK, Inc. | | $ | 38,796,586 | |
| | | | | | | | |
| | |
| | | | Airlines — 0.6% | | | |
| | 497,063 | | | Skywest, Inc. | | | 14,986,449 | |
| | | | | | | | |
| | |
| | | | Apparel Retailers — 1.1% | | | |
| | 1,407,042 | | | Wolverine World Wide, Inc. | | | 30,040,347 | |
| | | | | | | | |
| | |
| | | | Automotive — 2.0% | | | |
| | 1,358,405 | | | American Axle & Manufacturing Holdings, Inc.1 | | | 24,342,617 | |
| | 366,628 | | | Thor Industries, Inc. | | | 29,077,267 | |
| | | | | | | | |
| | | | | | | 53,419,884 | |
| | | | | | | | |
| | |
| | | | Banking — 14.1% | | | |
| | 620,601 | | | Chemical Financial Corp. | | | 26,654,813 | |
| | 506,462 | | | Eagle Bancorp, Inc.1 | | | 24,892,607 | |
| | 354,878 | | | Euronet Worldwide, Inc.1 | | | 28,230,545 | |
| | 647,476 | | | FCB Financial Holdings, Inc. — Class A1 | | | 24,150,855 | |
| | 2,243,249 | | | FNB Corp. | | | 29,319,265 | |
| | 1,470,038 | | | Great Western Bancorp, Inc. | | | 47,394,025 | |
| | 1,584,022 | | | Home BancShares, Inc. | | | 34,072,313 | |
| | 1,629,853 | | | Hope Bancorp, Inc. | | | 26,305,827 | |
| | 1,659,229 | | | Umpqua Holdings Corp. | | | 25,353,019 | |
| | 479,437 | | | WesBanco, Inc. | | | 15,778,272 | |
| | 1,367,806 | | | Western Alliance Bancorp1 | | | 51,101,232 | |
| | 693,303 | | | Wintrust Financial Corp. | | | 37,403,697 | |
| | | | | | | | |
| | | | | | | 370,656,470 | |
| | | | | | | | |
| | |
| | | | Building Materials — 2.4% | | | |
| | 458,286 | | | EMCOR Group, Inc. | | | 27,707,972 | |
| | 380,729 | | | ScanSource, Inc.1 | | | 13,325,515 | |
| | 453,585 | | | US Concrete, Inc.1 | | | 22,633,891 | |
| | | | | | | | |
| | | | | | | 63,667,378 | |
| | | | | | | | |
| | |
| | | | Chemicals — 2.3% | | | |
| | 1,569,922 | | | Huntsman Corp. | | | 26,610,178 | |
| | 641,601 | | | Trinseo SA | | | 33,651,972 | |
| | | | | | | | |
| | | | | | | 60,262,150 | |
| | | | | | | | |
| | |
| | | | Commercial Services — 6.6% | | | |
| | 801,412 | | | AMN Healthcare Services, Inc.1 | | | 26,286,313 | |
| | 647,476 | | | Cardtronics PLC — Class A1 | | | 32,373,800 | |
| | 839,014 | | | Grand Canyon Education, Inc.1 | | | 36,614,571 | |
| | 965,925 | | | Korn/Ferry International | | | 19,695,211 | |
| | 666,278 | | | MAXIMUS, Inc. | | | 34,686,433 | |
| | 735,606 | | | Omnicell, Inc.1 | | | 23,999,146 | |
| | | | | | | | |
| | | | | | | 173,655,474 | |
| | | | | | | | |
| | |
| | | | Communications — 2.9% | | | |
| | 1,151,590 | | | ARRIS International PLC1 | | | 31,991,170 | |
| | 641,601 | | | Fabrinet1 | | | 24,355,174 | |
| | 2,364,283 | | | Iridium Communications, Inc.1,2 | | | 19,268,907 | |
| | | | | | | | |
| | | | | | | 75,615,251 | |
| | | | | | | | |
| | |
| | | | Computer Software & Processing — 0.8% | | | |
| | 1,353,704 | | | Web.com Group, Inc.1 | | | 21,794,634 | |
| | | | | | | | |
| | |
| | | | Computers & Information — 2.8% | | | |
| | 741,483 | | | Electronics for Imaging, Inc.1 | | | 31,535,272 | |
| | 1,836,667 | | | Fitbit, Inc. — Class A1,2 | | | 24,354,204 | |
| | 1,230,319 | | | NeoPhotonics Corp.1 | | | 17,224,466 | |
| | | | | | | | |
| | | | | | | 73,113,942 | |
| | | | | | | | |
See Notes to Financial Statements.
THE GLENMEDE FUND, INC.
Small Cap Equity Portfolio
SCHEDULE OF PORTFOLIO INVESTMENTS — (Continued)
October 31, 2016
| | | | | | | | |
| Shares | | | | | Value | |
| |
| COMMON STOCKS* — (Continued) | | | |
| | | | Consumer Services — 1.2% | | | |
| | 1,740,310 | | | Boyd Gaming Corp.1 | | $ | 31,081,937 | |
| | | | | | | | |
| | |
| | | | Electrical Equipment — 0.9% | | | |
| | 370,154 | | | EnerSys | | | 24,108,130 | |
| | | | | | | | |
| | |
| | | | Electronics — 6.5% | | | |
| | 458,286 | | | Cirrus Logic, Inc.1 | | | 24,738,278 | |
| | 1,628,676 | | | Integrated Device Technology, Inc.1 | | | 33,729,880 | |
| | 722,679 | | | MaxLinear, Inc. — Class A1 | | | 13,521,324 | |
| | 783,784 | | | Methode Electronics, Inc. | | | 24,454,061 | |
| | 893,069 | | | Microsemi Corp.1 | | | 37,624,997 | |
| | 1,025,854 | | | Tessera Technologies, Inc. | | | 38,059,184 | |
| | | | | | | | |
| | | | | | | 172,127,724 | |
| | | | | | | | |
| | |
| | | | Entertainment & Leisure — 1.5% | | | |
| | 1,008,229 | | | Cinemark Holdings, Inc. | | | 40,127,514 | |
| | | | | | | | |
| | |
| | | | Financial Services — 2.0% | | | |
| | 370,154 | | | EPR Properties | | | 26,917,599 | |
| | 1,008,229 | | | Kite Realty Group Trust | | | 25,135,149 | |
| | | | | | | | |
| | | | | | | 52,052,748 | |
| | | | | | | | |
| | |
| | | | Forest Products & Paper — 2.6% | | | |
| | 857,817 | | | Boise Cascade Co.1 | | | 16,512,977 | |
| | 184,058 | | | Drew Industries, Inc. | | | 16,482,394 | |
| | 2,931,190 | | | Graphic Packaging Holding Co. | | | 36,639,875 | |
| | | | | | | | |
| | | | | | | 69,635,246 | |
| | | | | | | | |
| | |
| | | | Health Care Providers — 3.3% | | | |
| | 926,900 | | | Acadia Healthcare Co., Inc.1,2 | | | 33,331,324 | |
| | 606,182 | | | Team Health Holdings, Inc.1 | | | 25,974,899 | |
| | 428,746 | | | VCA, Inc.1 | | | 26,350,729 | |
| | | | | | | | |
| | | | | | | 85,656,952 | |
| | | | | | | | |
| | |
| | | | Heavy Construction — 3.3% | | | |
| | 663,927 | | | Granite Construction, Inc. | | | 32,638,651 | |
| | 1,037,607 | | | Primoris Services Corp. | | | 20,783,268 | |
| | 2,302,020 | | | TRI Pointe Group, Inc.1 | | | 24,930,877 | |
| | 512,339 | | | Tutor Perini Corp.1 | | | 9,760,058 | |
| | | | | | | | |
| | | | | | | 88,112,854 | |
| | | | | | | | |
| | |
| | | | Heavy Machinery — 2.3% | | | |
| | 479,011 | | | Dycom Industries, Inc.1 | | | 36,850,316 | |
| | 1,462,223 | | | Entegris, Inc.1 | | | 23,249,346 | |
| | | | | | | | |
| | | | | | | 60,099,662 | |
| | | | | | | | |
| | |
| | | | Home Construction, Furnishings & Appliances — 2.4% | | | |
| | 876,691 | | | CalAtlantic Group, Inc. | | | 28,334,653 | |
| | 484,139 | | | Herman Miller, Inc. | | | 13,459,064 | |
| | 856,641 | | | La-Z-Boy, Inc. | | | 20,045,400 | |
| | | | | | | | |
| | | | | | | 61,839,117 | |
| | | | | | | | |
| | |
| | | | Household Products — 1.1% | | | |
| | 720,330 | | | Apogee Enterprises, Inc. | | | 29,353,448 | |
| | | | | | | | |
| | |
| | | | Insurance — 4.3% | | | |
| | 1,659,229 | | | American Equity Investment Life Holding Co. | | | 29,749,976 | |
| | 445,360 | | | Horace Mann Educators Corp. | | | 16,010,692 | |
| | 480,110 | | | Molina Healthcare, Inc.1 | | | 26,122,785 | |
| | 3,057,586 | | | Radian Group, Inc. | | | 41,552,594 | |
| | | | | | | | |
| | | | | | | 113,436,047 | |
| | | | | | | | |
See Notes to Financial Statements.
THE GLENMEDE FUND, INC.
Small Cap Equity Portfolio
SCHEDULE OF PORTFOLIO INVESTMENTS — (Continued)
October 31, 2016
| | | | | | | | |
| Shares | | | | | Value | |
| |
| COMMON STOCKS* — (Continued) | | | |
| | | | Media — Broadcasting & Publishing — 1.9% | | | |
| | 397,180 | | | Ryman Hospitality Properties, Inc. | | $ | 20,025,816 | |
| | 1,184,491 | | | Sinclair Broadcast Group, Inc. — Class A | | | 29,730,724 | |
| | | | | | | | |
| | | | | | | 49,756,540 | |
| | | | | | | | |
| | |
| | | | Medical Supplies — 4.8% | | | |
| | 277,322 | | | Coherent, Inc.1 | | | 28,874,766 | |
| | 317,275 | | | Cynosure, Inc. — Class A1 | | | 13,531,779 | |
| | 1,297,302 | | | Depomed, Inc.1 | | | 29,007,673 | |
| | 1,300,825 | | | Globus Medical, Inc. — Class A1 | | | 28,787,257 | |
| | 196,240 | | | ICU Medical, Inc.1 | | | 27,336,232 | |
| | | | | | | | |
| | | | | | | 127,537,707 | |
| | | | | | | | |
| | |
| | | | Miscellaneous — 1.0% | | | |
| | 1,223,270 | | | Columbia Property Trust, Inc. | | | 25,786,532 | |
| | | | | | | | |
| | |
| | | | Oil & Gas — 5.8% | | | |
| | 716,806 | | | Callon Petroleum Co.1 | | | 9,311,310 | |
| | 888,368 | | | Carrizo Oil & Gas, Inc.1 | | | 30,053,489 | |
| | 230,745 | | | Chesapeake Utilities Corp. | | | 14,779,217 | |
| | 783,784 | | | Delek US Holdings, Inc. | | | 13,245,950 | |
| | 1,166,866 | | | Gulfport Energy Corp.1 | | | 28,133,139 | |
| | 1,673,329 | | | Headwaters, Inc.1 | | | 27,442,596 | |
| | 4,394,840 | | | Synergy Resources Corp.1,2 | | | 30,060,706 | |
| | | | | | | | |
| | | | | | | 153,026,407 | |
| | | | | | | | |
| | |
| | | | Pharmaceuticals — 4.3% | | | |
| | 770,911 | | | AMAG Pharmaceuticals, Inc.1 | | | 19,812,413 | |
| | 242,068 | | | ANI Pharmaceuticals, Inc.1,2 | | | 14,451,460 | |
| | 1,031,730 | | | Emergent BioSolutions, Inc.1 | | | 27,567,825 | |
| | 1,790,839 | | | Horizon Pharma PLC1 | | | 29,942,828 | |
| | 1,113,109 | | | Supernus Pharmaceuticals, Inc.1 | | | 22,039,558 | |
| | | | | | | | |
| | | | | | | 113,814,084 | |
| | | | | | | | |
| | |
| | | | Real Estate — 1.2% | | | |
| | 1,224,444 | | | Hilltop Holdings, Inc.1 | | | 30,243,767 | |
| | | | | | | | |
| | |
| | | | Real Estate Investment Trusts — 1.4% | | | |
| | 1,739,135 | | | Ashford Hospitality Trust, Inc. | | | 10,104,374 | |
| | 633,374 | | | DuPont Fabros Technology, Inc. | | | 25,847,993 | |
| | | | | | | | |
| | | | | | | 35,952,367 | |
| | | | | | | | |
| | |
| | | | Restaurants — 1.4% | | | |
| | 2,070,145 | | | Bloomin’ Brands, Inc. | | | 35,813,509 | |
| | | | | | | | |
| | |
| | | | Retailers — 2.3% | | | |
| | 579,319 | | | Big Lots, Inc. | | | 25,142,445 | |
| | 364,279 | | | Stamps.com, Inc.1 | | | 35,535,416 | |
| | | | | | | | |
| | | | | | | 60,677,861 | |
| | | | | | | | |
| | |
| | | | Telecommunications — 1.4% | | | |
| | 528,442 | | | j2 Global, Inc. | | | 37,598,648 | |
| | | | | | | | |
| | |
| | | | Textiles, Clothing & Fabrics — 0.9% | | | |
| | 395,745 | | | Oxford Industries, Inc. | | | 24,821,126 | |
| | | | | | | | |
| | |
| | | | Transportation — 1.9% | | | |
| | 564,859 | | | Matson, Inc. | | | 22,560,468 | |
| | 1,266,747 | | | Swift Transportation Co.1 | | | 28,349,797 | |
| | | | | | | | |
| | | | | | | 50,910,265 | |
| | | | | | | | |
| | |
| | | | TOTAL COMMON STOCKS
(Cost $2,392,955,629) | | | 2,549,578,757 | |
| | | | | | | | |
See Notes to Financial Statements.
THE GLENMEDE FUND, INC.
Small Cap Equity Portfolio
SCHEDULE OF PORTFOLIO INVESTMENTS — (Continued)
October 31, 2016
| | | | | | | | |
Face
Amount | | | | | Value | |
| |
| REPURCHASE AGREEMENT* — 3.0% | | | |
| $ | 78,969,763 | | | With Fixed Income Clearing Corp., dated 10/31/16, 0.01%, principal and interest in the amount of $78,969,785, due 11/1/16, (collateralized by a U.S. Treasury Bond with a par value of $73,565,000, coupon rate of 3.000%, due 5/15/45, market value of $80,553,675) | | $ | 78,969,763 | |
| | | | | | | | |
| | |
| | | | TOTAL REPURCHASE AGREEMENT
(Cost $78,969,763) | | | 78,969,763 | |
| | | | | | | | |
| | |
| Shares | | | | | | |
|
| INVESTMENT OF SECURITY LENDING COLLATERAL* — 1.4% | |
| | 36,102,827 | | | State Street Navigator Securities Lending Government Money Market Portfolio | | | 36,102,827 | |
| | | | | | | | |
| | |
| | | | TOTAL INVESTMENT OF SECURITY LENDING COLLATERAL
(Cost $36,102,827) | | | 36,102,827 | |
| | | | | | | | |
| | | | | | | | | | |
| | |
TOTAL INVESTMENTS
(Cost $2,508,028,219)3 | | | 101.2 | % | | $ | 2,664,651,347 | |
| | |
LIABILITIES IN EXCESS OF OTHER ASSETS | | | (1.2 | ) | | | (32,739,398 | ) |
| | | | | | | | | | |
| | |
NET ASSETS | | | 100.0 | % | | $ | 2,631,911,949 | |
| | | | | | | | | | |
| * | Percentages indicated are based on net assets. |
| 1 | Non income-producing security. |
| 2 | Securities or partial securities on loan. See Note 1. |
| 3 | Aggregate cost for federal tax purposes was $2,520,762,003. |
See Notes to Financial Statements.
THE GLENMEDE FUND, INC.
Small Cap Equity Portfolio
SCHEDULE OF PORTFOLIO INVESTMENTS — (Concluded)
October 31, 2016
INDUSTRY DIVERSIFICATION
On October 31, 2016, industry diversification of the Portfolio was as follows:
| | | | | | | | |
| | | % of
Net Assets | | | Value | |
INDUSTRIES: | | | | | | | | |
Banking | | | 14.1 | % | | $ | 370,656,470 | |
Commercial Services | | | 6.6 | | | | 173,655,474 | |
Electronics | | | 6.5 | | | | 172,127,724 | |
Oil & Gas | | | 5.8 | | | | 153,026,407 | |
Medical Supplies | | | 4.8 | | | | 127,537,707 | |
Pharmaceuticals | | | 4.3 | | | | 113,814,084 | |
Insurance | | | 4.3 | | | | 113,436,047 | |
Heavy Construction | | | 3.3 | | | | 88,112,854 | |
Health Care Providers | | | 3.3 | | | | 85,656,952 | |
Communications | | | 2.9 | | | | 75,615,251 | |
Computers & Information | | | 2.8 | | | | 73,113,942 | |
Forest Products & Paper | | | 2.6 | | | | 69,635,246 | |
Building Materials | | | 2.4 | | | | 63,667,378 | |
Home Construction, Furnishings & Appliances | | | 2.4 | | | | 61,839,117 | |
Retailers | | | 2.3 | | | | 60,677,861 | |
Chemicals | | | 2.3 | | | | 60,262,150 | |
Heavy Machinery | | | 2.3 | | | | 60,099,662 | |
Automotive | | | 2.0 | | | | 53,419,884 | |
Financial Services | | | 2.0 | | | | 52,052,748 | |
Transportation | | | 1.9 | | | | 50,910,265 | |
Media — Broadcasting & Publishing | | | 1.9 | | | | 49,756,540 | |
Entertainment & Leisure | | | 1.5 | | | | 40,127,514 | |
Aerospace & Defense | | | 1.5 | | | | 38,796,586 | |
Telecommunications | | | 1.4 | | | | 37,598,648 | |
Real Estate Investment Trusts | | | 1.4 | | | | 35,952,367 | |
Restaurants | | | 1.4 | | | | 35,813,509 | |
Consumer Services | | | 1.2 | | | | 31,081,937 | |
Real Estate | | | 1.2 | | | | 30,243,767 | |
Apparel Retailers | | | 1.1 | | | | 30,040,347 | |
Household Products | | | 1.1 | | | | 29,353,448 | |
Miscellaneous | | | 1.0 | | | | 25,786,532 | |
Textiles, Clothing & Fabrics | | | 0.9 | | | | 24,821,126 | |
Electrical Equipment | | | 0.9 | | | | 24,108,130 | |
Computer Software & Processing | | | 0.8 | | | | 21,794,634 | |
Airlines | | | 0.6 | | | | 14,986,449 | |
| | | | | | | | |
TOTAL COMMON STOCKS | | | 96.8 | % | | $ | 2,549,578,757 | |
| | |
REPURCHASE AGREEMENTS | | | 3.0 | | | | 78,969,763 | |
| | |
INVESTMENTS OF SECURITY LENDING COLLATERAL | | | 1.4 | | | | 36,102,827 | |
| | | | | | | | |
TOTAL INVESTMENTS | | | 101.2 | % | | $ | 2,664,651,347 | |
| | | | | | | | |
See Notes to Financial Statements.
THE GLENMEDE FUND, INC.
Mid Cap Equity Portfolio
SCHEDULE OF PORTFOLIO INVESTMENTS
October 31, 2016
| | | | | | | | |
| Shares | | | | | Value | |
| |
| COMMON STOCKS* — 98.8% | | | |
| | | | Advertising — 2.7% | | | |
| | 14,083 | | | Interpublic Group of Cos., Inc. (The) | | $ | 315,318 | |
| | 7,823 | | | Outfront Media, Inc. | | | 168,273 | |
| | | | | | | | |
| | | | | | | 483,591 | |
| | | | | | | | |
| |
| | | | Airlines — 1.4% | |
| | 14,196 | | | JetBlue Airways Corp.1 | | | 248,146 | |
| | | | | | | | |
| |
| | | | Automotive — 3.2% | |
| | 15,687 | | | Gentex Corp. | | | 265,267 | |
| | 3,924 | | | Thor Industries, Inc. | | | 311,213 | |
| | | | | | | | |
| | | | | | | 576,480 | |
| | | | | | | | |
| |
| | | | Banking — 10.3% | |
| | 9,580 | | | East West Bancorp, Inc. | | | 378,506 | |
| | 41,589 | | | Huntington Bancshares, Inc. | | | 440,843 | |
| | 9,555 | | | PacWest Bancorp | | | 414,591 | |
| | 5,084 | | | Prosperity Bancshares, Inc. | | | 282,010 | |
| | 22,309 | | | Umpqua Holdings Corp. | | | 340,882 | |
| | | | | | | | |
| | | | | | | 1,856,832 | |
| | | | | | | | |
| |
| | | | Chemicals — 1.6% | |
| | 6,437 | | | Berry Plastics Group, Inc.1 | | | 281,619 | |
| | | | | | | | |
| |
| | | | Commercial Services — 7.7% | |
| | 9,032 | | | AECOM(1) | | | 251,541 | |
| | 4,270 | | | Fluor Corp. | | | 221,997 | |
| | 3,964 | | | Global Payments, Inc. | | | 287,469 | |
| | 5,237 | | | Jacobs Engineering Group, Inc.1 | | | 270,125 | |
| | 6,139 | | | Vantiv, Inc. — Class A1 | | | 358,272 | |
| | | | | | | | |
| | | | | | | 1,389,404 | |
| | | | | | | | |
| |
| | | | Communications — 7.9% | |
| | 14,406 | | | ARRIS International PLC1 | | | 400,199 | |
| | 15,703 | | | Ciena Corp.1 | | | 304,324 | |
| | 10,998 | | | CommScope Holding Co., Inc.1 | | | 335,989 | |
| | 4,230 | | | Harris Corp. | | | 377,358 | |
| | | | | | | | |
| | | | | | | 1,417,870 | |
| | | | | | | | |
| |
| | | | Computer Software & Processing — 6.0% | |
| | 6,695 | | | Amdocs, Ltd. | | | 391,323 | |
| | 5,809 | | | Deluxe Corp. | | | 355,511 | |
| | 2,457 | | | F5 Networks, Inc.1 | | | 339,582 | |
| | | | | | | | |
| | | | | | | 1,086,416 | |
| | | | | | | | |
| |
| | | | Computers & Information — 1.5% | |
| | 20,408 | | | Fitbit, Inc. — Class A1,2 | | | 270,610 | |
| | | | | | | | |
| |
| | | | Containers & Packaging — 2.1% | |
| | 7,098 | | | Crown Holdings, Inc.1 | | | 385,066 | |
| | | | | | | | |
| |
| | | | Electric Utilities — 1.2% | |
| | 6,655 | | | OGE Energy Corp. | | | 206,571 | |
| | | | | | | | |
| |
| | | | Electronics — 4.6% | |
| | 4,681 | | | Arrow Electronics, Inc.1 | | | 286,103 | |
| | 13,197 | | | Integrated Device Technology, Inc.1 | | | 273,310 | |
| | 4,802 | | | Qorvo, Inc.1 | | | 267,231 | |
| | | | | | | | |
| | | | | | | 826,644 | |
| | | | | | | | |
| |
| | | | Entertainment & Leisure — 1.0% | |
| | 5,624 | | | Gaming and Leisure Properties, Inc. | | | 184,636 | |
| | | | | | | | |
See Notes to Financial Statements.
THE GLENMEDE FUND, INC.
Mid Cap Equity Portfolio
SCHEDULE OF PORTFOLIO INVESTMENTS — (Continued)
October 31, 2016
| | | | | | | | |
| Shares | | | | | Value | |
| |
| COMMON STOCKS* — (Continued) | | | |
| | | | Financial Services — 2.8% | |
| | 6,647 | | | Corporate Office Properties Trust | | $ | 177,408 | |
| | 3,456 | | | Digital Realty Trust, Inc. | | | 322,894 | |
| | | | | | | | |
| | | | | | | 500,302 | |
| | | | | | | | |
| |
| | | | Forest Products & Paper — 2.0% | |
| | 11,425 | | | Masco Corp. | | | 352,804 | |
| | | | | | | | |
| |
| | | | Health Care Providers — 1.7% | |
| | 5,019 | | | Amsurg Corp.1 | | | 299,885 | |
| | | | | | | | |
| |
| | | | Heavy Construction — 1.8% | |
| | 17,322 | | | PulteGroup, Inc. | | | 322,189 | |
| | | | | | | | |
| |
| | | | Heavy Machinery — 3.7% | |
| | 11,312 | | | FMC Technologies, Inc.1 | | | 365,038 | |
| | 8,564 | | | ITT, Inc. | | | 301,624 | |
| | | | | | | | |
| | | | | | | 666,662 | |
| | | | | | | | |
| |
| | | | Industrial — 1.8% | |
| | 4,786 | | | Crane Co. | | | 325,496 | |
| | | | | | | | |
| |
| | | | Insurance — 10.6% | |
| | 5,334 | | | Centene Corp.1 | | | 333,268 | |
| | 8,347 | | | Lincoln National Corp. | | | 409,754 | |
| | 60,346 | | | MGIC Investment Corp.1 | | | 492,423 | |
| | 21,816 | | | Old Republic International Corp. | | | 367,818 | |
| | 10,361 | | | Voya Financial, Inc. | | | 316,529 | |
| | | | | | | | |
| | | | | | | 1,919,792 | |
| | | | | | | | |
| |
| | | | Media — Broadcasting & Publishing — 2.2% | |
| | 2,876 | | | Scripps Networks Interactive, Inc. — Class A | | | 185,099 | |
| | 10,909 | | | TEGNA, Inc. | | | 214,035 | |
| | | | | | | | |
| | | | | | | 399,134 | |
| | | | | | | | |
| |
| | | | Medical Supplies — 1.7% | |
| | 8,581 | | | Hologic, Inc.1 | | | 309,002 | |
| | | | | | | | |
| |
| | | | Metals & Mining — 3.7% | |
| | 5,600 | | | Belden, Inc. | | | 362,936 | |
| | 11,175 | | | Steel Dynamics, Inc. | | | 306,865 | |
| | | | | | | | |
| | | | | | | 669,801 | |
| | | | | | | | |
| |
| | | | Oil & Gas — 3.5% | |
| | 18,595 | | | Antero Resources Corp.1 | | | 492,210 | |
| | 58,952 | | | Denbury Resources, Inc.1,2 | | | 140,895 | |
| | | | | | | | |
| | | | | | | 633,105 | |
| | | | | | | | |
| |
| | | | Pharmaceuticals — 1.2% | |
| | 9,346 | | | Akorn, Inc.1 | | | 223,837 | |
| | | | | | | | |
| |
| | | | Real Estate — 1.0% | |
| | 8,266 | | | Forest City Realty Trust, Inc. — Class A | | | 178,463 | |
| | | | | | | | |
| |
| | | | Restaurants — 1.5% | |
| | 4,238 | | | Darden Restaurants, Inc. | | | 274,580 | |
| | | | | | | | |
| |
| | | | Retailers — 1.8% | |
| | 4,939 | | | Foot Locker, Inc. | | | 329,777 | |
| | | | | | | | |
| |
| | | | Textiles, Clothing & Fabrics — 2.1% | |
| | 8,613 | | | Hanesbrands, Inc. | | | 221,354 | |
| | 7,863 | | | Skechers U.S.A., Inc. — Class A1 | | | 165,359 | |
| | | | | | | | |
| | | | | | | 386,713 | |
| | | | | | | | |
See Notes to Financial Statements.
THE GLENMEDE FUND, INC.
Mid Cap Equity Portfolio
SCHEDULE OF PORTFOLIO INVESTMENTS — (Continued)
October 31, 2016
| | | | | | | | |
| Shares | | | | | Value | |
| |
| COMMON STOCKS* — (Continued) | | | |
| | | | Transportation — 4.5% | |
| | 1,684 | | | Huntington Ingalls Industries, Inc. | | $ | 271,730 | |
| | 3,827 | | | Old Dominion Freight Line, Inc.1 | | | 285,801 | |
| | 3,384 | | | Wabtec Corp. | | | 261,618 | |
| | | | | | | | |
| | | | | | | 819,149 | |
| | | | | | | | |
| | |
| | | | TOTAL COMMON STOCKS
(Cost $16,942,862) | | | 17,824,576 | |
| | | | | | | | |
| | |
Face
Amount | | | | | | |
| |
| REPURCHASE AGREEMENT* — 1.7% | | | |
| $ | 311,752 | | | With Fixed Income Clearing Corp., dated 10/31/16, 0.01%, principal and interest in the amount of $311,752, due 11/1/16, (collateralized by a U.S. Treasury Bond with a par value of $325,000, coupon rate of 2.500%, due 2/15/46, market value of $319,313) | | | 311,752 | |
| | | | | | | | |
| | |
| | | | TOTAL REPURCHASE AGREEMENT
(Cost $311,752) | | | 311,752 | |
| | | | | | | | |
| | |
| Shares | | | | | | |
| |
| INVESTMENT OF SECURITY LENDING COLLATERAL* — 2.5% | | | |
| | 446,056 | | | State Street Navigator Securities Lending Government Money Market Portfolio | | | 446,056 | |
| | | | | | | | |
| | |
| | | | TOTAL INVESTMENT OF SECURITY LENDING COLLATERAL
(Cost $446,056) | | | 446,056 | |
| | | | | | | | |
| | | | | | | | | | |
| | |
TOTAL INVESTMENTS
(Cost $17,700,670)3 | | | 103.0 | % | | $ | 18,582,384 | |
| | |
LIABILITIES IN EXCESS OF OTHER ASSETS | | | (3.0 | ) | | | (533,840 | ) |
| | | | | | | | | | |
| | |
NET ASSETS | | | 100.0 | % | | $ | 18,048,544 | |
| | | | | | | | | | |
| * | Percentages indicated are based on net assets. |
| 1 | Non income-producing security. |
| 2 | Securities or partial securities on loan. See Note 1. |
| 3 | Aggregate cost for federal tax purposes was $17,823,729. |
See Notes to Financial Statements.
THE GLENMEDE FUND, INC.
Mid Cap Equity Portfolio
SCHEDULE OF PORTFOLIO INVESTMENTS — (Concluded)
October 31, 2016
INDUSTRY DIVERSIFICATION
On October 31, 2016, industry diversification of the Portfolio was as follows:
| | | | | | | | |
| | | % of
Net Assets | | | Value | |
INDUSTRIES: | | | | | | | | |
Insurance | | | 10.6 | % | | $ | 1,919,792 | |
Banking | | | 10.3 | | | | 1,856,832 | |
Communications | | | 7.9 | | | | 1,417,870 | |
Commercial Services | | | 7.7 | | | | 1,389,404 | |
Computer Software & Processing | | | 6.0 | | | | 1,086,416 | |
Electronics | | | 4.6 | | | | 826,644 | |
Transportation | | | 4.5 | | | | 819,149 | |
Metals & Mining | | | 3.7 | | | | 669,801 | |
Heavy Machinery | | | 3.7 | | | | 666,662 | |
Oil & Gas | | | 3.5 | | | | 633,105 | |
Automotive | | | 3.2 | | | | 576,480 | |
Financial Services | | | 2.8 | | | | 500,302 | |
Advertising | | | 2.7 | | | | 483,591 | |
Media — Broadcasting & Publishing | | | 2.2 | | | | 399,134 | |
Textiles, Clothing & Fabrics | | | 2.1 | | | | 386,713 | |
Containers & Packaging | | | 2.1 | | | | 385,066 | |
Forest Products & Paper | | | 2.0 | | | | 352,804 | |
Retailers | | | 1.8 | | | | 329,777 | |
Industrial | | | 1.8 | | | | 325,496 | |
Heavy Construction | | | 1.8 | | | | 322,189 | |
Medical Supplies | | | 1.7 | | | | 309,002 | |
Health Care Providers | | | 1.7 | | | | 299,885 | |
Chemicals | | | 1.6 | | | | 281,619 | |
Restaurants | | | 1.5 | | | | 274,580 | |
Computers & Information | | | 1.5 | | | | 270,610 | |
Airlines | | | 1.4 | | | | 248,146 | |
Pharmaceuticals | | | 1.2 | | | | 223,837 | |
Electric Utilities | | | 1.2 | | | | 206,571 | |
Entertainment & Leisure | | | 1.0 | | | | 184,636 | |
Real Estate | | | 1.0 | | | | 178,463 | |
| | | | | | | | |
TOTAL COMMON STOCKS | | | 98.8 | % | | $ | 17,824,576 | |
| | |
REPURCHASE AGREEMENTS | | | 1.7 | | | | 311,752 | |
| | |
INVESTMENTS OF SECURITY LENDING COLLATERAL | | | 2.5 | | | | 446,056 | |
| | | | | | | | |
TOTAL INVESTMENTS | | | 103.0 | % | | $ | 18,582,384 | |
| | | | | | | | |
See Notes to Financial Statements.
THE GLENMEDE FUND, INC.
Large Cap Value Portfolio
SCHEDULE OF PORTFOLIO INVESTMENTS
October 31, 2016
| | | | | | | | |
| Shares | | | | | Value | |
|
| COMMON STOCKS* — 99.5% | |
| | | | Aerospace & Defense — 1.0% | |
| | 4,690 | | | General Dynamics Corp. | | $ | 706,971 | |
| | | | | | | | |
| |
| | | | Airlines — 3.1% | |
| | 19,225 | | | Delta Air Lines, Inc. | | | 803,028 | |
| | 8,360 | | | FedEx Corp. | | | 1,457,315 | |
| | | | | | | | |
| | | | | | | 2,260,343 | |
| | | | | | | | |
| |
| | | | Automotive — 2.7% | |
| | 1,646 | | | Adient PLC1 | | | 74,909 | |
| | 32,410 | | | General Motors Co. | | | 1,024,156 | |
| | 15,005 | | | PACCAR, Inc. | | | 824,074 | |
| | | | | | | | |
| | | | | | | 1,923,139 | |
| | | | | | | | |
| |
| | | | Banking — 8.9% | |
| | 34,465 | | | Bank of New York Mellon Corp. (The) | | | 1,491,300 | |
| | 13,400 | | | Capital One Financial Corp. | | | 992,136 | |
| | 35,250 | | | Citigroup, Inc. | | | 1,732,537 | |
| | 22,105 | | | Discover Financial Services | | | 1,245,175 | |
| | 33,355 | | | OneMain Holdings, Inc.1 | | | 945,281 | |
| | | | | | | | |
| | | | | | | 6,406,429 | |
| | | | | | | | |
| |
| | | | Beverages, Food & Tobacco — 2.0% | |
| | 10,765 | | | Bunge, Ltd. | | | 667,538 | |
| | 10,720 | | | Tyson Foods, Inc. — Class A | | | 759,512 | |
| | | | | | | | |
| | | | | | | 1,427,050 | |
| | | | | | | | |
| |
| | | | Chemicals — 2.2% | |
| | 9,785 | | | Celanese Corp. — Class A | | | 713,522 | |
| | 16,720 | | | Dow Chemical Co. (The) | | | 899,703 | |
| | | | | | | | |
| | | �� | | | | 1,613,225 | |
| | | | | | | | |
| |
| | | | Communications — 2.0% | |
| | 21,355 | | | QUALCOMM, Inc. | | | 1,467,516 | |
| | | | | | | | |
| |
| | | | Computers & Information — 1.8% | |
| | 58,935 | | | Hewlett Packard Enterprise Co. | | | 1,324,269 | |
| | | | | | | | |
| |
| | | | Cosmetics & Personal Care — 2.2% | |
| | 18,610 | | | Procter & Gamble Co. (The) | | | 1,615,348 | |
| | | | | | | | |
| |
| | | | Electronic Technology — 1.8% | |
| | 13,015 | | | Lam Research Corp. | | | 1,260,633 | |
| | | | | | | | |
| |
| | | | Energy — 3.8% | |
| | 32,580 | | | Exxon Mobil Corp. | | | 2,714,566 | |
| | | | | | | | |
| |
| | | | Financial Services — 7.6% | |
| | 10,615 | | | Ameriprise Financial, Inc. | | | 938,260 | |
| | 43,070 | | | JPMorgan Chase & Co. | | | 2,983,028 | |
| | 47,195 | | | Morgan Stanley | | | 1,584,336 | |
| | | | | | | | |
| | | | | | | 5,505,624 | |
| | | | | | | | |
| |
| | | | Food Retailers — 0.8% | |
| | 19,495 | | | Kroger Co. (The) | | | 603,955 | |
| | | | | | | | |
| |
| | | | Forest Products & Paper — 1.2% | |
| | 10,530 | | | Packaging Corp. of America | | | 868,725 | |
| | | | | | | | |
| |
| | | | Heavy Machinery — 2.9% | |
| | 15,650 | | | Eaton Corp. PLC | | | 998,000 | |
| | 35,040 | | | National Oilwell Varco, Inc. | | | 1,124,784 | |
| | | | | | | | |
| | | | | | | 2,122,784 | |
| | | | | | | | |
See Notes to Financial Statements.
THE GLENMEDE FUND, INC.
Large Cap Value Portfolio
SCHEDULE OF PORTFOLIO INVESTMENTS — (Continued)
October 31, 2016
| | | | | | | | |
| Shares | | | | | Value | |
|
| COMMON STOCKS* — (Continued) | |
| | | | Industrial — Diversified — 0.9% | |
| | 16,462 | | | Johnson Controls International PLC | | $ | 663,748 | |
| | | | | | | | |
| |
| | | | Insurance — 11.3% | |
| | 16,015 | | | Aflac, Inc. | | | 1,102,953 | |
| | 30,630 | | | AmTrust Financial Services, Inc. | | | 808,326 | |
| | 6,225 | | | Anthem, Inc. | | | 758,579 | |
| | 21,260 | | | Lincoln National Corp. | | | 1,043,653 | |
| | 22,240 | | | Principal Financial Group, Inc. | | | 1,214,304 | |
| | 8,670 | | | Reinsurance Group of America, Inc. | | | 935,146 | |
| | 33,630 | | | Unum Group | | | 1,190,502 | |
| | 36,730 | | | Voya Financial, Inc. | | | 1,122,101 | |
| | | | | | | | |
| | | | | | | 8,175,564 | |
| | | | | | | | |
| |
| | | | Media — Broadcasting & Publishing — 1.1% | |
| | 13,335 | | | CBS Corp. — Class B | | | 755,028 | |
| | | | | | | | |
| |
| | | | Medical Supplies — 2.7% | |
| | 11,600 | | | Ingersoll-Rand PLC | | | 780,564 | |
| | 11,055 | | | Zimmer Biomet Holdings, Inc. | | | 1,165,197 | |
| | | | | | | | |
| | | | | | | 1,945,761 | |
| | | | | | | | |
| |
| | | | Metals & Mining — 1.8% | |
| | 56,410 | | | Corning, Inc. | | | 1,281,071 | |
| | | | | | | | |
| |
| | | | Oil & Gas — 10.1% | |
| | 25,475 | | | Baker Hughes, Inc. | | | 1,411,315 | |
| | 22,395 | | | Chevron Corp. | | | 2,345,876 | |
| | 20,035 | | | Devon Energy Corp. | | | 759,126 | |
| | 18,980 | | | Helmerich & Payne, Inc. | | | 1,197,828 | |
| | 21,920 | | | ONEOK, Inc. | | | 1,061,586 | |
| | 9,085 | | | Valero Energy Corp. | | | 538,195 | |
| | | | | | | | |
| | | | | | | 7,313,926 | |
| | | | | | | | |
| | |
| | | | Pharmaceuticals — 8.6% | | | |
| | 21,320 | | | Johnson & Johnson | | | 2,472,907 | |
| | 29,815 | | | Merck & Co., Inc. | | | 1,750,737 | |
| | 62,000 | | | Pfizer, Inc. | | | 1,966,020 | |
| | | | | | | | |
| | | | | | | 6,189,664 | |
| | | | | | | | |
| | |
| | | | Real Estate — 3.0% | | | |
| | 24,215 | | | CBRE Group, Inc. — Class A1 | | | 623,778 | |
| | 83,650 | | | VEREIT, Inc. | | | 786,310 | |
| | 12,890 | | | WP Carey, Inc. | | | 782,939 | |
| | | | | | | | |
| | | | | | | 2,193,027 | |
| | | | | | | | |
| | |
| | | | Real Estate Investment Trusts — 1.2% | | | |
| | 55,420 | | | Host Hotels & Resorts, Inc. | | | 857,902 | |
| | | | | | | | |
| | |
| | | | Retailers — 2.6% | | | |
| | 6,960 | | | CVS Health Corp. | | | 585,336 | |
| | 9,010 | | | Express Scripts Holding Co.1 | | | 607,274 | |
| | 9,950 | | | Wal-Mart Stores, Inc. | | | 696,699 | |
| | | | | | | | |
| | | | | | | 1,889,309 | |
| | | | | | | | |
| | |
| | | | Technology — 5.2% | | | |
| | 58,590 | | | Cisco Systems, Inc. | | | 1,797,541 | |
| | 56,880 | | | Intel Corp. | | | 1,983,406 | |
| | | | | | | | |
| | | | | | | 3,780,947 | |
| | | | | | | | |
| | |
| | | | Telecommunications — 2.8% | | | |
| | 53,965 | | | AT&T, Inc. | | | 1,985,372 | |
| | | | | | | | |
See Notes to Financial Statements.
THE GLENMEDE FUND, INC.
Large Cap Value Portfolio
SCHEDULE OF PORTFOLIO INVESTMENTS — (Continued)
October 31, 2016
| | | | | | | | |
| Shares | | | | | Value | |
|
| COMMON STOCKS* — (Continued) | |
| | | | Telephone Systems — 1.3% | | | |
| | 18,765 | | | Verizon Communications, Inc. | | $ | 902,597 | |
| | | | | | | | |
| | |
| | | | Transportation — 2.9% | | | |
| | 18,815 | | | Carnival Corp. | | | 923,817 | |
| | 12,180 | | | Norfolk Southern Corp. | | | 1,132,740 | |
| | | | | | | | |
| | | | | | | 2,056,557 | |
| | | | | | | | |
| | |
| | | | TOTAL COMMON STOCKS
(Cost $67,049,487) | | | 71,811,050 | |
| | | | | | | | |
| | |
Face
Amount | | | | | | |
|
| REPURCHASE AGREEMENT* — 0.5% | |
| $ | 320,660 | | | With Fixed Income Clearing Corp., dated 10/31/16, 0.01%, principal and interest in the amount of $320,660, due 11/1/16, (collateralized by a U.S. Treasury Bond with a par value of $300,000, coupon rate of 3.000%, due 5/15/45, market value of $328,500) | | | 320,660 | |
| | | | | | | | |
| | |
| | | | TOTAL REPURCHASE AGREEMENT
(Cost $320,660) | | | 320,660 | |
| | | | | | | | |
| | | | | | | | | | |
| | |
TOTAL INVESTMENTS
(Cost $67,370,147)2 | | | 100.0 | % | | $ | 72,131,710 | |
| | |
OTHER ASSETS IN EXCESS OF LIABILITIES | | | 0.0 | | | | 22,605 | |
| | | | | | | | | | |
| | |
NET ASSETS | | | 100.0 | % | | $ | 72,154,315 | |
| | | | | | | | | | |
| * | Percentages indicated are based on net assets. |
| 1 | Non income-producing security. |
| 2 | Aggregate cost for federal tax purposes was $67,655,734. |
See Notes to Financial Statements.
THE GLENMEDE FUND, INC.
Large Cap Value Portfolio
SCHEDULE OF PORTFOLIO INVESTMENTS — (Concluded)
October 31, 2016
INDUSTRY DIVERSIFICATION
On October 31, 2016, industry diversification of the Portfolio was as follows:
| | | | | | | | |
| | | % of
Net Assets | | | Value | |
INDUSTRIES: | | | | | | | | |
Insurance | | | 11.3 | % | | $ | 8,175,564 | |
Oil & Gas | | | 10.1 | | | | 7,313,926 | |
Banking | | | 8.9 | | | | 6,406,429 | |
Pharmaceuticals | | | 8.6 | | | | 6,189,664 | |
Financial Services | | | 7.6 | | | | 5,505,624 | |
Technology | | | 5.2 | | | | 3,780,947 | |
Energy | | | 3.8 | | | | 2,714,566 | |
Airlines | | | 3.1 | | | | 2,260,343 | |
Real Estate | | | 3.0 | | | | 2,193,027 | |
Heavy Machinery | | | 2.9 | | | | 2,122,784 | |
Transportation | | | 2.9 | | | | 2,056,557 | |
Telecommunications | | | 2.8 | | | | 1,985,372 | |
Medical Supplies | | | 2.7 | | | | 1,945,761 | |
Automotive | | | 2.7 | | | | 1,923,139 | |
Retailers | | | 2.6 | | | | 1,889,309 | |
Cosmetics & Personal Care | | | 2.2 | | | | 1,615,348 | |
Chemicals | | | 2.2 | | | | 1,613,225 | |
Communications | | | 2.0 | | | | 1,467,516 | |
Beverages, Food & Tobacco | | | 2.0 | | | | 1,427,050 | |
Computers & Information | | | 1.8 | | | | 1,324,269 | |
Metals & Mining | | | 1.8 | | | | 1,281,071 | |
Electronic Technology | | | 1.8 | | | | 1,260,633 | |
Telephone Systems | | | 1.3 | | | | 902,597 | |
Forest Products & Paper | | | 1.2 | | | | 868,725 | |
Real Estate Investment Trusts | | | 1.2 | | | | 857,902 | |
Media — Broadcasting & Publishing | | | 1.1 | | | | 755,028 | |
Aerospace & Defense | | | 1.0 | | | | 706,971 | |
Industrial — Diversified | | | 0.9 | | | | 663,748 | |
Food Retailers | | | 0.8 | | | | 603,955 | |
| | | | | | | | |
TOTAL COMMON STOCKS | | | 99.5 | % | | $ | 71,811,050 | |
| | |
REPURCHASE AGREEMENTS | | | 0.5 | | | | 320,660 | |
| | | | | | | | |
TOTAL INVESTMENTS | | | 100.0 | % | | $ | 72,131,710 | |
| | | | | | | | |
See Notes to Financial Statements.
THE GLENMEDE FUND, INC.
U.S. Emerging Growth Portfolio
SCHEDULE OF PORTFOLIO INVESTMENTS
October 31, 2016
| | | | | | | | |
| Shares | | | | | Value | |
| |
| COMMON STOCKS* — 99.3% | | | |
| | | | Aerospace & Defense — 1.3% | | | |
| | 24,453 | | | Mercury Systems, Inc.1 | | $ | 679,304 | |
| | | | | | | | |
| | |
| | | | Airlines — 1.4% | | | |
| | 16,698 | | | Hawaiian Holdings, Inc.1 | | | 751,827 | |
| | | | | | | | |
| | |
| | | | Auto Components — 1.7% | | | |
| | 8,930 | | | Dorman Products, Inc.1 | | | 573,663 | |
| | 5,798 | | | Tenneco, Inc.1 | | | 319,296 | |
| | | | | | | | |
| | | | | | | 892,959 | |
| | | | | | | | |
| | |
| | | | Automobiles — 0.6% | | | |
| | 11,940 | | | Winnebago Industries, Inc. | | | 337,305 | |
| | | | | | | | |
| | |
| | | | Banks — 11.6% | | | |
| | 39,763 | | | Brookline Bancorp, Inc. | | | 508,966 | |
| | 11,778 | | | Cardinal Financial Corp. | | | 309,526 | |
| | 21,875 | | | Central Pacific Financial Corp. | | | 560,656 | |
| | 6,188 | | | Chemical Financial Corp. | | | 265,775 | |
| | 16,806 | | | Columbia Banking System, Inc. | | | 554,934 | |
| | 10,368 | | | Eagle Bancorp, Inc.1 | | | 509,587 | |
| | 25,239 | | | First Midwest Bancorp, Inc. | | | 487,365 | |
| | 11,997 | | | Glacier Bancorp, Inc. | | | 339,035 | |
| | 15,994 | | | Great Western Bancorp, Inc. | | | 515,647 | |
| | 21,265 | | | Hanmi Financial Corp. | | | 531,625 | |
| | 31,213 | | | Hope Bancorp, Inc. | | | 503,778 | |
| | 14,178 | | | MB Financial, Inc. | | | 515,937 | |
| | 27,205 | | | United Community Banks, Inc. | | | 586,812 | |
| | | | | | | | |
| | | | | | | 6,189,643 | |
| | | | | | | | |
| | |
| | | | Biotechnology — 2.0% | | | |
| | 17,804 | | | Emergent BioSolutions, Inc.1 | | | 475,723 | |
| | 20,985 | | | Lexicon Pharmaceuticals, Inc.1,2 | | | 311,207 | |
| | 8,551 | | | Ophthotech Corp.1 | | | 306,297 | |
| | | | | | | | |
| | | | | | | 1,093,227 | |
| | | | | | | | |
| | |
| | | | Building Products — 1.3% | | | |
| | 18,492 | | | Gibraltar Industries, Inc.1 | | | 719,339 | |
| | | | | | | | |
| | |
| | | | Capital Markets — 1.7% | | | |
| | 11,525 | | | Evercore Partners, Inc. — Class A | | | 619,469 | |
| | 10,568 | | | Moelis & Co. — Class A | | | 268,427 | |
| | | | | | | | |
| | | | | | | 887,896 | |
| | | | | | | | |
| | |
| | | | Chemicals — 2.9% | | | |
| | 8,528 | | | Innospec, Inc. | | | 513,812 | |
| | 3,553 | | | Stepan Co. | | | 252,370 | |
| | 15,201 | | | Trinseo SA | | | 797,292 | |
| | | | | | | | |
| | | | | | | 1,563,474 | |
| | | | | | | | |
| | |
| | | | Commercial Services & Supplies — 2.1% | | | |
| | 6,669 | | | Deluxe Corp. | | | 408,143 | |
| | 18,870 | | | Steelcase, Inc. — Class A | | | 251,915 | |
| | 16,472 | | | Sykes Enterprises, Inc.1 | | | 440,461 | |
| | | | | | | | |
| | | | | | | 1,100,519 | |
| | | | | | | | |
| | |
| | | | Communications Equipment — 2.8% | | | |
| | 7,528 | | | Dycom Industries, Inc.1 | | | 579,129 | |
| | 7,088 | | | InterDigital, Inc. | | | 500,767 | |
| | 8,123 | | | Plantronics, Inc. | | | 420,041 | |
| | | | | | | | |
| | | | | | | 1,499,937 | |
| | | | | | | | |
See Notes to Financial Statements.
THE GLENMEDE FUND, INC.
U.S. Emerging Growth Portfolio
SCHEDULE OF PORTFOLIO INVESTMENTS — (Continued)
October 31, 2016
| | | | | | | | |
| Shares | | | | | Value | |
| |
| COMMON STOCKS* — (Continued) | | | |
| | | | Diversified Consumer Services — 0.6% | | | |
| | 8,338 | | | Sotheby’s | | $ | 299,167 | |
| | | | | | | | |
| | |
| | | | Electric Utilities — 0.4% | | | |
| | 9,510 | | | Spark Energy, Inc. — Class A | | | 230,142 | |
| | | | | | | | |
| | |
| | | | Electrical Equipment — 2.7% | | | |
| | 10,697 | | | Belden, Inc. | | | 693,272 | |
| | 13,648 | | | Brady Corp. — Class A | | | 451,749 | |
| | 20,233 | | | General Cable Corp. | | | 283,262 | |
| | | | | | | | |
| | | | | | | 1,428,283 | |
| | | | | | | | |
| | |
| | | | Electronic Equipment, Instruments & Components — 2.4% | | | |
| | 2,906 | | | Coherent, Inc.1 | | | 302,573 | |
| | 4,564 | | | Littelfuse, Inc. | | | 636,678 | |
| | 8,126 | | | Plexus Corp.1 | | | 372,252 | |
| | | | | | | | |
| | | | | | | 1,311,503 | |
| | | | | | | | |
| | |
| | | | Energy Equipment & Services — 1.6% | | | |
| | 33,651 | | | Matrix Service Co.1 | | | 595,623 | |
| | 5,765 | | | US Silica Holdings, Inc. | | | 266,285 | |
| | | | | | | | |
| | | | | | | 861,908 | |
| | | | | | | | |
| | |
| | | | Equity Real Estate Investment Trusts — 6.5% | | | |
| | 5,625 | | | Agree Realty Corp. | | | 271,969 | |
| | 9,241 | | | Coresite Realty Corp. | | | 681,431 | |
| | 57,009 | | | DiamondRock Hospitality Co. | | | 521,632 | |
| | 14,981 | | | DuPont Fabros Technology, Inc. | | | 611,375 | |
| | 7,487 | | | EastGroup Properties, Inc. | | | 508,442 | |
| | 11,561 | | | Ryman Hospitality Properties, Inc. | | | 582,906 | |
| | 21,363 | | | Summit Hotel Properties, Inc. | | | 277,505 | |
| | | | | | | | |
| | | | | | | 3,455,260 | |
| | | | | | | | |
| | |
| | | | Food & Staples Retailing — 0.7% | | | |
| | 16,417 | | | Performance Food Group Co.1 | | | 394,008 | |
| | | | | | | | |
| | |
| | | | Food Products — 2.0% | | | |
| | 11,684 | | | B&G Foods, Inc. | | | 495,402 | |
| | 32,892 | | | Dean Foods Co. | | | 600,608 | |
| | | | | | | | |
| | | | | | | 1,096,010 | |
| | | | | | | | |
| | |
| | | | Health Care Equipment & Supplies — 6.3% | | | |
| | 5,603 | | | Abaxis, Inc. | | | 267,487 | |
| | 6,511 | | | CONMED Corp. | | | 260,440 | |
| | 10,533 | | | Cynosure, Inc. — Class A1 | | | 449,233 | |
| | 4,960 | | | ICU Medical, Inc.1 | | | 690,928 | |
| | 16,731 | | | Natus Medical, Inc.1 | | | 658,365 | |
| | 13,541 | | | NuVasive, Inc.1 | | | 808,804 | |
| | 9,706 | | | SurModics, Inc.1 | | | 241,679 | |
| | | | | | | | |
| | | | | | | 3,376,936 | |
| | | | | | | | |
| | |
| | | | Health Care Providers & Services — 4.9% | | | |
| | 15,506 | | | AMN Healthcare Services, Inc.1 | | | 508,597 | |
| | 3,503 | | | Chemed Corp. | | | 495,394 | |
| | 9,980 | | | Magellan Health, Inc.1 | | | 513,471 | |
| | 10,878 | | | Molina Healthcare, Inc.1 | | | 591,872 | |
| | 9,493 | | | US Physical Therapy, Inc. | | | 540,152 | |
| | | | | | | | |
| | | | | | | 2,649,486 | |
| | | | | | | | |
See Notes to Financial Statements.
THE GLENMEDE FUND, INC.
U.S. Emerging Growth Portfolio
SCHEDULE OF PORTFOLIO INVESTMENTS — (Continued)
October 31, 2016
| | | | | | | | |
| Shares | | | | | Value | |
| |
| COMMON STOCKS* — (Continued) | | | |
| | | | Health Care Technology — 1.6% | | | |
| | 7,358 | | | Omnicell, Inc.1 | | $ | 240,055 | |
| | 34,223 | | | Vocera Communications, Inc.1 | | | 629,703 | |
| | | | | | | | |
| | | | | | | 869,758 | |
| | | | | | | | |
| | |
| | | | Hotels, Restaurants & Leisure — 2.8% | | | |
| | 27,451 | | | Bloomin’ Brands, Inc. | | | 474,902 | |
| | 7,840 | | | Cheesecake Factory, Inc. (The) | | | 417,010 | |
| | 37,724 | | | ILG, Inc. | | | 617,919 | |
| | | | | | | | |
| | | | | | | 1,509,831 | |
| | | | | | | | |
| | |
| | | | Household Durables — 1.5% | | | |
| | 6,518 | | | Helen of Troy, Ltd.1 | | | 531,217 | |
| | 8,265 | | | TopBuild Corp.1 | | | 249,024 | |
| | | | | | | | |
| | | | | | | 780,241 | |
| | | | | | | | |
| | |
| | | | Insurance — 3.4% | | | |
| | 9,312 | | | AMERISAFE, Inc. | | | 517,747 | |
| | 16,757 | | | Employers Holdings, Inc. | | | 525,332 | |
| | 21,396 | | | Maiden Holdings, Ltd. | | | 292,056 | |
| | 13,635 | | | Selective Insurance Group, Inc. | | | 503,813 | |
| | | | | | | | |
| | | | | | | 1,838,948 | |
| | | | | | | | |
| | |
| | | | Internet Software & Services — 2.7% | | | |
| | 7,927 | | | j2 Global, Inc. | | | 564,006 | |
| | 23,833 | | | NIC, Inc. | | | 546,968 | |
| | 18,166 | | | Perficient, Inc.1 | | | 338,069 | |
| | | | | | | | |
| | | | | | | 1,449,043 | |
| | | | | | | | |
| | |
| | | | IT Services — 4.9% | | | |
| | 21,130 | | | Convergys Corp. | | | 616,996 | |
| | 6,618 | | | CSG Systems International, Inc. | | | 251,682 | |
| | 13,486 | | | ExlService Holdings, Inc.1 | | | 593,789 | |
| | 9,363 | | | Science Applications International Corp. | | | 645,204 | |
| | 36,956 | | | Travelport Worldwide, Ltd. | | | 521,819 | |
| | | | | | | | |
| | | | | | | 2,629,490 | |
| | | | | | | | |
| | |
| | | | Leisure Equipment & Products — 0.8% | | | |
| | 16,985 | | | Smith & Wesson Holding Corp.1,2 | | | 448,914 | |
| | | | | | | | |
| | |
| | | | Life Sciences Tools & Services — 4.1% | | | |
| | 11,591 | | | AMAG Pharmaceuticals, Inc.1 | | | 297,889 | |
| | 11,560 | | | Cambrex Corp.1 | | | 465,868 | |
| | 13,325 | | | INC Research Holdings, Inc. — Class A1 | | | 608,953 | |
| | 25,664 | | | Luminex Corp.1 | | | 534,581 | |
| | 4,632 | | | PAREXEL International Corp.1 | | | 269,860 | |
| | | | | | | | |
| | | | | | | 2,177,151 | |
| | | | | | | | |
| | |
| | | | Machinery — 4.0% | | | |
| | 14,050 | | | Barnes Group, Inc. | | | 559,752 | |
| | 5,497 | | | CLARCOR, Inc. | | | 341,968 | |
| | 8,546 | | | Douglas Dynamics, Inc. | | | 274,327 | |
| | 45,897 | | | Mueller Water Products, Inc. | | | 565,451 | |
| | 20,594 | | | Rexnord Corp.1 | | | 409,615 | |
| | | | | | | | |
| | | | | | | 2,151,113 | |
| | | | | | | | |
| | |
| | | | Marine — 0.6% | | | |
| | 8,545 | | | Matson, Inc. | | | 341,287 | |
| | | | | | | | |
| | |
| | | | Metals & Mining — 0.6% | | | |
| | 6,348 | | | Worthington Industries, Inc. | | | 298,356 | |
| | | | | | | | |
See Notes to Financial Statements.
THE GLENMEDE FUND, INC.
U.S. Emerging Growth Portfolio
SCHEDULE OF PORTFOLIO INVESTMENTS — (Continued)
October 31, 2016
| | | | | | | | |
| Shares | | | | | Value | |
| |
| COMMON STOCKS* — (Continued) | | | |
| | | | Multi-line Retail — 0.9% | | | |
| | 10,726 | | | Big Lots, Inc. | | $ | 465,508 | |
| | | | | | | | |
| | |
| | | | Paper & Forest Products — 1.2% | | | |
| | 7,771 | | | Neenah Paper, Inc. | | | 620,903 | |
| | | | | | | | |
| | |
| | | | Personal Products — 0.8% | | | |
| | 3,136 | | | USANA Health Sciences, Inc.1 | | | 402,976 | |
| | | | | | | | |
| | |
| | | | Pharmaceuticals — 0.5% | | | |
| | 21,110 | | | Intra-Cellular Therapies, Inc.1,2 | | | 261,764 | |
| | | | | | | | |
| | |
| | | | Professional Services — 3.1% | | | |
| | 7,205 | | | Insperity, Inc. | | | 541,816 | |
| | 28,860 | | | Navigant Consulting, Inc.1 | | | 675,324 | |
| | 25,338 | | | TrueBlue, Inc.1 | | | 443,415 | |
| | | | | | | | |
| | | | 1,660,555 | |
| | | | | | | | |
| | |
| | | | Semiconductors & Semiconductor Equipment — 2.5% | | | |
| | 6,028 | | | Advanced Energy Industries, Inc.1 | | | 287,536 | |
| | 7,899 | | | MKS Instruments, Inc. | | | 398,504 | |
| | 35,028 | | | Rudolph Technologies, Inc.1 | | | 634,007 | |
| | | | | | | | |
| | | | 1,320,047 | |
| | | | | | | | |
| | |
| | | | Software — 0.7% | | | |
| | 10,265 | | | Synchronoss Technologies, Inc.1 | | | 376,828 | |
| | | | | | | | |
| | |
| | | | Specialty Retail — 2.6% | | | |
| | 24,310 | | | American Eagle Outfitters, Inc. | | | 414,242 | |
| | 19,443 | | | Finish Line, Inc. (The) — Class A | | | 382,833 | |
| | 14,665 | | | Hibbett Sports, Inc.1 | | | 569,735 | |
| | | | | | | | |
| | | | 1,366,810 | |
| | | | | | | | |
| | |
| | | | Thrifts & Mortgage Finance — 2.0% | | | |
| | 24,594 | | | BofI Holding, Inc.1,2 | | | 458,186 | |
| | 23,420 | | | Essent Group, Ltd.1 | | | 619,225 | |
| | | | | | | | |
| | | | 1,077,411 | |
| | | | | | | | |
| | |
| | | | Wireless Telecommunication Services — 0.5% | | | |
| | 10,754 | | | Shenandoah Telecommunications Co. | | | 283,906 | |
| | | | | | | | |
| | |
| | | | TOTAL COMMON STOCKS
(Cost $45,474,442) | | | 53,148,973 | |
| | | | | | | | |
| | |
Face
Amount | | | | | | |
| |
| REPURCHASE AGREEMENT* — 0.8% | | | |
| $ | 412,997 | | | With Fixed Income Clearing Corp., dated 10/31/16, 0.01%, principal and interest in the amount of $412,997, due 11/1/16, (collateralized by a U.S. Treasury Bond with a par value of $385,000, coupon rate of 3.000%, due 5/15/45, market value of $421,575) | | | 412,997 | |
| | | | | | | | |
| | |
| | | | TOTAL REPURCHASE AGREEMENT
(Cost $412,997) | | | 412,997 | |
| | | | | | | | |
See Notes to Financial Statements.
THE GLENMEDE FUND, INC.
U.S. Emerging Growth Portfolio
SCHEDULE OF PORTFOLIO INVESTMENTS — (Continued)
October 31, 2016
| | | | | | | | |
| Shares | | | | | Value | |
|
| INVESTMENT OF SECURITY LENDING COLLATERAL* — 2.8% | |
| | 1,496,136 | | | State Street Navigator Securities Lending Government Money Market Portfolio | | $ | 1,496,136 | |
| | | | | | | | |
| | |
| | | | TOTAL INVESTMENT OF SECURITY LENDING COLLATERAL
(Cost $1,496,136) | | | 1,496,136 | |
| | | | | | | | |
| | | | | | | | | | |
| | |
TOTAL INVESTMENTS
(Cost $47,383,575)3 | | | 102.9 | % | | $ | 55,058,106 | |
| | |
LIABILITIES IN EXCESS OF OTHER ASSETS | | | (2.9 | ) | | | (1,563,025 | ) |
| | | | | | | | | | |
| | |
NET ASSETS | | | 100.0 | % | | $ | 53,495,081 | |
| | | | | | | | | | |
| * | Percentages indicated are based on net assets. |
| 1 | Non income-producing security. |
| 2 | Securities or partial securities on loan. See Note 1. |
| 3 | Aggregate cost for federal tax purposes was $47,378,084. |
See Notes to Financial Statements.
THE GLENMEDE FUND, INC.
U.S. Emerging Growth Portfolio
SCHEDULE OF PORTFOLIO INVESTMENTS — (Concluded)
October 31, 2016
INDUSTRY DIVERSIFICATION
On October 31, 2016, industry diversification of the Portfolio was as follows:
| | | | | | | | |
| | | % of
Net Assets | | | Value | |
INDUSTRIES: | | | | | | | | |
Banks | | | 11.6 | % | | $ | 6,189,643 | |
Equity Real Estate Investment Trusts | | | 6.5 | | | | 3,455,260 | |
Health Care Equipment & Supplies | | | 6.3 | | | | 3,376,936 | |
Health Care Providers & Services | | | 4.9 | | | | 2,649,486 | |
IT Services | | | 4.9 | | | | 2,629,490 | |
Life Sciences Tools & Services | | | 4.1 | | | | 2,177,151 | |
Machinery | | | 4.0 | | | | 2,151,113 | |
Insurance | | | 3.4 | | | | 1,838,948 | |
Professional Services | | | 3.1 | | | | 1,660,555 | |
Chemicals | | | 2.9 | | | | 1,563,474 | |
Hotels, Restaurants & Leisure | | | 2.8 | | | | 1,509,831 | |
Communications Equipment | | | 2.8 | | | | 1,499,937 | |
Internet Software & Services | | | 2.7 | | | | 1,449,043 | |
Electrical Equipment | | | 2.7 | | | | 1,428,283 | |
Specialty Retail | | | 2.6 | | | | 1,366,810 | |
Semiconductors & Semiconductor Equipment | | | 2.5 | | | | 1,320,047 | |
Electronic Equipment, Instruments & Components | | | 2.4 | | | | 1,311,503 | |
Commercial Services & Supplies | | | 2.1 | | | | 1,100,519 | |
Food Products | | | 2.0 | | | | 1,096,010 | |
Biotechnology | | | 2.0 | | | | 1,093,227 | |
Thrifts & Mortgage Finance | | | 2.0 | | | | 1,077,411 | |
Auto Components | | | 1.7 | | | | 892,959 | |
Capital Markets | | | 1.7 | | | | 887,896 | |
Health Care Technology | | | 1.6 | | | | 869,758 | |
Energy Equipment & Services | | | 1.6 | | | | 861,908 | |
Household Durables | | | 1.5 | | | | 780,241 | |
Airlines | | | 1.4 | | | | 751,827 | |
Building Products | | | 1.3 | | | | 719,339 | |
Aerospace & Defense | | | 1.3 | | | | 679,304 | |
Paper & Forest Products | | | 1.2 | | | | 620,903 | |
Multi-line Retail | | | 0.9 | | | | 465,508 | |
Leisure Equipment & Products | | | 0.8 | | | | 448,914 | |
Personal Products | | | 0.8 | | | | 402,976 | |
Food & Staples Retailing | | | 0.7 | | | | 394,008 | |
Software | | | 0.7 | | | | 376,828 | |
Marine | | | 0.6 | | | | 341,287 | |
Automobiles | | | 0.6 | | | | 337,305 | |
Diversified Consumer Services | | | 0.6 | | | | 299,167 | |
Metals & Mining | | | 0.6 | | | | 298,356 | |
Wireless Telecommunication Services | | | 0.5 | | | | 283,906 | |
Pharmaceuticals | | | 0.5 | | | | 261,764 | |
Electric Utilities | | | 0.4 | | | | 230,142 | |
| | | | | | | | |
TOTAL COMMON STOCKS | | | 99.3 | % | | $ | 53,148,973 | |
| | |
REPURCHASE AGREEMENT | | | 0.8 | | | | 412,997 | |
| | |
INVESTMENT OF SECURITY LENDING COLLATERAL | | | 2.8 | | | | 1,496,136 | |
| | | | | | | | |
TOTAL INVESTMENTS | | | 102.9 | % | | $ | 55,058,106 | |
| | | | | | | | |
See Notes to Financial Statements.
THE GLENMEDE FUND, INC.
Large Cap Core Portfolio
SCHEDULE OF PORTFOLIO INVESTMENTS
October 31, 2016
| | | | | | | | |
| Shares | | | | | Value | |
|
| COMMON STOCKS* — 99.3% | |
| | | | Aerospace & Defense — 0.6% | |
| | 68,390 | | | Huntington Ingalls Industries, Inc. | | $ | 11,035,410 | |
| | | | | | | | |
| |
| | | | Airlines — 1.1% | |
| | 307,186 | | | Alaska Air Group, Inc. | | | 22,184,973 | |
| | | | | | | | |
| |
| | | | Automobiles — 0.8% | |
| | 280,571 | | | Harley-Davidson, Inc. | | | 15,998,158 | |
| | | | | | | | |
| |
| | | | Banks — 6.5% | |
| | 550,121 | | | BB&T Corp. | | | 21,564,743 | |
| | 811,475 | | | Citizens Financial Group, Inc. | | | 21,374,251 | |
| | 1,070,661 | | | Fifth Third Bancorp | | | 23,297,583 | |
| | 296,808 | | | JPMorgan Chase & Co. | | | 20,556,922 | |
| | 218,993 | | | PNC Financial Services Group, Inc. (The) | | | 20,935,731 | |
| | 441,150 | | | Wells Fargo & Co. | | | 20,297,312 | |
| | | | | | | | |
| | | | | | | 128,026,542 | |
| | | | | | | | |
| |
| | | | Beverages — 2.0% | |
| | 226,519 | | | Dr Pepper Snapple Group, Inc. | | | 19,886,103 | |
| | 180,667 | | | PepsiCo, Inc. | | | 19,367,502 | |
| | | | | | | | |
| | | | | | | 39,253,605 | |
| | | | | | | | |
| |
| | | | Biotechnology — 2.6% | |
| | 123,571 | | | Amgen, Inc. | | | 17,443,282 | |
| | 67,596 | | | Biogen, Inc.1 | | | 18,939,047 | |
| | 137,881 | | | Celgene Corp.1 | | | 14,088,681 | |
| | | | | | | | |
| | | | | | | 50,471,010 | |
| | | | | | | | |
| |
| | | | Capital Markets — 3.9% | |
| | 403,819 | | | Bank of New York Mellon Corp. (The) | | | 17,473,248 | |
| | 197,488 | | | CME Group, Inc. | | | 19,768,549 | |
| | 242,108 | | | MSCI, Inc. | | | 19,414,641 | |
| | 310,191 | | | Nasdaq, Inc. | | | 19,842,918 | |
| | | | | | | | |
| | | | | | | 76,499,356 | |
| | | | | | | | |
| |
| | | | Chemicals — 1.3% | |
| | 123,730 | | | LyondellBasell Industries N.V. — Class A | | | 9,842,721 | |
| | 176,658 | | | PPG Industries, Inc. | | | 16,452,160 | |
| | | | | | | | |
| | | | | | | 26,294,881 | |
| | | | | | | | |
| |
| | | | Commercial Services & Supplies — 0.9% | |
| | 260,691 | | | Avery Dennison Corp. | | | 18,193,625 | |
| | | | | | | | |
| |
| | | | Communications Equipment — 2.4% | |
| | 707,208 | | | Cisco Systems, Inc. | | | 21,697,141 | |
| | 181,807 | | | F5 Networks, Inc.1 | | | 25,127,546 | |
| | | | | | | | |
| | | | | | | 46,824,687 | |
| | | | | | | | |
| |
| | | | Construction & Engineering — 1.0% | |
| | 364,121 | | | Fluor Corp. | | | 18,930,651 | |
| | | | | | | | |
| |
| | | | Containers & Packaging — 0.6% | |
| | 131,524 | | | Packaging Corp. of America | | | 10,850,730 | |
| | | | | | | | |
| |
| | | | Diversified Telecommunication Services — 1.9% | |
| | 697,657 | | | CenturyLink, Inc. | | | 18,543,723 | |
| | 411,644 | | | Verizon Communications, Inc. | | | 19,800,077 | |
| | | | | | | | |
| | | | | | | 38,343,800 | |
| | | | | | | | |
| |
| | | | Electric Utilities — 1.1% | |
| | 612,091 | | | PPL Corp. | | | 21,019,205 | |
| | | | | | | | |
See Notes to Financial Statements.
THE GLENMEDE FUND, INC.
Large Cap Core Portfolio
SCHEDULE OF PORTFOLIO INVESTMENTS — (Continued)
October 31, 2016
| | | | | | | | |
| Shares | | | | | Value | |
|
| COMMON STOCKS* — (Continued) | |
| | | | Electrical Equipment — 0.7% | |
| | 297,524 | | | AO Smith Corp. | | $ | 13,439,159 | |
| | | | | | | | |
| |
| | | | Energy Equipment & Services — 2.5% | |
| | 163,878 | | | Helmerich & Payne, Inc. | | | 10,342,341 | |
| | 598,005 | | | National Oilwell Varco, Inc. | | | 19,195,960 | |
| | 242,344 | | | Schlumberger, Ltd. | | | 18,958,571 | |
| | | | | | | | |
| | | | | | | 48,496,872 | |
| | | | | | | | |
| |
| | | | Equity Real Estate Investment Trusts — 3.9% | |
| | 769,421 | | | Brixmor Property Group, Inc. | | | 19,558,682 | |
| | 712,900 | | | Kimco Realty Corp. | | | 18,970,269 | |
| | 208,987 | | | Mid-America Apartment Communities, Inc. | | | 19,383,544 | |
| | 101,043 | | | Simon Property Group, Inc. | | | 18,789,956 | |
| | | | | | | | |
| | | | | | | 76,702,451 | |
| | | | | | | | |
| |
| | | | Food & Staples Retailing — 2.4% | |
| | 85,277 | | | CVS Health Corp. | | | 7,171,796 | |
| | 416,483 | | | SYSCO Corp. | | | 20,041,162 | |
| | 275,976 | | | Wal-Mart Stores, Inc. | | | 19,323,839 | |
| | | | | | | | |
| | | | | | | 46,536,797 | |
| | | | | | | | |
| |
| | | | Food Products — 2.3% | |
| | 146,370 | | | Ingredion, Inc. | | | 19,199,353 | |
| | 370,425 | | | Tyson Foods, Inc. — Class A | | | 26,244,611 | |
| | | | | | | | |
| | | | | | | 45,443,964 | |
| | | | | | | | |
| |
| | | | Gas Utilities — 0.5% | |
| | 213,799 | | | UGI Corp. | | | 9,896,756 | |
| | | | | | | | |
| |
| | | | Health Care Equipment & Supplies — 0.5% | |
| | 120,041 | | | Danaher Corp. | | | 9,429,221 | |
| | | | | | | | |
| |
| | | | Health Care Providers & Services — 5.5% | |
| | 173,262 | | | Aetna, Inc. | | | 18,599,676 | |
| | 161,198 | | | Anthem, Inc. | | | 19,643,588 | |
| | 223,888 | | | Centene Corp.1 | | | 13,988,522 | |
| | 157,814 | | | DaVita, Inc.1 | | | 9,251,057 | |
| | 261,953 | | | Express Scripts Holding Co.1 | | | 17,655,632 | |
| | 109,450 | | | McKesson Corp. | | | 13,918,756 | |
| | 112,084 | | | UnitedHealth Group, Inc. | | | 15,840,832 | |
| | | | | | | | |
| | | | | | | 108,898,063 | |
| | | | | | | | |
| |
| | | | Hotels, Restaurants & Leisure — 0.9% | |
| | 282,872 | | | Wyndham Worldwide Corp. | | | 18,624,293 | |
| | | | | | | | |
| |
| | | | Household Products — 2.5% | |
| | 426,691 | | | Church & Dwight Co., Inc. | | | 20,592,108 | |
| | 80,900 | | | Kimberly-Clark Corp. | | | 9,255,769 | |
| | 212,915 | | | Procter & Gamble Co. (The) | | | 18,481,022 | |
| | | | | | | | |
| | | | | | | 48,328,899 | |
| | | | | | | | |
| |
| | | | Industrial Conglomerates — 0.9% | |
| | 165,683 | | | Honeywell International, Inc. | | | 18,172,111 | |
| | | | | | | | |
| |
| | | | Insurance — 3.8% | |
| | 229,760 | | | Cincinnati Financial Corp. | | | 16,262,413 | |
| | 293,224 | | | Marsh & McLennan Cos., Inc. | | | 18,587,469 | |
| | 386,414 | | | Progressive Corp. (The) | | | 12,175,905 | |
| | 174,397 | | | Travelers Cos., Inc. (The) | | | 18,866,267 | |
| | 275,534 | | | Unum Group | | | 9,753,904 | |
| | | | | | | | |
| | | | | | | 75,645,958 | |
| | | | | | | | |
See Notes to Financial Statements.
THE GLENMEDE FUND, INC.
Large Cap Core Portfolio
SCHEDULE OF PORTFOLIO INVESTMENTS — (Continued)
October 31, 2016
| | | | | | | | |
| Shares | | | | | Value | |
|
| COMMON STOCKS* — (Continued) | |
| | | | Internet Software & Services — 1.7% | |
| | 782,519 | | | eBay, Inc.1 | | $ | 22,309,617 | |
| | 80,709 | | | Facebook, Inc. — Class A1 | | | 10,572,072 | |
| | | | | | | | |
| | | | | | | 32,881,689 | |
| | | | | | | | |
| |
| | | | IT Services — 4.5% | |
| | 177,838 | | | Accenture PLC — Class A | | | 20,671,889 | |
| | 223,494 | | | Amdocs, Ltd. | | | 13,063,224 | |
| | 192,348 | | | Global Payments, Inc. | | | 13,949,077 | |
| | 515,257 | | | PayPal Holdings, Inc.1 | | | 21,465,607 | |
| | 244,963 | | | Visa, Inc. — Class A | | | 20,211,897 | |
| | | | | | | | |
| | | | | | | 89,361,694 | |
| | | | | | | | |
| |
| | | | Life Sciences Tools & Services — 2.3% | |
| | 38,945 | | | Mettler-Toledo International, Inc.1 | | | 15,736,896 | |
| | 128,377 | | | Thermo Fisher Scientific, Inc. | | | 18,875,270 | |
| | 74,304 | | | Waters Corp.1 | | | 10,338,659 | |
| | | | | | | | |
| | | | | | | 44,950,825 | |
| | | | | | | | |
| |
| | | | Machinery — 3.1% | |
| | 179,416 | | | Illinois Tool Works, Inc. | | | 20,376,275 | |
| | 175,096 | | | Stanley Black & Decker, Inc. | | | 19,932,929 | |
| | 261,247 | | | Wabtec Corp. | | | 20,197,005 | |
| | | | | | | | |
| | | | | | | 60,506,209 | |
| | | | | | | | |
| |
| | | | Media — 3.1% | |
| | 223,161 | | | Comcast Corp. — Class A | | | 13,795,813 | |
| | 551,081 | | | Interpublic Group of Cos., Inc. (The) | | | 12,338,704 | |
| | 230,682 | | | Omnicom Group, Inc. | | | 18,413,037 | |
| | 80,946 | | | Time Warner, Inc. | | | 7,203,384 | |
| | 96,829 | | | Walt Disney Co. (The) | | | 8,975,080 | |
| | | | | | | | |
| | | | | | | 60,726,018 | |
| | | | | | | | |
| |
| | | | Multi-line Retail — 1.0% | |
| | 526,297 | | | Macy’s, Inc. | | | 19,204,578 | |
| | | | | | | | |
| |
| | | | Multi-Utilities — 1.1% | |
| | 497,907 | | | CMS Energy Corp. | | | 20,986,780 | |
| | | | | | | | |
| |
| | | | Office Electronics — 1.0% | |
| | 1,967,832 | | | Xerox Corp. | | | 19,225,719 | |
| | | | | | | | |
| |
| | | | Oil, Gas & Consumable Fuels — 3.7% | |
| | 483,259 | | | Kinder Morgan, Inc. | | | 9,872,982 | |
| | 335,509 | | | Marathon Petroleum Corp. | | | 14,624,837 | |
| | 148,655 | | | Phillips 66 | | | 12,063,353 | |
| | 263,396 | | | Tesoro Corp. | | | 22,380,758 | |
| | 247,599 | | | Valero Energy Corp. | | | 14,667,765 | |
| | | | | | | | |
| | | | | | | 73,609,695 | |
| | | | | | | | |
| |
| | | | Paper & Forest Products — 1.0% | |
| | 443,099 | | | International Paper Co. | | | 19,952,748 | |
| | | | | | | | |
| |
| | | | Pharmaceuticals — 3.8% | |
| | 319,492 | | | AbbVie, Inc. | | | 17,821,264 | |
| | 168,537 | | | Johnson & Johnson | | | 19,548,606 | |
| | 307,412 | | | Merck & Co., Inc. | | | 18,051,233 | |
| | 589,783 | | | Pfizer, Inc. | | | 18,702,019 | |
| | | | | | | | |
| | | | | | | 74,123,122 | |
| | | | | | | | |
| |
| | | | Professional Services — 0.6% | |
| | 161,037 | | | Manpowergroup, Inc. | | | 12,367,642 | |
| | | | | | | | |
See Notes to Financial Statements.
THE GLENMEDE FUND, INC.
Large Cap Core Portfolio
SCHEDULE OF PORTFOLIO INVESTMENTS — (Continued)
October 31, 2016
| | | | | | | | |
| Shares | | | | | Value | |
|
| COMMON STOCKS* — (Continued) | |
| | | | Road & Rail — 1.1% | |
| | 711,699 | | | CSX Corp. | | $ | 21,713,937 | |
| | | | | | | | |
| |
| | | | Semiconductors & Semiconductor Equipment — 4.2% | |
| | 992,563 | | | Applied Materials, Inc. | | | 28,863,732 | |
| | 273,387 | | | Intel Corp. | | | 9,533,005 | |
| | 447,239 | | | NVIDIA Corp. | | | 31,825,527 | |
| | 167,273 | | | Texas Instruments, Inc. | | | 11,851,292 | |
| | | | | | | | |
| | | | | | | 82,073,556 | |
| | | | | | | | |
| |
| | | | Software — 4.9% | |
| | 244,199 | | | Citrix Systems, Inc.1 | �� | | 20,708,075 | |
| | 331,137 | | | Microsoft Corp. | | | 19,841,729 | |
| | 462,198 | | | Oracle Corp. | | | 17,757,647 | |
| | 178,375 | | | Synopsys, Inc.1 | | | 10,579,421 | |
| | 360,101 | | | VMware, Inc. —Class A1,2 | | | 28,303,939 | |
| | | | | | | | |
| | | | | | | 97,190,811 | |
| | | | | | | | |
| |
| | | | Specialty Retail — 4.5% | |
| | 334,799 | | | Foot Locker, Inc. | | | 22,354,529 | |
| | 156,093 | | | Home Depot, Inc. | | | 19,044,907 | |
| | 279,261 | | | Lowe’s Cos., Inc. | | | 18,612,746 | |
| | 73,137 | | | O’Reilly Automotive, Inc.1 | | | 19,340,348 | |
| | 135,749 | | | TJX Cos., Inc. (The) | | | 10,011,489 | |
| | | | | | | | |
| | | | | | | 89,364,019 | |
| | | | | | | | |
| |
| | | | Technology Hardware, Storage & Peripherals — 3.0% | |
| | 1,258,613 | | | Hewlett Packard Enterprise Co. | | | 28,281,034 | |
| | 330,477 | | | Teradata Corp.1 | | | 8,909,660 | |
| | 373,993 | | | Western Digital Corp. | | | 21,856,151 | |
| | | | | | | | |
| | | | | | | 59,046,845 | |
| | | | | | | | |
| |
| | | | Textiles, Apparel & Luxury Goods — 0.6% | |
| | 247,431 | | | Michael Kors Holdings, Ltd.1 | | | 12,564,546 | |
| | | | | | | | |
| |
| | | | Tobacco — 0.5% | |
| | 146,128 | | | Altria Group Inc. | | | 9,661,983 | |
| | | | | | | | |
| |
| | | | Trading Companies & Distributors — 0.5% | |
| | 134,274 | | | MSC Industrial Direct Co., Inc. —Class A | | | 9,775,147 | |
| | | | | | | | |
| | |
| | | | TOTAL COMMON STOCKS
(Cost $1,743,382,698) | | | 1,952,828,740 | |
| | | | | | | | |
| | |
Face
Amount | | | | | | |
|
| REPURCHASE AGREEMENT* — 0.7% | |
| $ | 14,223,371 | | | With Fixed Income Clearing Corp., dated 10/31/16, 0.01%, principal and interest in the amount of $14,223,375, due 11/1/16, (collateralized by a U.S. Treasury Bond with a par value of $13,250,000, coupon rate of 3.000%, due 5/15/45, market value of $14,508,750) | | | 14,223,371 | |
| | | | | | | | |
| | |
| | | | TOTAL REPURCHASE AGREEMENT
(Cost $14,223,371) | | | 14,223,371 | |
| | | | | | | | |
See Notes to Financial Statements.
THE GLENMEDE FUND, INC.
Large Cap Core Portfolio
SCHEDULE OF PORTFOLIO INVESTMENTS — (Continued)
October 31, 2016
| | | | | | | | |
| Shares | | | | | Value | |
|
| INVESTMENT OF SECURITY LENDING COLLATERAL* — 1.0% | |
| | 19,850,223 | | | State Street Navigator Securities Lending Government Money Market Portfolio | | $ | 19,850,223 | |
| | | | | | | | |
| | |
| | | | TOTAL INVESTMENT OF SECURITY LENDING COLLATERAL
(Cost $19,850,223) | | | 19,850,223 | |
| | | | | | | | |
| | | | | | | | | | |
| | |
TOTAL INVESTMENTS
(Cost $1,777,456,292)3 | | | 101.0 | % | | $ | 1,986,902,334 | |
| | |
LIABILITIES IN EXCESS OF OTHER ASSETS | | | (1.0 | ) | | | (20,118,624 | ) |
| | | | | | | | | | |
| | |
NET ASSETS | | | 100.0 | % | | $ | 1,966,783,710 | |
| | | | | | | | | | |
| * | Percentages indicated are based on net assets. |
| 1 | Non income-producing security. |
| 2 | Securities or partial securities on loan. See Note 1. |
| 3 | Aggregate cost for federal tax purposes was $1,778,217,146. |
See Notes to Financial Statements.
THE GLENMEDE FUND, INC.
Large Cap Core Portfolio
SCHEDULE OF PORTFOLIO INVESTMENTS — (Concluded)
October 31, 2016
INDUSTRY DIVERSIFICATION
On October 31, 2016, industry diversification of the Portfolio was as follows:
| | | | | | | | |
| | | % of
Net Assets | | | Value | |
INDUSTRIES: | | | | | | | | |
Banks | | | 6.5 | % | | $ | 128,026,542 | |
Health Care Providers & Services | | | 5.5 | | | | 108,898,063 | |
Software | | | 4.9 | | | | 97,190,811 | |
Specialty Retail | | | 4.5 | | | | 89,364,019 | |
IT Services | | | 4.5 | | | | 89,361,694 | |
Semiconductors & Semiconductor Equipment | | | 4.2 | | | | 82,073,556 | |
Equity Real Estate Investment Trusts | | | 3.9 | | | | 76,702,451 | |
Capital Markets | | | 3.9 | | | | 76,499,356 | |
Insurance | | | 3.8 | | | | 75,645,958 | |
Pharmaceuticals | | | 3.8 | | | | 74,123,122 | |
Oil, Gas & Consumable Fuels | | | 3.7 | | | | 73,609,695 | |
Media | | | 3.1 | | | | 60,726,018 | |
Machinery | | | 3.1 | | | | 60,506,209 | |
Technology Hardware, Storage & Peripherals | | | 3.0 | | | | 59,046,845 | |
Biotechnology | | | 2.6 | | | | 50,471,010 | |
Energy Equipment & Services | | | 2.5 | | | | 48,496,872 | |
Household Products | | | 2.5 | | | | 48,328,899 | |
Communications Equipment | | | 2.4 | | | | 46,824,687 | |
Food & Staples Retailing | | | 2.4 | | | | 46,536,797 | |
Food Products | | | 2.3 | | | | 45,443,964 | |
Life Sciences Tools & Services | | | 2.3 | | | | 44,950,825 | |
Beverages | | | 2.0 | | | | 39,253,605 | |
Diversified Telecommunication Services | | | 1.9 | | | | 38,343,800 | |
Internet Software & Services | | | 1.7 | | | | 32,881,689 | |
Chemicals | | | 1.3 | | | | 26,294,881 | |
Airlines | | | 1.1 | | | | 22,184,973 | |
Road & Rail | | | 1.1 | | | | 21,713,937 | |
Electric Utilities | | | 1.1 | | | | 21,019,205 | |
Multi-Utilities | | | 1.1 | | | | 20,986,780 | |
Paper & Forest Products | | | 1.0 | | | | 19,952,748 | |
Office Electronics | | | 1.0 | | | | 19,225,719 | |
Multi-line Retail | | | 1.0 | | | | 19,204,578 | |
Construction & Engineering | | | 1.0 | | | | 18,930,651 | |
Hotels, Restaurants & Leisure | | | 0.9 | | | | 18,624,293 | |
Commercial Services & Supplies | | | 0.9 | | | | 18,193,625 | |
Industrial Conglomerates | | | 0.9 | | | | 18,172,111 | |
Automobiles | | | 0.8 | | | | 15,998,158 | |
Electrical Equipment | | | 0.7 | | | | 13,439,159 | |
Textiles, Apparel & Luxury Goods | | | 0.6 | | | | 12,564,546 | |
Professional Services | | | 0.6 | | | | 12,367,642 | |
Aerospace & Defense | | | 0.6 | | | | 11,035,410 | |
Containers & Packaging | | | 0.6 | | | | 10,850,730 | |
Gas Utilities | | | 0.5 | | | | 9,896,756 | |
Trading Companies & Distributors | | | 0.5 | | | | 9,775,147 | |
Tobacco | | | 0.5 | | | | 9,661,983 | |
Health Care Equipment & Supplies | | | 0.5 | | | | 9,429,221 | |
| | | | | | | | |
TOTAL COMMON STOCKS | | | 99.3 | % | | $ | 1,952,828,740 | |
| | |
REPURCHASE AGREEMENT | | | 0.7 | | | | 14,223,371 | |
| | |
INVESTMENT OF SECURITY LENDING COLLATERAL | | | 1.0 | | | | 19,850,223 | |
| | | | | | | | |
TOTAL INVESTMENTS | | | 101.0 | % | | $ | 1,986,902,334 | |
| | | | | | | | |
See Notes to Financial Statements.
THE GLENMEDE FUND, INC.
Large Cap Growth Portfolio
SCHEDULE OF PORTFOLIO INVESTMENTS
October 31, 2016
| | | | | | | | |
| Shares | | | | | Value | |
| |
| COMMON STOCKS* — 99.5% | | | |
| | | | Airlines — 2.3% | |
| | 437,834 | | | Alaska Air Group, Inc. | | $ | 31,620,372 | |
| | 952,603 | | | Southwest Airlines Co. | | | 38,151,750 | |
| | | | | | | | |
| | | | | | | 69,772,122 | |
| | | | | | | | |
| | | | Automobiles — 1.1% | |
| | 567,291 | | | Harley-Davidson, Inc. | | | 32,346,933 | |
| | | | | | | | |
| | | | Banks — 0.4% | |
| | 471,296 | | | Citizens Financial Group, Inc. | | | 12,413,937 | |
| | | | | | | | |
| | | | Beverages — 3.9% | |
| | 646,866 | | | Dr Pepper Snapple Group, Inc. | | | 56,788,366 | |
| | 579,199 | | | PepsiCo, Inc. | | | 62,090,133 | |
| | | | | | | | |
| | | | | | | 118,878,499 | |
| | | | | | | | |
| | | | Biotechnology — 4.1% | |
| | 374,209 | | | Amgen, Inc. | | | 52,823,342 | |
| | 200,354 | | | Biogen, Inc.1 | | | 56,135,184 | |
| | 131,397 | | | United Therapeutics Corp.1 | | | 15,776,838 | |
| | | | | | | | |
| | | | | | | 124,735,364 | |
| | | | | | | | |
| | | | Building Products — 1.0% | |
| | 965,961 | | | Masco Corp. | | | 29,828,876 | |
| | | | | | | | |
| | | | Capital Markets — 1.2% | |
| | 582,399 | | | Charles Schwab Corp. (The) | | | 18,462,048 | |
| | 548,148 | | | TD Ameritrade Holding Corp. | | | 18,752,143 | |
| | | | | | | | |
| | | | | | | 37,214,191 | |
| | | | | | | | |
| | | | Chemicals — 1.0% | |
| | 155,483 | | | Air Products & Chemicals, Inc. | | | 20,744,542 | |
| | 114,211 | | | LyondellBasell Industries N.V. — Class A | | | 9,085,485 | |
| | | | | | | | |
| | | | | | | 29,830,027 | |
| | | | | | | | |
| | | | Commercial Services & Supplies — 1.2% | |
| | 498,355 | | | Avery Dennison Corp. | | | 34,780,195 | |
| | | | | | | | |
| | | | Communications Equipment — 1.3% | |
| | 287,640 | | | F5 Networks, Inc.1 | | | 39,754,724 | |
| | | | | | | | |
| | | | Containers & Packaging — 0.9% | |
| | 338,772 | | | Packaging Corp. of America | | | 27,948,690 | |
| | | | | | | | |
| | | | Distributors — 0.5% | |
| | 449,438 | | | LKQ Corp.1 | | | 14,507,859 | |
| | | | | | | | |
| | | | Diversified Telecommunication Services — 1.0% | |
| | 597,941 | | | Verizon Communications, Inc. | | | 28,760,962 | |
| | | | | | | | |
| | | | Electronic Equipment, Instruments & Components — 3.3% | |
| | 1,026,323 | | | Amphenol Corp. — Class A | | | 67,665,475 | |
| | 694,689 | | | CDW Corp. | | | 31,198,483 | |
| | | | | | | | |
| | | | | | | 98,863,958 | |
| | | | | | | | |
| | | | Equity Real Estate Investment Trusts — 1.4% | |
| | 234,398 | | | Simon Property Group, Inc. | | | 43,588,652 | |
| | | | | | | | |
| | | | Food & Staples Retailing — 2.8% | |
| | 135,829 | | | CVS Health Corp. | | | 11,423,219 | |
| | 1,652,170 | | | Kroger Co. (The) | | | 51,184,227 | |
| | 472,767 | | | SYSCO Corp. | | | 22,749,548 | |
| | | | | | | | |
| | | | | | | 85,356,994 | |
| | | | | | | | |
See Notes to Financial Statements.
THE GLENMEDE FUND, INC.
Large Cap Growth Portfolio
SCHEDULE OF PORTFOLIO INVESTMENTS — (Continued)
October 31, 2016
| | | | | | | | |
| Shares | | | | | Value | |
| |
| COMMON STOCKS* — (Continued) | | | |
| | | | Food Products — 2.6% | |
| | 509,843 | | | Hormel Foods Corp. | | $ | 19,628,956 | |
| | 834,750 | | | Tyson Foods, Inc. — Class A | | | 59,142,037 | |
| | | | | | | | |
| | | | | | | 78,770,993 | |
| | | | | | | | |
| | | | Health Care Equipment & Supplies — 1.0% | |
| | 866,917 | | | Hologic, Inc.1 | | | 31,217,681 | |
| | | | | | | | |
| | | | Health Care Providers & Services — 5.4% | |
| | 560,767 | | | Aetna, Inc. | | | 60,198,337 | |
| | 521,240 | | | Express Scripts Holding Co.1 | | | 35,131,576 | |
| | 351,417 | | | McKesson Corp. | | | 44,689,700 | |
| | 160,700 | | | UnitedHealth Group, Inc. | | | 22,711,731 | |
| | | | | | | | |
| | | | | | | 162,731,344 | |
| | | | | | | | |
| | | | Hotels, Restaurants & Leisure — 3.0% | |
| | 873,621 | | | Marriott International, Inc. — Class A | | | 60,017,763 | |
| | 453,604 | | | Wyndham Worldwide Corp. | | | 29,865,287 | |
| | | | | | | | |
| | | | | | | 89,883,050 | |
| | | | | | | | |
| | | | Household Durables — 0.8% | |
| | 154,299 | | | Snap-on, Inc. | | | 23,777,476 | |
| | | | | | | | |
| | | | Household Products — 0.5% | |
| | 334,811 | | | Church & Dwight Co., Inc. | | | 16,157,979 | |
| | | | | | | | |
| | | | Industrial Conglomerates — 2.3% | |
| | 486,014 | | | Honeywell International, Inc. | | | 53,306,015 | |
| | 143,181 | | | Carlisle Cos., Inc. | | | 15,012,528 | |
| | | | | | | | |
| | | | | | | 68,318,543 | |
| | | | | | | | |
| | | | Insurance — 1.3% | |
| | 607,050 | | | Marsh & McLennan Cos., Inc. | | | 38,480,899 | |
| | | | | | | | |
| | | | Internet Software & Services — 6.3% | |
| | 71,800 | | | Alphabet, Inc. — Class C1 | | | 56,329,972 | |
| | 2,404,406 | | | eBay, Inc.1 | | | 68,549,615 | |
| | 492,094 | | | Facebook, Inc. — Class A1 | | | 64,459,393 | |
| | | | | | | | |
| | | | | | | 189,338,980 | |
| | | | | | | | |
| | | | IT Services — 8.8% | |
| | 498,649 | | | Accenture PLC — Class A | | | 57,962,960 | |
| | 157,996 | | | Mastercard, Inc. — Class A | | | 16,908,732 | |
| | 1,073,307 | | | Paychex, Inc. | | | 59,246,546 | |
| | 1,659,229 | | | PayPal Holdings, Inc.1 | | | 69,123,480 | |
| | 776,362 | | | Visa, Inc. — Class A | | | 64,057,629 | |
| | | | | | | | |
| | | | | | | 267,299,347 | |
| | | | | | | | |
| | | | Leisure Equipment & Products — 1.0% | |
| | 666,631 | | | Brunswick Corp. | | | 28,998,449 | |
| | | | | | | | |
| | | | Life Sciences Tools & Services — 4.1% | |
| | 964,837 | | | Agilent Technologies, Inc. | | | 42,037,948 | |
| | 364,084 | | | Thermo Fisher Scientific, Inc. | | | 53,531,271 | |
| | 212,044 | | | Waters Corp.1 | | | 29,503,802 | |
| | | | | | | | |
| | | | | | | 125,073,021 | |
| | | | | | | | |
| | | | Machinery — 1.8% | |
| | 242,489 | | | Illinois Tool Works, Inc. | | | 27,539,476 | |
| | 336,016 | | | Wabtec Corp. | | | 25,977,397 | |
| | | | | | | | |
| | | | | | | 53,516,873 | |
| | | | | | | | |
| | | | Media — 5.3% | |
| | 897,774 | | | CBS Corp. — Class B | | | 50,831,964 | |
| | 234,877 | | | Comcast Corp. — Class A | | | 14,520,096 | |
See Notes to Financial Statements.
THE GLENMEDE FUND, INC.
Large Cap Growth Portfolio
SCHEDULE OF PORTFOLIO INVESTMENTS — (Continued)
October 31, 2016
| | | | | | | | |
| Shares | | | | | Value | |
| |
| COMMON STOCKS* — (Continued) | | | |
| | | | Media — (Continued) | |
| | 674,200 | | | Omnicom Group, Inc. | | $ | 53,814,644 | |
| | 451,210 | | | Time Warner, Inc. | | | 40,153,178 | |
| | | | | | | | |
| | | | | | | 159,319,882 | |
| | | | | | | | |
| | | | Paper & Forest Products — 0.6% | |
| | 413,557 | | | International Paper Co. | | | 18,622,472 | |
| | | | | | | | |
| | | | Pharmaceuticals — 2.0% | |
| | 723,216 | | | Merck & Co., Inc. | | | 42,467,244 | |
| | 529,815 | | | Mylan N.V.1 | | | 19,338,247 | |
| | | | | | | | |
| | | | | | | 61,805,491 | |
| | | | | | | | |
| | | | Professional Services — 0.7% | |
| | 176,365 | | | Equifax, Inc. | | | 21,863,969 | |
| | | | | | | | |
| | | | Real Estate Management & Development — 0.5% | |
| | 555,086 | | | CBRE Group, Inc. — Class A1 | | | 14,299,015 | |
| | | | | | | | |
| | | | Semiconductors & Semiconductor Equipment — 4.7% | |
| | 2,157,361 | | | Applied Materials, Inc. | | | 62,736,058 | |
| | 352,457 | | | Lam Research Corp. | | | 34,138,985 | |
| | 220,630 | | | Skyworks Solutions, Inc. | | | 16,975,272 | |
| | 393,449 | | | Texas Instruments, Inc. | | | 27,875,862 | |
| | | | | | | | |
| | | | | | | 141,726,177 | |
| | | | | | | | |
| | | | Software — 6.8% | |
| | 1,239,187 | | | Cadence Design Systems, Inc.1 | | | 31,698,403 | |
| | 487,208 | | | Manhattan Associates, Inc.1 | | | 24,672,213 | |
| | 467,940 | | | Microsoft Corp. | | | 28,038,965 | |
| | 1,394,362 | | | Oracle Corp. | | | 53,571,388 | |
| | 864,671 | | | VMware, Inc. — Class A1 | | | 67,963,141 | |
| | | | | | | | |
| | | | | | | 205,944,110 | |
| | | | | | | | |
| | | | Specialty Retail — 8.3% | |
| | 526,124 | | | Foot Locker, Inc. | | | 35,129,299 | |
| | 456,845 | | | Home Depot, Inc. | | | 55,739,658 | |
| | 818,641 | | | Lowe’s Cos., Inc. | | | 54,562,423 | |
| | 55,334 | | | O’Reilly Automotive, Inc.1 | | | 14,632,523 | |
| | 511,458 | | | Ross Stores, Inc. | | | 31,986,583 | |
| | 809,682 | | | TJX Cos., Inc. (The) | | | 59,714,048 | |
| | | | | | | | |
| | | | | | | 251,764,534 | |
| | | | | | | | |
| | | | Technology Hardware, Storage & Peripherals — 2.2% | |
| | 588,677 | | | Apple, Inc. | | | 66,838,387 | |
| | | | | | | | |
| | | | Textiles, Apparel & Luxury Goods — 1.1% | |
| | 638,003 | | | Michael Kors Holdings, Ltd.1 | | | 32,397,792 | |
| | | | | | | | |
| | | | Tobacco — 0.5% | |
| | 241,999 | | | Altria Industrial Motion Corp. | | | 16,000,974 | |
| | | | | | | | |
| | | | Trading Companies & Distributors — 0.5% | |
| | 214,478 | | | MSC Industrial Direct Co., Inc. — Class A | | | 15,613,998 | |
| | | | | | | | |
| | |
| | | | TOTAL COMMON STOCKS
(Cost $2,806,540,035) | | | 3,008,343,419 | |
| | | | | | | | |
See Notes to Financial Statements.
THE GLENMEDE FUND, INC.
Large Cap Growth Portfolio
SCHEDULE OF PORTFOLIO INVESTMENTS — (Continued)
October 31, 2016
| | | | | | | | |
Face
Amount | | | | | Value | |
| |
| REPURCHASE AGREEMENT* — 0.6% | | | |
| $ | 18,094,528 | | | With Fixed Income Clearing Corp., dated 10/31/16, 0.01%, principal and interest in the amount of $18,094,533, due 11/1/16, (collateralized by a U.S. Treasury Bond with a par value of $16,860,000, coupon rate of 3.000%, due 5/15/45, market value of $18,461,700) | | $ | 18,094,528 | |
| | | | | | | | |
| | |
| | | | TOTAL REPURCHASE AGREEMENT
(Cost $18,094,528) | | | 18,094,528 | |
| | | | | | | | |
| | | | | | | | | | |
| | |
TOTAL INVESTMENTS
(Cost $2,824,634,563)2 | | | 100.1 | % | | $ | 3,026,437,947 | |
| | |
LIABILITIES IN EXCESS OF OTHER ASSETS | | | (0.1 | ) | | | (2,981,581 | ) |
| | | | | | | | | | |
| | |
NET ASSETS | | | 100.0 | % | | $ | 3,023,456,366 | |
| | | | | | | | | | |
| * | Percentages indicated are based on net assets. |
| 1 | Non income-producing security. |
| 2 | Aggregate cost for federal tax purposes was $2,826,248,605. |
See Notes to Financial Statements.
THE GLENMEDE FUND, INC.
Large Cap Growth Portfolio
SCHEDULE OF PORTFOLIO INVESTMENTS — (Concluded)
October 31, 2016
INDUSTRY DIVERSIFICATION
On October 31, 2016, industry diversification of the Portfolio was as follows:
| | | | | | | | |
| | | % of
Net Assets | | | Value | |
INDUSTRIES: | | | | | | | | |
IT Services | | | 8.8 | % | | $ | 267,299,347 | |
Specialty Retail | | | 8.3 | | | | 251,764,534 | |
Software | | | 6.8 | | | | 205,944,110 | |
Internet Software & Services | | | 6.3 | | | | 189,338,980 | |
Health Care Providers & Services | | | 5.4 | | | | 162,731,344 | |
Media | | | 5.3 | | | | 159,319,882 | |
Semiconductors & Semiconductor Equipment | | | 4.7 | | | | 141,726,177 | |
Life Sciences Tools & Services | | | 4.1 | | | | 125,073,021 | |
Biotechnology | | | 4.1 | | | | 124,735,364 | |
Beverages | | | 3.9 | | | | 118,878,499 | |
Electronic Equipment, Instruments & Components | | | 3.3 | | | | 98,863,958 | |
Hotels, Restaurants & Leisure | | | 3.0 | | | | 89,883,050 | |
Food & Staples Retailing | | | 2.8 | | | | 85,356,994 | |
Food Products | | | 2.6 | | | | 78,770,993 | |
Airlines | | | 2.3 | | | | 69,772,122 | |
Industrial Conglomerates | | | 2.3 | | | | 68,318,543 | |
Technology Hardware, Storage & Peripherals | | | 2.2 | | | | 66,838,387 | |
Pharmaceuticals | | | 2.0 | | | | 61,805,491 | |
Machinery | | | 1.8 | | | | 53,516,873 | |
Equity Real Estate Investment Trusts | | | 1.4 | | | | 43,588,652 | |
Communications Equipment | | | 1.3 | | | | 39,754,724 | |
Insurance | | | 1.3 | | | | 38,480,899 | |
Capital Markets | | | 1.2 | | | | 37,214,191 | |
Commercial Services & Supplies | | | 1.2 | | | | 34,780,195 | |
Textiles, Apparel & Luxury Goods | | | 1.1 | | | | 32,397,792 | |
Automobiles | | | 1.1 | | | | 32,346,933 | |
Health Care Equipment & Supplies | | | 1.0 | | | | 31,217,681 | |
Chemicals | | | 1.0 | | | | 29,830,027 | |
Building Products | | | 1.0 | | | | 29,828,876 | |
Leisure Equipment & Products | | | 1.0 | | | | 28,998,449 | |
Diversified Telecommunication Services | | | 1.0 | | | | 28,760,962 | |
Containers & Packaging | | | 0.9 | | | | 27,948,690 | |
Household Durables | | | 0.8 | | | | 23,777,476 | |
Professional Services | | | 0.7 | | | | 21,863,969 | |
Paper & Forest Products | | | 0.6 | | | | 18,622,472 | |
Household Products | | | 0.5 | | | | 16,157,979 | |
Tobacco | | | 0.5 | | | | 16,000,974 | |
Trading Companies & Distributors | | | 0.5 | | | | 15,613,998 | |
Distributors | | | 0.5 | | | | 14,507,859 | |
Real Estate Management & Development | | | 0.5 | | | | 14,299,015 | |
Banks | | | 0.4 | | | | 12,413,937 | |
| | | | | | | | |
TOTAL COMMON STOCKS | | | 99.5 | % | | $ | 3,008,343,419 | |
| | |
REPURCHASE AGREEMENT | | | 0.6 | | | | 18,094,528 | |
| | | | | | | | |
TOTAL INVESTMENTS | | | 100.1 | % | | $ | 3,026,437,947 | |
| | | | | | | | |
See Notes to Financial Statements.
THE GLENMEDE FUND, INC.
Long/Short Portfolio
SCHEDULE OF PORTFOLIO INVESTMENTS
October 31, 2016
| | | | | | | | |
| Shares | | | | | Value | |
|
| COMMON STOCKS* — 96.4% | |
| | | | Aerospace & Defense — 0.5% | |
| | 24,780 | | | Spirit AeroSystems Holdings, Inc. — Class A1 | | $ | 1,247,921 | |
| | | | | | | | |
| | | | Air Freight & Logistics — 2.5% | |
| | 33,780 | | | CH Robinson Worldwide, Inc. | | | 2,301,094 | |
| | 23,960 | | | Expeditors International of Washington, Inc. | | | 1,233,221 | |
| | 22,900 | | | United Parcel Service, Inc. — Class B | | | 2,467,704 | |
| | | | | | | | |
| | | | | | | 6,002,019 | |
| | | | | | | | |
| | | | Airlines — 1.0% | |
| | 58,000 | | | Southwest Airlines Co. | | | 2,322,900 | |
| | | | | | | | |
| | | | Auto Components — 0.7% | |
| | 27,980 | | | Tenneco, Inc.1 | | | 1,540,859 | |
| | | | | | | | |
| | | | Banks — 4.0% | |
| | 46,900 | | | East West Bancorp, Inc. | | | 1,853,019 | |
| | 71,620 | | | Huntington Bancshares, Inc. | | | 759,172 | |
| | 155,000 | | | KeyCorp | | | 2,188,600 | |
| | 48,380 | | | SunTrust Banks, Inc. | | | 2,188,228 | |
| | 185,960 | | | TCF Financial Corp. | | | 2,659,228 | |
| | | | | | | | |
| | | | | | | 9,648,247 | |
| | | | | | | | |
| | | | Beverages — 1.9% | |
| | 22,720 | | | Dr Pepper Snapple Group, Inc. | | | 1,994,589 | |
| | 22,700 | | | PepsiCo, Inc. | | | 2,433,440 | |
| | | | | | | | |
| | | | | | | 4,428,029 | |
| | | | | | | | |
| | | | Biotechnology — 1.4% | |
| | 61,180 | | | Acorda Therapeutics, Inc.1 | | | 1,082,886 | |
| | 82,660 | | | Emergent BioSolutions, Inc.1 | | | 2,208,675 | |
| | | | | | | | |
| | | | | | | 3,291,561 | |
| | | | | | | | |
| | | | Capital Markets — 1.6% | |
| | 27,940 | | | Bank of New York Mellon Corp. (The) | | | 1,208,964 | |
| | 26,740 | | | CME Group, Inc. | | | 2,676,674 | |
| | | | | | | | |
| | | | | | | 3,885,638 | |
| | | | | | | | |
| | | | Chemicals — 1.3% | |
| | 48,460 | | | Dow Chemical Co. (The) | | | 2,607,633 | |
| | 7,680 | | | Minerals Technologies, Inc. | | | 516,096 | |
| | | | | | | | |
| | | | | | | 3,123,729 | |
| | | | | | | | |
| | | | Commercial Services & Supplies — 2.6% | |
| | 123,000 | | | Pitney Bowes, Inc. | | | 2,194,320 | |
| | 39,740 | | | Republic Services, Inc. | | | 2,091,516 | |
| | 31,960 | | | Sykes Enterprises, Inc.1 | | | 854,611 | |
| | 30,860 | | | Tetra Tech, Inc. | | | 1,186,567 | |
| | | | | | | | |
| | | | | | | 6,327,014 | |
| | | | | | | | |
| | | | Communications Equipment — 0.9% | |
| | 70,460 | | | Cisco Systems, Inc. | | | 2,161,713 | |
| | | | | | | | |
| | | | Construction & Engineering — 2.2% | |
| | 49,460 | | | EMCOR Group, Inc. | | | 2,990,351 | |
| | 158,860 | | | KBR, Inc. | | | 2,352,717 | |
| | | | | | | | |
| | | | | | | 5,343,068 | |
| | | | | | | | |
| | | | Consumer Finance — 1.0% | |
| | 41,980 | | | Discover Financial Services | | | 2,364,733 | |
| | | | | | | | |
| | | | Containers & Packaging — 1.5% | |
| | 163,120 | | | Graphic Packaging Holding Co. | | | 2,039,000 | |
| | 17,560 | | | Packaging Corp. of America | | | 1,448,700 | |
| | | | | | | | |
| | | | | | | 3,487,700 | |
| | | | | | | | |
See Notes to Financial Statements.
THE GLENMEDE FUND, INC.
Long/Short Portfolio
SCHEDULE OF PORTFOLIO INVESTMENTS — (Continued)
October 31, 2016
| | | | | | | | |
| Shares | | | | | Value | |
|
| COMMON STOCKS* — (Continued) | |
| | | | Diversified Consumer Services — 0.5% | |
| | 50,300 | | | Service Corp. International | | $ | 1,287,680 | |
| | | | | | | | |
| | | | Diversified Financial Services — 1.1% | |
| | 165,000 | | | Bank of America Corp. | | | 2,722,500 | |
| | | | | | | | |
| | | | Diversified Telecommunication Services — 0.6% | |
| | 51,180 | | | CenturyLink, Inc. | | | 1,360,364 | |
| | | | | | | | |
| | | | Electric Utilities — 2.4% | |
| | 22,794 | | | American Electric Power Co., Inc. | | | 1,477,963 | |
| | 26,980 | | | Entergy Corp. | | | 1,987,887 | |
| | 69,460 | | | Exelon Corp. | | | 2,366,502 | |
| | | | | | | | |
| | | | | | | 5,832,352 | |
| | | | | | | | |
| | | | Electrical Equipment — 1.9% | |
| | 50,320 | | | AO Smith Corp. | | | 2,272,954 | |
| | 35,300 | | | EnerSys | | | 2,299,089 | |
| | | | | | | | |
| | | | | | | 4,572,043 | |
| | | | | | | | |
| | | | Electronic Equipment, Instruments & Components — 1.9% | |
| | 18,520 | | | Arrow Electronics, Inc.1 | | | 1,131,942 | |
| | 69,180 | | | Methode Electronics, Inc. | | | 2,158,416 | |
| | 16,200 | | | Tech Data Corp.1 | | | 1,247,724 | |
| | | | | | | | |
| | | | | | | 4,538,082 | |
| | | | | | | | |
| | | | Energy Equipment & Services — 1.7% | |
| | 143,765 | | | Nabors Industries, Ltd. | | | 1,710,804 | |
| | 204,480 | | | Noble Corp. PLC | | | 1,010,131 | |
| | 99,200 | | | Superior Energy Services, Inc. | | | 1,404,672 | |
| | | | | | | | |
| | | | | | | 4,125,607 | |
| | | | | | | | |
| | | | Equity Real Estate Investment Trusts — 8.4% | |
| | 56,180 | | | Apartment Investment & Management Co. — Class A | | | 2,475,852 | |
| | 95,400 | | | Corporate Office Properties Trust | | | 2,546,226 | |
| | 15,100 | | | Equity Lifestyle Properties, Inc. | | | 1,145,184 | |
| | 127,100 | | | Government Properties Income Trust2 | | | 2,432,694 | |
| | 87,500 | | | Hospitality Properties Trust | | | 2,394,000 | |
| | 128,860 | | | Host Hotels & Resorts, Inc. | | | 1,994,753 | |
| | 74,000 | | | Liberty Property Trust | | | 2,991,820 | |
| | 94,960 | | | Piedmont Office Realty Trust, Inc. — Class A | | | 1,944,781 | |
| | 56,000 | | | RLJ Lodging Trust | | | 1,104,320 | |
| | 33,220 | | | Tanger Factory Outlet Centers, Inc. | | | 1,156,056 | |
| | | | | | | | |
| | | | | | | 20,185,686 | |
| | | | | | | | |
| | | | Food & Staples Retailing — 1.0% | |
| | 5,740 | | | CVS Health Corp. | | | 482,734 | |
| | 37,960 | | | SYSCO Corp. | | | 1,826,635 | |
| | | | | | | | |
| | | | | | | 2,309,369 | |
| | | | | | | | |
| | | | Food Products — 2.8% | |
| | 50,620 | | | ConAgra Foods, Inc. | | | 2,438,871 | |
| | 14,340 | | | Ingredion, Inc. | | | 1,880,978 | |
| | 32,320 | | | Tyson Foods, Inc. — Class A | | | 2,289,872 | |
| | | | | | | | |
| | | | | | | 6,609,721 | |
| | | | | | | | |
| | | | Health Care Equipment & Supplies — 2.3% | |
| | 31,200 | | | Align Technology, Inc.1 | | | 2,680,704 | |
| | 23,260 | | | Cynosure, Inc. — Class A1 | | | 992,039 | |
| | 30,880 | | | Hill-Rom Holdings, Inc. | | | 1,711,061 | |
| | | | | | | | |
| | | | | | | 5,383,804 | |
| | | | | | | | |
| | | | Health Care Providers & Services — 2.4% | |
| | 68,220 | | | AMN Healthcare Services, Inc.1 | | | 2,237,616 | |
See Notes to Financial Statements.
THE GLENMEDE FUND, INC.
Long/Short Portfolio
SCHEDULE OF PORTFOLIO INVESTMENTS — (Continued)
October 31, 2016
| | | | | | | | |
| Shares | | | | | Value | |
|
| COMMON STOCKS* — (Continued) | |
| | | | Health Care Providers & Services — (Continued) | |
| | 15,640 | | | Cardinal Health, Inc. | | $ | 1,074,312 | |
| | 21,120 | | | WellCare Health Plans, Inc.1 | | | 2,397,331 | |
| | | | | | | | |
| | | | | | | 5,709,259 | |
| | | | | | | | |
| | | | Hotels, Restaurants & Leisure — 0.9% | |
| | 33,900 | | | Wyndham Worldwide Corp. | | | 2,231,976 | |
| | | | | | | | |
| | | | Household Durables — 1.6% | |
| | 37,620 | | | Leggett & Platt, Inc. | | | 1,726,006 | |
| | 41,860 | | | Newell Brands, Inc. | | | 2,010,117 | |
| | | | | | | | |
| | | | | | | 3,736,123 | |
| | | | | | | | |
| | | | Household Products — 0.5% | |
| | 25,320 | | | Church & Dwight Co., Inc. | | | 1,221,943 | |
| | | | | | | | |
| | | | Industrial Conglomerates — 1.0% | |
| | 21,140 | | | Honeywell International, Inc. | | | 2,318,635 | |
| | | | | | | | |
| | | | Insurance — 5.2% | |
| | 24,980 | | | Aflac, Inc. | | | 1,720,373 | |
| | 22,020 | | | CNA Financial Corp. | | | 805,271 | |
| | 22,220 | | | Endurance Specialty Holdings, Ltd. | | | 2,043,129 | |
| | 59,020 | | | Old Republic International Corp. | | | 995,077 | |
| | 51,500 | | | Principal Financial Group, Inc. | | | 2,811,900 | |
| | 18,420 | | | Travelers Cos., Inc. (The) | | | 1,992,676 | |
| | 61,160 | | | Unum Group | | | 2,165,064 | |
| | | | | | | | |
| | | | | | | 12,533,490 | |
| | | | | | | | |
| | | | IT Services — 2.4% | |
| | 33,500 | | | Amdocs, Ltd. | | | 1,958,075 | |
| | 12,400 | | | Automatic Data Processing, Inc. | | | 1,079,544 | |
| | 47,200 | | | Convergys Corp. | | | 1,378,240 | |
| | 61,260 | | | Genpact, Ltd.1 | | | 1,408,367 | |
| | | | | | | | |
| | | | | | | 5,824,226 | |
| | | | | | | | |
| | | | Leisure Equipment & Products — 1.2% | |
| | 18,380 | | | Hasbro, Inc. | | | 1,533,076 | |
| | 52,180 | | | Smith & Wesson Holding Corp.1,2 | | | 1,379,117 | |
| | | | | | | | |
| | | | | | | 2,912,193 | |
| | | | | | | | |
| | | | Life Sciences Tools & Services — 2.2% | |
| | 20,020 | | | Charles River Laboratories International, Inc.1 | | | 1,519,118 | |
| | 26,120 | | | PAREXEL International Corp.1 | | | 1,521,751 | |
| | 43,340 | | | PerkinElmer, Inc. | | | 2,205,572 | |
| | | | | | | | |
| | | | | | | 5,246,441 | |
| | | | | | | | |
| | | | Machinery — 3.6% | |
| | 47,480 | | | AGCO Corp. | | | 2,425,278 | |
| | 39,420 | | | Crane Co. | | | 2,680,954 | |
| | 115,060 | | | Federal Signal Corp. | | | 1,412,937 | |
| | 9,500 | | | Illinois Tool Works, Inc. | | | 1,078,915 | |
| | 50,620 | | | Trinity Industries, Inc. | | | 1,080,737 | |
| | | | | | | | |
| | | | | | | 8,678,821 | |
| | | | | | | | |
| | | | Marine — 0.9% | |
| | 51,760 | | | Matson, Inc. | | | 2,067,294 | |
| | | | | | | | |
| | | | Media — 3.3% | |
| | 38,140 | | | Comcast Corp. — Class A | | | 2,357,815 | |
| | 68,900 | | | Interpublic Group of Cos., Inc. (The) | | | 1,542,671 | |
| | 21,900 | | | Omnicom Group, Inc. | | | 1,748,058 | |
| | 34,420 | | | Scripps Networks Interactive, Inc. — Class A | | | 2,215,271 | |
| | | | | | | | |
| | | | | | | 7,863,815 | |
| | | | | | | | |
See Notes to Financial Statements.
THE GLENMEDE FUND, INC.
Long/Short Portfolio
SCHEDULE OF PORTFOLIO INVESTMENTS — (Continued)
October 31, 2016
| | | | | | | | |
| Shares | | | | | Value | |
|
| COMMON STOCKS* — (Continued) | |
| | | | Metals & Mining — 2.6% | |
| | 80,720 | | | Commercial Metals Co. | | $ | 1,268,111 | |
| | 80,460 | | | Newmont Mining Corp. | | | 2,980,239 | |
| | 27,040 | | | Reliance Steel & Aluminum Co. | | | 1,859,811 | |
| | | | | | | | |
| | | | | | | 6,108,161 | |
| | | | | | | | |
| | | | Multi-Utilities — 2.8% | |
| | 49,640 | | | Ameren Corp. | | | 2,479,518 | |
| | 45,000 | | | Public Service Enterprise Group, Inc. | | | 1,893,600 | |
| | 33,000 | | | SCANA Corp. | | | 2,420,880 | |
| | | | | | | | |
| | | | | | | 6,793,998 | |
| | | | | | | | |
| | | | Office Electronics — 0.9% | |
| | 224,880 | | | Xerox Corp. | | | 2,197,078 | |
| | | | | | | | |
| | | | Oil, Gas & Consumable Fuels — 2.8% | |
| | 26,260 | | | HollyFrontier Corp. | | | 655,187 | |
| | 26,660 | | | PBF Energy, Inc. — Class A | | | 581,188 | |
| | 9,020 | | | Tesoro Corp. | | | 766,429 | |
| | 42,160 | | | Valero Energy Corp. | | | 2,497,559 | |
| | 56,640 | | | World Fuel Services Corp. | | | 2,279,760 | |
| | | | | | | | |
| | | | | | | 6,780,123 | |
| | | | | | | | |
| | | | Paper & Forest Products — 0.8% | |
| | 53,620 | | | Schweitzer-Mauduit International, Inc. | | | 1,979,114 | |
| | | | | | | | |
| | | | Pharmaceuticals — 2.0% | |
| | 15,720 | | | Johnson & Johnson | | | 1,823,363 | |
| | 194,713 | | | Sciclone Pharmaceuticals, Inc.1 | | | 1,742,681 | |
| | 65,940 | | | Supernus Pharmaceuticals, Inc.1 | | | 1,305,612 | |
| | | | | | | | |
| | | | | | | 4,871,656 | |
| | | | | | | | |
| | | | Professional Services — 2.8% | |
| | 80,660 | | | Korn/Ferry International | | | 1,644,657 | |
| | 28,720 | | | Manpowergroup, Inc. | | | 2,205,696 | |
| | 121,100 | | | Navigant Consulting, Inc.1 | | | 2,833,740 | |
| | | | | | | | |
| | | | | | | 6,684,093 | |
| | | | | | | | |
| | | | Real Estate Management & Development — 0.6% | |
| | 31,880 | | | RE/MAX Holdings, Inc. — Class A | | | 1,385,186 | |
| | | | | | | | |
| | | | Semiconductors & Semiconductor Equipment — 2.8% | |
| | 55,760 | | | NVIDIA Corp. | | | 3,967,882 | |
| | 120,000 | | | Teradyne, Inc. | | | 2,794,800 | |
| | | | | | | | |
| | | | | | | 6,762,682 | |
| | | | | | | | |
| | | | Software — 1.9% | |
| | 57,220 | | | Cadence Design Systems, Inc.1 | | | 1,463,688 | |
| | 50,060 | | | Synopsys, Inc.1 | | | 2,969,058 | |
| | | | | | | | |
| | | | | | | 4,432,746 | |
| | | | | | | | |
| | | | Specialty Retail — 3.5% | |
| | 30,760 | | | Childrens Place2 | | | 2,336,222 | |
| | 30,400 | | | Foot Locker, Inc. | | | 2,029,808 | |
| | 28,760 | | | Lowe’s Cos., Inc. | | | 1,916,854 | |
| | 27,080 | | | TJX Cos., Inc. (The) | | | 1,997,150 | |
| | | | | | | | |
| | | | | | | 8,280,034 | |
| | | | | | | | |
| | |
| | | | TOTAL COMMON STOCKS
(Cost $209,467,561) | | | 230,721,426 | |
| | | | | | | | |
See Notes to Financial Statements.
THE GLENMEDE FUND, INC.
Long/Short Portfolio
SCHEDULE OF PORTFOLIO INVESTMENTS — (Continued)
October 31, 2016
| | | | | | | | |
| | |
Face
Amount | | | | | Value | |
| |
| REPURCHASE AGREEMENT* — 2.4% | | | |
| $ | 5,813,985 | | | With Fixed Income Clearing Corp., dated 10/31/16, 0.01%, principal and interest in the amount of $5,813,987, due 11/1/16, (collateralized by a U.S. Treasury Bond with a par value of $5,420,000, coupon rate of 3.000%, due 5/15/45, market value of $5,934,900) | | $ | 5,813,985 | |
| | | | | | | | |
| | |
| | | | TOTAL REPURCHASE AGREEMENTS
(Cost $5,813,985) | | | 5,813,985 | |
| | | | | | | | |
| | |
| Shares | | | | | | |
| |
| INVESTMENT OF SECURITY LENDING COLLATERAL* — 1.8% | | | |
| | 4,252,730 | | | State Street Navigator Securities Lending Government Money Market Portfolio | | | 4,252,730 | |
| | | | | | | | |
| | |
| | | | TOTAL INVESTMENT OF SECURITY LENDING COLLATERAL
(Cost $4,252,730) | | | 4,252,730 | |
| | | | | | | | |
| | | | | | | | | | |
| | |
TOTAL LONG INVESTMENTS
(Cost $219,534,276) | | | 100.6 | % | | $ | 240,788,141 | |
| | | | | | | | | | |
| | | | | | | | |
| |
| COMMON STOCKS SOLD SHORT* — (66.1)% | | | |
| | | | Aerospace & Defense — (1.9)% | | | |
| | (32,760 | ) | | Orbital ATK, Inc. | | | (2,436,034 | ) |
| | (26,220 | ) | | Rockwell Collins, Inc. | | | (2,210,870 | ) |
| | | | | | | | |
| | | | | | | (4,646,904 | ) |
| | | | | | | | |
| | | | Air Freight & Logistics — (1.1)% | |
| | (14,920 | ) | | FedEx Corp. | | | (2,600,854 | ) |
| | | | | | | | |
| | | | Banks — (4.0)% | |
| | (40,420 | ) | | Bank of the Ozarks, Inc. | | | (1,493,923 | ) |
| | (42,220 | ) | | Banner Corp. | | | (1,905,811 | ) |
| | (98,860 | ) | | Investors Bancorp, Inc. | | | (1,212,024 | ) |
| | (46,420 | ) | | Pinnacle Financial Partners, Inc. | | | (2,395,272 | ) |
| | (62,920 | ) | | Webster Financial Corp. | | | (2,541,968 | ) |
| | | | | | | | |
| | | | | | | (9,548,998 | ) |
| | | | | | | | |
| | | | Beverages — (2.4)% | |
| | (26,740 | ) | | Brown-Forman Corp. — Class B | | | (1,234,586 | ) |
| | (52,340 | ) | | Coca-Cola Co. (The) | | | (2,219,216 | ) |
| | (22,880 | ) | | Molson Coors Brewing Co. — Class B | | | (2,375,173 | ) |
| | | | | | | | |
| | | | | | | (5,828,975 | ) |
| | | | | | | | |
| | | | Capital Markets — (1.0)% | |
| | (7,340 | ) | | FactSet Research Systems, Inc. | | | (1,135,645 | ) |
| | (12,260 | ) | | Moody’s Corp. | | | (1,232,375 | ) |
| | | | | | | | |
| | | | | | | (2,368,020 | ) |
| | | | | | | | |
| | | | Chemicals — (1.8)% | |
| | (33,980 | ) | | EI du Pont de Nemours & Co. | | | (2,337,484 | ) |
| | (22,460 | ) | | Scotts Miracle-Gro Co. (The) — Class A | | | (1,978,502 | ) |
| | | | | | | | |
| | | | | | | (4,315,986 | ) |
| | | | | | | | |
| | | | Commercial Services & Supplies — (3.4)% | |
| | (53,120 | ) | | Clean Harbors, Inc.1 | | | (2,513,639 | ) |
| | (129,400 | ) | | Covanta Holding Corp. | | | (1,941,000 | ) |
| | (27,380 | ) | | Stericycle, Inc.1 | | | (2,192,864 | ) |
| | (35,200 | ) | | US Ecology, Inc. | | | (1,487,200 | ) |
| | | | | | | | |
| | | | | | | (8,134,703 | ) |
| | | | | | | | |
| | | | Construction Materials — (2.2)% | |
| | (19,560 | ) | | Eagle Materials, Inc. | | | (1,583,773 | ) |
| | (13,380 | ) | | Martin Marietta Materials, Inc. | | | (2,480,385 | ) |
See Notes to Financial Statements.
THE GLENMEDE FUND, INC.
Long/Short Portfolio
SCHEDULE OF PORTFOLIO INVESTMENTS — (Continued)
October 31, 2016
| | | | | | | | |
| | |
| Shares | | | | | Value | |
| |
| COMMON STOCKS SOLD SHORT* — (Continued) | | | |
| | | | Construction Materials — (Continued) | |
| | (10,780 | ) | | Vulcan Materials Co. | | $ | (1,220,296 | ) |
| | | | | | | | |
| | | | | | | (5,284,454 | ) |
| | | | | | | | |
| | | | Consumer Finance — (0.7)% | |
| | (36,220 | ) | | FirstCash, Inc. | | | (1,709,584 | ) |
| | | | | | | | |
| | | | Containers & Packaging — (0.5)% | | | |
| | (15,300 | ) | | Ball Corp. | | | (1,179,171 | ) |
| | | | | | | | |
| | | | Electrical Equipment — (0.9)% | |
| | (10,040 | ) | | Acuity Brands, Inc. | | | (2,244,643 | ) |
| | | | | | | | |
| | | | Equity Real Estate Investment Trusts — (7.6)% | |
| | (34,400 | ) | | Acadia Realty Trust | | | (1,158,936 | ) |
| | (137,500 | ) | | American Homes 4 Rent — Class A | | | (2,902,625 | ) |
| | (20,120 | ) | | American Tower Corp. | | | (2,357,863 | ) |
| | (6,220 | ) | | Equinix, Inc. | | | (2,222,282 | ) |
| | (9,460 | ) | | Essex Property Trust, Inc. | | | (2,025,291 | ) |
| | (50,920 | ) | | HCP, Inc. | | | (1,744,010 | ) |
| | (35,760 | ) | | Realty Income Corp. | | | (2,118,422 | ) |
| | (20,580 | ) | | SL Green Realty Corp. | | | (2,021,368 | ) |
| | (17,920 | ) | | Vornado Realty Trust | | | (1,662,617 | ) |
| | | | | | | | |
| | | | | | | (18,213,414 | ) |
| | | | | | | | |
| | | | Gas Utilities — (0.5)% | |
| | (17,180 | ) | | EQT Corp. | | | (1,133,880 | ) |
| | | | | | | | |
| | | | Health Care Equipment & Supplies — (3.8)% | |
| | (34,540 | ) | | Abbott Laboratories | | | (1,355,350 | ) |
| | (10,580 | ) | | CR Bard, Inc. | | | (2,292,474 | ) |
| | (26,720 | ) | | DexCom, Inc.1 | | | (2,090,573 | ) |
| | (26,900 | ) | | Medtronic PLC | | | (2,206,338 | ) |
| | (18,640 | ) | | ResMed, Inc. | | | (1,114,113 | ) |
| | | | | | | | |
| | | | | | | (9,058,848 | ) |
| | | | | | | | |
| | | | Health Care Providers & Services — (0.4)% | |
| | (65,740 | ) | | Capital Senior Living Corp.1 | | | (1,049,868 | ) |
| | | | | | | | |
| | | | Hotels, Restaurants & Leisure — (2.9)% | |
| | (39,240 | ) | | Bob Evans Farms, Inc. | | | (1,617,473 | ) |
| | (4,400 | ) | | Chipotle Mexican Grill, Inc.1 | | | (1,587,344 | ) |
| | (24,420 | ) | | Jack In The Box, Inc. | | | (2,288,887 | ) |
| | (26,120 | ) | | Las Vegas Sands Corp. | | | (1,511,825 | ) |
| | | | | | | | |
| | | | | | | (7,005,529 | ) |
| | | | | | | | |
| | | | Household Durables — (1.5)% | |
| | (75,000 | ) | | CalAtlantic Group, Inc. | | | (2,424,000 | ) |
| | (49,980 | ) | | MDC Holdings, Inc. | | | (1,185,026 | ) |
| | | | | | | | |
| | | | | | | (3,609,026 | ) |
| | | | | | | | |
| | | | Industrial Conglomerates — (0.9)% | |
| | (12,880 | ) | | 3M Co. | | | (2,129,064 | ) |
| | | | | | | | |
| | | | Insurance — (3.0)% | |
| | (40,360 | ) | | American International Group, Inc. | | | (2,490,212 | ) |
| | (1,300 | ) | | Markel Corp.1 | | | (1,140,659 | ) |
| | (37,740 | ) | | Progressive Corp. (The) | | | (1,189,187 | ) |
| | (17,640 | ) | | RLI Corp. | | | (983,254 | ) |
| | (28,660 | ) | | Stewart Information Services Corp. | | | (1,288,267 | ) |
| | | | | | | | |
| | | | | | | (7,091,579 | ) |
| | | | | | | | |
| | | | Internet Software & Services — (0.7)% | |
| | (38,140 | ) | | Yahoo!, Inc.1 | | | (1,584,717 | ) |
| | | | | | | | |
See Notes to Financial Statements.
THE GLENMEDE FUND, INC.
Long/Short Portfolio
SCHEDULE OF PORTFOLIO INVESTMENTS — (Continued)
October 31, 2016
| | | | | | | | |
| | |
| Shares | | | | | Value | |
| |
| COMMON STOCKS SOLD SHORT* — (Continued) | | | |
| | | | Leisure Equipment & Products — (0.9)% | |
| | (71,180 | ) | | Mattel, Inc. | | $ | (2,244,305 | ) |
| | | | | | | | |
| | | | Life Sciences Tools & Services — (0.9)% | |
| | (21,500 | ) | | Bio-Techne Corp. | | | (2,235,785 | ) |
| | | | | | | | |
| | | | Machinery — (3.5)% | |
| | (28,100 | ) | | Caterpillar, Inc. | | | (2,345,226 | ) |
| | (31,620 | ) | | Dover Corp. | | | (2,115,062 | ) |
| | (35,700 | ) | | Pentair PLC | | | (1,968,141 | ) |
| | (26,340 | ) | | RBC Bearings, Inc.1 | | | (1,879,359 | ) |
| | | | | | | | |
| | | | | | | (8,307,788 | ) |
| | | | | | | | |
| | | | Marine — (1.0)% | |
| | (40,000 | ) | | Kirby Corp.1 | | | (2,358,000 | ) |
| | | | | | | | |
| | | | Multi-Utilities — (2.7)% | |
| | (32,140 | ) | | Dominion Resources, Inc. | | | (2,416,928 | ) |
| | (91,240 | ) | | NiSource, Inc. | | | (2,122,242 | ) |
| | (17,220 | ) | | Sempra Energy | | | (1,844,262 | ) |
| | | | | | | | |
| | | | | | | (6,383,432 | ) |
| | | | | | | | |
| | | | Office Electronics — (1.2)% | |
| | (45,460 | ) | | Zebra Technologies Corp. — Class A1 | | | (2,993,086 | ) |
| | | | | | | | |
| | | | Oil, Gas & Consumable Fuels — (2.5)% | |
| | (59,960 | ) | | Carrizo Oil & Gas, Inc.1 | | | (2,028,447 | ) |
| | (65,520 | ) | | Cheniere Energy, Inc.1 | | | (2,470,104 | ) |
| | (7,720 | ) | | Pioneer Natural Resources Co. | | | (1,382,034 | ) |
| | | | | | | | |
| | | | | | | (5,880,585 | ) |
| | | | | | | | |
| | | | Pharmaceuticals — (1.0)% | |
| | (10,960 | ) | | Allergan PLC1 | | | (2,289,982 | ) |
| | | | | | | | |
| | | | Professional Services — (0.6)% | |
| | (37,140 | ) | | Advisory Board Co. (The)1 | | | (1,478,172 | ) |
| | | | | | | | |
| | | | Road & Rail — (3.5)% | |
| | (3,160 | ) | | Amerco, Inc. | | | (1,018,752 | ) |
| | (29,560 | ) | | JB Hunt Transport Services, Inc. | | | (2,412,392 | ) |
| | (31,240 | ) | | Kansas City Southern | | | (2,741,622 | ) |
| | (22,800 | ) | | Norfolk Southern Corp. | | | (2,120,400 | ) |
| | | | | | | | |
| | | | | | | (8,293,166 | ) |
| | | | | | | | |
| | | | Semiconductors & Semiconductor Equipment — (1.1)% | |
| | (61,120 | ) | | Microsemi Corp.1 | | | (2,574,986 | ) |
| | | | | | | | |
| | | | Software — (1.0)% | |
| | (32,520 | ) | | Salesforce.com, Inc.1 | | | (2,444,203 | ) |
| | | | | | | | |
| | | | Specialty Retail — (2.6)% | |
| | (14,580 | ) | | Advance Auto Parts, Inc. | | | (2,042,366 | ) |
| | (33,000 | ) | | Genesco, Inc.1 | | | (1,775,400 | ) |
| | (34,700 | ) | | L Brands, Inc. | | | (2,504,993 | ) |
| | | | | | | | |
| | | | | | | (6,322,759 | ) |
| | | | | | | | |
| | | | Textiles, Apparel & Luxury Goods — (0.8)% | |
| | (24,400 | ) | | NIKE, Inc. — Class B | | | (1,224,392 | ) |
| | (28,198 | ) | | Under Armour, Inc. — Class C1 | | | (729,200 | ) |
| | | | | | | | |
| | | | | | | (1,953,592 | ) |
| | | | | | | | |
See Notes to Financial Statements.
THE GLENMEDE FUND, INC.
Long/Short Portfolio
SCHEDULE OF PORTFOLIO INVESTMENTS — (Continued)
October 31, 2016
| | | | | | | | |
| | |
| Shares | | | | | Value | |
| |
| COMMON STOCKS SOLD SHORT* — (Continued) | | | |
| | | | Water and Sewer — (1.6)% | |
| | (52,140 | ) | | American States Water Co. | | $ | (2,084,557 | ) |
| | (53,440 | ) | | California Water Service Group | | | (1,656,640 | ) |
| | | | | | | | |
| | | | | | | (3,741,197 | ) |
| | | | | | | | |
| | |
| | | | TOTAL COMMON STOCKS SOLD SHORT
(Proceeds $(164,217,288)) | | | (158,239,255 | ) |
| | | | | | | | |
| | | | | | | | | | |
| | |
TOTAL SHORT INVESTMENTS
(Proceeds $(164,217,288)) | | | (66.1 | )% | | $ | (158,239,255 | ) |
| | |
TOTAL INVESTMENTS
(Cost $55,316,988)3 | | | 34.5 | % | | $ | 82,548,886 | |
| | |
OTHER ASSETS IN EXCESS OF LIABILITIES | | | 65.5 | | | | 156,864,567 | |
| | | | | | | | | | |
| | |
NET ASSETS | | | 100.0 | % | | $ | 239,413,453 | |
| | | | | | | | | | |
| * | Percentages indicated are based on net assets. |
| 1 | Non income-producing security. |
| 2 | Securities or partial securities on loan. See Note 1. |
| 3 | Aggregate cost for federal tax purposes was $56,905,393. |
See Notes to Financial Statements.
THE GLENMEDE FUND, INC.
Long/Short Portfolio
SCHEDULE OF PORTFOLIO INVESTMENTS — (Continued)
October 31, 2016
| | | | | | | | |
| | | % of
Net Assets | | | Value | |
INDUSTRIES: | | | | | | | | |
Long Positions: | | | | | | | | |
Equity Real Estate Investment Trusts | | | 8.4 | % | | $ | 20,185,686 | |
Insurance | | | 5.2 | | | | 12,533,490 | |
Banks | | | 4.0 | | | | 9,648,247 | |
Machinery | | | 3.6 | | | | 8,678,821 | |
Specialty Retail | | | 3.5 | | | | 8,280,034 | |
Media | | | 3.3 | | | | 7,863,815 | |
Multi-Utilities | | | 2.8 | | | | 6,793,998 | |
Oil, Gas & Consumable Fuels | | | 2.8 | | | | 6,780,123 | |
Semiconductors & Semiconductor Equipment | | | 2.8 | | | | 6,762,682 | |
Professional Services | | | 2.8 | | | | 6,684,093 | |
Food Products | | | 2.8 | | | | 6,609,721 | |
Commercial Services & Supplies | | | 2.6 | | | | 6,327,014 | |
Metals & Mining | | | 2.6 | | | | 6,108,161 | |
Air Freight & Logistics | | | 2.5 | | | | 6,002,019 | |
Electric Utilities | | | 2.4 | | | | 5,832,352 | |
IT Services | | | 2.4 | | | | 5,824,226 | |
Health Care Providers & Services | | | 2.4 | | | | 5,709,259 | |
Health Care Equipment & Supplies | | | 2.3 | | | | 5,383,804 | |
Construction & Engineering | | | 2.2 | | | | 5,343,068 | |
Life Sciences Tools & Services | | | 2.2 | | | | 5,246,441 | |
Pharmaceuticals | | | 2.0 | | | | 4,871,656 | |
Electrical Equipment | | | 1.9 | | | | 4,572,043 | |
Electronic Equipment, Instruments & Components | | | 1.9 | | | | 4,538,082 | |
Software | | | 1.9 | | | | 4,432,746 | |
Beverages | | | 1.9 | | | | 4,428,029 | |
Energy Equipment & Services | | | 1.7 | | | | 4,125,607 | |
Capital Markets | | | 1.6 | | | | 3,885,638 | |
Household Durables | | | 1.6 | | | | 3,736,123 | |
Containers & Packaging | | | 1.5 | | | | 3,487,700 | |
Biotechnology | | | 1.4 | | | | 3,291,561 | |
Chemicals | | | 1.3 | | | | 3,123,729 | |
Leisure Equipment & Products | | | 1.2 | | | | 2,912,193 | |
Diversified Financial Services | | | 1.1 | | | | 2,722,500 | |
Consumer Finance | | | 1.0 | | | | 2,364,733 | |
Airlines | | | 1.0 | | | | 2,322,900 | |
Industrial Conglomerates | | | 1.0 | | | | 2,318,635 | |
Food & Staples Retailing | | | 1.0 | | | | 2,309,369 | |
Hotels, Restaurants & Leisure | | | 0.9 | | | | 2,231,976 | |
Office Electronics | | | 0.9 | | | | 2,197,078 | |
Communications Equipment | | | 0.9 | | | | 2,161,713 | |
Marine | | | 0.9 | | | | 2,067,294 | |
Paper & Forest Products | | | 0.8 | | | | 1,979,114 | |
Auto Components | | | 0.7 | | | | 1,540,859 | |
Real Estate Management & Development | | | 0.6 | | | | 1,385,186 | |
Diversified Telecommunication Services | | | 0.6 | | | | 1,360,364 | |
Diversified Consumer Services | | | 0.5 | | | | 1,287,680 | |
Aerospace & Defense | | | 0.5 | | | | 1,247,921 | |
Household Products | | | 0.5 | | | | 1,221,943 | |
| | |
Short Positions: | | | | | | | | |
Health Care Providers & Services | | | (0.4 | ) | | | (1,049,868 | ) |
Gas Utilities | | | (0.5 | ) | | | (1,133,880 | ) |
Containers & Packaging | | | (0.5 | ) | | | (1,179,171 | ) |
Professional Services | | | (0.6 | ) | | | (1,478,172 | ) |
Internet Software & Services | | | (0.7 | ) | | | (1,584,717 | ) |
Consumer Finance | | | (0.7 | ) | | | (1,709,584 | ) |
Textiles, Apparel & Luxury Goods | | | (0.8 | ) | | | (1,953,592 | ) |
Industrial Conglomerates | | | (0.9 | ) | | | (2,129,064 | ) |
Life Sciences Tools & Services | | | (0.9 | ) | | | (2,235,785 | ) |
See Notes to Financial Statements.
THE GLENMEDE FUND, INC.
Long/Short Portfolio
SCHEDULE OF PORTFOLIO INVESTMENTS — (Concluded)
October 31, 2016
| | | | | | | | |
| | | % of
Net Assets | | | Value | |
INDUSTRIES: — (Continued) | | | | | | | | |
Short Positions: — (Continued) | | | | | | | | |
Leisure Equipment & Products | | | (0.9 | )% | | $ | (2,244,305 | ) |
Electrical Equipment | | | (0.9 | ) | | | (2,244,643 | ) |
Pharmaceuticals | | | (1.0 | ) | | | (2,289,982 | ) |
Marine | | | (1.0 | ) | | | (2,358,000 | ) |
Capital Markets | | | (1.0 | ) | | | (2,368,020 | ) |
Software | | | (1.0 | ) | | | (2,444,203 | ) |
Semiconductors & Semiconductor Equipment | | | (1.1 | ) | | | (2,574,986 | ) |
Air Freight & Logistics | | | (1.1 | ) | | | (2,600,854 | ) |
Office Electronics | | | (1.2 | ) | | �� | (2,993,086 | ) |
Household Durables | | | (1.5 | ) | | | (3,609,026 | ) |
Water and Sewer | | | (1.6 | ) | | | (3,741,197 | ) |
Chemicals | | | (1.8 | ) | | | (4,315,986 | ) |
Aerospace & Defense | | | (1.9 | ) | | | (4,646,904 | ) |
Construction Materials | | | (2.2 | ) | | | (5,284,454 | ) |
Beverages | | | (2.4 | ) | | | (5,828,975 | ) |
Oil, Gas & Consumable Fuels | | | (2.5 | ) | | | (5,880,585 | ) |
Specialty Retail | | | (2.6 | ) | | | (6,322,759 | ) |
Multi-Utilities | | | (2.7 | ) | | | (6,383,432 | ) |
Hotels, Restaurants & Leisure | | | (2.9 | ) | | | (7,005,529 | ) |
Insurance | | | (3.0 | ) | | | (7,091,579 | ) |
Commercial Services & Supplies | | | (3.4 | ) | | | (8,134,703 | ) |
Road & Rail | | | (3.5 | ) | | | (8,293,166 | ) |
Machinery | | | (3.5 | ) | | | (8,307,788 | ) |
Health Care Equipment & Supplies | | | (3.8 | ) | | | (9,058,848 | ) |
Banks | | | (4.0 | ) | | | (9,548,998 | ) |
Equity Real Estate Investment Trusts | | | (7.6 | ) | | | (18,213,414 | ) |
| | | | | | | | |
TOTAL COMMON STOCKS | | | 30.3 | % | | $ | 72,482,171 | |
| | |
REPURCHASE AGREEMENT | | | 2.4 | | | | 5,813,985 | |
| | |
INVESTMENT OF SECURITY LENDING COLLATERAL | | | 1.8 | | | | 4,252,730 | |
| | | | | | | | |
TOTAL INVESTMENTS | | | 34.5 | % | | $ | 82,548,886 | |
| | | | | | | | |
See Notes to Financial Statements.
THE GLENMEDE FUND, INC.
Total Market Portfolio
SCHEDULE OF PORTFOLIO INVESTMENTS
October 31, 2016
| | | | | | | | |
| Shares | | | | | Value | |
| |
| COMMON STOCKS* — 127.2% | | | |
| | | | Aerospace & Defense — 2.7% | | | |
| | 5,394 | | | Northrop Grumman Corp.1 | | $ | 1,235,226 | |
| | 8,740 | | | Spirit AeroSystems Holdings, Inc. — Class A2 | | | 440,146 | |
| | | | | | | | |
| | | | | | | 1,675,372 | |
| | | | | | | | |
| | |
| | | | Airlines — 2.7% | | | |
| | 4,800 | | | Alaska Air Group, Inc. | | | 346,656 | |
| | 31,940 | | | Southwest Airlines Co.1 | | | 1,279,197 | |
| | | | | | | | |
| | | | | | | 1,625,853 | |
| | | | | | | | |
| | |
| | | | Auto Components — 0.6% | | | |
| | 21,180 | | | Gentex Corp. | | | 358,154 | |
| | | | | | | | |
| | |
| | | | Banks — 6.4% | | | |
| | 48,380 | | | Fifth Third Bancorp | | | 1,052,749 | |
| | 5,940 | | | Great Western Bancorp, Inc. | | | 191,506 | |
| | 10,097 | | | JPMorgan Chase & Co. | | | 699,318 | |
| | 62,060 | | | KeyCorp | | | 876,287 | |
| | 24,700 | | | SunTrust Banks, Inc.1 | | | 1,117,181 | |
| | | | | | | | |
| | | | | | | 3,937,041 | |
| | | | | | | | |
| | |
| | | | Beverages — 4.7% | | | |
| | 15,160 | | | Dr Pepper Snapple Group, Inc.1 | | | 1,330,897 | |
| | 14,180 | | | PepsiCo, Inc.1 | | | 1,520,096 | |
| | | | | | | | |
| | | | | | | 2,850,993 | |
| | | | | | | | |
| | |
| | | | Biotechnology — 1.0% | | | |
| | 22,700 | | | Emergent BioSolutions, Inc.2 | | | 606,544 | |
| | | | | | | | |
| | |
| | | | Capital Markets — 4.0% | | | |
| | 7,660 | | | CME Group, Inc. | | | 766,766 | |
| | 8,140 | | | Eaton Vance Corp. | | | 285,388 | |
| | 8,680 | | | Evercore Partners, Inc. — Class A | | | 466,550 | |
| | 28,920 | | | Federated Investors, Inc. — Class B | | | 780,840 | |
| | 6,100 | | | Invesco, Ltd. | | | 171,349 | |
| | | | | | | | |
| | | | | | | 2,470,893 | |
| | | | | | | | |
| | |
| | | | Chemicals — 1.7% | | | |
| | 10,540 | | | Dow Chemical Co. (The) | | | 567,157 | |
| | 7,140 | | | Minerals Technologies, Inc. | | | 479,808 | |
| | | | | | | | |
| | | | | | | 1,046,965 | |
| | | | | | | | |
| | |
| | | | Commercial Services & Supplies — 3.7% | | | |
| | 19,520 | | | Avery Dennison Corp.1 | | | 1,362,301 | |
| | 16,520 | | | Republic Services, Inc. | | | 869,447 | |
| | | | | | | | |
| | | | | | | 2,231,748 | |
| | | | | | | | |
| | |
| | | | Communications Equipment — 3.5% | | | |
| | 54,360 | | | Brocade Communications Systems, Inc. | | | 576,216 | |
| | 50,204 | | | Cisco Systems, Inc.1 | | | 1,540,259 | |
| | | | | | | | |
| | | | | | | 2,116,475 | |
| | | | | | | | |
| | |
| | | | Construction & Engineering — 3.0% | | | |
| | 22,400 | | | EMCOR Group, Inc.1 | | | 1,354,304 | |
| | 30,920 | | | KBR, Inc. | | | 457,925 | |
| | | | | | | | |
| | | | | | | 1,812,229 | |
| | | | | | | | |
| | |
| | | | Containers & Packaging — 1.5% | | | |
| | 5,820 | | | Crown Holdings, Inc.2 | | | 315,735 | |
| | 7,400 | | | Packaging Corp. of America | | | 610,500 | |
| | | | | | | | |
| | | | | | | 926,235 | |
| | | | | | | | |
See Notes to Financial Statements.
THE GLENMEDE FUND, INC.
Total Market Portfolio
SCHEDULE OF PORTFOLIO INVESTMENTS — (Continued)
October 31, 2016
| | | | | | | | |
| Shares | | | | | Value | |
| |
| COMMON STOCKS* — (Continued) | | | |
| | | | Diversified Consumer Services — 0.8% | | | |
| | 18,540 | | | Service Corp. International | | $ | 474,624 | |
| | | | | | | | |
| | |
| | | | Diversified Telecommunication Services — 1.8% | | | |
| | 40,680 | | | CenturyLink, Inc.1 | | | 1,081,274 | |
| | | | | | | | |
| | |
| | | | Electric Utilities — 0.8% | | | |
| | 17,420 | | | Hawaiian Electric Industries, Inc. | | | 513,890 | |
| | | | | | | | |
| | |
| | | | Electronic Equipment, Instruments & Components — 2.3% | | | |
| | 9,680 | | | Arrow Electronics, Inc.2 | | | 591,642 | |
| | 10,280 | | | Tech Data Corp.2 | | | 791,765 | |
| | | | | | | | |
| | | | | | | 1,383,407 | |
| | | | | | | | |
| | |
| | | | Energy Equipment & Services — 3.5% | | | |
| | 5,620 | | | Halliburton Co. | | | 258,520 | |
| | 84,420 | | | Nabors Industries, Ltd. | | | 1,004,598 | |
| | 6,519 | | | Schlumberger, Ltd. | | | 509,981 | |
| | 23,780 | | | Superior Energy Services, Inc. | | | 336,725 | |
| | | | | | | | |
| | | | | | | 2,109,824 | |
| | | | | | | | |
| | |
| | | | Equity Real Estate Investment Trusts — 7.4% | | | |
| | 32,760 | | | Brixmor Property Group, Inc. | | | 832,759 | |
| | 40,420 | | | Corporate Office Properties Trust1 | | | 1,078,810 | |
| | 4,640 | | | Equity Commonwealth2 | | | 140,174 | |
| | 14,940 | | | Hospitality Properties Trust | | | 408,758 | |
| | 40,980 | | | Host Marriott Corp. | | | 634,371 | |
| | 18,080 | | | Liberty Property Trust | | | 730,975 | |
| | 19,860 | | | Tanger Factory Outlet Centers, Inc. | | | 691,128 | |
| | | | | | | | |
| | | | | | | 4,516,975 | |
| | | | | | | | |
| | |
| | | | Food & Staples Retailing — 2.0% | | | |
| | 3,500 | | | CVS Health Corp. | | | 294,350 | |
| | 30,760 | | | Kroger Co. (The) | | | 952,945 | |
| | | | | | | | |
| | | | | | | 1,247,295 | |
| | | | | | | | |
| | |
| | | | Food Products — 2.6% | | | |
| | 16,920 | | | ConAgra Foods, Inc. | | | 815,206 | |
| | 11,080 | | | Tyson Foods, Inc. — Class A | | | 785,018 | |
| | | | | | | | |
| | | | | | | 1,600,224 | |
| | | | | | | | |
| | |
| | | | Health Care Equipment & Supplies — 1.3% | | | |
| | 12,260 | | | Cynosure, Inc. — Class A2 | | | 522,889 | |
| | 5,386 | | | Hill-Rom Holdings, Inc. | | | 298,438 | |
| | | | | | | | |
| | | | | | | 821,327 | |
| | | | | | | | |
| | |
| | | | Health Care Providers & Services — 5.4% | | | |
| | 7,806 | | | Aetna, Inc. | | | 837,974 | |
| | 5,780 | | | AMN Healthcare Services, Inc.2 | | | 189,584 | |
| | 5,340 | | | Anthem, Inc. | | | 650,732 | |
| | 8,740 | | | Cardinal Health, Inc. | | | 600,351 | |
| | 9,120 | | | WellCare Health Plans, Inc.2 | | | 1,035,211 | |
| | | | | | | | |
| | | | | | | 3,313,852 | |
| | | | | | | | |
| | |
| | | | Hotels, Restaurants & Leisure — 1.9% | | | |
| | 17,420 | | | Wyndham Worldwide Corp.1 | | | 1,146,933 | |
| | | | | | | | |
| | |
| | | | Household Durables — 0.5% | | | |
| | 6,150 | | | Newell Brands, Inc. | | | 295,323 | |
| | | | | | | | |
| | |
| | | | Household Products — 0.4% | | | |
| | 5,600 | | | Church & Dwight Co., Inc. | | | 270,256 | |
| | | | | | | | |
See Notes to Financial Statements.
THE GLENMEDE FUND, INC.
Total Market Portfolio
SCHEDULE OF PORTFOLIO INVESTMENTS — (Continued)
October 31, 2016
| | | | | | | | |
| Shares | | | | | Value | |
| |
| COMMON STOCKS* — (Continued) | | | |
| | | | Independent Power Producers & Energy Traders — 0.7% | | | |
| | 38,060 | | | AES Corp. | | $ | 447,966 | |
| | | | | | | | |
| | |
| | | | Industrial Conglomerates — 1.9% | | | |
| | 7,360 | | | Honeywell International, Inc. | | | 807,245 | |
| | 3,500 | | | Carlisle Cos., Inc. | | | 366,975 | |
| | | | | | | | |
| | | | | | | 1,174,220 | |
| | | | | | | | |
| | |
| | | | Insurance — 7.6% | | | |
| | 12,380 | | | Aflac, Inc. | | | 852,610 | |
| | 44,660 | | | Old Republic International Corp. | | | 752,968 | |
| | 11,280 | | | Primerica, Inc. | | | 617,016 | |
| | 10,660 | | | Principal Financial Group, Inc. | | | 582,036 | |
| | 9,160 | | | Travelers Cos., Inc. (The) | | | 990,929 | |
| | 15,880 | | | Universal Insurance Holdings, Inc. | | | 338,244 | |
| | 14,840 | | | Unum Group | | | 525,336 | |
| | | | | | | | |
| | | | | | | 4,659,139 | |
| | | | | | | | |
| | |
| | | | IT Services — 7.1% | | | |
| | 2,447 | | | Accenture PLC — Class A | | | 284,439 | |
| | 24,264 | | | Amdocs, Ltd.1 | | | 1,418,231 | |
| | 21,980 | | | Convergys Corp. | | | 641,816 | |
| | 8,160 | | | CoreLogic, Inc.2 | | | 347,290 | |
| | 49,500 | | | Genpact, Ltd.1,2 | | | 1,138,005 | |
| | 7,419 | | | Science Applications International Corp. | | | 511,243 | |
| | | | | | | | |
| | | | | | | 4,341,024 | |
| | | | | | | | |
| | |
| | | | Leisure Equipment & Products — 0.6% | | | |
| | 13,600 | | | Smith & Wesson Holding Corp.2 | | | 359,448 | |
| | | | | | | | |
| | |
| | | | Life Sciences Tools & Services — 3.3% | | | |
| | 16,238 | | | Charles River Laboratories International, Inc.1,2 | | | 1,232,139 | |
| | 13,302 | | | PAREXEL International Corp.2 | | | 774,975 | |
| | | | | | | | |
| | | | | | | 2,007,114 | |
| | | | | | | | |
| | |
| | | | Machinery — 2.5% | | | |
| | 14,580 | | | AGCO Corp. | | | 744,746 | |
| | 9,160 | | | IDEX Corp. | | | 791,791 | |
| | | | | | | | |
| | | | | | | 1,536,537 | |
| | | | | | | | |
| | |
| | | | Media — 2.9% | | | |
| | 14,300 | | | Comcast Corp. — Class A | | | 884,026 | |
| | 6,500 | | | Scripps Networks Interactive, Inc. — Class A | | | 418,340 | |
| | 5,460 | | | Time Warner, Inc. | | | 485,885 | |
| | | | | | | | |
| | | | | | | 1,788,251 | |
| | | | | | | | |
| | |
| | | | Multi-line Retail — 0.5% | | | |
| | 6,740 | | | Big Lots, Inc. | | | 292,516 | |
| | | | | | | | |
| | |
| | | | Multi-Utilities — 3.5% | | | |
| | 24,080 | | | MDU Resources Group, Inc. | | | 631,137 | |
| | 11,460 | | | Public Service Enterprise Group, Inc. | | | 482,237 | |
| | 13,920 | | | SCANA Corp. | | | 1,021,171 | |
| | | | | | | | |
| | | | | | | 2,134,545 | |
| | | | | | | | |
| | |
| | | | Office Electronics — 1.2% | | | |
| | 76,740 | | | Xerox Corp. | | | 749,750 | |
| | | | | | | | |
See Notes to Financial Statements.
THE GLENMEDE FUND, INC.
Total Market Portfolio
SCHEDULE OF PORTFOLIO INVESTMENTS — (Continued)
October 31, 2016
| | | | | | | | |
| Shares | | | | | Value | |
| |
| COMMON STOCKS* — (Continued) | | | |
| | | | Oil, Gas & Consumable Fuels — 3.9% | | | |
| | 106,600 | | | Denbury Resources, Inc.2 | | $ | 254,774 | |
| | 9,837 | | | Tesoro Corp. | | | 835,850 | |
| | 14,300 | | | Valero Energy Corp. | | | 847,132 | |
| | 10,580 | | | World Fuel Services Corp. | | | 425,845 | |
| | | | | | | | |
| | | | | | | 2,363,601 | |
| | | | | | | | |
| | |
| | | | Pharmaceuticals — 5.3% | | | |
| | 10,500 | | | Johnson & Johnson1 | | | 1,217,895 | |
| | 5,060 | | | Mylan N.V.2 | | | 184,690 | |
| | 110,360 | | | Sciclone Pharmaceuticals, Inc.1,2 | | | 987,722 | |
| | 43,000 | | | Supernus Pharmaceuticals, Inc.2 | | | 851,400 | |
| | | | | | | | |
| | | | | | | 3,241,707 | |
| | | | | | | | |
| | |
| | | | Professional Services — 1.7% | | | |
| | 11,160 | | | Manpowergroup, Inc. | | | 857,088 | |
| | 9,100 | | | TrueBlue, Inc.2 | | | 159,250 | |
| | | | | | | | |
| | | | | | | 1,016,338 | |
| | | | | | | | |
| | |
| | | | Real Estate Management & Development — 1.0% | �� | | |
| | 14,220 | | | RE/MAX Holdings, Inc. — Class A | | | 617,859 | |
| | | | | | | | |
| | |
| | | | Semiconductors & Semiconductor Equipment — 4.8% | | | |
| | 4,260 | | | Lam Research Corp. | | | 412,624 | |
| | 21,300 | | | NVIDIA Corp.1 | | | 1,515,708 | |
| | 26,400 | | | Tessera Technologies, Inc. | | | 979,440 | |
| | | | | | | | |
| | | | | | | 2,907,772 | |
| | | | | | | | |
| | |
| | | | Software — 5.3% | | | |
| | 33,414 | | | CA, Inc. | | | 1,027,146 | |
| | 11,620 | | | Citrix Systems, Inc.2 | | | 985,376 | |
| | 29,520 | | | Mentor Graphics Corp. | | | 853,128 | |
| | 9,620 | | | Oracle Corp. | | | 369,601 | |
| | | | | | | | |
| | | | | | | 3,235,251 | |
| | | | | | | | |
| | |
| | | | Specialty Retail — 5.2% | | | |
| | 17,000 | | | Foot Locker, Inc.1 | | | 1,135,090 | |
| | 6,300 | | | Home Depot, Inc. | | | 768,663 | |
| | 6,740 | | | Lowe’s Cos., Inc. | | | 449,221 | |
| | 11,240 | | | TJX Cos., Inc. (The) | | | 828,950 | |
| | | | | | | | |
| | | | | | | 3,181,924 | |
| | | | | | | | |
| | |
| | | | Thrifts & Mortgage Finance — 1.5% | | | |
| | 32,780 | | | Flagstar Bancorp, Inc.2 | | | 899,155 | |
| | | | | | | | |
| | |
| | | | Wireless Telecommunication Services — 0.5% | | | |
| | 12,580 | | | Telephone & Data Systems, Inc. | | | 325,067 | |
| | | | | | | | |
| | |
| | | | TOTAL COMMON STOCKS
(Cost $65,702,352) | | | 77,712,890 | |
| | | | | | | | |
| | |
Face
Amount | | | | | | |
| |
| REPURCHASE AGREEMENT* — 0.4% | | | |
| $ | 201,551 | | | With Fixed Income Clearing Corp., dated 10/31/16, 0.01%, principal and interest in the amount of $201,552, due 11/1/16, (collateralized by a U.S. Treasury Bond with a par value of $190,000, coupon rate of 3.000%, due 5/15/45, market value of $208,050) | | | 201,551 | |
| | | | | | | | |
| | |
| | | | TOTAL REPURCHASE AGREEMENT
(Cost $201,551) | | | 201,551 | |
| | | | | | | | |
| | | | | | | | | | |
| | |
TOTAL LONG INVESTMENTS
(Cost $65,903,903) | | | 127.6 | % | | $ | 77,914,441 | |
| | | | | | | | | | |
See Notes to Financial Statements.
THE GLENMEDE FUND, INC.
Total Market Portfolio
SCHEDULE OF PORTFOLIO INVESTMENTS — (Continued)
October 31, 2016
| | | | | | | | |
| Shares | | | | | Value | |
|
| COMMON STOCKS SOLD SHORT* — (27.4)% | |
| | | | Aerospace & Defense — (0.8)% | |
| | (2,980 | ) | | Orbital ATK, Inc. | | $ | (221,593 | ) |
| | (2,940 | ) | | Rockwell Collins, Inc. | | | (247,901 | ) |
| | | | | | | | |
| | | | | | | (469,494 | ) |
| | | | | | | | |
| |
| | | | Banks — (2.1)% | |
| | (10,860 | ) | | Bancorpsouth, Inc. | | | (255,210 | ) |
| | (6,600 | ) | | Bank of the Ozarks, Inc. | | | (243,936 | ) |
| | (6,860 | ) | | Banner Corp. | | | (309,660 | ) |
| | (6,980 | ) | | Glacier Bancorp, Inc. | | | (197,255 | ) |
| | (5,020 | ) | | Pinnacle Financial Partners, Inc. | | | (259,032 | ) |
| | | | | | | | |
| | | | | | | (1,265,093 | ) |
| | | | | | | | |
| |
| | | | Beverages — (0.8)% | |
| | (5,720 | ) | | Brown-Forman Corp. — Class B | | | (264,092 | ) |
| | (5,900 | ) | | Coca-Cola Co. (The) | | | (250,160 | ) |
| | | | | | | | |
| | | | | | | (514,252 | ) |
| | | | | | | | |
| |
| | | | Chemicals — (1.0)% | |
| | (7,480 | ) | | CF Industries Holdings, Inc. | | | (179,595 | ) |
| | (1,700 | ) | | Ecolab, Inc. | | | (194,089 | ) |
| | (3,740 | ) | | WR Grace & Co. | | | (250,430 | ) |
| | | | | | | | |
| | | | | | | (624,114 | ) |
| | | | | | | | |
| |
| | | | Commercial Services & Supplies — (0.9)% | |
| | (21,000 | ) | | Covanta Holding Corp. | | | (315,000 | ) |
| | (2,620 | ) | | Stericycle, Inc.2 | | | (209,836 | ) |
| | | | | | | | |
| | | | | | | (524,836 | ) |
| | | | | | | | |
| |
| | | | Containers & Packaging — (0.4)% | |
| | (2,860 | ) | | Ball Corp. | | | (220,420 | ) |
| | | | | | | | |
| |
| | | | Electric Utilities — (0.3)% | |
| | (4,360 | ) | | El Paso Electric Co. | | | (201,432 | ) |
| | | | | | | | |
| |
| | | | Equity Real Estate Investment Trusts — (1.9)% | |
| | (5,280 | ) | | Acadia Realty Trust | | | (177,883 | ) |
| | (6,760 | ) | | HCP, Inc. | | | (231,530 | ) |
| | (3,360 | ) | | Realty Income Corp. | | | (199,047 | ) |
| | (3,000 | ) | | SL Green Realty Corp. | | | (294,660 | ) |
| | (2,540 | ) | | Vornado Realty Trust | | | (235,661 | ) |
| | | | | | | | |
| | | | | | | (1,138,781 | ) |
| | | | | | | | |
| |
| | | | Gas Utilities — (0.4)% | |
| | (3,540 | ) | | EQT Corp. | | | (233,640 | ) |
| | | | | | | | |
| |
| | | | Health Care Equipment & Supplies — (1.1)% | |
| | (1,000 | ) | | CR Bard, Inc. | | | (216,680 | ) |
| | (2,820 | ) | | DexCom, Inc.2 | | | (220,637 | ) |
| | (2,020 | ) | | Zimmer Biomet Holdings, Inc. | | | (212,908 | ) |
| | | | | | | | |
| | | | | | | (650,225 | ) |
| | | | | | | | |
| |
| | | | Health Care Providers & Services — (0.3)% | |
| | (4,440 | ) | | Patterson Cos., Inc. | | | (189,633 | ) |
| | | | | | | | |
| |
| | | | Hotels, Restaurants & Leisure — (0.5)% | |
| | (500 | ) | | Chipotle Mexican Grill, Inc.2 | | | (180,380 | ) |
| | (1,880 | ) | | Popeyes Louisiana Kitchen, Inc.2 | | | (100,354 | ) |
| | | | | | | | |
| | | | | | | (280,734 | ) |
| | | | | | | | |
| |
| | | | Household Durables — (0.4)% | |
| | (6,860 | ) | | CalAtlantic Group, Inc. | | | (221,715 | ) |
| | | | | | | | |
See Notes to Financial Statements.
THE GLENMEDE FUND, INC.
Total Market Portfolio
SCHEDULE OF PORTFOLIO INVESTMENTS — (Continued)
October 31, 2016
| | | | | | | | |
| Shares | | | | | Value | |
| |
| COMMON STOCKS SOLD SHORT* — (Continued) | | | |
| | | | Insurance — (3.0)% | |
| | (8,200 | ) | | Arthur J Gallagher & Co. | | $ | (395,486 | ) |
| | (6,260 | ) | | Kemper Corp. | | | (235,063 | ) |
| | (280 | ) | | Markel Corp.2 | | | (245,680 | ) |
| | (7,980 | ) | | Mercury General Corp. | | | (434,671 | ) |
| | (8,420 | ) | | Progressive Corp. (The) | | | (265,314 | ) |
| | (5,760 | ) | | Stewart Information Services Corp. | | | (258,912 | ) |
| | | | | | | | |
| | | | | | | (1,835,126 | ) |
| | | | | | | | |
| |
| | | | Machinery — (1.4)% | |
| | (3,280 | ) | | Caterpillar, Inc. | | | (273,749 | ) |
| | (3,360 | ) | | Deere & Co. | | | (296,688 | ) |
| | (3,980 | ) | | RBC Bearings, Inc.2 | | | (283,973 | ) |
| | | | | | | | |
| | | | | | | (854,410 | ) |
| | | | | | | | |
| |
| | | | Multi-Utilities — (0.9)% | |
| | (2,960 | ) | | Dominion Resources, Inc. | | | (222,592 | ) |
| | (3,380 | ) | | Sempra Energy | | | (361,998 | ) |
| | | | | | | | |
| | | | | | | (584,590 | ) |
| | | | | | | | |
| |
| | | | Oil, Gas & Consumable Fuels — (1.1)% | |
| | (6,000 | ) | | Cheniere Energy, Inc.2 | | | (226,200 | ) |
| | (2,800 | ) | | Exxon Mobil Corp. | | | (233,296 | ) |
| | (6,262 | ) | | Range Resources Corp. | | | (211,593 | ) |
| | | | | | | | |
| | | | | | | (671,089 | ) |
| | | | | | | | |
| |
| | | | Pharmaceuticals — (0.6)% | |
| | (970 | ) | | Allergan PLC2 | | | (202,672 | ) |
| | (2,167 | ) | | Perrigo Co. PLC | | | (180,273 | ) |
| | | | | | | | |
| | | | | | | (382,945 | ) |
| | | | | | | | |
| |
| | | | Professional Services — (0.3)% | |
| | (4,740 | ) | | Advisory Board Co. (The)2 | | | (188,652 | ) |
| | | | | | | | |
| |
| | | | Real Estate Investment Trusts — (2.0)% | |
| | (9,060 | ) | | Kite Realty Group Trust | | | (225,866 | ) |
| | (11,800 | ) | | Senior Housing Property Trust | | | (250,986 | ) |
| | (3,300 | ) | | Sun Communities, Inc. | | | (253,869 | ) |
| | (7,180 | ) | | UDR, Inc. | | | (251,084 | ) |
| | (3,500 | ) | | Ventas, Inc. | | | (237,125 | ) |
| | | | | | | | |
| | | | | | | (1,218,930 | ) |
| | | | | | | | |
| |
| | | | Real Estate Management & Development — (0.5)% | |
| | (7,360 | ) | | Alexander & Baldwin, Inc. | | | (307,574 | ) |
| | | | | | | | |
| |
| | | | Road & Rail — (2.5)% | |
| | (700 | ) | | Amerco, Inc. | | | (225,673 | ) |
| | (2,820 | ) | | JB Hunt Transport Services, Inc. | | | (230,140 | ) |
| | (3,040 | ) | | Kansas City Southern | | | (266,791 | ) |
| | (8,800 | ) | | Knight Transportation, Inc. | | | (257,400 | ) |
| | (3,700 | ) | | Ryder System, Inc. | | | (256,743 | ) |
| | (11,320 | ) | | Werner Enterprises, Inc. | | | (272,246 | ) |
| | | | | | | | |
| | | | | | | (1,508,993 | ) |
| | | | | | | | |
| |
| | | | Semiconductors & Semiconductor Equipment — (1.0)% | |
| | (17,300 | ) | | Cypress Semiconductor Corp. | | | (172,481 | ) |
| | (37,800 | ) | | Lattice Semiconductor Corp.2 | | | (229,446 | ) |
| | (19,640 | ) | | Rambus, Inc.2 | | | (239,412 | ) |
| | | | | | | | |
| | | | | | | (641,339 | ) |
| | | | | | | | |
| |
| | | | Software — (0.4)% | |
| | (5,780 | ) | | PTC, Inc.2 | | | (274,203 | ) |
| | | | | | | | |
See Notes to Financial Statements.
THE GLENMEDE FUND, INC.
Total Market Portfolio
SCHEDULE OF PORTFOLIO INVESTMENTS — (Continued)
October 31, 2016
| | | | | | | | |
| Shares | | | | | Value | |
| |
| COMMON STOCKS SOLD SHORT* — (Continued) | | | |
| | | | Specialty Retail — (1.1)% | |
| | (1,480 | ) | | Advance Auto Parts, Inc. | | $ | (207,319 | ) |
| | (3,260 | ) | | L Brands, Inc. | | | (235,339 | ) |
| | (3,580 | ) | | Tractor Supply Co. | | | (224,215 | ) |
| | | | | | | | |
| | | | | | | (666,873 | ) |
| | | | | | | | |
| |
| | | | Textiles, Apparel & Luxury Goods — (0.1)% | |
| | (3,385 | ) | | Under Armour, Inc. — Class C2 | | | (87,536 | ) |
| | | | | | | | |
| |
| | | | Trading Companies & Distributors — (0.7)% | |
| | (12,500 | ) | | H&E Equipment Services, Inc. | | | (174,375 | ) |
| | (3,520 | ) | | United Rentals, Inc.2 | | | (266,323 | ) |
| | | | | | | | |
| | | | | | | (440,698 | ) |
| | | | | | | | |
| |
| | | | Water and Sewer — (0.9)% | |
| | (6,980 | ) | | American States Water Co. | | | (279,061 | ) |
| | (8,500 | ) | | Aqua America, Inc. | | | (260,950 | ) |
| | | | | | | | |
| | | | | | | (540,011 | ) |
| | | | | | | | |
| | |
| | | | TOTAL COMMON STOCKS SOLD SHORT
(Proceeds $(18,452,155)) | | | (16,737,338 | ) |
| | | | | | | | |
| | | | | | | | | | |
| | |
TOTAL SHORT INVESTMENTS
(Proceeds $(18,452,155)) | | | (27.4 | )% | | $ | (16,737,338 | ) |
| | |
TOTAL INVESTMENTS
(Cost $47,451,748)3 | | | 100.2 | % | | $ | 61,177,103 | |
| | |
LIABILITIES IN EXCESS OF OTHER ASSETS | | | (0.2 | ) | | | (94,509 | ) |
| | | | | | | | | | |
| | |
NET ASSETS | | | 100.0 | % | | $ | 61,082,594 | |
| | | | | | | | | | |
| * | Percentages indicated are based on net assets. |
| 1 | All or a portion of security pledged as collateral for securities sold short. The total market value of collateral is $20,827,113. |
| 2 | Non income-producing security. |
| 3 | Aggregate cost for federal tax purposes was $47,854,213. |
See Notes to Financial Statements.
THE GLENMEDE FUND, INC.
Total Market Portfolio
SCHEDULE OF PORTFOLIO INVESTMENTS — (Continued)
October 31, 2016
INDUSTRY DIVERSIFICATION
On October 31, 2016, industry diversification of the Portfolio was as follows:
| | | | | | | | |
| | | % of
Net Assets | | | Value | |
INDUSTRIES: | | | | | | | | |
Long Positions: | | | | | | | | |
Insurance | | | 7.6 | % | | $ | 4,659,139 | |
Equity Real Estate Investment Trusts | | | 7.4 | | | | 4,516,975 | |
IT Services | | | 7.1 | | | | 4,341,024 | |
Banks | | | 6.4 | | | | 3,937,041 | |
Health Care Providers & Services | | | 5.4 | | | | 3,313,852 | |
Pharmaceuticals | | | 5.3 | | | | 3,241,707 | |
Software | | | 5.3 | | | | 3,235,251 | |
Specialty Retail | | | 5.2 | | | | 3,181,924 | |
Semiconductors & Semiconductor Equipment | | | 4.8 | | | | 2,907,772 | |
Beverages | | | 4.7 | | | | 2,850,993 | |
Capital Markets | | | 4.0 | | | | 2,470,893 | |
Oil, Gas & Consumable Fuels | | | 3.9 | | | | 2,363,601 | |
Commercial Services & Supplies | | | 3.7 | | | | 2,231,748 | |
Multi-Utilities | | | 3.5 | | | | 2,134,545 | |
Communications Equipment | | | 3.5 | | | | 2,116,475 | |
Energy Equipment & Services | | | 3.5 | | | | 2,109,824 | |
Life Sciences Tools & Services | | | 3.3 | | | | 2,007,114 | |
Construction & Engineering | | | 3.0 | | | | 1,812,229 | |
Media | | | 2.9 | | | | 1,788,251 | |
Aerospace & Defense | | | 2.7 | | | | 1,675,372 | |
Airlines | | | 2.7 | | | | 1,625,853 | |
Food Products | | | 2.6 | | | | 1,600,224 | |
Machinery | | | 2.5 | | | | 1,536,537 | |
Electronic Equipment, Instruments & Components | | | 2.3 | | | | 1,383,407 | |
Food & Staples Retailing | | | 2.0 | | | | 1,247,295 | |
Industrial Conglomerates | | | 1.9 | | | | 1,174,220 | |
Hotels, Restaurants & Leisure | | | 1.9 | | | | 1,146,933 | |
Diversified Telecommunication Services | | | 1.8 | | | | 1,081,274 | |
Chemicals | | | 1.7 | | | | 1,046,965 | |
Professional Services | | | 1.7 | | | | 1,016,338 | |
Containers & Packaging | | | 1.5 | | | | 926,235 | |
Thrifts & Mortgage Finance | | | 1.5 | | | | 899,155 | |
Health Care Equipment & Supplies | | | 1.3 | | | | 821,327 | |
Office Electronics | | | 1.2 | | | | 749,750 | |
Real Estate Management & Development | | | 1.0 | | | | 617,859 | |
Biotechnology | | | 1.0 | | | | 606,544 | |
Electric Utilities | | | 0.8 | | | | 513,890 | |
Diversified Consumer Services | | | 0.8 | | | | 474,624 | |
Independent Power Producers & Energy Traders | | | 0.7 | | | | 447,966 | |
Leisure Equipment & Products | | | 0.6 | | | | 359,448 | |
Auto Components | | | 0.6 | | | | 358,154 | |
Wireless Telecommunication Services | | | 0.5 | | | | 325,067 | |
Household Durables | | | 0.5 | | | | 295,323 | |
Multi-line Retail | | | 0.5 | | | | 292,516 | |
Household Products | | | 0.4 | | | | 270,256 | |
Short Positions: | | | | | | | | |
Textiles, Apparel & Luxury Goods | | | (0.1 | ) | | | (87,536 | ) |
Professional Services | | | (0.3 | ) | | | (188,652 | ) |
Health Care Providers & Services | | | (0.3 | ) | | | (189,633 | ) |
Electric Utilities | | | (0.3 | ) | | | (201,432 | ) |
Containers & Packaging | | | (0.4 | ) | | | (220,420 | ) |
Household Durables | | | (0.4 | ) | | | (221,715 | ) |
Gas Utilities | | | (0.4 | ) | | | (233,640 | ) |
See Notes to Financial Statements.
THE GLENMEDE FUND, INC.
Total Market Portfolio
SCHEDULE OF PORTFOLIO INVESTMENTS — (Concluded)
October 31, 2016
| | | | | | | | |
| | | % of
Net Assets | | | Value | |
INDUSTRIES: — (Continued) | | | | | | | | |
Short Positions: — (Continued) | | | | | | | | |
Software | | | (0.4 | )% | | $ | (274,203 | ) |
Hotels, Restaurants & Leisure | | | (0.5 | ) | | | (280,734 | ) |
Real Estate Management & Development | | | (0.5 | ) | | | (307,574 | ) |
Pharmaceuticals | | | (0.6 | ) | | | (382,945 | ) |
Trading Companies & Distributors | | | (0.7 | ) | | | (440,698 | ) |
Aerospace & Defense | | | (0.8 | ) | | | (469,494 | ) |
Beverages | | | (0.8 | ) | | | (514,252 | ) |
Commercial Services & Supplies | | | (0.9 | ) | | | (524,836 | ) |
Water and Sewer | | | (0.9 | ) | | | (540,011 | ) |
Multi-Utilities | | | (0.9 | ) | | | (584,590 | ) |
Chemicals | | | (1.0 | ) | | | (624,114 | ) |
Semiconductors & Semiconductor Equipment | | | (1.0 | ) | | | (641,339 | ) |
Health Care Equipment & Supplies | | | (1.1 | ) | | | (650,225 | ) |
Specialty Retail | | | (1.1 | ) | | | (666,873 | ) |
Oil, Gas & Consumable Fuels | | | (1.1 | ) | | | (671,089 | ) |
Machinery | | | (1.4 | ) | | | (854,410 | ) |
Equity Real Estate Investment Trusts | | | (1.9 | ) | | | (1,138,781 | ) |
Real Estate Investment Trusts | | | (2.0 | ) | | | (1,218,930 | ) |
Banks | | | (2.1 | ) | | | (1,265,093 | ) |
Road & Rail | | | (2.5 | ) | | | (1,508,993 | ) |
Insurance | | | (3.0 | ) | | | (1,835,126 | ) |
| | | | | | | | |
TOTAL COMMON STOCKS | | | 99.8 | % | | $ | 60,975,552 | |
| | |
REPURCHASE AGREEMENT | | | 0.4 | | | | 201,551 | |
| | | | | | | | |
TOTAL INVESTMENTS | | | 100.2 | % | | $ | 61,177,103 | |
| | | | | | | | |
See Notes to Financial Statements.
THE GLENMEDE FUND, INC.
High Yield Municipal Portfolio
SCHEDULE OF PORTFOLIO INVESTMENTS
October 31, 2016
| | | | | | | | |
Face
Amount | | | | | Value | |
|
| MUNICIPAL BONDS* — 98.3% | |
| | | | Alabama — 1.8% | | | |
| $ | 500,000 | | | Jefferson County, AL, Sewer Revenue Warrants, Series E
0.000% due 10/1/341 | | $ | 157,960 | |
| | 500,000 | | | Jefferson County, AL, Sewer Revenue, Series B, (AGMC Insured)
0.000% due 10/1/251 | | | 374,260 | |
| | 1,070,000 | | | Jefferson County, AL, Sewer Revenue, Series D, Warrants,
6.000% due 10/1/42 | | | 1,271,802 | |
| | 300,000 | | | Lower, AL, Gas District, Gas Project Revenue, Series A,
5.000% due 9/1/46 | | | 377,052 | |
| | 500,000 | | | Montgomery, AL, Medical Clinic, Board Health Care Facility Revenue, Refunding,
5.000% due 3/1/30 | | | 569,935 | |
| | | | | | | | |
| | | | | | | 2,751,009 | |
| | | | | | | | |
| | |
| | | | Alaska — 0.4% | | | |
| | 500,000 | | | Alaska State International Airports Revenue, Refunding, Series B,
5.000% due 10/1/34 | | | 586,255 | |
| | | | | | | | |
| | |
| | | | Arizona — 2.4% | | | |
| | 100,000 | | | Florence Town, Inc., AZ, Industrial Development Authority, Legacy Traditional School Project, Revenue Bonds,
5.000% due 7/1/23 | | | 107,613 | |
| | 190,000 | | | Glendale, AZ, Industrial Development Authority, Glencroft Retirement Community Project, Revenue Bonds, Refunding,
5.250% due 11/15/51 | | | 188,161 | |
| | 750,000 | | | Maricopa County, AZ, Industrial Development Authority, Educational Revenue, Revenue Bonds, Refunding,
5.000% due 7/1/362 | | | 797,227 | |
| | 250,000 | | | Phoenix, AZ, Industrial Development Authority, Education Revenue, Basis Schools, Inc., Revenue Bonds,
5.000% due 7/1/452 | | | 264,390 | |
| | 330,000 | | | Phoenix, AZ, Industrial Development Authority, Education Revenue, Basis Schools, Inc., Revenue Bonds, Refunding,
5.000% due 7/1/352 | | | 352,704 | |
| | 700,000 | | | Phoenix, AZ, Industrial Development Authority, Education Revenue, Basis Schools, Inc., Revenue Bonds, Refunding, Series A,
3.000% due 7/1/202 | | | 707,511 | |
| | | | Phoenix, AZ, Industrial Development Authority, Education Revenue, Legacy Traditional Schools Project, Revenue Bonds, Series A: | | | | |
| | 100,000 | | | 5.750% due 7/1/242 | | | 113,570 | |
| | 500,000 | | | 6.750% due 7/1/442 | | | 581,020 | |
| | 500,000 | | | Phoenix, AZ, Industrial Development Authority, Education Revenue, Revenue Bonds, Series A,
5.000% due 7/1/463 | | | 511,575 | |
| | | | | | | | |
| | | | | | | 3,623,771 | |
| | | | | | | | |
| |
| | | | California — 5.0% | |
| | 350,000 | | | Alameda, CA, Community Facilities District No.13-1, Special Tax, Alameda Landing Public Improvements,
5.000% due 9/1/42 | | | 393,585 | |
| | 475,000 | | | Alhambra City, CA, Atherton Baptist Homes, Revenue Bonds, Series A, Prerefunded 1/1/20 @ 100,
7.500% due 1/1/30 | | | 552,415 | |
| | | | California State, Municipal Finance Authority, Educational Revenue, Refunding, Series A: | | | | |
| | 360,000 | | | 5.000% due 6/1/36 | | | 406,764 | |
| | 500,000 | | | 5.000% due 6/1/46 | | | 561,035 | |
| | 500,000 | | | California State, School Financing Authority, Downtown College Prep Obligation Group,
5.000% due 6/1/512 | | | 514,170 | |
| | | | California State, Statewide Communities Development Authority, Beverly Community Hospital Association, Revenue Bonds: | | | | |
| | 560,000 | | | 4.000% due 2/1/20 | | | 596,574 | |
| | 270,000 | | | 4.000% due 2/1/21 | | | 291,430 | |
| | 240,000 | | | 4.000% due 2/1/23 | | | 262,630 | |
See Notes to Financial Statements.
THE GLENMEDE FUND, INC.
High Yield Municipal Portfolio
SCHEDULE OF PORTFOLIO INVESTMENTS — (Continued)
October 31, 2016
| | | | | | | | |
Face
Amount | | | | | Value | |
|
| MUNICIPAL BONDS* — (Continued) | |
| | | | California — (Continued) | |
| $ | 250,000 | | | California State, Statewide Communities Development Authority, CHF Irvine LLC, Revenue Bonds,
5.000% due 5/15/29 | | $ | 299,500 | |
| | 300,000 | | | California State, Statewide Communities Development Authority, Daughters of Charity Health, Revenue Bonds, Series A,
5.750% due 7/1/30 | | | 296,511 | |
| | 255,000 | | | Corona-Norco, CA, Unified School District, Refunding,
5.000% due 9/1/24 | | | 306,240 | |
| | 1,000,000 | | | Foothill-Eastern Transportation Corridor Agency, CA, Toll Road Revenue, (AGMC Insured)
0.000% due 1/15/341 | | | 536,690 | |
| | | | Palomar Pomerado,CA, General Obligation Unlimited, Series A, (AGC Insured): | | | | |
| | 1,000,000 | | | 0.000% due 8/1/291 | | | 660,840 | |
| | 500,000 | | | 0.000% due 8/1/311 | | | 304,090 | |
| | 325,000 | | | San Francisco City & County, CA, Redevelopment Agency, Mission Bay Redevelopment Project, Series B,
5.000% due 8/1/33 | | | 387,153 | |
| | 570,000 | | | San Joaquin Hills, CA, Transportation Corridor Agency, Toll Road Revenue, Revenue Bonds, Series A, (NPFG Insured)
0.000% due 1/15/221 | | | 501,366 | |
| | 500,000 | | | Saugus/Hart, CA, School Facilities Financing Authority, Special Tax, Refunding,
5.000% due 9/1/24 | | | 601,535 | |
| | 200,000 | | | Seal Beach, CA, Community Facilities District No. 2005-1, Special Tax, Refunding,
3.000% due 9/1/29 | | | 196,558 | |
| | | | | | | | |
| | | | | | | 7,669,086 | |
| | | | | | | | |
| |
| | | | Colorado — 3.0% | |
| | 300,000 | | | Colorado State, Health Facilities Authority, Hospital Revenue, Refunding,
5.000% due 1/1/37 | | | 330,072 | |
| | 750,000 | | | Forest Trace, CO, Metropolitan District No. 3, Limited Tax, General Obligation Unlimited, Series A,
5.000% due 12/1/46 | | | 761,122 | |
| | 750,000 | | | Leyden Rock, Metropolitan District No. 10, General Obligation Limited, Series A,
5.000% due 12/1/45 | | | 756,473 | |
| | 500,000 | | | Midcities Metropolitan District No. 2, CO, Special Revenue, Revenue Bonds, Refunding, Subseries B,
7.750% due 12/15/464 | | | 488,740 | |
| | 500,000 | | | Mountain Shadows, CO, Metropolitan District, General Obligation Limited,
3.250% due 12/1/20 | | | 502,715 | |
| | 750,000 | | | Solaris, CO, Metropolitan District No. 3, General Obligation Limited, Refunding, Series A,
5.000% due 12/1/36 | | | 781,132 | |
| | 500,000 | | | Southglenn, CO, Metropolitan District, Special Revenue, General Obligation Limited, Refunding,
5.000% due 12/1/30 | | | 529,865 | |
| | 500,000 | | | Tallyns Reach, CO, Metropolitan District No. 3, General Obligation Limited,
6.750% due 11/1/384 | | | 509,925 | |
| | | | | | | | |
| | | | | | | 4,660,044 | |
| | | | | | | | |
| | |
| | | | Connecticut — 1.5% | | | |
| | 425,000 | | | Connecticut State Health & Educational Facilities Authority, Church Home of Hartford, Inc. Project, Revenue Bonds, Series A,
5.000% due 9/1/532 | | | 456,743 | |
| | 750,000 | | | Hamden, CT, Facilities Revenue Bonds, Series A,
7.750% due 1/1/434 | | | 784,530 | |
| | 1,000,000 | | | Mohegan Tribe of Indians, CT, Gaming Authority, Revenue Bonds, Series A,
5.500% due 8/1/262 | | | 984,730 | |
| | | | | | | | |
| | | | | | | 2,226,003 | |
| | | | | | | | |
| | |
| | | | District Of Columbia — 1.1% | | | |
| | | | District of Columbia, Friendship Public Charter School, Inc., Revenue Bonds, Series A: | | | | |
| | 500,000 | | | 5.000% due 6/1/36 | | | 569,775 | |
| | 600,000 | | | 5.000% due 6/1/46 | | | 675,846 | |
| | 3,000,000 | | | District of Columbia, Tobacco Settlement Financing Corp., Revenue Bonds, Series A
0.000% due 6/15/461 | | | 381,120 | |
| | | | | | | | |
| | | | | | | 1,626,741 | |
| | | | | | | | |
See Notes to Financial Statements.
THE GLENMEDE FUND, INC.
High Yield Municipal Portfolio
SCHEDULE OF PORTFOLIO INVESTMENTS — (Continued)
October 31, 2016
| | | | | | | | |
Face
Amount | | | | | Value | |
|
| MUNICIPAL BONDS* — (Continued) | |
| | | | Florida — 6.0% | | | |
| $ | 150,000 | | | Collier County, FL, Health Facilities Authority, Residential Care Facility Revenue, Refunding, Series A,
3.000% due 5/1/20 | | $ | 157,924 | |
| | 200,000 | | | Florida Development Finance Corp., Healthcare Facilities Revenue, University of Florida Health Project, Series A,
6.000% due 2/1/33 | | | 226,412 | |
| | 500,000 | | | Florida State Higher Educational Facilities Financial Authority, Nova Southeastern University Project,
5.000% due 4/1/33 | | | 585,970 | |
| | 860,000 | | | Miami-Dade County, FL, Expressway Authority, Toll System Revenue, Revenue Bonds, Refunding, Series A,
5.000% due 7/1/32 | | | 1,028,887 | |
| | | | Orange County, FL, Health Facilities Authority Revenue: | | | | |
| | 150,000 | | | 4.000% due 8/1/19 | | | 160,077 | |
| | 750,000 | | | 5.000% due 8/1/40 | | | 843,750 | |
| | | | Palm Beach County, FL, Health Facilities Authority, Lifespace Communities, Revenue Bonds, Refunding, Series C: | | | | |
| | 295,000 | | | 5.000% due 5/15/20 | | | 330,134 | |
| | 55,000 | | | 5.000% due 5/15/25 | | | 66,926 | |
| | 150,000 | | | Palm Beach County, FL, Health Facilities Authority, Revenue Bonds, Refunding,
4.000% due 12/1/18 | | | 157,916 | |
| | 200,000 | | | Pompano Beach, FL, John Knox Project, Revenue Bonds,
4.000% due 9/1/19 | | | 213,106 | |
| | 500,000 | | | Seminole Tribe, FL, Special Obligation Revenue, Series A,
5.250% due 10/1/272 | | | 514,885 | |
| | | | Southeast Overtown Park West Community Redevelopment Agency, FL, Series A-1: | | | | |
| | 325,000 | | | 5.000% due 3/1/202 | | | 354,416 | |
| | 500,000 | | | 5.000% due 3/1/302 | | | 555,975 | |
| | | | Tallahassee, FL, Health Facilities Revenue, Tallahassee Memorial Healthcare Project, Series A: | | | | |
| | 460,000 | | | 5.000% due 12/1/41 | | | 520,159 | |
| | 300,000 | | | 5.000% due 12/1/55 | | | 335,985 | |
| | 1,000,000 | | | Tallahassee, FL, Health Facilities, Tallahassee Memorial Healthcare, Revenue Bonds, Series A,
5.000% due 12/1/44 | | | 1,115,060 | |
| | 1,000,000 | | | Tampa, FL, Revenue Bonds, Refunding, University of Tampa Project,,
5.000% due 4/1/40 | | | 1,131,870 | |
| | | | Winter Garden Village at Fowler Groves, FL, Community Development District, Special Assessment, Refunding: | | | | |
| | 500,000 | | | 3.750% due 5/1/31 | | | 493,770 | |
| | 500,000 | | | 4.125% due 5/1/37 | | | 492,985 | |
| | | | | | | | |
| | | | | | | 9,286,207 | |
| | | | | | | | |
| | |
| | | | Georgia — 1.1% | | | |
| | 500,000 | | | DeKalb County, GA, Hospital Authority, DeKalb Medical Center, Inc. Project, Revenue Bonds,
6.000% due 9/1/30 | | | 569,070 | |
| | 1,000,000 | | | Private Colleges & Universities Authority, GA, Savannah College of Art & Design Project, Revenue,
5.000% due 4/1/44 | | | 1,122,190 | |
| | | | | | | | |
| | | | | | | 1,691,260 | |
| | | | | | | | |
| | |
| | | | Illinois — 16.0% | | | |
| | 500,000 | | | Chicago, IL, Board of Education, General Obligation Unlimited, Refunding, Series A3,
1.460% due 3/1/365 | | | 468,605 | |
| | 250,000 | | | Chicago, IL, Board of Education, General Obligation Unlimited, Series A,
7.000% due 12/1/44 | | | 265,497 | |
| | 500,000 | | | Chicago, IL, Board of Education, General Obligation Unlimited, Series C,
5.250% due 12/1/39 | | | 459,280 | |
| | 500,000 | | | Chicago, IL, O’Hare International Airport, Revenue Bonds, Series B,
5.000% due 1/1/30 | | | 590,590 | |
| | 250,000 | | | Chicago, IL, Wastewater Transmission Revenue, (NPFG Insured),
5.500% due 1/1/20 | | | 278,832 | |
See Notes to Financial Statements.
THE GLENMEDE FUND, INC.
High Yield Municipal Portfolio
SCHEDULE OF PORTFOLIO INVESTMENTS — (Continued)
October 31, 2016
| | | | | | | | |
Face
Amount | | | | | Value | |
|
| MUNICIPAL BONDS* — (Continued) | |
| | | | Illinois — (Continued) | | | |
| $ | 500,000 | | | Chicago, IL, Wastewater Transmission Revenue, Revenue Bonds, Series C,
5.000% due 1/1/22 | | $ | 567,485 | |
| | | | Chicago, IL, Waterworks Revenue, Revenue Bonds: | | | | |
| | 200,000 | | | 5.000% due 11/1/24 | | | 229,214 | |
| | 375,000 | | | 5.000% due 11/1/30 | | | 430,001 | |
| | 150,000 | | | Chicago, IL, Waterworks Revenue, Revenue Bonds, (AGMC Insured),
5.000% due 11/1/17 | | | 155,924 | |
| | 500,000 | | | Chicago, IL, Waterworks Revenue, Revenue Bonds, Refunding,
5.000% due 11/1/27 | | | 593,520 | |
| | 500,000 | | | Cook County, IL, Community College District No. 508, General Obligation Unlimited,
5.250% due 12/1/43 | | | 556,780 | |
| | 500,000 | | | Cook County, IL, General Obligation Unlimited, Refunding, Series A,
5.000% due 11/15/31 | | | 573,050 | |
| | 400,000 | | | Illinois State Finance Authority, Christian Homes, Inc., Revenue Bonds,
5.000% due 5/15/36 | | | 437,096 | |
| | 795,000 | | | Illinois State Finance Authority, Presbyterian Homes, Revenue Bonds, Series A,
5.000% due 5/1/25 | | | 960,805 | |
| | 150,000 | | | Illinois State Finance Authority, Presbyterian Homes, Revenue Bonds, Series B,
1.719% due 5/1/365 | | | 150,629 | |
| | 255,000 | | | Illinois State Finance Authority, Revenue Bonds, Refunding,
3.000% due 5/15/20 | | | 259,465 | |
| | 150,000 | | | Illinois State Finance Authority, Revenue Bonds, Refunding, Lifespace Communities Project, Series A,
5.000% due 5/15/22 | | | 175,146 | |
| | 500,000 | | | Illinois State Finance Authority, Revenue Bonds, Refunding, OSF Healthcare System, Series A,
5.000% due 11/15/45 | | | 566,795 | |
| | | | Illinois State Finance Authority, Revenue Bonds, Refunding, Series A: | | | | |
| | 300,000 | | | 5.000% due 7/1/35 | | | 349,737 | |
| | 1,000,000 | | | 4.125% due 11/15/37 | | | 1,044,510 | |
| | | | Illinois State Finance Authority, Revenue Bonds, Refunding, Series C: | | | | |
| | 1,000,000 | | | 5.000% due 2/15/31 | | | 1,117,610 | |
| | 1,000,000 | | | 4.125% due 8/15/37 | | | 1,040,360 | |
| | 500,000 | | | Illinois State Finance Authority, Silver Cross Hospital & Medical Center, Revenue Bonds, Series C,
5.000% due 8/15/44 | | | 555,495 | |
| | 500,000 | | | Illinois State Finance Authority, Student Housing Revenue, Northern Illinois University Project, Revenue Bonds,
6.000% due 10/1/24 | | | 569,500 | |
| | | | Illinois State Finance Authority, Student Housing Revenue, Northern Illinois University Project, Revenue Bonds, Series A: | | | | |
| | 250,000 | | | 5.000% due 7/1/35 | | | 261,063 | |
| | 500,000 | | | 5.000% due 7/1/47 | | | 518,110 | |
| | 1,000,000 | | | Illinois State Housing Development Authority, Revenue Bonds, Refunding, Series C,
3.500% due 8/1/46 | | | 1,064,310 | |
| | 1,000,000 | | | Illinois State Sports Facilities Authority, Revenue Bonds, Refunding, (AGMC Insured),
5.250% due 6/15/31 | | | 1,136,930 | |
| | 500,000 | | | Illinois State University, Revenue Bonds, (AGMC Insured),
5.000% due 4/1/24 | | | 588,855 | |
| | | | Illinois State, General Obligation Unlimited: | | | | |
| | 500,000 | | | 5.000% due 1/1/30 | | | 535,255 | |
| | 1,500,000 | | | 4.000% due 6/1/32 | | | 1,449,225 | |
| | 1,000,000 | | | 5.000% due 2/1/39 | | | 1,034,950 | |
| | 200,000 | | | 5.000% due 1/1/41 | | | 208,194 | |
| | 500,000 | | | Metropolitan Pier & Exposition Authority, IL, Dedicated State Tax Revenue, Revenue Bonds, (AGMC Insured)
0.000% due 6/15/271 | | | 327,895 | |
| | 2,000,000 | | | Metropolitan Pier & Exposition Authority, IL, Dedicated State Tax Revenue, Revenue Bonds, Series A, (NPFG Insured)
0.000% due 6/15/341 | | | 922,460 | |
See Notes to Financial Statements.
THE GLENMEDE FUND, INC.
High Yield Municipal Portfolio
SCHEDULE OF PORTFOLIO INVESTMENTS — (Continued)
October 31, 2016
| | | | | | | | |
Face
Amount | | | | | Value | |
|
| MUNICIPAL BONDS* — (Continued) | |
| | | | Illinois — (Continued) | | | |
| $ | 500,000 | | | Metropolitan Pier & Exposition Authority, IL, McCormick Place Expansion Project, Revenue Bonds, Series B,
5.000% due 12/15/40 | | $ | 547,485 | |
| | 500,000 | | | Metropolitan Pier & Exposition Authority, IL, Revenue Bonds, Series A, (NPFG Insured)
0.000% due 12/15/311 | | | 258,900 | |
| | 500,000 | | | Regional Transportation Authority, IL, Revenue Bonds, Series A, (NPFG Insured),
6.000% due 7/1/33 | | | 666,985 | |
| | 500,000 | | | Southern Illinois State University, Housing & Auxiliary Facilities System, Revenue Bonds, Series B1,
5.000% due 4/1/22 | | | 548,330 | |
| | 1,000,000 | | | University of Illinois, Auxiliary Facilities, Revenue Bonds, Series A, (AGMC Insured),
4.000% due 4/1/36 | | | 1,052,930 | |
| | 500,000 | | | Volo Village, IL, Special Service Area No. 3 & 6, Special Tax, Symphony Meadows/Lancaster Falls Project, (AGMC Insured),
2.875% due 3/1/25 | | | 504,490 | |
| | 500,000 | | | Yorkville, IL, United City Special Service, Special Tax, (AGMC Insured),
3.000% due 3/1/25 | | | 509,820 | |
| | | | | | | | |
| | | | | | | 24,532,113 | |
| | | | | | | | |
| | |
| | | | Indiana — 0.9% | | | |
| | | | Indiana State Finance Authority, Greencroft Obligated Group, Revenue Bonds, Series A: | | | | |
| | 95,000 | | | 5.750% due 11/15/28 | | | 106,346 | |
| | 120,000 | | | 6.500% due 11/15/33 | | | 138,403 | |
| | | | Knox County, IN, Economic Development Authority, Revenue Bonds, Refunding, Series A: | | | | |
| | 300,000 | | | 5.000% due 4/1/23 | | | 334,512 | |
| | 350,000 | | | 5.000% due 4/1/28 | | | 380,824 | |
| | 355,000 | | | Vigo County, IN, Hospital Authority, Revenue Bonds, Prerefunded 9/1/17 @ 100,
5.500% due 9/1/272 | | | 368,927 | |
| | | | | | | | |
| | | | | | | 1,329,012 | |
| | | | | | | | |
| | |
| | | | Iowa — 0.3% | | | |
| | 395,000 | | | Tobacco Settlement Authority, IA, Revenue Bonds, Series C,
5.375% due 6/1/38 | | | 393,381 | |
| | | | | | | | |
| | |
| | | | Kansas — 0.3% | | | |
| | 250,000 | | | Wichita, KS, Health Care Facilities, Revenue Bonds, Series II-A,
5.000% due 12/1/31 | | | 253,870 | |
| | 150,000 | | | Wyandotte County, Kansas City Unified Government, Revenue Bonds,
5.000% due 12/1/34 | | | 153,915 | |
| | 100,000 | | | Wyandotte County, KS, Kansas City Unified Government, Wyandotte Plaza Project, Revenue Bonds,
4.000% due 12/1/28 | | | 100,162 | |
| | | | | | | | |
| | | | | | | 507,947 | |
| | | | | | | | |
| | |
| | | | Kentucky — 1.8% | | | |
| | 555,000 | | | Ashland, KY, Medical Center Revenue, Refunding, Kings Daughters Medical Center Project, Series A,
5.000% due 2/1/30 | | | 632,028 | |
| | | | Kentucky Public Transportation Infrastructure Authority, Toll Revenue, Downtown Crossing Project, Series A: | | | | |
| | 100,000 | | | 5.000% due 7/1/17 | | | 102,623 | |
| | 100,000 | | | 6.000% due 7/1/53 | | | 117,534 | |
| | 1,225,000 | | | Kentucky State Economic Development Finance Authority, Solid Waste Disposal Revenue, Republic Services, Inc., Project,
0.700% due 4/1/315 | | | 1,225,000 | |
| | 110,000 | | | Kentucky State, Economic Development Finance Authority, Baptist Healthcare System, Revenue Bonds, Series A,
5.375% due 8/15/24 | | | 117,464 | |
| | 500,000 | | | Paducah, KY, Electric Plant Board Revenue, Refunding, Series A, (AGMC Insured),
5.000% due 10/1/32 | | | 589,915 | |
| | | | | | | | |
| | | | | | | 2,784,564 | |
| | | | | | | | |
See Notes to Financial Statements.
THE GLENMEDE FUND, INC.
High Yield Municipal Portfolio
SCHEDULE OF PORTFOLIO INVESTMENTS — (Continued)
October 31, 2016
| | | | | | | | |
Face
Amount | | | | | Value | |
|
| MUNICIPAL BONDS* — (Continued) | |
| | | | Louisiana — 1.7% | | | |
| $ | 900,000 | | | Juban Crossing Economic Development District, LA, Revenue Bonds, Refunding, Series C,
7.000% due 9/15/442 | | $ | 953,316 | |
| | 1,000,000 | | | Louisiana State, Citizens Property Insurance Corp., Revenue Bonds, Refunding, Series A,
5.000% due 6/1/26 | | | 1,239,850 | |
| | 350,000 | | | Louisiana State, Local Government Environmental Facilities & Community Development Authority, Westlake Chemical Corp, Series A,
6.500% due 8/1/29 | | | 401,625 | |
| | | | | | | | |
| | | | | | | 2,594,791 | |
| | | | | | | | |
| | |
| | | | Maryland — 0.3% | | | |
| | 500,000 | | | Prince George’s County, MD, Revenue Authority, Suitland-Naylor Road Project,
5.000% due 7/1/462 | | | 514,450 | |
| | | | | | | | |
| | |
| | | | Massachusetts — 0.2% | | | |
| | 190,000 | | | Massachusetts State, Development Finance Agency Revenue, Refunding, Umass Memorial Healthcare, Series I,
5.000% due 7/1/29 | | | 223,508 | |
| | | | | | | | |
| | |
| | | | Michigan — 3.9% | | | |
| | 450,000 | | | Detroit, MI, City School District, General Obligation Unlimited, Refunding, Series A, (AGMC Insured QSBLF),
5.250% due 5/1/32 | | | 546,615 | |
| | | | Kentwood, MI, Economic Development Corp., Revenue Bonds, Refunding: | | | | |
| | 50,000 | | | 4.500% due 11/15/21 | | | 55,168 | |
| | 25,000 | | | 4.750% due 11/15/22 | | | 27,619 | |
| | 250,000 | | | 5.625% due 11/15/41 | | | 271,682 | |
| | 1,045,000 | | | Michigan State Finance Authority, Detroit Water & Sewer Department, Revenue Bonds, Series C, (AGMC Insured),
5.000% due 7/1/35 | | | 1,200,841 | |
| | 1,000,000 | | | Michigan State Finance Authority, Revenue Bonds, Detroit Water & Sewer Department, Series C,
5.000% due 7/1/35 | | | 1,127,990 | |
| | 200,000 | | | Michigan State Strategic Fund, Limited Obligation Revenue, Revenue Bonds, Refunding, Series CC,
1.450% due 9/1/305 | | | 197,460 | |
| | | | Michigan State Tobacco Settlement Finance Authority, Revenue Bonds, Series A: | | | | |
| | 1,000,000 | | | 6.000% due 6/1/34 | | | 1,003,830 | |
| | 1,015,000 | | | 6.000% due 6/1/48 | | | 1,001,632 | |
| | 500,000 | | | Wayne County, MI, Airport Authority Revenue, Refunding, Series D,
5.000% due 12/1/45 | | | 575,550 | |
| | | | | | | | |
| | | | | | | 6,008,387 | |
| | | | | | | | |
| | |
| | | | Missouri — 1.6% | | | |
| | 500,000 | | | Cape Girardeau County, MO, Industrial Development Authority, Southeast Health, Revenue Bonds, Series A,
6.000% due 3/1/334 | | | 540,295 | |
| | 500,000 | | | Lees Summit, MO, Industrial Development Authority, Senior Living Facilities, Revenue Bonds, Series A,
5.000% due 8/15/463 | | | 515,560 | |
| | 100,000 | | | Missouri State Health & Educational Facilities Authority, Lutheran Senior Services, Revenue Bonds,
5.000% due 2/1/25 | | | 116,053 | |
| | 125,000 | | | Missouri State Health & Educational Facilities Authority, Revenue Bonds,
5.000% due 2/1/26 | | | 143,580 | |
| | | | Missouri State Health & Educational Facilities Authority, Revenue Bonds, Series A: | | | | |
| | 100,000 | | | 5.000% due 2/1/28 | | | 117,472 | |
| | 225,000 | | | 5.000% due 2/1/29 | | | 262,008 | |
| | 580,000 | | | St. Louis, MO, Airport Revenue, (NPFG Insured),
5.500% due 7/1/28 | | | 732,291 | |
| | | | | | | | |
| | | | | | | 2,427,259 | |
| | | | | | | | |
| | |
| | | | Nebraska — 0.1% | | | |
| | 180,000 | | | Lancaster County, NE, Hospital Authority, Revenue Bonds, Series B-1, (LOC: U.S. Bank N.A.),
0.530% due 6/1/315 | | | 180,000 | |
| | | | | | | | |
See Notes to Financial Statements.
THE GLENMEDE FUND, INC.
High Yield Municipal Portfolio
SCHEDULE OF PORTFOLIO INVESTMENTS — (Continued)
October 31, 2016
| | | | | | | | |
Face
Amount | | | | | Value | |
|
| MUNICIPAL BONDS* — (Continued) | |
| | | | Nevada — 0.9% | | | |
| $ | 890,000 | | | Las Vegas, NV, Redevelopment Agency, Tax Revenue,
5.000% due 6/15/22 | | $ | 1,034,803 | |
| | | | Las Vegas, NV, Sales Tax Increment Revenue: | | | | |
| | 165,000 | | | 2.750% due 6/15/212 | | | 162,751 | |
| | 235,000 | | | 3.500% due 6/15/252 | | | 231,534 | |
| | | | | | | | |
| | | | | | | 1,429,088 | |
| | | | | | | | |
| | |
| | | | New Jersey — 4.7% | | | |
| | 250,000 | | | Casino Reinvestment Development Authority, NJ, Luxury Tax Revenue, Refunding, (AGMC Insured),
5.000% due 11/1/24 | | | 288,978 | |
| | 500,000 | | | New Jersey State Economic Development Authority, Revenue Bonds, Refunding, Series I,
2.230% due 3/1/285 | | | 475,360 | |
| | 250,000 | | | New Jersey State Economic Development Authority, Revenue Bonds, Series A,
5.000% due 1/1/24 | | | 289,877 | |
| | 1,000,000 | | | New Jersey State Educational Facilities Authority, Revenue Bonds, Refunding, Series A,
5.000% due 7/1/29 | | | 1,173,600 | |
| | 400,000 | | | New Jersey State Educational Facilities Authority, Revenue Bonds, Refunding, Series A, (AGMC Insured),
5.000% due 7/1/34 | | | 468,148 | |
| | 125,000 | | | New Jersey State Health Care Facilities Financing Authority, Revenue Bonds, Refunding,
5.000% due 7/1/41 | | | 139,608 | |
| | 500,000 | | | New Jersey State Health Care Facilities Financing Authority, Revenue Bonds, Series A,
5.000% due 7/1/34 | | | 587,945 | |
| | 450,000 | | | New Jersey State Health Care Facilities Financing Authority, Revenue Bonds, Series A,
5.000% due 7/1/29 | | | 515,736 | |
| | 200,000 | | | New Jersey State Health Care Facilities Financing Authority, University Hospital, Revenue Bonds, Series A, (AGMC Insured),
5.000% due 7/1/30 | | | 234,652 | |
| | 1,000,000 | | | New Jersey State Transportation Trust Fund Authority, Revenue Bonds, Series C, (AMBAC Insured)
0.000% due 12/15/351 | | | 445,780 | |
| | 285,000 | | | New Jersey State Turnpike Authority, Revenue Bonds,
1.180% due 1/1/185 | | | 285,601 | |
| | 1,000,000 | | | New Jersey State Turnpike Authority, Revenue Bonds, Series E,
1.310% due 1/1/245 | | | 1,002,730 | |
| | | | South Jersey, NJ, Transportation Authority LLC, Revenue Bonds, Refunding, Series A: | | | | |
| | 200,000 | | | 5.000% due 11/1/26 | | | 234,414 | |
| | 750,000 | | | 5.000% due 11/1/32 | | | 850,282 | |
| | 250,000 | | | 5.000% due 11/1/33 | | | 282,670 | |
| | | | | | | | |
| | | | | | | 7,275,381 | |
| | | | | | | | |
| | |
| | | | New York — 7.0% | | | |
| | 225,000 | | | Glen Cove, NY, Local Economic Assistance Corp., Revenue Bonds, Series C
0.000% due 1/1/553 | | | 156,938 | |
| | 500,000 | | | New York City, NY, Housing Development Corp., Multi-Family Mortgage Revenue, Series E,
3.500% due 2/15/48 | | | 507,700 | |
| | 500,000 | | | New York City, NY, Housing Development Corp., Multi-Family Mortgage Revenue, Series F,
4.500% due 2/15/48 | | | 526,035 | |
| | 3,000,000 | | | New York City, NY, Municipal Water Finance Authority, Water & Sewer System Revenue, Series B (SPA: State Street Bank & Trust Co.),
0.520% due 6/15/325 | | | 3,000,000 | |
| | 1,200,000 | | | New York City, NY, Transitional Finance Authority Revenue, SubSeries E-4
(SPA: JP Morgan Chase Bank N.A.),
0.520% due 2/1/455 | | | 1,200,000 | |
| | 500,000 | | | New York State, Liberty Development Corp., Revenue Bonds,
5.000% due 11/15/442 | | | 562,440 | |
| | 1,000,000 | | | New York State, Liberty Development Corp., World Trade Center Project, Revenue Bonds,
5.150% due 11/15/342 | | | 1,136,860 | |
| | 1,000,000 | | | New York State, Mortgage Agency, Homeowner Mortgage, Revenue Bonds, Refunding, Series 195,
4.000% due 10/1/46 | | | 1,084,580 | |
See Notes to Financial Statements.
THE GLENMEDE FUND, INC.
High Yield Municipal Portfolio
SCHEDULE OF PORTFOLIO INVESTMENTS — (Continued)
October 31, 2016
| | | | | | | | |
Face
Amount | | | | | Value | |
|
| MUNICIPAL BONDS* — (Continued) | |
| | | | New York — (Continued) | | | |
| $ | 2,300,000 | | | New York, NY, General Obligation Unlimited, Subseries H-1 (SPA: JP Morgan Chase Bank N.A.),
0.520% due 1/1/365 | | $ | 2,300,000 | |
| | 310,000 | | | Port Authority of New York & New Jersey, JFK International Airport, Revenue Bonds,
6.000% due 12/1/42 | | | 359,110 | |
| | | | | | | | |
| | | | | | | 10,833,663 | |
| | | | | | | | |
| | |
| | | | North Carolina — 0.8% | | | |
| | 500,000 | | | North Carolina State Medical Care Commission, Revenue Bonds,
5.000% due 10/1/20 | | | 547,920 | |
| | 150,000 | | | North Carolina State, Medical Care Commission, Health System Revenue, Revenue Bonds, Refunding,
5.000% due 10/1/343 | | | 174,567 | |
| | 500,000 | | | North Carolina State, Medical Care Commission, Retirement Facilities Revenue, Revenue Bonds, Refunding,
5.000% due 10/1/313 | | | 555,100 | |
| | | | | | | | |
| | | | | | | 1,277,587 | |
| | | | | | | | |
| | |
| | | | Ohio — 6.5% | | | |
| | | | Buckeye Tobacco Settlement Financing Authority, OH, Revenue Bonds, Series A-2: | | | | |
| | 2,000,000 | | | 5.875% due 6/1/47 | | | 1,880,060 | |
| | 1,205,000 | | | 6.500% due 6/1/47 | | | 1,185,274 | |
| | 25,000 | | | Buckeye Tobacco Settlement Financing Authority, OH, Revenue Bonds, Series A-3,
6.250% due 6/1/37 | | | 24,283 | |
| | 230,000 | | | Cleveland, OH, Airport System Revenue, Revenue Bonds, Series A, (AGMC Insured),
5.000% due 1/1/29 | | | 270,372 | |
| | 250,000 | | | Cleveland, OH, Airport System Revenue, Revenue Bonds, Series B, (AGMC Insured),
5.000% due 1/1/23 | | | 295,370 | |
| | 700,000 | | | Hamilton County, OH, Healthcare Revenue, Refunding and Improvement, Life Enriching Communities Project, Revenue Bonds, Refunding,
5.000% due 1/1/51 | | | 758,828 | |
| | 815,000 | | | Licking County, OH, Health Care Facilities Authority Revenue, Refunding, Series A,
6.000% due 7/1/50 | | | 881,276 | |
| | | | Muskingum County, OH, Hospital Facilities, Genesis Healthcare Systems Project, Revenue Bonds: | | | | |
| | 280,000 | | | 5.000% due 2/15/19 | | | 298,239 | |
| | 1,000,000 | | | 5.000% due 2/15/44 | | | 1,071,190 | |
| | 500,000 | | | Ohio State, Air Quality Development Authority, Revenue Bonds, Series A,
3.750% due 12/1/235 | | | 466,645 | |
| | | | Southeastern Ohio Port Authority Hospital Facilities, Revenue Bonds: | | | | |
| | 200,000 | | | 5.000% due 12/1/16 | | | 200,556 | |
| | 690,000 | | | 5.000% due 12/1/19 | | | 747,491 | |
| | 300,000 | | | 5.750% due 12/1/32 | | | 339,336 | |
| | 500,000 | | | 6.000% due 12/1/42 | | | 567,795 | |
| | 800,000 | | | Warren County, OH, Health Care Facilities, Otterbein Homes, Revenue Bonds, Series A,
5.000% due 7/1/32 | | | 924,648 | |
| | | | | | | | |
| | | | | | | 9,911,363 | |
| | | | | | | | |
| | |
| | | | Oklahoma — 0.4% | | | |
| | 500,000 | | | Comanche County, OK, Hospital Authority Revenue, Refunding,
5.000% due 7/1/27 | | | 542,670 | |
| | 110,000 | | | Fort Sill Apache Tribe, OK, Economic Development Authority, Gaming Enterprise Revenue, Series A,
8.500% due 8/25/262,4 | | | 130,723 | |
| | | | | | | | |
| | | | | | | 673,393 | |
| | | | | | | | |
| | |
| | | | Oregon — 0.2% | | | |
| | 50,000 | | | Oregon State, Facilities Authority, Revenue Bonds, Series C,
1.630% due 10/1/225 | | | 50,008 | |
| | 275,000 | | | Yamhill County, OR, Hospital Authority, Revenue Bonds, Refunding, Series A,
5.000% due 11/15/51 | | | 296,252 | |
| | | | | | | | |
| | | | | | | 346,260 | |
| | | | | | | | |
See Notes to Financial Statements.
THE GLENMEDE FUND, INC.
High Yield Municipal Portfolio
SCHEDULE OF PORTFOLIO INVESTMENTS — (Continued)
October 31, 2016
| | | | | | | | |
Face
Amount | | | | | Value | |
|
| MUNICIPAL BONDS* — (Continued) | |
| | | | Pennsylvania — 3.4% | | | |
| $ | 400,000 | | | Crawford County, PA, Hospital Authority, Revenue Bonds, Refunding, Series A,
6.000% due 6/1/363 | | $ | 403,164 | |
| | 620,000 | | | Cumberland County, PA, Municipal Authority, Revenue Bonds, Refunding,
5.000% due 1/1/32 | | | 713,880 | |
| | 275,000 | | | Dauphin County, PA, General Authority, Health Systems Revenue, Refunding, Series A,
5.000% due 6/1/34 | | | 324,272 | |
| | 450,000 | | | Doylestown, PA, Hospital Authority, Revenue Bonds, Refunding, Series A,,
5.000% due 7/1/41 | | | 498,699 | |
| | 175,000 | | | East Hempfield Township, PA, Industrial Development Authority, Revenue Bonds, Refunding,
5.000% due 12/1/26 | | | 210,296 | |
| | | | Montgomery County, PA, Industrial Development Authority, Revenue Bonds, Refunding: | | | | |
| | 105,000 | | | 5.000% due 11/15/23 | | | 121,804 | |
| | 100,000 | | | 5.000% due 12/1/46 | | | 110,151 | |
| | | | Pennsylvania State, Higher Educational Facilities Authority, Revenue Bonds, Prerefunded 7/1/20 @ 100: | | | | |
| | 1,080,000 | | | 5.800% due 7/1/30 | | | 1,255,975 | |
| | 650,000 | | | 6.000% due 7/1/43 | | | 760,559 | |
| | 545,000 | | | Pennsylvania State, Higher Educational Facilities Authority, Student Housing Revenue, Refunding, Series A,
5.000% due 7/1/25 | | | 629,873 | |
| | 245,000 | | | Philadelphia, PA, Hospitals & Higher Education Facilities Authority, Temple University Health Systems, Revenue Bonds, Series B,
5.000% due 7/1/17 | | | 248,523 | |
| | | | | | | | |
| | | | | | | 5,277,196 | |
| | | | | | | | |
| | |
| | | | Puerto Rico — 7.6% | | | |
| | 145,000 | | | Commonwealth of Puerto Rico, Aqueduct & Sewer Authority, Revenue Bonds, Series A, (AGC Insured),
5.000% due 7/1/28 | | | 149,051 | |
| | 35,000 | | | Commonwealth of Puerto Rico, General Obligation Unlimited, Refunding, (AGMC Insured),
4.500% due 7/1/23 | | | 35,039 | |
| | 90,000 | | | Commonwealth of Puerto Rico, General Obligation Unlimited, Refunding, (NPFG Insured)
0.000% due 7/1/181 | | | 84,416 | |
| | 150,000 | | | Commonwealth of Puerto Rico, General Obligation Unlimited, Refunding, Series A, (AGMC Insured),
5.000% due 7/1/35 | | | 161,141 | |
| | | | Commonwealth of Puerto Rico, General Obligation Unlimited, Series A-4, (AGMC Insured): | | | | |
| | 135,000 | | | 5.250% due 7/1/30 | | | 144,284 | |
| | 45,000 | | | 5.000% due 7/1/31 | | | 47,759 | |
| | | | Puerto Rico Commonwealth Aqueduct & Sewer Authority, Revenue Bonds, Series A: | | | | |
| | 90,000 | | | 5.125% due 7/1/37 | | | 67,874 | |
| | 2,000,000 | | | 5.250% due 7/1/42 | | | 1,508,520 | |
| | 1,150,000 | | | Puerto Rico Commonwealth Aqueduct & Sewer Authority, Revenue Bonds, Series A, (AGC Insured),
5.125% due 7/1/47 | | | 1,180,164 | |
| | 25,000 | | | Puerto Rico Electric Power Authority, Revenue Bonds, (AGMC Insured),
5.000% due 7/1/27 | | | 25,326 | |
| | | | Puerto Rico Electric Power Authority, Revenue Bonds, Refunding, Series DDD, (AGMC Insured): | | | | |
| | 610,000 | | | 3.625% due 7/1/23 | | | 606,938 | |
| | 50,000 | | | 3.650% due 7/1/24 | | | 49,750 | |
| | 50,000 | | | Puerto Rico Electric Power Authority, Revenue Bonds, Refunding, Series SS, (AGMC Insured),
5.000% due 7/1/30 | | | 50,079 | |
| | 100,000 | | | Puerto Rico Electric Power Authority, Revenue Bonds, Refunding, Series UU, (AGC Insured),
4.250% due 7/1/27 | | | 100,634 | |
| | 125,000 | | | Puerto Rico Electric Power Authority, Revenue Bonds, Refunding, Series V, (NPFG Insured),
5.250% due 7/1/35 | | | 136,349 | |
| | 265,000 | | | Puerto Rico Electric Power Authority, Revenue Bonds, Refunding, Series VV, (NPFG Insured),
5.250% due 7/1/30 | | | 288,961 | |
| | 100,000 | | | Puerto Rico Electric Power Authority, Revenue Bonds, Series A,
7.000% due 7/1/33 | | | 68,006 | |
| | 160,000 | | | Puerto Rico Electric Power Authority, Revenue Bonds, Series NN, (NPFG Insured),
4.750% due 7/1/33 | | | 160,098 | |
See Notes to Financial Statements.
THE GLENMEDE FUND, INC.
High Yield Municipal Portfolio
SCHEDULE OF PORTFOLIO INVESTMENTS — (Continued)
October 31, 2016
| | | | | | | | |
Face
Amount | | | | | Value | |
|
| MUNICIPAL BONDS* — (Continued) | |
| | | | Puerto Rico — (Continued) | | | |
| $ | 50,000 | | | Puerto Rico Electric Power Authority, Revenue Bonds, Series RR, (AGC Insured),
5.000% due 7/1/28 | | $ | 50,080 | |
| | 90,000 | | | Puerto Rico Electric Power Authority, Revenue Bonds, Series SS, (NPFG Insured),
5.000% due 7/1/24 | | | 91,140 | |
| | 50,000 | | | Puerto Rico Electric Power Authority, Revenue Bonds, Series TT,
5.000% due 7/1/22 | | | 33,862 | |
| | 1,250,000 | | | Puerto Rico Electric Power Authority, Revenue Bonds, Series UU, (AGMC Insured),
1.087% due 7/1/295 | | | 934,512 | |
| | 150,000 | | | Puerto Rico Electric Power Authority, Revenue Bonds, Series VV, (NPFG Insured),
5.250% due 7/1/29 | | | 163,124 | |
| | 335,000 | | | Puerto Rico Electric Power Authority, Revenue Bonds, Series XX,
5.250% due 7/1/40 | | | 227,408 | |
| | | | Puerto Rico Industrial Tourist Educational Medical & Environmental Control Facilities Financing Authority, Auxilio Muto, Revenue Bonds, Series A: | | | | |
| | 250,000 | | | 5.000% due 7/1/18 | | | 258,595 | |
| | 750,000 | | | 6.000% due 7/1/33 | | | 758,422 | |
| | 250,000 | | | Puerto Rico Industrial Tourist Educational Medical & Environmental Control Facilities Financing Authority, International American University Project, Revenue Bonds,
5.000% due 10/1/31 | | | 244,210 | |
| | 435,000 | | | Puerto Rico Industrial Tourist Educational Medical & Environmental Control Facilities Financing Authority, Revenue Bonds,
5.000% due 3/1/36 | | | 378,842 | |
| | 500,000 | | | Puerto Rico Industrial Tourist Educational Medical & Environmental Control Facilities Financing Authority, Revenue Bonds, Refunding,
5.000% due 10/1/20 | | | 515,110 | |
| | | | Puerto Rico Sales Tax Financing Corp., Sales Tax Revenue, Series A, (AMBAC Insured): | | | | |
| | 5,000,000 | | | 0.000% due 8/1/541 | | | 546,650 | |
| | 1,000,000 | | | 0.000% due 8/1/471 | | | 167,790 | |
| | | | Puerto Rico Sales Tax Financing Corp., Sales Tax Revenue, Series A, (NPFG Insured): | | | | |
| | 4,500,000 | | | 0.000% due 8/1/461 | | | 855,225 | |
| | 1,300,000 | | | 0.000% due 8/1/441 | | | 274,755 | |
| | 1,475,000 | | | 0.000% due 8/1/411 | | | 371,449 | |
| | 2,000,000 | | | 0.000% due 8/1/431 | | | 450,560 | |
| | 400,000 | | | 0.000% due 8/1/451 | | | 80,608 | |
| | | | University of Puerto Rico, Revenue Bonds, Refunding, Series P: | | | | |
| | 365,000 | | | 5.000% due 6/1/194 | | | 167,363 | |
| | 25,000 | | | 5.000% due 6/1/17 | | | 16,539 | |
| | 50,000 | | | 5.000% due 6/1/20 | | | 22,435 | |
| | 65,000 | | | University of Puerto Rico, Revenue Bonds, Refunding, Series P, (NPFG Insured),
5.000% due 6/1/25 | | | 65,070 | |
| | | | University of Puerto Rico, Revenue Bonds, Series Q: | | | | |
| | 75,000 | | | 5.000% due 6/1/25 | | | 32,499 | |
| | 210,000 | | | 5.000% due 6/1/304 | | | 89,861 | |
| | 30,000 | | | 5.000% due 6/1/36 | | | 12,757 | |
| | 145,000 | | | 5.000% due 6/1/194 | | | 66,487 | |
| | | | | | | | |
| | | | | | | 11,739,742 | |
| | | | | | | | |
| | |
| | | | Rhode Island — 1.5% | | | |
| | | | Rhode Island Health & Educational Building Corp., Revenue Bonds, Refunding, Series B: | | | | |
| | 900,000 | | | 5.000% due 9/1/31 | | | 974,817 | |
| | 750,000 | | | 5.000% due 9/1/36 | | | 798,510 | |
| | 400,000 | | | Rhode Island State, Commerce Corp., Airports Revenue, Revenue Bonds, Series D,
5.000% due 7/1/28 | | | 475,932 | |
| | | | | | | | |
| | | | | | | 2,249,259 | |
| | | | | | | | |
| | |
| | | | South Carolina — 2.9% | | | |
| | 1,786,324 | | | Connector 2000 Association, Inc., Revenue Bonds, Series A-1
0.000% due 1/1/421 | | | 285,597 | |
See Notes to Financial Statements.
THE GLENMEDE FUND, INC.
High Yield Municipal Portfolio
SCHEDULE OF PORTFOLIO INVESTMENTS — (Continued)
October 31, 2016
| | | | | | | | |
Face
Amount | | | | | Value | |
|
| MUNICIPAL BONDS* — (Continued) | |
| | | | South Carolina — (Continued) | | | |
| $ | 500,000 | | | Connector 2000 Association, Inc., SC, Toll Road Revenue, Series A-1
0.000% due 1/1/321 | | $ | 159,940 | |
| | 610,000 | | | South Carolina State, Housing Finance & Development Authority, Revenue Bonds, (GNMA/FNMA/FHLMC/FHA Insured),
4.000% due 7/1/36 | | | 660,728 | |
| | | | South Carolina State, Jobs-Economic Development Authority, Health Facilities Revenue, Revenue Bonds, Refunding: | | | | |
| | 410,000 | | | 5.000% due 10/1/362 | | | 429,918 | |
| | 1,090,000 | | | 5.000% due 10/1/412 | | | 1,132,107 | |
| | 600,000 | | | 5.625% due 5/1/42 | | | 595,506 | |
| | 1,000,000 | | | South Carolina State, Public Service Authority, Revenue Bonds, Series E,
5.250% due 12/1/55 | | | 1,178,580 | |
| | | | | | | | |
| | | | | | | 4,442,376 | |
| | | | | | | | |
| | |
| | | | Tennessee — 0.4% | | | |
| | 675,000 | | | Clarksville, TN, Public Building Authority Revenue (LOC: Bank of America N.A.),
0.590% due 7/1/355 | | | 675,000 | |
| | | | | | | | |
| | |
| | | | Texas — 7.6% | | | |
| | 250,000 | | | Brazoria County, TX, Health Facilities Development Corp., Revenue Bonds,
5.250% due 7/1/32 | | | 287,687 | |
| | 360,000 | | | Fort Bend County, TX, Industrial Development Corp., NGR Energy, Inc., Revenue Bonds, Series A,
4.750% due 5/1/38 | | | 380,689 | |
| | 250,000 | | | Gregg County, TX, Health Facilities Development Corp., Revenue Bonds, Series C,
5.000% due 7/1/324 | | | 254,598 | |
| | 1,010,000 | | | Harris County, TX, Cultural Education Facilities Finance Corp., Brazos Presbyterian Homes Project, Revenue Bonds, Refunding,
5.000% due 1/1/483 | | | 1,096,506 | |
| | 150,000 | | | Harris County, TX, Cultural Education Facilities Finance Corp., Revenue Bonds, Series A,
5.000% due 1/1/43 | | | 157,658 | |
| | 500,000 | | | Harrison County, TX, Health Facilities Development Corp., Good Shepard Health System, Revenue Bonds,
5.250% due 7/1/284 | | | 516,265 | |
| | 250,000 | | | New Hope Cultural Education Facilities Corp., TX, Housing Revenue, Tarleton State University Project, Revenue Bonds, Series A,
5.000% due 4/1/47 | | | 269,005 | |
| | | | New Hope Cultural Education Facilities Corp., TX, Revenue Bonds, Series A: | | | | |
| | 500,000 | | | 5.000% due 4/1/29 | | | 554,115 | |
| | 600,000 | | | 5.000% due 4/1/30 | | | 664,182 | |
| | 1,200,000 | | | New Hope Cultural Education Facilities Finance Corp., TX, Education Revenue, Revenue Bonds, Refunding, Series A,
5.000% due 8/15/36 | | | 1,211,916 | |
| | | | New Hope Cultural Education Facilities Finance Corp., TX, Retirement Facilities Revenue, Revenue Bonds, Refunding: | | | | |
| | 400,000 | | | 5.000% due 11/1/22 | | | 464,132 | |
| | 200,000 | | | 5.000% due 11/15/36 | | | 221,652 | |
| | 200,000 | | | New Hope Cultural Education Facilities Finance Corp., TX, Retirement Facilities Revenue, Revenue Bonds, Series A,
5.500% due 11/15/463 | | | 200,608 | |
| | 880,000 | | | New Hope Cultural Education Facilities Finance Corp., TX, Student Housing Revenue Bonds, Series A,
5.000% due 4/1/48 | | | 952,767 | |
| | 1,375,000 | | | Tarrant County, TX, Cultural Education Facilities Finance Corp., Retirement Facilities, Revenue Bonds, Refunding,
5.000% due 5/15/45 | | | 1,485,509 | |
| | 285,000 | | | Tarrant County, TX, Cultural Education Facilities Finance Corp., Retirement Facilities, Revenue Bonds, Refunding, Series A,
5.000% due 11/15/45 | | | 306,660 | |
| | 615,000 | | | Texas State, Public Finance Authority, Revenue Bonds, (BAM Insured),
4.000% due 5/1/33 | | | 649,348 | |
See Notes to Financial Statements.
THE GLENMEDE FUND, INC.
High Yield Municipal Portfolio
SCHEDULE OF PORTFOLIO INVESTMENTS — (Continued)
October 31, 2016
| | | | | | | | |
Face
Amount | | | | | Value | |
|
| MUNICIPAL BONDS* — (Continued) | |
| | | | Texas — (Continued) | | | |
| $ | 1,000,000 | | | Texas State, Transportation Commission, Refunding, Series C,
5.000% due 8/15/34 | | $ | 1,146,930 | |
| | 1,000,000 | | | Texas State, Turnpike Authority Central, Turnpike System Revenue, Revenue Bonds, Unrefunded, (AMBAC Insured)
0.000% due 8/15/281 | | | 701,220 | |
| | 200,000 | | | Tyler, TX, Health Facilities Development Corp., Refunding and Improvement East Texas Medical Center, Revenue Bonds,
5.250% due 11/1/27 | | | 204,046 | |
| | | | | | | | |
| | | | | | | 11,725,493 | |
| | | | | | | | |
| | |
| | | | Virginia — 0.3% | | | |
| | 487,000 | | | Peninsula Town Center, VA, Community Development Authority, Revenue Bonds,
6.350% due 9/1/28 | | | 500,095 | |
| | | | | | | | |
| | |
| | | | Washington — 1.7% | | | |
| | 100,000 | | | Skagit County, WA, Public Hospital District No.1, Refunding, Series A,
5.000% due 12/1/19 | | | 109,323 | |
| | 750,000 | | | Washington State, Health Care Facilities Authority, Central Washington Health Services Association,
5.000% due 7/1/39 | | | 840,585 | |
| | 1,000,000 | | | Washington State, Health Care Facilities Authority, Revenue Bonds,
5.000% due 12/1/363 | | | 1,089,910 | |
| | 375,000 | | | Washington State, Health Care Facilities Authority, Series B-1,
1.630% due 1/1/355 | | | 373,170 | |
| | 250,000 | | | Washington State, Housing Finance Commission, Revenue Bonds, Refunding, Series A,
5.000% due 7/1/462 | | | 265,253 | |
| | | | | | | | |
| | | | | | | 2,678,241 | |
| | | | | | | | |
| | |
| | | | Wisconsin — 3.0% | | | |
| | | | Public Finance Authority, WI, Educational Revenue, Revenue Bonds, Series A: | | | | |
| | 500,000 | | | 5.000% due 6/15/362 | | | 499,350 | |
| | 250,000 | | | 5.000% due 6/15/462 | | | 245,895 | |
| | 1,000,000 | | | Public Finance Authority, WI, Revenue Bonds,
5.750% due 4/1/42 | | | 1,044,310 | |
| | 100,000 | | | Public Finance Authority, WI, Senior Living Revenue, Rose Village Project, Revenue Bonds, Series A,
5.000% due 11/15/24 | | | 108,605 | |
| | 1,060,000 | | | Public Finance Authority, WI, Student Housing, Revenue Bonds, Series A,
5.000% due 7/1/25 | | | 1,231,232 | |
| | 2,350,000 | | | Public Finance Authority, WI, Tax Allocation, Increment Finance Grant Revenue
0.000% due 9/1/281 | | | 1,453,170 | |
| | | | | | | | |
| | | | | | | 4,582,562 | |
| | | | | | | | |
| | |
| | | | TOTAL MUNICIPAL BONDS
(Cost $149,938,870) | | | 151,232,487 | |
| | | | | | | | |
| | | | | | | | | | |
| | |
TOTAL INVESTMENTS
(Cost $149,938,870)6 | | | 98.3 | % | | $ | 151,232,487 | |
| | |
OTHER ASSETS IN EXCESS OF LIABILITIES | | | 1.7 | | | | 2,657,813 | |
| | | | | | | | | | |
| | |
NET ASSETS | | | 100.0 | % | | $ | 153,890,300 | |
| | | | | | | | | | |
| * | Percentages indicated are based on net assets. |
| 2 | Security exempt from registration under Rule 144A of the Securities Act of 1933, as amended. This security may be resold in transasctions exempt from registration, normally to qualified buyers. |
| 5 | Floating Rate Bond. Rate shown is as of October 31, 2016. |
| 6 | Aggregate cost for federal tax purposes was $149,938,870. |
See Notes to Financial Statements.
THE GLENMEDE FUND, INC.
High Yield Municipal Portfolio
SCHEDULE OF PORTFOLIO INVESTMENTS — (Continued)
October 31, 2016
Abbreviations:
AGC — Assurance Guaranty Corporation
AGMC — Assured Guaranty Municipal Corporation
AMBAC — American Municipal Bond Assurance Corporation
BAM — Build America Mutual
FHA — Federal Housing Administration
FHLMC — Federal Home Loan Mortgage Corporation
FNMA — Federal National Mortgage Association
GNMA — Government National Mortgage Association
LOC — Letter of Credit
NPFG — National Public Finance Guarantee Corporation
SPA — Stand-By Purchase Agreement
QSBLF — Michigan Qualified School Bond Loan Fund
See Notes to Financial Statements.
THE GLENMEDE FUND, INC.
High Yield Municipal Portfolio
SCHEDULE OF PORTFOLIO INVESTMENTS — (Concluded)
October 31, 2016
STATE DIVERSIFICATION
On October 31, 2016, State Diversification of the Porfolio was as follows:
| | | | | | | | |
| | | % of
Net Assets | | | Value | |
STATE: | | | | | | | | |
Illinois | | | 16.0 | % | | $ | 24,532,113 | |
Puerto Rico | | | 7.6 | | | | 11,739,742 | |
Texas | | | 7.6 | | | | 11,725,493 | |
New York | | | 7.0 | | | | 10,833,663 | |
Ohio | | | 6.5 | | | | 9,911,363 | |
Florida | | | 6.0 | | | | 9,286,207 | |
California | | | 5.0 | | | | 7,669,086 | |
New Jersey | | | 4.7 | | | | 7,275,381 | |
Michigan | | | 3.9 | | | | 6,008,387 | |
Pennsylvania | | | 3.4 | | | | 5,277,196 | |
Colorado | | | 3.0 | | | | 4,660,044 | |
Wisconsin | | | 3.0 | | | | 4,582,562 | |
South Carolina | | | 2.9 | | | | 4,442,376 | |
Arizona | | | 2.4 | | | | 3,623,771 | |
Kentucky | | | 1.8 | | | | 2,784,564 | |
Alabama | | | 1.8 | | | | 2,751,009 | |
Washington | | | 1.7 | | | | 2,678,241 | |
Louisiana | | | 1.7 | | | | 2,594,791 | |
Missouri | | | 1.6 | | | | 2,427,259 | |
Rhode Island | | | 1.5 | | | | 2,249,259 | |
Connecticut | | | 1.5 | | | | 2,226,003 | |
Georgia | | | 1.1 | | | | 1,691,260 | |
District Of Columbia | | | 1.1 | | | | 1,626,741 | |
Nevada | | | 0.9 | | | | 1,429,088 | |
Indiana | | | 0.9 | | | | 1,329,012 | |
North Carolina | | | 0.8 | | | | 1,277,587 | |
Tennessee | | | 0.4 | | | | 675,000 | |
Oklahoma | | | 0.4 | | | | 673,393 | |
Alaska | | | 0.4 | | | | 586,255 | |
Maryland | | | 0.3 | | | | 514,450 | |
Kansas | | | 0.3 | | | | 507,947 | |
Virginia | | | 0.3 | | | | 500,095 | |
Iowa | | | 0.3 | | | | 393,381 | |
Oregon | | | 0.2 | | | | 346,260 | |
Massachusetts | | | 0.2 | | | | 223,508 | |
Nebraska | | | 0.1 | | | | 180,000 | |
| | | | | | | | |
| | |
TOTAL MUNICIPAL BONDS | | | 98.3 | % | | $ | 151,232,487 | |
| | | | | | | | |
TOTAL INVESTMENTS | | | 98.3 | % | | $ | 151,232,487 | |
| | | | | | | | |
See Notes to Financial Statements.
THE GLENMEDE FUND, INC.
Responsible ESG U.S. Equity Portfolio
SCHEDULE OF PORTFOLIO INVESTMENTS
October 31, 2016
| | | | | | | | |
| Shares | | | | | Value | |
|
| COMMON STOCKS1 — 99.3% | |
| | | | Air Freight & Logistics — 1.1% | |
| | 117 | | | CH Robinson Worldwide, Inc. | | $ | 7,970 | |
| | 1,281 | | | Expeditors International of Washington, Inc. | | | 65,933 | |
| | | | | | | | |
| | | | | | | 73,903 | |
| | | | | | | | |
| |
| | | | Airlines — 1.6% | |
| | 2,585 | | | Southwest Airlines Co. | | | 103,529 | |
| | | | | | | | |
| |
| | | | Auto Components — 0.5% | |
| | 1,814 | | | Gentex Corp. | | | 30,675 | |
| | | | | | | | |
| |
| | | | Automobiles — 0.6% | |
| | 691 | | | Harley-Davidson, Inc. | | | 39,401 | |
| | | | | | | | |
| |
| | | | Banks — 5.5% | |
| | 4,171 | | | Citizens Financial Group, Inc. | | | 109,864 | |
| | 1,430 | | | Comerica, Inc. | | | 74,489 | |
| | 1,072 | | | PNC Financial Services Group, Inc. (The) | | | 102,483 | |
| | 2,237 | | | Zions BanCorp | | | 72,054 | |
| | | | | | | | |
| | | | | | | 358,890 | |
| | | | | | | | |
| |
| | | | Beverages — 1.2% | |
| | 736 | | | PepsiCo, Inc. | | | 78,899 | |
| | | | | | | | |
| |
| | | | Biotechnology — 2.5% | |
| | 405 | | | Biogen, Inc.2 | | | 113,473 | |
| | 504 | | | Celgene Corp.2 | | | 51,499 | |
| | | | | | | | |
| | | | | | | 164,972 | |
| | | | | | | | |
| |
| | | | Capital Markets — 4.1% | |
| | 2,943 | | | Bank of New York Mellon Corp. (The) | | | 127,344 | |
| | 822 | | | CME Group, Inc. | | | 82,282 | |
| | 1,726 | | | TD Ameritrade Holding Corp. | | | 59,046 | |
| | | | | | | | |
| | | | | | | 268,672 | |
| | | | | | | | |
| |
| | | | Chemicals — 0.7% | |
| | 516 | | | PPG Industries, Inc. | | | 48,055 | |
| | | | | | | | |
| |
| | | | Commercial Services & Supplies — 1.1% | |
| | 1,047 | | | Avery Dennison Corp. | | | 73,070 | |
| | | | | | | | |
| |
| | | | Communications Equipment — 4.4% | |
| | 8,999 | | | Brocade Communications Systems, Inc. | | | 95,389 | |
| | 3,870 | | | Cisco Systems, Inc. | | | 118,732 | |
| | 2,734 | | | Juniper Networks, Inc. | | | 72,014 | |
| | | | | | | | |
| | | | | | | 286,135 | |
| | | | | | | | |
| |
| | | | Diversified Telecommunication Services — 2.2% | |
| | 2,341 | | | CenturyLink, Inc. | | | 62,224 | |
| | 1,701 | | | Verizon Communications, Inc. | | | 81,818 | |
| | | | | | | | |
| | | | | | | 144,042 | |
| | | | | | | | |
| |
| | | | Electric Utilities — 1.6% | |
| | 1,079 | | | Exelon Corp. | | | 36,762 | |
| | 534 | | | NextEra Energy, Inc. | | | 68,352 | |
| | | | | | | | |
| | | | | | | 105,114 | |
| | | | | | | | |
| |
| | | | Electrical Equipment — 1.5% | |
| | 1,533 | | | Eaton Corp. PLC | | | 97,759 | |
| | | | | | | | |
See Notes to Financial Statements.
THE GLENMEDE FUND, INC.
Responsible ESG U.S. Equity Portfolio
SCHEDULE OF PORTFOLIO INVESTMENTS — (Continued)
October 31, 2016
| | | | | | | | |
| Shares | | | | | Value | |
|
| COMMON STOCKS1 — (Continued) | |
| | | | Energy Equipment & Services — 3.5% | |
| | 3,011 | | | Halliburton Co. | | $ | 138,506 | |
| | 2,759 | | | National Oilwell Varco, Inc. | | | 88,564 | |
| | | | | | | | |
| | | | | | | 227,070 | |
| | | | | | | | |
| |
| | | | Equity Real Estate Investment Trusts — 2.6% | |
| | 2,559 | | | Kimco Realty Corp. | | | 68,095 | |
| | 2,494 | | | Liberty Property Trust | | | 100,832 | |
| | | | | | | | |
| | | | | | | 168,927 | |
| | | | | | | | |
| |
| | | | Food & Staples Retailing — 3.1% | |
| | 2,016 | | | Kroger Co. (The) | | | 62,455 | |
| | 1,440 | | | Wal-Mart Stores, Inc. | | | 100,829 | |
| | 1,351 | | | Whole Foods Market, Inc. | | | 38,220 | |
| | | | | | | | |
| | | | | | | 201,504 | |
| | | | | | | | |
| |
| | | | Food Products — 4.0% | |
| | 352 | | | General Mills, Inc. | | | 21,817 | |
| | 953 | | | Hormel Foods Corp. | | | 36,690 | |
| | 1,074 | | | Ingredion, Inc. | | | 140,877 | |
| | 1,423 | | | Mondelez International, Inc. — Class A | | | 63,950 | |
| | | | | | | | |
| | | | | | | 263,334 | |
| | | | | | | | |
| |
| | | | Health Care Providers & Services — 5.8% | |
| | 853 | | | Aetna, Inc. | | | 91,569 | |
| | 641 | | | Anthem, Inc. | | | 78,112 | |
| | 1,177 | | | Cardinal Health, Inc. | | | 80,848 | |
| | 724 | | | HCA Holdings, Inc.2 | | | 55,408 | |
| | 593 | | | McKesson Corp. | | | 75,412 | |
| | | | | | | | |
| | | | | | | 381,349 | |
| | | | | | | | |
| |
| | | | Hotels, Restaurants & Leisure — 1.3% | |
| | 1,312 | | | Wyndham Worldwide Corp. | | | 86,382 | |
| | | | | | | | |
| |
| | | | Household Durables — 0.9% | |
| | 1,301 | | | Newell Brands, Inc. | | | 62,474 | |
| | | | | | | | |
| |
| | | | Household Products — 2.0% | |
| | 261 | | | Kimberly-Clark Corp. | | | 29,861 | |
| | 1,136 | | | Procter & Gamble Co. (The) | | | 98,605 | |
| | | | | | | | |
| | | | | | | 128,466 | |
| | | | | | | | |
| |
| | | | Industrial Conglomerates — 0.9% | |
| | 259 | | | .Honeywell International, Inc. | | | 28,407 | |
| | 306 | | | Carlisle Cos., Inc. | | | 32,084 | |
| | | | | | | | |
| | | | | | | 60,491 | |
| | | | | | | | |
| |
| | | | Insurance — 4.4% | |
| | 2,206 | | | First American Financial Corp. | | | 86,166 | |
| | 641 | | | Marsh & McLennan Cos., Inc. | | | 40,633 | |
| | 1,869 | | | Principal Financial Group, Inc. | | | 102,047 | |
| | 553 | | | Travelers Cos., Inc. (The) | | | 59,824 | |
| | | | | | | | |
| | | | | | | 288,670 | |
| | | | | | | | |
| |
| | | | IT Services — 1.6% | |
| | 2,477 | | | PayPal Holdings, Inc.2 | | | 103,192 | |
| | | | | | | | |
| |
| | | | Life Sciences Tools & Services — 3.6% | |
| | 810 | | | Quintiles IMS Holdings, Inc.2 | | | 58,109 | |
| | 634 | | | Thermo Fisher Scientific, Inc. | | | 93,217 | |
| | 589 | | | Waters Corp.2 | | | 81,954 | |
| | | | | | | | |
| | | | | | | 233,280 | |
| | | | | | | | |
See Notes to Financial Statements.
THE GLENMEDE FUND, INC.
Responsible ESG U.S. Equity Portfolio
SCHEDULE OF PORTFOLIO INVESTMENTS — (Continued)
October 31, 2016
| | | | | | | | |
| Shares | | | | | Value | |
|
| COMMON STOCKS1 — (Continued) | |
| | | | Machinery — 3.7% | |
| | 556 | | | Cummins, Inc. | | $ | 71,068 | |
| | 1,460 | | | Ingersoll-Rand PLC | | | 98,243 | |
| | 668 | | | Stanley Black & Decker, Inc. | | | 76,045 | |
| | | | | | | | |
| | | | | | | 245,356 | |
| | | | | | | | |
| |
| | | | Media — 3.3% | |
| | 1,163 | | | Scripps Networks Interactive, Inc. — Class A | | | 74,851 | |
| | 1,612 | | | Time Warner, Inc. | | | 143,452 | |
| | | | | | | | |
| | | | | | | 218,303 | |
| | | | | | | | |
| |
| | | | Metals & Mining �� 0.5% | |
| | 447 | | | Reliance Steel & Aluminum Co. | | | 30,745 | |
| | | | | | | | |
| |
| | | | Multi-line Retail — 0.6% | |
| | 1,043 | | | Macy’s, Inc. | | | 38,059 | |
| | | | | | | | |
| |
| | | | Multi-Utilities — 1.0% | |
| | 1,380 | | | Ameren Corp. | | | 68,931 | |
| | | | | | | | |
| |
| | | | Office Electronics — 1.4% | |
| | 9,764 | | | Xerox Corp. | | | 95,394 | |
| | | | | | | | |
| |
| | | | Oil, Gas & Consumable Fuels — 3.3% | |
| | 4,371 | | | Marathon Oil Corp. | | | 57,610 | |
| | 2,056 | | | Marathon Petroleum Corp. | | | 89,621 | |
| | 1,145 | | | Valero Energy Corp. | | | 67,830 | |
| | | | | | | | |
| | | | | | | 215,061 | |
| | | | | | | | |
| |
| | | | Paper & Forest Products — 1.3% | |
| | 1,909 | | | International Paper Co. | | | 85,962 | |
| | | | | | | | |
| |
| | | | Pharmaceuticals — 2.9% | |
| | 770 | | | Johnson & Johnson | | | 89,312 | |
| | 1,735 | | | Merck & Co., Inc. | | | 101,879 | |
| | | | | | | | |
| | | | | | | 191,191 | |
| | | | | | | | |
| |
| | | | Professional Services — 0.5% | |
| | 467 | | | Manpowergroup, Inc. | | | 35,866 | |
| | | | | | | | |
| |
| | | | Semiconductors & Semiconductor Equipment — 2.8% | |
| | 188 | | | Marvell Technology Group, Ltd. | | | 2,450 | |
| | 2,507 | | | NVIDIA Corp. | | | 178,398 | |
| | | | | | | | |
| | | | | | | 180,848 | |
| | | | | | | | |
| |
| | | | Software — 8.3% | |
| | 605 | | | ANSYS, Inc.2 | | | 55,267 | |
| | 2,838 | | | CA, Inc. | | | 87,240 | |
| | 1,425 | | | Citrix Systems, Inc.2 | | | 120,840 | |
| | 2,052 | | | Oracle Corp. | | | 78,838 | |
| | 582 | | | Synopsys, Inc.2 | | | 34,518 | |
| | 2,101 | | | VMware, Inc. — Class A2 | | | 165,139 | |
| | | | | | | | |
| | | | | | | 541,842 | |
| | | | | | | | |
| |
| | | | Specialty Retail — 4.9% | |
| | 2,857 | | | Dick’s Sporting Goods, Inc. | | | 158,992 | |
| | 1,253 | | | Foot Locker, Inc. | | | 83,663 | |
| | 1,166 | | | Lowe’s Cos., Inc. | | | 77,714 | |
| | | | | | | | |
| | | | | | | 320,369 | |
| | | | | | | | |
See Notes to Financial Statements.
THE GLENMEDE FUND, INC.
Responsible ESG U.S. Equity Portfolio
SCHEDULE OF PORTFOLIO INVESTMENTS — (Continued)
October 31, 2016
| | | | | | | | |
| Shares | | | | | Value | |
|
| COMMON STOCKS1 — (Continued) | |
| | | | Technology Hardware, Storage & Peripherals — 2.5% | |
| | 612 | | | Apple, Inc. | | $ | 69,486 | |
| | 3,500 | | | Teradata Corp.2 | | | 94,360 | |
| | | | | | | | |
| | | | | | | 163,846 | |
| | | | | | | | |
| | |
| | | | TOTAL COMMON STOCKS
(Cost $6,121,703) | | | 6,510,028 | |
| | | | | | | | |
| | |
Face
Amount | | | | | | |
|
| REPURCHASE AGREEMENT1 — 1.6% | |
| | 106,445 | | | With Fixed Income Clearing Corp., dated 10/31/16, 0.01%, principal and interest in the amount of $106,445, due 11/1/16, (collateralized by a U.S. Treasury Bond with a par value of $115,000, coupon rate of 2.500%, due 2/15/46, market value of $112,988) | | | 106,445 | |
| | | | | | | | |
| | |
| | | | TOTAL REPURCHASE AGREEMENT
(Cost $106,445) | | | 106,445 | |
| | | | | | | | |
| | | | | | | | | | |
| | |
TOTAL INVESTMENTS
(Cost $6,228,148)3 | | | 100.9 | % | | $ | 6,616,473 | |
| | |
LIABILITIES IN EXCESS OF OTHER ASSETS | | | (0.9 | ) | | | (55,912 | ) |
| | | | | | | | | | |
| | |
NET ASSETS | | | 100.0 | % | | $ | 6,560,561 | |
| | | | | | | | | | |
| 1 | Percentages indicated are based on net assets. |
| 2 | Non income-producing security. |
| 3 | Aggregate cost for federal tax purposes was $6,234,768. |
See Notes to Financial Statements.
THE GLENMEDE FUND, INC.
Responsible ESG U.S. Equity Portfolio
SCHEDULE OF PORTFOLIO INVESTMENTS — (Concluded)
October 31, 2016
INDUSTRY DIVERSIFICATION
On October 31, 2016, industry diversification of the Portfolio was as follows:
| | | | | | | | |
| | | % of
Net Assets | | | Value | |
INDUSTRIES: | | | | | | | | |
Software | | | 8.3 | % | | $ | 541,842 | |
Health Care Providers & Services | | | 5.8 | | | | 381,349 | |
Banks | | | 5.5 | | | | 358,890 | |
Specialty Retail | | | 4.9 | | | | 320,369 | |
Insurance | | | 4.4 | | | | 288,670 | |
Communications Equipment | | | 4.4 | | | | 286,135 | |
Capital Markets | | | 4.1 | | | | 268,672 | |
Food Products | | | 4.0 | | | | 263,334 | |
Machinery | | | 3.7 | | | | 245,356 | |
Life Sciences Tools & Services | | | 3.6 | | | | 233,280 | |
Energy Equipment & Services | | | 3.5 | | | | 227,070 | |
Media | | | 3.3 | | | | 218,303 | |
Oil, Gas & Consumable Fuels | | | 3.3 | | | | 215,061 | |
Food & Staples Retailing | | | 3.1 | | | | 201,504 | |
Pharmaceuticals | | | 2.9 | | | | 191,191 | |
Semiconductors & Semiconductor Equipment | | | 2.8 | | | | 180,848 | |
Equity Real Estate Investment Trusts | | | 2.6 | | | | 168,927 | |
Biotechnology | | | 2.5 | | | | 164,972 | |
Technology Hardware, Storage & Peripherals | | | 2.5 | | | | 163,846 | |
Diversified Telecommunication Services | | | 2.2 | | | | 144,042 | |
Household Products | | | 2.0 | | | | 128,466 | |
Electric Utilities | | | 1.6 | | | | 105,114 | |
Airlines | | | 1.6 | | | | 103,529 | |
IT Services | | | 1.6 | | | | 103,192 | |
Electrical Equipment | | | 1.5 | | | | 97,759 | |
Office Electronics | | | 1.4 | | | | 95,394 | |
Hotels, Restaurants & Leisure | | | 1.3 | | | | 86,382 | |
Paper & Forest Products | | | 1.3 | | | | 85,962 | |
Beverages | | | 1.2 | | | | 78,899 | |
Air Freight & Logistics | | | 1.1 | | | | 73,903 | |
Commercial Services & Supplies | | | 1.1 | | | | 73,070 | |
Multi-Utilities | | | 1.0 | | | | 68,931 | |
Household Durables | | | 0.9 | | | | 62,474 | |
Industrial Conglomerates | | | 0.9 | | | | 60,491 | |
Chemicals | | | 0.7 | | | | 48,055 | |
Automobiles | | | 0.6 | | | | 39,401 | |
Multi-line Retail | | | 0.6 | | | | 38,059 | |
Professional Services | | | 0.5 | | | | 35,866 | |
Metals & Mining | | | 0.5 | | | | 30,745 | |
Auto Components | | | 0.5 | | | | 30,675 | |
| | | | | | | | |
TOTAL COMMON STOCKS | | | 99.3 | % | | $ | 6,510,028 | |
| | |
REPURCHASE AGREEMENT | | | 1.6 | | | | 106,445 | |
| | | | | | | | |
TOTAL INVESTMENTS | | | 100.9 | % | | $ | 6,616,473 | |
| | | | | | | | |
See Notes to Financial Statements.
THE GLENMEDE FUND, INC.
Women in Leadership U.S. Equity Portfolio
SCHEDULE OF PORTFOLIO INVESTMENTS
October 31, 2016
| | | | | | | | |
| Shares | | | | | Value | |
|
| COMMON STOCKS* — 99.3% | |
| | | | Airlines — 2.7% | |
| | 1,879 | | | Alaska Air Group, Inc. | | $ | 135,702 | |
| | 1,004 | | | Southwest Airlines Co. | | | 40,210 | |
| | | | | | | | |
| | | | | | | 175,912 | |
| | | | | | | | |
| |
| | | | Auto Components — 1.5% | |
| | 795 | | | Lear Corp. | | | 97,610 | |
| | | | | | | | |
| |
| | | | Banks — 6.5% | |
| | 1,374 | | | Comerica, Inc. | | | 71,572 | |
| | 6,587 | | | Fifth Third Bancorp | | | 143,333 | |
| | 970 | | | JPMorgan Chase & Co. | | | 67,182 | |
| | 1,443 | | | PNC Financial Services Group, Inc. (The) | | | 137,951 | |
| | | | | | | | |
| | | | | | | 420,038 | |
| | | | | | | | |
| |
| | | | Beverages — 0.5% | |
| | 358 | | | Dr Pepper Snapple Group, Inc. | | | 31,429 | |
| | | | | | | | |
| |
| | | | Biotechnology — 2.3% | |
| | 534 | | | Biogen, Inc.1 | | | 149,616 | |
| | | | | | | | |
| |
| | | | Capital Markets — 4.3% | |
| | 1,956 | | | MSCI, Inc. | | | 156,852 | |
| | 3,636 | | | TD Ameritrade Holding Corp. | | | 124,387 | |
| | | | | | | | |
| | | | | | | 281,239 | |
| | | | | | | | |
| |
| | | | Chemicals — 1.4% | |
| | 441 | | | Air Products & Chemicals, Inc. | | | 58,838 | |
| | 352 | | | PPG Industries, Inc. | | | 32,782 | |
| | | | | | | | |
| | | | | | | 91,620 | |
| | | | | | | | |
| |
| | | | Commercial Services & Supplies — 2.3% | |
| | 2,190 | | | Avery Dennison Corp. | | | 152,840 | |
| | | | | | | | |
| |
| | | | Communications Equipment — 3.3% | |
| | 5,623 | | | Cisco Systems, Inc. | | | 172,514 | |
| | 310 | | | F5 Networks, Inc.1 | | | 42,845 | |
| | | | | | | | |
| | | | | | | 215,359 | |
| | | | | | | | |
| |
| | | | Diversified Telecommunication Services — 2.2% | |
| | 2,953 | | | Verizon Communications, Inc. | | | 142,039 | |
| | | | | | | | |
| |
| | | | Equity Real Estate Investment Trusts — 4.6% | |
| | 3,171 | | | Liberty Property Trust | | | 128,204 | |
| | 663 | | | Mid-America Apartment Communities, Inc. | | | 61,493 | |
| | 4,103 | | | Spirit Realty Capital, Inc. | | | 48,867 | |
| | 1,764 | | | Tanger Factory Outlet Centers, Inc. | | | 61,387 | |
| | | | | | | | |
| | | | | | | 299,951 | |
| | | | | | | | |
| |
| | | | Food & Staples Retailing — 3.0% | |
| | 2,802 | | | Kroger Co. (The) | | | 86,806 | |
| | 670 | | | SYSCO Corp. | | | 32,240 | |
| | 1,079 | | | Wal-Mart Stores, Inc. | | | 75,552 | |
| | | | | | | | |
| | | | | | | 194,598 | |
| | | | | | | | |
| |
| | | | Food Products — 5.2% | |
| | 2,841 | | | Hormel Foods Corp. | | | 109,378 | |
| | 651 | | | Ingredion, Inc. | | | 85,392 | |
| | 2,021 | | | Tyson Foods, Inc. — Class A | | | 143,188 | |
| | | | | | | | |
| | | | | | | 337,958 | |
| | | | | | | | |
See Notes to Financial Statements.
THE GLENMEDE FUND, INC.
Women in Leadership U.S. Equity Portfolio
SCHEDULE OF PORTFOLIO INVESTMENTS — (Continued)
October 31, 2016
| | | | | | | | |
| Shares | | | | | Value | |
|
| COMMON STOCKS* — (Continued) | |
| | | | Gas Utilities — 1.1% | |
| | 1,545 | | | UGI Corp. | | $ | 71,518 | |
| | | | | | | | |
| |
| | | | Health Care Providers & Services — 5.9% | |
| | 1,436 | | | Aetna, Inc. | | | 154,155 | |
| | 893 | | | Anthem, Inc. | | | 108,821 | |
| | 1,355 | | | Cardinal Health, Inc. | | | 93,075 | |
| | 200 | | | McKesson Corp. | | | 25,434 | |
| | | | | | | | |
| | | | | | | 381,485 | |
| | | | | | | | |
| |
| | | | Hotels, Restaurants & Leisure — 1.3% | |
| | 1,299 | | | Wyndham Worldwide Corp. | | | 85,526 | |
| | | | | | | | |
| |
| | | | Household Durables — 0.5% | |
| | 212 | | | Snap-on, Inc. | | | 32,669 | |
| | | | | | | | |
| |
| | | | Household Products — 2.2% | |
| | 257 | | | Kimberly-Clark Corp. | | | 29,403 | |
| | 1,336 | | | Procter & Gamble Co. (The) | | | 115,965 | |
| | | | | | | | |
| | | | | | | 145,368 | |
| | | | | | | | |
| |
| | | | Independent Power Producers & Energy Traders — 0.5% | |
| | 2,750 | | | AES Corp. | | | 32,368 | |
| | | | | | | | |
| |
| | | | Industrial Conglomerates — 0.9% | |
| | 515 | | | Honeywell International, Inc. | | | 56,485 | |
| | | | | | | | |
| |
| | | | Insurance — 2.7% | |
| | 1,091 | | | Travelers Cos., Inc. (The) | | | 118,024 | |
| | 1,656 | | | Unum Group | | | 58,623 | |
| | | | | | | | |
| | | | | | | 176,647 | |
| | | | | | | | |
| |
| | | | Internet Software & Services — 4.8% | |
| | 6,835 | | | eBay, Inc.1 | | | 194,866 | |
| | 3,659 | | | Rackspace Hosting, Inc.1 | | | 116,868 | |
| | | | | | | | |
| | | | | | | 311,734 | |
| | | | | | | | |
| |
| | | | Life Sciences Tools & Services — 1.1% | |
| | 1,704 | | | QIAGEN N.V.1 | | | 41,544 | |
| | 215 | | | Thermo Fisher Scientific, Inc. | | | 31,611 | |
| | | | | | | | |
| | | | | | | 73,155 | |
| | | | | | | | |
| |
| | | | Machinery — 4.8% | |
| | 1,381 | | | Cummins, Inc. | | | 176,519 | |
| | 1,191 | | | Stanley Black & Decker, Inc. | | | 135,584 | |
| | | | | | | | |
| | | | | | | 312,103 | |
| | | | | | | | |
| |
| | | | Media — 2.8% | |
| | 1,313 | | | Interpublic Group of Cos., Inc. (The) | | | 29,398 | |
| | 1,528 | | | Omnicom Group, Inc. | | | 121,965 | |
| | 367 | | | Walt Disney Co. (The) | | | 34,017 | |
| | | | | | | | |
| | | | | | | 185,380 | |
| | | | | | | | |
| |
| | | | Multi-Utilities — 1.2% | |
| | 1,924 | | | CMS Energy Corp. | | | 81,097 | |
| | | | | | | | |
| |
| | | | Office Electronics — 2.6% | |
| | 17,230 | | | Xerox Corp. | | | 168,337 | |
| | | | | | | | |
| |
| | | | Oil, Gas & Consumable Fuels — 6.4% | |
| | 968 | | | Phillips 66 | | | 78,553 | |
| | 1,905 | | | Tesoro Corp. | | | 161,868 | |
See Notes to Financial Statements.
THE GLENMEDE FUND, INC.
Women in Leadership U.S. Equity Portfolio
SCHEDULE OF PORTFOLIO INVESTMENTS — (Continued)
October 31, 2016
| | | | | | | | |
| Shares | | | | | Value | |
|
| COMMON STOCKS* — (Continued) | |
| | | | Oil, Gas & Consumable Fuels — (Continued) | |
| | 2,970 | | | Valero Energy Corp. | | $ | 175,943 | |
| | | | | | | | |
| | | | | | | 416,364 | |
| | | | | | | | |
| |
| | | | Pharmaceuticals — 5.4% | |
| | 2,591 | | | Merck & Co., Inc. | | | 152,144 | |
| | 1,563 | | | Mylan N.V.1 | | | 57,049 | |
| | 4,518 | | | Pfizer, Inc. | | | 143,266 | |
| | | | | | | | |
| | | | | | | 352,459 | |
| | | | | | | | |
| |
| | | | Professional Services — 0.7% | |
| | 614 | | | Manpowergroup, Inc. | | | 47,155 | |
| | | | | | | | |
| |
| | | | Semiconductors & Semiconductor Equipment — 2.6% | |
| | 1,949 | | | QUALCOMM, Inc. | | | 133,935 | |
| | 532 | | | Texas Instruments, Inc. | | | 37,692 | |
| | | | | | | | |
| | | | | | | 171,627 | |
| | | | | | | | |
| |
| | | | Software — 3.3% | |
| | 2,195 | | | Oracle Corp. | | | 84,332 | |
| | 2,244 | | | Synopsys, Inc.1 | | | 133,091 | |
| | | | | | | | |
| | | | | | | 217,423 | |
| | | | | | | | |
| |
| | | | Specialty Retail — 5.3% | |
| | 2,467 | | | Foot Locker, Inc. | | | 164,721 | |
| | 1,726 | | | Lowe’s Cos., Inc. | | | 115,038 | |
| | 1,020 | | | Ross Stores, Inc. | | | 63,791 | |
| | | | | | | | |
| | | | 343,550 | |
| | | | | | | | |
| |
| | | | Technology Hardware, Storage & Peripherals — 2.2% | |
| | 1,275 | | | Apple, Inc. | | | 144,763 | |
| | | | | | | | |
| |
| | | | Textiles, Apparel & Luxury Goods — 1.2% | |
| | 712 | | | PVH Corp. | | | 76,170 | |
| | | | | | | | |
| | |
| | | | TOTAL COMMON STOCKS
(Cost $6,237,324) | | | 6,473,592 | |
| | | | | | | | |
| | |
Face
Amount | | | | | | |
|
| REPURCHASE AGREEMENT* — 1.7% | |
| $ | 107,886 | | | With Fixed Income Clearing Corp., dated 10/31/16, 0.01%, principal and interest in the amount of $107,886, due 11/1/16, (collateralized by a U.S. Treasury Bond with a par value of $115,000, coupon rate of 2.500%, due 02/15/46, market value of $112,988) | | | 107,886 | |
| | | | | | | | |
| | |
| | | | TOTAL REPURCHASE AGREEMENT
(Cost $107,886) | | | 107,886 | |
| | | | | | | | |
| | | | | | | | | | |
| | |
TOTAL INVESTMENTS
(Cost $6,345,210)2 | | | 101.0 | % | | $ | 6,581,478 | |
| | |
LIABILITIES IN EXCESS OF OTHER ASSETS | | | (1.0 | ) | | | (64,820 | ) |
| | | | | | | | | | |
| | |
NET ASSETS | | | 100.0 | % | | $ | 6,516,658 | |
| | | | | | | | | | |
| * | Percentages indicated are based on net assets. |
| 1 | Non income-producing security. |
| 2 | Aggregate cost for federal tax purposes was $6,353,130. |
See Notes to Financial Statements.
THE GLENMEDE FUND, INC.
Women in Leadership U.S. Equity Portfolio
SCHEDULE OF PORTFOLIO INVESTMENTS — (Concluded)
October 31, 2016
INDUSTRY DIVERSIFICATION
On October 31, 2016, industry diversification of the Portfolio was as follows:
| | | | | | | | |
| | | % of
Net Assets | | | Value | |
INDUSTRIES: | | | | | | | | |
Banks | | | 6.5 | % | | $ | 420,038 | |
Oil, Gas & Consumable Fuels | | | 6.4 | | | | 416,364 | |
Health Care Providers & Services | | | 5.9 | | | | 381,485 | |
Pharmaceuticals | | | 5.4 | | | | 352,459 | |
Specialty Retail | | | 5.3 | | | | 343,550 | |
Food Products | | | 5.2 | | | | 337,958 | |
Machinery | | | 4.8 | | | | 312,103 | |
Internet Software & Services | | | 4.8 | | | | 311,734 | |
Equity Real Estate Investment Trusts | | | 4.6 | | | | 299,951 | |
Capital Markets | | | 4.3 | | | | 281,239 | |
Software | | | 3.3 | | | | 217,423 | |
Communications Equipment | | | 3.3 | | | | 215,359 | |
Food & Staples Retailing | | | 3.0 | | | | 194,598 | |
Media | | | 2.8 | | | | 185,380 | |
Insurance | | | 2.7 | | | | 176,647 | |
Airlines | | | 2.7 | | | | 175,912 | |
Semiconductors & Semiconductor Equipment | | | 2.6 | | | | 171,627 | |
Office Electronics | | | 2.6 | | | | 168,337 | |
Commercial Services & Supplies | | | 2.3 | | | | 152,840 | |
Biotechnology | | | 2.3 | | | | 149,616 | |
Household Products | | | 2.2 | | | | 145,368 | |
Technology Hardware, Storage & Peripherals | | | 2.2 | | | | 144,763 | |
Diversified Telecommunication Services | | | 2.2 | | | | 142,039 | |
Auto Components | | | 1.5 | | | | 97,610 | |
Chemicals | | | 1.4 | | | | 91,620 | |
Hotels, Restaurants & Leisure | | | 1.3 | | | | 85,526 | |
Multi-Utilities | | | 1.2 | | | | 81,097 | |
Textiles, Apparel & Luxury Goods | | | 1.2 | | | | 76,170 | |
Life Sciences Tools & Services | | | 1.1 | | | | 73,155 | |
Gas Utilities | | | 1.1 | | | | 71,518 | |
Industrial Conglomerates | | | 0.9 | | | | 56,485 | |
Professional Services | | | 0.7 | | | | 47,155 | |
Household Durables | | | 0.5 | | | | 32,669 | |
Independent Power Producers & Energy Traders | | | 0.5 | | | | 32,368 | |
Beverages | | | 0.5 | | | | 31,429 | |
| | | | | | | | |
TOTAL COMMON STOCKS | | | 99.3 | % | | $ | 6,473,592 | |
| | |
REPURCHASE AGREEMENT | | | 1.7 | | | | 107,886 | |
| | | | | | | | |
TOTAL INVESTMENTS | | | 101.0 | % | | $ | 6,581,478 | |
| | | | | | | | |
See Notes to Financial Statements.
THE GLENMEDE FUND, INC.
Short Term Tax Aware Fixed Income Portfolio
SCHEDULE OF PORTFOLIO INVESTMENTS
October 31, 2016
| | | | | | | | |
Face
Amount | | | | | Value | |
|
| CORPORATE NOTES* — 12.9% | |
| | | | Automotive — 2.6% | | | |
| $ | 250,000 | | | Ford Motor Credit Co. LLC,
6.625% due 8/15/17 | | $ | 259,705 | |
| | 100,000 | | | Ford Motor Credit Co. LLC,
5.875% due 8/2/21 | | | 113,553 | |
| | 400,000 | | | General Motors Financial Co., Inc.,
2.400% due 5/9/19 | | | 400,371 | |
| | | | | | | | |
| | | | | | | 773,629 | |
| | | | | | | | |
| | |
| | | | Electronics — 1.2% | | | |
| | 350,000 | | | Lam Research Corp.,
2.800% due 6/15/21 | | | 356,380 | |
| | | | | | | | |
| | |
| | | | Financial — 3.0% | | | |
| | 250,000 | | | Bank of America Corp.,
6.400% due 8/28/17 | | | 260,040 | |
| | 100,000 | | | Bank of America Corp.,
5.490% due 3/15/19 | | | 107,505 | |
| | 300,000 | | | Goldman Sachs Group, Inc.,
7.500% due 2/15/19 | | | 337,285 | |
| | 200,000 | | | JPMorgan Chase & Co.,
2.750% due 6/23/20 | | | 204,768 | |
| | | | | | | | |
| | | | | | | 909,598 | |
| | | | | | | | |
| | |
| | | | Insurance — 0.9% | | | |
| | 250,000 | | | Coventry Health Care, Inc.,
5.450% due 6/15/21 | | | 282,885 | |
| | | | | | | | |
| | |
| | | | Media — Broadcasting & Publishing — 2.4% | | | |
| | 400,000 | | | Scripps Networks Interactive, Inc.,
2.750% due 11/15/19 | | | 409,074 | |
| | 300,000 | | | Time Warner Cable, Inc.,
5.850% due 5/1/17 | | | 306,660 | |
| | | | | | | | |
| | | | | | | 715,734 | |
| | | | | | | | |
| | |
| | | | Oil & Gas — 1.9% | | | |
| | 200,000 | | | Apache Corp.,
6.900% due 9/15/18 | | | 218,853 | |
| | 300,000 | | | Valero Energy Corp.,
9.375% due 3/15/19 | | | 350,994 | |
| | | | | | | | |
| | | | | | | 569,847 | |
| | | | | | | | |
| | |
| | | | Retailers — 0.9% | | | |
| | 250,000 | | | Best Buy Co., Inc.,
5.000% due 8/1/18 | | | 263,500 | |
| | | | | | | | |
| | |
| | | | TOTAL CORPORATE NOTES
(Cost $3,879,692) | | | 3,871,573 | |
| | | | | | | | |
| |
| MUNICIPAL BONDS* — 87.0% | | | |
| | | | Alabama — 2.6% | | | |
| | 250,000 | | | Alabama Federal Aid Highway Finance Authority, Revenue Bonds,
5.000% due 9/1/20 | | | 285,042 | |
| | 250,000 | | | Black Belt Energy Gas District, AL, Gas Supply Revenue, Revenue Bonds, Series A,
4.000% due 7/1/461 | | | 275,133 | |
| | 215,000 | | | Madison, AL, General Obligation Unlimited, Prerefunded 2/1/19 @ 100,
5.125% due 2/1/36 | | | 234,855 | |
| | | | | | | | |
| | | | | | | 795,030 | |
| | | | | | | | |
See Notes to Financial Statements.
THE GLENMEDE FUND, INC.
Short Term Tax Aware Fixed Income Portfolio
SCHEDULE OF PORTFOLIO INVESTMENTS — (Continued)
October 31, 2016
| | | | | | | | |
Face
Amount | | | | | Value | |
| |
| MUNICIPAL BONDS* — (Continued) | | | |
| | | | Alaska — 2.9% | | | |
| $ | 500,000 | | | North Slope Boro, AK, General Obligation Unlimited, Series B,
5.000% due 6/30/202 | | $ | 565,730 | |
| | 310,000 | | | North Slope Boro, AK, General Obligation Unlimited, Unrefunded, Series A, (NPFG Insured),
5.000% due 6/30/17 | | | 318,869 | |
| | | | | | | | |
| | | | | | | 884,599 | |
| | | | | | | | |
| | |
| | | | California — 1.7% | | | |
| | 500,000 | | | Irvine, CA, Improvement Bond Act of 1915, Assessment District 97-17, (LOC: State Street Bank & Trust Co.),
0.480% due 9/2/231 | | | 500,000 | |
| | | | | | | | |
| | |
| | | | Colorado — 2.5% | | | |
| | 250,000 | | | Trinidad, CO, School District No. 1, General Obligation Unlimited, Refunding, (State Aid Withholding),
4.000% due 12/1/18 | | | 264,818 | |
| | 480,000 | | | Western State, CO, University Auxiliary Facilities Revenue, Revenue Bonds, Refunding, (State Aid Intercept),
2.000% due 5/15/17 | | | 482,923 | |
| | | | | | | | |
| | | | | | | 747,741 | |
| | | | | | | | |
| | |
| | | | Delaware — 0.7% | | | |
| | 205,000 | | | Delaware State, Transportation Authority, Grant Anticpation Bonds, Revenue Bonds,
5.000% due 3/1/19 | | | 223,565 | |
| | | | | | | | |
| | |
| | | | District Of Columbia — 1.4% | | | |
| | 150,000 | | | District of Columbia, Revenue Bonds,
5.000% due 12/1/17 | | | 156,591 | |
| | 250,000 | | | District of Columbia, Revenue Bonds, Series A, (AMBAC Insured),
5.000% due 4/1/17 | | | 254,362 | |
| | | | | | | | |
| | | | | | | 410,953 | |
| | | | | | | | |
| | |
| | | | Florida — 3.6% | | | |
| | 325,000 | | | Citizens Property Insurance Corp., FL, Revenue Bonds, Series A-1,
5.000% due 6/1/19 | | | 357,133 | |
| | 340,000 | | | Cocoa, FL, Water & Sewer Revenue, Revenue Bonds, Refunding, (NPFG Insured),
5.250% due 10/1/17 | | | 353,117 | |
| | 350,000 | | | Florida State, Department of Environmental Protection, Preservation Revenue, Revenue Bonds, Refunding, Series A,
5.000% due 7/1/19 | | | 386,256 | |
| | | | | | | | |
| | | | | | | 1,096,506 | |
| | | | | | | | |
| | |
| | | | Georgia — 2.1% | | | |
| | 225,000 | | | Atlanta, GA, Airport Passenger Facilities Charge Revenue, Revenue Bonds, Subseries B,
5.000% due 1/1/18 | | | 235,786 | |
| | 400,000 | | | Cobb County, GA, Hospital Authority, Revenue Bonds, (LOC: Wells Fargo Bank N.A.),
0.640% due 4/1/361 | | | 400,000 | |
| | | | | | | | |
| | | | | | | 635,786 | |
| | | | | | | | |
| | |
| | | | Illinois — 9.0% | | | |
| | 150,000 | | | Chicago, IL, O’Hare International Airport Revenue Bonds, Refunding, Series B,
5.000% due 1/1/21 | | | 171,845 | |
| | 200,000 | | | Chicago, IL, O’Hare International Airport Revenue Bonds, Series B,
5.000% due 1/1/18 | | | 209,206 | |
| | 245,000 | | | Chicago, IL, O’Hare International Airport Revenue Bonds, Series B,
5.000% due 1/1/17 | | | 246,698 | |
| | 400,000 | | | Illinois State Finance Authority, Revenue Bonds,
5.000% due 1/1/20 | | | 447,748 | |
| | 300,000 | | | Illinois State Finance Authority, Revenue Bonds, Refunding, Series 3B,
0.700% due 11/1/381 | | | 299,793 | |
| | 200,000 | | | Illinois State Finance Authority, Revenue Bonds, Series A, Prerefunded 11/1/18 @ 100,
7.250% due 11/1/38 | | | 225,016 | |
See Notes to Financial Statements.
THE GLENMEDE FUND, INC.
Short Term Tax Aware Fixed Income Portfolio
SCHEDULE OF PORTFOLIO INVESTMENTS — (Continued)
October 31, 2016
| | | | | | | | |
Face
Amount | | | | | Value | |
| |
| MUNICIPAL BONDS* — (Continued) | | | |
| | | | Illinois — (Continued) | | | |
| $ | 300,000 | | | Illinois State Finance Authority, Revenue Bonds, University of Chicago Medical Center, Series B,
(LOC: Wells Fargo Bank N.A.),
0.480% due 8/1/441 | | $ | 300,000 | |
| | 300,000 | | | McHenry County, IL, Conservation District, General Obligation Unlimited, Refunding,
5.000% due 2/1/19 | | | 325,611 | |
| | 250,000 | | | Regional Transportation Authority, IL, Revenue Bonds, Refunding, Series A, (AGMC Insured),
5.000% due 6/1/18 | | | 265,742 | |
| | 200,000 | | | Regional Transportation Authority, IL, Revenue Bonds, Refunding, Series B, (NPFG Insured),
5.500% due 6/1/18 | | | 214,160 | |
| | | | | | | | |
| | | | | | | 2,705,819 | |
| | | | | | | | |
| | |
| | | | Iowa — 2.0% | | | |
| | 400,000 | | | Iowa State Finance Authority, Revenue Bonds, (LOC: Wells Fargo Bank N.A.),
0.600% due 2/1/231 | | | 400,000 | |
| | 190,000 | | | Iowa State Finance Authority, Revenue Bonds, Drake University Project, (LOC: Wells Fargo Bank N.A.),
0.530% due 4/1/311 | | | 190,000 | |
| | | | | | | | |
| | | | | | | 590,000 | |
| | | | | | | | |
| | |
| | | | Kansas — 1.5% | | | |
| | 425,000 | | | Kansas State, Development Finance Authority, Revenue Bonds, Kansas Projects, Series A,
4.000% due 5/1/18 | | | 443,959 | |
| | | | | | | | |
| | |
| | | | Kentucky — 0.9% | | | |
| | 250,000 | | | Louisville & Jefferson County, KY, Metropolitan Government Health System Revenue, Revenue Bonds, Series A,
5.000% due 10/1/19 | | | 276,538 | |
| | | | | | | | |
| | |
| | | | Michigan — 6.5% | | | |
| | | | Dansville, MI, Schools, General Obligation Unlimited, (QSBLF Insured): | | | | |
| | 125,000 | | | 4.000% due 5/1/19 | | | 133,456 | |
| | 140,000 | | | 4.000% due 5/1/20 | | | 152,324 | |
| | 150,000 | | | Detroit, MI, City School District, General Obligation Unlimited, Refunding, Series A, (QSBLF Insured),
5.000% due 5/1/17 | | | 152,915 | |
| | 235,000 | | | Harper Creek, MI, Community School District, General Obligation Unlimited, Refunding, Series A,
(QSBLF Insured),
4.000% due 5/1/19 | | | 251,579 | |
| | 300,000 | | | Michigan State Building Authority Revenue, Revenue Bonds, Refunding, Series I,
5.000% due 10/15/18 | | | 323,283 | |
| | 400,000 | | | Michigan State Finance Authority Revenue, Revenue Bonds, Refunding,
5.000% due 11/15/19 | | | 443,576 | |
| | 250,000 | | | Pinconning, MI, Area Schools, General Obligation Unlimited, Refunding, (QSBLF Insured),
3.000% due 5/1/192 | | | 260,285 | |
| | 200,000 | | | Ypsilanti, MI, School District, General Obligation Unlimited, Refunding, Series A, (QSBLF Insured),
5.000% due 5/1/21 | | | 227,858 | |
| | | | | | | | |
| | | | | | | 1,945,276 | |
| | | | | | | | |
| | |
| | | | Minnesota — 2.1% | | | |
| | 400,000 | | | Rochester, MN, Health Care Facilities Revenue, Revenue Bonds, Series A,
4.000% due 11/15/301 | | | 424,160 | |
| | 205,000 | | | St. Paul, MN, Housing & Redevelopment Authority Health Care, Revenue Bonds, Series C2,
(LOC: Wells Fargo Bank N.A.),
0.600% due 11/15/341 | | | 205,000 | |
| | | | | | | | |
| | | | | | | 629,160 | |
| | | | | | | | |
| | |
| | | | Mississippi — 2.0% | | | |
| | 300,000 | | | Mississippi Business Finance Corp., Mississippi Gulf Opportunity Zone, Chevron USA Inc. Project, Series A,
0.480% due 11/1/351 | | | 300,000 | |
| | 300,000 | | | Mississippi Business Finance Corp., Mississippi Gulf Opportunity Zone, Chevron USA Inc. Project, Series G,
0.480% due 11/1/351 | | | 300,000 | |
| | | | | | | | |
| | | | | | | 600,000 | |
| | | | | | | | |
See Notes to Financial Statements.
THE GLENMEDE FUND, INC.
Short Term Tax Aware Fixed Income Portfolio
SCHEDULE OF PORTFOLIO INVESTMENTS — (Continued)
October 31, 2016
| | | | | | | | |
Face
Amount | | | | | Value | |
| |
| MUNICIPAL BONDS* — (Continued) | | | |
| | | | Missouri — 1.0% | | | |
| $ | 295,000 | | | Missouri State Health & Educational Facilities Authority, Revenue Bonds, St. Louis University, Series B-2,
(LOC: Wells Fargo Bank N.A.),
0.480% due 10/1/351 | | $ | 295,000 | |
| | | | | | | | |
| | |
| | | | Nebraska — 0.7% | | | |
| | 200,000 | | | Public Power Generation Agency, NE, Revenue Bonds, (AMBAC Insured),
4.000% due 1/1/17 | | | 201,052 | |
| | | | | | | | |
| | |
| | | | Nevada — 1.3% | | | |
| | 350,000 | | | Clark County, NV, Water Reclamation District, General Obligation Limited, Refunding,
5.000% due 7/1/20 | | | 398,646 | |
| | | | | | | | |
| | |
| | | | New Jersey — 0.9% | | | |
| | 245,000 | | | New Jersey State Health Care Facilities Financing Authority, Revenue Bonds, Prerefunded 7/1/19 @ 100,
5.500% due 7/1/29 | | | 273,317 | |
| | | | | | | | |
| | |
| | | | New York — 4.3% | | | |
| | 300,000 | | | New York City, New York, General Obligation Unlimited, Subseries D-3, (LOC: Royal Bank of Canada),
0.510% due 10/1/391 | | | 300,000 | |
| | 200,000 | | | New York State, Dormitory Authority, State Personal Income Tax Revenue, Refunding, Series A,
5.000% due 12/15/19 | | | 224,224 | |
| | 500,000 | | | West Seneca, NY, General Obligation, Tax Anticipation Notes,
2.000% due 7/27/17 | | | 504,875 | |
| | 240,000 | | | Westchester, NY, Tobacco Asset Securitization, Revenue Bonds, Prerefunded, 7/15/17 @ 101,
6.950% due 7/15/39 | | | 252,938 | |
| | | | | | | | |
| | | | | | | 1,282,037 | |
| | | | | | | | |
| | |
| | | | North Carolina — 3.8% | | | |
| | 295,000 | | | Charlotte-Mecklenburg, NC, Hospital Authority, Healthcare System Revenue, Series H,
(LOC: Wells Fargo Bank N.A.),
0.480% due 1/15/451 | | | 295,000 | |
| | 100,000 | | | Duplin County, NC, Limited Obligation, Revenue Bonds,
4.000% due 6/1/18 | | | 104,506 | |
| | 100,000 | | | Durham County, NC, Certificate Participation, Series A,
4.000% due 6/1/18 | | | 104,792 | |
| | 350,000 | | | North Carolina State, Grant Anticiaption Revenue, Revenue Bonds,
5.000% due 3/1/19 | | | 381,017 | |
| | 250,000 | | | Pitt County, NC, Limited Obligation, Revenue Bonds, Refunding,
5.000% due 4/1/182 | | | 261,035 | |
| | | | | | | | |
| | | | | | | 1,146,350 | |
| | | | | | | | |
| | |
| | | | Ohio — 4.3% | | | |
| | 350,000 | | | Greene County, OH, General Obligation, Tax Anticipation Notes,
2.000% due 6/16/17 | | | 352,604 | |
| | 255,000 | | | Ohio State, Higher Educational Facility Commission, Revenue Bonds,
4.000% due 12/1/19 | | | 277,249 | |
| | 450,000 | | | Ohio State, Hospital Facilities Revenue, Revenue Bonds, Refunding, Series A,
5.000% due 1/1/17 | | | 453,195 | |
| | 200,000 | | | Ohio State, Hospital Revenue Bonds, Series A,
5.000% due 1/15/17 | | | 201,680 | |
| | | | | | | | |
| | | | | | | 1,284,728 | |
| | | | | | | | |
| | |
| | | | Pennsylvania — 11.2% | | | |
| | 400,000 | | | Allegheny County, PA, General Obligation Unlimited, Refunding, Series C-75,
4.000% due 11/1/21 | | | 450,256 | |
| | 235,000 | | | Allegheny County, PA, Hospital Development Authority, Revenue Bonds, University of Pittsburgh Medical Center, Series A,
5.000% due 5/15/19 | | | 257,964 | |
| | 400,000 | | | Delaware Valley, PA, Regional Finance Authority, Revenue Bonds,
5.750% due 7/1/17 | | | 412,724 | |
See Notes to Financial Statements.
THE GLENMEDE FUND, INC.
Short Term Tax Aware Fixed Income Portfolio
SCHEDULE OF PORTFOLIO INVESTMENTS — (Continued)
October 31, 2016
| | | | | | | | |
Face
Amount | | | | | Value | |
| |
| MUNICIPAL BONDS* — (Continued) | | | |
| | | | Pennsylvania — (Continued) | | | |
| $ | 300,000 | | | East Stroudsburg, PA, Area School District, General Obligation Limited, Refunding, Series A,
(State Aid Withholding),
5.000% due 9/1/20 | | $ | 341,409 | |
| | 210,000 | | | Lycoming County, PA, Authority, Revenue Bonds, Prerefunded, 4/1/18 @ 100, (AGC Insured),
5.500% due 10/1/32 | | | 223,722 | |
| | 200,000 | | | Pennsylvania State Turnpike Commission, Oil Franchise, Tax Revenue, Revenue Bonds, Refunding, Series A,
5.000% due 12/1/20 | | | 229,806 | |
| | 190,000 | | | Pennsylvania State, General Obligation Unlimited, Refunding,
5.000% due 7/1/20 | | | 214,360 | |
| | 100,000 | | | Pennsylvania State, Higher Educational Facilities Authority Revenue Bonds, Thomas Jafferson University,
5.000% due 3/1/18 | | | 105,147 | |
| | 400,000 | | | Pittsburgh, PA, School District, General Obligation Unlimited, Refunding, Series B, (State Aid Withholding),
5.000% due 9/1/21 | | | 464,284 | |
| | 300,000 | | | Red Lion, PA, Area School District, General Obligation Limited, Refunding, Series A, (State Aid Withholding),
4.000% due 4/15/20 | | | 327,114 | |
| | 305,000 | | | Springfield Township, PA, School District, Montgomery County, General Obligation Limited, Refunding,
(State Aid Withholding),
4.000% due 11/15/20 | | | 338,126 | |
| | | | | | | | |
| | | | | | | 3,364,912 | |
| | | | | | | | |
| | |
| | | | South Carolina — 0.7% | | | |
| | 200,000 | | | South Carolina State, Public Service Authority, Revenue Bonds, Refunding, Series B,
5.000% due 1/1/17 | | | 201,418 | |
| | | | | | | | |
| | |
| | | | Tennessee — 0.8% | | | |
| | 245,000 | | | Clarksville, TN, Natural Gas Acquisition Corp., Gas Revenue, Revenue Bonds, Merrill Lynch & Co., Inc., Project,
5.000% due 12/15/16 | | | 246,250 | |
| | | | | | | | |
| | |
| | | | Texas — 9.5% | | | |
| | 460,000 | | | Alvin, TX, Independent School District, General Obligation Unlimited, Series B, (PSF Guaranteed),
0.950% due 2/15/391 | | | 457,153 | |
| | 305,000 | | | Arlington, TX, Higher Education Finance Corp., Revenue Bonds, Refunding, Brown Fellowship Leadership Academy, Series A, (PSF Guaranteed),
2.000% due 8/15/17 | | | 307,709 | |
| | 200,000 | | | Denton, TX, Independent School District, General Obligation Unlimited, (PSF Guaranteed),
2.000% due 8/1/431 | | | 204,564 | |
| | 150,000 | | | Eagle Pass, TX, General Obligation Limited, Refunding,
2.000% due 3/1/17 | | | 150,519 | |
| | 200,000 | | | Fort Bend, TX, Independent School District, General Obligation Unlimited, Series A, (PSF Guaranteed),
0.900% due 8/1/401 | | | 199,198 | |
| | 300,000 | | | Grapevine-Colleyville, TX, Independent School District, General Obligation Unlimited, Series B,
(PSF Guaranteed),
2.500% due 8/1/361 | | | 303,369 | |
| | 250,000 | | | Harris County, TX, General Obligation Limited, Refunding, Series B,
5.000% due 10/1/19 | | | 278,635 | |
| | 100,000 | | | Lower Colorado River, TX, Authority Transmission Contract Revenue, Refunding,
5.000% due 5/15/17 | | | 102,286 | |
| | 250,000 | | | Lower Colorado River, TX, Authority Transmission Contract Revenue, Refunding, Series A,
5.000% due 5/15/17 | | | 255,715 | |
| | 250,000 | | | North East, TX, Independent School District, General Obligation Unlimited, Series B, (PSF Guaranteed),
1.420% due 8/1/401 | | | 248,310 | |
| | 210,000 | | | Taft, TX, Independent School District, General Obligation Unlimited, Refunding, (PSF Guaranteed),
3.000% due 8/15/20 | | | 223,677 | |
| | 140,000 | | | Venus, TX, Independent School District, General Obligation Unlimited, Refunding, (PSF Guaranteed),
2.000% due 8/15/18 | | | 142,507 | |
| | | | | | | | |
| | | | | | | 2,873,642 | |
| | | | | | | | |
See Notes to Financial Statements.
THE GLENMEDE FUND, INC.
Short Term Tax Aware Fixed Income Portfolio
SCHEDULE OF PORTFOLIO INVESTMENTS — (Continued)
October 31, 2016
| | | | | | | | |
Face
Amount | | | | | Value | |
| |
| MUNICIPAL BONDS* — (Continued) | | | |
| | | | Washington — 3.4% | | | |
| $ | 325,000 | | | Grays Harbor County, WA, Public Utility District No. 1, Revenue Bonds, Refunding,
4.000% due 7/1/17 | | $ | 331,789 | |
| | 315,000 | | | Seattle, WA, Municipal Light & Power Revenue, Revenue Bonds, Refunding, Series A,
5.000% due 6/1/19 | | | 346,922 | |
| | 350,000 | | | Washington, Federal Highway Grant Anticipation Revenue, Series F,
5.000% due 9/1/17 | | | 362,170 | |
| | | | | | | | |
| | | | | | | 1,040,881 | |
| | | | | | | | |
| | |
| | | | Wisconsin — 3.6% | | | |
| | 285,000 | | | Oshkosh, WI, Water Revenue, Revenue Bonds, Series F,
2.000% due 1/1/19 | | | 290,538 | |
| | 275,000 | | | Wisconsin State, Health & Educational Facilities Authority Revenue, Refunding, Series B,
5.000% due 8/15/18 | | | 294,299 | |
| | 500,000 | �� | | Wisconsin State, Health & Educational Facilities Authority Revenue, Revenue Bonds, Series 2013B-1,
1.375% due 11/15/381,2 | | | 499,935 | |
| | | | | | | | |
| | | | | | | 1,084,772 | |
| | | | | | | | |
| | |
| | | | TOTAL MUNICIPAL BONDS
(Cost $26,262,169) | | | 26,177,937 | |
| | | | | | | | |
| | |
| Shares | | | | | | |
| |
| REGISTERED INVESTMENT COMPANIES* — 4.3% | | | |
| | 450 | | | BlackRock Defined Opportunity Credit Trust | | | 6,053 | |
| | 3,200 | | | BlackRock Municipal 2020 Term Trust | | | 52,064 | |
| | 6,232 | | | PIMCO 0-5 Year High Yield Corporate Bond Index Exchange-Traded Fund | | | 613,540 | |
| | 7,700 | | | Vanguard Short-Term Corporate Bond ETF | | | 618,464 | |
| | | | | | | | |
| | |
| | | | TOTAL REGISTERED INVESTMENT COMPANIES
(Cost $1,286,576) | | | 1,290,121 | |
| | | | | | | | |
| | | | | | | | | | |
| | |
TOTAL INVESTMENTS
(Cost $31,428,437)3 | | | 104.2 | % | | $ | 31,339,631 | |
| | |
LIABILITIES IN EXCESS OF OTHER ASSETS | | | (4.2 | ) | | | (1,263,185 | ) |
| | | | | | | | | | |
| | |
NET ASSETS | | | 100.0 | % | | $ | 30,076,446 | |
| | | | | | | | | | |
| * | Percentages indicated are based on net assets. |
| 1 | Floating Rate Bond. Rate shown is as of October 31, 2016. |
| 3 | Aggregate cost for federal tax purposes was $31,428,567. |
Abbreviations:
AGC — Assurance Guaranty Corporation
AGMC — Assured Guaranty Municipal Corporation
AMBAC — American Municipal Bond Assurance Corporation
LOC — Letter of Credit
NPFG — National Public Finance Guarantee Corporation
PSF — Permanent School Fund
QSBLF — Michigan Qualified School Bond Loan Fund
See Notes to Financial Statements.
THE GLENMEDE FUND, INC.
Short Term Tax Aware Fixed Income Portfolio
SCHEDULE OF PORTFOLIO INVESTMENTS — (Concluded)
October 31, 2016
SECTOR DIVERSIFICATION
On October 31, 2016, sector diversification of the Portfolio was as follows:
| | | | | | | | |
| | | % of
Net Assets | | | Value | |
SECTOR: | | | | | | | | |
Municipal Bonds | | | 87.0 | % | | $ | 26,177,937 | |
Corporate Notes | | | 12.9 | | | | 3,871,573 | |
Registered Investment Companies | | | 4.3 | | | | 1,290,121 | |
| | | | | | | | |
TOTAL | | | 104.2 | % | | $ | 31,339,631 | |
| | | | | | | | |
TOTAL INVESTMENTS | | | 104.2 | % | | $ | 31,339,631 | |
| | | | | | | | |
See Notes to Financial Statements.
THE GLENMEDE FUND, INC.
Secured Options Portfolio
SCHEDULE OF PORTFOLIO INVESTMENTS
October 31, 2016
| | | | | | | | |
| Shares | | | | | Value | |
| |
| EXCHANGE-TRADED FUNDS* — 1.8% | | | |
| | 22,100 | | | SPDR S&P 500 ETF Trust | | $ | 4,697,355 | |
| | 30,000 | | | Vanguard S&P 500 ETF | | | 5,853,900 | |
| | | | | | | | |
| | |
| | | | TOTAL EXCHANGE-TRADED FUNDS
(Cost $6,430,609) | | | 10,551,255 | |
| | | | | | | | |
| |
| U.S. TREASURY BILLS — 17.4% | | | |
| $ | 100,000,000 | | | U.S. Treasury Bill
0.000% due 11/3/16 | | | 99,999,400 | |
| | | | | | | | |
| | |
| | | | TOTAL U.S. TREASURY BILLS
(Cost $99,998,611) | | | 99,999,400 | |
| | | | | | | | |
| |
| PURCHASED OPTIONS — 71.3% | | | |
| | | | CALLS — 39.9% | |
| | 2,050 | | | S&P 500 Index with Goldman Sachs, Exercise Price $1,000, Expires 12/16/2016 | | | 229,343,750 | |
| | | | | | | | |
| | | | | | | 229,343,750 | |
| | | | | | | | |
| |
| | | | PUTS — 31.4% | |
| | 2,050 | | | S&P 500 Index with Goldman Sachs, Exercise Price $3,000, Expires 12/16/2016 | | | 180,164,250 | |
| | | | | | | | |
| | | | | | | 180,164,250 | |
| | | | | | | | |
| | |
| | | | TOTAL PURCHASED OPTIONS
(Cost $409,245,600) | | | 409,508,000 | |
| | | | | | | | |
| | |
Face
Amount | | | | | | |
| |
| REPURCHASE AGREEMENT* — 7.2% | | | |
| $ | 41,080,677 | | | With Fixed Income Clearing Corp., dated 10/31/16, 0.01%, principal and interest in the amount of $41,080,689, due 11/1/16, (collateralized by a U.S. Treasury Bond with a par value of $42,650,000, coupon rate of 2.500%, due 02/15/46, market value of $41,903,625) | | | 41,080,677 | |
| | | | | | | | |
| | |
| | | | TOTAL REPURCHASE AGREEMENT
(Cost $41,080,677) | | | 41,080,677 | |
| | | | | | | | |
| | | | | | | | | | |
| | |
TOTAL INVESTMENTS
(Cost $556,755,497)1 | | | 97.7 | % | | $ | 561,139,332 | |
| | |
OTHER ASSETS IN EXCESS OF LIABILITIES | | | 2.3 | | | | 13,060,507 | |
| | | | | | | | | | |
| | |
NET ASSETS2 | | | 100.0 | % | | $ | 574,199,839 | |
| | | | | | | | | | |
| * | Percentages indicated are based on net assets. |
| 1 | Aggregate cost for federal tax purposes was $556,755,497. |
| 2 | Cash in the amount of $22,475,062 is held as collateral to secure the open written put options contracts. |
See Notes to Financial Statements.
THE GLENMEDE FUND, INC.
Secured Options Portfolio
SCHEDULE OF PORTFOLIO INVESTMENTS — (Concluded)
October 31, 2016
| | | | | | | | |
Name of Issuer,
Title of Issue and
Counterparty | | Number of
Contracts | | | Value | |
WRITTEN OPTIONS | | | | | | | | |
CALLS: | | | | | | | | |
S&P 500 Index expires December 2016 exercise price $3,000 Goldman Sachs | | | 2,050 | | | $ | (5,125 | ) |
| | | | | | | | |
TOTAL WRITTEN CALL OPTIONS
(Premiums Received $(8,200)) | | | | | | $ | (5,125 | ) |
| | | | | | | | |
PUTS: | | | | | | | | |
S&P 500 Index expires November 2016 exercise price $2,100 Goldman Sachs | | | 1,070 | | | | (2,551,950 | ) |
S&P 500 Index expires November 2016 exercise price $2,150 Goldman Sachs | | | 1,490 | | | | (6,518,750 | ) |
S&P 500 Index expires December 2016 exercise price $1,000 Goldman Sachs | | | 2,050 | | | | (10,250 | ) |
| | | | | | | | |
TOTAL WRITTEN PUT OPTIONS
(Premiums Received $(8,103,315)) | | | | | | $ | (9,080,950 | ) |
| | | | | | | | |
TOTAL WRITTEN OPTIONS
(Premiums Received $(8,111,515)) | | | | | | $ | (9,086,075 | ) |
| | | | | | | | |
SECTOR DIVERSIFICATION
On October 31, 2016, sector diversification of the Portfolio was as follows:
| | | | | | | | |
| | | % of
Net Assets | | | Value | |
SECTOR: | | | | | | | | |
Purchased Options | | | 71.3 | % | | $ | 409,508,000 | |
U.S. Treasury Bills | | | 17.4 | | | | 99,999,400 | |
Exchange-Traded Funds | | | 1.8 | | | | 10,551,255 | |
| | | | | | | | |
TOTAL | | | 90.5 | % | | $ | 520,058,655 | |
| | |
REPURCHASE AGREEMENTS | | | 7.2 | | | | 41,080,677 | |
| | | | | | | | |
TOTAL INVESTMENTS | | | 97.7 | % | | $ | 561,139,332 | |
| | | | | | | | |
See Notes to Financial Statements.
THE GLENMEDE FUND, INC.
International Secured Options Portfolio
SCHEDULE OF PORTFOLIO INVESTMENTS
October 31, 2016
| | | | | | | | |
| Shares | | | | | Value | |
|
| COMMON STOCKS* — 83.9% | |
| | | | Air Freight & Logistics — 0.7% | | | |
| | 4,439 | | | Deutsche Post AG, Sponsored ADR | | $ | 137,920 | |
| | 5,171 | | | Royal Mail PLC, Unsponsored ADR | | | 61,586 | |
| | | | | | | | |
| | | | | | | 199,506 | |
| | | | | | | | |
| | |
| | | | Auto Components — 2.3% | | | |
| | 10,917 | | | Cie Generale des Etablissements Michelin, Unsponsored ADR | | | 235,370 | |
| | 6,522 | | | Continental AG, Sponsored ADR | | | 250,510 | |
| | 6,352 | | | Valeo SA, Sponsored ADR | | | 183,065 | |
| | | | | | | | |
| | | | | | | 668,945 | |
| | | | | | | | |
| | |
| | | | Automobiles — 2.6% | | | |
| | 3,849 | | | Daimler AG, Sponsored ADR | | | 274,010 | |
| | 5,945 | | | Honda Motor Co., Ltd., Sponsored ADR | | | 177,340 | |
| | 2,662 | | | Toyota Motor Corp., Sponsored ADR | | | 307,887 | |
| | | | | | | | |
| | | | | | | 759,237 | |
| | | | | | | | |
| | |
| | | | Banks — 8.8% | | | |
| | 7,203 | | | BNP Paribas SA, ADR | | | 209,031 | |
| | 3,642 | | | BOC Hong Kong Holdings, Ltd., Sponsored ADR | | | 258,109 | |
| | 8,534 | | | Danske Bank AS, Sponsored ADR | | | 132,106 | |
| | 5,508 | | | DBS Group Holdings, Ltd., Sponsored ADR | | | 237,835 | |
| | 979 | | | DNB ASA, Sponsored ADR | | | 142,445 | |
| | 14,730 | | | ING Groep N.V., Sponsored ADR | | | 193,110 | |
| | 70,889 | | | Mitsubishi UFJ Financial Group, Inc., Sponsored ADR | | | 365,078 | |
| | 25,066 | | | Nordea Bank AB, Sponsored ADR | | | 261,814 | |
| | 50,619 | | | Sumitomo Mitsui Financial Group, Inc., Sponsored ADR | | | 348,259 | |
| | 6,550 | | | Swedbank AB, ADR | | | 153,532 | |
| | 8,882 | | | United Overseas Bank, Ltd., Sponsored ADR | | | 238,926 | |
| | | | | | | | |
| | | | | | | 2,540,245 | |
| | | | | | | | |
| | |
| | | | Beverages — 0.8% | | | |
| | 2,109 | | | Diageo Plc—Sponsored ADR | | | 226,781 | |
| | | | | | | | |
| | |
| | | | Biotechnology — 0.7% | | | |
| | 1,217 | | | Shire PLC, ADR | | | 205,235 | |
| | | | | | | | |
| | |
| | | | Capital Markets — 1.0% | | | |
| | 50,844 | | | Daiwa Securities Group, Inc., Sponsored ADR | | | 300,488 | |
| | | | | | | | |
| | |
| | | | Chemicals — 3.1% | | | |
| | 5,247 | | | Air Liquide SA, Unsponsored ADR | | | 106,514 | |
| | 3,325 | | | BASF SE, Sponsored ADR | | | 293,198 | |
| | 13,894 | | | Shin-Etsu Chemical Co., Ltd., Unsponsored ADR | | | 264,681 | |
| | 12,653 | | | Toray Industries, Inc., Unsponsored ADR | | | 236,232 | |
| | | | | | | | |
| | | | | | | 900,625 | |
| | | | | | | | |
| | |
| | | | Construction & Engineering — 1.1% | | | |
| | 16,867 | | | Vinci SA, Unsponsored ADR | | | 305,630 | |
| | | | | | | | |
| | |
| | | | Construction Materials — 1.5% | | | |
| | 28,728 | | | Fletcher Building, Ltd., Sponsored ADR | | | 420,578 | |
| | | | | | | | |
| | |
| | | | Containers & Packaging — 0.8% | | | |
| | 5,328 | | | Amcor, Ltd., Sponsored ADR | | | 238,908 | |
| | | | | | | | |
| | |
| | | | Diversified Telecommunication Services — 3.9% | | | |
| | 7,831 | | | BT Group PLC, Sponsored ADR | | | 181,209 | |
| | 5,009 | | | Nippon Telegraph & Telephone Corp., ADR | | | 222,350 | |
| | 16,535 | | | Orange SA, Sponsored ADR | | | 259,599 | |
| | 23,576 | | | Telefonica SA, Sponsored ADR | | | 239,061 | |
| | 27,443 | | | Telia Co. AB, Unsponsored ADR | | | 217,349 | |
| | | | | | | | |
| | | | | | | 1,119,568 | |
| | | | | | | | |
See Notes to Financial Statements.
THE GLENMEDE FUND, INC.
International Secured Options Portfolio
SCHEDULE OF PORTFOLIO INVESTMENTS — (Continued)
October 31, 2016
| | | | | | | | |
| Shares | | | | | Value | |
|
| COMMON STOCKS* — (Continued) | |
| | | | Electric Utilities — 2.7% | | | |
| | 24,093 | | | CLP Holdings, Ltd., Sponsored ADR | | $ | 246,351 | |
| | 7,919 | | | Iberdrola SA, Sponsored ADR | | | 215,555 | |
| | 17,864 | | | Red Electrica Corp., SA, Unsponsored ADR | | | 187,125 | |
| | 8,004 | | | Terna Rete Elettrica Nazionale SPA, Unsponsored ADR | | | 117,459 | |
| | | | | | | | |
| | | | | | | 766,490 | |
| | | | | | | | |
| | |
| | | | Electrical Equipment — 1.2% | | | |
| | 17,059 | | | ABB, Ltd., Sponsored ADR1 | | | 352,268 | |
| | | | | | | | |
| | |
| | | | Electronic Equipment, Instruments & Components — 0.9% | | | |
| | 5,215 | | | Kyocera Corp., Sponsored ADR | | | 253,345 | |
| | | | | | | | |
| | |
| | | | Energy Equipment & Services — 1.0% | | | |
| | 17,495 | | | Technip SA, ADR | | | 287,443 | |
| | | | | | | | |
| | |
| | | | Food & Staples Retailing — 1.5% | | | |
| | 6,475 | | | J Sainsbury PLC, Sponsored ADR | | | 80,245 | |
| | 10,194 | | | Koninklijke Ahold Delhaize N.V., Sponsored ADR | | | 232,219 | |
| | 5,160 | | | Seven & I Holdings Co., Ltd., Unsponsored ADR | | | 107,586 | |
| | | | | | | | |
| | | | | | | 420,050 | |
| | | | | | | | |
| | |
| | | | Food Products — 3.4% | | | |
| | 11,939 | | | Danone SA, Sponsored ADR | | | 166,071 | |
| | 7,185 | | | Nestle SA, Sponsored ADR | | | 521,954 | |
| | 3,250 | | | Tate & Lyle PLC, Sponsored ADR | | | 126,393 | |
| | 7,374 | | | Wilmar International, Ltd., Unsponsored ADR | | | 173,459 | |
| | | | | | | | |
| | | | | | | 987,877 | |
| | | | | | | | |
| | |
| | | | Health Care Providers & Services — 1.0% | | | |
| | 19,452 | | | Sonic Healthcare, Ltd., Unsponsored ADR | | | 300,728 | |
| | | | | | | | |
| | |
| | | | Hotels, Restaurants & Leisure — 1.9% | | | |
| | 17,017 | | | Compass Group PLC, Sponsored ADR | | | 309,028 | |
| | 5,984 | | | InterContinental Hotels Group PLC, ADR | | | 236,069 | |
| | | | | | | | |
| | | | | | | 545,097 | |
| | | | | | | | |
| | |
| | | | Household Durables — 1.1% | | | |
| | 19,373 | | | Sekisui House, Ltd., Sponsored ADR | | | 319,073 | |
| | | | | | | | |
| | |
| | | | Industrial Conglomerates — 2.0% | | | |
| | 3,092 | | | Siemens AG, Sponsored ADR | | | 351,406 | |
| | 13,298 | | | Smiths Group PLC, Sponsored ADR | | | 232,981 | |
| | | | | | | | |
| | | | | | | 584,387 | |
| | | | | | | | |
| | |
| | | | Insurance — 5.0% | | | |
| | 9,329 | | | AIA Group, Ltd., Sponsored ADR | | | 236,770 | |
| | 13,419 | | | Allianz SE, ADR | | | 208,397 | |
| | 10,060 | | | AXA SA, Sponsored ADR | | | 227,255 | |
| | 10,030 | | | Muenchener Rueckversicherungs-Gesellschaft AG in Muenchen, Unsponsored ADR | | | 193,880 | |
| | 4,386 | | | Prudential PLC, ADR | | | 143,554 | |
| | 8,942 | | | Swiss Re AG, Sponsored ADR | | | 207,499 | |
| | 8,932 | | | Zurich Insurance Group AG, ADR | | | 233,840 | |
| | | | | | | | |
| | | | | | | 1,451,195 | |
| | | | | | | | |
| | |
| | | | IT Services — 2.3% | | | |
| | 3,176 | | | Amadeus IT Group SA, Unsponsored ADR | | | 150,161 | |
| | 7,443 | | | Atos SE, Unsponsored ADR | | | 154,145 | |
| | 8,492 | | | Capgemini SA, Unsponsored ADR | | | 350,592 | |
| | | | | | | | |
| | | | | | | 654,898 | |
| | | | | | | | |
See Notes to Financial Statements.
THE GLENMEDE FUND, INC.
International Secured Options Portfolio
SCHEDULE OF PORTFOLIO INVESTMENTS — (Continued)
October 31, 2016
| | | | | | | | |
| Shares | | | | | Value | |
|
| COMMON STOCKS* — (Continued) | |
| | | | Machinery — 1.9% | | | |
| | 10,091 | | | Atlas Copco AB, Sponsored ADR | | $ | 296,676 | |
| | 1,687 | | | Makita Corp., Sponsored ADR | | | 117,196 | |
| | 11,302 | | | Volvo AB, Unsponsored ADR | | | 120,366 | |
| | | | | | | | |
| | | | | | | 534,238 | |
| | | | | | | | |
| | |
| | | | Media — 3.0% | | | |
| | 12,703 | | | Publicis Groupe SA, ADR | | | 218,492 | |
| | 11,016 | | | RELX PLC, Sponsored ADR | | | 199,830 | |
| | 2,876 | | | Sky PLC, Sponsored ADR | | | 114,882 | |
| | 2,878 | | | Wolters Kluwer N.V., Sponsored ADR | | | 111,364 | |
| | 2,123 | | | WPP PLC, Sponsored ADR | | | 230,282 | |
| | | | | | | | |
| | | | | | | 874,850 | |
| | | | | | | | |
| | |
| | | | Metals & Mining — 1.1% | | | |
| | 17,997 | | | Newcrest Mining, Ltd., Sponsored ADR | | | 310,628 | |
| | | | | | | | |
| | |
| | | | Oil, Gas & Consumable Fuels — 3.4% | | | |
| | 18,806 | | | Inpex Corp., Unsponsored ADR | | | 174,143 | |
| | 12,167 | | | Repsol SA, Sponsored ADR | | | 170,460 | |
| | 5,263 | | | Total SA, Sponsored ADR | | | 251,256 | |
| | 17,871 | | | Woodside Petroleum, Ltd., Sponsored ADR | | | 384,048 | |
| | | | | | | | |
| | | | | | | 979,907 | |
| | | | | | | | |
| | |
| | | | Paper & Forest Products — 0.7% | | | |
| | 9,130 | | | UPM-Kymmene OYJ, Sponsored ADR | | | 212,181 | |
| | | | | | | | |
| | |
| | | | Personal Products — 2.8% | | | |
| | 5,408 | | | L’Oreal SA, Unsponsored ADR | | | 193,715 | |
| | 4,971 | | | Unilever N.V. | | | 207,887 | |
| | 9,908 | | | Unilever PLC, Sponsored ADR | | | 412,866 | |
| | | | | | | | |
| | | | | | | 814,468 | |
| | | | | | | | |
| | |
| | | | Pharmaceuticals — 7.8% | | | |
| | 24,404 | | | Astellas Pharma, Inc., Unsponsored ADR | | | 362,521 | |
| | 2,281 | | | AstraZeneca PLC, Sponsored ADR | | | 64,598 | |
| | 2,320 | | | Bayer AG, Sponsored ADR | | | 230,179 | |
| | 27,132 | | | Daiichi Sankyo Co., Ltd., Sponsored ADR | | | 650,761 | |
| | 4,729 | | | Novartis AG, Sponsored ADR | | | 335,854 | |
| | 14,213 | | | Roche Holding AG, Sponsored ADR | | | 407,558 | |
| | 4,622 | | | Teva Pharmaceutical Industries, Ltd., Sponsored ADR | | | 197,544 | |
| | | | | | | | |
| | | | | | | 2,249,015 | |
| | | | | | | | |
| | |
| | | | Professional Services — 1.2% | | | |
| | 11,314 | | | Experian PLC, Sponsored ADR | | | 218,021 | |
| | 6,993 | | | RELX N.V., Sponsored ADR | | | 117,552 | |
| | | | | | | | |
| | | | | | | 335,573 | |
| | | | | | | | |
| | |
| | | | Real Estate Management & Development — 1.3% | | | |
| | 13,101 | | | Daiwa House Industry Co., Ltd., Unsponsored ADR | | | 359,950 | |
| | | | | | | | |
| | |
| | | | Road & Rail — 0.4% | | | |
| | 1,886 | | | West Japan Railway Co., Unsponsored ADR | | | 115,027 | |
| | | | | | | | |
| | |
| | | | Software — 0.8% | | | |
| | 2,677 | | | SAP SE, Sponsored ADR | | | 235,148 | |
| | | | | | | | |
| | |
| | | | Specialty Retail — 1.4% | | | |
| | 10,366 | | | Industria de Diseno Textil SA, Unsponsored ADR | | | 180,835 | |
| | 23,570 | | | Kingfisher PLC, Sponsored ADR | | | 212,837 | |
| | | | | | | | |
| | | | | | | 393,672 | |
| | | | | | | | |
See Notes to Financial Statements.
THE GLENMEDE FUND, INC.
International Secured Options Portfolio
SCHEDULE OF PORTFOLIO INVESTMENTS — (Continued)
October 31, 2016
| | | | | | | | |
| Shares | | | | | Value | |
|
| COMMON STOCKS* — (Continued) | |
| | | | Technology Hardware, Storage & Peripherals — 1.8% | | | |
| | 17,520 | | | Canon, Inc., Sponsored ADR | | $ | 503,174 | |
| | | | | | | | |
| | |
| | | | Textiles, Apparel & Luxury Goods — 0.8% | | | |
| | 1,389 | | | adidas AG, Sponsored ADR | | | 113,898 | |
| | 3,486 | | | LVMH Moet Hennessy Louis Vuitton SA, Sponsored ADR | | | 126,890 | |
| | | | | | | | |
| | | | | | | 240,788 | |
| | | | | | | | |
| | |
| | | | Tobacco — 1.6% | | | |
| | 4,015 | | | British American Tobacco PLC, Sponsored ADR | | | 461,283 | |
| | | | | | | | |
| | |
| | | | Trading Companies & Distributors — 0.9% | | | |
| | 908 | | | Mitsui & Co., Ltd., Sponsored ADR | | | 250,059 | |
| | | | | | | | |
| | |
| | | | Wireless Telecommunication Services — 1.7% | | | |
| | 12,776 | | | KDDI Corp., Unsponsored ADR | | | 193,556 | |
| | 11,590 | | | NTT DOCOMO, Inc., Sponsored ADR | | | 291,373 | |
| | | | | | | | |
| | | | | | | 484,929 | |
| | | | | | | | |
| | |
| | | | TOTAL COMMON STOCKS
(Cost $23,804,093) | | | 24,163,487 | |
| | | | | | | | |
| |
| EXCHANGE-TRADED FUND* — 1.5% | | | |
| | 7,500 | | | iShares MSCI EAFE ETF | | | 433,650 | |
| | | | | | | | |
| | |
| | | | TOTAL EXCHANGE-TRADED FUNDS
(Cost $397,724) | | | 433,650 | |
| | | | | | | | |
| | |
Face
Amount | | | | | | |
| |
| REPURCHASE AGREEMENT* — 7.8% | | | |
| $ | 2,257,479 | | | With Fixed Income Clearing Corp., dated 10/31/16, 0.01%, principal and interest in the amount of $2,257,480, due 11/1/16, (collateralized by a U.S. Treasury Bond with a par value of $2,345,000, coupon rate of 2.500%, due 2/15/46, market value of $2,303,963) | | | 2,257,479 | |
| | | | | | | | |
| | |
| | | | TOTAL REPURCHASE AGREEMENT
(Cost $2,257,479) | | | 2,257,479 | |
| | | | | | | | |
| | | | | | | | | | |
| | |
TOTAL INVESTMENTS
(Cost $26,459,296)2 | | | 93.2 | % | | $ | 26,854,616 | |
| | |
OTHER ASSETS IN EXCESS OF LIABILITIES | | | 6.8 | | | | 1,963,568 | |
| | | | | | | | | | |
| | |
NET ASSETS3 | | | 100.0 | % | | $ | 28,818,184 | |
| | | | | | | | | | |
| * | Percentages indicated are based on net assets. |
| 1 | Non income-producing security. |
| 2 | Aggregate cost for federal tax purposes was $26,512,206. |
| 3 | Cash in the amount of $1,993,324 is held as collateral to secure the open written call and put options contracts. |
Abbreviations:
ADR — American Depositary Receipt
SPA — Stand-By Purchase Agreement
See Notes to Financial Statements.
THE GLENMEDE FUND, INC.
International Secured Options Portfolio
SCHEDULE OF PORTFOLIO INVESTMENTS — (Concluded)
October 31, 2016
| | | | | | | | |
Name of Issuer,
Title of Issue and
Counterparty | | Number of
Contracts | | | Value | |
WRITTEN OPTIONS | | | | | | | | |
CALLS: | | | | | | | | |
iShares MSCI EAFE Index Fund expires November 2016 exercise price $59 Goldman Sachs | | | 1,150 | | | $ | (28,750 | ) |
iShares MSCI EAFE Index Fund expires December 2016 exercise price $60 Goldman Sachs | | | 1,800 | | | | (55,800 | ) |
iShares MSCI EAFE Index Fund expires November 2016 exercise price $60 Goldman Sachs | | | 1,100 | | | | (7,700 | ) |
| | | | | | | | |
TOTAL WRITTEN CALL OPTIONS
(Premiums Received $(184,720)) | | | | | | $ | (92,250 | ) |
| | | | | | | | |
PUTS: | | | | | | | | |
iShares MSCI EAFE Index Fund expires November 2016 exercise price $56 Goldman Sachs | | | 320 | | | $ | (9,280 | ) |
| | | | | | | | |
TOTAL WRITTEN PUT OPTIONS
(Premiums Received $(7,661)) | | | | | | $ | (9,280 | ) |
| | | | | | | | |
TOTAL WRITTEN OPTIONS
(Premiums Received $(192,381)) | | | | | | $ | (101,530 | ) |
| | | | | | | | |
SECTOR DIVERSIFICATION
On October 31, 2016, sector diversification of the Portfolio was as follows:
| | | | | | | | |
| | | % of
Net Assets | | | Value | |
SECTOR: | | | | | | | | |
Common Stocks | | | 83.9 | % | | $ | 24,163,487 | |
Exchange-Traded Funds | | | 1.5 | | | | 433,650 | |
| | | | | | | | |
TOTAL | | | 85.4 | % | | $ | 24,597,137 | |
| | |
REPURCHASE AGREEMENTS | | | 7.8 | | | | 2,257,479 | |
| | | | | | | | |
TOTAL INVESTMENTS | | | 93.2 | % | | $ | 26,854,616 | |
| | | | | | | | |
See Notes to Financial Statements.
THE GLENMEDE FUND, INC.
International Portfolio
SCHEDULE OF PORTFOLIO INVESTMENTS
October 31, 2016
| | | | | | | | |
| Shares | | | | | Value | |
| |
| COMMON STOCKS* — 99.0% | | | |
| | | | Japan — 25.2% | | | |
| | 472,203 | | | Daiichi Sankyo Co., Ltd., Sponsored ADR | | $ | 11,325,789 | |
| | 307,349 | | | Daiwa House Industry Co., Ltd., Unsponsored ADR | | | 8,444,414 | |
| | 387,176 | | | Fuji Heavy Industries, Ltd., Unsponsored ADR | | | 7,526,701 | |
| | 88,155 | | | Honda Motor Co., Ltd., Sponsored ADR | | | 2,629,664 | |
| | 192,683 | | | Isuzu Motors, Ltd., Unsponsored ADR | | | 2,370,001 | |
| | 211,418 | | | Japan Airlines Co., Ltd., Unsponsored ADR | | | 3,171,270 | |
| | 124,314 | | | Kao Corp., Sponsored ADR | | | 6,396,577 | |
| | 652,835 | | | KDDI Corp., Unsponsored ADR | | | 9,890,450 | |
| | 135,371 | | | Kyocera Corp., Sponsored ADR | | | 6,576,323 | |
| | 955,659 | | | Mitsubishi UFJ Financial Group, Inc., Sponsored ADR | | | 4,921,644 | |
| | 442,603 | | | MS&AD Insurance Group Holdings, Inc., Unsponsored ADR | | | 6,789,530 | |
| | 133,694 | | | Nippon Telegraph & Telephone Corp., ADR | | | 5,934,677 | |
| | 238,551 | | | NTT DOCOMO, Inc., Sponsored ADR | | | 5,997,172 | |
| | 181,554 | | | Sekisui House, Ltd., Sponsored ADR | | | 2,990,194 | |
| | 693,041 | | | Sumitomo Mitsui Financial Group, Inc., Sponsored ADR | | | 4,768,122 | |
| | 1,132,064 | | | Sumitomo Mitsui Trust Holdings, Inc., Sponsored ADR | | | 3,792,414 | |
| | 38,585 | | | Suzuki Motor Corp., Unsponsored ADR | | | 5,410,003 | |
| | 252,522 | | | Tokyo Electron, Ltd., Unsponsored ADR | | | 5,676,695 | |
| | 358,547 | | | Toray Industries, Inc., Unsponsored ADR | | | 6,694,072 | |
| | | | | | | | |
| | | | | | | 111,305,712 | |
| | | | | | | | |
| | |
| | | | United Kingdom — 16.5% | | | |
| | 74,579 | | | Ashtead Group PLC, Unsponsored ADR | | | 4,668,645 | |
| | 53,001 | | | British American Tobacco PLC, Sponsored ADR | | | 6,089,285 | |
| | 251,384 | | | Burberry Group PLC, Sponsored ADR | | | 4,587,758 | |
| | 20,308 | | | Diageo PLC, Sponsored ADR | | | 2,183,719 | |
| | 166,854 | | | GlaxoSmithKline PLC, Sponsored ADR | | | 6,675,829 | |
| | 157,429 | | | Imperial Brands PLC, Sponsored ADR | | | 7,611,692 | |
| | 733,320 | | | Kingfisher PLC, Sponsored ADR | | | 6,621,880 | |
| | 393,025 | | | Legal & General Group PLC, Sponsored ADR | | | 5,056,267 | |
| | 145,590 | | | Prudential PLC, ADR | | | 4,765,161 | |
| | 243,189 | | | RELX PLC, Sponsored ADR | | | 4,411,448 | |
| | 136,329 | | | Sky PLC, Sponsored ADR | | | 5,445,662 | |
| | 430,566 | | | Smiths Group PLC, Sponsored ADR | | | 7,543,516 | |
| | 64,458 | | | WPP PLC, Sponsored ADR | | | 6,991,759 | |
| | | | | | | | |
| | | | | | | 72,652,621 | |
| | | | | | | | |
| | |
| | | | Switzerland — 9.1% | | | |
| | 119,223 | | | ABB, Ltd., Sponsored ADR1 | | | 2,461,955 | |
| | 181,544 | | | Actelion, Ltd., Unsponsored ADR1 | | | 6,544,661 | |
| | 163,966 | | | Adecco Group AG, Unsponsored ADR | | | 4,877,169 | |
| | 467,944 | | | Lonza Group AG, Unsponsored ADR1 | | | 8,823,084 | |
| | 84,501 | | | Nestle SA, Sponsored ADR | | | 6,138,575 | |
| | 84,865 | | | Roche Holding AG, Sponsored ADR | | | 2,433,504 | |
| | 81,707 | | | Sonova Holding AG, Unsponsored ADR | | | 2,189,748 | |
| | 281,231 | | | Swiss Re AG, Sponsored ADR | | | 6,525,965 | |
| | | | | | | | |
| | | | | | | 39,994,661 | |
| | | | | | | | |
| | |
| | | | France — 8.9% | | | |
| | 79,807 | | | Arkema SA, Sponsored ADR | | | 7,558,122 | |
| | 249,191 | | | Atos SE, Unsponsored ADR | | | 5,160,746 | |
| | 74,945 | | | Capgemini SA, Unsponsored ADR | | | 3,094,104 | |
| | 101,928 | | | Cie Generale des Etablissements Michelin, Unsponsored ADR | | | 2,197,568 | |
| | 263,368 | | | Renault SA, Unsponsored ADR | | | 4,561,534 | |
| | 488,396 | | | Technip SA, ADR | | | 8,024,346 | |
| | 140,452 | | | Total SA, Sponsored ADR | | | 6,705,178 | |
| | 102,208 | | | Veolia Environnement SA, ADR | | | 2,231,201 | |
| | | | | | | | |
| | | | | | | 39,532,799 | |
| | | | | | | | |
See Notes to Financial Statements.
THE GLENMEDE FUND, INC.
International Portfolio
SCHEDULE OF PORTFOLIO INVESTMENTS — (Continued)
October 31, 2016
| | | | | | | | |
| Shares | | | | | Value | |
| |
| COMMON STOCKS* — (Continued) | | | |
| | | | Germany — 8.8% | | | |
| | 26,299 | | | adidas AG, Sponsored ADR | | $ | 2,156,518 | |
| | 437,088 | | | Allianz SE, Sponsored ADR | | | 6,787,977 | |
| | 71,060 | | | Bayer AG, Sponsored ADR | | | 7,050,218 | |
| | 245,061 | | | Deutsche Lufthansa AG, Sponsored ADR | | | 3,122,077 | |
| | 306,014 | | | E.ON SE, Sponsored ADR | | | 2,253,793 | |
| | 82,729 | | | GEA Group AG, Sponsored ADR | | | 3,197,889 | |
| | 339,830 | | | Muenchener Rueckversicherungs-Gesellschaft AG, Unsponsored ADR | | | 6,568,914 | |
| | 66,384 | | | Siemens AG, Sponsored ADR | | | 7,544,542 | |
| | | | | | | | |
| | | | | | | 38,681,928 | |
| | | | | | | | |
| | |
| | | | Australia — 6.3% | | | |
| | 163,880 | | | Amcor, Ltd., Sponsored ADR | | | 7,348,379 | |
| | 954,567 | | | Coca-Cola Amatil, Ltd., Sponsored ADR | | | 6,958,793 | |
| | 407,370 | | | Sonic Healthcare, Ltd., Unsponsored ADR | | | 6,297,940 | |
| | 733,908 | | | South32, Ltd., ADR | | | 7,063,865 | |
| | | | | | | | |
| | | | | | | 27,668,977 | |
| | | | | | | | |
| | |
| | | | Hong Kong — 4.5% | | | |
| | 115,843 | | | BOC Hong Kong Holdings, Ltd., Sponsored ADR | | | 8,209,794 | |
| | 457,321 | | | CLP Holdings, Ltd., Sponsored ADR | | | 4,676,107 | |
| | 445,183 | | | WH Group, Ltd., ADR | | | 7,165,220 | |
| | | | | | | | |
| | | | | | | 20,051,121 | |
| | | | | | | | |
| | |
| | | | Finland — 3.5% | | | |
| | 293,504 | | | Kone OYJ, Unsponsored ADR | | | 6,728,579 | |
| | 380,704 | | | UPM-Kymmene OYJ, Sponsored ADR | | | 8,847,561 | |
| | | | | | | | |
| | | | | | | 15,576,140 | |
| | | | | | | | |
| | |
| | | | Netherlands — 3.5% | | | |
| | 540,510 | | | Koninklijke Ahold Delhaize N.V., Sponsored ADR | | | 12,312,818 | |
| | 78,719 | | | Wolters Kluwer N.V., Sponsored ADR | | | 3,046,032 | |
| | | | | | | | |
| | | | | | | 15,358,850 | |
| | | | | | | | |
| | |
| | | | Denmark — 3.0% | | | |
| | 425,040 | | | Danske Bank AS, Sponsored ADR | | | 6,579,619 | |
| | 68,176 | | | Novo Nordisk AS, Sponsored ADR | | | 2,422,975 | |
| | 166,276 | | | Vestas Wind Systems AS, Unsponsored ADR | | | 4,422,942 | |
| | | | | | | | |
| | | | 13,425,536 | |
| | | | | | | | |
| | |
| | | | Sweden — 2.6% | | | |
| | 678,020 | | | Nordea Bank AB, Sponsored ADR | | | 7,081,919 | |
| | 186,236 | | | Swedbank AB, ADR | | | 4,365,372 | |
| | | | | | | | |
| | | | | | | 11,447,291 | |
| | | | | | | | |
| | |
| | | | Austria — 1.6% | | | |
| | 461,062 | | | Erste Group Bank AG, Sponsored ADR | | | 7,250,200 | |
| | | | | | | | |
| | |
| | | | Singapore — 1.5% | | | |
| | 242,152 | | | United Overseas Bank, Ltd., Sponsored ADR | | | 6,513,889 | |
| | | | | | | | |
| | |
| | | | Ireland — 1.4% | | | |
| | 36,691 | | | Shire PLC, ADR | | | 6,187,570 | |
| | | | | | | | |
| | |
| | | | Spain — 1.0% | | | |
| | 93,716 | | | Amadeus IT Group SA, Unsponsored ADR | | | 4,430,892 | |
| | | | | | | | |
| | |
| | | | Italy — 1.0% | | | |
| | 313,171 | | | Intesa Sanpaolo SPA, Sponsored ADR | | | 4,365,604 | |
| | | | | | | | |
See Notes to Financial Statements.
THE GLENMEDE FUND, INC.
International Portfolio
SCHEDULE OF PORTFOLIO INVESTMENTS — (Continued)
October 31, 2016
| | | | | | | | |
| Shares | | | | | Value | |
| |
| COMMON STOCKS* — (Continued) | | | |
| | | | New Zealand — 0.6% | | | |
| | 197,707 | | | Spark New Zealand, Ltd., Sponsored ADR | | $ | 2,574,145 | |
| | | | | | | | |
| | |
| | | | TOTAL COMMON STOCKS
(Cost $423,540,912) | | | 437,017,936 | |
| | | | | | | | |
| | |
Face
Amount | | | | | | |
| |
| REPURCHASE AGREEMENT* — 1.0% | | | |
| $ | 4,196,979 | | | With Fixed Income Clearing Corp., dated 10/31/16, 0.01%, principal and interest in the amount of $4,196,980, due 11/1/16, (collateralized by a U.S. Treasury Bond with a par value of $3,910,000, coupon rate of 3.000%, due 5/15/45, market value of $4,281,450) | | | 4,196,979 | |
| | | | | | | | |
| | |
| | | | TOTAL REPURCHASE AGREEMENT
(Cost $4,196,979) | | | 4,196,979 | |
| | | | | | | | |
| | | | | | | | | | |
| | |
TOTAL INVESTMENTS
(Cost $427,737,891)2 | | | 100.0 | % | | $ | 441,214,915 | |
| | |
OTHER ASSETS IN EXCESS OF LIABILITIES | | | 0.0 | | | | 69,357 | |
| | | | | | | | | | |
| | |
NET ASSETS | | | 100.0 | % | | $ | 441,284,272 | |
| | | | | | | | | | |
| * | Percentages indicated are based on net assets. |
| 1 | Non income-producing security. |
| 2 | Aggregate cost for federal tax purposes was $428,244,723. |
Abbreviations:
ADR — American Depositary Receipt
See Notes to Financial Statements.
THE GLENMEDE FUND, INC.
International Portfolio
SCHEDULE OF PORTFOLIO INVESTMENTS — (Concluded)
October 31, 2016
INDUSTRY DIVERSIFICATION
On October 31, 2016, industry diversification of the Portfolio was as follows:
| | | | | | | | |
| | | % of
Net Assets | | | Value | |
INDUSTRIES: | | | | | | | | |
Banks | | | 13.1 | % | | $ | 57,848,577 | |
Insurance | | | 8.3 | | | | 36,493,814 | |
Pharmaceuticals | | | 8.2 | | | | 36,095,885 | |
Automobiles | | | 5.1 | | | | 22,497,903 | |
Media | | | 4.5 | | | | 19,894,901 | |
Wireless Telecommunication Services | | | 3.6 | | | | 15,887,622 | |
Industrial Conglomerates | | | 3.4 | | | | 15,088,058 | |
Chemicals | | | 3.2 | | | | 14,252,194 | |
Tobacco | | | 3.1 | | | | 13,700,977 | |
Food Products | | | 3.0 | | | | 13,303,795 | |
IT Services | | | 2.9 | | | | 12,685,742 | |
Food & Staples Retailing | | | 2.8 | | | | 12,312,818 | |
Machinery | | | 2.2 | | | | 9,926,468 | |
Beverages | | | 2.1 | | | | 9,142,512 | |
Paper & Forest Products | | | 2.0 | | | | 8,847,561 | |
Life Sciences Tools & Services | | | 2.0 | | | | 8,823,084 | |
Diversified Telecommunication Services | | | 1.9 | | | | 8,508,822 | |
Real Estate Management & Development | | | 1.9 | | | | 8,444,414 | |
Energy Equipment & Services | | | 1.8 | | | | 8,024,346 | |
Containers & Packaging | | | 1.7 | | | | 7,348,379 | |
Metals & Mining | | | 1.6 | | | | 7,063,865 | |
Electrical Equipment | | | 1.6 | | | | 6,884,897 | |
Textiles, Apparel & Luxury Goods | | | 1.5 | | | | 6,744,276 | |
Oil, Gas & Consumable Fuels | | | 1.5 | | | | 6,705,178 | |
Specialty Retail | | | 1.5 | | | | 6,621,880 | |
Electronic Equipment, Instruments & Components | | | 1.5 | | | | 6,576,323 | |
Biotechnology | | | 1.5 | | | | 6,544,661 | |
Personal Products | | | 1.4 | | | | 6,396,577 | |
Health Care Providers & Services | | | 1.4 | | | | 6,297,940 | |
Airlines | | | 1.4 | | | | 6,293,347 | |
Semiconductors & Semiconductor Equipment | | | 1.3 | | | | 5,676,695 | |
Professional Services | | | 1.1 | | | | 4,877,169 | |
Electric Utilities | | | 1.1 | | | | 4,676,107 | |
Trading Companies & Distributors | | | 1.1 | | | | 4,668,645 | |
Multi-Utilities | | | 1.0 | | | | 4,484,994 | |
Household Durables | | | 0.7 | | | | 2,990,194 | |
Auto Components | | | 0.5 | | | | 2,197,568 | |
Health Care Equipment & Supplies | | | 0.5 | | | | 2,189,748 | |
| | | | | | | | |
TOTAL COMMON STOCKS | | | 99.0 | % | | $ | 437,017,936 | |
| | |
REPURCHASE AGREEMENTS | | | 1.0 | | | | 4,196,979 | |
| | | | | | | | |
TOTAL INVESTMENTS | | | 100.0 | % | | $ | 441,214,915 | |
| | | | | | | | |
See Notes to Financial Statements.
THE GLENMEDE FUND, INC.
Notes to Financial Statements
1. Organization and Significant Accounting Policies
As of October 31, 2016, The Glenmede Fund, Inc. (the “Fund”) consists of seventeen portfolios: the Core Fixed Income Portfolio, the Strategic Equity Portfolio, the Small Cap Equity Portfolio, the Mid Cap Equity Portfolio, the Large Cap Value Portfolio, the U.S. Emerging Growth Portfolio, the Large Cap Core Portfolio, the Large Cap Growth Portfolio, the Long/Short Portfolio, the Total Market Portfolio, the High Yield Municipal Portfolio, the Responsible ESG U.S. Equity Portfolio, the Women in Leadership U.S. Equity Portfolio, the Short Term Tax Aware Fixed Income Portfolio, the Secured Options Portfolio, the International Secured Options Portfolio and the International Portfolio (each, a “Portfolio” and collectively, the “Portfolios”). The Fund was incorporated in the State of Maryland on June 30, 1988, and is registered with the Securities and Exchange Commission (the “SEC”) under the Investment Company Act of 1940, as amended (the “1940 Act”), as an open-end management investment company. Since January 2, 1998, the Small Cap Equity Portfolio has consisted of two classes of shares: the Advisor Class and the Institutional Class. The Mid Cap Equity Portfolio commenced operations on September 30, 2014. The Mid Cap Equity Portfolio consists of two classes of shares: the Advisor Class and the Institutional Class. As of October 31, 2016, Institutional Class shares of the Mid Cap Equity Portfolio have not been issued. Since June 30, 2015, the Large Cap Core Portfolio and the Large Cap Growth Portfolio have offered two classes of shares: the Advisor Class and the Institutional Class. The Institutional classes commenced operations on December 30, 2015 and November 5, 2015 respectively. Since July 14, 2016, the Secured Options Portfolio has offered two classes of shares: the Advisor Class and the Institutional Class. As of October 31, 2016, Institutional Class shares of the Secured Options Portfolio have not been issued.
The High Yield Municipal Portfolio, the Responsible ESG U.S. Equity Portfolio and the Women in Leadership U.S. Equity Portfolio commenced operations on December 22, 2015.
The Government Cash Portfolio and the Tax-Exempt Cash Portfolio were each liquidated on June 1, 2016. The Short Term Tax Aware Fixed Income Portfolio commenced operations on June 29, 2016.
The Fund is an investment company and follows accounting and reporting guidance in Financial Accounting Standards Board (“FASB”) Accounting Standards Codification Topic 946 (“ASC 946”). The preparation of financial statements in conformity with accounting principles generally accepted in the United States of America (“U.S.”), including but not limited to ASC 946, requires management to make estimates and assumptions that affect the reported amounts of assets and liabilities and disclosures of contingent assets and liabilities at the date of the financial statements and the reported amounts of revenues and expenses during the reporting period. Actual results could differ from those estimates. The following is a summary of significant accounting policies consistently followed by the Portfolios in the preparation of their financial statements.
Valuation of Securities: Equity securities and options listed on a U.S. securities exchange, including exchange traded funds (“ETFs”), for which market quotations are readily available are valued at the last quoted sale price as of the close of the exchange’s regular trading hours on the day the valuation is made. These securities are typically categorized as Level 1 in the fair value hierarchy. Price information on listed securities is taken from the exchange where the securities are primarily traded. Securities traded on the NASDAQ System are valued at the NASDAQ Official Closing Price (“NOCP”) and are typically categorized as Level 1 in the fair value hierarchy. Unlisted equity securities and listed securities not traded on the valuation date for which market quotations are readily available are valued at an amount that does not exceed the asked price and is not less than the bid price and are typically categorized as Level 2. If no sales are reported, exchange traded options are valued at the mean of the bid and ask price and are typically categorized as Level 2. Options traded over-the-counter are valued using prices supplied by dealers and are typically categorized as Level 2. Securities and options listed on a foreign exchange and unlisted foreign securities that are traded on the valuation date are valued at the last quoted sales price available before the time when assets are valued and are typically categorized as Level 1. Investments in open-end registered investment companies are valued at their respective net asset values as reported by such companies. These valuations are typically categorized as Level 1 in the fair value hierarchy.
Bonds and other fixed-income securities are valued at the most recent quoted bid price or, when exchange valuations are used, at the latest quoted sale price on the day of valuation. Such securities are typically categorized as Level 2 in the fair value hierarchy. In addition, bond and other fixed-income securities may be valued on the basis of prices provided by a pricing service or by using a matrix or formula. In such instances, when the Portfolio’s investment advisor believes such prices reflect the fair market value of such securities and are based on observable inputs, these securities are typically categorized as Level 2. Debt securities purchased with maturities of 60 days or less at the time of purchase are valued at amortized cost and are typically categorized as Level 2. Amortized cost valuation involves valuing an instrument at its cost initially and thereafter assuming a constant amortization to maturity of any discount or premium, regardless of the effect of fluctuating interest rates on the market value of the instrument.
When market quotations are not readily available or events occur that make established valuation methods unreliable, securities and other assets are valued in a manner that is intended to reflect their fair value as determined in accordance with procedures approved by the Board of Directors of the Fund (the “Board”) and are typically categorized as Level 3 in the fair value hierarchy. The fair value of securities is generally determined as the amount that a Portfolio could reasonably expect to realize from an orderly disposition of such securities over a reasonable period of time. By its nature, a fair value price is a good faith estimate of the value of a security at a given point in time and does not reflect an actual market price, which may be different by a material amount.
FASB ASC Topic 820, “Fair Value Measurements” (“ASC 820”) defines fair value, establishes a three-level hierarchy for measuring fair value and expands disclosure about fair value measurements. The valuation hierarchy is based
THE GLENMEDE FUND, INC.
Notes to Financial Statements — (Continued)
upon the transparency of inputs to the valuation of each Portfolio’s investments. Inputs refer broadly to the assumptions that market participants would use in pricing a security. Observable inputs are inputs that reflect the assumptions market participants would use in pricing the asset or liability based on market data obtained from sources independent of the reporting entity. Unobservable inputs are inputs that reflect the reporting entity’s own assumptions about the assumptions market participants would use in pricing the asset or liability based on the best information available in the circumstances. These inputs are summarized in the three levels listed below:
Level 1 — quoted prices in active markets for identical investments;
Level 2 — other significant observable inputs (including quoted prices for similar investments, interest rates, prepayment speeds, credit risk, adjusted quoted prices on foreign equity securities and others) or valuations based on quoted prices in markets that are not active; and
Level 3 — significant unobservable inputs (including the Fund’s own assumptions in determining the fair value of investments).
The inputs or methodology used for valuing securities are not necessarily an indication of the risks associated with investing in those securities.
Changes in valuation techniques may result in changing an investment’s assigned level within the hierarchy.
The Strategic Equity Portfolio, Small Cap Equity Portfolio, Mid Cap Equity Portfolio, Large Cap Value Portfolio, U.S. Emerging Growth Portfolio, Large Cap Core Portfolio, Large Cap Growth Portfolio, Long/Short Portfolio, Total Market Portfolio, Responsible ESG U.S. Equity Portfolio, Women in Leadership U.S. Equity Portfolio, International Secured Options Portfolio and International Portfolio had all investments with corresponding industries at Level 1 except repurchase agreements which were at Level 2, at October 31, 2016. The High Yield Municipal Portfolio had all long-term investments, with corresponding sectors at Level 2 at October 31, 2016.
The Portfolios did not recognize any level transfers as of the fiscal year ended October 31, 2016. Transfers into and out of a level are typically recognized at the end of the reporting period.
The following is a summary of the inputs used as of October 31, 2016 in valuing the assets and liabilities of the Core Fixed Income Portfolio, Short Term Tax Aware Fixed Income Portfolio and the Secured Options Portfolio:
Core Fixed Income Portfolio
ASSETS VALUATION INPUT
| | | | | | | | | | | | | | | | |
Description | | Quoted
Prices in
Active
Markets for
Identical
Assets
(Level 1) | | | Significant
Other
Observable
Inputs
(Level 2) | | | Significant
Unobservable
Inputs
(Level 3) | | | Total | |
Agency Notes | | | | | | | | | | | | | | | | |
Federal Home Loan Bank | | $ | — | | | $ | 24,747,582 | | | $ | — | | | $ | 24,747,582 | |
Federal Home Loan Mortgage Corporation | | | — | | | | 21,097,810 | | | | — | | | | 21,097,810 | |
Federal National Mortgage Association | | | — | | | | 25,251,505 | | | | — | | | | 25,251,505 | |
| | | | | | | | | | | | | | | | |
Total Agency Notes | | | — | | | | 71,096,897 | | | | — | | | | 71,096,897 | |
| | | | | | | | | | | | | | | | |
Mortgage-Backed Securities | | | | | | | | | | | | | | | | |
Federal Home Loan Mortgage Corporation | | | — | | | | 40,221,359 | | | | — | | | | 40,221,359 | |
Federal National Mortgage Association | | | — | | | | 82,728,426 | | | | — | | | | 82,728,426 | |
Government National Mortgage Association | | | — | | | | 3,018,917 | | | | — | | | | 3,018,917 | |
| | | | | | | | | | | | | | | | |
Total Mortgage-Backed Securities | | | — | | | | 125,968,702 | | | | — | | | | 125,968,702 | |
| | | | | | | | | | | | | | | | |
Corporate Notes | | | | | | | | | | | | | | | | |
Communications | | | — | | | | 20,667,451 | | | | — | | | | 20,667,451 | |
Computer Software & Processing | | | — | | | | 14,708,200 | | | | — | | | | 14,708,200 | |
Consumer, Cyclical | | | — | | | | 37,580,983 | | | | — | | | | 37,580,983 | |
Consumer, Non-Cyclical | | | — | | | | 35,810,443 | | | | — | | | | 35,810,443 | |
Financial | | | — | | | | 35,307,940 | | | | — | | | | 35,307,940 | |
Financial Services | | | — | | | | 6,416,784 | | | | — | | | | 6,416,784 | |
Industrial | | | — | | | | 23,310,587 | | | | — | | | | 23,310,587 | |
Pharmaceuticals | | | — | | | | 8,836,219 | | | | — | | | | 8,836,219 | |
Technology | | | — | | | | 8,520,944 | | | | — | | | | 8,520,944 | |
| | | | | | | | | | | | | | | | |
Total Corporate Notes | | | — | | | | 191,159,551 | | | | — | | | | 191,159,551 | |
| | | | | | | | | | | | | | | | |
THE GLENMEDE FUND, INC.
Notes to Financial Statements — (Continued)
| | | | | | | | | | | | | | | | |
Description | | Quoted
Prices in
Active
Markets for
Identical
Assets
(Level 1) | | | Significant
Other
Observable
Inputs
(Level 2) | | | Significant
Unobservable
Inputs
(Level 3) | | | Total | |
U.S. Treasury Notes/Bonds | | $ | — | | | $ | 81,625,346 | | | $ | — | | | $ | 81,625,346 | |
Municipal Bonds | | | — | | | | 6,110,981 | | | | — | | | | 6,110,981 | |
Repurchase Agreements | | | — | | | | 7,178,355 | | | | — | | | | 7,178,355 | |
Investment of Security Lending Collateral | | | 6,361,580 | | | | — | | | | — | | | | 6,361,580 | |
| | | | | | | | | | | | | | | | |
Total Investments | | | 6,361,580 | | | | 483,139,832 | | | | — | | | | 489,501,412 | |
| | | | | | | | | | | | | | | | |
Total | | $ | 6,361,580 | | | $ | 483,139,832 | | | $ | — | | | $ | 489,501,412 | |
| | | | | | | | | | | | | | | | |
Short Term Tax Aware Fixed Income Portfolio
ASSETS VALUATION INPUT
| | | | | | | | | | | | | | | | |
Description | | Quoted
Prices in
Active
Markets for
Identical
Assets
(Level 1) | | | Significant
Other
Observable
Inputs
(Level 2) | | | Significant
Unobservable
Inputs
(Level 3) | | | Total | |
Corporate Notes | | | | | | | | | | | | | | | | |
Automotive | | $ | — | | | $ | 773,629 | | | $ | — | | | $ | 773,629 | |
Electronics | | | — | | | | 356,380 | | | | — | | | | 356,380 | |
Financial | | | — | | | | 909,598 | | | | — | | | | 909,598 | |
Insurance | | | — | | | | 282,885 | | | | — | | | | 282,885 | |
Media — Broadcasting & Publishing | | | — | | | | 715,734 | | | | — | | | | 715,734 | |
Oil & Gas | | | — | | | | 569,847 | | | | — | | | | 569,847 | |
Retailers | | | — | | | | 263,500 | | | | — | | | | 263,500 | |
| | | | | | | | | | | | | | | | |
Total Corporate Notes | | | — | | | | 3,871,573 | | | | — | | | | 3,871,573 | |
| | | | | | | | | | | | | | | | |
Municipal Bonds | | | | | | | | | | | | | | | | |
Alabama | | | — | | | | 795,030 | | | | — | | | | 795,030 | |
Alaska | | | — | | | | 884,599 | | | | — | | | | 884,599 | |
California | | | — | | | | 500,000 | | | | — | | | | 500,000 | |
Colorado | | | — | | | | 747,741 | | | | — | | | | 747,741 | |
Delaware | | | — | | | | 223,565 | | | | — | | | | 223,565 | |
District Of Columbia | | | — | | | | 410,953 | | | | — | | | | 410,953 | |
Florida | | | — | | | | 1,096,506 | | | | — | | | | 1,096,506 | |
Georgia | | | — | | | | 635,786 | | | | — | | | | 635,786 | |
Illinois | | | — | | | | 2,705,819 | | | | — | | | | 2,705,819 | |
Iowa | | | — | | | | 590,000 | | | | — | | | | 590,000 | |
Kansas | | | — | | | | 443,959 | | | | — | | | | 443,959 | |
Kentucky | | | — | | | | 276,538 | | | | — | | | | 276,538 | |
Michigan | | | — | | | | 1,945,276 | | | | — | | | | 1,945,276 | |
Minnesota | | | — | | | | 629,160 | | | | — | | | | 629,160 | |
Mississippi | | | — | | | | 600,000 | | | | — | | | | 600,000 | |
Missouri | | | — | | | | 295,000 | | | | — | | | | 295,000 | |
Nebraska | | | — | | | | 201,052 | | | | — | | | | 201,052 | |
Nevada | | | — | | | | 398,646 | | | | — | | | | 398,646 | |
New Jersey | | | — | | | | 273,317 | | | | — | | | | 273,317 | |
New York | | | — | | | | 1,282,037 | | | | — | | | | 1,282,037 | |
North Carolina | | | — | | | | 1,146,350 | | | | — | | | | 1,146,350 | |
Ohio | | | — | | | | 1,284,728 | | | | — | | | | 1,284,728 | |
Pennsylvania | | | — | | | | 3,364,912 | | | | — | | | | 3,364,912 | |
South Carolina | | | — | | | | 201,418 | | | | — | | | | 201,418 | |
Tennessee | | | — | | | | 246,250 | | | | — | | | | 246,250 | |
Texas | | | — | | | | 2,873,642 | | | | — | | | | 2,873,642 | |
THE GLENMEDE FUND, INC.
Notes to Financial Statements — (Continued)
| | | | | | | | | | | | | | | | |
Description | | Quoted
Prices in
Active
Markets for
Identical
Assets
(Level 1) | | | Significant
Other
Observable
Inputs
(Level 2) | | | Significant
Unobservable
Inputs
(Level 3) | | | Total | |
Washington | | $ | — | | | $ | 1,040,881 | | | $ | — | | | $ | 1,040,881 | |
Wisconsin | | | — | | | | 1,084,772 | | | | — | | | | 1,084,772 | |
| | | | | | | | | | | | | | | | |
Total Municipal Bonds | | | — | | | | 26,177,937 | | | | — | | | | 26,177,937 | |
| | | | | | | | | | | | | | | | |
Registered Investment Companies | | | 1,290,121 | | | | — | | | | — | | | | 1,290,121 | |
| | | | | | | | | | | | | | | | |
Total Investments | | | 1,290,121 | | | | 30,049,510 | | | | — | | | | 31,339,631 | |
| | | | | | | | | | | | | | | | |
Total | | $ | 1,290,121 | | | $ | 30,049,510 | | | $ | — | | | $ | 31,339,631 | |
| | | | | | | | | | | | | | | | |
Secured Options Portfolio
ASSETS VALUATION INPUT
| | | | | | | | | | | | | | | | |
Description | | Quoted
Prices in
Active
Markets for
Identical
Assets
(Level 1) | | | Significant
Other
Observable
Inputs
(Level 2) | | | Significant
Unobservable
Inputs
(Level 3) | | | Total | |
Exchange-Traded Funds | | $ | 10,551,255 | | | $ | — | | | $ | — | | | $ | 10,551,255 | |
U.S. Treasury Bills | | | — | | | | 99,999,400 | | | | — | | | | 99,999,400 | |
Purchased Options | | | | | | | | | | | | | | | | |
CALLS | | | 229,343,750 | | | | — | | | | — | | | | 229,343,750 | |
PUTS | | | 180,164,250 | | | | — | | | | — | | | | 180,164,250 | |
| | | | | | | | | | | | | | | | |
Total Purchased Options | | | 409,508,000 | | | | — | | | | — | | | | 409,508,000 | |
| | | | | | | | | | | | | | | | |
Repurchase Agreements | | | — | | | | 41,080,677 | | | | — | | | | 41,080,677 | |
| | | | | | | | | | | | | | | | |
Total Investments | | | 420,059,255 | | | | 141,080,077 | | | | — | | | | 561,139,332 | |
| | | | | | | | | | | | | | | | |
Total | | $ | 420,059,255 | | | $ | 141,080,077 | | | $ | — | | | $ | 561,139,332 | |
| | | | | | | | | | | | | | | | |
LIABILITIES VALUATION INPUT
| | | | | | | | | | | | | | | | |
Description | | Quoted
Prices in
Active
Markets for
Identical
Assets
(Level 1) | | | Significant
Other
Observable
Inputs
(Level 2) | | | Significant
Unobservable
Inputs
(Level 3) | | | Total | |
Written Options | | | | | | | | | | | | | | | | |
CALLS | | $ | (5,125 | ) | | $ | — | | | $ | — | | | $ | (5,125 | ) |
PUTS | | | (9,080,950 | ) | | | — | | | | — | | | | (9,080,950 | ) |
| | | | | | | | | | | | | | | | |
Total Written Options | | | (9,086,075 | ) | | | — | | | | — | | | | (9,086,075 | ) |
| | | | | | | | | | | | | | | | |
Total | | $ | (9,086,075 | ) | | $ | — | | | $ | — | | | $ | (9,086,075 | ) |
| | | | | | | | | | | | | | | | |
Repurchase Agreements: Each Portfolio may engage in repurchase agreement transactions. Under the terms of a typical repurchase agreement, the applicable Portfolio takes possession of an underlying debt obligation subject to an obligation of the seller to repurchase, and the applicable Portfolio to resell the obligation at an agreed-upon price and time, thereby determining the yield during the Portfolio’s holding period. This arrangement results in a fixed rate of return that is not subject to market fluctuations during the Portfolio’s holding period. The seller’s obligation is secured by collateral (underlying securities) segregated on behalf of the Portfolio. The value of the collateral at the time of execution must be at least equal to 102% of the total amount of the repurchase obligations, including interest. In the event of counterparty default, the Portfolio has the right to sell the collateral to offset losses incurred. There is a potential for loss to the Portfolio in the event a Portfolio is delayed or prevented from exercising its rights to dispose of the collateral securities, including the risk of a possible decline in the value of the underlying securities during the period while the Portfolio seeks to assert its rights. The Portfolio’s investment advisor, acting under the supervision
THE GLENMEDE FUND, INC.
Notes to Financial Statements — (Continued)
of the Board, reviews the value of the collateral and the creditworthiness of those banks and dealers with which each Portfolio enters into repurchase agreements to evaluate potential risks.
Master Repurchase Agreements (“MRA”) permit a Portfolio, under certain circumstances, including an event of default (such as bankruptcy or insolvency), to offset payables and/or receivables under the MRA with collateral held and/or posted to the counterparty and create one single net payment due to or from the Portfolio. However, bankruptcy or insolvency laws of a particular jurisdiction may impose restrictions on or prohibitions against such a right of offset in the event of the MRA counterparty’s bankruptcy or insolvency. Pursuant to the terms of the MRA, the applicable Portfolio receives or posts securities as collateral with a market value in excess of the repurchase price to be paid or received by the Portfolio upon the maturity of the transaction. Upon a bankruptcy or insolvency of the MRA counterparty, the Portfolio would recognize a liability with respect to such excess collateral to reflect the Portfolio’s obligation under bankruptcy law to return the excess to the counterparty. The gross value and related collateral received for each Portfolio’s investments in repurchase agreements as of October 31, 2016 are presented in each Portfolio’s Schedule of Portfolio Investments and the value of these investments are also presented in the Statements of Assets and Liabilities.
Foreign Currency Translation: The books and records of each Portfolio are maintained in U.S. dollars. Foreign currencies, investments and other assets and liabilities are translated into U.S. dollars at the exchange rates prevailing at the end of the period, and purchases and sales of investment securities, income and expenses are translated at exchange rates prevailing on the dates of such transactions. Unrealized gains and losses that result from changes in foreign currency exchange rates have been included in the unrealized gains and losses on foreign currency translations. Net realized foreign currency gains and losses resulting from changes in exchange rates include foreign currency gains and losses between trade date and settlement date on investment securities transactions, foreign currency transactions and the difference between the amounts of interest and dividends recorded on the books of each Portfolio and the amount actually received. The portion of foreign currency gains and losses related to fluctuation in exchange rates between the purchase settlement date and subsequent sale trade date is included in realized gains and losses on investment transactions. The Portfolios do not isolate that portion of the results of operations resulting from changes in the foreign exchange rates on investments from the fluctuations in the market prices of securities held at the end of the period. Similarly, the Portfolios do not isolate the effect of changes in foreign exchange rates from the fluctuations in the market prices of portfolio securities sold during the period.
Foreign Securities: The Strategic Equity Portfolio, Small Cap Equity Portfolio, Mid Cap Equity Portfolio, Large Cap Value Portfolio, U.S. Emerging Growth Portfolio, Large Cap Core Portfolio, Large Cap Growth Portfolio, Long/Short Portfolio, Total Market Portfolio, Responsible ESG U.S. Equity Portfolio, Women in Leadership U.S. Equity Portfolio, Secured Options Portfolio, International Secured Options Portfolio and International Portfolio may invest in foreign securities. Investing in securities of foreign companies and foreign governments involves special risks and considerations not typically associated with investing in securities of U.S. companies and the U.S. government. These risks include valuation of currencies and future adverse political and economic developments. Moreover, securities of some foreign companies and foreign governments and their markets may be less liquid and their prices more volatile than those of securities of comparable U.S. companies and the U.S. government. This is particularly true with respect to emerging markets in developing countries.
Options Transactions: The Strategic Equity Portfolio, Large Cap Value Portfolio, Long/Short Portfolio, Secured Options Portfolio and International Secured Options Portfolio are subject to equity price risk and may purchase or write covered call options or secured put options to hedge against changes in the value of securities each Portfolio owns or expects to own. The Secured Options Portfolio and International Secured Options Portfolio use option strategies also in an effort to earn options premiums and to provide more stable returns. These options may relate to particular securities or securities indices and may or may not be listed on a domestic securities exchange or issued by the Options Clearing Corporation. A call option gives the option holder the right to purchase the underlying security at a specified price until a specified date. A put option gives the option holder the right to sell the underlying security at a specified price until a specified date. The risk in writing a call option is that the Portfolio may forgo the opportunity of profit if the market price of the underlying security increases and the option is exercised. The risk in writing a put option is that the Portfolio may incur a loss if the market price of the underlying security decreases and the option is exercised. In addition, there is a risk the Portfolio may not be able to enter into a closing transaction because of an illiquid secondary market or, for over-the-counter options, because of the counterparty’s inability to perform. Portfolio assets covering written options cannot be sold while the option is outstanding, unless replaced by similar assets. A Portfolio also risks losing all or part of the cash paid for purchasing call and put options. The Portfolios may also write over-the-counter options where completing the obligation depends upon the credit standing of the other party. The Strategic Equity Portfolio, Large Cap Value Portfolio and Long/Short Portfolio did not enter into any options transactions during the fiscal year ended October 31, 2016. During the fiscal year ended October 31, 2016, the Secured Options Portfolio and the International Secured Options Portfolio wrote put and call options and the Secured Options Portfolio purchased put and call options in an attempt to achieve their respective investment objective and strategies.
Written options are recorded in each Portfolio’s Statement of Assets and Liabilities as a liability to the extent of premiums received. Gains or losses are realized when the option transaction expires or closes. Cash collateral held by the Fund’s custodian and pledged to secure open written put option contracts are included in “Cash collateral on deposit at broker” in the Statement of Assets and Liabilities. If a written call option is exercised, the premium originally received is recorded as an addition to sales proceeds. If a written put option is exercised, the premium originally received is recorded as a reduction of cost. Realized gains and losses on purchased options, if any, are included with net realized gains and losses on investment transactions in each Portfolio’s Statement of Operations.
THE GLENMEDE FUND, INC.
Notes to Financial Statements — (Continued)
Information regarding transactions in written option contracts for the Secured Options Portfolio and the International Secured Options Portfolio for the fiscal year ended October 31, 2016 are included in Note 2.
Lending of Portfolio Securities: Each Portfolio, using State Street Bank and Trust Company (“State Street”) as its lending agent, may loan securities to qualified brokers and dealers in exchange for negotiated lenders’ fees. These fees are disclosed as “Income from security lending” in the Statement of Operations, net of expenses retained by State Street as compensation for its services as lending agent. Each applicable Portfolio receives cash collateral, which may be invested by the lending agent in short-term instruments, in an amount at least equal to 102% (for loans of U.S. securities) or 105% (for loans of non-U.S. securities) of the market value of the loaned securities at the inception of each loan. The market value of the loaned securities is determined at the close of business of the Fund and any additional required collateral is delivered to the applicable Portfolio on the next business day. On behalf of the Long/Short Portfolio and Total Market Portfolio, some or all of the cash collateral may be used to finance short sales. The cash collateral received for the Long/Short Portfolio was not used to finance short sales. As of October 31, 2016, the cash collateral received by the Core Fixed Income Portfolio, Strategic Equity Portfolio, Small Cap Equity Portfolio, Mid Cap Equity Portfolio, U.S. Emerging Growth Portfolio, Large Cap Core Portfolio and Long/Short Portfolio was invested in the State Street Navigator Securities Lending Government Money Market Portfolio, which is a 1940 Act money market fund. To the extent that advisory or other fees paid by the State Street Navigator Securities Lending Government Money Market Portfolio, are for the same or similar services as fees paid by the applicable Portfolio, there will be a layering of fees, which would increase expenses and decrease returns. Information regarding the value of the securities loaned and the value of the collateral at period end is included at the end of each applicable Portfolio’s Statement of Assets and Liabilities, Schedule of Portfolio Investments and Note 6. A Portfolio could experience a delay in recovering its securities and a possible loss of income or value if the borrower fails to return the securities when due. A Portfolio may also record realized gain or loss on securities deemed sold due to a borrower’s inability to return securities on loan. Such loans would involve risks of delay in receiving additional collateral in the event that the collateral decreased below the value of the securities loaned or risks of the loss of rights in the collateral should the borrower of the securities fail financially.
Real Estate Investment Trusts: The Portfolios may invest in real estate investment trusts (“REITs”), which pool investors’ funds for investment, primarily in income producing real estate or real estate-related loans or interests. A REIT is not taxed on income distributed to its shareholders or unitholders if it complies with regulatory requirements relating to its organization, ownership, assets and income, and with a regulatory requirement to distribute to its shareholders or unitholders at least 90% of its taxable income for each taxable year.
A shareholder in a Portfolio, by investing in REITs through the Portfolio, will bear not only the shareholder’s proportionate share of the expenses of the Portfolio, but also, indirectly, the management expenses of the underlying REITs. REITs depend generally on their ability to generate cash flow to make distributions to shareholders or unitholders, and may be subject to defaults by borrowers and to self-liquidations. In addition, the performance of a REIT may be affected by its failure to qualify for tax-free pass-through of income, or the REIT’s failure to maintain exemption from registration under the 1940 Act. Dividends representing a return of capital are reflected as a reduction of cost and/or as a realized gain when the amount of the return of capital is conclusively determined. See each Portfolio’s Schedule of Investments for REIT securities held as of October 31, 2016.
Securities Sold Short: The Long/Short Portfolio and Total Market Portfolio may engage in short sales, which are sales by the applicable Portfolio of securities which have been borrowed from a third party on the expectation that the market price will decline. If the price of the securities declines, the Portfolio will make a profit by purchasing the securities in the open market at a lower price than the one at which it sold the securities. If the price of the securities increases, the Portfolio may have to cover its short positions at a higher price than the short sale price, resulting in a loss. Gains are limited to the price at which the Portfolios sold the security short, while losses are potentially unlimited in size. Each Portfolio pledges securities and/or other assets, which may include cash collateral from securities lending activities, to the lender as collateral. Proceeds received from short sales may be maintained by the lender as collateral or may be released to the Portfolio and used to purchase additional securities or for any other purpose. The “Short position flex fees” on the Statement of Operations are fees charged by the lender for releasing the cash proceeds to the Total Market Portfolio. Each Portfolio is required to segregate an amount of cash, cash equivalents or other appropriate liquid marketable securities with the custodian in at least an amount equal to the current market value of the securities sold short (less any additional collateral held by the lender) and the amount of any securities lending cash collateral used to finance short sales until the Portfolio replaces a borrowed security. Depending on arrangements made with the lender or custodian, the Portfolio may not receive any payments (including interest) on the deposits made with the lender or custodian. The Portfolio is liable to the buyer for any dividends payable on securities while those securities are in a short position. These dividends are recorded as an expense of the Portfolio. As of October 31, 2016, the Long/Short Portfolio pledged cash in the amount of $161,256,352 to State Street, as collateral for short sales. This amount is included in the “Cash collateral on deposit at broker” on the Statement of Assets and Liabilities. The Total Market Portfolio also pledged securities in the amount of $20,827,113 to State Street, as collateral for short sales. In addition, State Street has a perfected security interest in each such Portfolio’s assets.
Investment Company Securities and Exchange-Traded Funds: Subject to applicable regulatory requirements, each Portfolio may invest in shares of other registered investment companies, including ETFs. Pursuant to orders issued by the SEC to certain ETFs and procedures approved by the Board, each Portfolio may seek to invest in certain ETFs beyond the statutory limitations, provided the Portfolio complies with certain conditions of the SEC orders and any applicable investment limitations. Some ETFs seek to track the performance of a particular market index. These indices include
THE GLENMEDE FUND, INC.
Notes to Financial Statements — (Continued)
both broad-market indices and more narrowly-based indices, including those relating to particular sectors, markets, regions, or industries. However, some ETFs have an actively managed investment objective. ETF shares and closed-end fund shares are traded like traditional equity securities on a national securities exchange or NASDAQ.
Fixed Income and Municipal Securities: The Core Fixed Income, High Yield Municipal and Short Term Tax Aware Fixed Income Portfolios invest in fixed income securities. The value of fixed income securities tends to fluctuate with changes in interest rates. Generally, their value will decrease when interest rates rise and increase when interest rates fall. Fixed income securities are also subject to the risk that an issuer will be unable to make principal and interest payments when due which could adversely impact a Portfolio’s return and net asset value. Changes in the credit rating of a debt security held by a Portfolio could have a similar effect. Fixed income securities with longer maturities are more susceptible to interest rate fluctuations than those with shorter maturities. Although in recent periods, governmental financial regulators, including the Federal Reserve, have taken steps to maintain historically low interest rates; the Federal Reserve recently raised interest rates slightly. It is possible that governmental action will be less effective in maintaining low interest rates or action will be taken to raise interest rates further.
The High Yield Municipal Portfolio invests primarily in municipal securities. The value of, payment of interest on, repayment of principal for, and the ability to sell a municipal security may be affected by constitutional amendments, legislation, executive orders, administrative regulations, voter initiatives and the economics of the regions in which the issuers are located. A credit rating downgrade, bond default, or bankruptcy involving an issuer within a particular state or territory could affect the market values and marketability of some or all of the municipal obligations of that state or territory. For example, significant economic and financial difficulties in Puerto Rico have led certain credit rating agencies to downgrade Puerto Rican general obligation debt and certain issuers below investment grade and to continue to have a negative outlook on certain Puerto Rican issuers. Such downgrades and continued financial difficulties could lead to lower prices and increased likelihood of restructurings or default of Puerto Rican bonds which could negatively impact the value of the High Yield Municipal Portfolio’s investments in such obligations. In addition, since many municipal securities are issued to finance similar projects, especially those relating to education, health care, transportation and utilities, conditions in those sectors can affect the overall municipal securities market and a Portfolio’s investments in municipal securities. There is some risk that a portion or all of the interest received from certain tax-free municipal securities could become taxable as a result of determinations by the Internal Revenue Service.
Securities Transactions and Investment Income: Securities transactions are recorded as of the trade date. Realized gains and losses on investments sold are computed on the basis of identified cost. Dividend income and distributions to shareholders are recorded on the ex-dividend date. Dividend income for foreign securities is recorded on the ex-dividend date except that certain dividends from foreign securities are recorded “net of withholding tax” as soon thereafter as a Portfolio is informed of the ex-dividend date. Interest income is recorded on the accrual basis and includes, when appropriate, amortization of premiums and accretion of discounts.
Securities purchased or sold on a when-issued or delayed-delivery basis may be settled after a period longer than the regular settlement time of trade date plus three business days. Interest income is accrued based on the terms of the security on settlement date. Each Portfolio segregates assets with a current value at least equal to the amount of its when-issued purchase commitments. When-issued purchase commitments involve a risk of loss if the value of the security to be purchased declines prior to settlement date, or if the counterparty does not perform under the contract.
Dividends and Distributions to Shareholders: Dividends from net investment income, if any, of the Core Fixed Income Portfolio, High Yield Municipal Portfolio and Short Term Tax Aware Fixed Income Portfolio are declared and paid monthly. Dividends from net investment income, if any, of the Strategic Equity Portfolio, Small Cap Equity Portfolio, Mid Cap Equity Portfolio, Large Cap Value Portfolio, U.S. Emerging Growth Portfolio, Large Cap Core Portfolio, Large Cap Growth Portfolio, Long/Short Portfolio, Total Market Portfolio, Secured Options Portfolio, International Secured Options Portfolio, Responsible ESG U.S. Equity Portfolio, Women in Leadership U.S. Equity Portfolio and International Portfolio are declared and paid quarterly. Each Portfolio distributes any net realized capital gains on an annual basis. Additional distributions of net investment income and capital gains for each Portfolio may be made at the discretion of the Board in order to avoid a nondeductible excise tax under Section 4982 of the Internal Revenue Code of 1986, as amended (the “Code”).
Income and capital gains distributions are determined in accordance with income tax regulations which may differ from accounting principles generally accepted in the U.S. These differences are primarily due to differing treatments of income and gains on various investment securities held by each Portfolio, timing differences and differing characterization of distributions made by each Portfolio.
Income and Expense Allocation: Expenses which are not readily identifiable to a specific Portfolio are allocated among Portfolios taking into consideration, among other things, the nature and type of expenses and the relative size of each Portfolio. Investment income, realized and unrealized gains and losses, and certain fund-level expenses are borne pro rata on the basis of relative net assets by the holders of all classes of shares, except that each class bears certain expenses unique to that class, such as shareholder servicing fees and certain other class-specific expenses. Differences in class-level expenses may result in payment of different per share dividends by class.
Federal Income Taxes: Each Portfolio intends to continue to qualify as a regulated investment company by complying with the requirements of the Code applicable to regulated investment companies, and by distributing substantially all of its taxable income to its shareholders. Therefore, no federal income tax provision is required. Income distributions and capital gain distributions are determined in accordance with income tax regulations which may differ from accounting principles generally accepted in the U.S.
THE GLENMEDE FUND, INC.
Notes to Financial Statements — (Continued)
“Accounting for Uncertainty in Income Taxes — an interpretation of FASB ASC 740” (“ASC 740”) clarifies the accounting for uncertainty in income taxes recognized in accordance with ASC 740, “Accounting for Income Taxes.” This interpretation prescribes a recognition threshold and measurement attribute for the financial statement recognition and measurement of a tax position taken or expected to be taken in a tax return. It also provides guidance on de-recognition, classification, interest and penalties, accounting in interim periods, disclosure and transition. Each Portfolio’s federal tax returns filed in the 3-year period ended October 31, 2016 remain subject to examination by the Internal Revenue Service.
On October, 31, 2016, the tax year end of the Fund, the following Portfolios had available capital loss carryforwards to be utilized in future periods to offset future capital gains through the indicated expiration dates as follows:
| | | | | | | | | | | | |
| | | Expiring October 31, | |
Portfolio | | 2017 | | | Unlimited
(Short Term) | | | Unlimited
(Long Term) | |
Mid Cap Equity Portfolio | | $ | — | | | $ | 1,823,443 | | | $ | 674,188 | |
U.S. Emerging Growth Portfolio | | | — | | | | 437,551 | | | | — | |
Large Cap Core Portfolio | | | — | | | | 754,093 | | | | — | |
Large Cap Growth Portfolio | | | — | | | | 20,080,310 | | | | — | |
Long/Short Portfolio | | | 5,227,189 | | | | 11,651,857 | | | | — | |
Total Market Portfolio | | | — | | | | 694,562 | | | | — | |
Responsible ESG U.S. Equity Portfolio | | | — | | | | 28,756 | | | | — | |
Women in Leadership U.S. Equity Portfolio | | | — | | | | 1,629 | | | | — | |
International Secured Options Portfolio | | | — | | | | 5,107,951 | | | | 2,493,221 | |
International Portfolio | | | 55,170,197 | | | | 23,820,545 | | | | 2,164,596 | |
During the fiscal year ended October 31, 2016, as permitted under federal income tax regulations, the Long/Short Portfolio elected to defer $767,721 of late year ordinary losses.
During the fiscal year ended October 31, 2016, the following Portfolios utilized capital loss carryforwards:
| | | | |
Total Market Portfolio | | $ | 46,172 | |
On December 22, 2010, the Regulated Investment Company Modernization Act of 2010 (the “Act”) was enacted. The Act modernized several of the federal income and excise tax provisions related to regulated investment companies, and, with certain exceptions, was effective for taxable years beginning after December 22, 2010. Among the changes made were changes to the capital loss carryforward rules allowing for capital losses to be carried forward indefinitely. Rules in effect prior to the effective date of the Act limited the carryforward period to eight years. Capital loss carryforwards generated in taxable years beginning after the effective date of the Act must be fully used before capital loss carryforwards generated in taxable years prior to effective date of the Act; therefore, under certain circumstances, capital loss carryforwards available as of the report date, if any, may expire unused. During the fiscal year ended October 31, 2016, $404,939 of the Long/Short Portfolio’s carryforward losses expired.
As of October 31, 2016, the tax year end of the Fund, the components of distributable earnings on a tax basis were as follows:
| | | | | | | | | | | | | | | | | | | | | | | | |
Portfolio | | Undistributed
Tax-exempt
Income | | | Undistributed
Ordinary
Income | | | Undistributed
Long-Term
Gain | | | Unrealized
Appreciation/
(Depreciation) | | | Loss
Carryforwards | | | Total
Distributable
Earnings | |
Core Fixed Income Portfolio | | $ | — | | | $ | 771,361 | | | $ | 3,221,282 | | | $ | 9,463,620 | | | $ | — | | | $ | 13,456,263 | |
Strategic Equity Portfolio | | | — | | | | 718,241 | | | | 11,060,511 | | | | 48,911,831 | | | | — | | | | 60,690,583 | |
Small Cap Equity Portfolio | | | — | | | | 401,702 | | | | 52,089,649 | | | | 143,889,344 | | | | — | | | | 196,380,695 | |
Mid Cap Equity Portfolio | | | — | | | | 11,382 | | | | — | | | | 758,655 | | | | (2,497,631 | ) | | | (1,727,594 | ) |
Large Cap Value Portfolio | | | — | | | | 197,031 | | | | 5,416,621 | | | | 4,475,976 | | | | — | | | | 10,089,628 | |
U.S. Emerging Growth Portfolio | | | — | | | | 11,278 | | | | — | | | | 7,680,022 | | | | (437,551 | ) | | | 7,253,749 | |
Large Cap Core Portfolio | | | — | | | | 1,568,955 | | | | — | | | | 208,685,188 | | | | (754,093 | ) | | | 209,500,050 | |
Large Cap Growth Portfolio | | | — | | | | 917,908 | | | | — | | | | 200,189,342 | | | | (20,080,310 | ) | | | 181,026,940 | |
Long/Short Portfolio | | | — | | | | — | | | | — | | | | 25,643,493 | | | | (17,646,767 | ) | | | 7,996,726 | |
Total Market Portfolio | | | — | | | | 35,364 | | | | — | | | | 13,322,890 | | | | (694,562 | ) | | | 12,663,692 | |
High Yield Municipal Portfolio | | | 307,166 | | | | 604,722 | | | | — | | | | 1,293,617 | | | | — | | | | 2,205,505 | |
Responsible ESG U.S. Equity Portfolio | | | — | | | | 4,238 | | | | — | | | | 381,705 | | | | (28,756 | ) | | | 357,187 | |
Women in Leadership U.S. Equity Portfolio | | | — | | | | 8,760 | | | | — | | | | 228,348 | | | | (1,629 | ) | | | 235,479 | |
Short Term Tax Aware Fixed Income Portfolio | | | — | | | | 12,343 | | | | — | | | | (88,936 | ) | | | — | | | | (76,593 | ) |
Secured Options Portfolio | | | — | | | | 9,161,549 | | | | 19,218,875 | | | | 4,121,435 | | | | — | | | | 32,501,859 | |
THE GLENMEDE FUND, INC.
Notes to Financial Statements — (Continued)
| | | | | | | | | | | | | | | | | | | | | | | | |
Portfolio | | Undistributed
Tax-exempt
Income | | | Undistributed
Ordinary
Income | | | Undistributed
Long-Term
Gain | | | Unrealized
Appreciation/
(Depreciation) | | | Loss
Carryforwards | | | Total
Distributable
Earnings | |
International Secured Options Portfolio | | $ | — | | | $ | 32,162 | | | $ | — | | | $ | 433,261 | | | $ | (7,601,172 | ) | | $ | (7,135,749 | ) |
International Portfolio | | | — | | | | 67,077 | | | | — | | | | 12,969,931 | | | | (81,155,338 | ) | | | (68,118,330 | ) |
The difference between book-basis and tax-basis unrealized appreciation (depreciation) is attributable primarily to the tax deferral of losses on wash sales, nontaxable dividends received from investments and the realization for tax purposes of unrealized gains on investments in passive foreign investment companies.
The tax character of distributions paid during the fiscal year ended October 31, 2016, was as follows:
| | | | | | | | | | | | | | | | |
Portfolio | | Tax
Exempt | | | Ordinary
Income | | | Long-Term
Gains | | | Return of
Capital | |
Core Fixed Income Portfolio | | $ | — | | | $ | 9,014,871 | | | $ | 2,439,232 | | | $ | — | |
Strategic Equity Portfolio | | | — | | | | 1,610,968 | | | | 13,155,192 | | | | — | |
Small Cap Equity Portfolio | | | — | | | | 5,296,109 | | | | 22,541,619 | | | | — | |
Mid Cap Equity Portfolio | | | — | | | | 241,341 | | | | 162,727 | | | | — | |
Large Cap Value Portfolio | | | — | | | | 1,175,176 | | | | 8,691,151 | | | | — | |
U.S. Emerging Growth Portfolio | | | — | | | | 153,913 | | | | 315,331 | | | | — | |
Large Cap Core Portfolio | | | — | | | | 23,026,609 | | | | 17,871,085 | | | | — | |
Large Cap Growth Portfolio | | | — | | | | 14,837,214 | | | | — | | | | — | |
Total Market Portfolio | | | — | | | | 408,601 | | | | — | | | | — | |
High Yield Municipal Portfolio | | | 1,704,157 | | | | 66,817 | | | | — | | | | — | |
Responsible ESG U.S. Equity Portfolio | | | — | | | | 20,176 | | | | — | | | | — | |
Women in Leadership U.S. Equity Portfolio | | | — | | | | 32,425 | | | | — | | | | — | |
Short Term Tax Aware Fixed Income Portfolio | | | 8,785 | | | | 13,286 | | | | — | | | | — | |
Secured Options Portfolio | | | — | | | | 7,351,656 | | | | 15,273,542 | | | | — | |
International Secured Options Portfolio | | | — | | | | 711,091 | | | | — | | | | — | |
International Portfolio | | | — | | | | 7,301,630 | | | | — | | | | — | |
The tax character of distributions paid during the fiscal year ended October 31, 2015, was as follows:
| | | | | | | | | | | | | | | | |
Portfolio | | Tax
Exempt | | | Ordinary
Income | | | Long-Term
Gains | | | Return of
Capital | |
Core Fixed Income Portfolio | | $ | — | | | $ | 9,615,897 | | | $ | — | | | $ | — | |
Strategic Equity Portfolio | | | — | | | | 2,457,254 | | | | 20,744,154 | | | | — | |
Small Cap Equity Portfolio | | | — | | | | 1,508,054 | | | | 66,333,016 | | | | — | |
Mid Cap Equity Portfolio | | | — | | | | 61,611 | | | | — | | | | — | |
Large Cap Value Portfolio | | | — | | | | 5,801,544 | | | | 8,157,981 | | | | — | |
U.S. Emerging Growth Portfolio | | | — | | | | 79,896 | | | | 3,631,479 | | | | — | |
Large Cap Core Portfolio | | | — | | | | 11,254,628 | | | | 23,130,256 | | | | — | |
Large Cap Growth Portfolio | | | — | | | | 8,103,928 | | | | 19,346,866 | | | | — | |
Total Market Portfolio | | | — | | | | 496,452 | | | | 3,725,638 | | | | — | |
Secured Options Portfolio | | | — | | | | 5,883,448 | | | | 12,955,179 | | | | — | |
International Secured Options Portfolio | | | — | | | | 3,033,529 | | | | — | | | | — | |
International Portfolio | | | — | | | | 907,264 | | | | — | | | | — | |
For the fiscal year ended October 31, 2016, permanent differences between financial and tax reporting related primarily to paydowns, REITs, foreign currency gain/(loss), distribution reallocations, non-deductible blue sky expenses and excise taxes paid, dividend expense reclass for short positions, capital loss carryover expired, net operating losses, nontaxable dividends received from investments and the realization for tax purposes of unrealized gains on investments in passive foreign investment companies were identified and reclassified among the components of the Portfolio’s net assets as identified below. These reclassifications had no effect on net assets.
| | | | | | | | | | | | |
Portfolio | | Accumulated Net
Investment Income | | | Net Realized
Gain (Loss) | | | Paid-In
Capital | |
Core Fixed Income Portfolio | | $ | 744,449 | | | $ | (744,449 | ) | | $ | — | |
Strategic Equity Portfolio | | | (24,099 | ) | | | 24,099 | | | | — | |
Small Cap Equity Portfolio | | | 507,476 | | | | (507,476 | ) | | | — | |
Mid Cap Equity Portfolio | | | (6,428 | ) | | | 6,428 | | | | — | |
Large Cap Value Portfolio | | | (4,909 | ) | | | 4,909 | | | | — | |
THE GLENMEDE FUND, INC.
Notes to Financial Statements — (Continued)
| | | | | | | | | | | | |
Portfolio | | Accumulated Net
Investment Income | | | Net Realized
Gain (Loss) | | | Paid-In
Capital | |
U.S. Emerging Growth Portfolio | | $ | (4,303 | ) | | $ | 4,303 | | | $ | — | |
Large Cap Core Portfolio | | | (106,740 | ) | | | 106,740 | | | | — | |
Large Cap Growth Portfolio | | | (195,448 | ) | | | 195,448 | | | | — | |
Long/Short Portfolio | | | 1,280,096 | | | | 340,132 | | | | (1,620,228 | ) |
Total Market Portfolio | | | (12,914 | ) | | | 12,914 | | | | — | |
High Yield Municipal Portfolio | | | 769 | | | | 6,739 | | | | (7,508 | ) |
Responsible ESG U.S. Equity Portfolio | | | (1,175 | ) | | | 1,955 | | | | (780 | ) |
Women in Leadership U.S. Equity Portfolio | | | 757 | | | | 29 | | | | (786 | ) |
Short Term Tax Aware Fixed Income Portfolio | | | 7 | | | | — | | | | (7 | ) |
Secured Options Portfolio | | | 3,475,490 | | | | (3,475,490 | ) | | | — | |
International Secured Options Portfolio | | | 8,295 | | | | (4,045 | ) | | | (4,250 | ) |
International Portfolio | | | (3,457 | ) | | | 3,457 | | | | — | |
As of October 31, 2016, aggregate gross unrealized appreciation for all securities in which there was an excess of value over tax cost and aggregate gross unrealized depreciation for all securities in which there was an excess of tax cost over value were as follows:
| | | | | | | | | | | | |
Portfolio | | Appreciation | | | (Depreciation) | | | Net | |
Core Fixed Income Portfolio | | $ | 10,737,029 | | | $ | 1,273,409 | | | $ | 9,463,620 | |
Strategic Equity Portfolio | | | 50,820,334 | | | | 1,908,503 | | | | 48,911,831 | |
Small Cap Equity Portfolio | | | 281,656,321 | | | | 137,766,977 | | | | 143,889,344 | |
Mid Cap Equity Portfolio | | | 1,451,692 | | | | 693,037 | | | | 758,655 | |
Large Cap Value Portfolio | | | 5,582,033 | | | | 1,106,057 | | | | 4,475,976 | |
U.S. Emerging Growth Portfolio | | | 9,010,767 | | | | 1,330,745 | | | | 7,680,022 | |
Large Cap Core Portfolio | | | 236,119,448 | | | | 27,434,260 | | | | 208,685,188 | |
Large Cap Growth Portfolio | | | 261,449,702 | | | | 61,260,360 | | | | 200,189,342 | |
Long/Short Portfolio | | | 39,104,692 | | | | 13,461,199 | | | | 25,643,493 | |
Total Market Portfolio | | | 15,222,783 | | | | 1,899,893 | | | | 13,322,890 | |
High Yield Municipal Portfolio | | | 2,420,316 | | | | 1,126,699 | | | | 1,293,617 | |
Responsible ESG U.S. Equity Portfolio | | | 507,695 | | | | 125,990 | | | | 381,705 | |
Women in Leadership U.S. Equity Portfolio | | | 396,914 | | | | 168,566 | | | | 228,348 | |
Short Term Tax Aware Fixed Income Portfolio | | | 12,781 | | | | 101,717 | | | | (88,936 | ) |
Secured Options Portfolio | | | 6,282,135 | | | | 1,898,300 | | | | 4,383,835 | |
International Secured Options Portfolio | | | 1,538,576 | | | | 1,196,166 | | | | 342,410 | |
International Portfolio | | | 27,771,308 | | | | 14,801,116 | | | | 12,970,192 | |
Other: In the normal course of business, the Fund enters into contracts that may include agreements to indemnify another party under given circumstances. The Fund’s maximum exposure under these arrangements is unknown as this would involve future claims that may be, but have not yet been, made against the Fund. However, based on experience, the risk of material loss from such claims is considered to be remote.
2. Financial Instruments and Hedging Activities
Transactions in written option contracts for the Secured Options Portfolio and the International Secured Options Portfolio for the fiscal year ended October 31, 2016, are as follows:
Secured Options Portfolio
| | | | | | | | |
| | | Number of
Contracts | | | Premiums
Received | |
Options outstanding at October 31, 2015 | | | 1,757 | | | $ | 6,436,796 | |
Options written | | | 43,891 | | | | 108,867,297 | |
Options terminated in closing purchase transactions | | | (14,315 | ) | | | (69,270,555 | ) |
Options expired | | | (24,673 | ) | | | (37,922,023 | ) |
| | | | | | | | |
Options outstanding at October 31, 2016 | | | 6,660 | | | $ | 8,111,515 | |
THE GLENMEDE FUND, INC.
Notes to Financial Statements — (Continued)
International Secured Options Portfolio
| | | | | | | | |
| | | Number of
Contracts | | | Premiums
Received | |
Options outstanding at October 31, 2015 | | | 12,472 | | | $ | 1,085,370 | |
Options written | | | 57,961 | | | | 3,706,289 | |
Options terminated in closing purchase transactions | | | (20,962 | ) | | | (1,935,379 | ) |
Options exercised | | | (2,123 | ) | | | (213,830 | ) |
Options expired | | | (42,978 | ) | | | (2,450,069 | ) |
| | | | | | | | |
Options outstanding at October 31, 2016 | | | 4,370 | | | $ | 192,381 | |
Disclosures about Derivative Instruments and Hedging Activities: Each Portfolio follows FASB ASC Topic 815 “Disclosures about Derivative Instruments and Hedging Activities” (“ASC 815”). ASC 815 requires enhanced disclosures about each Portfolio’s use of, and accounting for, derivative instruments and the effect on the results of each Portfolio’s operations and financial position. At October 31, 2016 and during the period then ended, the Secured Options Portfolio and the International Secured Options Portfolio had the following derivatives and transactions in derivatives, grouped into appropriate risk categories, none of which have been designated as hedging instruments:
Secured Options Portfolio
Asset Derivatives
| | | | | | | | |
| | | Equity
Contracts Risk | | | Total | |
Options Purchased1 | | $ | 409,508,000 | | | $ | 409,508,000 | |
| | | | | | | | |
Total Value | | $ | 409,508,000 | | | $ | 409,508,000 | |
| | | | | | | | |
Liability Derivatives
| | | | | | | | |
| | | Equity
Contracts
Risk | | | Total | |
Options Written2 | | $ | (9,086,075 | ) | | $ | (9,086,075 | ) |
| | | | | | | | |
Total Value | | $ | (9,086,075 | ) | | $ | (9,086,075 | ) |
| | | | | | | | |
Realized Gain (Loss)
| | | | | | | | |
| | | Equity
Contracts
Risk | | | Total | |
Options Purchased3 | | $ | (1,935,298 | ) | | $ | (1,935,298 | ) |
Options Written4 | | | 37,986,859 | | | | 37,986,859 | |
| | | | | | | | |
Total Realized Gain (Loss) | | $ | 36,051,561 | | | $ | 36,051,561 | |
| | | | | | | | |
Change in Appreciation (Depreciation)
| | | | | | | | |
| | | Equity
Contracts
Risk | | | Total | |
Options Purchased5 | | $ | 262,400 | | | $ | 262,400 | |
Options Written6 | | | (974,560 | ) | | | (974,560 | ) |
| | | | | | | | |
Total Change in Appreciation (Depreciation) | | $ | (712,160 | ) | | $ | (712,160 | ) |
| | | | | | | | |
Number of Contracts, Notional Amounts or Shares/Units7
| | | | | | | | |
| | | Equity
Contracts
Risk | | | Total | |
Options Purchased | | | 403,333 | | | | 403,333 | |
Options Written | | | (540,792 | ) | | | (540,792 | ) |
THE GLENMEDE FUND, INC.
Notes to Financial Statements — (Continued)
International Secured Options Portfolio
Liability Derivatives
| | | | | | | | |
| | | Equity
Contracts
Risk | | | Total | |
Options Written2 | | $ | (101,530 | ) | | $ | (101,530 | ) |
| | | | | | | | |
Total Value | | $ | (101,530 | ) | | $ | (101,530 | ) |
| | | | | | | | |
Realized Gain (Loss)
| | | | | | | | |
| | | Equity
Contracts
Risk | | | Total | |
Options Written4 | | $ | 1,313,495 | | | $ | 1,313,495 | |
| | | | | | | | |
Total Realized Gain (Loss) | | $ | 1,313,495 | | | $ | 1,313,495 | |
| | | | | | | | |
Change in Appreciation (Depreciation)
| | | | | | | | |
| | | Equity
Contracts
Risk | | | Total | |
Options Written6 | | $ | 90,851 | | | $ | 90,851 | |
| | | | | | | | |
Total Change in Appreciation (Depreciation) | | $ | 90,851 | | | $ | 90,851 | |
| | | | | | | | |
Number of Contracts, Notional Amounts or Shares/Units7
| | | | | | | | |
| | | Equity
Contracts
Risk | | | Total | |
Options Written | | | (520,175 | ) | | | (520,175 | ) |
| | Additional disclosure about the Secured Options Portfolio’s and International Secured Options Portfolio’s use of options is provided in Note 1 under the heading ‘Options Transactions‘. |
| 1 | Statement of Assets and Liabilities location: Investments at value. |
| 2 | Statement of Assets and Liabilities location: Options written, at value. |
| 3 | Statement of Operations location: Amount is included in Net realized gain (loss) on Investments. |
| 4 | Statement of Operations location: Amount is included in Net realized gain (loss) on Options written. |
| 5 | Statement of Operations location: Amount is included in Net change in unrealized gain (loss) of Investments. |
| 6 | Statement of Operations location: Amount is included in Net change in unrealized gain (loss) of Options written. |
| 7 | Amounts disclosed represents average number of contracts, notional amounts, or shares/units outstanding during the period ended October 31, 2016. |
3. Investment Advisory Fee, Administration Fee and Other Related Party Transactions
Glenmede Investment Management LP (the “Advisor”), a wholly-owned subsidiary of The Glenmede Trust Company, N.A. (“Glenmede Trust”), serves as investment advisor to the Strategic Equity Portfolio, Large Cap Value Portfolio, International Portfolio, Core Fixed Income Portfolio, Small Cap Equity Portfolio, Mid Cap Equity Portfolio, U.S. Emerging Growth Portfolio, Large Cap Core Portfolio, Large Cap Growth Portfolio, Long/Short Portfolio, Short Term Tax Aware Fixed Income Portfolio, Total Market Portfolio, High Yield Municipal Portfolio, Responsible ESG U.S. Equity Portfolio, Women in Leadership U.S. Equity Portfolio, Secured Options Portfolio and International Secured Options Portfolio pursuant to investment management agreements with the Fund. Under these agreements, the Advisor manages the Portfolios, subject to the general supervision of the Board.
Capital Guardian Trust Company (“CGTC”) serves as sub-advisor to the High Yield Municipal Portfolio. CGTC is a wholly-owned subsidiary of Capital Group International, Inc., which is owned by Capital Research and Management Company, a wholly-owned subsidiary of The Capital Group Companies, Inc. The Advisor has agreed to pay CGTC a fee for its sub-investment advisory services to the High Yield Municipal Portfolio, calculated daily and payable monthly, at the annual rate of the High Yield Municipal Portfolio’s average daily net assets as follows: 0.38% of the first $300,000,000 of the net assets; 0.34% of the net assets between $300,000,000 and $1 billion; and 0.30% of the net assets in excess of $1 billion.
THE GLENMEDE FUND, INC.
Notes to Financial Statements — (Continued)
Under the investment management agreements, the Portfolios pay the Advisor a management fee on a monthly basis in an amount equal to the following annual rates of the average daily net assets of each Portfolio:
| | | | |
Fund Name | | Management Fee
on Net Assets* | |
Core Fixed Income Portfolio | | | 0.35 | % |
Strategic Equity Portfolio | | | 0.55 | % |
Small Cap Equity Portfolio | | | 0.55 | % |
Mid Cap Equity Portfolio | | | 0.55 | %* |
Large Cap Value Portfolio | | | 0.55 | % |
U.S. Emerging Growth Portfolio | | | 0.55 | % |
Large Cap Core Portfolio | | | 0.55 | % |
Large Cap Growth Portfolio | | | 0.55 | % |
Long/Short Portfolio | | | 1.20 | %** |
Total Market Portfolio | | | 1.20 | %** |
High Yield Municipal Portfolio | | | 0.65 | %* |
Responsible ESG U.S. Equity Portfolio | | | 0.55 | %* |
Women in Leadership U.S. Equity Portfolio | | | 0.55 | %* |
Short Term Tax Aware Fixed Income Portfolio | | | 0.35 | %*** |
Secured Options Portfolio | | | 0.55 | %**** |
International Secured Options Portfolio | | | 0.55 | % |
International Portfolio | | | 0.75 | %* |
* The Advisor has contractually agreed to waive a portion of its management fees and/or reimburse expenses to the extent that the Mid Cap Equity Portfolio’s Advisor Class, High Yield Municipal Portfolio’s, Responsible ESG U.S. Equity Portfolio’s, Women in Leadership U.S. Equity Portfolio’s and, since February 26, 2016, the International Portfolio’s annual total operating expenses exceed 1.00% of such Portfolio’s average daily net assets (excluding Acquired Fund fees and expenses, brokerage commissions, extraordinary items, interest and taxes). The Advisor has contractually agreed to these waivers and/or reimbursements until at least February 28, 2017 which are included, if any, under the caption “Less expenses waived/reimbursed” in the Statement of Operations. Shareholders of the Portfolios will be notified if these waivers/reimbursements are discontinued after that date.
** The Advisor has contractually agreed to waive a portion of its management fees so that, after giving effect to such contractual waiver, the management fee for each Portfolio is 0.85% of such Portfolio’s average daily net assets. The Advisor has also contractually agreed to waive an additional portion of its management fees and/or reimburse the Portfolios to the extent that total annual Portfolio operating expenses, as a percentage of the Portfolio’s daily average net assets, exceed 1.25% (excluding Acquired Fund fees and expenses, short-sale dividend expense, prime broker interest expense, brokerage commissions, taxes, interest and extraordinary items). The Advisor has contractually agreed to these waivers and/or reimbursements until at least February 28, 2017, which are included under the caption “Less expenses waived/ reimbursed” in the Statement of Operations. Shareholders of the Portfolios will be notified if the waivers/reimbursements are discontinued after that date.
*** The Advisor has contractually agreed to waive its fees and/or reimburse expenses to the extent that the Short Term Tax Aware Fixed Income Portfolio’s annual total operating expenses exceed 0.55% of the Portfolio’s average daily net assets (excluding Acquired Fund fees and expenses, brokerage commissions, extraordinary items, interest and taxes). The Advisor has contractually agreed to these waivers and/or reimbursements until at least June 30, 2017, which are included, if any, under the caption “Less expenses waived/reimbursed” in the Statement of Operations. Shareholders of the Portfolios will be notified if these waivers and/or reimbursements are discontinued after that date.
**** The Advisor contractually agreed to waive a portion of its management fees and/or reimburse expenses to the extent that the International Secured Options Portfolio’s annual total operating expenses exceeded 1.00% of such Portfolio’s average daily net assets (excluding Acquired Fund fees and expenses, brokerage commissions, extraordinary items, interest and taxes) through February 28, 2015, which are included under the caption “Ratio of operating expenses after waiver/reimbursement to average net assets” in the Financial Highlights. These waivers/reimbursements were discontinued because the International Secured Options Portfolio’s expenses had been consistently below the expense cap for over one year.
Under a Shareholder Servicing Agreement, the following Portfolios pay Glenmede Trust shareholder servicing fees for providing or arranging to provide shareholder support services to the beneficial owner of the Portfolios and share classes listed below:
| | | | |
| | | Shareholder Servicing Fee
on Net Assets | |
Core Fixed Income Portfolio | | | 0.10 | % |
Strategic Equity Portfolio | | | 0.20 | % |
Small Cap Equity Portfolio (Advisor Class) | | | 0.25 | % |
THE GLENMEDE FUND, INC.
Notes to Financial Statements — (Continued)
| | | | |
| | | Shareholder Servicing Fee
on Net Assets | |
Small Cap Equity Portfolio (Institutional Class) | | | 0.05 | % |
Mid Cap Equity Portfolio (Advisor Class) | | | 0.25 | % |
Large Cap Value Portfolio | | | 0.20 | % |
U.S. Emerging Growth Portfolio | | | 0.25 | % |
Large Cap Core Portfolio (Advisor Class) | | | 0.20 | % |
Large Cap Growth (Advisor Class) | | | 0.20 | % |
Long/Short Portfolio | | | 0.20 | % |
Total Market Portfolio | | | 0.20 | % |
High Yield Municipal Portfolio | | | 0.25 | % |
Responsible ESG U.S. Equity Portfolio | | | 0.20 | % |
Women in Leadership U.S. Equity Portfolio | | | 0.20 | % |
Short Term Tax Aware Fixed Income Portfolio | | | 0.10 | % |
Secured Options Portfolio (Advisor Class) | | | 0.20 | % |
International Secured Options Portfolio | | | 0.20 | % |
International Portfolio | | | 0.25 | % |
State Street serves as administrator, transfer agent, dividend-paying agent and custodian with respect to the Fund. The Fund pays State Street a fee based on the combined aggregate average daily net assets of the Portfolios and The Glenmede Portfolios, an affiliated registered investment company, plus transaction charges for certain transactions and out-of-pocket expenses. The fee is computed daily and paid monthly.
Foreside Fund Officer Services, LLC (formerly known as Foreside Compliance Services, LLC) is paid an annual fee plus out-of-pocket expenses for the provision of personnel and services related to the Fund’s compliance program. The Fund’s Chief Compliance Officer is Managing Director of Foreside Fund Officer Services, LLC.
Quasar Distributors, LLC (“Quasar”) serves as distributor of each Portfolio’s shares. The distributor receives no fees from the Fund in connection with distribution services provided to the Fund. The Advisor pays Quasar’s fees and out-of-pocket expenses for the distribution services it provides to the Fund.
Effective January 1, 2017, the Fund pays each Board member an annual fee of $54,000 plus $5,000 for each Board meeting attended and out-of-pocket expenses incurred in attending Board meetings, and the Audit Committee Chairman receives an annual fee of $7,500 for his services as Chairman of the Audit Committee. Prior to January 1, 2017, each Board member received an annual fee of $49,000. These fees can be found under the caption “Directors’ fees and expenses” in the Statement of Operations.
Expenses for the fiscal year ended October 31, 2016 include legal fees paid to Drinker Biddle & Reath LLP as legal counsel to the Fund and the independent Directors. A partner of the law firm is Secretary of the Fund.
4. Purchases and Sales of Securities
For the fiscal year ended October 31, 2016, cost of purchases and proceeds from sales of investment securities other than U.S. government securities and short-term securities were:
| | | | | | | | |
Portfolio | | Purchases | | | Sales | |
Core Fixed Income Portfolio | | $ | 73,136,324 | | | $ | 37,866,652 | |
Strategic Equity Portfolio | | | 37,096,878 | | | | 42,933,277 | |
Small Cap Equity Portfolio | | | 1,691,356,465 | | | | 1,428,504,827 | |
Mid Cap Equity Portfolio | | | 19,878,679 | | | | 29,655,947 | |
Large Cap Value Portfolio | | | 79,206,655 | | | | 92,534,555 | |
U.S. Emerging Growth Portfolio | | | 57,728,451 | | | | 49,755,796 | |
Large Cap Core Portfolio | | | 2,505,215,265 | | | | 2,251,802,279 | |
Large Cap Growth Portfolio | | | 3,103,950,751 | | | | 2,039,074,947 | |
Long/Short Portfolio | | | 361,154,581 | | | | 353,919,267 | |
Total Market Portfolio | | | 99,138,672 | | | | 125,483,019 | |
High Yield Municipal Portfolio | | | 221,551,341 | | | | 72,580,659 | |
Responsible ESG U.S. Equity Portfolio | | | 8,756,388 | | | | 2,595,222 | |
Women in Leadership U.S. Equity Portfolio | | | 9,267,531 | | | | 3,019,216 | |
Short Term Tax Aware Fixed Income Portfolio | | | 32,635,850 | | | | 6,246,025 | |
Secured Options Portfolio | | | — | | | | 699,945 | |
International Secured Options Portfolio | | | 21,810,012 | | | | 73,711,224 | |
International Portfolio | | | 673,689,969 | | | | 451,899,502 | |
THE GLENMEDE FUND, INC.
Notes to Financial Statements — (Continued)
For the fiscal year ended October 31, 2016, the cost of purchases and proceeds from sales of long-term U.S. government securities were:
| | | | | | | | |
Portfolio | | Purchases | | | Sales | |
Core Fixed Income Portfolio | | $ | 108,914,893 | | | $ | 65,760,754 | |
5. Common Stock
Changes in the capital shares outstanding were as follows:
| | | | | | | | | | | | | | | | |
| | | Year Ended
10/31/16 | | | Year Ended
10/31/15 | |
| | | Shares | | | Amount | | | Shares | | | Amount | |
Core Fixed Income Portfolio | | | | | | | | | | | | | | | | |
Sold | | | 12,906,761 | | | $ | 145,372,599 | | | | 7,071,305 | | | $ | 79,500,994 | |
Issued as reinvestment of dividends | | | 313,461 | | | | 3,491,317 | | | | 155,070 | | | | 1,739,507 | |
Redeemed | | | (8,660,441 | ) | | | (97,514,114 | ) | | | (6,606,061 | ) | | | (74,275,513 | ) |
| | | | | | | | | | | | | | | | |
Net Increase | | | 4,559,781 | | | $ | 51,349,802 | | | | 620,314 | | | $ | 6,964,988 | |
| | | | | | | | | | | | | | | | |
Strategic Equity Portfolio | | | | | | | | | | | | | | | | |
Sold | | | 1,360,099 | | | $ | 27,883,530 | | | | 715,270 | | | $ | 15,510,270 | |
Issued as reinvestment of dividends | | | 664,195 | | | | 13,119,427 | | | | 922,407 | | | | 19,712,167 | |
Redeemed | | | (1,578,697 | ) | | | (32,040,616 | ) | | | (1,356,250 | ) | | | (29,859,885 | ) |
| | | | | | | | | | | | | | | | |
Net Increase | | | 445,597 | | | $ | 8,962,341 | | | | 281,427 | | | $ | 5,362,552 | |
| | | | | | | | | | | | | | | | |
Small Cap Equity Portfolio — Advisor | | | | | | | | | | | | | | | | |
Sold | | | 10,690,213 | | | $ | 266,261,014 | | | | 16,934,995 | | | $ | 445,691,380 | |
Issued as reinvestment of dividends | | | 515,284 | | | | 12,799,971 | | | | 1,623,876 | | | | 40,873,083 | |
Redeemed | | | (11,588,671 | ) | | | (289,162,496 | ) | | | (8,108,583 | ) | | | (214,060,493 | ) |
| | | | | | | | | | | | | | | | |
Net Increase | | | (383,174 | ) | | $ | (10,101,511 | ) | | | 10,450,288 | | | $ | 272,503,970 | |
| | | | | | | | | | | | | | | | |
Small Cap Equity Portfolio — Institutional | | | | | | | | | | | | | | | | |
Sold | | | 24,227,560 | | | $ | 628,093,312 | | | | 22,321,416 | | | $ | 612,845,648 | |
Issued as reinvestment of dividends | | | 225,081 | | | | 5,842,910 | | | | 424,455 | | | | 11,095,249 | |
Redeemed | | | (12,647,945 | ) | | | (330,817,028 | ) | | | (6,629,936 | ) | | | (181,917,323 | ) |
| | | | | | | | | | | | | | | | |
Net Increase | | | 11,804,696 | | | $ | 303,119,194 | | | | 16,115,935 | | | $ | 442,023,574 | |
| | | | | | | | | | | | | | | | |
Mid Cap Equity Portfolio — Advisor | | | | | | | | | | | | | | | | |
Sold | | | 451,852 | | | $ | 4,584,640 | | | | 2,057,261 | | | $ | 22,215,745 | |
Issued as reinvestment of dividends | | | 23,074 | | | | 229,814 | | | | 3 | | | | 27 | |
Redeemed | | | (1,489,386 | ) | | | (14,757,790 | ) | | | (125,645 | ) | | | (1,302,817 | ) |
| | | | | | | | | | | | | | | | |
Net Increase | | | (1,014,460 | ) | | $ | (9,943,336 | ) | | | 1,931,619 | | | $ | 20,912,955 | |
| | | | | | | | | | | | | | | | |
Large Cap Value Portfolio | | | | | | | | | | | | | | | | |
Sold | | | 1,307,485 | | | $ | 12,889,049 | | | | 970,507 | | | $ | 11,088,192 | |
Issued as reinvestment of dividends | | | 936,741 | | | | 8,850,468 | | | | 1,169,815 | | | | 13,218,731 | |
Redeemed | | | (2,630,584 | ) | | | (26,304,175 | ) | | | (2,371,228 | ) | | | (27,493,985 | ) |
| | | | | | | | | | | | | | | | |
Net Increase | | | (386,358 | ) | | $ | (4,564,658 | ) | | | (230,906 | ) | | $ | (3,187,062 | ) |
| | | | | | | | | | | | | | | | |
U.S. Emerging Growth Portfolio | | | | | | | | | | | | | | | | |
Sold | | | 1,399,073 | | | $ | 12,851,192 | | | | 1,089,129 | | | $ | 10,648,660 | |
Issued as reinvestment of dividends | | | 34,260 | | | | 315,587 | | | | 391,280 | | | | 3,623,268 | |
Redeemed | | | (553,409 | ) | | | (5,227,530 | ) | | | (464,384 | ) | | | (4,465,470 | ) |
| | | | | | | | | | | | | | | | |
Net Increase | | | 879,924 | | | $ | 7,939,249 | | | | 1,016,025 | | | $ | 9,806,458 | |
| | | | | | | | | | | | | | | | |
Large Cap Core Portfolio — Advisor | | | | | | | | | | | | | | | | |
Sold | | | 41,004,544 | | | $ | 897,682,616 | | | | 47,340,735 | | | $ | 1,054,074,195 | |
Issued as reinvestment of dividends | | | 1,393,718 | | | | 30,074,762 | | | | 1,332,492 | | | | 28,608,652 | |
Redeemed | | | (40,309,856 | ) | | | (898,506,816 | ) | | | (8,378,104 | ) | | | (183,789,465 | ) |
| | | | | | | | | | | | | | | | |
Net Increase | | | 2,088,406 | | | $ | 29,250,562 | | | | 40,295,123 | | | $ | 898,893,382 | |
| | | | | | | | | | | | | | | | |
THE GLENMEDE FUND, INC.
Notes to Financial Statements — (Continued)
| | | | | | | | | | | | | | | | |
| | | Year Ended
10/31/16 | | | Year Ended
10/31/15 | |
| | | Shares | | | Amount | | | Shares | | | Amount | |
Large Cap Core Portfolio — Institutional* | | | | | | | | | | | | | | | | |
Sold | | | 15,993,604 | | | $ | 325,614,460 | | | | | | | | | |
Issued as reinvestment of dividends | | | 11,592 | | | | 258,798 | | | | | | | | | |
Redeemed | | | (3,710,710 | ) | | | (82,024,408 | ) | | | | | | | | |
| | | | | | | | | | | | | | | | |
Net Increase | | | 12,294,486 | | | $ | 243,848,850 | | | | | | | | | |
| | | | | | | | | | | | | | | | |
Large Cap Growth Portfolio — Advisor | | | | | | | | | | | | | | | | |
Sold | | | 69,857,894 | | | $ | 1,721,285,344 | | | | 69,439,390 | | | $ | 1,667,228,005 | |
Issued as reinvestment of dividends | | | 516,067 | | | | 12,722,225 | | | | 1,106,564 | | | | 25,835,875 | |
Redeemed | | | (29,008,666 | ) | | | (701,445,119 | ) | | | (18,584,936 | ) | | | (447,131,711 | ) |
| | | | | | | | | | | | | | | | |
Net Increase | | | 41,365,295 | | | $ | 1,032,562,450 | | | | 51,961,018 | | | $ | 1,245,932,169 | |
| | | | | | | | | | | | | | | | |
Large Cap Growth Portfolio — Institutional** | | | | | | | | | | | | | | | | |
Sold | | | 2,076,690 | | | $ | 52,173,598 | | | | | | | | | |
Issued as reinvestment of dividends | | | 3,865 | | | | 96,557 | | | | | | | | | |
Redeemed | | | (662,806 | ) | | | (16,458,773 | ) | | | | | | | | |
| | | | | | | | | | | | | | | | |
Net Increase | | | 1,417,749 | | | $ | 35,811,382 | | | | | | | | | |
| | | | | | | | | | | | | | | | |
Long/Short Portfolio | | | | | | | | | | | | | | | | |
Sold | | | 7,630,656 | | | $ | 86,457,545 | | | | 8,060,025 | | | $ | 90,325,715 | |
Redeemed | | | (3,699,337 | ) | | | (41,996,058 | ) | | | (1,154,228 | ) | | | (12,902,995 | ) |
| | | | | | | | | | | | | | | | |
Net Increase | | | 3,931,319 | | | $ | 44,461,487 | | | | 6,905,797 | | | $ | 77,422,720 | |
| | | | | | | | | | | | | | | | |
Total Market Portfolio | | | | | | | | | | | | | | | | |
Sold | | | 830,931 | | | $ | 11,714,522 | | | | 4,519,877 | | | $ | 67,480,388 | |
Issued as reinvestment of dividends | | | 13,270 | | | | 191,403 | | | | 272,613 | | | | 3,922,096 | |
Redeemed | | | (2,720,384 | ) | | | (38,458,750 | ) | | | (2,824,626 | ) | | | (40,700,518 | ) |
| | | | | | | | | | | | | | | | |
Net Increase | | | (1,876,183 | ) | | $ | (26,552,825 | ) | | | 1,967,864 | | | $ | 30,701,966 | |
| | | | | | | | | | | | | | | | |
High Yield Municipal Portfolio*** | | | | | | | | | | | | | | | | |
Sold | | | 15,085,377 | | | $ | 154,553,313 | | | | | | | | | |
Redeemed | | | (273,691 | ) | | | (2,861,010 | ) | | | | | | | | |
| | | | | | | | | | | | | | | | |
Net Increase | | | 14,811,686 | | | $ | 151,692,303 | | | | | | | | | |
| | | | | | | | | | | | | | | | |
Responsible ESG U.S. Equity Portfolio*** | | | | | | | | | | | | | | | | |
Sold | | | 618,530 | | | $ | 6,340,364 | | | | | | | | | |
Redeemed | | | (13,499 | ) | | | (136,210 | ) | | | | | | | | |
| | | | | | | | | | | | | | | | |
Net Increase | | | 605,031 | | | $ | 6,204,154 | | | | | | | | | |
| | | | | | | | | | | | | | | | |
Women in Leadership U.S. Equity Portfolio*** | | | | | | | | | | | | | | | | |
Sold | | | 611,752 | | | $ | 6,282,672 | | | | | | | | | |
Issued as reinvestment of dividends | | | 18 | | | | 196 | | | | | | | | | |
Redeemed | | | (87 | ) | | | (903 | ) | | | | | | | | |
| | | | | | | | | | | | | | | | |
Net Increase | | | 611,683 | | | $ | 6,281,965 | | | | | | | | | |
| | | | | | | | | | | | | | | | |
Short Term Tax Aware Fixed Income Portfolio**** | | | | | | | | | | | | | | | | |
Sold | | | 3,042,527 | | | $ | 30,464,107 | | | | | | | | | |
Redeemed | | | (31,145 | ) | | | (311,061 | ) | | | | | | | | |
| | | | | | | | | | | | | | | | |
Net Increase | | | 3,011,382 | | | $ | 30,153,046 | | | | | | | | | |
| | | | | | | | | | | | | | | | |
Secured Options Portfolio — Advisor | | | | | | | | | | | | | | | | |
Sold | | | 20,425,632 | | | $ | 241,915,899 | | | | 5,750,551 | | | $ | 69,965,372 | |
Issued as reinvestment of dividends | | | 1,920,944 | | | | 22,513,534 | | | | 1,595,613 | | | | 18,764,404 | |
Redeemed | | | (7,664,114 | ) | | | (91,160,150 | ) | | | (5,227,890 | ) | | | (63,345,785 | ) |
| | | | | | | | | | | | | | | | |
Net Increase | | | 14,682,462 | | | $ | 173,269,283 | | | | 2,118,274 | | | $ | 25,383,991 | |
| | | | | | | | | | | | | | | | |
International Secured Options Portfolio | | | | | | | | | | | | | | | | |
Sold | | | 338,309 | | | $ | 3,179,464 | | | | 440,796 | | | $ | 4,484,099 | |
Issued as reinvestment of dividends | | | 5,700 | | | | 54,892 | | | | 199,420 | | | | 2,037,151 | |
Redeemed | | | (6,220,945 | ) | | | (60,550,933 | ) | | | (1,262,677 | ) | | | (13,087,432 | ) |
| | | | | | | | | | | | | | | | |
Net Increase | | | (5,876,936 | ) | | $ | (57,316,577 | ) | | | (622,461 | ) | | $ | (6,566,182 | ) |
| | | | | | | | | | | | | | | | |
THE GLENMEDE FUND, INC.
Notes to Financial Statements — (Continued)
| | | | | | | | | | | | | | | | |
| | | Year Ended
10/31/16 | | | Year Ended
10/31/15 | |
| | | Shares | | | Amount | | | Shares | | | Amount | |
International Portfolio | | | | | | | | | | | | | | | | |
Sold | | | 20,758,080 | | | $ | 268,531,004 | | | | 16,030,183 | | | $ | 216,018,227 | |
Issued as reinvestment of dividends | | | 7,614 | | | | 95,141 | | | | 2,949 | | | | 40,606 | |
Redeemed | | | (4,266,577 | ) | | | (54,737,212 | ) | | | (649,878 | ) | | | (8,713,577 | ) |
| | | | | | | | | | | | | | | | |
Net Increase | | | 16,499,117 | | | $ | 213,888,933 | | | | 15,383,254 | | | $ | 207,345,256 | |
| | | | | | | | | | | | | | | | |
* The Large Cap Core Portfolio Institutional Shares commenced operations on December 30, 2015.
** The Large Cap Growth Portfolio Institutional shares commenced operations on November 5, 2015.
*** Portfolio commenced operations on December 22, 2015.
**** Portfolio commenced operations on June 29, 2016.
As of October 31, 2016, with the exception of the Small Cap Equity Portfolio, Large Cap Value Portfolio, Large Cap Core Portfolio, Large Cap Growth Portfolio, Long/Short Portfolio, Total Market Portfolio and Secured Options Portfolio, Glenmede Trust, on behalf of its clients, holds of record and has voting and/or investment authority over a significant portion of each Portfolio’s outstanding shares. The following Portfolios have shareholders which, to the Fund’s knowledge, own beneficially 5% or more of the shares outstanding of a Portfolio as of October 31, 2016. The total percentage of the shares of a Portfolio held by such shareholders is as follows:
| | | | | | | | |
| | | 5% or Greater Shareholders | |
Portfolio | | # of
Shareholders | | | % of
Shares Held | |
Small Cap Equity Portfolio (Advisor Class) | | | 3 | | | | 62 | |
Small Cap Equity Portfolio (Institutional Class) | | | 2 | | | | 81 | |
Mid Cap Equity Portfolio (Advisor Class) | | | 2 | | | | 13 | |
Large Cap Value Portfolio | | | 2 | | | | 16 | |
Long/Short Portfolio | | | 1 | | | | 6 | |
Total Market Portfolio | | | 3 | | | | 37 | |
Responsible ESG U.S. Equity Portfolio | | | 6 | | | | 91 | |
Women in Leadership U.S. Equity Portfolio | | | 6 | | | | 87 | |
Secured Options Portfolio (Advisor Class) | | | 5 | | | | 56 | |
Short Term Tax Aware Fixed Income Portfolio | | | 2 | | | | 32 | |
Large Cap Core Portfolio (Advisor Class) | | | 2 | | | | 54 | |
Large Cap Core Portfolio (Institutional Class) | | | 2 | | | | 78 | |
Large Cap Growth (Advisor Class) | | | 2 | | | | 95 | |
Large Cap Growth (Institutional Class) | | | 1 | | | | 89 | |
International Secured Options Portfolio | | | 3 | | | | 23 | |
6. Lending of Portfolio Securities
As of October 31, 2016, the following Portfolios had outstanding loans of securities to certain approved brokers for which such Portfolios received collateral:
| | | | | | | | | | | | |
Portfolio | | Market Value
of Loaned
Securities | | | Market Value
of Collateral | | | % of Total
Assets on
Loan | |
Core Fixed Income Portfolio | | $ | 6,235,162 | | | $ | 6,361,580 | | | | 1.26 | |
Strategic Equity Portfolio | | | 3,416,893 | | | | 3,551,054 | | | | 1.89 | |
Small Cap Equity Portfolio | | | 34,255,630 | | | | 36,102,827 | | | | 1.27 | |
Mid Cap Equity Portfolio | | | 409,964 | | | | 446,056 | | | | 2.20 | |
U.S. Emerging Growth Portfolio | | | 1,480,071 | | | | 1,496,136 | | | | 2.69 | |
Large Cap Core Portfolio | | | 19,687,414 | | | | 19,850,223 | | | | 0.99 | |
Long/Short Portfolio | | | 4,265,614 | | | | 4,252,730 | | | | 1.06 | |
The Funds have adopted the disclosure provisions of FASB Accounting Standards Update No. 2014-11 (“ASU No. 2014-11”), Transfers & Servicing (Topic 860): Repurchase-to-Maturity Transactions, Repurchase Financings, and Disclosures. ASU No. 2014-11 is intended to provide increased transparency about the types of collateral pledged in securities lending and other similar transactions that are accounted for as secured borrowings.
THE GLENMEDE FUND, INC.
Notes to Financial Statements — (Concluded)
For the Strategic Equity Portfolio, the Small Cap Equity Portfolio, the Mid Cap Equity Portfolio, the U.S. Emerging Growth Portfolio, the Large Cap Core Portfolio and the Long/Short Portfolio, all of the securities on loan collateralized by cash are classified as Common Stocks in each Portfolio’s Schedule of Investments at October 31, 2016, with a contractual maturity of overnight and continuous.
For the Core Fixed Income Portfolio, all of the securities on loan collateralized by cash are classified as Corporate Notes in the Portfolio’s Schedule of Investments at October 31, 2016 with a contractual maturity of overnight and continuous.
7. Recently Issued Accounting Pronouncements
In May 2015, the FASB issued ASU 2015-07, Disclosures for Investments in Certain Entities That Calculate Net Asset Value per Share (or Its Equivalent) (“2015-17”). This is an update to Fair Value Measurement Topic 820. Under the amendments in this ASU, investments for which fair value is measured at net asset value per share (or its equivalent) using the practical expedient should not be categorized in the fair value hierarchy. ASU 2015-17 is effective for financial statements issued for fiscal years beginning after December 15, 2015, and interim periods within those fiscal years. Management is currently evaluating the impact these changes may have, if any, on the Fund’s financial statements.
8. Subsequent Events
Management has evaluated events and transactions subsequent to October 31, 2016 through the date the financial statements were available to be issued, for disclosure in the Fund’s financial statements.
THE GLENMEDE FUND, INC.
REPORT OF INDEPENDENT REGISTERED PUBLIC ACCOUNTING FIRM
To the Board of Directors and Shareholders of The Glenmede Fund, Inc.:
In our opinion, the accompanying statements of assets and liabilities, including the schedules of portfolio investments, and the related statements of operations, of changes in net assets and of cash flows, as applicable, and the financial highlights present fairly, in all material respects, the financial position of the Core Fixed Income Portfolio, Strategic Equity Portfolio, Small Cap Equity Portfolio, Mid Cap Equity Portfolio, Large Cap Value Portfolio, U.S. Emerging Growth Portfolio, Large Cap Core Portfolio, Large Cap Growth Portfolio, Long/Short Portfolio, Total Market Portfolio, High Yield Municipal Portfolio, Responsible ESG U.S. Equity Portfolio, Women in Leadership U.S. Equity Portfolio, Short Term Tax Aware Fixed Income Portfolio, Secured Options Portfolio, International Secured Options Portfolio, and International Portfolio (constituting The Glenmede Fund, Inc., hereafter referred to as the “Fund”) at October 31, 2016, the results of each of their operations and their cash flows, as applicable, for the year then ended, the changes in their net assets for each of the two years in the period then ended and the financial highlights for each of the periods indicated, in conformity with accounting principles generally accepted in the United States of America. These financial statements and financial highlights (hereafter referred to as “financial statements”) are the responsibility of the Fund’s management. Our responsibility is to express an opinion on these financial statements based on our audits. We conducted our audits of these financial statements in accordance with the standards of the Public Company Accounting Oversight Board (United States). Those standards require that we plan and perform the audit to obtain reasonable assurance about whether the financial statements are free of material misstatement. An audit includes examining, on a test basis, evidence supporting the amounts and disclosures in the financial statements, assessing the accounting principles used and significant estimates made by management, and evaluating the overall financial statement presentation. We believe that our audits, which included confirmation of securities at October 31, 2016 by correspondence with the custodian and brokers, and the application of alternative auditing procedures where securities purchased had not been received, provide a reasonable basis for our opinion.

December 21, 2016
THE GLENMEDE PORTFOLIOS
STATEMENTS OF ASSETS AND LIABILITIES
October 31, 2016
| | | | |
| | | Muni
Intermediate
Portfolio | |
Assets: | | | | |
Investments1: | | | | |
Investments at value | | $ | 331,152,677 | |
Cash | | | 1,338,246 | |
Receivable for fund shares sold | | | 63,535 | |
Interest receivable | | | 3,864,535 | |
Prepaid expenses | | | 1,520 | |
| | | | |
Total assets | | | 336,420,513 | |
| | | | |
Liabilities: | | | | |
Payable for when-issued securities | | | 5,000,000 | |
Payable for fund shares redeemed | | | 33,800 | |
Payable for Trustees’ fees | | | 10,895 | |
Payable to Affiliate | | | 42,082 | |
Accrued expenses | | | 90,380 | |
| | | | |
Total liabilities | | | 5,177,157 | |
| | | | |
Net Assets | | $ | 331,243,356 | |
| | | | |
Net Assets consist of: | | | | |
Par value ($0.001 of shares outstanding) | | $ | 29,900 | |
Paid-in capital in excess of par value | | | 324,194,686 | |
Undistributed net investment income | | | 411,319 | |
Accumulated net realized gain from investment transactions | | | 1,029,089 | |
Net unrealized appreciation on investments | | | 5,578,362 | |
| | | | |
Total Net Assets | | $ | 331,243,356 | |
| | | | |
Shares Outstanding | | | 29,900,087 | |
| | | | |
Net Asset Value Per Share | | $ | 11.08 | |
| | | | |
| | | | |
1 Investment at cost | | $ | 325,574,315 | |
See Notes to Financial Statements.
THE GLENMEDE PORTFOLIOS
STATEMENTS OF OPERATIONS
For the Year Ended October 31, 2016
| | | | |
| | | Muni
Intermediate
Portfolio | |
Investment income: | | | | |
Interest | | $ | 5,845,174 | |
| | | | |
Total investment income | | | 5,845,174 | |
| | | | |
Expenses: | | | | |
Administration, transfer agent and custody fees | | | 179,295 | |
Professional fees | | | 49,665 | |
Shareholder report expenses | | | 16,835 | |
Shareholder servicing fees | | | 494,464 | |
Trustees’ fees and expenses | | | 43,518 | |
Registration and filing fees | | | 9,050 | |
Other expenses | | | 17,404 | |
| | | | |
Total expenses | | | 810,231 | |
| | | | |
Net investment income | | | 5,034,943 | |
| | | | |
Realized and unrealized gain (loss): | | | | |
Net realized gain on:
Investment transactions | | | 2,091,590 | |
| | | | |
Net change in unrealized gain of:
Investments | | | 679,897 | |
| | | | |
Net realized and unrealized gain | | | 2,771,487 | |
| | | | |
Net increase in net assets resulting from operations | | $ | 7,806,430 | |
| | | | |
See Notes to Financial Statements.
THE GLENMEDE PORTFOLIOS
STATEMENTS OF CHANGES IN NET ASSETS
For the Year Ended October 31, 2016
| | | | |
| | | Muni
Intermediate
Portfolio | |
Increase (decrease) in net assets | | | | |
Operations: | | | | |
Net investment income | | $ | 5,034,943 | |
Net realized gain on: | | | | |
Investment transactions | | | 2,091,590 | |
Net change in unrealized gain of: | | | | |
Investments | | | 679,897 | |
| | | | |
Net increase in net assets resulting from operations | | | 7,806,430 | |
Distributions to shareholders from: | | | | |
Net investment income | | | (4,946,819 | ) |
Net increase in net assets from capital share transactions (See note 5) | | | 29,263,039 | |
| | | | |
Net increase in net assets | | | 32,122,650 | |
| | | | |
| |
NET ASSETS: | | | | |
Beginning of year | | | 299,120,706 | |
| | | | |
End of year | | $ | 331,243,356 | |
| | | | |
Undistributed net investment income included in net assets at end of year | | $ | 411,319 | |
For the Year Ended October 31, 2015
| | | | |
| | | Muni
Intermediate
Portfolio | |
Increase (decrease) in net assets | | | | |
Operations: | | | | |
Net investment income | | $ | 4,177,409 | |
Net realized loss on: | | | | |
Investment transactions | | | (1,062,501 | ) |
Net change in unrealized gain of: | | | | |
Investments | | | 1,059,111 | |
| | | | |
Net increase in net assets resulting from operations | | | 4,174,019 | |
Distributions to shareholders from: | | | | |
Net investment income | | | (4,137,028 | ) |
Net realized gain on investments | | | (1,447,295 | ) |
Net increase in net assets from capital share transactions (See note 5) | | | 36,664,399 | |
| | | | |
Net increase in net assets | | | 35,254,095 | |
| | | | |
| |
NET ASSETS: | | | | |
Beginning of year | | | 263,866,611 | |
| | | | |
End of year | | $ | 299,120,706 | |
| | | | |
Undistributed net investment income included in net assets at end of year | | $ | 323,195 | |
See Notes to Financial Statements.
THE GLENMEDE PORTFOLIOS
FINANCIAL HIGHLIGHTS
For a share outstanding throughout each year
| | | | | | | | | | | | | | | | | | | | |
| | | Muni Intermediate Portfolio | |
| | | For the Years Ended October 31, | |
| | | 2016 | | | 2015 | | | 2014 | | | 2013 | | | 2012 | |
| | | | | |
Net asset value, beginning of year | | $ | 10.98 | | | $ | 11.04 | | | $ | 10.94 | | | $ | 11.20 | | | $ | 10.95 | |
| | | | | | | | | | | | | | | | | | | | |
Income from investment operations: | | | | | | | | | | | | | | | | | | | | |
Net investment income | | | 0.17 | | | | 0.16 | | | | 0.18 | | | | 0.20 | | | | 0.24 | |
Net realized and unrealized gain (loss) on investments | | | 0.10 | | | | — | | | | 0.15 | | | | (0.25 | ) | | | 0.26 | |
| | | | | | | | | | | | | | | | | | | | |
| | | | | |
Total from investment operations | | | 0.27 | | | | 0.16 | | | | 0.33 | | | | (0.05 | ) | | | 0.50 | |
| | | | | | | | | | | | | | | | | | | | |
Distributions to shareholders from: | | | | | | | | | | | | | | | | | | | | |
Net investment income | | | (0.17 | ) | | | (0.16 | ) | | | (0.18 | ) | | | (0.21 | ) | | | (0.24 | ) |
| | | | | | | | | | | | | | | | | | | | |
Net realized capital gains | | | — | | | | (0.06 | ) | | | (0.05 | ) | | | (0.00 | )1 | | | (0.01 | ) |
| | | | | | | | | | | | | | | | | | | | |
| | | | | |
Total distributions | | | (0.17 | ) | | | (0.22 | ) | | | (0.23 | ) | | | (0.21 | ) | | | (0.25 | ) |
| | | | | | | | | | | | | | | | | | | | |
| | | | | |
Net asset value, end of year | | $ | 11.08 | | | $ | 10.98 | | | $ | 11.04 | | | $ | 10.94 | | | $ | 11.20 | |
| | | | | | | | | | | | | | | | | | | | |
| | | | | |
Total return | | | 2.45 | % | | | 1.45 | % | | | 3.09 | % | | | (0.46 | )% | | | 4.60 | % |
| | | | | | | | | | | | | | | | | | | | |
Ratios to average net assets/ Supplemental data: | | | | | | | | | | | | | | | | | | | | |
Net assets, end of year (in 000s) | | $ | 331,243 | | | $ | 299,121 | | | $ | 263,867 | | | $ | 212,731 | | | $ | 231,491 | |
Ratio of operating expenses to average net assets | | | 0.25 | % | | | 0.23 | % | | | 0.25 | % | | | 0.25 | % | | | 0.26 | % |
Ratio of net investment income to average net assets | | | 1.53 | % | | | 1.44 | % | | | 1.67 | % | | | 1.85 | % | | | 2.19 | % |
Portfolio turnover rate | | | 34 | % | | | 71 | % | | | 46 | % | | | 68 | % | | | 10 | % |
| 1 | Amount rounds to less than $0.01 per share. |
See Notes to Financial Statements.
THE GLENMEDE PORTFOLIOS
Muni Intermediate Portfolio
SCHEDULE OF PORTFOLIO INVESTMENTS
October 31, 2016
| | | | | | | | |
Face
Amount | | | | | Value | |
|
| MUNICIPAL BONDS* — 100.0% | |
| | | | Alabama — 1.0% | | | |
| $ | 3,000,000 | | | Black Belt Energy Gas District, AL, Gas Supply Revenue, Revenue Bonds, Series A,
4.000% due 7/1/46 | | $ | 3,301,589 | |
| | | | | | | | |
| | |
| | | | Alaska — 1.5% | | | |
| | 1,630,000 | | | Alaska State, General Obligation Unlimited, Refunding, Series B,
5.000% due 8/1/22 | | | 1,942,064 | |
| | 2,745,000 | | | Anchorage, AK, Electric Utility, Revenue Bonds, Refunding, Series A,
4.000% due 12/1/21 | | | 3,088,701 | |
| | | | | | | | |
| | | | | | | 5,030,765 | |
| | | | | | | | |
| | |
| | | | Arizona — 1.5% | | | |
| | 4,015,000 | | | Yuma, AZ, Municipal Property Corp., Road & Excise Tax, Revenue Bonds, Refunding,
5.000% due 7/1/26 | | | 4,901,151 | |
| | | | | | | | |
| | |
| | | | Connecticut — 0.4% | | | |
| | 1,170,000 | | | Connecticut State Health & Educational Facilities Authority, Revenue Bonds, Series J,
(BHAC Insured NPFG), Prerefunded 7/1/18 @ 100,
5.750% due 7/1/33 | | | 1,264,665 | |
| | | | | | | | |
| | |
| | | | Florida — 14.4% | | | |
| | 10,550,000 | | | Citizens Property Insurance Corp., FL, Revenue Bonds, Series A-1,
5.000% due 6/1/18 | | | 11,210,641 | |
| | 3,370,000 | | | Collier County, FL, School Board, Certificate of Participation, Refunding, (AGMC Insured),
5.250% due 2/15/19 | | | 3,675,962 | |
| | 5,000,000 | | | Florida State, Board of Education Capital Outlay, Public Education, General Obligation Unlimited, Refunding, Series E,
5.000% due 6/1/26 | | | 6,250,300 | |
| | 5,125,000 | | | Florida State, Board of Education, Lottery Revenue Bonds, Series B,
5.000% due 7/1/22 | | | 5,519,574 | |
| | 1,935,000 | | | Florida State, Water Pollution Control Financing Corp., Revenue Bonds, Water Pollution Control, Series A,
5.000% due 1/15/20 | | | 2,095,779 | |
| | 3,925,000 | | | Hillsborough County, FL, Community Investment Tax, Revenue Bonds, (AMBAC Insured), Prerefunded 11/1/17 @ 100,
5.000% due 11/1/19 | | | 4,089,929 | |
| | 2,630,000 | | | Hillsborough County, FL, Industrial Development Authority, Revenue Bonds, Prerefunded 8/15/19 @ 101,
8.000% due 8/15/32 | | | 3,155,343 | |
| | | | Lakeland, FL, Energy System Revenue Bonds, Refunding: | | | | |
| | 3,750,000 | | | 5.000% due 10/1/24 | | | 4,674,712 | |
| | 2,750,000 | | | 5.000% due 10/1/25 | | | 3,463,515 | |
| | 3,000,000 | | | Lee County, FL, School Board, Certificate of Participation, Refunding, Series A,
5.000% due 8/1/27 | | | 3,617,580 | |
| | | | | | | | |
| | | | | | | 47,753,335 | |
| | | | | | | | |
| | |
| | | | Georgia — 2.3% | | | |
| | 1,000,000 | | | Albany-Dougherty County, GA, Hospital Authority, Revenue Bonds,
5.000% due 12/1/18 | | | 1,078,730 | |
| | 6,000,000 | | | Georgia State, Road & Tollway Authority, Revenue Bonds, Series A,
5.000% due 6/1/19 | | | 6,595,140 | |
| | | | | | | | |
| | | | | | | 7,673,870 | |
| | | | | | | | |
| | |
| | | | Illinois — 4.1% | | | |
| | | | Chicago, IL, O’Hare International Airport Revenue Bonds, Refunding, Series B: | | | | |
| | 1,000,000 | | | 5.000% due 1/1/20 | | | 1,115,070 | |
| | 2,520,000 | | | 5.000% due 1/1/23 | | | 3,014,625 | |
| | 3,795,000 | | | Illinois State, Finance Authority Revenue, Revenue Bonds,
5.000% due 7/1/27 | | | 4,665,649 | |
| | 4,000,000 | | | McHenry County, IL, Conservation District, General Obligation Unlimited, Refunding,
5.000% due 2/1/25 | | | 4,915,400 | |
| | | | | | | | |
| | | | | | | 13,710,744 | |
| | | | | | | | |
See Notes to Financial Statements.
THE GLENMEDE PORTFOLIOS
Muni Intermediate Portfolio
SCHEDULE OF PORTFOLIO INVESTMENTS — (Continued)
October 31, 2016
| | | | | | | | |
Face
Amount | | | | | Value | |
|
| MUNICIPAL BONDS* — (Continued) | |
| | | | Indiana — 1.5% | | | |
| $ | 5,000,000 | | | Indiana State, Health & Educational Facilities Financing Authority, Revenue Bonds, Series 2006B-3,
1.750% due 11/15/311,2 | | $ | 4,995,150 | |
| | | | | | | | |
| | |
| | | | Kansas — 1.7% | | | |
| | 2,225,000 | | | Kansas State Department of Transportation, Highway Revenue, Refunding, Series B-4,
0.673% due 9/1/182 | | | 2,210,182 | |
| | 3,200,000 | | | Wichita, KS, General Obligation Unlimited, Refunding, Series A,
5.000% due 12/1/17 | | | 3,347,392 | |
| | | | | | | | |
| | | | | | | 5,557,574 | |
| | | | | | | | |
| | |
| | | | Kentucky — 0.7% | | | |
| | 2,000,000 | | | Kentucky State, Property & Building Commission, Revenue Bonds, Refunding,
4.000% due 8/1/21 | | | 2,194,420 | |
| | | | | | | | |
| | |
| | | | Louisiana — 1.7% | | | |
| | 4,500,000 | | | Louisiana State, General Obligation Unlimited, Refunding, Series B,
5.000% due 8/1/26 | | | 5,621,445 | |
| | | | | | | | |
| | |
| | | | Maine — 1.1% | | | |
| | | | Maine State Municipal Bond Bank, Infrastructure Revenue, Refunding, Series A: | | | | |
| | 1,175,000 | | | 5.000% due 9/1/21 | | | 1,375,373 | |
| | 1,985,000 | | | 5.000% due 9/1/22 | | | 2,376,918 | |
| | | | | | | | |
| | | | | | | 3,752,291 | |
| | | | | | | | |
| | |
| | | | Maryland — 2.1% | | | |
| | | | Washington, MD, Suburban Sanitary Commission, General Obligation Unlimited, Public Improvement: | | | | |
| | 4,410,000 | | | 5.000% due 6/1/18 | | | 4,699,252 | |
| | 2,000,000 | | | 4.000% due 6/1/21 | | | 2,253,760 | |
| | | | | | | | |
| | | | | | | 6,953,012 | |
| | | | | | | | |
| | |
| | | | Massachusetts — 1.0% | | | |
| | 1,000,000 | | | Massachusetts State, General Obligation Limited, Refunding, Series A,
0.967% due 11/1/182 | | | 1,002,120 | |
| | 2,000,000 | | | Massachusetts State, General Obligation Limited, Series A,
5.000% due 3/1/23 | | | 2,430,860 | |
| | | | | | | | |
| | | | | | | 3,432,980 | |
| | | | | | | | |
| | |
| | | | Michigan — 3.9% | | | |
| | 1,500,000 | | | Detroit, MI, City School District, General Obligation Unlimited, Refunding, Series A, (QSBLF Insured),
5.000% due 5/1/17 | | | 1,529,145 | |
| | 4,000,000 | | | Detroit, MI, City School District, General Obligation Unlimited, Series A (QSBLF Insured),
5.000% due 5/1/26 | | | 4,550,600 | |
| | 1,500,000 | | | Grand Valley, MI, State University, Revenue Bonds, Refunding, Series A,
5.000% due 12/1/26 | | | 1,831,350 | |
| | 5,000,000 | | | Michigan Finance Authority, Revenue Bonds,
0.899% due 12/1/392 | | | 4,932,750 | |
| | | | | | | | |
| | | | | | | 12,843,845 | |
| | | | | | | | |
| | |
| | | | Minnesota — 4.0% | | | |
| | 1,000,000 | | | Chaska, MN, Independent School District No. 112, General Obligation Unlimited, Refunding, Series A, 5.000% due 2/1/21 | | | 1,159,450 | |
| | 1,190,000 | | | Lake Superior, MN, Independent School District No. 381, General Obligation Unlimited, Refunding, Series A,
5.000% due 10/1/20 | | | 1,358,801 | |
| | 3,400,000 | | | Rochester, MN, Health Care Facilities Revenue, Revenue Bonds, Series A,
4.000% due 11/15/30 | | | 3,605,360 | |
| | 2,010,000 | | | Sartell, MN, Independent School District No. 748, General Obligation Unlimited, Series B
0.000% due 2/1/283 | | | 1,511,118 | |
See Notes to Financial Statements.
THE GLENMEDE PORTFOLIOS
Muni Intermediate Portfolio
SCHEDULE OF PORTFOLIO INVESTMENTS — (Continued)
October 31, 2016
| | | | | | | | |
Face
Amount | | | | | Value | |
|
| MUNICIPAL BONDS* — (Continued) | |
| | | | Minnesota — (Continued) | | | |
| $ | 4,800,000 | | | St. Paul, MN, Housing & Redevelopment Authority Health Care Facilities Revenue, Refunding, HealthPartners Obligated Group, Series A,
5.000% due 7/1/28 | | $ | 5,746,272 | |
| | | | | | | | |
| | | | | | | 13,381,001 | |
| | | | | | | | |
| | |
| | | | Mississippi — 4.5% | | | |
| | 9,800,000 | | | Mississippi Business Finance Commission, Mississippi Gulf Opportunity Zone, Chevron USA, Inc. Project, Series A,
0.480% due 12/1/302 | | | 9,800,000 | |
| | 1,000,000 | | | Mississippi Business Finance Commission, Mississippi Gulf Opportunity Zone, Chevron USA, Inc. Project, Series E,
0.520% due 12/1/302 | | | 1,000,000 | |
| | | | Mississippi Development Bank, Special Obligation, Revenue Bonds, Refunding, Series A: | | | | |
| | 1,000,000 | | | 5.000% due 4/1/20 | | | 1,117,910 | |
| | 2,460,000 | | | 5.000% due 4/1/21 | | | 2,823,785 | |
| | | | | | | | |
| | | | | | | 14,741,695 | |
| | | | | | | | |
| | |
| | | | Missouri — 0.7% | | | |
| | 2,000,000 | | | City of Kansas, MO, Sanitary Sewer System Revenue Bonds, Refunding, Series A,
5.000% due 1/1/27 | | | 2,448,260 | |
| | | | | | | | |
| | |
| | | | Nevada — 1.2% | | | |
| | 3,500,000 | | | Clark County, NV, Water Reclamation District, General Obligation Limited, Refunding,
5.000% due 7/1/20 | | | 3,986,465 | |
| | | | | | | | |
| | |
| | | | New Mexico — 1.9% | | | |
| | 6,300,000 | | | New Mexico State, Municipal Energy Acquisition Authority, Revenue Bonds, Subseries B,
1.103% due 11/1/392 | | | 6,270,012 | |
| | | | | | | | |
| | |
| | | | New York — 9.7% | | | |
| | 3,785,000 | | | New York City, New York, City Transitional Finance Authority Revenue, Future Tax Secured Bond, Series D, 5.000% due 11/1/22 | | | 4,292,341 | |
| | 1,200,000 | | | New York State, Dormitory Authority Revenue, State Supported Debt, Construction Service, Contract A, 5.000% due 7/1/18 | | | 1,278,504 | |
| | 5,000,000 | | | New York State, Dormitory Authority Sales Tax Revenue Bonds, Refunding, Series A,
5.000% due 3/15/19 | | | 5,469,850 | |
| | 5,575,000 | | | New York State, General Obligation Unlimited, Series A, (NPFG Insured),
0.617% due 2/15/222 | | | 5,379,875 | |
| | | | New York State, Thruway Authority Personal Income Tax, Revenue Bonds, Series A: | | | | |
| | 1,150,000 | | | 5.000% due 3/15/23 | | | 1,318,360 | |
| | 4,000,000 | | | 5.000% due 3/15/24 | | | 4,583,960 | |
| | 3,000,000 | | | New York, Metropolitan Transportation Authority Revenue, Dedicated Tax Fund, Series B, Prerefunded 11/15/19 @ 100,
5.250% due 11/15/27 | | | 3,384,060 | |
| | 5,470,000 | | | New York, Metropolitan Transportation Authority Revenue, Dedicated Tax Fund, Series B-1,
5.000% due 11/15/21 | | | 6,467,236 | |
| | | | | | | | |
| | | | | | | 32,174,186 | |
| | | | | | | | |
| | |
| | | | North Carolina — 5.2% | | | |
| | 1,220,000 | | | Duplin County, NC, Limited Obligation, Revenue Bonds,
5.000% due 4/1/23 | | | 1,456,192 | |
| | | | Mooresville, NC, Limited Obligation, Revenue Bonds, Refunding: | | | | |
| | 3,375,000 | | | 5.000% due 11/1/22 | | | 4,010,884 | |
| | 3,550,000 | | | 5.000% due 11/1/23 | | | 4,282,294 | |
| | 2,000,000 | | | New Hanover County, NC, Hospital Revenue Bonds,
5.000% due 10/1/19 | | | 2,212,300 | |
| | 2,000,000 | | | Raleigh City, North Carolina, Combined Enterprise System Revenue, Refunding, Series B,
5.000% due 12/1/24 | | | 2,523,860 | |
| | 1,150,000 | | | University of North Carolina, Chapel Hill, Revenue Bonds, Series B,
1.103% due 12/1/412 | | | 1,152,127 | |
See Notes to Financial Statements.
THE GLENMEDE PORTFOLIOS
Muni Intermediate Portfolio
SCHEDULE OF PORTFOLIO INVESTMENTS — (Continued)
October 31, 2016
| | | | | | | | |
Face
Amount | | | | | Value | |
|
| MUNICIPAL BONDS* — (Continued) | |
| | | | North Carolina — (Continued) | | | |
| $ | 1,500,000 | | | Wake County, NC, General Obligation Unlimited,
5.000% due 3/1/23 | | $ | 1,635,660 | |
| | | | | | | | |
| | | | | | | 17,273,317 | |
| | | | | | | | |
| | |
| | | | Ohio — 2.1% | | | |
| | 2,060,000 | | | Ohio State, Adult Correctional Capital Facilities, Lease Revenue, Series A,
5.000% due 4/1/21 | | | 2,385,624 | |
| | 1,175,000 | | | Ohio State, Higher Educational Facility, Revenue Bonds, Refunding,
6.250% due 10/1/17 | | | 1,234,079 | |
| | 2,670,000 | | | Ohio State, Hospital Revenue Bonds, Series A,
5.000% due 1/15/24 | | | 3,154,979 | |
| | | | | | | | |
| | | | | | | 6,774,682 | |
| | | | | | | | |
| | |
| | | | Oklahoma — 1.1% | | | |
| | 3,650,000 | | | Oklahoma City, OK, Industrial & Cultural Facilities Trust, Revenue Bonds, (NPFG Insured),
1.488% due 6/1/192 | | | 3,513,125 | |
| | | | | | | | |
| | |
| | | | Pennsylvania — 9.3% | | | |
| | 2,500,000 | | | Allegheny County, PA, General Obligation Unlimited, Refunding, Series C-73,
5.000% due 12/1/20 | | | 2,871,325 | |
| | 255,000 | | | Bucks County, PA, Community College Authority, College Building Revenue Bonds, (County Guaranteed) (Escrowed to Maturity),
4.750% due 6/15/18 | | | 270,966 | |
| | 500,000 | | | Conneaut, PA, School District, Refunding, Series B, (AGMC Insured State Aid Withholding),
5.000% due 11/1/20 | | | 570,550 | |
| | 1,000,000 | | | East Stroudsburg, PA, Area School District, General Obligation Limited,
(AGMC Insured State Aid Withholding),
5.000% due 9/1/20 | | | 1,033,440 | |
| | 325,000 | | | Easton, PA, Area School District, General Obligation Limited, (AGMC Insured State Aid Withholding), 5.000% due 4/1/17 | | | 330,714 | |
| | 350,000 | | | Hazleton, PA, Area School District, General Obligation Unlimited, (AGMC Insured State Aid Withholding), Prerefunded 3/1/18 @ 100,
5.000% due 3/1/20 | | | 369,358 | |
| | 1,490,000 | | | Montgomery County, PA, Industrial Development Authority Revenue, New Regional Medical Control Project, (FHA Insured) (Escrowed to Maturity),
5.000% due 2/1/18 | | | 1,567,271 | |
| | 750,000 | | | Pennsylvania State Higher Educational Facilities Authority Revenue, University of Pennsylvania Health System, Series B,
5.500% due 8/15/18 | | | 810,240 | |
| | 2,765,000 | | | Pennsylvania State University, Revenue Bonds, Refunding, Series B,
5.000% due 9/1/23 | | | 3,385,881 | |
| | 5,000,000 | | | Pennsylvania State, General Obligation Unlimited, Series 2,
5.000% due 9/15/25 | | | 6,142,400 | |
| | 1,500,000 | | | Philadelphia, PA, School District, General Obligation Limited, Series F
(BHAC Insured State Aid Withholding),
5.000% due 9/1/17 | | | 1,547,175 | |
| | 4,725,000 | | | Red Lion, PA, Area School District, General Obligation Limited, (AGMC Insured State Aid Withholding), Prerefunded 5/1/18 @ 100,
5.000% due 5/1/22 | | | 5,015,918 | |
| | 6,265,000 | | | Southcentral, PA, General Authority, Revenue Bonds, Series A, Prerefunded 12/1/18 @ 100,
6.000% due 6/1/29 | | | 6,915,119 | |
| | | | | | | | |
| | | | | | | 30,830,357 | |
| | | | | | | | |
| | |
| | | | Rhode Island — 1.9% | | | |
| | 5,000,000 | | | Rhode Island, State & Providence Plantations, General Obligation Unlimited, Refunding, Series A,
5.000% due 8/1/24 | | | 6,164,600 | |
| | | | | | | | |
| | |
| | | | South Carolina — 1.5% | | | |
| | 4,200,000 | | | Richland County, SC, School District No. 2, General Obligation Unlimited, Series B, (SCSDE Insured),
5.000% due 5/1/26 | | | 4,840,080 | |
| | | | | | | | |
See Notes to Financial Statements.
THE GLENMEDE PORTFOLIOS
Muni Intermediate Portfolio
SCHEDULE OF PORTFOLIO INVESTMENTS — (Continued)
October 31, 2016
| | | | | | | | |
Face
Amount | | | | | Value | |
|
| MUNICIPAL BONDS* — (Continued) | |
| | | | Tennessee — 0.3% | | | |
| $ | 1,050,000 | | | Metropolitan Government of Nashville and Davidson County, TN, General Obligation Unlimited, Refunding, Series D,
5.000% due 7/1/17 | | $ | 1,080,398 | |
| | | | | | | | |
| | |
| | | | Texas — 8.1% | | | |
| | 1,065,000 | | | Alamo, TX, Community College District, General Obligation Limited, Refunding,
5.000% due 2/15/24 | | | 1,311,015 | |
| | | | Harris County, Texas, Cultural Education Facilities Finance Corp., Revenue Bonds, Refunding, Children’s Hospital Project: | | | | |
| | 2,850,000 | | | 5.000% due 10/1/26 | | | 3,513,622 | |
| | 2,000,000 | | | 5.000% due 10/1/27 | | | 2,438,020 | |
| | 3,500,000 | | | Plano, TX, Independent School District, General Obligation Unlimited, Refunding, Series A, (PSF Guaranteed),
5.000% due 2/15/22 | | | 4,149,950 | |
| | 3,000,000 | | | Plano, TX, Independent School District, General Obligation Unlimited, Refunding, Series B, (PSF Guaranteed),
5.000% due 2/15/21 | | | 3,471,030 | |
| | 7,500,000 | | | Texas State, General Obligation Unlimited, Refunding,
5.000% due 10/1/23 | | | 9,233,625 | |
| | 2,675,000 | | | Texas State, Municipal Power Agency, Revenue Bonds, Refunding,
4.000% due 9/1/18 | | | 2,815,705 | |
| | | | | | | | |
| | | | | | | 26,932,967 | |
| | | | | | | | |
| | |
| | | | Virginia — 5.5% | | | |
| | 5,020,000 | | | Fairfax County, VA, General Obligation Unlimited, Refunding, Series A, (State Aid Withholding),
2.000% due 10/1/17 | | | 5,079,738 | |
| | 1,500,000 | | | Fairfax County, VA, General Obligation Unlimited, Refunding, Series C, (State Aid Withholding),
5.000% due 10/1/24 | | | 1,891,440 | |
| | 4,040,000 | | | Loudoun County, VA, Economic Development Authority, Public Facility Lease, Revenue Bonds,
5.000% due 12/1/20 | | | 4,660,665 | |
| | 2,800,000 | | | Richmond, VA, Convention Center Authority, Hotel Tax Revenue Bonds, Refunding,
5.000% due 6/15/27 | | | 3,419,556 | |
| | 3,060,000 | | | Virginia Beach, VA, General Obligation Unlimited, Refunding, Series A, (State Aid Withholding),
4.000% due 2/1/18 | | | 3,182,737 | |
| | | | | | | | |
| | | | 18,234,136 | |
| | | | | | | | |
| | |
| | | | Washington — 2.9% | | | |
| | 1,205,000 | | | Grays Harbor County, WA, Public Utility District No. 1, Revenue Bonds, Refunding, Series A,
5.000% due 1/1/27 | | | 1,451,917 | |
| | 2,000,000 | | | NJB Properties, Lease Revenue, King County Washington Project, Series A, (County Guaranteed), Prerefunded 12/1/16 @ 100,
5.000% due 12/1/18 | | | 2,007,160 | |
| | 2,240,000 | | | Washington State, Certificate of Participation, Refunding, Series C, (State Aid Intercept),
5.000% due 1/1/20 | | | 2,505,910 | |
| | 3,290,000 | | | Washington State, Various Purposes, General Obligation Unlimited, Series E, Prerefunded 2/1/19 @ 100,
5.000% due 2/1/20 | | | 3,584,718 | |
| | | | | | | | |
| | | | 9,549,705 | |
| | | | | | | | |
| | |
| | | | Wisconsin — 1.2% | | | |
| | 15,000 | | | Wisconsin State, General Obligation Unlimited, Series B, Prerefunded 5/1/20 @ 100,
5.000% due 5/1/26 | | | 17,018 | |
| | 3,485,000 | | | Wisconsin State, General Obligation Unlimited, Unrefunded, Series B, Prerefunded 5/1/20 @ 100,
5.000% due 5/1/26 | | | 3,953,837 | |
| | | | | | | | |
| | | | 3,970,855 | |
| | | | | | | | |
| | |
| | | | TOTAL MUNICIPAL BONDS
(Cost $325,574,315) | | | 331,152,677 | |
| | | | | | | | | | |
| | |
TOTAL INVESTMENTS
(Cost $325,574,315)4 | | | 100.0 | % | | $ | 331,152,677 | |
| | |
OTHER ASSETS IN EXCESS OF LIABILITIES | | | 0.0 | | | | 90,679 | |
| | | | | | | | | | |
| | |
NET ASSETS | | | 100.0 | % | | $ | 331,243,356 | |
| | | | | | | | | | |
See Notes to Financial Statements.
THE GLENMEDE PORTFOLIOS
Muni Intermediate Portfolio
SCHEDULE OF PORTFOLIO INVESTMENTS — (Continued)
October 31, 2016
| * | Percentages indicated are based on net assets. |
| 2 | Floating Rate Bond. Rate shown is as of October 31, 2016. |
| 4 | Aggregate cost for federal tax purposes was $325,574,315. |
Abbreviations:
AGMC — Assured Guaranty Municipal Corporation
AMBAC — American Municipal Bond Assurance Corporation
BHAC — Berkshire Hathaway Assurance Corporation
FHA — Federal Housing Administration
NPFG — National Public Finance Guarantee Corporation
PSF — Permanent School Fund
QSBLF — Michigan Qualified School Bond Loan Fund
SCSDE — South Carolina State Department of Education
See Notes to Financial Statements.
THE GLENMEDE PORTFOLIOS
Muni Intermediate Portfolio
SCHEDULE OF PORTFOLIO INVESTMENTS — (Concluded)
October 31, 2016
STATE DIVERSIFICATION
On October 31, 2016, State Diversification of the Porfolio was as follows:
| | | | | | | | |
| | | % of
Net Assets | | | Value | |
STATE: | | | | | | | | |
Florida | | | 14.4 | % | | $ | 47,753,335 | |
New York | | | 9.7 | | | | 32,174,186 | |
Pennsylvania | | | 9.3 | | | | 30,830,357 | |
Texas | | | 8.1 | | | | 26,932,967 | |
Virginia | | | 5.5 | | | | 18,234,136 | |
North Carolina | | | 5.2 | | | | 17,273,317 | |
Mississippi | | | 4.5 | | | | 14,741,695 | |
Illinois | | | 4.1 | | | | 13,710,744 | |
Minnesota | | | 4.0 | | | | 13,381,001 | |
Michigan | | | 3.9 | | | | 12,843,845 | |
Washington | | | 2.9 | | | | 9,549,705 | |
Georgia | | | 2.3 | | | | 7,673,870 | |
Maryland | | | 2.1 | | | | 6,953,012 | |
Ohio | | | 2.1 | | | | 6,774,682 | |
New Mexico | | | 1.9 | | | | 6,270,012 | |
Rhode Island | | | 1.9 | | | | 6,164,600 | |
Louisiana | | | 1.7 | | | | 5,621,445 | |
Kansas | | | 1.7 | | | | 5,557,574 | |
Alaska | | | 1.5 | | | | 5,030,765 | |
Indiana | | | 1.5 | | | | 4,995,150 | |
Arizona | | | 1.5 | | | | 4,901,151 | |
South Carolina | | | 1.5 | | | | 4,840,080 | |
Nevada | | | 1.2 | | | | 3,986,465 | |
Wisconsin | | | 1.2 | | | | 3,970,855 | |
Maine | | | 1.1 | | | | 3,752,291 | |
Oklahoma | | | 1.1 | | | | 3,513,125 | |
Massachusetts | | | 1.0 | | | | 3,432,980 | |
Alabama | | | 1.0 | | | | 3,301,589 | |
Missouri | | | 0.7 | | | | 2,448,260 | |
Kentucky | | | 0.7 | | | | 2,194,420 | |
Connecticut | | | 0.4 | | | | 1,264,665 | |
Tennessee | | | 0.3 | | | | 1,080,398 | |
| | | | | | | | |
TOTAL MUNICIPAL BONDS | | | 100.0 | % | | $ | 331,152,677 | |
| | | | | | | | |
TOTAL INVESTMENTS | | | 100.0 | % | | $ | 331,152,677 | |
| | | | | | | | |
See Notes to Financial Statements.
THE GLENMEDE PORTFOLIOS
Notes to Financial Statements
1. Organization and Significant Accounting Policies
The Glenmede Portfolios (the “Fund”) is an investment company that was organized as a Massachusetts business trust on March 3, 1992, and is registered with the Securities and Exchange Commission under the Investment Company Act of 1940, as amended (the “1940 Act”), as an open-end management investment company. As of October 31, 2016, the Fund offered shares of one sub-trust, the Muni Intermediate Portfolio (the “Portfolio”). The Portfolio is classified as diversified.
The preparation of financial statements in conformity with accounting principles generally accepted in the United States of America (“U.S.”) requires management to make estimates and assumptions that affect the reported amounts of assets and liabilities and disclosure of contingent assets and liabilities at the date of the financial statements and the reported amounts of revenues and expenses during the reporting period. Actual results could differ from those estimates. The following is a summary of significant accounting policies consistently followed by the Portfolio in the preparation of its financial statements.
Valuation of Securities: Municipal obligations for which market quotations are readily available are valued at the most recent quoted bid price provided by investment dealers, provided that municipal obligations may be valued on the basis of prices provided by a pricing service when such prices are determined by the investment advisor to reflect the fair market value of such municipal obligations. These valuations are typically categorized as Level 2 in the fair value hierarchy described below. When market quotations are not readily available or events occur that make established valuation methods unreliable, municipal obligations are valued in a manner which is intended to reflect their fair value as determined in accordance with procedures approved by the Board of Trustees of the Fund (the “Board”) and are typically categorized as Level 3 in the fair value hierarchy. The fair value of securities is generally determined as the amount that a Portfolio could reasonably expect to realize from an orderly disposition of such securities over a reasonable period of time. By its nature, a fair value price is a good faith estimate of the value of a security at a given point in time and does not reflect an actual market price, which may be different by a material amount. Debt obligations with maturities of 60 days or less at the time of purchase are valued on the basis of amortized cost and are typically categorized as Level 2 in the fair value hierarchy.
Financial Accounting Standards Board (“FASB”) Statement of Financial Accounting Standards Codification (“ASC”) Topic 820, “Fair Value Measurements” defines fair value, establishes a three-level hierarchy for measuring fair value and expands disclosure about fair value measurements. The valuation hierarchy is based upon the transparency of inputs to the valuation of the Portfolio’s investments. Inputs refer broadly to the assumptions that market participants would use in pricing a security. Observable inputs are inputs that reflect the assumptions market participants would use in pricing the asset or liability based on market data obtained from sources independent of the reporting entity. Unobservable inputs are inputs that reflect the reporting entity’s own assumptions about the assumptions market participants would use in pricing the asset or liability based on the best information available in the circumstances. These inputs are summarized in the three levels listed below:
Level 1 — quoted prices in active markets for identical investments;
Level 2 — other significant observable inputs (including quoted prices for similar investments, interest rates, prepayment speeds, credit risk and others) or valuations based on quoted prices in markets that are not active; and
Level 3 — significant unobservable inputs (including the Fund’s own assumptions in determining the fair value of investments).
The inputs or methodology used for valuing securities are not necessarily an indication of the risks associated with investing in those securities.
Changes in valuation techniques may result in changing an investment’s assigned level within the hierarchy.
The Portfolio had all long-term investments, with corresponding sectors at Level 2 at October 31, 2016. For the fiscal year ended October 31, 2016, there were no transfers between Level 1 and 2.
Municipal Securities: The value of, payment of interest on, repayment of principal for, and the ability to sell a municipal security may be affected by constitutional amendments, legislation, executive orders, administrative regulations, voter initiatives and the economics of the regions in which the issuers are located. A credit rating downgrade, bond default, or bankruptcy involving an issuer within a particular state or territory could affect the market values and marketability of some or all of the municipal obligations of that state or territory.
Since many municipal securities are issued to finance similar projects, especially those relating to education, health care, transportation and utilities, conditions in those sectors can affect the overall municipal securities market and a Portfolio’s investments in municipal securities.
There is some risk that a portion or all of the interest received from certain tax-free municipal securities could become taxable as a result of determinations by the Internal Revenue Service.
Securities Transactions and Investment Income: Securities transactions are recorded as of the trade date. Realized gains and losses on investments sold are computed on the basis of identified cost. Interest income is recorded on the accrual basis and includes, when appropriate, amortization of premiums and accretion of discounts.
THE GLENMEDE PORTFOLIOS
Notes to Financial Statements — (Continued)
Securities purchased or sold on a when-issued or delayed-delivery basis may be settled after a period longer than the regular settlement time of trade date plus three business days. Interest income is accrued based on the terms of the security on settlement date. The Portfolio segregates assets with a current value at least equal to the amount of its when-issued purchase commitments. When-issued purchase commitments involve a risk of loss if the value of the security to be purchased declines prior to settlement date, or if the counterparty does not perform under the contract.
Dividends and Distributions to Shareholders: Dividends from net investment income, if any, are declared and paid monthly. The Portfolio distributes any net realized capital gains on an annual basis. Additional distributions of net investment income and capital gains for the Portfolio may be made at the discretion of the Board in order to avoid a nondeductible excise tax under Section 4982 of the Internal Revenue Code of 1986, as amended (the “Code”).
Income and capital gains distributions are determined in accordance with income tax regulations which may differ from accounting principles generally accepted in the U.S. These differences are primarily due to differing treatments of income and gains on various investment securities held by the Portfolio, timing differences and differing characterization of distributions made by the Portfolio.
Federal Income Taxes: The Portfolio intends to continue to qualify as a regulated investment company by complying with the requirements of the Code applicable to regulated investment companies, and by distributing substantially all of its tax-exempt (and taxable, if any) income to its shareholders. Therefore, no federal income tax provision is required. Income distributions and capital gains distributions are determined in accordance with income tax regulations which may differ from accounting principles generally accepted in the U.S.
“Accounting for Uncertainty in Income Taxes — an interpretation of FASB ASC 740” (“ASC 740”) clarifies the accounting for uncertainty in income taxes recognized in accordance with ASC 740, “Accounting for Income Taxes.” This interpretation prescribes a recognition threshold and measurement attribute for the financial statement recognition and measurement of a tax position taken or expected to be taken in a tax return. It also provides guidance on de-recognition, classification, interest and penalties, accounting in interim periods, disclosure and transition. The Portfolio’s federal tax returns filed in the 3-year period ended October 31, 2016 remain subject to examination by the Internal Revenue Service.
On October 31, 2016, the tax year end of the Fund, the Portfolio had available capital loss carryforwards to be utilized in future periods to offset future capital gains as follows:
| | | | | | | | | | | | | | | | | | | | | | | | |
| | | Expiring October 31, | |
Portfolio | | 2016 | | | 2017 | | | 2018 | | | 2019 | | | Unlimited
(Short Term) | | | Unlimited
(Long Term) | |
Muni Intermediate Portfolio | | $ | — | | | $ | — | | | $ | — | | | $ | — | | | $ | — | | | $ | — | |
During the fiscal year ended October 31, 2016, the Portfolio utilized capital loss carryforwards in the amount of $1,062,501.
On December 22, 2010, the Regulated Investment Company Modernization Act of 2010 (the “Act”) was enacted. The Act modernizes several of the federal income and excise tax provisions related to regulated investment companies and, with certain exceptions, was effective for taxable years beginning after December 22, 2010. Among the changes made are changes to the capital loss carryforward rules allowing for capital losses to be carried forward indefinitely.
As of October 31, 2016, the tax year end of the Fund, the components of distributable earnings on a tax basis were as follows:
| | | | | | | | | | | | | | | | | | | | | | | | | | | | |
Portfolio | | Undistributed
Tax-exempt
Income | | | Undistributed
Short-Term
Gain | | | Undistributed
Long-Term
Gain | | | Unrealized
Appreciation/
(Depreciation) | | | Loss
Carryforwards,
Post October
Loss Deferrals | | | Other
Temporary
Differences | | | Total
Distributable
Earnings | |
Muni Intermediate Portfolio | | $ | 411,319 | | | $ | — | | | $ | 1,029,089 | | | $ | 5,578,362 | | | $ | — | | | $ | — | | | $ | 7,018,770 | |
For the fiscal year ended October 31, 2016, the Portfolio’s components of distributable earnings on a tax basis were equal to the components of distributable earnings on a book basis. Such reclasses had no effect on net assets.
As of October 31, 2016, the tax characterization of distributions paid during the year was equal to the book characterization of distributions paid for the Portfolio and was as follows:
| | | | | | | | | | | | | | | | |
Portfolio | | Tax
Exempt | | | Ordinary
Income | | | Long-Term
Gains | | | Return of
Capital | |
Muni Intermediate Portfolio | | $ | 4,888,616 | | | $ | 58,203 | | | $ | — | | | $ | — | |
THE GLENMEDE PORTFOLIOS
Notes to Financial Statements — (Continued)
As of October 31, 2015, the tax characterization of distributions paid during the year was equal to the book characterization of distributions paid for the Portfolio and was as follows:
| | | | | | | | | | | | | | | | |
Portfolio | | Tax
Exempt | | | Ordinary
Income | | | Long-Term
Gains | | | Return of
Capital | |
Muni Intermediate Portfolio | | $ | 4,131,187 | | | $ | 68,197 | | | $ | 1,384,939 | | | $ | — | |
For the fiscal year ended October 31, 2016, permanent differences between financial and tax reporting, related primarily to distribution reallocations, were identified and reclassified among the components of the Portfolio’s net assets as follows:
| | | | | | | | | | | | |
Portfolio | | Accumulated Net
Investment Income | | | Net Realized
Gain (Loss) | | | Paid-In
Capital | |
Muni Intermediate Portfolio | | $ | — | | | $ | — | | | $ | — | |
Other: In the normal course of business, the Portfolio enters into contracts that may include agreements to indemnify another party under given circumstances. The Portfolio’s maximum exposure under these arrangements is unknown as this would involve future claims that may be, but have not yet been, made against the Portfolio. However, based on experience, the risk of material loss from such claims is considered to be remote.
2. Investment Advisory Fee, Administration Fee and Other Related Party Transactions
Glenmede Investment Management LP (the “Advisor”), a wholly-owned subsidiary of The Glenmede Trust Company, N.A. (“Glenmede Trust”), serves as investment advisor to the Portfolio, pursuant to an investment management agreement with the Portfolio. Under this agreement, the Advisor manages the Portfolio, subject to the general supervision of the Board.
The Portfolio does not pay a management fee for advisory services. The investors in the Portfolio are the clients of Glenmede Trust or its affiliated companies (“Affiliates”). Glenmede Trust or its Affiliates charge a fee directly to their clients for fiduciary, trust and/or advisory services. The actual annual fees charged vary dependent on a number of factors, including the particular services provided to the client, and are generally 1.25% or less of the clients’ assets under management.
The Portfolio pays Glenmede Trust shareholder servicing fees at the annual rate of 0.15% of the Portfolio’s average daily net assets.
State Street Bank and Trust Company (“State Street”) serves as administrator, transfer agent, dividend-paying agent and custodian with respect to the Portfolio. The Portfolio pays State Street a fee based on the combined aggregate average daily net assets of the Portfolio and The Glenmede Fund, Inc., a registered investment company, plus transaction charges for certain transactions and out-of-pocket expenses. The fee is computed daily and paid monthly.
Foreside Fund Officer Services, LLC (formerly known as Foreside Compliance Services, LLC) is paid an annual fee plus out-of-pocket expenses for the provision of personnel and services related to the Fund’s compliance program. The Fund’s Chief Compliance Officer is a Managing Director of Foreside Fund Officer Services, LLC.
Quasar Distributors, LLC (“Quasar”) serves as distributor of the Portfolio’s shares. The distributor receives no fees from the Fund in connection with distribution services provided to the Fund. The Advisor pays Quasar’s fees and out-of-pocket expenses for the distribution services it provides to the Portfolio.
The Portfolio pays each Board member an annual fee of $6,000 and out-of-pocket expenses incurred in attending Board meetings.
Expenses for the fiscal year ended October 31, 2016 include legal fees paid to Drinker Biddle & Reath LLP as legal counsel to the Fund and the independent Trustees. A partner of the law firm is Secretary of the Fund.
3. Purchases and Sales of Securities
For the fiscal year ended October 31, 2016, the cost of purchases and proceeds from sales of investment securities other than U.S. government securities and short-term securities were:
| | | | | | | | |
Portfolio | | Purchases | | | Sales | |
Muni Intermediate Portfolio | | $ | 149,831,261 | | | $ | 108,773,487 | |
As of October 31, 2016, aggregate gross unrealized appreciation for all securities in which there was an excess of value over tax cost and aggregate gross unrealized depreciation for all securities in which there was an excess of tax cost over value were as follows:
| | | | | | | | | | | | |
Portfolio | | Appreciation | | | (Depreciation) | | | Net | |
Muni Intermediate Portfolio | | $ | 6,275,455 | | | $ | 697,093 | | | $ | 5,578,362 | |
THE GLENMEDE PORTFOLIOS
Notes to Financial Statements — (Concluded)
4. Shares of Beneficial Interest
The Portfolio may issue an unlimited number of shares of beneficial interest with a $.001 par value. Changes in shares of beneficial interest outstanding were as follows:
| | | | | | | | | | | | | | | | |
| | | Year Ended
10/31/16 | | | Year Ended
10/31/15 | |
| | | Shares | | | Amount | | | Shares | | | Amount | |
Muni Intermediate Portfolio | | | | | | | | | | | | | | | | |
Sold | | | 8,321,613 | | | $ | 92,297,982 | | | | 7,554,052 | | | $ | 82,848,475 | |
Issued as reinvestment of dividends | | | — | | | | — | | | | 132,029 | | | | 1,447,033 | |
Redeemed | | | (5,660,286 | ) | | | (63,034,943 | ) | | | (4,349,004 | ) | | | (47,631,109 | ) |
| | | | | | | | | | | | | | | | |
Net Increase | | | 2,661,327 | | | $ | 29,263,039 | | | | 3,337,077 | | | $ | 36,664,399 | |
| | | | | | | | | | | | | | | | |
As of October 31, 2016, Glenmede Trust, on behalf of its clients, holds of record and has voting and/or investment authority over substantially all of the Portfolio’s outstanding shares. The Portfolio had no shareholders that beneficially owned 5% of the shares outstanding of the Portfolio as of October 31, 2016.
5. Recently Issued Accounting Pronouncements
In May 2015, the FASB issued ASU 2015-07, Disclosures for Investments in Certain Entities That Calculate Net Asset Value per Share (or Its Equivalent) (“ASU 2015-17”). This is an update to Fair Value Measurement Topic 820. Under the amendments in this ASU, investments for which fair value is measured at net asset value per share (or its equivalent) using the practical expedient should not be categorized in the fair value hierarchy. ASU 2015-17 is effective for financial statements issued for fiscal years beginning after December 15, 2015, and interim periods within those fiscal years. Management is currently evaluating the impact these changes may have, if any, on the Fund’s financial statements.
6. Subsequent Events
Management has evaluated events and transactions subsequent to October 31, 2016 through the date the financial statements were available to be issued, for disclosure in the Fund’s financial statements and has determined that there were no material events that would require additional disclosure.
REPORT OF INDEPENDENT REGISTERED PUBLIC ACCOUNTING FIRM
To the Board of Trustees of The Glenmede Portfolios and Shareholders of the Muni Intermediate Portfolio:
In our opinion, the accompanying statement of assets and liabilities, including the schedule of portfolio investments, and the related statements of operations and of changes in net assets and the financial highlights present fairly, in all material respects, the financial position of the Muni Intermediate Portfolio (the sole portfolio constituting The Glenmede Portfolios, hereafter referred to as the “Fund”) at October 31, 2016, the results of its operations for the year then ended, the changes in its net assets for each of the two years in the period then ended and the financial highlights for each of the five years in the period then ended, in conformity with accounting principles generally accepted in the United States of America. These financial statements and financial highlights (hereafter referred to as “financial statements”) are the responsibility of the Fund’s management. Our responsibility is to express an opinion on these financial statements based on our audits. We conducted our audits of these financial statements in accordance with the standards of the Public Company Accounting Oversight Board (United States). Those standards require that we plan and perform the audit to obtain reasonable assurance about whether the financial statements are free of material misstatement. An audit includes examining, on a test basis, evidence supporting the amounts and disclosures in the financial statements, assessing the accounting principles used and significant estimates made by management, and evaluating the overall financial statement presentation. We believe that our audits, which included confirmation of securities at October 31, 2016 by correspondence with the custodian and brokers, and the application of alternative auditing procedures where securities purchased had not been received, provide a reasonable basis for our opinion.
December 21, 2016
THE GLENMEDE FUND, INC.
Tax Information (Unaudited)
For the fiscal year ended October 31, 2016
Of the ordinary distributions made during the fiscal year ended October 31, 2016, the following percentages have been derived from investments in U.S. Government and Agency Obligations. All or a portion of the distributions from this income may be exempt from taxation at the state level. Consult your tax advisor for state specific information.
| | | | |
Core Fixed Income Portfolio | | | 58.04 | % |
Of the ordinary distributions made during the fiscal year ended October 31, 2016, the following percentages qualify for the dividends received deduction available to corporate shareholders:
| | | | |
Strategic Equity Portfolio | | | 100 | % |
Small Cap Equity Portfolio | | | 100 | % |
Mid Cap Equity Portfolio | | | 87.39 | % |
Large Cap Value Portfolio | | | 100 | % |
U.S. Emerging Growth Portfolio | | | 100 | % |
Large Cap Core Portfolio | | | 100 | % |
Large Cap Growth Portfolio | | | 100 | % |
Total Market Portfolio | | | 100 | % |
Responsible ESG U.S. Equity Portfolio | | | 100 | % |
Women in Leadership U.S. Equity Portfolio | | | 100 | % |
Secured Options Portfolio | | | 0.42 | % |
The above figures may differ from those cited elsewhere in this report due to differences in the calculation of income and gains for Securities and Exchange Commission (book) purposes and Internal Revenue Service (tax) purposes.
Foreign Taxes Paid or Withheld
| | | | |
Portfolio | | Total | |
International Secured Options Portfolio | | $ | 78,855 | |
International Portfolio | | $ | 883,671 | |
The foreign taxes paid or withheld per share represent taxes incurred by the Fund on interest and dividends received by the Fund from foreign sources. Foreign taxes paid or withheld should be included in taxable income with an offsetting deduction from gross income or as a credit for taxes paid to foreign governments. Consult your tax advisor regarding the appropriate treatment of foreign taxes paid.
The Fund is required by the Code to advise shareholders within 60 days of the Fund’s fiscal year end (October 31, 2016) as to the federal tax status of dividends paid by the Fund during such fiscal year. Accordingly, the Fund paid long-term capital gain distributions of:
| | | | |
Core Fixed Income Portfolio | | $ | 2,439,232 | |
Strategic Equity Portfolio | | $ | 13,155,192 | |
Small Cap Equity Portfolio | | $ | 22,541,619 | |
Mid Cap Equity Portfolio | | $ | 162,727 | |
Large Cap Value Portfolio | | $ | 8,691,151 | |
U.S. Emerging Growth Portfolio | | $ | 315,331 | |
Large Cap Core Portfolio | | $ | 17,871,085 | |
Secured Options Portfolio | | $ | 15,273,542 | |
Qualified dividend income (“QDI”) received through October 31, 2016, that qualified for a reduced tax rate pursuant to the Code Section 1 (h)(11) are as follows:
| | | | |
Strategic Equity Portfolio | | $ | 1,610,968 | |
Small Cap Equity Portfolio | | $ | 5,296,109 | |
Mid Cap Equity Portfolio | | $ | 149,826 | |
Large Cap Value Portfolio | | $ | 1,175,176 | |
U.S. Emerging Growth Portfolio | | $ | 153,913 | |
Large Cap Core Portfolio | | $ | 23,026,609 | |
Large Cap Growth Portfolio | | $ | 14,837,214 | |
Total Market Portfolio | | $ | 408,601 | |
Responsible ESG U.S. Equity Portfolio | | $ | 20,176 | |
Women in Leadership U.S. Equity Portfolio | | $ | 32,425 | |
Secured Options Portfolio | | $ | 216,978 | |
THE GLENMEDE FUND, INC.
THE GLENMEDE PORTFOLIOS
Tax Information (Unaudited) — (Concluded)
For the fiscal year ended October 31, 2016
| | | | |
International Secured Options Portfolio | | $ | 711,091 | |
International Portfolio | | $ | 7,301,630 | |
Qualified interest income (“QII”) received through October 31, 2016, that qualified for a reduced tax rate
pursuant to the Code Section 871 (k) are as follows:
| | | | |
Core Fixed Income Portfolio | | | 15.81 | % |
Of the dividends paid by the High Yield Municipal Portfolio, Short Term Tax Aware Fixed Income Portfolio and Muni Intermediate Portfolio from net investment income for the fiscal year ended October 31, 2016, 96.23%, 39.80% and 98.82%, respectively is tax-exempt for regular Federal income taxes.
THE GLENMEDE FUND, INC.
THE GLENMEDE PORTFOLIOS
BOARD MEMBERS AND OFFICERS TABLE (Unaudited)
The information pertaining to the Board of Directors of The Glenmede Fund, Inc. and the Board of Trustees of The Glenmede Portfolios (collectively, the “Funds”) and their respective officers is set forth below. The Statement of Additional Information includes additional information about the Funds’ Directors/Trustees and is available without charge, upon request, by calling 1-800-442-8299. Each Director/Trustee holds office until the earliest of (i) the next meeting of shareholders, if any, called for the purpose of considering the election or re-election of such Director/Trustee and until the election and qualification of his/her successor, if any, elected at such meeting, or (ii) the date he or she dies, resigns or retires, or is removed by the applicable Board or shareholders. Each officer is elected by the applicable Board and holds office for the term of one year and until his or her successor is duly elected and qualified, or until he or she dies, resigns, is removed, or becomes disqualified. The address of each Board member is c/o State Street Bank and Trust Company, 100 Summer Street, Floor 7, SUM0703, Boston, MA 02111, Attention: Fund Administration Legal Department.
| | | | | | | | | | | | |
| Independent Directors/Trustees(1) | |
Name and Age | | Positions Held
with the
Funds/Time
Served | | Principal Occupations(s) During Past 5 Years | | Number of
Portfolios in Fund
Complex Overseen
by Director/Trustee | | | Other
Directorships
Held by
Director/
Trustee | |
| | | | |
H. Franklin Allen, Ph.D. Age: 60 | | Director of Glenmede Fund (since March 1991) and Trustee of Glenmede Portfolios (since May 1992) | | Professor of Finance and Economics and Executive Director of the Brevan Howard Centre for Financial Analysis at Imperial College London (since 2014); Professor Emeritus of Economics, The Wharton School of The University of Pennsylvania since June 2016; Professor of Finance and Economics (1990-1994); Vice Dean and Director of Wharton Doctoral Programs (1990-1993). Employed by The University of Pennsylvania (from 1980-2016). | | | 18 | | | | None | |
| | | | |
William L. Cobb, Jr. Age: 69 | | Director of Glenmede Fund and Trustee of Glenmede Portfolios (since February 2007) | | Former Executive Vice President and Former Chief Investment Officer, The Church Pension Fund (defined benefit plan for retired clergy of the Episcopal Church) (1999-2014); Vice Chairman, J.P. Morgan Investment Management (1994-1999), Chair (since 2008) and Member (until 2008), Investment Committee, The Minister and Missionaries Benefit Board of the American Baptist Church and the Wenner-Gren Foundation. | | | 18 | | |
| Director, TCW
Direct Lending LLC |
|
| | | | |
Gail E. Keppler Age: 70 | | Director of Glenmede Fund and Trustee of Glenmede Portfolios (since February 2007) | | Former Co-CEO/COO TVG, Inc. (pharmaceutical marketing consulting) (1992-2002); Former Board Member, Laurel House; Former Division President and Board Member, Burke Marketing Services, Inc.; Former Board member Cape May County Habitat for Humanity. | | | 18 | | | | None | |
| | | | | | | | |
(1) Independent Directors/Trustees are those Directors/Trustees who are not “interested persons” of the Funds as defined in the 1940 Act. |
THE GLENMEDE FUND, INC.
THE GLENMEDE PORTFOLIOS
BOARD MEMBERS AND OFFICERS TABLE (Unaudited) — (Continued)
| | | | | | | | | | | | |
| Independent Directors/Trustees(1) — (Continued) | |
Name and Age | | Positions Held
with the
Funds/Time
Served | | Principal Occupations(s) During Past 5 Years | | Number of
Portfolios in Fund
Complex Overseen
by Director/Trustee | | | Other
Directorships
Held by
Director/
Trustee | |
| | | | |
Francis J. Palamara Age: 91 | | Director of Glenmede Fund (since October 1988) and Trustee of Glenmede Portfolios (since May 1992) | | Former Chief Operating Officer, The New York Stock Exchange; Former Trustee, Gintel Fund; Former Director, XTRA Corporation; Former Director, Executive Vice President-Finance and Chief Financial Officer, ARAMARK, Inc.; Former Director, The Pittston Company; Former Director, Brinks Corp.; Former Director, Constar Corporation; Former President, Meinhard Commercial Corporation; Former Executive Vice President and Chief Financial Officer, James Talcott, Inc. | | | 18 | | | | None | |
| | | | |
Harry Wong Age: 68 | | Director of Glenmede Fund and Trustee of Glenmede Portfolios (since February 2007) | | Former Managing Director, Knight Capital Americas, L.P., an operating subsidiary of Knight Capital Group Inc. (investment banking) (2009-2011); Managing Director, Long Point Advisors, LLC (business consulting) (2003-2012); Managing Director, BIO-IB LLC (healthcare investment banking) (2004-2009); Senior Managing Director, ABN AMRO (investment banking) (1990-2002); Adjunct Faculty Member, Sacred Heart University (2003-2007). | | | 18 | | | | None | |
| | | | | | | | |
(1) Independent Directors/Trustees are those Directors/Trustees who are not “interested persons” of the Funds as defined in the 1940 Act. |
THE GLENMEDE FUND, INC.
THE GLENMEDE PORTFOLIOS
BOARD MEMBERS AND OFFICERS TABLE (Unaudited) — (Continued)
| | | | | | | | | | | | |
| Interested Directors/Trustees(2) | |
Name and Age | | Positions Held
with the
Funds/Time
Served | | Principal Occupation(s) During Past 5 Years | | Number of
Portfolios in Fund
Complex Overseen
by Director/Trustee | | | Other
Directorships
Held by
Director/
Trustee | |
| | | | |
Susan W. Catherwood(2) Age: 73 | | Director of Glenmede Fund and Trustee of Glenmede Portfolios (since February 2007) | | Director (since 1988) and Member of the Investment Review/Relationship Oversight Committee (since 2001) and Compensation Committee (since 1993), Glenmede Trust; Director, The Glenmede Corporation (since 1988); Board Member, The Pew Charitable Trusts; Charter Trustee, The University of Pennsylvania; Chairman Emeritus, The University Museum of The University of Pennsylvania; Chairman of the Board of Managers, The Christopher Ludwick Foundation; Board Member, Monell Chemical Senses Center; Director: Thomas Skelton Harrison Foundation and The Catherwood Foundation; Fellow and serves on Finance and Investment Committees, and former Board member, College of Physicians of Philadelphia; Former Member, The Women’s Committee and Penn Museum Board of Overseers of the University of Pennsylvania. | | | 18 | | | | None | |
| | | | |
G. Thompson Pew, Jr.(2) Age: 74 | | Director of Glenmede Fund (since October 1988) and Trustee of Glenmede Portfolios (since May 1992) Chairman of the Funds (since June 2006) | | Director (since 2013) of The Glenmede Corporation; Director, Member of the Relationship Oversight Committee, Private Equity/Real Estate Advisory Committee (until 2013), and the Compensation Committee, Glenmede Trust; Former Director, Brown & Glenmede Holdings, Inc.; Former Co-Director, Principal and Officer, Philadelphia Investment Banking Co.; Former Director and Officer, Valley Forge Administrative Services Company. | | | 18 | | | | None | |
| | | | | | | | |
(2) Interested Directors/Trustees are those Directors/Trustees who are “interested persons” of the Funds as defined in the 1940 Act. Susan W. Catherwood and G. Thompson Pew, Jr., are considered to be “interested” Director/Trustees of the Funds because of their affiliations with Glenmede Trust, the parent company of the Funds’ investment advisor, GIM, and their stock ownership in The Glenmede Corporation, of which GIM is an affiliate. |
THE GLENMEDE FUND, INC.
THE GLENMEDE PORTFOLIOS
BOARD MEMBERS AND OFFICERS TABLE (Unaudited) — (Concluded)
| | | | |
| Officers |
Name, Address and Age | | Positions Held with
the Funds/Time Served | | Principal Occupation(s) During Past 5 Years |
| | |
Mary Ann B. Wirts 1650 Market Street, Suite 1200 Philadelphia, PA 19103 Age: 65 | | President of the Funds since December 1997. | | Managing Director and Chief Administrative Officer of Glenmede Trust. Managing Director and Chief Administrative Officer of Glenmede Investment Management LP (since 2006). First Vice President and Managing Director of Fixed Income of Glenmede Advisers (2000-2006). Employed by Glenmede Trust since 1982 |
| | |
Kimberly C. Osborne 1650 Market Street, Suite 1200 Philadelphia, PA 19103 Age: 50 | | Executive Vice President of the Funds since December 1997. | | Client Service Manager of Glenmede Investment Management LP (since 2006). Vice President of Glenmede Trust and Glenmede Advisers until 2008. Employed by Glenmede Trust 1993-2008 and Glenmede Advisers 2000-2008. |
| | |
Kent E. Weaver 1650 Market Street, Suite 1200 Philadelphia, PA 19103 Age: 49 | | Treasurer of the Funds since September 2015. | | Director of Client Service of Glenmede Investment Management LP (since July 2015); Former Director of Client Service and Sales, Chief Compliance Officer of Philadelphia International Advisors, LP (2001-2015). |
| | |
Michael P. Malloy One Logan Square, Suite 2000 Philadelphia, PA 19103-6996 Age: 57 | | Secretary of the Funds since January 1995. | | Partner in the law firm of Drinker Biddle & Reath LLP. |
| | |
Christopher E. McGuire 1 Iron Street Boston, MA 02210 Age: 43 | | Assistant Treasurer of the Funds since December 2014. | | Vice President, State Street Bank and Trust Company (since 2007). |
| | |
Donna M. Rogers 10 High Street Boston, MA 02110 Age: 50 | | Chief Compliance Officer of the Fund since September 2004 | | Managing Director, Foreside Fund Officer Services, LLC (since 2010); Senior Vice President, State Street Bank and Trust Company (2007-2010); Senior Director, Investors Bank & Trust Company (prior to merger with State Street) (2002-2007). |
| | |
Bernard Brick 100 Summer Street Boston, MA 02111 Age: 42 | | Assistant Secretary of the Funds since December 2013. | | Vice President and Counsel, State Street Bank and Trust Company (2012-present); student, Northeastern University School of Law (2008-2011). |
THE GLENMEDE FUND, INC.
THE GLENMEDE PORTFOLIOS
(Unaudited)
Proxy Voting
A description of the policies and procedures that the Funds’ investment advisors and sub-advisor use to vote proxies relating to the Funds’ portfolio securities is available, without charge, upon request, by calling 1-800-442-8299, and on the Securities and Exchange Commission’s (the “SEC”) website at http://www.sec.gov.
Information regarding how the Funds voted proxies relating to portfolio securities during the most recent 12-month period ended June 30 is available, without charge, upon request, by calling 1-800-442-8299, and on the SEC’s website at http://www.sec.gov.
Quarterly Portfolio Holdings
The Funds file their complete schedule of portfolio holdings of each Portfolio with the SEC for the first and third quarter of each fiscal year on Form N-Q. The Funds’ Forms N-Q are available on the SEC’s website at http://www.sec.gov and may be reviewed and copied at the SEC’s Public Reference Room in Washington, D.C. Information on the operation of the SEC’s Public Reference Room may be obtained by calling 1-800-SEC-0330.
Boards of Directors/Trustees — Considerations Regarding Investment Advisory Agreements
At a meeting held on March 8, 2016 the Board of Directors of Glenmede Fund approved the Investment Advisory Agreement with respect to the Short Term Tax Aware Fixed Income Portfolio. In addition, at meetings held on September 20, 2016, the Board of Directors of Glenmede Fund and the Board of Trustees of Glenmede Portfolios (collectively, the “Boards”) renewed the current Investment Advisory Agreements for each Portfolio of the Funds that were expiring on October 31, 2016 and the Glenmede Fund Board approved the Investment Advisory Agreement with respect to the Equity Income Portfolio (the Equity Income Portfolio and the Short Term Tax Aware Fixed Income Portfolio, collectively referred to as the “New Portfolios”).
In determining whether to renew the Investment Advisory Agreements for the existing Portfolios and to approve the Investment Advisory Agreements for the New Portfolios (collectively, the “Agreements”), the Boards, including all of the Directors/Trustees who are not interested persons under the Investment Company Act of 1940, as amended (the “Independent Directors/Trustees”), reviewed and considered, among other items, at the respective meetings, as applicable: (1) a memorandum from independent counsel setting forth the Boards’ fiduciary duties, responsibilities and the factors the Boards should consider in their evaluation of the Agreements; (2) reports prepared by an independent rating and ranking organization and charts prepared by the Advisor comparing the performance of each existing Portfolio to the performance of its applicable benchmark index and relevant peer group and the composite performance of separate accounts managed by the Advisor with the same investment strategy as the Equity Income Portfolio as compared to its benchmark index (the Advisor did not manage any accounts that had a similar investment strategy as the Short Term Tax Aware Fixed Income Portfolio); (3) a Lipper Inc. (“Lipper”) report comparing each Portfolio’s advisory fees, if any, and expenses to those of its relevant peer group; and (4) reports and presentations by representatives of the Advisor that described: (i) the nature, extent and quality of the Advisor’s services provided or to be provided to the Portfolios; (ii) the experience and qualifications of the personnel providing those services; (iii) its organizational structure, financial information, insurance coverage and Form ADV; (iv) its investment philosophy and processes with respect to each Portfolio; (v) its assets under management and client descriptions; (vi) its soft dollar commission policy, including information on the types of research and services obtained in connection with soft dollar commissions and the Advisor’s trade allocation policies; (vii) the current advisory fee arrangements with those Portfolios that charge advisory fees; (viii) the proposed advisory fee arrangement for the New Portfolios; (ix) the proposed contractual fee waiver arrangement for the New Portfolios and the contractual fee and expense waivers in effect for the Long/Short Portfolio, Total Market Portfolio, International Portfolio and the Mid Cap Equity Portfolio; (x) the advisory fee arrangements with the Advisor’s other similarly managed clients, if any; (xi) its compliance processes and conflicts of interest assessments; (xii) the Advisor’s profitability analyses related to providing services to the existing Portfolios and its assessment that it was premature to attempt to quantify the profitability of its services to the New Portfolios; (xiii) the extent to which economies of scale are relevant to the Portfolios; and (xiv) the benefits of adding the New Portfolios to the Glenmede Fund complex. The Directors/Trustees considered the written materials, the Advisor’s presentation, the Funds’ Chief Compliance Officer’s quarterly reports, and deliberated on the Agreements in light of this information together with information provided to the Directors/Trustees over the course of the year. In their deliberations, the Directors/Trustees did not identify any single piece of information that was all-important or controlling.
The Boards, including all of the Independent Directors/Trustees, reached the following conclusions, among others, regarding the Advisor and its Agreements: the Advisor has the capabilities, resources and personnel necessary to manage the Portfolios, including the New Portfolios; the Boards are satisfied with the quality of services provided by the Advisor in advising the Portfolios; the actual advisory fee for each Portfolio that pays an advisory fee for the existing Portfolios and the proposed advisory fees for the New Portfolios are reasonable as compared to the fees paid by comparable mutual funds; and the advisory fees are reasonable as compared to the Advisor’s similarly-managed separate account clients. The Glenmede Fund Board also concluded that the advisory fees charged by the Advisor
THE GLENMEDE FUND, INC.
THE GLENMEDE PORTFOLIOS
(Unaudited) — (Concluded)
are based on services that are in addition to, rather than duplicative of, the services provided under the advisory contracts of exchange traded funds in which the existing Portfolios and the New Portfolios may invest.
The Boards also concluded that based on the information provided, the total annual portfolio operating expenses paid by each existing Portfolio are reasonable and the estimated operating expenses of the New Portfolios are reasonable. The Boards also concluded that the performance of the existing Portfolios are generally mixed as compared with their applicable benchmark indices and other mutual funds in their peer groups.
The Boards also concluded that the profit to the Advisor for advisory services to the existing Portfolios seems reasonable; and the Glenmede Fund Board concluded that the Advisor’s profitability for providing services to the New Portfolios was not a material factor in determining whether or not to approve the Investment Advisory Agreement for the New Portfolios; and the benefits derived by the Advisor from managing the Portfolios, including how the Advisor uses soft dollars and selects brokers, and the ways in which it conducts portfolio transactions, seem reasonable. The Boards noted that since the investment advisory fees do not have breakpoints, there would be no economies of scale for those fees as the Portfolios’ assets increase.
Based upon each Board’s deliberations and evaluation of the information described above, the Directors/Trustees, including all of the Independent Directors/Trustees, determined that the terms of each Investment Advisory Agreement were reasonable and fair to the respective Portfolios and their shareholders.
The Glenmede Fund, Inc. and The Glenmede Portfolios
Investment Advisor
Glenmede Investment Management LP
One Liberty Place
1650 Market Street, Suite 1200
Philadelphia, Pennsylvania 19103
Administrator
State Street Bank and Trust Company
2 Avenue de Lafayette
Boston, Massachusetts 02206
Custodian
State Street Bank and Trust Company
2 Avenue de Lafayette
Boston, Massachusetts 02206
Legal Counsel
Drinker Biddle & Reath LLP
One Logan Square
Suite 2000
Philadelphia, Pennsylvania 19103-6996
Distributor
Quasar Distributors, LLC
615 East Michigan Street
Milwaukee, Wisconsin 53202
Independent Auditors
PricewaterhouseCoopers LLP
101 Seaport Boulevard
Boston, MA 02210
Investment Sub-Advisor
(for High Yield Municipal Portfolio)
Capital Guardian Trust Company
333 South Hope Street
Los Angeles, California 90071
The report is submitted for the general information of the shareholders of The Glenmede Fund, Inc. and The Glenmede Portfolios. It is not authorized for distribution to prospective investors unless accompanied or preceded by an effective prospectus for the Funds, which contain information concerning the Fund’s investment policies and expenses as well as other pertinent information.
Item 2. Code of Ethics.
As of October 31, 2016, the Registrant has adopted a code of ethics that applies to the Registrant’s President and Treasurer (Principal Executive Officer and Principal Financial Officer). For the year ended October 31, 2016, there were no amendments to a provision of its code of ethics, nor were there any waivers, including implicit waivers granted from a provision of the code of ethics. A copy of the Registrant’s code of ethics is filed with the Form N-CSR under Item 12(a)(1).
Item 3. Audit Committee Financial Expert.
The Registrant’s Board of Directors has determined that the Registrant has at least one audit committee financial expert serving on its audit committee. The audit committee financial expert serving on the Registrant’s audit committee is Francis J. Palamara, who is “independent” as defined in Item 3(a)(2) of this Form.
Item 4. Principal Accountant Fees and Services.
| | (a) | Audit Fees – The aggregate fees billed for each of the last two fiscal years for professional services rendered by the principal accountant for the audit of the Registrant’s annual financial statements or services that are normally provided by the accountant in connection with statutory and regulatory filings or engagements for those fiscal years were $360,514 and $418,638 for the fiscal years ended October 31, 2015 and October 31, 2016, respectively. |
| | (b) | Audit-Related Fees – There were no fees billed for the fiscal years ended October 31, 2015 and October 31, 2016 for assurance and related services by the principal accountant that are reasonably related to the performance of the audit of the Registrant’s financial statements and are not reported under (a) of this Item. |
| | (c) | Tax Fees – The aggregate fees billed in each of the last two fiscal years for professional services rendered by the principal accountant for the review of the Registrant’s tax returns, other tax-related filings, excise tax calculations and final income distributions for liquidating funds were $81,474 and $89,490 for the fiscal years ended October 31, 2015 and October 31, 2016, respectively. |
| | (d) | All Other Fees – The aggregate fees billed for professional services rendered by the principal accountant for the review of a Form N-14 filing, including a SAS 100 review, in connection with the reorganization of two funds were $8,000 for the fiscal year ended October 31, 2015. The aggregate fees billed for professional services rendered by the principal accountant for the review of a Form N-1A filing, including a SAS 100 review, in connection with the launch of a new share class for a fund were $6,500 for the fiscal year ended October 31, 2016. |
| | (e) | (1) The Registrant’s audit committee pre-approves all audit and non-audit services to be performed by the Registrant’s accountant before the accountant is engaged by the Registrant to perform such services. |
| | (2) | There were no services described in (b) through (d) above (including services required to be approved by the audit committee pursuant to paragraph (c)(7)(ii) of Rule 2-01 of Regulation S-X) that were approved by the audit committee pursuant to paragraph (c)(7)(i)(C) of Rule 2-01 of Regulation S-X. |
| | (f) | None of the hours expended on the principal accountant’s engagement to audit the Registrant’s financial statements for the fiscal year ended October 31, 2016 were attributable to work performed by persons other than the principal accountant’s full-time, permanent employees. |
| | (g) | The aggregate non-audit fees and services billed by the Registrant’s accountant for each of the last two fiscal years were $89,474 and $95,990 for the fiscal years ended October 31, 2015 and October 31, 2016, respectively, as described above. |
Item 5. Audit Committee of Listed Registrants.
Not applicable.
Item 6. Schedule of Investments.
(a) Schedules of Investments in securities of unaffiliated issuers as of the close of the reporting period are included as part of the report to shareholders filed under Item 1 of this form.
(b) Not applicable.
Item 7. Disclosure of Proxy Voting Policies and Procedures for Closed-End Management Investment Companies.
Not applicable.
Item 8. Portfolio Managers of Closed-End Investment Management Companies.
Not applicable.
Item 9. Purchases of Equity Securities by Closed-End Management Investment Company and Affiliated Purchasers.
Not applicable.
Item 10. Submission of Matters to a Vote of Security Holders.
There have been no material changes to the procedures by which the shareholders may recommend nominees to the Registrant’s Board of Directors.
Item 11. Controls and Procedures.
(a) The Registrant’s Principal Executive Officer and Principal Financial Officer concluded that the Registrant’s disclosure controls and procedures (as defined in Rule 30a-3(c) under the Investment Company Act of 1940, as amended (the “1940 Act”) (17 CFR 270.30a-3(c))), are effective based on the evaluation of Registrant’s disclosure controls and procedures as of a date within 90 days prior to the filing date of this report.
(b) There were no changes in the Registrant’s internal control over financial reporting (as defined in Rule 30a-3(d) under the 1940 Act (17 CFR 270.30a-3(d))), that occurred during the Registrant’s second fiscal quarter of the period covered by this report that has materially affected, or is reasonably likely to materially affect, the Registrant’s internal control over financial reporting.
Item 12. Exhibits.
(a)(1) Code of Ethics for the Registrant’s President and Treasurer (Principal Executive Officer and Principal Financial Officer) described in Item 2 is attached hereto.
(a)(2) Certification of the Principal Executive Officer and Principal Financial Officer of the Registrant as required by Rule 30a-2(a) under the 1940 Act (17 CFR 270.30a-2(a)) is attached hereto as Exhibit 99.CERT.
(a)(3) Not applicable.
(b) Certification pursuant to Section 906 of the Sarbanes-Oxley Act of 2002 as required by Rule 30a-2(b), under the 1940 Act (17 CFR 270.30a-2(b)), Rule 15d-14(b) under the Securities Exchange Act of 1934, as amended (17 CFR 240.15d-14(b)) and Section 1350 of Chapter 63 of Title 18 of the United States Code (18 U.S.C. 1350) is attached hereto as Exhibit 99.906CERT.
SIGNATURES
Pursuant to the requirements of the Securities Exchange Act of 1934 and the Investment Company Act of 1940, the Registrant has duly caused this report to be signed on its behalf by the undersigned, thereunto duly authorized.
| | |
| (Registrant) THE GLENMEDE FUND, INC. |
| |
| By (Signature and Title) | | /s/ Mary Ann B. Wirts |
| | Mary Ann B. Wirts |
| | President |
| | (Principal Executive Officer) |
Date December 29, 2016
Pursuant to the requirements of the Securities Exchange Act of 1934 and the Investment Company Act of 1940, this report has been signed below by the following persons on behalf of the Registrant and in the capacities and on the dates indicated.
| | |
| By (Signature and Title) | | /s/ Mary Ann B. Wirts |
| | Mary Ann B. Wirts |
| | President |
| | (Principal Executive Officer) |
Date December 29, 2016
| | |
| | /s/ Kent E. Weaver |
| | Kent E. Weaver |
| | Treasurer |
| | (Principal Financial Officer) |
Date December 29, 2016