UNITED STATES
SECURITIES AND EXCHANGE COMMISSION
Washington, DC 20549
FORM N-CSR
CERTIFIED SHAREHOLDER REPORT OF REGISTERED
MANAGEMENT INVESTMENT COMPANIES
Investment Company Act File Number: 811-05577
The Glenmede Fund, Inc.
(Exact Name of Registrant as Specified in Charter)
100 Summer Street, Floor 7
SUM0703
Boston, MA 02110
(Address of Principal Executive Offices) (Zip Code)
Michael P. Malloy, Esq.
Secretary
Drinker Biddle & Reath LLP
One Logan Square
Suite 2000
Philadelphia, PA 19103-6996
(Name and Address of Agent for Service)
Registrant’s Telephone Number, including Area Code: 1-800-442-8299
Date of Fiscal Year End: October 31, 2018
Date of Reporting Period: October 31, 2018
Item 1. Reports to Stockholders.

The Glenmede Fund, Inc.
The Glenmede Portfolios
Annual Report
October 31, 2018
The performance for the portfolios shown on pages 2 to 4 and 6 to 25 represents past performance and is not a guarantee of future results. A portfolio’s share price and investment return will vary with market conditions, and the principal value of shares, when redeemed, may be more or less than their original cost.
An investment in a portfolio is neither insured nor guaranteed by the U.S. Government, the Federal Deposit Insurance Corporation, the Federal Reserve Board or any other governmental agency or bank.
Unlike actual fund performance, performance of an index does not reflect any expenses or transaction costs. A direct investment in an unmanaged index is not possible.
The reports concerning the portfolios included in this shareholder report may contain certain forwardlooking statements about the factors that may affect the performance of the portfolios in the future. These statements are based on the adviser’s predictions and expectations concerning certain future events and their expected impact on the portfolios, such as performance of the economy as a whole and of specific industry sectors, changes in the levels of interest rates, the impact of developing world events and other factors that may influence the future performance of the portfolios. The adviser believes these forwardlooking statements to be reasonable, although they are inherently uncertain and difficult to predict. Actual events may cause adjustments in portfolio management strategies from those currently expected to be employed.
THE GLENMEDE FUND, INC.
THE GLENMEDE PORTFOLIOS
TABLE OF CONTENTS
THE GLENMEDE FUND, INC. AND THE GLENMEDE PORTFOLIOS
PRESIDENT’S LETTER
Dear Shareholder:
We are pleased to present the annual report of the Glenmede family of funds for the fiscal year ended October 31, 2018. Domestic equity markets were volatile during the fiscal year ended October 31, 2018, but realized positive returns fueled by strengthening employment numbers, rising corporate profits and subdued inflation. Global equity returns were negative as global growth slowed in developed and emerging market countries and trade concerns impacted the markets. The U.S. Government yield curve continued to flatten as the Federal Reserve raised the Fed Funds target interest rate four times. Money market fund yields also rose because of the increase in the Fed Funds target interest rate.
At the fiscal year end on October 31, 2018, The Glenmede Fund, Inc. and The Glenmede Portfolios (collectively, the “Glenmede Funds”) consisted of twenty portfolios with total assets of $12.8 billion. During the fiscal year, two new portfolios were launched: The Glenmede Quantitative U.S. Large Cap Value Equity Portfolio and the Glenmede Quantitative U.S. Small Cap Equity Portfolio.
This fiscal year ended October 31, 2018 showed positive returns across domestic equity asset classes in response to improving growth in the U.S. economy. The S&P 500 Index1 gained 7.35%. Small cap stocks did not do as well as large cap stocks with the Russell 2000® Index1 returning 1.85% versus a return of 6.98% on the Russell 1000® Index1 for the fiscal year ended October 31, 2018. The MSCI EAFE Index1 underperformed domestic stocks for the fiscal year, losing -6.85% due partially to U.S. dollar strength. Short term interest rates increased more than longer rates flattening the curve as the Fed Funds Target range rose to 2.00% – 2.25%. One year maturity treasuries rose 123 basis points3 and 30 year treasury yields rose only 51 basis points3. The Bloomberg Barclays U.S. Aggregate Bond Index1 lost -2.05% and the Bloomberg Barclays Municipal 1-10 Year Blend Index1 lost -0.52% for the fiscal year ended October 31, 2018.
The Glenmede Quantitative U.S. Large Cap Core Equity Portfolio achieved a five star («««««) Overall Morningstar Rating™2 among 1,218 Large Blend Equity Funds for the period ended October 31, 2018 (based on risk adjusted returns). The Glenmede Secured Options Portfolio achieved a four star (««««) Overall Morningstar Rating™2 among 87 Option Writing Funds for the period ended October 31, 2018 (based on risk adjusted returns). The Glenmede Quantitative U.S. Large Cap Growth Equity Portfolio achieved a four star (««««) Overall Morningstar Rating™2 among 1,253 Large Growth Equity Funds for the period ended October 31, 2018 (based on risk adjusted returns). The Glenmede Strategic Equity Portfolio achieved a four star (««««) Overall Morningstar Rating™2 among 1,218 Large Blend Equity Funds for the period ended October 31, 2018 (based on risk adjusted returns). The Glenmede Quantitative U.S. Total Market Equity Portfolio achieved a four star (««««) Overall Morningstar Rating™2 among 363 Mid-Cap Value Funds for the period ended October 31, 2018 (based on risk adjusted returns).
We have featured the Strategic Equity Portfolio and included Portfolio Highlights for each individual fund in this report. We welcome any questions about the Glenmede Funds and thank our shareholders for their continued support.
Sincerely,
Mary Ann B. Wirts
President
November 20, 2018
Past performance is no guarantee of future results.
Mutual fund investing involves risks. Principal loss is possible. The Portfolios may invest in foreign securities which, especially in emerging markets, will involve greater volatility and political, economic and currency risks and differences in accounting methods. The Small Cap Equity Portfolio, Quantitative U.S. Small Cap Equity Portfolio and Mid Cap Equity Portfolio invest in smaller companies, which will involve additional risks such as limited liquidity and greater volatility than larger companies. The Quantitative U.S. Large Cap Value Equity Portfolio may invest in IPOs and the market value of IPO shares could fluctuate considerably due to factors such as the absence of a prior public market, unseasoned trading, the small number of shares available for trading, and limited information about the issuer. Short sales by the Quantitative U.S. Long/Short Equity Portfolio and Quantitative U.S. Total Market Equity Portfolio involve leverage risk, credit exposure to brokers that execute the short sales and have potentially unlimited losses. Use of derivatives by the Secured Options Portfolio and the Global Secured Options Portfolio may involve greater liquidity, counterparty, credit and pricing risks. The Muni Intermediate Portfolio, High Yield Municipal Portfolio and Short Term Tax Aware Fixed Income Portfolio invest in debt instruments of municipal issuers whose ability to meet their obligations may be affected by political and economic factors in the Issuer’s region. Investments in debt securities typically decrease in value when interest rates rise. This risk is usually greater for longer-term debt securities. Income from tax-exempt funds may be subject to state and local taxes and a portion of income may be subject to the federal alternative minimum tax for certain investors. Federal income tax rules will apply to any capital gains distributions. Investments in asset backed and mortgage backed securities include additional risks that investors should be aware of such as credit risk, prepayment risk, possible illiquidity and default, as well as increased susceptibility to adverse economic developments. The High Yield Municipal Portfolio invests in “Junk Bonds” which are securities rated below investment grade and are high risk investments that have greater credit risk, are less liquid and have more volatile prices than investment grade bonds. The Secured Options Portfolio and the Global Secured Options Portfolio invest in options which have risks of unlimited losses of the underlying holdings due to unanticipated market movements and failure to correctly predict the direction of the securities prices, interest rates and currency exchange rates. Covered call writing may limit the upside of an underlying security. This investment may not be suitable for all investors. The application of the social, governance and/or environmental standards of the Responsible ESG U.S. Equity Portfolio and the women in leadership criteria of the Women in Leadership U.S. Equity Portfolio will affect each Portfolio’s exposure to certain Issuers, industries, sectors, regions and countries and may impact the relative performance of these Portfolios, either positively or negatively, depending on whether such investments are in or out of favor. The Equity Income Portfolio invests in dividend paying stocks. Issuers that have paid regular dividends or distributions to shareholders may not continue to do so at the same level or at all in the future. Dividend paying securities can fall out of favor with the market, causing the Portfolio during such periods to underperform funds that do not focus on dividends.
Diversification does not assure a profit or protect against a loss in a declining market.
An investment in a Portfolio is neither insured nor guaranteed by the Federal Deposit Insurance Corporation, any other government agency or bank.
| 1 | The indices are defined on pages 26 to 27. |
| 2 | ©2018 Morningstar, Inc. All Rights Reserved. The information contained herein: (1) is proprietary to Morningstar and/or its content providers; (2) may not be copied or distributed; and (3) is not warranted to be accurate, complete or timely. Neither Morningstar nor its content providers are responsible for any damages or losses arising from any use of this information. Past performance is no guarantee of future results. |
The Morningstar Rating™ for funds, or “star rating”, is calculated for managed products (including mutual funds, variable annuity and variable life subaccounts, exchange-traded funds, closed-end funds, and separate accounts) with at least a three-year history. Exchange-traded funds and open-ended mutual funds are considered a single population for comparative purposes. It is calculated based on a Morningstar Risk-Adjusted Return measure that accounts for variation in a managed product’s monthly excess performance, placing more emphasis on downward variations and rewarding consistent performance. The top 10% of products in each product category receive 5 stars, the next 22.5% receive 4 stars, the next 35% receive 3 stars, the next 22.5% receive 2 stars, and the bottom 10% receive 1 star. The Overall Morningstar Rating™ for a managed product is derived from a weighted average of the performance figures associated with its three-, five-, and 10-year (if applicable) Morningstar Rating™ metrics. The weights are: 100% three-year rating for 36-59 months of total returns, 60% five-year rating/40% three-year rating for 60-119 months of total returns, and 50% 10-year rating/30% five-year rating/20% three-year rating for 120 or more months of total returns. While the 10-year overall star rating formula seems to give the most weight to the 10-year period, the most recent three-year period actually has the greatest impact because it is included in all three rating periods. The Quantitative U.S. Large Cap Core Equity Portfolio (Advisor Class and Institutional Class) was rated against the following numbers of U.S.-domiciled Large Blend Equity funds over the following time periods: 1,218 funds overall, 1,218 funds in the last three years, 1,084 funds in the last five years, and 817 funds in the last ten years. With respect to these Large Blend Equity funds, the Quantitative U.S. Large Cap Core Equity Portfolio (Advisor Class and Institutional Class) received an Overall Morningstar Rating™ of ««««« stars and a Morningstar Rating™ of ««« stars, «« ««« stars, and «« ««« stars for the three-, five- and ten-year periods, respectively. The Quantitative U.S. Large Cap Growth Equity Portfolio (Advisor Class and Institutional Class) was rated against the following numbers of U.S.-domiciled Large Growth Equity funds over the following time periods: 1,253 funds overall, 1,253 funds in the last three years, 1,120 funds in the last five years and 811 funds in the last ten years. With respect to these Large Growth Equity funds, the Quantitative U.S. Large Cap Growth Equity Portfolio (Advisor Class and
Institutional Class) received an Overall Morningstar Rating™ of «« «« stars and a Morningstar Rating™ of ««« stars, «« «« stars, and «« «« stars for the three-, five- and ten-year periods, respectively. The Secured Options Portfolio (Advisor Class and Institutional Class) was rated against the following numbers of Option Writing funds over the following time periods: 87 funds overall, 87 funds in the last three years, and 53 funds in the last five years. With respect to these Option Writing funds, the Secured Options Portfolio (Advisor Class and Institutional Class) received an Overall Morningstar Rating™ of «« «« stars and a Morningstar Rating™ of ««« stars and «« «« stars for the three- and five- year periods, respectively. The Strategic Equity Portfolio was rated against the following numbers of U.S.- domiciled Large Blend Equity funds over the following time periods: 1,218 funds overall, 1,218 funds in the last three years, 1,084 funds in the last five years and 817 funds in the last ten years. With respect to these Large Blend Equity funds, the Strategic Equity Portfolio received an Overall Morningstar Rating™ of «« «« stars and a Morningstar Rating™ of «« «« « stars, ««««« stars and «« « stars for the three-, five- and ten- year periods, respectively. The Quantitative U.S. Total Market Equity Portfolio was rated against the following numbers of U.S.- domiciled Mid-Cap Value funds over the following time periods: 363 funds overall, 363 funds in the last three years, 306 funds in the last five years and 220 funds in the last ten years. With respect to these Mid-Cap Value funds, the Quantitative U.S. Total Market Equity Portfolio received an Overall Morningstar Rating™ of «««« stars and a Morningstar Rating™ of «««« stars, «« «« « stars and «««« stars for the three-, five- and ten-year periods, respectively. Past performance is no guarantee of future results.
| 3 | A basis point equals .01%. |
This material must be preceded or accompanied by a current prospectus.
The Glenmede Fund, Inc. and The Glenmede Portfolios are distributed by Quasar Distributors, LLC. 12/18.
Bond ratings are grades given to bonds that indicate their credit quality as determined by a private independent rating service such as Standard & Poor’s. The firm evaluates a bond issuer’s financial strength, or its ability to pay a bond’s principal and interest in a timely fashion. Ratings are expressed as letters ranging from ’AAA’, which is the highest grade, to ’D’, which is the lowest grade. In limited situations when the rating agency has not issued a formal rating, the rating agency will classify the security as nonrated.
THE GLENMEDE FUND, INC.


Strategic Equity Portfolio
The Portfolio, managed by John Kichula, CFA and Mark Livingston, CFA, is intended to provide a core large-capitalization equity exposure for its investors and is benchmarked against the S&P 500 Index. The aim of the Portfolio is to achieve maximum long-term total return consistent with reasonable risk to principal. The majority of the possible return is expected to come through capital appreciation of the Portfolio’s holdings and the managers also attempt to minimize the impact of Federal and state income taxes by, for example, avoiding realizing short-term gains or taking advantage of offsetting losses. The Portfolio focuses on companies that have demonstrated strong levels of profitability relative to their peers and seeks to identify those whose competitive position appears likely to allow them to continue to do so in the future. Historically, on average, such companies have been able to deliver attractive long-term returns while generally seeing less downside risk versus the Portfolio’s benchmark in periods of economic stress. The portfolio managers and analysts on the Strategic Equity team attempt to maintain a diversified portfolio of such companies where they believe the valuation of the shares creates an attractive reward potential relative to the risk inherent in each business. In general, the team expects to hold an investment for a multi-year period as long as it continues to meet the Portfolio’s investment criteria.
Mr. Kichula is a Portfolio Manager/Research Analyst- Equities for Glenmede Investment Management LP. He has worked in the investment management and financial services business for over 27 years, in various roles as an analyst and portfolio manager. He has been with Glenmede for 16 years working as an analyst for the Strategic Equity strategy and has been a portfolio manager of the Portfolio since 2015.
Mark Livingston is a Portfolio Manager/Research Analyst- Equities for Glenmede Investment Management LP. He has worked in the investment management and financial services business for almost 15 years, as an analyst and portfolio manager. He has been with Glenmede for 8 years working as an analyst for the Strategic Equity strategy and has been a portfolio manager of the Portfolio since 2016.
THE GLENMEDE FUND, INC.
Quantitative U.S. Large Cap Core Equity Portfolio
PORTFOLIO HIGHLIGHTS
October 31, 2018
| | | | | | | | | | | | | | | | | | | | |
| Average Annual Total Return | |
| | | Return
Before
Taxes | | | Return After Taxes on | | | Russell 1000®
Index | | | Morningstar
Large Blend
Average | |
Quantitative U.S. Large Cap Core Equity Portfolio – Advisor
Class | | Distributions | | | Distributions
and Sales of
Fund Shares | |
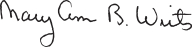
Year ended 10/31/18 | | | 4.42% | | | | 3.07% | | | | 3.37% | | | | 6.98% | | | | 5.28% | |
Five Years ended 10/31/18 | | | 11.75% | | | | 10.94% | | | | 9.23% | | | | 11.05% | | | | 9.00% | |
Ten Years ended 10/31/18 | | | 14.75% | | | | 14.24% | | | | 12.40% | | | | 13.42% | | | | 11.59% | |
Inception (02/27/04) through 10/31/181 | | | 9.36% | | | | 8.93% | | | | 7.83% | | | | 8.42% | | | | 7.00% | |
| | | | | | |
Quantitative U.S. Large Cap Core Equity Portfolio – Institutional
Class | | | | | | | | | | | | | | | |
Year ended 10/31/18 | | | 4.61% | | | | 3.19% | | | | 3.49% | | | | 6.98% | | | | 5.28% | |
Inception (12/30/15) through 10/31/181,2 | | | 9.56% | | | | 9.11% | | | | 8.00% | | | | 8.42% | | | | 7.00% | |
For the fiscal year ended October 31, 2018, the Portfolio’s Advisor Class underperformed the Russell 1000® Index by 2.56% and the Morningstar Large Blend Average by 0.86%, respectively. In the past year, the Portfolio’s performance was negatively impacted from its relatively lower average market capitalization and underexposures to large technology/internet companies such as Apple (AAPL, +31.4%), Amazon (AMZN, +44.6%), and Microsoft (MSFT, +30.7%) versus the benchmark index. The Portfolio’s performance had mixed contributions from multifactor ranking models with unfavorable effects from biases towards stocks with lower valuations. Avoiding stocks based on downside risk screens (including sell rankings and earnings surprise indicators) had favorable impacts. Leading industry group indicators were positive to performance, including relative overweightings of information technology and underweightings of industrial stocks. The Portfolio had positive relative stock performance in six of eleven sectors. The most favorable contributions from stock selection came in energy and consumer staples sectors. The most negative contributions from stock selection were in information technology and consumer discretionary sectors. The Portfolio’s gross annual operating expense ratio, as stated in the February 28, 2018 Prospectuses, are 0.86% (Advisor Class) and 0.66% (Institutional Class), respectively. These ratios can fluctuate and may differ from the expense ratios disclosed in the Financial Highlights section of this report.
| * | Assumes the reinvestment of all dividends and distributions. |
Performance data quoted represents past performance; past performance does not guarantee future results. The investment return and principal value of an investment will fluctuate so that an investor’s shares, when redeemed, may be worth more or less than their original cost. Current performance may be higher or lower than the total return shown. Please call the Fund at 1-800-442-8299 to obtain the most recent month-end return. Returns, other than after-tax returns are calculated using the historical highest individual federal marginal income tax rates, do not reflect the impact of state and local taxes and are not relevant to investors who hold their shares through tax-deferred arrangements such as 401(k) plans or IRAs. Actual after-tax returns depend on the investor’s tax situation and may differ from those shown. Performance of the Institutional Class will vary from the Advisor Class due to differences in fees.
| 1 | Benchmark returns are for the period beginning February 28, 2004. |
| 2 | Average annual total return for the Institutional Class includes the period from 02/27/04 through 10/31/18. Prior to the inception of the Institutional Class on 12/30/15, performance for the Institutional Class is based on the average annual total return of the Advisor Class. |
The indices and certain terms are defined on pages 26 to 27.
THE GLENMEDE FUND, INC.
Quantitative U.S. Large Cap Growth Equity Portfolio
PORTFOLIO HIGHLIGHTS
October 31, 2018
| | | | | | | | | | | | | | | | | | | | |
| Average Annual Total Return | |
| | | Return
Before
Taxes | | | Return After Taxes on | | | Russell 1000®
Growth Index | | | Morningstar
Large Growth
Average | |
Quantitative U.S. Large Cap Growth Equity Portfolio –
Advisor Class | | Distributions | | | Distributions
and Sales of
Fund Shares | |
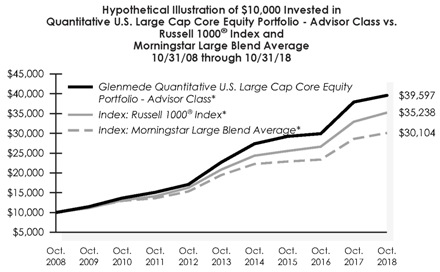
Year ended 10/31/18 | | | 5.53% | | | | 4.89% | | | | 3.62% | | | | 10.71% | | | | 8.70% | |
Five Years ended 10/31/18 | | | 13.21% | | | | 12.58% | | | | 10.43% | | | | 13.43% | | | | 10.91% | |
Ten Years ended 10/31/18 | | | 15.92% | | | | 15.54% | | | | 13.48% | | | | 15.45% | | | | 13.18% | |
Inception (02/27/04) through 10/31/181 | | | 9.86% | | | | 9.55% | | | | 8.30% | | | | 9.26% | | | | 7.72% | |
| | | | | | |
Quantitative U.S. Large Cap Growth Equity Portfolio –
Institutional Class | | | | | | | | | | | | | | | |
Year ended 10/31/18 | | | 5.74% | | | | 5.02% | | | | 3.75% | | | | 10.71% | | | | 8.70% | |
Inception (11/05/15) through 10/31/181,2 | | | 10.07% | | | | 9.74% | | | | 8.49% | | | | 9.26% | | | | 7.72% | |
For the fiscal year ended October 31, 2018, the Portfolio’s Advisor Class underperformed the Russell 1000® Growth Index by 5.18% and the Morningstar Large Growth Average by 3.17%, respectively. In the past year, the Portfolio’s performance was negatively impacted from its relatively lower average market capitalization and underexposures to large technology/internet companies such as Apple (AAPL, +31.4%), Amazon (AMZN, +44.6%), and Microsoft (MSFT, +30.7%) versus the benchmark index. The Portfolio’s performance had mixed contributions from multifactor ranking models with unfavorable effects from biases towards stocks with lower valuations. Leading industry group indicators were positive to performance, including relative overweightings of information technology and underweightings of industrial stocks. The Portfolio had positive relative stock performance in two of ten sectors. The positive contributions from stock selection came in health care and industrial sectors. The most negative contributions from stock selection were in information technology and consumer discretionary sectors. The Portfolio’s gross annual operating expense ratios, as stated in the February 28, 2018 Prospectuses, are 0.86% (Advisor Class) and 0.66% (Institutional Class), respectively. These ratios can fluctuate and may differ from the expense ratios disclosed in the Financial Highlights section of this report.
| * | Assumes the reinvestment of all dividends and distributions. |
Performance data quoted represents past performance; past performance does not guarantee future results. The investment return and principal value of an investment will fluctuate so that an investor’s shares, when redeemed, may be worth more or less than their original cost. Current performance may be higher or lower than the total return shown. Please call the Fund at 1-800-442-8299 to obtain the most recent month-end return. Returns, other than after-tax returns are calculated using the historical highest individual federal marginal income tax rates, do not reflect the impact of state and local taxes and are not relevant to investors who hold their shares through tax-deferred arrangements such as 401(k) plans or IRAs. Actual after-tax returns depend on the investor’s tax situation and may differ from those shown. Performance of the Institutional Class will vary from the Advisor Class due to differences in fees.
| 1 | Benchmark returns are for the period beginning February 28, 2004. |
| 2 | Average annual total return for the Institutional Class includes the period from 02/27/04 through 10/31/18. Prior to the inception of the Institutional Class on 11/05/15, performance for the Institutional Class is based on the average annual total return of the Advisor Class. |
The indices and certain terms are defined on pages 26 to 27.
THE GLENMEDE FUND, INC.
Quantitative U.S. Large Cap Value Equity Portfolio
PORTFOLIO HIGHLIGHTS
October 31, 2018
| | | | | | | | | | | | | | | | |
| Average Annual Total Return | |
| | | Return
Before
Taxes | | | Return After Taxes on | | | Russell 1000®
Value Index | |
| Quantitative U.S. Large Cap Value Equity Portfolio | | Distributions | | | Distributions
and Sales of
Fund Shares | |
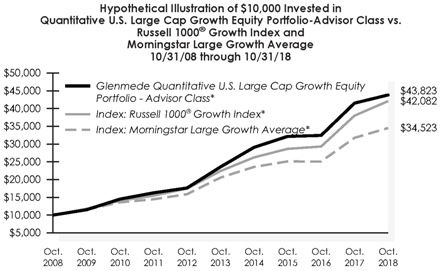
Since Inception (11/13/17) through 10/31/18 | | | -0.69% | | | | -1.11% | | | | -0.36% | | | | 3.01% | |
Since inception on November 13, 2017, the Portfolio underperformed the Russell 1000® Value Index by 3.70%. The Portfolio’s performance had mixed contributions from multifactor ranking models, including biases towards stocks with lower valuations. The Portfolio’s performance was negatively impacted from its relatively lower average market capitalization and underexposures to large technology/internet companies such as Cisco (CSCO, +38.8%) and Verizon (VZ, +33.6%) versus the benchmark index. The Portfolio had positive relative stock performance in six of eleven sectors. The most favorable contributions from stock selection came in energy and utilities sectors. The most negative contributions from stock selection were in information technology and consumer staples sectors. The Portfolio’s gross annual operating expense ratio, as stated in the February 28, 2018 Prospectus, is 3.90%. This ratio can fluctuate and may differ from the expense ratio disclosed in the Financial Highlights section of this report.
| * | Assumes the reinvestment of all dividends and distributions. |
Performance data quoted represents past performance; past performance does not guarantee future results. The investment return and principal value of an investment will fluctuate so that an investor’s shares, when redeemed, may be worth more or less than their original cost. Current performance may be higher or lower than the total return shown. Please call the Fund at 1-800-442-8299 to obtain the most recent month-end return. Returns, other than after-tax returns are calculated using the historical highest individual federal marginal income tax rates, do not reflect the impact of state and local taxes and are not relevant to investors who hold their shares through tax-deferred arrangements such as 401(k) plans or IRAs. Actual after-tax returns depend on the investor’s tax situation and may differ from those shown.
The indices and certain terms are defined on pages 26 to 27.
THE GLENMEDE FUND, INC.
Quantitative U.S. Small Cap Equity Portfolio
PORTFOLIO HIGHLIGHTS
October 31, 2018
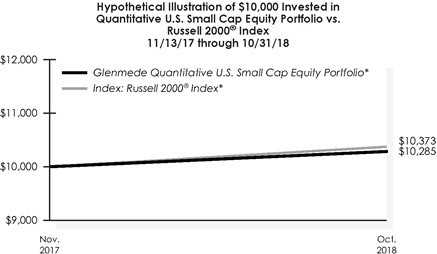
| | | | | | | | | | | | | | | | |
| Average Annual Total Return | |
| | | Return
Before
Taxes | | | Return After Taxes on | | | Russell 2000®
Index | |
| Quantitative U.S. Small Cap Equity Portfolio | | Distributions | | | Distributions
and Sales of
Fund Shares | |
Since inception (11/13/17) through 10/31/18 | | | 2.85% | | | | 2.73% | | | | 1.72% | | | | 3.73% | |
Since inception on November 13, 2017, the Portfolio underperformed the Russell 2000® Index by 0.88%. The Portfolio was negatively impacted from no exposure to some outperforming biotechnology/internet companies in the benchmark index, including Sarepta Therapeutics (SRPT, +76.3%) and Grubhub (GRUB, +71.1%). The Portfolio’s performance had mixed contributions from multifactor ranking models with unfavorable effects from biases towards stocks with lower valuations. The Portfolio had positive relative stock performance in six of eleven sectors. The most favorable contributions from stock selection came in energy and consumer discretionary sectors. The most negative contributions from stock selection were in consumer staples and materials sectors. The Portfolio’s gross annual operating expense ratio, as stated in the February 28, 2018 Prospectus, is 3.87%. This ratio can fluctuate and may differ from the expense ratio disclosed in the Financial Highlights section of this report.
| * | Assumes the reinvestment of all dividends and distributions. |
Performance data quoted represents past performance; past performance does not guarantee future results. The investment return and principal value of an investment will fluctuate so that an investor’s shares, when redeemed, may be worth more or less than their original cost. Current performance may be higher or lower than the total return shown. Please call the Fund at 1-800-442-8299 to obtain the most recent month-end return. Returns, other than after-tax returns are calculated using the historical highest individual federal marginal income tax rates, do not reflect the impact of state and local taxes and are not relevant to investors who hold their shares through tax-deferred arrangements such as 401(k) plans or IRAs. Actual after-tax returns depend on the investor’s tax situation and may differ from those shown.
The indices and certain terms are defined on pages 26 to 27.
THE GLENMEDE FUND, INC.
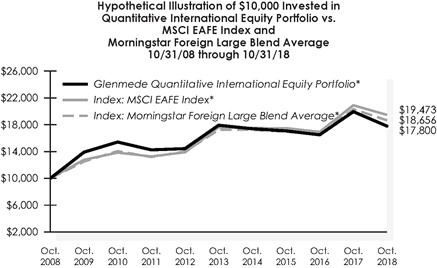
Quantitative International Equity Portfolio
PORTFOLIO HIGHLIGHTS
October 31, 2018
| | | | | | | | | | | | | | | | | | | | |
| Average Annual Total Return | |
| | | Return
Before
Taxes | | | Return After Taxes on | | | MSCI EAFE
Index | | | Morningstar
Foreign Large
Blend Average | |
| Quantitative International Equity Portfolio | | Distributions | | | Distributions
and Sales of
Fund Shares | |
Year ended 10/31/18 | | | -10.80% | | | | -11.47% | | | | -6.31% | | | | -6.85% | | | | -8.26% | |
Five Years ended 10/31/18 | | | -0.15% | | | | -0.52% | | | | -0.08% | | | | 2.02% | | | | 1.65% | |
Ten Years ended 10/31/18 | | | 5.94% | | | | 5.61% | | | | 4.91% | | | | 6.89% | | | | 6.42% | |
Inception (11/17/88) through 10/31/181 | | | 6.30% | | | | 5.06% | | | | 5.10% | | | | 4.40% | | | | 5.19% | |
For the fiscal year ended October 31, 2018, the Portfolio underperformed the MSCI EAFE Index by 3.95% and Morningstar Foreign Large Blend Average by 2.54%, respectively. The Portfolio’s performance had mixed contributions from multifactor ranking models with unfavorable effects from biases towards stocks with lower valuations (e.g. Price/ Earnings Ratios of less than 15). The Portfolio’s performance was positively impacted by leading country/region indicators with relative overweighting in Japanese stocks and underweightings of German/Belgian stocks, respectively. Leading industry group indicators were negative to performance, including relative overweightings of financial and underweightings of energy stocks. The Portfolio had positive relative stock performance in four of eleven sectors. The most favorable contributions from stock selection came in the consumer staples and health care sectors. The most negative contributions from stock selection were in financials and industrials sectors. The Portfolio’s gross annual operating expense ratio, as stated in the February 28, 2018 Prospectus, is 1.06%. This ratio can fluctuate and may differ from the expense ratio disclosed in the Financial Highlights section of this report.
| * | Assumes the reinvestment of all dividends and distributions. |
Performance data quoted represents past performance; past performance does not guarantee future results. The investment return and principal value of an investment will fluctuate so that an investor’s shares, when redeemed, may be worth more or less than their original cost. The performance quoted above reflects fee waivers in effect during certain periods and would have been lower in their absence. Current performance may be higher or lower than the total return shown. Please call the Fund at 1-800-442-8299 to obtain the most recent month-end returns. Returns other than after tax returns, do not reflect taxes that the shareholder may pay on fund distributions or the redemption of fund shares. After-tax returns are calculated using the historical highest individual federal marginal income tax rates, do not reflect the impact of state and local taxes and are not relevant to investors who hold their shares through tax-deferred arrangements such as 401(k) plans or IRAs. Actual after-tax returns depend on the investor’s tax situation and may differ from those shown.
| 1 | Benchmark returns are for the period beginning November 30, 1988. |
The indices and certain terms are defined on pages 26 to 27.
THE GLENMEDE FUND, INC.
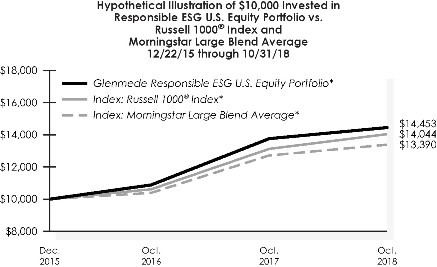
Responsible ESG U.S. Equity Portfolio
PORTFOLIO HIGHLIGHTS
October 31, 2018
| | | | | | | | | | | | |
| Average Annual Total Return | |
| Responsible ESG U.S. Equity Portfolio | | | | | Russell 1000®
Index | | | Morningstar
Large Blend
Average | |
Year ended 10/31/18 | | | 5.01% | | | | 6.98% | | | | 5.28% | |
Inception (12/22/15) through 10/31/181 | | | 13.73% | | | | 12.61% | | | | 10.84% | |
For the fiscal year ended October 31, 2018, the Portfolio underperformed the Russell 1000® Index by 1.97% and Morningstar Large Blend Average by 0.27%, respectively. The Portfolio selects stocks based on a combination of multi-factor models and ESG ratings (environmental, socially responsible and governance). In the past year, the Portfolio’s performance was negatively impacted from its relatively lower average market capitalization and underexposures to large technology/internet companies such as Apple (AAPL, +31.4%), Amazon (AMZN, +44.6%), and Microsoft (MSFT, +30.7%) versus the benchmark index. The Portfolio’s performance had mixed contributions from multifactor ranking models with unfavorable effects from biases towards stocks with lower valuations. Avoiding stocks based on downside risk screens (including sell rankings and earnings surprise indicators) had favorable impacts. Leading industry group indicators were positive to performance, including relative overweightings of information technology and underweightings of industrial stocks. The Portfolio had positive relative stock performance in four of eleven sectors. The most favorable contributions from stock selection came in energy and utilities sectors. The most negative contributions from stock selection were in industrials and technology sectors. The Portfolio’s gross annual operating expense ratio, as stated in February 28, 2018 Prospectus, is 1.23%. This ratio can fluctuate and may differ from expense ratio disclosed in Financial Highlights section of this report.
| * | Assumes the reinvestment of all dividends and distributions. |
Performance data quoted represents past performance; past performance does not guarantee future results. The investment return and principal value of an investment will fluctuate so that an investor’s shares, when redeemed, may be worth more or less than their original cost. The performance quoted reflects fee waivers and/or expense reimbursements in effect and would have been lower in their absence. Current performance may be higher or lower than the total return shown. Please call the Fund at 1-800-442-8299 to obtain the most recent month-end returns. Returns shown do not reflect taxes that a shareholder may pay on fund distributions or redemption of fund shares.
| 1 | Benchmark returns are for the periods beginning December 22, 2015 for the Russell 1000® Index and January 1, 2016 for Morningstar Large Blend Average. |
The indices and certain terms are defined on pages 26 to 27.
THE GLENMEDE FUND, INC.
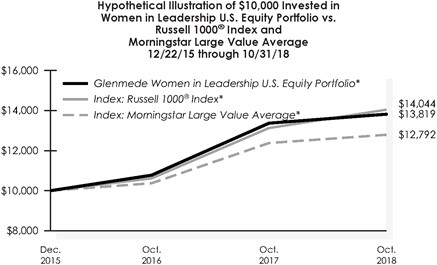
Women in Leadership U.S. Equity Portfolio
PORTFOLIO HIGHLIGHTS
October 31, 2018
| | | | | | | | | | | | |
| Average Annual Total Return | |
| Women in Leadership U.S. Equity Portfolio | | | | | Russell 1000®
Index | | | Morningstar
Large Value
Average | |
Year ended 10/31/18 | | | 3.36% | | | | 6.98% | | | | 3.34% | |
Inception (12/22/15) through 10/31/181 | | | 11.96% | | | | 12.61% | | | | 9.98% | |
For the fiscal year ended October 31, 2018, the Portfolio underperformed the Russell 1000® Index by 3.62% and outperformed the Morningstar Large Value Average by 0.02%, respectively. The Portfolio selects stocks based on companies that meet specific women in leadership criteria (including, but not limited to, a chairwoman, female chief executive officer, female board members or women in management positions). In the past year, the Portfolio’s performance was negatively impacted from its relatively lower average market capitalization and underexposures to large technology/internet companies such as Apple (AAPL, +31.4%), Amazon (AMZN, +44.6%), and Microsoft (MSFT, +30.7%) versus the benchmark index. The Portfolio’s performance had mixed contributions from multifactor ranking models with unfavorable effects from biases towards stocks with lower valuations. Leading industry group indicators were positive to performance, including relative overweightings of information technology and underweightings of industrial stocks. The Portfolio had positive relative stock performance in one of eleven sectors. The positive contribution from stock selection came in the energy sector. The most negative contributions from stock selection were in the industrials and financials sectors. The Portfolio’s gross annual operating expense ratio, as stated in February 28, 2018 Prospectus, is 1.28%. This ratio can fluctuate and may differ from expense ratio disclosed in Financial Highlights section of this report.
| * | Assumes the reinvestment of all dividends and distributions. |
Performance data quoted represents past performance; past performance does not guarantee future results. The investment return and principal value of an investment will fluctuate so that an investor’s shares, when redeemed, may be worth more or less than their original cost. The performance quoted reflects fee waivers and/or expense reimbursements in effect and would have been lower in their absence. Current performance may be higher or lower than the total return shown. Please call the Fund at 1-800-442-8299 to obtain the most recent month-end returns. Returns shown do not reflect taxes that a shareholder may pay on fund distributions or redemption of fund shares.
| 1 | Benchmark returns are for the periods beginning December 22, 2015 for the Russell 1000® Index and January 1, 2016 for Morningstar Large Value Average. |
The indices and certain terms are defined on pages 26 to 27.
THE GLENMEDE FUND, INC.
Quantitative U.S. Long/Short Equity Portfolio
PORTFOLIO HIGHLIGHTS
October 31, 2018
| | | | | | | | | | | | | | | | |
| Average Annual Total Return | |
| Quantitative U.S. Long/Short Equity Portfolio | | | | | Bloomberg
Barclays
U.S. Treasury
Bellwether
3-Month Index | | | Russell 3000®
Index | | | Morningstar
Long/Short
Average | |
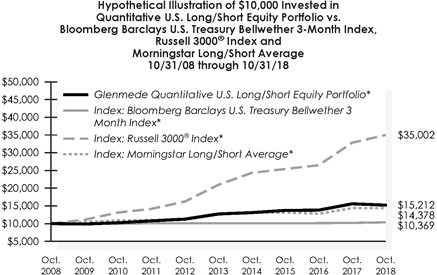
Year ended 10/31/18 | | | -2.41% | | | | 1.69% | | | | 6.60% | | | | 0.15% | |
Five Years ended 10/31/18 | | | 3.63% | | | | 0.57% | | | | 10.81% | | | | 2.57% | |
Ten Years ended 10/31/2018 | | | 4.28% | | | | 0.36% | | | | 13.35% | | | | 3.54% | |
Inception (09/29/06) through 10/31/181 | | | 2.26% | | | | 1.00% | | | | 8.31% | | | | 2.03% | |
For the fiscal year ended October 31, 2018, the Portfolio underperformed the Bloomberg Barclays U.S. Treasury Bellwether 3-Month Index by 4.10% and Morningstar Long/Short Average by 2.56%, respectively. Over the past year, the average net equity exposure for the Portfolio was about 30%. The Portfolio’s performance had mixed contributions from multifactor ranking models with unfavorable effects from biases towards stocks with lower valuations. The Russell 3000® Value Index (+2.8%) underperformed the Russell 3000® Growth Index by (+10.2%) by about 7.4%. The Portfolio’s long stock positions (+3.0%) underperformed short positions (+7.8%) by about 4.8%. Overall, the Portfolio had positive relative stock performance in four of eleven sectors. The most favorable contributions from stock selection came in health care and consumer staples sectors. The most negative contributions from stock selection were in information technology and financial sectors. The Portfolio’s gross annual operating expense ratio, as stated in the February 28, 2018 Prospectus, is 2.77%. This ratio can fluctuate and may differ from the expense ratio disclosed in the Financial Highlights section of this report.
| * | Assumes the reinvestment of all dividends and distributions. |
Performance data quoted represents past performance; past performance does not guarantee future results. The investment return and principal value of an investment will fluctuate so that an investor’s shares, when redeemed, may be worth more or less than their original cost. The performance quoted reflects fee waivers and/or expense reimbursements in effect and would have been lower in their absence. Current performance may be higher or lower than the total return shown. Please call the Fund at 1-800-442-8299 to obtain the most recent month-end returns. Returns shown do not reflect taxes that a shareholder may pay on fund distributions or redemption of fund shares.
| 1 | Benchmark returns are for the periods beginning September 30, 2006 for the Russell 3000® Index and October 1, 2006 for Morningstar Long/Short Average. |
The indices and certain terms are defined on pages 26 to 27.
THE GLENMEDE FUND, INC.
Quantitative U.S. Total Market Equity Portfolio
PORTFOLIO HIGHLIGHTS
October 31, 2018
| | | | | | | | | | | | |
| Average Annual Total Return | |
| Quantitative U.S. Total Market Equity Portfolio | | | | | Russell 3000®
Index | | | Morningstar
Mid-Cap
Value Average | |
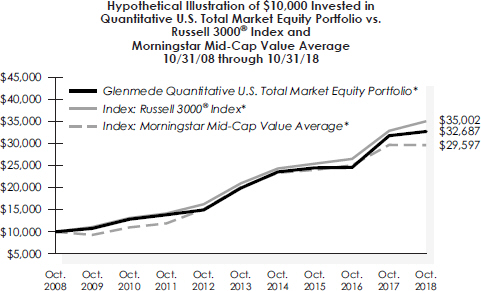
Year ended 10/31/18 | | | 3.01% | | | | 6.60% | | | | -0.20% | |
Five Years ended 10/31/18 | | | 10.46% | | | | 10.81% | | | | 6.74% | |
Ten Years ended 10/31/2018 | | | 12.57% | | | | 13.35% | | | | 12.06% | |
Inception (12/21/06) through 10/31/181 | | | 6.69% | | | | 7.85% | | | | 6.36% | |
For the fiscal year ended October 31, 2018, the Portfolio underperformed the Russell 3000® Index by 3.59% and outperformed the Morningstar Mid-Cap Value Average by 3.21%, respectively. In the past year, the Portfolio’s performance was negatively impacted from its relatively lower average market capitalization and underexposures to large technology/internet companies such as Apple (AAPL, +31.4%), Amazon (AMZN, +44.6%), and Microsoft (MSFT, +30.7%) versus the benchmark index. The Portfolio’s performance had mixed contributions from multifactor ranking models with unfavorable effects from biases towards stocks with lower valuations. The Russell 3000® Value Index (+2.8%) underperformed the Russell 3000® Growth Index by (+10.2%) by about 7.4%. The Portfolio’s long stock positions (+5.1%) underperformed short positions (+6.1%) by about 1%. Leading industry group indicators were positive to performance, including relative overweightings of information technology and underweightings of industrial stocks. Overall, the Portfolio had positive relative stock performance in five of eleven sectors. The most favorable contributions from stock selection came in health care and energy sectors. The most negative contributions from stock selection were in information technology and industrials sectors. The Portfolio’s gross annual operating expense ratio, as stated in the February 28, 2018 Prospectus, is 2.40%. This ratio can fluctuate and may differ from the expense ratio disclosed in the Financial Highlights section of this report.
| * | Assumes the reinvestment of all dividends and distributions. |
Performance data quoted represents past performance; past performance does not guarantee future results. The investment return and principal value of an investment will fluctuate so that an investor’s shares, when redeemed, may be worth more or less than their original cost. The performance quoted reflects fee waivers and/or expense reimbursements in effect and would have been lower in their absence. Current performance may be higher or lower than the total return shown. Please call the Fund at 1-800-442-8299 to obtain the most recent month-end returns. Returns shown do not reflect taxes that a shareholder may pay on fund distributions or redemption of fund shares.
| 1 | Benchmark returns are for the periods beginning December 31, 2006 for the Russell 3000® Index and January 1, 2007 for Morningstar Mid-Cap Value Average. |
The indices and certain terms are defined on pages 26 to 27.
THE GLENMEDE FUND, INC.
Strategic Equity Portfolio
PORTFOLIO HIGHLIGHTS
October 31, 2018
| | | | | | | | | | | | | | | | | | | | |
| Average Annual Total Return | |
| | | | | | Return After Taxes on | | | | | | | |
| Strategic Equity Portfolio | | Return
Before
Taxes | | | Distributions | | | Distributions
and Sales of
Fund Shares | | | S&P 500
Index | | | Morningstar
Large Blend
Average | |
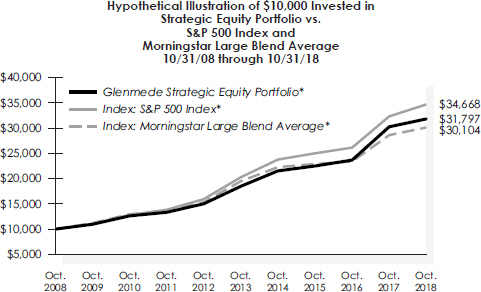
Year ended 10/31/18 | | | 5.14% | | | | 3.24% | | | | 4.22% | | | | 7.35% | | | | 5.28% | |
Five Years ended 10/31/18 | | | 11.47% | | | | 8.91% | | | | 8.55% | | | | 11.34% | | | | 9.00% | |
Ten Years ended 10/31/18 | | | 12.26% | | | | 10.87% | | | | 9.92% | | | | 13.24% | | | | 11.59% | |
Inception (07/20/89) through 10/31/181 | | | 8.81% | | | | 7.39% | | | | 7.11% | | | | 9.72% | | | | 8.17% | |
For the fiscal year ended October 31, 2018, the Strategic Equity Portfolio returned 5.14%, while its benchmark, the S&P 500 Index, returned 7.35% for the same period. Relative performance of the Portfolio versus the Index was weaker in the Health Care, Financials and Consumer Discretionary sectors, largely due to stock selection. This was partially offset by better performance from Portfolio holdings within the Industrial and Consumer Staples sectors. The Portfolio’s relative sector allocations were also generally helpful, notably within the Technology, Material and Utilities sectors. The Portfolio’s focus on owning companies that demonstrate consistently strong profitability also aided relative performance during this period, when the average stock in the Index underperformed the capitalization-weighted aggregate by almost 200 basis points. The Portfolio seeks to generate outperformance over time by investing in those companies with strong profitability whose shares are trading at attractive valuations. The Portfolio’s gross annual operating expense ratio, as stated in the February 28, 2018 Prospectus, is 0.82%. This ratio can fluctuate and may differ from the expense ratio disclosed in the Financial Highlights section of this report.
| * | Assumes the reinvestment of all dividends and distributions. |
Performance data quoted represents past performance; past performance does not guarantee future results. The investment return and principal value of an investment will fluctuate so that an investor’s shares, when redeemed, may be worth more or less than their original cost. Current performance may be higher or lower than the total return shown. Please call the Fund at 1-800-442-8299 to obtain the most recent month-end returns. Returns, other than after-tax returns, do not reflect taxes that the shareholder may pay on fund distributions or the redemption of fund shares. After-tax returns are calculated using the historical highest individual federal marginal income tax rates, do not reflect the impact of state and local taxes and are not relevant to investors who hold their shares through tax-deferred arrangements such as 401(k) plans or IRAs. Actual after-tax returns depend on the investor’s tax situation and may differ from those shown.
| 1 | Benchmark returns are for the period beginning July 31, 1989. |
The indices and certain terms are defined on pages 26 to 27.
THE GLENMEDE FUND, INC.
Small Cap Equity Portfolio
PORTFOLIO HIGHLIGHTS
October 31, 2018
| | | | | | | | | | | | | | | | | | | | |
| Average Annual Total Return | |
| Small Cap Equity Portfolio – Advisor Class | | | | | Russell 2000®
Index | | | Russell 2000®
Value Index | | | S&P 500
Index | | | Morningstar
Small Blend
Average | |
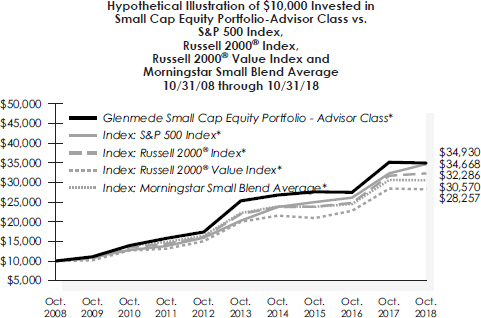
Year ended 10/31/18 | | | -0.58% | | | | 1.85% | | | | -0.59% | | | | 7.35% | | | | -0.07% | |
Five Years ended 10/31/18 | | | 6.66% | | | | 8.01% | | | | 7.18% | | | | 11.34% | | | | 6.56% | |
Ten Years ended 10/31/2018 | | | 13.32% | | | | 12.44% | | | | 10.95% | | | | 13.24% | | | | 11.82% | |
Inception (03/01/91) through 10/31/181 | | | 10.51% | | | | 9.96% | | | | 11.22% | | | | 9.73% | | | | 10.10% | |
| | | | | | |
| Small Cap Equity Portfolio – Institutional Class | | | | | | | | | | | | | | | |
Year ended 10/31/18 | | | -0.36% | | | | 1.85% | | | | -0.59% | | | | 7.35% | | | | -0.07% | |
Five Years ended 10/31/18 | | | 6.88% | | | | 8.01% | | | | 7.18% | | | | 11.34% | | | | 6.56% | |
Ten Years ended 10/31/18 | | | 13.55% | | | | 12.44% | | | | 10.95% | | | | 13.24% | | | | 11.82% | |
Inception (01/02/98) through 10/31/181,2 | | | 8.15% | | | | 7.54% | | | | 8.13% | | | | 7.05% | | | | 8.01% | |
For the fiscal year ended October 31, 2018, the Small Cap Equity Portfolio Advisor Class returned -0.58% and the Small Cap Equity Portfolio Institutional Class returned -0.36%, compared to the Russell 2000® Index return of 1.85% and the Morningstar Small Blend Average return of -0.07%. The financials sector accounted for the majority of the underperformance, followed by the materials and information technology sectors. The health care sector was the best performing sector on a relative basis. The Portfolio’s gross annual operating expense ratio, as stated in the February 28, 2018 Prospectuses is 0.90% and 0.70% for the Advisor and Institutional Class shares, respectively. These ratios can fluctuate and may differ from the expense ratios disclosed in the Financial Highlights section of this report.
| * | Assumes the reinvestment of all dividends and distributions. |
Performance data quoted represents past performance; past performance does not guarantee future results. The investment return and principal value of an investment will fluctuate so that an investor’s shares, when redeemed, may be worth more or less than their original cost. Current performance may be higher or lower than the total return shown. Please call the Fund at 1-800-442-8299 to obtain the most recent month-end returns. Returns do not reflect taxes that the shareholder may pay on fund distributions or the redemption of fund shares. Performance of the Institutional Class will vary from the Advisor Class due to differences in fees.
| 1 | Benchmark returns are for the inception period beginning February 28, 1991 for both Russell 2000® Indices and the S&P 500 Index and April 1, 1991 for the Morningstar Small Blend Average. |
| 2 | Average annual total return for the Institutional Class includes the period from 03/01/91 through 10/31/18. Prior to the inception of the Institutional Class on 01/02/98, performance for the Institutional Class is based on the average annual total return of the Advisor Class. |
The indices and certain terms are defined on pages 26 to 27.
THE GLENMEDE FUND, INC.
Mid Cap Equity Portfolio
PORTFOLIO HIGHLIGHTS
October 31, 2018
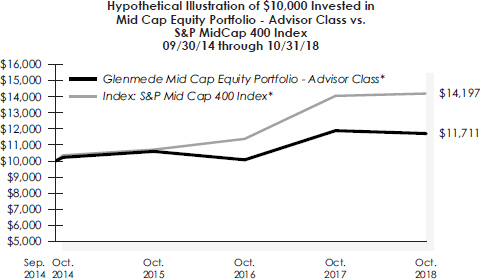
| | | | | | | | |
| Average Annual Total Return | |
| Mid Cap Equity Portfolio – Advisor Class1 | | | | | S&P MidCap
400 Index | |
Year ended 10/31/18 | | | -1.51% | | | | 1.02% | |
Inception (09/30/14) through 10/31/18 | | | 3.94% | | | | 8.96% | |
For the fiscal year ended October 31, 2018, the Mid Cap Equity Portfolio Advisor Class returned -1.51% compared to the S&P MidCap 400 Index return of 1.02%. The materials sector accounted for the majority of the underperformance, followed by the real estate and financials sectors. The utilities sector was the best performing sector on a relative basis. The Portfolio’s gross annual operating expense ratio, as stated in the February 28, 2018 Prospectus is 1.16% for the Advisor Class shares. This ratio can fluctuate and may differ from the expense ratio disclosed in the Financial Highlights section of this report.
| * | Assumes the reinvestment of all dividends and distributions. |
Performance data quoted represents past performance; past performance does not guarantee future results. The investment return and principal value of an investment will fluctuate so that an investor’s shares, when redeemed, may be worth more or less than their original cost. The performance quoted reflects fee waivers and/or expense reimbursements in effect and would have been lower in their absence. Current performance may be higher or lower than the total return shown. Please call the Fund at 1-800-442-8299 to obtain the most recent month-end returns. Returns shown do not reflect taxes that a shareholder may pay on fund distributions or redemption of fund shares.
| 1 | The Mid Cap Equity Portfolio Institutional Class has not commenced operations. |
The indices and certain terms are defined on pages 26 to 27.
THE GLENMEDE FUND, INC.
Large Cap Value Portfolio
PORTFOLIO HIGHLIGHTS
October 31, 2018
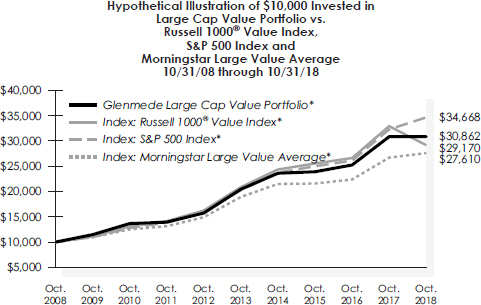
| | | | | | | | | | | | | | | | |
| Average Annual Total Return | |
| Large Cap Value Portfolio | | | | | Russell 1000®
Value Index | | | S&P 500
Index | | | Morningstar
Large Value
Average | |
Year ended 10/31/18 | | | 0.04% | | | | 3.03% | | | | 7.35% | | | | 3.34% | |
Five Years ended 10/31/18 | | | 8.58% | | | | 8.61% | | | | 11.34% | | | | 7.78% | |
Ten Years ended 10/31/2018 | | | 11.93% | | | | 11.30% | | | | 13.24% | | | | 10.66% | |
Inception (01/04/93) through 10/31/181 | | | 9.07% | | | | 9.65% | | | | 9.50% | | | | 8.11% | |
For the fiscal year ended October 31, 2018, the Large Cap Value Portfolio returned 0.04% versus 3.03% for its benchmark, the Russell 1000® Value Index. Stock selection in Financials was the biggest detractor, followed by the Communication and Energy sectors. Offsetting this was positive relative contributions from Consumer Staples, Industrials, and Real Estate sectors. The Portfolio’s gross annual operating expense ratio, as stated in the February 28, 2018 Prospectus, is 0.91%. This ratio can fluctuate and may differ from the expense ratio disclosed in the Financial Highlights section of this report.
| * | Assumes the reinvestment of all dividends and distributions. |
Performance data quoted represents past performance; past performance does not guarantee future results. The investment return and principal value of an investment will fluctuate so that an investor’s shares, when redeemed, may be worth more or less than their original cost. Current performance may be higher or lower than the total return shown. Please call the Fund at 1-800-442-8299 to obtain the most recent month-end returns. Returns do not reflect taxes that the shareholder may pay on fund distributions or the redemption of fund shares.
| 1 | Benchmark returns are for the period beginning December 31, 1992. |
The indices and certain terms are defined on pages 26 to 27.
THE GLENMEDE FUND, INC.
Equity Income Portfolio
PORTFOLIO HIGHLIGHTS
October 31, 2018
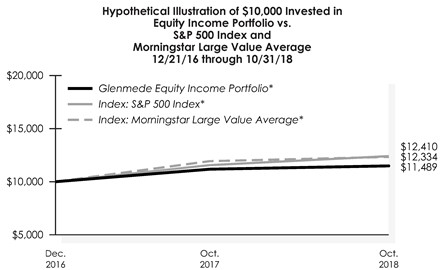
| | | | | | | | | | | | |
| Average Annual Total Return | |
| Equity Income Portfolio | | | | | S&P 500
Index | | | Morningstar
Large Value
Average | |
Year ended 10/31/18 | | | 2.79% | | | | 7.35% | | | | 3.34% | |
Inception (12/21/16) through 10/31/18 | | | 7.73% | | | | 12.31% | | | | 7.55% | |
For the fiscal year ended October 31, 2018, the Equity Income Portfolio returned 2.79% versus 7.35% for its benchmark, the S&P 500 Index. Most of this performance gap can be attributed to the underperformance of the dividend yield universe, which we define as stocks with a dividend yield greater than that of the S&P 500 Index. Looking at relative performance across sectors, Technology, Consumer Discretionary, and Financials were the most significant detractors. Positive relative performance came from the Materials, Consumer Staples, and Communication sectors. The Portfolio’s gross annual operating expense ratio, as stated in the February 28, 2018 Prospectus, is 2.08%. This ratio can fluctuate and may differ from the expense ratio disclosed in the Financial Highlights section of this report.
| * | Assumes the reinvestment of all dividends and distributions. |
Performance data quoted represents past performance; past performance does not guarantee future results. The investment return and principal value of an investment will fluctuate so that an investor’s shares, when redeemed, may be worth more or less than their original cost. The performance quoted reflects fee waivers and/or expense reimbursements in effect and would have been lower in their absence. Current performance may be higher or lower than the total return shown. Please call the Fund at 1-800-442-8299 to obtain the most recent month-end returns. Returns shown do not reflect taxes that a shareholder may pay on fund distributions or redemption of fund shares.
The indices and certain terms are defined on pages 26 to 27.
THE GLENMEDE FUND, INC.
Secured Options Portfolio
PORTFOLIO HIGHLIGHTS
October 31, 2018
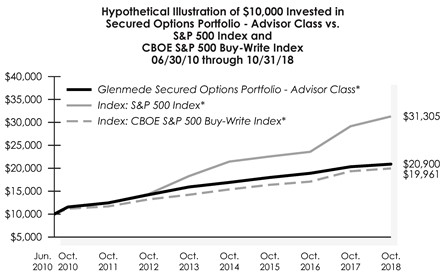
| | | | | | | | | | | | |
| Average Annual Total Return | |
| Secured Options Portfolio – Advisor Class | | | | | S&P 500
Index | | | CBOE S&P 500
Buy-Write
Index | |
Year ended 10/31/18 | | | 2.81% | | | | 7.35% | | | | 3.16% | |
Five Years ended 10/31/18 | | | 5.59% | | | | 11.34% | | | | 7.03% | |
Inception (06/30/10) through 10/31/18 | | | 9.24% | | | | 14.67% | | | | 8.64% | |
| | | | |
| Secured Options Portfolio – Institutional Class | | | | | | | | | |
Year ended 10/31/18 | | | 2.97% | | | | 7.35% | | | | 3.16% | |
Inception (11/09/16) through 10/31/181 | | | 9.49% | | | | 14.67% | | | | 8.64% | |
For the fiscal year ended October 31, 2018, the Secured Options Portfolio purchased and wrote put and call options in an effort to reduce share price volatility, obtain option premiums and provide more stable returns. For this period, the Portfolio’s Advisor Class achieved a total return of 2.81% while its benchmark, the CBOE S&P 500 Buy-Write Index, returned 3.16% and the S&P 500 Index returned 7.35%. The Portfolio’s underperformance relative to the CBOE S&P 500 Buy-Write Index was caused primarily by the Portfolio’s strike selection process and by the Portfolio’s use of cash-secured puts, which underperformed covered calls, the strategy utilized by the benchmark. Generally speaking, equity securities or cash positions are pledged to secure the written option positions. The Portfolio’s gross annual operating expense ratios, as stated in the February 28, 2018 Prospectuses, are 0.85% (Advisor Class) and 0.65% (Institutional Class), respectively. These ratios can fluctuate and may differ from the expense ratios disclosed in the Financial Highlights sections of this report.
| * | Assumes the reinvestment of all dividends and distributions. |
Performance data quoted represents past performance; past performance does not guarantee future results. The investment return and principal value of an investment will fluctuate so that an investor’s shares, when redeemed, may be worth more or less than their original cost. Current performance may be higher or lower than the total return shown. Please call the Fund at 1-800-442-8299 to obtain the most recent month-end returns. Returns do not reflect taxes that the shareholder may pay on fund distributions or the redemption of fund shares. Performance of the Institutional Class will vary from the Advisor Class due to differences in fees.
| 1 | Average annual total return for the Institutional Class includes the period from 06/30/10 through 10/31/18. Prior to the inception of the Institutional Class on 11/09/16, performance for the Institutional Class is based on the average annual total return of the Advisor Class. |
The indices and certain terms are defined on pages 26 to 27.
THE GLENMEDE FUND, INC.
Global Secured Options Portfolio
PORTFOLIO HIGHLIGHTS
October 31, 2018
| | | | | | | | |
| Average Annual Total Return | |
| Global Secured Options Portfolio | | | | | MSCI All
Country World
Index | |
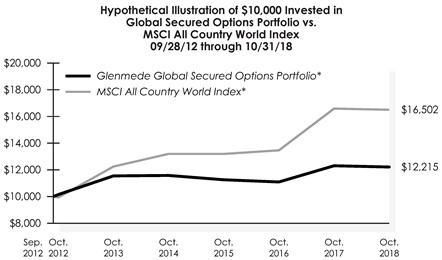
Year ended 10/31/18 | | | -0.76% | | | | -0.52% | |
Five Years ended 10/31/18 | | | 1.13% | | | | 6.15% | |
Inception (09/28/12) through 10/31/18 | | | 3.34% | | | | 8.48% | |
For the fiscal year ended October 31, 2018, the Global Secured Options Portfolio purchased and wrote put and call options in an effort to reduce share price volatility, obtain option premiums and provide more stable returns. For this period, the Portfolio returned -0.76% while its benchmark, the MSCI All Country World (ACWI) Index, returned -0.52%. For the fiscal year, the Portfolio experienced less volatility than the benchmark, as measured by standard deviation of monthly returns1, but did not capture enough upside participation during some particularly strong periods for the benchmark, resulting in a -0.24% underperformance for the full 12 month period. Generally speaking, equity securities or cash positions are pledged to secure the written option positions. The Portfolio’s gross annual operating expense ratio, as stated in the February 28, 2018 Prospectus, is 1.14%. This ratio can fluctuate and may differ from the expense ratio disclosed in the Financial Highlights section of this report.
| * | Assumes the reinvestment of all dividends and distributions. |
Performance data quoted represents past performance; past performance does not guarantee future results. The investment return and principal value of an investment will fluctuate so that an investor’s shares, when redeemed, may be worth more or less than their original cost. Since inception performance quoted above reflects expense reimbursements in effect and would have been lower in their absence. Current performance may be higher or lower than the total return shown. Please call the Fund at 1-800-442-8299 to obtain the most recent month-end returns. Returns do not reflect taxes that the shareholder may pay on fund distributions or the redemption of fund shares.
| 1 | For the fiscal year ended October 31, 2018, the standard deviation of the Global Secured Options Portfolio was 8.87% vs. 12.03% for the MSCI All Country World Index. |
The indices and certain terms are defined on pages 26 to 27.
THE GLENMEDE FUND, INC.
Core Fixed Income Portfolio
PORTFOLIO HIGHLIGHTS
October 31, 2018
| | | | | | | | | | | | |
| Average Annual Total Return | |
| Core Fixed Income Portfolio | | | | | Bloomberg Barclays
U.S. Aggregate
Bond Index | | | Morningstar
Intermediate-Term
Bond Average | |
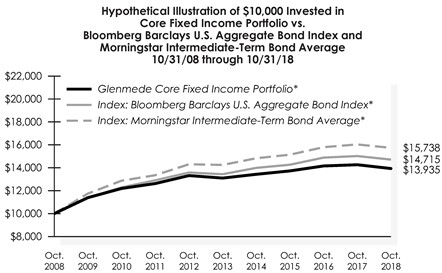
Year ended 10/31/18 | | | -2.32% | | | | -2.05% | | | | -1.87% | |
Five Years ended 10/31/18 | | | 1.24% | | | | 1.83% | | | | 1.77% | |
Ten Years ended 10/31/2018 | | | 3.37% | | | | 3.94% | | | | 4.52% | |
Inception (11/17/88) through 10/31/181 | | | 5.59% | | | | 6.03% | | | | 5.43% | |
The Core Fixed Income Portfolio returned -2.32% for the fiscal year ended October 31, 2018. The benchmark, the Bloomberg Barclays U.S. Aggregate Bond Index, returned -2.05% for the year and the Portfolio’s peer group, the Morningstar Intermediate — Term Bond Average, returned -1.87% for the year. The Portfolio’s underperformance versus the Bloomberg Barclays U.S. Aggregate Bond Index can be attributed to the higher overall percentage of corporates relative to the Index, and the Portfolio’s bias towards higher credit quality. The single A corporate credits, sold off throughout the year returning -3.22% versus the lower tier BBB component returning -2.96%. Our higher quality bias, contributed negatively to the Portfolio’s performance. The Portfolio’s underperformance versus its peer group can also be attributed to the Portfolio’s high credit quality bias and low risk themes.
The Portfolio seeks to add value by monitoring yield curve exposure while utilizing sector and security selection. Diversification, liquidity, and low risk themes dominate the Portfolio’s investment discipline. The Portfolio’s gross annual operating expense ratio, as stated in the February 28, 2018 Prospectus, is 0.52%. This ratio can fluctuate and may differ from the expense ratio disclosed in the Financial Highlights section of this report.
| * | Assumes the reinvestment of all dividends and distributions. |
Performance data quoted represents past performance; past performance does not guarantee future results. The investment return and principal value of an investment will fluctuate so that an investor’s shares, when redeemed, may be worth more or less than their original cost. Current performance may be higher or lower than the total return shown. Please call the Fund at 1-800-442-8299 to obtain the most recent month-end returns. Returns do not reflect taxes that the shareholder may pay on fund distributions or the redemption of fund shares.
| 1 | Benchmark returns are for the periods beginning November 30, 1988 for Bloomberg Barclays U.S. Aggregate Bond Index and December 1, 1988 for Morningstar Intermediate-Term Bond Average. |
The indices and certain terms are defined on pages 26 to 27.
THE GLENMEDE FUND, INC.
Short Term Tax Aware Fixed Income Portfolio
PORTFOLIO HIGHLIGHTS
October 31, 2018
| | | | | | | | | | | | | | | | |
| Average Annual Total Return | |
| | | | | | Return After Taxes on | | | | |
| Short Term Tax Aware Fixed Income Portfolio | | Return
Before
Taxes | | | Distributions | | | Distributions
and Sales of
Fund Shares | | | BofA
Merrill Lynch
1-3 Year
US Municipal
Securities Index | |
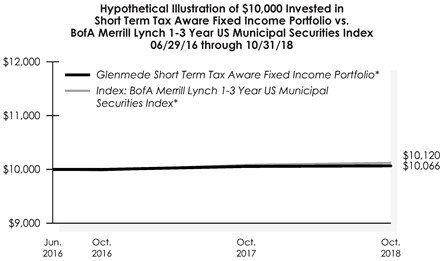
Year ended 10/31/18 | | | 0.10% | | | | -0.20% | | | | 0.12% | | | | 0.37% | |
Inception (06/29/16) through 10/31/181 | | | 0.28% | | | | 0.10% | | | | 0.20% | | | | 0.51% | |
For the fiscal year ended October 31, 2018, the Short Term Tax Aware Fixed Income Portfolio underperformed its primary benchmark, the BofA Merrill Lynch 1-3 Year US Municipal Securities Index. The Portfolio’s duration was kept marginally shorter than the benchmark duration consistently over the period as rates were expected to rise with the Federal Reserve’s increases to the Fed Funds rate. This was detrimental to the relative return of the Portfolio as the yield foregone with that shorter duration positioning outweighed the market value depreciation of security holdings resulting from rising interest rates. The Portfolio’s tactical exposure to taxable securities was a positive contributor to relative performance. This tactical exposure to taxable securities was increased throughout the latter half of the fiscal year as relative value metrics reflected opportunity for better relative performance. The Portfolio’s gross annual operating expense ratio, as stated in the February 28, 2018 prospectus, is 0.70%. This rate can fluctuate and may differ from the expense ratio disclosed in the Financial Highlights in this report.
| * | Assumes the reinvestment of all dividends and distributions. |
Performance data quoted represents past performance; past performance does not guarantee future results. The investment return and principal value of an investment will fluctuate so that an investor’s shares, when redeemed, may be worth more or less than their original cost. The performance quoted reflects fee waivers and/or expense reimbursements in effect and would have been lower in their absence. Current performance may be higher or lower than the total return shown. Please call the Fund at 1-800-442-8299 to obtain the most recent month-end returns. Returns, other than after-tax returns, do not reflect taxes that the shareholder may pay on fund distributions or the redemption of fund shares. After-tax returns are calculated using the historical highest individual federal marginal income tax rates, do not reflect the impact of state and local taxes and are not relevant to investors who hold their shares through tax-deferred arrangements such as 401(k) plans or IRAs. Actual after-tax returns depend on the investor’s tax situation and may differ from those shown.
| 1 | Benchmark returns are for the periods beginning June 29, 2016 for the BofA Merrill Lynch 1-3 Year US Municipal Securities Index. The indices and certain terms are defined on pages 26 to 27. |
THE GLENMEDE FUND, INC.
High Yield Municipal Portfolio
PORTFOLIO HIGHLIGHTS
October 31, 2018
| | | | | | | | | | | | | | | | | | | | |
| Average Annual Total Return | |
| High Yield Municipal Portfolio | | | | | Bloomberg Barclays
Municipal Bond
Index | | | Bloomberg
Barclays
Muni BBB
Index | | | Bloomberg
Barclays
Muni High Yield 5%
Tobacco Cap 2%
Issuer Cap Index | | | Morningstar
High Yield
Muni
Average | |
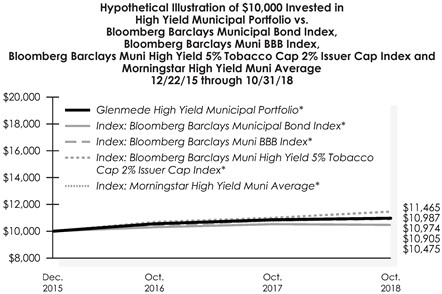
Year ended 10/31/18 | | | 1.04% | | | | -0.51% | | | | 0.82% | | | | 4.23% | | | | 2.06% | |
Inception (12/22/15) through 10/31/181 | | | 3.30% | | | | 1.64% | | | | 3.07% | | | | 4.90% | | | | 3.16% | |
The High Yield Municipal Portfolio (the “Portfolio”) trailed the Bloomberg Barclays Muni High Yield 5% Tobacco Cap, 2% Issuer Cap Index for the 12 months ended October 31, 2018. The Portfolio returned 1.04% while the Index returned 4.23%. The Portfolio trailed by 1.02% relative to the Morningstar High Yield Muni Average peer group, which returned 2.06% over the same time period. The Portfolio’s longer duration position detracted 0.28% of relative return. The largest detractor from returns was not owning as much as the benchmark in riskier securities issued in Puerto Rico and U.S. Virgin Islands. Market expectations of recovery values for these distressed securities improved. The Portfolio continued to maintain exposure to higher credit quality in anticipation of increased market volatility, so as to be consistent with the Portfolio’s goal of a high level of current income exempt from regular federal income tax. The Portfolio’s gross annual operating expense ratio, as stated in the February 28, 2018 Prospectus, is 1.00%. This ratio can fluctuate and may differ from the expense ratio disclosed in the Financial Highlights section of this report.
| * | Assumes the reinvestment of all dividends and distributions. |
Performance data quoted represents past performance; past performance does not guarantee future results. The investment return and principal value of an investment will fluctuate so that an investor’s shares, when redeemed, may be worth more or less than their original cost. The performance quoted reflects fee waivers and/or expense reimbursements in effect during certain periods and would have been lower in their absence. Current performance may be higher or lower than the total return shown. Please call the Fund at 1-800-442-8299 to obtain the most recent month-end returns. Returns shown do not reflect taxes that a shareholder may pay on fund distributions or redemption of fund shares.
| 1 | Benchmark return is for the period beginning January 1, 2016 for the Morningstar High Yield Muni Average. |
The indices and certain terms are defined on pages 26 to 27.
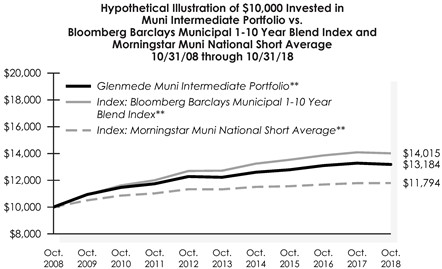
THE GLENMEDE PORTFOLIOS
Muni Intermediate Portfolio
PORTFOLIO HIGHLIGHTS
October 31, 2018
| | | | | | | | | | | | |
| Average Annual Total Return | |
| Muni Intermediate Portfolio | | | | | Bloomberg
Barclays
Municipal 1-10 Year
Blend Index | | | Morningstar
Muni National
Short Average | |
Year ended 10/31/18 | | | -0.73% | | | | -0.52% | | | | 0.05% | |
Five Years ended 10/31/18 | | | 1.52% | | | | 1.96% | | | | 0.79% | |
Ten Years ended 10/31/2018 | | | 2.80% | | | | 3.43% | | | | 1.66% | |
Inception (06/05/92) through 10/31/18 | | | 3.85% | | | | N/A | * | | | 2.85% | |
For the fiscal year ended October 31, 2018, the Muni Intermediate Portfolio underperformed its primary benchmark, the Bloomberg Barclays Municipal 1-10 Year Blend Index. The Portfolio’s duration was kept marginally below the benchmark duration consistently throughout the year in anticipation of the Federal Reserve continuing to hike short-term rates. Tax-exempt yields rose consistently throughout the year with a pause in the summer months as investor demand outpaced supply, keeping rates from moving higher during this period. The Portfolio’s shorter relative duration was a positive contributor to relative performance, but this was outweighed by other factors throughout the year. Lower credit quality securities continued their recent outperformance with spreads to triple-A securities moving lower. This contributed to the Portfolio’s underperformance as the Portfolio continued to maintain exposure to higher credit quality securities, so as to be consistent with the Portfolio’s goals of principal preservation and high current tax-exempt interest income generation. The Portfolio’s gross annual operating expense ratio, as stated in the February 28, 2018 prospectus, is 0.23%. This rate can fluctuate and may differ from the expense ratio disclosed in the Financial Highlights in this report.
| * | Index commenced 6/30/93. Thus Portfolio inception comparisons are not provided. |
| ** | Assumes the reinvestment of all dividends and distributions. |
Performance data quoted represents past performance; past performance does not guarantee future results. The investment return and principal value of an investment will fluctuate so that an investor’s shares, when redeemed, may be worth more or less than their original cost. Current performance may be higher or lower than the total return shown. Please call the Fund at 1-800-442-8299 to obtain the most recent month-end returns. Returns do not reflect taxes that the shareholder may pay on fund distributions or the redemption of fund shares.
The indices and certain terms are defined on pages 26 to 27.
THE GLENMEDE FUND, INC.
THE GLENMEDE PORTFOLIOS
Glossary of Indices & Terms
Indices — It is not possible to invest directly in an index.
The Bloomberg Barclays Municipal 1-10 Year Blend Index is a composite index made up of several different broad sub-indices: the Bloomberg Barclays Municipal 1-Year Index; the Bloomberg Barclays Municipal 3-Year Index; the Bloomberg Barclays Municipal 5-Year Index; the Bloomberg Barclays Municipal 7-Year Index and the Bloomberg Bar-clays Municipal 10-Year Index. The total of all these indices represents all maturities between 1-10 Years.
The Bloomberg Barclays U.S. Treasury Bellwether 3-Month Index is a market value-weighted index of investment-grade fixed-rate public obligations of the U.S. Treasury with maturities of 3 months, excluding zero coupon strips.
The Bloomberg Barclays U.S. Aggregate Bond Index represents securities that are SEC-registered, taxable, and dollar denominated. The index covers the U.S. investment grade fixed rate bond market, with index components for government and corporate securities, mortgage pass-through securities, and asset-backed securities. These major sectors are subdivided into more specific indices that are calculated and reported on a regular basis. Indexes are rebalanced by market capitalization each month.
The Bloomberg Barclays Muni BBB Index is a sub-index of the Bloomberg Barclays U.S. Municipal Index that includes only bonds rated BBB on the day the Index resets. The rating is established using the middle rating of Moody’s Investor Services, Inc. (“Moody’s”), S&P Global Ratings (“S&P”) and Fitch Ratings, Inc.
The Bloomberg Barclays Muni High Yield 5% Tobacco 2% Issuer Cap Index is an issuer constrained sub-index of the Bloomberg Barclays US Municipal High Yield Index that caps issuer exposure to 2% and tobacco stocks to 5%.
The Bloomberg Barclays Municipal Bond Index is an unmanaged index of municipal bonds with maturities greater than two years.
The BofA Merrill Lynch 1-3 Year US Municipal Securities Index is a subset of The BofA Merrill Lynch US Municipal Securities Index including all securities with a remaining term to final maturity less than 3 years.
The CBOE S&P 500 Buy-Write Index is an index designed to track the performance of a hypothetical covered call strategy on the S&P 500 Index.
The MSCI All Country World Index is a market capitalization weighted index designed to provide a broad measure of equity-market performance throughout the world. The MSCI All Country World Index is comprised of stocks from both developed and emerging markets.
The MSCI EAFE Index is an unmanaged capitalization weighted composite portfolio consisting of equity total returns of countries in Australia, New Zealand, Europe and the Far East.
The Russell 1000® Index is an unmanaged market capitalization weighted total return index which is comprised of the 1,000 largest companies in the Russell 3000® Index.
The Russell 1000® Growth Index is an unmanaged capitalization weighted total return index which is comprised of securities in the Russell 1000® Index with greater than average growth orientation.
The Russell 1000® Value Index is an unmanaged capitalization weighted total return index which is comprised of those securities in the Russell 1000® Index with a less than average growth orientation.
The Russell 2000® Index is an unmanaged market capitalization weighted total return index which measures the performance of the 2,000 smallest companies in the Russell 3000® Index.
The Russell 2000® Value Index is an index measuring the performance of approximately 2,000 small-cap companies in the Russell 3000® Index, which is made up of 3,000 of the biggest U.S. stocks. The Russell 2000® Value Index serves as a benchmark for small-cap stocks in the United States.
The Russell 3000® Index is an unmanaged capitalization weighted total return index which is comprised of the 3,000 largest U.S. companies based on total market capitalization. The Index re-balances annually.
The Russell 3000® Value Index is a market-capitalization weighted equity index based on the Russell 3000 Index, which measures how U.S. stocks in the equity value segment perform. Included in the Russell 3000 Value Index are stocks from the Russell 3000 Index with lower price-to-book ratios and lower expected growth rates.
The Russell 3000® Growth Index is a market capitalization weighted index based on the Russell 3000 index. The Russell 3000 Growth Index includes companies that display signs of above average growth. The index is used to provide a gauge of the performance of growth stocks in the United States.
The S&P 500 Index is a market capitalization weighted index comprised of 500 widely held common stocks.
The S&P MidCap 400 Index is a capitalization weighted index of mid cap stocks with capitalizations ranging from about $750 million to $3 billion.
Morningstar Foreign Large Blend Average funds invest mainly in a variety of big international stocks. Most of these funds divide their assets among a dozen or more developed markets, including Japan, Britain, France, and Germany. The blend style is assigned to funds where neither growth nor value characteristics predominate.
THE GLENMEDE FUND, INC.
THE GLENMEDE PORTFOLIOS
Glossary of Indices & Terms — (Concluded)
Morningstar High Yield Muni Average funds invest at least 50% of assets in high-income municipal securities that are not rated or that are rated by a major agency such as S&P or Moody’s at the level of BBB (considered speculative in the municipal industry) and below.
Morningstar Intermediate-Term Bond Average contains bond funds that have average durations of greater than 3.5 years and less than 6 years. Most of the funds rotate among a variety of sectors in the bond market, based upon that which appears to offer better values.
Morningstar Large Blend Average funds are fairly representative of the overall U.S. Stock market in size, growth rates, and price. The blend style is assigned to funds where neither growth nor value characteristics predominate. These funds tend to invest across the spectrum of U.S. industries, and owing to their broad exposure, the funds returns are often similar to those of the S&P 500 Index.
Morningstar Large Growth Average funds invest in big U.S. companies that are projected to grow faster than other large-cap stocks. This classification consists of stocks in the top 70% of the capitalization of the U.S. equity market defined as large-cap. Growth is defined based on fast growth (high growth rates for earnings, sales, book value, and cash flow) and high valuations (high price ratios and low dividend yields). Most of these funds focus on companies in rapidly expanding industries.
Morningstar Large Value Average funds focus on big companies that are less expensive or growing more slowly than other large-cap stocks. These funds often feature investments in energy, financial, or manufacturing sectors.
Morningstar Long/Short Average funds aim to deliberately exploit market movements through the use of a variety of derivative instruments. These can include (but are not limited to) futures, options, swaps, short sells along with physical positions.
Morningstar Mid-Cap Value Average funds invest primarily in mid-cap U.S. stocks that are value-oriented. Midcap stocks collectively represent 20% of the total capitalization of the U.S. equity market (large-cap stocks represent the top 70%). The mid-cap range for market capitalization typically falls between $1-$8 billion. Value is defined based on low valuations (low price ratios and high dividend yields) and slow growth (low growth rates for earnings, sales, book value, and cash flow).
Morningstar Muni National Short Average invests in bonds with an average duration of less than 4.5 years issued by state and local governments to fund projects. Such bonds are free from federal taxes and from state taxes in the issuing state.
Morningstar Small Blend Average funds favor firms at the smaller end of the market-capitalization range, and are flexible in the types of small caps they buy. Some aim to own an array of value and growth stocks while others employ a discipline that leads to holdings with valuations and growth rates close to the small-cap averages.
Terms
Cash flow: measures the cash generating capability of a company by adding non-cash charges (e.g. depreciation) and interest expense to pretax income.
Duration: is a commonly used measure of the potential volatility of the price of a debt security, or the aggregate market value of a portfolio of debt securities, prior to maturity. Securities with a longer duration generally have more volatile prices than securities of comparable quality with a shorter duration.
Market Capitalization: is the market price of an entire company, calculated by multiplying the number of shares outstanding by the price per share.
Total return: consists of price appreciation/depreciation and income as a percentage of the original investment.
Price/Earnings Ratio: The current market price of a company share divided by the earnings per share of the company.
Dividend Yield: The dividend yield or dividend-price ratio of a share is the dividend per share, divided by the price per share. It is also a company’s total annual dividend payments divided by its market capitalization, assuming the number of shares is constant.
Standard Deviation: A measure that is used to quantify the amount of variation or dispersion of a set of data values.
THE GLENMEDE FUND, INC.
Shareholder Expenses (Unaudited)
As a shareholder of a Glenmede Portfolio, you incur ongoing costs, including management fees and, for certain classes, shareholder servicing fees and other portfolio expenses. The following example is intended to help you understand your ongoing costs (in dollars and cents) of investing in a Glenmede Portfolio and to compare these costs with the ongoing costs of investing in other mutual funds.
The example is based on an investment of $1,000 invested at the beginning of the period and held for the entire period from May 1, 2018 to October 31, 2018.
Actual Expenses
The first line under each Portfolio in the table below provides information about actual account values and actual expenses. You may use the information in this line, together with the amount you invested, to estimate the expenses that you paid over the period. Simply divide your account value by $1,000 (for example, an $8,600 account value divided by $1,000 = 8.6), then multiply the result by the number in the first line for your Portfolio under the heading entitled “Expenses Paid During Period” to estimate the expenses you paid on your account during this period.
Hypothetical Example for Comparison Purposes
The second line under each Portfolio in the table below provides information about hypothetical account values and hypothetical expenses based on each Portfolio’s actual expense ratio and an assumed rate of return of 5% per year before expenses, which is not the Portfolio’s actual return. The hypothetical account values and expenses may not be used to estimate the actual ending account balance or expenses you paid for the period. You may use this information to compare the ongoing costs of investing in your Portfolio and other funds. To do so, compare this 5% hypothetical example with the 5% hypothetical examples that appear in the shareholder reports of the other funds.
| | | | | | | | | | | | | | | | |
| | | Beginning
Account
Value
(May 1, 2018) | | | Ending
Account
Value
(October 31, 2018) | | | Annualized
Expense
Ratio | | | Expenses
Paid During
Period*
(May 1, 2018 to
October 31, 2018) | |
Quantitative U.S. Large Cap Core Equity Portfolio – Advisor | | | | | | | | | | | | | | | | |
Actual | | $ | 1,000.00 | | | $ | 1,001.80 | | | | 0.84 | % | | $ | 4.24 | |
Hypothetical (5% return less expenses) | | | 1,000.00 | | | | 1,021.00 | | | | 0.84 | | | | 4.28 | |
Quantitative U.S. Large Cap Core Equity Portfolio – Institutional | | | | | | | | | | | | | | | | |
Actual | | | 1,000.00 | | | | 1,002.80 | | | | 0.64 | �� | | | 3.23 | |
Hypothetical (5% return less expenses) | | | 1,000.00 | | | | 1,022.00 | | | | 0.64 | | | | 3.26 | |
Quantitative U.S. Large Cap Growth Equity Portfolio – Advisor | | | | | | | | | | | | | | | | |
Actual | | | 1,000.00 | | | | 1,005.40 | | | | 0.84 | | | | 4.25 | |
Hypothetical (5% return less expenses) | | | 1,000.00 | | | | 1,021.00 | | | | 0.84 | | | | 4.28 | |
Quantitative U.S. Large Cap Growth Equity Portfolio – Institutional | | | | | | | | | | | | | | | | |
Actual | | | 1,000.00 | | | | 1,006.40 | | | | 0.65 | | | | 3.29 | |
Hypothetical (5% return less expenses) | | | 1,000.00 | | | | 1,021.90 | | | | 0.65 | | | | 3.31 | |
Quantitative U.S. Large Cap Value Equity Portfolio | | | | | | | | | | | | | | | | |
Actual | | | 1,000.00 | | | | 963.00 | | | | 1.00 | | | | 4.95 | |
Hypothetical (5% return less expenses) | | | 1,000.00 | | | | 1,020.20 | | | | 1.00 | | | | 5.09 | |
Quantitative U.S. Small Cap Equity Portfolio | | | | | | | | | | | | | | | | |
Actual | | | 1,000.00 | | | | 987.50 | | | | 1.00 | | | | 5.01 | |
Hypothetical (5% return less expenses) | | | 1,000.00 | | | | 1,020.20 | | | | 1.00 | | | | 5.09 | |
Quantitative International Equity Portfolio | | | | | | | | | | | | | | | | |
Actual | | | 1,000.00 | | | | 865.60 | | | | 1.00 | | | | 4.70 | |
Hypothetical (5% return less expenses) | | | 1,000.00 | | | | 1,020.20 | | | | 1.00 | | | | 5.09 | |
Responsible ESG U.S. Equity Portfolio | | | | | | | | | | | | | | | | |
Actual | | | 1,000.00 | | | | 1,003.20 | | | | 1.00 | | | | 5.05 | |
Hypothetical (5% return less expenses) | | | 1,000.00 | | | | 1,020.20 | | | | 1.00 | | | | 5.09 | |
Women in Leadership U.S. Equity Portfolio | | | | | | | | | | | | | | | | |
Actual | | | 1,000.00 | | | | 992.50 | | | | 1.00 | | | | 5.02 | |
Hypothetical (5% return less expenses) | | | 1,000.00 | | | | 1,020.20 | | | | 1.00 | | | | 5.09 | |
Quantitative U.S. Long/Short Equity Portfolio | | | | | | | | | | | | | | | | |
Actual | | | 1,000.00 | | | | 960.20 | | | | 1.15 | | | | 5.68 | |
Hypothetical (5% return less expenses) | | | 1,000.00 | | | | 1,019.40 | | | | 1.15 | | | | 5.85 | |
Quantitative U.S. Total Market Equity Portfolio | | | | | | | | | | | | | | | | |
Actual | | | 1,000.00 | | | | 978.30 | | | | 1.25 | | | | 6.23 | |
Hypothetical (5% return less expenses) | | | 1,000.00 | | | | 1,018.90 | | | | 1.25 | | | | 6.36 | |
THE GLENMEDE FUND, INC.
Shareholder Expenses (Unaudited) — (Concluded)
| | | | | | | | | | | | | | | | |
| | | Beginning
Account
Value
(May 1, 2018) | | | Ending
Account
Value
(October 31, 2018) | | | Annualized
Expense
Ratio | | | Expenses
Paid During
Period*
(May 1, 2018 to
October 31, 2018) | |
Strategic Equity Portfolio | | | | | | | | | | | | | | | | |
Actual | | $ | 1,000.00 | | | $ | 998.80 | | | | 0.83 | % | | $ | 4.18 | |
Hypothetical (5% return less expenses) | | | 1,000.00 | | | | 1,021.00 | | | | 0.83 | | | | 4.23 | |
Small Cap Equity Portfolio – Advisor | | | | | | | | | | | | | | | | |
Actual | | | 1,000.00 | | | | 975.10 | | | | 0.88 | | | | 4.38 | |
Hypothetical (5% return less expenses) | | | 1,000.00 | | | | 1,020.80 | | | | 0.88 | | | | 4.48 | |
Small Cap Equity Portfolio – Institutional | | | | | | | | | | | | | | | | |
Actual | | | 1,000.00 | | | | 975.80 | | | | 0.68 | | | | 3.39 | |
Hypothetical (5% return less expenses) | | | 1,000.00 | | | | 1,021.80 | | | | 0.68 | | | | 3.47 | |
Mid Cap Equity Portfolio – Advisor | | | | | | | | | | | | | | | | |
Actual | | | 1,000.00 | | | | 973.30 | | | | 1.00 | | | | 4.97 | |
Hypothetical (5% return less expenses) | | | 1,000.00 | | | | 1,020.20 | | | | 1.00 | | | | 5.09 | |
Large Cap Value Portfolio | | | | | | | | | | | | | | | | |
Actual | | | 1,000.00 | | | | 987.70 | | | | 0.91 | | | | 4.56 | |
Hypothetical (5% return less expenses) | | | 1,000.00 | | | | 1,020.60 | | | | 0.91 | | | | 4.63 | |
Equity Income Portfolio | | | | | | | | | | | | | | | | |
Actual | | | 1,000.00 | | | | 1,002.80 | | | | 0.85 | | | | 4.29 | |
Hypothetical (5% return less expenses) | | | 1,000.00 | | | | 1,020.90 | | | | 0.85 | | | | 4.33 | |
Secured Options Portfolio – Advisor | | | | | | | | | | | | | | | | |
Actual | | | 1,000.00 | | | | 1,014.00 | | | | 0.84 | | | | 4.26 | |
Hypothetical (5% return less expenses) | | | 1,000.00 | | | | 1,021.00 | | | | 0.84 | | | | 4.28 | |
Secured Options Portfolio – Institutional | | | | | | | | | | | | | | | | |
Actual | | | 1,000.00 | | | | 1,014.80 | | | | 0.64 | | | | 3.25 | |
Hypothetical (5% return less expenses) | | | 1,000.00 | | | | 1,022.00 | | | | 0.64 | | | | 3.26 | |
Global Secured Options Portfolio | | | | | | | | | | | | | | | | |
Actual | | | 1,000.00 | | | | 972.30 | | | | 1.26 | | | | 6.26 | |
Hypothetical (5% return less expenses) | | | 1,000.00 | | | | 1,018.90 | | | | 1.26 | | | | 6.41 | |
Core Fixed Income Portfolio | | | | | | | | | | | | | | | | |
Actual | | | 1,000.00 | | | | 998.80 | | | | 0.52 | | | | 2.62 | |
Hypothetical (5% return less expenses) | | | 1,000.00 | | | | 1,022.60 | | | | 0.52 | | | | 2.65 | |
Short Term Tax Aware Fixed Income Portfolio | | | | | | | | | | | | | | | | |
Actual | | | 1,000.00 | | | | 1,005.90 | | | | 0.55 | | | | 2.78 | |
Hypothetical (5% return less expenses) | | | 1,000.00 | | | | 1,022.40 | | | | 0.55 | | | | 2.80 | |
High Yield Municipal Portfolio | | | | | | | | | | | | | | | | |
Actual | | | 1,000.00 | | | | 1,008.00 | | | | 0.99 | | | | 5.01 | |
Hypothetical (5% return less expenses) | | | 1,000.00 | | | | 1,020.20 | | | | 0.99 | | | | 5.04 | |
| * | Expenses are calculated using the Portfolio’s annualized expense ratio (as disclosed in the table), which is net of fee waivers, dividends on securities sold short and expense reimbursements, if any, multiplied by the average account value for the period, multiplied by the number of days in the period (184 days), and divided by the number of days in the calendar year (365 days). |
THE GLENMEDE PORTFOLIOS
Shareholder Expenses (Unaudited)
As a shareholder of the Glenmede Muni Intermediate Portfolio, you incur ongoing costs, including shareholder servicing fees and other portfolio expenses. The following example is intended to help you understand your ongoing costs (in dollars and cents) of investing in the Glenmede Muni Intermediate Portfolio and to compare these costs with the ongoing costs of investing in other mutual funds.
The example is based on an investment of $1,000 invested at the beginning of the period and held for the entire period from May 1, 2018 to October 31, 2018.
Actual Expenses
The first line under the Portfolio in the table below provides information about actual account values and actual expenses. You may use the information in this line, together with the amount you invested, to estimate the expenses that you paid over the period. Simply divide your account value by $1,000 (for example, an $8,600 account value divided by $1,000 = 8.6), then multiply the result by the number in the first line for the Portfolio under the heading entitled “Expenses Paid During Period” to estimate the expenses you paid on your account during this period.
Hypothetical Example for Comparison Purposes
The second line under the Portfolio in the table below provides information about hypothetical account values and hypothetical expenses based on the Portfolio’s actual expense ratio and an assumed rate of return of 5% per year before expenses, which is not the Portfolio’s actual return. The hypothetical account values and expenses may not be used to estimate the actual ending account balance or expenses you paid for the period. You may use this information to compare the ongoing costs of investing in the Portfolio and other funds. To do so, compare this 5% hypothetical example with the 5% hypothetical examples that appear in the shareholder reports of the other funds.
Please note that the expenses shown in the table are meant to highlight your ongoing costs only. As a shareholder of the Glenmede Muni Intermediate Portfolio, you do not incur any transaction costs, such as sales charges (loads), redemption fees or exchange fees, but shareholders of other funds may incur such costs. Therefore, the second line under the Portfolio in the table is useful in comparing ongoing costs only, and will not help you determine the relative total costs of owning different funds whose shareholders may incur transaction costs.
| | | | | | | | | | | | | | | | |
| | | Beginning
Account
Value
(May 1, 2018) | | | Ending
Account
Value
(October 31, 2018) | | | Annualized
Expense
Ratio | | | Expenses
Paid During
Period*
(May 1, 2018 to
October 31, 2018) | |
Muni Intermediate Portfolio | | | | | | | | | |
Actual | | $ | 1,000.00 | | | $ | 1,005.50 | | | | 0.23 | % | | $ | 1.16 | |
Hypothetical (5% return less expenses) | | | 1,000.00 | | | | 1,024.00 | | | | 0.23 | | | | 1.17 | |
| * | Expenses are calculated using the Portfolio’s annualized expense ratio (as disclosed in the table), multiplied by the average account value for the period, multiplied by the number of days in the period (184 days), and divided by the number of days in the calendar year (365 days). |
THE GLENMEDE FUND, INC.
STATEMENTS OF ASSETS AND LIABILITIES
October 31, 2018
| | | | | | | | | | | | |
| | | Quantitative
U.S. Large Cap
Core Equity
Portfolio | | | Quantitative
U.S. Large Cap
Growth Equity
Portfolio | | | Quantitative
U.S. Large Cap
Value Equity
Portfolio | |
Assets: | | | | | | | | | | | | |
Investments at value1,2 | | $ | 2,841,637,381 | | | $ | 3,406,623,308 | | | $ | 1,077,404 | |
Repurchase agreements at value1 | | | 2,944,141 | | | | 12,538,685 | | | | — | |
Cash | | | — | | | | — | | | | 7,359 | |
Receivable from Advisor | | | — | | | | — | | | | 10,294 | |
Receivable for fund shares sold | | | 3,624,744 | | | | 893,366 | | | | — | |
Dividends receivable | | | 3,440,646 | | | | 1,354,689 | | | | 1,707 | |
Interest receivable | | | 34 | | | | 146 | | | | — | |
Securities lending receivable | | | 632 | | | | 273 | | | | — | |
Prepaid Expenses | | | 32,518 | | | | 44,724 | | | | 800 | |
| | | | | | | | | | | | |
Total assets | | | 2,851,680,096 | | | | 3,421,455,191 | | | | 1,097,564 | |
| | | | | | | | | | | | |
Liabilities: | | | | | | | | | | | | |
Obligation to return securities lending collateral | | | 5,112,366 | | | | 7,850,227 | | | | — | |
Payable for fund shares redeemed | | | 1,898,428 | | | | 3,906,348 | | | | — | |
Payable for Management fees | | | 1,361,691 | | | | 1,659,830 | | | | 527 | |
Payable for Directors’ fees | | | 31,868 | | | | 44,170 | | | | 12 | |
Payable for Shareholder Servicing fees | | | 362,524 | | | | 473,410 | | | | 192 | |
Accrued expenses | | | 531,622 | | | | 633,318 | | | | 5,059 | |
| | | | | | | | | | | | |
Total liabilities | | | 9,298,499 | | | | 14,567,303 | | | | 5,790 | |
| | | | | | | | | | | | |
Net Assets | | $ | 2,842,381,597 | | | $ | 3,406,887,888 | | | $ | 1,091,774 | |
| | | | | | | | | | | | |
Net Assets consist of: | | | | | | | | | | | | |
Par value ($0.001 of shares outstanding) | | $ | 101,947 | | | $ | 104,748 | | | $ | 111 | |
Paid-in capital in excess of par value | | | 2,128,811,978 | | | | 2,216,950,559 | | | | 1,114,002 | |
Total distributable earnings | | | 713,467,672 | | | | 1,189,832,581 | | | | (22,339 | ) |
| | | | | | | | | | | | |
Total Net Assets** | | $ | 2,842,381,597 | | | $ | 3,406,887,888 | | | $ | 1,091,774 | |
| | | | | | | | | | | | |
Shares Outstanding3 | | | 101,946,855 | | | | 104,748,193 | | | | 111,182 | |
| | | | | | | | | | | | |
Net Asset Value Per Share | | $ | — | | | $ | — | | | $ | 9.82 | |
| | | | | | | | | | | | |
Advisor Class — based on net assets of $2,075,264,206 and $2,660,858,127, respectively and shares outstanding of 74,443,127 and 81,816,756, respectively | | | 27.88 | | | | 32.52 | | | | — | |
| | | | | | | | | | | | |
Institutional Class — based on net assets of $767,117,391 and $746,029,761, respectively and shares outstanding of 27,503,728 and 22,931,437, respectively | | | 27.89 | | | | 32.53 | | | | — | |
| | | | | | | | | | | | |
| | | | | | | | | | | | |
** The SEC eliminated the requirement to disclose total distributable earnings by each of its components as previously disclosed as the previous presentation did not provide insight into the tax implications of distributions. | | | | | | | | | | | | |
1 Investments at cost | | $ | 2,349,155,519 | | | $ | 2,667,034,161 | | | $ | 1,081,994 | |
2 Market value of securities on loan | | $ | 4,921,884 | | | $ | 7,242,817 | | | $ | — | |
3 Authorized shares | | | — | | | | — | | | | 80,000,000 | |
| Authorized shares - Advisor Class | | | 155,000,000 | | | | 240,000,000 | | | | — | |
| Authorized shares - Institutional Class | | | 155,000,000 | | | | 140,000,000 | | | | — | |
See Notes to Financial Statements.
THE GLENMEDE FUND, INC.
STATEMENTS OF ASSETS AND LIABILITIES — (Continued)
October 31, 2018
| | | | | | | | | | | | |
| | | Quantitative
U.S. Small Cap
Equity Portfolio | | | Quantitative
International
Equity Portfolio | | | Responsible
ESG U.S.
Equity Portfolio | |
Assets: | | | | | | | | | | | | |
Investments at value1,2 | | $ | 1,081,351 | | | $ | 419,826,923 | | | $ | 21,696,034 | |
Repurchase agreements at value1 | | | — | | | | 584,454 | | | | 130,291 | |
Cash | | | 9,293 | | | | 46,842 | | | | — | |
Receivable from Advisor | | | 10,011 | | | | 21,097 | | | | — | |
Receivable for securities sold | | | — | | | | 2,253,691 | | | | — | |
Receivable for fund shares sold | | | — | | | | 1,088,431 | | | | 6,156 | |
Dividends receivable | | | 391 | | | | 402,819 | | | | 30,652 | |
Interest receivable | | | — | | | | 7 | | | | 2 | |
Securities lending receivable | | | 10 | | | | 91,011 | | | | 14 | |
Foreign tax reclaims receivable | | | — | | | | 744,005 | | | | — | |
Prepaid expenses | | | 801 | | | | 1,900 | | | | 204 | |
| | | | | | | | | | | | |
Total assets | | | 1,101,857 | | | | 425,061,180 | | | | 21,863,353 | |
| | | | | | | | | | | | |
Liabilities: | | | | | | | | | | | | |
Obligation to return securities lending collateral | | | 22,309 | | | | 33,915,385 | | | | 92,367 | |
Payable to Advisor | | | — | | | | — | | | | 3,476 | |
Payable for fund shares redeemed | | | — | | | | 3,531,274 | | | | — | |
Payable for Management fees | | | 514 | | | | 259,453 | | | | 10,283 | |
Payable for Directors’ fees | | | 12 | | | | 5,074 | | | | 190 | |
Payable for Shareholder Servicing fees | | | 187 | | | | 86,485 | | | | 3,739 | |
Accrued expenses | | | 5,281 | | | | 75,130 | | | | 6,970 | |
| | | | | | | | | | | | |
Total liabilities | | | 28,303 | | | | 37,872,801 | | | | 117,025 | |
| | | | | | | | | | | | |
Net Assets | | $ | 1,073,554 | | | $ | 387,188,379 | | | $ | 21,746,328 | |
| | | | | | | | | | | | |
Net Assets consist of: | | | | | | | | | | | | |
Par value ($0.001 of shares outstanding) | | $ | 105 | | | $ | 29,190 | | | $ | 1,540 | |
Paid-in capital in excess of par value | | | 1,044,281 | | | | 382,273,998 | | | | 19,011,327 | |
Total distributable earnings | | | 29,168 | | | | 4,885,191 | | | | 2,733,461 | |
| | | | | | | | | | | | |
Total Net Assets** | | $ | 1,073,554 | | | $ | 387,188,379 | | | $ | 21,746,328 | |
| | | | | | | | | | | | |
Shares Outstanding3 | | | 104,750 | | | | 29,190,058 | | | | 1,540,049 | |
| | | | | | | | | | | | |
Net Asset Value Per Share | | $ | 10.25 | | | $ | 13.26 | | | $ | 14.12 | |
| | | | | | | | | | | | |
| | | | | | | | | | | | |
** The SEC eliminated the requirement to disclose total distributable earnings by each of its components as previously disclosed as the previous presentation did not provide insight into the tax implications of distributions. | | | | | | | | | | | | |
1 Investments at cost | | $ | 1,054,246 | | | $ | 413,472,719 | | | $ | 19,893,150 | |
2 Market value of securities on loan | | $ | 80,352 | | | $ | 39,056,697 | | | $ | 103,843 | |
3 Authorized shares | | | 80,000,000 | | | | 120,000,000 | | | | 80,000,000 | |
See Notes to Financial Statements.
THE GLENMEDE FUND, INC.
STATEMENTS OF ASSETS AND LIABILITIES — (Continued)
October 31, 2018
| | | | | | | | | | | | |
| | | Women in
Leadership
U.S. Equity
Portfolio | | | Quantitative
U.S. Long/
Short
Equity
Portfolio | | | Quantitative
U.S. Total
Market
Equity
Portfolio | |
Assets: | | | | | | | | | | | | |
Investments at value1,2 | | $ | 18,886,638 | | | $ | 325,544,058 | | | $ | 112,817,552 | |
Repurchase agreements at value1 | | | — | | | | 11,456,016 | | | | 822,770 | |
Cash | | | 36,172 | | | | — | | | | — | |
Receivable from Advisor | | | — | | | | — | | | | 2,616 | |
Receivable for fund shares sold | | | 56,126 | | | | 504,237 | | | | 19,664 | |
Dividends receivable | | | 16,897 | | | | 331,586 | | | | 110,331 | |
Interest receivable | | | — | | | | 306,665 | | | | 10 | |
Securities lending receivable | | | — | | | | 222 | | | | — | |
Cash collateral on deposit at broker (Note 1) | | | — | | | | 220,301,691 | | | | — | |
Prepaid expenses | | | 192 | | | | 1,296 | | | | 337 | |
| | | | | | | | | | | | |
Total assets | | | 18,996,025 | | | | 558,445,771 | | | | 113,773,280 | |
| | | | | | | | | | | | |
Liabilities: | | | | | | | | | | | | |
Payable for securities purchased | | | — | | | | 1,538,026 | | | | — | |
Obligation to return securities lending collateral | | | — | | | | 5,392,036 | | | | — | |
Payable to Advisor | | | 3,192 | | | | — | | | | — | |
Payable for fund shares redeemed | | | — | | | | 594,293 | | | | 23,257 | |
Dividend payable on securities sold short | | | — | | | | 118,538 | | | | 10,772 | |
Payable for securities sold short, at value3 | | | — | | | | 216,634,909 | | | | 23,002,381 | |
Payable for Management fees | | | 8,997 | | | | 244,522 | | | | 67,196 | |
Payable for Directors’ fees | | | 179 | | | | 3,597 | | | | 954 | |
Payable for Shareholder Servicing fees | | | 3,272 | | | | 57,535 | | | | 15,813 | |
Accrued expenses | | | 6,808 | | | | 56,579 | | | | 42,795 | |
| | | | | | | | | | | | |
Total liabilities | | | 22,448 | | | | 224,640,035 | | | | 23,163,168 | |
| | | | | | | | | | | | |
Net Assets | | $ | 18,973,577 | | | $ | 333,805,736 | | | $ | 90,610,112 | |
| | | | | | | | | | | | |
Net Assets consist of: | | | | | | | | | | | | |
Par value ($0.001 of shares outstanding) | | $ | 1,422 | | | $ | 26,594 | | | $ | 4,807 | |
Paid-in capital in excess of par value | | | 16,979,021 | | | | 295,906,585 | | | | 61,850,320 | |
Total distributable earnings | | | 1,993,134 | | | | 37,872,557 | | | | 28,754,985 | |
| | | | | | | | | | | | |
Total Net Assets** | | $ | 18,973,577 | | | $ | 333,805,736 | | | $ | 90,610,112 | |
| | | | | | | | | | | | |
Shares Outstanding4 | | | 1,422,022 | | | | 26,593,883 | | | | 4,807,456 | |
| | | | | | | | | | | | |
Net Asset Value Per Share | | $ | 13.34 | | | $ | 12.55 | | | $ | 18.85 | |
| | | | | | | | | | | | |
| | | | | | | | | | | | |
**TheSEC eliminated the requirement to disclose total distributable earnings by each of its components as previously disclosed as the previous presentation did not provide insight into the tax implications of distributions. | | | | | | | | | | | | |
1 Investments at cost | | $ | 17,520,507 | | | $ | 292,519,346 | | | $ | 94,411,188 | |
2 Market value of securities on loan | | $ | — | | | $ | 5,463,111 | | | $ | — | |
3 Proceeds from securities sold short | | $ | — | | | $ | 230,524,116 | | | $ | 25,995,799 | |
4 Authorized shares | | | 80,000,000 | | | | 120,000,000 | | | | 120,000,000 | |
See Notes to Financial Statements.
THE GLENMEDE FUND, INC.
STATEMENTS OF ASSETS AND LIABILITIES — (Continued)
October 31, 2018
| | | | | | | | | | | | |
| | | Strategic
Equity
Portfolio | | | Small
Cap
Equity
Portfolio | | | Mid
Cap
Equity
Portfolio | |
Assets: | | | | | | | | | | | | |
Investments at value1,2 | | $ | 224,851,522 | | | $ | 3,567,341,974 | | | $ | — | |
Repurchase agreements at value1 | | | 1,250,284 | | | | 112,572,385 | | | | 571,610 | |
Cash | | | — | | | | — | | | | 2,598,913 | |
Receivable from Advisor | | | — | | | | — | | | | 3,223 | |
Receivable for securities sold | | | — | | | | 20,781,573 | | | | — | |
Receivable for fund shares sold | | | 38,445 | | | | 1,839,655 | | | | — | |
Dividends receivable | | | 186,227 | | | | 543,127 | | | | 1,780 | |
Interest receivable | | | 15 | | | | 1,313 | | | | 7 | |
Securities lending receivable | | | 908 | | | | 444,501 | | | | 11 | |
Prepaid Expenses | | | 898 | | | | 42,610 | | | | 125 | |
| | | | | | | | | | | | |
Total assets | | | 226,328,299 | | | | 3,703,567,138 | | | | 3,175,669 | |
| | | | | | | | | | | | |
Liabilities: | | | | | | | | | | | | |
Payable for securities purchased | | | — | | | | 17,843,742 | | | | — | |
Obligation to return securities lending collateral | | | — | | | | 155,361,882 | | | | — | |
Payable for fund shares redeemed | | | 111,455 | | | | 6,018,123 | | | | — | |
Payable for Management fees | | | 108,491 | | | | 1,730,340 | | | | 2,277 | |
Payable for Directors’ fees | | | 2,490 | | | | 41,062 | | | | 136 | |
Payable for Shareholder Servicing fees | | | 39,451 | | | | 406,654 | | | | 1,025 | |
Accrued expenses | | | 34,350 | | | | 567,770 | | | | 6,274 | |
| | | | | | | | | | | | |
Total liabilities | | | 296,237 | | | | 181,969,573 | | | | 9,712 | |
| | | | | | | | | | | | |
Net Assets | | $ | 226,032,062 | | | $ | 3,521,597,565 | | | $ | 3,165,957 | |
| | | | | | | | | | | | |
Net Assets consist of: | | | | | | | | | | | | |
Par value ($0.001 of shares outstanding) | | $ | 9,302 | | | $ | 118,707 | | | $ | 278 | |
Paid-in capital in excess of par value | | | 136,942,503 | | | | 3,020,465,479 | | | | 3,165,679 | |
Total distributable earnings | | | 89,080,257 | | | | 501,013,379 | | | | — | |
| | | | | | | | | | | | |
Total Net Assets** | | $ | 226,032,062 | | | $ | 3,521,597,565 | | | $ | 3,165,957 | |
| | | | | | | | | | | | |
Shares Outstanding3 | | | 9,302,033 | | | | 118,707,153 | | | | 277,713 | |
| | | | | | | | | | | | |
Net Asset Value Per Share | | $ | 24.30 | | | $ | — | | | $ | — | |
| | | | | | | | | | | | |
Advisor Class — based on net assets of $1,390,136,478 and $3,165,957, respectively and shares outstanding of 48,240,295 and 277,713, respectively | | | — | | | | 28.82 | | | | 11.40 | |
| | | | | | | | | | | | |
Institutional Class — based on net assets of $2,131,461,087 and shares outstanding of 70,466,858 | | | — | | | | 30.25 | | | | — | |
| | | | | | | | | | | | |
| | | | | | | | | | | | |
**TheSEC eliminated the requirement to disclose total distributable earnings by each of its components as previously disclosed as the previous presentation did not provide insight into the tax implications of distributions. | | | | | | | | | | | | |
1 Investments at cost | | $ | 139,912,037 | | | $ | 3,608,280,764 | | | $ | 571,610 | |
2 Market value of securities on loan | | $ | — | | | $ | 150,653,243 | | | $ | — | |
3 Authorized shares | | | 150,000,000 | | | | — | | | | — | |
Authorizedshares - Advisor Class | | | — | | | | 180,000,000 | | | | 120,000,000 | |
Authorizedshares - Institutional Class | | | — | | | | 135,000,000 | | | | 120,000,000 | |
See Notes to Financial Statements.
THE GLENMEDE FUND, INC.
STATEMENTS OF ASSETS AND LIABILITIES — (Continued)
October 31, 2018
| | | | | | | | | | | | |
| | | Large Cap
Value
Portfolio | | | Equity
Income
Portfolio | | | Secured
Options
Portfolio | |
Assets: | | | | | | | | | | | | |
Investments at value1,2 | | $ | 72,220,803 | | | $ | 18,842,258 | | | $ | 1,361,880,415 | |
Repurchase agreements at value1 | | | 283,684 | | | | — | | | | 1,171,219 | |
Cash | | | — | | | | 74,443 | | | | — | |
Receivable from Advisor | | | — | | | | 2,879 | | | | — | |
Receivable for fund shares sold | | | 8,491 | | | | 10,775 | | | | 1,406,154 | |
Dividends receivable | | | 51,761 | | | | 30,612 | | | | — | |
Interest receivable | | | 3 | | | | — | | | | 14 | |
Securities lending receivable | | | 39 | | | | 37 | | | | — | |
Cash collateral on deposit at broker (Note 1) | | | — | | | | — | | | | 45,093 | |
Prepaid Expenses | | | 317 | | | | 203 | | | | 8,735 | |
| | | | | | | | | | | | |
Total assets | | | 72,565,098 | | | | 18,961,207 | | | | 1,364,511,630 | |
| | | | | | | | | | | | |
Liabilities: | | | | | | | | | | | | |
Obligation to return securities lending collateral | | | 900,112 | | | | 404,003 | | | | — | |
Payable for fund shares redeemed | | | 2,549 | | | | — | | | | 234,365 | |
Options written, at value3 | | | — | | | | — | | | | 521,202,675 | |
Payable for Management fees | | | 34,558 | | | | 8,902 | | | | 397,979 | |
Payable for Directors’ fees | | | 854 | | | | 190 | | | | 8,721 | |
Payable for Shareholder Servicing fees | | | 12,566 | | | | 3,237 | | | | 77,021 | |
Accrued expenses | | | 17,948 | | | | 9,259 | | | | 121,844 | |
| | | | | | | | | | | | |
Total liabilities | | | 968,587 | | | | 425,591 | | | | 522,042,605 | |
| | | | | | | | | | | | |
Net Assets | | $ | 71,596,511 | | | $ | 18,535,616 | | | $ | 842,469,025 | |
| | | | | | | | | | | | |
Net Assets consist of: | | | | | | | | | | | | |
Par value ($0.001 of shares outstanding) | | $ | 6,813 | | | $ | 1,662 | | | $ | 68,389 | |
Paid-in capital in excess of par value | | | 59,305,680 | | | | 17,738,691 | | | | 816,554,220 | |
Total distributable earnings | | | 12,284,018 | | | | 795,263 | | | | 25,846,416 | |
| | | | | | | | | | | | |
Total Net Assets** | | $ | 71,596,511 | | | $ | 18,535,616 | | | $ | 842,469,025 | |
| | | | | | | | | | | | |
Shares Outstanding4 | | | 6,812,808 | | | | 1,662,076 | | | | 68,389,119 | |
| | | | | | | | | | | | |
Net Asset Value Per Share | | $ | 10.51 | | | $ | 11.15 | | | $ | — | |
| | | | | | | | | | | | |
Advisor Class — based on net assets of $445,945,539 and shares outstanding of 36,266,555 | | | — | | | | — | | | | 12.30 | |
| | | | | | | | | | | | |
Institutional Class — based on net assets of $396,523,486 and shares outstanding of 32,122,564 | | | — | | | | — | | | | 12.34 | |
| | | | | | | | | | | | |
| | | | | | | | | | | | |
**TheSEC eliminated the requirement to disclose total distributable earnings by each of its components as previously disclosed as the previous presentation did not provide insight into the tax implications of distributions. | | | | | | | | | | | | |
1 Investments at cost | | $ | 66,507,941 | | | $ | 18,405,810 | | | $ | 1,496,201,519 | |
2 Market value of securities on loan | | $ | 864,675 | | | $ | 398,433 | | | $ | — | |
3 Premiums received from options written | | $ | — | | | $ | — | | | $ | 646,465,516 | |
4 Authorized shares | | | 175,000,000 | | | | 80,000,000 | | | | — | |
Authorizedshares - Advisor Class | | | — | | | | — | | | | 160,000,000 | |
Authorizedshares - Institutional Class | | | — | | | | — | | | | 160,000,000 | |
See Notes to Financial Statements.
THE GLENMEDE FUND, INC.
STATEMENTS OF ASSETS AND LIABILITIES — (Continued)
October 31, 2018
| | | | | | | | | | | | |
| | | Global
Secured
Options
Portfolio | | | Core
Fixed
Income
Portfolio | | | Short Term
Tax Aware
Fixed
Income
Portfolio | |
Assets: | | | | | | | | | | | | |
Investments at value1,2 | | $ | 3,301,685 | | | $ | 487,885,500 | | | $ | 26,040,647 | |
Repurchase agreements at value1 | | | — | | | | 12,939,399 | | | | — | |
Cash | | | 24,357 | | | | — | | | | 38,588 | |
Receivable from Advisor | | | — | | | | — | | | | 3,229 | |
Receivable for fund shares sold | | | — | | | | 994,692 | | | | 800,000 | |
Dividends receivable | | | — | | | | — | | | | 1,096 | |
Interest receivable | | | — | | | | 3,550,275 | | | | 293,848 | |
Securities lending receivable | | | — | | | | 989 | | | | 82 | |
Cash collateral on deposit at broker (Note 1) | | | 18,409 | | | | — | | | | — | |
Foreign tax reclaims receivable | | | 39,662 | | | | — | | | | — | |
Prepaid expenses | | | 39 | | | | 2,028 | | | | 312 | |
| | | | | | | | | | | | |
Total assets | | | 3,384,152 | | | | 505,372,883 | | | | 27,177,802 | |
| | | | | | | | | | | | |
Liabilities: | | | | | | | | | | | | |
Payable for securities purchased | | | — | | | | — | | | | 407,847 | |
Obligation to return securities lending collateral | | | — | | | | 19,105,863 | | | | 191,425 | |
Payable for when-issued securities purchased | | | — | | | | — | | | | 266,485 | |
Payable for fund shares redeemed | | | — | | | | 799,207 | | | | — | |
Options written, at value3 | | | 863,580 | | | | — | | | | — | |
Payable for Management fees | | | 1,206 | | | | 144,487 | | | | 7,810 | |
Payable for Directors’ fees | | | 89 | | | | 5,249 | | | | 334 | |
Payable for Shareholder Servicing fees | | | 438 | | | | 41,282 | | | | 2,231 | |
Accrued expenses | | | 8,920 | | | | 75,726 | | | | 7,779 | |
| | | | | | | | | | | | |
Total liabilities | | | 874,233 | | | | 20,171,814 | | | | 883,911 | |
| | | | | | | | | | | | |
Net Assets | | $ | 2,509,919 | | | $ | 485,201,069 | | | $ | 26,293,891 | |
| | | | | | | | | | | | |
Net Assets consist of: | | | | | | | | | | | | |
Par value ($0.001 of shares outstanding) | | $ | 241 | | | $ | 46,259 | | | $ | 2,656 | |
Paid-in capital in excess of par value | | | 7,837,923 | | | | 505,879,332 | | | | 26,658,906 | |
Total distributable earnings | | | (5,328,245 | ) | | | (20,724,522 | ) | | | (367,671 | ) |
| | | | | | | | | | | | |
Total Net Assets** | | $ | 2,509,919 | | | $ | 485,201,069 | | | $ | 26,293,891 | |
| | | | | | | | | | | | |
Shares Outstanding4 | | | 241,073 | | | | 46,259,011 | | | | 2,656,356 | |
| | | | | | | | �� | | | | |
Net Asset Value Per Share | | $ | 10.41 | | | $ | 10.49 | | | $ | 9.90 | |
| | | | | | | | | | | | |
| | | | | | | | | | | | |
**TheSEC eliminated the requirement to disclose total distributable earnings by each of its components as previously disclosed as the previous presentation did not provide insight into the tax implications of distributions. | | | | | | | | | | | | |
1 Investments at cost | | $ | 3,590,640 | | | $ | 520,483,811 | | | $ | 26,298,943 | |
2 Market value of securities on loan | | $ | — | | | $ | 18,708,371 | | | $ | 187,587 | |
3 Premiums received from options written | | $ | 1,013,082 | | | $ | — | | | $ | — | |
4 Authorized shares | | | 120,000,000 | | | | 160,000,000 | | | | 80,000,000 | |
See Notes to Financial Statements.
THE GLENMEDE FUND, INC.
STATEMENTS OF ASSETS AND LIABILITIES — (Concluded)
October 31, 2018
| | | | |
| | | High Yield
Municipal
Portfolio | |
Assets: | | | | |
Investments at value1, | | $ | 189,981,293 | |
Cash | | | 1,726,296 | |
Receivable for securities sold | | | 1,396,557 | |
Receivable for fund shares sold | | | 222,000 | |
Interest receivable | | | 2,546,266 | |
Prepaid expenses | | | 2,116 | |
| | | | |
Total assets | | | 195,874,528 | |
| | | | |
Liabilities: | | | | |
Payable for securities purchased | | | 268,611 | |
Payable for when-issued securities purchased | | | 3,027,632 | |
Payable for fund shares redeemed | | | 69,233 | |
Payable for Management fees | | | 108,009 | |
Payable for Directors’ fees | | | 2,048 | |
Payable for Shareholder Servicing fees | | | 41,542 | |
Accrued expenses | | | 38,325 | |
| | | | |
Total liabilities | | | 3,555,400 | |
| | | | |
Net Assets | | $ | 192,319,128 | |
| | | | |
Net Assets consist of: | | | | |
Par value ($0.001 of shares outstanding) | | $ | 18,926 | |
Paid-in capital in excess of par value | | | 194,203,607 | |
Total distributable earnings | | | (1,903,405 | ) |
| | | | |
Total Net Assets** | | $ | 192,319,128 | |
| | | | |
Shares Outstanding2 | | | 18,925,588 | |
| | | | |
Net Asset Value Per Share | | $ | 10.16 | |
| | | | |
| | | | |
**TheSEC eliminated the requirement to disclose total distributable earnings by each of its components as previously disclosed as the previous presentation did not provide insight into the tax implications of distributions. | | | | |
1 Investments at cost | | $ | 191,637,946 | |
2 Authorized shares | | | 80,000,000 | |
See Notes to Financial Statements.
THE GLENMEDE FUND, INC.
STATEMENTS OF OPERATIONS
For the Year Ended October 31, 2018
| | | | | | | | | | | | |
| | | Quantitative
U.S. Large Cap
Core Equity
Portfolio | | | Quantitative
U.S. Large Cap
Growth Equity
Portfolio | | | Quantitative
U.S. Large Cap
Value Equity
Portfolio1 | |
Investment income: | | | | | | | | | | | | |
Dividends | | $ | 54,372,337 | | | $ | 51,083,153 | | | $ | 24,536 | |
Interest | | | 44,769 | | | | 34,846 | | | | 1 | |
Income from security lending | | | 71,321 | | | | 391,982 | | | | 5 | |
| | | | | | | | | | | | |
Total investment income | | | 54,488,427 | | | | 51,509,981 | | | | 24,542 | |
| | | | | | | | | | | | |
Expenses: | | | | | | | | | | | | |
Management fees | | | 16,019,807 | | | | 21,987,704 | | | | 5,708 | |
Administration, transfer agent and custody fees | | | 2,354,935 | | | | 3,108,368 | | | | 20,333 | |
Professional fees | | | 181,532 | | | | 251,903 | | | | 2,541 | |
Shareholder report expenses | | | 162,444 | | | | 325,296 | | | | 1,281 | |
Shareholder servicing fees | | | — | | | | — | | | | 2,076 | |
Shareholder servicing fees (Advisor Class) | | | 4,421,280 | | | | 6,174,063 | | | | — | |
Directors’ fees and expenses | | | 119,078 | | | | 167,649 | | | | 45 | |
Offering expenses | | | — | | | | — | | | | 25,154 | |
Registration and filing fees | | | 70,451 | | | | 67,421 | | | | 8,482 | |
Other expenses | | | 98,413 | | | | 146,395 | | | | 2,074 | |
| | | | | | | | | | | | |
Total expenses | | | 23,427,940 | | | | 32,228,799 | | | | 67,694 | |
| | | | | | | | | | | | |
Less expenses waived/reimbursed | | | — | | | | — | | | | (57,315 | ) |
| | | | | | | | | | | | |
Net expenses | | | 23,427,940 | | | | 32,228,799 | | | | 10,379 | |
| | | | | | | | | | | | |
Net investment income | | | 31,060,487 | | | | 19,281,182 | | | | 14,163 | |
| | | | | | | | | | | | |
Realized and unrealized gain (loss): | | | | | | | | | | | | |
Net realized gain (loss) on: | | | | | | | | | | | | |
Investment transactions | | | 214,504,733 | | | | 439,898,261 | | | | (24,574 | ) |
Net change in unrealized loss of: | | | | | | | | | | | | |
Investments | | | (127,314,232 | ) | | | (206,750,443 | ) | | | (4,590 | ) |
| | | | | | | | | | | | |
Net realized and unrealized gain (loss) | | | 87,190,501 | | | | 233,147,818 | | | | (29,164 | ) |
| | | | | | | | | | | | |
Net increase (decrease) in net assets resulting from operations | | $ | 118,250,988 | | | $ | 252,429,000 | | | $ | (15,001 | ) |
| | | | | | | | | | | | |
| 1 | Portfolio commenced operations on November 13, 2017. |
See Notes to Financial Statements.
THE GLENMEDE FUND, INC.
STATEMENTS OF OPERATIONS — (Continued)
For the Year Ended October 31, 2018
| | | | | | | | | | | | |
| | | Quantitative
U.S. Small Cap Equity
Portfolio1 | | | Quantitative
International
Equity
Portfolio | | | Responsible
ESG U.S.
Equity
Portfolio | |
Investment income: | | | | | | | | | | | | |
Dividends2 | | $ | 15,536 | | | $ | 12,653,216 | | | $ | 329,810 | |
Interest | | | — | | | | 5,442 | | | | 422 | |
Income from security lending | | | 54 | | | | 642,340 | | | | 631 | |
| | | | | | | | | | | | |
Total investment income | | | 15,590 | | | | 13,300,998 | | | | 330,863 | |
| | | | | | | | | | | | |
Expenses: | | | | | | | | | | | | |
Management fees | | | 5,946 | | | | 3,444,127 | | | | 97,368 | |
Administration, transfer agent and custody fees | | | 22,408 | | | | 251,916 | | | | 30,696 | |
Professional fees | | | 2,546 | | | | 28,778 | | | | 1,061 | |
Shareholder report expenses | | | 1,257 | | | | 8,602 | | | | 1,801 | |
Shareholder servicing fees | | | 2,162 | | | | 1,148,043 | | | | 35,407 | |
Directors’ fees and expenses | | | 46 | | | | 19,595 | | | | 717 | |
Offering expenses | | | 25,154 | | | | — | | | | — | |
Registration and filing fees | | | 8,482 | | | | 24,021 | | | | 23,541 | |
Other expenses | | | 2,071 | | | | 7,713 | | | | 2,464 | |
| | | | | | | | | | | | |
Total expenses | | | 70,072 | | | | 4,932,795 | | | | 193,055 | |
| | | | | | | | | | | | |
Less expenses waived/reimbursed | | | (59,262 | ) | | | (340,625 | ) | | | (16,022 | ) |
| | | | | | | | | | | | |
Net expenses | | | 10,810 | | | | 4,592,170 | | | | 177,033 | |
| | | | | | | | | | | | |
Net investment income | | | 4,780 | | | | 8,708,828 | | | | 153,830 | |
| | | | | | | | | | | | |
Realized and unrealized gain (loss): | | | | | | | | | | | | |
Net realized gain (loss) on: | | | | | | | | | | | | |
Investment transactions | | | (3,730 | ) | | | 12,416,904 | | | | 787,318 | |
Net change in unrealized gain (loss) of: | | | | | | | | | | | | |
Investments | | | 27,104 | | | | (69,083,516 | ) | | | (480,378 | ) |
Foreign currency translation | | | — | | | | (24 | ) | | | — | |
| | | | | | | | | | | | |
Net change in unrealized gain (loss) | | | 27,104 | | | | (69,083,540 | ) | | | (480,378 | ) |
| | | | | | | | | | | | |
Net realized and unrealized gain (loss) | | | 23,374 | | | | (56,666,636 | ) | | | 306,940 | |
| | | | | | | | | | | | |
Net increase (decrease) in net assets resulting from operations | | $ | 28,154 | | | $ | (47,957,808 | ) | | $ | 460,770 | |
| | | | | | | | | | | | |
| 1 | Portfolio commenced operations on November 13, 2017. |
| 2 | The Quantitative International Equity Portfolio had foreign dividend withholding taxes of $1,460,174. |
See Notes to Financial Statements.
THE GLENMEDE FUND, INC.
STATEMENTS OF OPERATIONS — (Continued)
For the Year Ended October 31, 2018
| | | | | | | | | | | | |
| | | Women in
Leadership
U.S. Equity
Portfolio | | | Quantitative U.S.
Long/Short
Equity Portfolio | | | Quantitative
U.S. Total
Market Equity
Portfolio | |
Investment income: | | | | | | | | | | | | |
Dividends | | $ | 312,591 | | | $ | 5,805,237 | | | $ | 2,038,840 | |
Interest | | | 256 | | | | 2,452,181 | | | | 1,921 | |
Income from security lending | | | 77 | | | | 1,398 | | | | — | |
| | | | | | | | | | | | |
Total investment income | | | 312,924 | | | | 8,258,816 | | | | 2,040,761 | |
| | | | | | | | | | | | |
Expenses: | | | | | | | | | | | | |
Management fees | | | 91,377 | | | | 3,954,797 | | | | 1,051,631 | |
Administration, transfer agent and custody fees | | | 30,680 | | | | 263,606 | | | | 136,497 | |
Professional fees | | | 1,006 | | | | 20,362 | | | | 5,510 | |
Shareholder report expenses | | | 1,781 | | | | 5,178 | | | | 4,956 | |
Shareholder servicing fees | | | 33,228 | | | | 659,133 | | | | 175,272 | |
Dividends on securities sold short | | | — | | | | 3,658,923 | | | | 425,129 | |
Directors’ fees and expenses | | | 675 | | | | 13,732 | | | | 3,603 | |
Short position flex fees | | | — | | | | — | | | | 196,822 | |
Registration and filing fees | | | 23,541 | | | | 31,118 | | | | 23,977 | |
Other expenses | | | 2,200 | | | | 7,865 | | | | 3,345 | |
| | | | | | | | | | | | |
Total expenses | | | 184,488 | | | | 8,614,714 | | | | 2,026,742 | |
| | | | | | | | | | | | |
Less expenses waived/reimbursed | | | (18,349 | ) | | | (1,153,483 | ) | | | (309,342 | ) |
| | | | | | | | | | | | |
Net expenses | | | 166,139 | | | | 7,461,231 | | | | 1,717,400 | |
| | | | | | | | | | | | |
Net investment income | | | 146,785 | | | | 797,585 | | | | 323,361 | |
| | | | | | | | | | | | |
Realized and unrealized gain (loss): | | | | | | | | | | | | |
Net realized gain on: | | | | | | | | | | | | |
Investment transactions | | | 625,644 | | | | 28,360,510 | | | | 9,329,617 | |
Securities sold short | | | — | | | | (25,562,844 | ) | | | (2,752,346 | ) |
| | | | | | | | | | | | |
Net realized gain | | | 625,644 | | | | 2,797,666 | | | | 6,577,271 | |
| | | | | | | | | | | | |
Net change in unrealized loss of: | | | | | | | | | | | | |
Investments | | | (555,008 | ) | | | (24,427,733 | ) | | | (6,715,343 | ) |
Securities sold short | | | — | | | | 11,778,484 | | | | 1,570,230 | |
| | | | | | | | | | | | |
Net change in unrealized loss | | | (555,008 | ) | | | (12,649,249 | ) | | | (5,145,113 | ) |
| | | | | | | | | | | | |
Net realized and unrealized gain (loss) | | | 70,636 | | | | (9,851,583 | ) | | | 1,432,158 | |
| | | | | | | | | | | | |
Net increase (decrease) in net assets resulting from operations | | $ | 217,421 | | | $ | (9,053,998 | ) | | $ | 1,755,519 | |
| | | | | | | | | | | | |
See Notes to Financial Statements.
THE GLENMEDE FUND, INC.
STATEMENTS OF OPERATIONS — (Continued)
For the Year Ended October 31, 2018
| | | | | | | | | | | | |
| | | Strategic
Equity
Portfolio | | | Small
Cap
Equity
Portfolio | | | Mid
Cap
Equity
Portfolio | |
Investment income: | | | | | | | | | | | | |
Dividends | | $ | 3,668,835 | | | $ | 34,952,444 | | | $ | 181,900 | |
Interest | | | 7,472 | | | | 214,041 | | | | 510 | |
Income from security lending | | | 3,153 | | | | 1,147,067 | | | | 349 | |
| | | | | | | | | | | | |
Total investment income | | | 3,679,460 | | | | 36,313,552 | | | | 182,759 | |
| | | | | | | | | | | | |
Expenses: | | | | | | | | | | | | |
Management fees | | | 1,253,734 | | | | 20,614,891 | | | | 64,882 | |
Administration, transfer agent and custody fees | | | 131,536 | | | | 2,888,140 | | | | 28,475 | |
Professional fees | | | 14,123 | | | | 234,598 | | | | 1,008 | |
Shareholder report expenses | | | 3,800 | | | | 328,686 | | | | 1,976 | |
Shareholder servicing fees | | | 455,903 | | | | — | | | | — | |
Shareholder servicing fees (Advisor Class) | | | — | | | | 3,945,240 | | | | 29,492 | |
Shareholder servicing fees (Institutional Class) | | | — | | | | 1,085,033 | | | | — | |
Directors’ fees and expenses | | | 9,489 | | | | 155,075 | | | | 448 | |
Registration and filing fees | | | 10,108 | | | | 50,097 | | | | 37,296 | |
Other expenses | | | 5,542 | | | | 146,785 | | | | 2,262 | |
| | | | | | | | | | | | |
Total expenses | | | 1,884,235 | | | | 29,448,545 | | | | 165,839 | |
| | | | | | | | | | | | |
Less expenses waived/reimbursed | | | — | | | | — | | | | (47,872 | ) |
| | | | | | | | | | | | |
Net expenses | | | 1,884,235 | | | | 29,448,545 | | | | 117,967 | |
| | | | | | | | | | | | |
Net investment income | | | 1,795,225 | | | | 6,865,007 | | | | 64,792 | |
| | | | | | | | | | | | |
Realized and unrealized gain (loss): | | | | | | | | | | | | |
Net realized gain on: | | | | | | | | | | | | |
Investment transactions | | | 2,696,774 | | | | 438,340,023 | | | | 2,681,742 | |
Net change in unrealized gain (loss) of: | | | | | | | | | | | | |
Investments | | | 6,004,844 | | | | (483,441,224 | ) | | | (2,536,921 | ) |
| | | | | | | | | | | | |
Net realized and unrealized gain (loss) | | | 8,701,618 | | | | (45,101,201 | ) | | | 144,821 | |
| | | | | | | | | | | | |
Net increase (decrease) in net assets resulting from operations | | $ | 10,496,843 | | | $ | (38,236,194 | ) | | $ | 209,613 | |
| | | | | | | | | | | | |
See Notes to Financial Statements.
THE GLENMEDE FUND, INC.
STATEMENTS OF OPERATIONS — (Continued)
For the Year Ended October 31, 2018
| | | | | | | | | | | | |
| | | Large
Cap
Value
Portfolio | | | Equity
Income
Portfolio | | | Secured
Options
Portfolio | |
Investment income: | | | | | | | | | | | | |
Dividends | | $ | 2,018,905 | | | $ | 499,538 | | | $ | 249,808 | |
Interest | | | 822 | | | | 362 | | | | 2,493,003 | |
Income from security lending | | | 208 | | | | 642 | | | | — | |
| | | | | | | | | | | | |
Total investment income | | | 2,019,935 | | | | 500,542 | | | | 2,742,811 | |
| | | | | | | | | | | | |
Expenses: | | | | | | | | | | | | |
Management fees | | | 427,258 | | | | 96,056 | | | | 4,408,239 | |
Administration, transfer agent and custody fees | | | 88,505 | | | | 38,016 | | | | 547,545 | |
Professional fees | | | 4,862 | | | | 1,012 | | | | 51,345 | |
Shareholder report expenses | | | 1,756 | | | | 1,681 | | | | 36,528 | |
Shareholder servicing fees | | | 155,367 | | | | 34,929 | | | | — | |
Shareholder servicing fees (Advisor Class) | | | — | | | | — | | | | 884,796 | |
Directors’ fees and expenses | | | 3,229 | | | | 751 | | | | 33,322 | |
Interest expense | | | — | | | | — | | | | 614 | |
Offering expenses | | | — | | | | 13,147 | | | | — | |
Registration and filing fees | | | 21,016 | | | | 7,013 | | | | 46,545 | |
Other expenses | | | 2,957 | | | | 1,573 | | | | 32,876 | |
| | | | | | | | | | | | |
Total expenses | | | 704,950 | | | | 194,178 | | | | 6,041,810 | |
| | | | | | | | | | | | |
Less expenses waived/reimbursed | | | — | | | | (45,728 | ) | | | — | |
| | | | | | | | | | | | |
Net expenses | | | 704,950 | | | | 148,450 | | | | 6,041,810 | |
| | | | | | | | | | | | |
Net investment income (loss) | | | 1,314,985 | | | | 352,092 | | | | (3,298,999 | ) |
| | | | | | | | | | | | |
Realized and unrealized gain (loss): | | | | | | | | | | | | |
Net realized gain on: | | | | | | | | | | | | |
Investment transactions | | | 6,230,383 | | | | 344,821 | | | | 7,341 | |
Options written | | | — | | | | — | | | | (74,422,576 | ) |
Purchased options | | | — | | | | — | | | | 113,477,232 | |
| | | | | | | | | | | | |
Net realized gain | | | 6,230,383 | | | | 344,821 | | | | 39,061,997 | |
| | | | | | | | | | | | |
Net change in unrealized loss of: | | | | | | | | | | | | |
Investments | | | (7,462,298 | ) | | | (442,641 | ) | | | 677,563 | |
Options written | | | — | | | | — | | | | 124,373,837 | |
Purchased options | | | — | | | | — | | | | (141,199,630 | ) |
| | | | | | | | | | | | |
Net change in unrealized loss | | | (7,462,298 | ) | | | (442,641 | ) | | | (16,148,230 | ) |
| | | | | | | | | | | | |
Net realized and unrealized gain (loss) | | | (1,231,915 | ) | | | (97,820 | ) | | | 22,913,767 | |
| | | | | | | | | | | | |
Net increase in net assets resulting from operations | | $ | 83,070 | | | $ | 254,272 | | | $ | 19,614,768 | |
| | | | | | | | | | | | |
See Notes to Financial Statements.
THE GLENMEDE FUND, INC.
STATEMENTS OF OPERATIONS — (Continued)
For the Year Ended October 31, 2018
| | | | | | | | | | | | |
| | | Global
Secured
Options
Portfolio | | | Core
Fixed
Income
Portfolio | | | Short Term
Tax Aware
Fixed
Income
Portfolio | |
Investment income: | | | | | | | | | | | | |
Dividends1 | | $ | 81,628 | | | $ | — | | | $ | 37,227 | |
Interest | | | 15,637 | | | | 13,232,723 | | | | 404,912 | |
Income from security lending | | | — | | | | 8,591 | | | | 1,093 | |
| | | | | | | | | | | | |
Total investment income | | | 97,265 | | | | 13,241,314 | | | | 443,232 | |
| | | | | | | | | | | | |
Expenses: | | | | | | | | | | | | |
Management fees | | | 42,460 | | | | 1,681,283 | | | | 105,512 | |
Administration, transfer agent and custody fees | | | 19,721 | | | | 268,298 | | | | 35,783 | |
Professional fees | | | 329 | | | | 29,670 | | | | 2,042 | |
Shareholder report expenses | | | 2,217 | | | | 3,047 | | | | 689 | |
Shareholder servicing fees | | | 15,440 | | | | 480,367 | | | | 30,146 | |
Dividends on securities sold short | | | 5,198 | | | | — | | | | — | |
Directors’ fees and expenses | | | 82 | | | | 19,887 | | | | 1,250 | |
Interest expense | | | 580 | | | | — | | | | — | |
Registration and filing fees | | | 3,338 | | | | 8,736 | | | | 4,959 | |
Other expenses | | | 1,814 | | | | 10,679 | | | | 2,961 | |
| | | | | | | | | | | | |
Total expenses | | | 91,179 | | | | 2,501,967 | | | | 183,342 | |
| | | | | | | | | | | | |
Less expenses waived/reimbursed | | | — | | | | — | | | | (17,538 | ) |
| | | | | | | | | | | | |
Net expenses | | | 91,179 | | | | 2,501,967 | | | | 165,804 | |
| | | | | | | | | | | | |
Net investment income | | | 6,086 | | | | 10,739,347 | | | | 277,428 | |
| | | | | | | | | | | | |
Realized and unrealized gain (loss): | | | | | | | | | | | | |
Net realized gain (loss) on: | | | | | | | | | | | | |
Investment transactions | | | 978,833 | | | | (1,233,187 | ) | | | (55,210 | ) |
Options written | | | (215,170 | ) | | | — | | | | — | |
Purchased options | | | 608,556 | | | | — | | | | — | |
| | | | | | | | | | | | |
Net realized gain (loss) | | | 1,372,219 | | | | (1,233,187 | ) | | | (55,210 | ) |
| | | | | | | | | | | | |
Net change in unrealized loss of: | | | | | | | | | | | | |
Investments | | | (1,013,339 | ) | | | (20,734,389 | ) | | | (221,379 | ) |
Options written | | | 150,393 | | | | — | | | | — | |
Purchased options | | | (214,780 | ) | | | — | | | | — | |
| | | | | | | | | | | | |
Net change in unrealized loss | | | (1,077,726 | ) | | | (20,734,389 | ) | | | (221,379 | ) |
| | | | | | | | | | | | |
Net realized and unrealized gain (loss) | | | 294,493 | | | | (21,967,576 | ) | | | (276,589 | ) |
| | | | | | | | | | | | |
Net increase (decrease) in net assets resulting from operations | | $ | 300,579 | | | $ | (11,228,229 | ) | | $ | 839 | |
| | | | | | | | | | | | |
| 1 | Global Secured Options Portfolio had foreign dividend withholding taxes of $12,625. |
See Notes to Financial Statements.
THE GLENMEDE FUND, INC.
STATEMENTS OF OPERATIONS — (Concluded)
For the Year Ended October 31, 2018
| | | | |
| | | High Yield
Municipal
Portfolio | |
Investment income: | | | | |
Interest | | $ | 7,318,160 | |
| | | | |
Total investment income | | | 7,318,160 | |
| | | | |
Expenses: | | | | |
Management fees | | | 1,221,364 | |
Administration, transfer agent and custody fees | | | 135,023 | |
Professional fees | | | 11,269 | |
Shareholder report expenses | | | 2,726 | |
Shareholder servicing fees | | | 469,755 | |
Directors’ fees and expenses | | | 7,835 | |
Registration and filing fees | | | 9,484 | |
Other expenses | | | 7,833 | |
| | | | |
Total expenses | | | 1,865,289 | |
| | | | |
Net investment income | | | 5,452,871 | |
| | | | |
Realized and unrealized gain (loss): | | | | |
Net realized loss on: | | | | |
Investment transactions | | | (302,326 | ) |
Net change in unrealized loss of: | | | | |
Investments | | | (3,329,635 | ) |
| | | | |
Net realized and unrealized loss | | | (3,631,961 | ) |
| | | | |
Net increase in net assets resulting from operations | | $ | 1,820,910 | |
| | | | |
See Notes to Financial Statements.
THE GLENMEDE FUND, INC.
STATEMENTS OF CHANGES IN NET ASSETS
For the Year Ended October 31, 2018
| | | | | | | | | | | | |
| | | Quantitative
U.S. Large Cap
Core Equity
Portfolio | | | Quantitative
U.S. Large Cap
Growth Equity
Portfolio | | | Quantitative
U.S. Large Cap
Value Equity
Portfolio1 | |
Increase (decrease) in net assets | | | | | | | | | | | | |
Operations: | | | | | | | | | | | | |
Net investment income | | $ | 31,060,487 | | | $ | 19,281,182 | | | $ | 14,163 | |
Net realized gain (loss) on: | | | | | | | | | | | | |
Investment transactions | | | 214,504,733 | | | | 439,898,261 | | | | (24,574 | ) |
Net change in unrealized loss of: | | | | | | | | | | | | |
Investments | | | (127,314,232 | ) | | | (206,750,443 | ) | | | (4,590 | ) |
| | | | | | | | | | | | |
Net increase (decrease) in net assets resulting from operations | | | 118,250,988 | | | | 252,429,000 | | | | (15,001 | ) |
Distributions from earnings* | | | — | | | | — | | | | (12,152 | ) |
Distributions from earnings: Advisor Class* | | | (108,519,634 | ) | | | (71,840,240 | ) | | | — | |
Distributions from earnings: Institutional Class* | | | (32,533,715 | ) | | | (22,676,269 | ) | | | — | |
Net increase (decrease) in net assets from capital share transactions (See note 6) | | | 191,028,830 | | | | (688,056,159 | ) | | | 1,118,927 | |
| | | | | | | | | | | | |
Net increase (decrease) in net assets | | | 168,226,469 | | | | (530,143,668 | ) | | | 1,091,774 | |
| | | | | | | | | | | | |
| | | |
NET ASSETS: | | | | | | | | | | | | |
Beginning of year | | | 2,674,155,128 | | | | 3,937,031,556 | | | | — | |
| | | | | | | | | | | | |
End of year** | | $ | 2,842,381,597 | | | $ | 3,406,887,888 | | | $ | 1,091,774 | |
| | | | | | | | | | | | |
| * | The SEC eliminated the requirement to disclose distributions to shareholders from net investment income and from net realized gains in 2018. |
| ** | The SEC eliminated the requirement to disclose undistributed net investment income in 2018. |
| 1 | Portfolio commenced operations on November 13, 2017. |
For the Year Ended October 31, 2017
| | | | | | | | |
| | | Quantitative
U.S. Large Cap
Core Equity
Portfolio | | | Quantitative
U.S. Large Cap
Growth Equity
Portfolio | |
Increase (decrease) in net assets | | | | | | | | |
Operations: | | | | | | | | |
Net investment income | | $ | 23,053,074 | | | $ | 20,244,197 | |
Net realized gain on: | | | | | | | | |
Investment transactions | | | 112,943,392 | | | | 92,697,678 | |
Net change in unrealized gain of: | | | | | | | | |
Investments | | | 413,294,193 | | | | 757,074,891 | |
| | | | | | | | |
Net increase in net assets resulting from operations | | | 549,290,659 | | | | 870,016,766 | |
Distributions to shareholders from: | | | | | | | | |
Net investment income: | | | | | | | | |
Advisor Class | | | (18,027,294 | ) | | | (17,159,516 | ) |
Institutional Class | | | (4,495,507 | ) | | | (1,964,103 | ) |
Net increase in net assets from capital share transactions (See note 6) | | | 180,603,560 | | | | 62,682,043 | |
| | | | | | | | |
Net increase in net assets | | | 707,371,418 | | | | 913,575,190 | |
| | | | | | | | |
| | |
NET ASSETS: | | | | | | | | |
Beginning of year | | | 1,966,783,710 | | | | 3,023,456,366 | |
| | | | | | | | |
End of year | | $ | 2,674,155,128 | | | $ | 3,937,031,556 | |
| | | | | | | | |
Undistributed net investment income included in net assets at end of year | | $ | 2,032,279 | | | $ | 2,019,426 | |
See Notes to Financial Statements.
THE GLENMEDE FUND, INC.
STATEMENTS OF CHANGES IN NET ASSETS — (Continued)
For the Year Ended October 31, 2018
| | | | | | | | | | | | |
| | | Quantitative
U.S. Small Cap
Equity Portfolio1 | | | Quantitative
International
Equity Portfolio | | | Responsible
ESG U.S.
Equity
Portfolio | |
Increase (decrease) in net assets | | | | | | | | | | | | |
Operations: | | | | | | | | | | | | |
Net investment income | | $ | 4,780 | | | $ | 8,708,828 | | | $ | 153,830 | |
Net realized gain (loss) on: | | | | | | | | | | | | |
Investment transactions | | | (3,730 | ) | | | 12,416,904 | | | | 787,318 | |
Net change in unrealized gain (loss) of: | | | | | | | | | | | | |
Investments | | | 27,104 | | | | (69,083,516 | ) | | | (480,378 | ) |
Foreign currency translations | | | — | | | | (24 | ) | | | — | |
| | | | | | | | | | | | |
Net increase (decrease) in net assets resulting from operations | | | 28,154 | | | | (47,957,808 | ) | | | 460,770 | |
Distributions from earnings* | | | (3,800 | ) | | | (8,716,752 | ) | | | (202,750 | ) |
Net increase (decrease) in net assets from capital share transactions (See note 6) | | | 1,049,200 | | | | (17,822,688 | ) | | | 7,899,714 | |
| | | | | | | | | | | | |
Net increase (decrease) in net assets | | | 1,073,554 | | | | (74,497,248 | ) | | | 8,157,734 | |
| | | | | | | | | | | | |
NET ASSETS: | | | | | | | | | | | | |
Beginning of year | | | — | | | | 461,685,627 | | | | 13,588,594 | |
| | | | | | | | | | | | |
End of year** | | $ | 1,073,554 | | | $ | 387,188,379 | | | $ | 21,746,328 | |
| | | | | | | | | | | | |
| * | The SEC eliminated the requirement to disclose distributions to shareholders from net investment income and from net realized gains in 2018. |
| ** | The SEC eliminated the requirement to disclose undistributed net investment income in 2018. |
| 1 | Portfolio commenced operations on November 13, 2017. |
For the Year Ended October 31, 2017
| | | | | | | | |
| | | Quantitative
International
Equity Portfolio | | | Responsible
ESG U.S.
Equity
Portfolio | |
Increase (decrease) in net assets | | | | | | | | |
Operations: | | | | | | | | |
Net investment income | | $ | 7,911,346 | | | $ | 74,582 | |
Net realized gain (loss) on: | | | | | | | | |
Investment transactions | | | 11,937,738 | | | | 83,890 | |
Foreign currency transactions | | | (837 | ) | | | — | |
Net change in unrealized gain of: | | | | | | | | |
Investments | | | 62,545,150 | | | | 2,025,228 | |
Foreign currency translations | | | 206 | | | | — | |
| | | | | | | | |
Net increase in net assets resulting from operations | | | 82,393,603 | | | | 2,183,700 | |
Distributions to shareholders from: | | | | | | | | |
Net investment income | | | (7,885,718 | ) | | | (65,637 | ) |
Net increase (decrease) in net assets from capital share transactions (See note 6) | | | (54,106,530 | ) | | | 4,909,970 | |
| | | | | | | | |
Net increase in net assets | | | 20,401,355 | | | | 7,028,033 | |
| | | | | | | | |
| | |
NET ASSETS: | | | | | | | | |
Beginning of year | | | 441,284,272 | | | | 6,560,561 | |
| | | | | | | | |
End of year | | $ | 461,685,627 | | | $ | 13,588,594 | |
| | | | | | | | |
Undistributed net investment income included in net assets at end of year | | $ | 212,072 | | | $ | 7,492 | |
See Notes to Financial Statements.
THE GLENMEDE FUND, INC.
STATEMENTS OF CHANGES IN NET ASSETS — (Continued)
For the Year Ended October 31, 2018
| | | | | | | | | | | | |
| | | Women in
Leadership
U.S. Equity
Portfolio | | | Quantitative
U.S. Long/
Short Equity
Portfolio | | | Quantitative
U.S. Total
Market Equity
Portfolio | |
Increase (decrease) in net assets | | | | | | | | | | | | |
Operations: | | | | | | | | | | | | |
Net investment income | | $ | 146,785 | | | $ | 797,585 | | | $ | 323,361 | |
Net realized gain (loss) on: | | | | | | | | | | | | |
Investment transactions | | | 625,644 | | | | 28,360,510 | | | | 9,329,617 | |
Securities sold short | | | — | | | | (25,562,844 | ) | | | (2,752,346 | ) |
Net change in unrealized gain (loss) of: | | | | | | | | | | | | |
Investments | | | (555,008 | ) | | | (24,427,733 | ) | | | (6,715,343 | ) |
Securities sold short | | | — | | | | 11,778,484 | | | | 1,570,230 | |
| | | | | | | | | | | | |
Net increase (decrease) in net assets resulting from operations | | | 217,421 | | | | (9,053,998 | ) | | | 1,755,519 | |
Distributions from earnings* | | | (223,116 | ) | | | — | | | | (2,506,149 | ) |
Net increase in net assets from capital share transactions (See note 6) | | | 7,125,920 | | | | 42,075,902 | | | | 17,093,541 | |
| | | | | | | | | | | | |
Net increase in net assets | | | 7,120,225 | | | | 33,021,904 | | | | 16,342,911 | |
| | | | | | | | | | | | |
| | | |
NET ASSETS: | | | | | | | | | | | | |
Beginning of year | | | 11,853,352 | | | | 300,783,832 | | | | 74,267,201 | |
| | | | | | | | | | | | |
End of year** | | $ | 18,973,577 | | | $ | 333,805,736 | | | $ | 90,610,112 | |
| | | | | | | | | | | | |
| * | The SEC eliminated the requirement to disclose distributions to shareholders from net investment income and from net realized gains in 2018. |
| ** | The SEC eliminated the requirement to disclose undistributed net investment income in 2018. |
For the Year Ended October 31, 2017
| | | | | | | | | | | | |
| | | Women in
Leadership
U.S. Equity
Portfolio | | | Quantitative
U.S. Long/
Short Equity
Portfolio | | | Quantitative
U.S. Total
Market
Equity
Portfolio | |
Increase (decrease) in net assets | | | | | | | | | | | | |
Operations: | | | | | | | | | | | | |
Net investment income (loss) | | $ | 77,241 | | | $ | (1,165,154 | ) | | $ | 158,212 | |
Net realized gain (loss) on: | | | | | | | | | | | | |
Investment transactions | | | 79,110 | | | | 11,127,045 | | | | 4,562,367 | |
Securities sold short | | | — | | | | (21,190,936 | ) | | | (1,343,742 | ) |
Net change in unrealized gain (loss) of: | | | | | | | | | | | | |
Investments | | | 1,684,871 | | | | 47,654,596 | | | | 13,933,940 | |
Securities sold short | | | — | | | | (3,867,310 | ) | | | (291,629 | ) |
| | | | | | | | | | | | |
Net increase in net assets resulting from operations | | | 1,841,222 | | | | 32,558,241 | | | | 17,019,148 | |
Distributions to shareholders from: | | | | | | | | | | | | |
Net investment income | | | (77,872 | ) | | | — | | | | (160,173 | ) |
Net increase (decrease) in net assets from capital share transactions (See note 6) . | | | 3,573,344 | | | | 28,812,138 | | | | (3,674,368 | ) |
| | | | | | | | | | | | |
Net increase in net assets | | | 5,336,694 | | | | 61,370,379 | | | | 13,184,607 | |
| | | | | | | | | | | | |
| | | |
NET ASSETS: | | | | | | | | | | | | |
Beginning of year | | | 6,516,658 | | | | 239,413,453 | | | | 61,082,594 | |
| | | | | | | | | | | | |
End of year | | $ | 11,853,352 | | | $ | 300,783,832 | | | $ | 74,267,201 | |
| | | | | | | | | | | | |
Undistributed (distributions in excess of) net investment income included in net assets at end of year | | $ | 6,920 | | | $ | (852,391 | ) | | $ | 15,798 | |
See Notes to Financial Statements.
THE GLENMEDE FUND, INC.
STATEMENTS OF CHANGES IN NET ASSETS — (Continued)
For the Year Ended October 31, 2018
| | | | | | | | | | | | |
| | | Strategic
Equity
Portfolio | | | Small
Cap
Equity
Portfolio | | | Mid
Cap
Equity
Portfolio | |
Increase (decrease) in net assets | | | | | | | | | | | | |
Operations: | | | | | | | | | | | | |
Net investment income | | $ | 1,795,225 | | | $ | 6,865,007 | | | $ | 64,792 | |
Net realized gain on: | | | | | | | | | | | | |
Investment transactions | | | 2,696,774 | | | | 438,340,023 | | | | 2,681,742 | |
Net change in unrealized gain (loss) of: | | | | | | | | | | | | |
Investments | | | 6,004,844 | | | | (483,441,224 | ) | | | (2,536,921 | ) |
| | | | | | | | | | | | |
Net increase (decrease) in net assets resulting from operations | | | 10,496,843 | | | | (38,236,194 | ) | | | 209,613 | |
Distributions from earnings* | | | (15,680,195 | ) | | | — | | | | — | |
Distributions from earnings: Advisor Class* | | | — | | | | (155,679,103 | ) | | | (63,157 | ) |
Distributions from earnings: Institutional Class* | | | — | | | | (186,692,964 | ) | | | — | |
Net increase (decrease) in net assets from capital share transactions (See note 6) | | | 21,876,413 | | | | 447,569,616 | | | | (11,770,101 | ) |
| | | | | | | | | | | | |
Net increase (decrease) in net assets | | | 16,693,061 | | | | 66,961,355 | | | | (11,623,645 | ) |
| | | | | | | | | | | | |
| | | |
NET ASSETS: | | | | | | | | | | | | |
Beginning of year | | | 209,339,001 | | | | 3,454,636,210 | | | | 14,789,602 | |
| | | | | | | | | | | | |
End of year** | | $ | 226,032,062 | | | $ | 3,521,597,565 | | | $ | 3,165,957 | |
| | | | | | | | | | | | |
| * | The SEC eliminated the requirement to disclose distributions to shareholders from net investment income and from net realized gains in 2018. |
| ** | The SEC eliminated the requirement to disclose undistributed net investment income in 2018. |
For the Year Ended October 31, 2017
| | | | | | | | | | | | |
| | | Strategic
Equity
Portfolio | | | Small
Cap
Equity
Portfolio | | | Mid
Cap
Equity
Portfolio | |
Increase (decrease) in net assets | | | | | | | | | | | | |
Operations: | | | | | | | | | | | | |
Net investment income | | $ | 1,612,540 | | | $ | 2,134,665 | | | $ | 51,985 | |
Net realized gain on: | | | | | | | | | | | | |
Investment transactions | | | 13,878,632 | | | | 339,553,081 | | | | 1,218,041 | |
Net change in unrealized gain of: | | | | | | | | | | | | |
Investments | | | 31,243,358 | | | | 398,451,691 | | | | 1,655,207 | |
| | | | | | | | | | | | |
Net increase in net assets resulting from operations | | | 46,734,530 | | | | 740,139,437 | | | | 2,925,233 | |
Distributions to shareholders from: | | | | | | | | | | | | |
Net investment income: | | | | | | | | | | | | |
Net investment income | | | (1,598,222 | ) | | | — | | | | — | |
Advisor Class | | | — | | | | (1,143,575 | ) | | | (62,132 | ) |
Institutional Class | | | — | | | | (1,571,028 | ) | | | — | |
Net realized gain on investments: | | | | | | | | | | | | |
Net realized gain on investments | | | (11,563,281 | ) | | | — | | | | — | |
Advisor Class | | | — | | | | (27,237,864 | ) | | | — | |
Institutional Class | | | — | | | | (24,946,026 | ) | | | — | |
Net increase (decrease) in net assets from capital share transactions (See note 6) | | | (1,097,983 | ) | | | 137,483,317 | | | | (6,122,043 | ) |
| | | | | | | | | | | | |
Net increase (decrease) in net assets | | | 32,475,044 | | | | 822,724,261 | | | | (3,258,942 | ) |
| | | | | | | | | | | | |
| | | |
NET ASSETS: | | | | | | | | | | | | |
Beginning of year | | | 176,863,957 | | | | 2,631,911,949 | | | | 18,048,544 | |
| | | | | | | | | | | | |
End of year | | $ | 209,339,001 | | | $ | 3,454,636,210 | | | $ | 14,789,602 | |
| | | | | | | | | | | | |
Undistributed net investment income included in net assets at end of year | | $ | 239,060 | | | $ | 348,454 | | | $ | 1,140 | |
See Notes to Financial Statements.
THE GLENMEDE FUND, INC.
STATEMENTS OF CHANGES IN NET ASSETS — (Continued)
For the Year Ended October 31, 2018
| | | | | | | | | | | | |
| | | Large Cap
Value
Portfolio | | | Equity
Income
Portfolio | | | Secured
Options
Portfolio | |
Increase (decrease) in net assets | | | | | | | | | | | | |
Operations: | | | | | | | | | | | | |
Net investment income (loss) | | $ | 1,314,985 | | | $ | 352,092 | | | $ | (3,298,999 | ) |
Net realized gain (loss) on: | | | | | | | | | | | | |
Investment transactions | | | 6,230,383 | | | | 344,821 | | | | 7,341 | |
Options written | | | — | | | | — | | | | (74,422,576 | ) |
Purchased options | | | — | | | | — | | | | 113,477,232 | |
Net change in unrealized gain (loss) of: | | | | | | | | | | | | |
Investments | | | (7,462,298 | ) | | | (442,641 | ) | | | 677,563 | |
Options written | | | — | | | | — | | | | 124,373,837 | |
Purchased options | | | — | | | | — | | | | (141,199,630 | ) |
| | | | | | | | | | | | |
Net increase in net assets resulting from operations | | | 83,070 | | | | 254,272 | | | | 19,614,768 | |
Distributions from earnings* | | | (5,981,449 | ) | | | (342,969 | ) | | | — | |
Distributions from earnings: Advisor Class* | | | — | | | | — | | | | (27,003,515 | ) |
Distributions from earnings: Institutional Class* | | | — | | | | — | | | | (22,919,496 | ) |
Net increase in net assets from capital share transactions (See note 6) | | | 1,030,019 | | | | 5,654,233 | | | | 60,394,967 | |
| | | | | | | | | | | | |
Net increase (decrease) in net assets | | | (4,868,360 | ) | | | 5,565,536 | | | | 30,086,724 | |
| | | | | | | | | | | | |
| | | |
NET ASSETS: | | | | | | | | | | | | |
Beginning of year | | | 76,464,871 | | | | 12,970,080 | | | | 812,382,301 | |
| | | | | | | | | | | | |
End of year** | | $ | 71,596,511 | | | $ | 18,535,616 | | | $ | 842,469,025 | |
| | | | | | | | | | | | |
| * | The SEC eliminated the requirement to disclose distributions to shareholders from net investment income and from net realized gains in 2018. |
| ** | The SEC eliminated the requirement to disclose undistributed net investment income in 2018. |
For the Year Ended October 31, 2017
| | | | | | | | | | | | |
| | | Large Cap
Value
Portfolio | | | Equity
Income
Portfolio1 | | | Secured
Options
Portfolio | |
Increase (decrease) in net assets | | | | | | | | | | | | |
Operations: | | | | | | | | | | | | |
Net investment income (loss) | | $ | 1,514,496 | | | $ | 126,103 | | | $ | (4,552,698 | ) |
Net realized gain (loss) on: | | | | | | | | | | | | |
Investment transactions | | | 4,942,796 | | | | (17,393 | ) | | | 6,370,303 | |
Options written | | | — | | | | — | | | | 45,444,375 | |
Net change in unrealized gain of: | | | | | | | | | | | | |
Investments | | | 8,697,281 | | | | 879,089 | | | | 2,988,347 | |
Options Written | | | — | | | | — | | | | 1,863,564 | |
| | | | | | | | | | | | |
Net increase in net assets resulting from operations | | | 15,154,573 | | | | 987,799 | | | | 52,113,891 | |
Distributions to shareholders from: | | | | | | | | | | | | |
Net investment income | | | (1,640,134 | ) | | | (105,892 | ) | | | — | |
Net realized gain on investments: | | | | | | | | | | | | |
Net realized gain on investments | | | (5,421,668 | ) | | | — | | | | — | |
Advisor Class | | | — | | | | — | | | | (24,886,106 | ) |
Institutional Class | | | — | | | | — | | | | (3,551,257 | ) |
Net increase (decrease) in net assets from capital share transactions (See note 6) | | | (3,782,215 | ) | | | 12,088,173 | | | | 214,505,934 | |
| | | | | | | | | | | | |
Net increase in net assets | | | 4,310,556 | | | | 12,970,080 | | | | 238,182,462 | |
| | | | | | | | | | | | |
NET ASSETS: | | | | | | | | | | | | |
Beginning of year | | | 72,154,315 | | | | — | | | | 574,199,839 | |
| | | | | | | | | | | | |
End of year | | $ | 76,464,871 | | | $ | 12,970,080 | | | $ | 812,382,301 | |
| | | | | | | | | | | | |
Undistributed (distributions in excess of) net investment income included in net assets at end of year | | $ | 39,233 | | | $ | 19,270 | | | $ | (21,056 | ) |
| 1 | Portfolio commenced operations on December 21, 2016. |
See Notes to Financial Statements.
THE GLENMEDE FUND, INC.
STATEMENTS OF CHANGES IN NET ASSETS — (Continued)
For the Year Ended October 31, 2018
| | | | | | | | | | | | |
| | | Global
Secured
Options
Portfolio | | | Core
Fixed
Income
Portfolio | | | Short Term
Tax Aware
Fixed
Income
Portfolio | |
Increase (decrease) in net assets | | | | | | | | | | | | |
Operations: | | | | | | | | | | | | |
Net investment income | | $ | 6,086 | | | $ | 10,739,347 | | | $ | 277,428 | |
Net realized gain (loss) on: | | | | | | | | | | | | |
Investment transactions | | | 978,833 | | | | (1,233,187 | ) | | | (55,210 | ) |
Options written | | | (215,170 | ) | | | — | | | | — | |
Purchased options | | | 608,556 | | | | — | | | | — | |
Net change in unrealized gain (loss) of: | | | | | | | | | | | | |
Investments | | | (1,013,339 | ) | | | (20,734,389 | ) | | | (221,379 | ) |
Options written | | | 150,393 | | | | — | | | | — | |
Purchased options | | | (214,780 | ) | | | — | | | | — | |
| | | | | | | | | | | | |
Net increase (decrease) in net assets resulting from operations | | | 300,579 | | | | (11,228,229 | ) | | | 839 | |
Distributions from earnings* | | | (90,635 | ) | | | (13,346,135 | ) | | | (272,978 | ) |
Net increase (decrease) in net assets from capital share transactions (See note 6) | | | (8,341,643 | ) | | | 21,227,341 | | | | (7,334,294 | ) |
| | | | | | | | | | | | |
Net increase (decrease) in net assets | | | (8,131,699 | ) | | | (3,347,023 | ) | | | (7,606,433 | ) |
| | | | | | | | | | | | |
| | | |
NET ASSETS: | | | | | | | | | | | | |
Beginning of year | | | 10,641,618 | | | | 488,548,092 | | | | 33,900,324 | |
| | | | | | | | | | | | |
End of year** | | $ | 2,509,919 | | | $ | 485,201,069 | | | $ | 26,293,891 | |
| | | | | | | | | | | | |
| * | The SEC eliminated the requirement to disclose distributions to shareholders from net investment income and from net realized gains in 2018. |
| ** | The SEC eliminated the requirement to disclose undistributed net investment income in 2018. |
For the Year Ended October 31, 2017
| | | | | | | | | | | | |
| | | Global
Secured
Options
Portfolio | | | Core
Fixed
Income
Portfolio | | | Short Term
Tax Aware
Fixed
Income
Portfolio | |
Increase (decrease) in net assets | | | | | | | | | | | | |
Operations: | | | | | | | | | | | | |
Net investment income | | $ | 90,179 | | | $ | 9,162,397 | | | $ | 221,377 | |
Net realized gain (loss) on: | | | | | | | | | | | | |
Investment transactions | | | 1,210,345 | | | | 2,642,385 | | | | (77,153 | ) |
Options written | | | (19,710 | ) | | | — | | | | — | |
Net change in unrealized gain (loss) of: | | | | | | | | | | | | |
Investments | | | 543,844 | | | | (8,388,143 | ) | | | 51,889 | |
Options Written | | | (91,742 | ) | | | — | | | | — | |
| | | | | | | | | | | | |
Net increase in net assets resulting from operations | | | 1,732,916 | | | | 3,416,639 | | | | 196,113 | |
Distributions to shareholders from: | | | | | | | | | | | | |
Net investment income | | | (135,356 | ) | | | (9,796,163 | ) | | | (215,204 | ) |
Net realized gain on investments | | | — | | | | (3,226,898 | ) | | | — | |
Net increase (decrease) in net assets from capital share transactions (See note 6) | | | (19,774,126 | ) | | | 11,282,745 | | | | 3,842,969 | |
| | | | | | | | | | | | |
Net increase (decrease) in net assets | | | (18,176,566 | ) | | | 1,676,323 | | | | 3,823,878 | |
| | | | | | | | | | | | |
| | | |
NET ASSETS: | | | | | | | | | | | | |
Beginning of year | | | 28,818,184 | | | | 486,871,769 | | | | 30,076,446 | |
| | | | | | | | | | | | |
End of year | | $ | 10,641,618 | | | $ | 488,548,092 | | | $ | 33,900,324 | |
| | | | | | | | | | | | |
Undistributed net investment income included in net assets at end of year | | $ | 27,533 | | | $ | 927,412 | | | $ | 18,485 | |
See Notes to Financial Statements.
THE GLENMEDE FUND, INC.
STATEMENTS OF CHANGES IN NET ASSETS — (Concluded)
For the Year Ended October 31, 2018
| | | | |
| | | High Yield
Municipal
Portfolio | |
Increase (decrease) in net assets | | | | |
Operations: | | | | |
Net investment income | | $ | 5,452,871 | |
Net realized loss on: | | | | |
Investment transactions | | | (302,326 | ) |
Net change in unrealized loss of: | | | | |
Investments | | | (3,329,635 | ) |
| | | | |
Net increase in net assets resulting from operations | | | 1,820,910 | |
Distributions from earnings* | | | (5,398,931 | ) |
Net increase in net assets from capital share transactions (See note 6) | | | 25,457,385 | |
| | | | |
Net increase in net assets | | | 21,879,364 | |
| | | | |
| |
NET ASSETS: | | | | |
Beginning of year | | | 170,439,764 | |
| | | | |
End of year** | | $ | 192,319,128 | |
| | | | |
| * | The SEC eliminated the requirement to disclose distributions to shareholders from net investment income and from net realized gains in 2018. |
| ** | The SEC eliminated the requirement to disclose undistributed net investment income in 2018. |
For the Year Ended October 31, 2017
| | | | |
| | | High Yield
Municipal
Portfolio | |
Increase (decrease) in net assets | | | | |
Operations: | | | | |
Net investment income | | $ | 4,480,945 | |
Net realized loss on: | | | | |
Investment transactions | | | (425,239 | ) |
Net change in unrealized gain of: | | | | |
Investments | | | 379,365 | |
| | | | |
Net increase in net assets resulting from operations | | | 4,435,071 | |
Distributions to shareholders from: | | | | |
Net investment income | | | (4,350,831 | ) |
Net realized gain on investments | | | (615,129 | ) |
Net increase in net assets from capital share transactions (See note 6) | | | 17,080,353 | |
| | | | |
Net increase in net assets | | | 16,549,464 | |
| | | | |
| |
NET ASSETS: | | | | |
Beginning of year | | | 153,890,300 | |
| | | | |
End of year | | $ | 170,439,764 | |
| | | | |
Undistributed net investment income included in net assets at end of year | | $ | 426,873 | |
| | | | |
See Notes to Financial Statements.
THE GLENMEDE FUND, INC.
STATEMENT OF CASH FLOWS
For the Year Ended October 31, 2018
| | | | |
| | | Quantitative U.S.
Long/Short
Equity
Portfolio | |
Cash flows from operating activities | | | | |
Adjustments to reconcile net decrease in net assets from operations to net cash provided by (used in) operating activities | | | | |
Net decrease in net assets resulting from operations | | $ | (9,053,998 | ) |
Investments purchased | | | (187,652,813 | ) |
Investments sold | | | 165,561,538 | |
Purchases to cover securities sold short | | | (281,430,525 | ) |
Securities sold short | | | 282,978,253 | |
(Purchase)/Sale of short term investments, net | | | (7,872,796 | ) |
Increase in Interest receivable | | | (208,521 | ) |
Increase in Cash collateral on deposit at broker | | | (15,357,406 | ) |
Increase in Securities lending receivable | | | (45 | ) |
Increase in Dividends receivable | | | (211,822 | ) |
Increase in Prepaid expenses | | | (1,015 | ) |
Increase in Obligation to return securities lending collateral | | | 1,124,016 | |
Increase in Dividends payable for securities sold short | | | 79,909 | |
Increase in Payable for Management fees | | | 28,839 | |
Increase in Payable for Directors’ fees | | | 894 | |
Increase in Payable for Shareholder Servicing fees | | | 6,786 | |
Decrease in Accrued expenses | | | (5,279 | ) |
Net change in unrealized gain (loss) on investments | | | 24,427,733 | |
Net realized gain from investments | | | (28,360,510 | ) |
Net change in unrealized gain (loss) on securities sold short | | | (11,778,484 | ) |
Net realized loss from securities sold short | | | 25,562,844 | |
| | | | |
Net cash provided by (used in) operating activities | | | (42,162,402 | ) |
| | | | |
| |
Cash flows from financing activities | | | | |
Proceeds from shares sold | | | 76,535,237 | |
Payments on shares redeemed | | | (34,372,835 | ) |
| | | | |
Net cash provided by (used in) financing activities | | | 42,162,402 | |
| | | | |
Net increase (decrease) in cash | | | — | |
Cash at beginning of period | | | — | |
| | | | |
Cash at end of period | | $ | — | |
| | | | |
Short sale dividend expense for the fiscal year was $3,658,923.
The Portfolio did not pay any prime broker fees during the year ended October 31, 2018.
See Notes to Financial Statements.
THE GLENMEDE FUND, INC.
STATEMENT OF CASH FLOWS — (Concluded)
For the Year Ended October 31, 2018
| | | | |
| | | Quantitative U.S.
Total Market
Equity
Portfolio | |
Cash flows from operating activities | | | | |
Adjustments to reconcile net increase in net assets from operations to net cash provided by (used in) operating activities | | | | |
Net increase in net assets resulting from operations | | $ | 1,755,519 | |
Investments purchased | | | (87,849,493 | ) |
Investments sold | | | 71,750,223 | |
Purchases to cover securities sold short | | | (36,905,084 | ) |
Securities sold short | | | 38,362,617 | |
(Purchase)/Sale of short term investments, net | | | (208,676 | ) |
Increase in Interest receivable | | | (8 | ) |
Increase in Receivable from Investment Advisor | | | (2,616 | ) |
Increase in Dividends receivable | | | (58,439 | ) |
Increase in Prepaid expenses | | | (271 | ) |
Increase in Dividends payable for securities sold short | | | 7,982 | |
Increase in Payable for Management fees | | | 14,544 | |
Increase in Payable for Directors’ fees | | | 292 | |
Increase in Payable for Shareholder Servicing fees | | | 3,422 | |
Increase in Accrued expenses | | | 6,917 | |
Net change in unrealized gain (loss) on investments | | | 6,715,343 | |
Net realized gain from investments | | | (9,329,617 | ) |
Net change in unrealized gain (loss) on securities sold short | | | (1,570,230 | ) |
Net realized loss from securities sold short | | | 2,752,346 | |
| | | | |
Net cash provided by (used in) operating activities | | | (14,555,229 | ) |
| | | | |
| |
Cash flows from financing activities | | | | |
Proceeds from shares sold | | | 33,825,076 | |
Payments on shares redeemed | | | (19,068,386 | ) |
Cash distributions paid | | | (201,461 | ) |
| | | | |
Net cash provided by (used in) financing activities | | | 14,555,229 | |
| | | | |
Net increase (decrease) in cash | | | — | |
Cash at beginning of period | | | — | |
| | | | |
Cash at end of period | | $ | — | |
| | | | |
Non-cash financing activities not included herein consist of a reinvestment of dividends of $2,304,688. Short sale dividend expense for the fiscal year was $425,129.
The Portfolio did not pay any prime broker fees during the year ended October 31, 2018.
See Notes to Financial Statements.
THE GLENMEDE FUND, INC.
FINANCIAL HIGHLIGHTS
For a share outstanding throughout each year
| | | | | | | | | | | | | | | | | | | | |
| | | Quantitative U.S. Large Cap Core Equity Portfolio Advisor
Shares | |
| | | For The Years Ended October 31, | |
| | | 20181 | | | 2017 | | | 20161 | | | 2015 | | | 2014 | |
| | | | | |
Net asset value, beginning of year | | $ | 28.08 | | | $ | 22.36 | | | $ | 22.34 | | | $ | 21.76 | | | $ | 18.57 | |
| | | | | | | | | | | | | | | | | | | | |
Income from investment operations: | | | | | | | | | | | | | | | | | | | | |
Net investment income | | | 0.29 | | | | 0.23 | | | | 0.25 | | | | 0.22 | | | | 0.18 | |
Net realized and unrealized gain on investments | | | 0.95 | | | | 5.72 | | | | 0.25 | | | | 1.23 | | | | 3.54 | |
| | | | | | | | | | | | | | | | | | | | |
| | | | | |
Total from investment operations | | | 1.24 | | | | 5.95 | | | | 0.50 | | | | 1.45 | | | | 3.72 | |
| | | | | | | | | | | | | | | | | | | | |
Distributions to shareholders from: | | | | | | | | | | | | | | | | | | | | |
Net investment income | | | (0.28 | ) | | | (0.23 | ) | | | (0.25 | ) | | | (0.22 | ) | | | (0.19 | ) |
Net realized capital gains | | | (1.16 | ) | | | — | | | | (0.23 | ) | | | (0.65 | ) | | | (0.34 | ) |
| | | | | | | | | | | | | | | | | | | | |
| | | | | |
Total distributions | | | (1.44 | ) | | | (0.23 | ) | | | (0.48 | ) | | | (0.87 | ) | | | (0.53 | ) |
| | | | | | | | | | | | | | | | | | | | |
| | | | | |
Net asset value, end of year | | $ | 27.88 | | | $ | 28.08 | | | $ | 22.36 | | | $ | 22.34 | | | $ | 21.76 | |
| | | | | | | | | | | | | | | | | | | | |
| | | | | |
Total return | | | 4.42 | % | | | 26.74 | % | | | 2.34 | % | | | 6.83 | % | | | 20.46 | % |
| | | | | | | | | | | | | | | | | | | | |
Ratios to average net assets/ Supplemental data: | | | | | | | | | | | | | | | | | | | | |
Net assets, at end of year (in 000s) | | $ | 2,075,264 | | | $ | 2,124,803 | | | $ | 1,691,802 | | | $ | 1,643,278 | | | $ | 724,089 | |
Ratio of operating expenses to average net assets | | | 0.85 | % | | | 0.86 | % | | | 0.88 | % | | | 0.87 | % | | | 0.87 | % |
Ratio of net investment income to average net assets | | | 1.02 | % | | | 0.94 | % | | | 1.14 | % | | | 1.05 | % | | | 1.00 | % |
Portfolio turnover rate2 | | | 71 | % | | | 62 | % | | | 111 | % | | | 122 | % | | | 73 | % |
| 1 | Per share net investment income (loss) has been calculated using the average shares outstanding during the period. |
| 2 | Portfolio turnover is calculated at the fund level. |
| | | | | | | | | | | | |
| | | Quantitative U.S. Large Cap Core Equity Portfolio
Institutional Shares | |
| | | For The Years Ended October 31, | | | For the
Period
December 30, 20151
through
October 31,
20162 | |
| | | 2018 | | | 2017 | |
| | | |
Net asset value, beginning of year | | $ | 28.09 | | | $ | 22.37 | | | $ | 21.85 | |
| | | | | | | | | | | | |
Income from investment operations: | | | | | | | | | | | | |
Net investment income | | | 0.34 | | | | 0.27 | | | | 0.29 | |
Net realized and unrealized gain on investments | | | 0.95 | | | | 5.73 | | | | 0.45 | |
| | | | | | | | | | | | |
| | | |
Total from investment operations | | | 1.29 | | | | 6.00 | | | | 0.74 | |
| | | | | | | | | | | | |
Distributions to shareholders from: | | | | | | | | | | | | |
Net investment income | | | (0.33 | ) | | | (0.28 | ) | | | (0.22 | ) |
Net realized capital gains | | | (1.16 | ) | | | — | | | | — | |
| | | | | | | | | | | | |
| | | |
Total distributions | | | (1.49 | ) | | | (0.28 | ) | | | (0.22 | ) |
| | | | | | | | | | | | |
| | | |
Net asset value, end of year | | $ | 27.89 | | | $ | 28.09 | | | $ | 22.37 | |
| | | | | | | | | | | | |
| | | |
Total return | | | 4.61 | % | | | 26.96 | % | | | 3.41 | %3 |
| | | | | | | | | | | | |
Ratios to average net assets/ Supplemental data: | | | | | | | | | | | | |
Net assets, at end of year (in 000s) | | $ | 767,117 | | | $ | 549,352 | | | $ | 274,982 | |
Ratio of operating expenses to average net assets | | | 0.65 | % | | | 0.66 | % | | | 0.68 | %4 |
Ratio of net investment income to average net assets | | | 1.22 | % | | | 1.12 | % | | | 1.31 | %4 |
Portfolio turnover rate5 | | | 71 | % | | | 62 | % | | | 111 | % |
| 1 | Commencement of operations. |
| 2 | Per share net investment income (loss) has been calculated using the average shares outstanding during the period. |
| 3 | Total return calculation is not annualized. |
| 5 | Portfolio turnover is calculated at the fund level. |
See Notes to Financial Statements.
THE GLENMEDE FUND, INC.
FINANCIAL HIGHLIGHTS — (Continued)
For a share outstanding throughout each year
| | | | | | | | | | | | | | | | | | | | |
| | | Quantitative U.S. Large Cap Growth Equity Portfolio Advisor Shares | |
| | | For The Years Ended October 31, | |
| | | 2018 | | | 2017 | | | 20161 | | | 2015 | | | 2014 | |
| | | | | |
Net asset value, beginning of year | | $ | 31.54 | | | $ | 24.76 | | | $ | 24.70 | | | $ | 23.05 | | | $ | 19.65 | |
| | | | | | | | | | | | | | | | | | | | |
Income from investment operations: | | | | | | | | | | | | | | | | | | | | |
Net investment income | | | 0.16 | | | | 0.16 | | | | 0.16 | | | | 0.13 | | | | 0.14 | |
Net realized and unrealized gain on investments | | | 1.58 | | | | 6.77 | | | | 0.05 | 2 | | | 2.26 | | | | 4.26 | |
| | | | | | | | | | | | | | | | | | | | |
| | | | | |
Total from investment operations | | | 1.74 | | | | 6.93 | | | | 0.21 | | | | 2.39 | | | | 4.40 | |
| | | | | | | | | | | | | | | | | | | | |
Distributions to shareholders from: | | | | | | | | | | | | | | | | | | | | |
Net investment income | | | (0.17 | ) | | | (0.15 | ) | | | (0.15 | ) | | | (0.13 | ) | | | (0.14 | ) |
Net realized capital gains | | | (0.59 | ) | | | — | | | | — | | | | (0.61 | ) | | | (0.86 | ) |
| | | | | | | | | | | | | | | | | | | | |
| | | | | |
Total distributions | | | (0.76 | ) | | | (0.15 | ) | | | (0.15 | ) | | | (0.74 | ) | | | (1.00 | ) |
| | | | | | | | | | | | | | | | | | | | |
| | | | | |
Net asset value, end of year | | $ | 32.52 | | | $ | 31.54 | | | $ | 24.76 | | | $ | 24.70 | | | $ | 23.05 | |
| | | | | | | | | | | | | | | | | | | | |
| | | | | |
Total return | | | 5.53 | % | | | 28.05 | % | | | 0.87 | % | | | 10.60 | % | | | 23.36 | % |
| | | | | | | | | | | | | | | | | | | | |
Ratios to average net assets/ Supplemental data: | | | | | | | | | | | | | | | | | | | | |
Net assets, at end of year (in 000s) | | $ | 2,660,858 | | | $ | 3,076,616 | | | $ | 2,988,342 | | | $ | 1,959,171 | | | $ | 630,362 | |
Ratio of operating expenses to average net assets | | | 0.85 | % | | | 0.86 | % | | | 0.88 | % | | | 0.87 | % | | | 0.88 | % |
Ratio of net investment income to average net assets | | | 0.44 | % | | | 0.56 | % | | | 0.66 | % | | | 0.59 | % | | | 0.70 | % |
Portfolio turnover rate3 | | | 63 | % | | | 69 | % | | | 88 | % | | | 95 | % | | | 76 | % |
| 1 | Per share net investment income (loss) has been calculated using the average shares outstanding during the period. |
| 2 | The amount shown for a share outstanding does not correspond with the aggregate net realized and unrealized loss for the period due to the timing of purchases and redemptions of Portfolio shares in relation to the fluctuating net asset value per share of the Portfolio. |
| 3 | Portfolio turnover is calculated at the fund level. |
See Notes to Financial Statements.
THE GLENMEDE FUND, INC.
FINANCIAL HIGHLIGHTS — (Continued)
For a share outstanding throughout each year
| | | | | | | | | | | | |
| | | Quantitative U.S. Large Cap Growth Equity
Portfolio Institutional Shares | |
| | | For The
Years Ended
October 31, | | | For the Period
November 5, 20151
through
October 31, 20162 | |
| | | 2018 | | | 2017 | |
| | | |
Net asset value, beginning of year | | $ | 31.55 | | | $ | 24.77 | | | $ | 24.83 | |
| | | | | | | | | | | | |
Income from investment operations: | | | | | | | | | | | | |
Net investment income | | | 0.21 | | | | 0.18 | | | | 0.22 | |
Net realized and unrealized gain (loss) on investments | | | 1.59 | | | | 6.80 | | | | (0.08 | ) |
| | | | | | | | | | | | |
| | | |
Total from investment operations | | | 1.80 | | | | 6.98 | | | | 0.14 | |
| | | | | | | | | | | | |
Distributions to shareholders from: | | | | | | | | | | | | |
Net investment income | | | (0.23 | ) | | | (0.20 | ) | | | (0.20 | ) |
Net realized capital gains | | | (0.59 | ) | | | — | | | | — | |
| | | | | | | | | | | | |
| | | |
Total distributions | | | (0.82 | ) | | | (0.20 | ) | | | (0.20 | ) |
| | | | | | | | | | | | |
| | | |
Net asset value, end of year | | $ | 32.53 | | | $ | 31.55 | | | $ | 24.77 | |
| | | | | | | | | | | | |
| | | |
Total return | | | 5.74 | % | | | 28.28 | % | | | 0.60 | %3 |
| | | | | | | | | | | | |
Ratios to average net assets/ Supplemental data: | | | | | | | | | | | | |
Net assets, at end of year (in 000s) | | $ | 746,030 | | | $ | 860,416 | | | $ | 35,114 | |
Ratio of operating expenses to average net assets | | | 0.65 | % | | �� | 0.66 | % | | | 0.68 | %4 |
Ratio of net investment income to average net assets | | | 0.64 | % | | | 0.66 | % | | | 0.90 | %4 |
Portfolio turnover rate5 | | | 63 | % | | | 69 | % | | | 88 | % |
| 1 | Commencement of operations. |
| 2 | Per share net investment income (loss) has been calculated using the average shares outstanding during the period. |
| 3 | Total return calculation is not annualized. |
| 5 | Portfolio turnover is calculated at the fund level. |
See Notes to Financial Statements.
THE GLENMEDE FUND, INC.
FINANCIAL HIGHLIGHTS — (Continued)
For a share outstanding throughout each year
| | | | |
| | | Quantitative U.S.
Large Cap Value
Equity Portfolio | |
| | | For the Period
November 13, 2017
through
October 31,1 2018 | |
| |
Net asset value, beginning of period | | $ | 10.00 | |
| | | | |
Income from investment operations: | | | | |
Net investment income | | | 0.14 | |
Net realized and unrealized gain (loss) on investments | | | (0.20 | ) |
| | | | |
| |
Total from investment operations | | | (0.06 | ) |
| | | | |
Distributions to shareholders from: | | | | |
Net investment income | | | (0.12 | ) |
| | | | |
| |
Total distributions | | | (0.12 | ) |
| | | | |
| |
Net asset value, end of period | | $ | 9.82 | |
| | | | |
| |
Total return | | | (0.69 | )%2,3 |
| | | | |
Ratios to average net assets/ Supplemental data: | | | | |
Net assets, at end of period (in 000s) | | $ | 1,092 | |
Ratio of operating expenses before waiver/reimbursement to average net assets | | | 6.52 | %4 |
Ratio of operating expenses after waiver/reimbursement to average net assets | | | 1.00 | %4 |
Ratio of net investment income to average net assets | | | 1.36 | %4 |
Portfolio turnover rate | | | 61 | %5 |
| 1 | Commencement of operations. |
| 2 | The Total Return reflects fee waivers and/or expense reimbursements in effect and would have been lower in their absence. |
| 3 | Total return calculation is not annualized. |
| 5 | Calculations represent portfolio turnover for the Portfolio for the period of November 13, 2017 through October 31, 2018. |
See Notes to Financial Statements.
THE GLENMEDE FUND, INC.
FINANCIAL HIGHLIGHTS — (Continued)
For a share outstanding throughout each year
| | | | |
| | | Quantitative
U.S. Small Cap
Equity Portfolio | |
| | | For the Period
November 13, 2017
through
October 31,1 2018 | |
| |
Net asset value, beginning of period | | $ | 10.00 | |
| | | | |
Income from investment operations: | | | | |
Net investment income | | | 0.05 | |
Net realized and unrealized gain on investments | | | 0.24 | |
| | | | |
| |
Total from investment operations | | | 0.29 | |
| | | | |
Distributions to shareholders from: | | | | |
Net investment income | | | (0.04 | ) |
| | | | |
| |
Total distributions | | | (0.04 | ) |
| | | | |
| |
Net asset value, end of period | | $ | 10.25 | |
| | | | |
| |
Total return | | | 2.85 | %2,3 |
| | | | |
Ratios to average net assets/ Supplemental data: | | | | |
Net assets, at end of period (in 000s) | | $ | 1,074 | |
Ratio of operating expenses before waiver/reimbursement to average net assets | | | 6.48 | %4 |
Ratio of operating expenses after waiver/reimbursement to average net assets | | | 1.00 | %4 |
Ratio of net investment income to average net assets | | | 0.44 | %4 |
Portfolio turnover rate | | | 80 | %5 |
| 1 | Commencement of operations. |
| 2 | Total return calculation is not annualized. |
| 3 | The Total Return reflects fee waivers and/or expense reimbursements in effect and would have been lower in their absence. |
| 5 | Calculations represent portfolio turnover for the Portfolio for the period of November 13, 2017 through October 31, 2018. |
See Notes to Financial Statements.
THE GLENMEDE FUND, INC.
FINANCIAL HIGHLIGHTS — (Continued)
For a share outstanding throughout each year
| | | | | | | | | | | | | | | | | | | | |
| | | Quantitative International Equity Portfolio | |
| | | For the Years Ended October 31, | |
| | | 2018 | | | 20171 | | | 20161 | | | 20151 | | | 20141 | |
| | | | | |
Net asset value, beginning of year | | $ | 15.16 | | | $ | 12.76 | | | $ | 13.45 | | | $ | 13.83 | | | $ | 14.52 | |
| | | | | | | | | | | | | | | | | | | | |
| | | | | |
Income from investment operations: | | | | | | | | | | | | | | | | | | | | |
Net investment income | | | 0.29 | | | | 0.25 | | | | 0.24 | | | | 0.15 | | | | 0.24 | |
Net realized and unrealized gain (loss) on investments | | | (1.90 | ) | | | 2.41 | | | | (0.71 | ) | | | (0.40 | ) | | | (0.65 | ) |
| | | | | | | | | | | | | | | | | | | | |
| | | | | |
Total from investment operations | | | (1.61 | ) | | | 2.66 | | | | (0.47 | ) | | | (0.25 | ) | | | (0.41 | ) |
| | | | | | | | | | | | | | | | | | | | |
Distributions to shareholders from: | | | | | | | | | | | | | | | | | | | | |
Net investment income | | | (0.29 | ) | | | (0.26 | ) | | | (0.22 | ) | | | (0.13 | ) | | | (0.28 | ) |
| | | | | | | | | | | | | | | | | | | | |
| | | | | |
Total distributions | | | (0.29 | ) | | | (0.26 | ) | | | (0.22 | ) | | | (0.13 | ) | | | (0.28 | ) |
| | | | | | | | | | | | | | | | | | | | |
| | | | | |
Net asset value, end of year | | $ | 13.26 | | | $ | 15.16 | | | $ | 12.76 | | | $ | 13.45 | | | $ | 13.83 | |
| | | | | | | | | | | | | | | | | | | | |
| | | | | |
Total return | | | (10.80 | )%2 | | | 20.96 | %2 | | | (3.44 | )%2 | | | (1.83 | )%2 | | | (2.94 | )%2 |
| | | | | | | | | | | | | | | | | | | | |
Ratios to average net assets/ Supplemental data: | | | | | | | | | | | | | | | | | | | | |
Net assets, at end of year (in 000s) | | $ | 387,188 | | | $ | 461,686 | | | $ | 441,284 | | | $ | 243,403 | | | $ | 37,520 | |
Ratio of operating expenses before waiver/reimbursement to average net assets | | | 1.07 | % | | | 1.06 | % | | | 1.12 | % | | | 1.24 | % | | | 1.24 | % |
Ratio of operating expenses after waiver/reimbursement to average net assets | | | 1.00 | % | | | 1.00 | % | | | 1.04 | % | | | 1.24 | % | | | 1.23 | % |
Ratio of net investment income to average net assets | | | 1.90 | % | | | 1.82 | % | | | 1.88 | % | | | 1.10 | % | | | 1.64 | % |
Portfolio turnover rate | | | 78 | % | | | 75 | % | | | 121 | % | | | 148 | % | | | 47 | % |
| 1 | Per share net investment income (loss) has been calculated using the average shares outstanding during the period. |
| 2 | The Total Return reflects fee waivers and/or expense reimbursements in effect and would have been lower in their absence. |
See Notes to Financial Statements.
THE GLENMEDE FUND, INC.
FINANCIAL HIGHLIGHTS — (Continued)
For a share outstanding throughout each year
| | | | | | | | | | | | |
| | | Responsible ESG U.S. Equity Portfolio | |
| | | For the
Years Ended
October 31, | | | For the Period
December 22, 20151
through
October 31, 20162 | |
| | | 2018 | | | 2017 | |
| | | |
Net asset value, beginning of year | | $ | 13.61 | | | $ | 10.84 | | | $ | 10.00 | |
| | | | | | | | | | | | |
Income from investment operations: | | | | | | | | | | | | |
Net investment income | | | 0.11 | | | | 0.09 | | | | 0.07 | |
Net realized and unrealized gain on investments | | | 0.57 | | | | 2.77 | | | | 0.82 | |
| | | | | | | | | | | | |
| | | |
Total from investment operations | | | 0.68 | | | | 2.86 | | | | 0.89 | |
| | | | | | | | | | | | |
Distributions to shareholders from: | | | | | | | | | | | | |
Net investment income | | | (0.11 | ) | | | (0.09 | ) | | | (0.05 | ) |
Net realized capital gains | | | (0.06 | ) | | | — | | | | — | |
| | | | | | | | | | | | |
| | | |
Total distributions | | | (0.17 | ) | | | (0.09 | ) | | | (0.05 | ) |
| | | | | | | | | | | | |
| | | |
Net asset value, end of year | | $ | 14.12 | | | $ | 13.61 | | | $ | 10.84 | |
| | | | | | | | | | | | |
| | | |
Total return3 | | | 5.01 | % | | | 26.42 | % | | | 8.87 | %4 |
| | | | | | | | | | | | |
Ratios to average net assets/ Supplemental data: | | | | | | | | | | | | |
Net assets, at end of year (in 000s) | | $ | 21,746 | | | $ | 13,589 | | | $ | 6,561 | |
Ratio of operating expenses before waiver/reimbursement to average net assets | | | 1.09 | % | | | 1.23 | % | | | 2.21 | %5 |
Ratio of operating expenses after waiver/reimbursement to average net assets | | | 1.00 | % | | | 1.00 | % | | | 1.00 | %5 |
Ratio of net investment income to average net assets | | | 0.87 | % | | | 0.75 | % | | | 0.76 | %5 |
Portfolio turnover rate | | | 61 | % | | | 54 | % | | | 65 | %6 |
| 1 | Commencement of operations. |
| 2 | Per share net investment income (loss) has been calculated using the average shares outstanding during the period. |
| 3 | The Total Return reflects fee waivers and/or expense reimbursements in effect and would have been lower in their absence. |
| 4 | Total return calculation is not annualized. |
| 6 | Calculations represent portfolio turnover for the Portfolio for the period of December 22, 2015 through October 31, 2016. |
See Notes to Financial Statements.
THE GLENMEDE FUND, INC.
FINANCIAL HIGHLIGHTS — (Continued)
For a share outstanding throughout each year
| | | | | | | | | | | | |
| | | Women in Leadership U.S. Equity Portfolio | |
| | | For the
Years Ended
October 31, | | | For the Period
December 22, 20151
through
October 31, 20162 | |
| | | 20182 | | | 2017 | |
| | | |
Net asset value, beginning of year | | $ | 13.10 | | | $ | 10.65 | | | $ | 10.00 | |
| | | | | | | | | | | | |
Income from investment operations: | | | | | | | | | | | | |
Net investment income | | | 0.12 | | | | 0.11 | | | | 0.14 | |
Net realized and unrealized gain on investments | | | 0.32 | | | | 2.45 | | | | 0.63 | |
| | | | | | | | | | | | |
| | | |
Total from investment operations | | | 0.44 | | | | 2.56 | | | | 0.77 | |
| | | | | | | | | | | | |
Distributions to shareholders from: | | | | | | | | | | | | |
Net investment income | | | (0.11 | ) | | | (0.11 | ) | | | (0.12 | ) |
Net realized capital gains | | | (0.09 | ) | | | — | | | | — | |
| | | | | | | | | | | | |
| | | |
Total distributions | | | (0.20 | ) | | | (0.11 | ) | | | (0.12 | ) |
| | | | | | | | | | | | |
| | | |
Net asset value, end of year | | $ | 13.34 | | | $ | 13.10 | | | $ | 10.65 | |
| | | | | | | | | | | | |
| | | |
Total return3 | | | 3.36 | % | | | 24.11 | % | | | 7.73 | %4 |
| | | | | | | | | | | | |
Ratios to average net assets/ Supplemental data: | | | | | | | | | | | | |
Net assets, at end of year (in 000s) | | $ | 18,974 | | | $ | 11,853 | | | $ | 6,517 | |
Ratio of operating expenses before waiver/reimbursement to average net assets | | | 1.11 | % | | | 1.28 | % | | | 2.22 | %5 |
Ratio of operating expenses after waiver/reimbursement to average net assets | | | 1.00 | % | | | 1.00 | % | | | 1.00 | %5 |
Ratio of net investment income to average net assets | | | 0.88 | % | | | 0.88 | % | | | 1.31 | %5 |
Portfolio turnover rate | | | 81 | % | | | 70 | % | | | 81 | %6 |
| 1 | Commencement of operations. |
| 2 | Per share net investment income (loss) has been calculated using the average shares outstanding during the period. |
| 3 | The Total Return reflects fee waivers and/or expense reimbursements in effect and would have been lower in their absence. |
| 4 | Total return calculation is not annualized. |
| 6 | Calculations represent portfolio turnover for the Portfolio for the period of December 22, 2015 through October 31, 2016. |
See Notes to Financial Statements.
THE GLENMEDE FUND, INC.
FINANCIAL HIGHLIGHTS — (Continued)
For a share outstanding throughout each year
| | | | | | | | | | | | | | | | | | | | |
| | | Quantitative U.S. Long/Short Equity Portfolio | |
| | | For the Years Ended October 31, | |
| | | 20181 | | | 20171 | | | 20161 | | | 20151 | | | 20141 | |
| | | | | |
Net asset value, beginning of year | | $ | 12.86 | | | $ | 11.39 | | | $ | 11.32 | | | $ | 10.80 | | | $ | 10.50 | |
| | | | | | | | | | | | | | | | | | | | |
Income from investment operations: | | | | | | | | | | | | | | | | | | | | |
Net investment income (loss) | | | 0.03 | | | | (0.05 | ) | | | (0.03 | ) | | | (0.07 | ) | | | (0.07 | ) |
Net realized and unrealized gain (loss) on investments | | | (0.34 | ) | | | 1.52 | | | | 0.10 | | | | 0.59 | | | | 0.37 | |
| | | | | | | | | | | | | | | | | | | | |
| | | | | |
Total from investment operations | | | (0.31 | ) | | | 1.47 | | | | 0.07 | | | | 0.52 | | | | 0.30 | |
| | | | | | | | | | | | | | | | | | | | |
| | | | | |
Net asset value, end of year | | $ | 12.55 | | | $ | 12.86 | | | $ | 11.39 | | | $ | 11.32 | | | $ | 10.80 | |
| | | | | | | | | | | | | | | | | | | | |
| | | | | |
Total return2 | | | (2.41 | )% | | | 12.91 | % | | | 0.62 | % | | | 4.81 | %3 | | | 2.86 | %3 |
| | | | | | | | | | | | | | | | | | | | |
Ratios to average net assets/ Supplemental data: | | | | | | | | | | | | | | | | | | | | |
Net assets, at end of year (in 000s) | | $ | 333,806 | | | $ | 300,784 | | | $ | 239,413 | | | $ | 193,480 | | | $ | 109,965 | |
Ratio of operating expenses before waiver/reimbursement to average net assets | | | 2.61 | % | | | 2.77 | % | | | 2.73 | % | | | 2.64 | % | | | 2.48 | % |
Ratio of operating expenses after waiver/reimbursement to average net assets4 | | | 2.26 | % | | | 2.42 | % | | | 2.38 | % | | | 2.29 | % | | | 2.13 | % |
Ratio of net investment income to average net assets | | | 0.24 | % | | | (0.43 | )% | | | (0.41 | )% | | | (0.67 | )% | | | (0.63 | )% |
Portfolio turnover rate5 | | | 84 | % | | | 65 | % | | | 98 | % | | | 119 | % | | | 150 | % |
| 1 | Per share net investment income (loss) has been calculated using the average shares outstanding during the period. |
| 2 | The Total Return reflects fee waivers and/or expense reimbursements in effect and would have been lower in their absence. |
| 3 | Includes adjustments in accordance with accounting principles generally accepted in the United States of America and as such, the net asset value and returns for shareholder transactions as shown in the management discussion and analysis and as otherwise reported to shareholders. |
| 4 | The ratio of operating expenses after waiver/reimbursement excluding dividends on securities sold short was 1.15%, 1.15%, 1.17%, 1.16% and 1.22% for the years ended October 31, 2018, 2017, 2016, 2015 and 2014 respectively. |
| 5 | The calculation of the portfolio turnover rate reflects the absolute value of the long and short positions. |
See Notes to Financial Statements.
THE GLENMEDE FUND, INC.
FINANCIAL HIGHLIGHTS — (Continued)
For a share outstanding throughout each year
| | | | | | | | | | | | | | | | | | | | |
| | | Quantitative U.S. Total Market Equity Portfolio | |
| | | For the Years Ended October 31, | |
| | | 2018 | | | 2017 | | | 2016 | | | 2015 | | | 2014 | |
| | | | | |
Net asset value, beginning of year | | $ | 18.88 | | | $ | 14.65 | | | $ | 14.68 | | | $ | 15.07 | | | $ | 12.78 | |
| | | | | | | | | | | | | | | | | | | | |
Income from investment operations: | | | | | | | | | | | | | | | | | | | | |
Net investment income | | | 0.07 | | | | 0.04 | | | | 0.09 | | | | 0.08 | | | | 0.06 | |
Net realized and unrealized gain (loss) on investments | | | 0.51 | | | | 4.23 | | | | (0.04 | ) | | | 0.49 | | | | 2.29 | |
| | | | | | | | | | | | | | | | | | | | |
| | | | | |
Total from investment operations | | | 0.58 | | | | 4.27 | | | | 0.05 | | | | 0.57 | | | | 2.35 | |
| | | | | | | | | | | | | | | | | | | | |
Distributions to shareholders from: | | | | | | | | | | | | | | | | | | | | |
Net investment income | | | (0.06 | ) | | | (0.04 | ) | | | (0.08 | ) | | | (0.08 | ) | | | (0.06 | ) |
Net realized capital gains | | | (0.55 | ) | | | — | | | | — | | | | (0.88 | ) | | | (0.00 | )1 |
| | | | | | | | | | | | | | | | | | | | |
| | | | | |
Total distributions | | | (0.61 | ) | | | (0.04 | ) | | | (0.08 | ) | | | (0.96 | ) | | | (0.06 | ) |
| | | | | | | | | | | | | | | | | | | | |
| | | | | |
Net asset value, end of year | | $ | 18.85 | | | $ | 18.88 | | | $ | 14.65 | | | $ | 14.68 | | | $ | 15.07 | |
| | | | | | | | | | | | | | | | | | | | |
| | | | | |
Total return2 | | | 3.01 | % | | | 29.18 | % | | | 0.37 | % | | | 3.94 | % | | | 18.43 | % |
| | | | | | | | | | | | | | | | | | | | |
Ratios to average net assets/ Supplemental data: | | | | | | | | | | | | | | | | | | | | |
Net assets, at end of year (in 000s) | | $ | 90,610 | | | $ | 74,267 | | | $ | 61,083 | | | $ | 88,734 | | | $ | 61,467 | |
Ratio of operating expenses before waiver/reimbursement to average net assets | | | 2.31 | % | | | 2.40 | % | | | 2.59 | % | | | 2.29 | % | | | 2.23 | % |
Ratio of operating expenses after waiver/reimbursement to average net
assets3 | | | 1.96 | % | | | 2.05 | % | | | 2.16 | % | | | 1.93 | % | | | 1.85 | % |
Ratio of net investment income to average net assets | | | 0.37 | % | | | 0.24 | % | | | 0.56 | % | | | 0.55 | % | | | 0.41 | % |
Portfolio turnover rate4 | | | 82 | % | | | 70 | % | | | 88 | % | | | 129 | % | | | 117 | % |
| 1 | Amount rounds to less than $0.01 per share. |
| 2 | The Total Return reflects fee waivers and/or expense reimbursements in effect and would have been lower in their absence. |
| 3 | The ratio of operating expenses after waiver/reimbursement excluding dividends sold short and flex fees was 1.25%, 1.23%, 1.25%, 1.25% and 1.25% for the years ended October 31, 2018, 2017, 2016, 2015, 2014, respectively. |
| 4 | The calculation of the portfolio turnover rate reflects the absolute value of the long and short positions. |
| | | | | | | | | | | | | | | | | | | | |
| | | Strategic Equity Portfolio | |
| | | For the Years Ended October 31, | |
| | | 20181 | | | 2017 | | | 2016 | | | 2015 | | | 2014 | |
| | | | | |
Net asset value, beginning of year | | $ | 24.90 | | | $ | 20.94 | | | $ | 21.80 | | | $ | 23.89 | | | $ | 23.14 | |
| | | | | | | | | | | | | | | | | | | | |
Income from investment operations: | | | | | | | | | | | | | | | | | | | | |
Net investment income | | | 0.20 | | | | 0.19 | | | | 0.21 | | | | 0.23 | | | | 0.23 | |
Net realized and unrealized gain on investments | | | 1.07 | | | | 5.35 | | | | 0.81 | | | | 0.76 | | | | 3.20 | |
| | | | | | | | | | | | | | | | | | | | |
| | | | | |
Total from investment operations | | | 1.27 | | | | 5.54 | | | | 1.02 | | | | 0.99 | | | | 3.43 | |
| | | | | | | | | | | | | | | | | | | | |
Distributions to shareholders from: | | | | | | | | | | | | | | | | | | | | |
Net investment income | | | (0.20 | ) | | | (0.19 | ) | | | (0.20 | ) | | | (0.24 | ) | | | (0.24 | ) |
Net realized capital gains | | | (1.67 | ) | | | (1.39 | ) | | | (1.68 | ) | | | (2.84 | ) | | | (2.44 | ) |
| | | | | | | | | | | | | | | | | | | | |
| | | | | |
Total distributions | | | (1.87 | ) | | | (1.58 | ) | | | (1.88 | ) | | | (3.08 | ) | | | (2.68 | ) |
| | | | | | | | | | | | | | | | | | | | |
| | | | | |
Net asset value, end of year | | $ | 24.30 | | | $ | 24.90 | | | $ | 20.94 | | | $ | 21.80 | | | $ | 23.89 | |
| | | | | | | | | | | | | | | | | | | | |
| | | | | |
Total return | | | 5.14 | % | | | 27.83 | % | | | 5.22 | % | | | 4.49 | % | | | 16.48 | % |
| | | | | | | | | | | | | | | | | | | | |
Ratios to average net assets/ Supplemental data: | | | | | | | | | | | | | | | | | | | | |
Net assets, at end of year (in 000s) | | $ | 226,032 | | | $ | 209,339 | | | $ | 176,864 | | | $ | 174,409 | | | $ | 184,368 | |
Ratio of operating expenses to average net assets | | | 0.83 | % | | | 0.82 | % | | | 0.84 | % | | | 0.84 | % | | | 0.86 | % |
Ratio of net investment income to average net assets | | | 0.79 | % | | | 0.84 | % | | | 1.00 | % | | | 1.03 | % | | | 1.04 | % |
Portfolio turnover rate | | | 6 | % | | | 15 | % | | | 22 | % | | | 23 | % | | | 22 | % |
| 1 | Per share net investment income (loss) has been calculated using the average shares outstanding during the period. |
See Notes to Financial Statements.
THE GLENMEDE FUND, INC.
FINANCIAL HIGHLIGHTS — (Continued)
For a share outstanding throughout each year
| | | | | | | | | | | | | | | | | | | | |
| | | Small Cap Equity Portfolio Advisor Shares | |
| | | For The Years Ended October 31, | |
| | | 2018 | | | 2017 | | | 2016 | | | 2015 | | | 20141 | |
| | | | | |
Net asset value, beginning of year | | $ | 32.13 | | | $ | 25.61 | | | $ | 26.02 | | | $ | 26.30 | | | $ | 26.12 | |
| | | | | | | | | | | | | | | | | | | | |
Income from investment operations: | | | | | | | | | | | | | | | | | | | | |
Net investment income (loss) | | | 0.02 | | | | (0.01 | ) | | | 0.03 | | | | 0.02 | | | | (0.02 | ) |
Net realized and unrealized gain (loss) on investments | | | (0.10 | ) | | | 7.07 | | | | (0.15 | ) | | | 0.74 | | | | 1.49 | |
| | | | | | | | | | | | | | | | | | | | |
| | | | | |
Total from investment operations | | | (0.08 | ) | | | 7.06 | | | | (0.12 | ) | | | 0.76 | | | | 1.47 | |
| | | | | | | | | | | | | | | | | | | | |
Distributions to shareholders from: | | | | | | | | | | | | | | | | | | | | |
Net investment income | | | (0.02 | ) | | | (0.02 | ) | | | (0.05 | ) | | | (0.02 | ) | | | (0.10 | ) |
Net realized capital gains | | | (3.21 | ) | | | (0.52 | ) | | | (0.24 | ) | | | (1.02 | ) | | | (1.19 | ) |
| | | | | | | | | | | | | | | | | | | | |
| | | | | |
Total distributions | | | (3.23 | ) | | | (0.54 | ) | | | (0.29 | ) | | | (1.04 | ) | | | (1.29 | ) |
| | | | | | | | | | | | | | | | | | | | |
| | | | | |
Net asset value, end of year | | $ | 28.82 | | | $ | 32.13 | | | $ | 25.61 | | | $ | 26.02 | | | $ | 26.30 | |
| | | | | | | | | | | | | | | | | | | | |
| | | | | |
Total return | | | (0.58 | )% | | | 27.84 | % | | | (0.43 | )% | | | 3.03 | % | | | 5.86 | % |
| | | | | | | | | | | | | | | | | | | | |
Ratios to average net assets/ Supplemental data: | | | | | | | | | | | | | | | | | | | | |
Net assets, at end of year (in 000s) | | $ | 1,390,136 | | | $ | 1,574,979 | | | $ | 1,367,160 | | | $ | 1,399,042 | | | $ | 1,139,273 | |
Ratio of operating expenses to average net assets | | | 0.90 | % | | | 0.90 | % | | | 0.91 | % | | | 0.91 | % | | | 0.94 | % |
Ratio of net investment income (loss) (expenses in excess of income) to average net assets | | | 0.07 | % | | | (0.04 | )% | | | 0.12 | % | | | 0.07 | % | | | (0.07 | )% |
Portfolio turnover rate2 | | | 44 | % | | | 63 | % | | | 58 | % | | | 53 | % | | | 45 | % |
| 1 | Per share net investment income (loss) has been calculated using the average shares outstanding during the period. |
| 2 | Portfolio turnover is calculated at the fund level. |
| | | | | | | | | | | | | | | | | | | | |
| | | Small Cap Equity Portfolio Institutional Shares | |
| | | For The Years Ended October 31, | |
| | | 2018 | | | 2017 | | | 2016 | | | 2015 | | | 20141 | |
| | | | | |
Net asset value, beginning of year | | $ | 33.54 | | | $ | 26.67 | | | $ | 27.07 | | | $ | 27.28 | | | $ | 27.00 | |
| | | | | | | | | | | | | | | | | | | | |
Income from investment operations: | | | | | | | | | | | | | | | | | | | | |
Net investment income | | | 0.09 | | | | 0.05 | | | | 0.08 | | | | 0.08 | | | | 0.01 | |
Net realized and unrealized gain (loss) on investments | | | (0.10 | ) | | | 7.37 | | | | (0.16 | ) | | | 0.76 | | | | 1.57 | |
| | | | | | | | | | | | | | | | | | | | |
| | | | | |
Total from investment operations | | | (0.01 | ) | | | 7.42 | | | | (0.08 | ) | | | 0.84 | | | | 1.58 | |
| | | | | | | | | | | | | | | | | | | | |
Distributions to shareholders from: | | | | | | | | | | | | | | | | | | | | |
Net investment income | | | (0.07 | ) | | | (0.03 | ) | | | (0.08 | ) | | | (0.03 | ) | | | (0.11 | ) |
Net realized capital gains | | | (3.21 | ) | | | (0.52 | ) | | | (0.24 | ) | | | (1.02 | ) | | | (1.19 | ) |
| | | | | | | | | | | | | | | | | | | | |
| | | | | |
Total distributions | | | (3.28 | ) | | | (0.55 | ) | | | (0.32 | ) | | | (1.05 | ) | | | (1.30 | ) |
| | | | | | | | | | | | | | | | | | | | |
| | | | | |
Net asset value, end of year | | $ | 30.25 | | | $ | 33.54 | | | $ | 26.67 | | | $ | 27.07 | | | $ | 27.28 | |
| | | | | | | | | | | | | | | | | | | | |
| | | | | |
Total return | | | (0.36 | )% | | | 28.10 | % | | | (0.25 | )% | | | 3.24 | % | | | 6.10 | % |
| | | | | | | | | | | | | | | | | | | | |
Ratios to average net assets/ Supplemental data: | | | | | | | | | | | | | | | | | | | | |
Net assets, at end of year (in 000s) | | $ | 2,131,461 | | | $ | 1,879,657 | | | $ | 1,264,752 | | | $ | 963,970 | | | $ | 531,853 | |
Ratio of operating expenses to average net assets | | | 0.70 | % | | | 0.70 | % | | | 0.71 | % | | | 0.71 | % | | | 0.74 | % |
Ratio of net investment income to average net assets | | | 0.27 | % | | | 0.16 | % | | | 0.30 | % | | | 0.26 | % | | | 0.03 | % |
Portfolio turnover rate2 | | | 44 | % | | | 63 | % | | | 58 | % | | | 53 | % | | | 45 | % |
| 1 | Per share net investment income (loss) has been calculated using the average shares outstanding during the period. |
| 2 | Portfolio turnover is calculated at the fund level. |
See Notes to Financial Statements.
THE GLENMEDE FUND, INC.
FINANCIAL HIGHLIGHTS — (Continued)
For a share outstanding throughout each year
| | | | | | | | | | | | | | | | | | | | |
| | | Mid Cap Equity Portfolio Advisor Shares | |
| | | For The
Years Ended
October 31, | | | For the Period
September 30, 20141
through
October 31, 20142 | |
| | | 20182 | | | 2017 | | | 2016 | | | 20152 | |
| | | | | |
Net asset value, beginning of year | | $ | 11.64 | | | $ | 9.90 | | | $ | 10.57 | | | $ | 10.23 | | | $ | 10.00 | |
| | | | | | | | | | | | | | | | | | | | |
Income from investment operations: | | | | | | | | | | | | | | | | | | | | |
Net investment income (loss) | | | 0.07 | | | | 0.03 | | | | 0.08 | | | | 0.05 | | | | (0.01 | ) |
Net realized and unrealized gain (loss) on investments | | | (0.24 | ) | | | 1.75 | | | | (0.60 | ) | | | 0.32 | 3 | | | 0.24 | |
| | | | | | | | | | | | | | | | | | | | |
| | | | | |
Total from investment operations | | | (0.17 | ) | | | 1.78 | | | | (0.52 | ) | | | 0.37 | | | | 0.23 | |
| | | | | | | | | | | | | | | | | | | | |
Distributions to shareholders from: | | | | | | | | | | | | | | | | | | | | |
Net investment income | | | (0.07 | ) | | | (0.04 | ) | | | (0.07 | ) | | | (0.03 | ) | | | — | |
Net realized capital gains | | | — | | | | — | | | | (0.08 | ) | | | — | | | | — | |
| | | | | | | | | | | | | | | | | | | | |
| | | | | |
Total distributions | | | (0.07 | ) | | | (0.04 | ) | | | (0.15 | ) | | | (0.03 | ) | | | — | |
| | | | | | | | | | | | | | | | | | | | |
| | | | | |
Net asset value, end of year | | $ | 11.40 | | | $ | 11.64 | | | $ | 9.90 | | | $ | 10.57 | | | $ | 10.23 | |
| | | | | | | | | | | | | | | | | | | | |
| | | | | |
Total return4 | | | (1.51 | )% | | | 18.00 | % | | | (4.94 | )% | | | 3.62 | % | | | 2.30 | %5 |
| | | | | | | | | | | | | | | | | | | | |
Ratios to average net assets/ Supplemental data: | | | | | | | | | | | | | | | | | | | | |
Net assets, at end of year (in 000s) | | $ | 3,166 | | | $ | 14,790 | | | $ | 18,049 | | | $ | 29,980 | | | $ | 9,262 | |
Ratio of operating expenses before waiver/reimbursement to average net assets | | | 1.41 | % | | | 1.16 | % | | | 1.15 | % | | | 1.44 | % | | | 1.58 | %6 |
Ratio of operating expenses after waiver/reimbursement to average net assets | | | 1.00 | % | | | 1.00 | % | | | 1.00 | % | | | 1.00 | % | | | 1.00 | %6 |
Ratio of net investment income (loss) (expenses in excess of income) to average net assets | | | 0.56 | % | | | 0.30 | % | | | 0.66 | % | | | 0.43 | % | | | (0.30 | )%6 |
Portfolio turnover rate | | | 26 | % | | | 47 | % | | | 84 | % | | | 54 | % | | | 3 | %7 |
| 1 | Commencement of operations. |
| 2 | Per share net investment income (loss) has been calculated using the average shares outstanding during the period. |
| 3 | The amount shown for a share outstanding does not correspond with the aggregate net realized and unrealized loss for the period due to the timing of purchases and redemptions of Portfolio shares in relation to the fluctuating net asset value per share of the Portfolio. |
| 4 | The Total Return reflects fee waivers and/or expense reimbursements in effect and would have been lower in their absence. |
| 5 | Total return calculation is not annualized. |
| 7 | Calculations represent portfolio turnover for the Portfolio for the period of September 30, 2014 through October 31, 2014. |
See Notes to Financial Statements.
THE GLENMEDE FUND, INC.
FINANCIAL HIGHLIGHTS — (Continued)
For a share outstanding throughout each year
| | | | | | | | | | | | | | | | | | | | |
| | | Large Cap Value Portfolio | |
| | | For the Years Ended October 31, | |
| | | 20181 | | | 20171 | | | 2016 | | | 20151 | | | 2014 | |
| | | | | |
Net asset value, beginning of year | | $ | 11.37 | | | $ | 10.22 | | | $ | 11.15 | | | $ | 12.85 | | | $ | 12.96 | |
| | | | | | | | | | | | | | | | | | | | |
Income from investment operations: | | | | | | | | | | | | | | | | | | | | |
Net investment income | | | 0.19 | | | | 0.21 | | | | 0.19 | | | | 0.12 | | | | 0.03 | |
Net realized and unrealized gain (loss) on investments | | | (0.16 | ) | | | 1.96 | | | | 0.30 | | | | 0.06 | | | | 1.72 | |
| | | | | | | | | | | | | | | | | | | | |
| | | | | |
Total from investment operations | | | 0.03 | | | | 2.17 | | | | 0.49 | | | | 0.18 | | | | 1.75 | |
| | | | | | | | | | | | | | | | | | | | |
Distributions to shareholders from: | | | | | | | | | | | | | | | | | | | | |
Net investment income | | | (0.18 | ) | | | (0.24 | ) | | | (0.17 | ) | | | (0.11 | ) | | | (0.05 | ) |
Net realized capital gains | | | (0.71 | ) | | | (0.78 | ) | | | (1.25 | ) | | | (1.77 | ) | | | (1.81 | ) |
| | | | | | | | | | | | | | | | | | | | |
| | | | | |
Total distributions | | | (0.89 | ) | | | (1.02 | ) | | | (1.42 | ) | | | (1.88 | ) | | | (1.86 | ) |
| | | | | | | | | | | | | | | | | | | | |
| | | | | |
Net asset value, end of year | | $ | 10.51 | | | $ | 11.37 | | | $ | 10.22 | | | $ | 11.15 | | | $ | 12.85 | |
| | | | | | | | | | | | | | | | | | | | |
| | | | | |
Total return | | | 0.04 | % | | | 22.17 | % | | | 5.58 | % | | | 1.28 | % | | | 15.48 | % |
| | | | | | | | | | | | | | | | | | | | |
Ratios to average net assets/ Supplemental data: | | | | | | | | | | | | | | | | | | | | |
Net assets, at end of year (in 000s) | | $ | 71,597 | | | $ | 76,465 | | | $ | 72,154 | | | $ | 83,065 | | | $ | 98,642 | |
Ratio of operating expenses to average net assets | | | 0.91 | % | | | 0.91 | % | | | 0.91 | % | | | 0.91 | % | | | 0.92 | % |
Ratio of net investment income to average net assets | | | 1.69 | % | | | 1.99 | % | | | 1.83 | % | | | 1.03 | % | | | 0.28 | % |
Portfolio turnover rate | | | 71 | % | | | 93 | % | | | 110 | % | | | 106 | % | | | 106 | % |
| 1 | Per share net investment income (loss) has been calculated using the average shares outstanding during the period. |
See Notes to Financial Statements.
THE GLENMEDE FUND, INC.
FINANCIAL HIGHLIGHTS — (Continued)
For a share outstanding throughout each year
| | | | | | | | |
| | | Equity Income Portfolio | |
| | | For the
Year Ended
October 31,
2018 | | | For the Period
December 21, 20161
through
October 31, 20172 | |
| | |
Net asset value, beginning of year | | $ | 11.06 | | | $ | 10.00 | |
| | | | | | | | |
Income from investment operations: | | | | | | | | |
Net investment income | | | 0.22 | | | | 0.16 | |
Net realized and unrealized gain on investments | | | 0.09 | | | | 1.01 | |
| | | | | | | | |
| | |
Total from investment operations | | | 0.31 | | | | 1.17 | |
| | | | | | | | |
Distributions to shareholders from: | | | | | | | | |
Net investment income | | | (0.22 | ) | | | (0.11 | ) |
Net realized capital gains | | | (0.00 | )3 | | | — | |
| | | | | | | | |
| | |
Total distributions | | | (0.22 | ) | | | (0.11 | ) |
| | | | | | | | |
| | |
Net asset value, end of year | | $ | 11.15 | | | $ | 11.06 | |
| | | | | | | | |
| | |
Total return4 | | | 2.79 | % | | | 11.77 | %5 |
| | | | | | | | |
Ratios to average net assets/ Supplemental data: | | | | | | | | |
Net assets, at end of year (in 000s) | | $ | 18,536 | | | $ | 12,970 | |
Ratio of operating expenses before waiver/reimbursement to average net assets | | | 1.11 | % | | | 2.08 | %6 |
Ratio of operating expenses after waiver/reimbursement to average net assets | | | 0.85 | % | | | 0.85 | %6 |
Ratio of net investment income to average net assets | | | 2.02 | % | | | 1.82 | %6 |
Portfolio turnover rate | | | 29 | % | | | 14 | %7 |
| 1 | Commencement of operations. |
| 2 | Per share net investment income (loss) has been calculated using the average shares outstanding during the period. |
| 3 | Amount rounds to less than $0.01 per share. |
| 4 | The Total Return reflects fee waivers and/or expense reimbursements in effect and would have been lower in their absence. |
| 5 | Total return calculation is not annualized. |
| 7 | Calculations represent portfolio turnover for the Portfolio for the period of December 21, 2016 through October 31, 2017. |
See Notes to Financial Statements.
THE GLENMEDE FUND, INC.
FINANCIAL HIGHLIGHTS — (Continued)
For a share outstanding throughout each year
| | | | | | | | | | | | | | | | | | | | |
| | | Secured Options Portfolio Advisor Shares | |
| | | For The Years Ended October 31, | |
| | | 2018 | | | 20171 | | | 20161 | | | 20151 | | | 20141 | |
| | | | | |
Net asset value, beginning of year | | $ | 12.75 | | | $ | 12.45 | | | $ | 12.57 | | | $ | 12.47 | | | $ | 13.24 | |
| | | | | | | | | | | | | | | | | | | | |
Income from investment operations: | | | | | | | | | | | | | | | | | | | | |
Net investment income (loss) | | | (0.06 | ) | | | (0.08 | ) | | | (0.09 | ) | | | (0.09 | ) | | | (0.11 | ) |
Net realized and unrealized gain on investments | | | 0.40 | | | | 0.99 | | | | 0.68 | | | | 0.84 | | | | 0.85 | |
| | | | | | | | | | | | | | | | | | | | |
| | | | | |
Total from investment operations | | | 0.34 | | | | 0.91 | | | | 0.59 | | | | 0.75 | | | | 0.74 | |
| | | | | | | | | | | | | | | | | | | | |
Distributions to shareholders from: | | | | | | | | | | | | | | | | | | | | |
Net realized capital gains | | | (0.79 | ) | | | (0.61 | ) | | | (0.71 | ) | | | (0.65 | ) | | | (1.51 | ) |
| | | | | | | | | | | | | | | | | | | | |
| | | | | |
Total distributions | | | (0.79 | ) | | | (0.61 | ) | | | (0.71 | ) | | | (0.65 | ) | | | (1.51 | ) |
| | | | | | | | | | | | | | | | | | | | |
| | | | | |
Net asset value, end of year | | $ | 12.30 | | | $ | 12.75 | | | $ | 12.45 | | | $ | 12.57 | | | $ | 12.47 | |
| | | | | | | | | | | | | | | | | | | | |
| | | | | |
Total return | | | 2.81 | % | | | 7.53 | % | | | 5.08 | % | | | 6.37 | % | | | 6.22 | % |
| | | �� | | | | | | | | | | | | | | | | | |
Ratios to average net assets/ Supplemental data: | | | | | | | | | | | | | | | | | | | | |
Net assets, at end of year (in 000s) | | $ | 445,946 | | | $ | 446,859 | | | $ | 574,200 | | | $ | 395,163 | | | $ | 365,675 | |
Ratio of operating expenses to average net assets2 | | | 0.84 | % | | | 0.85 | % | | | 0.85 | % | | | 0.84 | % | | | 0.87 | % |
Ratio of net investment income (loss) (expenses in excess of income) to average net assets2 | | | (0.50 | )% | | | (0.68 | )% | | | 0.95 | % | | | (0.77 | )% | | | (0.81 | )% |
Portfolio turnover rate3 | | | — | %4 | | | — | %4 | | | — | %4 | | | — | %4 | | | 1,108 | % |
| 1 | Per share net investment income (loss) has been calculated using the average shares outstanding during the period. |
| 2 | This ratio does not include the expenses for the Exchange-Traded Funds held in the Portfolio. |
| 3 | Portfolio turnover is calculated at the fund level. |
| 4 | All trading activity in the Portfolio during the year was short term and is excluded for portfolio turnover calculations resulting in zero portfolio turnover percentage. |
See Notes to Financial Statements.
THE GLENMEDE FUND, INC.
FINANCIAL HIGHLIGHTS — (Continued)
For a share outstanding throughout each year
| | | | | | | | |
| | | Secured Options Portfolio Institutional Shares | |
| | | For The
Years Ended
October 31,
20182 | | | For the Period
November 9, 20161
through
October 31, 20172 | |
| | |
Net asset value, beginning of year | | $ | 12.77 | | | $ | 12.61 | |
| | | | | | | | |
Income from investment operations: | | | | | | | | |
Net investment income (loss) | | | (0.04 | ) | | | (0.06 | ) |
Net realized and unrealized gain on investments | | | 0.40 | | | | 0.83 | |
| | | | | | | | |
| | |
Total from investment operations | | | 0.36 | | | | 0.77 | |
| | | | | | | | |
Distributions to shareholders from: | | | | | | | | |
Net realized capital gains | | | (0.79 | ) | | | (0.61 | ) |
| | | | | | | | |
| | |
Total distributions | | | (0.79 | ) | | | (0.61 | ) |
| | | | | | | | |
| | |
Net asset value, end of year | | $ | 12.34 | | | $ | 12.77 | |
| | | | | | | | |
| | |
Total return | | | 2.97 | % | | | 6.34 | %3 |
| | | | | | | | |
Ratios to average net assets/ Supplemental data: | | | | | | | | |
Net assets, at end of year (in 000s) | | $ | 396,523 | | | $ | 365,523 | |
Ratio of operating expenses to average net assets4 | | | 0.64 | % | | | 0.65 | %5 |
Ratio of net investment income (loss) (expenses in excess of income) to average net assets4 | | | (0.30 | )% | | | (0.45 | )%5 |
Portfolio turnover rate6,7 | | | — | % | | | — | % |
| 1 | Class commenced operations on November 9, 2016. |
| 2 | Per share net investment income (loss) has been calculated using the average shares outstanding during the period. |
| 3 | Total return calculation is not annualized. |
| 4 | This ratio does not include the expenses for the Exchange-Traded Funds held in the Portfolio. |
| 6 | Portfolio turnover is calculated at the fund level. |
| 7 | All trading activity in the Portfolio during the year was short term and is excluded for portfolio turnover calculations resulting in zero portfolio turnover percentage. |
See Notes to Financial Statements.
THE GLENMEDE FUND, INC.
FINANCIAL HIGHLIGHTS — (Continued)
For a share outstanding throughout each year
| | | | | | | | | | | | | | | | | | | | |
| | | Global Secured Options Portfolio | |
| | | For the Years Ended October 31, | |
| | | 20181 | | | 20171 | | | 20161 | | | 20151 | | | 20141 | |
| | | | | |
Net asset value, beginning of year | | $ | 10.58 | | | $ | 9.60 | | | $ | 9.96 | | | $ | 10.58 | | | $ | 11.52 | |
| | | | | | | | | | | | | | | | | | | | |
Income from investment operations: | | | | | | | | | | | | | | | | | | | | |
Net investment income | | | 0.01 | | | | 0.06 | | | | 0.15 | | | | 0.19 | | | | 0.13 | |
Net realized and unrealized gain (loss) on investments | | | (0.09 | ) | | | 0.99 | | | | (0.30 | ) | | | (0.48 | ) | | | (0.11 | ) |
| | | | | | | | | | | | | | | | | | | | |
| | | | | |
Total from investment operations | | | (0.08 | ) | | | 1.05 | | | | (0.15 | ) | | | (0.29 | ) | | | 0.02 | |
| | | | | | | | | | | | | | | | | | | | |
Distributions to shareholders from: | | | | | | | | | | | | | | | | | | | | |
Net investment income | | | (0.09 | ) | | | (0.07 | ) | | | (0.21 | ) | | | (0.21 | ) | | | (0.11 | ) |
Net realized capital gains | | | — | | | | — | | | | — | | | | (0.12 | ) | | | (0.85 | ) |
| | | | | | | | | | | | | | | | | | | | |
| | | | | |
Total distributions | | | (0.09 | ) | | | (0.07 | ) | | | (0.21 | ) | | | (0.33 | ) | | | (0.96 | ) |
| | | | | | | | | | | | | | | | | | | | |
| | | | | |
Net asset value, end of year | | $ | 10.41 | | | $ | 10.58 | | | $ | 9.60 | | | $ | 9.96 | | | $ | 10.58 | |
| | | | | | | | | | | | | | | | | | | | |
| | | | | |
Total return | | | (0.76 | )% | | | 10.94 | % | | | (1.47 | )% | | | (2.78 | )% | | | 0.30 | % |
| | | | | | | | | | | | | | | | | | | | |
Ratios to average net assets/ Supplemental data: | | | | | | | | | | | | | | | | | | | | |
Net assets, at end of year (in 000s) | | $ | 2,510 | | | $ | 10,642 | | | $ | 28,818 | | | $ | 88,478 | | | $ | 100,552 | |
Ratio of operating expenses to average net assets2 | | | 1.17 | %3 | | | 1.13 | % | | | 0.91 | % | | | 0.84 | % | | | 0.87 | % |
Ratio of net investment income to average net assets2 | | | 0.08 | % | | | 0.58 | % | | | 1.61 | % | | | 1.83 | % | | | 1.20 | % |
Portfolio turnover rate | | | 224 | % | | | 9 | % | | | 70 | % | | | 106 | % | | | 81 | % |
| 1 | Per share net investment income (loss) has been calculated using the average shares outstanding during the period. |
| 2 | This ratio does not include the expenses for the Exchange-Traded Funds held in the Portfolio. |
| 3 | The ratio of operating expenses excluding dividends on securities sold short and interest expense was 1.11% for the period ended October 31, 2018. |
| | | | | | | | | | | | | | | | | | | | |
| | | Core Fixed Income Portfolio | |
| | | For the Years Ended October 31, | |
| | | 2018 | | | 20171 | | | 2016 | | | 2015 | | | 2014 | |
| | | | | |
Net asset value, beginning of year | | $ | 11.04 | | | $ | 11.26 | | | $ | 11.20 | | | $ | 11.21 | | | $ | 11.22 | |
| | | | | | | | | | | | | | | | | | | | |
Income from investment operations: | | | | | | | | | | | | | | | | | | | | |
Net investment income | | | 0.25 | | | | 0.21 | | | | 0.21 | | | | 0.23 | | | | 0.25 | |
Net realized and unrealized gain (loss) on investments | | | (0.50 | ) | | | (0.13 | ) | | | 0.14 | | | | 0.01 | | | | 0.02 | |
| | | | | | | | | | | | | | | | | | | | |
| | | | | |
Total from investment operations | | | (0.25 | ) | | | 0.08 | | | | 0.35 | | | | 0.24 | | | | 0.27 | |
| | | | | | | | | | | | | | | | | | | | |
Distributions to shareholders from: | | | | | | | | | | | | | | | | | | | | |
Net investment income | | | (0.26 | ) | | | (0.22 | ) | | | (0.23 | ) | | | (0.25 | ) | | | (0.26 | ) |
Net realized capital gains | | | (0.04 | ) | | | (0.08 | ) | | | (0.06 | ) | | | — | | | | (0.02 | ) |
| | | | | | | | | | | | | | | | | | | | |
| | | | | |
Total distributions | | | (0.30 | ) | | | (0.30 | ) | | | (0.29 | ) | | | (0.25 | ) | | | (0.28 | ) |
| | | | | | | | | | | | | | | | | | | | |
| | | | | |
Net asset value, end of year | | $ | 10.49 | | | $ | 11.04 | | | $ | 11.26 | | | $ | 11.20 | | | $ | 11.21 | |
| | | | | | | | | | | | | | | | | | | | |
| | | | | |
Total return | | | (2.32 | )% | | | 0.75 | % | | | 3.15 | % | | | 2.20 | % | | | 2.52 | % |
| | | | | | | | | | | | | | | | | | | | |
Ratios to average net assets/ Supplemental data: | | | | | | | | | | | | | | | | | | | | |
Net assets, at end of year (in 000s) | | $ | 485,201 | | | $ | 488,548 | | | $ | 486,872 | | | $ | 433,086 | | | $ | 426,528 | |
Ratio of operating expenses to average net assets | | | 0.52 | % | | | 0.52 | % | | | 0.54 | % | | | 0.53 | % | | | 0.56 | % |
Ratio of net investment income to average net assets | | | 2.24 | % | | | 1.90 | % | | | 1.84 | % | | | 2.11 | % | | | 2.23 | % |
Portfolio turnover rate | | | 29 | % | | | 46 | % | | | 24 | % | | | 27 | % | | | 18 | % |
| 1 | Per share net investment income (loss) has been calculated using the average shares outstanding during the period. |
See Notes to Financial Statements.
THE GLENMEDE FUND, INC.
FINANCIAL HIGHLIGHTS — (Continued)
For a share outstanding throughout each year
| | | | | | | | | | | | |
| | | Short Term Tax Aware Fixed Income Portfolio | |
| | | For the
Years Ended
October 31, | | | For the Period
June 29, 20161
through
October 31, 20162 | |
| | | 2018 | | | 20172 | |
| | | |
Net asset value, beginning of year | | $ | 9.98 | | | $ | 9.99 | | | $ | 10.00 | |
| | | | | | | | | | | | |
Income from investment operations: | | | | | | | | | | | | |
Net investment income | | | 0.09 | | | | 0.07 | | | | 0.02 | |
Net realized and unrealized gain (loss) on investments | | | (0.08 | ) | | | (0.01 | ) | | | (0.02 | ) |
| | | | | | | | | | | | |
| | | |
Total from investment operations | | | 0.01 | | | | 0.06 | | | | 0.00 | |
| | | | | | | | | | | | |
Distributions to shareholders from: | | | | | | | | | | | | |
Net investment income | | | (0.09 | ) | | | (0.07 | ) | | | (0.01 | ) |
| | | | | | | | | | | | |
| | | |
Total distributions | | | (0.09 | ) | | | (0.07 | ) | | | (0.01 | ) |
| | | | | | | | | | | | |
| | | |
Net asset value, end of year | | $ | 9.90 | | | $ | 9.98 | | | $ | 9.99 | |
| | | | | | | | | | | | |
| | | |
Total return3 | | | 0.10 | % | | | 0.57 | % | | | (0.02 | )%4 |
| | | | | | | | | | | | |
Ratios to average net assets/ Supplemental data: | | | | | | | | | | | | |
Net assets, at end of year (in 000s) | | $ | 26,294 | | | $ | 33,900 | | | $ | 30,076 | |
Ratio of operating expenses before waiver/reimbursement to average net assets5 | | | 0.61 | % | | | 0.69 | % | | | 0.90 | %6 |
Ratio of operating expenses after waiver/reimbursement to average net assets5 | | | 0.55 | % | | | 0.55 | % | | | 0.55 | %6 |
Ratio of net investment income to average net assets5 | | | 0.92 | % | | | 0.69 | % | | | 0.46 | %6 |
Portfolio turnover rate | | | 19 | % | | | 31 | % | | | 35 | %7 |
| 1 | Commencement of operations. |
| 2 | Per share net investment income (loss) has been calculated using the average shares outstanding during the period. |
| 3 | The Total Return reflects fee waivers and/or expense reimbursements in effect and would have been lower in their absence. |
| 4 | Total return calculation is not annualized. |
| 5 | This ratio does not include the expenses for the Exchange-Traded Funds held in the Portfolio. |
| 7 | Calculations represent portfolio turnover for the Portfolio for the period of June 29, 2016 through October 31, 2016. |
See Notes to Financial Statements.
THE GLENMEDE FUND, INC.
FINANCIAL HIGHLIGHTS — (Concluded)
For a share outstanding throughout each year
| | | | | | | | | | | | |
| | | High Yield Municipal Portfolio | |
| | | For the
Years Ended
October 31, | | | For the Period
December 22, 20151
through
October 31, 20162 | |
| | | 2018 | | | 2017 | |
| | | |
Net asset value, beginning of year | | $ | 10.35 | | | $ | 10.39 | | | $ | 10.00 | |
| | | | | | | | | | | | |
Income from investment operations: | | | | | | | | | | | | |
Net investment income | | | 0.30 | | | | 0.30 | | | | 0.22 | |
Net realized and unrealized gain (loss) on investments | | | (0.19 | ) | | | (0.01 | ) | | | 0.34 | |
| | | | | | | | | | | | |
| | | |
Total from investment operations | | | 0.11 | | | | 0.29 | | | | 0.56 | |
| | | | | | | | | | | | |
Distributions to shareholders from: | | | | | | | | | | | | |
Net investment income | | | (0.30 | ) | | | (0.29 | ) | | | (0.17 | ) |
Net realized capital gains | | | — | | | | (0.04 | ) | | | — | |
| | | | | | | | | | | | |
| | | |
Total distributions | | | (0.30 | ) | | | (0.33 | ) | | | (0.17 | ) |
| | | | | | | | | | | | |
| | | |
Net asset value, end of year | | $ | 10.16 | | | $ | 10.35 | | | $ | 10.39 | |
| | | | | | | | | | | | |
| | | |
Total return | | | 1.04 | % | | | 2.89 | % | | | 5.56 | %3,4 |
| | | | | | | | | | | | |
Ratios to average net assets/ Supplemental data: | | | | | | | | | | | | |
Net assets, at end of year (in 000s) | | $ | 192,319 | | | $ | 170,440 | | | $ | 153,893 | |
Ratio of operating expenses to average net assets | | | 0.99 | % | | | 1.00 | % | | | — | % |
Ratio of operating expenses before waiver/reimbursement to average net assets | | | — | % | | | — | % | | | 1.08 | %5 |
Ratio of operating expenses after waiver/reimbursement to average net assets | | | — | % | | | — | % | | | 1.00 | %5 |
Ratio of net investment income to average net assets | | | 2.90 | % | | | 2.92 | % | | | 2.44 | %5 |
Portfolio turnover rate | | | 44 | %6 | | | 43 | %6 | | | 73 | %7 |
| 1 | Commencement of operations. |
| 2 | Per share net investment income (loss) has been calculated using the average shares outstanding during the period. |
| 3 | Total return calculation is not annualized. |
| 4 | The Total Return reflects fee waivers and/or expense reimbursements in effect and would have been lower in their absence. |
| 6 | Variable Rate Demand Note (VRDN) securities are excluded from the portfolio turnover calculation. |
| 7 | Calculations represent portfolio turnover for the Portfolio for the period of December 22, 2015 through October 31, 2016. |
See Notes to Financial Statements.
THE GLENMEDE FUND, INC.
Quantitative U.S. Large Cap Core Equity Portfolio
SCHEDULE OF PORTFOLIO INVESTMENTS
October 31, 2018
| | | | | | | | |
| Shares | | | | | Value | |
| |
| COMMON STOCKS* — 99.8% | | | |
| | | | Aerospace & Defense — 2.2% | | | |
| | 138,655 | | | Boeing Co. (The) | | $ | 49,203,113 | |
| | 69,914 | | | General Dynamics Corp. | | | 12,065,758 | |
| | | | | | | | |
| | | | | | | 61,268,871 | |
| | | | | | | | |
| | |
| | | | Airlines — 0.5% | | | |
| | 276,659 | | | Delta Air Lines, Inc. | | | 15,141,547 | |
| | | | | | | | |
| | |
| | | | Banks — 6.0% | | | |
| | 811,475 | | | Citizens Financial Group, Inc. | | | 30,308,591 | |
| | 385,117 | | | Comerica, Inc. | | | 31,410,143 | |
| | 1,070,661 | | | Fifth Third Bancorp | | | 28,897,141 | |
| | 296,808 | | | JPMorgan Chase & Co. | | | 32,358,008 | |
| | 1,572,499 | | | Regions Financial Corp. | | | 26,685,308 | |
| | 317,052 | | | SunTrust Banks, Inc. | | | 19,866,478 | |
| | | | | | | | |
| | | | | | | 169,525,669 | |
| | | | | | | | |
| | |
| | | | Beverages — 1.0% | | | |
| | 542,498 | | | Monster Beverage Corp.1 | | | 28,671,019 | |
| | | | | | | | |
| | |
| | | | Biotechnology — 4.4% | | | |
| | 319,492 | | | AbbVie, Inc. | | | 24,872,452 | |
| | 142,320 | | | Amgen, Inc. | | | 27,437,873 | |
| | 92,666 | | | Biogen, Inc.1 | | | 28,195,484 | |
| | 248,291 | | | Celgene Corp.1 | | | 17,777,635 | |
| | 396,599 | | | Gilead Sciences, Inc. | | | 27,040,120 | |
| | | | | | | | |
| | | | | | | 125,323,564 | |
| | | | | | | | |
| | |
| | | | Building Products — 0.7% | | | |
| | 453,970 | | | Fortune Brands Home & Security, Inc. | | | 20,351,475 | |
| | 31,168 | | | Resideo Technologies, Inc.1 | | | 656,076 | |
| | | | | | | | |
| | | | | | | 21,007,551 | |
| | | | | | | | |
| | |
| | | | Capital Markets — 4.4% | | | |
| | 201,254 | | | Ameriprise Financial, Inc. | | | 25,607,559 | |
| | 283,483 | | | Bank of New York Mellon Corp. (The) | | | 13,417,250 | |
| | 185,743 | | | CME Group, Inc. | | | 34,035,547 | |
| | 322,017 | | | Intercontinental Exchange, Inc. | | | 24,808,190 | |
| | 136,259 | | | Northern Trust Corp. | | | 12,817,884 | |
| | 151,740 | | | T Rowe Price Group, Inc. | | | 14,717,263 | |
| | | | | | | | |
| | | | | | | 125,403,693 | |
| | | | | | | | |
| | |
| | | | Chemicals — 1.0% | | | |
| | 130,790 | | | Celanese Corp. | | | 12,678,783 | |
| | 172,426 | | | LyondellBasell Industries N.V. — Class A | | | 15,392,469 | |
| | | | | | | | |
| | | | | | | 28,071,252 | |
| | | | | | | | |
| | |
| | | | Commercial Services & Supplies — 1.1% | | | |
| | 334,738 | | | Waste Management, Inc. | | | 29,949,009 | |
| | | | | | | | |
| | |
| | | | Communications Equipment — 2.4% | | | |
| | 800,373 | | | Cisco Systems, Inc. | | | 36,617,065 | |
| | 181,807 | | | F5 Networks, Inc.1 | | | 31,867,131 | |
| | | | | | | | |
| | | | | | | 68,484,196 | |
| | | | | | | | |
| | |
| | | | Consumer Finance — 1.6% | | | |
| | 1,121,873 | | | Ally Financial, Inc. | | | 28,506,793 | |
| | 590,826 | | | Synchrony Financial | | | 17,063,055 | |
| | | | | | | | |
| | | | | | | 45,569,848 | |
| | | | | | | | |
See Notes to Financial Statements.
THE GLENMEDE FUND, INC.
Quantitative U.S. Large Cap Core Equity Portfolio
SCHEDULE OF PORTFOLIO INVESTMENTS — (Continued)
October 31, 2018
| | | | | | | | |
| Shares | | | | | Value | |
| |
| COMMON STOCKS* — (Continued) | | | |
| | | | Containers & Packaging — 1.4% | | | |
| | 305,256 | | | Avery Dennison Corp. | | $ | 27,692,824 | |
| | 272,548 | | | WestRock Co. | | | 11,711,388 | |
| | | | | | | | |
| | | | | | | 39,404,212 | |
| | | | | | | | |
| | |
| | | | Diversified Consumer Services — 1.0% | | | |
| | 691,340 | | | Service Corp. International | | | 28,669,870 | |
| | | | | | | | |
| | |
| | | | Diversified Telecommunication Services — 1.9% | | | |
| | 620,806 | | | AT&T, Inc. | | | 19,046,328 | |
| | 598,661 | | | Verizon Communications, Inc. | | | 34,177,557 | |
| | | | | | | | |
| | | | | | | 53,223,885 | |
| | | | | | | | |
| | |
| | | | Electric Utilities — 2.3% | | | |
| | 773,907 | | | Exelon Corp. | | | 33,904,866 | |
| | 659,609 | | | PG&E Corp. | | | 30,876,297 | |
| | | | | | | | |
| | | | | | | 64,781,163 | |
| | | | | | | | |
| | |
| | | | Electrical Equipment — 1.9% | | | |
| | 407,254 | | | AMETEK, Inc. | | | 27,318,598 | |
| | 382,285 | | | Eaton Corp. PLC | | | 27,398,366 | |
| | | | | | | | |
| | | | | | | 54,716,964 | |
| | | | | | | | |
| | |
| | | | Entertainment — 1.7% | | | |
| | 198,653 | | | Electronic Arts, Inc.1 | | | 18,073,450 | |
| | 273,730 | | | Walt Disney Co. (The) | | | 31,432,416 | |
| | | | | | | | |
| | | | | | | 49,505,866 | |
| | | | | | | | |
| | |
| | | | Equity Real Estate Investment Trusts — 1.9% | | | |
| | 1,353,600 | | | Host Hotels & Resorts, Inc. | | | 25,867,296 | |
| | 146,334 | | | Simon Property Group, Inc. | | | 26,855,216 | |
| | | | | | | | |
| | | | | | | 52,722,512 | |
| | | | | | | | |
| | |
| | | | Food & Staples Retailing — 2.1% | | | |
| | 460,874 | | | Walgreens Boots Alliance, Inc. | | | 36,763,919 | |
| | 219,590 | | | Walmart, Inc. | | | 22,020,485 | |
| | | | | | | | |
| | | | | | | 58,784,404 | |
| | | | | | | | |
| | |
| | | | Food Products — 3.1% | | | |
| | 671,220 | | | General Mills, Inc. | | | 29,399,436 | |
| | 165,017 | | | JM Smucker Co. (The) | | | 17,874,641 | |
| | 289,435 | | | McCormick & Co., Inc. | | | 41,678,640 | |
| | | | | | | | |
| | | | | | | 88,952,717 | |
| | | | | | | | |
| | |
| | | | Health Care Providers & Services — 7.3% | | | |
| | 161,198 | | | Anthem, Inc. | | | 44,421,333 | |
| | 223,888 | | | Centene Corp.1 | | | 29,177,084 | |
| | 439,707 | | | CVS Health Corp. | | | 31,830,390 | |
| | 223,540 | | | DaVita, Inc.1 | | | 15,053,184 | |
| | 202,770 | | | Express Scripts Holding Co.1 | | | 19,662,607 | |
| | 97,786 | | | Humana, Inc. | | | 31,331,612 | |
| | 134,441 | | | UnitedHealth Group, Inc. | | | 35,136,155 | |
| | | | | | | | |
| | | | | | | 206,612,365 | |
| | | | | | | | |
| | |
| | | | Hotels, Restaurants & Leisure — 1.4% | | | |
| | 248,475 | | | Marriott International, Inc. — Class A | | | 29,044,243 | |
| | 299,142 | | | Wyndham Destinations, Inc. | | | 10,733,215 | |
| | | | | | | | |
| | | | | | | 39,777,458 | |
| | | | | | | | |
| | |
| | | | Household Products — 1.7% | | | |
| | 547,113 | | | Church & Dwight Co., Inc. | | | 32,482,099 | |
See Notes to Financial Statements.
THE GLENMEDE FUND, INC.
Quantitative U.S. Large Cap Core Equity Portfolio
SCHEDULE OF PORTFOLIO INVESTMENTS — (Continued)
October 31, 2018
| | | | | | | | |
| Shares | | | | | Value | |
| |
| COMMON STOCKS* — (Continued) | | | |
| | | | Household Products — (Continued) | | | |
| | 182,175 | | | Procter & Gamble Co. (The) | | $ | 16,155,279 | |
| | | | | | | | |
| | | | | | | 48,637,378 | |
| | | | | | | | |
| | |
| | | | Independent Power & Renewable Electricity Producer — 1.4% | | | |
| | 2,655,810 | | | AES Corp. | | | 38,721,710 | |
| | | | | | | | |
| | |
| | | | Industrial Conglomerates — 1.0% | | | |
| | 187,005 | | | Honeywell International, Inc. | | | 27,082,064 | |
| | | | | | | | |
| | |
| | | | Insurance — 3.0% | | | |
| | 416,182 | | | Arthur J Gallagher & Co. | | | 30,801,630 | |
| | 640,040 | | | MetLife, Inc. | | | 26,363,247 | |
| | 236,511 | | | Progressive Corp. (The) | | | 16,484,817 | |
| | 337,189 | | | Unum Group | | | 12,226,473 | |
| | | | | | | | |
| | | | | | | 85,876,167 | |
| | | | | | | | |
| | |
| | | | Interactive Media & Services — 2.0% | | | |
| | 25,796 | | | Alphabet, Inc. — Class A1 | | | 28,132,602 | |
| | 184,532 | | | Facebook, Inc. — Class A1 | | | 28,010,112 | |
| | | | | | | | |
| | | | | | | 56,142,714 | |
| | | | | | | | |
| | |
| | | | Internet & Direct Marketing Retail — 0.8% | | | |
| | 782,519 | | | eBay, Inc.1 | | | 22,716,527 | |
| | | | | | | | |
| | |
| | | | IT Services — 6.0% | | | |
| | 177,838 | | | Accenture PLC — Class A | | | 28,030,825 | |
| | 395,890 | | | Amdocs, Ltd. | | | 25,047,960 | |
| | 405,042 | | | Cognizant Technology Solutions Corp. — Class A | | | 27,960,049 | |
| | 108,119 | | | DXC Technology Co. | | | 7,874,307 | |
| | 549,874 | | | PayPal Holdings, Inc.1 | | | 46,293,892 | |
| | 266,696 | | | Visa, Inc. — Class A | | | 36,764,044 | |
| | | | | | | | |
| | | | | | | 171,971,077 | |
| | | | | | | | |
| | |
| | | | Life Sciences Tools & Services — 1.0% | | | |
| | 150,483 | | | Waters Corp.1 | | | 28,545,120 | |
| | | | | | | | |
| | |
| | | | Machinery — 1.5% | | | |
| | 329,309 | | | Ingersoll-Rand PLC | | | 31,593,906 | |
| | 80,148 | | | Snap-on, Inc. | | | 12,337,983 | |
| | | | | | | | |
| | | | | | | 43,931,889 | |
| | | | | | | | |
| | |
| | | | Media — 3.3% | | | |
| | 833,234 | | | Comcast Corp. — Class A | | | 31,779,545 | |
| | 644,040 | | | Interpublic Group of Cos., Inc. (The) | | | 14,915,966 | |
| | 1,138,920 | | | News Corp. — Class A | | | 15,022,355 | |
| | 434,324 | | | Omnicom Group, Inc. | | | 32,278,960 | |
| | | | | | | | |
| | | | | | | 93,996,826 | |
| | | | | | | | |
| | |
| | | | Metals & Mining — 0.9% | | | |
| | 677,624 | | | Steel Dynamics, Inc. | | | 26,833,910 | |
| | | | | | | | |
| | |
| | | | Multi-line Retail — 2.6% | | | |
| | 475,529 | | | Kohl’s Corp. | | | 36,011,811 | |
| | 447,668 | | | Target Corp. | | | 37,438,475 | |
| | | | | | | | |
| | | | | | | 73,450,286 | |
| | | | | | | | |
| | |
| | | | Multi-Utilities — 0.5% | | | |
| | 136,046 | | | DTE Energy Co.2 | | | 15,291,570 | |
| | | | | | | | |
| | |
| | | | Oil, Gas & Consumable Fuels — 5.3% | | | |
| | 241,983 | | | Chevron Corp. | | | 27,017,402 | |
See Notes to Financial Statements.
THE GLENMEDE FUND, INC.
Quantitative U.S. Large Cap Core Equity Portfolio
SCHEDULE OF PORTFOLIO INVESTMENTS — (Continued)
October 31, 2018
| | | | | | | | |
| Shares | | | | | Value | |
| |
| COMMON STOCKS* — (Continued) | | | |
| | | | Oil, Gas & Consumable Fuels — (Continued) | | | |
| | 1,674,996 | | | Kinder Morgan, Inc. | | $ | 28,508,432 | |
| | 619,694 | | | Marathon Petroleum Corp. | | | 43,657,442 | |
| | 257,975 | | | Phillips 66 | | | 26,524,989 | |
| | 259,031 | | | Valero Energy Corp. | | | 23,595,134 | |
| | | | | | | | |
| | | | | | | 149,303,399 | |
| | | | | | | | |
| | |
| | | | Pharmaceuticals — 2.6% | | | |
| | 360,836 | | | Eli Lilly & Co. | | | 39,129,056 | |
| | 821,999 | | | Pfizer, Inc. | | | 35,395,277 | |
| | | | | | | | |
| | | | | | | 74,524,333 | |
| | | | | | | | |
| | |
| | | | Real Estate Management & Development — 0.9% | | | |
| | 646,889 | | | CBRE Group, Inc. — Class A1 | | | 26,063,158 | |
| | | | | | | | |
| | |
| | | | Semiconductors & Semiconductor Equipment — 4.0% | | | |
| | 545,968 | | | Applied Materials, Inc. | | | 17,951,428 | |
| | 694,528 | | | Intel Corp. | | | 32,559,473 | |
| | 143,327 | | | KLA-Tencor Corp. | | | 13,120,154 | |
| | 150,376 | | | Lam Research Corp. | | | 21,312,790 | |
| | 298,733 | | | Texas Instruments, Inc. | | | 27,731,384 | |
| | | | | | | | |
| | | | | | | 112,675,229 | |
| | | | | | | | |
| | |
| | | | Software — 4.5% | | | |
| | 342,517 | | | CA, Inc. | | | 15,194,054 | |
| | 171,460 | | | Citrix Systems, Inc.1 | | | 17,569,506 | |
| | 331,137 | | | Microsoft Corp. | | | 35,368,743 | |
| | 400,415 | | | Oracle Corp. | | | 19,556,269 | |
| | 288,139 | | | VMware, Inc. — Class A1 | | | 40,739,973 | |
| | | | | | | | |
| | | | | | | 128,428,545 | |
| | | | | | | | |
| | |
| | | | Specialty Retail — 2.3% | | | |
| | 427,364 | | | Best Buy Co., Inc. | | | 29,983,858 | |
| | 76,348 | | | Home Depot, Inc. (The) | | | 13,428,086 | |
| | 225,666 | | | Ross Stores, Inc. | | | 22,340,934 | |
| | | | | | | | |
| | | | | | | 65,752,878 | |
| | | | | | | | |
| | |
| | | | Technology Hardware, Storage & Peripherals — 3.2% | | | |
| | 732,139 | | | HP, Inc. | | | 17,673,835 | |
| | 640,050 | | | NetApp, Inc. | | | 50,237,524 | |
| | 536,365 | | | Western Digital Corp. | | | 23,101,241 | |
| | | | | | | | |
| | | | | | | 91,012,600 | |
| | | | | | | | |
| | |
| | | | TOTAL COMMON STOCKS
(Cost $2,341,099,012) | | | 2,836,525,015 | |
| | | | | | | | |
| | |
Face
Amount | | | | | | |
| |
| REPURCHASE AGREEMENT* — 0.1% | | | |
| $ | 2,944,141 | | | With Fixed Income Clearing Corp., dated 10/31/18, 0.42%, principal and interest in the amount of $2,944,175, due 11/1/18, (collateralized by a U.S. Treasury Note with a par value of $3,040,000, coupon rate of 2.375%, due 4/15/2021, market value of $3,006,940) | | | 2,944,141 | |
| | | | | | | | |
| | |
| | | | TOTAL REPURCHASE AGREEMENT
(Cost $2,944,141) | | | 2,944,141 | |
| | | | | | | | |
See Notes to Financial Statements.
THE GLENMEDE FUND, INC.
Quantitative U.S. Large Cap Core Equity Portfolio
SCHEDULE OF PORTFOLIO INVESTMENTS — (Continued)
October 31, 2018
| | | | | | | | |
| Shares | | | | | Value | |
| |
| INVESTMENT OF SECURITY LENDING COLLATERAL* — 0.2% | | | |
| | 5,112,366 | | | State Street Navigator Securities Lending Government Money Market Portfolio | | $ | 5,112,366 | |
| | | | | | | | |
| | |
| | | | TOTAL INVESTMENT OF SECURITY LENDING COLLATERAL
(Cost $5,112,366) | | | 5,112,366 | |
| | | | | | | | |
| | | | | | | | | | |
| | |
TOTAL INVESTMENTS
(Cost $2,349,155,519) | | | 100.1 | % | | $ | 2,844,581,522 | |
| | |
LIABILITIES IN EXCESS OF OTHER ASSETS | | | (0.1 | ) | | | (2,199,925 | ) |
| | | | | | | | |
| | |
NET ASSETS | | | 100.0 | % | | $ | 2,842,381,597 | |
| | | | | | | | |
| * | Percentages indicated are based on net assets. |
| 1 | Non income-producing security. |
| 2 | Securities or partial securities on loan. See Note 1. |
See Notes to Financial Statements.
THE GLENMEDE FUND, INC.
Quantitative U.S. Large Cap Core Equity Portfolio
SCHEDULE OF PORTFOLIO INVESTMENTS — (Concluded)
October 31, 2018
INDUSTRY DIVERSIFICATION
On October 31, 2018, industry diversification of the Portfolio was as follows:
| | | | | | | | |
| | | % of
Net Assets | | | Value | |
| INDUSTRIES: | | | | | | |
Health Care Providers & Services | | | 7.3 | % | | $ | 206,612,365 | |
IT Services | | | 6.0 | | | | 171,971,077 | |
Banks | | | 6.0 | | | | 169,525,669 | |
Oil, Gas & Consumable Fuels | | | 5.3 | | | | 149,303,399 | |
Software | | | 4.5 | | | | 128,428,545 | |
Capital Markets | | | 4.4 | | | | 125,403,693 | |
Biotechnology | | | 4.4 | | | | 125,323,564 | |
Semiconductors & Semiconductor Equipment | | | 4.0 | | | | 112,675,229 | |
Media | | | 3.3 | | | | 93,996,826 | |
Technology Hardware, Storage & Peripherals | | | 3.2 | | | | 91,012,600 | |
Food Products | | | 3.1 | | | | 88,952,717 | |
Insurance | | | 3.0 | | | | 85,876,167 | |
Pharmaceuticals | | | 2.6 | | | | 74,524,333 | |
Multi-line Retail | | | 2.6 | | | | 73,450,286 | |
Communications Equipment | | | 2.4 | | | | 68,484,196 | |
Specialty Retail | | | 2.3 | | | | 65,752,878 | |
Electric Utilities | | | 2.3 | | | | 64,781,163 | |
Aerospace & Defense | | | 2.2 | | | | 61,268,871 | |
Food & Staples Retailing | | | 2.1 | | | | 58,784,404 | |
Interactive Media & Services | | | 2.0 | | | | 56,142,714 | |
Electrical Equipment | | | 1.9 | | | | 54,716,964 | |
Diversified Telecommunication Services | | | 1.9 | | | | 53,223,885 | |
Equity Real Estate Investment Trusts | | | 1.9 | | | | 52,722,512 | |
Entertainment | | | 1.7 | | | | 49,505,866 | |
Household Products | | | 1.7 | | | | 48,637,378 | |
Consumer Finance | | | 1.6 | | | | 45,569,848 | |
Machinery | | | 1.5 | | | | 43,931,889 | |
Hotels, Restaurants & Leisure | | | 1.4 | | | | 39,777,458 | |
Containers & Packaging | | | 1.4 | | �� | | 39,404,212 | |
Independent Power & Renewable Electricity Producer | | | 1.4 | | | | 38,721,710 | |
Commercial Services & Supplies | | | 1.1 | | | | 29,949,009 | |
Beverages | | | 1.0 | | | | 28,671,019 | |
Diversified Consumer Services | | | 1.0 | | | | 28,669,870 | |
Life Sciences Tools & Services | | | 1.0 | | | | 28,545,120 | |
Chemicals | | | 1.0 | | | | 28,071,252 | |
Industrial Conglomerates | | | 1.0 | | | | 27,082,064 | |
Metals & Mining | | | 0.9 | | | | 26,833,910 | |
Real Estate Management & Development | | | 0.9 | | | | 26,063,158 | |
Internet & Direct Marketing Retail | | | 0.8 | | | | 22,716,527 | |
Building Products | | | 0.7 | | | | 21,007,551 | |
Multi-Utilities | | | 0.5 | | | | 15,291,570 | |
Airlines | | | 0.5 | | | | 15,141,547 | |
| | | | | | | | |
TOTAL COMMON STOCKS | | | 99.8 | % | | $ | 2,836,525,015 | |
| | |
REPURCHASE AGREEMENT | | | 0.1 | | | | 2,944,141 | |
| | |
INVESTMENT OF SECURITY LENDING COLLATERAL | | | 0.2 | | | | 5,112,366 | |
| | | | | | | | |
TOTAL INVESTMENTS | | | 100.1 | % | | $ | 2,844,581,522 | |
| | | | | | | | |
See Notes to Financial Statements.
THE GLENMEDE FUND, INC.
Quantitative U.S. Large Cap Growth Equity Portfolio
SCHEDULE OF PORTFOLIO INVESTMENTS
October 31, 2018
| | | | | | | | |
| Shares | | | | | Value | |
|
| COMMON STOCKS* — 99.8% | |
| | | | Aerospace & Defense — 3.6% | |
| | 288,801 | | | Boeing Co. (The) | | $ | 102,483,924 | |
| | 89,073 | | | Huntington Ingalls Industries, Inc. | | | 19,460,669 | |
| | | | | | | | |
| | | | | | | 121,944,593 | |
| | | | | | | | |
| |
| | | | Airlines — 0.8% | |
| | 542,849 | | | Southwest Airlines Co. | | | 26,653,886 | |
| | | | | | | | |
| |
| | | | Banks — 0.4% | |
| | 375,244 | | | Citizens Financial Group, Inc. | | | 14,015,363 | |
| | | | | | | | |
| |
| | | | Beverages — 3.6% | |
| | 1,314,791 | | | Monster Beverage Corp.1 | | | 69,486,704 | |
| | 486,204 | | | PepsiCo, Inc. | | | 54,639,606 | |
| | | | | | | | |
| | | | | | | 124,126,310 | |
| | | | | | | | |
| |
| | | | Biotechnology — 5.4% | |
| | 454,724 | | | Amgen, Inc. | | | 87,666,240 | |
| | 161,737 | | | Biogen, Inc.1 | | | 49,211,717 | |
| | 647,834 | | | Celgene Corp.1 | | | 46,384,914 | |
| | | | | | | | |
| | | | | | | 183,262,871 | |
| | | | | | | | |
| |
| | | | Building Products — 2.1% | |
| | 423,803 | | | AO Smith Corp. | | | 19,295,750 | |
| | 551,237 | | | Fortune Brands Home & Security, Inc. | | | 24,711,955 | |
| | 965,961 | | | Masco Corp. | | | 28,978,830 | |
| | | | | | | | |
| | | | | | | 72,986,535 | |
| | | | | | | | |
| |
| | | | Capital Markets — 2.2% | |
| | 263,889 | | | Ameriprise Financial, Inc. | | | 33,577,236 | |
| | 436,524 | | | Northern Trust Corp. | | | 41,063,813 | |
| | | | | | | | |
| | | | | | | 74,641,049 | |
| | | | | | | | |
| |
| | | | Chemicals — 1.3% | |
| | 480,083 | | | LyondellBasell Industries N.V. — Class A | | | 42,857,010 | |
| | | | | | | | |
| |
| | | | Communications Equipment — 1.2% | |
| | 237,792 | | | F5 Networks, Inc.1 | | | 41,680,182 | |
| | | | | | | | |
| |
| | | | Consumer Finance — 1.0% | |
| | 258,276 | | | Discover Financial Services | | | 17,994,089 | |
| | 583,580 | | | Synchrony Financial | | | 16,853,790 | |
| | | | | | | | |
| | | | | | | 34,847,879 | |
| | | | | | | | |
| |
| | | | Containers & Packaging — 1.7% | |
| | 498,355 | | | Avery Dennison Corp. | | | 45,210,766 | |
| | 303,307 | | | International Paper Co. | | | 13,758,005 | |
| | | | | | | | |
| | | | | | | 58,968,771 | |
| | | | | | | | |
| |
| | | | Electronic Equipment, Instruments & Components — 4.9% | |
| | 757,548 | | | Amphenol Corp. — Class A | | | 67,800,546 | |
| | 807,749 | | | CDW Corp. | | | 72,705,487 | |
| | 196,954 | | | IPG Photonics Corp.1,2 | | | 26,303,207 | |
| | | | | | | | |
| | | | | | | 166,809,240 | |
| | | | | | | | |
| |
| | | | Energy Equipment & Services — 0.4% | |
| | 381,944 | | | Halliburton Co. | | | 13,245,818 | |
| | | | | | | | |
| |
| | | | Entertainment — 2.7% | |
| | 791,550 | | | Walt Disney Co. (The) | | | 90,893,687 | |
| | | | | | | | |
See Notes to Financial Statements.
THE GLENMEDE FUND, INC.
Quantitative U.S. Large Cap Growth Equity Portfolio
SCHEDULE OF PORTFOLIO INVESTMENTS — (Continued)
October 31, 2018
| | | | | | | | |
| Shares | | | | | Value | |
| |
| COMMON STOCKS* — (Continued) | | | |
| | | | Food Products — 0.6% | |
| | 180,719 | | | Hershey Co. (The) | | $ | 19,364,041 | |
| | | | | | | | |
| |
| | | | Health Care Providers & Services — 7.8% | |
| | 114,000 | | | Cigna Corp. | | | 24,374,340 | |
| | 289,558 | | | DaVita, Inc.1 | | | 19,498,836 | |
| | 305,228 | | | Henry Schein, Inc.1 | | | 25,333,924 | |
| | 291,015 | | | Humana, Inc. | | | 93,244,116 | |
| | 392,924 | | | UnitedHealth Group, Inc. | | | 102,690,687 | |
| | | | | | | | |
| | | | | | | 265,141,903 | |
| | | | | | | | |
| |
| | | | Hotels, Restaurants & Leisure — 2.4% | |
| | 219,550 | | | Hilton Worldwide Holdings, Inc. | | | 15,625,373 | |
| | 575,056 | | | Marriott International, Inc. — Class A | | | 67,218,296 | |
| | | | | | | | |
| | | | | | | 82,843,669 | |
| | | | | | | | |
| |
| | | | Household Durables — 0.6% | |
| | 562,147 | | | DR Horton, Inc. | | | 20,214,806 | |
| | | | | | | | |
| |
| | | | Household Products — 1.1% | |
| | 629,338 | | | Church & Dwight Co., Inc. | | | 37,363,797 | |
| | | | | | | | |
| |
| | | | Insurance — 1.4% | |
| | 669,255 | | | Progressive Corp. (The) | | | 46,647,074 | |
| | | | | | | | |
| |
| | | | Interactive Media & Services — 5.9% | |
| | 65,414 | | | Alphabet, Inc. — Class A1 | | | 71,339,200 | |
| | 518,459 | | | Facebook, Inc. — Class A1 | | | 78,696,892 | |
| | 267,168 | | | IAC/InterActiveCorp1 | | | 52,522,557 | |
| | | | | | | | |
| | | | | | | 202,558,649 | |
| | | | | | | | |
| |
| | | | Internet & Direct Marketing Retail — 0.6% | |
| | 654,070 | | | eBay, Inc.1 | | | 18,987,652 | |
| | | | | | | | |
| |
| | | | IT Services — 11.4% | |
| | 496,524 | | | Cognizant Technology Solutions Corp. — Class A | | | 34,275,052 | |
| | 210,788 | | | Fidelity National Information Services, Inc. | | | 21,943,031 | |
| | 203,632 | | | FleetCor Technologies, Inc.1 | | | 40,732,509 | |
| | 452,466 | | | Mastercard, Inc. — Class A | | | 89,438,954 | |
| | 1,052,705 | | | PayPal Holdings, Inc.1 | | | 88,627,234 | |
| | 159,815 | | | VeriSign, Inc.1 | | | 22,780,030 | |
| | 661,501 | | | Visa, Inc. — Class A | | | 91,187,913 | |
| | | | | | | | |
| | | | | | | 388,984,723 | |
| | | | | | | | |
| |
| | | | Life Sciences Tools & Services — 2.6% | |
| | 232,270 | | | Agilent Technologies, Inc. | | | 15,048,773 | |
| | 381,953 | | | Waters Corp.1 | | | 72,452,665 | |
| | | | | | | | |
| | | | | | | 87,501,438 | |
| | | | | | | | |
| |
| | | | Machinery — 3.4% | |
| | 395,158 | | | Fortive Corp. | | | 29,340,481 | |
| | 910,653 | | | Ingersoll-Rand PLC | | | 87,368,049 | |
| | | | | | | | |
| | | | | | | 116,708,530 | |
| | | | | | | | |
| |
| | | | Media — 2.0% | |
| | 935,026 | | | Omnicom Group, Inc. | | | 69,491,132 | |
| | | | | | | | |
| |
| | | | Multi-line Retail — 2.8% | |
| | 863,877 | | | Dollar General Corp. | | | 96,218,620 | |
| | | | | | | | |
| |
| | | | Professional Services — 0.7% | |
| | 371,336 | | | Robert Half International, Inc. | | | 22,476,968 | |
| | | | | | | | |
See Notes to Financial Statements.
THE GLENMEDE FUND, INC.
Quantitative U.S. Large Cap Growth Equity Portfolio
SCHEDULE OF PORTFOLIO INVESTMENTS — (Continued)
October 31, 2018
| | | | | | | | |
| Shares | | | | | Value | |
| |
| COMMON STOCKS* — (Continued) | | | |
| | | | Real Estate Management & Development — 1.9% | |
| | 1,608,394 | | | CBRE Group, Inc. — Class A1 | | $ | 64,802,194 | |
| | | | | | | | |
| |
| | | | Road & Rail — 0.8% | |
| | 175,473 | | | Union Pacific Corp. | | | 25,657,662 | |
| | | | | | | | |
| |
| | | | Semiconductors & Semiconductor Equipment — 4.7% | |
| | 1,391,704 | | | Applied Materials, Inc. | | | 45,759,228 | |
| | 479,112 | | | KLA-Tencor Corp. | | | 43,857,912 | |
| | 751,160 | | | Texas Instruments, Inc. | | | 69,730,183 | |
| | | | | | | | |
| | | | | | | 159,347,323 | |
| | | | | | | | |
| |
| | | | Software — 7.3% | |
| | 936,161 | | | Microsoft Corp. | | | 99,991,356 | |
| | 1,119,562 | | | Oracle Corp. | | | 54,679,408 | |
| | 656,281 | | | VMware, Inc. — Class A1 | | | 92,791,571 | |
| | | | | | | | |
| | | | | | | 247,462,335 | |
| | | | | | | | |
| |
| | | | Specialty Retail — 7.5% | |
| | 490,490 | | | Home Depot, Inc. (The) | | | 86,267,381 | |
| | 734,816 | | | Lowe’s Cos., Inc. | | | 69,969,180 | |
| | 632,873 | | | Ross Stores, Inc. | | | 62,654,427 | |
| | 347,444 | | | TJX Cos., Inc. (The) | | | 38,177,147 | |
| | | | | | | | |
| | | | | | | 257,068,135 | |
| | | | | | | | |
| |
| | | | Technology Hardware, Storage & Peripherals — 3.0% | |
| | 470,617 | | | Apple, Inc. | | | 102,999,236 | |
| | | | | | | | |
| | |
| | | | TOTAL COMMON STOCKS
(Cost $2,646,645,249) | | | 3,398,773,081 | |
| | | | | | | | |
| | |
Face
Amount | | | | | | |
| |
| REPURCHASE AGREEMENT* — 0.4% | | | |
| $ | 12,538,685 | | | With Fixed Income Clearing Corp., dated 10/31/18, 0.42%, principal and interest in the amount of $12,538,831, due 11/1/18, (collateralized by a U.S. Treasury Note with a par value of $12,935,000, coupon rate of 2.375%, due 4/15/2021, market value of $12,794,332) | | | 12,538,685 | |
| | | | | | | | |
| | |
| | | | TOTAL REPURCHASE AGREEMENT
(Cost $12,538,685) | | | 12,538,685 | |
| | | | | | | | |
| | |
| Shares | | | | | | |
| |
| INVESTMENT OF SECURITY LENDING COLLATERAL* — 0.2% | | | |
| | 7,850,227 | | | State Street Navigator Securities Lending Government Money Market Portfolio | | | 7,850,227 | |
| | | | | | | | |
| | |
| | | | TOTAL INVESTMENT OF SECURITY LENDING COLLATERAL
(Cost $7,850,227) | | | 7,850,227 | |
| | | | | | | | |
| | | | | | | | |
| | |
TOTAL INVESTMENTS
(Cost $2,667,034,161) | | | 100.4 | % | | $ | 3,419,161,993 | |
| | |
LIABILITIES IN EXCESS OF OTHER ASSETS | | | (0.4 | ) | | | (12,274,105 | ) |
| | | | | | | | |
| | |
NET ASSETS | | | 100.0 | % | | $ | 3,406,887,888 | |
| | | | | | | | |
| * | Percentages indicated are based on net assets. |
| 1 | Non income-producing security. |
| 2 | Securities or partial securities on loan. See Note 1. |
See Notes to Financial Statements.
THE GLENMEDE FUND, INC.
Quantitative U.S. Large Cap Growth Equity Portfolio
SCHEDULE OF PORTFOLIO INVESTMENTS — (Concluded)
October 31, 2018
INDUSTRY DIVERSIFICATION
On October 31, 2018, industry diversification of the Portfolio was as follows:
| | | | | | | | |
| | | % of
Net Assets | | | Value | |
|
| INDUSTRIES: | | | | | | |
IT Services | | | 11.4 | % | | $ | 388,984,723 | |
Health Care Providers & Services | | | 7.8 | | | | 265,141,903 | |
Specialty Retail | | | 7.5 | | | | 257,068,135 | |
Software | | | 7.3 | | | | 247,462,335 | |
Interactive Media & Services | | | 5.9 | | | | 202,558,649 | |
Biotechnology | | | 5.4 | | | | 183,262,871 | |
Electronic Equipment, Instruments & Components | | | 4.9 | | | | 166,809,240 | |
Semiconductors & Semiconductor Equipment | | | 4.7 | | | | 159,347,323 | |
Beverages | | | 3.6 | | | | 124,126,310 | |
Aerospace & Defense | | | 3.6 | | | | 121,944,593 | |
Machinery | | | 3.4 | | | | 116,708,530 | |
Technology Hardware, Storage & Peripherals | | | 3.0 | | | | 102,999,236 | |
Multi-line Retail | | | 2.8 | | | | 96,218,620 | |
Entertainment | | | 2.7 | | | | 90,893,687 | |
Life Sciences Tools & Services | | | 2.6 | | | | 87,501,438 | |
Hotels, Restaurants & Leisure | | | 2.4 | | | | 82,843,669 | |
Capital Markets | | | 2.2 | | | | 74,641,049 | |
Building Products | | | 2.1 | | | | 72,986,535 | |
Media | | | 2.0 | | | | 69,491,132 | |
Real Estate Management & Development | | | 1.9 | | | | 64,802,194 | |
Containers & Packaging | | | 1.7 | | | | 58,968,771 | |
Insurance | | | 1.4 | | | | 46,647,074 | |
Chemicals | | | 1.3 | | | | 42,857,010 | |
Communications Equipment | | | 1.2 | | | | 41,680,182 | |
Household Products | | | 1.1 | | | | 37,363,797 | |
Consumer Finance | | | 1.0 | | | | 34,847,879 | |
Airlines | | | 0.8 | | | | 26,653,886 | |
Road & Rail | | | 0.8 | | | | 25,657,662 | |
Professional Services | | | 0.7 | | | | 22,476,968 | |
Household Durables | | | 0.6 | | | | 20,214,806 | |
Food Products | | | 0.6 | | | | 19,364,041 | |
Internet & Direct Marketing Retail | | | 0.6 | | | | 18,987,652 | |
Banks | | | 0.4 | | | | 14,015,363 | |
Energy Equipment & Services | | | 0.4 | | | | 13,245,818 | |
| | | | | | | | |
TOTAL COMMON STOCKS | | | 99.8 | % | | $ | 3,398,773,081 | |
| | |
REPURCHASE AGREEMENT | | | 0.4 | | | | 12,538,685 | |
| | |
INVESTMENT OF SECURITY LENDING COLLATERAL | | | 0.2 | | | | 7,850,227 | |
| | | | | | | | |
TOTAL INVESTMENTS | | | 100.4 | % | | $ | 3,419,161,993 | |
| | | | | | | | |
See Notes to Financial Statements.
THE GLENMEDE FUND, INC.
Quantitative U.S. Large Cap Value Equity Portfolio
SCHEDULE OF PORTFOLIO INVESTMENTS
October 31, 2018
| | | | | | | | |
| Shares | | | | | Value | |
| |
| COMMON STOCKS* — 98.7% | | | |
| | | | Airlines — 0.5% | | | |
| | 99 | | | Delta Air Lines, Inc. | | $ | 5,418 | |
| | | | | | | | |
| | |
| | | | Banks — 11.9% | | | |
| | 930 | | | Bank of America Corp. | | | 25,575 | |
| | 329 | | | Citigroup, Inc. | | | 21,536 | |
| | 675 | | | Citizens Financial Group, Inc. | | | 25,211 | |
| | 252 | | | JPMorgan Chase & Co. | | | 27,473 | |
| | 276 | | | Regions Financial Corp. | | | 4,684 | |
| | 409 | | | SunTrust Banks, Inc. | | | 25,628 | |
| | | | | | | | |
| | | | | | | 130,107 | |
| | | | | | | | |
| | |
| | | | Biotechnology — 2.0% | | | |
| | 322 | | | Gilead Sciences, Inc. | | | 21,954 | |
| | | | | | | | |
| | |
| | | | Building Products — 1.3% | | | |
| | 181 | | | Fortune Brands Home & Security, Inc. | | | 8,114 | |
| | 221 | | | Masco Corp. | | | 6,630 | |
| | | | | | | | |
| | | | | | | 14,744 | |
| | | | | | | | |
| | |
| | | | Capital Markets — 2.9% | | | |
| | 158 | | | Ameriprise Financial, Inc. | | | 20,104 | |
| | 245 | | | Morgan Stanley | | | 11,187 | |
| | | | | | | | |
| | | | | | | 31,291 | |
| | | | | | | | |
| | |
| | | | Chemicals — 1.6% | | | |
| | 224 | | | Eastman Chemical Co. | | | 17,551 | |
| | | | | | | | |
| | |
| | | | Communications Equipment — 0.6% | | | |
| | 148 | | | Cisco Systems, Inc. | | | 6,771 | |
| | | | | | | | |
| | |
| | | | Consumer Finance — 3.9% | | | |
| | 648 | | | Ally Financial, Inc. | | | 16,466 | |
| | 248 | | | Discover Financial Services | | | 17,278 | |
| | 299 | | | Synchrony Financial | | | 8,635 | |
| | | | | | | | |
| | | | | | | 42,379 | |
| | | | | | | | |
| | |
| | | | Containers & Packaging — 1.7% | | | |
| | 426 | | | WestRock Co. | | | 18,305 | |
| | | | | | | | |
| | |
| | | | Diversified Telecommunication Services — 2.1% | | | |
| | 734 | | | AT&T, Inc. | | | 22,519 | |
| | | | | | | | |
| | |
| | | | Electric Utilities — 4.6% | | | |
| | 568 | | | Exelon Corp. | | | 24,884 | |
| | 669 | | | FirstEnergy Corp. | | | 24,941 | |
| | | | | | | | |
| | | | | | | 49,825 | |
| | | | | | | | |
| | |
| | | | Electrical Equipment — 1.6% | | | |
| | 251 | | | Eaton Corp. PLC | | | 17,989 | |
| | | | | | | | |
| | |
| | | | Entertainment — 1.6% | | | |
| | 148 | | | Walt Disney Co. (The) | | | 16,995 | |
| | | | | | | | |
| | |
| | | | Equity Real Estate Investment Trusts — 2.9% | | | |
| | 575 | | | Host Hotels & Resorts, Inc. | | | 10,989 | |
| | 186 | | | Park Hotels & Resorts, Inc. | | | 5,407 | |
| | 243 | | | Prologis, Inc. | | | 15,666 | |
| | | | | | | | |
| | | | | | | 32,062 | |
| | | | | | | | |
| | |
| | | | Food & Staples Retailing — 1.5% | | | |
| | 561 | | | Kroger Co. (The) | | | 16,695 | |
| | | | | | | | |
See Notes to Financial Statements.
THE GLENMEDE FUND, INC.
Quantitative U.S. Large Cap Value Equity Portfolio
SCHEDULE OF PORTFOLIO INVESTMENTS — (Continued)
October 31, 2018
| | | | | | | | |
| Shares | | | | | Value | |
| |
| COMMON STOCKS* — (Continued) | | | |
| | | | Food Products — 4.5% | |
| | 528 | | | General Mills, Inc. | | $ | 23,126 | |
| | 55 | | | Hershey Co. (The) | | | 5,893 | |
| | 75 | | | JM Smucker Co. (The) | | | 8,124 | |
| | 204 | | | Tyson Foods, Inc. — Class A | | | 12,224 | |
| | | | | | | | |
| | | | | | | 49,367 | |
| | | | | | | | |
| |
| | | | Health Care Providers & Services — 7.9% | |
| | 87 | | | Aetna, Inc. | | | 17,261 | |
| | 78 | | | Anthem, Inc. | | | 21,494 | |
| | 128 | | | Cardinal Health, Inc. | | | 6,477 | |
| | 58 | | | Centene Corp.1 | | | 7,559 | |
| | 132 | | | CVS Health Corp. | | | 9,556 | |
| | 119 | | | DaVita, Inc.1 | | | 8,013 | |
| | 87 | | | Express Scripts Holding Co.1 | | | 8,436 | |
| | 61 | | | McKesson Corp. | | | 7,610 | |
| | | | | | | | |
| | | | | | | 86,406 | |
| | | | | | | | |
| |
| | | | Hotels, Restaurants & Leisure — 0.9% | |
| | 135 | | | Hyatt Hotels Corp. — Class A | | | 9,342 | |
| | | | | | | | |
| |
| | | | Household Products — 2.1% | |
| | 256 | | | Procter & Gamble Co. (The) | | | 22,702 | |
| | | | | | | | |
| |
| | | | Independent Power & Renewable Electricity Producer — 1.3% | |
| | 981 | | | AES Corp. | | | 14,303 | |
| | | | | | | | |
| |
| | | | Insurance — 4.9% | |
| | 260 | | | Lincoln National Corp. | | | 15,649 | |
| | 245 | | | MetLife, Inc. | | | 10,092 | |
| | 411 | | | Old Republic International Corp. | | | 9,063 | |
| | 109 | | | Prudential Financial, Inc. | | | 10,222 | |
| | 227 | | | Unum Group | | | 8,231 | |
| | | | | | | | |
| | | | | | | 53,257 | |
| | | | | | | | |
| |
| | | | IT Services — 2.0% | |
| | 146 | | | Amdocs, Ltd. | | | 9,237 | |
| | 111 | | | International Business Machines Corp. | | | 12,813 | |
| | | | | | | | |
| | | | | | | 22,050 | |
| | | | | | | | |
| |
| | | | Machinery — 2.7% | |
| | 217 | | | Ingersoll-Rand PLC | | | 20,819 | |
| | 57 | | | Snap-on, Inc. | | | 8,775 | |
| | | | | | | | |
| | | | | | | 29,594 | |
| | | | | | | | |
| |
| | | | Media — 2.4% | |
| | 156 | | | Comcast Corp. — Class A | | | 5,950 | |
| | 470 | | | Discovery, Inc. — Class C1 | | | 13,776 | |
| | 80 | | | Omnicom Group, Inc. | | | 5,945 | |
| | | | | | | | |
| | | | | | | 25,671 | |
| | | | | | | | |
| |
| | | | Metals & Mining — 1.9% | |
| | 179 | | | Nucor Corp. | | | 10,582 | |
| | 266 | | | Steel Dynamics, Inc. | | | 10,534 | |
| | | | | | | | |
| | | | | | | 21,116 | |
| | | | | | | | |
| |
| | | | Multi-line Retail — 0.6% | |
| | 80 | | | Kohl’s Corp. | | | 6,058 | |
| | | | | | | | |
| |
| | | | Multi-Utilities — 1.6% | |
| | 184 | | | Ameren Corp. | | | 11,883 | |
See Notes to Financial Statements.
THE GLENMEDE FUND, INC.
Quantitative U.S. Large Cap Value Equity Portfolio
SCHEDULE OF PORTFOLIO INVESTMENTS — (Continued)
October 31, 2018
| | | | | | | | |
| Shares | | | | | Value | |
| |
| COMMON STOCKS* — (Continued) | | | |
| | | | Multi-Utilities — (Continued) | |
| | 203 | | | CenterPoint Energy, Inc. | | $ | 5,483 | |
| | | | | | | | |
| | | | | | | 17,366 | |
| | | | | | | | |
| |
| | | | Oil, Gas & Consumable Fuels — 9.6% | |
| | 66 | | | Chevron Corp. | | | 7,369 | |
| | 322 | | | ConocoPhillips | | | 22,508 | |
| | 250 | | | Exxon Mobil Corp. | | | 19,920 | |
| | 532 | | | Marathon Oil Corp. | | | 10,103 | |
| | 323 | | | Marathon Petroleum Corp. | | | 22,755 | |
| | 239 | | | Valero Energy Corp. | | | 21,770 | |
| | | | | | | | |
| | | | | | | 104,425 | |
| | | | | | | | |
| |
| | | | Pharmaceuticals — 5.6% | |
| | 123 | | | Allergan PLC | | | 19,435 | |
| | 226 | | | Merck & Co., Inc. | | | 16,636 | |
| | 586 | | | Pfizer, Inc. | | | 25,233 | |
| | | | | | | | |
| | | | | | | 61,304 | |
| | | | | | | | |
| |
| | | | Professional Services — 0.5% | |
| | 71 | | | ManpowerGroup, Inc. | | | 5,417 | |
| | | | | | | | |
| |
| | | | Real Estate Management & Development — 1.8% | |
| | 501 | | | CBRE Group, Inc. — Class A1 | | | 20,185 | |
| | | | | | | | |
| |
| | | | Semiconductors & Semiconductor Equipment — 4.5% | |
| | 549 | | | Intel Corp. | | | 25,737 | |
| | 193 | | | Micron Technology, Inc.1 | | | 7,280 | |
| | 214 | | | NXP Semiconductors N.V. | | | 16,048 | |
| | | | | | | | |
| | | | | | | 49,065 | |
| | | | | | | | |
| |
| | | | Specialty Retail — 1.1% | |
| | 174 | | | Best Buy Co., Inc. | | | 12,208 | |
| | | | | | | | |
| |
| | | | Technology Hardware, Storage & Peripherals — 2.1% | |
| | 234 | | | HP, Inc. | | | 5,649 | |
| | 402 | | | Western Digital Corp. | | | 17,314 | |
| | | | | | | | |
| | | | | | | 22,963 | |
| | | | | | | | |
| | |
| | | | TOTAL COMMON STOCKS
(Cost $1,081,994) | | | 1,077,404 | |
| | | | | | | | |
| | | | | | | | |
| | |
TOTAL INVESTMENTS
(Cost $1,081,994) | | | 98.7 | % | | $ | 1,077,404 | |
| | |
OTHER ASSETS IN EXCESS OF LIABILITIES | | | 1.3 | | | | 14,370 | |
| | | | | | | | |
| | |
NET ASSETS | | | 100.0 | % | | $ | 1,091,774 | |
| | | | | | | | |
| * | Percentages indicated are based on net assets. |
| 1 | Non income-producing security. |
See Notes to Financial Statements.
THE GLENMEDE FUND, INC.
Quantitative U.S. Large Cap Value Equity Portfolio
SCHEDULE OF PORTFOLIO INVESTMENTS — (Concluded)
October 31, 2018
INDUSTRY DIVERSIFICATION
On October 31, 2018, industry diversification of the Portfolio was as follows:
| | | | | | | | |
| | | % of
Net Assets | | | Value | |
|
| INDUSTRIES: | | | | | | |
Banks | | | 11.9 | % | | $ | 130,107 | |
Oil, Gas & Consumable Fuels | | | 9.6 | | | | 104,425 | |
Health Care Providers & Services | | | 7.9 | | | | 86,406 | |
Pharmaceuticals | | | 5.6 | | | | 61,304 | |
Insurance | | | 4.9 | | | | 53,257 | |
Electric Utilities | | | 4.6 | | | | 49,825 | |
Food Products | | | 4.5 | | | | 49,367 | |
Semiconductors & Semiconductor Equipment | | | 4.5 | | | | 49,065 | |
Consumer Finance | | | 3.9 | | | | 42,379 | |
Equity Real Estate Investment Trusts | | | 2.9 | | | | 32,062 | |
Capital Markets | | | 2.9 | | | | 31,291 | |
Machinery | | | 2.7 | | | | 29,594 | |
Media | | | 2.4 | | | | 25,671 | |
Technology Hardware, Storage & Peripherals | | | 2.1 | | | | 22,963 | |
Household Products | | | 2.1 | | | | 22,702 | |
Diversified Telecommunication Services | | | 2.1 | | | | 22,519 | |
IT Services | | | 2.0 | | | | 22,050 | |
Biotechnology | | | 2.0 | | | | 21,954 | |
Metals & Mining | | | 1.9 | | | | 21,116 | |
Real Estate Management & Development | | | 1.8 | | | | 20,185 | |
Containers & Packaging | | | 1.7 | | | | 18,305 | |
Electrical Equipment | | | 1.6 | | | | 17,989 | |
Chemicals | | | 1.6 | | | | 17,551 | |
Multi-Utilities | | | 1.6 | | | | 17,366 | |
Entertainment | | | 1.6 | | | | 16,995 | |
Food & Staples Retailing | | | 1.5 | | | | 16,695 | |
Building Products | | | 1.3 | | | | 14,744 | |
Independent Power & Renewable Electricity Producer | | | 1.3 | | | | 14,303 | |
Specialty Retail | | | 1.1 | | | | 12,208 | |
Hotels, Restaurants & Leisure | | | 0.9 | | | | 9,342 | |
Communications Equipment | | | 0.6 | | | | 6,771 | |
Multi-line Retail | | | 0.6 | | | | 6,058 | |
Airlines | | | 0.5 | | | | 5,418 | |
Professional Services | | | 0.5 | | | | 5,417 | |
| | | | | | | | |
TOTAL COMMON STOCKS | | | 98.7 | % | | $ | 1,077,404 | |
| | | | | | | | |
TOTAL INVESTMENTS | | | 98.7 | % | | $ | 1,077,404 | |
| | | | | | | | |
See Notes to Financial Statements.
THE GLENMEDE FUND, INC.
Quantitative U.S. Small Cap Equity Portfolio
SCHEDULE OF PORTFOLIO INVESTMENTS
October 31, 2018
| | | | | | | | |
| Shares | | | | | Value | |
| |
| COMMON STOCKS* — 98.6% | | | |
| | | | Banks — 8.9% | | | |
| | 256 | | | BancorpSouth Bank | | $ | 7,347 | |
| | 199 | | | Cathay General Bancorp | | | 7,496 | |
| | 178 | | | Community Trust Bancorp, Inc. | | | 8,101 | |
| | 181 | | | Eagle Bancorp, Inc.1 | | | 8,900 | |
| | 300 | | | Financial Institutions, Inc. | | | 8,565 | |
| | 300 | | | First Financial Bancorp | | | 7,851 | |
| | 212 | | | Great Western Bancorp, Inc. | | | 7,770 | |
| | 238 | | | NBT Bancorp, Inc. | | | 8,685 | |
| | 249 | | | Peapack Gladstone Financial Corp. | | | 6,721 | |
| | 249 | | | Peoples Bancorp, Inc. | | | 8,523 | |
| | 198 | | | Sandy Spring Bancorp, Inc. | | | 7,039 | |
| | 278 | | | Trustmark Corp. | | | 8,562 | |
| | | | | | | | |
| | | | | | | 95,560 | |
| | | | | | | | |
| | |
| | | | Biotechnology — 5.9% | | | |
| | 366 | | | Acorda Therapeutics, Inc.1 | | | 6,994 | |
| | 404 | | | Concert Pharmaceuticals, Inc.1 | | | 6,028 | |
| | 168 | | | Genomic Health, Inc.1 | | | 12,047 | |
| | 157 | | | Heron Therapeutics, Inc.1,2 | | | 4,359 | |
| | 243 | | | Myriad Genetics, Inc.1 | | | 10,942 | |
| | 188 | | | Spark Therapeutics, Inc.1,2 | | | 8,458 | |
| | 400 | | | Spectrum Pharmaceuticals, Inc.1 | | | 4,760 | |
| | 538 | | | Vanda Pharmaceuticals, Inc.1 | | | 10,206 | |
| | | | | | | | |
| | | | | | | 63,794 | |
| | | | | | | | |
| | |
| | | | Building Products — 1.7% | | | |
| | 126 | | | Continental Building Products, Inc.1 | | | 3,504 | |
| | 260 | | | Gibraltar Industries, Inc.1 | | | 9,266 | |
| | 291 | | | PGT Innovations, Inc.1 | | | 5,896 | |
| | | | | | | | |
| | | | | | | 18,666 | |
| | | | | | | | |
| | |
| | | | Capital Markets — 2.2% | | | |
| | 96 | | | Evercore, Inc. — Class A | | | 7,842 | |
| | 299 | | | Federated Investors, Inc. — Class B | | | 7,377 | |
| | 416 | | | Waddell & Reed Financial, Inc. — Class A | | | 7,933 | |
| | | | | | | | |
| | | | | | | 23,152 | |
| | | | | | | | |
| | |
| | | | Chemicals — 1.8% | | | |
| | 109 | | | Minerals Technologies, Inc. | | | 5,968 | |
| | 168 | | | PolyOne Corp. | | | 5,428 | |
| | 145 | | | Trinseo SA. | | | 7,812 | |
| | | | | | | | |
| | | | | | | 19,208 | |
| | | | | | | | |
| | |
| | | | Commercial Services & Supplies — 2.3% | | | |
| | 627 | | | ACCO Brands Corp. | | | 5,060 | |
| | 421 | | | Heritage-Crystal Clean, Inc.1 | | | 9,679 | |
| | 158 | | | Tetra Tech, Inc. | | | 10,434 | |
| | | | | | | | |
| | | | | | | 25,173 | |
| | | | | | | | |
| | |
| | | | Communications Equipment — 1.5% | | | |
| | 364 | | | CalAmp Corp.1 | | | 7,258 | |
| | 158 | | | NETGEAR, Inc.1 | | | 8,766 | |
| | | | | | | | |
| | | | | | | 16,024 | |
| | | | | | | | |
| | |
| | | | Diversified Consumer Services — 3.3% | | | |
| | 180 | | | American Public Education, Inc.1 | | | 5,891 | |
| | 629 | | | K12, Inc.1 | | | 13,467 | |
| | 618 | | | Laureate Education, Inc. — Class A1 | | | 9,202 | |
See Notes to Financial Statements.
THE GLENMEDE FUND, INC.
Quantitative U.S. Small Cap Equity Portfolio
SCHEDULE OF PORTFOLIO INVESTMENTS — (Continued)
October 31, 2018
| | | | | | | | |
| Shares | | | | | Value | |
| |
| COMMON STOCKS* — (Continued) | | | |
| | | | Diversified Consumer Services — (Continued) | | | |
| | 164 | | | Sotheby’s1,2 | | $ | 6,888 | |
| | | | | | | | |
| | | | | | | 35,448 | |
| | | | | | | | |
| | |
| | | | Electric Utilities — 1.6% | | | |
| | 124 | | | ALLETE, Inc. | | | 9,176 | |
| | 169 | | | Otter Tail Corp. | | | 7,617 | |
| | | | | | | | |
| | | | | | | 16,793 | |
| | | | | | | | |
| | |
| | | | Electrical Equipment — 1.6% | | | |
| | 413 | | | Atkore International Group, Inc.1 | | | 7,954 | |
| | 119 | | | EnerSys | | | 9,469 | |
| | | | | | | | |
| | | | | | | 17,423 | |
| | | | | | | | |
| | |
| | | | Electronic Equipment, Instruments & Components — 2.8% | | | |
| | 266 | | | Fabrinet1 | | | 11,523 | |
| | 202 | | | Insight Enterprises, Inc.1 | | | 10,441 | |
| | 439 | | | Vishay Intertechnology, Inc. | | | 8,034 | |
| | | | | | | | |
| | | | | | | 29,998 | |
| | | | | | | | |
| | |
| | | | Energy Equipment & Services — 1.8% | | | |
| | 541 | | | Keane Group, Inc.1 | | | 6,800 | |
| | 56 | | | KLX Energy Services Holdings, Inc.1 | | | 1,618 | |
| | 517 | | | Matrix Service Co.1 | | | 10,511 | |
| | | | | | | | |
| | | | | | | 18,929 | |
| | | | | | | | |
| | |
| | | | Equity Real Estate Investment Trusts — 5.8% | | | |
| | 288 | | | Chesapeake Lodging Trust | | | 8,464 | |
| | 377 | | | City Office REIT, Inc. | | | 4,155 | |
| | 708 | | | DiamondRock Hospitality Co. | | | 7,399 | |
| | 104 | | | EastGroup Properties, Inc. | | | 9,962 | |
| | 246 | | | First Industrial Realty Trust, Inc. | | | 7,552 | |
| | 200 | | | GEO Group, Inc. (The) | | | 4,422 | |
| | 281 | | | LaSalle Hotel Properties | | | 9,276 | |
| | 221 | | | Pebblebrook Hotel Trust2 | | | 7,450 | |
| | 288 | | | Sunstone Hotel Investors, Inc. | | | 4,167 | |
| | | | | | | | |
| | | | | | | 62,847 | |
| | | | | | | | |
| | |
| | | | Food & Staples Retailing — 1.4% | | | |
| | 279 | | | Performance Food Group Co.1 | | | 8,180 | |
| | 204 | | | SpartanNash Co. | | | 3,642 | |
| | 156 | | | United Natural Foods, Inc.1 | | | 3,390 | |
| | | | | | | | |
| | | | | | | 15,212 | |
| | | | | | | | |
| | |
| | | | Food Products — 0.9% | | | |
| | 120 | | | Cal-Maine Foods, Inc. | | | 5,840 | |
| | 400 | | | Hostess Brands, Inc.1 | | | 4,160 | |
| | | | | | | | |
| | | | | | | 10,000 | |
| | | | | | | | |
| | |
| | | | Gas Utilities — 0.9% | | | |
| | 316 | | | South Jersey Industries, Inc.2 | | | 9,335 | |
| | | | | | | | |
| | |
| | | | Health Care Equipment & Supplies — 4.4% | | | |
| | 498 | | | AngioDynamics, Inc.1 | | | 10,174 | |
| | 168 | | | Avanos Medical, Inc.1 | | | 9,509 | |
| | 139 | | | Haemonetics Corp.1 | | | 14,522 | |
| | 75 | | | Integer Holdings Corp.1 | | | 5,585 | |
| | 548 | | | OraSure Technologies, Inc.1 | | | 7,617 | |
| | | | | | | | |
| | | | | | | 47,407 | |
| | | | | | | | |
See Notes to Financial Statements.
THE GLENMEDE FUND, INC.
Quantitative U.S. Small Cap Equity Portfolio
SCHEDULE OF PORTFOLIO INVESTMENTS — (Continued)
October 31, 2018
| | | | | | | | |
| Shares | | | | | Value | |
| |
| COMMON STOCKS* — (Continued) | | | |
| | | | Health Care Providers & Services — 3.1% | | | |
| | 117 | | | LHC Group, Inc.1 | | $ | 10,697 | |
| | 124 | | | Magellan Health, Inc.1 | | | 8,068 | |
| | 269 | | | Tenet Healthcare Corp.1 | | | 6,921 | |
| | 231 | | | Tivity Health, Inc.1,2 | | | 7,949 | |
| | | | | | | | |
| | | | | | | 33,635 | |
| | | | | | | | |
| | |
| | | | Hotels, Restaurants & Leisure — 1.0% | | | |
| | 45 | | | Marriott Vacations Worldwide Corp. | | | 3,982 | |
| | 281 | | | Penn National Gaming, Inc.1 | | | 6,823 | |
| | | | | | | | |
| | | | | | | 10,805 | |
| | | | | | | | |
| | |
| | | | Household Products — 1.0% | | | |
| | 221 | | | Central Garden & Pet Co.1,2 | | | 7,178 | |
| | 119 | | | Central Garden & Pet Co. — Class A1 | | | 3,528 | |
| | | | | | | | |
| | | | | | | 10,706 | |
| | | | | | | | |
| | |
| | | | Independent Power & Renewable Electricity Producer — 0.7% | | | |
| | 370 | | | Clearway Energy, Inc. — Class C | | | 7,256 | |
| | | | | | | | |
| | |
| | | | Insurance — 3.5% | | | |
| | 467 | | | Ambac Financial Group, Inc.1 | | | 9,611 | |
| | 278 | | | American Equity Investment Life Holding Co. | | | 8,679 | |
| | 441 | | | CNO Financial Group, Inc. | | | 8,335 | |
| | 231 | | | Employers Holdings, Inc. | | | 10,617 | |
| | | | | | | | |
| | | | | | | 37,242 | |
| | | | | | | | |
| | |
| | | | Interactive Media & Service — 0.6% | | | |
| | 367 | | | Care.com, Inc.1 | | | 6,459 | |
| | | | | | | | |
| | |
| | | | IT Services — 4.7% | | | |
| | 470 | | | Cardtronics PLC — Class A1 | | | 12,765 | |
| | 522 | | | Hackett Group, Inc. (The) | | | 10,685 | |
| | 163 | | | ManTech International Corp. — Class A | | | 9,337 | |
| | 280 | | | Sykes Enterprises, Inc.1 | | | 8,588 | |
| | 593 | | | Travelport Worldwide, Ltd. | | | 8,871 | |
| | | | | | | | |
| | | | | | | 50,246 | |
| | | | | | | | |
| | |
| | | | Life Sciences Tools & Services — 1.7% | | | |
| | 141 | | | Cambrex Corp.1 | | | 7,514 | |
| | 377 | | | Luminex Corp. | | | 10,846 | |
| | | | | | | | |
| | | | | | | 18,360 | |
| | | | | | | | |
| | |
| | | | Machinery — 3.6% | | | |
| | 151 | | | Hillenbrand, Inc. | | | 7,233 | |
| | 332 | | | Rexnord Corp.1 | | | 8,901 | |
| | 265 | | | SPX Corp.1 | | | 7,770 | |
| | 192 | | | SPX FLOW, Inc.1 | | | 6,572 | |
| | 110 | | | Watts Water Technologies, Inc. — Class A | | | 7,705 | |
| | | | | | | | |
| | | | | | | 38,181 | |
| | | | | | | | |
| | |
| | | | Media — 1.9% | | | |
| | 912 | | | Gannett Co., Inc.2 | | | 8,846 | |
| | 297 | | | Gray Television, Inc.1 | | | 5,141 | |
| | 759 | | | National CineMedia, Inc. | | | 6,793 | |
| | | | | | | | |
| | | | | | | 20,780 | |
| | | | | | | | |
| | |
| | | | Metals & Mining — 1.8% | | | |
| | 80 | | | Kaiser Aluminum Corp. | | | 7,630 | |
| | 135 | | | Schnitzer Steel Industries, Inc. — Class A | | | 3,632 | |
See Notes to Financial Statements.
THE GLENMEDE FUND, INC.
Quantitative U.S. Small Cap Equity Portfolio
SCHEDULE OF PORTFOLIO INVESTMENTS — (Continued)
October 31, 2018
| | | | | | | | |
| Shares | | | | | Value | |
| |
| COMMON STOCKS* — (Continued) | | | |
| | | | Metals & Mining — (Continued) | | | |
| | 196 | | | Worthington Industries, Inc. | | $ | 8,208 | |
| | | | | | | | |
| | | | | | | 19,470 | |
| | | | | | | | |
| | |
| | | | Mortgage Real Estate Investment Trusts — 1.0% | | | |
| | 395 | | | Arbor Realty Trust, Inc.2 | | | 4,772 | |
| | 304 | | | PennyMac Mortgage Investment Trust | | | 5,870 | |
| | | | | | | | |
| | | | | | | 10,642 | |
| | | | | | | | |
| | |
| | | | Multi-Utilities — 0.9% | | | |
| | 166 | | | Black Hills Corp. | | | 9,877 | |
| | | | | | | | |
| | |
| | | | Oil, Gas & Consumable Fuels — 3.1% | | | |
| | 249 | | | Delek US Holdings, Inc. | | | 9,143 | |
| | 1,742 | | | Southwestern Energy Co.1 | | | 9,303 | |
| | 461 | | | World Fuel Services Corp. | | | 14,752 | |
| | | | | | | | |
| | | | | | | 33,198 | |
| | | | | | | | |
| | |
| | | | Paper & Forest Products — 1.4% | | | |
| | 269 | | | Boise Cascade Co. | | | 8,282 | |
| | 296 | | | Louisiana-Pacific Corp. | | | 6,444 | |
| | | | | | | | |
| | | | | | | 14,726 | |
| | | | | | | | |
| | |
| | | | Pharmaceuticals — 1.6% | | | |
| | 583 | | | Horizon Pharma PLC1 | | | 10,617 | |
| | 252 | | | Mallinckrodt PLC1 | | | 6,315 | |
| | | | | | | | |
| | | | | | | 16,932 | |
| | | | | | | | |
| | |
| | | | Professional Services — 1.4% | | | |
| | 150 | | | FTI Consulting, Inc.1 | | | 10,366 | |
| | 100 | | | Korn/Ferry International | | | 4,514 | |
| | | | | | | | |
| | | | | | | 14,880 | |
| | | | | | | | |
| | |
| | | | Real Estate Management & Development — 1.0% | | | |
| | 138 | | | RMR Group, Inc. (The) — Class A | | | 10,471 | |
| | | | | | | | |
| | |
| | | | Road & Rail — 0.7% | | | |
| | 199 | | | ArcBest Corp. | | | 7,387 | |
| | | | | | | | |
| | |
| | | | Semiconductors & Semiconductor Equipment — 3.0% | | | |
| | 80 | | | Cabot Microelectronics Corp. | | | 7,809 | |
| | 256 | | | Diodes, Inc.1 | | | 7,729 | |
| | 300 | | | Nanometrics, Inc.1 | | | 9,618 | |
| | 270 | | | SMART Global Holdings, Inc.1,2 | | | 7,563 | |
| | | | | | | | |
| | | | | | | 32,719 | |
| | | | | | | | |
| | |
| | | | Software — 2.0% | | | |
| | 217 | | | Verint Systems, Inc.1 | | | 9,910 | |
| | 1,729 | | | Zix Corp.1 | | | 11,654 | |
| | | | | | | | |
| | | | | | | 21,564 | |
| | | | | | | | |
| | |
| | | | Specialty Retail — 3.4% | | | |
| | 121 | | | Asbury Automotive Group, Inc.1 | | | 7,877 | |
| | 280 | | | Caleres, Inc. | | | 9,576 | |
| | 741 | | | Party City Holdco, Inc.1,2 | | | 7,758 | |
| | 518 | | | Tailored Brands, Inc. | | | 10,883 | |
| | | | | | | | |
| | | | | | | 36,094 | |
| | | | | | | | |
| | |
| | | | Textiles, Apparel & Luxury Goods — 2.3% | | | |
| | 110 | | | Deckers Outdoor Corp.1 | | | 13,989 | |
See Notes to Financial Statements.
THE GLENMEDE FUND, INC.
Quantitative U.S. Small Cap Equity Portfolio
SCHEDULE OF PORTFOLIO INVESTMENTS — (Continued)
October 31, 2018
| | | | | | | | |
| Shares | | | | | Value | |
| |
| COMMON STOCKS* — (Continued) | | | |
| | | | Textiles, Apparel & Luxury Goods — (Continued) | | | |
| | 290 | | | Movado Group, Inc. | | $ | 11,168 | |
| | | | | | | | |
| | | | | | | 25,157 | |
| | | | | | | | |
| | |
| | | | Thrifts & Mortgage Finance — 2.6% | | | |
| | 531 | | | Northwest Bancshares, Inc. | | | 8,570 | |
| | 569 | | | Radian Group, Inc. | | | 10,919 | |
| | 144 | | | Washington Federal, Inc. | | | 4,055 | |
| | 100 | | | WSFS Financial Corp. | | | 4,253 | |
| | | | | | | | |
| | | | | | | 27,797 | |
| | | | | | | | |
| | |
| | | | Trading Companies & Distributors — 1.3% | | | |
| | 400 | | | BMC Stock Holdings, Inc.1 | | | 6,696 | |
| | 210 | | | Rush Enterprises, Inc. — Class A | | | 7,432 | |
| | | | | | | | |
| | | | | | | 14,128 | |
| | | | | | | | |
| | |
| | | | Wireless Telecommunication Services — 0.5% | | | |
| | 141 | | | Shenandoah Telecommunications Co. | | | 5,361 | |
| | | | | | | | |
| | |
| | | | TOTAL COMMON STOCKS
(Cost $1,031,937) | | | 1,059,042 | |
| | | | | | | | |
| |
| INVESTMENT OF SECURITY LENDING COLLATERAL* — 2.1% | | | |
| | 22,309 | | | State Street Navigator Securities Lending Government Money Market Portfolio | | | 22,309 | |
| | | | | | | | |
| | |
| | | | TOTAL INVESTMENT OF SECURITY LENDING COLLATERAL
(Cost $22,309) | | | 22,309 | |
| | | | | | | | |
| | | | | | | | |
| | |
TOTAL INVESTMENTS
(Cost $1,054,246) | | | 100.7 | % | | $ | 1,081,351 | |
| | |
LIABILITIES IN EXCESS OF OTHER ASSETS | | | (0.7 | ) | | | (7,797 | ) |
| | | | | | | | |
| | |
NET ASSETS | | | 100.0 | % | | $ | 1,073,554 | |
| | | | | | | | |
| * | Percentages indicated are based on net assets. |
| 1 | Non income-producing security. |
| 2 | Securities or partial securities on loan. See Note 1. |
See Notes to Financial Statements.
THE GLENMEDE FUND, INC.
Quantitative U.S. Small Cap Equity Portfolio
SCHEDULE OF PORTFOLIO INVESTMENTS — (Concluded)
October 31, 2018
INDUSTRY DIVERSIFICATION
On October 31, 2018, industry diversification of the Portfolio was as follows:
| | | | | | | | |
| | | % of
Net Assets | | | Value | |
| INDUSTRIES: | | | | | | |
Banks | | | 8.9 | % | | $ | 95,560 | |
Biotechnology | | | 5.9 | | | | 63,794 | |
Equity Real Estate Investment Trusts | | | 5.8 | | | | 62,847 | |
IT Services | | | 4.7 | | | | 50,246 | |
Health Care Equipment & Supplies | | | 4.4 | | | | 47,407 | |
Machinery | | | 3.6 | | | | 38,181 | |
Insurance | | | 3.5 | | | | 37,242 | |
Specialty Retail | | | 3.4 | | | | 36,094 | |
Diversified Consumer Services | | | 3.3 | | | | 35,448 | |
Health Care Providers & Services | | | 3.1 | | | | 33,635 | |
Oil, Gas & Consumable Fuels | | | 3.1 | | | | 33,198 | |
Semiconductors & Semiconductor Equipment | | | 3.0 | | | | 32,719 | |
Electronic Equipment, Instruments & Components | | | 2.8 | | | | 29,998 | |
Thrifts & Mortgage Finance | | | 2.6 | | | | 27,797 | |
Commercial Services & Supplies | | | 2.3 | | | | 25,173 | |
Textiles, Apparel & Luxury Goods | | | 2.3 | | | | 25,157 | |
Capital Markets | | | 2.2 | | | | 23,152 | |
Software | | | 2.0 | | | | 21,564 | |
Media | | | 1.9 | | | | 20,780 | |
Metals & Mining | | | 1.8 | | | | 19,470 | |
Chemicals | | | 1.8 | | | | 19,208 | |
Energy Equipment & Services | | | 1.8 | | | | 18,929 | |
Building Products | | | 1.7 | | | | 18,666 | |
Life Sciences Tools & Services | | | 1.7 | | | | 18,360 | |
Electrical Equipment | | | 1.6 | | | | 17,423 | |
Pharmaceuticals | | | 1.6 | | | | 16,932 | |
Electric Utilities | | | 1.6 | | | | 16,793 | |
Communications Equipment | | | 1.5 | | | | 16,024 | |
Food & Staples Retailing | | | 1.4 | | | | 15,212 | |
Professional Services | | | 1.4 | | | | 14,880 | |
Paper & Forest Products | | | 1.4 | | | | 14,726 | |
Trading Companies & Distributors | | | 1.3 | | | | 14,128 | |
Hotels, Restaurants & Leisure | | | 1.0 | | | | 10,805 | |
Household Products | | | 1.0 | | | | 10,706 | |
Mortgage Real Estate Investment Trusts | | | 1.0 | | | | 10,642 | |
Real Estate Management & Development | | | 1.0 | | | | 10,471 | |
Food Products | | | 0.9 | | | | 10,000 | |
Multi-Utilities | | | 0.9 | | | | 9,877 | |
Gas Utilities | | | 0.9 | | | | 9,335 | |
Road & Rail | | | 0.7 | | | | 7,387 | |
Independent Power & Renewable Electricity Producer | | | 0.7 | | | | 7,256 | |
Interactive Media & Service | | | 0.6 | | | | 6,459 | |
Wireless Telecommunication Services | | | 0.5 | | | | 5,361 | |
| | | | | | | | |
TOTAL COMMON STOCKS | | | 98.6 | % | | $ | 1,059,042 | |
| | |
INVESTMENT OF SECURITY LENDING COLLATERAL | | | 2.1 | | | | 22,309 | |
| | | | | | | | |
TOTAL INVESTMENTS | | | 100.7 | % | | $ | 1,081,351 | |
| | | | | | | | |
See Notes to Financial Statements.
THE GLENMEDE FUND, INC.
Quantitative International Equity Portfolio
SCHEDULE OF PORTFOLIO INVESTMENTS
October 31, 2018
| | | | | | | | |
| Shares | | | | | Value | |
| |
| COMMON STOCKS* — 99.7% | | | |
| | | | Japan — 26.1% | | | |
| | 523,817 | | | Astellas Pharma, Inc., Unsponsored ADR1 | | $ | 8,072,020 | |
| | 69,181 | | | Canon, Inc., Sponsored ADR1 | | | 1,949,521 | |
| | 190,155 | | | Daito Trust Construction Co., Ltd., Sponsored ADR1 | | | 6,250,395 | |
| | 176,260 | | | FUJIFILM Holdings Corp., Unsponsored ADR1 | | | 7,596,806 | |
| | 180,962 | | | Fujitsu, Ltd., Unsponsored ADR1 | | | 2,186,926 | |
| | 120,476 | | | Hoya Corp., Sponsored ADR | | | 6,843,037 | |
| | 240,652 | | | ITOCHU Corp., Unsponsored ADR1 | | | 8,944,072 | |
| | 190,048 | | | Japan Tobacco, Inc., Unsponsored ADR1 | | | 2,427,863 | |
| | 143,285 | | | Kajima Corp., Unsponsored ADR | | | 1,839,063 | |
| | 425,618 | | | KDDI Corp., Unsponsored ADR1 | | | 4,977,603 | |
| | 278,211 | | | Kirin Holdings Co., Ltd., Sponsored ADR | | | 6,615,858 | |
| | 53,350 | | | Mitsubishi Corp., Sponsored ADR | | | 3,027,879 | |
| | 133,694 | | | Nippon Telegraph & Telephone Corp., ADR | | | 5,414,607 | |
| | 65,345 | | | Omron Corp., Sponsored ADR1 | | | 2,642,552 | |
| | 180,748 | | | Sony Corp., Sponsored ADR | | | 9,783,889 | |
| | 145,693 | | | Suntory Beverage & Food, Ltd., Unsponsored ADR | | | 2,940,813 | |
| | 38,585 | | | Suzuki Motor Corp., Unsponsored ADR1 | | | 7,711,019 | |
| | 352,462 | | | Takeda Pharmaceutical Co., Ltd., Sponsored ADR1 | | | 7,436,948 | |
| | 46,746 | | | Tokio Marine Holdings, Inc., ADR1 | | | 2,212,254 | |
| | 60,400 | | | Tokyo Electron, Ltd., Unsponsored ADR1 | | | 2,038,500 | |
| | | | | | | | |
| | | | | | | 100,911,625 | |
| | | | | | | | |
| | |
| | | | United Kingdom — 15.2% | | | |
| | 64,088 | | | Ashtead Group PLC, Unsponsored ADR | | | 6,378,743 | |
| | 72,310 | | | BAE Systems PLC, Sponsored ADR | | | 1,948,754 | |
| | 222,897 | | | Barclays PLC, Sponsored ADR | | | 1,959,265 | |
| | 200,000 | | | British Land Co. PLC (The), Sponsored ADR1 | | | 1,548,000 | |
| | 383,365 | | | Centrica PLC, Sponsored ADR1 | | | 2,919,324 | |
| | 37,186 | | | Diageo PLC, Sponsored ADR | | | 5,137,618 | |
| | 529,839 | | | J Sainsbury PLC, Sponsored ADR1 | | | 8,485,372 | |
| | 368,528 | | | Legal & General Group PLC, Sponsored ADR1 | | | 5,907,504 | |
| | 440,665 | | | Pearson PLC, Sponsored ADR1 | | | 5,023,581 | |
| | 183,738 | | | Reckitt Benckiser Group PLC, Sponsored ADR | | | 2,977,474 | |
| | 173,489 | | | Smith & Nephew PLC, Sponsored ADR | | | 5,704,318 | |
| | 396,467 | | | Smiths Group PLC, Sponsored ADR | | | 7,078,918 | |
| | 103,290 | | | Vodafone Group PLC, Sponsored ADR | | | 1,955,280 | |
| | 29,541 | | | WPP PLC, Sponsored ADR1 | | | 1,666,408 | |
| | | | | | | | |
| | | | | | | 58,690,559 | |
| | | | | | | | |
| | |
| | | | Germany — 10.6% | | | |
| | 17,653 | | | adidas AG, Sponsored ADR | | | 2,081,112 | |
| | 287,995 | | | Allianz SE, Sponsored ADR | | | 5,984,536 | |
| | 97,826 | | | BASF SE, Sponsored ADR | | | 1,878,259 | |
| | 284,240 | | | Bayer AG, Sponsored ADR | | | 5,454,566 | |
| | 295,182 | | | Continental AG, Sponsored ADR | | | 4,873,455 | |
| | 485,252 | | | Deutsche Boerse AG, Unsponsored ADR | | | 6,106,896 | |
| | 308,158 | | | Deutsche Lufthansa AG, Sponsored ADR | | | 6,192,435 | |
| | 113,208 | | | HeidelbergCement AG, Unsponsored ADR | | | 1,532,836 | |
| | 98,166 | | | Infineon Technologies AG, ADR | | | 1,979,027 | |
| | 223,752 | | | Muenchener Rueckversicherungs-Gesellschaft AG, Unsponsored ADR | | | 4,796,124 | |
| | | | | | | | |
| | | | | | | 40,879,246 | |
| | | | | | | | |
| | |
| | | | France — 10.1% | | | |
| | 79,807 | | | Arkema SA, Sponsored ADR | | | 8,327,461 | |
| | 98,597 | | | Atos SE, Unsponsored ADR1 | | | 1,681,572 | |
| | 683,853 | | | Cie de Saint-Gobain, Unsponsored ADR1 | | | 5,118,640 | |
| | 101,928 | | | Cie Generale des Etablissements Michelin SCA, Unsponsored ADR | | | 2,079,331 | |
| | 140,657 | | | Danone SA, Sponsored ADR | | | 1,990,296 | |
See Notes to Financial Statements.
THE GLENMEDE FUND, INC.
Quantitative International Equity Portfolio
SCHEDULE OF PORTFOLIO INVESTMENTS — (Continued)
October 31, 2018
| | | | | | | | |
| Shares | | | | | Value | |
| |
| COMMON STOCKS* — (Continued) | | | |
| | | | France — (Continued) | | | |
| | 299,348 | | | Engie SA, Sponsored ADR | | $ | 3,967,858 | |
| | 46,084 | | | L’Oreal SA, Unsponsored ADR | | | 2,073,780 | |
| | 144,367 | | | Renault SA, Unsponsored ADR1 | | | 2,158,287 | |
| | 796,904 | | | Societe Generale SA, Sponsored ADR | | | 5,817,399 | |
| | 103,426 | | | Total SA, Sponsored ADR | | | 6,060,764 | |
| | | | | | | | |
| | | | | | | 39,275,388 | |
| | | | | | | | |
| | |
| | | | Australia — 7.3% | | | |
| | 326,857 | | | Australia & New Zealand Banking Group, Ltd., Sponsored ADR1 | | | 6,012,534 | |
| | 65,524 | | | BHP Billiton PLC, ADR | | | 2,637,341 | |
| | 73,547 | | | Macquarie Group, Ltd., ADR1 | | | 6,119,110 | |
| | 610,112 | | | South32, Ltd., ADR | | | 7,864,344 | |
| | 303,048 | | | Westpac Banking Corp., Sponsored ADR1 | | | 5,736,699 | |
| | | | | | | | |
| | | | | | | 28,370,028 | |
| | | | | | | | |
| | |
| | | | Switzerland — 6.7% | | | |
| | 90,384 | | | ABB, Ltd., Sponsored ADR | | | 1,813,103 | |
| | 148,306 | | | Adecco Group AG, Unsponsored ADR1 | | | 3,620,149 | |
| | 25,412 | | | Novartis AG, Sponsored ADR | | | 2,222,533 | |
| | 240,271 | | | Roche Holding AG, Sponsored ADR | | | 7,294,628 | |
| | 231,936 | | | Swatch Group AG (The), Unsponsored ADR1 | | | 3,908,122 | |
| | 224,992 | | | Zurich Insurance Group AG, ADR1 | | | 6,970,252 | |
| | | | | | | | |
| | | | | | | 25,828,787 | |
| | | | | | | | |
| | |
| | | | Spain — 5.8% | | | |
| | 69,645 | | | Amadeus IT Group SA, Unsponsored ADR1 | | | 5,605,029 | |
| | 416,278 | | | Enagas SA, Unsponsored ADR | | | 5,490,707 | |
| | 724,936 | | | Red Electrica Corp. SA, Unsponsored ADR | | | 7,488,589 | |
| | 220,134 | | | Repsol SA, Sponsored ADR1 | | | 3,926,090 | |
| | | | | | | | |
| | | | | | | 22,510,415 | |
| | | | | | | | |
| | |
| | | | Netherlands — 4.4% | | | |
| | 280,437 | | | Koninklijke Ahold Delhaize N.V., Sponsored ADR1 | | | 6,418,362 | |
| | 86,000 | | | Koninklijke DSM N.V., Sponsored ADR1 | | | 1,877,810 | |
| | 77,523 | | | Royal Dutch Shell PLC — Class B, Sponsored ADR1 | | | 5,094,036 | |
| | 65,517 | | | Wolters Kluwer N.V., Sponsored ADR1 | | | 3,711,931 | |
| | | | | | | | |
| | | | | | | 17,102,139 | |
| | | | | | | | |
| | |
| | | | Hong Kong — 3.8% | | | |
| | 92,802 | | | BOC Hong Kong Holdings, Ltd., Sponsored ADR1 | | | 6,942,981 | |
| | 277,885 | | | Sun Hung Kai Properties, Ltd., Sponsored ADR1 | | | 3,612,505 | |
| | 285,459 | | | WH Group, Ltd., Sponsored ADR1 | | | 4,019,263 | |
| | | | | | | | |
| | | | | | | 14,574,749 | |
| | | | | | | | |
| | |
| | | | Finland — 2.5% | | | |
| | 299,764 | | | UPM-Kymmene OYJ, Sponsored ADR1 | | | 9,635,914 | |
| | | | | | | | |
| | |
| | | | Italy — 2.1% | | | |
| | 278,561 | | | Intesa Sanpaolo SPA, Sponsored ADR | | | 3,661,684 | |
| | 302,674 | | | Terna Rete Elettrica Nazionale SPA, Unsponsored ADR | | | 4,649,073 | |
| | | | | | | | |
| | | | | | | 8,310,757 | |
| | | | | | | | |
| | |
| | | | Sweden — 2.0% | | | |
| | 398,704 | | | Skandinaviska Enskilda Banken AB, ADR1 | | | 4,156,489 | |
| | 229,170 | | | SKF AB, Sponsored ADR | | | 3,672,450 | |
| | | | | | | | |
| | | | | | | 7,828,939 | |
| | | | | | | | |
| | |
| | | | Denmark — 1.9% | | | |
| | 282,402 | | | Coloplast AS, Unsponsored ADR1 | | | 2,630,575 | |
��
See Notes to Financial Statements.
THE GLENMEDE FUND, INC.
Quantitative International Equity Portfolio
SCHEDULE OF PORTFOLIO INVESTMENTS — (Continued)
October 31, 2018
| | | | | | | | |
| Shares | | | | | Value | |
| |
| COMMON STOCKS* — (Continued) | | | |
| | | | Denmark — (Continued) | | | |
| | 186,465 | | | Danske Bank AS, Sponsored ADR | | $ | 1,777,011 | |
| | 71,563 | | | Novo Nordisk AS, Sponsored ADR | | | 3,090,090 | |
| | | | | | | | |
| | | | | | | 7,497,676 | |
| | | | | | | | |
| | |
| | | | Norway — 1.2% | | | |
| | 249,186 | | | DNB ASA, Sponsored ADR1 | | | 4,495,316 | |
| | | | | | | | |
| | |
| | | | TOTAL COMMON STOCKS
(Cost $378,972,880) | | | 385,911,538 | |
| | | | | | | | |
| |
| INVESTMENT OF SECURITY LENDING COLLATERAL* — 8.8% | | | |
| | 33,915,385 | | | State Street Navigator Securities Lending Government Money Market Portfolio | | | 33,915,385 | |
| | | | | | | | |
| | |
| | | | TOTAL INVESTMENT OF SECURITY LENDING COLLATERAL
(Cost $33,915,385) | | | 33,915,385 | |
| | | | | | | | |
| | |
Face
Amount | | | | | | |
| |
| REPURCHASE AGREEMENT* — 0.1% | | | |
| $ | 584,454 | | | With Fixed Income Clearing Corp., dated 10/31/18, 0.42%, principal and interest in the amount of $584,461, due 11/1/18, (collateralized by a U.S. Treasury Note with a par value of $605,000, coupon rate of 2.375%, due 4/15/2021, market value of $598,421) | | | 584,454 | |
| | | | | | | | |
| | |
| | | | TOTAL REPURCHASE AGREEMENT
(Cost $584,454) | | | 584,454 | |
| | | | | | | | |
| | | | | | | | |
| | |
TOTAL INVESTMENTS
(Cost $413,472,719) | | | 108.6 | % | | $ | 420,411,377 | |
| | |
LIABILITIES IN EXCESS OF OTHER ASSETS | | | (8.6 | ) | | | (33,222,998 | ) |
| | | | | | | | |
| | |
NET ASSETS | | | 100.0 | % | | $ | 387,188,379 | |
| | | | | | | | |
| * | Percentages indicated are based on net assets. |
| 1 | Securities or partial securities on loan. See Note 1. |
Abbreviatons:
ADR — American Depositary Receipt
See Notes to Financial Statements.
THE GLENMEDE FUND, INC.
Quantitative International Equity Portfolio
SCHEDULE OF PORTFOLIO INVESTMENTS — (Concluded)
October 31, 2018
INDUSTRY DIVERSIFICATION
On October 31, 2018, industry diversification of the Portfolio was as follows:
| | | | | | | | |
| | | % of
Net Assets | | | Value | |
| INDUSTRIES: | | | | | | |
Banks | | | 10.5 | % | | $ | 40,559,379 | |
Pharmaceuticals | | | 8.7 | | | | 33,570,785 | |
Insurance | | | 6.7 | | | | 25,870,671 | |
Oil, Gas & Consumable Fuels | | | 5.3 | | | | 20,571,597 | |
Trading Companies & Distributors | | | 4.7 | | | | 18,350,694 | |
Health Care Equipment & Supplies | | | 3.9 | | | | 15,177,930 | |
Food & Staples Retailing | | | 3.9 | | | | 14,903,733 | |
Beverages | | | 3.8 | | | | 14,694,288 | |
Capital Markets | | | 3.2 | | | | 12,226,007 | |
Electric Utilities | | | 3.1 | | | | 12,137,661 | |
Chemicals | | | 3.1 | | | | 12,083,531 | |
Metals & Mining | | | 2.7 | | | | 10,501,685 | |
Automobiles | | | 2.6 | | | | 9,869,306 | |
Real Estate Management & Development | | | 2.5 | | | | 9,862,900 | |
Household Durables | | | 2.5 | | | | 9,783,889 | |
Paper & Forest Products | | | 2.5 | | | | 9,635,914 | |
Technology Hardware, Storage & Peripherals | | | 2.5 | | | | 9,546,327 | |
IT Services | | | 2.4 | | | | 9,473,527 | |
Professional Services | | | 1.9 | | | | 7,332,081 | |
Industrial Conglomerates | | | 1.8 | | | | 7,078,918 | |
Auto Components | | | 1.8 | | | | 6,952,786 | |
Wireless Telecommunication Services | | | 1.8 | | | | 6,932,882 | |
Multi-Utilities | | | 1.8 | | | | 6,887,182 | |
Media | | | 1.7 | | | | 6,689,989 | |
Airlines | | | 1.6 | | | | 6,192,435 | |
Food Products | | | 1.6 | | | | 6,009,559 | |
Textiles, Apparel & Luxury Goods | | | 1.5 | | | | 5,989,234 | |
Diversified Telecommunication Services | | | 1.4 | | | | 5,414,607 | |
Building Products | | | 1.3 | | | | 5,118,640 | |
Semiconductors & Semiconductor Equipment | | | 1.0 | | | | 4,017,527 | |
Machinery | | | 1.0 | | | | 3,672,449 | |
Household Products | | | 0.8 | | | | 2,977,474 | |
Electronic Equipment, Instruments & Components | | | 0.7 | | | | 2,642,552 | |
Tobacco | | | 0.6 | | | | 2,427,863 | |
Personal Products | | | 0.5 | | | | 2,073,780 | |
Aerospace & Defense | | | 0.5 | | | | 1,948,754 | |
Construction & Engineering | | | 0.5 | | | | 1,839,063 | |
Electrical Equipment | | | 0.5 | | | | 1,813,103 | |
Equity Real Estate Investment Trusts | | | 0.4 | | | | 1,548,000 | |
Construction Materials | | | 0.4 | | | | 1,532,836 | |
| | | | | | | | |
TOTAL COMMON STOCKS | | | 99.7 | % | | $ | 385,911,538 | |
| | |
REPURCHASE AGREEMENT | | | 0.1 | | | | 584,454 | |
| | |
INVESTMENT OF SECURITY LENDING COLLATERAL | | | 8.8 | | | | 33,915,385 | |
| | | | | | | | |
TOTAL INVESTMENTS | | | 108.6 | % | | $ | 420,411,377 | |
| | | | | | | | |
See Notes to Financial Statements.
THE GLENMEDE FUND, INC.
Responsible ESG U.S. Equity Portfolio
SCHEDULE OF PORTFOLIO INVESTMENTS
October 31, 2018
| | | | | | | | |
| Shares | | | | | Value | |
| |
| COMMON STOCKS* — 99.4% | | | |
| | | | Aerospace & Defense — 1.4% | | | |
| | 2,072 | | | Curtiss-Wright Corp. | | $ | 226,801 | |
| | 324 | | | Northrop Grumman Corp. | | | 84,872 | |
| | | | | | | | |
| | | | | | | 311,673 | |
| | | | | | | | |
| | |
| | | | Airlines — 0.6% | | | |
| | 2,845 | | | Southwest Airlines Co. | | | 139,689 | |
| | | | | | | | |
| | |
| | | | Banks — 5.7% | | | |
| | 9,529 | | | Bank of America Corp. | | | 262,047 | |
| | 6,311 | | | Citizens Financial Group, Inc. | | | 235,716 | |
| | 3,039 | | | Comerica, Inc. | | | 247,861 | |
| | 1,500 | | | Cullen/Frost Bankers, Inc. | | | 146,880 | |
| | 2,014 | | | JPMorgan Chase & Co. | | | 219,566 | |
| | 2,737 | | | Zions Bancorp N.A. | | | 128,776 | |
| | | | | | | | |
| | | | | | | 1,240,846 | |
| | | | | | | | |
| | |
| | | | Biotechnology — 3.9% | | | |
| | 1,646 | | | Amgen, Inc. | | | 317,332 | |
| | 817 | | | Biogen, Inc.1 | | | 248,589 | |
| | 4,168 | | | Gilead Sciences, Inc. | | | 284,174 | |
| | | | | | | | |
| | | | | | | 850,095 | |
| | | | | | | | |
| | |
| | | | Building Products — 1.8% | | | |
| | 6,244 | | | Fortune Brands Home & Security, Inc. | | | 279,919 | |
| | 2,120 | | | Owens Corning | | | 100,212 | |
| | 160 | | | Resideo Technologies, Inc.1 | | | 3,375 | |
| | | | | | | | |
| | | | | | | 383,506 | |
| | | | | | | | |
| | |
| | | | Capital Markets — 3.8% | | | |
| | 4,608 | | | Bank of New York Mellon Corp. (The) | | | 218,097 | |
| | 1,823 | | | CME Group, Inc. | | | 334,046 | |
| | 2,300 | | | Morgan Stanley | | | 105,018 | |
| | 1,725 | | | Northern Trust Corp. | | | 162,271 | |
| | | | | | | | |
| | | | | | | 819,432 | |
| | | | | | | | |
| | |
| | | | Chemicals — 1.6% | | | |
| | 940 | | | Air Products & Chemicals, Inc. | | | 145,089 | |
| | 4,051 | | | Axalta Coating Systems, Ltd.1 | | | 99,979 | |
| | 1,112 | | | Celanese Corp. | | | 107,797 | |
| | | | | | | | |
| | | | | | | 352,865 | |
| | | | | | | | |
| | |
| | | | Communications Equipment — 4.1% | | | |
| | 6,656 | | | Cisco Systems, Inc. | | | 304,512 | |
| | 1,955 | | | F5 Networks, Inc.1 | | | 342,673 | |
| | 8,190 | | | Juniper Networks, Inc. | | | 239,721 | |
| | | | | | | | |
| | | | | | | 886,906 | |
| | | | | | | | |
| | |
| | | | Construction & Engineering — 1.3% | | | |
| | 9,357 | | | Quanta Services, Inc.1 | | | 291,938 | |
| | | | | | | | |
| | |
| | | | Consumer Finance — 1.3% | | | |
| | 11,477 | | | Ally Financial, Inc. | | | 291,630 | |
| | | | | | | | |
| | |
| | | | Containers & Packaging — 1.2% | | | |
| | 2,190 | | | Avery Dennison Corp. | | | 198,677 | |
| | 1,428 | | | International Paper Co. | | | 64,774 | |
| | | | | | | | |
| | | | | | | 263,451 | |
| | | | | | | | |
| | |
| | | | Diversified Consumer Services — 0.9% | | | |
| | 4,925 | | | Service Corp. International | | | 204,240 | |
| | | | | | | | |
See Notes to Financial Statements.
THE GLENMEDE FUND, INC.
Responsible ESG U.S. Equity Portfolio
SCHEDULE OF PORTFOLIO INVESTMENTS — (Continued)
October 31, 2018
| | | | | | | | |
| Shares | | | | | Value | |
| |
| COMMON STOCKS* — (Continued) | | | |
| | | | Diversified Telecommunication Services — 2.2% | | | |
| | 9,336 | | | AT&T, Inc. | | $ | 286,428 | |
| | 3,310 | | | Verizon Communications, Inc. | | | 188,968 | |
| | | | | | | | |
| | | | | | | 475,396 | |
| | | | | | | | |
| | |
| | | | Electric Utilities — 2.3% | | | |
| | 7,009 | | | Exelon Corp. | | | 307,064 | |
| | 4,178 | | | Xcel Energy, Inc. | | | 204,764 | |
| | | | | | | | |
| | | | | | | 511,828 | |
| | | | | | | | |
| | |
| | | | Electronic Equipment, Instruments & Components — 0.8% | | | |
| | 2,298 | | | TE Connectivity, Ltd. | | | 173,315 | |
| | | | | | | | |
| | |
| | | | Entertainment — 2.8% | | | |
| | 3,004 | | | Electronic Arts, Inc.1 | | | 273,304 | |
| | 2,841 | | | Walt Disney Co. (The) | | | 326,232 | |
| | | | | | | | |
| | | | | | | 599,536 | |
| | | | | | | | |
| | |
| | | | Equity Real Estate Investment Trusts — 1.8% | | | |
| | 13,161 | | | Host Hotels & Resorts, Inc. | | | 251,507 | |
| | 5,000 | | | Weyerhaeuser Co. | | | 133,150 | |
| | | | | | | | |
| | | | | | | 384,657 | |
| | | | | | | | |
| | |
| | | | Food & Staples Retailing — 1.3% | | | |
| | 9,864 | | | US Foods Holding Corp.1 | | | 287,733 | |
| | | | | | | | |
| | |
| | | | Food Products — 4.1% | | | |
| | 7,520 | | | General Mills, Inc. | | | 329,376 | |
| | 1,006 | | | Hershey Co. (The) | | | 107,793 | |
| | 849 | | | JM Smucker Co. (The) | | | 91,964 | |
| | 2,454 | | | McCormick & Co., Inc. | | | 353,376 | |
| | | | | | | | |
| | | | | | | 882,509 | |
| | | | | | | | |
| | |
| | | | Health Care Equipment & Supplies — 0.7% | | | |
| | 1,050 | | | Edwards Lifesciences Corp.1 | | | 154,980 | |
| | | | | | | | |
| | |
| | | | Health Care Providers & Services — 6.5% | | | |
| | 898 | | | Anthem, Inc. | | | 247,462 | |
| | 4,802 | | | Cardinal Health, Inc. | | | 242,981 | |
| | 758 | | | Centene Corp.1 | | | 98,783 | |
| | 2,740 | | | CVS Health Corp. | | | 198,349 | |
| | 778 | | | HCA Healthcare, Inc. | | | 103,886 | |
| | 2,407 | | | Henry Schein, Inc.1 | | | 199,781 | |
| | 1,010 | | | Humana, Inc. | | | 323,614 | |
| | | | | | | | |
| | | | | | | 1,414,856 | |
| | | | | | | | |
| | |
| | | | Hotels, Restaurants & Leisure — 1.8% | | | |
| | 5,598 | | | International Game Technology PLC2 | | | 103,843 | |
| | 2,411 | | | Marriott International, Inc. — Class A | | | 281,822 | |
| | | | | | | | |
| | | | | | | 385,665 | |
| | | | | | | | |
| | |
| | | | Household Products — 1.7% | | | |
| | 2,414 | | | Kimberly-Clark Corp. | | | 251,780 | |
| | 1,250 | | | Procter & Gamble Co. (The) | | | 110,850 | |
| | | | | | | | |
| | | | | | | 362,630 | |
| | | | | | | | |
| | |
| | | | Independent Power & Renewable Electricity Producer — 1.4% | | | |
| | 21,660 | | | AES Corp. | | | 315,802 | |
| | | | | | | | |
| | |
| | | | Industrial Conglomerates — 0.6% | | | |
| | 962 | | | Honeywell International, Inc. | | | 139,317 | |
| | | | | | | | |
See Notes to Financial Statements.
THE GLENMEDE FUND, INC.
Responsible ESG U.S. Equity Portfolio
SCHEDULE OF PORTFOLIO INVESTMENTS — (Continued)
October 31, 2018
| | | | | | | | |
| Shares | | | | | Value | |
| |
| COMMON STOCKS* — (Continued) | | | |
| | | | Insurance — 3.2% | | | |
| | 1,840 | | | Principal Financial Group, Inc. | | $ | 86,609 | |
| | 4,814 | | | Progressive Corp. (The) | | | 335,536 | |
| | 2,945 | | | Prudential Financial, Inc. | | | 276,182 | |
| | | | | | | | |
| | | | | | | 698,327 | |
| | | | | | | | |
| | |
| | | | Interactive Media & Service — 1.5% | | | |
| | 297 | | | Alphabet, Inc. — Class A1 | | | 323,902 | |
| | | | | | | | |
| | |
| | | | IT Services — 4.2% | | | |
| | 854 | | | Accenture PLC — Class A | | | 134,607 | |
| | 707 | | | Automatic Data Processing, Inc. | | | 101,865 | |
| | 3,253 | | | Cognizant Technology Solutions Corp. — Class A | | | 224,555 | |
| | 2,289 | | | PayPal Holdings, Inc.1 | | | 192,711 | |
| | 1,873 | | | Visa, Inc. — Class A | | | 258,193 | |
| | | | | | | | |
| | | | | | | 911,931 | |
| | | | | | | | |
| | |
| | | | Life Sciences Tools & Services — 2.0% | | | |
| | 1,302 | | | Agilent Technologies, Inc. | | | 84,357 | |
| | 990 | | | IQVIA Holdings, Inc.1 | | | 121,701 | |
| | 1,186 | | | Waters Corp.1 | | | 224,972 | |
| | | | | | | | |
| | | | | | | 431,030 | |
| | | | | | | | |
| | |
| | | | Machinery — 1.6% | | | |
| | 3,098 | | | Ingersoll-Rand PLC | | | 297,222 | |
| | 425 | | | Stanley Black & Decker, Inc. | | | 49,521 | |
| | | | | | | | |
| | | | | | | 346,743 | |
| | | | | | | | |
| | |
| | | | Media — 2.5% | | | |
| | 6,473 | | | Discovery, Inc. — Class C1 | | | 189,723 | |
| | 4,640 | | | Omnicom Group, Inc. | | | 344,845 | |
| | | | | | | | |
| | | | | | | 534,568 | |
| | | | | | | | |
| | |
| | | | Metals & Mining — 1.4% | | | |
| | 5,150 | | | Nucor Corp. | | | 304,468 | |
| | | | | | | | |
| | |
| | | | Multi-line Retail — 1.5% | | | |
| | 3,848 | | | Target Corp. | | | 321,808 | |
| | | | | | | | |
| | |
| | | | Multi-Utilities — 0.7% | | | |
| | 2,514 | | | Ameren Corp | | | 162,354 | |
| | | | | | | | |
| | |
| | | | Oil, Gas & Consumable Fuels — 5.7% | | | |
| | 18,743 | | | Kinder Morgan, Inc. | | | 319,006 | |
| | 5,031 | | | Marathon Petroleum Corp. | | | 354,434 | |
| | 2,893 | | | Phillips 66 | | | 297,458 | |
| | 2,843 | | | Valero Energy Corp | | | 258,969 | |
| | | | | | | | |
| | | | | | | 1,229,867 | |
| | | | | | | | |
| | |
| | | | Pharmaceuticals — 1.8% | | | |
| | 1,953 | | | Eli Lilly & Co. | | | 211,783 | |
| | 2,379 | | | Merck & Co., Inc. | | | 175,118 | |
| | | | | | | | |
| | | | | | | 386,901 | |
| | | | | | | | |
| | |
| | | | Professional Services — 0.9% | | | |
| | 1,174 | | | ManpowerGroup, Inc. | | | 89,564 | |
| | 1,550 | | | TransUnion | | | 101,913 | |
| | | | | | | | |
| | | | | | | 191,477 | |
| | | | | | | | |
| | |
| | | | Real Estate Management & Development — 1.3% | | | |
| | 6,816 | | | CBRE Group, Inc. — Class A1 | | | 274,617 | |
| | | | | | | | |
See Notes to Financial Statements.
THE GLENMEDE FUND, INC.
Responsible ESG U.S. Equity Portfolio
SCHEDULE OF PORTFOLIO INVESTMENTS — (Continued)
October 31, 2018
| | | | | | | | |
| Shares | | | | | Value | |
| |
| COMMON STOCKS* — (Continued) | | | |
| | | | Semiconductors & Semiconductor Equipment — 4.4% | | | |
| | 6,815 | | | Intel Corp. | | $ | 319,487 | |
| | 1,792 | | | Lam Research Corp. | | | 253,980 | |
| | 943 | | | NVIDIA Corp. | | | 198,813 | |
| | 1,936 | | | Texas Instruments, Inc. | | | 179,719 | |
| | | | | | | | |
| | | | | | | 951,999 | |
| | | | | | | | |
| | |
| | | | Software — 6.5% | | | |
| | 741 | | | Adobe, Inc.1 | | | 182,108 | |
| | 2,500 | | | CA, Inc. | | | 110,900 | |
| | 935 | | | Citrix Systems, Inc.1 | | | 95,809 | |
| | 2,365 | | | Dell Technologies, Inc. — Class V1 | | | 213,772 | |
| | 3,214 | | | Fortinet, Inc.1 | | | 264,127 | |
| | 3,039 | | | Microsoft Corp. | | | 324,596 | |
| | 1,536 | | | VMware, Inc. — Class A1 | | | 217,175 | |
| | | | | | | | |
| | | | | | | 1,408,487 | |
| | | | | | | | |
| | |
| | | | Specialty Retail — 3.8% | | | |
| | 4,303 | | | Best Buy Co., Inc. | | | 301,898 | |
| | 5,183 | | | Gap, Inc. (The) | | | 141,496 | |
| | 1,989 | | | Lowe’s Cos., Inc. | | | 189,393 | |
| | 1,960 | | | Ross Stores, Inc. | | | 194,040 | |
| | | | | | | | |
| | | | | | | 826,827 | |
| | | | | | | | |
| | |
| | | | Technology Hardware, Storage & Peripherals — 0.8% | | | |
| | 6,736 | | | Hewlett Packard Enterprise Co. | | | 102,725 | |
| | 2,947 | | | HP, Inc. | | | 71,141 | |
| | | | | | | | |
| | | | | | | 173,866 | |
| | | | | | | | |
| | |
| | | | TOTAL COMMON STOCKS
(Cost $19,670,492) | | | 21,603,667 | |
| | | | | | | | |
| | |
Face
Amount | | | | | | |
| |
| REPURCHASE AGREEMENT* — 0.6% | | | |
| $ | 130,291 | | | With Fixed Income Clearing Corp., dated 10/31/18, 0.42%, principal and interest in the amount of $130,293, due 11/1/18, (collateralized by a U.S. Treasury Note with a par value of $130,000, coupon rate of 3.625 %, due 2/15/2021, market value of $133,131) | | | 130,291 | |
| | | | | | | | |
| | |
| | | | TOTAL REPURCHASE AGREEMENT
(Cost $130,291) | | | 130,291 | |
| | | | | | | | |
| | |
| Shares | | | | | | |
| |
| INVESTMENT OF SECURITY LENDING COLLATERAL* — 0.4% | | | |
| | 92,367 | | | State Street Navigator Securities Lending Government Money Market Portfolio | | | 92,367 | |
| | | | | | | | |
| | |
| | | | TOTAL INVESTMENT OF SECURITY LENDING COLLATERAL
(Cost $92,367) | | | 92,367 | |
| | | | | | | | |
| | | | | | | | | | |
| | |
TOTAL INVESTMENTS
(Cost $19,893,150) | | | 100.4 | % | | $ | 21,826,325 | |
| | |
LIABILITIES IN EXCESS OF OTHER ASSETS | | | (0.4 | ) | | | (79,997 | ) |
| | | | | | | | | | |
| | |
NET ASSETS | | | 100.0 | % | | $ | 21,746,328 | |
| | | | | | | | | | |
| * | Percentages indicated are based on net assets. |
| 1 | Non income-producing security. |
| 2 | Securities or partial securities on loan. See Note 1. |
See Notes to Financial Statements.
THE GLENMEDE FUND, INC.
Responsible ESG U.S. Equity Portfolio
SCHEDULE OF PORTFOLIO INVESTMENTS — (Concluded)
October 31, 2018
INDUSTRY DIVERSIFICATION
On October 31, 2018, industry diversification of the Portfolio was as follows:
| | | | | | | | |
| | | % of
Net Assets | | | Value | |
| INDUSTRIES: | | | | | | |
Health Care Providers & Services | | | 6.5 | % | | $ | 1,414,856 | |
Software | | | 6.5 | | | | 1,408,487 | |
Banks | | | 5.7 | | | | 1,240,846 | |
Oil, Gas & Consumable Fuels | | | 5.7 | | | | 1,229,867 | |
Semiconductors & Semiconductor Equipment | | | 4.4 | | | | 951,999 | |
IT Services | | | 4.2 | | | | 911,931 | |
Communications Equipment | | | 4.1 | | | | 886,906 | |
Food Products | | | 4.1 | | | | 882,509 | |
Biotechnology | | | 3.9 | | | | 850,095 | |
Specialty Retail | | | 3.8 | | | | 826,827 | |
Capital Markets | | | 3.8 | | | | 819,432 | |
Insurance | | | 3.2 | | | | 698,327 | |
Entertainment | | | 2.8 | | | | 599,536 | |
Media | | | 2.5 | | | | 534,568 | |
Electric Utilities | | | 2.3 | | | | 511,828 | |
Diversified Telecommunication Services | | | 2.2 | | | | 475,396 | |
Life Sciences Tools & Services | | | 2.0 | | | | 431,030 | |
Pharmaceuticals | | | 1.8 | | | | 386,901 | |
Hotels, Restaurants & Leisure | | | 1.8 | | | | 385,665 | |
Equity Real Estate Investment Trusts | | | 1.8 | | | | 384,657 | |
Building Products | | | 1.8 | | | | 383,506 | |
Household Products | | | 1.7 | | | | 362,630 | |
Chemicals | | | 1.6 | | | | 352,865 | |
Machinery | | | 1.6 | | | | 346,743 | |
Interactive Media & Service | | | 1.5 | | | | 323,902 | |
Multi-line Retail | | | 1.5 | | | | 321,808 | |
Independent Power & Renewable Electricity Producer | | | 1.4 | | | | 315,802 | |
Aerospace & Defense | | | 1.4 | | | | 311,673 | |
Metals & Mining | | | 1.4 | | | | 304,468 | |
Construction & Engineering | | | 1.3 | | | | 291,938 | |
Consumer Finance | | | 1.3 | | | | 291,630 | |
Food & Staples Retailing | | | 1.3 | | | | 287,733 | |
Real Estate Management & Development | | | 1.3 | | | | 274,617 | |
Containers & Packaging | | | 1.2 | | | | 263,451 | |
Diversified Consumer Services | | | 0.9 | | | | 204,240 | |
Professional Services | | | 0.9 | | | | 191,477 | |
Technology Hardware, Storage & Peripherals | | | 0.8 | | | | 173,866 | |
Electronic Equipment, Instruments & Components | | | 0.8 | | | | 173,315 | |
Multi-Utilities | | | 0.7 | | | | 162,354 | |
Health Care Equipment & Supplies | | | 0.7 | | | | 154,980 | |
Airlines | | | 0.6 | | | | 139,689 | |
Industrial Conglomerates | | | 0.6 | | | | 139,317 | |
| | | | | | | | |
TOTAL COMMON STOCKS | | | 99.4 | % | | $ | 21,603,667 | |
| | |
REPURCHASE AGREEMENT | | | 0.6 | | | | 130,291 | |
| | |
INVESTMENT OF SECURITY LENDING COLLATERAL | | | 0.4 | | | | 92,367 | |
| | | | | | | | |
TOTAL INVESTMENTS | | | 100.4 | % | | $ | 21,826,325 | |
| | | | | | | | |
See Notes to Financial Statements.
THE GLENMEDE FUND, INC.
Women in Leadership U.S. Equity Portfolio
SCHEDULE OF PORTFOLIO INVESTMENTS
October 31, 2018
| | | | | | | | |
| Shares | | | | | Value | |
| |
| COMMON STOCKS* — 99.5% | | | |
| | | | Aerospace & Defense — 2.4% | | | |
| | 1,258 | | | Boeing Co. (The) | | $ | 446,414 | |
| | | | | | | | |
| | |
| | | | Auto Components — 0.5% | | | |
| | 728 | | | Lear Corp. | | | 96,751 | |
| | | | | | | | |
| | |
| | | | Banks — 5.7% | | | |
| | 3,310 | | | Bank of America Corp. | | | 91,025 | |
| | 2,264 | | | Comerica, Inc. | | | 184,652 | |
| | 14,193 | | | Fifth Third Bancorp | | | 383,069 | |
| | 3,048 | | | JPMorgan Chase & Co. | | | 332,293 | |
| | 1,913 | | | Zions Bancorp N.A. | | | 90,007 | |
| | | | | | | | |
| | | | | | | 1,081,046 | |
| | | | | | | | |
| | |
| | | | Biotechnology — 4.0% | | | |
| | 1,994 | | | Amgen, Inc. | | | 384,423 | |
| | 5,283 | | | Celgene Corp.1 | | | 378,263 | |
| | | | | | | | |
| | | | | | | 762,686 | |
| | | | | | | | |
| | |
| | | | Building Products — 0.4% | | | |
| | 1,600 | | | Fortune Brands Home & Security, Inc. | | | 71,728 | |
| | 269 | | | Resideo Technologies, Inc.1 | | | 5,666 | |
| | | | | | | | |
| | | | | | | 77,394 | |
| | | | | | | | |
| | |
| | | | Capital Markets — 4.5% | | | |
| | 1,497 | | | CME Group, Inc. | | | 274,310 | |
| | 6,184 | | | Intercontinental Exchange, Inc. | | | 476,415 | |
| | 2,143 | | | Morgan Stanley | | | 97,850 | |
| | | | | | | | |
| | | | | | | 848,575 | |
| | | | | | | | |
| | |
| | | | Chemicals — 0.4% | | | |
| | 920 | | | LyondellBasell Industries N.V. — Class A | | | 82,129 | |
| | | | | | | | |
| | |
| | | | Commercial Services & Supplies — 0.5% | | | |
| | 1,350 | | | Republic Services, Inc. | | | 98,118 | |
| | | | | | | | |
| | |
| | | | Communications Equipment — 3.7% | | | |
| | 10,869 | | | Cisco Systems, Inc. | | | 497,257 | |
| | 1,197 | | | F5 Networks, Inc.1 | | | 209,810 | |
| | | | | | | | |
| | | | | | | 707,067 | |
| | | | | | | | |
| | |
| | | | Consumer Finance — 1.1% | | | |
| | 5,144 | | | Ally Financial, Inc. | | | 130,709 | |
| | 2,424 | | | Synchrony Financial | | | 70,005 | |
| | | | | | | | |
| | | | | | | 200,714 | |
| | | | | | | | |
| | |
| | | | Containers & Packaging — 2.7% | | | |
| | 3,160 | | | Avery Dennison Corp. | | | 286,675 | |
| | 5,238 | | | WestRock Co. | | | 225,077 | |
| | | | | | | | |
| | | | | | | 511,752 | |
| | | | | | | | |
| | |
| | | | Diversified Consumer Services — 2.1% | | | |
| | 942 | | | Grand Canyon Education, Inc.1 | | | 117,467 | |
| | 6,748 | | | Service Corp. International | | | 279,840 | |
| | | | | | | | |
| | | | | | | 397,307 | |
| | | | | | | | |
| | |
| | | | Diversified Telecommunication Services — 1.9% | | | |
| | 11,521 | | | AT&T, Inc. | | | 353,464 | |
| | | | | | | | |
| | |
| | | | Electric Utilities — 2.5% | | | |
| | 10,304 | | | PG&E Corp. | | | 482,330 | |
| | | | | | | | |
See Notes to Financial Statements.
THE GLENMEDE FUND, INC.
Women in Leadership U.S. Equity Portfolio
SCHEDULE OF PORTFOLIO INVESTMENTS — (Continued)
October 31, 2018
| | | | | | | | |
| Shares | | | | | Value | |
| |
| COMMON STOCKS* — (Continued) | | | |
| | | | Electrical Equipment — 1.1% | | | |
| | 2,991 | | | AMETEK, Inc. | | $ | 200,636 | |
| | | | | | | | |
| | |
| | | | Entertainment — 0.7% | | | |
| | 1,192 | | | Walt Disney Co. (The) | | | 136,877 | |
| | | | | | | | |
| | |
| | | | Equity Real Estate Investment Trusts — 0.5% | | | |
| | 538 | | | Simon Property Group, Inc. | | | 98,734 | |
| | | | | | | | |
| | |
| | | | Food & Staples Retailing — 1.0% | | | |
| | 6,707 | | | US Foods Holding Corp.1 | | | 195,643 | |
| | | | | | | | |
| | |
| | | | Food Products — 4.1% | | | |
| | 2,287 | | | Hershey Co. (The) | | | 245,052 | |
| | 3,702 | | | McCormick & Co., Inc. | | | 533,088 | |
| | | | | | | | |
| | | | | | | 778,140 | |
| | | | | | | | |
| | |
| | | | Gas Utilities — 0.8% | | | |
| | 2,833 | | | UGI Corp. | | | 150,319 | |
| | | | | | | | |
| | |
| | | | Health Care Equipment & Supplies — 1.2% | | | |
| | 1,870 | | | Varian Medical Systems, Inc.1 | | | 223,222 | |
| | | | | | | | |
| | |
| | | | Health Care Providers & Services — 6.0% | | | |
| | 791 | | | Aetna, Inc. | | | 156,935 | |
| | 1,060 | | | Anthem, Inc. | | | 292,104 | |
| | 4,313 | | | CVS Health Corp. | | | 312,218 | |
| | 1,356 | | | DaVita, Inc.1 | | | 91,313 | |
| | 907 | | | Humana, Inc. | | | 290,612 | |
| | | | | | | | |
| | | | | | | 1,143,182 | |
| | | | | | | | |
| | |
| | | | Household Products — 2.0% | | | |
| | 3,720 | | | Church & Dwight Co., Inc. | | | 220,857 | |
| | 2,594 | | | Energizer Holdings, Inc. | | | 152,449 | |
| | | | | | | | |
| | | | | | | 373,306 | |
| | | | | | | | |
| | |
| | | | Industrial Conglomerates — 1.2% | | | |
| | 1,615 | | | Honeywell International, Inc. | | | 233,884 | |
| | | | | | | | |
| | |
| | | | Insurance — 3.0% | | | |
| | 7,349 | | | MetLife, Inc. | | | 302,706 | |
| | 1,700 | | | Principal Financial Group, Inc. | | | 80,019 | |
| | 2,753 | | | Progressive Corp. (The) | | | 191,884 | |
| | | | | | | | |
| | | | | | | 574,609 | |
| | | | | | | | |
| | |
| | | | Interactive Media & Services — 4.4% | | | |
| | 346 | | | Alphabet, Inc. — Class A1 | | | 377,341 | |
| | 2,993 | | | Facebook, Inc. — Class A1 | | | 454,307 | |
| | | | | | | | |
| | | | | | | 831,648 | |
| | | | | | | | |
| | |
| | | | IT Services — 3.8% | | | |
| | 1,736 | | | Accenture PLC — Class A | | | 273,628 | |
| | 2,443 | | | Akamai Technologies, Inc.1 | | | 176,507 | |
| | 3,933 | | | Cognizant Technology Solutions Corp. — Class A | | | 271,495 | |
| | | | | | | | |
| | | | | | | 721,630 | |
| | | | | | | | |
| | |
| | | | Life Sciences Tools & Services — 0.9% | | | |
| | 874 | | | Waters Corp.1 | | | 165,789 | |
| | | | | | | | |
| | |
| | | | Machinery — 2.7% | | | |
| | 4,665 | | | Ingersoll-Rand PLC | | | 447,560 | |
| | 624 | | | Stanley Black & Decker, Inc. | | | 72,709 | |
| | | | | | | | |
| | | | | | | 520,269 | |
| | | | | | | | |
See Notes to Financial Statements.
THE GLENMEDE FUND, INC.
Women in Leadership U.S. Equity Portfolio
SCHEDULE OF PORTFOLIO INVESTMENTS — (Continued)
October 31, 2018
| | | | | | | | |
| Shares | | | | | Value | |
| |
| COMMON STOCKS* — (Continued) | | | |
| | | | Media — 2.6% | | | |
| | 13,076 | | | Comcast Corp. — Class A | | $ | 498,719 | |
| | | | | | | | |
| | |
| | | | Metals & Mining — 0.6% | | | |
| | 1,800 | | | Nucor Corp. | | | 106,416 | |
| | | | | | | | |
| | |
| | | | Multi-line Retail — 2.2% | | | |
| | 4,983 | | | Target Corp. | | | 416,728 | |
| | | | | | | | |
| | |
| | | | Multi-Utilities — 1.5% | | | |
| | 10,632 | | | CenterPoint Energy, Inc. | | | 287,170 | |
| | | | | | | | |
| | |
| | | | Oil, Gas & Consumable Fuels — 4.6% | | | |
| | 3,102 | | | Chevron Corp. | | | 346,338 | |
| | 1,472 | | | Phillips 66 | | | 151,351 | |
| | 4,176 | | | Valero Energy Corp. | | | 380,392 | |
| | | | | | | | |
| | | | | | | 878,081 | |
| | | | | | | | |
| | |
| | | | Pharmaceuticals — 2.6% | | | |
| | 11,541 | | | Pfizer, Inc. | | | 496,956 | |
| | | | | | | | |
| | |
| | | | Real Estate Management & Development — 2.6% | | | |
| | 9,640 | | | CBRE Group, Inc. — Class A1 | | | 388,395 | |
| | 741 | | | Jones Lang LaSalle, Inc. | | | 98,005 | |
| | | | | | | | |
| | | | | | | 486,400 | |
| | | | | | | | |
| | |
| | | | Semiconductors & Semiconductor Equipment — 4.3% | | | |
| | 7,817 | | | Intel Corp. | | | 366,461 | |
| | 3,321 | | | Teradyne, Inc. | | | 114,409 | |
| | 3,564 | | | Texas Instruments, Inc. | | | 330,846 | |
| | | | | | | | |
| | | | | | | 811,716 | |
| | | | | | | | |
| | |
| | | | Software — 6.5% | | | |
| | 6,401 | | | CA, Inc. | | | 283,948 | |
| | 1,053 | | | Dell Technologies, Inc. — Class V1 | | | 95,181 | |
| | 3,392 | | | Microsoft Corp. | | | 362,299 | |
| | 5,770 | | | Oracle Corp. | | | 281,807 | |
| | 1,441 | | | Synopsys, Inc.1 | | | 129,013 | |
| | 616 | | | VMware, Inc. — Class A1 | | | 87,096 | |
| | | | | | | | |
| | | | | | | 1,239,344 | |
| | | | | | | | |
| | |
| | | | Specialty Retail — 4.1% | | | |
| | 5,742 | | | Best Buy Co., Inc. | | | 402,859 | |
| | 2,516 | | | Lowe’s Cos., Inc. | | | 239,573 | |
| | 1,415 | | | Ross Stores, Inc. | | | 140,085 | |
| | | | | | | | |
| | | | | | | 782,517 | |
| | | | | | | | |
| | |
| | | | Technology Hardware, Storage & Peripherals — 2.1% | | | |
| | 3,137 | | | NetApp, Inc. | | | 246,223 | |
| | 3,314 | | | Western Digital Corp. | | | 142,733 | |
| | | | | | | | |
| | | | | | | 388,956 | |
| | | | | | | | |
| | |
| | | | TOTAL COMMON STOCKS
(Cost $17,520,507) | | | 18,886,638 | |
| | | | | | | | |
| | | | | | | | |
| | |
TOTAL INVESTMENTS
(Cost $17,520,507) | | | 99.5 | % | | $ | 18,886,638 | |
| | |
OTHER ASSETS IN EXCESS OF LIABILITIES | | | 0.5 | | | | 86,939 | |
| | | | | |
| | |
NET ASSETS | | | 100.0 | % | | $ | 18,973,577 | |
| | | | | | | | |
See Notes to Financial Statements.
THE GLENMEDE FUND, INC.
Women in Leadership U.S. Equity Portfolio
SCHEDULE OF PORTFOLIO INVESTMENTS — (Continued)
October 31, 2018
| * | Percentages indicated are based on net assets. |
| 1 | Non income-producing security. |
See Notes to Financial Statements.
THE GLENMEDE FUND, INC.
Women in Leadership U.S. Equity Portfolio
SCHEDULE OF PORTFOLIO INVESTMENTS — (Concluded)
October 31, 2018
INDUSTRY DIVERSIFICATION
On October 31, 2018, industry diversification of the Portfolio was as follows:
| | | | | | | | |
| | | % of
Net Assets | | | Value | |
| INDUSTRIES: | | | | | | |
Software | | | 6.5 | % | | $ | 1,239,344 | |
Health Care Providers & Services | | | 6.0 | | | | 1,143,182 | |
Banks | | | 5.7 | | | | 1,081,046 | |
Oil, Gas & Consumable Fuels | | | 4.6 | | | | 878,081 | |
Capital Markets | | | 4.5 | | | | 848,575 | |
Interactive Media & Services | | | 4.4 | | | | 831,648 | |
Semiconductors & Semiconductor Equipment | | | 4.3 | | | | 811,716 | |
Specialty Retail | | | 4.1 | | | | 782,517 | |
Food Products | | | 4.1 | | | | 778,140 | |
Biotechnology | | | 4.0 | | | | 762,686 | |
IT Services | | | 3.8 | | | | 721,630 | |
Communications Equipment | | | 3.7 | | | | 707,067 | |
Insurance | | | 3.0 | | | | 574,609 | |
Machinery | | | 2.7 | | | | 520,269 | |
Containers & Packaging | | | 2.7 | | | | 511,752 | |
Media | | | 2.6 | | | | 498,719 | |
Pharmaceuticals | | | 2.6 | | | | 496,956 | |
Real Estate Management & Development | | | 2.6 | | | | 486,400 | |
Electric Utilities | | | 2.5 | | | | 482,330 | |
Aerospace & Defense | | | 2.4 | | | | 446,414 | |
Multi-line Retail | | | 2.2 | | | | 416,728 | |
Diversified Consumer Services | | | 2.1 | | | | 397,307 | |
Technology Hardware, Storage & Peripherals | | | 2.1 | | | | 388,956 | |
Household Products | | | 2.0 | | | | 373,306 | |
Diversified Telecommunication Services | | | 1.9 | | | | 353,464 | |
Multi-Utilities | | | 1.5 | | | | 287,170 | |
Industrial Conglomerates | | | 1.2 | | | | 233,884 | |
Health Care Equipment & Supplies | | | 1.2 | | | | 223,222 | |
Consumer Finance | | | 1.1 | | | | 200,714 | |
Electrical Equipment | | | 1.1 | | | | 200,636 | |
Food & Staples Retailing | | | 1.0 | | | | 195,643 | |
Life Sciences Tools & Services | | | 0.9 | | | | 165,789 | |
Gas Utilities | | | 0.8 | | | | 150,319 | |
Entertainment | | | 0.7 | | | | 136,877 | |
Metals & Mining | | | 0.6 | | | | 106,416 | |
Equity Real Estate Investment Trusts | | | 0.5 | | | | 98,734 | |
Commercial Services & Supplies | | | 0.5 | | | | 98,118 | |
Auto Components | | | 0.5 | | | | 96,751 | |
Chemicals | | | 0.4 | | | | 82,129 | |
Building Products | | | 0.4 | | | | 77,394 | |
| | | | | | | | |
TOTAL COMMON STOCKS | | | 99.5 | % | | $ | 18,886,638 | |
| | | | | | | | |
TOTAL INVESTMENTS | | | 99.5 | % | | $ | 18,886,638 | |
| | | | | | | | |
See Notes to Financial Statements.
THE GLENMEDE FUND, INC.
Quantitative U.S. Long/Short Equity Portfolio
SCHEDULE OF PORTFOLIO INVESTMENTS
October 31, 2018
| | | | | | | | |
| Shares | | | | | Value | |
| |
| COMMON STOCKS* — 95.9% | | | |
| | | | Air Freight & Logistics — 1.0% | | | |
| | 47,980 | | | Expeditors International of Washington, Inc. | | $ | 3,223,296 | |
| | | | | | | | |
| | |
| | | | Banks — 6.1% | | | |
| | 165,000 | | | Bank of America Corp | | | 4,537,500 | |
| | 75,280 | | | Citizens Financial Group, Inc. | | | 2,811,708 | |
| | 46,900 | | | East West Bancorp, Inc. | | | 2,459,436 | |
| | 155,000 | | | KeyCorp | | | 2,814,800 | |
| | 13,960 | | | PNC Financial Services Group, Inc. (The) | | | 1,793,720 | |
| | 48,380 | | | SunTrust Banks, Inc. | | | 3,031,491 | |
| | 62,476 | | | Zions Bancorp N.A. | | | 2,939,496 | |
| | | | | | | | |
| | | | | | | 20,388,151 | |
| | | | | | | | |
| | |
| | | | Beverages — 1.0% | | | |
| | 60,920 | | | Monster Beverage Corp.1 | | | 3,219,622 | |
| | | | | | | | |
| | |
| | | | Biotechnology — 2.3% | | | |
| | 142,120 | | | Acorda Therapeutics, Inc.1 | | | 2,715,913 | |
| | 82,660 | | | Emergent BioSolutions, Inc.1,2 | | | 5,057,966 | |
| | | | | | | | |
| | | | | | | 7,773,879 | |
| | | | | | | | |
| | |
| | | | Capital Markets — 1.7% | | | |
| | 51,380 | | | Bank of New York Mellon Corp. (The) | | | 2,431,815 | |
| | 170,700 | | | Waddell & Reed Financial, Inc. — Class A | | | 3,255,249 | |
| | | | | | | | |
| | | | | | | 5,687,064 | |
| | | | | | | | |
| | |
| | | | Chemicals — 2.9% | | | |
| | 35,080 | | | Eastman Chemical Co. | | | 2,748,518 | |
| | 119,900 | | | Huntsman Corp. | | | 2,623,412 | |
| | 29,180 | | | LyondellBasell Industries N.V. — Class A | | | 2,604,899 | |
| | 57,152 | | | PolyOne Corp. | | | 1,846,581 | |
| | | | | | | | |
| | | | | | | 9,823,410 | |
| | | | | | | | |
| | |
| | | | Commercial Services & Supplies — 1.3% | | | |
| | 64,540 | | | Tetra Tech, Inc. | | | 4,262,222 | |
| | | | | | | | |
| | |
| | | | Communications Equipment — 1.2% | | | |
| | 87,280 | | | Cisco Systems, Inc.2 | | | 3,993,060 | |
| | | | | | | | |
| | |
| | | | Construction & Engineering — 2.0% | | | |
| | 49,460 | | | EMCOR Group, Inc.2 | | | 3,510,671 | |
| | 158,860 | | | KBR, Inc. | | | 3,142,251 | |
| | | | | | | | |
| | | | | | | 6,652,922 | |
| | | | | | | | |
| | |
| | | | Consumer Finance — 1.4% | | | |
| | 22,540 | | | Discover Financial Services | | | 1,570,362 | |
| | 311,100 | | | SLM Corp.1 | | | 3,154,554 | |
| | | | | | | | |
| | | | | | | 4,724,916 | |
| | | | | | | | |
| | |
| | | | Containers & Packaging — 0.8% | | | |
| | 62,560 | | | WestRock Co. | | | 2,688,203 | |
| | | | | | | | |
| | |
| | | | Diversified Consumer Services — 1.0% | | | |
| | 83,120 | | | Service Corp. International | | | 3,446,986 | |
| | | | | | | | |
| | |
| | | | Diversified Financial Services — 0.5% | | | |
| | 41,080 | | | Voya Financial, Inc. | | | 1,797,661 | |
| | | | | | | | |
| | |
| | | | Diversified Telecommunication Services — 0.6% | | | |
| | 63,160 | | | AT&T, Inc.2 | | | 1,937,749 | |
| | | | | | | | |
| | |
| | | | Electric Utilities — 1.8% | | | |
| | 88,240 | | | Exelon Corp. | | | 3,865,794 | |
See Notes to Financial Statements.
THE GLENMEDE FUND, INC.
Quantitative U.S. Long/Short Equity Portfolio
SCHEDULE OF PORTFOLIO INVESTMENTS — (Continued)
October 31, 2018
| | | | | | | | |
| Shares | | | | | Value | |
| |
| COMMON STOCKS* — (Continued) | | | |
| | | | Electric Utilities — (Continued) | | | |
| | 45,300 | | | PG&E Corp | | $ | 2,120,493 | |
| | | | | | | | |
| | | | | | | 5,986,287 | |
| | | | | | | | |
| | |
| | | | Electrical Equipment — 1.2% | | | |
| | 16,200 | | | Eaton Corp. PLC | | | 1,161,054 | |
| | 35,300 | | | EnerSys | | | 2,808,821 | |
| | | | | | | | |
| | | | | | | 3,969,875 | |
| | | | | | | | |
| | |
| | | | Electronic Equipment, Instruments & Components — 2.7% | | | |
| | 37,600 | | | Arrow Electronics, Inc.1 | | | 2,545,896 | |
| | 69,180 | | | Methode Electronics, Inc | | | 2,047,728 | |
| | 16,940 | | | Tech Data Corp.1 | | | 1,196,981 | |
| | 183,120 | | | Vishay Intertechnology, Inc | | | 3,351,096 | |
| | | | | | | | |
| | | | | | | 9,141,701 | |
| | | | | | | | |
| | |
| | | | Equity Real Estate Investment Trusts — 3.6% | | | |
| | 39,760 | | | EPR Properties2 | | | 2,733,103 | |
| | 119,980 | | | Hospitality Properties Trust | | | 3,073,888 | |
| | 180,220 | | | Host Hotels & Resorts, Inc. | | | 3,444,004 | |
| | 98,960 | | | Park Hotels & Resorts, Inc. | | | 2,876,767 | |
| | | | | | | | |
| | | | | | | 12,127,762 | |
| | | | | | | | |
| | |
| | | | Food & Staples Retailing — 2.2% | | | |
| | 51,480 | | | Sysco Corp. | | | 3,672,068 | |
| | 35,360 | | | Walmart, Inc. | | | 3,545,901 | |
| | | | | | | | |
| | | | | | | 7,217,969 | |
| | | | | | | | |
| | |
| | | | Food Products — 2.4% | | | |
| | 54,400 | | | Archer-Daniels-Midland Co. | | | 2,570,400 | |
| | 77,720 | | | General Mills, Inc. | | | 3,404,136 | |
| | 32,320 | | | Tyson Foods, Inc. — Class A | | | 1,936,614 | |
| | | | | | | | |
| | | | | | | 7,911,150 | |
| | | | | | | | |
| | |
| | | | Health Care Equipment & Supplies — 1.6% | | | |
| | 17,860 | | | Align Technology, Inc.1,2 | | | 3,950,632 | |
| | 21,740 | | | Baxter International, Inc. | | | 1,358,967 | |
| | | | | | | | |
| | | | | | | 5,309,599 | |
| | | | | | | | |
| | |
| | | | Health Care Providers & Services — 8.0% | | | |
| | 57,960 | | | Amedisys, Inc.1 | | | 6,375,600 | |
| | 68,220 | | | AMN Healthcare Services, Inc.1,2 | | | 3,453,296 | |
| | 23,960 | | | Centene Corp.1,2 | | | 3,122,467 | |
| | 45,660 | | | CVS Health Corp. | | | 3,305,327 | |
| | 36,520 | | | Molina Healthcare, Inc.1 | | | 4,629,641 | |
| | 21,120 | | | WellCare Health Plans, Inc.1,2 | | | 5,828,909 | |
| | | | | | | | |
| | | | | | | 26,715,240 | |
| | | | | | | | |
| | |
| | | | Hotels, Restaurants & Leisure — 2.4% | | | |
| | 44,720 | | | Hilton Worldwide Holdings, Inc. | | | 3,182,722 | |
| | 22,740 | | | Hyatt Hotels Corp. — Class A | | | 1,573,608 | |
| | 102,160 | | | International Game Technology PLC3 | | | 1,895,068 | |
| | 33,900 | | | Wyndham Destinations, Inc.2 | | | 1,216,332 | |
| | | | | | | | |
| | | | | | | 7,867,730 | |
| | | | | | | | |
| | |
| | | | Household Products — 0.9% | | | |
| | 48,020 | | | Church & Dwight Co., Inc. | | | 2,850,947 | |
| | | | | | | | |
| | |
| | | | Independent Power & Renewable Electricity Producer — 0.6% | | | |
| | 130,000 | | | AES Corp.2 | | | 1,895,400 | |
| | | | | | | | |
See Notes to Financial Statements.
THE GLENMEDE FUND, INC.
Quantitative U.S. Long/Short Equity Portfolio
SCHEDULE OF PORTFOLIO INVESTMENTS — (Continued)
October 31, 2018
| | | | | | | | |
| Shares | | | | | Value | |
| |
| COMMON STOCKS* — (Continued) | | | |
| | | | Insurance — 4.7% | | | |
| | 63,700 | | | CNA Financial Corp. | | $ | 2,762,669 | |
| | 29,700 | | | Lincoln National Corp. | | | 1,787,643 | |
| | 76,960 | | | MetLife, Inc. | | | 3,169,982 | |
| | 142,040 | | | Old Republic International Corp. | | | 3,131,982 | |
| | 24,900 | | | Prudential Financial, Inc. | | | 2,335,122 | |
| | 67,572 | | | Unum Group | | | 2,450,161 | |
| | | | | | | | |
| | | | | | | 15,637,559 | |
| | | | | | | | |
| | |
| | | | Interactive Media & Service — 0.6% | | | |
| | 46,600 | | | Yelp, Inc.1 | | | 1,995,412 | |
| | | | | | | | |
| | |
| | | | IT Services — 6.5% | | | |
| | 49,032 | | | Amdocs, Ltd. | | | 3,102,255 | |
| | 40,580 | | | Cognizant Technology Solutions Corp. — Class A | | | 2,801,237 | |
| | 198,375 | | | Conduent, Inc.1,2 | | | 3,788,963 | |
| | 18,700 | | | Euronet Worldwide, Inc.1 | | | 2,079,066 | |
| | 19,460 | | | FleetCor Technologies, Inc.1,2 | | | 3,892,584 | |
| | 39,320 | | | MAXIMUS, Inc. | | | 2,554,620 | |
| | 118,900 | | | Sykes Enterprises, Inc.1 | | | 3,646,663 | |
| | | | | | | | |
| | | | | | | 21,865,388 | |
| | | | | | | | |
| | |
| | | | Life Sciences Tools & Services — 2.7% | | | |
| | 52,540 | | | Agilent Technologies, Inc. | | | 3,404,067 | |
| | 30,000 | | | Medpace Holdings, Inc.1 | | | 1,563,000 | |
| | 17,780 | | | Thermo Fisher Scientific, Inc. | | | 4,154,297 | |
| | | | | | | | |
| | | | | | | 9,121,364 | |
| | | | | | | | |
| | |
| | | | Machinery — 3.7% | | | |
| | 47,480 | | | AGCO Corp.2 | | | 2,660,779 | |
| | 48,280 | | | Barnes Group, Inc. | | | 2,732,648 | |
| | 39,420 | | | Crane Co.2 | | | 3,431,117 | |
| | 36,080 | | | Ingersoll-Rand PLC | | | 3,461,515 | |
| | | | | | | | |
| | | | | | | 12,286,059 | |
| | | | | | | | |
| | |
| | | | Media — 2.9% | | | |
| | 76,280 | | | Comcast Corp. — Class A | | | 2,909,319 | |
| | 70,800 | | | Interpublic Group of Cos., Inc. (The) | | | 1,639,728 | |
| | 129,160 | | | News Corp. — Class A | | | 1,703,620 | |
| | 44,580 | | | Omnicom Group, Inc. | | | 3,313,186 | |
| | | | | | | | |
| | | | | | | 9,565,853 | |
| | | | | | | | |
| | |
| | | | Metals & Mining — 0.9% | | | |
| | 75,192 | | | Steel Dynamics, Inc. | | | 2,977,603 | |
| | | | | | | | |
| | |
| | | | Multi-line Retail — 0.6% | | | |
| | 22,800 | | | Target Corp. | | | 1,906,764 | |
| | | | | | | | |
| | |
| | | | Multi-Utilities — 2.7% | | | |
| | 49,640 | | | Ameren Corp. | | | 3,205,751 | |
| | 31,760 | | | DTE Energy Co.3 | | | 3,569,824 | |
| | 45,000 | | | Public Service Enterprise Group, Inc. | | | 2,404,350 | |
| | | | | | | | |
| | | | | | | 9,179,925 | |
| | | | | | | | |
| | |
| | | | Oil, Gas & Consumable Fuels — 3.8% | | | |
| | 48,620 | | | Marathon Petroleum Corp. | | | 3,425,279 | |
| | 75,440 | | | PBF Energy, Inc. — Class A | | | 3,157,164 | |
| | 203,900 | | | Range Resources Corp. | | | 3,231,815 | |
| | 33,460 | | | Valero Energy Corp. | | | 3,047,872 | |
| | | | | | | | |
| | | | | | | 12,862,130 | |
| | | | | | | | |
See Notes to Financial Statements.
THE GLENMEDE FUND, INC.
Quantitative U.S. Long/Short Equity Portfolio
SCHEDULE OF PORTFOLIO INVESTMENTS — (Continued)
October 31, 2018
| | | | | | | | |
| Shares | | | | | Value | |
| |
| COMMON STOCKS* — (Continued) | | | |
| | | | Paper & Forest Products — 1.8% | | | |
| | 70,680 | | | Domtar Corp. | | $ | 3,273,191 | |
| | 126,140 | | | Louisiana-Pacific Corp. | | | 2,746,068 | |
| | | | | | | | |
| | | | | | | 6,019,259 | |
| | | | | | | | |
| | |
| | | | Personal Products — 0.5% | | | |
| | 21,760 | | | Nu Skin Enterprises, Inc. — Class A | | | 1,527,987 | |
| | | | | | | | |
| | |
| | | | Pharmaceuticals — 0.9% | | | |
| | 65,940 | | | Supernus Pharmaceuticals, Inc.1 | | | 3,136,106 | |
| | | | | | | | |
| | |
| | | | Professional Services — 1.4% | | | |
| | 56,300 | | | Korn/Ferry International | | | 2,541,382 | |
| | 28,720 | | | ManpowerGroup, Inc. | | | 2,191,049 | |
| | | | | | | | |
| | | | | | | 4,732,431 | |
| | | | | | | | |
| | |
| | | | Real Estate Management & Development — 0.9% | | | |
| | 72,780 | | | CBRE Group, Inc. — Class A1 | | | 2,932,306 | |
| | | | | | | | |
| | |
| | | | Semiconductors & Semiconductor Equipment — 3.3% | | | |
| | 65,380 | | | Applied Materials, Inc. | | | 2,149,695 | |
| | 38,000 | | | Intel Corp. | | | 1,781,440 | |
| | 74,060 | | | Micron Technology, Inc.1,2 | | | 2,793,543 | |
| | 180,140 | | | ON Semiconductor Corp.1 | | | 3,062,380 | |
| | 39,680 | | | Teradyne, Inc. | | | 1,366,976 | |
| | | | | | | | |
| | | | | | | 11,154,034 | |
| | | | | | | | |
| | |
| | | | Software — 2.4% | | | |
| | 86,049 | | | Cadence Design Systems, Inc.1 | | | 3,835,204 | |
| | 38,080 | | | Microsoft Corp. | | | 4,067,325 | |
| | | | | | | | |
| | | | | | | 7,902,529 | |
| | | | | | | | |
| | |
| | | | Specialty Retail — 3.8% | | | |
| | 59,980 | | | Best Buy Co., Inc.2 | | | 4,208,197 | |
| | 32,260 | | | Lowe’s Cos., Inc. | | | 3,071,797 | |
| | 38,960 | | | Ross Stores, Inc. | | | 3,857,040 | |
| | 14,100 | | | TJX Cos., Inc. (The) | | | 1,549,308 | |
| | | | | | | | |
| | | | | | | 12,686,342 | |
| | | | | | | | |
| | |
| | | | Textiles, Apparel & Luxury Goods — 0.6% | | | |
| | 37,000 | | | Michael Kors Holdings, Ltd.1 | | | 2,050,170 | |
| | | | | | | | |
| | |
| | | | TOTAL COMMON STOCKS
(Cost $275,671,294) | | | 320,152,022 | |
| | | | | | | | |
| | |
Face
Amount | | | | | | |
| |
| REPURCHASE AGREEMENT* — 3.5% | | | |
| $ | 11,456,016 | | | With Fixed Income Clearing Corp., dated 10/31/18, 0.42%, principal and interest in the amount of $11,456,150, due 11/1/18, (collateralized by a U.S. Treasury Note with a par value of $11,815,000, coupon rate of 2.375%, due 4/15/2021, market value of $11,686,512) | | | 11,456,016 | |
| | | | | | | | |
| | |
| | | | TOTAL REPURCHASE AGREEMENT
(Cost $11,456,016) | | | 11,456,016 | |
| | | | | | | | |
See Notes to Financial Statements.
THE GLENMEDE FUND, INC.
Quantitative U.S. Long/Short Equity Portfolio
SCHEDULE OF PORTFOLIO INVESTMENTS — (Continued)
October 31, 2018
| | | | | | | | |
| Shares | | | | | Value | |
| |
| INVESTMENT OF SECURITY LENDING COLLATERAL* — 1.6% | | | |
| | 5,392,036 | | | State Street Navigator Securities Lending Government Money Market Portfolio | | $ | 5,392,036 | |
| | | | | |
| | |
| | | | TOTAL INVESTMENT OF SECURITY LENDING COLLATERAL
(Cost $5,392,036) | | | 5,392,036 | |
| | | | | | | | |
| | | | | | | | | | |
| | |
TOTAL LONG INVESTMENTS
(Cost $292,519,346) | | | 101.0 | % | | $ | 337,000,074 | |
| | | | | | | | | | |
| | | | | | | | |
| |
| COMMON STOCKS SOLD SHORT* — (64.9)% | | | |
| | | | Aerospace & Defense — (0.9)% | | | |
| | (9,460 | ) | | TransDigm Group, Inc.1 | | | (3,124,165 | ) |
| | | | | | | | |
| | |
| | | | Air Freight & Logistics — (0.8)% | | | |
| | (11,500 | ) | | FedEx Corp. | | | (2,533,910 | ) |
| | | | | | | | |
| | |
| | | | Banks — (3.7)% | | | |
| | (71,500 | ) | | Ameris Bancorp | | | (3,066,635 | ) |
| | (30,140 | ) | | First Republic Bank | | | (2,742,439 | ) |
| | (31,820 | ) | | Signature Bank | | | (3,497,018 | ) |
| | (24,440 | ) | | South State Corp. | | | (1,653,855 | ) |
| | (150,400 | ) | | Valley National Bancorp | | | (1,500,992 | ) |
| | | | | | | | |
| | | | | | | (12,460,939 | ) |
| | | | | | | | |
| | |
| | | | Beverages — (1.8)% | | | |
| | (51,160 | ) | | Brown-Forman Corp. — Class B | | | (2,370,755 | ) |
| | (77,500 | ) | | Coca-Cola Co. (The) | | | (3,710,700 | ) |
| | | | | | | | |
| | | | | | | (6,081,455 | ) |
| | | | | | | | |
| | |
| | | | Capital Markets — (2.0)% | | | |
| | (7,780 | ) | | Goldman Sachs Group, Inc. (The) | | | (1,753,379 | ) |
| | (16,620 | ) | | MarketAxess Holdings, Inc. | | | (3,484,715 | ) |
| | (30,280 | ) | | TD Ameritrade Holding Corp. | | | (1,566,082 | ) |
| | | | | | | | |
| | | | | | | (6,804,176 | ) |
| | | | | | | | |
| | |
| | | | Chemicals — (2.8)% | | | |
| | (31,360 | ) | | Balchem Corp. | | | (2,936,864 | ) |
| | (24,680 | ) | | DowDuPont, Inc. | | | (1,330,746 | ) |
| | (15,700 | ) | | International Flavors & Fragrances, Inc. | | | (2,271,162 | ) |
| | (6,960 | ) | | Sherwin-Williams Co. (The) | | | (2,738,551 | ) |
| | | | | | | | |
| | | | | | | (9,277,323 | ) |
| | | | | | | | |
| | |
| | | | Commercial Services & Supplies — (2.2)% | | | |
| | (129,400 | ) | | Covanta Holding Corp. | | | (1,900,886 | ) |
| | (31,020 | ) | | Rollins, Inc. | | | (1,836,384 | ) |
| | (40,200 | ) | | Waste Management, Inc. | | | (3,596,694 | ) |
| | | | | | | | |
| | | | | | | (7,333,964 | ) |
| | | | | | | | |
| | |
| | | | Communications Equipment — (0.7)% | | | |
| | (19,000 | ) | | Motorola Solutions, Inc. | | | (2,328,640 | ) |
| | | | | | | | |
| | |
| | | | Construction Materials — (1.1)% | | | |
| | (12,920 | ) | | Martin Marietta Materials, Inc. | | | (2,212,937 | ) |
| | (14,320 | ) | | Vulcan Materials Co. | | | (1,448,325 | ) |
| | | | | | | | |
| | | | | | | (3,661,262 | ) |
| | | | | | | | |
| | |
| | | | Distributors — (1.0)% | | | |
| | (35,000 | ) | | Genuine Parts Co. | | | (3,427,200 | ) |
| | | | | | | | |
| | |
| | | | Electric Utilities — (1.6)% | | | |
| | (27,580 | ) | | Edison International | | | (1,913,776 | ) |
| | (28,340 | ) | | El Paso Electric Co. | | | (1,616,797 | ) |
See Notes to Financial Statements.
THE GLENMEDE FUND, INC.
Quantitative U.S. Long/Short Equity Portfolio
SCHEDULE OF PORTFOLIO INVESTMENTS — (Continued)
October 31, 2018
| | | | | | | | |
| Shares | | | | | Value | |
| |
| COMMON STOCKS SOLD SHORT* — (Continued) | | | |
| | | | Electric Utilities — (Continued) | | | |
| | (43,200 | ) | | Southern Co. (The) | | $ | (1,945,296 | ) |
| | | | | | | | |
| | | | | | | (5,475,869 | ) |
| | | | | | | | |
| | |
| | | | Electronic Equipment, Instruments & Components — (0.6)% | | | |
| | (38,960 | ) | | National Instruments Corp. | | | (1,907,871 | ) |
| | | | | | | | |
| | |
| | | | Equity Real Estate Investment Trusts — (4.3)% | | | |
| | (75,260 | ) | | Acadia Realty Trust | | | (2,095,239 | ) |
| | (3,915 | ) | | Equinix, Inc. | | | (1,482,767 | ) |
| | (48,040 | ) | | Kilroy Realty Corp. | | | (3,308,995 | ) |
| | (13,300 | ) | | Public Storage | | | (2,732,751 | ) |
| | (20,660 | ) | | SBA Communications Corp.1 | | | (3,350,432 | ) |
| | (17,920 | ) | | Vornado Realty Trust | | | (1,219,994 | ) |
| | | | | | | | |
| | | | | | | (14,190,178 | ) |
| | | | | | | | |
| | |
| | | | Food & Staples Retailing — (0.8)% | | | |
| | (38,107 | ) | | PriceSmart, Inc. | | | (2,673,206 | ) |
| | | | | | | | |
| | |
| | | | Health Care Equipment & Supplies — (6.8)% | | | |
| | (14,960 | ) | | Becton Dickinson & Co. | | | (3,448,280 | ) |
| | (14,860 | ) | | Cooper Cos., Inc. (The) | | | (3,838,486 | ) |
| | (49,440 | ) | | DENTSPLY SIRONA, Inc. | | | (1,712,107 | ) |
| | (23,560 | ) | | Edwards Lifesciences Corp.1 | | | (3,477,456 | ) |
| | (15,380 | ) | | IDEXX Laboratories, Inc.1 | | | (3,262,406 | ) |
| | (40,800 | ) | | Medtronic PLC | | | (3,664,656 | ) |
| | (20,780 | ) | | Stryker Corp. | | | (3,370,932 | ) |
| | | | | | | | |
| | | | | | | (22,774,323 | ) |
| | | | | | | | |
| | |
| | | | Health Care Providers & Services — (0.8)% | | | |
| | (67,700 | ) | | MEDNAX, Inc.1 | | | (2,795,333 | ) |
| | | | | | | | |
| | |
| | | | Hotels, Restaurants & Leisure — (2.5)% | | | |
| | (9,340 | ) | | Chipotle Mexican Grill, Inc.1 | | | (4,299,482 | ) |
| | (28,400 | ) | | Jack in the Box, Inc. | | | (2,241,612 | ) |
| | (10,640 | ) | | McDonald’s Corp. | | | (1,882,216 | ) |
| | | | | | | | |
| | | | | | | (8,423,310 | ) |
| | | | | | | | |
| | |
| | | | Household Durables — (1.3)% | | | |
| | (117,600 | ) | | Newell Brands, Inc. | | | (1,867,488 | ) |
| | (21,980 | ) | | Whirlpool Corp. | | | (2,412,525 | ) |
| | | | | | | | |
| | | | | | | (4,280,013 | ) |
| | | | | | | | |
| | |
| | | | Household Products — (0.7)% | | | |
| | (40,920 | ) | | Colgate-Palmolive Co. | | | (2,436,786 | ) |
| | | | | | | | |
| | |
| | | | Industrial Conglomerates — (1.6)% | | | |
| | (16,480 | ) | | 3M Co. | | | (3,135,485 | ) |
| | (218,960 | ) | | General Electric Co. | | | (2,211,496 | ) |
| | | | | | | | |
| | | | | | | (5,346,981 | ) |
| | | | | | | | |
| | |
| | | | Insurance — (3.0)% | | | |
| | (61,160 | ) | | American International Group, Inc. | | | (2,525,296 | ) |
| | (2,900 | ) | | Markel Corp.1 | | | (3,170,396 | ) |
| | (70,780 | ) | | Mercury General Corp. | | | (4,197,962 | ) |
| | | | | | | | |
| | | | | | | (9,893,654 | ) |
| | | | | | | | |
| | |
| | | | IT Services — (1.8)% | | | |
| | (42,710 | ) | | Fiserv, Inc.1 | | | (3,386,903 | ) |
| | (23,180 | ) | | International Business Machines Corp. | | | (2,675,667 | ) |
| | | | | | | | |
| | | | | | | (6,062,570 | ) |
| | | | | | | | |
See Notes to Financial Statements.
THE GLENMEDE FUND, INC.
Quantitative U.S. Long/Short Equity Portfolio
SCHEDULE OF PORTFOLIO INVESTMENTS — (Continued)
October 31, 2018
| | | | | | | | |
| Shares | | | | | Value | |
| |
| COMMON STOCKS SOLD SHORT* — (Continued) | | | |
| | | | Leisure Product — (1.1)% | | | |
| | (37,940 | ) | | Hasbro, Inc | | $ | (3,479,477 | ) |
| | | | | | | | |
| | |
| | | | Life Sciences Tools & Services — (1.0)% | | | |
| | (17,480 | ) | | Waters Corp.1 | | | (3,315,781 | ) |
| | | | | | | | |
| | |
| | | | Machinery — (1.1)% | | | |
| | (73,820 | ) | | Donaldson Co., Inc. | | | (3,785,490 | ) |
| | | | | | | | |
| | |
| | | | Media — (1.4)% | | | |
| | (52,660 | ) | | John Wiley & Sons, Inc. — Class A | | | (2,856,278 | ) |
| | (69,500 | ) | | New York Times Co. (The) — Class A | | | (1,834,800 | ) |
| | | | | | | | |
| | | | | | | (4,691,078 | ) |
| | | | | | | | |
| | |
| | | | Multi-Utilities — (1.1)% | | | |
| | (68,680 | ) | | NiSource, Inc. | | | (1,741,725 | ) |
| | (17,220 | ) | | Sempra Energy | | | (1,896,266 | ) |
| | | | | | | | |
| | | | | | | (3,637,991 | ) |
| | | | | | | | |
| | |
| | | | Oil, Gas & Consumable Fuels — (2.5)% | | | |
| | (52,340 | ) | | Cheniere Energy, Inc.1 | | | (3,161,860 | ) |
| | (204,060 | ) | | Kinder Morgan, Inc. | | | (3,473,101 | ) |
| | (25,900 | ) | | ONEOK, Inc. | | | (1,699,040 | ) |
| | | | | | | | |
| | | | | | | (8,334,001 | ) |
| | | | | | | | |
| | |
| | | | Personal Products — (0.5)% | | | |
| | (12,520 | ) | | Estee Lauder Cos., Inc. (The) — Class A | | | (1,720,749 | ) |
| | | | | | | | |
| | |
| | | | Pharmaceuticals — (2.7)% | | | |
| | (27,580 | ) | | Johnson & Johnson | | | (3,860,924 | ) |
| | (89,920 | ) | | Mylan N.V.1 | | | (2,810,000 | ) |
| | (31,100 | ) | | Perrigo Co. PLC | | | (2,186,330 | ) |
| | | | | | | | |
| | | | | | | (8,857,254 | ) |
| | | | | | | | |
| | |
| | | | Road & Rail — (1.6)% | | | |
| | (6,640 | ) | | AMERCO | | | (2,167,827 | ) |
| | (28,420 | ) | | JB Hunt Transport Services, Inc. | | | (3,143,536 | ) |
| | | | | | | | |
| | | | | | | (5,311,363 | ) |
| | | | | | | | |
| | |
| | | | Semiconductors & Semiconductor Equipment — (1.0)% | | | |
| | (189,120 | ) | | Advanced Micro Devices, Inc.1 | | | (3,443,875 | ) |
| | | | | | | | |
| | |
| | | | Software — (4.4)% | | | |
| | (27,360 | ) | | Autodesk, Inc.1 | | | (3,536,280 | ) |
| | (16,800 | ) | | Fair Isaac Corp.1 | | | (3,237,528 | ) |
| | (41,960 | ) | | PTC, Inc.1 | | | (3,457,924 | ) |
| | (23,140 | ) | | salesforce.com, Inc.1 | | | (3,175,734 | ) |
| | (5,540 | ) | | Tyler Technologies, Inc.1 | | | (1,172,596 | ) |
| | | | | | | | |
| | | | | | | (14,580,062 | ) |
| | | | | | | | |
| | |
| | | | Specialty Retail — (1.9)% | | | |
| | (33,940 | ) | | CarMax, Inc.1 | | | (2,304,865 | ) |
| | (122,820 | ) | | L Brands, Inc | | | (3,981,825 | ) |
| | | | | | | | |
| | | | | | | (6,286,690 | ) |
| | | | | | | | |
| | |
| | | | Technology Hardware, Storage & Peripherals — (1.1)% | | | |
| | (133,760 | ) | | Xerox Corp. | | | (3,727,891 | ) |
| | | | | | | | |
See Notes to Financial Statements.
THE GLENMEDE FUND, INC.
Quantitative U.S. Long/Short Equity Portfolio
SCHEDULE OF PORTFOLIO INVESTMENTS — (Continued)
October 31, 2018
| | | | | | | | |
| Shares | | | | | Value | |
| |
| COMMON STOCKS SOLD SHORT* — (Continued) | | | |
| | | | Thrifts & Mortgage Finance — (0.7)% | | | |
| | (70,480 | ) | | Flagstar Bancorp, Inc.1 | | $ | (2,170,079 | ) |
| | | | | | | | |
| | |
| | | | TOTAL COMMON STOCKS SOLD SHORT
(Proceeds $(230,524,116)) | | | (216,634,909 | ) |
| | | | | | | | |
| | | | | | | | | | |
| | |
TOTAL SHORT INVESTMENTS
(Proceeds $(230,524,116)) | | | (64.9 | )% | | $ | (216,634,909 | ) |
| | |
TOTAL INVESTMENTS
(Cost $61,995,230) | | | 36.1 | % | | $ | 120,365,165 | |
| | |
OTHER ASSETS IN EXCESS OF LIABILITIES | | | 63.9 | | | | 213,440,571 | |
| | | | | | | | |
| | |
NET ASSETS | | | 100.0 | % | | $ | 333,805,736 | |
| | | | | | | | |
| * | Percentages indicated are based on net assets. |
| 1 | Non income-producing security. |
| 2 | All or portion of security pledged as collateral for securities sold short. The total market value of collateral is $49,080,487. |
| 3 | Securities or partial securities on loan. See Note 1. |
See Notes to Financial Statements.
THE GLENMEDE FUND, INC.
Quantitative U.S. Long/Short Equity Portfolio
SCHEDULE OF PORTFOLIO INVESTMENTS — (Continued)
October 31, 2018
INDUSTRY DIVERSIFICATION
On October 31, 2018, industry diversification of the Portfolio was as follows:
| | | | | | | | |
| | | % of
Net Assets | | | Value | |
| INDUSTRIES: | | | | | | |
| Long Positions: | | | | | | |
Health Care Providers & Services | | | 8.0 | % | | $ | 26,715,240 | |
IT Services | | | 6.5 | | | | 21,865,388 | |
Banks | | | 6.1 | | | | 20,388,151 | |
Insurance | | | 4.7 | | | | 15,637,559 | |
Oil, Gas & Consumable Fuels | | | 3.8 | | | | 12,862,130 | |
Specialty Retail | | | 3.8 | | | | 12,686,342 | |
Machinery | | | 3.7 | | | | 12,286,059 | |
Equity Real Estate Investment Trusts | | | 3.6 | | | | 12,127,762 | |
Semiconductors & Semiconductor Equipment | | | 3.3 | | | | 11,154,034 | |
Chemicals | | | 2.9 | | | | 9,823,410 | |
Media | | | 2.9 | | | | 9,565,853 | |
Multi-Utilities | | | 2.7 | | | | 9,179,925 | |
Electronic Equipment, Instruments & Components | | | 2.7 | | | | 9,141,701 | |
Life Sciences Tools & Services | | | 2.7 | | | | 9,121,364 | |
Food Products | | | 2.4 | | | | 7,911,150 | |
Software | | | 2.4 | | | | 7,902,529 | |
Hotels, Restaurants & Leisure | | | 2.4 | | | | 7,867,730 | |
Biotechnology | | | 2.3 | | | | 7,773,879 | |
Food & Staples Retailing | | | 2.2 | | | | 7,217,969 | |
Construction & Engineering | | | 2.0 | | | | 6,652,922 | |
Paper & Forest Products | | | 1.8 | | | | 6,019,259 | |
Electric Utilities | | | 1.8 | | | | 5,986,287 | |
Capital Markets | | | 1.7 | | | | 5,687,064 | |
Health Care Equipment & Supplies | | | 1.6 | | | | 5,309,599 | |
Professional Services | | | 1.4 | | | | 4,732,431 | |
Consumer Finance | | | 1.4 | | | | 4,724,916 | |
Commercial Services & Supplies | | | 1.3 | | | | 4,262,222 | |
Communications Equipment | | | 1.2 | | | | 3,993,060 | |
Electrical Equipment | | | 1.2 | | | | 3,969,875 | |
Diversified Consumer Services | | | 1.0 | | | | 3,446,986 | |
Air Freight & Logistics | | | 1.0 | | | | 3,223,296 | |
Beverages | | | 1.0 | | | | 3,219,622 | |
Pharmaceuticals | | | 0.9 | | | | 3,136,106 | |
Metals & Mining | | | 0.9 | | | | 2,977,603 | |
Real Estate Management & Development | | | 0.9 | | | | 2,932,306 | |
Household Products | | | 0.9 | | | | 2,850,947 | |
Containers & Packaging | | | 0.8 | | | | 2,688,203 | |
Textiles, Apparel & Luxury Goods | | | 0.6 | | | | 2,050,170 | |
Interactive Media & Service | | | 0.6 | | | | 1,995,412 | |
Diversified Telecommunication Services | | | 0.6 | | | | 1,937,749 | |
Multi-line Retail | | | 0.6 | | | | 1,906,764 | |
Independent Power & Renewable Electricity Producer | | | 0.6 | | | | 1,895,400 | |
Diversified Financial Services | | | 0.5 | | | | 1,797,661 | |
Personal Products | | | 0.5 | | | | 1,527,987 | |
| Short Positions: | | | | | | |
Personal Products | | | (0.5 | ) | | | (1,720,749 | ) |
Electronic Equipment, Instruments & Components | | | (0.6 | ) | | | (1,907,871 | ) |
Thrifts & Mortgage Finance | | | (0.7 | ) | | | (2,170,079 | ) |
Communications Equipment | | | (0.7 | ) | | | (2,328,640 | ) |
Household Products | | | (0.7 | ) | | | (2,436,786 | ) |
Air Freight & Logistics | | | (0.8 | ) | | | (2,533,910 | ) |
Food & Staples Retailing | | | (0.8 | ) | | | (2,673,206 | ) |
Health Care Providers & Services | | | (0.8 | ) | | | (2,795,333 | ) |
See Notes to Financial Statements.
THE GLENMEDE FUND, INC.
Quantitative U.S. Long/Short Equity Portfolio
SCHEDULE OF PORTFOLIO INVESTMENTS — (Concluded)
October 31, 2018
| | | | | | | | |
| | | % of
Net Assets | | | Value | |
| INDUSTRIES: — (Continued) | | | | | | |
| Short Positions: — (Continued) | | | | | | |
Aerospace & Defense | | | (0.9 | )% | | $ | (3,124,165 | ) |
Life Sciences Tools & Services | | | (1.0 | ) | | | (3,315,781 | ) |
Distributors | | | (1.0 | ) | | | (3,427,200 | ) |
Semiconductors & Semiconductor Equipment | | | (1.0 | ) | | | (3,443,875 | ) |
Leisure Product | | | (1.1 | ) | | | (3,479,477 | ) |
Multi-Utilities | | | (1.1 | ) | | | (3,637,991 | ) |
Construction Materials | | | (1.1 | ) | | | (3,661,262 | ) |
Technology Hardware, Storage & Peripherals | | | (1.1 | ) | | | (3,727,891 | ) |
Machinery | | | (1.1 | ) | | | (3,785,490 | ) |
Household Durables | | | (1.3 | ) | | | (4,280,013 | ) |
Media | | | (1.4 | ) | | | (4,691,078 | ) |
Road & Rail | | | (1.6 | ) | | | (5,311,363 | ) |
Industrial Conglomerates | | | (1.6 | ) | | | (5,346,981 | ) |
Electric Utilities | | | (1.6 | ) | | | (5,475,869 | ) |
IT Services | | | (1.8 | ) | | | (6,062,570 | ) |
Beverages | | | (1.8 | ) | | | (6,081,455 | ) |
Specialty Retail | | | (1.9 | ) | | | (6,286,690 | ) |
Capital Markets | | | (2.0 | ) | | | (6,804,176 | ) |
Commercial Services & Supplies | | | (2.2 | ) | | | (7,333,964 | ) |
Oil, Gas & Consumable Fuels | | | (2.5 | ) | | | (8,334,001 | ) |
Hotels, Restaurants & Leisure | | | (2.5 | ) | | | (8,423,310 | ) |
Pharmaceuticals | | | (2.7 | ) | | | (8,857,254 | ) |
Chemicals | | | (2.8 | ) | | | (9,277,323 | ) |
Insurance | | | (3.0 | ) | | | (9,893,654 | ) |
Banks | | | (3.7 | ) | | | (12,460,939 | ) |
Equity Real Estate Investment Trusts | | | (4.3 | ) | | | (14,190,178 | ) |
Software | | | (4.4 | ) | | | (14,580,062 | ) |
Health Care Equipment & Supplies | | | (6.8 | ) | | | (22,774,323 | ) |
| | | | | | | | |
TOTAL COMMON STOCKS | | | 31.0 | % | | $ | 103,517,113 | |
| | |
REPURCHASE AGREEMENT | | | 3.5 | | | | 11,456,016 | |
| | |
INVESTMENT OF SECURITY LENDING COLLATERAL | | | 1.6 | | | | 5,392,036 | |
| | | | | | | | |
TOTAL INVESTMENTS | | | 36.1 | % | | $ | 120,365,165 | |
| | | | | | | | |
See Notes to Financial Statements.
THE GLENMEDE FUND, INC.
Quantitative U.S. Total Market Equity Portfolio
SCHEDULE OF PORTFOLIO INVESTMENTS
October 31, 2018
| | | | | | | | |
| Shares | | | | | Value | |
| |
| COMMON STOCKS* — 124.5% | | | |
| | | | Air Freight & Logistics — 1.1% | |
| | 15,340 | | | Expeditors International of Washington, Inc. | | $ | 1,030,541 | |
| | | | | | | | |
| |
| | | | Airlines — 0.7% | |
| | 10,380 | | | SkyWest, Inc. | | | 594,670 | |
| | | | | | | | |
| |
| | | | Auto Components — 0.0% | |
| | 736 | | | Garrett Motion, Inc.1 | | | 11,165 | |
| | | | | | | | |
| |
| | | | Banks — 8.9% | |
| | 36,300 | | | Bank of America Corp. | | | 998,250 | |
| | 20,480 | | | Citizens Financial Group, Inc. | | | 764,928 | |
| | 4,780 | | | Comerica, Inc. | | | 389,857 | |
| | 5,960 | | | East West Bancorp, Inc. | | | 312,542 | |
| | 48,380 | | | Fifth Third Bancorp2 | | | 1,305,776 | |
| | 10,097 | | | JPMorgan Chase & Co. | | | 1,100,775 | |
| | 62,060 | | | KeyCorp2 | | | 1,127,010 | |
| | 24,700 | | | SunTrust Banks, Inc.2 | | | 1,547,702 | |
| | 10,800 | | | Zions Bancorp N.A. | | | 508,140 | |
| | | | | | | | |
| | | | | | | 8,054,980 | |
| | | | | | | | |
| |
| | | | Beverages — 1.2% | |
| | 20,440 | | | Monster Beverage Corp.1 | | | 1,080,254 | |
| | | | | | | | |
| |
| | | | Biotechnology — 2.8% | |
| | 22,700 | | | Emergent BioSolutions, Inc.1,2 | | | 1,389,013 | |
| | 16,860 | | | Gilead Sciences, Inc. | | | 1,149,515 | |
| | | | | | | | |
| | | | | | | 2,538,528 | |
| | | | | | | | |
| |
| | | | Building Products — 0.0% | |
| | 1,227 | | | Resideo Technologies, Inc.1 | | | 25,821 | |
| | | | | | | | |
| |
| | | | Capital Markets — 2.9% | |
| | 7,660 | | | CME Group, Inc.2 | | | 1,403,619 | |
| | 8,680 | | | Evercore, Inc. — Class A | | | 709,069 | |
| | 28,300 | | | Waddell & Reed Financial, Inc. — Class A | | | 539,681 | |
| | | | | | | | |
| | | | | | | 2,652,369 | |
| | | | | | | | |
| |
| | | | Chemicals — 1.9% | |
| | 40,100 | | | Huntsman Corp. | | | 877,388 | |
| | 9,156 | | | LyondellBasell Industries N.V. — Class A | | | 817,356 | |
| | | | | | | | |
| | | | | | | 1,694,744 | |
| | | | | | | | |
| |
| | | | Communications Equipment — 2.1% | |
| | 42,100 | | | Cisco Systems, Inc.2 | | | 1,926,075 | |
| | | | | | | | |
| |
| | | | Construction & Engineering — 1.6% | |
| | 20,340 | | | EMCOR Group, Inc.2 | | | 1,443,733 | |
| | | | | | | | |
| |
| | | | Consumer Finance — 1.9% | |
| | 28,820 | | | Ally Financial, Inc. | | | 732,316 | |
| | 5,800 | | | Discover Financial Services | | | 404,086 | |
| | 53,800 | | | SLM Corp.1 | | | 545,532 | |
| | | | | | | | |
| | | | | | | 1,681,934 | |
| | | | | | | | |
| |
| | | | Containers & Packaging — 2.6% | |
| | 15,560 | | | Avery Dennison Corp.2 | | | 1,411,603 | |
| | 22,000 | | | WestRock Co. | | | 945,340 | |
| | | | | | | | |
| | | | | | | 2,356,943 | |
| | | | | | | | |
| |
| | | | Diversified Consumer Services — 1.0% | |
| | 22,560 | | | Service Corp. International | | | 935,563 | |
| | | | | | | | |
See Notes to Financial Statements.
THE GLENMEDE FUND, INC.
Quantitative U.S. Total Market Equity Portfolio
SCHEDULE OF PORTFOLIO INVESTMENTS — (Continued)
October 31, 2018
| | | | | | | | |
| Shares | | | | | Value | |
| |
| COMMON STOCKS* — (Continued) | | | |
| | | | Diversified Financial Services — 0.9% | | | |
| | 19,500 | | | Voya Financial, Inc. | | $ | 853,320 | |
| | | | | | | | |
| | |
| | | | Diversified Telecommunication Services — 2.1% | | | |
| | 29,020 | | | AT&T, Inc. | | | 890,334 | |
| | 26,800 | | | CenturyLink, Inc. | | | 553,152 | |
| | 8,700 | | | Verizon Communications, Inc. | | | 496,683 | |
| | | | | | | | |
| | | | | | | 1,940,169 | |
| | | | | | | | |
| | |
| | | | Electric Utilities — 2.0% | | | |
| | 29,220 | | | Exelon Corp.2 | | | 1,280,128 | |
| | 13,620 | | | Hawaiian Electric Industries, Inc. | | | 508,026 | |
| | | | | | | | |
| | | | | | | 1,788,154 | |
| | | | | | | | |
| | |
| | | | Electrical Equipment — 1.2% | | | |
| | 16,080 | | | AMETEK, Inc. | | | 1,078,646 | |
| | | | | | | | |
| | |
| | | | Electronic Equipment, Instruments & Components — 2.1% | | | |
| | 9,680 | | | Arrow Electronics, Inc.1 | | | 655,433 | |
| | 17,520 | | | Tech Data Corp.1 | | | 1,237,963 | |
| | | | | | | | |
| | | | | | | 1,893,396 | |
| | | | | | | | |
| | |
| | | | Entertainment — 1.1% | | | |
| | 32,500 | | | Viacom, Inc. — Class B | | | 1,039,350 | |
| | | | | | | | |
| | |
| | | | Equity Real Estate Investment Trusts — 4.2% | | | |
| | 6,680 | | | EPR Properties | | | 459,183 | |
| | 38,038 | | | Hospitality Properties Trust | | | 974,534 | |
| | 60,780 | | | Host Hotels & Resorts, Inc.2 | | | 1,161,506 | |
| | 6,200 | | | National Health Investors, Inc. REIT | | | 455,452 | |
| | 24,860 | | | Park Hotels & Resorts, Inc. | | | 722,680 | |
| | | | | | | | |
| | | | | | | 3,773,355 | |
| | | | | | | | |
| | |
| | | | Food & Staples Retailing — 3.5% | | | |
| | 15,640 | | | Sysco Corp. | | | 1,115,601 | |
| | 14,060 | | | Walgreens Boots Alliance, Inc. | | | 1,121,566 | |
| | 9,620 | | | Walmart, Inc. | | | 964,694 | |
| | | | | | | | |
| | | | | | | 3,201,861 | |
| | | | | | | | |
| | |
| | | | Food Products — 3.0% | | | |
| | 21,660 | | | Conagra Brands, Inc. | | | 771,096 | |
| | 28,920 | | | General Mills, Inc.2 | | | 1,266,696 | |
| | 16,560 | | | Hormel Foods Corp. | | | 722,678 | |
| | | | | | | | |
| | | | | | | 2,760,470 | |
| | | | | | | | |
| | |
| | | | Health Care Equipment & Supplies — 1.1% | | | |
| | 16,620 | | | Baxter International, Inc. | | | 1,038,916 | |
| | | | | | | | |
| | |
| | | | Health Care Providers & Services — 7.4% | | | |
| | 10,640 | | | Amedisys, Inc.1 | | | 1,170,400 | |
| | 3,640 | | | Anthem, Inc. | | | 1,003,075 | |
| | 4,020 | | | Centene Corp.1 | | | 523,886 | |
| | 6,800 | | | CVS Health Corp. | | | 492,252 | |
| | 13,380 | | | Molina Healthcare, Inc.1,2 | | | 1,696,183 | |
| | 6,700 | | | WellCare Health Plans, Inc.1,2 | | | 1,849,133 | |
| | | | | | | | |
| | | | | | | 6,734,929 | |
| | | | | | | | |
| | |
| | | | Hotels, Restaurants & Leisure — 2.6% | | | |
| | 14,350 | | | Hilton Worldwide Holdings, Inc. | | | 1,021,289 | |
| | 15,340 | | | Wyndham Destinations, Inc. | | | 550,399 | |
See Notes to Financial Statements.
THE GLENMEDE FUND, INC.
Quantitative U.S. Total Market Equity Portfolio
SCHEDULE OF PORTFOLIO INVESTMENTS — (Continued)
October 31, 2018
| | | | | | | | |
| Shares | | | | | Value | |
| |
| COMMON STOCKS* — (Continued) | | | |
| | | | Hotels, Restaurants & Leisure — (Continued) | |
| | 15,340 | | | Wyndham Hotels & Resorts, Inc. | | $ | 756,109 | |
| | | | | | | | |
| | | | | | | 2,327,797 | |
| | | | | | | | |
| | |
| | | | Household Products — 1.4% | | | |
| | 20,900 | | | Church & Dwight Co., Inc. | | | 1,240,833 | |
| | | | | | | | |
| | |
| | | | Independent Power & Renewable Electricity Producer — 1.2% | | | |
| | 72,300 | | | AES Corp. | | | 1,054,134 | |
| | | | | | | | |
| | |
| | | | Industrial Conglomerates — 1.2% | | | |
| | 7,360 | | | Honeywell International, Inc. | | | 1,065,875 | |
| | | | | | | | |
| | |
| | | | Insurance — 4.4% | | | |
| | 26,960 | | | Aflac, Inc. | | | 1,161,167 | |
| | 26,380 | | | MetLife, Inc. | | | 1,086,592 | |
| | 7,380 | | | Travelers Cos., Inc. (The) | | | 923,460 | |
| | 21,780 | | | Unum Group | | | 789,743 | |
| | | | | | | | |
| | | | | | | 3,960,962 | |
| | | | | | | | |
| | |
| | | | Interactive Media & Service — 1.3% | | | |
| | 27,060 | | | Yelp, Inc.1 | | | 1,158,709 | |
| | | | | | | | |
| | |
| | | | IT Services — 7.5% | | | |
| | 20,120 | | | Amdocs, Ltd.2 | | | 1,272,992 | |
| | 16,920 | | | Cognizant Technology Solutions Corp. — Class A | | | 1,167,988 | |
| | 15,348 | | | Conduent, Inc.1 | | | 293,147 | |
| | 4,920 | | | FleetCor Technologies, Inc.1 | | | 984,148 | |
| | 49,500 | | | Genpact, Ltd.2 | | | 1,356,795 | |
| | 8,080 | | | ManTech International Corp. — Class A | | | 462,822 | |
| | 13,580 | | | MAXIMUS, Inc. | | | 882,293 | |
| | 2,800 | | | Visa, Inc. — Class A. | | | 385,980 | |
| | | | | | | | |
| | | | | | | 6,806,165 | |
| | | | | | | | |
| | |
| | | | Life Sciences Tools & Services — 3.1% | | | |
| | 13,700 | | | Charles River Laboratories International, Inc.1,2 | | | 1,668,934 | |
| | 13,300 | | | Luminex Corp. | | | 382,641 | |
| | 15,260 | | | Medpace Holdings, Inc.1 | | | 795,046 | |
| | | | | | | | |
| | | | | | | 2,846,621 | |
| | | | | | | | |
| | |
| | | | Machinery — 5.1% | | | |
| | 8,960 | | | AGCO Corp. | | | 502,118 | |
| | 9,020 | | | Crane Co. | | | 785,101 | |
| | 9,220 | | | Fortive Corp. | | | 684,585 | |
| | 9,160 | | | IDEX Corp.2 | | | 1,161,671 | |
| | 11,660 | | | Ingersoll-Rand PLC | | | 1,118,661 | |
| | 11,300 | | | Terex Corp. | | | 377,307 | |
| | | | | | | | |
| | | | | | | 4,629,443 | |
| | | | | | | | |
| | |
| | | | Media — 3.9% | | | |
| | 35,320 | | | Comcast Corp. — Class A2 | | | 1,347,105 | |
| | 51,840 | | | Interpublic Group of Cos., Inc. (The) | | | 1,200,614 | |
| | 74,480 | | | News Corp. — Class A | | | 982,391 | |
| | | | | | | | |
| | | | | | | 3,530,110 | |
| | | | | | | | |
| | |
| | | | Metals & Mining — 1.1% | | | |
| | 24,520 | | | Steel Dynamics, Inc. | | | 970,992 | |
| | | | | | | | |
| | |
| | | | Multi-line Retail — 2.2% | | | |
| | 14,910 | | | Kohl’s Corp. | | | 1,129,135 | |
See Notes to Financial Statements.
THE GLENMEDE FUND, INC.
Quantitative U.S. Total Market Equity Portfolio
SCHEDULE OF PORTFOLIO INVESTMENTS — (Continued)
October 31, 2018
| | | | | | | | |
| Shares | | | | | Value | |
| |
| COMMON STOCKS* — (Continued) | | | |
| | | | Multi-line Retail — (Continued) | | | |
| | 9,840 | | | Target Corp. | | $ | 822,919 | |
| | | | | | | | |
| | | | | | | 1,952,054 | |
| | | | | | | | |
| | |
| | | | Multi-Utilities — 1.9% | | | |
| | 8,540 | | | DTE Energy Co. | | | 959,896 | |
| | 30,080 | | | MDU Resources Group, Inc. | | | 750,797 | |
| | | | | | | | |
| | | | | | | 1,710,693 | |
| | | | | | | | |
| | |
| | | | Oil, Gas & Consumable Fuels — 5.0% | | | |
| | 16,600 | | | ConocoPhillips | | | 1,160,340 | |
| | 16,740 | | | Marathon Petroleum Corp.2 | | | 1,179,333 | |
| | 3,700 | | | Phillips 66 | | | 380,434 | |
| | 32,280 | | | Range Resources Corp. | | | 511,638 | |
| | 14,300 | | | Valero Energy Corp.2 | | | 1,302,587 | |
| | | | | | | | |
| | | | | | | 4,534,332 | |
| | | | | | | | |
| | |
| | | | Paper & Forest Products — 0.7% | | | |
| | 13,920 | | | Domtar Corp. | | | 644,635 | |
| | | | | | | | |
| | |
| | | | Pharmaceuticals — 1.5% | | | |
| | 31,235 | | | Pfizer, Inc.2 | | | 1,344,979 | |
| | | | | | | | |
| | |
| | | | Professional Services — 2.0% | | | |
| | 11,160 | | | ManpowerGroup, Inc. | | | 851,396 | |
| | 15,520 | | | Robert Half International, Inc. | | | 939,426 | |
| | | | | | | | |
| | | | | | | 1,790,822 | |
| | | | | | | | |
| | |
| | | | Real Estate Management & Development — 1.1% | | | |
| | 25,320 | | | CBRE Group, Inc. — Class A1 | | | 1,020,143 | |
| | | | | | | | |
| | |
| | | | Road & Rail — 0.9% | | | |
| | 8,320 | | | Landstar System, Inc. | | | 832,749 | |
| | | | | | | | |
| | |
| | | | Semiconductors & Semiconductor Equipment — 4.6% | | | |
| | 9,000 | | | Intel Corp. | | | 421,920 | |
| | 18,320 | | | Micron Technology, Inc.1 | | | 691,030 | |
| | 3,420 | | | NVIDIA Corp. | | | 721,039 | |
| | 38,880 | | | ON Semiconductor Corp.1 | | | 660,960 | |
| | 22,660 | | | Teradyne, Inc. | | | 780,637 | |
| | 9,980 | | | Texas Instruments, Inc. | | | 926,443 | |
| | | | | | | | |
| | | | | | | 4,202,029 | |
| | | | | | | | |
| | |
| | | | Software — 3.3% | | | |
| | 9,140 | | | Citrix Systems, Inc.1 | | | 936,576 | |
| | 9,680 | | | Oracle Corp. | | | 472,771 | |
| | 18,000 | | | SS&C Technologies Holdings, Inc. | | | 920,880 | |
| | 13,889 | | | Verint Systems, Inc.1 | | | 634,311 | |
| | | | | | | | |
| | | | | | | 2,964,538 | |
| | | | | | | | |
| | |
| | | | Specialty Retail — 6.1% | | | |
| | 14,760 | | | Best Buy Co., Inc. | | | 1,035,562 | |
| | 6,300 | | | Home Depot, Inc. (The)2 | | | 1,108,044 | |
| | 9,580 | | | Lowe’s Cos., Inc. | | | 912,208 | |
| | 12,220 | | | Ross Stores, Inc. | | | 1,209,780 | |
| | 11,240 | | | TJX Cos., Inc. (The) | | | 1,235,051 | |
| | | | | | | | |
| | | | | | | 5,500,645 | |
| | | | | | | | |
| | |
| | | | Technology Hardware, Storage & Peripherals — 2.9% | | | |
| | 53,680 | | | Hewlett Packard Enterprise Co. | | | 818,620 | |
| | 19,400 | | | HP, Inc. | | | 468,316 | |
See Notes to Financial Statements.
THE GLENMEDE FUND, INC.
Quantitative U.S. Total Market Equity Portfolio
SCHEDULE OF PORTFOLIO INVESTMENTS — (Continued)
October 31, 2018
| | | | | | | | | | |
| Shares | | | | | Value | |
| |
| COMMON STOCKS* — (Continued) | | | |
| | | | Technology Hardware, Storage & Peripherals — (Continued) | | | |
| | 16,660 | | | NetApp, Inc.2 | | $ | 1,307,643 | |
| | | | | | | | |
| | | | | | | 2,594,579 | |
| | | | | | | | |
| | |
| | | | Textiles, Apparel & Luxury Goods — 1.2% | | | |
| | 19,120 | | | Michael Kors Holdings, Ltd.1,2 | | | 1,059,439 | |
| | | | | | | | |
| | |
| | | | Trading Companies & Distributors — 1.0% | | | |
| | 18,820 | | | WESCO International, Inc.1 | | | 944,388 | |
| | | | | | | | |
| | |
| | | | TOTAL COMMON STOCKS
(Cost $93,588,418) | | | 112,817,552 | |
| | | | | | | | |
| | |
Face
Amount | | | | | | |
| |
| REPURCHASE AGREEMENT* — 0.9% | | | |
| $ | 822,770 | | | With Fixed Income Clearing Corp., dated 10/31/18, 0.42%, principal and interest in the amount of $822,780, due 11/1/18, (collateralized by a U.S. Treasury Note with a par value of $850,000, coupon rate of 2.375%, due 4/15/2021, market value of $840,756) | | | 822,770 | |
| | | | | | | | | | |
| | |
| | | | TOTAL REPURCHASE AGREEMENT
(Cost $822,770) | | | 822,770 | |
| | | | | | | | | | |
| | | | | | | | |
| | |
TOTAL LONG INVESTMENTS
(Cost $94,411,188) | | | 125.4 | % | | $ | 113,640,322 | |
| | | | | | | | |
| | | | | | | | |
| | |
| Shares | | | | | | |
| |
| COMMON STOCKS SOLD SHORT* — (25.4)% | | | |
| | | | Aerospace & Defense — (0.4)% | |
| | (1,000 | ) | | TransDigm Group, Inc.1 | | | (330,250 | ) |
| | | | | | | | |
| | |
| | | | Air Freight & Logistics — (0.3)% | | | |
| | (1,400 | ) | | FedEx Corp. | | | (308,476 | ) |
| | | | | | | | |
| | |
| | | | Airlines — (0.4)% | | | |
| | (5,520 | ) | | Alaska Air Group, Inc. | | | (339,038 | ) |
| | | | | | | | |
| | |
| | | | Banks — (2.4)% | | | |
| | (7,540 | ) | | Ameris Bancorp | | | (323,391 | ) |
| | (8,840 | ) | | Columbia Banking System, Inc. | | | (327,876 | ) |
| | (3,480 | ) | | First Republic Bank | | | (316,645 | ) |
| | (5,060 | ) | | Pinnacle Financial Partners, Inc. | | | (264,638 | ) |
| | (2,920 | ) | | Signature Bank | | | (320,908 | ) |
| | (4,420 | ) | | South State Corp. | | | (299,101 | ) |
| | (8,960 | ) | | Union Bankshares Corp. | | | (305,894 | ) |
| | | | | | | | |
| | | | | | | (2,158,453 | ) |
| | | | | | | | |
| | |
| | | | Beverages — (0.7)% | | | |
| | (7,480 | ) | | Brown-Forman Corp. — Class B | | | (346,623 | ) |
| | (5,900 | ) | | Coca-Cola Co. (The) | | | (282,492 | ) |
| | | | | | | | |
| | | | | | | (629,115 | ) |
| | | | | | | | |
| | |
| | | | Capital Markets — (0.6)% | | | |
| | (1,020 | ) | | Goldman Sachs Group, Inc. (The) | | | (229,877 | ) |
| | (1,780 | ) | | S&P Global, Inc. | | | (324,530 | ) |
| | | | | | | | |
| | | | | | | (554,407 | ) |
| | | | | | | | |
| | |
| | | | Chemicals — (1.5)% | | | |
| | (6,180 | ) | | DowDuPont, Inc. | | | (333,226 | ) |
| | (4,080 | ) | | FMC Corp. | | | (318,566 | ) |
| | (900 | ) | | NewMarket Corp. | | | (347,364 | ) |
See Notes to Financial Statements.
THE GLENMEDE FUND, INC.
Quantitative U.S. Total Market Equity Portfolio
SCHEDULE OF PORTFOLIO INVESTMENTS — (Continued)
October 31, 2018
| | | | | | | | |
| Shares | | | | | Value | |
| |
| COMMON STOCKS SOLD SHORT* — (Continued) | | | |
| | | | Chemicals — (Continued) | | | |
| | (900 | ) | | Sherwin-Williams Co. (The) | | $ | (354,123 | ) |
| | | | | | | | |
| | | | | | | (1,353,279 | ) |
| | | | | | | | |
| | |
| | | | Commercial Services & Supplies — (0.8)% | | | |
| | (6,660 | ) | | Healthcare Services Group, Inc. | | | (270,329 | ) |
| | (6,320 | ) | | HNI Corp. | | | (239,465 | ) |
| | (4,680 | ) | | Stericycle, Inc.1 | | | (233,860 | ) |
| | | | | | | | |
| | | | | | | (743,654 | ) |
| | | | | | | | |
| | |
| | | | Communications Equipment — (0.4)% | | | |
| | (2,980 | ) | | Motorola Solutions, Inc. | | | (365,229 | ) |
| | | | | | | | |
| | |
| | | | Construction Materials — (0.9)% | | | |
| | (3,420 | ) | | Eagle Materials, Inc. | | | (252,533 | ) |
| | (2,080 | ) | | Martin Marietta Materials, Inc. | | | (356,262 | ) |
| | (2,420 | ) | | Vulcan Materials Co. | | | (244,759 | ) |
| | | | | | | | |
| | | | | | | (853,554 | ) |
| | | | | | | | |
| | |
| | | | Distributors — (0.7)% | | | |
| | (2,920 | ) | | Genuine Parts Co. | | | (285,926 | ) |
| | (2,480 | ) | | Pool Corp. | | | (361,460 | ) |
| | | | | | | | |
| | | | | | | (647,386 | ) |
| | | | | | | | |
| | |
| | | | Electrical Equipment — (0.2)% | | | |
| | (1,100 | ) | | Acuity Brands, Inc. | | | (138,204 | ) |
| | | | | | | | |
| | |
| | | | Electronic Equipment, Instruments & Components — (0.8)% | | | |
| | (6,600 | ) | | Cognex Corp. | | | (282,744 | ) |
| | (8,700 | ) | | National Instruments Corp. | | | (426,039 | ) |
| | | | | | | | |
| | | | | | | (708,783 | ) |
| | | | | | | | |
| | |
| | | | Equity Real Estate Investment Trusts — (2.6)% | | | |
| | (8,120 | ) | | Acadia Realty Trust | | | (226,061 | ) |
| | (1,900 | ) | | Federal Realty Investment Trust | | | (235,695 | ) |
| | (5,200 | ) | | Kilroy Realty Corp. | | | (358,176 | ) |
| | (5,740 | ) | | Prologis, Inc. | | | (370,058 | ) |
| | (1,220 | ) | | Public Storage | | | (250,673 | ) |
| | (3,360 | ) | | Realty Income Corp. | | | (202,507 | ) |
| | (1,980 | ) | | SBA Communications Corp.1 | | | (321,097 | ) |
| | (3,500 | ) | | Ventas, Inc. | | | (203,140 | ) |
| | (2,900 | ) | | Vornado Realty Trust | | | (197,432 | ) |
| | | | | | | | |
| | | | | | | (2,364,839 | ) |
| | | | | | | | |
| | |
| | | | Food & Staples Retailing — (0.4)% | | | |
| | (4,520 | ) | | PriceSmart, Inc. | | | (317,078 | ) |
| | | | | | | | |
| | |
| | | | Health Care Equipment & Supplies — (1.4)% | | | |
| | (1,520 | ) | | Becton Dickinson & Co. | | | (350,360 | ) |
| | (1,380 | ) | | Cooper Cos., Inc. (The) | | | (356,468 | ) |
| | (5,920 | ) | | DENTSPLY SIRONA, Inc. | | | (205,010 | ) |
| | (3,280 | ) | | ResMed, Inc. | | | (347,417 | ) |
| | | | | | | | |
| | | | | | | (1,259,255 | ) |
| | | | | | | | |
| | |
| | | | Hotels, Restaurants & Leisure — (1.4)% | | | |
| | (700 | ) | | Chipotle Mexican Grill, Inc.1 | | | (322,231 | ) |
| | (2,940 | ) | | Jack in the Box, Inc. | | | (232,054 | ) |
| | (2,200 | ) | | McDonald’s Corp. | | | (389,180 | ) |
| | (12,280 | ) | | MGM Resorts International | | | (327,630 | ) |
| | | | | | | | |
| | | | | | | (1,271,095 | ) |
| | | | | | | | |
See Notes to Financial Statements.
THE GLENMEDE FUND, INC.
Quantitative U.S. Total Market Equity Portfolio
SCHEDULE OF PORTFOLIO INVESTMENTS — (Continued)
October 31, 2018
| | | | | | | | |
| Shares | | | | | Value | |
| |
| COMMON STOCKS SOLD SHORT* — (Continued) | | | |
| | | | Household Durables — (0.7)% | |
| | (1,580 | ) | | Mohawk Industries, Inc.1 | | $ | (197,073 | ) |
| | (12,980 | ) | | Newell Brands, Inc. | | | (206,123 | ) |
| | (2,300 | ) | | Whirlpool Corp. | | | (252,448 | ) |
| | | | | | | | |
| | | | | | | (655,644 | ) |
| | | | | | | | |
| | |
| | | | Household Products — (0.4)% | | | |
| | (5,840 | ) | | Colgate-Palmolive Co. | | | (347,772 | ) |
| | | | | | | | |
| | |
| | | | Industrial Conglomerates — (0.5)% | | | |
| | (1,660 | ) | | 3M Co. | | | (315,832 | ) |
| | (17,580 | ) | | General Electric Co. | | | (177,558 | ) |
| | | | | | | | |
| | | | | | | (493,390 | ) |
| | | | | | | | |
| | |
| | | | Insurance — (1.1)% | | | |
| | (3,940 | ) | | American International Group, Inc. | | | (162,683 | ) |
| | (3,720 | ) | | Cincinnati Financial Corp. | | | (292,541 | ) |
| | (300 | ) | | Markel Corp.1 | | | (327,972 | ) |
| | (4,120 | ) | | Mercury General Corp. | | | (244,357 | ) |
| | | | | | | | |
| | | | | | | (1,027,553 | ) |
| | | | | | | | |
| | |
| | | | IT Services — (0.6)% | | | |
| | (1,300 | ) | | International Business Machines Corp. | | | (150,059 | ) |
| | (5,320 | ) | | Paychex, Inc. | | | (348,407 | ) |
| | | | | | | | |
| | | | | | | (498,466 | ) |
| | | | | | | | |
| | |
| | | | Leisure Product — (0.6)% | | | |
| | (2,940 | ) | | Hasbro, Inc. | | | (269,628 | ) |
| | (3,340 | ) | | Polaris Industries, Inc. | | | (297,193 | ) |
| | | | | | | | |
| | | | | | | (566,821 | ) |
| | | | | | | | |
| | |
| | | | Machinery — (0.7)% | | | |
| | (2,580 | ) | | Illinois Tool Works, Inc. | | | (329,131 | ) |
| | (4,560 | ) | | Woodward, Inc. | | | (335,798 | ) |
| | | | | | | | |
| | | | | | | (664,929 | ) |
| | | | | | | | |
| | |
| | | | Multi-line Retail — (0.4)% | | | |
| | (8,540 | ) | | Big Lots, Inc. | | | (354,581 | ) |
| | | | | | | | |
| | |
| | | | Oil, Gas & Consumable Fuels — (0.4)% | | | |
| | (5,420 | ) | | ONEOK, Inc. | | | (355,552 | ) |
| | | | | | | | |
| | |
| �� | | | Pharmaceuticals — (0.2)% | | | |
| | (2,167 | ) | | Perrigo Co. PLC. | | | (152,340 | ) |
| | | | | | | | |
| | |
| | | | Professional Services — (0.6)% | | | |
| | (800 | ) | | CoStar Group, Inc.1 | | | (289,136 | ) |
| | (2,100 | ) | | Equifax, Inc. | | | (213,024 | ) |
| | | | | | | | |
| | | | | | | (502,160 | ) |
| | | | | | | | |
| | |
| | | | Road & Rail — (1.4)% | | | |
| | (880 | ) | | AMERCO | | | (287,302 | ) |
| | (3,180 | ) | | JB Hunt Transport Services, Inc. | | | (351,740 | ) |
| | (3,220 | ) | | Kansas City Southern | | | (328,311 | ) |
| | (10,200 | ) | | Knight-Swift Transportation Holdings, Inc. | | | (326,400 | ) |
| | | | | | | | |
| | | | | | | (1,293,753 | ) |
| | | | | | | | |
| | |
| | | | Software — (0.7)% | | | |
| | (2,400 | ) | | Autodesk, Inc.1 | | | (310,200 | ) |
| | (1,680 | ) | | Intuit, Inc. | | | (354,480 | ) |
| | | | | | | | |
| | | | | | | (664,680 | ) |
| | | | | | | | |
See Notes to Financial Statements.
THE GLENMEDE FUND, INC.
Quantitative U.S. Total Market Equity Portfolio
SCHEDULE OF PORTFOLIO INVESTMENTS — (Continued)
October 31, 2018
| | | | | | | | |
| Shares | | | | | Value | |
| |
| COMMON STOCKS SOLD SHORT* — (Continued) | | | |
| | | | Specialty Retail — (0.9)% | | | |
| | (5,080 | ) | | CarMax, Inc.1 | | $ | (344,983 | ) |
| | (13,560 | ) | | L Brands, Inc | | | (439,615 | ) |
| | | | | | | | |
| | | | | | | (784,598 | ) |
| | | | | | | | |
| | | | Thrifts & Mortgage Finance — (0.3)% | | | |
| | (9,680 | ) | | Flagstar Bancorp, Inc.1 | | | (298,047 | ) |
| | | | | | | | |
| | |
| | | | TOTAL COMMON STOCKS SOLD SHORT
(Proceeds $(25,995,799)) | | | (23,002,381 | ) |
| | | | | | | | |
| | | | | | | | |
| | |
TOTAL SHORT INVESTMENTS
(Proceeds $(25,995,799)) | | | (25.4 | )% | | $ | (23,002,381 | ) |
| | |
TOTAL INVESTMENTS
(Cost $68,415,389) | | | 100.0 | % | | $ | 90,637,941 | |
| | |
LIABILITIES IN EXCESS OF OTHER ASSETS | | | (0.0 | ) | | | (27,829 | ) |
| | | | | | | | |
| | |
NET ASSETS | | | 100.0 | % | | $ | 90,610,112 | |
| | | | | | | | |
| * | Percentages indicated are based on net assets. |
| 1 | Non income-producing security. |
| 2 | All or portion of security pledged as collateral for securities sold short. The total market value of collateral is $28,637,625. |
See Notes to Financial Statements.
THE GLENMEDE FUND, INC.
Quantitative U.S. Total Market Equity Portfolio
SCHEDULE OF PORTFOLIO INVESTMENTS — (Continued)
October 31, 2018
INDUSTRY DIVERSIFICATION
On October 31, 2018, industry diversification of the Portfolio was as follows:
| | | | | | | | |
| | | % of
Net Assets | | | Value | |
| INDUSTRIES: | | | | | | |
| Long Positions: | | | | | | |
Banks | | | 8.9 | % | | $ | 8,054,980 | |
IT Services | | | 7.5 | | | | 6,806,165 | |
Health Care Providers & Services | | | 7.4 | | | | 6,734,929 | |
Specialty Retail | | | 6.1 | | | | 5,500,645 | |
Machinery | | | 5.1 | | | | 4,629,443 | |
Oil, Gas & Consumable Fuels | | | 5.0 | | | | 4,534,332 | |
Semiconductors & Semiconductor Equipment | | | 4.6 | | | | 4,202,029 | |
Insurance | | | 4.4 | | | | 3,960,962 | |
Equity Real Estate Investment Trusts | | | 4.2 | | | | 3,773,355 | |
Media | | | 3.9 | | | | 3,530,110 | |
Food & Staples Retailing | | | 3.5 | | | | 3,201,861 | |
Software | | | 3.3 | | | | 2,964,538 | |
Life Sciences Tools & Services | | | 3.1 | | | | 2,846,621 | |
Food Products | | | 3.0 | | | | 2,760,470 | |
Capital Markets | | | 2.9 | | | | 2,652,369 | |
Technology Hardware, Storage & Peripherals | | | 2.9 | | | | 2,594,579 | |
Biotechnology | | | 2.8 | | | | 2,538,528 | |
Containers & Packaging | | | 2.6 | | | | 2,356,943 | |
Hotels, Restaurants & Leisure | | | 2.6 | | | | 2,327,797 | |
Multi-line Retail | | | 2.2 | | | | 1,952,054 | |
Diversified Telecommunication Services | | | 2.1 | | | | 1,940,169 | |
Communications Equipment | | | 2.1 | | | | 1,926,075 | |
Electronic Equipment, Instruments & Components | | | 2.1 | | | | 1,893,396 | |
Professional Services | | | 2.0 | | | | 1,790,822 | |
Electric Utilities | | | 2.0 | | | | 1,788,154 | |
Multi-Utilities | | | 1.9 | | | | 1,710,693 | |
Chemicals | | | 1.9 | | | | 1,694,744 | |
Consumer Finance | | | 1.9 | | | | 1,681,934 | |
Construction & Engineering | | | 1.6 | | | | 1,443,733 | |
Pharmaceuticals | | | 1.5 | | | | 1,344,979 | |
Household Products | | | 1.4 | | | | 1,240,833 | |
Interactive Media & Service | | | 1.3 | | | | 1,158,709 | |
Beverages | | | 1.2 | | | | 1,080,254 | |
Electrical Equipment | | | 1.2 | | | | 1,078,646 | |
Industrial Conglomerates | | | 1.2 | | | | 1,065,875 | |
Textiles, Apparel & Luxury Goods | | | 1.2 | | | | 1,059,439 | |
Independent Power & Renewable Electricity Producer | | | 1.2 | | | | 1,054,134 | |
Entertainment | | | 1.1 | | | | 1,039,350 | |
Health Care Equipment & Supplies | | | 1.1 | | | | 1,038,916 | |
Air Freight & Logistics | | | 1.1 | | | | 1,030,541 | |
Real Estate Management & Development | | | 1.1 | | | | 1,020,143 | |
Metals & Mining | | | 1.1 | | | | 970,992 | |
Trading Companies & Distributors | | | 1.0 | | | | 944,388 | |
Diversified Consumer Services | | | 1.0 | | | | 935,563 | |
Diversified Financial Services | | | 0.9 | | | | 853,320 | |
Road & Rail | | | 0.9 | | | | 832,749 | |
Paper & Forest Products | | | 0.7 | | | | 644,635 | |
Airlines | | | 0.7 | | | | 594,670 | |
Building Products | | | 0.0 | | | | 25,821 | |
Auto Components | | | 0.0 | | | | 11,165 | |
| | |
| Short Positions: | | | | | | |
Electrical Equipment | | | (0.2 | ) | | | (138,204 | ) |
Pharmaceuticals | | | (0.2 | ) | | | (152,340 | ) |
See Notes to Financial Statements.
THE GLENMEDE FUND, INC.
Quantitative U.S. Total Market Equity Portfolio
SCHEDULE OF PORTFOLIO INVESTMENTS — (Concluded)
October 31, 2018
| | | | | | | | |
| | | % of
Net Assets | | | Value | |
| INDUSTRIES: — (Continued) | | | | | | |
| Short Positions: — (Continued) | | | | | | |
Thrifts & Mortgage Finance | | | (0.3 | )% | | $ | (298,047 | ) |
Air Freight & Logistics | | | (0.3 | ) | | | (308,476 | ) |
Food & Staples Retailing | | | (0.4 | ) | | | (317,078 | ) |
Aerospace & Defense | | | (0.4 | ) | | | (330,250 | ) |
Airlines | | | (0.4 | ) | | | (339,038 | ) |
Household Products | | | (0.4 | ) | | | (347,772 | ) |
Multi-line Retail | | | (0.4 | ) | | | (354,581 | ) |
Oil, Gas & Consumable Fuels | | | (0.4 | ) | | | (355,552 | ) |
Communications Equipment | | | (0.4 | ) | | | (365,229 | ) |
Industrial Conglomerates | | | (0.5 | ) | | | (493,390 | ) |
IT Services | | | (0.6 | ) | | | (498,466 | ) |
Professional Services | | | (0.6 | ) | | | (502,160 | ) |
Capital Markets | | | (0.6 | ) | | | (554,407 | ) |
Leisure Product | | | (0.6 | ) | | | (566,821 | ) |
Beverages | | | (0.7 | ) | | | (629,115 | ) |
Distributors | | | (0.7 | ) | | | (647,386 | ) |
Household Durables | | | (0.7 | ) | | | (655,644 | ) |
Software | | | (0.7 | ) | | | (664,680 | ) |
Machinery | | | (0.7 | ) | | | (664,929 | ) |
Electronic Equipment, Instruments & Components | | | (0.8 | ) | | | (708,783 | ) |
Commercial Services & Supplies | | | (0.8 | ) | | | (743,654 | ) |
Specialty Retail | | | (0.9 | ) | | | (784,598 | ) |
Construction Materials | | | (0.9 | ) | | | (853,554 | ) |
Insurance | | | (1.1 | ) | | | (1,027,553 | ) |
Health Care Equipment & Supplies | | | (1.4 | ) | | | (1,259,255 | ) |
Hotels, Restaurants & Leisure | | | (1.4 | ) | | | (1,271,095 | ) |
Road & Rail | | | (1.4 | ) | | | (1,293,753 | ) |
Chemicals | | | (1.5 | ) | | | (1,353,279 | ) |
Banks | | | (2.4 | ) | | | (2,158,453 | ) |
Equity Real Estate Investment Trusts | | | (2.6 | ) | | | (2,364,839 | ) |
| | | | | | | | |
TOTAL COMMON STOCKS | | | 99.1 | % | | $ | 89,815,171 | |
| | |
REPURCHASE AGREEMENT | | | 0.9 | | | | 822,770 | |
| | | | | | | | |
TOTAL INVESTMENTS | | | 100.0 | % | | $ | 90,637,941 | |
| | | | | | | | |
See Notes to Financial Statements.
THE GLENMEDE FUND, INC.
Strategic Equity Portfolio
SCHEDULE OF PORTFOLIO INVESTMENTS
October 31, 2018
| | | | | | | | |
| Shares | | | | | Value | |
| |
| COMMON STOCKS* — 99.5% | | | |
| | | | Aerospace & Defense — 8.6% | | | |
| | 24,973 | | | Boeing Co. (The) | | $ | 8,861,919 | |
| | 33,996 | | | Raytheon Co. | | | 5,950,660 | |
| | 37,846 | | | United Technologies Corp. | | | 4,700,851 | |
| | | | | | | | |
| | | | | | | 19,513,430 | |
| | | | | | | | |
| | |
| | | | Banks — 6.9% | | | |
| | 52,064 | | | JPMorgan Chase & Co. | | | 5,676,017 | |
| | 37,219 | | | PNC Financial Services Group, Inc. (The) | | | 4,782,269 | |
| | 96,668 | | | Wells Fargo & Co. | | | 5,145,638 | |
| | | | | | | | |
| | | | | | | 15,603,924 | |
| | | | | | | | |
| | |
| | | | Beverages — 1.9% | | | |
| | 38,358 | | | PepsiCo, Inc. | | | 4,310,672 | |
| | | | | | | | |
| | |
| | | | Biotechnology — 4.3% | | | |
| | 17,401 | | | Biogen, Inc.1 | | | 5,294,602 | |
| | 66,096 | | | Gilead Sciences, Inc. | | | 4,506,426 | |
| | | | | | | | |
| | | | | | | 9,801,028 | |
| | | | | | | | |
| | |
| | | | Capital Markets — 3.6% | | | |
| | 201,642 | | | Invesco, Ltd. | | | 4,377,648 | |
| | 39,264 | | | Northern Trust Corp. | | | 3,693,564 | |
| | | | | | | | |
| | | | | | | 8,071,212 | |
| | | | | | | | |
| | |
| | | | Communications Equipment — 3.2% | | | |
| | 157,959 | | | Cisco Systems, Inc. | | | 7,226,624 | |
| | | | | | | | |
| | |
| | | | Consumer Finance — 3.2% | | | |
| | 26,568 | | | American Express Co. | | | 2,729,331 | |
| | 64,592 | | | Discover Financial Services | | | 4,500,124 | |
| | | | | | | | |
| | | | | | | 7,229,455 | |
| | | | | | | | |
| | |
| | | | Electrical Equipment — 2.7% | | | |
| | 92,494 | | | AMETEK, Inc. | | | 6,204,498 | |
| | | | | | | | |
| | |
| | | | Electronic Equipment, Instruments & Components — 2.2% | | | |
| | 54,967 | | | Amphenol Corp. — Class A | | | 4,919,547 | |
| | | | | | | | |
| | |
| | | | Energy Equipment & Services — 2.5% | | | |
| | 98,083 | | | Halliburton Co. | | | 3,401,518 | |
| | 41,589 | | | Schlumberger, Ltd. | | | 2,133,932 | |
| | | | | | | | |
| | | | | | | 5,535,450 | |
| | | | | | | | |
| | |
| | | | Food & Staples Retailing — 2.1% | | | |
| | 47,982 | | | Walmart, Inc. | | | 4,811,635 | |
| | | | | | | | |
| | |
| | | | Food Products — 1.4% | | | |
| | 85,025 | | | Campbell Soup Co. | | | 3,180,785 | |
| | | | | | | | |
| | |
| | | | Health Care Equipment & Supplies — 4.9% | | | |
| | 81,423 | | | Abbott Laboratories | | | 5,613,301 | |
| | 164,117 | | | Smith & Nephew PLC, Sponsored ADR | | | 5,396,167 | |
| | | | | | | | |
| | | | | | | 11,009,468 | |
| | | | | | | | |
| | |
| | | | Health Care Providers & Services — 2.3% | | | |
| | 32,136 | | | Laboratory Corp. of America Holdings1 | | | 5,159,435 | |
| | | | | | | | |
| | |
| | | | Household Products — 2.1% | | | |
| | 79,255 | | | Colgate-Palmolive Co. | | | 4,719,635 | |
| | | | | | | | |
| | |
| | | | Insurance — 1.8% | | | |
| | 33,317 | | | Chubb, Ltd. | | | 4,161,626 | |
| | | | | | | | |
See Notes to Financial Statements.
THE GLENMEDE FUND, INC.
Strategic Equity Portfolio
SCHEDULE OF PORTFOLIO INVESTMENTS — (Continued)
October 31, 2018
| | | | | | | | |
| Shares | | | | | Value | |
| |
| COMMON STOCKS* — (Continued) | | | |
| | |
| | | | Interactive Media & Service — 3.5% | | | |
| | 7,374 | | | Alphabet, Inc. — Class C1 | | $ | 7,940,102 | |
| | | | | | | | |
| | |
| | | | Internet & Catalog Retail — 2.6% | | | |
| | 3,151 | | | Booking Holdings, Inc.1 | | | 5,906,802 | |
| | | | | | | | |
| | |
| | | | IT Services — 12.4% | | | |
| | 30,508 | | | Accenture PLC — Class A | | | 4,808,671 | |
| | 71,728 | | | Cognizant Technology Solutions Corp. — Class A | | | 4,951,384 | |
| | 23,286 | | | Gartner, Inc.1 | | | 3,435,150 | |
| | 57,043 | | | Global Payments, Inc. | | | 6,516,022 | |
| | 41,555 | | | Mastercard, Inc. — Class A | | | 8,214,177 | |
| | | | | | | | |
| | | | | | | 27,925,404 | |
| | | | | | | | |
| | |
| | | | Life Sciences Tools & Services — 2.1% | | | |
| | 24,802 | | | Waters Corp.1 | | | 4,704,691 | |
| | | | | | | | |
| | |
| | | | Machinery — 1.6% | | | |
| | 24,489 | | | Parker-Hannifin Corp. | | | 3,713,267 | |
| | | | | | | | |
| | |
| | | | Media — 2.1% | | | |
| | 62,369 | | | Omnicom Group, Inc. | | | 4,635,264 | |
| | | | | | | | |
| | |
| | | | Multi-line Retail — 4.1% | | | |
| | 46,155 | | | Dollar General Corp. | | | 5,140,744 | |
| | 47,822 | | | Dollar Tree, Inc.1 | | | 4,031,395 | |
| | | | | | | | |
| | | | | | | 9,172,139 | |
| | | | | | | | |
| | |
| | | | Oil, Gas & Consumable Fuels — 2.1% | | | |
| | 43,403 | | | Chevron Corp. | | | 4,845,945 | |
| | | | | | | | |
| | |
| | | | Pharmaceuticals — 2.7% | | | |
| | 56,857 | | | Eli Lilly & Co. | | | 6,165,573 | |
| | | | | | | | |
| | |
| | | | Software — 3.3% | | | |
| | 153,155 | | | Oracle Corp. | | | 7,480,090 | |
| | | | | | | | |
| | |
| | | | Specialty Retail — 2.5% | | | |
| | 32,052 | | | Home Depot, Inc. (The) | | | 5,637,306 | |
| | | | | | | | |
| | |
| | | | Technology Hardware, Storage & Peripherals — 4.9% | | | |
| | 50,239 | | | Apple, Inc. | | | 10,995,308 | |
| | | | | | | | |
| | |
| | | | Textiles, Apparel & Luxury Goods — 1.9% | | | |
| | 44,501 | | | Carter’s, Inc. | | | 4,271,207 | |
| | | | | | | | |
| | |
| | | | TOTAL COMMON STOCKS
(Cost $138,661,753) | | | 224,851,522 | |
| | | | | | | | |
See Notes to Financial Statements.
THE GLENMEDE FUND, INC.
Strategic Equity Portfolio
SCHEDULE OF PORTFOLIO INVESTMENTS — (Continued)
October 31, 2018
| | | | | | | | |
Face
Amount | | | | | Value | |
|
| REPURCHASE AGREEMENT* — 0.5% | |
| $ | 1,250,284 | | | With Fixed Income Clearing Corp., dated 10/31/18, 0.42%, principal and interest in the amount of $1,250,299, due 11/1/18, (collateralized by a U.S. Treasury Note with a par value of $1,250,000, coupon rate of 3.625%, due 02/15/2021, market value of $1,280,105) | | $ | 1,250,284 | |
| | | | | | | | |
| | |
| | | | TOTAL REPURCHASE AGREEMENT
(Cost $1,250,284) | | | 1,250,284 | |
| | | | | | | | |
| | | | | | | | |
| | |
TOTAL INVESTMENTS
(Cost $139,912,037) | | | 100.0 | % | | $ | 226,101,806 | |
| | |
LIABILITIES IN EXCESS OF OTHER ASSETS | | | (0.0 | ) | | | (69,744 | ) |
| | | | | | | | |
| | |
NET ASSETS | | | 100.0 | % | | $ | 226,032,062 | |
| | | | | | | | |
| * | Percentages indicated are based on net assets. |
| 1 | Non income-producing security. |
Abbreviations:
ADR — American Depositary Receipt
See Notes to Financial Statements.
THE GLENMEDE FUND, INC.
Strategic Equity Portfolio
SCHEDULE OF PORTFOLIO INVESTMENTS — (Concluded)
October 31, 2018
INDUSTRY DIVERSIFICATION
On October 31, 2018, industry diversification of the Portfolio was as follows:
| | | | | | | | |
| | | % of
Net Assets | | | Value | |
| INDUSTRIES: | | | | | | |
IT Services | | | 12.4 | % | | $ | 27,925,404 | |
Aerospace & Defense | | | 8.6 | | | | 19,513,430 | |
Banks | | | 6.9 | | | | 15,603,924 | |
Health Care Equipment & Supplies | | | 4.9 | | | | 11,009,468 | |
Technology Hardware, Storage & Peripherals | | | 4.9 | | | | 10,995,308 | |
Biotechnology | | | 4.3 | | | | 9,801,028 | |
Multi-line Retail | | | 4.1 | | | | 9,172,139 | |
Capital Markets | | | 3.6 | | | | 8,071,212 | |
Interactive Media & Service | | | 3.5 | | | | 7,940,102 | |
Software | | | 3.3 | | | | 7,480,090 | |
Consumer Finance | | | 3.2 | | | | 7,229,455 | |
Communications Equipment | | | 3.2 | | | | 7,226,624 | |
Electrical Equipment | | | 2.7 | | | | 6,204,498 | |
Pharmaceuticals | | | 2.7 | | | | 6,165,573 | |
Internet & Catalog Retail | | | 2.6 | | | | 5,906,802 | |
Specialty Retail | | | 2.5 | | | | 5,637,306 | |
Energy Equipment & Services | | | 2.5 | | | | 5,535,450 | |
Health Care Providers & Services | | | 2.3 | | | | 5,159,435 | |
Electronic Equipment, Instruments & Components | | | 2.2 | | | | 4,919,547 | |
Oil, Gas & Consumable Fuels | | | 2.1 | | | | 4,845,945 | |
Food & Staples Retailing | | | 2.1 | | | | 4,811,635 | |
Household Products | | | 2.1 | | | | 4,719,635 | |
Life Sciences Tools & Services | | | 2.1 | | | | 4,704,691 | |
Media | | | 2.1 | | | | 4,635,264 | |
Beverages | | | 1.9 | | | | 4,310,672 | |
Textiles, Apparel & Luxury Goods | | | 1.9 | | | | 4,271,207 | |
Insurance | | | 1.8 | | | | 4,161,626 | |
Machinery | | | 1.6 | | | | 3,713,267 | |
Food Products | | | 1.4 | | | | 3,180,785 | |
| | | | | | | | |
TOTAL COMMON STOCKS | | | 99.5 | % | | $ | 224,851,522 | |
| | |
REPURCHASE AGREEMENT | | | 0.5 | | | | 1,250,284 | |
| | | | | | | | |
TOTAL INVESTMENTS | | | 100.0 | % | | $ | 226,101,806 | |
| | | | | | | | |
See Notes to Financial Statements.
THE GLENMEDE FUND, INC.
Small Cap Equity Portfolio
SCHEDULE OF PORTFOLIO INVESTMENTS
October 31, 2018
| | | | | | | | |
| Shares | | | | | Value | |
|
| COMMON STOCKS* — 96.9% | |
| | | | Advertising — 1.0% | | | |
| | 1,963,347 | | | Outfront Media, Inc. | | $ | 34,790,509 | |
| | | | | | | | |
| | |
| | | | Aerospace & Defense — 1.1% | | | |
| | 776,675 | | | AAR Corp. | | | 36,954,197 | |
| | | | | | | | |
| | |
| | | | Airlines — 0.8% | | | |
| | 522,346 | | | Atlas Air Worldwide Holdings, Inc.1 | | | 26,963,501 | |
| | | | | | | | |
| | |
| | | | Automotive — 1.7% | | | |
| | 2,591,638 | | | American Axle & Manufacturing Holdings, Inc.1 | | | 39,315,149 | |
| | 317,349 | | | LCI Industries | | | 22,008,153 | |
| | | | | | | | |
| | | | | | | 61,323,302 | |
| | | | | | | | |
| | |
| | | | Banking — 15.1% | | | |
| | 968,605 | | | Chemical Financial Corp. | | | 45,388,830 | |
| | 739,983 | | | FCB Financial Holdings, Inc. — Class A1 | | | 28,955,535 | |
| | 473,126 | | | First Interstate BancSystem, Inc. — Class A | | | 19,615,804 | |
| | 1,406,205 | | | First Midwest Bancorp, Inc. | | | 32,286,467 | |
| | 5,636,534 | | | FNB Corp. | | | 66,680,197 | |
| | 1,225,657 | | | Great Western Bancorp, Inc. | | | 44,920,329 | |
| | 2,240,476 | | | Home BancShares, Inc. | | | 42,658,663 | |
| | 695,957 | | | IBERIABANK Corp. | | | 51,841,837 | |
| | 789,785 | | | LegacyTexas Financial Group, Inc. | | | 30,430,416 | |
| | 1,972,510 | | | Umpqua Holdings Corp. | | | 37,872,192 | |
| | 1,495,128 | | | United Community Banks, Inc. | | | 37,183,834 | |
| | 987,509 | | | Western Alliance Bancorp1 | | | 47,637,434 | |
| | 627,007 | | | Wintrust Financial Corp. | | | 47,740,313 | |
| | | | | | | | |
| | | | | | | 533,211,851 | |
| | | | | | | | |
| | |
| | | | Building Materials — 2.6% | | | |
| | 2,363,147 | | | Builders FirstSource, Inc.1 | | | 29,255,760 | |
| | 565,019 | | | EMCOR Group, Inc. | | | 40,105,049 | |
| | 370,057 | | | US Concrete, Inc.1 | | | 12,078,660 | |
| | 622,682 | | | US Silica Holdings, Inc.2 | | | 8,717,548 | |
| | | | | | | | |
| | | | | | | 90,157,017 | |
| | | | | | | | |
| | |
| | | | Chemicals — 0.6% | | | |
| | 407,767 | | | Trinseo SA | | | 21,970,486 | |
| | | | | | | | |
| | |
| | | | Commercial Services — 5.2% | | | |
| | 837,457 | | | Aaron’s, Inc. | | | 39,469,348 | |
| | 767,433 | | | AMN Healthcare Services, Inc.1 | | | 38,847,458 | |
| | 418,626 | | | ASGN, Inc.1 | | | 28,081,432 | |
| | 1,017,774 | | | Etsy, Inc.1 | | | 43,275,751 | |
| | 799,000 | | | Yelp, Inc.1 | | | 34,213,180 | |
| | | | | | | | |
| | | | | | | 183,887,169 | |
| | | | | | | | |
| | |
| | | | Communications — 3.0% | | | |
| | 1,589,193 | | | ARRIS International PLC1 | | | 39,523,230 | |
| | 1,625,993 | | | Iridium Communications, Inc.1,2 | | | 32,210,921 | |
| | 617,681 | | | NETGEAR, Inc.1 | | | 34,268,942 | |
| | | | | | | | |
| | | | | | | 106,003,093 | |
| | | | | | | | |
| | |
| | | | Computer Software & Processing — 2.9% | | | |
| | 255,546 | | | CACI International, Inc. — Class A1 | | | 45,604,739 | |
| | 1,214,372 | | | Verint Systems, Inc.1 | | | 55,460,369 | |
| | | | | | | | |
| | | | | | | 101,065,108 | |
| | | | | | | | |
| | |
| | | | Computers & Information — 0.9% | | | |
| | 1,085,334 | | | Electronics for Imaging, Inc.1 | | | 33,048,420 | |
| | | | | | | | |
See Notes to Financial Statements.
THE GLENMEDE FUND, INC.
Small Cap Equity Portfolio
SCHEDULE OF PORTFOLIO INVESTMENTS — (Continued)
October 31, 2018
| | | | | | | | |
| Shares | | | | | Value | |
|
| COMMON STOCKS* — (Continued) | |
| | | | Diversified Financial Services — 0.9% | | | |
| | 1,090,301 | | | Blucora, Inc.1 | | $ | 31,531,505 | |
| | | | | | | | |
| | |
| | | | Electric Utilities — 2.4% | | | |
| | 228,824 | | | ALLETE, Inc. | | | 16,932,976 | |
| | 364,081 | | | IDACORP, Inc. | | | 33,954,194 | |
| | 685,527 | | | Ormat Technologies, Inc. | | | 35,078,417 | |
| | | | | | | | |
| | | | | | | 85,965,587 | |
| | | | | | | | |
| | |
| | | | Electrical Equipment — 0.9% | | | |
| | 406,588 | | | EnerSys | | | 32,352,207 | |
| | | | | | | | |
| | |
| | | | Electronics — 4.7% | | | |
| | 857,865 | | | Diodes, Inc.1 | | | 25,898,944 | |
| | 1,589,589 | | | Finisar Corp.1 | | | 26,530,240 | |
| | 1,824,205 | | | MaxLinear, Inc.1,2 | | | 35,407,819 | |
| | 608,138 | | | Mercury Systems, Inc.1 | | | 28,497,347 | |
| | 2,710,998 | | | TTM Technologies, Inc.1 | | | 31,718,677 | |
| | 1,229,945 | | | Xperi Corp. | | | 15,989,285 | |
| | | | | | | | |
| | | | | | | 164,042,312 | |
| | | | | | | | |
| | |
| | | | Entertainment & Leisure — 1.6% | | | |
| | 1,564,863 | | | Callaway Golf Co. | | | 33,488,068 | |
| | 1,323,949 | | | Camping World Holdings, Inc. — Class A2 | | | 22,705,726 | |
| | | | | | | | |
| | | | | | | 56,193,794 | |
| | | | | | | | |
| | |
| | | | Financial Services — 3.9% | | | |
| | 410,050 | | | Evercore, Inc. — Class A | | | 33,496,984 | |
| | 1,892,504 | | | Hudson Pacific Properties, Inc. | | | 57,342,871 | |
| | 1,342,387 | | | Pebblebrook Hotel Trust2 | | | 45,251,866 | |
| | | | | | | | |
| | | | | | | 136,091,721 | |
| | | | | | | | |
| | |
| | | | Forest Products & Paper — 3.3% | | | |
| | 741,355 | | | Beacon Roofing Supply, Inc.1 | | | 20,691,218 | |
| | 738,596 | | | Boise Cascade Co. | | | 22,741,371 | |
| | 3,950,325 | | | Graphic Packaging Holding Co. | | | 43,493,078 | |
| | 555,085 | | | Masonite International Corp.1 | | | 30,746,158 | |
| | | | | | | | |
| | | | | | | 117,671,825 | |
| | | | | | | | |
| | |
| | | | Health Care Providers — 1.3% | | | |
| | 167,178 | | | Acadia Healthcare Co., Inc.1,2 | | | 6,937,887 | |
| | 1,157,358 | | | Tivity Health, Inc.1 | | | 39,824,689 | |
| | | | | | | | |
| | | | | | | 46,762,576 | |
| | | | | | | | |
| | |
| | | | Heavy Construction — 3.6% | | | |
| | 895,338 | | | Granite Construction, Inc. | | | 40,934,853 | |
| | 1,244,435 | | | MasTec, Inc.1,2 | | | 54,145,367 | |
| | 2,697,191 | | | TRI Pointe Group, Inc.1 | | | 32,096,573 | |
| | | | | | | | |
| | | | | | | 127,176,793 | |
| | | | | | | | |
| | |
| | | | Heavy Machinery — 3.5% | | | |
| | 795,477 | | | Brooks Automation, Inc. | | | 24,683,651 | |
| | 565,019 | | | Dycom Industries, Inc.1 | | | 38,353,490 | |
| | 897,501 | | | Entegris, Inc. | | | 23,819,676 | |
| | 1,346,918 | | | Rexnord Corp.1 | | | 36,110,872 | |
| | | | | | | | |
| | | | | | | 122,967,689 | |
| | | | | | | | |
| | |
| | | | Home Construction, Furnishings & Appliances — 0.9% | | | |
| | 249,319 | | | Helen of Troy, Ltd.1 | | | 30,945,474 | |
| | | | | | | | |
See Notes to Financial Statements.
THE GLENMEDE FUND, INC.
Small Cap Equity Portfolio
SCHEDULE OF PORTFOLIO INVESTMENTS — (Continued)
October 31, 2018
| | | | | | | | |
| Shares | | | | | Value | |
|
| COMMON STOCKS* — (Continued) | |
| | | | Household Products — 1.3% | | | |
| | 682,051 | | | Apogee Enterprises, Inc. | | $ | 24,622,041 | |
| | 1,307,239 | | | Ferro Corp.1 | | | 22,144,629 | |
| | | | | | | | |
| | | | | | | 46,766,670 | |
| | | | | | | | |
| | | | Industrial — Diversified — 0.9% | | | |
| | 645,736 | | | Hillenbrand, Inc. | | | 30,930,754 | |
| | | | | | | | |
| | | | Insurance — 1.5% | | | |
| | 2,719,544 | | | Radian Group, Inc. | | | 52,188,049 | |
| | | | | | | | |
| | | | Lodging — 2.3% | | | |
| | 1,526,252 | | | Boyd Gaming Corp. | | | 40,537,253 | |
| | 1,671,124 | | | Penn National Gaming, Inc.1 | | | 40,574,891 | |
| | | | | | | | |
| | | | | | | 81,112,144 | |
| | | | | | | | |
| | | | Media — Broadcasting & Publishing — 2.1% | | | |
| | 453,393 | | | Nexstar Media Group, Inc. — Class A | | | 33,954,602 | |
| | 1,382,168 | | | Sinclair Broadcast Group, Inc. — Class A | | | 39,585,291 | |
| | | | | | | | |
| | | | | | | 73,539,893 | |
| | | | | | | | |
| | | | Medical Supplies — 4.4% | | | |
| | 151,571 | | | ICU Medical, Inc.1 | | | 38,609,681 | |
| | 824,443 | | | Luminex Corp. | | | 23,719,225 | |
| | 420,111 | | | Merit Medical Systems, Inc.1 | | | 23,996,740 | |
| | 453,327 | | | NuVasive, Inc.1 | | | 25,463,378 | |
| | 1,634,505 | | | Wright Medical Group N.V.1 | | | 44,098,945 | |
| | | | | | | | |
| | | | | | | 155,887,969 | |
| | | | | | | | |
| | | | Miscellaneous — 1.9% | | | |
| | 1,178,065 | | | B&G Foods, Inc.2 | | | 30,676,812 | |
| | 1,528,657 | | | Columbia Property Trust, Inc. | | | 34,318,350 | |
| | | | | | | | |
| | | | | | | 64,995,162 | |
| | | | | | | | |
| | | | Oil & Gas — 6.2% | | | |
| | 4,988,805 | | | Callon Petroleum Co.1 | | | 49,738,386 | |
| | 2,353,212 | | | Carrizo Oil & Gas, Inc.1 | | | 42,851,991 | |
| | 462,967 | | | Delek US Holdings, Inc. | | | 17,000,148 | |
| | 3,043,654 | | | Gulfport Energy Corp.1 | | | 27,727,688 | |
| | 1,556,833 | | | Matador Resources Co.1 | | | 44,899,064 | |
| | 1,942,176 | | | ProPetro Holding Corp.1 | | | 34,279,406 | |
| | | | | | | | |
| | | | | | | 216,496,683 | |
| | | | | | | | |
| | | | Pharmaceuticals — 5.8% | | | |
| | 159,119 | | | Cambrex Corp.1 | | | 8,479,452 | |
| | 588,079 | | | Emergent BioSolutions, Inc.1 | | | 35,984,554 | |
| | 2,803,380 | | | Horizon Pharma PLC1 | | | 51,049,550 | |
| | 210,766 | | | Ligand Pharmaceuticals, Inc.1,2 | | | 34,736,344 | |
| | 998,696 | | | Supernus Pharmaceuticals, Inc.1 | | | 47,497,982 | |
| | 1,461,653 | | | Vanda Pharmaceuticals, Inc.1 | | | 27,727,557 | |
| | | | | | | | |
| | | | | | | 205,475,439 | |
| | | | | | | | |
| | | | Restaurants — 2.7% | | | |
| | 2,352,575 | | | Bloomin’ Brands, Inc. | | | 46,933,871 | |
| | 824,747 | | | Dave & Buster’s Entertainment, Inc. | | | 49,113,684 | |
| | | | | | | | |
| | | | | | | 96,047,555 | |
| | | | | | | | |
| | | | Retailers — 1.9% | | | |
| | 381,554 | | | Five Below, Inc.1 | | | 43,428,476 | |
| | 2,334,557 | | | Party City Holdco, Inc.1,2 | | | 24,442,812 | |
| | | | | | | | |
| | | | | | | 67,871,288 | |
| | | | | | | | |
See Notes to Financial Statements.
THE GLENMEDE FUND, INC.
Small Cap Equity Portfolio
SCHEDULE OF PORTFOLIO INVESTMENTS — (Continued)
October 31, 2018
| | | | | | | | |
| Shares | | | | | Value | |
|
| COMMON STOCKS* — (Continued) | |
| | | | Technology — 1.3% | | | |
| | 644,495 | | | j2 Global, Inc. | | $ | 46,945,016 | |
| | | | | | | | |
| | | | Telecommunications — 1.6% | | | |
| | 4,206,595 | | | Vonage Holdings Corp.1 | | | 55,779,450 | |
| | | | | | | | |
| | | | Textiles, Clothing & Fabrics — 1.1% | | | |
| | 414,339 | | | Oxford Industries, Inc. | | | 36,867,884 | |
| | | | | | | | |
| | |
| | | | TOTAL COMMON STOCKS
(Cost $3,340,346,497) | | | 3,411,980,092 | |
| | | | | | | | |
| | |
Face
Amount | | | | | | |
| |
| REPURCHASE AGREEMENT* — 3.2% | | | |
| $ | 112,572,385 | | | With Fixed Income Clearing Corp., dated 10/31/18, 0.42%, principal and interest in the amount of $112,573,698, due 11/1/18, (collateralized by U.S. Treasury Notes with a par value of $115,305,000, coupon rate of 2.375% - 3.625%, due 2/15/2021 - 4/15/2021, market value of $114,825,050) | | | 112,572,385 | |
| | | | | | | | |
| | |
| | | | TOTAL REPURCHASE AGREEMENT
(Cost $112,572,385) | | | 112,572,385 | |
| | | | | | | | |
| | |
| Shares | | | | | | |
|
| INVESTMENT OF SECURITY LENDING COLLATERAL* — 4.4% | |
| | 155,361,882 | | | State Street Navigator Securities Lending Government Money Market Portfolio | | | 155,361,882 | |
| | | | | | | | |
| | |
| | | | TOTAL INVESTMENT OF SECURITY LENDING COLLATERAL
(Cost $155,361,882) | | | 155,361,882 | |
| | | | | | | | |
| | | | | | | | |
| | |
TOTAL INVESTMENTS
(Cost $3,608,280,764) | | | 104.5 | % | | $ | 3,679,914,359 | |
| | |
LIABILITIES IN EXCESS OF OTHER ASSETS | | | (4.5 | ) | | | (158,316,794 | ) |
| | | | | | | | |
| | |
NET ASSETS | | | 100.0 | % | | $ | 3,521,597,565 | |
| | | | | | | | |
| * | Percentages indicated are based on net assets. |
| 1 | Non income-producing security. |
| 2 | Securities or partial securities on loan. See Note 1. |
See Notes to Financial Statements.
THE GLENMEDE FUND, INC.
Small Cap Equity Portfolio
SCHEDULE OF PORTFOLIO INVESTMENTS — (Concluded)
October 31, 2018
INDUSTRY DIVERSIFICATION
On October 31, 2018, industry diversification of the Portfolio was as follows:
| | | | | | | | |
| INDUSTRIES: | | % of
Net Assets | | | Value | |
Banking | | | 15.1 | % | | $ | 533,211,851 | |
Oil & Gas | | | 6.2 | | | | 216,496,683 | |
Pharmaceuticals | | | 5.8 | | | | 205,475,439 | |
Commercial Services | | | 5.2 | | | | 183,887,169 | |
Electronics | | | 4.7 | | | | 164,042,312 | |
Medical Supplies | | | 4.4 | | | | 155,887,969 | |
Financial Services | | | 3.9 | | | | 136,091,721 | |
Heavy Construction | | | 3.6 | | | | 127,176,793 | |
Heavy Machinery | | | 3.5 | | | | 122,967,689 | |
Forest Products & Paper | | | 3.3 | | | | 117,671,825 | |
Communications | | | 3.0 | | | | 106,003,093 | |
Computer Software & Processing | | | 2.9 | | | | 101,065,108 | |
Restaurants | | | 2.7 | | | | 96,047,555 | |
Building Materials | | | 2.6 | | | | 90,157,017 | |
Electric Utilities | | | 2.4 | | | | 85,965,587 | |
Lodging | | | 2.3 | | | | 81,112,144 | |
Media — Broadcasting & Publishing | | | 2.1 | | | | 73,539,893 | |
Retailers | | | 1.9 | | | | 67,871,288 | |
Miscellaneous | | | 1.9 | | | | 64,995,162 | |
Automotive | | | 1.7 | | | | 61,323,302 | |
Entertainment & Leisure | | | 1.6 | | | | 56,193,794 | |
Telecommunications | | | 1.6 | | | | 55,779,450 | |
Insurance | | | 1.5 | | | | 52,188,049 | |
Technology | | | 1.3 | | | | 46,945,016 | |
Household Products | | | 1.3 | | | | 46,766,670 | |
Health Care Providers | | | 1.3 | | | | 46,762,576 | |
Aerospace & Defense | | | 1.1 | | | | 36,954,197 | |
Textiles, Clothing & Fabrics | | | 1.1 | | | | 36,867,884 | |
Advertising | | | 1.0 | | | | 34,790,509 | |
Computers & Information | | | 0.9 | | | | 33,048,420 | |
Electrical Equipment | | | 0.9 | | | | 32,352,207 | |
Diversified Financial Services | | | 0.9 | | | | 31,531,505 | |
Home Construction, Furnishings & Appliances | | | 0.9 | | | | 30,945,474 | |
Industrial — Diversified | | | 0.9 | | | | 30,930,754 | |
Airlines | | | 0.8 | | | | 26,963,501 | |
Chemicals | | | 0.6 | | | | 21,970,486 | |
| | | | | | | | |
TOTAL COMMON STOCKS | | | 96.9 | % | | $ | 3,411,980,092 | |
| | |
REPURCHASE AGREEMENT | | | 3.2 | | | | 112,572,385 | |
| | |
INVESTMENT OF SECURITY LENDING COLLATERAL | | | 4.4 | | | | 155,361,882 | |
| | | | | | | | |
TOTAL INVESTMENTS | | | 104.5 | % | | $ | 3,679,914,359 | |
| | | | | | | | |
See Notes to Financial Statements.
THE GLENMEDE FUND, INC.
Mid Cap Equity Portfolio
SCHEDULE OF PORTFOLIO INVESTMENTS
October 31, 2018
| | | | | | | | |
Face
Amount | | | | | Value | |
|
| REPURCHASE AGREEMENT* — 18.1% | |
| $ | 571,610 | | | With Fixed Income Clearing Corp., dated 10/31/18, 0.42%, principal and interest in the amount of $571,616, due 11/1/18, (collateralized by a U.S. Treasury Note with a par value of $570,000, coupon rate of 3.625%, due 02/15/2021, market value of $583,728) | | $ | 571,610 | |
| | | | | | | | |
| | |
| | | | TOTAL REPURCHASE AGREEMENT
(Cost $571,610) | | | 571,610 | |
| | | | | | | | |
| | | | | | | | |
| | |
TOTAL INVESTMENTS
(Cost $571,610) | | | 18.1 | % | | $ | 571,610 | |
| | |
OTHER ASSETS IN EXCESS OF LIABILITIES | | | 81.9 | | | | 2,594,347 | |
| | | | | | | | |
| | |
NET ASSETS | | | 100.0 | % | | $ | 3,165,957 | |
| | | | | | | | |
| * | Percentages indicated are based on net assets. |
See Notes to Financial Statements.
THE GLENMEDE FUND, INC.
Mid Cap Equity Portfolio
SCHEDULE OF PORTFOLIO INVESTMENTS — (Concluded)
October 31, 2018
INDUSTRY DIVERSIFICATION
On October 31, 2018, industry diversification of the Portfolio was as follows:
| | | | | | | | |
| | |
REPURCHASE AGREEMENT | | | 18.1 | | | | 571,610 | |
| | | | | | | | |
TOTAL INVESTMENTS | | | 18.1 | % | | $ | 571,610 | |
| | | | | | | | |
See Notes to Financial Statements.
THE GLENMEDE FUND, INC.
Large Cap Value Portfolio
SCHEDULE OF PORTFOLIO INVESTMENTS
October 31, 2018
| | | | | | | | |
| Shares | | | | | Value | |
| |
| COMMON STOCKS* — 99.6% | | | |
| | | | Advertising — 1.5% | |
| | 14,795 | | | Omnicom Group, Inc. | | $ | 1,099,564 | |
| | | | | | | | |
| |
| | | | Airlines — 2.5% | |
| | 4,595 | | | FedEx Corp. | | | 1,012,462 | |
| | 16,220 | | | Southwest Airlines Co. | | | 796,402 | |
| | | | | | | | |
| | | | | | | 1,808,864 | |
| | | | | | | | |
| |
| | | | Automotive — 1.0% | |
| | 17,665 | | | BorgWarner, Inc. | | | 696,178 | |
| | | | | | | | |
| |
| | | | Banking — 8.5% | |
| | 12,325 | | | Capital One Financial Corp. | | | 1,100,622 | |
| | 29,055 | | | Citigroup, Inc. | | | 1,901,940 | |
| | 29,425 | | | Citizens Financial Group, Inc. | | | 1,099,024 | |
| | 69,210 | | | Regions Financial Corp. | | | 1,174,494 | |
| | 11,390 | | | State Street Corp. | | | 783,063 | |
| | | | | | | | |
| | | | | | | 6,059,143 | |
| | | | | | | | |
| |
| | | | Beverages, Food & Tobacco — 5.3% | |
| | 17,755 | | | Altria Group, Inc. | | | 1,154,785 | |
| | 22,330 | | | Archer-Daniels-Midland Co. | | | 1,055,093 | |
| | 7,285 | | | JM Smucker Co. (The) | | | 789,111 | |
| | 13,220 | | | Tyson Foods, Inc. — Class A | | | 792,142 | |
| | | | | | | | |
| | | | | | | 3,791,131 | |
| | | | | | | | |
| |
| | | | Chemicals — 1.0% | |
| | 8,220 | | | LyondellBasell Industries N.V. — Class A | | | 733,799 | |
| | | | | | | | |
| |
| | | | Computer Software & Processing — 1.6% | |
| | 23,955 | | | Oracle Corp. | | | 1,169,962 | |
| | | | | | | | |
| |
| | | | Computers & Information — 1.1% | |
| | 7,010 | | | International Business Machines Corp. | | | 809,164 | |
| | | | | | | | |
| |
| | | | Electric Utilities — 6.0% | |
| | 14,100 | | | American Electric Power Co., Inc. | | | 1,034,376 | |
| | 11,555 | | | Entergy Corp. | | | 970,042 | |
| | 27,140 | | | Exelon Corp. | | | 1,189,004 | |
| | 20,260 | | | Public Service Enterprise Group, Inc. | | | 1,082,492 | |
| | | | | | | | |
| | | | | | | 4,275,914 | |
| | | | | | | | |
| |
| | | | Electronics — 3.5% | |
| | 39,685 | | | Intel Corp. | | | 1,860,433 | |
| | 8,775 | | | TE Connectivity, Ltd. | | | 661,810 | |
| | | | | | | | |
| | | | | | | 2,522,243 | |
| | | | | | | | |
| |
| | | | Financial Services — 10.7% | |
| | 11,811 | | | Ameriprise Financial, Inc. | | | 1,502,832 | |
| | 91,390 | | | Bank of America Corp. | | | 2,513,225 | |
| | 28,350 | | | Franklin Resources, Inc.1 | | | 864,675 | |
| | 16,030 | | | Prologis, Inc. | | | 1,033,454 | |
| | 4,475 | | | Public Storage | | | 919,478 | |
| | 10,675 | | | Raymond James Financial, Inc. | | | 818,666 | |
| | | | | | | | |
| | | | | | | 7,652,330 | |
| | | | | | | | |
| |
| | | | Forest Products & Paper — 1.6% | |
| | 12,435 | | | International Paper Co. | | | 564,052 | |
| | 6,350 | | | Packaging Corp. of America | | | 582,993 | |
| | | | | | | | |
| | | | | | | 1,147,045 | |
| | | | | | | | |
See Notes to Financial Statements.
THE GLENMEDE FUND, INC.
Large Cap Value Portfolio
SCHEDULE OF PORTFOLIO INVESTMENTS — (Continued)
October 31, 2018
| | | | | | | | |
| Shares | | | | | Value | |
| |
| COMMON STOCKS* — (Continued) | | | |
| | | | Health Care Providers — 1.7% | |
| | 7,330 | | | Laboratory Corp. of America Holdings2 | | $ | 1,176,832 | |
| | | | | | | | |
| |
| | | | Heavy Machinery — 3.6% | |
| | 4,790 | | | Caterpillar, Inc. | | | 581,123 | |
| | 5,960 | | | Cummins, Inc. | | | 814,672 | |
| | 16,395 | | | Eaton Corp. PLC | | | 1,175,030 | |
| | | | | | | | |
| | | | | | | 2,570,825 | |
| | | | | | | | |
| |
| | | | Insurance — 8.2% | |
| | 35,615 | | | Aflac, Inc. | | | 1,533,938 | |
| | 11,175 | | | Allstate Corp. (The) | | | 1,069,671 | |
| | 4,595 | | | Anthem, Inc. | | | 1,266,244 | |
| | 18,880 | | | Principal Financial Group, Inc. | | | 888,682 | |
| | 12,105 | | | Prudential Financial, Inc. | | | 1,135,207 | |
| | | | | | | | |
| | | | | | | 5,893,742 | |
| | | | | | | | |
| |
| | | | Media — Broadcasting & Publishing — 1.2% | |
| | 22,840 | | | Comcast Corp. — Class A | | | 871,118 | |
| | | | | | | | |
| |
| | | | Medical Supplies — 1.3% | |
| | 9,935 | | | Ingersoll-Rand PLC | | | 953,164 | |
| | | | | | | | |
| |
| | | | Metals & Mining — 1.0% | |
| | 23,235 | | | Corning, Inc. | | | 742,358 | |
| | | | | | | | |
| |
| | | | Oil & Gas — 10.8% | |
| | 19,010 | | | Chevron Corp. | | | 2,122,466 | |
| | 12,115 | | | ConocoPhillips | | | 846,839 | |
| | 7,345 | | | EOG Resources, Inc. | | | 773,722 | |
| | 35,250 | | | Exxon Mobil Corp. | | | 2,808,720 | |
| | 12,610 | | | Valero Energy Corp. | | | 1,148,645 | |
| | | | | | | | |
| | | | | | | 7,700,392 | |
| | | | | | | | |
| |
| | | | Pharmaceuticals — 11.6% | |
| | 3,270 | | | Biogen, Inc.2 | | | 994,963 | |
| | 18,060 | | | Cardinal Health, Inc. | | | 913,836 | |
| | 13,440 | | | CVS Health Corp. | | | 972,921 | |
| | 20,010 | | | Johnson & Johnson | | | 2,801,200 | |
| | 59,895 | | | Pfizer, Inc. | | | 2,579,079 | |
| | | | | | | | |
| | | | | | | 8,261,999 | |
| | | | | | | | |
| |
| | | | Real Estate Investment Trusts — 2.3% | |
| | 11,325 | | | Lamar Advertising Co. — Class A | | | 830,349 | |
| | 14,165 | | | Ventas, Inc. | | | 822,137 | |
| | | | | | | | |
| | | | | | | 1,652,486 | |
| | | | | | | | |
| |
| | | | Retailers — 7.8% | |
| | 1,470 | | | AutoZone, Inc.2 | | | 1,078,201 | |
| | 14,835 | | | Express Scripts Holding Co.2 | | | 1,438,550 | |
| | 15,180 | | | Target Corp. | | | 1,269,503 | |
| | 22,830 | | | Walgreens Boots Alliance, Inc. | | | 1,821,149 | |
| | | | | | | | |
| | | | | | | 5,607,403 | |
| | | | | | | | |
| |
| | | | Technology — 2.4% | |
| | 37,475 | | | Cisco Systems, Inc. | | | 1,714,481 | |
| | | | | | | | |
| |
| | | | Telecommunications — 2.5% | |
| | 58,072 | | | AT&T, Inc. | | | 1,781,649 | |
| | | | | | | | |
See Notes to Financial Statements.
THE GLENMEDE FUND, INC.
Large Cap Value Portfolio
SCHEDULE OF PORTFOLIO INVESTMENTS — (Continued)
October 31, 2018
| | | | | | | | |
| Shares | | | | | Value | |
| |
| COMMON STOCKS* — (Continued) | | | |
| | | | Transportation — 0.9% | | | |
| | 6,005 | | | Royal Caribbean Cruises, Ltd. | | $ | 628,905 | |
| | | | | | | | |
| | |
| | | | TOTAL COMMON STOCKS
(Cost $65,324,145) | | | 71,320,691 | |
| | | | | | | | |
| | |
Face
Amount | | | | | | |
| |
| REPURCHASE AGREEMENT* — 0.4% | | | |
| $ | 283,684 | | | With Fixed Income Clearing Corp., dated 10/31/18, 0.42%, principal and interest in the amount of $283,687, due 11/1/18, (collateralized by a U.S. Treasury Note with a par value of $295,000, coupon rate of 2.375%, due 4/15/2021, market value of $291,792) | | | 283,684 | |
| | | | | | | | |
| | |
| | | | TOTAL REPURCHASE AGREEMENT
(Cost $283,684) | | | 283,684 | |
| | | | | | | | |
| | |
| Shares | | | | | | |
| |
| INVESTMENT OF SECURITY LENDING COLLATERAL* — 1.3% | | | |
| | 900,113 | | | State Street Navigator Securities Lending Government Money Market Portfolio | | | 900,112 | |
| | | | | | | | |
| | |
| | | | TOTAL INVESTMENT OF SECURITY LENDING COLLATERAL
(Cost $900,112) | | | 900,112 | |
| | | | | | | | |
| | | | | | | | |
| | |
TOTAL INVESTMENTS
(Cost $66,507,941) | | | 101.3 | % | | $ | 72,504,487 | |
| | |
LIABILITIES IN EXCESS OF OTHER ASSETS | | | (1.3 | ) | | | (907,976 | ) |
| | | | | | | | |
| | |
NET ASSETS | | | 100.0 | % | | $ | 71,596,511 | |
| | | | | | | | |
| * | Percentages indicated are based on net assets. |
| 1 | Securities or partial securities on loan. See Note 1. |
| 2 | Non income-producing security. |
See Notes to Financial Statements.
THE GLENMEDE FUND, INC.
Large Cap Value Portfolio
SCHEDULE OF PORTFOLIO INVESTMENTS — (Concluded)
October 31, 2018
INDUSTRY DIVERSIFICATION
On October 31, 2018, industry diversification of the Portfolio was as follows:
| | | | | | | | |
| | | % of
Net Assets | | | Value | |
| INDUSTRIES: | | | | | | |
Pharmaceuticals | | | 11.6 | % | | $ | 8,262,000 | |
Oil & Gas | | | 10.8 | | | | 7,700,392 | |
Financial Services | | | 10.7 | | | | 7,652,330 | |
Banking | | | 8.5 | | | | 6,059,142 | |
Insurance | | | 8.2 | | | | 5,893,742 | |
Retailers | | | 7.8 | | | | 5,607,403 | |
Electric Utilities | | | 6.0 | | | | 4,275,914 | |
Beverages, Food & Tobacco | | | 5.3 | | | | 3,791,131 | |
Heavy Machinery | | | 3.6 | | | | 2,570,825 | |
Electronics | | | 3.5 | | | | 2,522,244 | |
Airlines | | | 2.5 | | | | 1,808,864 | |
Telecommunications | | | 2.5 | | | | 1,781,649 | |
Technology | | | 2.4 | | | | 1,714,481 | |
Real Estate Investment Trusts | | | 2.3 | | | | 1,652,486 | |
Health Care Providers | | | 1.7 | | | | 1,176,831 | |
Computer Software & Processing | | | 1.6 | | | | 1,169,962 | |
Forest Products & Paper | | | 1.6 | | | | 1,147,045 | |
Advertising | | | 1.5 | | | | 1,099,564 | |
Medical Supplies | | | 1.3 | | | | 953,164 | |
Media — Broadcasting & Publishing | | | 1.2 | | | | 871,118 | |
Computers & Information | | | 1.1 | | | | 809,164 | |
Metals & Mining | | | 1.0 | | | | 742,358 | |
Chemicals | | | 1.0 | | | | 733,799 | |
Automotive | | | 1.0 | | | | 696,178 | |
Transportation | | | 0.9 | | | | 628,905 | |
| | | | | | | | |
TOTAL COMMON STOCKS | | | 99.6 | % | | $ | 71,320,691 | |
| | |
REPURCHASE AGREEMENT | | | 0.4 | | | | 283,684 | |
| | |
INVESTMENT OF SECURITY LENDING COLLATERAL | | | 1.3 | | | | 900,112 | |
| | | | | | | | |
TOTAL INVESTMENTS | | | 101.3 | % | | $ | 72,504,487 | |
| | | | | | | | |
See Notes to Financial Statements.
THE GLENMEDE FUND, INC.
Equity Income Portfolio
SCHEDULE OF PORTFOLIO INVESTMENTS
October 31, 2018
| | | | | | | | |
| Shares | | | | | Value | |
|
| COMMON STOCKS* — 99.5% | |
| | | | Aerospace & Defense — 2.2% | |
| | 1,420 | | | Lockheed Martin Corp. | | $ | 417,267 | |
| | | | | | | | |
| |
| | | | Air Freight & Logistics — 1.1% | |
| | 1,885 | | | United Parcel Service, Inc. — Class B | | | 200,828 | |
| | | | | | | | |
| |
| | | | Auto Components — 0.0% | |
| | 127 | | | Garrett Motion, Inc.1 | | | 1,927 | |
| | | | | | | | |
| |
| | | | Banks — 5.1% | |
| | 7,510 | | | BB&T Corp. | | | 369,191 | |
| | 1,825 | | | PNC Financial Services Group, Inc. (The) | | | 234,494 | |
| | 5,395 | | | SunTrust Banks, Inc. | | | 338,051 | |
| | | | | | | | |
| | | | | | | 941,736 | |
| | | | | | | | |
| |
| | | | Beverages — 1.6% | |
| | 2,590 | | | PepsiCo, Inc. | | | 291,064 | |
| | | | | | | | |
| |
| | | | Biotechnology — 4.7% | |
| | 5,350 | | | AbbVie, Inc. | | | 416,497 | |
| | 2,320 | | | Amgen, Inc. | | | 447,273 | |
| | | | | | | | |
| | | | | | | 863,770 | |
| | | | | | | | |
| |
| | | | Building Products — 0.0% | |
| | 214 | | | Resideo Technologies, Inc.1 | | | 4,508 | |
| | | | | | | | |
| |
| | | | Capital Markets — 4.1% | |
| | 1,420 | | | Ameriprise Financial, Inc. | | | 180,681 | |
| | 655 | | | BlackRock, Inc. | | | 269,480 | |
| | 3,185 | | | T Rowe Price Group, Inc. | | | 308,913 | |
| | | | | | | | |
| | | | | | | 759,074 | |
| | | | | | | | |
| |
| | | | Chemicals — 2.9% | |
| | 1,885 | | | Air Products & Chemicals, Inc. | | | 290,950 | |
| | 4,015 | | | RPM International, Inc. | | | 245,597 | |
| | | | | | | | |
| | | | | | | 536,547 | |
| | | | | | | | |
| |
| | | | Communications Equipment — 3.4% | |
| | 13,940 | | | Cisco Systems, Inc. | | | 637,755 | |
| | | | | | | | |
| |
| | | | Distributors — 1.8% | |
| | 3,400 | | | Genuine Parts Co. | | | 332,928 | |
| | | | | | | | |
| |
| | | | Diversified Telecommunication Services — 2.9% | |
| | 6,741 | | | AT&T, Inc. | | | 206,814 | |
| | 5,815 | | | Verizon Communications, Inc. | | | 331,978 | |
| | | | | | | | |
| | | | | | | 538,792 | |
| | | | | | | | |
| |
| | | | Electric Utilities — 1.3% | |
| | 3,185 | | | American Electric Power Co., Inc. | | | 233,652 | |
| | | | | | | | |
| |
| | | | Electrical Equipment — 1.3% | |
| | 3,400 | | | Eaton Corp. PLC | | | 243,678 | |
| | | | | | | | |
| |
| | | | Electronic Equipment, Instruments & Components — 3.4% | |
| | 8,430 | | | Corning, Inc. | | | 269,338 | |
| | 4,695 | | | TE Connectivity, Ltd. | | | 354,097 | |
| | | | | | | | |
| | | | | | | 623,435 | |
| | | | | | | | |
| |
| | | | Equity Real Estate Investment Trusts — 2.8% | |
| | 4,480 | | | Lamar Advertising Co. — Class A | | | 328,474 | |
| | 950 | | | Public Storage | | | 195,196 | |
| | | | | | | | |
| | | | | | | 523,670 | |
| | | | | | | | |
See Notes to Financial Statements.
THE GLENMEDE FUND, INC.
Equity Income Portfolio
SCHEDULE OF PORTFOLIO INVESTMENTS — (Continued)
October 31, 2018
| | | | | | | | |
| Shares | | | | | Value | |
|
| COMMON STOCKS* — (Continued) | |
| | | | Food Products — 3.6% | |
| | 2,530 | | | Hershey Co. (The) | | $ | 271,090 | |
| | 9,130 | | | Hormel Foods Corp.2 | | | 398,433 | |
| | | | | | | | |
| | | | | | | 669,523 | |
| | | | | | | | |
| |
| | | | Health Care Providers & Services — 2.8% | |
| | 3,000 | | | Cardinal Health, Inc. | | | 151,800 | |
| | 3,940 | | | Quest Diagnostics, Inc. | | | 370,793 | |
| | | | | | | | |
| | | | | | | 522,593 | |
| | | | | | | | |
| |
| | | | Hotels, Restaurants & Leisure — 3.8% | |
| | 3,940 | | | McDonald’s Corp. | | | 696,986 | |
| | | | | | | | |
| |
| | | | Household Products — 1.5% | |
| | 2,590 | | | Kimberly-Clark Corp. | | | 270,137 | |
| | | | | | | | |
| |
| | | | Industrial Conglomerates — 3.5% | |
| | 2,470 | | | 3M Co. | | | 469,942 | |
| | 1,285 | | | Honeywell International, Inc. | | | 186,094 | |
| | | | | | | | |
| | | | | | | 656,036 | |
| | | | | | | | |
| |
| | | | Insurance — 3.8% | |
| | 5,970 | | | Aflac, Inc. | | | 257,128 | |
| | 5,445 | | | FNF Group | | | 182,135 | |
| | 5,765 | | | Principal Financial Group, Inc. | | | 271,359 | |
| | | | | | | | |
| | | | | | | 710,622 | |
| | | | | | | | |
| |
| | | | IT Services — 7.1% | |
| | 1,835 | | | Accenture PLC — Class A | | | 289,233 | |
| | 3,515 | | | International Business Machines Corp. | | | 405,736 | |
| | 9,580 | | | Paychex, Inc. | | | 627,394 | |
| | | | | | | | |
| | | | | | | 1,322,363 | |
| | | | | | | | |
| |
| | | | Leisure Product — 1.2% | |
| | 2,470 | | | Hasbro, Inc. | | | 226,524 | |
| | | | | | | | |
| |
| | | | Machinery — 1.2% | |
| | 1,420 | | | Snap-on, Inc. | | | 218,595 | |
| | | | | | | | |
| |
| | | | Media — 1.7% | |
| | 4,215 | | | Omnicom Group, Inc. | | | 313,259 | |
| | | | | | | | |
| |
| | | | Multi-Utilities — 2.4% | |
| | 2,135 | | | DTE Energy Co. | | | 239,974 | |
| | 2,935 | | | WEC Energy Group, Inc. | | | 200,754 | |
| | | | | | | | |
| | | | | | | 440,728 | |
| | | | | | | | |
| |
| | | | Oil, Gas & Consumable Fuels — 6.3% | |
| | 3,205 | | | Chevron Corp. | | | 357,838 | |
| | 5,640 | | | Exxon Mobil Corp. | | | 449,395 | |
| | 4,015 | | | Valero Energy Corp. | | | 365,727 | |
| | | | | | | | |
| | | | | | | 1,172,960 | |
| | | | | | | | |
| |
| | | | Pharmaceuticals — 8.0% | |
| | 4,765 | | | Johnson & Johnson | | | 667,052 | |
| | 4,695 | | | Merck & Co., Inc. | | | 345,599 | |
| | 10,890 | | | Pfizer, Inc. | | | 468,924 | |
| | | | | | | | |
| | | | | | | 1,481,575 | |
| | | | | | | | |
| |
| | | | Road & Rail — 1.1% | |
| | 1,350 | | | Union Pacific Corp. | | | 197,397 | |
| | | | | | | | |
See Notes to Financial Statements.
THE GLENMEDE FUND, INC.
Equity Income Portfolio
SCHEDULE OF PORTFOLIO INVESTMENTS — (Continued)
October 31, 2018
| | | | | | | | |
| Shares | | | | | Value | |
|
| COMMON STOCKS* — (Continued) | |
| | | | Semiconductors & Semiconductor Equipment — 6.9% | | | |
| | 7,285 | | | Intel Corp. | | $ | 341,521 | |
| | 10,445 | | | Maxim Integrated Products, Inc. | | | 522,459 | |
| | 4,545 | | | Texas Instruments, Inc. | | | 421,912 | |
| | | | | | | | |
| | | | | | | 1,285,892 | |
| | | | | | | | |
| | |
| | | | Software — 1.9% | | | |
| | 3,330 | | | Microsoft Corp. | | | 355,677 | |
| | | | | | | | |
| | |
| | | | Specialty Retail — 1.0% | | | |
| | 1,070 | | | Home Depot, Inc. (The) | | | 188,192 | |
| | | | | | | | |
| | |
| | | | Textiles, Apparel & Luxury Goods — 1.6% | | | |
| | 16,840 | | | Hanesbrands, Inc. | | | 288,974 | |
| | | | | | | | |
| | |
| | | | Tobacco — 1.5% | | | |
| | 4,145 | | | Altria Group, Inc. | | | 269,591 | |
| | | | | | | | |
| | |
| | | | TOTAL COMMON STOCKS
(Cost $18,001,807) | | | 18,438,255 | |
| | | | | | | | |
|
| INVESTMENT OF SECURITY LENDING COLLATERAL* — 2.2% | |
| | 404,003 | | | State Street Navigator Securities Lending Government Money Market Portfolio | | | 404,003 | |
| | | | | | | | |
| | |
| | | | TOTAL INVESTMENT OF SECURITY LENDING COLLATERAL
(Cost $404,003) | | | 404,003 | |
| | | | | | | | |
| | | | | | | | | | |
| | |
TOTAL INVESTMENTS
(Cost $18,405,810) | | | 101.7 | % | | $ | 18,842,258 | |
| | |
LIABILITIES IN EXCESS OF OTHER ASSETS | | | (1.7 | ) | | | (306,642 | ) |
| | | | | | | | | | |
| | |
NET ASSETS | | | 100.0 | % | | $ | 18,535,616 | |
| | | | | | | | | | |
| * | Percentages indicated are based on net assets. |
| 1 | Non income-producing security. |
| 2 | Securities or partial securities on loan. See Note 1. |
See Notes to Financial Statements.
THE GLENMEDE FUND, INC.
Equity Income Portfolio
SCHEDULE OF PORTFOLIO INVESTMENTS — (Concluded)
October 31, 2018
INDUSTRY DIVERSIFICATION
On October 31, 2018, industry diversification of the Portfolio was as follows:
| | | | | | | | |
| | | % of
Net Assets | | | Value | |
| INDUSTRIES: | | | | | | |
Pharmaceuticals | | | 8.0 | % | | $ | 1,481,575 | |
IT Services | | | 7.1 | | | | 1,322,363 | |
Semiconductors & Semiconductor Equipment | | | 6.9 | | | | 1,285,892 | |
Oil, Gas & Consumable Fuels | | | 6.3 | | | | 1,172,960 | |
Banks | | | 5.1 | | | | 941,736 | |
Biotechnology | | | 4.7 | | | | 863,770 | |
Capital Markets | | | 4.1 | | | | 759,074 | |
Insurance | | | 3.8 | | | | 710,622 | |
Hotels, Restaurants & Leisure | | | 3.8 | | | | 696,986 | |
Food Products | | | 3.6 | | | | 669,523 | |
Industrial Conglomerates | | | 3.5 | | | | 656,036 | |
Communications Equipment | | | 3.4 | | | | 637,755 | |
Electronic Equipment, Instruments & Components | | | 3.4 | | | | 623,435 | |
Diversified Telecommunication Services | | | 2.9 | | | | 538,792 | |
Chemicals | | | 2.9 | | | | 536,547 | |
Equity Real Estate Investment Trusts | | | 2.8 | | | | 523,670 | |
Health Care Providers & Services | | | 2.8 | | | | 522,593 | |
Multi-Utilities | | | 2.4 | | | | 440,728 | |
Aerospace & Defense | | | 2.2 | | | | 417,267 | |
Software | | | 1.9 | | | | 355,677 | |
Distributors | | | 1.8 | | | | 332,928 | |
Media | | | 1.7 | | | | 313,259 | |
Beverages | | | 1.6 | | | | 291,064 | |
Textiles, Apparel & Luxury Goods | | | 1.6 | | | | 288,974 | |
Household Products | | | 1.5 | | | | 270,137 | |
Tobacco | | | 1.5 | | | | 269,591 | |
Electrical Equipment | | | 1.3 | | | | 243,678 | |
Electric Utilities | | | 1.3 | | | | 233,652 | |
Leisure Product | | | 1.2 | | | | 226,524 | |
Machinery | | | 1.2 | | | | 218,595 | |
Air Freight & Logistics | | | 1.1 | | | | 200,828 | |
Road & Rail | | | 1.1 | | | | 197,397 | |
Specialty Retail | | | 1.0 | | | | 188,192 | |
Building Products | | | 0.0 | | | | 4,508 | |
Auto Components | | | 0.0 | | | | 1,927 | |
| | | | | | | | |
TOTAL COMMON STOCKS | | | 99.5 | % | | $ | 18,438,255 | |
| | |
INVESTMENT OF SECURITY LENDING COLLATERAL | | | 2.2 | | | | 404,003 | |
| | | | | | | | |
TOTAL INVESTMENTS | | | 101.7 | % | | $ | 18,842,258 | |
| | | | | | | | |
See Notes to Financial Statements.
THE GLENMEDE FUND, INC.
Secured Options Portfolio
SCHEDULE OF PORTFOLIO INVESTMENTS
October 31, 2018
| | | | | | | | |
| Shares | | | | | Value | |
| |
| EXCHANGE-TRADED FUNDS* — 1.6% | | | |
| | 22,100 | | | SPDR S&P 500 ETF Trust1 | | $ | 5,980,923 | |
| | 30,000 | | | Vanguard S&P 500 ETF1 | | | 7,463,700 | |
| | | | | | | | |
| | |
| | | | TOTAL EXCHANGE-TRADED FUNDS
(Cost $6,430,609) | | | 13,444,623 | |
| | | | | | | | |
| | |
Face
Amount | | | | | | |
| |
| U.S. TREASURY BILL* — 22.6% | | | |
| $ | 191,500,000 | | | U.S. Treasury Bill
2.230% due 01/10/191 | | | 190,672,892 | |
| | | | | | | | |
| | |
| | | | TOTAL U.S. TREASURY BILL
(Cost $190,673,036) | | | 190,672,892 | |
| | | | | | | | |
| |
| REPURCHASE AGREEMENT* — 0.2% | | | |
| | 1,171,219 | | | With Fixed Income Clearing Corp., dated 10/31/18, 0.42%, principal and interest in the amount of $1,171,233, due 11/1/18, (collateralized by a U.S. Treasury Note with a par value of $1,170,000, coupon rate of 3.625%, due 2/15/2021, market value of $1,198,178) | | | 1,171,219 | |
| | | | | | | | |
| | |
| | | | TOTAL REPURCHASE AGREEMENT
(Cost $1,171,219) | | | 1,171,219 | |
| | | | | | | | |
| | | | | | | | | | |
| | |
TOTAL PURCHASED OPTIONS
(Cost $1,297,926,655) | | | 137.4 | % | | | 1,157,762,900 | |
| | |
TOTAL INVESTMENTS
(Cost $1,496,201,519) | | | 161.8 | % | | $ | 1,363,051,634 | |
| | |
LIABILITIES IN EXCESS OF OTHER ASSETS | | | (61.8 | ) | | | (520,582,609 | ) |
| | | | | | | | | | |
| | |
NET ASSETS2 | | | 100.0 | % | | $ | 842,469,025 | |
| | | | | | | | | | |
| * | Percentages indicated are based on net assets. |
| 1 | All or a portion of this security is held as collateral for written options. |
| 2 | Cash in the amount of $45,093 is held as collateral to secure the open written call and put options contracts. |
See Notes to Financial Statements.
THE GLENMEDE FUND, INC.
Secured Options Portfolio
SCHEDULE OF PORTFOLIO INVESTMENTS — (Concluded)
October 31, 2018
| | | | | | | | | | | | | | | | | | | | | | | | | | | | | | | | | | | | |
Description | | Counterparty | | | Exercise
Price/
FX Rate | | | Expiration
Date | | | Number of
Contracts | | | Notional
Amount | | | Market
Value | | | Premiums
Paid
(Recieved
by Fund) | | | Unrealized
Appreciation/
(Depreciation) | |
PURCHASED OPTIONS | | | | | | | | | | | | | | | | | | | | | | | | | | | | | |
CALLS: | | | | | | | | | | | | | | | | | | | | | | | | | | | | | | | | | | | | |
S&P 500 Index | | | OCC** | | | | 1,000.00 | | | | 12/21/18 | | | | USD | | | | 6,790 | | | $ | 1,841,271,460 | | | $ | 1,156,201,200 | | | $ | 1,296,548,302 | | | $ | (140,347,102 | ) |
PUTS: | | | | | | | | | | | | | | | | | | | | | | | | | | | | | | | | | | | | |
S&P 500 Index | | | OCC** | | | | 2,000.00 | | | | 12/21/18 | | | | USD | | | | 6,790 | | | | 1,841,271,460 | | | | 1,561,700 | | | | 1,378,353 | | | | 183,347 | |
| | | | | | | | | | | | | | | | | | | | | | | | | | | | | | | | | | | | |
TOTAL PURCHASED OPTIONS | | | | | | | | | | | | | | | | | | | | | | $ | 3,682,542,920 | | | $ | 1,157,762,900 | | | $ | 1,297,926,655 | | | $ | (140,163,755 | ) |
| | | | | | | | | | | | | | | | | | | | | | | | | | | | | | | | | | | | |
WRITTEN OPTIONS | | | | | | | | | | | | | | | | | | | | | | | | | | | | | | | | | | | | |
CALL: | | | | | | | | | | | | | | | | | | | | | | | | | | | | | | | | | | | | |
S&P 500 Index | | | OCC** | | | | 2,000.00 | | | | 12/21/18 | | | | USD | | | | 6,790 | | | | (1,841,271,460 | ) | | | (480,765,949 | ) | | | (622,842,652 | ) | | | 142,076,703 | |
PUTS: | | | | | | | | | | | | | | | | | | | | | | | | | | | | | | | | | | | | |
S&P 500 Index | | | OCC** | | | | 2,620.00 | | | | 11/12/18 | | | | USD | | | | 80 | | | | (21,693,920 | ) | | | (122,800 | ) | | | (174,034 | ) | | | 51,234 | |
S&P 500 Index | | | OCC** | | | | 2,685.00 | | | | 11/14/18 | | | | USD | | | | 50 | | | | (13,558,700 | ) | | | (171,500 | ) | | | (91,375 | ) | | | (80,125 | ) |
S&P 500 Index | | | OCC** | | | | 2,750.00 | | | | 11/16/18 | | | | USD | | | | 220 | | | | (59,658,280 | ) | | | (1,434,401 | ) | | | (857,391 | ) | | | (577,010 | ) |
S&P 500 Index | | | OCC** | | | | 2,800.00 | | | | 11/16/18 | | | | USD | | | | 40 | | | | (10,846,960 | ) | | | (397,000 | ) | | | (298,980 | ) | | | (98,020 | ) |
S&P 500 Index | | | OCC** | | | | 2,850.00 | | | | 11/16/18 | | | | USD | | | | 2,400 | | | | (650,817,600 | ) | | | (34,296,000 | ) | | | (20,222,856 | ) | | | (14,073,144 | ) |
S&P 500 Index | | | OCC** | | | | 2,850.00 | | | | 11/16/18 | | | | USD | | | | 10 | | | | (2,711,740 | ) | | | (143,100 | ) | | | (87,285 | ) | | | (55,815 | ) |
S&P 500 Index | | | OCC** | | | | 2,900.00 | | | | 11/16/18 | | | | USD | | | | 200 | | | | (54,234,800 | ) | | | (3,821,000 | ) | | | (1,766,900 | ) | | | (2,054,100 | ) |
S&P 500 Index | | | OCC** | | | | 1,000.00 | | | | 12/21/18 | | | | USD | | | | 6,790 | | | | (1,841,271,460 | ) | | | (50,925 | ) | | | (124,043 | ) | | | 73,118 | |
| | | | | | | | | | | | | | | | | | | | | | | | | | | | | | | | | | | | |
TOTAL PUTS | | | | | | | | | | | | | | | | | | | | | | $ | (2,654,793,460 | ) | | $ | (40,436,726 | ) | | $ | (23,622,864 | ) | | $ | (16,813,862 | ) |
| | | | | | | | | | | | | | | | | | | | | | | | | | | | | | | | | | | | |
TOTAL WRITTEN OPTIONS | | | | | | | | | | | | | | | | | | | | | | $ | (4,496,064,920 | ) | | $ | (521,202,675 | ) | | $ | (646,465,516 | ) | | $ | 125,262,841 | |
| | | | | | | | | | | | | | | | | | | | | | | | | | | | | | | | | | | | |
| ** | The Options Clearing Corp |
SECTOR DIVERSIFICATION
On October 31, 2018, sector diversification of the Portfolio was as follows:
| | | | | | | | |
| | | % of
Net Assets | | | Value | |
| SECTOR: | | | | | | |
Purchased Options | | | 137.4 | % | | $ | 1,157,762,900 | |
U.S. Treasury Bill | | | 22.6 | | | | 190,672,892 | |
Exchange-Traded Funds | | | 1.6 | | | | 13,444,623 | |
| | | | | | | | |
TOTAL | | | 161.6 | % | | $ | 1,361,880,415 | |
| | |
REPURCHASE AGREEMENT | | | 0.2 | | | | 1,171,219 | |
| | | | | | | | |
TOTAL INVESTMENTS | | | 161.8 | % | | $ | 1,363,051,634 | |
| | | | | | | | |
See Notes to Financial Statements.
THE GLENMEDE FUND, INC.
Global Secured Options Portfolio
SCHEDULE OF PORTFOLIO INVESTMENTS
October 31, 2018
| | | | | | | | |
| Shares | | | | | Value | |
|
| EXCHANGE-TRADED FUND* — 37.8% | |
| | 15,200 | | | iShares MSCI EAFE ETF1 | | $ | 949,392 | |
| | | | | | | | |
| | |
| | | | TOTAL EXCHANGE-TRADED FUND
(Cost $1,031,909) | | | 949,392 | |
| | | | | | | | |
| | |
Face
Amount | | | | | | |
|
| U.S. TREASURY BILL* — 25.8% | |
| $ | 650,000 | | | U.S. Treasury Bill 2.230% due 01/10/191 | | | 647,193 | |
| | | | | | | | |
| | |
| | | | TOTAL U.S. TREASURY BILL
(Cost $647,176) | | | 647,193 | |
| | | | | | | | |
| | | | | | | | |
| | |
TOTAL PURCHASED OPTIONS
(Cost $1,911,555) | | | 67.9 | % | | | 1,705,100 | |
| | |
TOTAL INVESTMENTS
(Cost $3,590,640) | | | 131.5 | % | | $ | 3,301,685 | |
| | |
LIABILITIES IN EXCESS OF OTHER ASSETS | | | (31.5 | ) | | | (791,766 | ) |
| | | | | | | | |
| | |
NET ASSETS2 | | | 100.0 | % | | $ | 2,509,919 | |
| | | | | | | | |
| * | Percentages indicated are based on net assets. |
| 1 | All or a portion of this security is held as collateral for written options. |
| 2 | Cash in the amount of $18,409 is held as collateral to secure the open written call and put options contracts. |
See Notes to Financial Statements.
THE GLENMEDE FUND, INC.
Global Secured Options Portfolio
SCHEDULE OF PORTFOLIO INVESTMENTS — (Concluded)
October 31, 2018
| | | | | | | | | | | | | | | | | | | | | | | | | | | | | | | | |
Description | | Counterparty | | | Exercise
Price/
FX Rate | | | Expiration
Date | | | Number of
Contracts | | | Notional
Amount | | | Market
Value | | | Premiums
Paid
(Received
by Fund) | | | Unrealized
Appreciation/
(Depreciation) | |
PURCHASED OPTIONS | | | | | | | | | | | | | | | | | | | | | | | | | | | | | | | | |
CALLS: | | | | | | | | | | | | | | | | | | | | | | | | | | | | | | | | |
S&P 500 Index | | | OCC** | | | | 1,000.00 | | | | 12/21/18 USD | | | | 10 | | | $ | 2,711,740 | | | $ | 1,702,800 | | | $ | 1,909,525 | | | $ | (206,725 | ) |
PUTS: | | | | | | | | | | | | | | | | | | | | | | | | | | | | | | | | |
S&P 500 Index | | | OCC** | | | | 2,000.00 | | | | 12/21/18 USD | | | | 10 | | | | 2,711,740 | | | | 2,300 | | | | 2,030 | | | | 270 | |
| | | | | | | | | | | | | | | | | | | | | | | | | | | | | | | | |
TOTAL PURCHASED OPTIONS | | | | | | | | | | | | | | | | | | $ | 5,423,480 | | | $ | 1,705,100 | | | $ | 1,911,555 | | | $ | (206,455 | ) |
| | | | | | | | | | | | | | | | | | | | | | | | | | | | | | | | |
WRITTEN OPTIONS | | | | | | | | | | | | | | | | | | | | | | | | | | | | | | | | |
CALL: | | | | | | | | | | | | | | | | | | | | | | | | | | | | | | | | |
S&P 500 Index | | | OCC** | | | | 2,000.00 | | | | 12/21/18 USD | | | | 10 | | | | (2,711,740 | ) | | | (708,050 | ) | | | (917,322 | ) | | | 209,272 | |
PUTS: | | | | | | | | | | | | | | | | | | | | | | | | | | | | | | | | |
Russell 2000 Index | | | OCC** | | | | 1,650.00 | | | | 11/16/18 USD | | | | 1 | | | | (151,141 | ) | | | (14,040 | ) | | | (8,485 | ) | | | (5,555 | ) |
S&P 500 Index | | | OCC** | | | | 2,840.00 | | | | 11/16/18 USD | | | | 4 | | | | (1,084,696 | ) | | | (53,440 | ) | | | (34,265 | ) | | | (19,175 | ) |
iShares MSCI Emerging Markets Fund | | | OCC** | | | | 49.00 | | | | 12/21/18 USD | | | | 85 | | | | (332,860 | ) | | | (87,975 | ) | | | (52,827 | ) | | | (35,148 | ) |
S&P 500 Index | | | OCC** | | | | 1,000.00 | | | | 12/21/18 USD | | | | 10 | | | | (2,711,740 | ) | | | (75 | ) | | | (183 | ) | | | 108 | |
| | | | | | | | | | | | | | | | | | | | | | | | | | | | | | | | |
TOTAL PUTS | | | | | | | | | | | | | | | | | | $ | (4,280,437 | ) | | $ | (155,530 | ) | | $ | (95,760 | ) | | $ | (59,770 | ) |
| | | | | | | | | | | | | | | | | | | | | | | | | | | | | | | | |
TOTAL WRITTEN OPTIONS | | | | | | | | | | | | | | | | | | $ | (6,992,177 | ) | | $ | (863,580 | ) | | $ | (1,013,082 | ) | | $ | 149,502 | |
| | | | | | | | | | | | | | | | | | | | | | | | | | | | | | | | |
| ** | The Options Clearing Corp |
SECTOR DIVERSIFICATION
On October 31, 2018, sector diversification of the Portfolio was as follows:
| | | | | | | | |
| | | % of
Net Assets | | | Value | |
| SECTOR: | | | | | | |
Purchased Options | | | 67.9 | % | | $ | 1,705,100 | |
Exchange-Traded Fund | | | 37.8 | | | | 949,392 | |
U.S. Treasury Bill | | | 25.8 | | | | 647,193 | |
| | | | | | | | |
TOTAL | | | 131.5 | % | | $ | 3,301,685 | |
| | | | | | | | |
| | |
TOTAL INVESTMENTS | | | 131.5 | % | | $ | 3,301,685 | |
| | | | | | | | |
See Notes to Financial Statements.
THE GLENMEDE FUND, INC.
Core Fixed Income Portfolio
SCHEDULE OF PORTFOLIO INVESTMENTS
October 31, 2018
| | | | | | | | |
Face
Amount | | | | | Value | |
|
| AGENCY NOTES* — 17.2% | |
| | | | Federal Home Loan Bank — 5.1% | |
| $ | 10,000,000 | | | 3.250% due 11/8/21 | | $ | 9,987,460 | |
| | 15,000,000 | | | 2.750% due 12/13/24 | | | 14,604,285 | |
| | | | | | | | |
| | | | | | | 24,591,745 | |
| | | | | | | | |
| |
| | | | Federal Home Loan Mortgage Corporation — 2.0% | |
| | 10,000,000 | | | 2.375% due 1/13/22 | | | 9,811,680 | |
| | | | | | | | |
| |
| | | | Federal National Mortgage Association — 10.1% | |
| | 9,650,000 | | | 1.250% due 5/6/211 | | | 9,258,857 | |
| | 10,000,000 | | | 2.000% due 10/5/22 | | | 9,616,250 | |
| | 10,000,000 | | | 2.625% due 9/6/241 | | | 9,711,210 | |
| | 7,960,000 | | | 2.125% due 4/24/26 | | | 7,364,329 | |
| | 10,000,000 | | | 6.625% due 11/15/30 | | | 13,029,680 | |
| | | | | | | | |
| | | | | | | 48,980,326 | |
| | | | | | | | |
| | |
| | | | TOTAL AGENCY NOTES
(Cost $87,153,730) | | | 83,383,751 | |
| | | | | | | | |
|
| MORTGAGE-BACKED SECURITIES*,2 — 26.2% | |
| | | | Federal Home Loan Mortgage Corporation — 8.6% | |
| | 1 | | | # G00807, 9.500% due 3/1/21 | | | 1 | |
| | 66,100 | | | # G12342, 5.500% due 8/1/21 | | | 67,244 | |
| | 25,447 | | | # J03604, 5.500% due 10/1/21 | | | 25,836 | |
| | 13,427 | | | # J03649, 5.500% due 10/1/21 | | | 13,610 | |
| | 31,911 | | | # G12442, 6.000% due 11/1/21 | | | 32,751 | |
| | 45,930 | | | # J03536, 5.500% due 11/1/21 | | | 46,189 | |
| | 30,946 | | | # G18163, 5.500% due 1/1/22 | | | 31,687 | |
| | 112,277 | | | # G13396, 5.500% due 12/1/23 | | | 115,618 | |
| | 47,105 | | | # D78677, 8.000% due 3/1/27 | | | 48,066 | |
| | 126,894 | | | # C00742, 6.500% due 4/1/29 | | | 139,709 | |
| | 4,609,888 | | | # J38111, 3.000% due 12/1/32 | | | 4,516,926 | |
| | 10,594 | | | # A57845, 7.000% due 2/1/37 | | | 10,605 | |
| | 41,449 | | | # A68937, 6.000% due 11/1/37 | | | 45,523 | |
| | 302,754 | | | # A69653, 5.500% due 12/1/37 | | | 324,441 | |
| | 357,894 | | | # A73370, 5.000% due 2/1/38 | | | 377,278 | |
| | 356,317 | | | # A90421, 4.500% due 12/1/39 | | | 369,144 | |
| | 446,255 | | | # A92890, 4.500% due 7/1/40 | | | 462,421 | |
| | 1,659,448 | | | # A97620, 4.500% due 3/1/41 | | | 1,719,482 | |
| | 2,869,799 | | | # C03770, 3.500% due 2/1/42 | | | 2,819,057 | |
| | 1,364,743 | | | # Q07651, 3.500% due 4/1/42 | | | 1,337,821 | |
| | 3,673,053 | | | # Q41208, 3.500% due 6/1/46 | | | 3,587,701 | |
| | 13,302,626 | | | # Q46279, 3.500% due 2/1/47 | | | 12,981,348 | |
| | 12,499,518 | | | # Q47596, 4.000% due 4/1/47 | | | 12,518,327 | |
| | | | | | | | |
| | | | | | | 41,590,785 | |
| | | | | | | | |
| |
| | | | Federal National Mortgage Association — 17.3% | |
| | 1,744 | | | # 255159, 5.500% due 3/1/19 | | | 1,744 | |
| | 1,012 | | | # 125275, 7.000% due 3/1/24 | | | 1,053 | |
| | 174 | | | # 313795, 9.500% due 1/1/25 | | | 174 | |
| | 699,535 | | | # AH6827, 4.000% due 3/1/26 | | | 711,880 | |
| | 795,429 | | | # AI1657, 4.000% due 4/1/26 | | | 809,559 | |
| | 1,031,506 | | | # AB3900, 3.000% due 11/1/26 | | | 1,018,515 | |
| | 20,371 | | | # 373328, 8.000% due 3/1/27 | | | 20,387 | |
| | 1,312,674 | | | # AK4751, 3.000% due 4/1/27 | | | 1,296,135 | |
| | 15,409 | | | # 390895, 8.000% due 6/1/27 | | | 15,528 | |
| | 2,802,815 | | | # AO0533, 3.000% due 6/1/27 | | | 2,767,496 | |
| | 82,827 | | | # 397602, 8.000% due 8/1/27 | | | 88,304 | |
| | 1,797 | | | # 499335, 6.500% due 8/1/29 | | | 1,957 | |
| | 5,272 | | | # 252806, 7.500% due 10/1/29 | | | 6,001 | |
See Notes to Financial Statements.
THE GLENMEDE FUND, INC.
Core Fixed Income Portfolio
SCHEDULE OF PORTFOLIO INVESTMENTS — (Continued)
October 31, 2018
| | | | | | | | |
Face
Amount | | | | | Value | |
|
| MORTGAGE-BACKED SECURITIES*,2 — (Continued) | |
| |
| | | | Federal National Mortgage Association — (Continued) | |
| $ | 345 | | | # 523497, 7.500% due 11/1/29 | | $ | 374 | |
| | 7,390,767 | | | # BC2462, 3.000% due 2/1/31 | | | 7,259,171 | |
| | 2,016 | | | # 588945, 7.000% due 6/1/31 | | | 2,137 | |
| | 55,886 | | | # 607862, 7.000% due 9/1/31 | | | 58,940 | |
| | 3,865 | | | # 656872, 6.500% due 8/1/32 | | | 4,209 | |
| | 17,137 | | | # 687575, 7.000% due 2/1/33 | | | 17,231 | |
| | 244,748 | | | # 789856, 6.000% due 8/1/34 | | | 266,992 | |
| | 66,572 | | | # 829202, 5.000% due 7/1/35 | | | 70,382 | |
| | 130,611 | | | # 826586, 5.000% due 8/1/35 | | | 138,194 | |
| | 29,806 | | | # 256216, 7.000% due 4/1/36 | | | 34,315 | |
| | 139,950 | | | # 898412, 5.000% due 10/1/36 | | | 147,751 | |
| | 16,154 | | | # 910894, 5.000% due 2/1/37 | | | 16,972 | |
| | 20,173 | | | # 912456, 6.500% due 3/1/37 | | | 21,967 | |
| | 412,745 | | | # 973241, 5.000% due 3/1/38 | | | 433,208 | |
| | 126,149 | | | # 975593, 5.000% due 6/1/38 | | | 132,892 | |
| | 132,104 | | | # 257573, 5.500% due 2/1/39 | | | 140,858 | |
| | 522,415 | | | # AD7128, 4.500% due 7/1/40 | | | 541,212 | |
| | 4,762,129 | | | # AH1568, 4.500% due 12/1/40 | | | 4,933,543 | |
| | 2,325,163 | | | # AH6991, 4.000% due 1/1/41 | | | 2,342,794 | |
| | 1,396,760 | | | # AH4004, 4.500% due 3/1/41 | | | 1,446,997 | |
| | 1,274,073 | | | # AH8351, 4.000% due 3/1/41 | | | 1,283,733 | |
| | 989,841 | | | # AJ1315, 4.000% due 9/1/41 | | | 997,363 | |
| | 1,359,340 | | | # AI8779, 4.000% due 11/1/41 | | | 1,369,671 | |
| | 2,424,403 | | | # AJ5958, 4.000% due 12/1/41 | | | 2,442,829 | |
| | 979,467 | | | # AK5070, 3.500% due 3/1/42 | | | 956,369 | |
| | 3,736,417 | | | # AK5426, 3.500% due 3/1/42 | | | 3,670,178 | |
| | 6,797,779 | | | # AT7682, 3.500% due 6/1/43 | | | 6,669,355 | |
| | 6,097,303 | | | # AS6326, 3.500% due 12/1/45 | | | 5,960,823 | |
| | 6,726,169 | | | # AS6881, 3.500% due 3/1/46 | | | 6,573,532 | |
| | 6,663,006 | | | # BC0960, 4.000% due 6/1/46 | | | 6,669,914 | |
| | 8,165,455 | | | # AS8966, 4.000% due 3/1/47 | | | 8,175,908 | |
| | 8,551,887 | | | # AS9988, 4.500% due 7/1/47 | | | 8,770,196 | |
| | 5,990,783 | | | # BK4718, 4.000% due 9/1/48 | | | 5,993,661 | |
| | | | | | | | |
| | | | | | | 84,282,404 | |
| | | | | | | | |
| | |
| | | | Government National Mortgage Association — 0.3% | | | |
| | 11,506 | | | # 460389, 7.000% due 5/15/28 | | | 11,520 | |
| | 6,664 | | | # 464049, 7.000% due 7/15/28 | | | 6,934 | |
| | 12,634 | | | # 476259, 7.000% due 8/15/28 | | | 12,649 | |
| | 8,941 | | | # 485264, 7.500% due 2/15/31 | | | 9,038 | |
| | 18,871 | | | # 559304, 7.000% due 9/15/31 | | | 20,220 | |
| | 256,534 | | | # 651859, 5.000% due 6/15/36 | | | 271,552 | |
| | 187,642 | | | # 782150, 5.500% due 4/15/37 | | | 201,921 | |
| | 30,630 | | | # 662521, 6.000% due 8/15/37 | | | 32,810 | |
| | 72,352 | | | # 677545, 6.000% due 11/15/37 | | | 78,066 | |
| | 129,285 | | | # 676291, 6.000% due 12/15/37 | | | 140,550 | |
| | 69,596 | | | # 685836, 5.500% due 4/15/38 | | | 74,198 | |
| | 414,695 | | | # 698235, 5.000% due 6/15/39 | | | 439,012 | |
| | 125,193 | | | # 716655, 5.000% due 8/15/39 | | | 129,984 | |
| | | | | | | | |
| | | | | | | 1,428,454 | |
| | | | | | | | |
| | |
| | | | TOTAL MORTGAGE-BACKED SECURITIES
(Cost $132,536,557) | | | 127,301,643 | |
| | | | | | | | |
| |
| CORPORATE NOTES* — 42.8% | | | |
| | | | Automotive — 0.8% | | | |
| | 2,000,000 | | | American Honda Finance Corp.,
2.650% due 2/12/21 | | | 1,970,793 | |
See Notes to Financial Statements.
THE GLENMEDE FUND, INC.
Core Fixed Income Portfolio
SCHEDULE OF PORTFOLIO INVESTMENTS — (Continued)
October 31, 2018
| | | | | | | | |
Face
Amount | | | | | Value | |
| |
| CORPORATE NOTES* — (Continued) | | | |
| | | | Automotive — (Continued) | | | |
| $ | 2,000,000 | | | American Honda Finance Corp.,
3.450% due 7/14/23 | | $ | 1,987,798 | |
| | | | | | | | |
| | | | | | | 3,958,591 | |
| | | | | | | | |
| |
| | | | Banking — 9.0% | |
| | 10,000,000 | | | Bank of America Corp.,
7.625% due 6/1/19 | | | 10,260,867 | |
| | 7,000,000 | | | Branch Banking & Trust Co.,
3.625% due 9/16/25 | | | 6,800,516 | |
| | 11,000,000 | | | Citibank NA,
2.125% due 10/20/20 | | | 10,742,557 | |
| | 10,000,000 | | | PNC Bank NA,
2.625% due 2/17/22 | | | 9,704,611 | |
| | 6,500,000 | | | PNC Bank NA,
3.250% due 6/1/25 | | | 6,251,495 | |
| | | | | | | | |
| | | | | | | 43,760,046 | |
| | | | | | | | |
| |
| | | | Beverages, Food & Tobacco — 3.9% | |
| | 5,000,000 | | | Coca-Cola Co. (The),
2.875% due 10/27/25 | | | 4,749,228 | |
| | 6,000,000 | | | Coca-Cola Co. (The),
2.250% due 9/1/26 | | | 5,378,318 | |
| | 9,000,000 | | | PepsiCo, Inc.,
3.000% due 8/25/21 | | | 8,964,744 | |
| | | | | | | | |
| | | | | | | 19,092,290 | |
| | | | | | | | |
| |
| | | | Communications — 5.2% | |
| | 14,000,000 | | | Amazon.com, Inc.,
4.800% due 12/5/34 | | | 14,732,909 | |
| | 11,100,000 | | | Cisco Systems, Inc.,
2.200% due 9/20/23 | | | 10,470,075 | |
| | | | | | | | |
| | | | | | | 25,202,984 | |
| | | | | | | | |
| |
| | | | Computer Software & Processing — 7.9% | |
| | 11,250,000 | | | Apple, Inc.,
4.500% due 2/23/36 | | | 11,698,921 | |
| | 9,650,000 | | | International Business Machines Corp.,
3.450% due 2/19/261 | | | 9,314,916 | |
| | 8,000,000 | | | Microsoft Corp.,
3.450% due 8/8/36 | | | 7,361,055 | |
| | 10,750,000 | | | Oracle Corp.,
2.400% due 9/15/23 | | | 10,165,872 | |
| | | | | | | | |
| | | | | | | 38,540,764 | |
| | | | | | | | |
| |
| | | | Electronics — 2.7% | |
| | 5,000,000 | | | Applied Materials, Inc.,
3.900% due 10/1/25 | | | 4,953,862 | |
| | 8,000,000 | | | Intel Corp.,
3.300% due 10/1/21 | | | 8,008,421 | |
| | | | | | | | |
| | | | | | | 12,962,283 | |
| | | | | | | | |
| |
| | | | Financial — 3.5% | |
| | 10,533,000 | | | JPMorgan Chase & Co.,
4.950% due 3/25/20 | | | 10,776,330 | |
| | 5,000,000 | | | JPMorgan Chase & Co.,
6.400% due 5/15/38 | | | 6,012,097 | |
| | | | | | | | |
| | | | | | | 16,788,427 | |
| | | | | | | | |
See Notes to Financial Statements.
THE GLENMEDE FUND, INC.
Core Fixed Income Portfolio
SCHEDULE OF PORTFOLIO INVESTMENTS — (Continued)
October 31, 2018
| | | | | | | | |
Face
Amount | | | | | Value | |
| |
| CORPORATE NOTES* — (Continued) | | | |
| | | | Heavy Machinery — 1.2% | | | |
| $ | 5,700,000 | | | John Deere Capital Corp.,
2.800% due 3/4/211 | | $ | 5,639,002 | |
| | | | | | | | |
| | | | Insurance — 3.4% | | | |
| | 6,500,000 | | | Aflac, Inc.,
2.400% due 3/16/20 | | | 6,435,178 | |
| | 10,000,000 | | | Berkshire Hathaway Finance Corp.,
4.250% due 1/15/21 | | | 10,250,793 | |
| | | | | | | | |
| | | | | | | 16,685,971 | |
| | | | | | | | |
| | | | Pharmaceuticals — 2.5% | | | |
| | 7,000,000 | | | Johnson & Johnson,
4.850% due 5/15/411 | | | 7,497,766 | |
| | 5,000,000 | | | Merck & Co., Inc.,
2.750% due 2/10/25 | | | 4,738,608 | |
| | | | | | | | |
| | | | | | | 12,236,374 | |
| | | | | | | | |
| | | | Retailers — 2.7% | | | |
| | 6,000,000 | | | Target Corp.,
3.500% due 7/1/24 | | | 6,018,781 | |
| | 5,325,000 | | | Target Corp.,
7.000% due 1/15/38 | | | 6,960,723 | |
| | | | | | | | |
| | | | | | | 12,979,504 | |
| | | | | | | | |
| | |
| | | | TOTAL CORPORATE NOTES
(Cost $215,493,751) | | | 207,846,236 | |
| | | | | | | | |
| |
| U.S. TREASURY NOTES/BONDS* — 10.4% | | | |
| | 15,000,000 | | | U.S. Treasury Bonds,
6.250% due 8/15/23 | | | 17,175,586 | |
| | 5,000,000 | | | U.S. Treasury Bonds,
6.625% due 2/15/27 | | | 6,281,836 | |
| | 5,000,000 | | | U.S. Treasury Bonds,
3.125% due 11/15/41 | | | 4,797,070 | |
| | 2,000,000 | | | U.S. Treasury Bonds,
3.750% due 11/15/43 | | | 2,117,813 | |
| | 5,000,000 | | | U.S. Treasury Bonds,
2.750% due 8/15/47 | | | 4,398,828 | |
| | 10,000,000 | | | U.S. Treasury Notes,
2.875% due 5/31/25 | | | 9,886,328 | |
| | 6,000,000 | | | U.S. Treasury Notes,
2.250% due 8/15/27 | | | 5,590,546 | |
| | | | | | | | |
| | |
| | | | TOTAL U.S. TREASURY NOTES/BONDS
(Cost $53,254,511) | | | 50,248,007 | |
| | | | | | | | |
| |
| REPURCHASE AGREEMENT* — 2.7% | | | |
| | 12,939,399 | | | With Fixed Income Clearing Corp., dated 10/31/18, 0.42%, principal and interest in the amount of $12,939,549, due 11/1/18, (collateralized by a U.S. Treasury Note with a par value of $12,890,000, coupon rate of 3.625%, due 2/15/2021, market value of $13,200,443) | | | 12,939,399 | |
| | | | | | | | |
| | |
| | | | TOTAL REPURCHASE AGREEMENT
(Cost $12,939,399) | | | 12,939,399 | |
| | | | | | | | |
See Notes to Financial Statements.
THE GLENMEDE FUND, INC.
Core Fixed Income Portfolio
SCHEDULE OF PORTFOLIO INVESTMENTS — (Continued)
October 31, 2018
| | | | | | | | |
| Shares | | | | | Value | |
|
| INVESTMENT OF SECURITY LENDING COLLATERAL* — 3.9% | |
| | 19,105,863 | | | State Street Navigator Securities Lending Government Money Market Portfolio | | $ | 19,105,863 | |
| | | | | | | | |
| | |
| | | | TOTAL INVESTMENT OF SECURITY LENDING COLLATERAL
(Cost $19,105,863) | | | 19,105,863 | |
| | | | | | | | |
| | | | | | | | |
| | |
TOTAL INVESTMENTS
(Cost $520,483,811) | | | 103.2 | % | | $ | 500,824,899 | |
| | |
LIABILITIES IN EXCESS OF OTHER ASSETS | | | (3.2 | ) | | | (15,623,830 | ) |
| | | | | | | | |
| | |
NET ASSETS | | | 100.0 | % | | $ | 485,201,069 | |
| | | | | | | | |
| * | Percentages indicated are based on net assets. |
| 1 | Securities or partial securities on loan. See Note 1. |
| 2 | Represents current face amount at October 31, 2018. |
See Notes to Financial Statements.
THE GLENMEDE FUND, INC.
Core Fixed Income Portfolio
SCHEDULE OF PORTFOLIO INVESTMENTS — (Concluded)
October 31, 2018
SECTOR DIVERSIFICATION
On October 31, 2018, sector diversification of the Portfolio was as follows:
| | | | | | | | |
| | | % of
Net Assets | | | Value | |
| SECTOR: | | | | | | |
Corporate | | | 42.8 | % | | $ | 207,846,236 | |
Federal National Mortgage Association | | | 27.4 | | | | 133,262,730 | |
Federal Home Loan Mortgage Corporation | | | 10.6 | | | | 51,402,465 | |
U.S. Treasury Notes/Bonds | | | 10.4 | | | | 50,248,007 | |
Federal Home Loan Bank | | | 5.1 | | | | 24,591,745 | |
Government National Mortgage Association | | | 0.3 | | | | 1,428,454 | |
| | | | | | | | |
TOTAL | | | 96.6 | % | | $ | 468,779,637 | |
| | |
REPURCHASE AGREEMENT | | | 2.7 | | | | 12,939,399 | |
| | |
INVESTMENT OF SECURITY LENDING COLLATERAL | | | 3.9 | | | | 19,105,863 | |
| | | | | | | | |
TOTAL INVESTMENTS | | | 103.2 | % | | $ | 500,824,899 | |
| | | | | | | | |
See Notes to Financial Statements.
THE GLENMEDE FUND, INC.
Short Term Tax Aware Fixed Income Portfolio
SCHEDULE OF PORTFOLIO INVESTMENTS
October 31, 2018
| | | | | | | | |
Face
Amount | | | | | Value | |
| |
| CORPORATE NOTES* — 2.5% | | | |
| | | | Automotive — 1.1% | | | |
| $ | 300,000 | | | Ford Motor Credit Co. LLC,
3.336% due 3/18/21 | | $ | 293,015 | |
| | | | | | | | |
| | |
| | | | Financial — 1.4% | | | |
| | 359,000 | | | JPMorgan Chase & Co., (3M USD LIBOR + 3.47%),
5.990% due 12/29/491 | | | 360,925 | |
| | | | | | | | |
| | |
| | | | TOTAL CORPORATE NOTES
(Cost $656,395) | | | 653,940 | |
| | | | | | | | |
| |
| MUNICIPAL BONDS* — 82.2% | | | |
| | | | Alabama — 2.0% | | | |
| | 250,000 | | | Alabama Federal Aid Highway Finance Authority, Revenue Bonds,
5.000% due 9/1/20 | | | 262,300 | |
| | 250,000 | | | Black Belt Energy Gas District, AL, Gas Supply Revenue, Revenue Bonds, Series A,
4.000% due 7/1/46 | | | 258,108 | |
| | | | | | | | |
| | | | | | | 520,408 | |
| | | | | | | | |
| | |
| | | | Alaska — 3.6% | | | |
| | 300,000 | | | Alaska State, General Obligation Unlimited, Series B,
5.000% due 8/1/20 | | | 314,364 | |
| | 400,000 | | | North Slope Boro, AK, General Obligation Unlimited, Series B,
5.000% due 6/30/20 | | | 418,560 | |
| | 200,000 | | | Valdez, AK, Marine Terminal Revenue, Revenue Bonds, Refunding, Series B, (SPA : British Petroleum PLC),
5.000% due 1/1/21 | | | 210,548 | |
| | | | | | | | |
| | | | | | | 943,472 | |
| | | | | | | | |
| | |
| | | | Arizona — 1.6% | | | |
| | 400,000 | | | Yuma, AZ, Municipal Property Corp., Excise Tax Revenue, Revenue Bonds, Refunding,
5.000% due 7/1/22 | | | 436,552 | |
| | | | | | | | |
| | |
| | | | California — 1.9% | | | |
| | 210,000 | | | La Quinta, CA, Financing Authority, Local Agency Revenue, Tax Allocation, Series A, Prerefunded 9/1/20 @ 100,
7.900% due 9/1/31 | | | 228,547 | |
| | 250,000 | | | San Diego, CA, Redevelopment Agency Tax Allocation Revenue, Series A, Prerefunded 9/1/20 @ 100,
7.750% due 9/1/40 | | | 270,298 | |
| | | | | | | | |
| | | | | | | 498,845 | |
| | | | | | | | |
| | |
| | | | Colorado — 1.5% | | | |
| | 250,000 | | | Trinidad, CO, School District No. 1, General Obligation Unlimited, Refunding, (State Aid Withholding),
4.000% due 12/1/18 | | | 250,435 | |
| | 150,000 | | | Weld County, CO, Reorganized School District No. RE-8, General Obligation Unlimited, (State Aid Withholding),
4.000% due 12/1/20 | | | 155,583 | |
| | | | | | | | |
| | | | | | | 406,018 | |
| | | | | | | | |
| | |
| | | | Delaware — 0.8% | | | |
| | 205,000 | | | Delaware State, Transportation Authority, Grant Anticipation Bonds, Revenue Bonds,
5.000% due 3/1/19 | | | 206,968 | |
| | | | | | | | |
| | |
| | | | Florida — 2.2% | | | |
| | 325,000 | | | Citizens Property Insurance Corp., FL, Revenue Bonds, Series A-1,
5.000% due 6/1/19 | | | 330,385 | |
| | 250,000 | | | Orlando & Orange County, FL, Expressway Authority, Revenue Bonds, Refunding, Series B (AGMC Insured),
5.000% due 7/1/21 | | | 261,325 | |
| | | | | | | | |
| | | | | | | 591,710 | |
| | | | | | | | |
See Notes to Financial Statements.
THE GLENMEDE FUND, INC.
Short Term Tax Aware Fixed Income Portfolio
SCHEDULE OF PORTFOLIO INVESTMENTS — (Continued)
October 31, 2018
| | | | | | | | |
Face
Amount | | | | | Value | |
| |
| MUNICIPAL BONDS* — (Continued) | | | |
| | | | Georgia — 1.4% | | | |
| $ | 350,000 | | | Georgia State, Road & Tollway Authority, Federal Highway Reimbursement, Revenue Bonds, Series A,
5.000% due 6/1/20 | | $ | 365,691 | |
| | | | | | | | |
| | |
| | | | Idaho — 0.8% | | | |
| | 200,000 | | | Idaho, Housing & Finance Association, Revenue Bonds,
5.000% due 7/15/20 | | | 209,062 | |
| | | | | | | | |
| | |
| | | | Illinois — 12.3% | | | |
| | 150,000 | | | Chicago, IL, O’Hare International Airport Revenue Bonds, Refunding, Series B,
5.000% due 1/1/21 | | | 158,498 | |
| | 400,000 | | | Du Page & Will Counties, IL, Community School District No. 204 Indian Prairie, General Obligation Unlimited, Refunding, Series A,
5.000% due 12/30/20 | | | 421,936 | |
| | 400,000 | | | Illinois State Finance Authority, Revenue Bonds,
5.000% due 1/1/20 | | | 413,396 | |
| | 200,000 | | | Illinois State Finance Authority, Revenue Bonds, Series A, Prerefunded 11/1/18 @ 100,
7.250% due 11/1/38 | | | 200,000 | |
| | 500,000 | | | Illinois State Finance Authority, Revenue Bonds, Series L,
4.000% due 12/1/20 | | | 517,785 | |
| | | | Illinois State, General Obligation Unlimited: | | | | |
| | 400,000 | | | 5.363% due 2/1/19 | | | 402,084 | |
| | 100,000 | | | 4.000% due 9/1/20 | | | 101,515 | |
| | 130,000 | | | 5.000% due 1/1/21 | | | 133,641 | |
| | 100,000 | | | Lake County, IL, Community College District No. 532, General Obligation Unlimited, Series A,
4.000% due 6/1/19 | | | 101,142 | |
| | 300,000 | | | McHenry County, IL, Conservation District, General Obligation Unlimited, Refunding,
5.000% due 2/1/19 | | | 302,217 | |
| | 450,000 | | | Regional Transportation Authority, IL, Revenue Bonds, Series A (NPFG Insured),
5.500% due 7/1/20 | | | 473,134 | |
| | | | | | | | |
| | | | | | | 3,225,348 | |
| | | | | | | | |
| | |
| | | | Kentucky — 2.2% | | | |
| | 300,000 | | | Kentucky State, Property & Building Commission Revenue, Project No. 84, Revenue Bonds, Refunding, (NPFG Insured),
5.000% due 8/1/20 | | | 313,311 | |
| | 250,000 | | | Louisville & Jefferson County, KY, Metropolitan Government Health System Revenue, Revenue Bonds, Series A,
5.000% due 10/1/19 | | | 256,202 | |
| | | | | | | | |
| | | | | | | 569,513 | |
| | | | | | | | |
| | |
| | | | Louisiana — 2.2% | | | |
| | 300,000 | | | Louisiana State, General Obligation Unlimited, Series A,
4.000% due 9/1/21 | | | 313,554 | |
| | 250,000 | | | Louisiana State, University & Agricultural and Mechanical College, Auxiliary, Revenue Bonds, Refunding,
5.000% due 7/1/19 | | | 254,665 | |
| | | | | | | | |
| | | | | | | 568,219 | |
| | | | | | | | |
| | |
| | | | Maryland — 0.5% | | | |
| | 125,000 | | | Baltimore, MD, Water Utility Project Revenue, Revenue Bonds, Series A,
5.000% due 7/1/19 | | | 127,399 | |
| | | | | | | | |
| | |
| | | | Michigan — 6.4% | | | |
| | | | Dansville, MI, Schools, General Obligation Unlimited, (QSBLF Insured): | | | | |
| | 125,000 | | | 4.000% due 5/1/19 | | | 126,231 | |
| | 140,000 | | | 4.000% due 5/1/20 | | | 143,795 | |
| | 260,000 | | | L’Anse Creuse, MI, Public Schools, General Obligation Unlimited, Refunding, (QSBLF Insured),
5.000% due 5/1/20 | | | 271,055 | |
| | 250,000 | | | Michigan Finance Authority, Revenue Bonds, Refunding, Series A,
5.000% due 12/1/20 | | | 263,945 | |
See Notes to Financial Statements.
THE GLENMEDE FUND, INC.
Short Term Tax Aware Fixed Income Portfolio
SCHEDULE OF PORTFOLIO INVESTMENTS — (Continued)
October 31, 2018
| | | | | | | | |
Face
Amount | | | | | Value | |
| |
| MUNICIPAL BONDS* — (Continued) | | | |
| | | | Michigan — (Continued) | | | |
| $ | 400,000 | | | Michigan State Finance Authority Revenue, Revenue Bonds, Refunding,
5.000% due 11/15/19 | | $ | 411,240 | |
| | 250,000 | | | Pinconning, MI, Area Schools, General Obligation Unlimited, Refunding, (QSBLF Insured),
3.000% due 5/1/19 | | | 250,948 | |
| | 200,000 | | | Ypsilanti, MI, School District, General Obligation Unlimited, Refunding, Series A, (QSBLF Insured),
5.000% due 5/1/21 | | | 211,682 | |
| | | | | | | | |
| | | | | | | 1,678,896 | |
| | | | | | | | |
| | |
| | | | Minnesota — 4.8% | | | |
| | 100,000 | | | Minneapolis, MN, St. Paul, Housing & Redevelopment Authority Health Care, Revenue Bonds, Refunding, Series A,
5.000% due 11/15/20 | | | 105,627 | |
| | 400,000 | | | Rochester, MN, Health Care Facilities Revenue, Revenue Bonds, Series A,
4.000% due 11/15/30 | | | 400,308 | |
| | 250,000 | | | St. Paul, MN, Housing & Redevelopment Authority Health Care, Revenue Bonds, Refunding, Series A,
5.000% due 7/1/21 | | | 267,070 | |
| | 500,000 | | | St. Paul, MN, Housing & Redevelopment Authority Health Care, Revenue Bonds, Refunding, Series B,
2.353% due 7/1/19 | | | 497,290 | |
| | | | | | | | |
| | | | | | | 1,270,295 | |
| | | | | | | | |
| | |
| | | | Mississippi — 2.0% | | | |
| | 500,000 | | | Mississippi State, Development Bank, Special Obligation, Jackson Public School District Project, Revenue Bonds, Refunding, Series A,
5.000% due 4/1/21 | | | 529,820 | |
| | | | | | | | |
| | |
| | | | New Jersey — 4.0% | | | |
| | 350,000 | | | Camden County, NJ, Improvement Authority, Revenue Bonds, (County Guaranteed),
4.000% due 1/15/20 | | | 357,595 | |
| | 175,000 | | | New Jersey State Economic Development Authority Revenue, Revenue Bonds, Refunding, Series NN,
5.000% due 3/1/22 | | | 185,608 | |
| | 500,000 | | | New Jersey State Turnpike Authority, Revenue Bonds, Refunding, Series C-1, (1M USD LIBOR * 0.7+ 0.34%),
1.919% due 1/1/211 | | | 499,875 | |
| | | | | | | | |
| | | | | | | 1,043,078 | |
| | | | | | | | |
| | |
| | | | New York — 0.8% | | | |
| | 200,000 | | | New York State, Dormitory Authority, State Personal Income Tax Revenue, Refunding, Series A,
5.000% due 12/15/19 | | | 206,740 | |
| | | | | | | | |
| | |
| | | | North Carolina — 1.2% | | | |
| | 100,000 | | | New Hanover County, NC, Hospital Revenue Bonds, Refunding,
5.000% due 10/1/21 | | | 107,390 | |
| | 200,000 | | | North Carolina State, Grant Anticipation Revenue, Revenue Bonds,
5.000% due 3/1/19 | | | 202,006 | |
| | | | | | | | |
| | | | | | | 309,396 | |
| | | | | | | | |
| | |
| | | | Ohio — 3.8% | | | |
| | 265,000 | | | Ohio State University, General Receipts Athens, Revenue Bonds, Refunding, Series A,
5.000% due 12/1/20 | | | 279,670 | |
| | 255,000 | | | Ohio State, Higher Educational Facility Commission, Revenue Bonds,
4.000% due 12/1/19 | | | 260,202 | |
| | 425,000 | | | Ohio State, Hospital Facilities Revenue, Revenue Bonds, Series A,
5.000% due 1/15/23 | | | 456,408 | |
| | | | | | | | |
| | | | | | | 996,280 | |
| | | | | | | | |
| | |
| | | | Oklahoma — 0.5% | | | |
| | 125,000 | | | Grand River, OK, Dam Authority, Revenue Bonds, Series A,
4.000% due 6/1/19 | | | 126,428 | |
| | | | | | | | |
See Notes to Financial Statements.
THE GLENMEDE FUND, INC.
Short Term Tax Aware Fixed Income Portfolio
SCHEDULE OF PORTFOLIO INVESTMENTS — (Continued)
October 31, 2018
| | | | | | | | |
Face
Amount | | | | | Value | |
| |
| MUNICIPAL BONDS* — (Continued) | | | |
| | | | Pennsylvania — 14.4% | | | |
| $ | 400,000 | | | Allegheny County, PA, General Obligation Unlimited, Refunding, Series C-75,
4.000% due 11/1/21 | | $ | 418,876 | |
| | 235,000 | | | Allegheny County, PA, Hospital Development Authority, Revenue Bonds, University of Pittsburgh Medical Center, Series A,
5.000% due 5/15/19 | | | 238,664 | |
| | 400,000 | | | Bucks County, CA, Centennial School District, General Obligation Limited, Refunding, Series B, (State Aid Withholding),
5.000% due 12/15/21 | | | 432,320 | |
| | 390,000 | | | Danville, PA, Area School District, General Obligation Limited, Refunding, Series B, (State Aid Withholding),
4.000% due 11/1/20 | | | 403,490 | |
| | 300,000 | | | East Stroudsburg, PA, Area School District, General Obligation Limited, Refunding, Series A, (State Aid Withholding),
5.000% due 9/1/20 | | | 314,814 | |
| | 140,000 | | | Monroeville, PA, Finance Authority UPMC Revenue, Revenue Bonds,
5.000% due 2/15/20 | | | 144,975 | |
| | 250,000 | | | Pennsylvania State Turnpike Authority, Revenue Bonds, Refunding,
5.000% due 12/1/222 | | | 265,545 | |
| | 190,000 | | | Pennsylvania State, General Obligation Unlimited, Refunding,
5.000% due 7/1/20 | | | 198,480 | |
| | 200,000 | | | Pennsylvania State, General Obligation Unlimited, Refunding, First Series,
5.000% due 8/15/20 | | | 209,534 | |
| | | | Pittsburgh, PA, School District, General Obligation Unlimited, Refunding, Series A, (State Aid Withholding): | | | | |
| | 225,000 | | | 4.000% due 9/1/19 | | | 228,645 | |
| | 200,000 | | | 5.000% due 9/1/22 | | | 214,368 | |
| | 300,000 | | | Red Lion, PA, Area School District, General Obligation Limited, Refunding, Series A, (State Aid Withholding),
4.000% due 4/15/20 | | | 307,851 | |
| | 100,000 | | | Scranton, PA, School District, General Obligation Limited, Refunding, Series A, (State Aid Withholding),
5.000% due 6/1/19 | | | 101,331 | |
| | 305,000 | | | Springfield Township, PA, School District, Montgomery County, General Obligation Limited, Refunding, (State Aid Withholding),
4.000% due 11/15/20 | | | 315,995 | |
| | | | | | | | |
| | | | | | | 3,794,888 | |
| | | | | | | | |
| | |
| | | | Texas — 7.4% | | | |
| | 575,000 | | | Arlington, TX, Higher Education Finance Corp., Revenue Bonds, Refunding, Brown Fellowship Leadership Academy, Series A, (PSF Guaranteed),
4.000% due 8/15/19 | | | 583,504 | |
| | 200,000 | | | Arlington, TX, Higher Education Finance Corp., Revenue Bonds, Refunding, Series A, (PSF Guaranteed),
4.000% due 2/15/21 | | | 207,388 | |
| | 100,000 | | | Brushy Creek, TX, Regional Utility Authority, Inc., Contract Revenue, Refunding,
3.000% due 8/1/20 | | | 101,310 | |
| | 250,000 | | | Dallas, TX, General Obligation Limited, Refunding,
5.000% due 2/15/19 | | | 252,155 | |
| | 200,000 | | | Denton, TX, Independent School District, General Obligation Unlimited, (PSF Guaranteed),
2.000% due 8/1/43 | | | 198,942 | |
| | 200,000 | | | Georgetown, TX, Independent School District, General Obligation Unlimited, Series B, (PSF Guaranteed),
2.000% due 8/1/41 | | | 203,858 | |
| | 200,000 | | | North East, TX, Independent School District, General Obligation Unlimited, Series B, (PSF Guaranteed),
1.420% due 8/1/40 | | | 194,038 | |
| | 210,000 | | | Taft, TX, Independent School District, General Obligation Unlimited, Refunding, (PSF Guaranteed),
3.000% due 8/15/20 | | | 213,182 | |
| | | | | | | | |
| | | | | | | 1,954,377 | |
| | | | | | | | |
| | |
| | | | Washington — 1.1% | | | |
| | 300,000 | | | Grant County, WA, Public Utility District No. 2, Revenue Bonds, Refunding,
2.000% due 1/1/441,3 | | | 297,333 | |
| | | | | | | | |
See Notes to Financial Statements.
THE GLENMEDE FUND, INC.
Short Term Tax Aware Fixed Income Portfolio
SCHEDULE OF PORTFOLIO INVESTMENTS — (Continued)
October 31, 2018
| | | | | | | | |
Face
Amount | | | | | Value | |
| |
| MUNICIPAL BONDS* — (Continued) | | | |
| | | | Wisconsin — 2.8% | | | |
| $ | 285,000 | | | Oshkosh, WI, Water Revenue, Revenue Bonds, Series F,
2.000% due 1/1/19 | | $ | 285,023 | |
| | 470,000 | | | Wisconsin State, Health & Educational Facilities Authority Revenue, Revenue Bonds, Series 2013B-1,
1.375% due 11/15/38 | | | 465,309 | |
| | | | | | | | |
| | | | | | | 750,332 | |
| | | | | | | | |
| | |
| | | | TOTAL MUNICIPAL BONDS
(Cost $21,856,971) | | | 21,627,068 | |
| | | | | | | | |
| | |
| Shares | | | | | | |
| |
| REGISTERED INVESTMENT COMPANIES* — 3.8% | | | |
| | 450 | | | BlackRock Defined Opportunity Credit Trust4,5 | | | 0 | |
| | 34,460 | | | BlackRock Municipal 2020 Term Trust | | | 508,974 | |
| | 1,932 | | | PIMCO 0-5 Year High Yield Corporate Bond Index Exchange-Traded Fund6 | | | 190,746 | |
| | 3,850 | | | Vanguard Short-Term Corporate Bond ETF | | | 300,031 | |
| | | | | | | | |
| | |
| | | | TOTAL REGISTERED INVESTMENT COMPANIES
(Cost $1,025,511) | | | 999,751 | |
| | | | | | | | |
| | |
Face
Amount | | | | | | |
| |
| U.S. TREASURY NOTES/BONDS* — 9.8% | | | |
| | 500,000 | | | U.S. Treasury Notes,
1.250% due 12/15/18 | | | 499,424 | |
| | 750,000 | | | U.S. Treasury Notes,
1.500% due 1/31/19 | | | 748,490 | |
| | 1,325,000 | | | U.S. Treasury Notes,
1.375% due 2/28/19 | | | 1,320,549 | |
| | | | | | | | |
| | |
| | | | TOTAL U.S. TREASURY NOTES/BONDS
(Cost $2,568,641) | | | 2,568,463 | |
| | | | | | | | |
| | |
| Shares | | | | | | |
| |
| INVESTMENT OF SECURITY LENDING COLLATERAL* — 0.7% | | | |
| | 191,425 | | | State Street Navigator Securities Lending Government Money Market Portfolio | | | 191,425 | |
| | | | | | | | |
| | |
| | | | TOTAL INVESTMENT OF SECURITY LENDING COLLATERAL
(Cost $191,425) | | | 191,425 | |
| | | | | | | | |
| | | | | | | | |
| | |
TOTAL INVESTMENTS
(Cost $26,298,943) | | | 99.0 | % | | $ | 26,040,647 | |
| | |
OTHER ASSETS IN EXCESS OF LIABILITIES | | | 1.0 | | | | 253,244 | |
| | | | | | | | |
| | |
NET ASSETS | | | 100.0 | % | | $ | 26,293,891 | |
| | | | | | | | |
| * | Percentages indicated are based on net assets. |
| 1 | Floating Rate Bond. Rate shown is as of October 31, 2018. |
| 3 | Variable Rate is Fixed to Float: Rate remains fixed until designated future date. |
| 4 | Held for any potential distributions from terminated trust. |
| 5 | For fair value measurement disclosure purposes, security is categorized as Level 3 (See Note 1 of the Notes to Financial Statements). |
| 6 | Securities or partial securities on loan. See Note 1. |
Abbreviations:
AGMC — Assured Guaranty Municipal Corporation
NPFG — National Public Finance Guarantee Corporation
PSF — Permanent School Fund
QSBLF — Michigan Qualified School Bond Loan Fund
SPA — Stand-By Purchase Agreement
See Notes to Financial Statements.
THE GLENMEDE FUND, INC.
Short Term Tax Aware Fixed Income Portfolio
SCHEDULE OF PORTFOLIO INVESTMENTS — (Concluded)
October 31, 2018
SECTOR DIVERSIFICATION
On October 31, 2018, sector diversification of the Portfolio was as follows:
| | | | | | | | |
| | | % of
Net Assets | | | Value | |
| SECTOR: | | | | | | |
Municipal Bonds | | | 82.2 | % | | $ | 21,627,068 | |
U.S. Treasury Notes/Bonds | | | 9.8 | | | | 2,568,463 | |
Registered Investment Companies | | | 3.8 | | | | 999,751 | |
Corporate Notes | | | 2.5 | | | | 653,940 | |
| | | | | | | | |
TOTAL | | | 98.3 | % | | $ | 25,849,222 | |
| | |
INVESTMENT OF SECURITY LENDING COLLATERAL | | | 0.7 | | | | 191,425 | |
| | | | | | | | |
TOTAL INVESTMENTS | | | 99.0 | % | | $ | 26,040,647 | |
| | | | | | | | |
See Notes to Financial Statements.
THE GLENMEDE FUND, INC.
High Yield Municipal Portfolio
SCHEDULE OF PORTFOLIO INVESTMENTS
October 31, 2018
| | | | | | | | |
Face
Amount | | | | | Value | |
| |
| MUNICIPAL BONDS* — 98.8% | | | |
| | | | Alabama — 1.2% | | | |
| $ | 500,000 | | | Jefferson County, AL, Sewer Revenue Warrants, Series E,
0.000% due 10/1/341 | | $ | 183,455 | |
| | 500,000 | | | Jefferson County, AL, Sewer Revenue, Series B, (AGMC Insured),
0.000% due 10/1/251 | | | 391,755 | |
| | 1,070,000 | | | Jefferson County, AL, Sewer Revenue, Series D, Warrants,
6.000% due 10/1/42 | | | 1,208,094 | |
| | 500,000 | | | Montgomery, AL, Medical Clinic, Board Health Care Facility Revenue, Refunding,
5.000% due 3/1/30 | | | 531,470 | |
| | | | | | | | |
| | | | | | | 2,314,774 | |
| | | | | | | | |
| | |
| | | | Alaska — 0.7% | | | |
| | 1,360,000 | | | Alaska State, Housing Finance Corp., Revenue Bonds, Series A,
4.000% due 12/1/48 | | | 1,418,235 | |
| | | | | | | | |
| | |
| | | | Arizona — 2.6% | | | |
| | 300,000 | | | Arizona State, Industrial Development Authority, Education Revenue, Basis Schools Projects, Revenue Bonds, Refunding, Series A,
5.250% due 7/1/472 | | | 303,942 | |
| | 500,000 | | | Arizona State, Industrial Development Authority, Education Revenue, Revenue Bonds, Refunding, Series A,
5.000% due 7/1/322 | | | 500,945 | |
| | 500,000 | | | Arizona State, Industrial Development Authority, Education Revenue, Traditional Schools Project, Revenue Bonds,
5.250% due 7/1/222 | | | 491,980 | |
| | 100,000 | | | Florence Town, Inc., AZ, Industrial Development Authority, Legacy Traditional School Project, Revenue Bonds,
5.000% due 7/1/23 | | | 103,646 | |
| | 750,000 | | | Maricopa County, AZ, Industrial Development Authority, Educational Revenue, Revenue Bonds, Refunding,
5.000% due 7/1/362 | | | 765,742 | |
| | 250,000 | | | Phoenix, AZ, Industrial Development Authority, Education Revenue, Basis Schools, Inc., Revenue Bonds,
5.000% due 7/1/452 | | | 249,253 | |
| | 500,000 | | | Phoenix, AZ, Industrial Development Authority, Education Revenue, Basis Schools, Inc., Revenue Bonds, Refunding,
5.000% due 7/1/352 | | | 504,195 | |
| | 405,000 | | | Phoenix, AZ, Industrial Development Authority, Education Revenue, Basis Schools, Inc., Revenue Bonds, Refunding, Series A,
3.000% due 7/1/202 | | | 399,492 | |
| | | | Phoenix, AZ, Industrial Development Authority, Education Revenue, Legacy Traditional Schools Project, Revenue Bonds, Series A: | | | | |
| | 300,000 | | | 5.750% due 7/1/242 | | | 318,531 | |
| | 500,000 | | | 6.750% due 7/1/442 | | | 542,655 | |
| | 500,000 | | | Phoenix, AZ, Industrial Development Authority, Education Revenue, Revenue Bonds, Series A,
5.000% due 7/1/462 | | | 500,910 | |
| | 250,000 | | | Phoenix, AZ, Industrial Development Authority, Education Revenue, Revenue Bonds, Series B,
4.000% due 7/1/222 | | | 243,095 | |
| | | | | | | | |
| | | | | | | 4,924,386 | |
| | | | | | | | |
| | |
| | | | California — 3.0% | | | |
| | 435,000 | | | Alhambra City, CA, Atherton Baptist Homes, Revenue Bonds, Series A, Prerefunded 1/1/20 @ 100,
7.500% due 1/1/30 | | | 458,473 | |
| | 250,000 | | | California Public Finance Authority, Revenue Bonds, Refunding,
5.000% due 10/15/47 | | | 260,310 | |
| | 400,000 | | | California State, Infrastructure and Economic Development Bank, Revenue Bonds, Refunding, Series E,
1.750% due 11/1/26 | | | 376,888 | |
| | | | California State, Municipal Finance Authority, Educational Revenue, Refunding, Series A: | | | | |
| | 360,000 | | | 5.000% due 6/1/36 | | | 381,157 | |
| | 500,000 | | | 5.000% due 6/1/46 | | | 522,750 | |
See Notes to Financial Statements.
THE GLENMEDE FUND, INC.
High Yield Municipal Portfolio
SCHEDULE OF PORTFOLIO INVESTMENTS — (Continued)
October 31, 2018
| | | | | | | | |
Face
Amount | | | | | Value | |
| |
| MUNICIPAL BONDS* — (Continued) | | | |
| | | | California — (Continued) | | | |
| $ | 300,000 | | | California State, Municipal Finance Authority, Revenue Bonds, Series A,
5.000% due 11/1/462 | | $ | 318,462 | |
| | 335,000 | | | California State, School Financing Authority, Rocketship Education Obligated Group, Revenue Bonds, Series A,
5.250% due 6/1/522 | | | 340,849 | |
| | 250,000 | | | California State, Statewide Communities Development Authority, CHF Irvine LLC, Revenue Bonds,
5.000% due 5/15/29 | | | 278,503 | |
| | 945,000 | | | California State, Statewide Communities Development Authority, Student Housing Revenue, Revenue Bonds,
4.305% due 7/1/32 | | | 970,902 | |
| | 255,000 | | | Corona-Norco, CA, Unified School District, Refunding,
5.000% due 9/1/24 | | | 284,251 | |
| | 500,000 | | | Northern, CA, Gas Authority No. 1, Gas Project Revenue, Revenue Bonds, Series B, (3M USD LIBOR * 0.67 + 0.72%),
2.325% due 7/1/273 | | | 487,620 | |
| | 1,000,000 | | | Riverside County, Redevelopment Successor Agency, Revenue Bonds, Series B,
0.000% due 10/1/391 | | | 391,870 | |
| | 500,000 | | | Saugus/Hart, CA, School Facilities Financing Authority, Special Tax, Refunding,
5.000% due 9/1/24 | | | 551,140 | |
| | 200,000 | | | Seal Beach, CA, Community Facilities District No. 2005-1, Special Tax, Refunding,
3.000% due 9/1/29 | | | 186,572 | |
| | | | | | | | |
| | | | | | | 5,809,747 | |
| | | | | | | | |
| | |
| | | | Colorado — 9.7% | | | |
| | 500,000 | | | Amber Creek, Metropolitan District, General Obligation Limited, Refunding, Series A,
5.125% due 12/1/47 | | | 480,630 | |
| | 1,000,000 | | | Arista, CO, Metropolitan District, General Obligation Limited, Series A,
4.375% due 12/1/28 | | | 993,130 | |
| | 1,000,000 | | | Arkansas River Power Authority, CO, Power Revenue, Revenue Bonds, Refunding, Series A,
5.000% due 10/1/33 | | | 1,084,560 | |
| | 500,000 | | | Base Village Metropolitan District No. 2, General Obligation Limited, Refunding, Series A,
5.750% due 12/1/46 | | | 498,790 | |
| | 500,000 | | | Belleview Station, CO, Metropolitan District No. 2, General Obligation Limited, Refunding,
5.000% due 12/1/36 | | | 504,415 | |
| | 500,000 | | | Big Dry Creek, Metropolitan District, General Obligation Limited, Series A,
5.750% due 12/1/47 | | | 486,895 | |
| | 680,000 | | | Bradburn, CO, Metropolitan District No. 2, General Obligation Limited, Refunding, Series A,
4.000% due 12/1/28 | | | 658,022 | |
| | 500,000 | | | Buffalo Ridge, CO, Metropolitan District, General Obligation Limited, Series B,
7.375% due 12/15/47 | | | 485,110 | |
| | 500,000 | | | Clear Creek Station, Metropolitan District No. 2, General Obligation Limited, Refunding, Series A,
5.000% due 12/1/47 | | | 496,945 | |
| | 625,000 | | | Colorado International Center, CO, Metropolitan District No. 14, General Obligation Limited,
5.875% due 12/1/46 | | | 647,513 | |
| | 500,000 | | | Colorado State, Health Facilities Authority, Hospital Revenue, Christian Living Neighborhoods Project, Revenue Bonds, Refunding,
5.000% due 1/1/31 | | | 521,040 | |
| | 400,000 | | | Colorado State, Health Facilities Authority, Hospital Revenue, Refunding,
5.000% due 1/1/37 | | | 408,668 | |
| | 700,000 | | | Colorado State, Health Facilities Authority, Hospital Revenue, Refunding, Series A,
5.250% due 5/15/37 | | | 745,024 | |
| | 700,000 | | | Colorado State, Health Facilities Authority, Hospital Revenue, Revenue Bonds, Refunding,
5.000% due 6/1/37 | | | 749,868 | |
| | 230,000 | | | Colorado State, Health Facilities Authority, Hospital Revenue, Series A,
5.750% due 11/1/47 | | | 231,605 | |
| | 650,000 | | | Colorado State, Health Facilities Authority, Refunding, Series A,
5.000% due 6/1/45 | | | 679,224 | |
See Notes to Financial Statements.
THE GLENMEDE FUND, INC.
High Yield Municipal Portfolio
SCHEDULE OF PORTFOLIO INVESTMENTS — (Continued)
October 31, 2018
| | | | | | | | |
Face
Amount | | | | | Value | |
| |
| MUNICIPAL BONDS* — (Continued) | | | |
| | | | Colorado — (Continued) | |
| $ | 165,000 | | | Colorado State, Health Facilities Authority, Revenue Bonds,
5.625% due 6/1/43 | | $ | 177,258 | |
| | 500,000 | | | Colorado State, Housing and Finance Authority, Non Amount Non ACE SF Mortgage, Revenue Bonds, Series C, (GNMA Insured),
4.250% due 11/1/48 | | | 526,985 | |
| | 250,000 | | | Denver, CO, Urban Renewal Authority, Tax Increment Revenue, Series A,
5.250% due 12/1/392 | | | 247,475 | |
| | 150,000 | | | E-470, CO, Public Highway Authority, Revenue Bonds, Refunding, Series B, (1M USD LIBOR * 0.67 + 1.05%),
2.579% due 9/1/393 | | | 151,119 | |
| | 750,000 | | | Forest Trace, CO, Metropolitan District No. 3, Limited Tax, General Obligation Unlimited, Series A,
5.000% due 12/1/46 | | | 699,683 | |
| | 1,000,000 | | | Gardens on Havana, CO, Metropolitan District No. 3, Revenue Bonds, Series A,
4.625% due 12/1/27 | | | 1,024,360 | |
| | 945,000 | | | Harmony Technology Park, Metropolitan District No. 2, General Obligation Limited,
4.500% due 12/1/32 | | | 892,552 | |
| | 500,000 | | | Leyden Ranch, Metropolitan District, General Obligation Unlimited, Series A,
5.125% due 12/1/47 | | | 506,345 | |
| | 750,000 | | | Leyden Rock, Metropolitan District No. 10, General Obligation Limited, Series A,
5.000% due 12/1/45 | | | 740,108 | |
| | 500,000 | | | Midcities Metropolitan District No. 2, CO, Special Revenue, Revenue Bonds, Refunding, Series B,
7.750% due 12/15/46 | | | 480,650 | |
| | 271,000 | | | Mountain Shadows, CO, Metropolitan District, General Obligation Limited,
3.250% due 12/1/20 | | | 271,382 | |
| | 500,000 | | | Serenity Ridge, CO, Metropolitan District No. 2, General Obligation Limited, Refunding, Series A,
5.125% due 12/1/43 | | | 500,140 | |
| | 750,000 | | | Solaris, CO, Metropolitan District No. 3, General Obligation Limited, Refunding, Series A,
5.000% due 12/1/36 | | | 765,727 | |
| | | | Southglenn, CO, Metropolitan District, Special Revenue, General Obligation Limited, Refunding: | | | | |
| | 500,000 | | | 3.000% due 12/1/21 | | | 490,460 | |
| | 750,000 | | | 5.000% due 12/1/30 | | | 755,048 | |
| | 215,000 | | | Southlands, CO, Metropolitan District No. 1, General Obligation Unlimited, Series A-2,
3.500% due 12/1/27 | | | 209,436 | |
| | 500,000 | | | Tallyns Reach, CO, Metropolitan District No. 3, General Obligation Limited, Series A,
6.750% due 11/1/38 | | | 485,200 | |
| | | | | | | | |
| | | | | | | 18,595,367 | |
| | | | | | | | |
| | |
| | | | Connecticut — 1.2% | | | |
| | 425,000 | | | Connecticut State Health & Educational Facilities Authority, Church Home of Hartford, Inc. Project, Revenue Bonds, Series A,
5.000% due 9/1/532 | | | 422,883 | |
| | 750,000 | | | Hamden, CT, Facilities Revenue Bonds, Series A,
7.750% due 1/1/43 | | | 772,275 | |
| | 250,000 | | | Harbor Point, CT, Infrastructure Improvement District, Special Obligation Revenue, Tax Allocation, Refunding,
5.000% due 4/1/302 | | | 264,408 | |
| | 800,000 | | | Mohegan Tribe of Indians, CT, Gaming Authority, Revenue Bonds, Series A,
5.500% due 8/1/262 | | | 839,128 | |
| | | | | | | | |
| | | | | | | 2,298,694 | |
| | | | | | | | |
| | |
| | | | Delaware — 0.4% | | | |
| | 760,000 | | | Kent County, DE, Student Housing & Dining Facilities Revenue, CHF Dover LLC, DE State University Project, Revenue Bonds, Series A,
5.000% due 7/1/32 | | | 811,771 | |
| | | | | | | | |
| | |
| | | | District Of Columbia — 1.2% | | | |
| | 500,000 | | | District of Columbia, Friendship Public Charter School, Inc., Revenue Bonds, Series A,
5.000% due 6/1/36 | | | 528,715 | |
See Notes to Financial Statements.
THE GLENMEDE FUND, INC.
High Yield Municipal Portfolio
SCHEDULE OF PORTFOLIO INVESTMENTS — (Continued)
October 31, 2018
| | | | | | | | |
Face
Amount | | | | | Value | |
| |
| MUNICIPAL BONDS* — (Continued) | | | |
| | | | District Of Columbia — (Continued) | | | |
| $ | 225,000 | | | District of Columbia, KIPP DC Obligated Group, Revenue Bonds, Series A,
5.000% due 7/1/27 | | $ | 250,916 | |
| | 5,415,000 | | | District of Columbia, Tobacco Settlement Financing Corp., Revenue Bonds, Series A,
0.000% due 6/15/461 | | | 827,141 | |
| | 2,000,000 | | | Metropolitan Washington, DC, Airports Authority Dulles Toll Road Revenue, Revenue Bonds, Series B, (AGMC Insured),
0.000% due 10/1/401 | | | 735,100 | |
| | | | | | | | |
| | | | | | | 2,341,872 | |
| | | | | | | | |
| | |
| | | | Florida — 5.0% | | | |
| | 160,000 | | | Capital Trust Agency, FL, Educational Facilities Revenue, Viera Charter School, Inc. Project, Revenue Bonds, Series A,
5.000% due 10/15/372 | | | 157,114 | |
| | 150,000 | | | Collier County, FL, Health Facilities Authority, Residential Care Facility Revenue, Refunding, Series A,
3.000% due 5/1/20 | | | 151,074 | |
| | 200,000 | | | Florida Development Finance Corp., Healthcare Facilities Revenue, University of Florida Health Project, Series A,
6.000% due 2/1/33 | | | 214,002 | |
| | 200,000 | | | Florida State Higher Educational Facilities Financial Authority, Jacksonville University Project, Revenue Bonds, Series A-1,
5.000% due 6/1/482 | | | 204,886 | |
| | 1,375,000 | | | Florida State Housing Finance Corp., Revenue Bonds, Series 1 (GNMA/FNMA/FHLMC Insured),
4.000% due 7/1/49 | | | 1,434,207 | |
| | 250,000 | | | Jacksonville, FL, Educational Facilities Revenue, Jacksonville University Project, Revenue Bonds, Series B,
5.000% due 6/1/532 | | | 254,177 | |
| | 300,000 | | | Lakewood Ranch, FL, Stewardship District, Special Assessment Revenue,
5.375% due 5/1/47 | | | 305,424 | |
| | 500,000 | | | Miami, FL, World Center Community Development District, Special Assessment,
5.125% due 11/1/39 | | | 505,565 | |
| | 1,250,000 | | | North Broward, FL, Hospital District, Revenue Bonds, Refunding, Series B,
5.000% due 1/1/48 | | | 1,296,437 | |
| | | | Orange County, FL, Health Facilities Authority Revenue: | | | | |
| | 150,000 | | | 4.000% due 8/1/19 | | | 151,931 | |
| | 750,000 | | | 5.000% due 8/1/40 | | | 788,490 | |
| | 875,000 | | | Orange County, FL, Health Facilities Authority, Revenue Bonds, Refunding,
5.000% due 8/1/41 | | | 927,955 | |
| | | | Palm Beach County, FL, Health Facilities Authority, Lifespace Communities, Revenue Bonds, Refunding, Series C: | | | | |
| | 295,000 | | | 5.000% due 5/15/20 | | | 302,670 | |
| | 55,000 | | | 5.000% due 5/15/25 | | | 58,558 | |
| | 150,000 | | | Palm Beach County, FL, Health Facilities Authority, Revenue Bonds, Refunding,
4.000% due 12/1/18 | | | 150,176 | |
| | 200,000 | | | Pompano Beach, FL, John Knox Project, Revenue Bonds,
4.000% due 9/1/19 | | | 202,926 | |
| | 550,000 | | | Sarasota County, FL, Health Facilities Authority, Retirement Facilities Revenue, Revenue Bonds, Series A,
5.000% due 1/1/37 | | | 569,723 | |
| | | | Southeast Overtown Park West Community Redevelopment Agency, FL, Series A-1: | | | | |
| | 325,000 | | | 5.000% due 3/1/202 | | | 336,466 | |
| | 500,000 | | | 5.000% due 3/1/302 | | | 536,915 | |
| | 185,000 | | | Town Center at Palm Coast, FL, Community Development District, Special Assessment,
6.000% due 5/1/36 | | | 185,209 | |
| | | | Winter Garden Village at Fowler Groves, FL, Community Development District, Special Assessment, Refunding: | | | | |
| | 500,000 | | | 3.750% due 5/1/31 | | | 476,890 | |
| | 500,000 | | | 4.125% due 5/1/37 | | | 470,630 | |
| | | | | | | | |
| | | | | | | 9,681,425 | |
| | | | | | | | |
See Notes to Financial Statements.
THE GLENMEDE FUND, INC.
High Yield Municipal Portfolio
SCHEDULE OF PORTFOLIO INVESTMENTS — (Continued)
October 31, 2018
| | | | | | | | |
Face
Amount | | | | | Value | |
| |
| MUNICIPAL BONDS* — (Continued) | | | |
| | | | Georgia — 0.5% | | | |
| $ | 500,000 | | | DeKalb County, GA, Hospital Authority, DeKalb Medical Center, Inc. Project, Revenue Bonds, Prerefunded 9/1/20 @ 100,
6.000% due 9/1/30 | | $ | 533,795 | |
| | 340,000 | | | Macon-Bibb County, GA, Urban Development Authority, Revenue Bonds,
5.750% due 6/15/372 | | | 342,040 | |
| | | | | | | | |
| | | | | | | 875,835 | |
| | | | | | | | |
| | |
| | | | Idaho — 0.6% | | | |
| | 500,000 | | | Idaho Health Facilities Authority, Revenue Bonds, Series A,
4.750% due 7/1/442 | | | 508,910 | |
| | 250,000 | | | Idaho State, Health Facilities Authority Revenue, Kootenai Health Project, Revenue Bonds, Series A,
4.375% due 7/1/342 | | | 252,172 | |
| | 365,000 | | | Idaho State, Housing and Finance Association, Nonprofit Facilities Revenue, Compass Charter School Project, Revenue Bonds, Series A,
6.000% due 7/1/392 | | | 378,370 | |
| | | | | | | | |
| | | | | | | 1,139,452 | |
| | | | | | | | |
| | |
| | | | Illinois — 15.2% | | | |
| | 125,000 | | | Chicago, IL, Board of Education, General Obligation Unlimited, Refunding, Series C,
5.000% due 12/1/28 | | | 125,019 | |
| | | | Chicago, IL, Board of Education, General Obligation Unlimited, Series A: | | | | |
| | 750,000 | | | 5.000% due 12/1/41 | | | 742,875 | |
| | 400,000 | | | 7.000% due 12/1/462 | | | 466,060 | |
| | | | Chicago, IL, Board of Education, General Obligation Unlimited, Series A, (NPFG Insured): | | | | |
| | 265,000 | | | 0.000% due 12/1/181 | | | 264,436 | |
| | 400,000 | | | 0.000% due 12/1/251 | | | 297,400 | |
| | 600,000 | | | Chicago, IL, Board of Education, General Obligation Unlimited, Series B,
7.000% due 12/1/422 | | | 701,022 | |
| | 345,000 | | | Chicago, IL, Board of Education, General Obligation Unlimited, Series B-1 (NPFG Insured),
0.000% due 12/1/191 | | | 334,929 | |
| | 1,030,000 | | | Chicago, IL, Board of Education, General Obligation Unlimited, Series B1, (NPFG Insured),
0.000% due 12/1/311 | | | 554,542 | |
| | 640,000 | | | Chicago, IL, Board of Education, General Obligation Unlimited, Series C,
5.250% due 12/1/39 | | | 647,270 | |
| | 500,000 | | | Chicago, IL, Board of Education, General Obligation Unlimited, Series H,
5.000% due 12/1/46 | | | 499,970 | |
| | 600,000 | | | Chicago, IL, General Obligation Unlimited, (NPFG Insured),
0.000% due 1/1/311 | | | 342,204 | |
| | | | Chicago, IL, General Obligation Unlimited, Refunding, Series A: | | | | |
| | 250,000 | | | 5.750% due 1/1/33 | | | 275,625 | |
| | 1,000,000 | | | 6.000% due 1/1/38 | | | 1,109,400 | |
| | 350,000 | | | Chicago, IL, General Obligation Unlimited, Refunding, Series B,
5.000% due 1/1/19 | | | 351,235 | |
| | 250,000 | | | Chicago, IL, General Obligation Unlimited, Refunding, Series C,
5.000% due 1/1/24 | | | 265,137 | |
| | | | Chicago, IL, General Obligation Unlimited, Series C: | | | | |
| | 410,000 | | | 0.000% due 1/1/311 | | | 229,707 | |
| | 500,000 | | | 5.000% due 1/1/34 | | | 500,840 | |
| | 250,000 | | | Chicago, IL, Transitional Authority, Sales Tax Receipts Revenue Bonds,
5.000% due 12/1/51 | | | 259,065 | |
| | | | Chicago, IL, Waterworks Revenue, Revenue Bonds: | | | | |
| | 200,000 | | | 5.000% due 11/1/24 | | | 214,572 | |
| | 375,000 | | | 5.000% due 11/1/30 | | | 403,721 | |
| | 500,000 | | | Cook County, IL, Community College District No. 508, General Obligation Unlimited,
5.250% due 12/1/43 | | | 512,510 | |
| | 400,000 | | | Illinois State Finance Authority, Christian Homes, Inc., Revenue Bonds,
5.000% due 5/15/36 | | | 411,112 | |
See Notes to Financial Statements.
THE GLENMEDE FUND, INC.
High Yield Municipal Portfolio
SCHEDULE OF PORTFOLIO INVESTMENTS — (Continued)
October 31, 2018
| | | | | | | | |
Face
Amount | | | | | Value | |
| |
| MUNICIPAL BONDS* — (Continued) | | | |
| | | | Illinois — (Continued) | | | |
| $ | 150,000 | | | Illinois State Finance Authority, Presbyterian Homes, Revenue Bonds, Series B, (1M USD LIBOR * 0.70 + 1.35%),
2.929% due 5/1/363 | | $ | 150,552 | |
| | 350,000 | | | Illinois State Finance Authority, Revenue Bonds,
4.000% due 7/1/35 | | | 351,501 | |
| | 255,000 | | | Illinois State Finance Authority, Revenue Bonds, Refunding,
3.000% due 5/15/20 | | | 255,989 | |
| | 150,000 | | | Illinois State Finance Authority, Revenue Bonds, Refunding, Lifespace Communities Project, Series A,
5.000% due 5/15/22 | | | 158,649 | |
| | | | Illinois State Finance Authority, Revenue Bonds, Refunding, Series A: | | | | |
| | 300,000 | | | 5.000% due 7/1/35 | | | 322,488 | |
| | 250,000 | | | 5.000% due 8/15/37 | | | 262,980 | |
| | | | Illinois State Finance Authority, Revenue Bonds, Refunding, Series C: | | | | |
| | 1,000,000 | | | 5.000% due 2/15/31 | | | 1,123,090 | |
| | 1,000,000 | | | 4.125% due 8/15/37 | | | 961,320 | |
| | 135,000 | | | Illinois State Finance Authority, Revenue Bonds, Series B, Prerefunded 8/15/19 @ 100,
5.750% due 8/15/30 | | | 138,914 | |
| | 500,000 | | | Illinois State Finance Authority, Silver Cross Hospital & Medical Center, Revenue Bonds, Series C,
5.000% due 8/15/44 | | | 522,775 | |
| | | | Illinois State Finance Authority, Student Housing Revenue, Dekalb II Northern Illinois, Revenue Bonds: | | | | |
| | 395,000 | | | 5.750% due 10/1/21 | | | 412,933 | |
| | 250,000 | | | 6.875% due 10/1/43 | | | 266,032 | |
| | 500,000 | | | Illinois State Finance Authority, Student Housing Revenue, Northern Illinois University Project, Revenue Bonds,
6.000% due 10/1/24 | | | 525,960 | |
| | | | Illinois State Finance Authority, Student Housing Revenue, Northern Illinois University Project, Revenue Bonds, Series A: | | | | |
| | 250,000 | | | 5.000% due 7/1/35 | | | 238,293 | |
| | 500,000 | | | 5.000% due 7/1/47 | | | 452,125 | |
| | 500,000 | | | Illinois State Finance Authority, Swedish Covenant Hospital, Revenue Bonds, Refunding, Series A,
5.000% due 8/15/34 | | | 530,390 | |
| | 820,000 | | | Illinois State Housing Development Authority, Revenue Bonds, Refunding, Series C,
3.500% due 8/1/46 | | | 832,718 | |
| | 500,000 | | | Illinois State Sports Facilities Authority, State Tax Supported, Capital Apprec, Revenue Bonds, (AMBAC Insured),
0.000% due 6/15/231 | | | 413,960 | |
| | 500,000 | | | Illinois State University, Revenue Bonds, (AGMC Insured),
5.000% due 4/1/24 | | | 542,585 | |
| | 750,000 | | | Illinois State, Finance Authority Revenue, Revenue Bonds, Refunding,
5.125% due 2/15/45 | | | 675,547 | |
| | 320,000 | | | Illinois State, Finance Authority, Charter School Revenue, Refunding and Improvement, Chicago International Charter School Project, Revenue Bonds,
5.000% due 12/1/47 | | | 323,245 | |
| | 560,000 | | | Illinois State, Finance Authority, Student Housing & Academic Facilities Revenue, Revenue Bonds, Series A,
5.000% due 2/15/37 | | | 594,289 | |
| | | | Illinois State, General Obligation Unlimited: | | | | |
| | 500,000 | | | 5.000% due 1/1/30 | | | 509,305 | |
| | 1,000,000 | | | 5.000% due 2/1/39 | | | 1,005,880 | |
| | 200,000 | | | 5.000% due 1/1/41 | | | 200,704 | |
| | 1,250,000 | | | Illinois State, General Obligation Unlimited, Series C,
5.000% due 11/1/29 | | | 1,279,100 | |
| | 1,000,000 | | | Illinois State, General Obligation Unlimited, Series D,
5.000% due 11/1/28 | | | 1,029,940 | |
| | 250,000 | | | Metropolitan Pier & Exposition Authority, IL, Dedicated State Tax Revenue, Revenue Bonds, Refunding (BAM, NPFG Insured),
0.000% due 6/15/281 | | | 166,038 | |
See Notes to Financial Statements.
THE GLENMEDE FUND, INC.
High Yield Municipal Portfolio
SCHEDULE OF PORTFOLIO INVESTMENTS — (Continued)
October 31, 2018
| | | | | | | | |
Face
Amount | | | | | Value | |
| |
| MUNICIPAL BONDS* — (Continued) | | | |
| | | | Illinois — (Continued) | | | |
| $ | 1,000,000 | | | Metropolitan Pier & Exposition Authority, IL, Dedicated State Tax Revenue, Revenue Bonds, Series A, (NPFG Insured),
0.000% due 6/15/361 | | $ | 411,760 | |
| | 500,000 | | | Metropolitan Pier & Exposition Authority, IL, Dedicated State Tax Revenue, Revenue Bonds, Series B, (AGMC Insured),
0.000% due 6/15/271 | | | 349,150 | |
| | 2,000,000 | | | Metropolitan Pier & Exposition Authority, IL, Dedicated State Tax, Revenue Bonds, Series A, (AGMC Insured MBIA),
0.000% due 12/15/291 | | | 1,231,340 | |
| | 500,000 | | | Metropolitan Pier & Exposition Authority, IL, McCormick Place Expansion Project, Revenue Bonds, Series B,
5.000% due 12/15/40 | | | 516,600 | |
| | 250,000 | | | Southern Illinois State University, Housing & Auxiliary Facilities System, Revenue Bonds, Series A, (NPFG Insured),
0.000% due 4/1/221 | | | 224,398 | |
| | 500,000 | | | Southern Illinois State University, Housing & Auxiliary Facilities System, Revenue Bonds, Series B1,
5.000% due 4/1/22 | | | 526,885 | |
| | 1,000,000 | | | University of Illinois, Auxiliary Facilities, Revenue Bonds, Series A, (AGMC Insured),
4.000% due 4/1/36 | | | 998,730 | |
| | 500,000 | | | Volo Village, IL, Special Service Area No. 3 & 6, Special Tax, Symphony Meadows/Lancaster Falls Project, (AGMC Insured),
2.875% due 3/1/25 | | | 476,095 | |
| | 497,000 | | | Yorkville, IL, United City Special Service, Special Tax, (AGMC Insured),
3.000% due 3/1/25 | | | 478,487 | |
| | 250,000 | | | Yorkville, IL, United City Special Service, Special Tax, Refunding, (AGMC Insured),
4.000% due 3/1/36 | | | 232,950 | |
| | | | | | | | |
| | | | | | | 29,202,348 | |
| | | | | | | | |
| | |
| | | | Indiana — 2.1% | | | |
| | | | Indiana Finance Authority, Midwestern Disaster Relief Revenue, Revenue Bonds, Ohio Valley Electric Corp. Project, Series A: | | | | |
| | 750,000 | | | 5.000% due 6/1/32 | | | 732,255 | |
| | 300,000 | | | 5.000% due 6/1/39 | | | 288,084 | |
| | 2,000,000 | | | Indiana State Finance Authority, Economic Development Revenue, Refunding, Republic Services, Inc. Project, Revenue Bonds, Series B,
1.850% due 5/1/283,4 | | | 1,999,780 | |
| | | | Indiana State Finance Authority, Greencroft Obligated Group, Revenue Bonds, Series A: | | | | |
| | 95,000 | | | 5.750% due 11/15/28 | | | 101,309 | |
| | 120,000 | | | 6.500% due 11/15/33 | | | 130,536 | |
| | | | Knox County, IN, Economic Development Authority, Revenue Bonds, Refunding, Series A: | | | | |
| | 300,000 | | | 5.000% due 4/1/23 | | | 316,131 | |
| | 350,000 | | | 5.000% due 4/1/28 | | | 363,318 | |
| | | | | | | | |
| | | | | | | 3,931,413 | |
| | | | | | | | |
| | |
| | | | Iowa — 1.6% | | | |
| | 150,000 | | | Iowa State, Finance Authority, Midwestern Disaster Area Revenue, Iowa Fertilizer Co. LLC Project, Revenue Bonds,
5.250% due 12/1/25 | | | 158,468 | |
| | 200,000 | | | Iowa State, Finance Authority, Midwestern Disaster Area Revenue, Iowa Fertilizer Co. LLC Project, Revenue Bonds, Refunding,
5.500% due 12/1/22 | | | 200,380 | |
| | 250,000 | | | Iowa State, Finance Authority, Midwestern Disaster Area Revenue, Lowa Fertilizer Co. LLC Project, Revenue Bonds, Refunding,
5.000% due 12/1/19 | | | 255,245 | |
| | 525,000 | | | Iowa State, Finance Authority, Midwestern Disaster Relief Revenue, Iowa Fertilizer Co. LLC Project, Revenue Bonds, Refunding, Series A,
5.250% due 12/1/503,5 | | | 548,819 | |
See Notes to Financial Statements.
THE GLENMEDE FUND, INC.
High Yield Municipal Portfolio
SCHEDULE OF PORTFOLIO INVESTMENTS — (Continued)
October 31, 2018
| | | | | | | | |
Face
Amount | | | | | Value | |
| |
| MUNICIPAL BONDS* — (Continued) | | | |
| | | | Iowa — (Continued) | | | |
| $ | 750,000 | | | Iowa State, Finance Authority, Midwestern Disaster Relief Revenue, Iowa Fertilizer Co. LLC Project, Revenue Bonds, Refunding, Series B,
5.250% due 12/1/503,5 | | $ | 796,440 | |
| | | | Tobacco Settlement Authority, IA, Revenue Bonds, Series C: | | | | |
| | 690,000 | | | 5.375% due 6/1/38 | | | 691,801 | |
| | 500,000 | | | 5.625% due 6/1/46 | | | 500,635 | |
| | | | | | | | |
| | | | | | | 3,151,788 | |
| | | | | | | | |
| | |
| | | | Kansas — 0.2% | | | |
| | 180,000 | | | Wichita, KS, Sales Tax, Special Obligation Revenue, Revenue Bonds, Refunding,
3.000% due 9/1/23 | | | 178,785 | |
| | 150,000 | | | Wyandotte County, Kansas City Unified Government, Revenue Bonds,
5.000% due 12/1/34 | | | 147,232 | |
| | 85,000 | | | Wyandotte County, KS, Kansas City Unified Government, Wyandotte Plaza Project, Revenue Bonds,
4.000% due 12/1/28 | | | 83,544 | |
| | | | | | | | |
| | | | | | | 409,561 | |
| | | | | | | | |
| | |
| | | | Kentucky — 0.5% | | | |
| | 785,000 | | | Kentucky Public Transportation Infrastructure Authority, Toll Revenue, Downtown Crossing Project, Revenue Bonds, Series B,
0.000% due 7/1/211 | | | 717,946 | |
| | 100,000 | | | Kentucky Public Transportation Infrastructure Authority, Toll Revenue, Downtown Crossing Project, Series A,
6.000% due 7/1/53 | | | 108,404 | |
| | 170,000 | | | Louisville & Jefferson County, KY, Metropolitan Government Healthcare System, Revenue Bonds, Refunding, Series A,
5.000% due 10/1/31 | | | 186,012 | |
| | | | | | | | |
| | | | | | | 1,012,362 | |
| | | | | | | | |
| | |
| | | | Louisiana — 1.0% | | | |
| | 900,000 | | | Juban Crossing Economic Development District, LA, Revenue Bonds, Refunding, Series C,
7.000% due 9/15/442 | | | 924,210 | |
| | 1,000,000 | | | Louisiana State, Public Facilities Authority Revenue, Revenue Bonds, Air Products & Chemicals Project, Series A,
1.670% due 8/1/433,6 | | | 1,000,000 | |
| | | | | | | | |
| | | | | | | 1,924,210 | |
| | | | | | | | |
| | |
| | | | Maine — 0.2% | | | |
| | 440,000 | | | Maine Health & Higher Educational Facilities Authority, Revenue Bonds,
5.000% due 7/1/43 | | | 451,928 | |
| | | | | | | | |
| | |
| | | | Maryland — 1.9% | | | |
| | 1,125,000 | | | Baltimore, MD, Special Obligation, Revenue Bonds, Refunding, Series A,
5.000% due 9/1/38 | | | 1,173,881 | |
| | 250,000 | | | Howard County, MD, Special Obligation, Revenue Bonds, Series A,
4.125% due 2/15/342 | | | 243,753 | |
| | 435,000 | | | Maryland State, Community Development Administration, Department Housing & Community Development, Revenue Bonds, Refunding, Series A,
4.500% due 9/1/487 | | | 462,383 | |
| | 250,000 | | | Maryland State, Economic Development Corp., Special Obligation, Tax Allocation,
4.500% due 7/1/44 | | | 249,608 | |
| | 750,000 | | | Maryland State, Health & Higher Educational Facilities Authority, Revenue Bonds, Series A,
5.000% due 1/1/21 | | | 785,992 | |
| | 500,000 | | | Prince George’s County, MD, Revenue Authority, Suitland-Naylor Road Project,
5.000% due 7/1/462 | | | 472,780 | |
| | 300,000 | | | Rockville, MD, Mayor & Council, Economic Development Revenue, Revenue Bonds, Series C3,
2.500% due 11/1/24 | | | 288,306 | |
| | | | | | | | |
| | | | | | | 3,676,703 | |
| | | | | | | | |
See Notes to Financial Statements.
THE GLENMEDE FUND, INC.
High Yield Municipal Portfolio
SCHEDULE OF PORTFOLIO INVESTMENTS — (Continued)
October 31, 2018
| | | | | | | | |
Face
Amount | | | | | Value | |
| |
| MUNICIPAL BONDS* — (Continued) | | | |
| | | | Massachusetts — 0.8% | | | |
| $ | 500,000 | | | Massachusetts State, Development Finance Agency Revenue, Refunding, Suffolk University,
5.000% due 7/1/36 | | $ | 537,795 | |
| | 470,000 | | | Massachusetts State, Development Finance Agency Revenue, Series A,
4.680% due 11/15/212 | | | 470,470 | |
| | 418,083 | | | Massachusetts State, Development Finance Agency Revenue, Series A-1,
6.250% due 11/15/462 | | | 429,308 | |
| | 105,000 | | | Massachusetts State, Development Finance Agency Revenue, Series B,
4.680% due 11/15/212 | | | 105,013 | |
| | | | | | | | |
| | | | | | | 1,542,586 | |
| | | | | | | | |
| | |
| | | | Michigan — 2.4% | | | |
| | 385,000 | | | Dearborn, MI, Economic Development Corp., Revenue Bonds,
7.500% due 11/15/442 | | | 373,442 | |
| | 280,000 | | | Flint, MI, Hospital Building Authority Rental, Revenue Bonds, Series A,
5.250% due 7/1/39 | | | 282,859 | |
| | 600,000 | | | Grand Rapids, MI, Economic Development Corp., Beacon Hill Eastgate Project, Revenue Bonds, Refunding, Series A,
5.000% due 11/1/37 | | | 614,850 | |
| | | | Kentwood, MI, Economic Development Corp., Revenue Bonds, Refunding: | | | | |
| | 50,000 | | | 4.500% due 11/15/21 | | | 52,190 | |
| | 25,000 | | | 4.750% due 11/15/22 | | | 26,363 | |
| | 250,000 | | | 5.000% due 11/15/37 | | | 262,473 | |
| | 250,000 | | | 5.625% due 11/15/41 | | | 264,027 | |
| | 2,430,000 | | | Michigan State Housing Development Authority, Safe Mortgage Revenue, Revenue Bonds, Series C,
4.250% due 6/1/497 | | | 2,560,734 | |
| | 200,000 | | | Michigan State Strategic Fund, Limited Obligation Revenue, Revenue Bonds, Refunding, Series CC,
1.450% due 9/1/303 | | | 191,434 | |
| | | | | | | | |
| | | | | | | 4,628,372 | |
| | | | | | | | |
| | |
| | | | Minnesota — 0.1% | | | |
| | 240,000 | | | St. Paul, MN, Housing & Redevelopment Authority, Charter School Lease Revenue, Revenue Bonds, Series A,
5.500% due 7/1/382 | | | 242,616 | |
| | | | | | | | |
| | |
| | | | Mississippi — 2.3% | | | |
| | 4,000,000 | | | Mississippi State, Business Finance Commission, Gulf Opportunity Zone, Chevron USA, Inc. Project, Series A,
1.710% due 12/1/303,6 | | | 4,000,000 | |
| | 450,000 | | | Mississippi State, Hospital Equipment and Facilities Authority, Refunding, Baptist Memorial Health Care Obligated Group, Revenue Bonds, Series B-2,
2.125% due 9/1/22 | | | 449,568 | |
| | | | | | | | |
| | | | | | | 4,449,568 | |
| | | | | | | | |
| | |
| | | | Missouri — 1.1% | | | |
| | 470,000 | | | Cape Girardeau County, MO, Industrial Development Authority, Southeast Health, Revenue Bonds, Series A,
6.000% due 3/1/33 | | | 523,082 | |
| | 195,000 | | | Lees Summit, MO, Special Obligation Tax Increment, Tax Allocation, Refunding,
3.500% due 11/1/232 | | | 190,839 | |
| | 500,000 | | | Maryland Heights, MO, Industrial Development Authority, State Louis Community ICE Center Project, Revenue Bonds, Series A,
4.375% due 3/15/30 | | | 490,970 | |
| | 100,000 | | | Missouri State Health & Educational Facilities Authority, Lutheran Senior Services, Revenue Bonds,
5.000% due 2/1/25 | | | 108,024 | |
| | 125,000 | | | Missouri State Health & Educational Facilities Authority, Revenue Bonds,
5.000% due 2/1/26 | | | 134,531 | |
| | 100,000 | | | Missouri State Health & Educational Facilities Authority, Revenue Bonds, Series A,
5.000% due 2/1/28 | | | 108,457 | |
See Notes to Financial Statements.
THE GLENMEDE FUND, INC.
High Yield Municipal Portfolio
SCHEDULE OF PORTFOLIO INVESTMENTS — (Continued)
October 31, 2018
| | | | | | | | |
Face
Amount | | | | | Value | |
| |
| MUNICIPAL BONDS* — (Continued) | | | |
| | | | Missouri — (Continued) | | | |
| $ | 355,000 | | | St. Louis County, MO, Industrial Development Authority, Senior Living Facilities, Revenue Bonds, Refunding,
5.000% due 9/1/32 | | $ | 363,633 | |
| | 150,000 | | | St. Louis County, MO, Industrial Development Authority, Senior Living Revenue, Revenue Bonds, Refunding,
5.000% due 9/1/48 | | | 150,414 | |
| | | | | | | | |
| | | | | | | 2,069,950 | |
| | | | | | | | |
| | |
| | | | Nebraska — 0.2% | | | |
| | 300,000 | | | Nebraska State, Investment Finance Authority, Safe Housing Revenue, Revenue Bonds, Series C,
4.000% due 9/1/48 | | | 312,837 | |
| | | | | | | | |
| | |
| | | | Nevada — 0.7% | | | |
| | 335,000 | | | Department of Business & Industry, NV, Revenue Bonds, Series A,
5.000% due 7/15/272 | | | 347,127 | |
| | | | Las Vegas, NV, Sales Tax Increment Revenue: | | | | |
| | 100,000 | | | 2.750% due 6/15/212 | | | 98,456 | |
| | 385,000 | | | 3.500% due 6/15/252 | | | 366,339 | |
| | 500,000 | | | Nevada State, Department of Business and Industry, Revenue Bonds, Series A,
5.000% due 12/15/482 | | | 493,075 | |
| | | | | | | | |
| | | | | | | 1,304,997 | |
| | | | | | | | |
| | |
| | | | New Jersey — 8.2% | | | |
| | 250,000 | | | Casino Reinvestment Development Authority, NJ, Luxury Tax Revenue, Refunding, (AGMC Insured),
5.000% due 11/1/24 | | | 271,395 | |
| | 500,000 | | | New Jersey Economic Development Authority, Revenue Bonds, Refunding, Series K, (AMBAC Insured),
5.500% due 12/15/19 | | | 516,385 | |
| | 1,085,000 | | | New Jersey State Economic Development Authority Revenue, Refunding, School Facilities Construction, Revenue Bonds, Series NN,
5.000% due 3/1/24 | | | 1,161,536 | |
| | 1,000,000 | | | New Jersey State Economic Development Authority Revenue, Revenue Bonds, Refunding, (AGMC Insured),
5.000% due 6/1/29 | | | 1,104,080 | |
| | 345,000 | | | New Jersey State Economic Development Authority School Revenue, Foundation Academy Charter School Project, Revenue Bonds, Series A,
5.000% due 7/1/38 | | | 359,659 | |
| | 500,000 | | | New Jersey State Economic Development Authority, Revenue Bonds, Refunding, Series I, (SIFMA MUNI SWAP INDEX + 1.60%),
3.200% due 3/1/283 | | | 494,830 | |
| | 2,500,000 | | | New Jersey State Economic Development Authority, Revenue Bonds, Refunding, Series XX,
5.000% due 6/15/25 | | | 2,724,400 | |
| | | | New Jersey State Economic Development Authority, Revenue Bonds, Series A: | | | | |
| | 250,000 | | | 5.000% due 1/1/24 | | | 270,140 | |
| | 600,000 | | | 5.000% due 7/1/32 | | | 642,270 | |
| | 500,000 | | | New Jersey State Health Care Facilities Financing Authority, Revenue Bonds, Series A,
5.000% due 7/1/34 | | | 557,480 | |
| | 200,000 | | | New Jersey State Health Care Facilities Financing Authority, University Hospital, Revenue Bonds, Series A, (AGMC Insured),
5.000% due 7/1/30 | | | 219,930 | |
| | 250,000 | | | New Jersey State Transportation Trust Fund Authority, Refunding, FED Highway Reimbursement, Revenue Bonds, Series A,
5.000% due 6/15/23 | | | 271,185 | |
| | | | New Jersey State Transportation Trust Fund Authority, Revenue Bonds, Series A: | | | | |
| | 1,000,000 | | | 0.000% due 12/15/351 | | | 436,600 | |
| | 1,300,000 | | | 0.000% due 12/15/391 | | | 452,491 | |
| | 1,000,000 | | | New Jersey State Transportation Trust Fund Authority, Revenue Bonds, Series A, (BAM Insured),
0.000% due 12/15/271 | | | 701,230 | |
| | 330,000 | | | New Jersey State Transportation Trust Fund Authority, Revenue Bonds, Series AA,
5.000% due 6/15/19 | | | 335,112 | |
See Notes to Financial Statements.
THE GLENMEDE FUND, INC.
High Yield Municipal Portfolio
SCHEDULE OF PORTFOLIO INVESTMENTS — (Continued)
October 31, 2018
| | | | | | | | |
Face
Amount | | | | | Value | |
| |
| MUNICIPAL BONDS* — (Continued) | | | |
| | | | New Jersey — (Continued) | | | |
| $ | 1,000,000 | | | New Jersey State Transportation Trust Fund Authority, Revenue Bonds, Series B, (NPFG Insured),
5.500% due 12/15/21 | | $ | 1,081,640 | |
| | 1,195,000 | | | New Jersey State Transportation Trust Fund Authority, Revenue Bonds, Series B-4,
5.250% due 12/15/19 | | | 1,230,886 | |
| | 1,000,000 | | | New Jersey State Transportation Trust Fund Authority, Revenue Bonds, Series C, (AGMC Insured),
0.000% due 12/15/341 | | | 491,910 | |
| | 1,000,000 | | | New Jersey State Transportation Trust Fund Authority, Revenue Bonds, Series C, (NPFG Insured),
0.000% due 12/15/311 | | | 554,900 | |
| | 95,000 | | | New Jersey State, Economic Development Authority, Revenue Bonds, Series A, Prerefunded 6/1/20 @ 100,
5.000% due 6/1/21 | | | 99,289 | |
| | | | South Jersey, NJ, Transportation Authority LLC, Revenue Bonds, Refunding, Series A: | | | | |
| | 200,000 | | | 5.000% due 11/1/26 | | | 218,590 | |
| | 750,000 | | | 5.000% due 11/1/32 | | | 806,602 | |
| | 250,000 | | | 5.000% due 11/1/33 | | | 268,310 | |
| | 500,000 | | | Tobacco Settlement Financing Corp., NJ, Revenue Bonds, Refunding, Series A,
5.000% due 6/1/29 | | | 553,720 | |
| | | | | | | | |
| | | | | | | 15,824,570 | |
| | | | | | | | |
| |
| | | | New York — 2.6% | |
| | 500,000 | | | Glen Cove, NY, Local Economic Assistance Corp., Revenue Bonds, Series C,
0.000% due 1/1/551 | | | 407,875 | |
| | 500,000 | | | New York City, NY, Housing Development Corp., Multi-Family Mortgage Revenue, Series E,
3.500% due 2/15/48 | | | 489,320 | |
| | 500,000 | | | New York City, NY, Housing Development Corp., Multi-Family Mortgage Revenue, Series F,
4.500% due 2/15/48 | | | 510,640 | |
| | 700,000 | | | New York City, NY, Transitional Finance Authority Revenue, Revenue Bonds, Subseries E-3, (SPA : JP Morgan Chase Bank N.A.),
1.680% due 2/1/453,6 | | | 700,000 | |
| | 700,000 | | | New York State, Dormitory Authority Revenue, Non State Supported Debt, Refunding,
5.000% due 12/1/322 | | | 758,863 | |
| | 820,000 | | | New York State, Mortgage Agency, Homeowner Mortgage, Revenue Bonds, Refunding, Series 195,
4.000% due 10/1/46 | | | 847,388 | |
| | 1,000,000 | | | New York, NY, General Obligation Unlimited, Subseries L-5, (SPA : Bank of America N.A.),
1.700% due 4/1/353,6 | | | 1,000,000 | |
| | 310,000 | | | Port Authority of New York & New Jersey, JFK International Airport, Revenue Bonds,
6.000% due 12/1/42 | | | 331,920 | |
| | | | | | | | |
| | | | | | | 5,046,006 | |
| | | | | | | | |
| | |
| | | | North Carolina — 0.5% | | | |
| | 500,000 | | | North Carolina State Medical Care Commission, Revenue Bonds,
5.000% due 10/1/20 | | | 519,590 | |
| | 500,000 | | | North Carolina State, Medical Care Commission, Retirement Facilities Revenue, Revenue Bonds, Series B,
5.000% due 4/1/47 | | | 511,000 | |
| | | | | | | | |
| | | | | | | 1,030,590 | |
| | | | | | | | |
| | |
| | | | Ohio — 5.2% | | | |
| | 450,000 | | | American Municipal Power, Inc., OH, Combination Hydroelectric Project, Revenue Bonds, Series A,
2.250% due 2/15/48 | | | 446,026 | |
| | | | Buckeye Tobacco Settlement Financing Authority, OH, Revenue Bonds, Series A-2: | | | | |
| | 1,000,000 | | | 6.500% due 6/1/47 | | | 1,010,750 | |
| | 500,000 | | | 5.875% due 6/1/47 | | | 485,495 | |
| | 775,000 | | | Buckeye Tobacco Settlement Financing Authority, OH, Revenue Bonds, Series A-3,
6.250% due 6/1/37 | | | 782,355 | |
| | 600,000 | | | Centerville, OH, Healthcare Revenue, Refunding,
5.250% due 11/1/50 | | | 613,380 | |
| | 250,000 | | | Cleveland, OH, Airport System Revenue, Revenue Bonds, Series B, (AGMC Insured),
5.000% due 1/1/23 | | | 273,835 | |
See Notes to Financial Statements.
THE GLENMEDE FUND, INC.
High Yield Municipal Portfolio
SCHEDULE OF PORTFOLIO INVESTMENTS — (Continued)
October 31, 2018
| | | | | | | | |
Face
Amount | | | | | Value | |
| |
| MUNICIPAL BONDS* — (Continued) | | | |
| | | | Ohio — (Continued) | | | |
| $ | 1,045,000 | | | Cuyahoga County, OH, Hospital Revenue, Refunding,
5.500% due 2/15/52 | | $ | 1,100,280 | |
| | 700,000 | | | Hamilton County, OH, Healthcare Revenue, Refunding and Improvement, Life Enriching Communities Project, Revenue Bonds, Refunding,
5.000% due 1/1/51 | | | 709,205 | |
| | 815,000 | | | Licking County, OH, Health Care Facilities Authority Revenue, Refunding, Series A,
6.000% due 7/1/50 | | | 844,764 | |
| | 920,000 | | | Lucas County, OH, Hospital Revenue, Promedica Healthcare Obligated Group, Revenue Bonds, Refunding, Series A,
5.250% due 11/15/48 | | | 960,103 | |
| | 380,000 | | | Muskingum County, OH, Hospital Facilities, Genesis Healthcare Systems Project, Revenue Bonds,
5.000% due 2/15/19 | | | 382,098 | |
| | 500,000 | | | Ohio State, Air Quality Development Authority, Pollution Control, Revenue Bonds, Refunding, Series C,
5.625% due 6/1/498 | | | 485,000 | |
| | 350,000 | | | Ohio State, Air Quality Development Authority, Revenue Bonds, Ohio Valley Electric Corp. Project, Series E,
5.625% due 10/1/19 | | | 356,010 | |
| | | | Southeastern Ohio Port Authority Hospital Facilities, Revenue Bonds: | | | | |
| | 690,000 | | | 5.000% due 12/1/19 | | | 701,226 | |
| | 300,000 | | | 5.750% due 12/1/32 | | | 316,224 | |
| | 500,000 | | | 6.000% due 12/1/42 | | | 520,095 | |
| | | | | | | | |
| | | | | | | 9,986,846 | |
| | | | | | | | |
| | |
| | | | Oklahoma — 0.1% | | | |
| | 105,000 | | | Fort Sill Apache Tribe, OK, Economic Development Authority, Gaming Enterprise Revenue, Series A,
8.500% due 8/25/262 | | | 119,610 | |
| | | | | | | | |
| | |
| | | | Pennsylvania — 4.6% | | | |
| | 500,000 | | | Allentown , PA, Commercial & Industrial Development Authority, Revenue Bonds, Series A,
6.250% due 7/1/472 | | | 470,230 | |
| | 125,000 | | | Chester County, PA, Industrial Development Authority, Revenue Bonds, Refunding, Series A,
5.000% due 12/15/51 | | | 125,539 | |
| | 500,000 | | | Chester County, PA, Industrial Development Authority, Special Obligation Revenue, Woodlands at Greystone Project, Revenue Bonds,
5.000% due 3/1/382 | | | 498,735 | |
| | 250,000 | | | Commonwealth Financing Authority, PA, Tobacco Master Settlement Payment Revenue, Revenue Bonds,
5.000% due 6/1/22 | | | 268,962 | |
| | | | Crawford County, PA, Hospital Authority, Revenue Bonds, Refunding, Series A: | | | | |
| | 400,000 | | | 6.000% due 6/1/36 | | | 421,868 | |
| | 250,000 | | | 6.000% due 6/1/46 | | | 261,273 | |
| | 450,000 | | | Doylestown, PA, Hospital Authority, Revenue Bonds, Refunding, Series A,
5.000% due 7/1/41 | | | 467,379 | |
| | 175,000 | | | East Hempfield Township, PA, Industrial Development Authority, Revenue Bonds, Refunding,
5.000% due 12/1/26 | | | 194,227 | |
| | 200,000 | | | Franklin County, PA, Industrial Development Authority, Menno-Haven, Inc. Project, Revenue Bonds, Refunding,
5.000% due 12/1/43 | | | 201,884 | |
| | 445,000 | | | Montgomery County, PA, Higher Education & Health Authority, Revenue Bonds, Refunding,
5.000% due 12/1/47 | | | 472,323 | |
| | | | Montgomery County, PA, Industrial Development Authority, Health System Revenue, Revenue Bonds, Refunding, Series A: | | | | |
| | 420,000 | | | 5.250% due 1/15/27 | | | 458,438 | |
| | 250,000 | | | 5.250% due 1/15/46 | | | 263,210 | |
| | | | Montgomery County, PA, Industrial Development Authority, Revenue Bonds, Refunding: | | | | |
| | 105,000 | | | 5.000% due 11/15/23 | | | 112,214 | |
| | 500,000 | | | 5.000% due 11/15/36 | | | 531,945 | |
| | 100,000 | | | 5.000% due 12/1/46 | | | 104,221 | |
See Notes to Financial Statements.
THE GLENMEDE FUND, INC.
High Yield Municipal Portfolio
SCHEDULE OF PORTFOLIO INVESTMENTS — (Continued)
October 31, 2018
| | | | | | | | |
Face
Amount | | | | | Value | |
| |
| MUNICIPAL BONDS* — (Continued) | | | |
| | | | Pennsylvania — (Continued) | | | |
| $ | 530,000 | | | Pennsylvania State, Higher Educational Facilities Authority Revenue, Revenue Bonds, Prerefunded 10/1/21 @ 100,
6.000% due 10/1/31 | | $ | 583,689 | |
| | | | Pennsylvania State, Higher Educational Facilities Authority, Revenue Bonds, Prerefunded 7/1/20 @ 100: | | | | |
| | 1,080,000 | | | 5.800% due 7/1/30 | | | 1,139,681 | |
| | 650,000 | | | 6.000% due 7/1/43 | | | 688,031 | |
| | 500,000 | | | Pennsylvania State, Higher Educational Facilities Authority, Student Housing Revenue,
5.000% due 7/1/31 | | | 513,700 | |
| | 545,000 | | | Pennsylvania State, Higher Educational Facilities Authority, Student Housing Revenue, Refunding, Series A,
5.000% due 7/1/25 | | | 586,480 | |
| | | | Philadelphia, PA, Authority for Industrial Development, Senior Living Revenue, Revenue Bonds, Refunding, Series A: | | | | |
| | 200,000 | | | 5.000% due 7/1/31 | | | 207,970 | |
| | 100,000 | | | 5.000% due 7/1/32 | | | 103,549 | |
| | 150,000 | | | Washington County, PA, Redevelopment Authority Revenue, Tax Allocation, Refunding,
5.000% due 7/1/28 | | | 153,336 | |
| | | | | | | | |
| | | | | | | 8,828,884 | |
| | | | | | | | |
| | |
| | | | Puerto Rico — 4.8% | | | |
| | 35,000 | | | Commonwealth of Puerto Rico, General Obligation Unlimited, Refunding, (AGMC Insured),
4.500% due 7/1/23 | | | 35,086 | |
| | 250,000 | | | Commonwealth of Puerto Rico, General Obligation Unlimited, Refunding, Series A, (NPFG Insured),
5.500% due 7/1/20 | | | 257,795 | |
| | 1,070,000 | | | Puerto Rico Commonwealth Aqueduct & Sewer Authority, Revenue Bonds, Series A,
5.250% due 7/1/42 | | | 989,750 | |
| | 315,000 | | | Puerto Rico Commonwealth, General Obligation Unlimited, Refunding, Series A, (AMBAC Insured),
4.600% due 7/1/19 | | | 317,819 | |
| | 25,000 | | | Puerto Rico Electric Power Authority, Revenue Bonds, (AGMC Insured),
5.000% due 7/1/27 | | | 26,198 | |
| | 610,000 | | | Puerto Rico Electric Power Authority, Revenue Bonds, Refunding, Series DDD, (AGMC Insured),
3.625% due 7/1/23 | | | 600,081 | |
| | 50,000 | | | Puerto Rico Electric Power Authority, Revenue Bonds, Refunding, Series SS, (AGMC Insured),
5.000% due 7/1/30 | | | 52,172 | |
| | 410,000 | | | Puerto Rico Electric Power Authority, Revenue Bonds, Refunding, Series UU, (AGMC Insured), (3M USD LIBOR * 0.67 + 0.52%),
2.125% due 7/1/293 | | | 384,375 | |
| | | | Puerto Rico Electric Power Authority, Revenue Bonds, Series NN, (NPFG Insured): | | | | |
| | 490,000 | | | 5.250% due 7/1/19 | | | 496,198 | |
| | 280,000 | | | 4.750% due 7/1/33 | | | 280,003 | |
| | 750,000 | | | Puerto Rico Highway and Transportation Authority, Revenue Bonds, Refunding, Series N, (AMBAC Insured),
4.070% due 7/1/283,4 | | | 652,500 | |
| | 790,000 | | | Puerto Rico Industrial Tourist Educational Medical & Environmental Control Facilities Financing Authority, Auxilio Muto, Revenue Bonds, Series A,
6.000% due 7/1/33 | | | 812,981 | |
| | 250,000 | | | Puerto Rico Industrial Tourist Educational Medical & Environmental Control Facilities Financing Authority, International American University Project, Revenue Bonds,
5.000% due 10/1/31 | | | 252,465 | |
| | 430,000 | | | Puerto Rico Industrial Tourist Educational Medical & Environmental Control Facilities Financing Authority, International American University Project, Revenue Bonds, (NPFG Insured),
4.500% due 10/1/29 | | | 425,962 | |
| | 100,000 | | | Puerto Rico Industrial Tourist Educational Medical & Environmental Control Facilities Financing Authority, Refunding, ANA G Mendez University Project, Revenue Bonds,
5.500% due 12/1/31 | | | 97,750 | |
| | 500,000 | | | Puerto Rico Industrial Tourist Educational Medical & Environmental Control Facilities Financing Authority, Revenue Bonds,
5.000% due 3/1/36 | | | 461,250 | |
See Notes to Financial Statements.
THE GLENMEDE FUND, INC.
High Yield Municipal Portfolio
SCHEDULE OF PORTFOLIO INVESTMENTS — (Continued)
October 31, 2018
| | | | | | | | |
Face
Amount | | | | | Value | |
|
| MUNICIPAL BONDS* — (Continued) | |
| | | | Puerto Rico — (Continued) | |
| $ | 500,000 | | | Puerto Rico Industrial Tourist Educational Medical & Environmental Control Facilities Financing Authority, Revenue Bonds, Refunding,
5.000% due 10/1/20 | | $ | 510,215 | |
| | 1,005,000 | | | Puerto Rico Sales Tax Financing Corp., Sales Tax Revenue, Revenue Bonds, Series A, (AMBAC Insured),
0.000% due 8/1/471 | | | 214,829 | |
| | 2,670,000 | | | Puerto Rico Sales Tax Financing Corp., Sales Tax Revenue, Series A, (AMBAC Insured),
0.000% due 8/1/541 | | | 385,201 | |
| | | | Puerto Rico Sales Tax Financing Corp., Sales Tax Revenue, Series A, (NPFG Insured): | | | | |
| | 1,030,000 | | | 0.000% due 8/1/431 | | | 289,131 | |
| | 1,000,000 | | | 0.000% due 8/1/441 | | | 266,670 | |
| | 220,000 | | | 0.000% due 8/1/461 | | | 52,943 | |
| | | | University of Puerto Rico, Revenue Bonds, Refunding, Series P: | | | | |
| | 495,000 | | | 5.000% due 6/1/19 | | | 482,006 | |
| | 50,000 | | | 5.000% due 6/1/20 | | | 47,813 | |
| | 185,000 | | | University of Puerto Rico, Revenue Bonds, Refunding, Series P, (NPFG Insured),
5.000% due 6/1/25 | | | 185,675 | |
| | | | University of Puerto Rico, Revenue Bonds, Series Q: | | | | |
| | 145,000 | | | 5.000% due 6/1/19 | | | 141,194 | |
| | 75,000 | | | 5.000% due 6/1/25 | | | 69,094 | |
| | 315,000 | | | 5.000% due 6/1/30 | | | 282,838 | |
| | 150,000 | | | 5.000% due 6/1/36 | | | 133,256 | |
| | | | | | | | |
| | | | | | | 9,203,250 | |
| | | | | | | | |
| |
| | | | Rhode Island — 1.7% | |
| | | | Rhode Island Health & Educational Building Corp., Revenue Bonds, Refunding, Series B: | | | | |
| | 900,000 | | | 5.000% due 9/1/31 | | | 939,636 | |
| | 750,000 | | | 5.000% due 9/1/36 | | | 768,503 | |
| | 400,000 | | | Rhode Island State, Commerce Corp., Airports Revenue, Revenue Bonds, Series D,
5.000% due 7/1/28 | | | 446,848 | |
| | 635,000 | | | Rhode Island State, Housing and Mortgage Finance Corp., Revenue Bonds, Series 69-B, (GNMA/FNMA/FHLMC Insured),
4.000% due 10/1/48 | | | 662,438 | |
| | 4,000,000 | | | Tobacco Settlement Financing Corp., RI, Revenue Bonds, Series A,
0.000% due 6/1/521 | | | 446,080 | |
| | | | | | | | |
| | | | | | | 3,263,505 | |
| | | | | | | | |
| |
| | | | South Carolina — 1.7% | |
| | 1,786,324 | | | Connector 2000 Association, Inc., Revenue Bonds, Series A-1,
0.000% due 1/1/421 | | | 339,366 | |
| | 500,000 | | | Connector 2000 Association, Inc., SC, Toll Road Revenue, Series A-1,
0.000% due 1/1/321 | | | 202,125 | |
| | 460,000 | | | South Carolina State, Housing Finance & Development Authority, Revenue Bonds, (GNMA / FNMA / FHLMC / FHA Insured),
4.000% due 7/1/36 | | | 474,738 | |
| | | | South Carolina State, Jobs-Economic Development Authority, Health Facilities Revenue, Revenue Bonds, Refunding: | | | | |
| | 410,000 | | | 5.000% due 10/1/362 | | | 413,182 | |
| | 1,090,000 | | | 5.000% due 10/1/412 | | | 1,092,779 | |
| | 800,000 | | | South Carolina State, Jobs-Economic Development Authority, Residential Facilities Revenue, Revenue Bonds, Refunding,
5.000% due 4/1/47 | | | 808,728 | |
| | | | | | | | |
| | | | | | | 3,330,918 | |
| | | | | | | | |
| |
| | | | Texas — 6.1% | |
| | 645,000 | | | Arlington, TX, Higher Education Finance Corp., Revenue Bonds, Refunding, Series A,
5.000% due 12/1/51 | | | 671,058 | |
| | 480,000 | | | Arlington, TX, Higher Education Finance Corp., Revenue Bonds, Refunding, Uplift Education, Series A,
2.750% due 12/1/26 | | | 458,107 | |
See Notes to Financial Statements.
THE GLENMEDE FUND, INC.
High Yield Municipal Portfolio
SCHEDULE OF PORTFOLIO INVESTMENTS — (Continued)
October 31, 2018
| | | | | | | | |
Face
Amount | | | | | Value | |
| |
| MUNICIPAL BONDS* — (Continued) | | | |
| | | | Texas — (Continued) | | | |
| $ | 250,000 | | | Brazoria County, TX, Health Facilities Development Corp., Revenue Bonds, Prerefunded 7/1/20 @ 100,
5.250% due 7/1/32 | | $ | 274,102 | |
| | 360,000 | | | Fort Bend County, TX, Industrial Development Corp., NRG Energy, Inc., Revenue Bonds, Series A,
4.750% due 5/1/38 | | | 365,890 | |
| | 250,000 | | | Gregg County, TX, Health Facilities Development Corp., Revenue Bonds, Series C, Prerefunded 7/1/22 @ 100,
5.000% due 7/1/32 | | | 272,385 | |
| | 1,510,000 | | | Harris County, TX, Cultural Education Facilities Finance Corp., Brazos Presbyterian Homes Project, Revenue Bonds, Refunding,
5.000% due 1/1/48 | | | 1,552,703 | |
| | 150,000 | | | Harris County, TX, Cultural Education Facilities Finance Corp., Revenue Bonds, Series A,
5.000% due 1/1/43 | | | 152,924 | |
| | 505,000 | | | Harrison County, TX, Health Facilities Development Corp., Good Shepard Health System, Revenue Bonds, Prerefunded 7/1/20 @ 100,
5.250% due 7/1/28 | | | 528,912 | |
| | 250,000 | | | New Hope Cultural Education Facilities Corp., TX, Housing Revenue, Tarleton State University Project, Revenue Bonds, Series A,
5.000% due 4/1/47 | | | 257,870 | |
| | | | New Hope Cultural Education Facilities Corp., TX, Revenue Bonds, Series A: | | | | |
| | 500,000 | | | 5.000% due 4/1/29 | | | 528,095 | |
| | 600,000 | | | 5.000% due 4/1/30 | | | 636,066 | |
| | 1,200,000 | | | New Hope Cultural Education Facilities Finance Corp., TX, Education Revenue, Revenue Bonds, Refunding, Series A,
5.000% due 8/15/362 | | | 1,184,604 | |
| | 950,000 | | | New Hope Cultural Education Facilities Finance Corp., TX, Retirement Facilities Revenue, Revenue Bonds, Refunding,
5.000% due 11/15/36 | | | 983,658 | |
| | 200,000 | | | New Hope Cultural Education Facilities Finance Corp., TX, Retirement Facilities Revenue, Revenue Bonds, Series A,
5.500% due 11/15/46 | | | 196,904 | |
| | | | New Hope Cultural Education Facilities Finance Corp., TX, Student Housing Revenue Bonds, Series A: | | | | |
| | 280,000 | | | 5.000% due 4/1/42 | | | 287,140 | |
| | 500,000 | | | 5.000% due 4/1/48 | | | 490,165 | |
| | | | Newark Higher Education Finance Corp., TX, Education Revenue, Revenue Bonds: | | | | |
| | 150,000 | | | 5.000% due 6/15/33 | | | 151,275 | |
| | 500,000 | | | 5.000% due 6/15/38 | | | 501,450 | |
| | 230,000 | | | Newark Higher Education Finance Corp., TX, Education Revenue, Revenue Bonds, Series A,
5.000% due 6/15/37 | | | 221,619 | |
| | | | Tarrant County, TX, Cultural Education Facilities Finance Corp., Retirement Facilities, Revenue Bonds, Refunding: | | | | |
| | 150,000 | | | 5.000% due 11/15/35 | | | 153,297 | |
| | 750,000 | | | 5.000% due 5/15/45 | | | 758,430 | |
| | 500,000 | | | 5.250% due 11/15/47 | | | 518,075 | |
| | 200,000 | | | Texas State, Department of Housing and Community Affairs, Revenue Bonds, Series A, (GNMA Insured),
4.750% due 3/1/49 | | | 215,298 | |
| | 350,000 | | | Wood County, TX, Central Hospital District, East Texas Medical Center, Revenue Bonds, Prerefunded 11/1/21 @ 100,
6.000% due 11/1/41 | | | 384,310 | |
| | | | | | | | |
| | | | | | | 11,744,337 | |
| | | | | | | | |
| |
| | | | Utah — 0.3% | |
| | 500,000 | | | Hideout Local District No. 1, UT, Special Assessment,
6.750% due 8/1/372 | | | 484,235 | |
| | | | | | | | |
| |
| | | | Virginia — 1.5% | |
| | 500,000 | | | Hanover County, VA, Economic Development Authority, Care Facilities Revenue, Refunding, Covenant Woods, Revenue Bonds,
5.000% due 7/1/38 | | | 512,330 | |
See Notes to Financial Statements.
THE GLENMEDE FUND, INC.
High Yield Municipal Portfolio
SCHEDULE OF PORTFOLIO INVESTMENTS — (Continued)
October 31, 2018
| | | | | | | | |
Face
Amount | | | | | Value | |
| |
| MUNICIPAL BONDS* — (Continued) | | | |
| | | | Virginia — (Continued) | | | |
| $ | 295,000 | | | Henrico County, VA, Economic Development Authority Health Care Facilities Revenue, Revenue Bonds, Refunding, Series C,
5.000% due 12/1/37 | | $ | 305,219 | |
| | 500,000 | | | Newport News, VA, Industrial Development Authority, Health System Revenue, Revenue Bonds, Series A,
5.000% due 7/1/462 | | | 505,575 | |
| | 1,000,000 | | | Newport News, VA, Industrial Development Authority, System Revenue, Revenue Bonds,
5.330% due 7/1/452 | | | 1,027,560 | |
| | 500,000 | | | Virginia State, Small Business Financing Authority, Residential Care Facility Revenue, Revenue Bonds, Refunding, Series C,
5.000% due 6/1/42 | | | 513,625 | |
| | | | | | | | |
| | | | | | | 2,864,309 | |
| | | | | | | | |
| | |
| | | | Washington — 1.4% | | | |
| | 200,000 | | | Kalispel Tribe of Indians Priority District, WA, Revenue Bonds, Series B,
5.250% due 1/1/382 | | | 206,896 | |
| | 100,000 | | | Skagit County, WA, Public Hospital District No. 1, Refunding, Series A,
5.000% due 12/1/19 | | | 102,485 | |
| | 1,000,000 | | | Washington State, Health Care Facilities Authority, Revenue Bonds,
5.000% due 12/1/36 | | | 1,050,810 | |
| | 235,000 | | | Washington State, Housing Finance Commission, Refunding, Hearthstone Project, Revenue Bonds, Series B,
3.125% due 7/1/232 | | | 232,528 | |
| | 325,000 | | | Washington State, Housing Finance Commission, Refunding, Judson Park Project, Revenue Bonds,
5.000% due 7/1/382 | | | 331,620 | |
| | 650,000 | | | Washington State, Housing Finance Commission, Revenue Bonds, Series A,
7.000% due 7/1/452 | | | 690,326 | |
| | | | | | | | |
| | | | | | | 2,614,665 | |
| | | | | | | | |
| | |
| | | | West Virginia — 0.1% | | | |
| | 250,000 | | | West Virginia State, Hospital Finance Authority, Revenue Bonds, Refunding, Series A,
5.000% due 1/1/43 | | | 266,180 | |
| | | | | | | | |
| | |
| | | | Wisconsin — 3.6% | | | |
| | 500,000 | | | Public Finance Authority, WI, Charter School Revenue, Revenue Bonds, Series A,
5.375% due 7/15/472 | | | 501,165 | |
| | 1,000,000 | | | Public Finance Authority, WI, Revenue Bonds,
5.750% due 4/1/42 | | | 1,049,480 | |
| | 260,000 | | | Public Finance Authority, WI, Revenue Bonds, Refunding,
5.875% due 4/1/45 | | | 273,504 | |
| | 350,000 | | | Public Finance Authority, WI, Senior Living Revenue, Mary’s Woods at Marylhurst Project, Revenue Bonds, Refunding, Series A,
5.250% due 5/15/372 | | | 364,399 | |
| | 90,000 | | | Public Finance Authority, WI, Senior Living Revenue, Rose Village Project, Revenue Bonds, Series A,
5.000% due 11/15/242 | | | 95,080 | |
| | 1,060,000 | | | Public Finance Authority, WI, Student Housing, Revenue Bonds, Series A,
5.000% due 7/1/25 | | | 1,150,047 | |
| | 2,350,000 | | | Public Finance Authority, WI, Tax Allocation, Increment Finance Grant Revenue,
0.000% due 9/1/281 | | | 1,406,546 | |
| | 955,000 | | | Wisconsin State, Health & Educational Facilities Authority Revenue, Revenue Bonds, Refunding,
5.000% due 6/1/41 | | | 967,300 | |
See Notes to Financial Statements.
THE GLENMEDE FUND, INC.
High Yield Municipal Portfolio
SCHEDULE OF PORTFOLIO INVESTMENTS — (Continued)
October 31, 2018
| | | | | | | | |
Face
Amount | | | | | Value | |
|
| MUNICIPAL BONDS* — (Continued) | |
| | | | Wisconsin — (Continued) | |
| $ | 1,000,000 | | | Wisconsin State, Housing and Economic Development Authority, Home Ownership Revenue, Revenue Bonds, Series D,
4.000% due 3/1/47 | | $ | 1,043,070 | |
| | | | | | | | |
| | | | | | | 6,850,591 | |
| | | | | | | | |
| | |
| | | | TOTAL MUNICIPAL BONDS
(Cost $191,637,946) | | | 189,981,293 | |
| | | | | | | | |
| | | | | | | | |
| | |
TOTAL INVESTMENTS
(Cost $191,637,946) | | | 98.8 | % | | $ | 189,981,293 | |
| | |
OTHER ASSETS IN EXCESS OF LIABILITIES | | | 1.2 | | | | 2,337,835 | |
| | | | | | | | |
| | |
NET ASSETS | | | 100.0 | % | | $ | 192,319,128 | |
| | | | | | | | |
| * | Percentages indicated are based on net assets. |
| 2 | Security exempt from registration under Rule 144A of the Securities Act of 1933, as amended. This security may be resold in transactions exempt from registration, normally to qualified buyers. At October 31, 2018, these securities, which are not illiquid, amounted to $25,126,892 or 13.5% of net assets for the Fund. |
| 3 | Floating Rate Bond. Rate shown is as of October 31, 2018. |
| 4 | Variable/Floating interest rate security. Certain variable/floating interest rate securities are not based on a published reference rate and spread but are determined by the issuer or agent and are based on current market conditions. These securities do not indicate a reference rate and spread in their description above. Rate presented is as of October 31, 2018. |
| 5 | Variable Rate is Fixed to Float: Rate remains fixed until designated future date. |
| 6 | Variable Rate Demand Note (VRDN) with a daily rate-reset. Shall be the rate of interest which, if borne by the bonds, would, in the judgment of the Remarketing Agent, having due regard for the prevailing financial market conditions for revenue bonds or other securities the interest on which is excluded from gross income for federal income tax purposes and of the same general nature as the bonds or securities the interest on which is excluded from gross income for federal income tax purposes and which are equivalent as to credit and maturity (or period for tender) to the credit and maturity (or period for tender) of the bonds, be the lowest interest rate which would enable the Remarketing Agent to remarket the bonds at a price of par (plus accrued interest, if any). |
| 8 | This security is in default. See Note 1. |
Abbreviations:
AGMC — Assured Guaranty Municipal Corporation
AMBAC — American Municipal Bond Assurance Corporation
BAM — Build America Mutual
FHA — Federal Housing Administration
FHLMC — Federal Home Loan Mortgage Corporation
FNMA — Federal National Mortgage Association
GNMA — Government National Mortgage Association
MBIA — Municipal Bond Investors Assurance
NPFG — National Public Finance Guarantee Corporation
SIFMA — Securities Industry and Financial Markets Association
SPA — Stand-By Purchase Agreement
See Notes to Financial Statements.
THE GLENMEDE FUND, INC.
High Yield Municipal Portfolio
SCHEDULE OF PORTFOLIO INVESTMENTS — (Concluded)
October 31, 2018
STATE DIVERSIFICATION
On October 31, 2018, State Diversification of the Portfolio was as follows:
| | | | | | | | |
| | | % of
Net Assets | | | Value | |
| STATE: | | | | | | |
Illinois | | | 15.2 | % | | $ | 29,202,348 | |
Colorado | | | 9.7 | | | | 18,595,367 | |
New Jersey | | | 8.2 | | | | 15,824,570 | |
Texas | | | 6.1 | | | | 11,744,337 | |
Ohio | | | 5.2 | | | | 9,986,846 | |
Florida | | | 5.0 | | | | 9,681,425 | |
Puerto Rico | | | 4.8 | | | | 9,203,250 | |
Pennsylvania | | | 4.6 | | | | 8,828,884 | |
Wisconsin | | | 3.6 | | | | 6,850,591 | |
California | | | 3.0 | | | | 5,809,747 | |
New York | | | 2.6 | | | | 5,046,006 | |
Arizona | | | 2.6 | | | | 4,924,386 | |
Michigan | | | 2.4 | | | | 4,628,372 | |
Mississippi | | | 2.3 | | | | 4,449,568 | |
Indiana | | | 2.1 | | | | 3,931,413 | |
Maryland | | | 1.9 | | | | 3,676,703 | |
South Carolina | | | 1.7 | | | | 3,330,918 | |
Rhode Island | | | 1.7 | | | | 3,263,505 | |
Iowa | | | 1.6 | | | | 3,151,788 | |
Virginia | | | 1.5 | | | | 2,864,309 | |
Washington | | | 1.4 | | | | 2,614,665 | |
District of Columbia | | | 1.2 | | | | 2,341,872 | |
Alabama | | | 1.2 | | | | 2,314,774 | |
Connecticut | | | 1.2 | | | | 2,298,694 | |
Missouri | | | 1.1 | | | | 2,069,950 | |
Louisiana | | | 1.0 | | | | 1,924,210 | |
Massachusetts | | | 0.8 | | | | 1,542,586 | |
Alaska | | | 0.7 | | | | 1,418,235 | |
Nevada | | | 0.7 | | | | 1,304,997 | |
Idaho | | | 0.6 | | | | 1,139,452 | |
North Carolina | | | 0.5 | | | | 1,030,590 | |
Kentucky | | | 0.5 | | | | 1,012,362 | |
Georgia | | | 0.5 | | | | 875,835 | |
Delaware | | | 0.4 | | | | 811,771 | |
Utah | | | 0.3 | | | | 484,235 | |
Maine | | | 0.2 | | | | 451,928 | |
Kansas | | | 0.2 | | | | 409,561 | |
Nebraska | | | 0.2 | | | | 312,837 | |
West Virginia | | | 0.1 | | | | 266,180 | |
Minnesota | | | 0.1 | | | | 242,616 | |
Oklahoma | | | 0.1 | | | | 119,610 | |
| | | | | | | | |
TOTAL MUNICIPAL BONDS | | | 98.8 | % | | $ | 189,981,293 | |
| | | | | | | | |
TOTAL INVESTMENTS | | | 98.8 | % | | $ | 189,981,293 | |
| | | | | | | | |
See Notes to Financial Statements.
THE GLENMEDE FUND, INC.
Notes to Financial Statements
| 1. | | Organization and Significant Accounting Policies |
As of October 31, 2018, The Glenmede Fund, Inc. (the “Fund”) consists of nineteen portfolios: the Quantitative U.S. Large Cap Core Equity Portfolio (formerly known as the Large Cap Core Portfolio), the Quantitative U.S. Large Cap Growth Equity Portfolio (formerly known as the Large Cap Growth Portfolio), the Quantitative U.S. Large Cap Value Equity Portfolio, the Quantitative U.S. Small Cap Equity Portfolio, the Quantitative International Equity Portfolio (formerly known as the International Portfolio), the Responsible ESG U.S. Equity Portfolio, the Women in Leadership U.S. Equity Portfolio, the Quantitative U.S. Long/Short Equity Portfolio (formerly known as the Long/Short Portfolio), the Quantitative U.S. Total Market Equity Portfolio (formerly known as the Total Market Portfolio), the Strategic Equity Portfolio, the Small Cap Equity Portfolio, the Mid Cap Equity Portfolio, the Large Cap Value Portfolio, the Equity Income Portfolio, the Secured Options Portfolio, the Global Secured Options Portfolio, the Core Fixed Income Portfolio, the Short Term Tax Aware Fixed Income Portfolio and the High Yield Municipal Portfolio (each, a “Portfolio” and collectively, the “Portfolios”). The Fund was incorporated in the State of Maryland on June 30, 1988, and is registered with the Securities and Exchange Commission (the “SEC”) under the Investment Company Act of 1940, as amended (the “1940 Act”), as an open-end management investment company. Since January 2, 1998, the Small Cap Equity Portfolio has consisted of two classes of shares: the Advisor Class and the Institutional Class. The Mid Cap Equity Portfolio commenced operations on September 30, 2014. The Mid Cap Equity Portfolio consists of two classes of shares: the Advisor Class and the Institutional Class. As of October 31, 2018, Institutional Class shares of the Mid Cap Equity Portfolio have not been issued. Since June 30, 2015, the Quantitative U.S. Large Cap Core Equity Portfolio and the Quantitative U.S. Large Cap Growth Equity Portfolio have offered two classes of shares: the Advisor Class and the Institutional Class. The Institutional Classes commenced operations on December 30, 2015 and November 5, 2015, respectively. Since July 14, 2016, the Secured Options Portfolio has offered two classes of shares: the Advisor Class and the Institutional Class. The Institutional Class shares of the Secured Options Portfolio commenced operations on November 9, 2016.
The High Yield Municipal Portfolio, the Responsible ESG U.S. Equity Portfolio and the Women in Leadership U.S. Equity Portfolio commenced operations on December 22, 2015.
The Short Term Tax Aware Fixed Income Portfolio commenced operations on June 29, 2016.
The Equity Income Portfolio commenced operations on December 21, 2016.
The Quantitative U.S. Large Cap Value Equity Portfolio and Quantitative U.S. Small Cap Equity Portfolio commenced operations on November 13, 2017.
The Fund is an investment company and follows accounting and reporting guidance in Financial Accounting Standards Board (“FASB”) Accounting Standards Codification (“ASC”) Topic 946 (“ASC 946”). The preparation of financial statements in conformity with accounting principles generally accepted in the United States of America (“U.S.”), including but not limited to ASC 946, requires management to make estimates and assumptions that affect the reported amounts of assets and liabilities and disclosures of contingent assets and liabilities at the date of the financial statements and the reported amounts of revenues and expenses during the reporting period. Actual results could differ from those estimates, and the differences could be material. The following is a summary of significant accounting policies consistently followed by the Portfolios in the preparation of their financial statements.
Valuation of Securities: Equity securities and options listed on a U.S. securities exchange, including exchange-traded funds (“ETFs”), for which market quotations are readily available are valued at the last quoted sale price as of the close of the exchange’s regular trading hours on the day the valuation is made. These securities are typically categorized as Level 1 in the fair value hierarchy. Price information on listed securities is taken from the exchange where the securities are primarily traded. Securities traded on the NASDAQ System are valued at the NASDAQ Official Closing Price (“NOCP”) and are typically categorized as Level 1 in the fair value hierarchy. Unlisted equity securities and listed securities not traded on the valuation date for which market quotations are readily available are valued at an amount that does not exceed the asked price and is not less than the bid price and are typically categorized as Level 2. If no sales are reported, exchange traded options are valued at the mean of the bid and ask price and are typically categorized as Level 2. Options traded over-the-counter are valued using prices supplied by dealers and are typically categorized as Level 2. Securities and options listed on a foreign exchange and unlisted foreign securities that are traded on the valuation date are valued at the last quoted sales price available before the time when assets are valued and are typically categorized as Level 1. Investments in open-end registered investment companies are valued at their respective net asset values as reported by such companies, and are typically categorized as Level 1.
Bonds and other fixed-income securities are valued at the most recent quoted bid price or, when exchange valuations are used, at the latest quoted sale price on the day of valuation. Such securities are typically categorized as Level 2 in the fair value hierarchy. In addition, bond and other fixed-income securities may be valued on the basis of prices provided by a pricing service or by using a matrix or formula. In such instances, when the Portfolio’s investment advisor believes such prices reflect the fair market value of such securities and are based on observable inputs, these securities are typically categorized as Level 2. Debt securities purchased with maturities of 60 days or less at the time of purchase are valued at amortized cost and are typically categorized as Level 2. Amortized cost valuation involves valuing an instrument at its cost initially and thereafter assuming a constant amortization to maturity of any discount or premium, regardless of the effect of fluctuating interest rates on the market value of the instrument.
When market quotations are not readily available or events occur that make established valuation methods unreliable, securities and other assets are valued in a manner that is intended to reflect their fair value as determined in
THE GLENMEDE FUND, INC.
Notes to Financial Statements — (Continued)
accordance with procedures approved by the Board of Directors of the Fund (the “Board”) and are typically categorized as Level 3 in the fair value hierarchy. The fair value of securities is generally determined as the amount that a Portfolio could reasonably expect to realize from an orderly disposition of such securities over a reasonable period of time. By its nature, a fair value price is a good faith estimate of the value of a security at a given point in time and does not reflect an actual market price, which may be different by a material amount.
FASB ASC Topic 820 (“ASC 820”) “Fair Value Measurements” defines fair value, establishes a three-level hierarchy for measuring fair value and expands disclosure about fair value measurements. The valuation hierarchy is based upon the transparency of inputs to the valuation of each Portfolio’s investments. Inputs refer broadly to the assumptions that market participants would use in pricing a security. Observable inputs are inputs that reflect the assumptions market participants would use in pricing the asset or liability based on market data obtained from sources independent of the reporting entity. Unobservable inputs are inputs that reflect the reporting entity’s own assumptions about the assumptions market participants would use in pricing the asset or liability based on the best information available in the circumstances. These inputs are summarized in the three levels listed below:
Level 1 — quoted prices in active markets for identical investments;
Level 2 — other significant observable inputs (including quoted prices for similar investments, interest rates, prepayment speeds, credit risk, adjusted quoted prices on foreign equity securities and others) or valuations based on quoted prices in markets that are not active; and
Level 3 — significant unobservable inputs (including the Fund’s own assumptions in determining the fair value of investments).
The inputs or methodology used for valuing securities are not necessarily an indication of the risks associated with investing in those securities.
Changes in valuation techniques may result in changing an investment’s assigned level within the hierarchy.
The Quantitative U.S. Large Cap Core Equity Portfolio, Quantitative U.S. Large Cap Growth Equity Portfolio, Quantitative U.S. Large Cap Value Equity Portfolio, Quantitative U.S. Small Cap Equity Portfolio, Quantitative International Equity Portfolio, Responsible ESG U.S. Equity Portfolio, Women in Leadership U.S. Equity Portfolio, Quantitative U.S. Long/Short Equity Portfolio, Quantitative U.S. Total Market Equity Portfolio, Strategic Equity Portfolio, Small Cap Equity Portfolio, Mid Cap Equity Portfolio, Large Cap Value Portfolio and Equity Income Portfolio had all investments with corresponding industries at Level 1 except repurchase agreements which were at Level 2, at October 31, 2018. The High Yield Municipal Portfolio had all investments with corresponding states at Level 2 at October 31, 2018.
The Portfolios did not recognize any level transfers as of the fiscal year ended October 31, 2018. Transfers into and out of a level are typically recognized at the end of the reporting period.
The following is a summary of the inputs used as of October 31, 2018 in valuing the assets and liabilities of the Secured Options Portfolio, Global Secured Options Portfolio, Core Fixed Income Portfolio and Short Term Tax Aware Fixed Income Portfolio:
Secured Options Portfolio
ASSETS VALUATION INPUT
| | | | | | | | | | | | | | | | |
Description | | Quoted
Prices in
Active
Markets for
Identical
Assets
(Level 1) | | | Significant
Other
Observable
Inputs
(Level 2) | | | Significant
Unobservable
Inputs
(Level 3) | | | Total | |
Exchange-Traded Funds | | $ | 13,444,623 | | | $ | — | | | $ | — | | | $ | 13,444,623 | |
U.S. Treasury Bill | | | — | | | | 190,672,892 | | | | — | | | | 190,672,892 | |
Repurchase Agreement | | | — | | | | 1,171,219 | | | | — | | | | 1,171,219 | |
Purchased Options | | | | | | | | | | | | | | | | |
Calls | | | 1,156,201,200 | | | | — | | | | — | | | | 1,156,201,200 | |
Puts | | | 1,561,700 | | | | — | | | | — | | | | 1,561,700 | |
| | | | | | | | | | | | | | | | |
Total Purchased Options | | | 1,157,762,900 | | | | — | | | | — | | | | 1,157,762,900 | |
| | | | | | | | | | | | | | | | |
Total Investments | | | 1,171,207,523 | | | | 191,844,111 | | | | — | | | | 1,363,051,634 | |
| | | | | | | | | | | | | | | | |
Total | | $ | 1,171,207,523 | | | $ | 191,844,111 | | | $ | — | | | $ | 1,363,051,634 | |
| | | | | | | | | | | | | | | | |
THE GLENMEDE FUND, INC.
Notes to Financial Statements — (Continued)
LIABILITIES VALUATION INPUT
| | | | | | | | | | | | | | | | |
Description | | Quoted
Prices in
Active
Markets for
Identical
Assets
(Level 1) | | | Significant
Other
Observable
Inputs
(Level 2) | | | Significant
Unobservable
Inputs
(Level 3) | | | Total | |
Written Options | | | | | | | | | | | | | | | | |
Call | | $ | (480,765,949 | ) | | $ | — | | | $ | — | | | $ | (480,765,949 | ) |
Puts | | | (40,436,726 | ) | | | — | | | | — | | | | (40,436,726 | ) |
| | | | | | | | | | | | | | | | |
Total Written Options | | | (521,202,675 | ) | | | — | | | | — | | | | (521,202,675 | ) |
| | | | | | | | | | | | | | | | |
Total | | $ | (521,202,675 | ) | | $ | — | | | $ | — | | | $ | (521,202,675 | ) |
| | | | | | | | | | | | | | | | |
Global Secured Options Portfolio
ASSETS VALUATION INPUT
| | | | | | | | | | | | | | | | |
Description | | Quoted
Prices in
Active
Markets for
Identical
Assets
(Level 1) | | | Significant
Other
Observable
Inputs
(Level 2) | | | Significant
Unobservable
Inputs
(Level 3) | | | Total | |
Exchange-Traded Fund | | $ | 949,392 | | | $ | — | | | $ | — | | | $ | 949,392 | |
U.S. Treasury Bill | | | — | | | | 647,193 | | | | — | | | | 647,193 | |
Purchased Options | | | | | | | | | | | | | | | | |
Calls | | | 1,702,800 | | | | — | | | | — | | | | 1,702,800 | |
Puts | | | 2,300 | | | | — | | | | — | | | | 2,300 | |
| | | | | | | | | | | | | | | | |
Total Purchased Options | | | 1,705,100 | | | | — | | | | — | | | | 1,705,100 | |
| | | | | | | | | | | | | | | | |
Total Investments | | | 2,654,492 | | | | 647,193 | | | | — | | | | 3,301,685 | |
| | | | | | | | | | | | | | | | |
Total | | $ | 2,654,492 | | | $ | 647,193 | | | $ | — | | | $ | 3,301,685 | |
| | | | | | | | | | | | | | | | |
LIABILITIES VALUATION INPUT
| | | | | | | | | | | | | | | | |
Description | | Quoted
Prices in
Active
Markets for
Identical
Assets
(Level 1) | | | Significant
Other
Observable
Inputs
(Level 2) | | | Significant
Unobservable
Inputs
(Level 3) | | | Total | |
Written Options | | | | | | | | | | | | | | | | |
Call | | $ | (708,050 | ) | | $ | — | | | $ | — | | | $ | (708,050 | ) |
Puts | | | (155,530 | ) | | | — | | | | — | | | | (155,530 | ) |
| | | | | | | | | | | | | | | | |
Total Written Options | | | (863,580 | ) | | | — | | | | — | | | | (863,580 | ) |
| | | | | | | | | | | | | | | | |
Total | | $ | (863,580 | ) | | $ | — | | | $ | — | | | $ | (863,580 | ) |
| | | | | | | | | | | | | | | | |
THE GLENMEDE FUND, INC.
Notes to Financial Statements — (Continued)
Core Fixed Income Portfolio
ASSETS VALUATION INPUT
| | | | | | | | | | | | | | | | |
Description | | Quoted
Prices in
Active
Markets for
Identical
Assets
(Level 1) | | | Significant
Other
Observable
Inputs
(Level 2) | | | Significant
Unobservable
Inputs
(Level 3) | | | Total | |
Agency Notes | | | | | | | | | | | | | | | | |
Federal Home Loan Bank | | $ | — | | | $ | 24,591,745 | | | $ | — | | | $ | 24,591,745 | |
Federal Home Loan Mortgage Corporation | | | — | | | | 9,811,680 | | | | — | | | | 9,811,680 | |
Federal National Mortgage Association | | | — | | | | 48,980,326 | | | | — | | | | 48,980,326 | |
| | | | | | | | | | | | | | | | |
Total Agency Notes | | | — | | | | 83,383,751 | | | | — | | | | 83,383,751 | |
| | | | | | | | | | | | | | | | |
Mortgage-Backed Securities | | | | | | | | | | | | | | | | |
Federal Home Loan Mortgage Corporation | | | — | | | | 41,590,785 | | | | — | | | | 41,590,785 | |
Federal National Mortgage Association | | | — | | | | 84,282,404 | | | | — | | | | 84,282,404 | |
Government National Mortgage Association | | | — | | | | 1,428,454 | | | | — | | | | 1,428,454 | |
| | | | | | | | | | | | | | | | |
Total Mortgage-Backed Securities | | | — | | | | 127,301,643 | | | | — | | | | 127,301,643 | |
| | | | | | | | | | | | | | | | |
Corporate Notes | | | | | | | | | | | | | | | | |
Automotive | | | — | | | | 3,958,591 | | | | — | | | | 3,958,591 | |
Banking | | | — | | | | 43,760,046 | | | | — | | | | 43,760,046 | |
Beverages, Food & Tobacco | | | — | | | | 19,092,290 | | | | — | | | | 19,092,290 | |
Communications | | | — | | | | 25,202,984 | | | | — | | | | 25,202,984 | |
Computer Software & Processing | | | — | | | | 38,540,764 | | | | — | | | | 38,540,764 | |
Electronics | | | — | | | | 12,962,283 | | | | — | | | | 12,962,283 | |
Financial | | | — | | | | 16,788,427 | | | | — | | | | 16,788,427 | |
Heavy Machinery | | | — | | | | 5,639,002 | | | | — | | | | 5,639,002 | |
Insurance | | | — | | | | 16,685,971 | | | | — | | | | 16,685,971 | |
Pharmaceuticals | | | — | | | | 12,236,374 | | | | — | | | | 12,236,374 | |
Retailers | | | — | | | | 12,979,504 | | | | — | | | | 12,979,504 | |
| | | | | | | | | | | | | | | | |
Total Corporate Notes | | | — | | | | 207,846,236 | | | | — | | | | 207,846,236 | |
| | | | | | | | | | | | | | | | |
U.S. Treasury Notes/Bonds | | | — | | | | 50,248,007 | | | | — | | | | 50,248,007 | |
Repurchase Agreement | | | — | | | | 12,939,399 | | | | — | | | | 12,939,399 | |
Investment of Security Lending Collateral | | | 19,105,863 | | | | — | | | | — | | | | 19,105,863 | |
| | | | | | | | | | | | | | | | |
Total Investments | | | 19,105,863 | | | | 481,719,036 | | | | — | | | | 500,824,899 | |
| | | | | | | | | | | | | | | | |
Total | | $ | 19,105,863 | | | $ | 481,719,036 | | | $ | — | | | $ | 500,824,899 | |
| | | | | | | | | | | | | | | | |
Short Term Tax Aware Fixed Income Portfolio
ASSETS VALUATION INPUT
| | | | | | | | | | | | | | | | |
Description | | Quoted
Prices in
Active
Markets for
Identical
Assets
(Level 1) | | | Significant
Other
Observable
Inputs
(Level 2) | | | Significant
Unobservable
Inputs
(Level 3) | | | Total | |
Corporate Notes | | | | | | | | | | | | | | | | |
Automotive | | $ | — | | | $ | 293,015 | | | $ | — | | | $ | 293,015 | |
Financial | | | — | | | | 360,925 | | | | — | | | | 360,925 | |
| | | | | | | | | | | | | | | | |
Total Corporate Notes | | | — | | | | 653,940 | | | | — | | | | 653,940 | |
| | | | | | | | | | | | | | | | |
Municipal Bonds | | | | | | | | | | | | | | | | |
Alabama | | | — | | | | 520,408 | | | | — | | | | 520,408 | |
Alaska | | | — | | | | 943,472 | | | | — | | | | 943,472 | |
Arizona | | | — | | | | 436,552 | | | | — | | | | 436,552 | |
California | | | — | | | | 498,845 | | | | — | | | | 498,845 | |
THE GLENMEDE FUND, INC.
Notes to Financial Statements — (Continued)
| | | | | | | | | | | | | | | | |
Description | | Quoted
Prices in
Active
Markets for
Identical
Assets
(Level 1) | | | Significant
Other
Observable
Inputs
(Level 2) | | | Significant
Unobservable
Inputs
(Level 3) | | | Total | |
Colorado | | $ | — | | | $ | 406,018 | | | $ | — | | | $ | 406,018 | |
Delaware | | | — | | | | 206,968 | | | | — | | | | 206,968 | |
Florida | | | — | | | | 591,710 | | | | — | | | | 591,710 | |
Georgia | | | — | | | | 365,691 | | | | — | | | | 365,691 | |
Idaho | | | — | | | | 209,062 | | | | — | | | | 209,062 | |
Illinois | | | — | | | | 3,225,348 | | | | — | | | | 3,225,348 | |
Kentucky | | | — | | | | 569,513 | | | | — | | | | 569,513 | |
Louisiana | | | — | | | | 568,219 | | | | — | | | | 568,219 | |
Maryland | | | — | | | | 127,399 | | | | — | | | | 127,399 | |
Michigan | | | — | | | | 1,678,896 | | | | — | | | | 1,678,896 | |
Minnesota | | | — | | | | 1,270,295 | | | | — | | | | 1,270,295 | |
Mississippi | | | — | | | | 529,820 | | | | — | | | | 529,820 | |
New Jersey | | | — | | | | 1,043,078 | | | | — | | | | 1,043,078 | |
New York | | | — | | | | 206,740 | | | | — | | | | 206,740 | |
North Carolina | | | — | | | | 309,396 | | | | — | | | | 309,396 | |
Ohio | | | — | | | | 996,280 | | | | — | | | | 996,280 | |
Oklahoma | | | — | | | | 126,428 | | | | — | | | | 126,428 | |
Pennsylvania | | | — | | | | 3,794,888 | | | | — | | | | 3,794,888 | |
Texas | | | — | | | | 1,954,377 | | | | — | | | | 1,954,377 | |
Washington | | | — | | | | 297,333 | | | | — | | | | 297,333 | |
Wisconsin | | | — | | | | 750,332 | | | | — | | | | 750,332 | |
| | | | | | | | | | | | | | | | |
Total Municipal Bonds | | | — | | | | 21,627,068 | | | | — | | | | 21,627,068 | |
| | | | | | | | | | | | | | | | |
U.S. Treasury Notes/Bonds | | | — | | | | 2,568,463 | | | | — | | | | 2,568,463 | |
Investment of Security Lending Collateral | | | 191,425 | | | | — | | | | — | | | | 191,425 | |
Registered Investment Companies | | | 999,751 | | | | — | | | | 0 | * | | | 999,751 | |
| | | | | | | | | | | | | | | | |
Total Investments | | | 1,191,176 | | | | 24,849,471 | | | | 0 | | | | 26,040,647 | |
| | | | | | | | | | | | | | | | |
Total | | $ | 1,191,176 | | | $ | 24,849,471 | | | $ | 0 | | | $ | 26,040,647 | |
| | | | | | | | | | | | | | | | |
* Includes one security priced at $0.
Repurchase Agreements: Each Portfolio may engage in repurchase agreement transactions. Under the terms of a typical repurchase agreement, the applicable Portfolio takes possession of an underlying debt obligation subject to an obligation of the seller to repurchase, and the applicable Portfolio to resell the obligation at an agreed-upon price and time, thereby determining the yield during the Portfolio’s holding period. This arrangement results in a fixed rate of return that is not subject to market fluctuations during the Portfolio’s holding period. The seller’s obligation is secured by collateral (underlying securities) segregated on behalf of the Portfolio. The value of the collateral at the time of execution must be at least equal to 102% of the total amount of the repurchase obligations, including interest. In the event of counterparty default, the Portfolio has the right to sell the collateral to offset losses incurred. There is a potential for loss to a Portfolio in the event the Portfolio is delayed or prevented from exercising its rights to dispose of the collateral securities, including the risk of a possible decline in the value of the underlying securities during the period while the Portfolio seeks to assert its rights. Each Portfolio’s investment advisor, acting under the supervision of the Board, reviews the value of the collateral and the creditworthiness of those banks and dealers with which each Portfolio enters into repurchase agreements to evaluate potential risks.
Master Repurchase Agreements (“MRA”) permit a Portfolio, under certain circumstances, including an event of default (such as bankruptcy or insolvency), to offset payables and/or receivables under the MRA with collateral held and/or posted to the counterparty and create one single net payment due to or from the Portfolio. However, bankruptcy or insolvency laws of a particular jurisdiction may impose restrictions on or prohibitions against such a right of offset in the event of the MRA counterparty’s bankruptcy or insolvency. Pursuant to the terms of the MRA, the applicable Portfolio receives or posts securities as collateral with a market value in excess of the repurchase price to be paid or received by the Portfolio upon the maturity of the transaction. Upon a bankruptcy or insolvency of the MRA counterparty, the Portfolio would recognize a liability with respect to such excess collateral to reflect the Portfolio’s obligation under bankruptcy law to return the excess to the counterparty. The gross value and related collateral received for each Portfolio’s investments in repurchase agreements as of October 31, 2018 are presented in each Portfolio’s Schedule of Portfolio Investments and the value of these investments are also presented in the Statements of Assets and Liabilities.
THE GLENMEDE FUND, INC.
Notes to Financial Statements — (Continued)
Foreign Currency Translation: The books and records of each Portfolio are maintained in U.S. dollars. Foreign currencies, investments and other assets and liabilities are translated into U.S. dollars at the exchange rates prevailing at the end of the period, and purchases and sales of investment securities, income and expenses are translated at exchange rates prevailing on the dates of such transactions. Unrealized gains and losses that result from changes in foreign currency exchange rates have been included in the unrealized gains and losses on foreign currency translations. Net realized foreign currency gains and losses resulting from changes in exchange rates include foreign currency gains and losses between trade date and settlement date on investment securities transactions, foreign currency transactions and the difference between the amounts of interest and dividends recorded on the books of each Portfolio and the amount actually received. The portion of foreign currency gains and losses related to fluctuation in exchange rates between the purchase settlement date and subsequent sale trade date is included in realized gains and losses on investment transactions. The Portfolios do not isolate that portion of the results of operations resulting from changes in the foreign exchange rates on investments from the fluctuations in the market prices of securities held at the end of the period. Similarly, the Portfolios do not isolate the effect of changes in foreign exchange rates from the fluctuations in the market prices of portfolio securities sold during the period.
Foreign Securities: The Strategic Equity Portfolio, Small Cap Equity Portfolio, Mid Cap Equity Portfolio, Large Cap Value Portfolio, Equity Income Portfolio, Quantitative U.S. Large Cap Value Equity Portfolio, Quantitative U.S. Small Cap Equity Portfolio, Quantitative U.S. Large Cap Core Equity Portfolio, Quantitative U.S. Large Cap Growth Equity Portfolio, Quantitative U.S. Long/Short Equity Portfolio, Quantitative U.S. Total Market Equity Portfolio, Responsible ESG U.S. Equity Portfolio, Women in Leadership U.S. Equity Portfolio, Secured Options Portfolio, Global Secured Options Portfolio and Quantitative International Equity Portfolio may invest in foreign securities. Investing in securities of foreign companies and foreign governments involves special risks and considerations not typically associated with investing in securities of U.S. companies and the U.S. government. These risks include valuation of currencies and future adverse political and economic developments. Moreover, securities of some foreign companies and foreign governments and their markets may be less liquid and their prices more volatile than those of securities of comparable U.S. companies and the U.S. government. This is particularly true with respect to emerging markets in developing countries.
Options Transactions: The Strategic Equity Portfolio, Large Cap Value Portfolio, Quantitative U.S. Long/Short Equity Portfolio, Secured Options Portfolio and Global Secured Options Portfolio are subject to equity price risk and may purchase or write covered call options or secured put options to hedge against changes in the value of securities each Portfolio owns or expects to own. The Secured Options Portfolio and Global Secured Options Portfolio use option strategies also in an effort to earn options premiums and to provide more stable returns. These options may relate to particular securities or securities indices and may or may not be listed on a domestic securities exchange or issued by the Options Clearing Corporation. A call option gives the option holder the right to purchase the underlying security at a specified price until a specified date. A put option gives the option holder the right to sell the underlying security at a specified price until a specified date. The risk in writing a call option is that the Portfolio may forgo the opportunity of profit if the market price of the underlying security increases and the option is exercised. The risk in writing a put option is that the Portfolio may incur a loss if the market price of the underlying security decreases and the option is exercised. In addition, there is a risk the Portfolio may not be able to enter into a closing transaction because of an illiquid secondary market or, for over-the-counter options, because of the counterparty’s inability to perform. Portfolio assets covering written options cannot be sold while the option is outstanding, unless replaced by similar assets. A Portfolio also risks losing all or part of the cash paid for purchasing call and put options. The Portfolios may also write over-the-counter options where completing the obligation depends upon the credit standing of the other party. The Strategic Equity Portfolio, Large Cap Value Portfolio and Quantitative U.S. Long/Short Equity Portfolio did not enter into any options transactions during the fiscal year ended October 31, 2018. During the fiscal year ended October 31, 2018, the Secured Options Portfolio and the Global Secured Options Portfolio wrote put and call options and purchased put and call options in an attempt to achieve their respective investment objective and strategies.
Lending of Portfolio Securities: Each Portfolio, using State Street Bank and Trust Company (“State Street”) as its lending agent, may loan securities to qualified brokers and dealers in exchange for negotiated lenders’ fees. These fees are disclosed as “Income from security lending” in the Statements of Operations, net of expenses retained by State Street as compensation for its services as lending agent. Each applicable Portfolio receives cash collateral (which may be invested by the lending agent in short-term instruments) and/or non-cash collateral (which may include U.S. Treasuries and/or U.S. Government Agency securities), in an amount at least equal to 102% (for loans of U.S. securities) or 105% (for loans of non-U.S. securities) of the market value of the loaned securities at the inception of each loan. The market value of the loaned securities is determined at the close of business of the Fund and any additional required collateral is delivered to the applicable Portfolio on the next business day. On behalf of the Quantitative U.S. Long/Short Equity Portfolio and Quantitative U.S. Total Market Equity Portfolio, some or all of the cash collateral may be used to finance short sales. The cash collateral received for the Quantitative U.S. Long/Short Equity Portfolio was not used to finance short sales during the fiscal year ended October 31, 2018. During the fiscal year ended October 31, 2018, the cash collateral received by the Quantitative U.S. Large Cap Core Equity Portfolio, Quantitative U.S. Large Cap Growth Equity Portfolio, Quantitative U.S. Large Cap Value Equity Portfolio, Quantitative U.S. Small Cap Equity Portfolio, Quantitative International Equity Portfolio, Responsible ESG U.S. Equity Portfolio, Women in Leadership U.S. Equity Portfolio, Quantitative U.S. Long/Short Equity Portfolio, Strategic Equity Portfolio, Small Cap Equity Portfolio, Mid Cap Equity Portfolio, Large Cap Value Portfolio, Equity Income Portfolio, Short Term Tax Aware Fixed Income Portfolio and Core Fixed Income Portfolio was invested in the State Street Navigator Securities Lending Government Money Market Portfolio, which is a 1940 Act money market fund. To the extent that advisory or other fees paid by the State Street Navigator
THE GLENMEDE FUND, INC.
Notes to Financial Statements — (Continued)
Securities Lending Government Money Market Portfolio are for the same or similar services as fees paid by the applicable Portfolio, there will be a layering of fees, which would increase expenses and decrease returns. Information regarding the value of the securities loaned and the value of the cash collateral at period end is included at the end of each applicable Portfolio’s Statement of Assets and Liabilities, Schedule of Portfolio Investments and Note 7. Non-cash collateral is not disclosed as it is held by the lending agent on behalf of the Portfolio, and the Portfolio does not have the ability to re-hypothecate those securities. A Portfolio could experience a delay in recovering its securities and a possible loss of income or value if the borrower fails to return the securities when due. A Portfolio may also record realized gain or loss on securities deemed sold due to a borrower’s inability to return securities on loan. Such loans would involve risks of delay in receiving additional collateral in the event that the collateral decreased below the value of the securities loaned or risks of the loss of rights in the collateral should the borrower of the securities fail financially.
Real Estate Investment Trusts: The Portfolios may invest in real estate investment trusts (“REITs”), which pool investors’ funds for investment, primarily in income producing real estate or real estate-related loans or interests. A REIT is not taxed on income distributed to its shareholders or unitholders if it complies with regulatory requirements relating to its organization, ownership, assets and income, and with a regulatory requirement to distribute to its shareholders or unitholders at least 90% of its taxable income for each taxable year.
A shareholder in a Portfolio, by investing in REITs through the Portfolio, will bear not only the shareholder’s proportionate share of the expenses of the Portfolio, but also, indirectly, the management expenses of the underlying REITs. REITs depend generally on their ability to generate cash flow to make distributions to shareholders or unitholders, and may be subject to defaults by borrowers and to self-liquidations. In addition, the performance of a REIT may be affected by its failure to qualify for tax-free pass-through of income, or the REIT’s failure to maintain exemption from registration under the 1940 Act. Dividends representing a return of capital are reflected as a reduction of cost and/or as a realized gain when the amount of the return of capital is conclusively determined. See each Portfolio’s Schedule of Investments for REIT securities held as of October 31, 2018.
Securities Sold Short: The Quantitative U.S. Long/Short Equity Portfolio and Quantitative U.S. Total Market Equity Portfolio may engage in short sales, which are sales by the applicable Portfolio of securities which have been borrowed from a third party on the expectation that the market price will decline. If the price of the securities declines, the Portfolio will make a profit by purchasing the securities in the open market at a lower price than the one at which it sold the securities. If the price of the securities increases, the Portfolio may have to cover its short positions at a higher price than the short sale price, resulting in a loss. Gains are limited to the price at which the Portfolios sold the security short, while losses are potentially unlimited in size. Each Portfolio pledges securities and/or other assets, which may include cash collateral from securities lending activities, to the lender as collateral. Proceeds received from short sales may be maintained by the lender as collateral or may be released to the Portfolio and used to purchase additional securities or for any other purpose. Each Portfolio is required to segregate an amount of cash, cash equivalents or other appropriate liquid marketable securities with the custodian in an amount at least equal to the current market value of the securities sold short (less any additional collateral held by the lender) and the amount of any securities lending cash collateral used to finance short sales until the Portfolio replaces a borrowed security. Depending on arrangements made with the lender or custodian, the Portfolio may not receive any payments (including interest) on the deposits made with the lender or custodian. The Portfolio is liable to the buyer for any dividends payable on securities while those securities are in a short position. These dividends are recorded as an expense of the Portfolio. As of October 31, 2018, the Quantitative U.S. Long/Short Equity Portfolio pledged cash in the amount of $220,301,691 to State Street, as collateral for short sales. This amount is included in the “Cash collateral on deposit at broker” on the Statement of Assets and Liabilities. The Quantitative U.S. Long/Short Equity Portfolio and Quantitative U.S. Total Market Equity Portfolio also pledged securities in the amount of $49,080,487 and $28,637,625, respectively, to State Street, as collateral for short sales. In addition, State Street has a perfected security interest in a portion of each such Portfolio’s assets.
Investment Company Securities and Exchange-Traded Funds: Subject to applicable regulatory requirements, each Portfolio may invest in shares of other registered investment companies, including ETFs. Pursuant to orders issued by the SEC to certain ETFs and procedures approved by the Board, each Portfolio may seek to invest in certain ETFs beyond the statutory limitations, provided the Portfolio complies with certain conditions of the SEC orders and any applicable investment limitations. Some ETFs seek to track the performance of a particular market index. These indices include both broad-market indices and more narrowly-based indices, including those relating to particular sectors, markets, regions, or industries. However, some ETFs have an actively managed investment objective. ETF shares and closed-end fund shares are traded like traditional equity securities on a national securities exchange or NASDAQ.
Fixed Income and Municipal Securities: The Core Fixed Income Portfolio, High Yield Municipal Portfolio and Short Term Tax Aware Fixed Income Portfolio invest in fixed income securities. The value of fixed income securities tends to fluctuate with changes in interest rates. Generally, their value will decrease when interest rates rise and increase when interest rates fall. Fixed income securities are also subject to the risk that an issuer will be unable to make principal and interest payments when due which could adversely impact a Portfolio’s return and net asset value. Changes in the credit rating of a debt security held by a Portfolio could have a similar effect. Fixed income securities with longer maturities are more susceptible to interest rate fluctuations than those with shorter maturities. Although governmental financial regulators, including the Federal Reserve, have taken steps to maintain historically low interest rates; the Federal Reserve has begun raising interest rates.
THE GLENMEDE FUND, INC.
Notes to Financial Statements — (Continued)
The High Yield Municipal Portfolio invests primarily in municipal securities. The value of, payment of interest on, repayment of principal for, and the ability to sell a municipal security may be affected by constitutional amendments, legislation, executive orders, administrative regulations, voter initiatives and the economics of the regions in which the issuers are located. A credit rating downgrade, bond default, or bankruptcy involving an issuer within a particular state or territory could affect the market values and marketability of some or all of the municipal obligations of that state or territory. For example, significant economic and financial difficulties in Puerto Rico have led certain credit rating agencies to downgrade Puerto Rican general obligation debt and certain issuers below investment grade and to continue to have a negative outlook on certain Puerto Rican issuers. Such downgrades and continued financial difficulties could lead to lower prices and increased likelihood of restructurings or default of Puerto Rican bonds which could negatively impact the value of the High Yield Municipal Portfolio’s investments in such obligations. In addition, since many municipal securities are issued to finance similar projects, especially those relating to education, health care, transportation and utilities, conditions in those sectors can affect the overall municipal securities market and a Portfolio’s investments in municipal securities. There is some risk that a portion or all of the interest received from certain tax-exempt municipal securities could become taxable as a result of determinations by the Internal Revenue Service.
Securities Transactions and Investment Income: Securities transactions are recorded as of the trade date. Realized gains and losses on investments sold are computed on the basis of identified cost. Dividend income and distributions to shareholders are recorded on the ex-dividend date. Dividend income for foreign securities is recorded on the ex-dividend date except that certain dividends from foreign securities are recorded “net of withholding tax” as soon thereafter as a Portfolio is informed of the ex-dividend date. Interest income is recorded on the accrual basis and includes, when appropriate, amortization of premiums and accretion of discounts using the effective interest method.
Securities purchased or sold on a when-issued or delayed-delivery basis may be settled after a period longer than the regular settlement time of trade date plus three business days. Interest income is accrued based on the terms of the security on settlement date. Each Portfolio segregates assets with a current value at least equal to the amount of its when-issued purchase commitments. When-issued purchase commitments involve a risk of loss if the value of the security to be purchased declines prior to settlement date, or if the counterparty does not perform under the contract.
Dividends and Distributions to Shareholders: Dividends from net investment income, if any, of the Core Fixed Income Portfolio, Short Term Tax Aware Fixed Income Portfolio and High Yield Municipal Portfolio are declared and paid monthly. Dividends from net investment income, if any, of the Quantitative U.S. Large Cap Core Equity Portfolio, Quantitative U.S. Large Cap Growth Equity Portfolio, Quantitative U.S. Large Cap Value Equity Portfolio, Quantitative U.S. Small Cap Equity Portfolio, Quantitative International Equity Portfolio, Responsible ESG U.S. Equity Portfolio, Women in Leadership U.S. Equity Portfolio, Quantitative U.S. Long/Short Equity Portfolio, Quantitative U.S. Total Market Equity Portfolio, Strategic Equity Portfolio, Small Cap Equity Portfolio, Mid Cap Equity Portfolio, Large Cap Value Portfolio, Equity Income Portfolio, Secured Options Portfolio and Global Secured Options Portfolio are declared and paid quarterly. Each Portfolio distributes any net realized capital gains on an annual basis. Additional distributions of net investment income and capital gains for each Portfolio may be made at the discretion of the Board in order to avoid a nondeductible excise tax under Section 4982 of the Internal Revenue Code of 1986, as amended (the “Code”).
Income and capital gains distributions are determined in accordance with income tax regulations which may differ from accounting principles generally accepted in the U.S. These differences are primarily due to differing treatments of income and gains on various investment securities held by each Portfolio, timing differences and differing characterization of distributions made by each Portfolio.
Income and Expense Allocation: Expenses which are not readily identifiable to a specific Portfolio are allocated among Portfolios taking into consideration, among other things, the nature and type of expenses and the relative size of each Portfolio. Investment income, realized and unrealized gains and losses, and certain fund-level expenses are borne pro rata on the basis of relative net assets by the holders of all classes of shares, except that each class bears certain expenses unique to that class, such as shareholder servicing fees and certain other class-specific expenses. Differences in class-level expenses may result in payment of different per share dividends by class.
Federal Income Taxes: Each Portfolio intends to continue to qualify as a regulated investment company by complying with the requirements of the Code applicable to regulated investment companies, and by distributing substantially all of its taxable income to its shareholders. Therefore, no federal income tax provision is required. Income distributions and capital gain distributions are determined in accordance with income tax regulations which may differ from accounting principles generally accepted in the U.S.
“Accounting for Uncertainty in Income Taxes — an interpretation of FASB ASC 740” (“ASC 740”) clarifies the accounting for uncertainty in income taxes recognized in accordance with ASC 740, “Accounting for Income Taxes.” This interpretation prescribes a recognition threshold and measurement attribute for the financial statement recognition and measurement of a tax position taken or expected to be taken in a tax return. It also provides guidance on de-recognition, classification, interest and penalties, accounting in interim periods, disclosure and transition. Each Portfolio’s federal tax returns filed in the 3-year period ended October 31, 2018 remain subject to examination by the Internal Revenue Service.
THE GLENMEDE FUND, INC.
Notes to Financial Statements — (Continued)
On October 31, 2018, the tax year end of the Fund, the following Portfolios had available capital loss carryforwards to be utilized in future periods to offset future capital gains as follows:
| | | | | | | | |
Portfolio | | Unlimited
(Short Term) | | | Unlimited
(Long Term) | |
Quantitative U.S. Large Cap Value Equity Portfolio | | $ | 24,532 | | | $ | — | |
Quantitative U.S. Small Cap Equity Portfolio | | | 2,798 | | | | — | |
Quantitative International Equity Portfolio | | | 2,136,441 | | | | — | |
Quantitative U.S. Long/Short Equity Portfolio | | | 19,680,918 | | | | — | |
Global Secured Options Portfolio* | | | 5,059,957 | | | | 1,642,909 | |
Core Fixed Income Portfolio | | | 188,259 | | | | 1,793,311 | |
Short Term Tax Aware Fixed Income Portfolio | | | 104,157 | | | | 27,826 | |
High Yield Municipal Portfolio | | | 430,216 | | | | 298,379 | |
During the fiscal year ended October 31, 2018, the following Portfolios utilized capital loss carryforwards:
| | | | |
Quantitative International Equity Portfolio | | $ | 12,291,805 | |
Quantitative U.S. Long/Short Equity Portfolio | | | 1,573,567 | |
Mid Cap Equity Portfolio | | | 1,321,662 | |
Global Secured Options Portfolio | | | 260,887 | |
On December 22, 2010, the Regulated Investment Company Modernization Act of 2010 (the “Act”) was enacted. The Act modernized several of the federal income and excise tax provisions related to regulated investment companies, and, with certain exceptions, was effective for taxable years beginning after December 22, 2010. Among the changes made were changes to the capital loss carryforward rules allowing for capital losses to be carried forward indefinitely. Rules in effect prior to the effective date of the Act limited the carryforward period to eight years. Capital loss carryforwards generated in taxable years beginning after the effective date of the Act must be fully used before capital loss carryforwards generated in taxable years prior to effective date of the Act; therefore, under certain circumstances, capital loss carryforwards available as of the report date, if any, may expire unused.
* Utilization of the capital loss carryforwards of the Global Secured Options Portfolio is limited currently and in future years pursuant to Internal Revenue Code Section 382.
As of October 31, 2018, the tax year end of the Fund, the components of distributable earnings on a tax basis were as follows:
| | | | | | | | | | | | | | | | | | | | | | | | | | | | |
Portfolio | | Undistributed
Tax-exempt
Income | | | Undistributed
Ordinary
Income | | | Undistributed
Long-Term
Gain | | | Unrealized
Appreciation/
(Depreciation) | | | Other
Temporary
Differences | | | Loss
Carryforwards | | | Total
Distributable
Earnings | |
Quantitative
U.S. Large Cap Core Equity Portfolio | | $ | — | | | $ | 3,602,100 | | | $ | 214,187,260 | | | $ | 495,678,312 | | | $ | — | | | $ | — | | | $ | 713,467,672 | |
Quantitative
U.S. Large Cap Growth Equity Portfolio | | | — | | | | 3 | | | | 438,972,348 | | | | 750,860,230 | | | | — | | | | — | | | | 1,189,832,581 | |
Quantitative U.S. Large Cap Value Equity Portfolio | | | — | | | | 6,286 | | | | — | | | | (4,093 | ) | | | — | | | | (24,532 | ) | | | (22,339 | ) |
Quantitative U.S. Small Cap Equity Portfolio | | | — | | | | 5,038 | | | | — | | | | 26,928 | | | | — | | | | (2,798 | ) | | | 29,168 | |
Quantitative International Equity Portfolio | | | — | | | | 204,147 | | | | — | | | | 6,817,485 | | | | — | | | | (2,136,441 | ) | | | 4,885,191 | |
Responsible ESG U.S. Equity Portfolio | | | — | | | | 25,300 | | | | 782,741 | | | | 1,925,420 | | | | — | | | | — | | | | 2,733,461 | |
Women in Leadership U.S. Equity Portfolio | | | — | | | | 18,444 | | | | 614,530 | | | | 1,360,160 | | | | — | | | | — | | | | 1,993,134 | |
THE GLENMEDE FUND, INC.
Notes to Financial Statements — (Continued)
| | | | | | | | | | | | | | | | | | | | | | | | | | | | |
Portfolio | | Undistributed
Tax-exempt
Income | | | Undistributed
Ordinary
Income | | | Undistributed
Long-Term
Gain | | | Unrealized
Appreciation/
(Depreciation) | | | Other
Temporary
Differences | | | Loss
Carryforwards | | | Total
Distributable
Earnings | |
Quantitative
U.S. Long/Short Equity Portfolio | | $ | — | | | $ | — | | | $ | — | | | $ | 57,574,273 | | | $ | (20,798 | ) | | $ | (19,680,918 | ) | | $ | 37,872,557 | |
Quantitative
U.S. Total Market Equity Portfolio | | | — | | | | 57,048 | | | | 6,593,129 | | | | 22,116,014 | | | | (11,206 | ) | | | — | | | | 28,754,985 | |
Strategic Equity Portfolio | | | — | | | | 229,232 | | | | 2,691,438 | | | | 86,159,587 | | | | — | | | | — | | | | 89,080,257 | |
Small Cap Equity Portfolio | | | — | | | | 58,747,688 | | | | 389,455,454 | | | | 52,810,237 | | | | — | | | | — | | | | 501,013,379 | |
Large Cap Value Portfolio | | | — | | | | 39,870 | | | | 6,239,316 | | | | 6,004,832 | | | | — | | | | — | | | | 12,284,018 | |
Equity Income Portfolio | | | — | | | | 163,305 | | | | 300,464 | | | | 331,494 | | | | — | | | | — | | | | 795,263 | |
Secured Options Portfolio | | | — | | | | 5,534,681 | | | | 13,316,289 | | | | 7,013,832 | | | | (18,386 | ) | | | — | | | | 25,846,416 | |
Global Secured Options Portfolio | | | — | | | | 179,322 | | | | 844,921 | | | | (121,703 | ) | | | 472,081 | ** | | | (6,702,866 | ) | | | (5,328,245 | ) |
Core Fixed Income Portfolio | | | — | | | | 915,960 | | | | — | | | | (19,658,912 | ) | | | — | | | | (1,981,570 | ) | | | (20,724,522 | ) |
Short Term Tax Aware Fixed Income Portfolio | | | 22,719 | | | | — | | | | — | | | | (258,407 | ) | | | — | | | | (131,983 | ) | | | (367,671 | ) |
High Yield Municipal Portfolio | | | 489,648 | | | | — | | | | — | | | | (1,664,458 | ) | | | — | | | | (728,595 | ) | | | (1,903,405 | ) |
** Refer to footnote 2 for additional information on the nature of the temporary difference.
The difference between book-basis and tax-basis unrealized appreciation (depreciation) is attributable primarily to the tax deferral of losses on wash sales, nontaxable dividends received from investments and the realization for tax purposes of unrealized gains on investments in passive foreign investment companies.
The tax character of distributions paid during the fiscal year ended October 31, 2018, was as follows:
| | | | | | | | | | | | | | | | |
Portfolio | | Tax
Exempt | | | Ordinary
Income | | | Long-Term
Gains | | | Return of
Capital | |
Quantitative U.S. Large Cap Core Equity Portfolio | | $ | — | | | $ | 29,331,979 | | | $ | 111,721,370 | | | $ | — | |
Quantitative U.S. Large Cap Growth Equity Portfolio | | | — | | | | 21,319,668 | | | | 73,196,841 | | | | — | |
Quantitative U.S. Large Cap Value Equity Portfolio | | | — | | | | 12,152 | | | | — | | | | — | |
Quantitative U.S. Small Cap Equity Portfolio | | | — | | | | 3,800 | | | | — | | | | — | |
Quantitative International Equity Portfolio | | | — | | | | 8,716,752 | | | | — | | | | — | |
Responsible ESG U.S. Equity Portfolio | | | — | | | | 140,449 | | | | 62,301 | | | | — | |
Women in Leadership U.S. Equity Portfolio | | | — | | | | 138,167 | | | | 84,949 | | | | — | |
Quantitative U.S. Long/Short Equity Portfolio | | | — | | | | — | | | | — | | | | — | |
Quantitative U.S. Total Market Equity Portfolio | | | — | | | | 272,471 | | | | 2,233,678 | | | | — | |
Strategic Equity Portfolio | | | — | | | | 1,954,304 | | | | 13,725,891 | | | | — | |
Small Cap Equity Portfolio | | | — | | | | 8,032,428 | | | | 334,339,639 | | | | — | |
Mid Cap Equity Portfolio | | | — | | | | 63,157 | | | | — | | | | — | |
Large Cap Value Portfolio | | | — | | | | 2,424,660 | | | | 3,556,789 | | | | — | |
Equity Income Portfolio | | | — | | | | 342,890 | | | | 79 | | | | — | |
Secured Options Portfolio | | | — | | | | 17,251,876 | | | | 32,671,135 | | | | — | |
Global Secured Options Portfolio | | | — | | | | 90,635 | | | | — | | | | — | |
Core Fixed Income Portfolio | | | — | | | | 11,591,006 | | | | 1,755,129 | | | | — | |
Short Term Tax Aware Fixed Income Portfolio | | | 214,377 | | | | 58,601 | | | | — | | | | — | |
High Yield Municipal Portfolio | | | 5,272,841 | | | | 126,090 | | | | — | | | | — | |
THE GLENMEDE FUND, INC.
Notes to Financial Statements — (Continued)
The tax character of distributions paid during the fiscal year ended October 31, 2017, was as follows:
| | | | | | | | | | | | |
Portfolio | | Tax
Exempt | | | Ordinary
Income | | | Long-Term
Gains | |
Quantitative U.S. Large Cap Core Equity Portfolio | | $ | — | | | $ | 22,522,801 | | | $ | — | |
Quantitative U.S. Large Cap Growth Equity Portfolio | | | — | | | | 19,123,619 | | | | — | |
Quantitative International Equity Portfolio | | | — | | | | 7,885,718 | | | | — | |
Responsible ESG U.S. Equity Portfolio | | | — | | | | 65,637 | | | | — | |
Women in Leadership U.S. Equity Portfolio | | | — | | | | 77,872 | | | | — | |
Quantitative U.S. Total Market Equity Portfolio | | | — | | | | 160,173 | | | | — | |
Strategic Equity Portfolio | | | — | | | | 2,097,356 | | | | 11,064,147 | |
Small Cap Equity Portfolio | | | — | | | | 2,714,603 | | | | 52,183,890 | |
Mid Cap Equity Portfolio | | | — | | | | 62,132 | | | | — | |
Large Cap Value Portfolio | | | — | | | | 1,622,798 | | | | 5,439,004 | |
Equity Income Portfolio | | | — | | | | 105,892 | | | | — | |
Secured Options Portfolio | | | — | | | | 9,197,563 | | | | 19,239,800 | |
Global Secured Options Portfolio | | | — | | | | 135,356 | | | | — | |
Core Fixed Income Portfolio | | | — | | | | 9,796,163 | | | | 3,226,898 | |
Short Term Tax Aware Fixed Income Portfolio | | | 142,982 | | | | 72,222 | | | | — | |
High Yield Municipal Portfolio | | | 4,202,037 | | | | 763,923 | | | | — | |
For the fiscal year ended October 31, 2018, permanent differences between financial and tax reporting related primarily to REITs, foreign currency gain/(loss), distribution reallocations, non-deductible blue sky expenses and excise taxes paid, dividend expense reclass for short positions, net operating losses, liquidating distributions, nontaxable dividends received from investments and the realization for tax purposes of unrealized gains on investments in passive foreign investment companies were identified and reclassified among the components of each Portfolio’s net assets as identified below. These reclassifications had no effect on net assets.
| | | | | | | | |
Portfolio | | Total distributable
earnings | | | Paid-in
capital | |
Quantitative U.S. Large Cap Core Equity Portfolio | | $ | 2,123 | | | $ | (2,123 | ) |
Quantitative U.S. Large Cap Value Equity Portfolio | | | 4,814 | | | | (4,814 | ) |
Quantitative U.S. Small Cap Equity Portfolio | | | 4,814 | | | | (4,814 | ) |
Responsible ESG U.S. Equity Portfolio | | | 191 | | | | (191 | ) |
Quantitative U.S. Long/Short Equity Portfolio | | | 6,693 | | | | (6,693 | ) |
Mid Cap Equity Portfolio | | | (1,281,962 | ) | | | 1,281,962 | |
As of October 31, 2018, aggregate gross unrealized appreciation for all investments in which there was an excess of value over tax cost and aggregate gross unrealized depreciation for all investments in which there was an excess of tax cost over value were as follows:
| | | | | | | | | | | | | | | | |
Portfolio | | Cost | | | Appreciation | | | (Depreciation) | | | Net | |
Quantitative U.S. Large Cap Core Equity Portfolio | | $ | 2,348,903,210 | | | $ | 580,258,467 | | | $ | 84,580,155 | | �� | $ | 495,678,312 | |
Quantitative U.S. Large Cap Growth Equity Portfolio | | | 2,668,301,763 | | | | 824,122,914 | | | | 73,262,684 | | | | 750,860,230 | |
Quantitative U.S. Large Cap Value Equity Portfolio | | | 1,081,497 | | | | 64,000 | | | | 68,093 | | | | (4,093 | ) |
Quantitative U.S. Small Cap Equity Portfolio | | | 1,054,423 | | | | 97,308 | | | | 70,380 | | | | 26,928 | |
Quantitative International Equity Portfolio | | | 413,593,813 | | | | 34,146,449 | | | | 27,328,885 | | | | 6,817,564 | |
Responsible ESG U.S. Equity Portfolio | | | 19,900,905 | | | | 2,739,002 | | | | 813,582 | | | | 1,925,420 | |
Women in Leadership U.S. Equity Portfolio | | | 17,526,478 | | | | 1,884,211 | | | | 524,051 | | | | 1,360,160 | |
Quantitative U.S. Long/Short Equity Portfolio | | | 62,790,892 | | | | 75,490,862 | | | | 17,916,589 | | | | 57,574,273 | |
Quantitative U.S. Total Market Equity Portfolio | | | 68,521,927 | | | | 25,411,303 | | | | 3,295,289 | | | | 22,116,014 | |
Strategic Equity Portfolio | | | 139,942,219 | | | | 90,707,107 | | | | 4,547,520 | | | | 86,159,587 | |
Small Cap Equity Portfolio | | | 3,627,104,122 | | | | 372,896,500 | | | | 320,086,263 | | | | 52,810,237 | |
Mid Cap Equity Portfolio | | | 571,610 | | | | — | | | | — | | | | — | |
Large Cap Value Portfolio | | | 66,499,655 | | | | 8,590,785 | | | | 2,585,953 | | | | 6,004,832 | |
Equity Income Portfolio | | | 18,510,764 | | | | 1,179,327 | | | | 847,833 | | | | 331,494 | |
Secured Options Portfolio | | | 834,835,127 | | | | 7,013,976 | | | | 144 | | | | 7,013,832 | |
Global Secured Options Portfolio | | | 2,559,808 | | | | 209,667 | | | | 331,370 | | | | (121,703 | ) |
Core Fixed Income Portfolio | | | 520,483,811 | | | | 250,372 | | | | 19,909,284 | | | | (19,658,912 | ) |
Short Term Tax Aware Fixed Income Portfolio | | | 26,299,054 | | | | 8,142 | | | | 266,549 | | | | (258,407 | ) |
High Yield Municipal Portfolio | | | 191,645,751 | | | | 2,085,067 | | | | 3,749,525 | | | | (1,664,458 | ) |
THE GLENMEDE FUND, INC.
Notes to Financial Statements — (Continued)
Other: In the normal course of business, the Fund enters into contracts that may include agreements to indemnify another party under given circumstances. The Fund’s maximum exposure under these arrangements is unknown as this would involve future claims that may be, but have not yet been, made against the Fund. However, based on experience, the risk of material loss from such claims is considered to be remote.
| 2. | | Revision to Previously Issued Financial Statements |
Subsequent to the issuance of the October 31, 2017 financial statements, management identified that the Global Secured Options Portfolio (the “Portfolio”) had an ownership change on January 26, 2017, which limits the Portfolio’s ability to utilize capital loss carryforwards to offset capital gains for purposes of calculating distributable income. As a result, the Portfolio should have reflected undistributed long term gains in the amount of $472,081 related to 2017. Accordingly, the undistributed long-term gain and capital loss carry forward amounts that were disclosed in the Federal Income Taxes footnote of the October 31, 2017 financial statements for this Portfolio were understated and overstated, respectively, by this amount. There was no impact to the statement of assets and liabilities, statement of operations, statement of changes in net assets, the financial highlights or any other disclosures for the year ended October 31, 2017. To correct for the error, the table below reflects the revisions to the components of distributable earnings on a tax basis as of October 31, 2017 for the Global Secured Options Portfolio:
| | | | | | | | | | | | |
| | | As of October 31, 2017 | |
| | | As Reported | | | Adjustment | | | As Revised | |
Undistributed Long Term Gain | | $ | — | | | $ | 472,081 | | | $ | 472,081 | |
Capital Loss Carryforwards | | | (6,491,672 | ) | | | (472,081 | ) | | | (6,963,753 | ) |
Undistributed Ordinary Income | | | 79,478 | | | | — | | | | 79,478 | |
Unrealized Appreciation/(Depreciation) | | | 874,005 | | | | — | | | | 874,005 | |
| | | | | | | | | | | | |
Total Distributable Earnings | | | (5,538,189 | ) | | | — | | | | (5,538,189 | ) |
| | | | | | | | | | | | |
On October 31, 2017, after correction for the error described above, the Global Secured Options Portfolio had the following capital loss carryforwards, utilization of which is limited pursuant to Internal Revenue Code Section 382 in future years:
Short Term ($5,107,951)
Long Term ($1,855,802)
During the fiscal year ended October 31, 2017, after correction for the error described above, the Global Secured Options Portfolio utilized capital loss carryforwards in the amount of $637,419.
| 3. | | Financial Instruments and Hedging Activities |
Disclosures about Derivative Instruments and Hedging Activities: Each Portfolio follows FASB ASC Topic 815 “Disclosures about Derivative Instruments and Hedging Activities” (“ASC 815”). ASC 815 requires enhanced disclosures about each Portfolio’s use of, and accounting for, derivative instruments and the effect on the results of each Portfolio’s operations and financial position. At October 31, 2018 and during the period then ended, the Secured Options Portfolio and the Global Secured Options Portfolio had the following derivatives and transactions in derivatives, grouped into appropriate risk categories, none of which have been designated as hedging instruments:
Secured Options Portfolio
Asset Derivatives
| | | | | | | | |
| | | Equity
Contracts
Risk | | | Total | |
Options Purchased1 | | $ | 1,157,762,900 | | | $ | 1,157,762,900 | |
| | | | | | | | |
Total Value | | $ | 1,157,762,900 | | | $ | 1,157,762,900 | |
| | | | | | | | |
Liability Derivatives
| | | | | | | | |
| | | Equity
Contracts
Risk | | | Total | |
Options Written2 | | $ | (521,202,675 | ) | | $ | (521,202,675 | ) |
| | | | | | | | |
Total Value | | $ | (521,202,675 | ) | | $ | (521,202,675 | ) |
| | | | | | | | |
THE GLENMEDE FUND, INC.
Notes to Financial Statements — (Continued)
Realized Gain (Loss)
| | | | | | | | |
| | | Equity
Contracts
Risk | | | Total | |
Options Purchased3 | | $ | 113,477,232 | | | $ | 113,477,232 | |
Options Written4 | | | (74,422,576 | ) | | | (74,422,576 | ) |
| | | | | | | | |
Total Realized Gain (Loss) | | $ | 39,054,656 | | | $ | 39,054,656 | |
| | | | | | | | |
Change in Appreciation (Depreciation)
| | | | | | | | |
| | | Equity
Contracts
Risk | | | Total | |
Options Purchased5 | | $ | (141,199,630 | ) | | $ | (141,199,630 | ) |
Options Written6 | | | 124,373,837 | | | | 124,373,837 | |
| | | | | | | | |
Total Change in Appreciation (Depreciation) | | $ | (16,825,793 | ) | | $ | (16,825,793 | ) |
| | | | | | | | |
Number of Contracts, Notional Amounts or Shares/Units7
| | | | | | | | |
| | | Equity
Contracts
Risk | | | Total | |
Options Purchased | | | 1,074,933 | | | | 1,074,933 | |
Options Written | | | (1,332,975 | ) | | | (1,332,975 | ) |
Global Secured Options Portfolio
Asset Derivatives
| | | | | | | | |
| | | Equity
Contracts
Risk | | | Total | |
Options Purchased1 | | $ | 1,705,100 | | | $ | 1,705,100 | |
| | | | | | | | |
Total Value | | $ | 1,705,100 | | | $ | 1,705,100 | |
| | | | | | | | |
Liability Derivatives
| | | | | | | | |
| | | Equity
Contracts
Risk | | | Total | |
Options Written2 | | $ | (863,580 | ) | | $ | (863,580 | ) |
| | | | | | | | |
Total Value | | $ | (863,580 | ) | | $ | (863,580 | ) |
| | | | | | | | |
Realized Gain (Loss)
| | | | | | | | |
| | | Equity
Contracts
Risk | | | Total | |
Options Purchased3 | | $ | 608,556 | | | $ | 608,556 | |
Options Written4 | | | (215,170 | ) | | | (215,170 | ) |
| | | | | | | | |
Total Realized Gain (Loss) | | $ | 393,386 | | | $ | 393,386 | |
| | | | | | | | |
THE GLENMEDE FUND, INC.
Notes to Financial Statements — (Continued)
Change in Appreciation (Depreciation)
| | | | | | | | |
| | | Equity
Contracts
Risk | | | Total | |
Options Purchased5 | | $ | (214,780 | ) | | $ | (214,780 | ) |
Options Written6 | | | 150,393 | | | | 150,393 | |
| | | | | | | | |
Total Change in Appreciation (Depreciation) | | $ | (64,387 | ) | | $ | (64,387 | ) |
| | | | | | | | |
Number of Contracts, Notional Amounts or Shares/Units7
| | | | | | | | |
| | | Equity
Contracts
Risk | | | Total | |
Options Purchased | | | 6,167 | | | | 6,167 | |
Options Written | | | (46,317 | ) | | | (46,317 | ) |
| 1 | Statement of Assets and Liabilities location: Investments at value. |
| 2 | Statement of Assets and Liabilities location: Options written, at value. |
| 3 | Statement of Operations location: Amount is included in Net realized gain (loss) on Investments. |
| 4 | Statement of Operations location: Amount is included in Net realized gain (loss) on Options written. |
| 5 | Statement of Operations location: Amount is included in Net change in unrealized gain (loss) of Investments. |
| 6 | Statement of Operations location: Amount is included in Net change in unrealized gain (loss) of Options written. |
| 7 | Amounts disclosed represents average number of contracts, notional amounts, or shares/units outstanding during the period ended October 31, 2018. |
| 4. | | Investment Advisory Fee, Administration Fee and Other Related Party Transactions |
Glenmede Investment Management LP (the “Advisor”), a wholly-owned subsidiary of The Glenmede Trust Company, N.A. (“Glenmede Trust”), serves as investment advisor to the Quantitative U.S. Large Cap Core Equity Portfolio, Quantitative U.S. Large Cap Growth Equity Portfolio, Quantitative U.S. Large Cap Value Equity Portfolio, Quantitative U.S. Small Cap Equity Portfolio, Quantitative International Equity Portfolio, Responsible ESG U.S. Equity Portfolio, Women in Leadership U.S. Equity Portfolio, Quantitative U.S. Long/Short Equity Portfolio, Quantitative U.S. Total Market Equity Portfolio, Strategic Equity Portfolio, Small Cap Equity Portfolio, Mid Cap Equity Portfolio, Large Cap Value Portfolio, Equity Income Portfolio, Secured Options Portfolio, Global Secured Options Portfolio, Core Fixed Income Portfolio, Short Term Tax Aware Fixed Income Portfolio and High Yield Municipal Portfolio pursuant to investment management agreements with the Fund. Under these agreements, the Advisor manages the Portfolios, subject to the general supervision of the Board.
Capital Guardian Trust Company (“CGTC”) serves as sub-advisor to the High Yield Municipal Portfolio. CGTC is a wholly-owned subsidiary of Capital Group International, Inc., which is owned by Capital Research and Management Company, a wholly-owned subsidiary of The Capital Group Companies, Inc. The Advisor has agreed to pay CGTC a fee for its sub-investment advisory services to the High Yield Municipal Portfolio, calculated daily and payable monthly, at the annual rate of the High Yield Municipal Portfolio’s average daily net assets as follows: 0.38% of the first $300,000,000 of the net assets; 0.34% of the net assets between $300,000,000 and $1 billion; and 0.30% of the net assets in excess of $1 billion.
Under the investment management agreements, the Portfolios pay the Advisor a management fee on a monthly basis in an amount equal to the following annual rates of the average daily net assets of each Portfolio:
| | | | |
Fund Name | | Management Fee
on Net Assets | |
Quantitative U.S. Large Cap Core Equity Portfolio | | | 0.55 | % |
Quantitative U.S. Large Cap Growth Equity Portfolio | | | 0.55 | % |
Quantitative U.S. Large Cap Value Equity Portfolio | | | 0.55 | %* |
Quantitative U.S. Small Cap Equity Portfolio | | | 0.55 | %* |
Quantitative International Equity Portfolio | | | 0.75 | %* |
Responsible ESG U.S. Equity Portfolio | | | 0.55 | %* |
Women in Leadership U.S. Equity Portfolio | | | 0.55 | %* |
Quantitative U.S. Long/Short Equity Portfolio | | | 1.20 | %** |
Quantitative U.S. Total Market Equity Portfolio | | | 1.20 | %** |
Strategic Equity Portfolio | | | 0.55 | % |
Small Cap Equity Portfolio | | | 0.55 | % |
Mid Cap Equity Portfolio | | | 0.55 | %* |
THE GLENMEDE FUND, INC.
Notes to Financial Statements — (Continued)
| | | | |
Fund Name | | Management Fee
on Net Assets | |
Large Cap Value Portfolio | | | 0.55 | % |
Equity Income Portfolio | | | 0.55 | %*** |
Secured Options Portfolio | | | 0.55 | % |
Global Secured Options Portfolio | | | 0.55 | % |
Core Fixed Income Portfolio | | | 0.35 | % |
Short Term Tax Aware Fixed Income Portfolio | | | 0.35 | %**** |
High Yield Municipal Portfolio | | | 0.65 | %* |
* The Advisor has contractually agreed to waive a portion of its management fees and/or reimburse expenses to the extent that the Quantitative U.S. Large Cap Value Equity Portfolio’s, Quantitative Small Cap Equity Portfolio’s, Responsible ESG U.S. Equity Portfolio’s, Women in Leadership U.S. Equity Portfolio’s, Mid Cap Equity Portfolio’s Advisor Class, High Yield Municipal Portfolio’s and, since February 26, 2016, the Quantitative International Equity Portfolio’s annual total operating expenses exceed 1.00% of such Portfolio’s average daily net assets (excluding Acquired Fund fees and expenses, brokerage commissions, extraordinary items, interest and taxes). The Advisor has contractually agreed to these waivers and/or reimbursements until at least February 28, 2019 which are included, if any, under the caption “Less expenses waived/reimbursed” in the Statement of Operations. Shareholders of the Portfolios will be notified if these waivers/reimbursements are discontinued after that date.
** The Advisor has contractually agreed to waive a portion of its management fees so that, after giving effect to such contractual waiver, the management fee for each Portfolio is 0.85% of such Portfolio’s average daily net assets. The Advisor has also contractually agreed to waive an additional portion of its management fees and/or reimburse the Portfolios to the extent that total annual Portfolio operating expenses, as a percentage of the Portfolio’s daily average net assets, exceed 1.25% (excluding Acquired Fund fees and expenses, short-sale dividend expense, prime broker interest expense, brokerage commissions, taxes, interest and extraordinary items). The Advisor has contractually agreed to these waivers and/or reimbursements until at least February 28, 2019, which are included under the caption “Less expenses waived/ reimbursed” in the Statement of Operations. Shareholders of the Portfolios will be notified if the waivers/reimbursements are discontinued after that date.
*** The Advisor has contractually agreed to waive its fees and/or reimburse expenses to the extent that the Equity Income Portfolio’s annual total operating expenses exceed 0.85% of the Portfolio’s average daily net assets (excluding Acquired Fund fees and expenses, brokerage commissions, extraordinary items, interest and taxes). The Advisor has contractually agreed to these waivers and/or reimbursements until at least February 28, 2019 which are included, if any, under the caption “Less expenses waived/reimbursed” in the Statement of Operations. Shareholders of the Portfolio will be notified if these waivers/reimbursements are discontinued after that date.
**** The Advisor has contractually agreed to waive its fees and/or reimburse expenses to the extent that the Short Term Tax Aware Fixed Income Portfolio’s annual total operating expenses exceed 0.55% of the Portfolio’s average daily net assets (excluding Acquired Fund fees and expenses, brokerage commissions, extraordinary items, interest and taxes). The Advisor has contractually agreed to these waivers and/or reimbursements until at least February 28, 2019, which are included, if any, under the caption “Less expenses waived/reimbursed” in the Statement of Operations. Shareholders of the Portfolio will be notified if these waivers and/or reimbursements are discontinued after that date.
Under a Shareholder Servicing Agreement, the following Portfolios pay Glenmede Trust shareholder servicing fees for providing or arranging to provide shareholder support services to the beneficial owner of the Portfolios and share classes listed below:
| | | | |
| | | Shareholder Servicing Fee
on Net Assets | |
Quantitative U.S. Large Cap Core Equity Portfolio (Advisor Class) | | | 0.20 | % |
Quantitative U.S. Large Cap Growth Equity Portfolio (Advisor Class) | | | 0.20 | % |
Quantitative U.S. Large Cap Value Equity Portfolio | | | 0.20 | % |
Quantitative U.S. Small Cap Equity Portfolio | | | 0.20 | % |
Quantitative International Equity Portfolio | | | 0.25 | % |
Responsible ESG U.S. Equity Portfolio | | | 0.20 | % |
Women in Leadership U.S. Equity Portfolio | | | 0.20 | % |
Quantitative U.S. Long/Short Equity Portfolio | | | 0.20 | % |
Quantitative U.S. Total Market Equity Portfolio | | | 0.20 | % |
Strategic Equity Portfolio | | | 0.20 | % |
Small Cap Equity Portfolio (Advisor Class) | | | 0.25 | % |
Small Cap Equity Portfolio (Institutional Class) | | | 0.05 | % |
Mid Cap Equity Portfolio (Advisor Class) | | | 0.25 | % |
Large Cap Value Portfolio | | | 0.20 | % |
Equity Income Portfolio | | | 0.20 | % |
Secured Options Portfolio (Advisor Class) | | | 0.20 | % |
THE GLENMEDE FUND, INC.
Notes to Financial Statements — (Continued)
| | | | |
| | | Shareholder Servicing Fee
on Net Assets | |
Global Secured Options Portfolio | | | 0.20 | % |
Core Fixed Income Portfolio | | | 0.10 | % |
Short Term Tax Aware Fixed Income Portfolio | | | 0.10 | % |
High Yield Municipal Portfolio | | | 0.25 | % |
State Street serves as administrator, transfer agent, dividend-paying agent and custodian with respect to the Fund. The Fund pays State Street a fee based on the combined aggregate average daily net assets of the Portfolios and The Glenmede Portfolios, an affiliated registered investment company, plus transaction charges for certain transactions and out-of-pocket expenses. The fee is computed daily and paid monthly. These fees can be found under the caption “Administration, transfer agent and custody fees” in the Statement of Operations.
Foreside Fund Officer Services, LLC (formerly known as Foreside Compliance Services, LLC) is paid an annual fee plus out-of-pocket expenses for the provision of personnel and services related to the Fund’s compliance program. The Fund’s Chief Compliance Officer is a Director of Foreside Financial Services, LLC.
Quasar Distributors, LLC (“Quasar”) serves as distributor of each Portfolio’s shares. The distributor receives no fees from the Fund in connection with distribution services provided to the Fund. The Advisor pays Quasar’s fees and out-of-pocket expenses for the distribution services it provides to the Fund.
The Fund pays each Board member an annual fee of $74,000 plus $5,000 for each Board meeting attended and out-of-pocket expenses incurred in attending Board meetings, and the Audit Committee Chairman receives an annual fee of $10,000 for his services as Chairman of the Audit Committee. These fees can be found under the caption “Directors’ fees and expenses” in the Statement of Operations.
Expenses for the fiscal year ended October 31, 2018 include legal fees paid to Drinker Biddle & Reath LLP as legal counsel to the Fund and the independent Directors. A partner of the law firm is Secretary of the Fund. These fees are included in the amount shown under the caption “Professional fees” in the Statement of Operations.
| 5. | | Purchases and Sales of Securities |
For the fiscal year ended October 31, 2018, the cost of purchases and proceeds from sales of investment securities other than U.S. government securities and short-term securities were:
| | | | | | | | |
Portfolio | | Purchases | | | Sales | |
Quantitative U.S. Large Cap Core Equity Portfolio | | $ | 2,150,247,323 | | | $ | 2,052,032,711 | |
Quantitative U.S. Large Cap Growth Equity Portfolio | | | 2,478,861,257 | | | | 3,242,754,641 | |
Quantitative U.S. Large Cap Value Equity Portfolio | | | 1,751,800 | | | | 644,982 | |
Quantitative U.S. Small Cap Equity Portfolio | | | 1,916,069 | | | | 879,825 | |
Quantitative International Equity Portfolio | | | 352,282,361 | | | | 361,665,601 | |
Responsible ESG U.S. Equity Portfolio | | | 18,738,366 | | | | 10,680,649 | |
Women in Leadership U.S. Equity Portfolio | | | 20,315,899 | | | | 13,245,475 | |
Quantitative U.S. Long/Short Equity Portfolio | | | 470,621,364 | | | | 448,539,791 | |
Quantitative U.S. Total Market Equity Portfolio | | | 124,754,577 | | | | 110,112,840 | |
Strategic Equity Portfolio | | | 23,458,423 | | | | 14,423,789 | |
Small Cap Equity Portfolio | | | 1,710,834,759 | | | | 1,598,864,059 | |
Mid Cap Equity Portfolio | | | 2,839,594 | | | | 17,561,811 | |
Large Cap Value Portfolio | | | 54,645,964 | | | | 57,618,878 | |
Equity Income Portfolio | | | 10,719,126 | | | | 4,985,079 | |
Secured Options Portfolio | | | — | | | | — | |
Global Secured Options Portfolio | | | 6,447,321 | | | | 11,075,005 | |
Core Fixed Income Portfolio | | | 77,976,960 | | | | 73,597,176 | |
Short Term Tax Aware Fixed Income Portfolio | | | 5,329,065 | | | | 12,897,882 | |
High Yield Municipal Portfolio | | | 106,832,298 | | | | 79,908,614 | |
For the fiscal year ended October 31, 2018, the cost of purchases and proceeds from sales of long-term U.S. government securities were:
| | | | | | | | |
Portfolio | | Purchases | | | Sales | |
Core Fixed Income Portfolio | | $ | 88,505,967 | | | $ | 60,611,328 | |
THE GLENMEDE FUND, INC.
Notes to Financial Statements — (Continued)
Changes in the capital shares outstanding were as follows:
| | | | | | | | | | | | | | | | |
| | | Year Ended
10/31/18 | | | Year Ended
10/31/17 | |
| | | Shares | | | Amount | | | Shares | | | Amount | |
Quantitative U.S. Large Cap Core Equity Portfolio — Advisor | | | | | | | | | | | | | | | | |
Sold | | | 11,436,924 | | | $ | 328,633,948 | | | | 17,432,710 | | | $ | 437,290,067 | |
Issued as reinvestment of dividends | | | 3,462,603 | | | | 97,124,284 | | | | 427,752 | | | | 10,922,717 | |
Redeemed | | | (16,137,755 | ) | | | (464,126,218 | ) | | | (17,835,255 | ) | | | (452,875,957 | ) |
| | | | | | | | | | | | | | | | |
Net Increase (Decrease) | | | (1,238,228 | ) | | $ | (38,367,986 | ) | | | 25,207 | | | $ | (4,663,173 | ) |
| | | | | | | | | | | | | | | | |
Quantitative U.S. Large Cap Core Equity Portfolio — Institutional | | | | | | | | | | | | | | | | |
Sold | | | 9,524,939 | | | $ | 275,611,925 | | | | 9,067,412 | | | $ | 231,638,665 | |
Issued as reinvestment of dividends | | | 1,037,112 | | | | 29,172,255 | | | | 95,445 | | | | 2,527,443 | |
Redeemed | | | (2,618,343 | ) | | | (75,387,364 | ) | | | (1,897,323 | ) | | | (48,899,375 | ) |
| | | | | | | | | | | | | | | | |
Net Increase | | | 7,943,708 | | | $ | 229,396,816 | | | | 7,265,534 | | | $ | 185,266,733 | |
| | | | | | | | | | | | | | | | |
Quantitative U.S. Large Cap Growth Equity Portfolio — Advisor | | | | | | | | | | | | | | | | |
Sold | | | 13,654,036 | | | $ | 456,555,937 | | | | 35,506,606 | | | $ | 975,947,541 | |
Issued as reinvestment of dividends | | | 2,076,091 | | | | 66,958,982 | | | | 536,451 | | | | 15,028,286 | |
Redeemed | | | (31,460,232 | ) | | | (1,054,413,273 | ) | | | (59,173,985 | ) | | | (1,671,457,692 | ) |
| | | | | | | | | | | | | | | | |
Net Decrease | | | (15,730,105 | ) | | $ | (530,898,354 | ) | | | (23,130,928 | ) | | $ | (680,481,865 | ) |
| | | | | | | | | | | | | | | | |
Quantitative U.S. Large Cap Growth Equity Portfolio — Institutional | | | | | | | | | | | | | | | | |
Sold | | | 8,907,593 | | | $ | 298,176,710 | | | | 30,819,654 | | | $ | 879,255,188 | |
Issued as reinvestment of dividends | | | 637,383 | | | | 20,607,718 | | | | 58,109 | | | | 1,732,309 | |
Redeemed | | | (13,887,458 | ) | | | (475,942,233 | ) | | | (5,021,593 | ) | | | (137,823,589 | ) |
| | | | | | | | | | | | | | | | |
Net Increase (Decrease) | | | (4,342,482 | ) | | $ | (157,157,805 | ) | | | 25,856,170 | | | $ | 743,163,908 | |
| | | | | | | | | | | | | | | | |
Quantitative U.S. Large Cap Value Equity Portfolio1 | | | | | | | | | | | | | | | | |
Sold | | | 110,464 | | | $ | 1,111,439 | | | | — | | | $ | — | |
Issued as reinvestment of dividends | | | 718 | | | | 7,488 | | | | — | | | | — | |
| | | | | | | | | | | | | | | | |
Net Increase | | | 111,182 | | | $ | 1,118,927 | | | | — | | | $ | — | |
| | | | | | | | | | | | | | | | |
Quantitative U.S. Small Cap Equity Portfolio1 | | | | | | | | | | | | | | | | |
Sold | | | 104,551 | | | $ | 1,047,000 | | | | — | | | $ | — | |
Issued as reinvestment of dividends | | | 199 | | | | 2,200 | | | | — | | | | — | |
| | | | | | | | | | | | | | | | |
Net Increase | | | 104,750 | | | $ | 1,049,200 | | | | — | | | $ | — | |
| | | | | | | | | | | | | | | | |
Quantitative International Equity Portfolio | | | | | | | | | | | | | | | | |
Sold | | | 2,986,388 | | | $ | 45,382,680 | | | | 5,290,341 | | | $ | 72,326,514 | |
Issued as reinvestment of dividends | | | 9,425 | | | | 138,826 | | | | 7,675 | | | | 109,386 | |
Redeemed | | | (4,252,311 | ) | | | (63,344,194 | ) | | | (9,447,036 | ) | | | (126,542,430 | ) |
| | | | | | | | | | | | | | | | |
Net Decrease | | | (1,256,498 | ) | | $ | (17,822,688 | ) | | | (4,149,020 | ) | | $ | (54,106,530 | ) |
| | | | | | | | | | | | | | | | |
Responsible ESG U.S. Equity Portfolio | | | | | | | | | | | | | | | | |
Sold | | | 594,885 | | | $ | 8,663,609 | | | | 454,284 | | | $ | 5,681,489 | |
Issued as reinvestment of dividends | | | 4,781 | | | | 67,264 | | | | 113 | | | | 1,400 | |
Redeemed | | | (57,712 | ) | | | (831,159 | ) | | | (61,333 | ) | | | (772,919 | ) |
| | | | | | | | | | | | | | | | |
Net Increase | | | 541,954 | | | $ | 7,899,714 | | | | 393,064 | | | $ | 4,909,970 | |
| | | | | | | | | | | | | | | | |
Women in Leadership U.S. Equity Portfolio | | | | | | | | | | | | | | | | |
Sold | | | 563,130 | | | $ | 7,760,641 | | | | 334,675 | | | $ | 4,066,006 | |
Issued as reinvestment of dividends | | | 7,076 | | | | 95,546 | | | | 191 | | | | 2,288 | |
Redeemed | | | (53,235 | ) | | | (730,267 | ) | | | (41,498 | ) | | | (494,950 | ) |
| | | | | | | | | | | | | | | | |
Net Increase | | | 516,971 | | | $ | 7,125,920 | | | | 293,368 | | | $ | 3,573,344 | |
| | | | | | | | | | | | | | | | |
THE GLENMEDE FUND, INC.
Notes to Financial Statements — (Continued)
| | | | | | | | | | | | | | | | |
| | | Year Ended
10/31/18 | | | Year Ended
10/31/17 | |
| | | Shares | | | Amount | | | Shares | | | Amount | |
Quantitative U.S. Long/Short Equity Portfolio | | | | | | | | | | | | | | | | |
Sold | | | 5,886,785 | | | $ | 76,982,955 | | | | 5,021,528 | | | $ | 61,021,369 | |
Redeemed | | | (2,679,530 | ) | | | (34,907,053 | ) | | | (2,651,167 | ) | | | (32,209,231 | ) |
| | | | | | | | | | | | | | | | |
Net Increase | | | 3,207,255 | | | $ | 42,075,902 | | | | 2,370,361 | | | $ | 28,812,138 | |
| | | | | | | | | | | | | | | | |
Quantitative U.S. Total Market Equity Portfolio | | | | | | | | | | | | | | | | |
Sold | | | 1,723,936 | | | $ | 33,819,877 | | | | 529,482 | | | $ | 9,095,047 | |
Issued as reinvestment of dividends | | | 120,421 | | | | 2,304,688 | | | | 3,662 | | | | 60,627 | |
Redeemed | | | (970,888 | ) | | | (19,031,024 | ) | | | (768,415 | ) | | | (12,830,042 | ) |
| | | | | | | | | | | | | | | | |
Net Increase (Decrease) | | | 873,469 | | | $ | 17,093,541 | | | | (235,271 | ) | | $ | (3,674,368 | ) |
| | | | | | | | | | | | | | | | |
Strategic Equity Portfolio | | | | | | | | | | | | | | | | |
Sold | | | 1,145,929 | | | $ | 28,701,105 | | | | 688,987 | | | $ | 15,551,970 | |
Issued as reinvestment of dividends | | | 574,373 | | | | 13,884,433 | | | | 550,116 | | | | 11,566,825 | |
Redeemed | | | (824,116 | ) | | | (20,709,125 | ) | | | (1,278,339 | ) | | | (28,216,778 | ) |
| | | | | | | | | | | | | | | | |
Net Increase (Decrease) | | | 896,186 | | | $ | 21,876,413 | | | | (39,236 | ) | | $ | (1,097,983 | ) |
| | | | | | | | | | | | | | | | |
Small Cap Equity Portfolio — Advisor | | | | | | | | | | | | | | | | |
Sold | | | 3,287,497 | | | $ | 101,730,528 | | | | 5,942,624 | | | $ | 176,691,343 | |
Issued as reinvestment of dividends | | | 4,554,760 | | | | 135,920,304 | | | | 842,108 | | | | 24,202,174 | |
Redeemed | | | (8,626,027 | ) | | | (268,783,662 | ) | | | (11,151,723 | ) | | | (329,278,433 | ) |
| | | | | | | | | | | | | | | | |
Net Decrease | | | (783,770 | ) | | $ | (31,132,830 | ) | | | (4,366,991 | ) | | $ | (128,384,916 | ) |
| | | | | | | | | | | | | | | | |
Small Cap Equity Portfolio — Institutional | | | | | | | | | | | | | | | | |
Sold | | | 27,435,565 | | | $ | 900,043,906 | | | | 32,017,912 | | | $ | 985,162,786 | |
Issued as reinvestment of dividends | | | 2,364,451 | | | | 74,045,002 | | | | 419,562 | | | | 12,570,091 | |
Redeemed | | | (15,368,773 | ) | | | (495,386,462 | ) | | | (23,821,823 | ) | | | (731,864,644 | ) |
| | | | | | | | | | | | | | | | |
Net Increase | | | 14,431,243 | | | $ | 478,702,446 | | | | 8,615,651 | | | $ | 265,868,233 | |
| | | | | | | | | | | | | | | | |
Mid Cap Equity Portfolio — Advisor | | | | | | | | | | | | | | | | |
Sold | | | 6,062 | | | $ | 75,360 | | | | 43,009 | | | $ | 479,466 | |
Issued as reinvestment of dividends | | | 69 | | | | 816 | | | | 26 | | | | 292 | |
Redeemed | | | (999,057 | ) | | | (11,846,277 | ) | | | (594,842 | ) | | | (6,601,801 | ) |
| | | | | | | | | | | | | | | | |
Net Decrease | | | (992,926 | ) | | $ | (11,770,101 | ) | | | (551,807 | ) | | $ | (6,122,043 | ) |
| | | | | | | | | | | | | | | | |
Large Cap Value Portfolio | | | | | | | | | | | | | | | | |
Sold | | | 998,661 | | | $ | 11,022,329 | | | | 1,190,517 | | | $ | 12,781,533 | |
Issued as reinvestment of dividends | | | 449,330 | | | | 4,939,648 | | | | 545,934 | | | | 5,716,676 | |
Redeemed | | | (1,359,618 | ) | | | (14,931,958 | ) | | | (2,073,036 | ) | | | (22,280,424 | ) |
| | | | | | | | | | | | | | | | |
Net Increase (Decrease) | | | 88,373 | | | $ | 1,030,019 | | | | (336,585 | ) | | $ | (3,782,215 | ) |
| | | | | | | | | | | | | | | | |
Equity Income Portfolio2 | | | | | | | | | | | | | | | | |
Sold | | | 719,858 | | | $ | 8,280,206 | | | | 1,271,676 | | | $ | 13,155,962 | |
Issued as reinvestment of dividends | | | 442 | | | | 5,065 | | | | — | | | | — | |
Redeemed | | | (230,561 | ) | | | (2,631,038 | ) | | | (99,339 | ) | | | (1,067,789 | ) |
| | | | | | | | | | | | | | | | |
Net Increase | | | 489,739 | | | $ | 5,654,233 | | | | 1,172,337 | | | $ | 12,088,173 | |
| | | | | | | | | | | | | | | | |
Secured Options Portfolio — Advisor | | | | | | | | | | | | | | | | |
Sold | | | 9,995,489 | | | $ | 124,211,619 | | | | 20,817,835 | | | $ | 255,692,822 | |
Issued as reinvestment of dividends | | | 2,170,190 | | | | 26,085,680 | | | | 1,994,084 | | | | 24,148,351 | |
Redeemed | | | (10,947,356 | ) | | | (135,365,729 | ) | | | (33,888,146 | ) | | | (419,551,810 | ) |
| | | | | | | | | | | | | | | | |
Net Increase (Decrease) | | | 1,218,323 | | | $ | 14,931,570 | | | | (11,076,227 | ) | | $ | (139,710,637 | ) |
| | | | | | | | | | | | | | | | |
Secured Options Portfolio — Institutional3 | | | | | | | | | | | | | | | | |
Sold | | | 11,550,437 | | | $ | 145,823,677 | | | | 29,734,349 | | | $ | 368,190,672 | |
Issued as reinvestment of dividends | | | 1,552,885 | | | | 18,712,267 | | | | 69,465 | | | | 841,215 | |
Redeemed | | | (9,602,946 | ) | | | (119,072,547 | ) | | | (1,181,626 | ) | | | (14,815,316 | ) |
| | | | | | | | | | | | | | | | |
Net Increase | | | 3,500,376 | | | $ | 45,463,397 | | | | 28,622,188 | | | $ | 354,216,571 | |
| | | | | | | | | | | | | | | | |
THE GLENMEDE FUND, INC.
Notes to Financial Statements — (Continued)
| | | | | | | | | | | | | | | | |
| | | Year Ended
10/31/18 | | | Year Ended
10/31/17 | |
| | | Shares | | | Amount | | | Shares | | | Amount | |
Global Secured Options Portfolio | | | | | | | | | | | | | | | | |
Sold | | | 5,989 | | | $ | 63,788 | | | | 298,403 | | | $ | 3,014,985 | |
Issued as reinvestment of dividends | | | 3 | | | | 32 | | | | 1 | | | | 9 | |
Redeemed | | | (770,906 | ) | | | (8,405,463 | ) | | | (2,295,314 | ) | | | (22,789,120 | ) |
| | | | | | | | | | | | | | | | |
Net Decrease | | | (764,914 | ) | | $ | (8,341,643 | ) | | | (1,996,910 | ) | | $ | (19,774,126 | ) |
| | | | | | | | | | | | | | | | |
Core Fixed Income Portfolio | | | | | | | | | | | | | | | | |
Sold | | | 8,648,799 | | | $ | 92,745,217 | | | | 9,610,755 | | | $ | 105,497,923 | |
Issued as reinvestment of dividends | | | 226,667 | | | | 2,473,400 | | | | 356,902 | | | | 3,881,561 | |
Redeemed | | | (6,870,199 | ) | | | (73,991,276 | ) | | | (8,936,559 | ) | | | (98,096,739 | ) |
| | | | | | | | | | | | | | | | |
Net Increase | | | 2,005,267 | | | $ | 21,227,341 | | | | 1,031,098 | | | $ | 11,282,745 | |
| | | | | | | | | | | | | | | | |
Short Term Tax Aware Fixed Income Portfolio | | | | | | | | | | | | | | | | |
Sold | | | 506,071 | | | $ | 5,018,252 | | | | 1,429,443 | | | $ | 14,229,559 | |
Redeemed | | | (1,244,972 | ) | | | (12,352,546 | ) | | | (1,045,568 | ) | | | (10,386,590 | ) |
| | | | | | | | | | | | | | | | |
Net Increase (Decrease) | | | (738,901 | ) | | $ | (7,334,294 | ) | | | 383,875 | | | $ | 3,842,969 | |
| | | | | | | | | | | | | | | | |
High Yield Municipal Portfolio | | | | | | | | | | | | | | | | |
Sold | | | 3,870,050 | | | $ | 39,914,227 | | | | 5,471,001 | | | $ | 54,980,310 | |
Issued as reinvestment of dividends | | | — | | | | — | | | | 62,768 | | | | 615,130 | |
Redeemed | | | (1,408,224 | ) | | | (14,456,842 | ) | | | (3,881,693 | ) | | | (38,515,087 | ) |
| | | | | | | | | | | | | | | | |
Net Increase | | | 2,461,826 | | | $ | 25,457,385 | | | | 1,652,076 | | | $ | 17,080,353 | |
| | | | | | | | | | | | | | | | |
| 1 | Portfolio commenced operations on November 13, 2017. |
| 2 | Portfolio commenced operations on December 21, 2016. |
| 3 | Class commenced operations on November 9, 2016. |
As of October 31, 2018, with the exception of the Small Cap Equity Portfolio, Large Cap Value Portfolio, Quantitative U.S. Large Cap Core Equity Portfolio, Quantitative U.S. Large Cap Growth Equity Portfolio, Quantitative U.S. Long/Short Equity Portfolio, Quantitative U.S. Total Market Equity Portfolio and Secured Options Portfolio, Glenmede Trust, on behalf of its clients, holds of record and has voting and/or investment authority over a significant portion of each Portfolio’s outstanding shares. The following Portfolios have shareholders which, to the Fund’s knowledge, own beneficially 5% or more of the shares outstanding of a Portfolio as of October 31, 2018. The total percentage of the shares of a Portfolio held by such shareholders is as follows:
| | | | | | | | |
| | | 5% or Greater Shareholders | |
Portfolio | | # of
Shareholders | | | % of
Shares Held | |
Quantitative U.S. Large Cap Core Equity Portfolio (Advisor Class) | | | 2 | | | | 54 | |
Quantitative U.S. Large Cap Core Equity Portfolio (Institutional Class) | | | 4 | | | | 89 | |
Quantitative U.S. Large Cap Growth Equity Portfolio (Advisor Class) | | | 2 | | | | 73 | |
Quantitative U.S. Large Cap Growth Equity Portfolio (Institutional Class) | | | 4 | | | | 86 | |
Quantitative U.S. Large Cap Value Equity Portfolio | | | 1 | | | | 91 | |
Quantitative U.S. Small Cap Equity Portfolio | | | 1 | | | | 96 | |
Responsible ESG U.S. Equity Portfolio | | | 4 | | | | 31 | |
Women in Leadership U.S. Equity Portfolio | | | 5 | | | | 42 | |
Quantitative U.S. Long/Short Equity Portfolio | | | 2 | | | | 17 | |
Quantitative U.S. Total Market Equity Portfolio | | | 4 | | | | 44 | |
Small Cap Equity Portfolio (Advisor Class) | | | 3 | | | | 53 | |
Small Cap Equity Portfolio (Institutional Class) | | | 2 | | | | 83 | |
Mid Cap Equity Portfolio (Advisor Class) | | | 4 | | | | 22 | |
Large Cap Value Portfolio | | | 1 | | | | 9 | |
Equity Income Portfolio | | | 4 | | | | 32 | |
Secured Options Portfolio (Advisor Class) | | | 3 | | | | 34 | |
Secured Options Portfolio (Institutional Class) | | | 3 | | | | 90 | |
Global Secured Options Portfolio | | | 4 | | | | 88 | |
Short Term Tax Aware Fixed Income Portfolio | | | 2 | | | | 37 | |
THE GLENMEDE FUND, INC.
Notes to Financial Statements — (Concluded)
| 7. | | Lending of Portfolio Securities |
As of October 31, 2018, the following Portfolios had outstanding loans of securities to certain approved brokers for which such Portfolios received collateral:
| | | | | | | | | | | | | | | | |
Portfolio | | Market Value
of Loaned
Securities | | | Market Value
of Cash
Collateral | | | Market Value
of Non-Cash
Collateral | | | % of Total
Assets on
Loan | |
Quantitative U.S. Large Cap Core Equity Portfolio | | $ | 4,921,884 | | | $ | 5,112,366 | | | | — | | | | 0.17 | |
Quantitative U.S. Large Cap Growth Equity Portfolio | | | 7,242,817 | | | | 7,850,227 | | | | — | | | | 0.21 | |
Quantitative U.S. Small Cap Equity Portfolio | | | 80,352 | | | | 22,309 | | | | 60,017 | | | | 7.29 | |
Quantitative International Equity Portfolio | | | 39,056,697 | | | | 33,915,385 | | | | 5,803,489 | | | | 9.19 | |
Responsible ESG U.S. Equity Portfolio | | | 103,843 | | | | 92,367 | | | | — | | | | 0.47 | |
Quantitative U.S. Long/Short Equity Portfolio | | | 5,463,111 | | | | 5,392,036 | | | | — | | | | 0.98 | |
Small Cap Equity Portfolio | | | 150,653,243 | | | | 155,361,882 | | | | — | | | | 4.07 | |
Large Cap Value Portfolio | | | 864,675 | | | | 900,112 | | | | — | | | | 1.19 | |
Equity Income Portfolio | | | 398,433 | | | | 404,003 | | | | — | | | | 2.10 | |
Core Fixed Income Portfolio | | | 18,708,371 | | | | 19,105,863 | | | | — | | | | 3.70 | |
Short Term Tax Aware Fixed Income Portfolio | | | 187,587 | | | | 191,425 | | | | — | | | | 0.69 | |
The Funds have adopted the disclosure provisions of FASB Accounting Standards Update (“ASU”) No. 2014-11 (“ASU No. 2014-11”), Transfers & Servicing (Topic 860): Repurchase-to-Maturity Transactions, Repurchase Financings, and Disclosures. ASU No. 2014-11 is intended to provide increased transparency about the types of collateral pledged in securities lending and other similar transactions that are accounted for as secured borrowings.
For the Quantitative U.S. Large Cap Core Equity Portfolio, the Quantitative U.S. Large Cap Growth Equity Portfolio, the Quantitative U.S. Small Cap Equity Portfolio, the Quantitative International Equity Portfolio, the Responsible ESG U.S. Equity Portfolio, the Quantitative U.S. Long/Short Equity Portfolio, the Small Cap Equity Portfolio, the Equity Income Portfolio, the Core Fixed Income Portfolio and the Short Term Tax Aware Fixed Income Portfolio, all of the securities on loan collateralized by cash are classified as Common Stocks in each Portfolio’s Schedule of Investments (except for Core Fixed Income Portfolio (Agency Notes and Corporate Notes) and Short Term Tax Aware Fixed Income Portfolio (Registered Investment Companies)) at October 31, 2018, with a contractual maturity of overnight and continuous.
| 8. | | Recently Issued Accounting Pronouncements |
In March 2017, the FASB issued ASU 2017-08 (“ASU 2017-08”), Receivables — Nonrefundable Fees and Other Costs (Subtopic 310-20): Premium Amortization on Purchased Callable Debt Securities, which amends the amortization period for certain purchased callable debt securities. Under ASU 2017-08, the premium amortization of purchased callable debt securities that have explicit, non-contingent call features and are callable at fixed prices will be amortized to the earliest call date. ASU 2017-08 will be applied on a modified retrospective basis and is effective for fiscal years, and their interim periods, beginning after December 15, 2018. Management is currently evaluating the impact of this guidance to the Funds.
Management has evaluated events and transactions subsequent to October 31, 2018 through the date the financial statements were available to be issued, for disclosure in the Fund’s financial statements and has determined that there were no material events that would require additional disclosure, except for the following: on September 18, 2018, the Board approved the liquidation and termination of the Mid Cap Equity Portfolio. The Mid Cap Equity Portfolio was liquidated on November 15, 2018.
REPORT OF INDEPENDENT REGISTERED PUBLIC ACCOUNTING FIRM
To the Board of Directors of The Glenmede Fund, Inc. and Shareholders of Quantitative U.S. Large Cap Core Equity Portfolio, Quantitative U.S. Large Cap Growth Equity Portfolio, Quantitative U.S. Large Cap Value Equity Portfolio, Quantitative U.S. Small Cap Equity Portfolio, Quantitative International Equity Portfolio, Responsible ESG U.S. Equity Portfolio, Women in Leadership U.S. Equity Portfolio, Quantitative U.S. Long/Short Equity Portfolio, Quantitative U.S. Total Market Equity Portfolio, Strategic Equity Portfolio, Small Cap Equity Portfolio, Mid Cap Equity Portfolio, Large Cap Value Portfolio, Equity Income Portfolio, Secured Options Portfolio, Global Secured Options Portfolio, Core Fixed Income Portfolio, Short Term Tax Aware Fixed Income Portfolio and High Yield Municipal Portfolio
Opinions on the Financial Statements
We have audited the accompanying statements of assets and liabilities, including the schedules of portfolio investments, of each of the portfolios listed in the table below (constituting The Glenmede Fund, Inc. hereafter collectively referred to as the “Portfolios”) as of October 31, 2018, the related statements of operations, of cash flows of Quantitative U.S. Long/Short Equity Portfolio and Quantitative U.S. Total Market Equity Portfolio, and of changes in net assets for each of the periods indicated in the table below, including the related notes, and the financial highlights for each of the periods indicated therein (collectively referred to as the “financial statements”). In our opinion, the financial statements present fairly, in all material respects, the financial position of each of the Portfolios as of October 31, 2018, the results of each of their operations, the cash flows of Quantitative U.S. Long/Short Equity Portfolio and Quantitative U.S. Total Market Equity Portfolio, and the changes in each of their net assets for each of the periods indicated in the table below, and each of the financial highlights for each of the periods indicated therein, in conformity with accounting principles generally accepted in the United States of America.
| | |
Quantitative U.S. Large Cap Core Equity Portfolio, Quantitative U.S. Large Cap Growth Equity Portfolio, Quantitative International Equity Portfolio, Responsible ESG U.S. Equity Portfolio, Women in Leadership U.S. Equity Portfolio, Strategic Equity Portfolio, Small Cap Equity Portfolio, Mid Cap Equity Portfolio, Large Cap Value Portfolio, Secured Options Portfolio, Global Secured Options Portfolio, Core Fixed Income Portfolio, Short Term Tax Aware Fixed Income Portfolio and High Yield Municipal Portfolio | | Statements of operations for the year ended October 31, 2018 and the statements of changes in net assets for the years ended October 31, 2018 and 2017 |
Quantitative U.S. Long/Short Equity Portfolio and Quantitative U.S. Total Market Equity Portfolio | | Statements of operations and of cash flows for the year ended October 31, 2018 and the statements of changes in net assets for the years ended October 31, 2018 and 2017 |
Equity Income Portfolio | | Statement of operations for the year ended October 31, 2018 and the statements of changes in net assets for the year ended October 31, 2018 and the period December 21, 2016 (commencement of operations) through October 31, 2017 |
Quantitative U.S. Large Cap Value Equity Portfolio and Quantitative U.S. Small Cap Equity Portfolio | | Statements of operations and of changes in net assets for the period November 13, 2017 (commencement of operations) through October 31, 2018 |
Basis for Opinions
These financial statements are the responsibility of the Portfolios’ management. Our responsibility is to express an opinion on the Portfolios’ financial statements based on our audits. We are a public accounting firm registered with the Public Company Accounting Oversight Board (United States) (“PCAOB”) and are required to be independent with respect to the Portfolios in accordance with the U.S. federal securities laws and the applicable rules and regulations of the Securities and Exchange Commission and the PCAOB.
We conducted our audits of these financial statements in accordance with the standards of the PCAOB. Those standards require that we plan and perform the audit to obtain reasonable assurance about whether the financial statements are free of material misstatement, whether due to error or fraud.
Our audits included performing procedures to assess the risks of material misstatement of the financial statements, whether due to error or fraud, and performing procedures that respond to those risks. Such procedures included examining, on a test basis, evidence regarding the amounts and disclosures in the financial statements. Our audits also included evaluating the accounting principles used and significant estimates made by management, as well as evaluating the overall presentation of the financial statements. Our procedures included confirmation of securities owned as of October 31, 2018 by correspondence with the custodian, transfer agent and brokers; when replies were not received from brokers, we performed alternative procedures. We believe that our audits provide a reasonable basis for our opinions.
Emphasis of Matter
As discussed in Note 9 to the financial statements, management has completed the liquidation of the Mid Cap Equity Portfolio, after which the portfolio ceased all operations. Our opinion is not modified with respect to this matter.

Boston, Massachusetts
December 21, 2018
We have served as the auditor of one or more investment companies in the Glenmede family of funds since 1988.
THE GLENMEDE PORTFOLIOS
STATEMENTS OF ASSETS AND LIABILITIES
October 31, 2018
| | | | |
| | | Muni
Intermediate
Portfolio | |
Assets: | | | | |
Investments at value1, | | $ | 287,375,503 | |
Cash | | | 972,185 | |
Receivable for securities sold | | | 3,112,069 | |
Receivable for fund shares sold | | | 675,289 | |
Interest receivable | | | 3,231,503 | |
Prepaid expenses | | | 1,261 | |
| | | | |
Total assets | | | 295,367,810 | |
| | | | |
Liabilities: | | | | |
Payable for securities purchased | | | 2,238,102 | |
Payable for when-issued securities purchased | | | 2,664,850 | |
Payable for fund shares redeemed | | | 978,480 | |
Payable for Trustees’ fees | | | 9,084 | |
Payable for Shareholder Servicing fees | | | 37,021 | |
Accrued expenses | | | 39,090 | |
| | | | |
Total liabilities | | | 5,966,627 | |
| | | | |
Net Assets | | $ | 289,401,183 | |
| | | | |
Net Assets consist of: | | | | |
Par value ($0.001 of shares outstanding) | | $ | 26,963 | |
Paid-in capital in excess of par value | | | 292,543,053 | |
Total distributable earnings | | | (3,168,833 | ) |
| | | | |
Total Net Assets** | | $ | 289,401,183 | |
| | | | |
Shares Outstanding | | | 26,963,109 | |
| | | | |
Net Asset Value Per Share | | $ | 10.73 | |
| | | | |
| **The SEC eliminated the requirement to disclose total distributable earnings by each of its components as previously disclosed as the previous presentation did not provide insight into the tax implications of distributions. | | | | |
| | | | |
1 Investments at cost | | $ | 290,618,982 | |
See Notes to Financial Statements.
THE GLENMEDE PORTFOLIOS
STATEMENTS OF OPERATIONS
For the Year Ended October 31, 2018
| | | | |
| | | Muni
Intermediate
Portfolio | |
Investment income: | | | | |
Interest | | $ | 6,303,887 | |
| | | | |
Total investment income | | | 6,303,887 | |
| | | | |
Expenses: | | | | |
Administration, transfer agent and custody fees | | | 164,008 | |
Professional fees | | | 14,378 | |
Shareholder report expenses | | | 10,207 | |
Shareholder servicing fees | | | 453,287 | |
Trustees’ fees and expenses | | | 36,275 | |
Registration and filing fees | | | 7,460 | |
Other expenses | | | 7,046 | |
| | | | |
Total expenses | | | 692,661 | |
| | | | |
Net investment income | | | 5,611,226 | |
| | | | |
Realized and unrealized gain (loss): | | | | |
Net realized loss on: | | | | |
Investment transactions | | | (102,884 | ) |
Net change in unrealized loss of: | | | | |
Investments | | | (7,566,031 | ) |
| | | | |
Net realized and unrealized loss | | | (7,668,915 | ) |
| | | | |
Net decrease in net assets resulting from operations | | $ | (2,057,689 | ) |
| | | | |
See Notes to Financial Statements.
THE GLENMEDE PORTFOLIOS
STATEMENTS OF CHANGES IN NET ASSETS
For the Year Ended October 31, 2018
| | | | |
| | | Muni
Intermediate
Portfolio | |
Increase (decrease) in net assets | | | | |
Operations: | | | | |
Net investment income | | $ | 5,611,226 | |
Net realized loss on: | | | | |
Investment transactions | | | (102,884 | ) |
Net change in unrealized loss of: | | | | |
Investments | | | (7,566,031 | ) |
| | | | |
Net increase (decrease) in net assets resulting from operations | | | (2,057,689 | ) |
Distributions from earnings* | | | (5,577,383 | ) |
Net increase (decrease) in net assets from capital share transactions (See note 4) | | | (6,945,937 | ) |
| | | | |
Net increase (decrease) in net assets | | | (14,581,009 | ) |
| | | | |
| |
NET ASSETS: | | | | |
Beginning of year | | | 303,982,192 | |
| | | | |
End of year** | | $ | 289,401,183 | |
| | | | |
| * | The SEC eliminated the requirement to disclose distributions to shareholders from net investment income and from net realized gains in 2018. |
| ** | The SEC eliminated the requirement to disclose undistributed net investment income in 2018. |
For the Year Ended October 31, 2017
| | | | |
| | | Muni
Intermediate
Portfolio | |
Increase (decrease) in net assets | | | | |
Operations: | | | | |
Net investment income | | $ | 5,179,296 | |
Net realized loss on: | | | | |
Investment transactions | | | (302,943 | ) |
Net change in unrealized loss of: | | | | |
Investments | | | (1,255,810 | ) |
| | | | |
Net increase in net assets resulting from operations | | | 3,620,543 | |
Distributions to shareholders from: | | | | |
Net investment income | | | (5,126,243 | ) |
Net realized gain on investments | | | (1,046,831 | ) |
Net increase (decrease) in net assets from capital share transactions (See note 4) | | | (24,708,633 | ) |
| | | | |
Net increase (decrease) in net assets | | | (27,261,164 | ) |
| | | | |
| |
NET ASSETS: | | | | |
Beginning of year | | | 331,243,356 | |
| | | | |
End of year | | $ | 303,982,192 | |
| | | | |
Undistributed net investment income included in net assets at end of year | | $ | 446,630 | |
See Notes to Financial Statements.
THE GLENMEDE PORTFOLIOS
FINANCIAL HIGHLIGHTS
For a share outstanding throughout each year
| | | | | | | | | | | | | | | | | | | | |
| | | Muni Intermediate Portfolio | |
| | | For the Years Ended October 31, | |
| | | 2018 | | | 2017 | | | 2016 | | | 2015 | | | 2014 | |
| | | | | |
Net asset value, beginning of year | | $ | 11.01 | | | $ | 11.08 | | | $ | 10.98 | | | $ | 11.04 | | | $ | 10.94 | |
| | | | | | | | | | | | | | | | | | | | |
Income from investment operations: | | | | | | | | | | | | | | | | | | | | |
Net investment income | | | 0.20 | | | | 0.19 | | | | 0.17 | | | | 0.16 | | | | 0.18 | |
Net realized and unrealized gain (loss) on investments | | | (0.28 | ) | | | (0.04 | ) | | | 0.10 | | | | — | | | | 0.15 | |
| | | | | | | | | | | | | | | | | | | | |
| | | | | |
Total from investment operations | | | (0.08 | ) | | | 0.15 | | | | 0.27 | | | | 0.16 | | | | 0.33 | |
| | | | | | | | | | | | | | | | | | | | |
Distributions to shareholders from: | | | | | | | | | | | | | | | | | | | | |
Net investment income | | | (0.20 | ) | | | (0.18 | ) | | | (0.17 | ) | | | (0.16 | ) | | | (0.18 | ) |
Net realized capital gains | | | — | | | | (0.04 | ) | | | — | | | | (0.06 | ) | | | (0.05 | ) |
| | | | | | | | | | | | | | | | | | | | |
| | | | | |
Total distributions | | | (0.20 | ) | | | (0.22 | ) | | | (0.17 | ) | | | (0.22 | ) | | | (0.23 | ) |
| | | | | | | | | | | | | | | | | | | | |
| | | | | |
Net asset value, end of year | | $ | 10.73 | | | $ | 11.01 | | | $ | 11.08 | | | $ | 10.98 | | | $ | 11.04 | |
| | | | | | | | | | | | | | | | | | | | |
| | | | | |
Total return | | | (0.73 | )% | | | 1.38 | % | | | 2.45 | % | | | 1.45 | % | | | 3.09 | % |
| | | | | | | | | | | | | | | | | | | | |
Ratios to average net assets/ Supplemental data: | | | | | | | | | | | | | | | | | | | | |
Net assets, at end of year (in 000s) | | $ | 289,401 | | | $ | 303,982 | | | $ | 331,243 | | | $ | 299,121 | | | $ | 263,867 | |
Ratio of operating expenses to average net assets | | | 0.23 | % | | | 0.23 | % | | | 0.25 | % | | | 0.23 | % | | | 0.25 | % |
Ratio of net investment income to average net assets | | | 1.86 | % | | | 1.70 | % | | | 1.53 | % | | | 1.44 | % | | | 1.67 | % |
Portfolio turnover rate | | | 31 | % | | | 19 | % | | | 34 | % | | | 71 | % | | | 46 | % |
See Notes to Financial Statements.
THE GLENMEDE PORTFOLIOS
Muni Intermediate Portfolio
SCHEDULE OF PORTFOLIO INVESTMENTS
October 31, 2018
| | | | | | | | |
Face
Amount | | | | | Value | |
|
| MUNICIPAL BONDS* — 90.3% | |
| | | | Alabama — 1.1% | | | |
| $ | 3,000,000 | | | Black Belt Energy Gas District, AL, Gas Supply Revenue, Revenue Bonds, Series A,
4.000% due 7/1/46 | | $ | 3,097,290 | |
| | | | | | | | |
| | |
| | | | Alaska — 3.7% | | | |
| | 1,630,000 | | | Alaska State, General Obligation Unlimited, Refunding, Series B,
5.000% due 8/1/22 | | | 1,785,241 | |
| | 1,000,000 | | | Alaska State, General Obligation Unlimited, Series B,
5.000% due 8/1/20 | | | 1,047,880 | |
| | 2,745,000 | | | Anchorage, AK, Electric Utility, Revenue Bonds, Refunding, Series A,
4.000% due 12/1/21 | | | 2,872,121 | |
| | 4,645,000 | | | Valdez, AK, Marine Terminal Revenue, Revenue Bonds, Refunding, Series B, (SPA : British Petroleum PLC),
5.000% due 1/1/21 | | | 4,889,977 | |
| | | | | | | | |
| | | | | | | 10,595,219 | |
| | | | | | | | |
| | |
| | | | Arizona — 1.6% | | | |
| | 4,015,000 | | | Yuma, AZ, Municipal Property Corp., Road & Excise Tax, Revenue Bonds, Refunding,
5.000% due 7/1/26 | | | 4,545,823 | |
| | | | | | | | |
| | |
| | | | Colorado — 1.1% | | | |
| | 2,750,000 | | | Colorado State, Certificate of Participation, Series A,
5.000% due 12/15/29 | | | 3,190,413 | |
| | | | | | | | |
| | |
| | | | District Of Columbia — 1.1% | | | |
| | 2,700,000 | | | District of Columbia, General Obligation Unlimited, Series D,
5.000% due 6/1/25 | | | 3,100,113 | |
| | | | | | | | |
| | |
| | | | Florida — 12.3% | | | |
| | 2,820,000 | | | Central, FL, Expressway Authority, Revenue Bonds, Refunding, Series B,
5.000% due 7/1/28 | | | 3,213,841 | |
| | 3,180,000 | | | Citizens Property Insurance Corp., FL, Revenue Bonds, Series A-1,
5.000% due 6/1/20 | | | 4,858,016 | |
| | 5,000,000 | | | Florida State, Board of Education Capital Outlay, Public Education, General Obligation Unlimited, Refunding, Series E,
5.000% due 6/1/26 | | | 5,714,900 | |
| | 2,765,000 | | | Florida State, Department of Environmental Protection, Preservation Revenue, Revenue Bonds, Refunding, Series A,
5.000% due 7/1/22 | | | 3,024,772 | |
| | 1,200,000 | | | Florida State, Water Pollution Control Financing Corp., Revenue Bonds, Water Pollution Control, Series A,
5.000% due 1/15/20 | | | 1,207,524 | |
| | 2,630,000 | | | Hillsborough County, FL, Industrial Development Authority, Revenue Bonds, Prerefunded 8/15/19 @ 101,
8.000% due 8/15/32 | | | 2,776,938 | |
| | | | Lakeland, FL, Energy System Revenue Bonds, Refunding: | | | | |
| | 3,750,000 | | | 5.000% due 10/1/24 | | | 4,246,912 | |
| | 2,750,000 | | | 5.000% due 10/1/25 | | | 3,146,412 | |
| | 3,000,000 | | | Lee County, FL, School Board, Certificate of Participation, Refunding, Series A,
5.000% due 8/1/27 | | | 3,354,750 | |
| | 2,025,000 | | | Orlando & Orange County, FL, Expressway Authority, Revenue Bonds, Refunding,
5.000% due 7/1/23 | | | 2,203,342 | |
| | 1,875,000 | | | Orlando & Orange County, FL, Expressway Authority, Revenue Bonds, Refunding, Series B (AGMC Insured),
5.000% due 7/1/21 | | | 1,959,938 | |
| | | | | | | | |
| | | | | | | 35,707,345 | |
| | | | | | | | |
| | |
| | | | Georgia — 0.3% | | | |
| | 1,000,000 | | | Albany-Dougherty County, GA, Hospital Authority, Revenue Bonds,
5.000% due 12/1/18 | | | 1,002,400 | |
| | | | | | | | |
See Notes to Financial Statements.
THE GLENMEDE PORTFOLIOS
Muni Intermediate Portfolio
SCHEDULE OF PORTFOLIO INVESTMENTS — (Continued)
October 31, 2018
| | | | | | | | |
Face
Amount | | | | | Value | |
|
| MUNICIPAL BONDS* — (Continued) | |
| | | | Illinois — 6.3% | | | |
| | | | Chicago, IL, O’Hare International Airport Revenue Bonds, Refunding, Series B: | | | | |
| $ | 2,545,000 | | | 5.000% due 1/1/30 | | $ | 2,791,865 | |
| | 2,000,000 | | | 5.000% due 1/1/32 | | | 2,178,840 | |
| | 3,795,000 | | | Illinois State, Finance Authority Revenue, Revenue Bonds,
5.000% due 7/1/27 | | | 4,317,571 | |
| | 4,000,000 | | | McHenry County, IL, Conservation District, General Obligation Unlimited, Refunding,
5.000% due 2/1/25 | | | 4,542,720 | |
| | 4,000,000 | | | Regional Transportation Authority, IL, Revenue Bonds, Refunding, Series A,
5.000% due 7/1/23 | | | 4,402,320 | |
| | | | | | | | |
| | | | | | | 18,233,316 | |
| | | | | | | | |
| | |
| | | | Indiana — 0.8% | | | |
| | 2,500,000 | | | Indiana State, Health & Educational Facilities Financing Authority, Revenue Bonds, Series 2006B-3,
1.750% due 11/15/31 | | | 2,439,050 | |
| | | | | | | | |
| | |
| | | | Kentucky — 0.7% | | | |
| | 2,000,000 | | | Kentucky State, Property & Building Commission, Revenue Bonds, Refunding,
4.000% due 8/1/21 | | | 2,053,000 | |
| | | | | | | | |
| | |
| | | | Louisiana — 1.2% | | | |
| | 3,000,000 | | | Louisiana State, General Obligation Unlimited, Series A,
5.000% due 4/1/28 | | | 3,426,390 | |
| | | | | | | | |
| | |
| | | | Maine — 1.2% | | | |
| | | | Maine State Municipal Bond Bank, Infrastructure Revenue, Refunding, Series A: | | | | |
| | 1,175,000 | | | 5.000% due 9/1/21 | | | 1,262,761 | |
| | 1,985,000 | | | 5.000% due 9/1/22 | | | 2,177,326 | |
| | | | | | | | |
| | | | | | | 3,440,087 | |
| | | | | | | | |
| | |
| | | | Maryland — 2.3% | | | |
| | 4,000,000 | | | Maryland State, General Obligation Unlimited,
5.000% due 8/1/24 | | | 4,543,560 | |
| | 2,000,000 | | | Washington, MD, Suburban Sanitary Commission, General Obligation Unlimited, Public Improvement,
4.000% due 6/1/21 | | | 2,093,400 | |
| | | | | | | | |
| | | | | | | 6,636,960 | |
| | | | | | | | |
| | |
| | | | Massachusetts — 2.6% | | | |
| | 1,000,000 | | | Massachusetts State, General Obligation Limited, Refunding, Series A, (3M USD LIBOR * 0.67+ 0.46%),
2.030% due 11/1/181 | | | 1,000,000 | |
| | 2,000,000 | | | Massachusetts State, General Obligation Limited, Series A,
5.000% due 3/1/23 | | | 2,220,440 | |
| | 3,850,000 | | | Massachusetts State, General Obligation Limited, Series C,
5.000% due 5/1/30 | | | 4,231,189 | |
| | | | | | | | |
| | | | | | | 7,451,629 | |
| | | | | | | | |
| | |
| | | | Michigan — 4.9% | | | |
| | 4,000,000 | | | Detroit, MI, City School District, General Obligation Unlimited, Series A, (QSBLF Insured),
5.000% due 5/1/26 | | | 4,305,040 | |
| | 1,500,000 | | | Grand Valley, MI, State University, Revenue Bonds, Refunding, Series A,
5.000% due 12/1/26 | | | 1,698,765 | |
| | 5,000,000 | | | Michigan Finance Authority, Revenue Bonds, (1M USD LIBOR * 0.67+ 0.54%),
2.069% due 12/1/391 | | | 5,012,150 | |
| | 3,100,000 | | | Michigan Finance Authority, Revenue Bonds, Refunding Detroit School District, Series A, (QSBLF Insured),
5.000% due 5/1/21 | | | 3,290,371 | |
| | | | | | | | |
| | | | | | | 14,306,326 | |
| | | | | | | | |
| | |
| | | | Minnesota — 2.8% | | | |
| | 1,190,000 | | | Lake Superior, MN, Independent School District No. 381, General Obligation Unlimited, Refunding, Series A, (School District Credit Program),
5.000% due 10/1/20 | | | 1,253,927 | |
See Notes to Financial Statements.
THE GLENMEDE PORTFOLIOS
Muni Intermediate Portfolio
SCHEDULE OF PORTFOLIO INVESTMENTS — (Continued)
October 31, 2018
| | | | | | | | |
Face
Amount | | | | | Value | |
| |
| MUNICIPAL BONDS* — (Continued) | | | |
| | | | Minnesota — (Continued) | | | |
| $ | 2,010,000 | | | Sartell, MN, Independent School District No. 748, General Obligation Unlimited, Series B, (School District Credit Program),
0.000% due 2/1/282 | | $ | 1,447,903 | |
| | 4,800,000 | | | St. Paul, MN, Housing & Redevelopment Authority Health Care Facilities Revenue, Refunding, HealthPartners Obligated Group, Series A,
5.000% due 7/1/28 | | | 5,372,688 | |
| | | | | | | | |
| | | | | | | 8,074,518 | |
| | | | | | | | |
| | |
| | | | Mississippi — 1.5% | | | |
| | 1,000,000 | | | Mississippi Development Bank, Special Obligation, Revenue Bonds, Refunding, Series A,
5.000% due 4/1/20 | | | 1,037,470 | |
| | 3,160,000 | | | Mississippi State, Development Bank, Special Obligation, Jackson Public School District Project, Revenue Bonds, Refunding, Series A,
5.000% due 4/1/21 | | | 3,348,462 | |
| | | | | | | | |
| | | | | | | 4,385,932 | |
| | | | | | | | |
| | |
| | | | Missouri — 0.8% | | | |
| | 2,000,000 | | | City of Kansas, MO, Sanitary Sewer System Revenue Bonds, Refunding, Series A,
5.000% due 1/1/27 | | | 2,261,940 | |
| | | | | | | | |
| | |
| | | | Nevada — 1.3% | | | |
| | 3,500,000 | | | Clark County, NV, Water Reclamation District, General Obligation Limited, Refunding,
5.000% due 7/1/20 | | | 3,663,240 | |
| | | | | | | | |
| | |
| | | | New Mexico — 2.2% | | | |
| | 6,300,000 | | | New Mexico State, Municipal Energy Acquisition Authority, Revenue Bonds, Subseries B, (1M USD LIBOR * 0.67+ 0.75%),
2.262% due 11/1/391 | | | 6,299,055 | |
| | | | | | | | |
| | |
| | | | New York — 2.9% | | | |
| | 1,650,000 | | | New York City, NY, Transitional Finance Authority Revenue, Future Tax Secured, Series C,
5.000% due 11/1/26 | | | 1,913,604 | |
| | 2,275,000 | | | New York City, NY, Transitional Finance Authority, Future Tax Secured, Revenue Bonds, Subseries E-1,
5.000% due 2/1/30 | | | 2,556,668 | |
| | 1,150,000 | | | New York State, Thruway Authority Personal Income Tax, Revenue Bonds, Series A,
5.000% due 3/15/23 | | | 1,209,283 | |
| | 2,470,000 | | | New York, Metropolitan Transportation Authority Revenue, Dedicated Tax Fund, Series B-1,
5.000% due 11/15/21 | | | 2,672,021 | |
| | | | | | | | |
| | | | | | | 8,351,576 | |
| | | | | | | | |
| | |
| | | | North Carolina — 4.6% | | | |
| | 1,220,000 | | | Duplin County, NC, Limited Obligation, Revenue Bonds,
5.000% due 4/1/23 | | | 1,340,792 | |
| | | | Mooresville, NC, Limited Obligation, Revenue Bonds, Refunding: | | | | |
| | 3,375,000 | | | 5.000% due 11/1/22 | | | 3,692,723 | |
| | 3,550,000 | | | 5.000% due 11/1/23 | | | 3,953,883 | |
| | 2,000,000 | | | New Hanover County, NC, Hospital Revenue Bonds,
5.000% due 10/1/19 | | | 2,053,480 | |
| | 2,000,000 | | | Raleigh City, North Carolina, Combined Enterprise System Revenue, Refunding, Series B,
5.000% due 12/1/24 | | | 2,287,660 | |
| | | | | | | | |
| | | | | | | 13,328,538 | |
| | | | | | | | |
| | |
| | | | Ohio — 3.5% | | | |
| | 2,060,000 | | | Ohio State, Adult Correctional Capital Facilities, Lease Revenue, Series A,
5.000% due 4/1/21 | | | 2,193,838 | |
| | 3,250,000 | | | Ohio State, General Obligation Unlimited, Series A,
5.000% due 6/15/28 | | | 3,580,005 | |
| | 1,400,000 | | | Ohio State, Hospital Facilities Revenue, Revenue Bonds, Refunding, Series A,
5.000% due 1/1/25 | | | 1,593,592 | |
See Notes to Financial Statements.
THE GLENMEDE PORTFOLIOS
Muni Intermediate Portfolio
SCHEDULE OF PORTFOLIO INVESTMENTS — (Continued)
October 31, 2018
| | | | | | | | |
Face
Amount | | | | | Value | |
| |
| MUNICIPAL BONDS* — (Continued) | | | |
| | | | Ohio — (Continued) | | | |
| $ | 2,670,000 | | | Ohio State, Hospital Revenue Bonds, Series A,
5.000% due 1/15/24 | | $ | 2,914,546 | |
| | | | | | | | |
| | | | | | | 10,281,981 | |
| | | | | | | | |
| | |
| | | | Oklahoma — 0.8% | | | |
| | 2,000,000 | | | Grand River, OK, Dam Authority, Revenue Bonds, Refunding, Series A,
5.000% due 6/1/24 | | | 2,262,240 | |
| | 100,000 | | | Oklahoma City, OK, Industrial & Cultural Facilities Trust, Revenue Bonds, (NPFG Insured),
3.005% due 6/1/191,3 | | | 100,000 | |
| | | | | | | | |
| | | | | | | 2,362,240 | |
| | | | | | | | |
| | |
| | | | Oregon — 2.1% | | | |
| | 3,280,000 | | | Oregon State, Department of Administrative Services, Lottery Revenue, Revenue Bonds, Refunding, Series D,
5.000% due 4/1/27 | | | 3,731,820 | |
| | 2,000,000 | | | Washington County, OR, Beaverton School District No. 48J, Series D,
5.000% due 6/15/26 | | | 2,320,800 | |
| | | | | | | | |
| | | | | | | 6,052,620 | |
| | | | | | | | |
| | |
| | | | Pennsylvania — 4.0% | | | |
| | 2,500,000 | | | Allegheny County, PA, General Obligation Unlimited, Refunding, Series C-73,
5.000% due 12/1/20 | | | 2,641,025 | |
| | 500,000 | | | Conneaut, PA, School District, Refunding, Series B, (AGMC Insured State Aid Withholding),
5.000% due 11/1/20 | | | 524,845 | |
| | 2,500,000 | | | Pennsylvania State Turnpike Authority, Revenue Bonds, Refunding,
5.000% due 12/1/224 | | | 2,655,450 | |
| | 5,000,000 | | | Pennsylvania State, General Obligation Unlimited, Series 2,
5.000% due 9/15/25 | | | 5,656,200 | |
| | | | | | | | |
| | | | | | | 11,477,520 | |
| | | | | | | | |
| | |
| | | | Texas — 9.4% | | | |
| | 1,065,000 | | | Alamo, TX, Community College District, General Obligation Limited, Refunding,
5.000% due 2/15/24 | | | 1,197,720 | |
| | | | Harris County, Texas, Cultural Education Facilities Finance Corp., Revenue Bonds, Refunding, Children’s Hospital Project: | | | | |
| | 2,850,000 | | | 5.000% due 10/1/26 | | | 3,237,743 | |
| | 2,000,000 | | | 5.000% due 10/1/27 | | | 2,260,020 | |
| | 3,000,000 | | | Harris County, Texas, Flood Control District, Revenue Bonds, Refunding, Series A,
5.000% due 10/1/28 | | | 3,489,120 | |
| | 3,000,000 | | | Harris County, Texas, Revenue Bonds, Refunding, Series A,
5.000% due 8/15/25 | | | 3,439,140 | |
| | 3,000,000 | | | Plano, TX, Independent School District, General Obligation Unlimited, Refunding, Series B, (PSF Guaranteed),
5.000% due 2/15/21 | | | 3,182,040 | |
| | 2,550,000 | | | Texas State, General Obligation Unlimited, Series A,
5.000% due 10/1/26 | | | 2,965,344 | |
| | 3,500,000 | | | University of Texas, Revenue Bonds, Series D,
5.000% due 8/15/25 | | | 4,021,710 | |
| | 3,090,000 | | | Waco, TX, Independent School District, General Obligation Unlimited, Refunding, (PSF Guaranteed),
5.000% due 8/15/23 | | | 3,440,746 | |
| | | | | | | | |
| | | | | | | 27,233,583 | |
| | | | | | | | |
| | |
| | | | Utah — 0.9% | | | |
| | 2,440,000 | | | Nebo, UT, School District, General Obligation Unlimited, Series C,
4.000% due 7/1/23 | | | 2,615,680 | |
| | | | | | | | |
| | |
| | | | Virginia — 4.2% | | | |
| | 1,500,000 | | | Fairfax County, VA, General Obligation Unlimited, Refunding, Series C, (State Aid Withholding),
5.000% due 10/1/24 | | | 1,713,795 | |
See Notes to Financial Statements.
THE GLENMEDE PORTFOLIOS
Muni Intermediate Portfolio
SCHEDULE OF PORTFOLIO INVESTMENTS — (Continued)
October 31, 2018
| | | | | | | | |
Face
Amount | | | | | Value | |
| |
| MUNICIPAL BONDS* — (Continued) | | | |
| | | | Virginia — (Continued) | | | |
| $ | 2,800,000 | | | Richmond, VA, Convention Center Authority, Hotel Tax Revenue Bonds, Refunding,
5.000% due 6/15/27 | | $ | 3,153,528 | |
| | 2,450,000 | | | Virginia State, Commonwealth University Health System Authority Revenue, Revenue Bonds, Series B,
5.000% due 7/1/29 | | | 2,807,234 | |
| | 4,000,000 | | | Virginia State, Public Building Authority, Public Facilities Revenue, Revenue Bonds, Refunding, Series B,
5.000% due 8/1/23 | | | 4,475,280 | |
| | | | | | | | |
| | | | 12,149,837 | |
| | | | | | | | |
| | |
| | | | Washington — 6.8% | | | |
| | 4,150,000 | | | Central Puget Sound, WA, Regional Transit Authority, Revenue Bonds, Refunding, Series P-1,
5.000% due 2/1/28 | | | 4,475,526 | |
| | 1,205,000 | | | Grays Harbor County, WA, Public Utility District No. 1, Revenue Bonds, Refunding, Series A,
5.000% due 1/1/27 | | | 1,346,130 | |
| | 3,600,000 | | | King County, WA, Bellevue School District No. 405, General Obligation Unlimited,
5.000% due 12/1/25 | | | 4,021,380 | |
| | 2,240,000 | | | Washington State, Certificate of Participation, Refunding, Series C, (State Aid Intercept),
5.000% due 1/1/20 | | | 2,314,233 | |
| | 4,000,000 | | | Washington State, General Obligation Unlimited, Refunding, Series R-2013A,
4.000% due 7/1/28 | | | 4,174,440 | |
| | 3,000,000 | | | Washington State, General Obligation Unlimited, Series D,
5.000% due 2/1/26 | | | 3,464,100 | |
| | | | | | | | |
| | | | 19,795,809 | |
| | | | | | | | |
| | |
| | | | Wisconsin — 1.3% | | | |
| | 2,100,000 | | | Wisconsin State, Department of Transportation Revenue, Revenue Bonds, Refunding, Series 2,
5.000% due 7/1/29 | | | 2,428,671 | |
| | 15,000 | | | Wisconsin State, General Obligation Unlimited, Series B, Prerefunded 5/1/20 @ 100,
5.000% due 5/1/26 | | | 15,631 | |
| | 1,350,000 | | | Wisconsin State, General Obligation Unlimited, Unrefunded, Series 1,
5.000% due 5/1/21 | | | 1,443,056 | |
| | | | | | | | |
| | | | 3,887,358 | |
| | | | | | | | |
| | |
| | | | TOTAL MUNICIPAL BONDS
(Cost $264,683,362) | | | 261,446,788 | |
| | | | | | | | |
| |
| U.S. TREASURY NOTES/BONDS* — 9.0% | | | |
| | 2,700,000 | | | U.S. Treasury Notes,
2.750% due 2/15/19 | | | 2,702,906 | |
| | 7,000,000 | | | U.S. Treasury Notes,
1.000% due 3/15/19 | | | 6,964,180 | |
| | 7,500,000 | | | U.S. Treasury Notes,
1.250% due 3/31/19 | | | 7,462,207 | |
| | 8,850,000 | | | U.S. Treasury Notes,
1.250% due 4/30/19 | | | 8,799,422 | |
| | | | | | | | |
| | |
| | | | TOTAL U.S. TREASURY NOTES/BONDS
(Cost $25,935,620) | | | 25,928,715 | |
| | | | | | | | |
| | | | | | | | | | |
| | |
TOTAL INVESTMENTS
(Cost $290,618,982) | | | 99.3 | % | | $ | 287,375,503 | |
| | |
OTHER ASSETS IN EXCESS OF LIABILITIES | | | 0.7 | | | | 2,025,680 | |
| | | | | | | | | | |
| | |
NET ASSETS | | | 100.0 | % | | $ | 289,401,183 | |
| | | | | | | | | | |
See Notes to Financial Statements.
THE GLENMEDE PORTFOLIOS
Muni Intermediate Portfolio
SCHEDULE OF PORTFOLIO INVESTMENTS — (Continued)
October 31, 2018
| * | Percentages indicated are based on net assets. |
| 1 | Floating Rate Bond. Rate shown is as of October 31, 2018. |
| 3 | Auction Rate Security (ARS) which will bear interest at Auction Rates established for Auction Periods for such series of 7 days each. The Auction Agent shall calculate the Maximum Interest Rate, the Maximum Rate and the All-Hold Rate on each auction date based upon bids submitted by current holders of the bonds. Upon a successful auction, interest rate will be set at auction-based clearing rate. Upon a failed auction, the interest rate is set at a percentage of the Federal Reserve Bank of New York’s “7-day AA Composite Commercial Paper Rate”, based upon the underlying credit rating of the bonds. As of 10/31/18, based upon S&P credit rating of AA+, the failed auction rate is equivalent to 150% of the “7-day AA Composite Commercial Paper Rate”. |
Abbreviations:
AGMC — Assured Guaranty Municipal Corporation
NPFG — National Public Finance Guarantee Corporation
PSF — Permanent School Fund
QSBLF — Michigan Qualified School Bond Loan Fund
SPA — Stand-By Purchase Agreement
See Notes to Financial Statements.
THE GLENMEDE PORTFOLIOS
Muni Intermediate Portfolio
SCHEDULE OF PORTFOLIO INVESTMENTS — (Concluded)
October 31, 2018
STATE DIVERSIFICATION
On October 31, 2018, State Diversification of the Portfolio was as follows:
| | | | | | | | | | |
| | | % of
Net Assets | | Value |
| STATE: | | | | |
Florida | | | | 12.3 | % | | | $ | 35,707,345 | |
Texas | | | | 9.4 | | | | | 27,233,583 | |
Washington | | | | 6.8 | | | | | 19,795,809 | |
Illinois | | | | 6.3 | | | | | 18,233,316 | |
Michigan | | | | 4.9 | | | | | 14,306,326 | |
North Carolina | | | | 4.6 | | | | | 13,328,538 | |
Virginia | | | | 4.2 | | | | | 12,149,837 | |
Pennsylvania | | | | 4.0 | | | | | 11,477,520 | |
Alaska | | | | 3.7 | | | | | 10,595,219 | |
Ohio | | | | 3.5 | | | | | 10,281,981 | |
New York | | | | 2.9 | | | | | 8,351,576 | |
Minnesota | | | | 2.8 | | | | | 8,074,518 | |
Massachusetts | | | | 2.6 | | | | | 7,451,629 | |
Maryland | | | | 2.3 | | | | | 6,636,960 | |
New Mexico | | | | 2.2 | | | | | 6,299,055 | |
Oregon | | | | 2.1 | | | | | 6,052,620 | |
Arizona | | | | 1.6 | | | | | 4,545,823 | |
Mississippi | | | | 1.5 | | | | | 4,385,932 | |
Wisconsin | | | | 1.3 | | | | | 3,887,358 | |
Nevada | | | | 1.3 | | | | | 3,663,240 | |
Maine | | | | 1.2 | | | | | 3,440,087 | |
Louisiana | | | | 1.2 | | | | | 3,426,390 | |
Colorado | | | | 1.1 | | | | | 3,190,413 | |
District of Columbia | | | | 1.1 | | | | | 3,100,113 | |
Alabama | | | | 1.1 | | | | | 3,097,290 | |
Utah | | | | 0.9 | | | | | 2,615,680 | |
Indiana | | | | 0.8 | | | | | 2,439,050 | |
Oklahoma | | | | 0.8 | | | | | 2,362,240 | |
Missouri | | | | 0.8 | | | | | 2,261,940 | |
Kentucky | | | | 0.7 | | | | | 2,053,000 | |
Georgia | | | | 0.3 | | | | | 1,002,400 | |
| | | | | | | | | | |
TOTAL MUNICIPAL BONDS | | | | 90.3 | % | | | $ | 261,446,788 | |
U.S. TREASURY NOTES/BONDS | | | | 9.0 | % | | | | 25,928,715 | |
| | | | | | | | | | |
TOTAL INVESTMENTS | | | | 99.3 | % | | | $ | 287,375,503 | |
| | | | | | | | | | |
See Notes to Financial Statements.
THE GLENMEDE PORTFOLIOS
Notes to Financial Statements
| 1. | | Organization and Significant Accounting Policies |
The Glenmede Portfolios (the “Fund”) is an investment company that was organized as a Massachusetts business trust on March 3, 1992, and is registered with the Securities and Exchange Commission (the “SEC”) under the Investment Company Act of 1940, as amended (the “1940 Act”), as an open-end management investment company. As of October 31, 2018, the Fund offered shares of one sub-trust, the Muni Intermediate Portfolio (the “Portfolio”). The Portfolio is classified as diversified.
The Fund is an investment company and follows accounting and reporting guidance in Financial Accounting Standards Board (“FASB”) Accounting Standards Codification (“ASC”) Topic 946 (“ASC 946”). The preparation of financial statements in conformity with accounting principles generally accepted in the United States of America (“U.S.”) including, but not limited to ASC 946, requires management to make estimates and assumptions that affect the reported amounts of assets and liabilities and disclosure of contingent assets and liabilities at the date of the financial statements and the reported amounts of revenues and expenses during the reporting period. Actual results could differ from those estimates, and the differences could be material. The following is a summary of significant accounting policies consistently followed by the Portfolio in the preparation of its financial statements.
Valuation of Securities: Municipal obligations for which market quotations are readily available are valued at the most recent quoted bid price provided by investment dealers, provided that municipal obligations may be valued on the basis of prices provided by a pricing service when such prices are determined by the investment advisor to reflect the fair market value of such municipal obligations. These valuations are typically categorized as Level 2 in the fair value hierarchy described below. When market quotations are not readily available or events occur that make established valuation methods unreliable, municipal obligations are valued in a manner which is intended to reflect their fair value as determined in accordance with procedures approved by the Board of Trustees of the Fund (the “Board”) and are typically categorized as Level 3 in the fair value hierarchy. The fair value of securities is generally determined as the amount that a Portfolio could reasonably expect to realize from an orderly disposition of such securities over a reasonable period of time. By its nature, a fair value price is a good faith estimate of the value of a security at a given point in time and does not reflect an actual market price, which may be different by a material amount. Debt obligations with maturities of 60 days or less at the time of purchase are valued on the basis of amortized cost and are typically categorized as Level 2 in the fair value hierarchy.
FASB ASC Topic 820, “Fair Value Measurements” defines fair value, establishes a three-level hierarchy for measuring fair value and expands disclosure about fair value measurements. The valuation hierarchy is based upon the transparency of inputs to the valuation of the Portfolio’s investments. Inputs refer broadly to the assumptions that market participants would use in pricing a security. Observable inputs are inputs that reflect the assumptions market participants would use in pricing the asset or liability based on market data obtained from sources independent of the reporting entity. Unobservable inputs are inputs that reflect the reporting entity’s own assumptions about the assumptions market participants would use in pricing the asset or liability based on the best information available in the circumstances. These inputs are summarized in the three levels listed below:
Level 1 — quoted prices in active markets for identical investments;
Level 2 — other significant observable inputs (including quoted prices for similar investments, interest rates, prepayment speeds, credit risk and others) or valuations based on quoted prices in markets that are not active; and
Level 3 — significant unobservable inputs (including the Fund’s own assumptions in determining the fair value of investments).
The inputs or methodology used for valuing securities are not necessarily an indication of the risks associated with investing in those securities.
Changes in valuation techniques may result in changing an investment’s assigned level within the hierarchy.
The Muni Intermediate Portfolio had all long-term investments, with corresponding states at Level 2 at October 31, 2018. For the fiscal year ended October 31, 2018, there were no transfers between Level 1 and 2.
Municipal Securities: The value of, payment of interest on, repayment of principal for, and the ability to sell a municipal security may be affected by constitutional amendments, legislation, executive orders, administrative regulations, voter initiatives and the economics of the regions in which the issuers are located. A credit rating downgrade, bond default, or bankruptcy involving an issuer within a particular state or territory could affect the market values and marketability of some or all of the municipal obligations of that state or territory.
Since many municipal securities are issued to finance similar projects, especially those relating to education, health care, transportation and utilities, conditions in those sectors can affect the overall municipal securities market and the Portfolio’s investments in municipal securities.
There is some risk that a portion or all of the interest received from certain tax-free municipal securities could become taxable as a result of determinations by the Internal Revenue Service.
Securities Transactions and Investment Income: Securities transactions are recorded as of the trade date. Realized gains and losses on investments sold are computed on the basis of identified cost. Interest income is recorded on the accrual basis and includes, when appropriate, amortization of premiums and accretion of discounts.
THE GLENMEDE PORTFOLIOS
Notes to Financial Statements — (Continued)
Securities purchased or sold on a when-issued or delayed-delivery basis may be settled after a period longer than the regular settlement time of trade date plus three business days. Interest income is accrued based on the terms of the security on settlement date. The Portfolio segregates assets with a current value at least equal to the amount of its when-issued purchase commitments. When-issued purchase commitments involve a risk of loss if the value of the security to be purchased declines prior to settlement date, or if the counterparty does not perform under the contract.
Dividends and Distributions to Shareholders: Dividends from net investment income, if any, are declared and paid monthly. The Portfolio distributes any net realized capital gains on an annual basis. Additional distributions of net investment income and capital gains for the Portfolio may be made at the discretion of the Board in order to avoid a non-deductible excise tax under Section 4982 of the Internal Revenue Code of 1986, as amended (the “Code”).
Income and capital gains distributions are determined in accordance with income tax regulations which may differ from accounting principles generally accepted in the U.S. These differences are primarily due to differing treatments of income and gains on various investment securities held by the Portfolio, timing differences and differing characterization of distributions made by the Portfolio.
Federal Income Taxes: The Portfolio intends to continue to qualify as a regulated investment company by complying with the requirements of the Code applicable to regulated investment companies, and by distributing substantially all of its tax-exempt (and taxable, if any) income to its shareholders. Therefore, no federal income tax provision is required. Income distributions and capital gains distributions are determined in accordance with income tax regulations which may differ from accounting principles generally accepted in the U.S.
“Accounting for Uncertainty in Income Taxes — an interpretation of FASB ASC 740” (“ASC 740”) clarifies the accounting for uncertainty in income taxes recognized in accordance with ASC 740, “Accounting for Income Taxes.” This interpretation prescribes a recognition threshold and measurement attribute for the financial statement recognition and measurement of a tax position taken or expected to be taken in a tax return. It also provides guidance on de-recognition, classification, interest and penalties, accounting in interim periods, disclosure and transition. The Portfolio’s federal tax returns filed in the 3-year period ended October 31, 2018 remain subject to examination by the Internal Revenue Service.
On October 31, 2018 , the tax year end of the Fund, the Portfolio had available capital loss carryforwards to be utilized in future periods to offset future capital gains as follows:
| | | | | | | | |
Portfolio | | Unlimited
(Short Term) | | | Unlimited
(Long Term) | |
Muni Intermediate Portfolio | | $ | 288,263 | | | $ | 117,564 | |
On December 22, 2010, the Regulated Investment Company Modernization Act of 2010 (the “Act”) was enacted. The Act modernizes several of the federal income and excise tax provisions related to regulated investment companies and, with certain exceptions, was effective for taxable years beginning after December 22, 2010. Among the changes made are changes to the capital loss carryforward rules allowing for capital losses to be carried forward indefinitely.
As of October 31, 2018, the tax year end of the Fund, the components of distributable earnings on a tax basis were as follows:
| | | | | | | | | | | | | | | | |
Portfolio | | Undistributed
Tax-exempt
Income | | | Unrealized
Appreciation/
(Depreciation) | | | Loss
Carryforwards | | | Total
Distributable
Earnings | |
Muni Intermediate Portfolio | | $ | 480,473 | | | $ | (3,243,479 | ) | | $ | (405,827 | ) | | $ | (3,168,833 | ) |
For the fiscal year ended October 31, 2018, the Portfolio’s components of distributable earnings on a tax basis were equal to the components of distributable earnings on a book basis. Such reclasses had no effect on net assets.
As of October 31, 2018, the tax characterization of distributions paid during the year was equal to the book characterization of distributions paid for the Portfolio and was as follows:
| | | | | | | | | | | | | | | | |
Portfolio | | Tax
Exempt | | | Ordinary
Income | | | Long-Term
Gains | | | Return of
Capital | |
Muni Intermediate Portfolio | | $ | 5,430,555 | | | $ | 146,828 | | | $ | — | | | $ | — | |
As of October 31, 2017, the tax characterization of distributions paid during the year was equal to the book characterization of distributions paid for the Portfolio and was as follows:
| | | | | | | | | | | | |
Portfolio | | Tax
Exempt | | | Ordinary
Income | | | Long-Term
Gains | |
Muni Intermediate Portfolio | | $ | 5,078,270 | | | $ | 65,715 | | | $ | 1,029,089 | |
THE GLENMEDE PORTFOLIOS
Notes to Financial Statements — (Continued)
As of October 31, 2018, aggregate gross unrealized appreciation for all securities in which there was an excess of value over tax cost and aggregate gross unrealized depreciation for all securities in which there was an excess of tax cost over value were as follows:
| | | | | | | | | | | | | | | | |
Portfolio | | Cost | | | Appreciation | | | (Depreciation) | | | Net | |
Muni Intermediate Portfolio | | $ | 290,618,982 | | | $ | 731,451 | | | $ | 3,974,930 | | | $ | (3,243,479 | ) |
Other: In the normal course of business, the Portfolio enters into contracts that may include agreements to indemnify another party under given circumstances. The Portfolio’s maximum exposure under these arrangements is unknown as this would involve future claims that may be, but have not yet been, made against the Portfolio. However, based on experience, the risk of material loss from such claims is considered to be remote.
| 2. | | Investment Advisory Fee, Administration Fee and Other Related Party Transactions |
Glenmede Investment Management LP (the “Advisor”), a wholly-owned subsidiary of The Glenmede Trust Company, N.A. (“Glenmede Trust”), serves as investment advisor to the Portfolio, pursuant to an investment management agreement with the Portfolio. Under this agreement, the Advisor manages the Portfolio, subject to the general supervision of the Board.
The Portfolio does not pay a management fee for advisory services. The investors in the Portfolio are the clients of Glenmede Trust or its affiliated companies (“Affiliates”). Glenmede Trust or its Affiliates charge a fee directly to their clients for fiduciary, trust and/or advisory services. The actual annual fees charged vary dependent on a number of factors, including the particular services provided to the client, and are generally 1.25% or less of the clients’ assets under management.
The Portfolio pays Glenmede Trust shareholder servicing fees at the annual rate of 0.15% of the Portfolio’s average daily net assets.
State Street Bank and Trust Company (“State Street”) serves as administrator, transfer agent, dividend-paying agent and custodian with respect to the Portfolio. The Portfolio pays State Street a fee based on the combined aggregate average daily net assets of the Portfolio and The Glenmede Fund, Inc., an affiliated registered investment company, plus transaction charges for certain transactions and out-of-pocket expenses. The fee is computed daily and paid monthly.
Foreside Fund Officer Services, LLC (formerly known as Foreside Compliance Services, LLC) is paid an annual fee plus out-of-pocket expenses for the provision of personnel and services related to the Fund’s compliance program. The Fund’s Chief Compliance Officer is a Director of Foreside Financial Services, LLC.
Quasar Distributors, LLC (“Quasar”) serves as distributor of the Portfolio’s shares. The distributor receives no fees from the Fund in connection with distribution services provided to the Fund. The Advisor pays Quasar’s fees and out-of-pocket expenses for the distribution services it provides to the Portfolio.
The Portfolio pays each Board member an annual fee of $6,000 and out-of-pocket expenses incurred in attending Board meetings.
Expenses for the fiscal year ended October 31, 2018 include legal fees paid to Drinker Biddle & Reath LLP as legal counsel to the Fund and the independent Trustees. A partner of the law firm is Secretary of the Fund.
| 3. | | Purchases and Sales of Securities |
For the fiscal year ended October 31, 2018, the cost of purchases and proceeds from sales of investment securities other than U.S. government securities and short-term securities were:
| | | | | | | | |
Portfolio | | Purchases | | | Sales | |
Muni Intermediate Portfolio | | $ | 90,442,083 | | | $ | 112,449,552 | |
THE GLENMEDE PORTFOLIOS
Notes to Financial Statements — (Concluded)
| 4. | | Shares of Beneficial Interest |
The Portfolio may issue an unlimited number of shares of beneficial interest with a $.001 par value. Changes in shares of beneficial interest outstanding were as follows:
| | | | | | | | | | | | | | | | |
| | | Year Ended
10/31/18 | | | Year Ended
10/31/17 | |
| | | Shares | | | Amount | | | Shares | | | Amount | |
Muni Intermediate Portfolio | | | | | | | | | | | | | | | | |
Sold | | | 5,096,672 | | | $ | 55,280,588 | | | | 7,318,662 | | | $ | 79,726,233 | |
Issued as reinvestment of dividends | | | — | | | | — | | | | 97,275 | | | | 1,046,674 | |
Redeemed | | | (5,741,062 | ) | | | (62,226,525 | ) | | | (9,708,525 | ) | | | (105,481,540 | ) |
| | | | | | | | | | | | | | | | |
Net Decrease | | | (644,390 | ) | | $ | (6,945,937) | | | | (2,292,588 | ) | | $ | (24,708,633) | |
| | | | | | | | | | | | | | | | |
As of October 31, 2018, Glenmede Trust, on behalf of its clients, holds of record and has voting and/or investment authority over substantially all of the Portfolio’s outstanding shares. The Portfolio had no shareholders that beneficially owned 5% of the shares outstanding of the Portfolio as of October 31, 2018.
| 5. | | Recently Issued Accounting Pronouncements |
In March 2017, the FASB issued Accounting Standards Update (“ASU”) 2017-08 (“ASU 2017-08”), Receivables — Nonrefundable Fees and Other Costs (Subtopic 310-20): Premium Amortization on Purchased Callable Debt Securities, which amends the amortization period for certain purchased callable debt securities. Under ASU 2017-08, the premium amortization of purchased callable debt securities that have explicit, non-contingent call features and are callable at fixed prices will be amortized to the earliest call date. ASU 2017-08 will be applied on a modified retrospective basis and is effective for fiscal years, and their interim periods, beginning after December 15, 2018. Management is currently evaluating the impact of this guidance to the Funds.
Management has evaluated events and transactions subsequent to October 31, 2018 through the date the financial statements were available to be issued, for disclosure in the Fund’s financial statements and has determined that there were no material events that would require additional disclosure.
REPORT OF INDEPENDENT REGISTERED PUBLIC ACCOUNTING FIRM
To the Board of Trustees of The Glenmede Portfolios and Shareholders of Muni Intermediate Portfolio
Opinion on the Financial Statements
We have audited the accompanying statement of assets and liabilities, including the schedule of portfolio investments, of Muni Intermediate Portfolio (constituting The Glenmede Portfolios, hereafter referred to as the “Portfolio”) as of October 31, 2018, the related statement of operations for the year ended October 31, 2018, the statements of changes in net assets for each of the two years in the period ended October 31, 2018, including the related notes, and the financial highlights for each of the five years in the period ended October 31, 2018 (collectively referred to as the “financial statements”). In our opinion, the financial statements present fairly, in all material respects, the financial position of the Portfolio as of October 31, 2018, the results of its operations for the year then ended, the changes in its net assets for each of the two years in the period ended October 31, 2018 and the financial highlights for each of the five years in the period ended October 31, 2018 in conformity with accounting principles generally accepted in the United States of America.
Basis for Opinion
These financial statements are the responsibility of the Portfolio’s management. Our responsibility is to express an opinion on the Portfolio’s financial statements based on our audits. We are a public accounting firm registered with the Public Company Accounting Oversight Board (United States) (“PCAOB”) and are required to be independent with respect to the Portfolio in accordance with the U.S. federal securities laws and the applicable rules and regulations of the Securities and Exchange Commission and the PCAOB.
We conducted our audits of these financial statements in accordance with the standards of the PCAOB. Those standards require that we plan and perform the audit to obtain reasonable assurance about whether the financial statements are free of material misstatement, whether due to error or fraud.
Our audits included performing procedures to assess the risks of material misstatement of the financial statements, whether due to error or fraud, and performing procedures that respond to those risks. Such procedures included examining, on a test basis, evidence regarding the amounts and disclosures in the financial statements. Our audits also included evaluating the accounting principles used and significant estimates made by management, as well as evaluating the overall presentation of the financial statements. Our procedures included confirmation of securities owned as of October 31, 2018 by correspondence with the custodian and brokers; when replies were not received from brokers, we performed alternative procedures. We believe that our audits provide a reasonable basis for our opinion.
Boston, Massachusetts
December 21, 2018
We have served as the auditor of one or more investment companies in the Glenmede family of funds since 1988.
THE GLENMEDE FUND, INC.
THE GLENMEDE PORTFOLIOS
Tax Information (Unaudited)
For the fiscal year ended October 31, 2018
Of the ordinary distributions made during the fiscal year ended October 31, 2018, the following percentages have been derived from investments in U.S. Government and Agency Obligations. All or a portion of the distributions from this income may be exempt from taxation at the state level. Consult your tax advisor for state specific information.
| | | | |
Core Fixed Income Portfolio | | | 52.70% | |
Of the ordinary distributions made during the fiscal year ended October 31, 2018, the following percentages qualify for the dividends received deduction available to corporate shareholders:
| | | | |
Quantitative U.S. Large Cap Core Equity Portfolio | | | 100% | |
Quantitative U.S. Large Cap Growth Equity Portfolio | | | 100% | |
Quantitative U.S. Large Cap Value Equity Portfolio | | | 100% | |
Quantitative U.S. Small Cap Equity Portfolio | | | 100% | |
Responsible ESG U.S. Equity Portfolio | | | 100% | |
Women in Leadership U.S. Equity Portfolio | | | 100% | |
Quantitative U.S. Total Market Equity Portfolio | | | 100% | |
Strategic Equity Portfolio | | | 100% | |
Small Cap Equity Portfolio | | | 70.05% | |
Mid Cap Equity Portfolio | | | 100% | |
Large Cap Value Portfolio | | | 87.5% | |
Equity Income Portfolio | | | 94.18% | |
Secured Options Portfolio | | | 1.31% | |
Short Term Tax Aware Fixed Income Portfolio | | | 12.03% | |
The above figures may differ from those cited elsewhere in this report due to differences in the calculation of income and gains for Securities and Exchange Commission (book) purposes and Internal Revenue Service (tax) purposes.
Foreign Taxes Paid or Withheld
| | | | |
Portfolio | | Total | |
Quantitative International Equity Portfolio | | $ | 1,344,532 | |
The foreign taxes paid or withheld per share represent taxes incurred by the Fund on interest and dividends received by the Fund from foreign sources. Foreign taxes paid or withheld should be included in taxable income with an offsetting deduction from gross income or as a credit for taxes paid to foreign governments. Consult your tax advisor regarding the appropriate treatment of foreign taxes paid.
The Fund is required by the Code to advise shareholders within 60 days of the Fund’s fiscal year end (October 31, 2018) as to the federal tax status of dividends paid by the Fund during such fiscal year. Accordingly, the Fund paid long-term capital gain distributions of:
| | | | |
Quantitative U.S. Large Cap Core Equity Portfolio | | $ | 111,721,370 | |
Quantitative U.S. Large Cap Growth Equity Portfolio | | $ | 73,196,841 | |
Responsible ESG U.S. Equity Portfolio | | $ | 62,301 | |
Women in Leadership U.S. Equity Portfolio | | $ | 84,949 | |
Quantitative U.S. Total Market Equity Portfolio | | $ | 2,233,678 | |
Strategic Equity Portfolio | | $ | 13,725,891 | |
Small Cap Equity Portfolio | | $ | 334,339,639 | |
Large Cap Value Portfolio | | $ | 3,556,789 | |
Equity Income Portfolio | | $ | 79 | |
Secured Options Portfolio | | $ | 32,671,135 | |
Core Fixed Income Portfolio | | $ | 1,755,129 | |
Qualified dividend income (“QDI”) received through October 31, 2018, that qualified for a reduced tax rate pursuant to the Code Section 1 (h)(11) are as follows:
| | | | |
Quantitative U.S. Large Cap Core Equity Portfolio | | $ | 29,331,979 | |
Quantitative U.S. Large Cap Growth Equity Portfolio | | $ | 21,319,668 | |
Quantitative U.S. Large Cap Value Equity Portfolio | | $ | 12,152 | |
Quantitative U.S. Small Cap Equity Portfolio | | $ | 3,800 | |
Quantitative International Equity Portfolio | | $ | 8,716,752 | |
THE GLENMEDE FUND, INC.
THE GLENMEDE PORTFOLIOS
Tax Information (Unaudited) — (Concluded)
For the fiscal year ended October 31, 2018
| | | | |
Responsible ESG U.S. Equity Portfolio | | $ | 140,449 | |
Women in Leadership U.S. Equity Portfolio | | $ | 138,167 | |
Quantitative U.S. Total Market Equity Portfolio | | $ | 272,471 | |
Strategic Equity Portfolio | | $ | 1,954,304 | |
Small Cap Equity Portfolio | | $ | 8,032,428 | |
Mid Cap Equity Portfolio | | $ | 63,157 | |
Large Cap Value Portfolio | | $ | 1,838,777 | |
Equity Income Portfolio | | $ | 342,890 | |
Secured Options Portfolio | | $ | 249,808 | |
Global Secured Options Portfolio | | $ | 90,563 | |
Short Term Tax Aware Fixed Income Portfolio | | $ | 7,050 | |
Qualified interest income (“QII”) received through October 31, 2018, that qualified for a reduced tax rate pursuant to the Code Section 871 (k) are as follows:
| | | | |
Secured Options Portfolio | | | 85.31% | |
Core Fixed Income Portfolio | | | 8.46% | |
Of the dividends paid by the High Yield Municipal Portfolio, Short Term Tax Aware Fixed Income Portfolio and Muni Intermediate Portfolio from net investment income for the fiscal year ended October 31, 2018, 97.66%, 78.53% and 97.37%, respectively is tax-exempt for regular Federal income taxes.
THE GLENMEDE FUND, INC.
THE GLENMEDE PORTFOLIOS
BOARD MEMBERS AND OFFICERS TABLE (Unaudited)
The information pertaining to the Board of Directors of The Glenmede Fund, Inc. and the Board of Trustees of The Glenmede Portfolios (collectively, the “Funds”) and their respective officers is set forth below. The Statement of Additional Information includes additional information about the Funds’ Directors/Trustees and is available without charge, upon request, by calling 1-800-442-8299. Each Director/Trustee holds office until the earliest of (i) the next meeting of shareholders, if any, called for the purpose of considering the election or re-election of such Director/Trustee and until the election and qualification of his/her successor, if any, elected at such meeting, or (ii) the date he or she dies, resigns or retires, or is removed by the applicable Board or shareholders. Each officer is elected by the applicable Board and holds office for the term of one year and until his or her successor is duly elected and qualified, or until he or she dies, resigns, is removed, or becomes disqualified. The address of each Board member is c/o State Street Bank and Trust Company, 100 Summer Street, Floor 7, SUM0703, Boston, MA 02110, Attention: Fund Administration Legal Department.
| | | | | | | | | | | | |
Independent Directors/Trustees(1) | |
Name and Age | | Positions Held with the Funds/Time Served | | Principal Occupations(s) During Past 5 Years | | Number of
Portfolios in Fund
Complex Overseen
by Director/Trustee | | | Other
Directorships
Held by
Director/
Trustee | |
| | | | |
H. Franklin Allen, Ph.D. Age: 62 | | Director of Glenmede Fund (since March 1991) and Trustee of Glenmede Portfolios (since May 1992) | | Professor of Finance and Economics and Director of the Brevan Howard Centre for Financial Analysis at Imperial College London (since 2014); Professor Emeritus of Finance, The Wharton School of The University of Pennsylvania since June 2016; Professor of Finance and Economics (1990-1994); Vice Dean and Director of Wharton Doctoral Programs (1990-1993). Employed by The University of Pennsylvania (from 1980-2016). | | | 20 | | | | None | |
| | | | |
William L. Cobb, Jr. Age: 71 | | Director of Glenmede Fund and Trustee of Glenmede Portfolios (since February 2007) | | Former Executive Vice President and Former Chief Investment Officer, The Church Pension Fund (defined benefit plan for retired clergy of the Episcopal Church) (1999-2014); Chair and Member, Investment Committee, The Minister and Missionaries Benefit Board of the American Baptist Church (until 2013); Vice Chairman, J.P. Morgan Investment Management (1994-1999). | | | 20 | | |
| Director, TCW
Direct Lending LLC |
|
| | | | |
Gail E. Keppler Age: 72 | | Director of Glenmede Fund and Trustee of Glenmede Portfolios (since February 2007) | | Former Co-CEO/COO TVG, Inc. (pharmaceutical marketing consulting) (1992-2002); Former Board Member, Laurel House; Former Division President and Board Member, Burke Marketing Services, Inc.; Former Board member Cape May County Habitat for Humanity. | | | 20 | | | | None | |
THE GLENMEDE FUND, INC.
THE GLENMEDE PORTFOLIOS
BOARD MEMBERS AND OFFICERS TABLE (Unaudited) — (Continued)
| | | | | | | | | | | | |
| Independent Directors/Trustees(1) — (Continued) | |
Name and Age | | Positions Held with the Funds/Time Served | | Principal Occupations(s) During Past 5 Years | | Number of
Portfolios in Fund
Complex Overseen
by Director/Trustee | | | Other
Directorships
Held by
Director/
Trustee | |
| | | | |
Harry Wong Age: 70 | | Director of Glenmede Fund and Trustee of Glenmede Portfolios (since February 2007) | | Former Managing Director, Knight Capital Americas, L.P., an operating subsidiary of Knight Capital Group Inc. (investment banking) (2009-2011); Managing Director, Long Point Advisors, LLC (business consulting) (2003-2012); Managing Director, BIO-IB LLC (healthcare investment banking) (2004-2009); Senior Managing Director, ABN AMRO (investment banking) (1990-2002); Adjunct Faculty Member, Sacred Heart University (2003-2007). | | | 20 | | | | None | |
| (1) | Independent Directors/Trustees are those Directors/Trustees who are not “interested persons” of the Funds as defined in the 1940 Act. |
THE GLENMEDE FUND, INC.
THE GLENMEDE PORTFOLIOS
BOARD MEMBERS AND OFFICERS TABLE (Unaudited) — (Continued)
| | | | | | | | | | | | |
| Interested Directors/Trustees(2) | |
Name and Age | | Positions Held with the Funds/Time Served | | Principal Occupation(s) During Past 5 Years | | Number of
Portfolios in Fund
Complex Overseen
by Director/Trustee | | | Other
Directorships
Held by
Director/
Trustee | |
| | | | |
Susan W. Catherwood(2) Age: 75 | | Director of Glenmede Fund and Trustee of Glenmede Portfolios (since February 2007) | | Director (since 1988) and Member of the Investment Review/Relationship Oversight Committee (since 2001), Compensation Committee (since 1993) and Nominating Committee (since 2018), Glenmede Trust; Director, The Glenmede Corporation (since 1988); Board Member, The Pew Charitable Trusts; Charter Trustee, The University of Pennsylvania; Chairman Emeritus, The University Museum of The University of Pennsylvania; Chairman of the Board of Managers, The Christopher Ludwick Foundation; Director: Thomas Skelton Harrison Foundation and The Catherwood Foundation; Fellow and serves on Finance and Investment Committees, and former Board member, College of Physicians of Philadelphia; Former Member and Chair, The Women’s Committee and Penn Museum Board of Overseers of the University of Pennsylvania. | | | 20 | | | | None | |
| | | | |
G. Thompson Pew, Jr.(2) Age: 76 | | Director of Glenmede Fund (since October 1988) and Trustee of Glenmede Portfolios (since May 1992) Chairman of the Funds (since June 2006) | | Director (since 2013) of The Glenmede Corporation; Director, Member of the Relationship Oversight Committee, Private Equity/Real Estate Advisory Committee (until 2013), and the Compensation Committee, Chairman of the Nominating Committee (since 2018), Glenmede Trust; Former Director, Brown & Glenmede Holdings, Inc.; Former Co-Director, Principal and Officer, Philadelphia Investment Banking Co.; Former Director and Officer, Valley Forge Administrative Services Company. | | | 20 | | | | None | |
| (2) | Interested Directors/Trustees are those Directors/Trustees who are “interested persons” of the Funds as defined in the 1940 Act. Susan W. Catherwood and G. Thompson Pew, Jr., are considered to be “interested” Directors/Trustees of the Funds because of their affiliations with Glenmede Trust, the parent company of the Funds’ investment advisor, GIM, and their stock ownership in The Glenmede Corporation, of which GIM is an affiliate. |
THE GLENMEDE FUND, INC.
THE GLENMEDE PORTFOLIOS
BOARD MEMBERS AND OFFICERS TABLE (Unaudited) — (Concluded)
| | | | |
| Officers |
Name, Address and Age | | Positions Held with the Funds/Time Served | | Principal Occupation(s) During Past 5 Years |
| | |
Mary Ann B. Wirts 1650 Market Street, Suite 1200 Philadelphia, PA 19103 Age: 67 | | President of the Funds since December 1997. | | Managing Director and Chief Administrative Officer of Glenmede Trust. Managing Director and Chief Administrative Officer of Glenmede Investment Management LP (since 2006). First Vice President and Managing Director of Fixed Income of Glenmede Advisers
(2000-2006). Employed by Glenmede Trust since 1982 |
| | |
Kimberly C. Osborne 1650 Market Street, Suite 1200 Philadelphia, PA 19103 Age: 52 | | Executive Vice President of the Funds since December 1997. | | Client Service Manager of Glenmede Investment Management LP (since 2006). Vice President of Glenmede Trust and Glenmede Advisers until 2008. Employed by Glenmede Trust 1993-2008 and Glenmede Advisers 2000-2008. |
| | |
Kent E. Weaver 1650 Market Street, Suite 1200 Philadelphia, PA 19103 Age: 51 | | Treasurer of the Funds since September 2015. | | Director of Client Service of Glenmede Investment Management LP (since July 2015); Former Director of Client Service and Sales, Chief Compliance Officer of Philadelphia International Advisors, LP (2002-June 2015). |
| | |
Michael P. Malloy One Logan Square, Suite 2000 Philadelphia, PA 19103- 6996 Age: 59 | | Secretary of the Funds since January 1995. | | Partner in the law firm of Drinker Biddle & Reath LLP. |
| | |
Chris E. McGuire 1 Iron Street Boston, MA 02210 Age: 45 | | Assistant Treasurer of the Funds since December 2014. | | Managing Director, State Street Bank and Trust Company (since 2007). |
| | |
Eimile J. Moore 690 Taylor Road, Suite 210 Columbus, OH 43230 Age: 49 | | Chief Compliance Officer of the Funds since December 2017 | | Managing Director, Foreside Financial Services, LLC (since 2011); Vice President/Business Manager, JP Morgan Distribution Services, Inc. (2006-2011). |
| | |
Bernard J. Brick 100 Summer Street, Floor 7 Boston, MA 02110 Age: 44 | | Assistant Secretary of the Funds since December 2013. | | Vice President and Counsel, State Street Bank and Trust Company (2011-present). |
THE GLENMEDE FUND, INC.
THE GLENMEDE PORTFOLIOS
(Unaudited)
Proxy Voting
A description of the policies and procedures that the Funds’ investment advisor and sub-advisor use to vote proxies relating to the Funds’ portfolio securities is available, without charge, upon request, by calling 1-800-442-8299, and on the Securities and Exchange Commission’s (the “SEC”) website at http://www.sec.gov.
Information regarding how the Funds voted proxies relating to portfolio securities during the most recent 12-month period ended June 30 is available, without charge, upon request, by calling 1-800-442-8299, and on the SEC’s website at http://www.sec.gov.
Quarterly Portfolio Holdings
The Funds file their complete schedule of portfolio holdings of each Portfolio with the SEC for the first and third quarter of each fiscal year on Form N-Q. The Funds’ Forms N-Q are available on the SEC’s website at http://www.sec.gov. The Funds’ Forms N-Q are also available, upon request, by calling 1-800-442-8299 or at www.glenmedeim.com.
Boards of Directors/Trustees — Considerations Regarding Investment Advisory Agreements and Sub-Investment Advisory Agreement
At a meeting held on September 18, 2018, the Board of Directors of Glenmede Fund and the Board of Trustees of Glenmede Portfolios (collectively, the “Boards”) renewed the Investment Advisory Agreements and Sub-Advisory Agreement for each Portfolio of the Funds that were expiring on October 31, 2018.
In determining whether to renew the Investment Advisory Agreements and Sub-Advisory Agreement (collectively, the “Agreements”), the Boards, including all of the Directors/Trustees who are not interested persons under the Investment Company Act of 1940, as amended (the “Independent Directors/Trustees”), reviewed and considered, among other items: (1) a memorandum from independent counsel setting forth the Boards’ fiduciary duties, responsibilities and the factors the Boards should consider in their evaluation of the Agreements; (2) reports prepared by an independent rating and ranking organization and charts prepared by the Advisor and Capital Guardian Trust Company (“Capital”), the sub-advisor to the High Yield Municipal Portfolio comparing the performance of each Portfolio it advises or sub-advises, as applicable, to the performance of its applicable benchmark index and relevant peer group; (3) a Broad-ridge Financial Solutions, Inc. (“Broadridge”) report comparing each Portfolio’s advisory fees, if any, and expenses to those of its relevant peer group; and (4) reports and presentations by representatives of the Advisor and Capital that described: (i) the nature, extent and quality of the Advisor’s services provided to its Portfolios; (ii) the nature, extent and quality of Capital’s sub-advisory services provided to the High Yield Municipal Portfolio; (iii) the experience and qualifications of the personnel providing those services; (iv) their organizational structures, financial information, insurance coverage and Forms ADV; (v) their investment philosophies and processes; (vi) their assets under management and client descriptions; (vii) the Advisor’s soft dollar commission policy, including information on the types of research and services obtained in connection with soft dollar commissions and the Advisor’s and Capital’s trade allocation policies; (viii) the current advisory fee arrangements with those Portfolios that charge advisory fees; (ix) the contractual fee and expense waivers in effect for the Quantitative U.S. Long/Short Equity Portfolio, Mid Cap Equity Portfolio, Quantitative International Equity Portfolio, Equity Income Portfolio, High Yield Municipal Portfolio, Women in Leadership U.S. Equity Portfolio, Responsible ESG U.S. Equity Portfolio, Short Term Tax Aware Fixed Income Portfolio and Quantitative U.S. Total Market Equity Portfolio; (x) the advisory fee arrangements with the Advisor’s other similarly managed clients, if any, and Capital’s affiliate’s similarly managed fund; (xi) their compliance processes and conflicts of interest assessments; (xii) the Advisor’s profitability analyses related to providing services to the Portfolios; (xiii) Capital’s assessment that since the High Yield Municipal Portfolio was a small portion of its assets under management and Capital’s overall profitability, that it would not be meaningful to extrapolate revenue and expenses on an individual fund or account basis; and (xiv) the extent to which economies of scale are relevant to the Portfolios. The Directors/Trustees considered the written materials, the Advisor’s and Capital’s presentations, the Funds’ Chief Compliance Officer’s quarterly reports, and deliberated on the Agreements in light of this information together with information provided to the Directors/Trustees over the course of the year. In their deliberations, the Directors/Trustees did not identify any single piece of information that was all- important or controlling.
The Boards, including all of the Independent Directors/Trustees, reached the following conclusions, among others, regarding the Advisor and Capital and their respective Agreements: the Advisor and Capital each has the capabilities, resources and personnel necessary to manage their respective Portfolio(s) and the Advisor has the capabilities, resources and personnel necessary to oversee the management of Capital as sub-advisor to the High Yield Municipal Portfolio; the Boards are satisfied with the quality of services provided by the Advisor in advising its Portfolios and Capital in sub-advising the High Yield Municipal Portfolio; the advisory fees for each Portfolio that pays an advisory fee are reasonable as compared to the fees paid by comparable mutual funds; the advisory fees are reasonable as compared to the Advisor’s similarly-managed separate account clients; and the sub-advisory fee is reasonable as compared to Capital’s affiliates’ other similarly-managed sub-advised mutual fund. The Glenmede Fund Board also concluded that the advisory fees charged by the Advisor are based on services that are in addition to, rather than duplicative of, the services provided under the advisory contracts of exchange traded funds in which the Portfolios may invest.
THE GLENMEDE FUND, INC.
THE GLENMEDE PORTFOLIOS
(Unaudited) — (Concluded)
The Boards also concluded that based on the information provided, the total annual portfolio operating expenses paid by each Portfolio are reasonable. The Boards also concluded that the performance of the Portfolios are generally mixed as compared with their applicable benchmark indices and other mutual funds in their peer groups.
The Boards also concluded that the profit to the Advisor for advisory services to the Portfolios seems reasonable; and the Glenmede Fund Board concluded that Capital’s profitability for providing services to the High Yield Municipal Portfolio was not a material factor in determining whether or not to renew the Sub- Advisory Agreement for the High Yield Municipal Portfolio; and the benefits derived by the Advisor from managing the Portfolios, including how the Advisor uses soft dollars and selects brokers, and the ways in which it conducts portfolio transactions, seem reasonable. The Glenmede Board concluded that consideration of Capital’s use of soft dollars was not relevant because based on the information provided, Capital does not use soft dollars in sub-advising the High Yield Municipal Portfolio. The Boards noted that since the investment advisory fees do not have breakpoints, there would be no economies of scale for those fees as the Portfolios’ assets increase. With respect to its evaluation of the High Yield Municipal Portfolio’s sub-advisory fee, economies of scale were not considered relevant because the sub-advisory fee is paid by the Advisor, not the High Yield Municipal Portfolio nor its shareholders, and therefore has no impact on the High Yield Municipal Portfolio’s expense ratio.
Based upon each Board’s deliberations and evaluation of the information described above, the Directors/Trustees, including all of the Independent Directors/Trustees, determined that the terms of each Investment Advisory Agreement and the Sub-Advisory Agreement were reasonable and fair to the respective Portfolios and their shareholders.
The Glenmede Fund, Inc. and The Glenmede Portfolios
Investment Advisor
Glenmede Investment Management LP
One Liberty Place
1650 Market Street, Suite 1200
Philadelphia, Pennsylvania 19103
Administrator
State Street Bank and Trust Company
One Lincoln Street
Boston, Massachusetts 02111
Custodian
State Street Bank and Trust Company
One Lincoln Street
Boston, Massachusetts 02111
Legal Counsel
Drinker Biddle & Reath LLP
One Logan Square
Suite 2000
Philadelphia, Pennsylvania 19103-6996
Distributor
Quasar Distributors, LLC
615 East Michigan Street
Milwaukee, Wisconsin 53202
Independent Auditors
PricewaterhouseCoopers LLP
101 Seaport Boulevard
Boston, MA 02210
Investment Sub-Advisor
(for High Yield Municipal Portfolio)
Capital Guardian Trust Company
333 South Hope Street
Los Angeles, California 90071
The report is submitted for the general information of the shareholders of The Glenmede Fund, Inc. and The Glenmede Portfolios. It is not authorized for distribution to prospective investors unless accompanied or preceded by an effective prospectus for the Funds, which contain information concerning the Fund’s investment policies and expenses as well as other pertinent information.
Item 2. Code of Ethics.
As of October 31, 2018, the Registrant has adopted a code of ethics that applies to the Registrant’s President and Treasurer (Principal Executive Officer and Principal Financial Officer). For the year ended October 31, 2018, there were no amendments to a provision of its code of ethics, nor were there any waivers, including implicit waivers granted from a provision of the code of ethics. A copy of the Registrant’s code of ethics is filed with the Form N-CSR under Item 13(a)(1).
Item 3. Audit Committee Financial Expert.
The Registrant’s Board of Directors has determined that the Registrant has at least one audit committee financial expert serving on its audit committee. The audit committee financial expert serving on the Registrant’s audit committee is Harry Wong, who is “independent” as defined in Item 3(a)(2) of this Form.
Item 4. Principal Accountant Fees and Services.
| | (a) | Audit Fees – The aggregate fees billed for each of the last two fiscal years for professional services rendered by the principal accountant for the audit of the Registrant’s annual financial statements or services that are normally provided by the accountant in connection with statutory and regulatory filings or engagements for those fiscal years were $460,687 and $496,582 for the fiscal years ended October 31, 2017 and October 31, 2018, respectively. |
| | (b) | Audit-Related Fees – There were no fees billed for the fiscal years ended October 31, 2017 and October 31, 2018 for assurance and related services by the principal accountant that are reasonably related to the performance of the audit of the Registrant’s financial statements and are not reported under (a) of this Item. |
| | (c) | Tax Fees – The aggregate fees billed in each of the last two fiscal years for professional services rendered by the principal accountant for the review of the Registrant’s tax returns, other tax-related filings, excise tax calculations and final income distributions for liquidating funds were $92,190 and $100,400 for the fiscal years ended October 31, 2017 and October 31, 2018, respectively. |
| | (d) | All Other Fees – The aggregate fees billed for professional services rendered by the principal accountant for the review of a Form N-1A filing in connection with the change in name and investment strategy a fund were $3,000 for the fiscal year ended October 31, 2017. There were no other fees billed for the fiscal year ended October 31, 2018 for products and services provided by the principal accountant, other than the services reported in (a) through (c) of this Item. |
| | (e) | (1) The Registrant’s audit committee pre-approves all audit and non-audit services to be performed by the Registrant’s accountant before the accountant is engaged by the Registrant to perform such services. |
(2) There were no services described in (b) through (d) above (including services required to be approved by the audit committee pursuant to paragraph (c)(7)(ii) of Rule 2-01 of Regulation S-X) that were approved by the audit committee pursuant to paragraph (c)(7)(i)(C) of Rule 2-01 of Regulation S-X.
| | (f) | None of the hours expended on the principal accountant’s engagement to audit the Registrant’s financial statements for the fiscal year ended October 31, 2018 were attributable to work performed by persons other than the principal accountant’s full-time, permanent employees. |
| | (g) | The aggregate non-audit fees and services billed by the Registrant’s accountant for each of the last two fiscal years were $95,190 and $100,400 for the fiscal years ended October 31, 2017 and October 31, 2018, respectively, as described above. |
Item 5. Audit Committee of Listed Registrants.
Not applicable.
Item 6. Investments.
(a) Schedules of Investments in securities of unaffiliated issuers as of the close of the reporting period are included as part of the report to shareholders filed under Item 1 of this form.
(b) Not applicable.
Item 7. Disclosure of Proxy Voting Policies and Procedures for Closed-End Management Investment Companies.
Not applicable.
Item 8. Portfolio Managers of Closed-End Investment Management Companies.
Not applicable.
Item 9. Purchases of Equity Securities by Closed-End Management Investment Company and Affiliated Purchasers.
Not applicable.
Item 10. Submission of Matters to a Vote of Security Holders.
There have been no material changes to the procedures by which the shareholders may recommend nominees to the Registrant’s Board of Directors.
Item 11. Controls and Procedures.
(a) The Registrant’s Principal Executive Officer and Principal Financial Officer have concluded that the Registrant’s disclosure controls and procedures (as defined in Rule 30a-3(c) under the Investment Company Act of 1940, as amended (the “1940 Act”) (17 CFR 270.30a-3(c))), are effective based on the evaluation of the Registrant’s disclosure controls and procedures as of a date within 90 days prior to the filing date of this report.
(b) There were no changes in the Registrant’s internal control over financial reporting (as defined in Rule 30a-3(d) under the 1940 Act (17 CFR 270.30a-3(d))), that occurred during the Registrant’s last fiscal quarter of the period covered by this report that have materially affected, or are reasonably likely to materially affect, the Registrant’s internal control over financial reporting.
Item 12. Disclosure of Securities Lending Activities for Closed-End Management Investment Companies.
(a) Not applicable.
(b) Not applicable.
Item 13. Exhibits.
(a)(1) Code of Ethics for the Registrant’s President and Treasurer (Principal Executive Officer and Principal Financial Officer) described in Item 2 is attached hereto.
(a)(2) Certifications of the Principal Executive Officer and Principal Financial Officer of the Registrant, as required by Rule 30a-2(a) under the 1940 Act (17 CFR 270.30a-2(a)), are attached hereto as Exhibit 99.CERT.
(a)(3) Not applicable.
(a)(4) Not applicable.
(b) Certifications pursuant to Section 906 of the Sarbanes-Oxley Act of 2002 as required by Rule 30a-2(b) under the 1940 Act (17 CFR 270.30a-2(b)), Rule 15d-14(b) under the Securities Exchange Act of 1934, as amended (17 CFR 240.15d-14(b)) and Section 1350 of Chapter 63 of Title 18 of the United States Code (18 U.S.C. 1350), are attached hereto as Exhibit 99.906CERT.
SIGNATURES
Pursuant to the requirements of the Securities Exchange Act of 1934 and the Investment Company Act of 1940, the Registrant has duly caused this report to be signed on its behalf by the undersigned, thereunto duly authorized.
| | | | |
| (Registrant) | | THE GLENMEDE FUND, INC. |
| | | | |
| |
| By (Signature and Title) | | /s/ Mary Ann B. Wirts |
| | Mary Ann B. Wirts President (Principal Executive Officer) |
Pursuant to the requirements of the Securities Exchange Act of 1934 and the Investment Company Act of 1940, this report has been signed below by the following persons on behalf of the Registrant and in the capacities and on the dates indicated.
| | | | |
| By (Signature and Title) | | /s/ Mary Ann B. Wirts |
| | Mary Ann B. Wirts President (Principal Executive Officer) |
| | | | |
| |
| | | /s/ Kent E. Weaver |
| | Kent E. Weaver Treasurer (Principal Financial Officer) |