UNITED STATES
SECURITIES AND EXCHANGE COMMISSION
Washington, D.C. 20549
FORM N-CSR
CERTIFIED SHAREHOLDER REPORT OF REGISTERED
MANAGEMENT INVESTMENT COMPANIES
Investment Company Act file number | 811-05624 |
|
Morgan Stanley Institutional Fund, Inc. |
(Exact name of registrant as specified in charter) |
|
522 Fifth Avenue, New York, New York | | 10036 |
(Address of principal executive offices) | | (Zip code) |
|
John H. Gernon 522 Fifth Avenue, New York, New York 10036 |
(Name and address of agent for service) |
|
Registrant’s telephone number, including area code: | 212 - 296-0289 | |
|
Date of fiscal year end: | December 31, 2013 | |
|
Date of reporting period: | December 31, 2013 | |
| | | | | | | | |
Item 1 - Report to Shareholders

Morgan Stanley Institutional Fund, Inc.
Insight Portfolio
Annual Report
December 31, 2013

Morgan Stanley Institutional Fund, Inc.
Annual Report — December 31, 2013
Shareholders' Letter | | | 2 | | |
Expense Example | | | 3 | | |
Investment Overview | | | 4 | | |
Portfolio of Investments | | | 6 | | |
Statement of Assets and Liabilities | | | 7 | | |
Statement of Operations | | | 8 | | |
Statements of Changes in Net Assets | | | 9 | | |
Financial Highlights | | | 10 | | |
Notes to Financial Statements | | | 13 | | |
Report of Independent Registered Public Accounting Firm | | | 19 | | |
Federal Tax Notice | | | 20 | | |
U.S. Privacy Policy | | | 21 | | |
Director and Officer Information | | | 24 | | |
This report is authorized for distribution only when preceded or accompanied by prospectuses of the Morgan Stanley Institutional Fund, Inc. To receive a prospectus and/or statement of additional information (SAI), which contains more complete information such as investment objectives, charges, expenses, policies for voting proxies, risk considerations, and describes in detail each of the Portfolio's investment policies to the prospective investor, please call toll free 1 (800) 548-7786. Please read the prospectuses carefully before you invest or send money.
Additionally, you can access portfolio information including performance, characteristics, and investment team commentary through Morgan Stanley Investment Management's website: www.morganstanley.com/im.
Market forecasts provided in this report may not necessarily come to pass. There is no guarantee that any sectors mentioned will continue to perform as discussed herein or that securities in such sectors will be held by the Portfolio in the future. There is no assurance that a Portfolio will achieve its investment objective. Portfolios are subject to market risk, which is the possibility that market values of securities owned by the Portfolio will decline and, therefore, the value of the Portfolio's shares may be less than what you paid for them. Accordingly, you can lose money investing in the Portfolio. Please see the prospectus for more complete information on investment risks.
1
Morgan Stanley Institutional Fund, Inc.
Annual Report — December 31, 2013
Shareholders' Letter (unaudited)
Dear Shareholders,
We are pleased to provide this Annual report, in which you will learn how your investment in Insight Portfolio (the "Portfolio") performed during the latest twelve-month period.
Morgan Stanley Investment Management is a client-centric, investor-led organization. Our global presence, intellectual capital, and breadth of products and services enable us to partner with investors to meet the evolving challenges of today's financial markets. We aim to deliver superior investment service and to empower our clients to make the informed decisions that help them reach their investment goals.
As always, we thank you for selecting Morgan Stanley Investment Management, and look forward to working with you in the months and years ahead.
Sincerely,

John H. Gernon
President and Principal Executive Officer
January 2014
2
Morgan Stanley Institutional Fund, Inc.
Annual Report — December 31, 2013
Expense Example (unaudited)
Insight Portfolio
As a shareholder of the Portfolio, you incur two types of costs: (1) transactional costs; and (2) ongoing costs, including advisory fees, administration fees, distribution and shareholder services fees and other Portfolio expenses. This example is intended to help you understand your ongoing costs (in dollars) of investing in the Portfolio and to compare these costs with the ongoing costs of investing in other mutual funds.
This example is based on an investment of $1,000 invested at the beginning of the six-month period ended December 31, 2013 and held for the entire six-month period.
Actual Expenses
The table below provides information about actual account values and actual expenses. You may use the information in this table, together with the amount you invested, to estimate the expenses that you paid over the period. Simply divide your account value by $1,000 (for example, an $8,600 account value divided by $1,000 = 8.6), then multiply the result by the number in the table under the heading entitled "Actual Expenses Paid During Period" to estimate the expenses you paid on your account during this period.
Hypothetical Example for Comparison Purposes
The table below provides information about hypothetical account values and hypothetical expenses based on the Portfolio's actual expense ratio and an assumed rate of return of 5% per year before expenses, which is not the Portfolio's actual return. The hypothetical account values and expenses may not be used to estimate the actual ending account balance or expenses you paid for the period. You may use this information to compare the ongoing costs of investing in the Portfolio and other funds. To do so, compare this 5% hypothetical example with the 5% hypothetical examples that appear in the shareholder reports of the other funds.
Please note that the expenses shown in the table are meant to highlight your ongoing costs only and do not reflect any transactional costs, such as sales charges (loads). Therefore, the information for each class in the table is useful in comparing ongoing costs only, and will not help you determine the relative total costs of owning different funds. In addition, if these transactional costs were included, your costs would have been higher.
| | | Beginning
Account
Value
7/1/13 | | Actual Ending
Account
Value
12/31/13 | | Hypothetical
Ending Account
Value | | Actual
Expenses
Paid
During
Period* | | Hypothetical
Expenses Paid
During Period* | | Net
Expense
Ratio
During
Period** | |
Insight Portfolio Class I | | $ | 1,000.00 | | | $ | 1,176.70 | | | $ | 1,019.91 | | | $ | 5.76 | | | $ | 5.35 | | | | 1.05 | % | |
Insight Portfolio Class A@ | | | 1,000.00 | | | | 1,174.40 | | | | 1,018.60 | | | | 7.18 | | | | 6.67 | | | | 1.31 | | |
Insight Portfolio Class L | | | 1,000.00 | | | | 1,171.70 | | | | 1,015.83 | | | | 10.18 | | | | 9.45 | | | | 1.86 | | |
* Expenses are calculated using each Portfolio Class' annualized net expense ratio (as disclosed), multiplied by the average account value over the period, and multiplied by 184/365 (to reflect the most recent one-half year period).
** Annualized.
@ Effective September 9, 2013, Class H shares were renamed Class A shares.
3
Morgan Stanley Institutional Fund, Inc.
Annual Report — December 31, 2013
Investment Overview (unaudited)
Insight Portfolio
The Insight Portfolio seeks long-term capital appreciation.
Performance
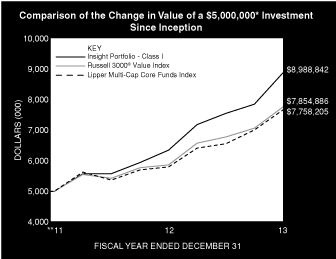
For the year ended December 31, 2013, the Portfolio had a total return based on net asset value and reinvestment of distributions per share of 40.20%, net of fees, for Class I shares. The Portfolio's Class I shares outperformed against its benchmark, the Russell 3000® Value Index (the "Index"), which returned 32.69% for the same period. Please keep in mind that high double-digit returns are highly unusual and cannot be sustained.
Factors Affecting Performance
• U.S. stocks turned in a strong performance for the year ended December 31, 2013. As in 2012, the expectation that accommodative monetary policy by the U.S. Federal Reserve (Fed) would continue for some time helped drive the prices of risky assets including stocks higher in 2013. However, as the U.S. economy began to look stronger, the Fed started signaling its intention to reduce the pace of its asset purchase program (known as quantitative easing or QE) if economic data warranted. Uncertainty as to the timing and magnitude of this tapering led to volatility across the capital markets. When the Fed unexpectedly left its QE program intact after its September meeting, stocks rallied strongly. The market's advance paused in October, disrupted by a partial government shutdown and political gridlock over whether to raise the debt ceiling, but resumed in the final months of the period on expectations — and later confirmation by the Fed — that QE tapering would begin in 2014.
• The consumer discretionary sector added the most to relative performance. Both stock selection and an overweight in the sector contributed to gains, led by a holding in a restaurant chain owner/operator.
• The energy sector also outperformed due to stock selection and an underweight there. A solar panel maker was the top-performing holding in the sector.
• No exposure to the utilities sector was advantageous, as the sector was the Index's weakest performer.
• Stock selection in the technology sector had a negative impact on performance, although an overweight in the sector was beneficial. Relative performance was hampered by the portfolio's zero weight in semiconductors and components and its smaller exposure to computer technology, two industries that performed well during the period.
• Relatively weak stock selection in materials and processing dampened returns. Exposure to a rare earth minerals miner detracted the most from the Portfolio's performance in the sector.
• Stock selection and an underweight in health care weighed on relative performance, as the Portfolio had less exposure to strong-performing pharmaceuticals stocks than the Index.
Management Strategies
• We seek to invest primarily in established and cyclical franchise companies that we believe have strong name recognition, sustainable competitive advantages, and ample growth prospects, and are trading at an attractive discount to future cash flow generation capacity or asset value. We typically favor companies with the ability to generate attractive free cash flow yields. We utilize a bottom-up stock selection process, seeking attractive investments on an individual company basis. The companies we consider have market capitalizations within the range of companies included in the Russell 3000® Value Index (approximately $3 million to $500 billion as of December 31, 2013).
• We continue to focus on assessing company prospects over a three- to five-year time horizon and on owning a portfolio of high-quality companies with diverse business drivers not tied to a particular market environment.
4
Morgan Stanley Institutional Fund, Inc.
Annual Report — December 31, 2013
Investment Overview (unaudited) (cont'd)
Insight Portfolio
* Minimum Investment for Class I shares
** Commenced Operations on December 28, 2011.
In accordance with SEC regulations, Portfolio's performance shown assumes that all recurring fees (including management fees) were deducted and all dividends and distributions were reinvested. The performance of Class A+ and L shares will vary from Class I shares and will be negatively impacted by additional fees assessed to those classes.
Performance Compared to the Russell 3000® Value Index(1) and the Lipper Multi-Cap Core Funds Index(2)
| | | Period Ended December 31, 2013
Total Returns(3) | |
| | | | | Average Annual | |
| | | One
Year | | Five
Years | | Ten
Years | | Since
Inception(5) | |
Portfolio — Class I Shares
w/o sales charges(4) | | | 40.20 | % | | | — | | | | — | | | | 33.92 | % | |
Russell 3000® Value Index | | | 32.69 | | | | — | | | | — | | | | 25.22 | | |
Lipper Multi-Cap Core Funds Index | | | 32.58 | | | | — | | | | — | | | | 24.46 | | |
Portfolio — Class A+ Shares
w/o sales charges(4) | | | 39.73 | | | | — | | | | — | | | | 33.56 | | |
Portfolio — Class A+ Shares with
maximum 5.25% sales charges(4) | | | 32.36 | | | | — | | | | — | | | | 30.05 | | |
Russell 3000® Value Index | | | 32.69 | | | | — | | | | — | | | | 25.22 | | |
Lipper Multi-Cap Core Funds Index | | | 32.58 | | | | — | | | | — | | | | 24.46 | | |
Portfolio — Class L Shares
w/o sales charges(4) | | | 39.13 | | | | — | | | | — | | | | 32.92 | | |
Russell 3000® Value Index | | | 32.69 | | | | — | | | | — | | | | 25.22 | | |
Lipper Multi-Cap Core Funds Index | | | 32.58 | | | | — | | | | — | | | | 24.46 | | |
Performance data quoted represents past performance, which is no guarantee of future results, and current performance may be lower or higher than the figures shown. Performance assumes that all dividends and distributions, if any, were reinvested. For the most recent month-end performance figures, please visit www.morganstanley.com/im. Investment return and principal value will fluctuate so that Portfolio shares, when redeemed, may be worth more or less than their original cost. Total returns do not reflect the deduction of taxes that a shareholder would pay on Portfolio distributions or the redemption of Portfolio shares. Performance of share classes will vary due to difference in expenses.
+ Effective September 9, 2013, Class H shares were renamed Class A shares.
(1) The Russell 3000® Value Index measures the performance of those companies in the Russell 3000® Index with lower price-to-book ratios and lower forecasted growth values. The Russell 3000® Index measures the performance of the largest 3000 U.S. companies representing approximately 98% of the investable U.S. equity market. The Index is unmanaged and its returns do not include any sales charges or fees. Such costs would lower performance. It is not possible to invest directly in an index.
(2) The Lipper Multi-Cap Core Funds Index is an equally weighted performance index of the largest qualifying funds (based on net assets) in the Lipper Multi-Cap Core Funds classification. The Index, which is adjusted for capital gains distributions and income dividends, is unmanaged and should not be considered an investment. There are currently 30 funds represented in this Index. As of the date of this report, the Portfolio is in the Lipper Multi-Cap Core Funds classification.
(3) Total returns for the Portfolio reflect fees waived and expenses reimbursed, if applicable, by the Adviser. Without such waivers and reimbursements, total returns would have been lower. The fee waivers and/or expense reimbursements will continue for at least one year or until such time as the Fund's Board of Directors acts to discontinue all or a portion of such waivers and/or expense reimbursements when it deems that such action is appropriate.
(4) Commenced operations on December 28, 2011.
(5) For comparative purposes, average annual since inception returns listed for the Indexes refer to the inception date or initial offering of the respective share class of the Portfolio, not the inception of the Index.
Portfolio Composition
Classification | | Percentage of
Total Investments | |
Other++ | | | 33.1 | % | |
Investment Company | | | 9.8 | | |
Insurance: Property-Casualty | | | 9.5 | | |
Chemicals: Diversified | | | 8.3 | | |
Foods | | | 8.3 | | |
Office Supplies & Equipment | | | 6.9 | | |
Restaurants | | | 6.9 | | |
Consumer Lending | | | 6.2 | | |
Consumer Services: Miscellaneous | | | 5.7 | | |
Communications Technology | | | 5.3 | | |
Total Investments | | | 100.0 | % | |
++ Industries and/or investment types representing less than 5% of total investments.
5
Morgan Stanley Institutional Fund, Inc.
Annual Report — December 31, 2013
Portfolio of Investments
Insight Portfolio
| | | Shares | | Value
(000) | |
Common Stocks (87.1%) | |
Banks: Savings, Thrift & Mortgage Lending (2.8%) | |
Essent Group Ltd. (a) | | | 2,556 | | | $ | 61 | | |
Beverage: Brewers & Distillers (2.8%) | |
Big Rock Brewery, Inc. (Canada) | | | 1,422 | | | | 23 | | |
Crimson Wine Group Ltd. (a) | | | 4,274 | | | | 38 | | |
| | | | 61 | | |
Beverage: Soft Drinks (3.9%) | |
Dr. Pepper Snapple Group, Inc. | | | 821 | | | | 40 | | |
PepsiCo, Inc. | | | 535 | | | | 44 | | |
| | | | 84 | | |
Chemicals: Diversified (8.1%) | |
Intrepid Potash, Inc. (a) | | | 2,722 | | | | 43 | | |
Mosaic Co. (The) | | | 1,914 | | | | 91 | | |
Tronox Ltd., Class A | | | 1,880 | | | | 43 | | |
| | | | 177 | | |
Communications Technology (5.2%) | |
Motorola Solutions, Inc. | | | 1,671 | | | | 113 | | |
Computer Services, Software & Systems (3.9%) | |
Solera Holdings, Inc. | | | 1,214 | | | | 86 | | |
Consumer Lending (6.0%) | |
Berkshire Hathaway, Inc., Class B (a) | | | 445 | | | | 53 | | |
Brown & Brown, Inc. | | | 1,230 | | | | 38 | | |
RenaissanceRe Holdings Ltd. | | | 420 | | | | 41 | | |
| | | | 132 | | |
Consumer Services: Miscellaneous (5.5%) | |
Collectors Universe, Inc. | | | 2,336 | | | | 40 | | |
Roundy's, Inc. | | | 8,256 | | | | 81 | | |
| | | | 121 | | |
Diversified Media (1.9%) | |
News Corp., Class A (a) | | | 2,303 | | | | 42 | | |
Diversified Retail (2.1%) | |
Sears Canada, Inc. (Canada) | | | 3,711 | | | | 45 | | |
Foods (8.2%) | |
Dean Foods Co. (a) | | | 1,830 | | | | 31 | | |
Fiesta Restaurant Group, Inc. (a) | | | 962 | | | | 50 | | |
Nestle SA ADR (Switzerland) | | | 1,313 | | | | 97 | | |
| | | | 178 | | |
Home Building (3.7%) | |
Brookfield Residential Properties, Inc. (Canada) (a) | | | 2,280 | | | | 55 | | |
NVR, Inc. (a) | | | 25 | | | | 26 | | |
| | | | 81 | | |
Insurance: Property-Casualty (9.3%) | |
Arch Capital Group Ltd. (a) | | | 1,688 | | | | 101 | | |
Progressive Corp. (The) | | | 3,731 | | | | 102 | | |
| | | | 203 | | |
Office Supplies & Equipment (6.7%) | |
MICROS Systems, Inc. (a) | | | 2,562 | | | | 147 | | |
Oil: Integrated (1.5%) | |
Phillips 66 | | | 411 | | | | 32 | | |
| | | Shares | | Value
(000) | |
Pharmaceuticals (3.5%) | |
Abbott Laboratories | | | 2,008 | | | $ | 77 | | |
Real Estate (1.4%) | |
Tejon Ranch Co. (a) | | | 810 | | | | 30 | | |
Restaurants (6.8%) | |
BJ's Restaurants, Inc. (a) | | | 3,095 | | | | 96 | | |
Second Cup Ltd. (The) (Canada) | | | 11,069 | | | | 52 | | |
| | | | 148 | | |
Semiconductors & Components (1.8%) | |
Tessera Technologies, Inc. | | | 2,036 | | | | 40 | | |
Specialty Retail (2.0%) | |
Ignite Restaurant Group, Inc. (a) | | | 3,453 | | | | 43 | | |
Total Common Stocks (Cost $1,482) | | | 1,901 | | |
Warrants (0.0%) | |
Real Estate (0.0%) | |
| Tejon Ranch Co. (a) (Cost $1) | | | 119 | | | | 1 | | |
| | | Face
Amount
(000) | | | |
Corporate Bond (1.3%) | |
Metals & Mining (1.3%) | |
| Molycorp, Inc. 5.50%, 2/1/18 (Cost $28) | | $ | 29 | | | | 27 | | |
| | | Shares | | | |
Short-Term Investment (9.6%) | |
Investment Company (9.6%) | |
Morgan Stanley Institutional Liquidity
Funds — Money Market Portfolio —
Institutional Class (See Note G)
(Cost $210) | | | 209,920 | | | | 210 | | |
Total Investments (98.0%) (Cost $1,721) | | | 2,139 | | |
Other Assets in Excess of Liabilities (2.0%) | | | 44 | | |
Net Assets (100.0%) | | $ | 2,183 | | |
(a) Non-income producing security.
ADR American Depositary Receipt.
The accompanying notes are an integral part of the financial statements.
6
Morgan Stanley Institutional Fund, Inc.
Annual Report — December 31, 2013
Statement of Assets and Liabilities | | December 31, 2013
(000) | |
Assets: | |
Investments in Securities of Unaffiliated Issuers, at Value (Cost $1,511) | | $ | 1,929 | | |
Investment in Security of Affiliated Issuer, at Value (Cost $210) | | | 210 | | |
Total Investments in Securities, at Value (Cost $1,721) | | | 2,139 | | |
Due from Adviser | | | 46 | | |
Interest Receivable | | | 1 | | |
Dividends Receivable | | | 1 | | |
Tax Reclaim Receivable | | | — | @ | |
Receivable from Affiliate | | | — | @ | |
Other Assets | | | 6 | | |
Total Assets | | | 2,193 | | |
Liabilities: | |
Payable for Professional Fees | | | 5 | | |
Payable for Custodian Fees | | | 1 | | |
Payable for Transfer Agent Fees — Class I | | | — | @ | |
Payable for Transfer Agent Fees — Class L | | | — | @ | |
Payable for Administration Fees | | | — | @ | |
Payable for Shareholder Services Fees — Class A* | | | — | @ | |
Payable for Distribution and Shareholder Services Fees — Class L | | | — | @ | |
Other Liabilities | | | 4 | | |
Total Liabilities | | | 10 | | |
Net Assets | | $ | 2,183 | | |
Net Assets Consist Of: | |
Paid-in-Capital | | $ | 1,608 | | |
Accumulated Undistributed Net Investment Income | | | 1 | | |
Accumulated Net Realized Gain | | | 156 | | |
Unrealized Appreciation (Depreciation) on: | |
Investments | | | 418 | | |
Foreign Currency Translations | | | — | @ | |
Net Assets | | $ | 2,183 | | |
CLASS I: | |
Net Assets | | $ | 1,859 | | |
| Shares Outstanding $0.001 par value shares of beneficial interest (500,000,000 shares authorized) (not in 000's) | | | 120,732 | | |
Net Asset Value, Offering and Redemption Price Per Share | | $ | 15.40 | | |
CLASS A*: | |
Net Assets | | $ | 209 | | |
| Shares Outstanding $0.001 par value shares of beneficial interest (500,000,000 shares authorized) (not in 000's) | | | 13,571 | | |
Net Asset Value, Redemption Price Per Share | | $ | 15.43 | | |
Maximum Sales Load§§ | | | 5.25 | % | |
Maximum Sales Charge | | $ | 0.85 | | |
Maximum Offering Price Per Share | | $ | 16.28 | | |
CLASS L: | |
Net Assets | | $ | 115 | | |
| Shares Outstanding $0.001 par value shares of beneficial interest (500,000,000 shares authorized) (not in 000's) | | | 7,502 | | |
Net Asset Value, Offering and Redemption Price Per Share | | $ | 15.35 | | |
@ Amount is less than $500.
* Effective September 9, 2013, Class H shares were renamed Class A shares.
§§ Effective September 9, 2013, the Directors approved the imposition of a maximum initial sales charge of 5.25% on purchases of Class A shares of the Portfolio.
The accompanying notes are an integral part of the financial statements.
7
Morgan Stanley Institutional Fund, Inc.
Annual Report — December 31, 2013
Statement of Operations | | Year Ended
December 31, 2013
(000) | |
Investment Income: | |
Dividends from Securities of Unaffiliated Issuers (Net of $3 of Foreign Taxes Withheld) | | $ | 38 | | |
Interest from Securities of Unaffiliated Issuers | | | 1 | | |
Dividends from Security of Affiliated Issuer (Note G) | | | — | @ | |
Total Investment Income | | | 39 | | |
Expenses: | |
Professional Fees | | | 90 | | |
Registration Fees | | | 50 | | |
Shareholder Reporting Fees | | | 15 | | |
Advisory Fees (Note B) | | | 14 | | |
Transfer Agency Fees (Note E) | | | 7 | | |
Transfer Agency Fees — Class I (Note E) | | | — | @ | |
Transfer Agency Fees — Class A* (Note E) | | | — | @ | |
Transfer Agency Fees — Class L (Note E) | | | — | @ | |
Custodian Fees (Note F) | | | 7 | | |
Pricing Fees | | | 3 | | |
Shareholder Services Fees — Class A* (Note D) | | | 1 | | |
Distribution and Shareholder Services Fees — Class L (Note D) | | | 1 | | |
Administration Fees (Note C) | | | 1 | | |
Directors' Fees and Expenses | | | 1 | | |
Other Expenses | | | 13 | | |
Total Expenses | | | 203 | | |
Expenses Reimbursed by Adviser (Note B) | | | (169 | ) | |
Waiver of Advisory Fees (Note B) | | | (14 | ) | |
Reimbursement of Class Specific Expenses — Class I (Note B) | | | (— | @) | |
Reimbursement of Class Specific Expenses — Class L (Note B) | | | (— | @) | |
Rebate from Morgan Stanley Affiliate (Note G) | | | (— | @) | |
Net Expenses | | | 20 | | |
Net Investment Income | | | 19 | | |
Realized Gain: | |
Investments Sold | | | 270 | | |
Foreign Currency Transactions | | | — | @ | |
Net Realized Gain | | | 270 | | |
Change in Unrealized Appreciation (Depreciation): | |
Investments | | | 284 | | |
Foreign Currency Translations | | | (— | @) | |
Net Change in Unrealized Appreciation (Depreciation) | | | 284 | | |
Net Realized Gain and Change in Unrealized Appreciation (Depreciation) | | | 554 | | |
Net Increase in Net Assets Resulting from Operations | | $ | 573 | | |
@ Amount is less than $500.
* Effective September 9, 2013, Class H shares were renamed Class A shares.
The accompanying notes are an integral part of the financial statements.
8
Morgan Stanley Institutional Fund, Inc.
Annual Report — December 31, 2013
Statements of Changes in Net Assets | | Year Ended
December 31,
2013
(000) | | Year Ended
December 31,
2012
(000) | |
Increase (Decrease) in Net Assets: | |
Operations: | |
Net Investment Income | | $ | 19 | | | $ | 12 | | |
Net Realized Gain | | | 270 | | | | 95 | | |
Net Change in Unrealized Appreciation (Depreciation) | | | 284 | | | | 129 | | |
Net Increase in Net Assets Resulting from Operations | | | 573 | | | | 236 | | |
Distributions from and/or in Excess of: | |
Class I: | |
Net Investment Income | | | (18 | ) | | | (— | @) | |
Net Realized Gain | | | (113 | ) | | | (1 | ) | |
Class A*: | |
Net Investment Income | | | (1 | ) | | | (10 | ) | |
Net Realized Gain | | | (13 | ) | | | (74 | ) | |
Class L: | |
Net Investment Income | | | (1 | ) | | | (— | @) | |
Net Realized Gain | | | (7 | ) | | | (1 | ) | |
Total Distributions | | | (153 | ) | | | (86 | ) | |
Capital Share Transactions:(1) | |
Class I: | |
Subscribed | | | 1,451 | | | | — | | |
Distributions Reinvested | | | 129 | | | | — | | |
Redeemed | | | (3 | ) | | | — | | |
Class A*: | |
Subscribed | | | 43 | | | | 100 | | |
Distributions Reinvested | | | 13 | | | | 83 | | |
Redeemed | | | (1,131 | ) | | | — | | |
Class L: | |
Subscribed | | | 151 | | | | — | | |
Distributions Reinvested | | | 7 | | | | — | | |
Redeemed | | | (65 | ) | | | — | | |
Net Increase in Net Assets Resulting from Capital Share Transactions | | | 595 | | | | 183 | | |
Total Increase in Net Assets | | | 1,015 | | | | 333 | | |
Net Assets: | |
Beginning of Period | | | 1,168 | | | | 835 | | |
End of Period (Including Accumulated Undistributed Net Investment Income of $1 and $2) | | $ | 2,183 | | | $ | 1,168 | | |
(1) Capital Share Transactions: | |
Class I: | |
Shares Subscribed | | | 111 | | | | — | | |
Shares Issued on Distributions Reinvested | | | 9 | | | | — | | |
Shares Redeemed | | | — | @@ | | | — | | |
Net Increase in Class I Shares Outstanding | | | 120 | | | | — | | |
Class A*: | |
Shares Subscribed | | | 3 | | | | 9 | | |
Shares Issued on Distributions Reinvested | | | 1 | | | | 7 | | |
Shares Redeemed | | | (87 | ) | | | — | | |
Net Increase (Decrease) in Class A Shares Outstanding | | | (83 | ) | | | 16 | | |
Class L: | |
Shares Subscribed | | | 11 | | | | — | | |
Shares Issued on Distributions Reinvested | | | — | @@ | | | — | | |
Shares Redeemed | | | (4 | ) | | | — | | |
Net Increase in Class L Shares Outstanding | | | 7 | | | | — | | |
@ Amount is less than $500.
@@ Amount is less than 500 shares.
* Effective September 9, 2013, Class H shares were renamed Class A shares.
The accompanying notes are an integral part of the financial statements.
9
Morgan Stanley Institutional Fund, Inc.
Annual Report — December 31, 2013
Financial Highlights
Insight Portfolio
| | | Class I | |
| | | Year Ended December 31, | | Period from
December 28, 2011^ to | |
Selected Per Share Data and Ratios | | 2013 | | 2012 | | December 31, 2011 | |
Net Asset Value, Beginning of Period | | $ | 11.86 | | | $ | 10.06 | | | $ | 10.00 | | |
Income (Loss) from Investment Operations: | |
Net Investment Income (Loss)† | | | 0.18 | | | | 0.17 | | | | (0.00 | )‡ | |
Net Realized and Unrealized Gain | | | 4.52 | | | | 2.59 | | | | 0.06 | | |
Total from Investment Operations | | | 4.70 | | | | 2.76 | | | | 0.06 | | |
Distributions from and/or in Excess of: | |
Net Investment Income | | | (0.16 | ) | | | (0.14 | ) | | | — | | |
Net Realized Gain | | | (1.00 | ) | | | (0.82 | ) | | | — | | |
Total Distributions | | | (1.16 | ) | | | (0.96 | ) | | | — | | |
Net Asset Value, End of Period | | $ | 15.40 | | | $ | 11.86 | | | $ | 10.06 | | |
Total Return++ | | | 40.20 | % | | | 27.47 | % | | | 0.60 | %# | |
Ratios and Supplemental Data: | |
Net Assets, End of Period (Thousands) | | $ | 1,859 | | | $ | 12 | | | $ | 10 | | |
Ratio of Expenses to Average Net Assets (1) | | | 1.04 | %+ | | | 1.04 | %+†† | | | 1.05 | %††* | |
Ratio of Net Investment Income (Loss) to Average Net Assets (1) | | | 1.25 | %+ | | | 1.47 | %+†† | | | (0.94 | )%††* | |
Ratio of Rebate from Morgan Stanley Affiliates to Average Net Assets | | | 0.01 | % | | | 0.01 | %†† | | | N/A | | |
Portfolio Turnover Rate | | | 51 | % | | | 62 | % | | | 0.00 | %# | |
(1) Supplemental Information on the Ratios to Average Net Assets: | |
Ratios Before Expense Limitation: | |
Expenses to Average Net Assets | | | 10.83 | % | | | 11.61 | %†† | | | 380.17 | %††* | |
Net Investment Loss to Average Net Assets | | | (8.54 | )% | | | (9.10 | )%†† | | | (380.06 | )%††* | |
^ Commencement of Operations.
† Per share amount is based on average shares outstanding.
‡ Amount is less than $0.005 per share.
++ Calculated based on the net asset value as of the last business day of the period.
+ The Ratios of Expenses and Net Investment Income (Loss) reflect the rebate of certain Portfolio expenses in connection with the investments in Morgan Stanley affiliates during the period. The effect of the rebate on the ratios is disclosed in the above table as "Ratio of Rebate from Morgan Stanley Affiliates to Average Net Assets."
†† Reflects overall Portfolio ratios for investment income and non-class specific expenses.
# Not Annualized.
* Annualized.
The accompanying notes are an integral part of the financial statements.
10
Morgan Stanley Institutional Fund, Inc.
Annual Report — December 31, 2013
Financial Highlights
Insight Portfolio
| | | Class A@ | |
| | | Year Ended December 31, | | Period from
December 28, 2011^ to | |
Selected Per Share Data and Ratios | | 2013 | | 2012 | | December 31, 2011 | |
Net Asset Value, Beginning of Period | | $ | 11.86 | | | $ | 10.06 | | | $ | 10.00 | | |
Income (Loss) from Investment Operations: | |
Net Investment Income (Loss)† | | | 0.07 | | | | 0.14 | | | | (0.00 | )‡ | |
Net Realized and Unrealized Gain | | | 4.58 | | | | 2.59 | | | | 0.06 | | |
Total from Investment Operations | | | 4.65 | | | | 2.73 | | | | 0.06 | | |
Distributions from and/or in Excess of: | |
Net Investment Income | | | (0.08 | ) | | | (0.11 | ) | | | — | | |
Net Realized Gain | | | (1.00 | ) | | | (0.82 | ) | | | — | | |
Total Distributions | | | (1.08 | ) | | | (0.93 | ) | | | — | | |
Net Asset Value, End of Period | | $ | 15.43 | | | $ | 11.86 | | | $ | 10.06 | | |
Total Return++ | | | 39.73 | % | | | 27.21 | % | | | 0.60 | %# | |
Ratios and Supplemental Data: | |
Net Assets, End of Period (Thousands) | | $ | 209 | | | $ | 1,144 | | | $ | 815 | | |
Ratio of Expenses to Average Net Assets (1) | | | 1.30 | %+^^ | | | 1.29 | %+†† | | | 1.30 | %††* | |
Ratio of Net Investment Income (Loss) to Average Net Assets (1) | | | 0.50 | %+ | | | 1.22 | %+†† | | | (1.19 | )%††* | |
Ratio of Rebate from Morgan Stanley Affiliates to Average Net Assets | | | 0.01 | % | | | 0.01 | %†† | | | N/A | | |
Portfolio Turnover Rate | | | 51 | % | | | 62 | % | | | 0.00 | %# | |
(1) Supplemental Information on the Ratios to Average Net Assets: | |
Ratios Before Expense Limitation: | |
Expenses to Average Net Assets | | | 13.79 | % | | | 11.86 | %†† | | | 380.42 | %††* | |
Net Investment Loss to Average Net Assets | | | (11.99 | )% | | | (9.35 | )%†† | | | (380.31 | )%††* | |
@ Effective September 9, 2013, Class H shares were renamed Class A shares.
† Per share amount is based on average shares outstanding.
^ Commencement of Operations.
‡ Amount is less than $0.005 per share.
++ Calculated based on the net asset value which does not reflect sales charges, if applicable, as of the last business day of the period.
+ The Ratios of Expenses and Net Investment Income (Loss) reflect the rebate of certain Portfolio expenses in connection with the investments in Morgan Stanley affiliates during the period. The effect of the rebate on the ratios is disclosed in the above table as "Ratio of Rebate from Morgan Stanley Affiliates to Average Net Assets."
^^ Effective September 16, 2013, the Adviser has agreed to limit the ratio of expenses to average net assets to the maximum ratio of 1.40% for Class A shares. Prior to September 16, 2013, the maximum ratio was 1.30% for Class A shares.
†† Reflects overall Portfolio ratios for investment income and non-class specific expenses.
# Not Annualized.
* Annualized.
The accompanying notes are an integral part of the financial statements.
11
Morgan Stanley Institutional Fund, Inc.
Annual Report — December 31, 2013
Financial Highlights
Insight Portfolio
| | | Class L | |
| | | Year Ended December 31, | | Period from
December 28, 2011^ to | |
Selected Per Share Data and Ratios | | 2013 | | 2012 | | December 31 2011 | |
Net Asset Value, Beginning of Period | | $ | 11.85 | | | $ | 10.06 | | | $ | 10.00 | | |
Income (Loss) from Investment Operations: | |
Net Investment Income (Loss)† | | | 0.08 | | | | 0.08 | | | | (0.00 | )‡ | |
Net Realized and Unrealized Gain | | | 4.49 | | | | 2.58 | | | | 0.06 | | |
Total from Investment Operations | | | 4.57 | | | | 2.66 | | | | 0.06 | | |
Distributions from and/or in Excess of: | |
Net Investment Income | | | (0.07 | ) | | | (0.05 | ) | | | — | | |
Net Realized Gain | | | (1.00 | ) | | | (0.82 | ) | | | — | | |
Total Distributions | | | (1.07 | ) | | | (0.87 | ) | | | — | | |
Net Asset Value, End of Period | | $ | 15.35 | | | $ | 11.85 | | | $ | 10.06 | | |
Total Return++ | | | 39.13 | % | | | 26.52 | % | | | 0.60 | %# | |
Ratios and Supplemental Data: | |
Net Assets, End of Period (Thousands) | | $ | 115 | | | $ | 12 | | | $ | 10 | | |
Ratio of Expenses to Average Net Assets (1) | | | 1.84 | %+^^ | | | 1.79 | %+†† | | | 1.80 | %††* | |
Ratio of Net Investment Income (Loss) to Average Net Assets (1) | | | 0.54 | %+ | | | 0.72 | %+†† | | | (1.70 | )%††* | |
Ratio of Rebate from Morgan Stanley Affiliates to Average Net Assets | | | 0.01 | % | | | 0.01 | %†† | | | N/A | | |
Portfolio Turnover Rate | | | 51 | % | | | 62 | % | | | 0.00 | %# | |
(1) Supplemental Information on the Ratios to Average Net Assets: | |
Ratios Before Expense Limitation: | |
Expenses to Average Net Assets | | | 12.31 | % | | | 12.36 | %†† | | | 380.92 | %††* | |
Net Investment Loss to Average Net Assets | | | (9.93 | )% | | | (9.85 | )%†† | | | (380.82 | )%††* | |
^ Commencement of Operations.
† Per share amount is based on average shares outstanding.
‡ Amount is less than $0.005 per share.
++ Calculated based on the net asset value as of the last business day of the period.
+ The Ratios of Expenses and Net Investment Income (Loss) reflect the rebate of certain Portfolio expenses in connection with the investments in Morgan Stanley affiliates during the period. The effect of the rebate on the ratios is disclosed in the above table as "Ratio of Rebate from Morgan Stanley Affiliates to Average Net Assets."
^^ Effective September 16, 2013, the Adviser has agreed to limit the ratio of expenses to average net assets to the maximum ratio of 1.90% for Class L shares. Prior to September 16, 2013, the maximum ratio was 1.80% for Class L shares.
†† Reflects overall Portfolio ratios for investment income and non-class specific expenses.
# Not Annualized.
* Annualized.
The accompanying notes are an integral part of the financial statements.
12
Morgan Stanley Institutional Fund, Inc.
Annual Report — December 31, 2013
Notes to Financial Statements
Morgan Stanley Institutional Fund, Inc. (the "Fund") is registered under the Investment Company Act of 1940, as amended (the "Act"), as an open-end management investment company. The Fund is comprised of twenty-seven separate, active, diversified and non-diversified portfolios (individually referred to as a "Portfolio", collectively as the "Portfolios").
The accompanying financial statements relate to the Insight Portfolio. The Portfolio seeks long-term capital appreciation by investing primarily in established and cyclical franchise companies with market capitalizations within the range of companies included in the Russell 3000® Value Index. The Portfolio offers three classes of shares — Class I, Class A and Class L.
Effective September 9, 2013, Class H shares were renamed Class A shares.
A. Significant Accounting Policies: The following significant accounting policies are in conformity with U.S. generally accepted accounting principles ("GAAP"). Such policies are consistently followed by the Fund in the preparation of its financial statements. GAAP may require management to make estimates and assumptions that affect the reported amounts and disclosures in the financial statements. Actual results may differ from those estimates.
1. Security Valuation: (1) An equity portfolio security listed or traded on an exchange is valued at its latest reported sales price (or at the exchange official closing price if such exchange reports an official closing price), if there were no sales on a given day, the security is valued at the mean between the last reported bid and asked prices; (2) certain portfolio securities may be valued by an outside pricing service approved by the Portfolio's Board of Directors (the "Directors"). The pricing service may utilize a matrix system or other model incorporating attributes such as security quality, maturity and coupon as the evaluation model parameters, and/or research evaluations by its staff, including review of broker-dealer market price quotations in determining what it believes is the fair valuation of the portfolios securities valued by such pricing service; (3) all other equity portfolio securities for which over-the-counter market quotations are readily available are valued at its latest reported sales price. In cases where a security is traded on more than one exchange, the security is valued on the exchange designated as the primary market; (4) when market quotations are not readily available, including circumstances under which Morgan Stanley Investment Management Inc. (the "Adviser") determines that the closing price, last sale price or the mean between
the last reported bid and asked prices are not reflective of a security's market value, portfolio securities are valued at their fair value as determined in good faith under procedures established by and under the general supervision of the Directors. Occasionally, developments affecting the closing prices of securities and other assets may occur between the times at which valuations of such securities are determined (that is, close of the foreign market on which the securities trade) and the close of business of the New York Stock Exchange ("NYSE"). If developments occur during such periods that are expected to materially affect the value of such securities, such valuations may be adjusted to reflect the estimated fair value of such securities as of the close of the NYSE, as determined in good faith by the Directors or by the Adviser using a pricing service and/or procedures approved by the Directors; (5) quotations of foreign portfolio securities, other assets and liabilities and forward contracts stated in foreign currency are translated into U.S. dollar equivalents at the prevailing market rates prior to the close of the NYSE; (6) investments in mutual funds, including the Morgan Stanley Institutional Liquidity Funds, are valued at the net asset value as of the close of each business day; and (7) short-term debt securities with remaining maturities of 60 days or less at the time of purchase may be valued at amortized cost, unless the Adviser determines such valuation does not reflect the securities' market value, in which case these securities will be valued at their fair market value determined by the Adviser.
Under procedures approved by the Directors, the Fund's Adviser has formed a Valuation Committee. The Valuation Committee provides administration and oversight of the Fund's valuation policies and procedures, which are reviewed at least annually by the Directors. These procedures allow the Fund to utilize independent pricing services, quotations from securities and financial instrument dealers, and other market sources to determine fair value.
The Fund has procedures to determine the fair value of securities and other financial instruments for which market prices are not readily available. Under these procedures, the Valuation Committee convenes on a regular and ad hoc basis to review such securities and considers a number of factors, including valuation methodologies and significant unobservable valuation inputs, when arriving at fair value. The Valuation Committee may
13
Morgan Stanley Institutional Fund, Inc.
Annual Report — December 31, 2013
Notes to Financial Statements (cont'd)
employ a market-based approach which may use related or comparable assets or liabilities, recent transactions, market multiples, book values, and other relevant information for the investment to determine the fair value of the investment. An income-based valuation approach may also be used in which the anticipated future cash flows of the investment are discounted to calculate fair value. Discounts may also be applied due to the nature or duration of any restrictions on the disposition of the investments. Due to the inherent uncertainty of valuations of such investments, the fair values may differ significantly from the values that would have been used had an active market existed. The Valuation Committee employs various methods for calibrating these valuation approaches including a regular review of valuation methodologies, key inputs and assumptions, transactional back-testing or disposition analysis, and reviews of any related market activity.
2. Fair Value Measurement: Financial Accounting Standards Board ("FASB") Accounting Standards CodificationTM ("ASC") 820, "Fair Value Measurements and Disclosures" ("ASC 820"), defines fair value as the value that the Fund would receive to sell an investment or pay to transfer a liability in a timely transaction with an independent buyer in the principal market, or in the absence of a principal market the most advantageous market for the investment or liability. ASC 820 establishes a three-tier hierarchy to distinguish between (1) inputs that reflect the assumptions market participants would use in valuing an asset or liability developed based on market data obtained from sources independent of the reporting entity (observable inputs) and (2) inputs that reflect the reporting entity's own assumptions about the assumptions market participants would use in valuing an asset or liability developed based on the best information available in the circumstances (unobservable inputs) and to establish classification of fair value measurements for disclosure purposes. Various inputs are used in determining the value of the Fund's investments. The inputs are summarized in the three broad levels listed below.
• Level 1 – unadjusted quoted prices in active markets for identical investments
• Level 2 – other significant observable inputs (including quoted prices for similar investments, interest rates, prepayment speeds, credit risk, etc.)
• Level 3 – significant unobservable inputs including the Fund's own assumptions in determining the fair value of investments. Factors considered in making this determination may include, but are not limited to, information obtained by contacting the issuer, analysts, or the appropriate stock exchange (for exchange-traded securities), analysis of the issuer's financial statements or other available documents and, if necessary, available information concerning other securities in similar circumstances
The inputs or methodology used for valuing securities are not necessarily an indication of the risk associated with investing in those securities and the determination of the significance of a particular input to the fair value measurement in its entirety requires judgment and considers factors specific to each security.
The following is a summary of the inputs used to value the Portfolio's investments as of December 31, 2013.
Investment Type | | Level 1
Unadjusted
quoted
prices
(000) | | Level 2
Other
significant
observable
inputs
(000) | | Level 3
Significant
unobservable
inputs
(000) | | Total
(000) | |
Assets: | |
Common Stocks | |
Banks: Savings, Thrift &
Mortgage Lending | | $ | 61 | | | $ | — | | | $ | — | | | $ | 61 | | |
Beverage: Brewers &
Distillers | | | 61 | | | | — | | | | — | | | | 61 | | |
Beverage: Soft Drinks | | | 84 | | | | — | | | | — | | | | 84 | | |
Chemicals: Diversified | | | 177 | | | | — | | | | — | | | | 177 | | |
Communications
Technology | | | 113 | | | | — | | | | — | | | | 113 | | |
Computer Services,
Software & Systems | | | 86 | | | | — | | | | — | | | | 86 | | |
Consumer Lending | | | 132 | | | | — | | | | — | | | | 132 | | |
Consumer Services:
Miscellaneous | | | 121 | | | | — | | | | — | | | | 121 | | |
Diversified Media | | | 42 | | | | — | | | | — | | | | 42 | | |
Diversified Retail | | | 45 | | | | — | | | | — | | | | 45 | | |
Foods | | | 178 | | | | — | | | | — | | | | 178 | | |
Home Building | | | 81 | | | | — | | | | — | | | | 81 | | |
Insurance:
Property-Casualty | | | 203 | | | | — | | | | — | | | | 203 | | |
Office Supplies &
Equipment | | | 147 | | | | — | | | | — | | | | 147 | | |
Oil: Integrated | | | 32 | | | | — | | | | — | | | | 32 | | |
Pharmaceuticals | | | 77 | | | | — | | | | — | | | | 77 | | |
Real Estate | | | 30 | | | | — | | | | — | | | | 30 | | |
Restaurants | | | 148 | | | | — | | | | — | | | | 148 | | |
14
Morgan Stanley Institutional Fund, Inc.
Annual Report — December 31, 2013
Notes to Financial Statements (cont'd)
Investment Type | | Level 1
Unadjusted
quoted
prices
(000) | | Level 2
Other
significant
observable
inputs
(000) | | Level 3
Significant
unobservable
inputs
(000) | | Total
(000) | |
Common Stocks (cont'd) | |
Semiconductors &
Components | | $ | 40 | | | $ | — | | | $ | — | | | $ | 40 | | |
Specialty Retail | | | 43 | | | | — | | | | — | | | | 43 | | |
Total Common Stocks | | | 1,901 | | | | — | | | | — | | | | 1,901 | | |
Warrants | | | 1 | | | | — | | | | — | | | | 1 | | |
Fixed Income
Securities —
Corporate Bond | | | — | | | | 27 | | | | — | | | | 27 | | |
Short-Term Investment —
Investment Company | | | 210 | | | | — | | | | — | | | | 210 | | |
Total Assets | | $ | 2,112 | | | $ | 27 | | | $ | — | | | $ | 2,139 | | |
Transfers between investment levels may occur as the markets fluctuate and/or the availability of data used in an investment's valuation changes. The Portfolio recognizes transfers between the levels as of the end of the period. As of December 31, 2013, the Portfolio did not have any investments transfer between investment levels.
3. Foreign Currency Translation and Foreign Investments: The books and records of the Portfolio are maintained in U.S. dollars. Foreign currency amounts are translated into U.S. dollars as follows:
– investments, other assets and liabilities at the prevailing rate of exchange on the valuation date;
– investment transactions and investment income at the prevailing rates of exchange on the dates of such transactions.
Although the net assets of the Portfolio are presented at the foreign exchange rates and market values at the close of the period, the Portfolio does not isolate that portion of the results of operations arising as a result of changes in the foreign exchange rates from the fluctuations arising from changes in the market prices of securities held at period end. Similarly, the Portfolio does not isolate the effect of changes in foreign exchange rates from the fluctuations arising from changes in the market prices of securities sold during the period. Accordingly, realized and unrealized foreign currency gains (losses) on investments in securities are included in the reported net realized and unrealized gains (losses) on investment transactions and balances. However, pursuant to U.S. Federal income tax regulations, gains and losses from certain foreign currency transactions and the foreign
currency portion of gains and losses realized on sales and maturities of foreign denominated debt securities are treated as ordinary income for U.S. Federal income tax purposes.
Net realized gains (losses) on foreign currency transactions represent net foreign exchange gains (losses) from foreign currency forward exchange contracts, disposition of foreign currencies, currency gains (losses) realized between the trade and settlement dates on securities transactions, and the difference between the amount of investment income and foreign withholding taxes recorded on the Portfolio's books and the U.S. dollar equivalent amounts actually received or paid. Net unrealized currency gains (losses) from valuing foreign currency denominated assets and liabilities at period end exchange rates are reflected as a component of unrealized appreciation (depreciation) on the Statement of Assets and Liabilities. The change in unrealized currency gains (losses) on foreign currency translations for the period is reflected in the Statement of Operations.
Foreign security and currency transactions may involve certain considerations and risks not typically associated with those of U.S. dollar denominated transactions as a result of, among other factors, fluctuations of exchange rates in relation to the U.S. dollar, the possibility of lower levels of governmental supervision and regulation of foreign securities markets and the possibility of political or economic instability.
Governmental approval for foreign investments may be required in advance of making an investment under certain circumstances in some countries, and the extent of foreign investments in domestic companies may be subject to limitation in other countries. Foreign ownership limitations also may be imposed by the charters of individual companies to prevent, among other concerns, violations of foreign investment limitations. As a result, an additional class of shares (identified as "Foreign" in the Portfolio of Investments) may be created and offered for investment. The "local" and "foreign shares" market values may differ. In the absence of trading of the foreign shares in such markets, the Portfolio values the foreign shares at the closing exchange price of the local shares.
4. Indemnifications: The Fund enters into contracts that contain a variety of indemnifications. The Fund's maximum exposure under these arrangements is unknown.
15
Morgan Stanley Institutional Fund, Inc.
Annual Report — December 31, 2013
Notes to Financial Statements (cont'd)
However, the Fund has not had prior claims or losses pursuant to these contracts and expects the risk of loss to be remote.
5. Dividends and Distributions to Shareholders: Dividend income and distributions to shareholders are recorded on the ex-dividend date. Dividends from net investment income, if any, are declared and paid semiannually. Net realized capital gains, if any, are distributed at least annually.
6. Security Transactions, Income and Expenses: Security transactions are accounted for on the trade date (date the order to buy or sell is executed). Realized gains and losses on the sale of investment securities are determined on the specific identified cost method. Dividend income and other distributions are recorded on the ex-dividend date (except for certain foreign dividends which may be recorded as soon as the Portfolio is informed of such dividends) net of applicable withholding taxes. Interest income is recognized on the accrual basis except where collection is in doubt. Discounts are accreted and premiums are amortized over the life of the respective securities. Most expenses of the Fund can be directly attributed to a particular Portfolio. Expenses which cannot be directly attributed are apportioned among the Portfolios based upon relative net assets or other appropriate methods. Income, expenses (other than class specific expenses — distribution, transfer agency and sub transfer agency fees) and realized and unrealized gains or losses are allocated to each class of shares based upon their relative net assets.
B. Advisory Fees: The Adviser, a wholly-owned subsidiary of Morgan Stanley, provides the Portfolio with advisory services under the terms of an Investment Advisory Agreement, paid quarterly, at the annual rate based on the average daily net assets as follows:
First $750
million | | Next $750
million | | Over $1.5
billion | |
| | 0.80 | % | | | 0.75 | % | | | 0.70 | % | |
For the year ended December 31, 2013, the advisory fee rate (net of waivers/rebate) was equivalent to an annual effective rate of 0.00% of the Portfolio's daily net assets.
The Adviser has agreed to reduce its advisory fee and/or reimburse the Portfolio so that total annual portfolio operating expenses, excluding certain investment related expenses, taxes, interest and other extraordinary expenses (including litigation), will not exceed 1.05% for Class I shares, 1.30% for Class A
shares and 1.80% for Class L shares. Effective September 16, 2013, the Adviser has agreed to limit the ratio of expenses to average net assets to the maximum ratio of 1.40% and 1.90% for Class A and Class L shares, respectively. The fee waivers and/or expense reimbursements will continue for at least one year or until such time that the Directors act to discontinue all or a portion of such waivers and/or reimbursements when it deems such action is appropriate. For the year ended December 31, 2013, approximately $14,000 of advisory fees were waived and approximately $169,000 of other expenses were reimbursed by the Adviser pursuant to this arrangement.
C. Administration Fees: The Adviser also serves as Administrator to the Fund and provides administrative services pursuant to an Administration Agreement for an annual fee, accrued daily and paid monthly, of 0.08% of the Portfolio's average daily net assets. Under a Sub-Administration Agreement between the Administrator and State Street Bank and Trust Company ("State Street"), State Street provides certain administrative services to the Fund. For such services, the Administrator pays State Street a portion of the fee the Administrator receives from the Portfolio.
D. Distribution and Shareholder Services Fees: Morgan Stanley Distribution, Inc. ("MSDI" or the "Distributor"), a wholly-owned subsidiary of the Adviser, and an indirect subsidiary of Morgan Stanley, serves as the Fund's Distributor of Portfolio shares pursuant to a Distribution Agreement. The Fund has adopted a Shareholder Services Plan with respect to Class A shares pursuant to Rule 12b-1 under the Act. Under the Shareholder Services Plan, the Portfolio pays the Distributor a shareholder services fee, accrued daily and paid monthly, at an annual rate of 0.25% of the Portfolio's average daily net assets attributable to Class A shares.
The Fund has adopted a Distribution and Shareholder Services Plan with respect to Class L shares pursuant to Rule 12b-1 under the Act. Under the Distribution and Shareholder Services Plan, the Portfolio pays the Distributor a distribution fee, accrued daily and paid monthly, at an annual rate of 0.50% and a shareholder services fee, accrued daily and paid monthly, at an annual rate of 0.25% of the Portfolio's average daily net assets attributable to Class L shares.
The distribution and shareholder services fees are used to support the expenses associated with servicing and maintaining accounts. The Distributor may compensate other parties for providing shareholder support services to investors who purchase Class A and Class L shares.
16
Morgan Stanley Institutional Fund, Inc.
Annual Report — December 31, 2013
Notes to Financial Statements (cont'd)
E. Dividend Disbursing and Transfer Agent: The Fund's dividend disbursing and transfer agent was Morgan Stanley Services Company Inc. ("Morgan Stanley Services"). Pursuant to a Transfer Agency Agreement, the Fund paid Morgan Stanley Services a fee based on the number of classes, accounts and transactions relating to the Portfolios of the Fund. Effective July 1, 2013, the Directors approved changing the transfer agent to Boston Financial Data Services, Inc.
F. Custodian Fees: State Street (the "Custodian") serves as Custodian for the Fund in accordance with a Custodian Agreement. The Custodian holds cash, securities, and other assets of the Fund as required by the Act. Custody fees are payable monthly based on assets held in custody, investment purchases and sales activity and account maintenance fees, plus reimbursement for certain out-of-pocket expenses.
G. Security Transactions and Transactions with Affiliates: For the year ended December 31, 2013, purchases and sales of investment securities for the Portfolio, other than long-term U.S. Government securities and short-term investments, were approximately $1,114,000 and $835,000, respectively. There were no purchases and sales of long-term U.S. Government securities for the year ended December 31, 2013.
The Portfolio invests in the Institutional Class of the Morgan Stanley Institutional Liquidity Funds — Money Market Portfolio (the "Liquidity Funds"), an open-end management investment company managed by the Adviser. Advisory fees paid by the Portfolio are reduced by an amount equal to its pro-rata share of the advisory and administration fees paid by the Portfolio due to its investment in the Liquidity Funds. For the year ended December 31, 2013, advisory fees paid were reduced by less than $500 relating to the Portfolio's investment in the Liquidity Funds.
A summary of the Portfolio's transactions in shares of the Liquidity Funds during the year ended December 31, 2013 is as follows:
Value
December 31,
2012
(000) | | Purchases
at Cost
(000) | | Sales
(000) | | Dividend
Income
(000) | | Value
December 31,
2013
(000) | |
| $ | 58 | | | $ | 1,176 | | | $ | 1,024 | | | $ | — | @ | | $ | 210 | | |
@ Amount is less than $500.
During the year ended December 31, 2013, the Portfolio incurred less than $500 in brokerage commissions with Morgan Stanley & Co., LLC, an affiliate of the Adviser, Administrator and Distributor, for portfolio transactions executed on behalf of the Portfolio.
From January 1, 2013 to June 30, 2013, the Portfolio incurred less than $500 in brokerage commissions with Citigroup, Inc., and its affiliated broker-dealers, which may be deemed affiliates of the Adviser, Distributor and Administrator under Section 17 of the Act, for portfolio transactions executed on behalf of the Portfolio. Citigroup, Inc. and its affiliated broker-dealers ceased to be affiliates of the Portfolio pursuant to Section 17 of the Act as of July 1, 2013.
H. Federal Income Taxes: It is the Portfolio's intention to continue to qualify as a regulated investment company and distribute all of its taxable and tax-exempt income. Accordingly, no provision for Federal income taxes is required in the financial statements.
The Portfolio may be subject to taxes imposed by countries in which it invests. Such taxes are generally based on income and/or capital gains earned or repatriated. Taxes are accrued based on net investment income, net realized gains and net unrealized appreciation as such income and/or gains are earned. Taxes may also be based on transactions in foreign currency and are accrued based on the value of investments denominated in such currency.
FASB ASC 740-10, Income Taxes — Overall, sets forth a minimum threshold for financial statement recognition of the benefit of a tax position taken or expected to be taken in a tax return. Management has concluded there are no significant uncertain tax positions that would require recognition in the financial statements. If applicable, the Portfolio recognizes interest accrued related to unrecognized tax benefits in "Interest Expense" and penalties in "Other Expenses" in the Statement of Operations. The Portfolio files tax returns with the U.S. Internal Revenue Service, New York and various states. Each of the tax years in the three-year period ended December 31, 2013, remains subject to examination by taxing authorities.
The tax character of distributions paid may differ from the character of distributions shown in the Statements of Changes in Net Assets due to short-term capital gains being treated as
17
Morgan Stanley Institutional Fund, Inc.
Annual Report — December 31, 2013
Notes to Financial Statements (cont'd)
ordinary income for tax purposes. The tax character of distributions paid during fiscal years 2013 and 2012 was as follows:
2013
Distributions
Paid From: | | 2012
Distributions
Paid From: | |
Ordinary
Income
(000) | | Long-Term
Capital Gain
(000) | | Ordinary
Income
(000) | | Long-Term
Capital Gain
(000) | |
| $ | 79 | | | $ | 74 | | | $ | 86 | | | $ | — | | |
The amount and character of income and gains to be distributed are determined in accordance with income tax regulations which may differ from GAAP. These book/tax differences are either considered temporary or permanent in nature.
Temporary differences are attributable to differing book and tax treatments for the timing of the recognition of gains (losses) on certain investment transactions and the timing of the deductibility of certain expenses.
Permanent differences, primarily due to differing treatments of gains (losses) related to foreign currency transactions, resulted in the following reclassifications among the components of net assets at December 31, 2013:
Accumulated
Undistributed
Net Investment
Income
(000) | | Accumulated
Net Realized
Gain
(000) | | Paid-in-
Capital
(000) | |
| | — | @ | | | (— | @) | | | (— | @) | |
@ Amount is less than $500.
At December 31, 2013, the components of distributable earnings for the Portfolio on a tax basis were as follows:
Undistributed
Ordinary
Income
(000) | | Undistributed
Long-Term
Capital Gain
(000) | |
| $ | 11 | | | $ | 147 | | |
At December 31, 2013, the aggregate cost for Federal income tax purposes is approximately $1,722,000. The aggregate gross unrealized appreciation is approximately $433,000 and the aggregate gross unrealized depreciation is approximately $15,000 resulting in net unrealized appreciation of approximately $418,000.
I. Other (unaudited): At December 31, 2013, the Portfolio had otherwise unaffiliated record owners of 10% or greater. Investment activities of these shareholders could have a material impact on the Portfolio. The aggregate percentage of such owners was 19%, 85% and 86%, for Class I, Class A and Class L shares, respectively.
J. Accounting Pronouncement: In June 2013, FASB issued Accounting Standards Update 2013-08 Financial Services — Investment Companies (Topic 946) — Amendments to the Scope, Measurement, and Disclosure Requirements ("ASU 2013-08") which is effective for interim and annual reporting periods in fiscal years that begin after December 15, 2013. ASU 2013-08 sets forth a methodology for determining whether an entity should be characterized as an investment company and prescribes fair value accounting for an investment company's non-controlling ownership interest in another investment company. FASB has determined that a fund registered under the Investment Company Act of 1940 automatically meets ASU 2013-08's criteria for an investment company. Although still evaluating the potential impacts of ASU 2013-08 to the Portfolio, management expects that the impact of the Portfolio's adoption will be limited to additional financial statement disclosures.
18
Morgan Stanley Institutional Fund, Inc.
Annual Report — December 31, 2013
Report of Independent Registered Public Accounting Firm
To the Shareholders and Board of Directors of
Morgan Stanley Institutional Fund, Inc. —
Insight Portfolio
We have audited the accompanying statement of assets and liabilities, including the portfolio of investments, of Insight Portfolio (one of the portfolios constituting Morgan Stanley Institutional Fund, Inc.) (the "Portfolio") as of December 31, 2013, and the related statement of operations for the year then ended, the statements of changes in net assets for each of the two years in the period then ended, and the financial highlights for each of the periods indicated therein. These financial statements and financial highlights are the responsibility of the Portfolio's management. Our responsibility is to express an opinion on these financial statements and financial highlights based on our audits.
We conducted our audits in accordance with the standards of the Public Company Accounting Oversight Board (United States). Those standards require that we plan and perform the audit to obtain reasonable assurance about whether the financial statements and financial highlights are free of material misstatement. We were not engaged to perform an audit of the Portfolio's internal control over financial reporting. Our audits included consideration of internal control over financial reporting as a basis for designing audit procedures that are appropriate in the circumstances, but not for the purpose of expressing an opinion on the effectiveness of the Portfolio's internal control over financial reporting. Accordingly, we express no such opinion. An audit also includes examining, on a test basis, evidence supporting the amounts and disclosures in the financial statements and financial highlights, assessing the accounting principles used and significant estimates made by management, and evaluating the overall financial statement presentation. Our procedures included confirmation of securities owned as of December 31, 2013, by correspondence with the custodian and others. We believe that our audits provide a reasonable basis for our opinion.
In our opinion, the financial statements and financial highlights referred to above present fairly, in all material respects, the financial position of Insight Portfolio (one of the portfolios constituting Morgan Stanley Institutional Fund, Inc.) at December 31, 2013, the results of its operations for the year then ended, the changes in its net assets for each of the two years in the period then ended, and the financial highlights for each of the periods indicated therein, in conformity with U.S. generally accepted accounting principles.

Boston, Massachusetts
February 26, 2014
19
Morgan Stanley Institutional Fund, Inc.
Annual Report — December 31, 2013
Federal Tax Notice (unaudited)
For Federal income tax purposes, the following information is furnished with respect to the distributions paid by the Portfolio during its taxable year ended December 31, 2013. For corporate shareholders, 19.0% of the dividends qualified for the dividends received deduction.
The Portfolio designated and paid approximately $74,000 as a long-term capital gain distribution.
For Federal income tax purposes, the following information is furnished with respect to the Portfolio's earnings for its taxable year ended December 31, 2013. When distributed, certain earnings may be subject to a maximum tax rate of 15% as provided for the Jobs and Growth Tax Relief Reconciliation Act of 2003. The Portfolio designated up to a maximum of $43,000 as taxable at this lower rate.
In January, the Portfolio provides tax information to shareholders for the preceding calendar year.
20
Morgan Stanley Institutional Fund, Inc.
Annual Report — December 31, 2013
U.S. Privacy Policy (unaudited)
AN IMPORTANT NOTICE CONCERNING OUR U.S. PRIVACY POLICY
This privacy notice describes the U.S. privacy policy of Morgan Stanley Distribution, Inc., and the Morgan Stanley family of mutual funds ("us", "our", "we").
We are required by federal law to provide you with notice of our U.S. privacy policy ("Policy"). This Policy applies to both our current and former clients unless we state otherwise and is intended for individual clients who purchase products or receive services from us for personal, family or household purposes. This Policy is not applicable to partnerships, corporations, trusts or other non-individual clients or account holders, nor is this Policy applicable to individuals who are either beneficiaries of a trust for which we serve as trustee or participants in an employee benefit plan administered or advised by us. This Policy is, however, applicable to individuals who select us to be a custodian of securities or assets in individual retirement accounts, 401(k) accounts, or accounts subject to the Uniform Gifts to Minors Act.
This notice sets out our business practices to protect your privacy; how we collect and share personal information about you; and how you can limit our sharing or certain uses by others of this information. We may amend this Policy at any time, and will inform you of any changes to our Policy as required by law.
WE RESPECT YOUR PRIVACY
We appreciate that you have provided us with your personal financial information and understand your concerns about your information. We strive to safeguard the information our clients entrust to us. Protecting the confidentiality and security of client information is an important part of how we conduct our business.
This notice describes what personal information we collect about you, how we collect it, when we may share it with others, and how certain others may use it. It discusses the steps you may take to limit our sharing of certain information about you with our affiliated companies, including, but not limited to our affiliated banking businesses, brokerage firms and credit service affiliates. It also discloses how you may limit our affiliates' use of shared information for marketing purposes.
Throughout this Policy, we refer to the nonpublic information that personally identifies you as "personal information." We also use the term "affiliated company" in this notice. An affiliated company is a company in our family of companies and includes companies with the Morgan Stanley name. These affiliated companies are financial institutions such as broker-dealers, banks, investment advisers and credit card issuers. We refer to any company that is not an affiliated company as a nonaffiliated third party. For purposes of Section 5 of this notice, and your ability to limit certain uses of personal information by our affiliates, this notice applies to the use of personal information by our affiliated companies.
1. WHAT PERSONAL INFORMATION DO WE COLLECT FROM YOU?
We may collect the following types of information about you: (i) information provided by you, including information from applications and other forms we receive from you, (ii) information about your transactions with us or our affiliates, (iii) information about your transactions with nonaffiliated third parties, (iv) information from consumer reporting agencies, (v) information obtained from our websites, and (vi) information obtained from other sources. For example:
• We collect information such as your name, address, e-mail address, telephone/fax numbers, assets, income and investment objectives through applications and other forms you submit to us.
• We may obtain information about account balances, your use of account(s) and the types of products and services you prefer to receive from us through your dealings and transactions with us and other sources.
• We may obtain information about your creditworthiness and credit history from consumer reporting agencies.
• We may collect background information from and through third-party vendors to verify representations you have made and to comply with various regulatory requirements.
2. WHEN DO WE DISCLOSE PERSONAL INFORMATION WE COLLECT ABOUT YOU?
We may disclose personal information we collect about you in each of the categories listed above to affiliated and nonaffiliated third parties.
21
Morgan Stanley Institutional Fund, Inc.
Annual Report — December 31, 2013
U.S. Privacy Policy (unaudited) (cont'd)
a. Information we disclose to affiliated companies.
We may disclose personal information that we collect about you to our affiliated companies to manage your account(s) effectively, to service and process your transactions, and to let you know about products and services offered by us and affiliated companies, to manage our business, and as otherwise required or permitted by law. Offers for products and services from affiliated companies are developed under conditions designed to safeguard your personal information.
b. Information we disclose to third parties.
We may disclose personal information that we collect about you to nonaffiliated third parties to provide marketing services on our behalf or to other financial institutions with whom we have joint marketing agreements. We may also disclose all of the information we collect to other nonaffiliated third parties for our everyday business purposes, such as to process transactions, maintain account(s), respond to court orders and legal investigations, report to credit bureaus, offer our own products and services, protect against fraud, for institutional risk control, to perform services on our behalf, and as otherwise required or permitted by law.
When we share personal information about you with a nonaffiliated third party, they are required to limit their use of personal information about you to the particular purpose for which it was shared and they are not allowed to share personal information about you with others except to fulfill that limited purpose or as may be permitted or required by law.
3. HOW DO WE PROTECT THE SECURITY AND CONFIDENTIALITY OF PERSONAL INFORMATION WE COLLECT ABOUT YOU?
We maintain physical, electronic and procedural security measures that comply with applicable law and regulations to help safeguard the personal information we collect about you. We have internal policies governing the proper handling of client information by employees. Third parties that provide support or marketing services on our behalf may also receive personal information about you, and we require them to adhere to appropriate security standards with respect to such information.
4. HOW CAN YOU LIMIT OUR SHARING CERTAIN PERSONAL INFORMATION ABOUT YOU WITH OUR AFFILIATED COMPANIES FOR ELIGIBILITY DETERMINATION?
By following the opt-out procedures in Section 6 below, you may limit the extent to which we share with our affiliated companies, personal information that was collected to determine your eligibility for products and services such as your credit reports and other information that you have provided to us or that we may obtain from third parties ("eligibility information"). Eligibility information does not include your identification information or personal information pertaining to our transactions or experiences with you. Please note that, even if you direct us not to share eligibility information with our affiliated companies, we may still share your personal information, including eligibility information, with our affiliated companies under circumstances that are permitted under applicable law, such as to process transactions or to service your account.
5. HOW CAN YOU LIMIT THE USE OF CERTAIN PERSONAL INFORMATION ABOUT YOU BY OUR AFFILIATED COMPANIES FOR MARKETING?
By following the opt-out instructions in Section 6 below, you may limit our affiliated companies from marketing their products or services to you based on personal information we disclose to them. This information may include, for example, your income and account history with us. Please note that, even if you choose to limit our affiliated companies from using personal information about you that we may share with them for marketing their products and services to you, our affiliated companies may use your personal information that they obtain from us to market to you in circumstances permitted by law, such as if the affiliated party has its own relationship with you.
22
Morgan Stanley Institutional Fund, Inc.
Annual Report — December 31, 2013
U.S. Privacy Policy (unaudited) (cont'd)
6. HOW CAN YOU SEND US AN OPT-OUT INSTRUCTION?
If you wish to limit our sharing of eligibility information about you with our affiliated companies, or our affiliated companies' use of personal information for marketing purposes, as described in this notice, you may do so by:
• Calling us at (800) 548-7786
Monday–Friday between 8a.m. and 5p.m. (EST)
• Writing to us at the following address:
Boston Financial Data Services, Inc.
c/o Privacy Coordinator
P.O. Box 219804
Kansas City, Missouri 64121
If you choose to write to us, your request should include: your name, address, telephone number and account number(s) to which the opt-out applies and whether you are opting out with respect to sharing of eligibility information (Section 4 above), or information used for marketing (Section 5 above), or both. Written opt-out requests should not be sent with any other correspondence. In order to process your request, we require that the request be provided by you directly and not through a third party. Once you have informed us about your privacy preferences, your opt-out preference will remain in effect with respect to this Policy (as it may be amended) until you notify us otherwise. If you are a joint account owner, we will accept instructions from any one of you and apply those instructions to the entire account.
Please understand that if you limit our sharing or our affiliated companies' use of personal information, you and any joint account holder(s) may not receive information about our affiliated companies' products and services, including products or services that could help you manage your financial resources and achieve your investment objectives.
If you have more than one account or relationship with us, please specify the accounts to which you would like us to apply your privacy choices. If you have accounts or relationships with our affiliates, you may receive multiple privacy policies from them, and will need to separately notify those companies of your privacy choices for those accounts or relationships.
7. WHAT IF AN AFFILIATED COMPANY BECOMES A NONAFFILIATED THIRD PARTY?
If, at any time in the future, an affiliated company becomes a nonaffiliated third party, further disclosures of personal information made to the former affiliated company will be limited to those described in Section 2(b) above relating to nonaffiliated third parties. If you elected under Section 6 to limit disclosures we make to affiliated companies, or use of personal information by affiliated companies, your election will not apply to use by any former affiliated company of your personal information in their possession once it becomes a nonaffiliated third party.
SPECIAL NOTICE TO RESIDENTS OF VERMONT
The following section supplements our Policy with respect to our individual clients who have a Vermont address and supersedes anything to the contrary in the above Policy with respect to those clients only.
The State of Vermont requires financial institutions to obtain your consent prior to sharing personal information that they collect about you with nonaffiliated third parties, or eligibility information with affiliated companies, other than in certain limited circumstances. Except as permitted by law, we will not share personal information we collect about you with nonaffiliated third parties or eligibility information with affiliated companies, unless you provide us with your written consent to share such information.
SPECIAL NOTICE TO RESIDENTS OF CALIFORNIA
The following section supplements our Policy with respect to our individual clients who have a California address and supersedes anything to the contrary in the above Policy with respect to those clients only.
In response to a California law, if your account has a California home address, your personal information will not be disclosed to nonaffiliated third parties except as permitted by applicable California law, and we will limit sharing such personal information with our affiliates to comply with California privacy laws that apply to us.
23
Morgan Stanley Institutional Fund, Inc.
Annual Report — December 31, 2013
Director and Officer Information (unaudited)
Independent Director:
Name, Age and Address of
Independent Director | | Position(s)
Held with
Registrant | | Length of Time
Served* | | Principal Occupation(s) During Past 5 Years | | Number of
Portfolios in
Fund Complex
Overseen by
Independent
Director** | | Other Directorships
Held by Independent
Director*** | |
Frank L. Bowman (69)
c/o Kramer Levin Naftalis &
Frankel LLP
Counsel to the Independent Directors
1177 Avenue of the Americas
New York, NY 10036 | | Director | | Since
August
2006 | | President, Strategic Decisions, LLC (consulting) (since February 2009); Director or Trustee of various Morgan Stanley Funds (since August 2006); Chairperson of the Insurance Sub-Committee of the Compliance and Insurance Committee (since February 2007); served as President and Chief Executive Officer of the Nuclear Energy Institute (policy organization) (February 2005-November 2008); retired as Admiral, U.S. Navy after serving over 38 years on active duty including 8 years as Director of the Naval Nuclear Propulsion Program in the Department of the Navy and the U.S. Department of Energy (1996-2004); served as Chief of Naval Personnel (July 1994-September 1996); and on the Joint Staff as Director of Political Military Affairs (June 1992-July 1994); knighted as Honorary Knight Commander of the Most Excellent Order of the British Empire; awarded the Officier de l'Orde National du Mérite by the French Government; elected to the National Academy of Engineering (2009). | | | 98 | | | Director of BP p.l.c.; Director of Naval and Nuclear Technologies LLP; Director of the Armed Services YMCA of the USA and the U.S. Naval Submarine League; Director of the American Shipbuilding Suppliers Association; Member of the National Security Advisory Council of the Center for U.S. Global Engagement and a member of the CNA Military Advisory Board; Chairman of the charity J Street Cup Golf, Trustee of the Fairhaven United Methodist Church. | |
Michael Bozic (73)
c/o Kramer Levin Naftalis & Frankel LLP
Counsel to the Independent Directors
1177 Avenue of the Americas
New York, NY 10036 | | Director | | Since
April
1994 | | Private investor and a member of the advisory board of American Road Group LLC (retail) (since June 2000); Chairperson of the Compliance and Insurance Committee (since October 2006); Director or Trustee of various Morgan Stanley Funds (since April 1994); formerly, Chairperson of the Insurance Committee (July 2006-September 2006); Vice Chairman of Kmart Corporation (December 1998-October 2000), Chairman and Chief Executive Officer of Levitz Furniture Corporation (November 1995-November 1998) and President and Chief Executive Officer of Hills Department Stores (May 1991-July 1995); variously Chairman, Chief Executive Officer, President and Chief Operating Officer (1987-1991) of the Sears Merchandise Group of Sears, Roebuck & Co. | | | 100 | | | Trustee and member of the Hillsdale College Board of Trustees. | |
Kathleen A. Dennis (60)
c/o Kramer Levin Naftalis & Frankel LLP
Counsel to the Independent Directors
1177 Avenue of the Americas
New York, NY 10036 | | Director | | Since
August
2006 | | President, Cedarwood Associates (mutual fund and investment management consulting) (since July 2006); Chairperson of the Money Market and Alternatives Sub-Committee of the Investment Committee (since October 2006) and Director or Trustee of various Morgan Stanley Funds (since August 2006); formerly, Senior Managing Director of Victory Capital Management (1993-2006). | | | 98 | | | Director of various non-profit organizations. | |
Dr. Manuel H. Johnson (65)
c/o Johnson Smick
International, Inc.
220 I Street, N.E.
Suite 200
Washington, D.C. 20002 | | Director | | Since
July
1991 | | Senior Partner, Johnson Smick International, Inc. (consulting firm); Chairperson of the Investment Committee (since October 2006) and Director or Trustee of various Morgan Stanley Funds (since July 1991); Co-Chairman and a founder of the Group of Seven Council (G7C) (international economic commission); formerly, Chairperson of the Audit Committee (July 1991-September 2006), Vice Chairman of the Board of Governors of the Federal Reserve System and Assistant Secretary of the U.S. Treasury. | | | 101 | | | Director of NVR, Inc. (home construction). | |
24
Morgan Stanley Institutional Fund, Inc.
Annual Report — December 31, 2013
Director and Officer Information (unaudited) (cont'd)
Independent Director: (cont'd)
Name, Age and Address of
Independent Director | | Position(s)
Held with
Registrant | | Length of Time
Served* | | Principal Occupation(s) During Past 5 Years | | Number of
Portfolios in
Fund Complex
Overseen by
Independent
Director** | | Other Directorships
Held by Independent
Director*** | |
Joseph J. Kearns (71)
c/o Kearns & Associates LLC
PMB754
22631 Pacific Coast Highway
Malibu, CA 90265 | | Director | | Since
August
1994 | | President, Kearns & Associates LLC (investment consulting); Chairperson of the Audit Committee (since October 2006) and Director or Trustee of various Morgan Stanley Funds (since August 1994); formerly, Deputy Chairperson of the Audit Committee (July 2003-September 2006) and Chairperson of the Audit Committee of various Morgan Stanley Funds (since August 1994); CFO of the J. Paul Getty Trust. | | | 101 | | | Director of Electro Rent Corporation (equipment leasing) and The Ford Family Foundation. | |
Michael F. Klein (55)
c/o Kramer Levin Naftalis & Frankel LLP
Counsel to the
Independent Directors
1177 Avenue of the Americas
New York, NY 10036 | | Director | | Since
August
2006 | | Managing Director, Aetos Capital, LLC (since March 2000) and Co-President, Aetos Alternatives Management, LLC (since January 2004) and Co-Chief Executive Officer of Aetos Capital LLC (since August 2013); Chairperson of the Fixed Income Sub-Committee of the Investment Committee (since October 2006) and Director or Trustee of various Morgan Stanley Funds (since August 2006); formerly, Managing Director, Morgan Stanley & Co. Inc. and Morgan Stanley Dean Witter Investment Management, President, various Morgan Stanley Funds (June 1998-March 2000) and Principal, Morgan Stanley & Co. Inc. and Morgan Stanley Dean Witter Investment Management (August 1997-December 1999). | | | 98 | | | Director of certain investment funds managed or sponsored by Aetos Capital, LLC. Director of Sanitized AG and Sanitized Marketing AG (specialty chemicals). | |
Michael E. Nugent (77)
522 Fifth Avenue
New York, NY 10036 | | Chairperson of the Board and Director | | Chairperson of the Boards since July 2006 and Director since July 1991 | | Chairperson of the Boards of various Morgan Stanley Funds (since July 2006); Chairperson of the Closed-End Fund Committee (since June 2012) and Director or Trustee of various Morgan Stanley Funds (since July 1991); formerly, Chairperson of the Insurance Committee (until July 2006); General Partner, Triumph Capital, L.P. (private investment partnership) (1988-2013) | | | 100 | | | None. | |
W. Allen Reed (66)
c/o Kramer Levin Naftalis & Frankel LLP
Counsel to the
Independent Directors
1177 Avenue of the Americas
New York, NY 10036 | | Director | | Since
August
2006 | | Chairperson of the Equity Sub-Committee of the Investment Committee (since October 2006) and Director or Trustee of various Morgan Stanley Funds (since August 2006); formerly, President and CEO of General Motors Asset Management; Chairman and Chief Executive Officer of the GM Trust Bank and Corporate Vice President of General Motors Corporation (August 1994-December 2005). | | | 98 | | | Director of Temple-Inland Industries (packaging and forest products); Director of Legg Mason, Inc. and Director of the Auburn University Foundation. | |
Fergus Reid (81)
c/o Joe Pietryka, Inc.
85 Charles Colman Blvd.
Pawling, NY 12564 | | Director | | Since
June
1992 | | Chairman, Joe Pietryka, Inc.; Chairperson of the Governance Committee and Director or Trustee of various Morgan Stanley Funds (since June 1992). | | | 101 | | | Through December 31, 2012, Trustee and Director of certain Investment companies in the JP Morgan Fund Complex. | |
25
Morgan Stanley Institutional Fund, Inc.
Annual Report — December 31, 2013
Director and Officer Information (unaudited) (cont'd)
Interested Director:
Name, Age and Address of
Interested Director | | Position(s) Held
with Registrant | | Length of
Time Served* | | Principal Occupation(s) During Past 5 Years | | Number of
Portfolios in
Fund Complex
Overseen by
Interested
Director** | | Other Directorships
Held by Interested
Director*** | |
James F. Higgins (66)
One New York Plaza
New York, NY 10004 | | Director | | Since
June
2000 | | Director or Trustee of various Morgan Stanley Funds (since June 2000); Senior Advisor of Morgan Stanley (since August 2000). | | | 99 | | | Formerly, Director of AXA Financial, Inc. and AXA Equitable Life Insurance Company (2002-2011) and Director of AXA MONY Life Insurance Company and AXA MONY Life Insurance Company of America (2004-2011). | |
* Each Director serves an indefinite term, until his or her successor is elected.
** The Fund Complex includes (as of December 31, 2013) all open-end and closed-end funds (including all of their portfolios) advised by Morgan Stanley Investment Management Inc. (the "Adviser") and any funds that have an adviser that is an affiliated person of the Adviser (including, but not limited to, Morgan Stanley AIP GP LP).
*** This includes any directorships at public companies and registered investment companies held by the Director at any time during the past five years.
26
Morgan Stanley Institutional Fund, Inc.
Annual Report — December 31, 2013
Director and Officer Information (unaudited) (cont'd)
Executive Officers:
Name, Age and Address of Executive Officer | | Position(s) Held
with
Registrant | | Length of
Time Served* | | Principal Occupation(s) During Past 5 Years | |
John H. Gernon (50)
522 Fifth Avenue
New York, NY 10036 | | President and Principal Executive Officer—Equity, Fixed Income and AIP Funds | | Since September 2013 | | President and Principal Executive Officer of the Equity and Fixed Income Funds and the Morgan Stanley AIP Funds (since September 2013) in the Fund Complex. Managing Director of the Adviser. | |
Stefanie V. Chang Yu (47)
522 Fifth Avenue
New York, NY 10036 | | Chief Compliance Officer | | Since
January
2014 | | Managing Director of the Adviser and various entities affiliated with the Adviser; Chief Compliance Officer of various Morgan Stanley Funds and the Adviser (since January 2014). Formerly, Vice President of various Morgan Stanley Funds (December 1997-January 2014). | |
Joseph C. Benedetti (48)
522 Fifth Avenue
New York, NY 10036 | | Vice President | | Since
January
2014 | | Managing Director of the Adviser and various entities affiliated with the Adviser; Vice President of various Morgan Stanley Funds (since January 2014). Formerly, Assistant Secretary of various Morgan Stanley Funds (October 2004-January 2014). | |
Francis J. Smith (48)
522 Fifth Avenue
New York, NY 10036 | | Treasurer and Principal Financial Officer | | Treasurer since July 2003 and Principal Financial Officer since September 2002 | | Executive Director of the Adviser and various entities affiliated with the Adviser; Treasurer and Principal Financial Officer of various Morgan Stanley Funds (since July 2003). | |
Mary E. Mullin (46)
522 Fifth Avenue
New York, NY 10036 | | Secretary | | Since
June
1999 | | Executive Director of the Adviser and various entities affiliated with the Adviser; Secretary of various Morgan Stanley Funds (since June 1999). | |
* Each officer serves an indefinite term, until his or her successor is elected.
27
Morgan Stanley Institutional Fund, Inc.
Annual Report — December 31, 2013
Adviser and Administrator
Morgan Stanley Investment Management Inc.
522 Fifth Avenue
New York, New York 10036
Distributor
Morgan Stanley Distribution, Inc.
522 Fifth Avenue
New York, New York 10036
Dividend Disbursing and Transfer Agent
Boston Financial Data Services, Inc.
2000 Crown Colony Drive
Quincy, Massachusetts 02169
Custodian
State Street Bank and Trust Company
One Lincoln Street
Boston, Massachusetts 02111
Legal Counsel
Dechert LLP
1095 Avenue of the Americas
New York, New York 10036
Counsel to the Independent Directors
Kramer Levin Naftalis & Frankel LLP
1177 Avenue of the Americas
New York, New York 10036
Independent Registered Public Accounting Firm
Ernst & Young LLP
200 Clarendon Street
Boston, Massachusetts 02116
Reporting to Shareholders
Each Morgan Stanley fund provides a complete schedule of portfolio holdings in its semi-annual and annual reports within 60 days of the end of the fund's second and fourth fiscal quarters by filing the schedule electronically with the Securities and Exchange Commission (SEC). The semi-annual reports are filed on Form N-CSRS and the annual reports are filed on Form N-CSR. Morgan Stanley also delivers the semi-annual and annual reports to fund shareholders and makes these reports available on its public website, www.morganstanley.com/im. Each Morgan Stanley fund also files a complete schedule of portfolio holdings with the SEC for the fund's first and third fiscal quarters on Form N-Q. Morgan Stanley does not deliver the reports for the first and third fiscal quarters to shareholders, nor are the reports posted to the Morgan Stanley public website. You may, however, obtain the Form N-Q filings (as well as the Form N-CSR and N-CSRS filings) by accessing the SEC's website, www.sec.gov. You may also review and copy them at the SEC's Public Reference Room in Washington, DC. Information on the operation of the SEC's Public Reference Room may be obtained by calling the SEC toll free at 1 (800) SEC-0330. You can also request copies of these materials, upon payment of a duplicating fee, by electronic request at the SEC's email address (publicinfo@sec.gov) or by writing the Public Reference Room of the SEC, Washington, DC 20549-0102.
Proxy Voting Policies and Procedures and Proxy Voting Record
You may obtain a copy of the Fund's Proxy Voting Policy and Procedures and information regarding how the Fund voted proxies relating to portfolio securities during the most recent twelve-month period ended June 30, without charge, upon request, by calling toll free 1 (800) 548-7786 or by visiting our website at www.morganstanley.com/im. This information is also available on the SEC's website at www.sec.gov.
This report is authorized for distribution only when preceded or accompanied by a prospectus of the Morgan Stanley Institutional Fund, Inc. which describes in detail each Investment Portfolio's investment policies, risks, fees and expenses. Please read the prospectus carefully before you invest or send money. For additional information, including information regarding the investments comprising the Portfolio, please visit our website at www.morganstanley.com/im or call toll free 1 (800) 548-7786.
28
(This Page has been left blank intentionally.)
Printed in U.S.A.
This Report has been prepared for shareholders and may be distributed to others only if preceded or accompanied by a current prospectus.
Morgan Stanley Investment Management Inc.
522 Fifth Avenue
New York, New York 10036
© 2014 Morgan Stanley. Morgan Stanley Distribution, Inc.

IFIINSGTANN
809395 EXP 2.28.15

Morgan Stanley Institutional Fund, Inc.
Growth Portfolio
Annual Report
December 31, 2013

Morgan Stanley Institutional Fund, Inc.
Annual Report — December 31, 2013
Shareholders' Letter | | | 2 | | |
Expense Example | | | 3 | | |
Investment Overview | | | 4 | | |
Portfolio of Investments | | | 6 | | |
Statement of Assets and Liabilities | | | 8 | | |
Statement of Operations | | | 10 | | |
Statements of Changes in Net Assets | | | 11 | | |
Financial Highlights | | | 13 | | |
Notes to Financial Statements | | | 17 | | |
Report of Independent Registered Public Accounting Firm | | | 26 | | |
Federal Tax Notice | | | 27 | | |
U.S. Privacy Policy | | | 28 | | |
Director and Officer Information | | | 31 | | |
This report is authorized for distribution only when preceded or accompanied by prospectuses of the Morgan Stanley Institutional Fund, Inc. To receive a prospectus and/or statement of additional information (SAI), which contains more complete information such as investment objectives, charges, expenses, policies for voting proxies, risk considerations, and describes in detail each of the Portfolio's investment policies to the prospective investor, please call toll free 1 (800) 548-7786. Please read the prospectuses carefully before you invest or send money.
Additionally, you can access portfolio information including performance, characteristics, and investment team commentary through Morgan Stanley Investment Management's website: www.morganstanley.com/im.
Market forecasts provided in this report may not necessarily come to pass. There is no guarantee that any sectors mentioned will continue to perform as discussed herein or that securities in such sectors will be held by the Portfolio in the future. There is no assurance that a Portfolio will achieve its investment objective. Portfolios are subject to market risk, which is the possibility that market values of securities owned by the Portfolio will decline and, therefore, the value of the Portfolio's shares may be less than what you paid for them. Accordingly, you can lose money investing in the Portfolio. Please see the prospectus for more complete information on investment risks.
1
Morgan Stanley Institutional Fund, Inc.
Annual Report — December 31, 2013
Shareholders' Letter (unaudited)
Dear Shareholders,
We are pleased to provide this Annual report, in which you will learn how your investment in Growth Portfolio (the "Portfolio") performed during the latest twelve-month period.
Morgan Stanley Investment Management is a client-centric, investor-led organization. Our global presence, intellectual capital, and breadth of products and services enable us to partner with investors to meet the evolving challenges of today's financial markets. We aim to deliver superior investment service and to empower our clients to make the informed decisions that help them reach their investment goals.
As always, we thank you for selecting Morgan Stanley Investment Management, and look forward to working with you in the months and years ahead.
Sincerely,

John H. Gernon
President and Principal Executive Officer
January 2014
2
Morgan Stanley Institutional Fund, Inc.
Annual Report — December 31, 2013
Expense Example (unaudited)
Growth Portfolio
As a shareholder of the Portfolio, you incur two types of costs: (1) transactional costs; and (2) ongoing costs, including advisory fees, administration fees, distribution and shareholder services fees and other Portfolio expenses. This example is intended to help you understand your ongoing costs (in dollars) of investing in the Portfolio and to compare these costs with the ongoing costs of investing in other mutual funds.
This example is based on an investment of $1,000 invested at the beginning of the six-month period ended December 31, 2013 and held for the entire six-month period.
Actual Expenses
The table below provides information about actual account values and actual expenses. You may use the information in this table, together with the amount you invested, to estimate the expenses that you paid over the period. Simply divide your account value by $1,000 (for example, an $8,600 account value divided by $1,000 = 8.6), then multiply the result by the number in the table under the heading entitled "Actual Expenses Paid During Period" to estimate the expenses you paid on your account during this period.
Hypothetical Example for Comparison Purposes
The table below provides information about hypothetical account values and hypothetical expenses based on the Portfolio's actual expense ratio and an assumed rate of return of 5% per year before expenses, which is not the Portfolio's actual return. The hypothetical account values and expenses may not be used to estimate the actual ending account balance or expenses you paid for the period. You may use this information to compare the ongoing costs of investing in the Portfolio and other funds. To do so, compare this 5% hypothetical example with the 5% hypothetical examples that appear in the shareholder reports of the other funds.
Please note that the expenses shown in the table are meant to highlight your ongoing costs only and do not reflect any transactional costs, such as sales charges (loads). Therefore, the information for each class in the table is useful in comparing ongoing costs only, and will not help you determine the relative total costs of owning different funds. In addition, if these transactional costs were included, your costs would have been higher.
| | | Beginning
Account
Value
7/1/13 | | Actual Ending
Account
Value
12/31/13 | | Hypothetical
Ending Account
Value | | Actual
Expenses
Paid
During
Period | | Hypothetical
Expenses Paid
During Period | | Net
Expense
Ratio
During
Period*** | |
Growth Portfolio Class I | | $ | 1,000.00 | | | $ | 1,322.70 | | | $ | 1,021.68 | | | $ | 4.10 | * | | $ | 3.57 | * | | | 0.70 | % | |
Growth Portfolio Class A^ | | | 1,000.00 | | | | 1,320.90 | | | | 1,020.42 | | | | 5.56 | * | | | 4.84 | * | | | 0.95 | | |
Growth Portfolio Class L | | | 1,000.00 | | | | 1,316.90 | | | | 1,017.09 | | | | 9.40 | * | | | 8.19 | * | | | 1.61 | | |
Growth Portfolio Class IS | | | 1,000.00 | | | | 1,162.00 | | | | 1,012.90 | | | | 1.90 | ** | | | 1.77 | ** | | | 0.60 | | |
* Expenses are calculated using each Portfolio Class' annualized net expense ratio (as disclosed), multiplied by the average account value over the period, and multiplied by 184/365 (to reflect the most recent one-half year period).
** Expenses are calculated using the Portfolio Class' annualized net expense ratio (as disclosed), multiplied by the average account value over the period, and multiplied by 107/365 (to reflect the actual days in the period).
*** Annualized.
^ Effective September 9, 2013, Class P and Class H shares were renamed Class A shares.
3
Morgan Stanley Institutional Fund, Inc.
Annual Report — December 31, 2013
Investment Overview (unaudited)
Growth Portfolio
The Growth Portfolio seeks long-term capital appreciation by investing primarily in growth-oriented equity securities of large capitalization companies.
Performance
For the year ended December 31, 2013, the Portfolio had a total return based on net asset value and reinvestment of distributions per share of 48.60%, net of fees, for Class I shares. The Portfolio's Class I shares outperformed against its benchmark, the Russell 1000® Growth Index (the "Index"), which returned 33.48%. Please keep in mind that high double-digit returns are highly unusual and cannot be sustained.
Factors Affecting Performance
• U.S. stocks turned in a strong performance for the year ended December 31, 2013. As in 2012, the expectation that accommodative monetary policy by the U.S. Federal Reserve (Fed) would continue for some time helped drive the prices of risky assets including stocks higher in 2013. However, as the U.S. economy began to look stronger, the Fed started signaling its intention to reduce the pace of its asset purchase program (known as quantitative easing or QE) if economic data warranted. Uncertainty as to the timing and magnitude of this tapering led to volatility across the capital markets. When the Fed unexpectedly left its QE program intact after its September meeting, stocks rallied strongly. The market's advance paused in October, disrupted by a partial government shutdown and political gridlock over whether to raise the debt ceiling, but resumed in the final months of the period on expectations — and later confirmation by the Fed — that QE tapering would begin in 2014.
• Nearly all of the Portfolio's outperformance came from two sectors: technology and consumer discretionary. Seven of the top 10 contributors to overall performance were from these two sectors. Within the technology sector, performance was led by a holding in an online social networking company. In consumer discretionary, a position in an online retailer was the most additive.
• Stock selection and an overweight in financial services also aided relative performance, with standout performance from a position in a credit card and transaction processing company.
• Relative detractors from performance included stock selection in the producer durables sector. Most of the Portfolio's producer durables holdings were additive to performance but a lack of exposure to strong-performing groups such as aerospace and diversified manufacturing operations was disadvantageous.
• Although stock selection in health care was favorable, it did not offset the relative loss from an underweight in the sector.
Management Strategies
• We look for high-quality growth companies that we believe have these attributes: sustainable competitive advantages, above-average business visibility, rising return on invested capital, strong free cash flow generation and a favorable risk/reward. We find these companies through intense fundamental research. Our emphasis is on secular growth, and as a result short-term market events are not as meaningful in the stock selection process.
* Minimum Investment for Class I shares
In accordance with SEC regulations, Portfolio's performance shown assumes that all recurring fees (including management fees) were deducted and all dividends and distributions were reinvested. The performance of Class A+, L and IS shares will vary from Class I shares based upon their different inception dates and will be negatively impacted by additional fees assessed to those classes (if applicable).
4
Morgan Stanley Institutional Fund, Inc.
Annual Report — December 31, 2013
Investment Overview (unaudited) (cont'd)
Growth Portfolio
Performance Compared to the Russell 1000® Growth Index(1) and the Lipper Large-Cap Growth Funds Index(2)
| | | Period Ended December 31, 2013
Total Returns(3) | |
| | | | | Average Annual | |
| | | One
Year | | Five
Years | | Ten
Years | | Since
Inception(8) | |
Portfolio — Class I Shares
w/o sales charges(4) | | | 48.60 | % | | | 27.31 | % | | | 10.15 | % | | | 10.53 | % | |
Russell 1000® Growth Index | | | 33.48 | | | | 20.39 | | | | 7.83 | | | | 8.59 | | |
Lipper Large-Cap Growth Funds Index | | | 35.41 | | | | 19.43 | | | | 7.08 | | | | 8.03 | | |
Portfolio — Class A+ Shares
w/o sales charges(5) | | | 48.22 | | | | 27.00 | | | | 9.87 | | | | 9.25 | | |
Portfolio — Class A+ Shares with
maximum 5.25% sales charges(5) | | | 40.44 | | | | 25.64 | | | | 9.28 | | | | 8.92 | | |
Russell 1000® Growth Index | | | 33.48 | | | | 20.39 | | | | 7.83 | | | | 7.40 | | |
Lipper Large-Cap Growth Funds Index | | | 35.41 | | | | 19.43 | | | | 7.08 | | | | 6.55 | | |
Portfolio — Class L Shares
w/o sales charges(6) | | | 47.44 | | | | — | | | | — | | | | 22.91 | | |
Russell 1000® Growth Index | | | 33.48 | | | | — | | | | — | | | | 18.88 | | |
Lipper Large-Cap Growth Funds Index | | | 35.41 | | | | — | | | | — | | | | 19.13 | | |
Portfolio — Class IS Shares
w/o sales charges(7) | | | — | | | | — | | | | — | | | | 16.20 | | |
Russell 1000® Growth Index | | | — | | | | — | | | | — | | | | 11.03 | | |
Lipper Large-Cap Growth Funds Index | | | — | | | | — | | | | — | | | | 11.82 | | |
Performance data quoted represents past performance, which is no guarantee of future results, and current performance may be lower or higher than the figures shown. Performance assumes that all dividends and distributions, if any, were reinvested. For the most recent month-end performance figures, please visit www.morganstanley.com/im. Investment return and principal value will fluctuate so that Portfolio shares, when redeemed, may be worth more or less than their original cost. Total returns do not reflect the deduction of taxes that a shareholder would pay on Portfolio distributions or the redemption of Portfolio shares. Returns for periods less than one year are not annualized. Performance of share classes will vary due to difference in expenses.
+ Effective September 9, 2013, Class P shares were renamed Class A shares.
(1) The Russell 1000® Growth Index measures the performance of the large-cap growth segment of the U.S. equity universe. It includes those Russell 1000® Index companies with higher price-to-book ratios and higher forecasted growth values. The Russell 1000® Index is an index of approximately 1,000 of the largest U.S. companies based on a combination of market capitalization and current index membership. The Index is unmanaged and its returns do not include any sales charges or fees. Such costs would lower performance. It is not possible to invest directly in an index.
(2) The Lipper Large-Cap Growth Funds Index is an equally weighted performance index of the largest qualifying funds (based on net assets) in the Lipper Large-Cap Growth Funds classification. The Index, which is adjusted for capital gains distributions and income dividends, is unmanaged and should not be considered an investment. There are currently 30 funds represented in this Index. As of the date of this report, the Portfolio is in the Lipper Large-Cap Growth Funds classification.
(3) Total returns for the Portfolio reflect fees waived and expenses reimbursed, if applicable, by the Adviser. Without such waivers and reimbursements, total returns would have been lower. The fee waivers and/or expense reimbursements
will continue for at least one year or until such time as the Fund's Board of Directors acts to discontinue all or a portion of such waivers and/or expense reimbursements when it deems that such action is appropriate.
(4) Commenced operations on April 2, 1991.
(5) Commenced offering on January 2, 1996.
(6) Commenced offering on April 27, 2012.
(7) Commenced offering on September 13, 2013.
(8) For comparative purposes, average annual since inception returns listed for the Indexes refer to the inception date or initial offering of the respective share class of the Portfolio, not the inception of the Index. Returns for periods less than one year are not annualized.
Portfolio Composition*
Classification | | Percentage of
Total Investments | |
Other** | | | 42.1 | % | |
Computer Services, Software & Systems | | | 23.9 | | |
Diversified Retail | | | 14.9 | | |
Consumer Lending | | | 7.0 | | |
Investment Company | | | 6.6 | | |
Pharmaceuticals | | | 5.5 | | |
Total Investments | | | 100.0 | % | |
* Percentages indicated are based upon total investment (excluding Securities held as Collateral on Loaned Securities) as of December 31, 2013.
** Industries and/or investment types representing less than 5% of total investments.
5
Morgan Stanley Institutional Fund, Inc.
Annual Report — December 31, 2013
Portfolio of Investments
Growth Portfolio
| | | Shares | | Value
(000) | |
Common Stocks (93.7%) | |
Alternative Energy (0.9%) | |
Range Resources Corp. | | | 126,187 | | | $ | 10,639 | | |
Asset Management & Custodian (1.4%) | |
BlackRock, Inc. | | | 52,129 | | | | 16,497 | | |
Automobiles (1.8%) | |
Tesla Motors, Inc. (a)(b) | | | 144,710 | | | | 21,762 | | |
Beverage: Soft Drinks (0.9%) | |
Green Mountain Coffee Roasters, Inc. (a)(b) | | | 134,991 | | | | 10,203 | | |
Biotechnology (3.5%) | |
Illumina, Inc. (a) | | | 379,417 | | | | 41,971 | | |
Cable Television Services (0.9%) | |
Charter Communications, Inc., Class A (a) | | | 80,325 | | | | 10,985 | | |
Chemicals: Diversified (2.3%) | |
Monsanto Co. | | | 238,243 | | | | 27,767 | | |
Commercial Services (1.4%) | |
Intertek Group PLC (United Kingdom) | | | 314,781 | | | | 16,409 | | |
Communications Technology (2.9%) | |
Motorola Solutions, Inc. | | | 510,906 | | | | 34,486 | | |
Computer Services, Software & Systems (24.0%) | |
Baidu, Inc. ADR (China) (a) | | | 34,865 | | | | 6,202 | | |
Facebook, Inc., Class A (a) | | | 1,725,992 | | | | 94,343 | | |
Google, Inc., Class A (a) | | | 78,613 | | | | 88,102 | | |
LinkedIn Corp., Class A (a) | | | 74,698 | | | | 16,197 | | |
Qihoo 360 Technology Co., Ltd. ADR
(China) (a) | | | 67,601 | | | | 5,547 | | |
Salesforce.com, Inc. (a) | | | 642,600 | | | | 35,465 | | |
Twitter, Inc. (a)(b) | | | 485,723 | | | | 30,916 | | |
Workday, Inc., Class A (a) | | | 129,381 | | | | 10,759 | | |
| | | | 287,531 | | |
Computer Technology (3.7%) | |
Apple, Inc. | | | 57,931 | | | | 32,506 | | |
Yandex N.V., Class A (Russia) (a) | | | 283,466 | | | | 12,231 | | |
| | | | 44,737 | | |
Consumer Lending (7.0%) | |
Mastercard, Inc., Class A | | | 52,840 | | | | 44,146 | | |
Visa, Inc., Class A | | | 179,780 | | | | 40,033 | | |
| | | | 84,179 | | |
Diversified Media (2.9%) | |
McGraw Hill Financial, Inc. | | | 211,755 | | | | 16,559 | | |
Naspers Ltd., Class N (South Africa) | | | 169,559 | | | | 17,716 | | |
| | | | 34,275 | | |
Diversified Retail (14.9%) | |
Amazon.com, Inc. (a) | | | 239,606 | | | | 95,553 | | |
Groupon, Inc. (a) | | | 2,209,567 | | | | 26,007 | | |
NetFlix, Inc. (a) | | | 31,095 | | | | 11,448 | | |
Priceline.com, Inc. (a) | | | 39,042 | | | | 45,382 | | |
| | | | 178,390 | | |
Entertainment (0.4%) | |
Liberty Media Corp. (a) | | | 33,394 | | | | 4,891 | | |
| | | Shares | | Value
(000) | |
Financial Data & Systems (2.8%) | |
MSCI, Inc. (a) | | | 370,258 | | | $ | 16,188 | | |
Verisk Analytics, Inc., Class A (a) | | | 256,032 | | | | 16,826 | | |
| | | | 33,014 | | |
Health Care Services (0.6%) | |
athenahealth, Inc. (a) | | | 50,172 | | | | 6,748 | | |
Insurance: Multi-Line (0.9%) | |
American International Group, Inc. | | | 212,545 | | | | 10,850 | | |
Insurance: Property-Casualty (3.3%) | |
Arch Capital Group Ltd. (a) | | | 228,902 | | | | 13,663 | | |
Progressive Corp. (The) | | | 933,610 | | | | 25,460 | | |
| | | | 39,123 | | |
Medical Equipment (2.7%) | |
Intuitive Surgical, Inc. (a) | | | 82,975 | | | | 31,869 | | |
Pharmaceuticals (5.5%) | |
Mead Johnson Nutrition Co. | | | 370,059 | | | | 30,996 | | |
Valeant Pharmaceuticals International, Inc.
(Canada) (a) | | | 295,614 | | | | 34,705 | | |
| | | | 65,701 | | |
Radio & TV Broadcasters (0.4%) | |
Sirius XM Holdings, Inc. (a) | | | 1,241,193 | | | | 4,332 | | |
Recreational Vehicles & Boats (2.4%) | |
Edenred (France) | | | 869,720 | | | | 29,110 | | |
Restaurants (2.2%) | |
Starbucks Corp. | | | 331,933 | | | | 26,020 | | |
Semiconductors & Components (1.8%) | |
ARM Holdings PLC ADR (United Kingdom) | | | 228,985 | | | | 12,535 | | |
First Solar, Inc. (a) | | | 174,240 | | | | 9,520 | | |
| | | | 22,055 | | |
Textiles, Apparel & Shoes (2.2%) | |
Christian Dior SA (France) | | | 139,912 | | | | 26,437 | | |
Total Common Stocks (Cost $626,615) | | | 1,119,981 | | |
| | Notional
Amount | | | |
Call Options Purchased (0.0%) | |
Foreign Currency Options (0.0%) | |
USD/CNY December 2014 @ CNY 6.50 | | | 12,603,517 | | | | 21 | | |
USD/CNY December 2014 @ CNY 6.50 | | | 157,035,437 | | | | 263 | | |
USD/CNY December 2014 @ CNY 6.50 | | | 177,522,350 | | | | 302 | | |
Total Call Options Purchased (Cost $1,093) | | | 586 | | |
| | | Shares | | | |
Short-Term Investments (11.0%) | |
Securities held as Collateral on Loaned Securities (4.4%) | |
Investment Company (3.8%) | |
Morgan Stanley Institutional Liquidity
Funds — Money Market Portfolio —
Institutional Class (See Note G) | | | 45,060,388 | | | | 45,060 | | |
The accompanying notes are an integral part of the financial statements.
6
Morgan Stanley Institutional Fund, Inc.
Annual Report — December 31, 2013
Portfolio of Investments (cont'd)
Growth Portfolio
| | | Face
Amount
(000) | | Value
(000) | |
Repurchase Agreements (0.6%) | |
BNP Paribas Securities Corp. (0.01%,
dated 12/31/13, due 1/2/14;
proceeds $4,059; fully collateralized by
various U.S. Government Obligations;
0.63% - 3.63% due 8/15/16 - 2/15/21;
valued at $4,140) | | $ | 4,058,667 | | | $ | 4,059 | | |
Merrill Lynch & Co., Inc. (0.18%,
dated 12/31/13, due 1/2/14;
proceeds $2,899; fully collateralized by
various Common Stocks and Exchange
Traded Funds; valued at $3,133) | | | 2,899,048 | | | | 2,899 | | |
| | | | 6,958 | | |
Total Securities held as Collateral on Loaned
Securities (Cost $52,018) | | | 52,018 | | |
| | | Shares | | | |
Investment Company (6.6%) | |
Morgan Stanley Institutional Liquidity
Funds — Money Market Portfolio —
Institutional Class (See Note G)
(Cost $78,947) | | | 78,947,142 | | | | 78,947 | | |
Total Short-Term Investments (Cost $130,965) | | | 130,965 | | |
Total Investments (104.7%) (Cost $758,673)
Including $64,028 of Securities Loaned | | | 1,251,532 | | |
Liabilities in Excess of Other Assets (-4.7%) | | | (56,058 | ) | |
Net Assets (100.0%) | | $ | 1,195,474 | | |
(a) Non-income producing security.
(b) All or a portion of this security was on loan at December 31, 2013.
ADR American Depositary Receipt.
CNY — Chinese Yuan Renminbi
USD — United States Dollar
The accompanying notes are an integral part of the financial statements.
7
Morgan Stanley Institutional Fund, Inc.
Annual Report — December 31, 2013
Statement of Assets and Liabilities | | December 31, 2013
(000) | |
Assets: | |
Investments in Securities of Unaffiliated Issuers, at Value(1) (Cost $634,666) | | $ | 1,127,525 | | |
Investment in Security of Affiliated Issuer, at Value (Cost $124,007) | | | 124,007 | | |
Total Investments in Securities, at Value (Cost $758,673) | | | 1,251,532 | | |
Cash | | | 1,590 | | |
Receivable for Portfolio Shares Sold | | | 1,527 | | |
Receivable for Investments Sold | | | 1,155 | | |
Dividends Receivable | | | 284 | | |
Tax Reclaim Receivable | | | 234 | | |
Receivable from Affiliate | | | 3 | | |
Other Assets | | | 18 | | |
Total Assets | | | 1,256,343 | | |
Liabilities: | |
Collateral on Securities Loaned, at Value | | | 53,608 | | |
Payable for Investments Purchased | | | 3,884 | | |
Payable for Advisory Fees | | | 1,337 | | |
Payable for Sub Transfer Agency Fees | | | 498 | | |
Payable for Sub Transfer Agency Fees — Class I | | | 209 | | |
Payable for Sub Transfer Agency Fees — Class A* | | | 44 | | |
Due to Broker | | | 750 | | |
Payable for Portfolio Shares Redeemed | | | 331 | | |
Payable for Administration Fees | | | 77 | | |
Payable for Shareholder Services Fees — Class A* | | | 42 | | |
Payable for Distribution and Shareholder Services Fees — Class L | | | — | @ | |
Payable for Directors' Fees and Expenses | | | 32 | | |
Payable for Custodian Fees | | | 9 | | |
Payable for Professional Fees | | | 6 | | |
Payable for Transfer Agent Fees — Class I | | | 2 | | |
Payable for Transfer Agent Fees — Class A* | | | 1 | | |
Payable for Transfer Agent Fees — Class L | | | — | @ | |
Other Liabilities | | | 39 | | |
Total Liabilities | | | 60,869 | | |
Net Assets | | $ | 1,195,474 | | |
Net Assets Consist Of: | |
Paid-in-Capital | | $ | 708,576 | | |
Accumulated Undistributed Net Investment Income | | | 267 | | |
Accumulated Net Realized Loss | | | (6,229 | ) | |
Unrealized Appreciation (Depreciation) on: | |
Investments | | | 492,859 | | |
Foreign Currency Translations | | | 1 | | |
Net Assets | | $ | 1,195,474 | | |
The accompanying notes are an integral part of the financial statements.
8
Morgan Stanley Institutional Fund, Inc.
Annual Report — December 31, 2013
Statement of Assets and Liabilities (cont'd) | | December 31, 2013
(000) | |
CLASS I: | |
Net Assets | | $ | 989,649 | | |
| Shares Outstanding $0.001 par value shares of beneficial interest (500,000,000 shares authorized) (not in 000's) | | | 25,783,158 | | |
Net Asset Value, Offering and Redemption Price Per Share | | $ | 38.38 | | |
CLASS A*: | |
Net Assets | | $ | 205,286 | | |
| Shares Outstanding $0.001 par value shares of beneficial interest (500,000,000 shares authorized) (not in 000's) | | | 5,457,552 | | |
Net Asset Value, Redemption Price Per Share | | $ | 37.61 | | |
Maximum Sales Load§§ | | | 5.25 | % | |
Maximum Sales Charge | | $ | 2.08 | | |
Maximum Offering Price Per Share | | $ | 39.69 | | |
CLASS L: | |
Net Assets | | $ | 528 | | |
| Shares Outstanding $0.001 par value shares of beneficial interest (500,000,000 shares authorized) (not in 000's) | | | 14,174 | | |
Net Asset Value, Offering and Redemption Price Per Share | | $ | 37.26 | | |
CLASS IS: | |
Net Assets | | $ | 11 | | |
| Shares Outstanding $0.001 par value shares of beneficial interest (500,000,000 shares authorized) (not in 000's) | | | 290 | | |
Net Asset Value, Offering and Redemption Price Per Share | | $ | 38.40 | | |
(1) Including:
Securities on Loan, at Value: | | $ | 64,028 | | |
* Effective September 9, 2013, Class P and Class H shares were renamed Class A shares.
@ Amount is less than $500.
§§ Effective February 25, 2013, the Directors approved the imposition of a maximum initial sales charge of 5.25% on purchases of Class A shares of the Portfolio.
The accompanying notes are an integral part of the financial statements.
9
Morgan Stanley Institutional Fund, Inc.
Annual Report — December 31, 2013
Statement of Operations | | Year Ended
December 31, 2013
(000) | |
Investment Income: | |
Dividends from Securities of Unaffiliated Issuers (Net of $321 of Foreign Taxes Withheld) | | $ | 7,188 | | |
Dividends from Security of Affiliated Issuer (Note G) | | | 32 | | |
Income from Securities Loaned — Net | | | 27 | | |
Total Investment Income | | | 7,247 | | |
Expenses: | |
Advisory Fees (Note B) | | | 4,657 | | |
Sub Transfer Agency Fees | | | 604 | | |
Sub Transfer Agency Fees — Class I | | | 219 | | |
Sub Transfer Agency Fees — Class A* | | | 47 | | |
Administration Fees (Note C) | | | 747 | | |
Shareholder Services Fees — Class A* (Note D) | | | 395 | | |
Distribution and Shareholder Services Fees — Class L (Note D) | | | 1 | | |
Professional Fees | | | 95 | | |
Registration Fees | | | 60 | | |
Shareholder Reporting Fees | | | 58 | | |
Custodian Fees (Note F) | | | 48 | | |
Directors' Fees and Expenses | | | 20 | | |
Transfer Agency Fees (Note E) | | | 13 | | |
Transfer Agency Fees — Class I (Note E) | | | 3 | | |
Transfer Agency Fees — Class A* (Note E) | | | 1 | | |
Transfer Agency Fees — Class L (Note E) | | | — | @ | |
Transfer Agency Fees — Class IS (Note E) | | | — | @ | |
Pricing Fees | | | 3 | | |
Other Expenses | | | 31 | | |
Total Expenses | | | 7,002 | | |
Rebate from Morgan Stanley Affiliate (Note G) | | | (49 | ) | |
Reimbursement of Class Specific Expenses — Class IS (Note B) | | | (— | @) | |
Waiver of Advisory Fees (Note B) | | | (— | @) | |
Net Expenses | | | 6,953 | | |
Net Investment Income | | | 294 | | |
Realized Gain (Loss): | |
Investments Sold | | | 61,067 | | |
Foreign Currency Transactions | | | (12 | ) | |
Net Realized Gain | | | 61,055 | | |
Change in Unrealized Appreciation (Depreciation): | |
Investments | | | 318,399 | | |
Foreign Currency Translations | | | 2 | | |
Net Change in Unrealized Appreciation (Depreciation) | | | 318,401 | | |
Net Realized Gain and Change in Unrealized Appreciation (Depreciation) | | | 379,456 | | |
Net Increase in Net Assets Resulting from Operations | | $ | 379,750 | | |
* Effective September 9, 2013, Class P and Class H shares were renamed Class A shares.
@ Amount is less than $500.
The accompanying notes are an integral part of the financial statements.
10
Morgan Stanley Institutional Fund, Inc.
Annual Report — December 31, 2013
Statements of Changes in Net Assets | | Year Ended
December 31,
2013
(000) | | Year Ended
December 31,
2012
(000) | |
Increase (Decrease) in Net Assets: | |
Operations: | |
Net Investment Income | | $ | 294 | | | $ | 4,547 | | |
Net Realized Gain | | | 61,055 | | | | 72,424 | | |
Net Change in Unrealized Appreciation (Depreciation) | | | 318,401 | | | | 36,391 | | |
Net Increase (Decrease) in Net Assets Resulting from Operations | | | 379,750 | | | | 113,362 | | |
Distributions from and/or in Excess of: | |
Class I: | |
Net Investment Income | | | (3,204 | ) | | | (1,111 | ) | |
Net Realized Gain | | | (38,260 | ) | | | (917 | ) | |
Class A*: | |
Net Investment Income | | | (271 | ) | | | — | | |
Net Realized Gain | | | (8,167 | ) | | | (195 | ) | |
Class H^: | |
Net Investment Income | | | (— | @)** | | | (— | @)**** | |
Net Realized Gain | | | — | ** | | | (— | @)**** | |
Class L: | |
Net Investment Income | | | (— | @) | | | (— | @)**** | |
Net Realized Gain | | | (21 | ) | | | (— | @)**** | |
Class IS: | |
Net Realized Gain | | | (— | @)*** | | | — | | |
Total Distributions | | | (49,923 | ) | | | (2,223 | ) | |
Capital Share Transactions:(1) | |
Class I: | |
Subscribed | | | 109,005 | | | | 102,434 | | |
Distributions Reinvested | | | 41,448 | | | | 2,027 | | |
Redeemed | | | (96,199 | ) | | | (156,920 | ) | |
Class A*: | |
Subscribed | | | 34,865 | | | | 33,160 | | |
Distributions Reinvested | | | 8,431 | | | | 195 | | |
Conversion from Class H | | | 145 | | | | — | | |
Redeemed | | | (32,015 | ) | | | (50,515 | ) | |
Class H^: | |
Subscribed | | | 86 | ** | | | 43 | **** | |
Distributions Reinvested | | | — | @** | | | — | @**** | |
Conversion to Class A | | | (145 | )** | | | — | | |
Class L: | |
Subscribed | | | 454 | | | | 10 | **** | |
Distributions Reinvested | | | 21 | | | | — | | |
Redeemed | | | (2 | ) | | | — | | |
Class IS: | |
Subscribed | | | 10 | *** | | | — | | |
Net Increase (Decrease) in Net Assets Resulting from Capital Share Transactions | | | 66,104 | | | | (69,566 | ) | |
Total Increase in Net Assets | | | 395,931 | | | | 41,573 | | |
Net Assets: | |
Beginning of Period | | | 799,543 | | | | 757,970 | | |
End of Period (Including Accumulated Undistributed Net Investment Income of $267 and $3,461) | | $ | 1,195,474 | | | $ | 799,543 | | |
The accompanying notes are an integral part of the financial statements.
11
Morgan Stanley Institutional Fund, Inc.
Annual Report — December 31, 2013
Statements of Changes in Net Assets (cont'd) | | Year Ended
December 31,
2013
(000) | | Year Ended
December 31,
2012
(000) | |
(1) Capital Share Transactions: | |
Class I: | |
Shares Subscribed | | | 3,291 | | | | 3,824 | | |
Shares Issued on Distributions Reinvested | | | 1,140 | | | | 75 | | |
Shares Redeemed | | | (3,090 | ) | | | (5,978 | ) | |
Net Increase (Decrease) in Class I Shares Outstanding | | | 1,341 | | | | (2,079 | ) | |
Class A*: | |
Shares Subscribed | | | 1,031 | | | | 1,264 | | |
Shares Issued on Distributions Reinvested | | | 234 | | | | 7 | | |
Conversion from Class H | | | 4 | | | | — | | |
Shares Redeemed | | | (1,029 | ) | | | (1,949 | ) | |
Net Increase (Decrease) in Class A Shares Outstanding | | | 240 | | | | (678 | ) | |
Class H^: | |
Shares Subscribed | | | 2 | ** | | | 2 | **** | |
Shares Issued on Distributions Reinvested | | | — | ** | | | — | @@**** | |
Conversion to Class A | | | (4 | )** | | | — | | |
Net Increase (Decrease) in Class H Shares Outstanding | | | (2 | ) | | | 2 | | |
Class L: | |
Shares Subscribed | | | 13 | | | | — | @@**** | |
Shares Issued on Distributions Reinvested | | | 1 | | | | — | | |
Shares Redeemed | | | (— | @@) | | | — | | |
Net Increase in Class L Shares Outstanding | | | 14 | | | | — | | |
Class IS: | |
Shares Subscribed | | | — | @@*** | | | — | | |
Net Increase in Class IS Shares Outstanding | | | — | @@ | | | — | | |
@ Amount is less than $500.
@@ Amount is less than 500 shares.
^ Effective September 9, 2013, Class H shares converted into Class A shares.
* Effective September 9, 2013, Class P shares were renamed Class A shares.
** For the period January 1, 2013 through September 6, 2013.
*** For the period September 13, 2013 through December 31, 2013.
**** For the period April 27, 2012 to December 31, 2012.
The accompanying notes are an integral part of the financial statements.
12
Morgan Stanley Institutional Fund, Inc.
Annual Report — December 31, 2013
Financial Highlights
Growth Portfolio
| | | Class I | |
| | | Year Ended December 31, | |
Selected Per Share Data and Ratios | | 2013 | | 2012 | | 2011 | | 2010 | | 2009 | |
Net Asset Value, Beginning of Period | | $ | 27.05 | | | $ | 23.46 | | | $ | 24.24 | | | $ | 19.69 | | | $ | 12.12 | | |
Income (Loss) from Investment Operations: | |
Net Investment Income† | | | 0.02 | | | | 0.16 | | | | 0.01 | | | | 0.06 | | | | 0.05 | | |
Net Realized and Unrealized Gain (Loss) | | | 13.02 | | | | 3.52 | | | | (0.73 | ) | | | 4.49 | | | | 7.58 | | |
Total from Investment Operations | | | 13.04 | | | | 3.68 | | | | (0.72 | ) | | | 4.55 | | | | 7.63 | | |
Distributions from and/or in Excess of: | |
Net Investment Income | | | (0.13 | ) | | | (0.05 | ) | | | (0.06 | ) | | | (0.00 | )‡ | | | (0.06 | ) | |
Net Realized Gain | | | (1.58 | ) | | | (0.04 | ) | | | — | | | | — | | | | — | | |
Total Distributions | | | (1.71 | ) | | | (0.09 | ) | | | (0.06 | ) | | | (0.00 | )‡ | | | (0.06 | ) | |
Redemption Fees | | | — | | | | — | | | | — | | | | — | | | | 0.00 | ‡ | |
Net Asset Value, End of Period | | $ | 38.38 | | | $ | 27.05 | | | $ | 23.46 | | | $ | 24.24 | | | $ | 19.69 | | |
Total Return++ | | | 48.60 | % | | | 15.66 | % | | | (3.01 | )% | | | 23.11 | % | | | 62.97 | %** | |
Ratios and Supplemental Data: | |
Net Assets, End of Period (Thousands) | | $ | 989,649 | | | $ | 661,073 | | | $ | 622,193 | | | $ | 704,410 | | | $ | 674,070 | | |
Ratio of Expenses to Average Net Assets (1) | | | 0.70 | %+ | | | 0.72 | %+ | | | 0.71 | %+†† | | | 0.73 | %+†† | | | 0.65 | %+ | |
Ratio of Expenses to Average Net Assets Excluding Non Operating Expenses | | | N/A | | | | N/A | | | | N/A | | | | 0.73 | %+†† | | | 0.65 | %+ | |
Ratio of Net Investment Income to Average Net Assets (1) | | | 0.08 | %+ | | | 0.59 | %+ | | | 0.05 | %+†† | | | 0.27 | %+†† | | | 0.35 | %+ | |
Ratio of Rebate from Morgan Stanley Affiliates to Average Net Assets | | | 0.01 | % | | | 0.00 | %§ | | | 0.00 | %††§ | | | 0.00 | %††§ | | | 0.00 | %§ | |
Portfolio Turnover Rate | | | 31 | % | | | 49 | % | | | 26 | % | | | 35 | % | | | 19 | % | |
(1) Supplemental Information on the Ratios to Average Net Assets: | |
Ratios Before Expense Limitation: | |
Expenses to Average Net Assets | | | 0.71 | % | | | N/A | | | | N/A | | | | N/A | | | | N/A | | |
Net Investment Income to Average Net Assets | | | 0.07 | % | | | N/A | | | | N/A | | | | N/A | | | | N/A | | |
† Per share amount is based on average shares outstanding.
‡ Amount is less than $0.005 per share.
++ Calculated based on the net asset value as of the last business day of the period.
** Performance was positively impacted by approximately 0.25% due to the receipt of proceeds from the settlements of class action suits involving primarily one of the Portfolio's past holdings. This was a one-time settlement, and as a result, the impact on the NAV and consequently the performance will not likely be repeated in the future. Had these settlements not occurred, the total return for Class I would have been approximately 62.72%.
+ The Ratios of Expenses and Net Investment Income reflect the rebate of certain Portfolio expenses in connection with the investments in Morgan Stanley affiliates during the period. The effect of the rebate on the ratios is disclosed in the above table as "Ratio of Rebate from Morgan Stanley Affiliates to Average Net Assets."
†† Reflects overall Portfolio ratios for investment income and non-class specific expenses.
§ Amount is less than 0.005%.
The accompanying notes are an integral part of the financial statements.
13
Morgan Stanley Institutional Fund, Inc.
Annual Report — December 31, 2013
Financial Highlights
Growth Portfolio
| | | Class A* | |
| | | Year Ended December 31, | |
Selected Per Share Data and Ratios | | 2013 | | 2012 | | 2011 | | 2010 | | 2009 | |
Net Asset Value, Beginning of Period | | $ | 26.53 | | | $ | 23.03 | | | $ | 23.82 | | | $ | 19.40 | | | $ | 11.94 | | |
Income (Loss) from Investment Operations: | |
Net Investment Income (Loss)† | | | (0.06 | ) | | | 0.09 | | | | (0.05 | ) | | | 0.00 | ‡ | | | 0.02 | | |
Net Realized and Unrealized Gain (Loss) | | | 12.78 | | | | 3.45 | | | | (0.73 | ) | | | 4.42 | | | | 7.46 | | |
Total from Investment Operations | | | 12.72 | | | | 3.54 | | | | (0.78 | ) | | | 4.42 | | | | 7.48 | | |
Distributions from and/or in Excess of: | |
Net Investment Income | | | (0.06 | ) | | | — | | | | (0.01 | ) | | | (0.00 | )‡ | | | (0.02 | ) | |
Net Realized Gain | | | (1.58 | ) | | | (0.04 | ) | | | — | | | | — | | | | — | | |
Total Distributions | | | (1.64 | ) | | | (0.04 | ) | | | (0.01 | ) | | | (0.00 | )‡ | | | (0.02 | ) | |
Redemption Fees | | | — | | | | — | | | | — | | | | — | | | | 0.00 | ‡ | |
Net Asset Value, End of Period | | $ | 37.61 | | | $ | 26.53 | | | $ | 23.03 | | | $ | 23.82 | | | $ | 19.40 | | |
Total Return++ | | | 48.22 | % | | | 15.36 | % | | | (3.27 | )% | | | 22.79 | % | | | 62.66 | %** | |
Ratios and Supplemental Data: | |
Net Assets, End of Period (Thousands) | | $ | 205,286 | | | $ | 138,416 | | | $ | 135,777 | | | $ | 136,585 | | | $ | 99,475 | | |
Ratio of Expenses to Average Net Assets (1) | | | 0.95 | %+^ | | | 0.97 | %+ | | | 0.96 | %+†† | | | 0.98 | %+†† | | | 0.90 | %+ | |
Ratio of Expenses to Average Net Assets Excluding Non Operating Expenses | | | N/A | | | | N/A | | | | N/A | | | | 0.98 | %+†† | | | 0.90 | %+ | |
Ratio of Net Investment Income (Loss) to Average Net Assets (1) | | | (0.18 | )%+ | | | 0.34 | %+ | | | (0.20 | )%+†† | | | 0.02 | %+†† | | | 0.10 | %+ | |
Ratio of Rebate from Morgan Stanley Affiliates to Average Net Assets | | | 0.01 | % | | | 0.00 | %§ | | | 0.00 | %††§ | | | 0.00 | %††§ | | | 0.00 | %§ | |
Portfolio Turnover Rate | | | 31 | % | | | 49 | % | | | 26 | % | | | 35 | % | | | 19 | % | |
(1) Supplemental Information on the Ratios to Average Net Assets: | |
Ratios Before Expense Limitation: | |
Expenses to Average Net Assets | | | 0.96 | % | | | N/A | | | | N/A | | | | N/A | | | | N/A | | |
Net Investment Income to Average Net Assets | | | (0.19 | )% | | | N/A | | | | N/A | | | | N/A | | | | N/A | | |
* Effective September 9, 2013, Class P and Class H shares were renamed Class A shares.
† Per share amount is based on average shares outstanding.
‡ Amount is less than $0.005 per share.
++ Calculated based on the net asset value which does not reflect sales charges, if applicable, as of the last business day of the period.
** Performance was positively impacted by approximately 0.25% due to the receipt of proceeds from the settlements of class action suits involving primarily one of the Portfolio's past holdings. This was a one-time settlement, and as a result, the impact on the NAV and consequently the performance will not likely be repeated in the future. Had these settlements not occurred, the total return for Class A would have been approximately 62.41%.
+ The Ratios of Expenses and Net Investment Income (Loss) reflect the rebate of certain Portfolio expenses in connection with the investments in Morgan Stanley affiliates during the period. The effect of the rebate on the ratios is disclosed in the above table as "Ratio of Rebate from Morgan Stanley Affiliates to Average Net Assets."
^ Effective September 16, 2013, the Adviser has agreed to limit the ratio of expenses to average net assets to the maximum ratio of 1.15% for Class A shares. Prior to September 16, 2013, the maximum ratio was 1.05% for Class A shares.
†† Reflects overall Portfolio ratios for investment income and non-class specific expenses.
§ Amount is less than 0.005%.
The accompanying notes are an integral part of the financial statements.
14
Morgan Stanley Institutional Fund, Inc.
Annual Report — December 31, 2013
Financial Highlights
Growth Portfolio
| | | Class L | |
Selected Per Share Data and Ratios | | Year Ended
December 31,
2013 | | Period from
April 27, 2012^ to
December 31, 2012 | |
Net Asset Value, Beginning of Period | | $ | 26.43 | | | $ | 27.60 | | |
Income (Loss) from Investment Operations: | |
Net Investment Income (Loss)† | | | (0.38 | ) | | | 0.03 | | |
Net Realized and Unrealized Gain (Loss) | | | 12.84 | | | | (1.16 | ) | |
Total from Investment Operations | | | 12.46 | | | | (1.13 | ) | |
Distributions from and/or in Excess of: | |
Net Investment Income | | | (0.05 | ) | | | (0.00 | )‡ | |
Net Realized Gain | | | (1.58 | ) | | | (0.04 | ) | |
Total Distributions | | | (1.63 | ) | | | (0.04 | ) | |
Net Asset Value, End of Period | | $ | 37.26 | | | $ | 26.43 | | |
Total Return++ | | | 47.44 | % | | | (4.10 | )%# | |
Ratios and Supplemental Data: | |
Net Assets, End of Period (Thousands) | | $ | 528 | | | $ | 10 | | |
Ratio of Expenses to Average Net Assets (1) | | | 1.60 | %+^^ | | | 1.51 | %+* | |
Ratio of Net Investment Income (Loss) to Average Net Assets (1) | | | (1.09 | )%+ | | | 0.20 | %+* | |
Ratio of Rebate from Morgan Stanley Affiliates to Average Net Assets | | | 0.01 | % | | | 0.00 | %*§ | |
Portfolio Turnover Rate | | | 31 | % | | | 49 | %# | |
(1) Supplemental Information on the Ratios to Average Net Assets: | |
Ratios Before Expense Limitation: | |
Expenses to Average Net Assets | | | 1.72 | % | | | N/A | | |
Net Investment Income (Loss) to Average Net Assets | | | (1.21 | )% | | | N/A | | |
^ Commencement of Operations.
† Per share amount is based on average shares outstanding.
‡ Amount is less than $0.005 per share.
++ Calculated based on the net asset value as of the last business day of the period.
+ The Ratios of Expenses and Net Investment Income (Loss) reflect the rebate of certain Portfolio expenses in connection with the investments in Morgan Stanley affiliates during the period. The effect of the rebate on the ratios is disclosed in the above table as "Ratio of Rebate from Morgan Stanley Affiliates to Average Net Assets."
^^ Effective September 16, 2013, the Adviser has agreed to limit the ratio of expenses to average net assets to the maximum ratio of 1.65% for Class L shares. Prior to September 16, 2013, the maximum ratio was 1.55% for Class L shares.
§ Amount is less than 0.005%.
# Not Annualized.
* Annualized.
The accompanying notes are an integral part of the financial statements.
15
Morgan Stanley Institutional Fund, Inc.
Annual Report — December 31, 2013
Financial Highlights
Growth Portfolio
| | | Class IS | |
Selected Per Share Data and Ratios | | Period from
September 13, 2013^ to
December 31, 2013 | |
Net Asset Value, Beginning of Period | | $ | 34.45 | | |
Income (Loss) from Investment Operations: | |
Net Investment Loss† | | | (0.02 | ) | |
Net Realized and Unrealized Gain | | | 5.55 | | |
Total from Investment Operations | | | 5.53 | | |
Distributions from and/or in Excess of: | |
Net Realized Gain | | | (1.58 | ) | |
Net Asset Value, End of Period | | $ | 38.40 | | |
Total Return++ | | | 16.20 | %# | |
Ratios and Supplemental Data: | |
Net Assets, End of Period (Thousands) | | $ | 11 | | |
Ratio of Expenses to Average Net Assets (1) | | | 0.60 | %+^^* | |
Ratio of Net Investment Loss to Average Net Assets (1) | | | (0.16 | )%+* | |
Ratio of Rebate from Morgan Stanley Affiliates to Average Net Assets | | | 0.01 | %* | |
Portfolio Turnover Rate | | | 31 | %# | |
(1) Supplemental Information on the Ratios to Average Net Assets: | |
Ratios Before Expense Limitation | |
Expenses to Average Net Assets | | | 5.60 | %* | |
Net Investment Loss to Average Net Assets | | | (5.16 | )%* | |
^ Commencement of Operations.
† Per share amount is based on average shares outstanding.
++ Calculated based on the net asset value as of the last business day of the period.
+ The Ratios of Expenses and Net Investment Loss reflect the rebate of certain Portfolio expenses in connection with the investments in Morgan Stanley affiliates during the period. The effect of the rebate on the ratios is disclosed in the above table as "Ratio of Rebate from Morgan Stanley Affiliates to Average Net Assets."
^^ Effective September 16, 2013, the Adviser has agreed to limit the ratio of expenses to average net assets to the maximum ratio of 0.73% for Class IS shares.
# Not Annualized.
* Annualized.
The accompanying notes are an integral part of the financial statements.
16
Morgan Stanley Institutional Fund, Inc.
Annual Report — December 31, 2013
Notes to Financial Statements
Morgan Stanley Institutional Fund, Inc. (the "Fund") is registered under the Investment Company Act of 1940, as amended (the "Act"), as an open-end management investment company. The Fund is comprised of twenty-seven separate, active, diversified and non-diversified portfolios (individually referred to as a "Portfolio", collectively as the "Portfolios").
The accompanying financial statements relate to the Growth Portfolio. The Portfolio seeks long-term capital appreciation by investing primarily in growth oriented equity securities of large capitalization companies. Under normal market conditions, the Portfolio seeks to achieve its investment objective by investing primarily in established and emerging companies, with capitalizations within the range of companies included in the Russell 1000® Growth Index. The Portfolio offers four classes of shares — Class I, Class A, Class L and Class IS.
On September 16, 2013, the Portfolio commenced offering Class IS shares. Effective September 9, 2013, Class P and Class H shares were renamed Class A shares.
A. Significant Accounting Policies: The following significant accounting policies are in conformity with U.S. generally accepted accounting principles ("GAAP"). Such policies are consistently followed by the Fund in the preparation of its financial statements. GAAP may require management to make estimates and assumptions that affect the reported amounts and disclosures in the financial statements. Actual results may differ from those estimates.
1. Security Valuation: (1) An equity portfolio security listed or traded on an exchange is valued at its latest reported sales price (or at the exchange official closing price if such exchange reports an official closing price), if there were no sales on a given day, the security is valued at the mean between the last reported bid and asked prices; (2) all other equity portfolio securities for which over-the-counter market quotations are readily available are valued at its latest reported sales price. In cases where a security is traded on more than one exchange, the security is valued on the exchange designated as the primary market; (3) listed options are valued at the last reported sales price on the exchange on which they are listed (or at the exchange official closing price if such exchange reports an official closing price). If an official closing price or last reported sale price is unavailable, the listed option should be fair valued at the mean between its latest bid and ask prices. Unlisted options are valued by an outside pricing service approved by the Fund's Board of Directors (the
"Directors") or quotes from a broker or dealer; (4) when market quotations are not readily available, including circumstances under which Morgan Stanley Investment Management Inc. (the "Adviser") determines that the closing price, last sale price or the mean between the last reported bid and asked prices are not reflective of a security's market value, portfolio securities are valued at their fair value as determined in good faith under procedures established by and under the general supervision of the Directors. Occasionally, developments affecting the closing prices of securities and other assets may occur between the times at which valuations of such securities are determined (that is, close of the foreign market on which the securities trade) and the close of business of the New York Stock Exchange ("NYSE"). If developments occur during such periods that are expected to materially affect the value of such securities, such valuations may be adjusted to reflect the estimated fair value of such securities as of the close of the NYSE, as determined in good faith by the Directors or by the Adviser using a pricing service and/or procedures approved by the Directors; (5) quotations of foreign portfolio securities, other assets and liabilities and forward contracts stated in foreign currency are translated into U.S. dollar equivalents at the prevailing market rates prior to the close of the NYSE; (6) investments in mutual funds, including the Morgan Stanley Institutional Liquidity Funds, are valued at the net asset value as of the close of each business day; and (7) short-term debt securities with remaining maturities of 60 days or less at the time of purchase may be valued at amortized cost, unless the Adviser determines such valuation does not reflect the securities' market value, in which case these securities will be valued at their fair market value determined by the Adviser.
Under procedures approved by the Directors, the Fund's Adviser has formed a Valuation Committee. The Valuation Committee provides administration and oversight of the Fund's valuation policies and procedures, which are reviewed at least annually by the Directors. These procedures allow the Fund to utilize independent pricing services, quotations from securities and financial instrument dealers, and other market sources to determine fair value.
The Fund has procedures to determine the fair value of securities and other financial instruments for which market prices are not readily available. Under these procedures, the Valuation Committee convenes on a regular
17
Morgan Stanley Institutional Fund, Inc.
Annual Report — December 31, 2013
Notes to Financial Statements (cont'd)
and ad hoc basis to review such securities and considers a number of factors, including valuation methodologies and significant unobservable valuation inputs, when arriving at fair value. The Valuation Committee may employ a market-based approach which may use related or comparable assets or liabilities, recent transactions, market multiples, book values, and other relevant information for the investment to determine the fair value of the investment. An income-based valuation approach may also be used in which the anticipated future cash flows of the investment are discounted to calculate fair value. Discounts may also be applied due to the nature or duration of any restrictions on the disposition of the investments. Due to the inherent uncertainty of valuations of such investments, the fair values may differ significantly from the values that would have been used had an active market existed. The Valuation Committee employs various methods for calibrating these valuation approaches including a regular review of valuation methodologies, key inputs and assumptions, transactional back-testing or disposition analysis, and reviews of any related market activity.
2. Fair Value Measurement: Financial Accounting Standards Board ("FASB") Accounting Standards CodificationTM ("ASC") 820, "Fair Value Measurements and Disclosures" ("ASC 820"), defines fair value as the value that the Fund would receive to sell an investment or pay to transfer a liability in a timely transaction with an independent buyer in the principal market, or in the absence of a principal market the most advantageous market for the investment or liability. ASC 820 establishes a three-tier hierarchy to distinguish between (1) inputs that reflect the assumptions market participants would use in valuing an asset or liability developed based on market data obtained from sources independent of the reporting entity (observable inputs) and (2) inputs that reflect the reporting entity's own assumptions about the assumptions market participants would use in valuing an asset or liability developed based on the best information available in the circumstances (unobservable inputs) and to establish classification of fair value measurements for disclosure purposes. Various inputs are used in determining the value of the Fund's investments. The inputs are summarized in the three broad levels listed below.
• Level 1 – unadjusted quoted prices in active markets for identical investments
• Level 2 – other significant observable inputs (including quoted prices for similar investments, interest rates, prepayment speeds, credit risk, etc.)
• Level 3 – significant unobservable inputs including the Fund's own assumptions in determining the fair value of investments. Factors considered in making this determination may include, but are not limited to, information obtained by contacting the issuer, analysts, or the appropriate stock exchange (for exchange-traded securities), analysis of the issuer's financial statements or other available documents and, if necessary, available information concerning other securities in similar circumstances
The inputs or methodology used for valuing securities are not necessarily an indication of the risk associated with investing in those securities and the determination of the significance of a particular input to the fair value measurement in its entirety requires judgment and considers factors specific to each security.
The following is a summary of the inputs used to value the Portfolio's investments as of December 31, 2013.
Investment Type | | Level 1
Unadjusted
quoted
prices
(000) | | Level 2
Other
significant
observable
inputs
(000) | | Level 3
Significant
unobservable
inputs
(000) | | Total
(000) | |
Assets: | |
Common Stocks | |
Alternative Energy | | $ | 10,639 | | | $ | — | | | $ | — | | | $ | 10,639 | | |
Asset Management &
Custodian | | | 16,497 | | | | — | | | | — | | | | 16,497 | | |
Automobiles | | | 21,762 | | | | — | | | | — | | | | 21,762 | | |
Beverage: Soft Drinks | | | 10,203 | | | | — | | | | — | | | | 10,203 | | |
Biotechnology | | | 41,971 | | | | — | | | | — | | | | 41,971 | | |
Cable Television
Services | | | 10,985 | | | | — | | | | — | | | | 10,985 | | |
Chemicals: Diversified | | | 27,767 | | | | — | | | | — | | | | 27,767 | | |
Commercial Services | | | 16,409 | | | | — | | | | — | | | | 16,409 | | |
Communications
Technology | | | 34,486 | | | | — | | | | — | | | | 34,486 | | |
Computer Services,
Software & Systems | | | 287,531 | | | | — | | | | — | | | | 287,531 | | |
Computer Technology | | | 44,737 | | | | — | | | | — | | | | 44,737 | | |
Consumer Lending | | | 84,179 | | | | — | | | | — | | | | 84,179 | | |
Diversified Media | | | 34,275 | | | | — | | | | — | | | | 34,275 | | |
Diversified Retail | | | 178,390 | | | | — | | | | — | | | | 178,390 | | |
Entertainment | | | 4,891 | | | | — | | | | — | | | | 4,891 | | |
Financial Data &
Systems | | | 33,014 | | | | — | | | | — | | | | 33,014 | | |
Health Care Services | | | 6,748 | | | | — | | | | — | | | | 6,748 | | |
Insurance: Multi-Line | | | 10,850 | | | | — | | | | — | | | | 10,850 | | |
18
Morgan Stanley Institutional Fund, Inc.
Annual Report — December 31, 2013
Notes to Financial Statements (cont'd)
Investment Type | | Level 1
Unadjusted
quoted
prices
(000) | | Level 2
Other
significant
observable
inputs
(000) | | Level 3
Significant
unobservable
inputs
(000) | | Total
(000) | |
Common Stocks (cont'd) | |
Insurance:
Property-Casualty | | $ | 39,123 | | | $ | — | | | $ | — | | | $ | 39,123 | | |
Medical Equipment | | | 31,869 | | | | — | | | | — | | | | 31,869 | | |
Pharmaceuticals | | | 65,701 | | | | — | | | | — | | | | 65,701 | | |
Radio & TV
Broadcasters | | | 4,332 | | | | — | | | | — | | | | 4,332 | | |
Recreational Vehicles &
Boats | | | 29,110 | | | | — | | | | — | | | | 29,110 | | |
Restaurants | | | 26,020 | | | | — | | | | — | | | | 26,020 | | |
Semiconductors &
Components | | | 22,055 | | | | — | | | | — | | | | 22,055 | | |
Textiles, Apparel &
Shoes | | | 26,437 | | | | — | | | | — | | | | 26,437 | | |
Total Common Stocks | | | 1,119,981 | | | | — | | | | — | | | | 1,119,981 | | |
Call Options Purchased | | | — | | | | 586 | | | | — | | | | 586 | | |
Short-Term Investments | |
Investment Company | | | 124,007 | | | | — | | | | — | | | | 124,007 | | |
Repurchase Agreements | | | — | | | | 6,958 | | | | — | | | | 6,958 | | |
Total Short-Term
Investments | | | 124,007 | | | | 6,958 | | | | — | | | | 130,965 | | |
Total Assets | | $ | 1,243,988 | | | $ | 7,544 | | | $ | — | | | $ | 1,251,532 | | |
Transfers between investment levels may occur as the markets fluctuate and/or the availability of data used in an investment's valuation changes. The Portfolio recognizes transfers between the levels as of the end of the period. As of December 31, 2013, securities with a total value of approximately $63,235,000 transferred from Level 2 to Level 1. At December 31, 2012, the fair value of certain securities were adjusted due to developments which occurred between the time of the close of the foreign markets on which they trade and the close of business on the NYSE which resulted in their Level 2 classification.
Following is a reconciliation of investments in which significant unobservable inputs (Level 3) were used in determining fair value.
| | | Convertible
Preferred
Stock
(000) | |
Beginning Balance | | $ | 522 | | |
Purchases | | | — | | |
Sales | | | — | | |
Amortization of discount | | | — | | |
Transfers in | | | — | | |
Transfers out | | | — | | |
Change in unrealized appreciation (depreciation) | | | 3,833 | | |
Realized gains (losses) | | | (4,355 | ) | |
Ending Balance | | $ | — | | |
Net change in unrealized appreciation (depreciation) from
investments still held as of December 31, 2013 | | $ | — | | |
3. Derivatives: The Portfolio may, but is not required to, use derivative instruments for a variety of purposes, including hedging, risk management, portfolio management or to earn income. Derivatives are financial instruments whose value is based, in part, on the value of an underlying asset, interest rate, index or financial instrument. Prevailing interest rates and volatility levels, among other things, also affect the value of derivative instruments. A derivative instrument often has risks similar to its underlying asset and may have additional risks, including imperfect correlation between the value of the derivative and the underlying asset, risks of default by the counterparty to certain transactions, magnification of losses incurred due to changes in the market value of the securities, instruments, indices or interest rates to which they relate, and risks that the transactions may not be liquid. The use of derivatives involves risks that are different from, and possibly greater than, the risks associated with other portfolio investments. Derivatives may involve the use of highly specialized instruments that require investment techniques and risk analyses different from those associated with other portfolio investments. All of the Portfolio's holdings, including derivative instruments, are marked-to-market each day with the change in value reflected in unrealized appreciation (depreciation). Upon disposition, a realized gain or loss is recognized.
Certain derivative transactions may give rise to a form of leverage. Leverage magnifies the potential for gain and the risk of loss. Leverage associated with derivative transactions may cause the Portfolio to liquidate portfolio positions when it may not be advantageous to do so to satisfy its obligations or to meet earmarking or segregation requirements, pursuant to applicable Securities and Exchange Commission rules and regulations, or may cause the Portfolio to be more volatile than if the Portfolio had not been leveraged. Although the Adviser seeks to use derivatives to further the Portfolio's investment objectives, there is no assurance that the use of derivatives will achieve this result.
Following is a description of the derivative instruments and techniques that the Portfolio used during the period and their associated risks:
Options: In respect to options, the Portfolio is subject to equity risk, interest rate risk and foreign currency exchange risk in the normal course of pursuing its investment objectives. If the Portfolio buys an option, it buys a legal contract giving it the right to buy or sell a
19
Morgan Stanley Institutional Fund, Inc.
Annual Report — December 31, 2013
Notes to Financial Statements (cont'd)
specific amount of the underlying instrument or futures contract on the underlying instrument such a as security, currency or index, at an agreed upon price typically in exchange for a premium paid by the Portfolio. The Portfolio may purchase put and call options. Purchasing call options tends to increase the Portfolio's exposure to the underlying (or similar) instrument. Purchasing put options tends to decrease the Portfolio's exposure to the underlying (or similar) instrument. When entering into purchased option contracts, the Portfolio bears the risk of interest or exchange rates or securities prices moving unexpectedly, in which case, the Portfolio may not achieve the anticipated benefits of the purchased option contracts; however the risk of loss is limited to the premium paid. Purchased options are reported as part of "Total Investments" on the Statement of Assets and Liabilities. Premium paid for purchasing options which expired are treated as realized losses. If the Portfolio sells an option, it sells to another party the right to buy from or sell to the Portfolio a specific amount of the underlying instrument or futures contract on the underlying instrument at an agreed upon price typically in exchange for a premium received by the Portfolio. There is the risk the Portfolio may not be able to enter into a closing transaction because of an illiquid market. A decision as to whether, when and how to use options involves the exercise of skill and judgment and even a well conceived option transaction may be unsuccessful because of market behavior or unexpected events. The prices of options can be highly volatile and the use of options can lower total returns.
FASB ASC 815, "Derivatives and Hedging: Overall" ("ASC 815"), is intended to improve financial reporting about derivative instruments by requiring enhanced disclosures to enable investors to better understand how and why the Portfolio uses derivative instruments, how these derivative instruments are accounted for and their effects on the Portfolio's financial position and results of operations.
The following table sets forth the fair value of the Portfolio's derivative contracts by primary risk exposure as of December 31, 2013.
| | | Asset Derivatives
Statement of Assets and
Liabilities Location | | Primary Risk
Exposure | | Value
(000) | |
Options Purchased | | Investments, at Value
(Options Purchased) | |
Currency Risk | | $ | 586 | + | |
+ Amounts are included in Investments in the Statement of Assets and Liabilities.
The following table sets forth by primary risk exposure the Portfolio's change in unrealized appreciation (depreciation) by type of derivative contract for the year ended December 31, 2013 in accordance with ASC 815.
Change in Unrealized Appreciation (Depreciation) | |
Primary Risk Exposure | | Derivative Type | | Value
(000) | |
Currency Risk | | Investments
(Options Purchased) | | $ | (507 | )++ | |
++ Amounts are included in Investments in the Statement of Operations.
At December 31, 2013, the Portfolio's derivative assets and liabilities are as follows:
Gross Amounts of Assets and Liabilities Presented in the
Statement of Assets and Liabilities | |
Derivatives | | Assets(a)
(000) | | Liabilities(a)
(000) | |
Options Purchased | | $ | 586 | | | $ | — | | |
(a) Absent an event of default or early termination, OTC derivative assets and liabilities are presented gross and not offset in the Statement of Assets and Liabilities.
The following table presents derivative financial instruments that are subject to enforceable netting arrangements as of December 31, 2013.
Gross Amounts Not Offset in the Statement of Assets and Liabilities | |
| Counterparty | | Gross Asset
Derivatives
Presented in
Statement of
Assets and Liabilities
(000) | | Financial
Instrument
(000) | | Collateral
Received
(000) | | Net
Amount
(not less
than 0)
(000) | |
Royal Bank of Scotland | | $ | 586 | | | $ | — | | | $ | (586 | )(a) | | $ | 0 | | |
(a) The actual collateral received is greater than the amount shown here due to overcollateralization.
For the year ended December 31, 2013, the approximate average monthly amount outstanding for each derivative type is as follows:
Options Purchased: | |
| Average monthly notional amount | | | 28,930,000 | | |
4. Foreign Currency Translation and Foreign Investments: The books and records of the Portfolio are maintained in U.S. dollars. Foreign currency amounts are translated into U.S. dollars as follows:
– investments, other assets and liabilities at the prevailing rate of exchange on the valuation date;
– investment transactions and investment income at the prevailing rates of exchange on the dates of such transactions.
Although the net assets of the Portfolio are presented at the foreign exchange rates and market values at the close of the period, the Portfolio does not isolate that portion
20
Morgan Stanley Institutional Fund, Inc.
Annual Report — December 31, 2013
Notes to Financial Statements (cont'd)
of the results of operations arising as a result of changes in the foreign exchange rates from the fluctuations arising from changes in the market prices of securities held at period end. Similarly, the Portfolio does not isolate the effect of changes in foreign exchange rates from the fluctuations arising from changes in the market prices of securities sold during the period. Accordingly, realized and unrealized foreign currency gains (losses) on investments in securities are included in the reported net realized and unrealized gains (losses) on investment transactions and balances. However, pursuant to U.S. Federal income tax regulations, gains and losses from certain foreign currency transactions and the foreign currency portion of gains and losses realized on sales and maturities of foreign denominated debt securities are treated as ordinary income for U.S. Federal income tax purposes.
Net realized gains (losses) on foreign currency transactions represent net foreign exchange gains (losses) from foreign currency forward exchange contracts, disposition of foreign currencies, currency gains (losses) realized between the trade and settlement dates on securities transactions, and the difference between the amount of investment income and foreign withholding taxes recorded on the Portfolio's books and the U.S. dollar equivalent amounts actually received or paid. Net unrealized currency gains (losses) from valuing foreign currency denominated assets and liabilities at period end exchange rates are reflected as a component of unrealized appreciation (depreciation) on the Statement of Assets and Liabilities. The change in unrealized currency gains (losses) on foreign currency translations for the period is reflected in the Statement of Operations.
Foreign security and currency transactions may involve certain considerations and risks not typically associated with those of U.S. dollar denominated transactions as a result of, among other factors, fluctuations of exchange rates in relation to the U.S. dollar, the possibility of lower levels of governmental supervision and regulation of foreign securities markets and the possibility of political or economic instability.
The net assets of the Portfolio include foreign denominated securities and currency. Changes in currency exchange rates will affect the U.S. Dollar value of and investment income from such securities.
Governmental approval for foreign investments may be required in advance of making an investment under certain circumstances in some countries, and the extent of foreign investments in domestic companies may be subject to limitation in other countries. Foreign ownership limitations also may be imposed by the charters of individual companies to prevent, among other concerns, violations of foreign investment limitations. As a result, an additional class of shares (identified as "Foreign" in the Portfolio of Investments) may be created and offered for investment. The "local" and "foreign shares" market values may differ. In the absence of trading of the foreign shares in such markets, the Portfolio values the foreign shares at the closing exchange price of the local shares.
5. Securities Lending: The Portfolio lends securities to qualified financial institutions, such as broker-dealers, to earn additional income. Any increase or decrease in the fair value of the securities loaned that might occur and any interest earned or dividends declared on those securities during the term of the loan would remain in the Portfolio. The Portfolio would receive cash or securities as collateral in an amount equal to or exceeding 100% of the current fair value of the loaned securities. The collateral is marked-to-market daily, by State Street Bank and Trust Company ("State Street"), the securities lending agent, to ensure that a minimum of 100% collateral coverage is maintained.
Based on pre-established guidelines, the securities lending agent invests any cash collateral that is received in an affiliated money market portfolio and repurchase agreements. Securities lending income is generated from the earnings on the invested collateral and borrowing fees, less any rebates owed to the borrowers and compensation to the lending agent, and is recorded as "Income from Securities Loaned-Net" in the Portfolio's Statement of Operations. Risks in securities lending transactions are that a borrower may not provide additional collateral when required or return the securities when due, and that the value of the short-term investments will be less than the amount of cash collateral plus any rebate that is required to be returned to the borrower.
The Portfolio has the right under the lending agreement to recover the securities from the borrower on demand.
21
Morgan Stanley Institutional Fund, Inc.
Annual Report — December 31, 2013
Notes to Financial Statements (cont'd)
The following table presents financial instruments that are subject to enforceable netting arrangements as of December 31, 2013.
Gross Amounts Not Offset in the Statement of Assets and Liabilities | |
Gross Asset
Amounts
Presented in
Statement of
Assets and
Liabilities
(000) | | Financial
Instrument
(000) | | Collateral
Received
(000) | | Net Amount
(not less than 0)
(000) | |
| $ | 64,028 | (a) | | | — | | | $ | (64,002 | )(b)(c) | | $ | 26 | | |
(a) Represents market value of loaned securities at period end.
(b) The Portfolio received cash collateral of approximately $53,608,000, of which approximately $52,018,000 was subsequently invested in Repurchase Agreements and Morgan Stanley Institutional Liquidity Funds as reported in the Portfolio of Investments. As of December 31, 2013 there was uninvested cash of approximately $1,590,000, which is not reflected in the Portfolio of Investments. In addition, the Portfolio received non-cash collateral of approximately $10,394,000 in the form of U.S. government obligations, which the Portfolio cannot sell or repledge, and accordingly are not reflected in the Portfolio of Investments.
(c) The collateral received was marked to market on a daily basis. The Portfolio's collateral coverage was below 100% at December 31, 2013. This was adjusted on the next business day.
6. Indemnifications: The Fund enters into contracts that contain a variety of indemnifications. The Fund's maximum exposure under these arrangements is unknown. However, the Fund has not had prior claims or losses pursuant to these contracts and expects the risk of loss to be remote.
7. Dividends and Distributions to Shareholders: Dividend income and distributions to shareholders are recorded on the ex-dividend date. Dividends from net investment income, if any, are declared and paid semiannually. Net realized capital gains, if any, are distributed at least annually.
8. Security Transactions, Income and Expenses: Security transactions are accounted for on the trade date (date the order to buy or sell is executed). Realized gains and losses on the sale of investment securities are determined on the specific identified cost method. Dividend income and other distributions are recorded on the ex-dividend date (except for certain foreign dividends which may be recorded as soon as the Portfolio is informed of such dividends) net of applicable withholding taxes. Interest income is recognized on the accrual basis except where collection is in doubt. Discounts are accreted and premiums are amortized over the life of the respective securities. Most expenses of the Fund can be directly attributed to a particular Portfolio. Expenses which cannot
be directly attributed are apportioned among the Portfolios based upon relative net assets or other appropriate methods. Income, expenses (other than class specific expenses — distribution, transfer agency and sub transfer agency fees) and realized and unrealized gains or losses are allocated to each class of shares based upon their relative net assets.
B. Advisory Fees: The Adviser, a wholly-owned subsidiary of Morgan Stanley, provides the Portfolio with advisory services under the terms of an Investment Advisory Agreement, paid quarterly, at the annual rate based on the average daily net assets as follows:
First $1
billion | | Next $1
billion | | Next $1
billion | | Over $3
billion | |
| | 0.50 | % | | | 0.45 | % | | | 0.40 | % | | | 0.35 | % | |
For the year ended December 31, 2013, the advisory fee rate (net of rebate) was equivalent to an annual effective rate of 0.49% of the Portfolio's daily net assets.
The Adviser has agreed to reduce its advisory fee and/or reimburse the Portfolio so that total annual portfolio operating expenses, excluding certain investment related expenses, taxes, interest and other extraordinary expenses (including litigation), will not exceed 0.80% for Class I shares, 1.05% for Class A shares and 1.55% for Class L shares. Effective September 16, 2013, the Adviser has agreed to limit the ratio of expenses to average net assets to the maximum ratios of 1.15%, 1.65% and 0.73% for Class A, Class L and Class IS shares, respectively. The fee waivers and/or expense reimbursements will continue for at least one year or until such time that the Directors act to discontinue all or a portion of such waivers and/or reimbursements when it deems such action is appropriate. For the year ended December 31, 2013, less than $500 of advisory fees were waived and less than $500 of other expenses were reimbursed by the Adviser pursuant to this arrangement.
C. Administration Fees: The Adviser also serves as Administrator to the Fund and provides administrative services pursuant to an Administration Agreement for an annual fee, accrued daily and paid monthly, of 0.08% of the Portfolio's average daily net assets. Under a Sub-Administration Agreement between the Administrator and State Street, State Street provides certain administrative services to the Fund. For such services, the Administrator pays State Street a portion of the fee the Administrator receives from the Portfolio.
D. Distribution and Shareholder Services Fees: Morgan Stanley Distribution, Inc. ("MSDI" or the "Distributor"), a wholly-owned subsidiary of the Adviser, and an
22
Morgan Stanley Institutional Fund, Inc.
Annual Report — December 31, 2013
Notes to Financial Statements (cont'd)
indirect subsidiary of Morgan Stanley, serves as the Fund's Distributor of Portfolio shares pursuant to a Distribution Agreement. The Fund has adopted a Shareholder Services Plan with respect to Class A shares pursuant to Rule 12b-1 under the Act. Under the Shareholder Services Plan, the Portfolio pays the Distributor a shareholder services fee, accrued daily and paid monthly, at an annual rate of 0.25% of the Portfolio's average daily net assets attributable to Class A shares.
The Fund has adopted a Distribution and Shareholder Services Plan with respect to Class L shares pursuant to Rule 12b-1 under the Act. Under the Distribution and Shareholder Services Plan, the Portfolio pays the Distributor a distribution fee, accrued daily and paid monthly, at an annual rate of 0.50% and a shareholder services fee, accrued daily and paid monthly, at an annual rate of 0.25% of the Portfolio's average daily net assets attributable to Class L shares.
The distribution and shareholder services fees are used to support the expenses associated with servicing and maintaining accounts. The Distributor may compensate other parties for providing shareholder support services to investors who purchase Class A and Class L shares.
E. Dividend Disbursing and Transfer Agent: The Fund's dividend disbursing and transfer agent was Morgan Stanley Services Company Inc. ("Morgan Stanley Services"). Pursuant to a Transfer Agency Agreement, the Fund paid Morgan Stanley Services a fee based on the number of classes, accounts and transactions relating to the Portfolios of the Fund. Effective July 1, 2013, the Directors approved changing the transfer agent to Boston Financial Data Services, Inc.
F. Custodian Fees: State Street (the "Custodian") serves as Custodian for the Fund in accordance with a Custodian Agreement. The Custodian holds cash, securities, and other assets of the Fund as required by the Act. Custody fees are payable monthly based on assets held in custody, investment purchases and sales activity and account maintenance fees, plus reimbursement for certain out-of-pocket expenses.
G. Security Transactions and Transactions with Affiliates: For the year ended December 31, 2013, purchases and sales of investment securities for the Portfolio, other than long-term U.S. Government securities and short-term investments, were approximately $278,115,000 and $331,044,000, respectively. There were no purchases and sales of long-term U.S. Government securities for the year ended December 31, 2013.
The Portfolio invests in the Institutional Class of the Morgan Stanley Institutional Liquidity Funds — Money Market Portfolio (the "Liquidity Funds"), an open-end management investment company managed by the Adviser, both directly, and as a portion of the securities held as collateral on loaned securities. Advisory fees paid by the Portfolio are reduced by an amount equal to its pro-rata share of the advisory and administration fees paid by the Portfolio due to its investment in the Liquidity Funds. For the year ended December 31, 2013, advisory fees paid were reduced by approximately $49,000 relating to the Portfolio's investment in the Liquidity Funds.
A summary of the Portfolio's transactions in shares of the Liquidity Funds during the year ended December 31, 2013 is as follows:
Value
December 31,
2012
(000) | | Purchases
at Cost
(000) | | Sales
(000) | | Dividend
Income
(000) | | Value
December 31,
2013
(000) | |
| $ | 9,357 | | | $ | 323,575 | | | $ | 208,925 | | | $ | 32 | | | $ | 124,007 | | |
During the year ended December 31, 2013, the Portfolio incurred approximately $12,000 in brokerage commissions with Morgan Stanley & Co., LLC, an affiliate of the Adviser, Administrator and Distributor, for portfolio transactions executed on behalf of the Portfolio.
From January 1, 2013 to June 30, 2013, the Portfolio incurred approximately $8,000 in brokerage commissions with Citigroup, Inc., and its affiliated broker-dealers, which may be deemed affiliates of the Adviser, Administrator and Distributor under Section 17 of the Act, for portfolio transactions executed on behalf of the Portfolio. Citigroup, Inc. and its affiliated broker-dealers ceased to be affiliates of the Portfolio pursuant to Section 17 of the Act as of July 1, 2013.
H. Federal Income Taxes: It is the Portfolio's intention to continue to qualify as a regulated investment company and distribute all of its taxable and tax-exempt income. Accordingly, no provision for Federal income taxes is required in the financial statements.
The Portfolio may be subject to taxes imposed by countries in which it invests. Such taxes are generally based on income and/or capital gains earned or repatriated. Taxes are accrued based on net investment income, net realized gains and net unrealized appreciation as such income and/or gains are earned. Taxes may also be based on transactions in foreign currency and are accrued based on the value of investments denominated in such currency.
23
Morgan Stanley Institutional Fund, Inc.
Annual Report — December 31, 2013
Notes to Financial Statements (cont'd)
FASB ASC 740-10, Income Taxes — Overall, sets forth a minimum threshold for financial statement recognition of the benefit of a tax position taken or expected to be taken in a tax return. Management has concluded there are no significant uncertain tax positions that would require recognition in the financial statements. If applicable, the Portfolio recognizes interest accrued related to unrecognized tax benefits in "Interest Expense" and penalties in "Other Expenses" in the Statement of Operations. The Portfolio files tax returns with the U.S. Internal Revenue Service, New York and various states. Each of the tax years in the four-year period ended December 31, 2013, remains subject to examination by taxing authorities.
The tax character of distributions paid may differ from the character of distributions shown in the Statements of Changes in Net Assets due to short-term capital gains being treated as ordinary income for tax purposes. The tax character of distributions paid during fiscal years 2013 and 2012 was as follows:
2013
Distributions
Paid From: | | 2012
Distributions
Paid From: | |
Ordinary
Income
(000) | | Long-Term
Capital Gain
(000) | | Ordinary
Income
(000) | | Long-Term
Capital Gain
(000) | |
| $ | 11,998 | | | $ | 37,925 | | | $ | 1,111 | | | $ | 1,112 | | |
The amount and character of income and gains to be distributed are determined in accordance with income tax regulations which may differ from GAAP. These book/tax differences are either considered temporary or permanent in nature.
Temporary differences are attributable to differing book and tax treatments for the timing of the recognition of gains (losses) on certain investment transactions and the timing of the deductibility of certain expenses.
Permanent differences, primarily due to differing treatments of gains (losses) related to foreign currency transactions and a dividend redesignation, resulted in the following reclassifications among the components of net assets at December 31, 2013:
Undistributed
(Distributions in
Exess of) Net
Investment
Income (Loss)
(000) | | Accumulated
Undistributed
Net Realized
Gain (Loss)
(000) | | Paid-in-Capital
(000) | |
| $ | (13 | ) | | $ | 13 | | | | — | | |
At December 31, 2013, the components of distributable earnings for the Portfolio on a tax basis were as follows:
Undistributed
Ordinary
Income
(000) | | Undistributed
Long-Term
Capital Gain
(000) | |
| $ | 3,224 | | | | — | | |
At December 31, 2013, the aggregate cost for Federal income tax purposes is approximately $759,241,000. The aggregate gross unrealized appreciation is approximately $492,812,000 and the aggregate gross unrealized depreciation is approximately $521,000 resulting in net unrealized appreciation of approximately $492,291,000.
Capital losses and specified ordinary losses, including currency losses, incurred after October 31 but within the taxable year are deemed to arise on the first day of the Portfolio's next taxable year. For the year ended December 31, 2013, the Portfolio deferred to January 1, 2014 for U.S. Federal income tax purposes the following losses:
Post-October
Currency And
Specified Ordinary
Losses
(000) | | Post-October
Capital Losses
(000) | |
| | — | | | $ | 8,601 | | |
I. Other (unaudited): At December 31, 2013, the Portfolio had otherwise unaffiliated record owners of 10% or greater. Investment activities of these shareholders could have a material impact on the Portfolio. The aggregate percentage of such owners was 56% and 50%, for Class I and Class A shares, respectively.
J. Results of Special Shareholder Meeting (unaudited): On June 5, 2013 as adjourned to June 24, 2013, July 17, 2013 and July 24, 2013, a Joint Special Shareholder Meeting was held for Class H shareholders of the Portfolio to approve the Articles of Amendment to the Fund's Articles of Amendment and Restatement and a Plan of Reclassification for the Portfolio pursuant to which Class H shares would be reclassified as Class P shares. The results with respect to this proposal were as follows:
| For | | Against | | Abstain | |
| | 1,665 | | | | 0 | | | | 0 | | |
K. Accounting Pronouncement: In June 2013, FASB issued Accounting Standards Update 2013-08 Financial Services — Investment Companies (Topic 946) — Amendments to the Scope, Measurement, and Disclosure Requirements ("ASU 2013-08") which is effective for interim and annual reporting periods in fiscal years that begin after December 15, 2013. ASU 2013-08 sets forth a methodology for determining whether an entity should be characterized as an investment company and prescribes fair value accounting for an investment company's non-controlling ownership interest in another investment company. FASB has determined that a fund registered under the Investment Company Act of 1940 automatically meets ASU 2013-08's criteria for an investment
24
Morgan Stanley Institutional Fund, Inc.
Annual Report — December 31, 2013
Notes to Financial Statements (cont'd)
company. Although still evaluating the potential impacts of ASU 2013-08 to the Portfolio, management expects that the impact of the Portfolio's adoption will be limited to additional financial statement disclosures.
25
Morgan Stanley Institutional Fund, Inc.
Annual Report — December 31, 2013
Report of Independent Registered Public Accounting Firm
To the Shareholders and Board of Directors of
Morgan Stanley Institutional Fund, Inc. —
Growth Portfolio
We have audited the accompanying statement of assets and liabilities, including the portfolio of investments, of Growth Portfolio (one of the portfolios constituting Morgan Stanley Institutional Fund, Inc.) (the "Portfolio") as of December 31, 2013, and the related statement of operations for the year then ended, the statements of changes in net assets for each of the two years in the period then ended, and the financial highlights for each of the periods indicated therein. These financial statements and financial highlights are the responsibility of the Portfolio's management. Our responsibility is to express an opinion on these financial statements and financial highlights based on our audits.
We conducted our audits in accordance with the standards of the Public Company Accounting Oversight Board (United States). Those standards require that we plan and perform the audit to obtain reasonable assurance about whether the financial statements and financial highlights are free of material misstatement. We were not engaged to perform an audit of the Portfolio's internal control over financial reporting. Our audits included consideration of internal control over financial reporting as a basis for designing audit procedures that are appropriate in the circumstances, but not for the purpose of expressing an opinion on the effectiveness of the Portfolio's internal control over financial reporting. Accordingly, we express no such opinion. An audit also includes examining, on a test basis, evidence supporting the amounts and disclosures in the financial statements and financial highlights, assessing the accounting principles used and significant estimates made by management, and evaluating the overall financial statement presentation. Our procedures included confirmation of securities owned as of December 31, 2013, by correspondence with the custodian and others or by other appropriate auditing procedures where replies from others were not received. We believe that our audits provide a reasonable basis for our opinion.
In our opinion, the financial statements and financial highlights referred to above present fairly, in all material respects, the financial position of Growth Portfolio (one of the portfolios constituting Morgan Stanley Institutional Fund, Inc.) December 31, 2013, the results of its operations for the year then ended, the changes in its net assets for each of the two years in the period then ended, and the financial highlights for each of the periods indicated therein, in conformity with U.S. generally accepted accounting principles.

Boston, Massachusetts
February 26, 2014
26
Morgan Stanley Institutional Fund, Inc.
Annual Report — December 31, 2013
Federal Tax Notice (unaudited)
For Federal income tax purposes, the following information is furnished with respect to the distributions paid by the Portfolio during its taxable year ended December 31, 2013. For corporate shareholders 55.7% of the dividends qualified for the dividends received deduction.
The Portfolio designated and paid approximately $37,925,000 as a long-term capital gain distribution.
For Federal income tax purposes, the following information is furnished with respect to the Portfolio's earnings for its taxable year ended December 31, 2013. When distributed, certain earnings may be subject to a maximum tax rate of 15% as provided for the Jobs and Growth Tax Relief Reconciliation Act of 2003. The Portfolio designated up to a maximum of approximately $10,963,000 as taxable at this lower rate.
In January, the Portfolio provides tax information to shareholders for the preceding calendar year.
27
Morgan Stanley Institutional Fund, Inc.
Annual Report — December 31, 2013
U.S. Privacy Policy (unaudited)
AN IMPORTANT NOTICE CONCERNING OUR U.S. PRIVACY POLICY
This privacy notice describes the U.S. privacy policy of Morgan Stanley Distribution, Inc., and the Morgan Stanley family of mutual funds ("us", "our", "we").
We are required by federal law to provide you with notice of our U.S. privacy policy ("Policy"). This Policy applies to both our current and former clients unless we state otherwise and is intended for individual clients who purchase products or receive services from us for personal, family or household purposes. This Policy is not applicable to partnerships, corporations, trusts or other non-individual clients or account holders, nor is this Policy applicable to individuals who are either beneficiaries of a trust for which we serve as trustee or participants in an employee benefit plan administered or advised by us. This Policy is, however, applicable to individuals who select us to be a custodian of securities or assets in individual retirement accounts, 401(k) accounts, or accounts subject to the Uniform Gifts to Minors Act.
This notice sets out our business practices to protect your privacy; how we collect and share personal information about you; and how you can limit our sharing or certain uses by others of this information. We may amend this Policy at any time, and will inform you of any changes to our Policy as required by law.
WE RESPECT YOUR PRIVACY
We appreciate that you have provided us with your personal financial information and understand your concerns about your information. We strive to safeguard the information our clients entrust to us. Protecting the confidentiality and security of client information is an important part of how we conduct our business.
This notice describes what personal information we collect about you, how we collect it, when we may share it with others, and how certain others may use it. It discusses the steps you may take to limit our sharing of certain information about you with our affiliated companies, including, but not limited to our affiliated banking businesses, brokerage firms and credit service affiliates. It also discloses how you may limit our affiliates' use of shared information for marketing purposes.
Throughout this Policy, we refer to the nonpublic information that personally identifies you as "personal information." We also use the term "affiliated company" in this notice. An affiliated company is a company in our family of companies and includes companies with the Morgan Stanley name. These affiliated companies are financial institutions such as broker-dealers, banks, investment advisers and credit card issuers. We refer to any company that is not an affiliated company as a nonaffiliated third party. For purposes of Section 5 of this notice, and your ability to limit certain uses of personal information by our affiliates, this notice applies to the use of personal information by our affiliated companies.
1. WHAT PERSONAL INFORMATION DO WE COLLECT FROM YOU?
We may collect the following types of information about you: (i) information provided by you, including information from applications and other forms we receive from you, (ii) information about your transactions with us or our affiliates, (iii) information about your transactions with nonaffiliated third parties, (iv) information from consumer reporting agencies, (v) information obtained from our websites, and (vi) information obtained from other sources. For example:
• We collect information such as your name, address, e-mail address, telephone/fax numbers, assets, income and investment objectives through applications and other forms you submit to us.
• We may obtain information about account balances, your use of account(s) and the types of products and services you prefer to receive from us through your dealings and transactions with us and other sources.
• We may obtain information about your creditworthiness and credit history from consumer reporting agencies.
• We may collect background information from and through third-party vendors to verify representations you have made and to comply with various regulatory requirements.
2. WHEN DO WE DISCLOSE PERSONAL INFORMATION WE COLLECT ABOUT YOU?
We may disclose personal information we collect about you in each of the categories listed above to affiliated and nonaffiliated third parties.
28
Morgan Stanley Institutional Fund, Inc.
Annual Report — December 31, 2013
U.S. Privacy Policy (unaudited) (cont'd)
a. Information we disclose to affiliated companies.
We may disclose personal information that we collect about you to our affiliated companies to manage your account(s) effectively, to service and process your transactions, and to let you know about products and services offered by us and affiliated companies, to manage our business, and as otherwise required or permitted by law. Offers for products and services from affiliated companies are developed under conditions designed to safeguard your personal information.
b. Information we disclose to third parties.
We may disclose personal information that we collect about you to nonaffiliated third parties to provide marketing services on our behalf or to other financial institutions with whom we have joint marketing agreements. We may also disclose all of the information we collect to other nonaffiliated third parties for our everyday business purposes, such as to process transactions, maintain account(s), respond to court orders and legal investigations, report to credit bureaus, offer our own products and services, protect against fraud, for institutional risk control, to perform services on our behalf, and as otherwise required or permitted by law.
When we share personal information about you with a nonaffiliated third party, they are required to limit their use of personal information about you to the particular purpose for which it was shared and they are not allowed to share personal information about you with others except to fulfill that limited purpose or as may be permitted or required by law.
3. HOW DO WE PROTECT THE SECURITY AND CONFIDENTIALITY OF PERSONAL INFORMATION WE COLLECT ABOUT YOU?
We maintain physical, electronic and procedural security measures that comply with applicable law and regulations to help safeguard the personal information we collect about you. We have internal policies governing the proper handling of client information by employees. Third parties that provide support or marketing services on our behalf may also receive personal information about you, and we require them to adhere to appropriate security standards with respect to such information.
4. HOW CAN YOU LIMIT OUR SHARING CERTAIN PERSONAL INFORMATION ABOUT YOU WITH OUR AFFILIATED COMPANIES FOR ELIGIBILITY DETERMINATION?
By following the opt-out procedures in Section 6 below, you may limit the extent to which we share with our affiliated companies, personal information that was collected to determine your eligibility for products and services such as your credit reports and other information that you have provided to us or that we may obtain from third parties ("eligibility information"). Eligibility information does not include your identification information or personal information pertaining to our transactions or experiences with you. Please note that, even if you direct us not to share eligibility information with our affiliated companies, we may still share your personal information, including eligibility information, with our affiliated companies under circumstances that are permitted under applicable law, such as to process transactions or to service your account.
5. HOW CAN YOU LIMIT THE USE OF CERTAIN PERSONAL INFORMATION ABOUT YOU BY OUR AFFILIATED COMPANIES FOR MARKETING?
By following the opt-out instructions in Section 6 below, you may limit our affiliated companies from marketing their products or services to you based on personal information we disclose to them. This information may include, for example, your income and account history with us. Please note that, even if you choose to limit our affiliated companies from using personal information about you that we may share with them for marketing their products and services to you, our affiliated companies may use your personal information that they obtain from us to market to you in circumstances permitted by law, such as if the affiliated party has its own relationship with you.
29
Morgan Stanley Institutional Fund, Inc.
Annual Report — December 31, 2013
U.S. Privacy Policy (unaudited) (cont'd)
6. HOW CAN YOU SEND US AN OPT-OUT INSTRUCTION?
If you wish to limit our sharing of eligibility information about you with our affiliated companies, or our affiliated companies' use of personal information for marketing purposes, as described in this notice, you may do so by:
• Calling us at (800) 548-7786
Monday–Friday between 8a.m. and 5p.m. (EST)
• Writing to us at the following address:
Boston Financial Data Services, Inc.
c/o Privacy Coordinator
P.O. Box 219804
Kansas City, Missouri 64121
If you choose to write to us, your request should include: your name, address, telephone number and account number(s) to which the opt-out applies and whether you are opting out with respect to sharing of eligibility information (Section 4 above), or information used for marketing (Section 5 above), or both. Written opt-out requests should not be sent with any other correspondence. In order to process your request, we require that the request be provided by you directly and not through a third party. Once you have informed us about your privacy preferences, your opt-out preference will remain in effect with respect to this Policy (as it may be amended) until you notify us otherwise. If you are a joint account owner, we will accept instructions from any one of you and apply those instructions to the entire account.
Please understand that if you limit our sharing or our affiliated companies' use of personal information, you and any joint account holder(s) may not receive information about our affiliated companies' products and services, including products or services that could help you manage your financial resources and achieve your investment objectives.
If you have more than one account or relationship with us, please specify the accounts to which you would like us to apply your privacy choices. If you have accounts or relationships with our affiliates, you may receive multiple privacy policies from them, and will need to separately notify those companies of your privacy choices for those accounts or relationships.
7. WHAT IF AN AFFILIATED COMPANY BECOMES A NONAFFILIATED THIRD PARTY?
If, at any time in the future, an affiliated company becomes a nonaffiliated third party, further disclosures of personal information made to the former affiliated company will be limited to those described in Section 2(b) above relating to nonaffiliated third parties. If you elected under Section 6 to limit disclosures we make to affiliated companies, or use of personal information by affiliated companies, your election will not apply to use by any former affiliated company of your personal information in their possession once it becomes a nonaffiliated third party.
SPECIAL NOTICE TO RESIDENTS OF VERMONT
The following section supplements our Policy with respect to our individual clients who have a Vermont address and supersedes anything to the contrary in the above Policy with respect to those clients only.
The State of Vermont requires financial institutions to obtain your consent prior to sharing personal information that they collect about you with nonaffiliated third parties, or eligibility information with affiliated companies, other than in certain limited circumstances. Except as permitted by law, we will not share personal information we collect about you with nonaffiliated third parties or eligibility information with affiliated companies, unless you provide us with your written consent to share such information.
SPECIAL NOTICE TO RESIDENTS OF CALIFORNIA
The following section supplements our Policy with respect to our individual clients who have a California address and supersedes anything to the contrary in the above Policy with respect to those clients only.
In response to a California law, if your account has a California home address, your personal information will not be disclosed to nonaffiliated third parties except as permitted by applicable California law, and we will limit sharing such personal information with our affiliates to comply with California privacy laws that apply to us.
30
Morgan Stanley Institutional Fund, Inc.
Annual Report — December 31, 2013
Director and Officer Information (unaudited)
Independent Director:
Name, Age and Address of
Independent Director | | Position(s)
Held with
Registrant | | Length of Time
Served* | | Principal Occupation(s) During Past 5 Years | | Number of
Portfolios in
Fund Complex
Overseen by
Independent
Director** | | Other Directorships
Held by Independent
Director*** | |
Frank L. Bowman (69)
c/o Kramer Levin Naftalis &
Frankel LLP
Counsel to the Independent
Directors
1177 Avenue of the Americas
New York, NY 10036 | | Director | | Since
August
2006 | | President, Strategic Decisions, LLC (consulting) (since February 2009); Director or Trustee of various Morgan Stanley Funds (since August 2006); Chairperson of the Insurance Sub-Committee of the Compliance and Insurance Committee (since February 2007); served as President and Chief Executive Officer of the Nuclear Energy Institute (policy organization) (February 2005-November 2008); retired as Admiral, U.S. Navy after serving over 38 years on active duty including 8 years as Director of the Naval Nuclear Propulsion Program in the Department of the Navy and the U.S. Department of Energy (1996-2004); served as Chief of Naval Personnel (July 1994-September 1996); and on the Joint Staff as Director of Political Military Affairs (June 1992-July 1994); knighted as Honorary Knight Commander of the Most Excellent Order of the British Empire; awarded the Officier de l'Orde National du Mérite by the French Government; elected to the National Academy of Engineering (2009). | | | 98 | | | Director of BP p.l.c.; Director of Naval and Nuclear Technologies LLP; Director of the Armed Services YMCA of the USA and the U.S. Naval Submarine League; Director of the American Shipbuilding Suppliers Association; Member of the National Security Advisory Council of the Center for U.S. Global Engagement and a member of the CNA Military Advisory Board; Chairman, J Street Cup Golf Charity, Trustee Fairhaven United Methodist Church. | |
Michael Bozic (73)
c/o Kramer Levin Naftalis & Frankel LLP
Counsel to the Independent Directors
1177 Avenue of the Americas New York, NY 10036 | | Director | | Since
April
1994 | | Private investor and a member of the advisory board of American Road Group LLC (retail) (since June 2000); Chairperson of the Compliance and Insurance Committee (since October 2006); Director or Trustee of various Morgan Stanley Funds (since April 1994); formerly, Chairperson of the Insurance Committee (July 2006-September 2006); Vice Chairman of Kmart Corporation (December 1998-October 2000), Chairman and Chief Executive Officer of Levitz Furniture Corporation (November 1995-November 1998) and President and Chief Executive Officer of Hills Department Stores (May 1991-July 1995); variously Chairman, Chief Executive Officer, President and Chief Operating Officer (1987-1991) of the Sears Merchandise Group of Sears, Roebuck & Co. | | | 100 | | | Trustee and member of the Hillsdale College Board of Trustees. | |
Kathleen A. Dennis (60)
c/o Kramer Levin Naftalis & Frankel LLP
Counsel to the Independent Directors
1177 Avenue of the Americas New York, NY 10036 | | Director | | Since
August
2006 | | President, Cedarwood Associates (mutual fund and investment management consulting) (since July 2006); Chairperson of the Money Market and Alternatives Sub-Committee of the Investment Committee (since October 2006) and Director or Trustee of various Morgan Stanley Funds (since August 2006); formerly, Senior Managing Director of Victory Capital Management (1993-2006). | | | 98 | | | Director of various non-profit organizations. | |
Dr. Manuel H. Johnson (65)
c/o Johnson Smick
Group, Inc.
888 16th Street, N.W.
Suite 740
Washington, D.C. 20006 | | Director | | Since
July
1991 | | Senior Partner, Johnson Smick International, Inc. (consulting firm); Chairperson of the Investment Committee (since October 2006) and Director or Trustee of various Morgan Stanley Funds (since July 1991); Co-Chairman and a founder of the Group of Seven Council (G7C) (international economic commission); formerly, Chairperson of the Audit Committee (July 1991-September 2006), Vice Chairman of the Board of Governors of the Federal Reserve System and Assistant Secretary of the U.S. Treasury. | | | 101 | | | Director of NVR, Inc. (home construction). | |
31
Morgan Stanley Institutional Fund, Inc.
Annual Report — December 31, 2013
Director and Officer Information (unaudited) (cont'd)
Independent Director: (cont'd)
Name, Age and Address of
Independent Director | | Position(s)
Held with
Registrant | | Length of Time
Served* | | Principal Occupation(s) During Past 5 Years | | Number of
Portfolios in
Fund Complex
Overseen by
Independent
Director** | | Other Directorships
Held by Independent
Director*** | |
Joseph J. Kearns (71)
c/o Kearns & Associates LLC PMB754
22631 Pacific Coast Highway
Malibu, CA 90265 | | Director | | Since
August
1994 | | President, Kearns & Associates LLC (investment consulting); Chairperson of the Audit Committee (since October 2006) and Director or Trustee of various Morgan Stanley Funds (since August 1994); formerly, Deputy Chairperson of the Audit Committee (July 2003-September 2006) and Chairperson of the Audit Committee of various Morgan Stanley Funds (since August 1994); CFO of the J. Paul Getty Trust. | | | 101 | | | Director of Electro Rent Corporation (equipment leasing) and The Ford Family Foundation. | |
Michael F. Klein (55)
c/o Kramer Levin Naftalis & Frankel LLP
Counsel to the Independent Directors
1177 Avenue of the Americas New York, NY 10036 | | Director | | Since
August
2006 | | Managing Director, Aetos Capital, LLC (since March 2000) and Co-President, Aetos Alternatives Management, LLC (since January 2004) and Co-Chief Executive Officer of Aetos Capital LLC (since August 2013); Chairperson of the Fixed Income Sub-Committee of the Investment Committee (since October 2006) and Director or Trustee of various Morgan Stanley Funds (since August 2006); formerly, Managing Director, Morgan Stanley & Co. Inc. and Morgan Stanley Dean Witter Investment Management, President, various Morgan Stanley Funds (June 1998-March 2000) and Principal, Morgan Stanley & Co. Inc. and Morgan Stanley Dean Witter Investment Management (August 1997-December 1999). | | | 98 | | | Director of certain investment funds managed or sponsored by Aetos Capital, LLC. Director of Sanitized AG and Sanitized Marketing AG (specialty chemicals). | |
Michael E. Nugent (77)
522 Fifth Avenue
New York, NY 10036 | | Chairperson
of the
Board and Director | | Chairperson of the Boards since July 2006 and Director since July 1991 | | Chairperson of the Boards of various Morgan Stanley Funds (since July 2006); Chairperson of the Closed-End Fund Committee (since June 2012) and Director or Trustee of various Morgan Stanley Funds (since July 1991); formerly, Chairperson of the Insurance Committee (until July 2006); General Partner, Triumph Capital, L.P. (private investment partnership) (1988-2013) | | | 100 | | | None. | |
W. Allen Reed (66)
c/o Kramer Levin Naftalis & Frankel LLP
Counsel to the Independent Directors
1177 Avenue of the Americas New York, NY 10036 | | Director | | Since
August
2006 | | Chairperson of the Equity Sub-Committee of the Investment Committee (since October 2006) and Director or Trustee of various Morgan Stanley Funds (since August 2006); formerly, President and CEO of General Motors Asset Management; Chairman and Chief Executive Officer of the GM Trust Bank and Corporate Vice President of General Motors Corporation (August 1994-December 2005). | | | 98 | | | Director of Temple-Inland Industries (packaging and forest products); Director of Legg Mason, Inc. and Director of the Auburn University Foundation. | |
Fergus Reid (81)
c/o Joe Pietryka, Inc.
85 Charles Colman Blvd. Pawling, NY 12564 | | Director | | Since
June
1992 | | Chairman, Joe Pietryka, Inc.; Chairperson of the Governance Committee and Director or Trustee of various Morgan Stanley Funds (since June 1992). | | | 101 | | | Through December 31, 2012, Trustee and Director of certain Investment companies in the JP Morgan Fund Complex. | |
32
Morgan Stanley Institutional Fund, Inc.
Annual Report — December 31, 2013
Director and Officer Information (unaudited) (cont'd)
Interested Director:
Name, Age and Address of
Interested Director | | Position(s)
Held with
Registrant | | Length of
Time Served* | | Principal Occupation(s) During Past 5 Years | | Number of
Portfolios in
Fund Complex
Overseen by
Interested
Director** | | Other Directorships
Held by Interested
Director*** | |
James F. Higgins (66)
One New York Plaza
New York, NY 10004 | | Director | | Since
June
2000 | | Director or Trustee of various Morgan Stanley Funds (since June 2000); Senior Advisor of Morgan Stanley (since August 2000). | | | 99 | | | Formerly, Director of AXA Financial, Inc. and AXA Equitable Life Insurance Company (2002-2011) and Director of AXA MONY Life Insurance Company and AXA MONY Life Insurance Company of America (2004-2011). | |
* Each Director serves an indefinite term, until his or her successor is elected.
** The Fund Complex includes (as of December 31, 2013) all open-end and closed-end funds (including all of their portfolios) advised by Morgan Stanley Investment Management Inc. (the "Adviser") and any funds that have an adviser that is an affiliated person of the Adviser (including, but not limited to, Morgan Stanley AIP GP LP).
*** This includes any directorships at public companies and registered investment companies held by the Director at any time during the past five years.
33
Morgan Stanley Institutional Fund, Inc.
Annual Report — December 31, 2013
Director and Officer Information (unaudited) (cont'd)
Executive Officers:
Name, Age and Address of Executive Officer | | Position(s) Held
with
Registrant | | Length of
Time Served* | | Principal Occupation(s) During Past 5 Years | |
John H. Gernon (50)
522 Fifth Avenue
New York, NY 10036 | | President and Principal Executive Officer—Equity, Fixed Income and AIP Funds | | Since
September
2013 | | President and Principal Executive Officer of the Equity and Fixed Income Funds and the Morgan Stanley AIP Funds (since September 2013) in the Fund Complex; Managing Director of the Adviser. | |
Stefanie V. Chang Yu (47)
522 Fifth Avenue
New York, NY 10036 | | Chief Compliance Officer | | Since
January
2014 | | Managing Director of the Adviser and various entities affiliated with the Adviser; Chief Compliance Officer of various Morgan Stanley Funds and the Adviser (since January 2014). Formerly, Vice President of various Morgan Stanley Funds (December 1997-January 2014). | |
Joseph C. Benedetti (48)
522 Fifth Avenue
New York, NY 10036 | | Vice President | | Since
January
2014 | | Managing Director of the Adviser and various entities affiliated with the Adviser; Vice President of various Morgan Stanley Funds (since January 2014). | |
Francis J. Smith (48)
522 Fifth Avenue
New York, NY 10036 | | Treasurer and Principal Financial Officer | | Treasurer since July 2003 and Principal Financial Officer since September 2002 | | Executive Director of the Adviser and various entities affiliated with the Adviser; Treasurer and Principal Financial Officer of various Morgan Stanley Funds (since July 2003). | |
Mary E. Mullin (46)
522 Fifth Avenue
New York, NY 10036 | | Secretary | | Since
June
1999 | | Executive Director of the Adviser and various entities affiliated with the Adviser; Secretary of various Morgan Stanley Funds (since June 1999). | |
* Each officer serves an indefinite term, until his or her successor is elected.
34
Morgan Stanley Institutional Fund, Inc.
Annual Report — December 31, 2013
Adviser and Administrator
Morgan Stanley Investment Management Inc.
522 Fifth Avenue
New York, New York 10036
Distributor
Morgan Stanley Distribution, Inc.
522 Fifth Avenue
New York, New York 10036
Dividend Disbursing and Transfer Agent
Boston Financial Data Services, Inc.
2000 Crown Colony Drive
Quincy, Massachusetts 02169
Custodian
State Street Bank and Trust Company
One Lincoln Street
Boston, Massachusetts 02111
Legal Counsel
Dechert LLP
1095 Avenue of the Americas
New York, New York 10036
Counsel to the Independent Directors
Kramer Levin Naftalis & Frankel LLP
1177 Avenue of the Americas
New York, New York 10036
Independent Registered Public Accounting Firm
Ernst & Young LLP
200 Clarendon Street
Boston, Massachusetts 02116
Reporting to Shareholders
Each Morgan Stanley fund provides a complete schedule of portfolio holdings in its semi-annual and annual reports within 60 days of the end of the fund's second and fourth fiscal quarters by filing the schedule electronically with the Securities and Exchange Commission (SEC). The semi-annual reports are filed on Form N-CSRS and the annual reports are filed on Form N-CSR. Morgan Stanley also delivers the semi-annual and annual reports to fund shareholders and makes these reports available on its public website, www.morganstanley.com/im. Each Morgan Stanley fund also files a complete schedule of portfolio holdings with the SEC for the fund's first and third fiscal quarters on Form N-Q. Morgan Stanley does not deliver the reports for the first and third fiscal quarters to shareholders, nor are the reports posted to the Morgan Stanley public website. You may, however, obtain the Form N-Q filings (as well as the Form N-CSR and N-CSRS filings) by accessing the SEC's website, www.sec.gov. You may also review and copy them at the SEC's Public Reference Room in Washington, DC. Information on the operation of the SEC's Public Reference Room may be obtained by calling the SEC toll free at 1 (800) SEC-0330. You can also request copies of these materials, upon payment of a duplicating fee, by electronic request at the SEC's email address (publicinfo@sec.gov) or by writing the Public Reference Room of the SEC, Washington, DC 20549-0102.
Proxy Voting Policies and Procedures and Proxy Voting Record
You may obtain a copy of the Fund's Proxy Voting Policy and Procedures and information regarding how the Fund voted proxies relating to portfolio securities during the most recent twelve-month period ended June 30, without charge, upon request, by calling toll free 1 (800) 548-7786 or by visiting our website at www.morganstanley.com/im. This information is also available on the SEC's website at www.sec.gov.
This report is authorized for distribution only when preceded or accompanied by a prospectus of the Morgan Stanley Institutional Fund, Inc. which describes in detail each Investment Portfolio's investment policies, risks, fees and expenses. Please read the prospectus carefully before you invest or send money. For additional information, including information regarding the investments comprising the Portfolio, please visit our website at www.morganstanley.com/im or call toll free 1 (800) 548-7786.
35
(This Page has been left blank intentionally.)
(This Page has been left blank intentionally.)
Printed in U.S.A.
This Report has been prepared for shareholders and may be distributed to others only if preceded or accompanied by a current prospectus.
Morgan Stanley Investment Management Inc.
522 Fifth Avenue
New York, New York 10036
© 2014 Morgan Stanley. Morgan Stanley Distribution, Inc.

IFIGRWANN
809219 Exp 2.28.15

Morgan Stanley Institutional Fund, Inc.
Opportunity Portfolio
Annual Report
December 31, 2013

Morgan Stanley Institutional Fund, Inc.
Annual Report — December 31, 2013
Shareholders' Letter | | | 2 | | |
Expense Example | | | 3 | | |
Investment Overview | | | 4 | | |
Portfolio of Investments | | | 6 | | |
Statement of Assets and Liabilities | | | 7 | | |
Statement of Operations | | | 9 | | |
Statements of Changes in Net Assets | | | 10 | | |
Financial Highlights | | | 12 | | |
Notes to Financial Statements | | | 16 | | |
Report of Independent Registered Public Accounting Firm | | | 24 | | |
Federal Tax Notice | | | 25 | | |
U.S. Privacy Policy | | | 26 | | |
Director and Officer Information | | | 29 | | |
This report is authorized for distribution only when preceded or accompanied by prospectuses of the Morgan Stanley Institutional Fund, Inc. To receive a prospectus and/or statement of additional information (SAI), which contains more complete information such as investment objectives, charges, expenses, policies for voting proxies, risk considerations, and describes in detail each of the Portfolio's investment policies to the prospective investor, please call toll free 1 (800) 548-7786. Please read the prospectuses carefully before you invest or send money.
Additionally, you can access portfolio information including performance, characteristics, and investment team commentary through Morgan Stanley Investment Management's website: www.morganstanley.com/im.
Market forecasts provided in this report may not necessarily come to pass. There is no guarantee that any sectors mentioned will continue to perform as discussed herein or that securities in such sectors will be held by the Portfolio in the future. There is no assurance that a Portfolio will achieve its investment objective. Portfolios are subject to market risk, which is the possibility that market values of securities owned by the Portfolio will decline and, therefore, the value of the Portfolio's shares may be less than what you paid for them. Accordingly, you can lose money investing in the Portfolio. Please see the prospectus for more complete information on investment risks.
1
Morgan Stanley Institutional Fund, Inc.
Annual Report — December 31, 2013
Shareholders' Letter (unaudited)
Dear Shareholders,
We are pleased to provide this Annual report, in which you will learn how your investment in Opportunity Portfolio (the "Portfolio") performed during the latest twelve-month period.
Morgan Stanley Investment Management is a client-centric, investor-led organization. Our global presence, intellectual capital, and breadth of products and services enable us to partner with investors to meet the evolving challenges of today's financial markets. We aim to deliver superior investment service and to empower our clients to make the informed decisions that help them reach their investment goals.
As always, we thank you for selecting Morgan Stanley Investment Management, and look forward to working with you in the months and years ahead.
Sincerely,

John H. Gernon
President and Principal Executive Officer
January 2014
2
Morgan Stanley Institutional Fund, Inc.
Annual Report — December 31, 2013
Expense Example (unaudited)
Opportunity Portfolio
As a shareholder of the Portfolio, you incur two types of costs: (1) transactional costs; and (2) ongoing costs, including advisory fees, administration fees, distribution and shareholder services fees and other Portfolio expenses. This example is intended to help you understand your ongoing costs (in dollars) of investing in the Portfolio and to compare these costs with the ongoing costs of investing in other mutual funds.
This example is based on an investment of $1,000 invested at the beginning of the six-month period ended December 31, 2013 and held for the entire six-month period.
Actual Expenses
The table below provides information about actual account values and actual expenses. You may use the information in this table, together with the amount you invested, to estimate the expenses that you paid over the period. Simply divide your account value by $1,000 (for example, an $8,600 account value divided by $1,000 = 8.6), then multiply the result by the number in the table under the heading entitled "Actual Expenses Paid During Period" to estimate the expenses you paid on your account during this period.
Hypothetical Example for Comparison Purposes
The table below provides information about hypothetical account values and hypothetical expenses based on the Portfolio's actual expense ratio and an assumed rate of return of 5% per year before expenses, which is not the Portfolio's actual return. The hypothetical account values and expenses may not be used to estimate the actual ending account balance or expenses you paid for the period. You may use this information to compare the ongoing costs of investing in the Portfolio and other funds. To do so, compare this 5% hypothetical example with the 5% hypothetical examples that appear in the shareholder reports of the other funds.
Please note that the expenses shown in the table are meant to highlight your ongoing costs only and do not reflect any transactional costs, such as sales charges (loads). Therefore, the information for each class in the table is useful in comparing ongoing costs only, and will not help you determine the relative total costs of owning different funds. In addition, if these transactional costs were included, your costs would have been higher.
| | | Beginning
Account
Value
7/1/13 | | Actual Ending
Account
Value
12/31/13 | | Hypothetical
Ending Account
Value | | Actual
Expenses
Paid
During
Period | | Hypothetical
Expenses Paid
During Period | | Net
Expense
Ratio
During
Period*** | |
Opportunity Portfolio Class I | | $ | 1,000.00 | | | $ | 1,346.70 | | | $ | 1,020.97 | | | $ | 4.97 | * | | $ | 4.28 | * | | | 0.84 | % | |
Opportunity Portfolio Class A^ | | | 1,000.00 | | | | 1,344.40 | | | | 1,019.11 | | | | 7.15 | * | | | 6.16 | * | | | 1.21 | | |
Opportunity Portfolio Class L | | | 1,000.00 | | | | 1,341.30 | | | | 1,016.74 | | | | 9.91 | * | | | 8.54 | * | | | 1.68 | | |
Opportunity Portfolio Class IS | | | 1,000.00 | | | | 1,205.10 | | | | 1,012.52 | | | | 2.36 | ** | | | 2.15 | ** | | | 0.73 | | |
* Expenses are calculated using each Portfolio Class' annualized net expense ratio (as disclosed), multiplied by the average account value over the period, and multiplied by 184/365 (to reflect the most recent one-half year period).
** Expenses are calculated using the Portfolio Class' annualized net expense ratio (as disclosed), multiplied by the average account value over the period, and multiplied by 107/365 (to reflect the actual days in the period).
*** Annualized.
^ Effective September 9, 2013, Class P and Class H shares were renamed Class A shares.
3
Morgan Stanley Institutional Fund, Inc.
Annual Report — December 31, 2013
Investment Overview (unaudited)
Opportunity Portfolio
The Opportunity Portfolio seeks long-term capital appreciation.
Performance
For the year ended December 31, 2013, the Portfolio had a total return based on net asset value and reinvestment of distributions per share of 43.92%, net of fees, for Class I shares. The Portfolio's Class I shares outperformed against its benchmark, the Russell 1000® Growth Index (the "Index"), which returned 33.48%. Please keep in mind that high double-digit returns are highly unusual and cannot be sustained.
Factors Affecting Performance
• U.S. stocks turned in a strong performance for the year ended December 31, 2013. As in 2012, the expectation that accommodative monetary policy by the U.S. Federal Reserve (Fed) would continue for some time helped drive the prices of risky assets including stocks higher in 2013. However, as the U.S. economy began to look stronger, the Fed started signaling its intention to reduce the pace of its asset purchase program (known as quantitative easing or QE) if economic data warranted. Uncertainty as to the timing and magnitude of this tapering led to volatility across the capital markets. When the Fed unexpectedly left its QE program intact after its September meeting, stocks rallied strongly. The market's advance paused in October, disrupted by a partial government shutdown and political gridlock over whether to raise the debt ceiling, but resumed in the final months of the period on expectations — and later confirmation by the Fed — that QE tapering would begin in 2014.
• The technology sector was, by far, the largest contributor to relative performance, with gains led by a holding in an online social networking company.
• The consumer discretionary sector outperformed as well, due to both stock selection and an overweight there. A position in an online retailer added the most to relative returns in the sector.
• An overweight and stock selection in the financial services sector also benefited relative performance. Within the sector, a credit card and transaction processing company was the leading contributor.
• Relative returns were hurt by stock selection in consumer staples, although it was slightly offset by the positive effect of an underweight in the sector. A position in a liquor producer in China (which is not represented in the Index) was the main detractor in the sector.(a)
• The Portfolio had no exposure to the health care sector, which was unfavorable during the period as health care was the best-performing sector in the Index.
• Stock selection and an underweight in the producer durables sector dampened relative returns. Although the Portfolio's holdings aided relative performance, a lack of exposure to other strong-performing groups such as aerospace and diversified manufacturing operations was detrimental.
Management Strategies
• We look for high-quality growth companies that we believe have these attributes: sustainable competitive advantages, above-average business visibility, rising return on invested capital, strong free cash flow generation and a favorable risk/reward profile. We find these companies through intense fundamental research. Our emphasis is on secular growth, and as a result short-term market events are not as meaningful in the stock selection process.
(a) To gain exposure to the stock, the Portfolio utilized a P-note (participation note), which is intended to mirror the performance of the underlying stock. There is no leverage associated with P-notes.
* Actual Minimum Investment for Class L shares is $1,000.
** Performance shown for the Portfolio's Class L shares reflects the performance of the Class C shares of the Predecessor Fund for periods prior to May 21, 2010.
In accordance with SEC regulations, Portfolio's performance shown assumes that all recurring fees (including management fees) were deducted and all dividends and distributions were reinvested. The performance of Class L shares will vary from the Class I, Class A+ and Class IS shares based upon its different inception date and will be impacted by fees assessed to that class (if applicable).
4
Morgan Stanley Institutional Fund, Inc.
Annual Report — December 31, 2013
Investment Overview (unaudited) (cont'd)
Opportunity Portfolio
Performance Compared to the Russell 1000® Growth Index(1) and the Lipper Multi-Cap Growth Funds Index(2)
| | | Period Ended December 31, 2013
Total Returns(3) | |
| | | | | Average Annual | |
| | | One
Year | | Five
Years | | Ten
Years | | Since
Inception(6) | |
Portfolio — Class I Shares
w/o sales charges(4) | | | 43.92 | % | | | 27.38 | % | | | — | % | | | 10.82 | % | |
Russell 1000® Growth Index | | | 33.48 | | | | 20.39 | | | | — | | | | 8.30 | | |
Lipper Multi-Cap Growth Funds Index | | | 36.52 | | | | 20.53 | | | | — | | | | 7.97 | | |
Portfolio — Class A+ Shares
w/o sales charges(4) | | | 43.51 | | | | — | | | | — | | | | 20.27 | | |
Portfolio — Class A+ Shares with
maximum 5.25% sales charges(4) | | | 35.99 | | | | — | | | | — | | | | 18.50 | | |
Russell 1000® Growth Index | | | 33.48 | | | | — | | | | — | | | | 19.29 | | |
Lipper Multi-Cap Growth Funds Index | | | 36.52 | | | | — | | | | — | | | | 18.70 | | |
Portfolio — Class L Shares
w/o sales charges(4) | | | 42.78 | | | | 26.33 | | | | 9.22 | | | | 5.51 | | |
Russell 1000® Growth Index | | | 33.48 | | | | 20.39 | | | | 7.83 | | | | 4.49 | | |
Lipper Multi-Cap Growth Funds Index | | | 36.52 | | | | 20.53 | | | | 8.15 | | | | 5.32 | | |
Portfolio — Class IS Shares
w/o sales charges(5) | | | — | | | | — | | | | — | | | | 20.51 | | |
Russell 1000® Growth Index | | | — | | | | — | | | | — | | | | 11.03 | | |
Lipper Multi-Cap Growth Funds Index | | | — | | | | — | | | | — | | | | 10.77 | | |
Performance data quoted represents past performance, which is no guarantee of future results, and current performance may be lower or higher than the figures shown. Performance assumes that all dividends and distributions, if any, were reinvested. For the most recent month-end performance figures, please visit www.morganstanley.com/im. Investment return and principal value will fluctuate so that Portfolio shares, when redeemed, may be worth more or less than their original cost. Total returns do not reflect the deduction of taxes that a shareholder would pay on Portfolio distributions or the redemption of Portfolio shares. Returns for periods less than one year are not annualized. Performance of share classes will vary due to difference in sales charges and expenses.
+ Effective September 9, 2013, Class P shares were renamed Class A shares.
(1) The Russell 1000® Growth Index measures the performance of the large-cap growth segment of the U.S. equity universe. It includes those Russell 1000® Index companies with higher price-to-book ratios and higher forecasted growth values. The Russell 1000® Index is an index of approximately 1,000 of the largest U.S. companies based on a combination of market capitalization and current index membership. The Index is unmanaged and its returns do not include any sales charges or fees. Such costs would lower performance. It is not possible to invest directly in an index.
(2) The Lipper Multi-Cap Growth Funds Index is an equally weighted performance index of the largest qualifying funds (based on net assets) in the Lipper Multi-Cap Growth Funds classification. The Index, which is adjusted for capital gains distributions and income dividends, is unmanaged and should not be considered an investment. There are currently 30 funds represented in this Index. As of the date of this report, the Portfolio was in the Lipper Multi-Cap Growth Funds classification.
(3) Total returns for the Portfolio reflect fees waived and expenses reimbursed, if applicable, by the Adviser. Without such waivers and reimbursements, total returns would have been lower. The fee waivers and/or expense reimbursements will continue for at least one year or until such time as the Fund's Board of Directors acts to discontinue all or a portion of such waivers and/or expense reimbursements when it deems that such action is appropriate.
(4) On May 21, 2010 Class C and Class I shares of Van Kampen Equity Growth Fund ("the Predecessor Fund") were reorganized into Class L and Class I shares of Morgan Stanley Equity Growth Portfolio ("the Portfolio"), respectively. Class L and Class I shares' returns of the Portfolio will differ from the Predecessor Fund as they have different expenses. Performance shown for the Portfolio's Class I and Class L shares reflects the performance of the shares of the Predecessor Fund for periods prior to May 21, 2010. The Class I shares of the Predecessor Fund commenced operations on August 12, 2005. The Class C shares of the Predecessor Fund commenced operations on May 28, 1998. Class P shares, which were renamed Class A shares effective September 9, 2013, commenced offering on May 21, 2010. In October 2010, the Morgan Stanley Equity Growth Portfolio changed its name to the Morgan Stanley Opportunity Portfolio.
(5) Commenced offering September 13, 2013.
(6) For comparative purposes, average annual since inception returns listed for the Indexes refer to the inception date or initial offering of the respective share class of the Portfolio, not the inception of the Index. Returns for periods less than one year are not annualized.
Portfolio Composition
Classification | | Percentage of
Total Investments | |
Other* | | | 40.1 | % | |
Computer Services, Software & Systems | | | 26.9 | | |
Diversified Retail | | | 21.3 | | |
Consumer Lending | | | 11.7 | | |
Total Investments | | | 100.0 | % | |
* Industries and/or investment types representing less than 5% of total investments.
5
Morgan Stanley Institutional Fund, Inc.
Annual Report — December 31, 2013
Portfolio of Investments
Opportunity Portfolio
| | | Shares | | Value
(000) | |
Common Stocks (96.3%) | |
Aerospace (1.5%) | |
TransDigm Group, Inc. | | | 23,788 | | | $ | 3,830 | | |
Air Transport (1.3%) | |
Expeditors International of Washington, Inc. | | | 72,662 | | | | 3,215 | | |
Alternative Energy (1.3%) | |
Ultra Petroleum Corp. (a) | | | 156,334 | | | | 3,385 | | |
Asset Management & Custodian (1.4%) | |
CETIP SA - Mercados Organizados (Brazil) | | | 341,654 | | | | 3,505 | | |
Beverage: Brewers & Distillers (1.5%) | |
Anheuser-Busch InBev N.V. (Belgium) | | | 36,653 | | | | 3,896 | | |
Casinos & Gambling (3.3%) | |
Wynn Resorts Ltd. | | | 43,330 | | | | 8,415 | | |
Chemicals: Diversified (4.0%) | |
Monsanto Co. | | | 87,242 | | | | 10,168 | | |
Computer Services, Software & Systems (27.3%) | |
Baidu, Inc. ADR (China) (a) | | | 21,825 | | | | 3,882 | | |
Facebook, Inc., Class A (a) | | | 439,906 | | | | 24,045 | | |
Google, Inc., Class A (a) | | | 20,073 | | | | 22,496 | | |
Luxoft Holding, Inc. (a) | | | 100,221 | | | | 3,806 | | |
NAVER Corp. (Korea, Republic of) (a) | | | 4,415 | | | | 3,029 | | |
Qihoo 360 Technology Co., Ltd. ADR (China) (a) | | | 46,628 | | | | 3,826 | | |
Twitter, Inc. (a) | | | 131,685 | | | | 8,382 | | |
| | | | 69,466 | | |
Consumer Lending (11.9%) | |
CME Group, Inc. | | | 59,901 | | | | 4,700 | | |
Mastercard, Inc., Class A | | | 16,342 | | | | 13,653 | | |
Visa, Inc., Class A | | | 53,546 | | | | 11,924 | | |
| | | | 30,277 | | |
Consumer Services: Miscellaneous (1.5%) | |
FleetCor Technologies, Inc. (a) | | | 33,231 | | | | 3,860 | | |
Diversified Retail (21.6%) | |
Amazon.com, Inc. (a) | | | 97,872 | | | | 39,031 | | |
Priceline.com, Inc. (a) | | | 13,634 | | | | 15,848 | | |
| | | | 54,879 | | |
Education Services (3.9%) | |
New Oriental Education & Technology Group, Inc.
ADR (China) | | | 130,662 | | | | 4,116 | | |
TAL Education Group ADR (a) | | | 259,237 | | | | 5,700 | | |
| | | | 9,816 | | |
Financial Data & Systems (3.7%) | |
MSCI, Inc. (a) | | | 218,045 | | | | 9,533 | | |
Foods (1.5%) | |
Jubilant Foodworks Ltd. (India) (a) | | | 188,725 | | | | 3,881 | | |
Insurance: Multi-Line (3.2%) | |
Greenlight Capital Re Ltd., Class A (a) | | | 241,146 | | | | 8,129 | | |
Real Estate Investment Trusts (REIT) (1.9%) | |
Brookfield Asset Management, Inc.,
Class A (Canada) | | | 124,646 | | | | 4,840 | | |
Textiles, Apparel & Shoes (1.7%) | |
Burberry Group PLC (United Kingdom) | | | 175,419 | | | | 4,404 | | |
| | | Shares | | Value
(000) | |
Truckers (3.8%) | |
DSV A/S (Denmark) | | | 293,522 | | | $ | 9,624 | | |
Total Common Stocks (Cost $140,083) | | | 245,123 | | |
Participation Note (2.2%) | |
Beverage: Brewers & Distillers (2.2%) | |
Kweichow Moutai Co., Ltd., Class A,
Equity Linked Notes, expires 3/4/21
(Cost $6,515) | | | 258,170 | | | | 5,477 | | |
| | | Notional
Amount | | | |
Call Options Purchased (0.1%) | |
Foreign Currency Options (0.1%) | |
USD/CNY December 2014 @ CNY 6.50 | | | 2,782,274 | | | | 5 | | |
USD/CNY December 2014 @ CNY 6.50 | | | 34,698,631 | | | | 58 | | |
USD/CNY December 2014 @ CNY 6.50 | | | 39,150,310 | | | | 66 | | |
Total Call Options Purchased (Cost $241) | | | 129 | | |
| | | Shares | | | |
Short-Term Investment (2.9%) | |
Investment Company (2.9%) | |
Morgan Stanley Institutional Liquidity
Funds — Money Market Portfolio —
Institutional Class (See Note G)
(Cost $7,433) | | | 7,433,071 | | | | 7,433 | | |
Total Investments (101.5%) (Cost $154,272) | | | 258,162 | | |
Liabilities in Excess of Other Assets (-1.5%) | | | (3,692 | ) | |
Net Assets (100.0%) | | $ | 254,470 | | |
(a) Non-income producing security.
ADR American Depositary Receipt.
CNY — Chinese Yuan Renminbi
USD — United States Dollar
The accompanying notes are an integral part of the financial statements.
6
Morgan Stanley Institutional Fund, Inc.
Annual Report — December 31, 2013
Statement of Assets and Liabilities | | December 31, 2013
(000) | |
Assets: | |
Investments in Securities of Unaffiliated Issuers, at Value (Cost $146,839) | | $ | 250,729 | | |
Investment in Security of Affiliated Issuer, at Value (Cost $7,433) | | | 7,433 | | |
Total Investments in Securities, at Value (Cost $154,272) | | | 258,162 | | |
Foreign Currency, at Value (Cost $0) | | | — | @ | |
Receivable for Investments Sold | | | 5,538 | | |
Dividends Receivable | | | 219 | | |
Receivable for Portfolio Shares Sold | | | 54 | | |
Tax Reclaim Receivable | | | 11 | | |
Receivable from Affiliate | | | — | @ | |
Other Assets | | | 26 | | |
Total Assets | | | 264,010 | | |
Liabilities: | |
Payable for Investments Purchased | | | 8,830 | | |
Payable for Advisory Fees | | | 296 | | |
Payable for Sub Transfer Agency Fees | | | 124 | | |
Payable for Sub Transfer Agency Fees — Class I | | | 2 | | |
Payable for Sub Transfer Agency Fees — Class A* | | | 53 | | |
Payable for Sub Transfer Agency Fees — Class L | | | 9 | | |
Payable for Portfolio Shares Redeemed | | | 73 | | |
Payable for Transfer Agent Fees — Class I | | | — | @ | |
Payable for Transfer Agent Fees — Class A* | | | 57 | | |
Payable for Transfer Agent Fees — Class L | | | 8 | | |
Payable for Shareholder Services Fees — Class A* | | | 43 | | |
Payable for Distribution and Shareholder Services Fees — Class L | | | 20 | | |
Payable for Administration Fees | | | 17 | | |
Payable for Directors' Fees and Expenses | | | — | @ | |
Other Liabilities | | | 8 | | |
Total Liabilities | | | 9,540 | | |
Net Assets | | $ | 254,470 | | |
Net Assets Consist Of: | |
Paid-in-Capital | | $ | 149,527 | | |
| Accumulated Net Investment Loss | | | (1 | ) | |
| Accumulated Net Realized Gain | | | 1,053 | | |
Unrealized Appreciation (Depreciation) on: | |
Investments | | | 103,890 | | |
Foreign Currency Translations | | | 1 | | |
Net Assets | | $ | 254,470 | | |
The accompanying notes are an integral part of the financial statements.
7
Morgan Stanley Institutional Fund, Inc.
Annual Report — December 31, 2013
Statement of Assets and Liabilities (cont'd) | | December 31, 2013
(000) | |
CLASS I: | |
Net Assets | | $ | 13,586 | | |
| Shares Outstanding $0.001 par value shares of beneficial interest (500,000,000 shares authorized) (not in 000's) | | | 632,799 | | |
Net Asset Value, Offering and Redemption Price Per Share | | $ | 21.47 | | |
CLASS A*: | |
Net Assets | | $ | 208,161 | | |
| Shares Outstanding $0.001 par value shares of beneficial interest (500,000,000 shares authorized) (not in 000's) | | | 9,804,806 | | |
Net Asset Value, Redemption Price Per Share | | $ | 21.23 | | |
Maximum Sales Load§§ | | | 5.25 | % | |
Maximum Sales Charge | | $ | 1.18 | | |
Maximum Offering Price Per Share | | $ | 22.41 | | |
CLASS L: | |
Net Assets | | $ | 32,712 | | |
| Shares Outstanding $0.001 par value shares of beneficial interest (500,000,000 shares authorized) (not in 000's) | | | 1,755,417 | | |
Net Asset Value, Offering and Redemption Price Per Share | | $ | 18.64 | | |
CLASS IS: | |
Net Assets | | $ | 11 | | |
| Shares Outstanding $0.001 par value shares of beneficial interest (500,000,000 shares authorized) (not in 000's) | | | 510 | | |
Net Asset Value, Offering and Redemption Price Per Share | | $ | 21.47 | | |
@ Amount is less than $500.
* Effective September 9, 2013, Class P and Class H shares were renamed Class A shares.
§§ Effective February 25, 2013, the Directors approved the imposition of a maximum initial sales charge of 5.25% on purchases of Class A shares of the Portfolio.
The accompanying notes are an integral part of the financial statements.
8
Morgan Stanley Institutional Fund, Inc.
Annual Report — December 31, 2013
Statement of Operations | | Year Ended
December 31, 2013
(000) | |
Investment Income: | |
Dividends from Securities of Unaffiliated Issuers (Net of $123 of Foreign Taxes Withheld) | | $ | 2,238 | | |
Dividends from Security of Affiliated Issuer (Note G) | | | 6 | | |
Total Investment Income | | | 2,244 | | |
Expenses: | |
Advisory Fees (Note B) | | | 1,121 | | |
Shareholder Services Fees — Class A* (Note D) | | | 462 | | |
Distribution and Shareholder Services Fees — Class L (Note D) | | | 213 | | |
Transfer Agency Fees (Note E) | | | 176 | | |
Transfer Agency Fees — Class I (Note E) | | | 1 | | |
Transfer Agency Fees — Class A* (Note E) | | | 74 | | |
Transfer Agency Fees — Class L (Note E) | | | 10 | | |
Sub Transfer Agency Fees | | | 153 | | |
Sub Transfer Agency Fees — Class I | | | 3 | | |
Sub Transfer Agency Fees — Class A* | | | 57 | | |
Sub Transfer Agency Fees — Class L | | | 9 | | |
Administration Fees (Note C) | | | 179 | | |
Professional Fees | | | 97 | | |
Shareholder Reporting Fees | | | 70 | | |
Registration Fees | | | 50 | | |
Custodian Fees (Note F) | | | 24 | | |
Directors' Fees and Expenses | | | 5 | | |
Pricing Fees | | | 4 | | |
Other Expenses | | | 18 | | |
Total Expenses | | | 2,726 | | |
Waiver of Advisory Fees (Note B) | | | (20 | ) | |
Rebate from Morgan Stanley Affiliate (Note G) | | | (10 | ) | |
Reimbursement of Class Specific Expenses — Class IS (Note B) | | | (— | @) | |
Net Expenses | | | 2,696 | | |
Net Investment Loss | | | (452 | ) | |
Realized Gain: | |
Investments Sold | | | 24,764 | | |
Foreign Currency Transactions | | | 14 | | |
Net Realized Gain | | | 24,778 | | |
Change in Unrealized Appreciation (Depreciation): | |
Investments | | | 58,252 | | |
Foreign Currency Translations | | | 1 | | |
Net Change in Unrealized Appreciation (Depreciation) | | | 58,253 | | |
Net Realized Gain and Change in Unrealized Appreciation (Depreciation) | | | 83,031 | | |
Net Increase in Net Assets Resulting from Operations | | $ | 82,579 | | |
* Effective September 9, 2013, Class P and Class H shares were renamed Class A shares.
@ Amount is less than $500.
The accompanying notes are an integral part of the financial statements.
9
Morgan Stanley Institutional Fund, Inc.
Annual Report — December 31, 2013
Statements of Changes in Net Assets | | Year Ended
December 31,
2013
(000) | | Year Ended
December 31,
2012
(000) | |
Increase (Decrease) in Net Assets: | |
Operations: | |
Net Investment Loss | | $ | (452 | ) | | $ | (381 | ) | |
Net Realized Gain | | | 24,778 | | | | 13,070 | | |
Net Change in Unrealized Appreciation (Depreciation) | | | 58,253 | | | | 9,247 | | |
Net Increase in Net Assets Resulting from Operations | | | 82,579 | | | | 21,936 | | |
Distributions from and/or in Excess of: | |
Class I: | |
Net Realized Gain | | | (1,310 | ) | | | — | | |
Class A*: | |
Net Realized Gain | | | (18,620 | ) | | | — | | |
Class H**: | |
Net Realized Gain | | | (2,020 | )*** | | | — | | |
Class L: | |
Net Realized Gain | | | (3,650 | ) | | | — | | |
Class IS: | |
Net Realized Gain | | | (1 | )^ | | | — | | |
Total Distributions | | | (25,601 | ) | | | — | | |
Capital Share Transactions:(1) | |
Class I: | |
Subscribed | | | 2,858 | | | | 6,980 | | |
Distributions Reinvested | | | 1,267 | | | | — | | |
Redeemed | | | (5,402 | ) | | | (9,426 | ) | |
Class A*: | |
Subscribed | | | 1,716 | | | | — | | |
Distributions Reinvested | | | 17,797 | | | | — | | |
Conversion from Class H | | | 182,310 | | | | — | | |
Redeemed | | | (15,624 | ) | | | (2,249 | ) | |
Class H**: | |
Subscribed | | | 2,568 | *** | | | 15,536 | | |
Distributions Reinvested | | | 1,916 | *** | | | — | | |
Conversion to Class A | | | (182,310 | )*** | | | — | | |
Redeemed | | | (30,117 | )*** | | | (48,994 | ) | |
Class L: | |
Subscribed | | | 841 | | | | 905 | | |
Distributions Reinvested | | | 3,317 | | | | — | | |
Redeemed | | | (6,127 | ) | | | (6,266 | ) | |
Class IS: | |
Subscribed | | | 10 | ^ | | | — | | |
Net Decrease in Net Assets Resulting from Capital Share Transactions | | | (24,980 | ) | | | (43,514 | ) | |
Total Increase (Decrease) in Net Assets | | | 31,998 | | | | (21,578 | ) | |
Net Assets: | |
Beginning of Period | | | 222,472 | | | | 244,050 | | |
End of Period (Including Accumulated Net Investment Loss of $(1) and $(1)) | | $ | 254,470 | | | $ | 222,472 | | |
The accompanying notes are an integral part of the financial statements.
10
Morgan Stanley Institutional Fund, Inc.
Annual Report — December 31, 2013
Statements of Changes in Net Assets (cont'd) | | Year Ended
December 31,
2013
(000) | | Year Ended
December 31,
2012
(000) | |
(1) Capital Share Transactions: | |
Class I: | |
Shares Subscribed | | | 147 | | | | 420 | | |
Shares Issued on Distributions Reinvested | | | 62 | | | | — | | |
Shares Redeemed | | | (295 | ) | | | (571 | ) | |
Net Decrease in Class I Shares Outstanding | | | (86 | ) | | | (151 | ) | |
Class A*: | |
Shares Subscribed | | | 81 | | | | — | | |
Shares Issued on Distributions Reinvested | | | 866 | | | | — | | |
Conversion from Class H | | | 9,616 | | | | — | | |
Shares Redeemed | | | (759 | ) | | | (138 | ) | |
Net Increase (Decrease) in Class A Shares Outstanding | | | 9,804 | | | | (138 | ) | |
Class H**: | |
Shares Subscribed | | | 149 | *** | | | 966 | | |
Shares Issued on Distributions Reinvested | | | 111 | *** | | | — | | |
Conversion to Class A | | | (9,730 | )*** | | | — | | |
Shares Redeemed | | | (1,742 | )*** | | | (3,032 | ) | |
Net Decrease in Class H Shares Outstanding | | | (11,212 | ) | | | (2,066 | ) | |
Class L: | |
Shares Subscribed | | | 49 | | | | 64 | | |
Shares Issued on Distributions Reinvested | | | 186 | | | | — | | |
Shares Redeemed | | | (380 | ) | | | (431 | ) | |
Net Decrease in Class L Shares Outstanding | | | (145 | ) | | | (367 | ) | |
Class IS: | |
Shares Subscribed | | | 1 | ^ | | | — | | |
Net Increase in Class IS Shares Outstanding | | | 1 | | | | — | | |
^ For the period September 13, 2013 through December 31, 2013.
* Effective September 9, 2013, Class P shares were renamed Class A shares.
** Effective September 9, 2013, Class H shares converted into Class A shares.
*** For the period January 1, 2013 through September 6, 2013.
The accompanying notes are an integral part of the financial statements.
11
Morgan Stanley Institutional Fund, Inc.
Annual Report — December 31, 2013
Financial Highlights
Opportunity Portfolio
| | | Class I* | |
| | | Year Ended December 31, | | Period from
July 1, 2010 to
December 31, | | Year Ended June 30, | |
Selected Per Share Data and Ratios | | 2013 | | 2012 | | 2011 | | 2010 | | 2010 | | 2009^^ | |
Net Asset Value, Beginning of Period | | $ | 16.59 | | | $ | 15.16 | | | $ | 15.23 | | | $ | 11.91 | | | $ | 9.59 | | | $ | 12.21 | | |
Income (Loss) from Investment Operations: | |
Net Investment Income (Loss)† | | | 0.02 | | | | 0.02 | | | | 0.00 | ‡ | | | 0.02 | | | | (0.02 | ) | | | 0.02 | | |
Net Realized and Unrealized Gain (Loss) | | | 7.13 | | | | 1.41 | | | | (0.07 | ) | | | 3.30 | | | | 2.34 | | | | (2.64 | ) | |
Total from Investment Operations | | | 7.15 | | | | 1.43 | | | | (0.07 | ) | | | 3.32 | | | | 2.32 | | | | (2.62 | ) | |
Distributions from and/or in Excess of: | |
Net Realized Gain | | | (2.27 | ) | | | — | | | | — | | | | — | | | | — | | | | — | | |
Net Asset Value, End of Period | | $ | 21.47 | | | $ | 16.59 | | | $ | 15.16 | | | $ | 15.23 | | | $ | 11.91 | | | $ | 9.59 | | |
Total Return++ | | | 43.92 | % | | | 9.43 | % | | | (0.46 | )% | | | 27.88 | %# | | | 24.19 | % | | | (21.52 | )% | |
Ratios and Supplemental Data: | |
Net Assets, End of Period (Millions) | | $ | 13.6 | | | $ | 11.9 | | | $ | 13.2 | | | $ | 13.0 | | | $ | 11.0 | | | $ | 7.5 | | |
Ratio of Expenses to Average Net Assets (1) | | | 0.86 | %+ | | | 0.88 | %+†† | | | 0.88 | %+†† | | | 0.72 | %+††@ | | | 1.14 | % | | | 0.91 | % | |
Ratio of Expenses to Average Net Assets Excluding
Non Operating Expenses | | | N/A | | | | N/A | | | | N/A | | | | 0.90 | %+††@ | | | 0.96 | % | | | N/A | | |
Ratio of Net Investment Income (Loss) to Average
Net Assets (1) | | | 0.13 | %+ | | | 0.14 | %+†† | | | 0.01 | %+†† | | | 0.25 | %+††@ | | | (0.14 | )% | | | 0.21 | % | |
Ratio of Rebate from Morgan Stanley Affiliates to
Average Net Assets | | | 0.00 | %§ | | | 0.00 | %††§ | | | 0.00 | %††§ | | | 0.00 | %††§@ | | | N/A | | | | N/A | | |
Portfolio Turnover Rate | | | 21 | % | | | 24 | % | | | 21 | % | | | 6 | %# | | | 12 | % | | | 33 | % | |
(1) Supplemental Information on the Ratios to Average Net Assets: | |
Ratios Before Expense Limitation: | |
Expenses to Average Net Assets | | | 0.87 | % | | | 0.91 | %†† | | | 0.95 | %†† | | | N/A | | | | N/A | | | | 1.41 | % | |
Net Investment Income (Loss) to Average Net Assets | | | 0.12 | % | | | 0.11 | %†† | | | (0.06 | )%†† | | | N/A | | | | N/A | | | | (0.29 | )% | |
* On May 21, 2010, the Portfolio acquired substantially all of the assets and liabilities of the Van Kampen Equity Growth Fund ("the Predecessor Fund"). Therefore, the per share data and ratios of Class I shares for the 12-month period ended June 30, 2010 and prior years reflect the historical per share data of Class I shares of the Predecessor Fund.
^^ Beginning the year ended June 30, 2010, the Portfolio was audited by Ernst & Young LLP. The previous years were audited by another independent registered public accounting firm.
† Per share amount is based on average shares outstanding.
‡ Amount is less than $0.005 per share.
++ Calculated based on the net asset value as of the last business day of the period.
+ The Ratios of Expenses and Net Investment Income (Loss) reflect the rebate of certain Portfolio expenses in connection with the investments in Morgan Stanley affiliates during the period. The effect of the rebate on the ratios is disclosed in the above table as "Ratio of Rebate from Morgan Stanley Affiliates to Average Net Assets."
†† Reflects overall Portfolio ratios for investment income and non-class specific expenses.
§ Amount is less than 0.005%.
# Not Annualized.
@ Annualized.
The accompanying notes are an integral part of the financial statements.
12
Morgan Stanley Institutional Fund, Inc.
Annual Report — December 31, 2013
Financial Highlights
Opportunity Portfolio
| | | Class A** | |
| | | Year Ended December 31, | | Period from
July 1, 2010 to
December 31, | | Period from
May 21, 2010^ to
June 30, | |
Selected Per Share Data and Ratios | | 2013 | | 2012 | | 2011 | | 2010 | | 2010 | |
Net Asset Value, Beginning of Period | | $ | 16.47 | | | $ | 15.08 | | | $ | 15.19 | | | $ | 11.89 | | | $ | 12.13 | | |
Income (Loss) from Investment Operations: | |
Net Investment Income (Loss)† | | | (0.10 | ) | | | (0.02 | ) | | | (0.04 | ) | | | 0.00 | ‡ | | | (0.01 | ) | |
Net Realized and Unrealized Gain (Loss) | | | 7.13 | | | | 1.41 | | | | (0.07 | ) | | | 3.30 | | | | (0.23 | ) | |
Total from Investment Operations | | | 7.03 | | | | 1.39 | | | | (0.11 | ) | | | 3.30 | | | | (0.24 | ) | |
Distributions from and/or in Excess of: | |
Net Realized Gain | | | (2.27 | ) | | | — | | | | — | | | | — | | | | — | | |
Net Asset Value, End of Period | | $ | 21.23 | | | $ | 16.47 | | | $ | 15.08 | | | $ | 15.19 | | | $ | 11.89 | | |
Total Return++ | | | 43.51 | % | | | 9.22 | % | | | (0.72 | )% | | | 27.75 | %# | | | (1.98 | )%# | |
Ratios and Supplemental Data: | |
Net Assets, End of Period (Thousands) | | $ | 208,161 | | | $ | 12 | | | $ | 2,098 | | | $ | 2,113 | | | $ | 1 | | |
Ratio of Expenses to Average Net Assets (1) | | | 1.21 | %+^^ | | | 1.13 | %+†† | | | 1.13 | %+†† | | | 0.97 | %+††* | | | 1.39 | %* | |
Ratio of Expenses to Average Net Assets Excluding
Non Operating Expenses | | | N/A | | | | N/A | | | | N/A | | | | 1.15 | %+* | | | N/A | | |
Ratio of Net Investment Income (Loss) to Average
Net Assets (1) | | | (0.46 | )%+ | | | (0.11 | )%+†† | | | (0.24 | )%+†† | | | 0.00 | %§+††* | | | (0.71 | )%* | |
Ratio of Rebate from Morgan Stanley Affiliates to
Average Net Assets | | | 0.00 | %§ | | | 0.00 | %§†† | | | 0.00 | %§†† | | | 0.00 | %§††* | | | N/A | | |
Portfolio Turnover Rate | | | 21 | % | | | 24 | % | | | 21 | % | | | 6 | %# | | | 12 | %# | |
(1) Supplemental Information on the Ratios to Average Net Assets: | |
Ratios Before Expense Limitation: | |
Expenses to Average Net Assets | | | 1.22 | % | | | 1.16 | %†† | | | 1.20 | %†† | | | N/A | | | | N/A | | |
Net Investment Loss to Average Net Assets | | | (0.47 | )% | | | (0.14 | )%†† | | | (0.31 | )%†† | | | N/A | | | | N/A | | |
** Effective September 9, 2013, Class P and Class H shares were renamed Class A shares.
^ Commencement of Operations.
† Per share amount is based on average shares outstanding.
‡ Amount is less than $0.005 per share.
++ Calculated based on the net asset value which does not reflect sales charges, if applicable, as of the last business day of the period.
+ The Ratios of Expenses and Net Investment Income (Loss) reflect the rebate of certain Portfolio expenses in connection with the investments in Morgan Stanley affiliates during the period. The effect of the rebate on the ratios is disclosed in the above table as "Ratio of Rebate from Morgan Stanley Affiliates to Average Net Assets."
^^ Effective September 16, 2013, the Adviser has agreed to limit the ratio of expenses to average net assets to the maximum ratio of 1.23% for Class A shares. Prior to September 16, 2013, the maximum ratio was 1.13% for Class A shares.
†† Reflects overall Portfolio ratios for investment income and non-class specific expenses.
§ Amount is less than 0.005%.
# Not Annualized.
* Annualized.
The accompanying notes are an integral part of the financial statements.
13
Morgan Stanley Institutional Fund, Inc.
Annual Report — December 31, 2013
Financial Highlights
Opportunity Portfolio
| | | Class L* | |
| | | Year Ended December 31, | | Period from
July 1, 2010 to
December 31, | | Year Ended June 30, | |
Selected Per Share Data and Ratios | | 2013 | | 2012 | | 2011 | | 2010 | | 2010 | | 2009^^ | |
Net Asset Value, Beginning of Period | | $ | 14.74 | | | $ | 13.57 | | | $ | 13.73 | | | $ | 10.78 | | | $ | 8.77 | | | $ | 11.28 | | |
Income (Loss) from Investment Operations: | |
Net Investment Loss† | | | (0.11 | ) | | | (0.09 | ) | | | (0.10 | ) | | | (0.03 | ) | | | (0.13 | ) | | | (0.07 | ) | |
Net Realized and Unrealized Gain (Loss) | | | 6.28 | | | | 1.26 | | | | (0.06 | ) | | | 2.98 | | | | 2.14 | | | | (2.44 | ) | |
Total from Investment Operations | | | 6.17 | | | | 1.17 | | | | (0.16 | ) | | | 2.95 | | | | 2.01 | | | | (2.51 | ) | |
Distributions from and/or in Excess of: | |
Net Realized Gain | | | (2.27 | ) | | | — | | | | — | | | | — | | | | — | | | | — | | |
Net Asset Value, End of Period | | $ | 18.64 | | | $ | 14.74 | | | $ | 13.57 | | | $ | 13.73 | | | $ | 10.78 | | | $ | 8.77 | | |
Total Return++ | | | 42.78 | % | | | 8.62 | % | | | (1.17 | )% | | | 27.37 | %# | | | 22.92 | % | | | (22.32 | )% | |
Ratios and Supplemental Data: | |
Net Assets, End of Period (Millions) | | $ | 32.7 | | | $ | 28.0 | | | $ | 30.8 | | | $ | 39.0 | | | $ | 34.8 | | | $ | 28.6 | | |
Ratio of Expenses to Average Net Assets (1) | | | 1.65 | %+^ | | | 1.63 | %+†† | | | 1.63 | %+†† | | | 1.47 | %+††@ | | | 2.12 | % | | | 1.89 | % | |
Ratio of Expenses to Average Net Assets Excluding
Non Operating Expenses | | | N/A | | | | N/A | | | | N/A | | | | 1.65 | %+††@ | | | 1.94 | % | | | N/A | | |
Ratio of Net Investment Loss to Average Net Assets (1) | | | (0.65 | )%+ | | | (0.61 | )%+†† | | | (0.74 | )%+†† | | | (0.50 | )%+††@ | | | (1.16 | )% | | | (0.90 | )% | |
Ratio of Rebate from Morgan Stanley Affiliates to
Average Net Assets | | | 0.00 | %§ | | | 0.00 | %††§ | | | 0.00 | %††§ | | | 0.00 | %††§@ | | | N/A | | | | N/A | | |
Portfolio Turnover Rate | | | 21 | % | | | 24 | % | | | 21 | % | | | 6 | %# | | | 12 | % | | | 33 | % | |
(1) Supplemental Information on the Ratios to Average Net Assets: | |
Ratios Before Expense Limitation: | |
Expenses to Average Net Assets | | | 1.67 | % | | | 1.66 | %†† | | | 1.70 | %†† | | | N/A | | | | N/A | | | | 2.24 | % | |
Net Investment Loss to Average Net Assets | | | (0.67 | )% | | | (0.64 | )%†† | | | (0.81 | )%†† | | | N/A | | | | N/A | | | | (1.25 | )% | |
* On May 21, 2010, the Portfolio acquired substantially all of the assets and liabilities of the Van Kampen Equity Growth Fund ("the Predecessor Fund"). Therefore, the per share data and ratios of Class L shares for the 12-month period ended June 30, 2010 and prior years reflect the historical per share data of Class L shares of the Predecessor Fund.
^^ Beginning the year ended June 30, 2010, the Portfolio was audited by Ernst & Young LLP. The previous years were audited by another independent registered public accounting firm.
† Per share amount is based on average shares outstanding.
++ Calculated based on the net asset value as of the last business day of the period.
+ The Ratios of Expenses and Net Investment Loss reflect the rebate of certain Portfolio expenses in connection with the investments in Morgan Stanley affiliates during the period. The effect of the rebate on the ratios is disclosed in the above table as "Ratio of Rebate from Morgan Stanley Affiliates to Average Net Assets."
^ Effective September 16, 2013, the Adviser has agreed to limit the ratio of expenses to average net assets to the maximum ratio of 1.73% for Class L shares. Prior to September 16, 2013, the maximum ratio was 1.63% for Class L shares.
†† Reflects overall Portfolio ratios for investment income and non-class specific expenses.
§ Amount is less than 0.005%.
# Not Annualized.
@ Annualized.
The accompanying notes are an integral part of the financial statements.
14
Morgan Stanley Institutional Fund, Inc.
Annual Report — December 31, 2013
Financial Highlights
Opportunity Portfolio
| | | Class IS | |
Selected Per Share Data and Ratios | | Period from September 13,
2013^ to December 31,
2013 | |
Net Asset Value, Beginning of Period | | $ | 19.59 | | |
Income from Investment Operations: | |
Net Investment Income† | | | 0.00 | ‡ | |
Net Realized and Unrealized Gain | | | 3.95 | | |
Total from Investment Operations | | | 3.95 | | |
Distributions from and/or in Excess of: | |
Net Realized Gain | | | (2.07 | ) | |
Net Asset Value, End of Period | | $ | 21.47 | | |
Total Return++ | | | 20.51 | %# | |
Ratios and Supplemental Data: | |
Net Assets, End of Period (Thousands) | | $ | 11 | | |
Ratio of Expenses to Average Net Assets (1) | | | 0.73 | %+^^* | |
Ratio of Net Investment Loss to Average Net Assets (1) | | | (9.82 | )%+* | |
Ratio of Rebate from Morgan Stanley Affiliates to Average Net Assets | | | 0.01 | %* | |
Portfolio Turnover Rate | | | 21 | %# | |
(1) Supplemental Information on the Ratios to Average Net Assets: | |
Ratios Before Expense Limitation | |
Expenses to Average Net Assets | | | 5.67 | %* | |
Net Investment Loss to Average Net Assets | | | (4.88 | )%* | |
^ Commencement of Operations.
† Per share amount is based on average shares outstanding.
‡ Amount is less than $0.005 per share.
++ Calculated based on the net asset value as of the last business day of the period.
+ The Ratios of Expenses and Net Investment Loss reflect the rebate of certain Portfolio expenses in connection with the investments in Morgan Stanley affiliates during the period. The effect of the rebate on the ratios is disclosed in the above table as "Ratio of Rebate from Morgan Stanley Affiliates to Average Net Assets."
^^ Effective September 16, 2013, the Adviser has agreed to limit the ratio of expenses to average net assets to the maximum ratio of 0.81% for Class IS shares.
# Not Annualized.
* Annualized.
The accompanying notes are an integral part of the financial statements.
15
Morgan Stanley Institutional Fund, Inc.
Annual Report — December 31, 2013
Notes to Financial Statements
Morgan Stanley Institutional Fund, Inc. (the "Fund") is registered under the Investment Company Act of 1940, as amended (the "Act"), as an open-end management investment company. The Fund is comprised of twenty-seven separate, active, diversified and non-diversified portfolios (individually referred to as a "Portfolio", collectively as the "Portfolios").
The accompanying financial statements relate to the Opportunity Portfolio. The Portfolio seeks long-term capital appreciation by investing primarily in established and emerging franchise companies with capitalizations within the range of companies included in the Russell 1000® Growth Index. The Portfolio offers four classes of shares — Class I, Class A, Class L and Class IS.
On September 16, 2013, the Portfolio commenced offering Class IS shares. Effective September 9, 2013, Class P and Class H shares were renamed Class A shares.
A. Significant Accounting Policies: The following significant accounting policies are in conformity with U.S. generally accepted accounting principles ("GAAP"). Such policies are consistently followed by the Fund in the preparation of its financial statements. GAAP may require management to make estimates and assumptions that affect the reported amounts and disclosures in the financial statements. Actual results may differ from those estimates.
1. Security Valuation: (1) An equity portfolio security listed or traded on an exchange is valued at its latest reported sales price (or at the exchange official closing price if such exchange reports an official closing price), if there were no sales on a given day, the security is valued at the mean between the last reported bid and asked prices; (2) all other equity portfolio securities for which over-the-counter market quotations are readily available are valued at its latest reported sales price. In cases where a security is traded on more than one exchange, the security is valued on the exchange designated as the primary market; (3) listed options are valued at the last reported sales price on the exchange on which they are listed (or at the exchange official closing price if such exchange reports an official closing price). If an official closing price or last reported sale price is unavailable, the listed option should be fair valued at the mean between its latest bid and asked prices. Unlisted options are valued by an outside pricing service approved by the Fund's Board of Directors (the "Directors") or quotes from a broker or dealer; (4) when market quotations are not readily available, including circumstances under which
Morgan Stanley Investment Management Inc. (the "Adviser") determines that the closing price, last sale price or the mean between the last reported bid and asked prices are not reflective of a security's market value, portfolio securities are valued at their fair value as determined in good faith under procedures established by and under the general supervision of the Directors. Occasionally, developments affecting the closing prices of securities and other assets may occur between the times at which valuations of such securities are determined (that is, close of the foreign market on which the securities trade) and the close of business of the New York Stock Exchange ("NYSE"). If developments occur during such periods that are expected to materially affect the value of such securities, such valuations may be adjusted to reflect the estimated fair value of such securities as of the close of the NYSE, as determined in good faith by the Directors or by the Adviser using a pricing service and/or procedures approved by the Directors; (5) quotations of foreign portfolio securities, other assets and liabilities and forward contracts stated in foreign currency are translated into U.S. dollar equivalents at the prevailing market rates prior to the close of the NYSE; (6) investments in mutual funds, including the Morgan Stanley Institutional Liquidity Funds, are valued at the net asset value as of the close of each business day; and (7) short-term debt securities with remaining maturities of 60 days or less at the time of purchase may be valued at amortized cost, unless the Adviser determines such valuation does not reflect the securities' market value, in which case these securities will be valued at their fair market value determined by the Adviser.
Under procedures approved by the Directors, the Fund's Adviser has formed a Valuation Committee. The Valuation Committee provides administration and oversight of the Fund's valuation policies and procedures, which are reviewed at least annually by the Directors. These procedures allow the Fund to utilize independent pricing services, quotations from securities and financial instrument dealers, and other market sources to determine fair value.
The Fund has procedures to determine the fair value of securities and other financial instruments for which market prices are not readily available. Under these procedures, the Valuation Committee convenes on a regular and ad hoc basis to review such securities and considers a number of factors, including valuation methodologies
16
Morgan Stanley Institutional Fund, Inc.
Annual Report — December 31, 2013
Notes to Financial Statements (cont'd)
and significant unobservable valuation inputs, when arriving at fair value. The Valuation Committee may employ a market-based approach which may use related or comparable assets or liabilities, recent transactions, market multiples, book values, and other relevant information for the investment to determine the fair value of the investment. An income-based valuation approach may also be used in which the anticipated future cash flows of the investment are discounted to calculate fair value. Discounts may also be applied due to the nature or duration of any restrictions on the disposition of the investments. Due to the inherent uncertainty of valuations of such investments, the fair values may differ significantly from the values that would have been used had an active market existed. The Valuation Committee employs various methods for calibrating these valuation approaches including a regular review of valuation methodologies, key inputs and assumptions, transactional back-testing or disposition analysis, and reviews of any related market activity.
2. Fair Value Measurement: Financial Accounting Standards Board ("FASB") Accounting Standards CodificationTM ("ASC") 820, "Fair Value Measurements and Disclosures" ("ASC 820"), defines fair value as the value that the Fund would receive to sell an investment or pay to transfer a liability in a timely transaction with an independent buyer in the principal market, or in the absence of a principal market the most advantageous market for the investment or liability. ASC 820 establishes a three-tier hierarchy to distinguish between (1) inputs that reflect the assumptions market participants would use in valuing an asset or liability developed based on market data obtained from sources independent of the reporting entity (observable inputs) and (2) inputs that reflect the reporting entity's own assumptions about the assumptions market participants would use in valuing an asset or liability developed based on the best information available in the circumstances (unobservable inputs) and to establish classification of fair value measurements for disclosure purposes. Various inputs are used in determining the value of the Fund's investments. The inputs are summarized in the three broad levels listed below.
• Level 1 – unadjusted quoted prices in active markets for identical investments
• Level 2 – other significant observable inputs (including quoted prices for similarinvestments, interest rates, prepayment speeds, credit risk, etc.)
• Level 3 – significant unobservable inputs including the Fund's own assumptions in determining the fair value of investments. Factors considered in making this determination may include, but are not limited to, information obtained by contacting the issuer, analysts, or the appropriate stock exchange (for exchange-traded securities), analysis of the issuer's financial statements or other available documents and, if necessary, available information concerning other securities in similar circumstances
The inputs or methodology used for valuing securities are not necessarily an indication of the risk associated with investing in those securities and the determination of the significance of a particular input to the fair value measurement in its entirety requires judgment and considers factors specific to each security.
The following is a summary of the inputs used to value the Portfolio's investments as of December 31, 2013.
Investment Type | | Level 1
Unadjusted
quoted
prices
(000) | | Level 2
Other
significant
observable
inputs
(000) | | Level 3
Significant
unobservable
inputs
(000) | | Total
(000) | |
Assets: | |
Common Stocks | |
Aerospace | | $ | 3,830 | | | $ | — | | | $ | — | | | $ | 3,830 | | |
Air Transport | | | 3,215 | | | | — | | | | — | | | | 3,215 | | |
Alternative Energy | | | 3,385 | | | | — | | | | — | | | | 3,385 | | |
Asset Management &
Custodian | | | 3,505 | | | | — | | | | — | | | | 3,505 | | |
Beverage: Brewers &
Distillers | | | 3,896 | | | | — | | | | — | | | | 3,896 | | |
Casinos & Gambling | | | 8,415 | | | | — | | | | — | | | | 8,415 | | |
Chemicals: Diversified | | | 10,168 | | | | — | | | | — | | | | 10,168 | | |
Computer Services,
Software & Systems | | | 69,466 | | | | — | | | | — | | | | 69,466 | | |
Consumer Lending | | | 30,277 | | | | — | | | | — | | | | 30,277 | | |
Consumer Services:
Miscellaneous | | | 3,860 | | | | — | | | | — | | | | 3,860 | | |
Diversified Retail | | | 54,879 | | | | — | | | | — | | | | 54,879 | | |
Education Services | | | 9,816 | | | | — | | | | — | | | | 9,816 | | |
Financial Data & Systems | | | 9,533 | | | | — | | | | — | | | | 9,533 | | |
Foods | | | 3,881 | | | | — | | | | — | | | | 3,881 | | |
Insurance: Multi-Line | | | 8,129 | | | | — | | | | — | | | | 8,129 | | |
17
Morgan Stanley Institutional Fund, Inc.
Annual Report — December 31, 2013
Notes to Financial Statements (cont'd)
Investment Type | | Level 1
Unadjusted
quoted
prices
(000) | | Level 2
Other
significant
observable
inputs
(000) | | Level 3
Significant
unobservable
inputs
(000) | | Total
(000) | |
| Common Stocks (cont'd) | |
Real Estate Investment
Trusts (REIT) | | $ | 4,840 | | | $ | — | | | $ | — | | | $ | 4,840 | | |
Textiles, Apparel & Shoes | | | 4,404 | | | | — | | | | — | | | | 4,404 | | |
Truckers | | | 9,624 | | | | — | | | | — | | | | 9,624 | | |
Total Common Stocks | | | 245,123 | | | | — | | | | — | | | | 245,123 | | |
Participation Note | | | — | | | | 5,477 | | | | — | | | | 5,477 | | |
Call Options Purchased | | | — | | | | 129 | | | | — | | | | 129 | | |
Short Term Investment
Investment Company | | | 7,433 | | | | — | | | | — | | | | 7,433 | | |
Total Assets | | $ | 252,556 | | | $ | 5,606 | | | $ | — | | | $ | 258,162 | | |
Transfers between investment levels may occur as the markets fluctuate and/or the availability of data used in an investment's valuation changes. The Portfolio recognizes transfers between the levels as of the end of the period. As of December 31, 2013, securities with a total value of approximately $17,532,000 transferred from Level 2 to Level 1. At December 31, 2012, the fair value of certain securities were adjusted due to developments which occurred between the time of the close of the foreign markets on which they trade and the close of business on the NYSE which resulted in their Level 2 classification.
Following is a reconciliation of investments in which significant unobservable inputs (Level 3) were used in determining fair value.
| | | Convertible
Preferred
Stock
(000) | |
Beginning Balance | | $ | 281 | | |
Purchases | | | — | | |
Sales | | | — | | |
Amortization of discount | | | — | | |
Transfers in | | | — | | |
Transfers out | | | — | | |
Change in unrealized appreciation (depreciation) | | | 2,058 | | |
Realized gains (losses) | | | (2,339 | ) | |
Ending Balance | | $ | — | | |
Net change in unrealized appreciation (depreciation) from investments
still held as of December 31, 2013 | | $ | — | | |
3. Foreign Currency Translation and Foreign Investments: The books and records of the Portfolio are maintained in U.S. dollars. Foreign currency amounts are translated into U.S. dollars as follows:
– investments, other assets and liabilities at the prevailing rate of exchange on the valuation date;
– investment transactions and investment income at the prevailing rates of exchange on the dates of such transactions.
Although the net assets of the Portfolio are presented at the foreign exchange rates and market values at the close of the period, the Portfolio does not isolate that portion of the results of operations arising as a result of changes in the foreign exchange rates from the fluctuations arising from changes in the market prices of securities held at period end. Similarly, the Portfolio does not isolate the effect of changes in foreign exchange rates from the fluctuations arising from changes in the market prices of securities sold during the period. Accordingly, realized and unrealized foreign currency gains (losses) on investments in securities are included in the reported net realized and unrealized gains (losses) on investment transactions and balances. However, pursuant to U.S. Federal income tax regulations, gains and losses from certain foreign currency transactions and the foreign currency portion of gains and losses realized on sales and maturities of foreign denominated debt securities are treated as ordinary income for U.S. Federal income tax purposes.
Net realized gains (losses) on foreign currency transactions represent net foreign exchange gains (losses) from foreign currency forward exchange contracts, disposition of foreign currencies, currency gains (losses) realized between the trade and settlement dates on securities transactions, and the difference between the amount of investment income and foreign withholding taxes recorded on the Portfolio's books and the U.S. dollar equivalent amounts actually received or paid. Net unrealized currency gains (losses) from valuing foreign currency denominated assets and liabilities at period end exchange rates are reflected as a component of unrealized appreciation (depreciation) on the Statement of Assets and Liabilities. The change in unrealized currency gains (losses) on foreign currency translations for the period is reflected in the Statement of Operations.
Foreign security and currency transactions may involve certain considerations and risks not typically associated with those of U.S. dollar denominated transactions as a result of, among other factors, fluctuations of exchange rates in relation to the U.S. dollar, the possibility of lower levels of governmental supervision and regulation
18
Morgan Stanley Institutional Fund, Inc.
Annual Report — December 31, 2013
Notes to Financial Statements (cont'd)
of foreign securities markets and the possibility of political or economic instability.
Governmental approval for foreign investments may be required in advance of making an investment under certain circumstances in some countries, and the extent of foreign investments in domestic companies may be subject to limitation in other countries. Foreign ownership limitations also may be imposed by the charters of individual companies to prevent, among other concerns, violations of foreign investment limitations. As a result, an additional class of shares (identified as "Foreign" in the Portfolio of Investments) may be created and offered for investment. The "local" and "foreign shares" market values may differ. In the absence of trading of the foreign shares in such markets, the Portfolio values the foreign shares at the closing exchange price of the local shares.
4. Derivatives: The Portfolio may, but is not required to, use derivative instruments for a variety of purposes, including hedging, risk management, portfolio management or to earn income. Derivatives are financial instruments whose value is based, in part, on the value of an underlying asset, interest rate, index or financial instrument. Prevailing interest rates and volatility levels, among other things, also affect the value of derivative instruments. A derivative instrument often has risks similar to its underlying asset and may have additional risks, including imperfect correlation between the value of the derivative and the underlying asset, risks of default by the counterparty to certain transactions, magnification of losses incurred due to changes in the market value of the securities, instruments, indices or interest rates to which they relate, and risks that the transactions may not be liquid. The use of derivatives involves risks that are different from, and possibly greater than, the risks associated with other portfolio investments. Derivatives may involve the use of highly specialized instruments that require investment techniques and risk analyses different from those associated with other portfolio investments. All of the Portfolio's holdings, including derivative instruments, are marked-to-market each day with the change in value reflected in unrealized appreciation (depreciation). Upon disposition, a realized gain or loss is recognized.
Certain derivative transactions may give rise to a form of leverage. Leverage magnifies the potential for gain and the risk of loss. Leverage associated with derivative transactions may cause the Portfolio to liquidate portfolio positions when it may not be advantageous to do so
to satisfy its obligations or to meet earmarking or segregation requirements, pursuant to applicable Securities and Exchange Commission rules and regulations, or may cause the Portfolio to be more volatile than if the Portfolio had not been leveraged. Although the Adviser seeks to use derivatives to further the Portfolio's investment objectives, there is no assurance that the use of derivatives will achieve this result.
Following is a description of the derivative instruments and techniques that the Portfolio used during the period and their associated risks:
Options: In respect to options, the Portfolio is subject to equity risk, interest rate risk and foreign currency exchange risk in the normal course of pursuing its investment objectives. If the Portfolio buys an option, it buys a legal contract giving it the right to buy or sell a specific amount of the underlying instrument or futures contract on the underlying instrument such a as security, currency or index, at an agreed upon price typically in exchange for a premium paid by the Portfolio. The Portfolio may purchase put and call options. Purchasing call options tends to increase the Portfolio's exposure to the underlying (or similar) instrument. Purchasing put options tends to decrease the Portfolio's exposure to the underlying (or similar) instrument. When entering into purchased option contracts, the Portfolio bears the risk of interest or exchange rates or securities prices moving unexpectedly, in which case, the Portfolio may not achieve the anticipated benefits of the purchased option contracts; however the risk of loss is limited to the premium paid. Purchased options are reported as part of "Total Investments" on the Statement of Assets and Liabilities. Premium paid for purchasing options which expired are treated as realized losses. If the Portfolio sells an option, it sells to another party the right to buy from or sell to the Portfolio a specific amount of the underlying instrument or futures contract on the underlying instrument at an agreed upon price typically in exchange for a premium received by the Portfolio. There is the risk the Portfolio may not be able to enter into a closing transaction because of an illiquid market. A decision as to whether, when and how to use options involves the exercise of skill and judgment and even a well conceived option transaction may be unsuccessful because of market behavior or unexpected events. The prices of options can be highly volatile and the use of options can lower total returns.
19
Morgan Stanley Institutional Fund, Inc.
Annual Report — December 31, 2013
Notes to Financial Statements (cont'd)
FASB ASC 815, "Derivatives and Hedging: Overall" ("ASC 815"), is intended to improve financial reporting about derivative instruments by requiring enhanced disclosures to enable investors to better understand how and why the Portfolio uses derivative instruments, how these derivative instruments are accounted for and their effects on the Portfolio's financial position and results of operations.
The following table sets forth the fair value of the Portfolio's derivative contracts by primary risk exposure as of December 31, 2013.
| | | Asset Derivatives
Statement of Assets and
Liabilities Location | | Primary Risk
Exposure | | Value
(000) | |
Options Purchased | | Investments, at Value
(Options Purchased) | |
Currency Risk | | $ | 129 | + | |
+ Amounts are included in Investments in the Statement of Assets and Liabilities.
The following table sets forth by primary risk exposure the Portfolio's change in unrealized appreciation (depreciation) by type of derivative contract for the year ended December 31, 2013 in accordance with ASC 815.
Change in Unrealized Appreciation (Depreciation) | |
Primary Risk Exposure | | Derivative Type | | Value
(000) | |
Currency Risk | | Investments
(Options Purchased) | | $ | (112 | )++ | |
++ Amounts are included in Investments in the Statement of Operations.
At December 31, 2013, the Portfolio's derivative assets and liabilities are as follows:
Gross Amounts of Assets and Liabilities Presented in the
Statement of Assets and Liabilities | |
Derivatives | | Assets(a)
(000) | | Liabilities(a)
(000) | |
Options Purchased | | $ | 129 | | | $ | — | | |
(a) Absent an event of default or early termination, OTC derivative assets and liabilities are presented gross and not offset in the Statement of Assets and Liabilities.
The following table presents derivative financial instruments that are subject to enforceable netting arrangements as of December 31, 2013.
Gross Amounts Not Offset in the Statement of Assets and Liabilities | |
Counterparty | | Gross Asset
Derivatives
Presented in
Statement of
Assets and Liabilities
(000) | | Financial
Instrument
(000) | | Collateral
Received
(000) | | Net Amount
(not less
than 0)
(000) | |
Royal Bank of Scotland | | $ | 129 | | | | — | | | | — | | | $ | 129 | | |
For the year ended December 31, 2013, the approximate average monthly amount outstanding for each derivative type is as follows:
Options Purchased: | |
| Average monthly notional amount | | | 6,386,000 | | |
5. Structured Investments: The Portfolio invested a portion of its assets in structured investments. A structured investment is a derivative security designed to offer a return linked to a particular underlying security, currency, commodity or market. Structured investments may come in various forms including notes (such as exchange-traded notes), warrants and options to purchase securities. The Portfolio will typically use structured investments to gain exposure to a permitted underlying security, currency, commodity or market when direct access to a market is limited or inefficient from a tax or cost standpoint. Investments in structured investments involve risks including issuer risk, counterparty risk and market risk. Holders of structured investments bear risks of the underlying investment and are subject to issuer or counterparty risk because the Portfolio is relying on the creditworthiness of such issuer or counterparty and has no rights with respect to the underlying investment. Certain structured investments may be thinly traded or have a limited trading market and may have the effect of increasing the Portfolio's illiquidity to the extent that the Portfolio, at a particular time, may be unable to find qualified buyers for these securities.
6. Indemnifications: The Fund enters into contracts that contain a variety of indemnifications. The Fund's maximum exposure under these arrangements is unknown. However, the Fund has not had prior claims or losses pursuant to these contracts and expects the risk of loss to be remote.
7. Dividends and Distributions to Shareholders: Dividend income and distributions to shareholders are recorded on the ex-dividend date. Dividends from net investment income, if any, are declared and paid semiannually. Net realized capital gains, if any, are distributed at least annually.
8. Security Transactions, Income and Expenses: Security transactions are accounted for on the trade date (date the order to buy or sell is executed). Realized gains and losses on the sale of investment securities are determined on the specific identified cost method. Dividend income and other distributions are recorded on the
20
Morgan Stanley Institutional Fund, Inc.
Annual Report — December 31, 2013
Notes to Financial Statements (cont'd)
ex-dividend date (except for certain foreign dividends which may be recorded as soon as the Portfolio is informed of such dividends) net of applicable withholding taxes. Interest income is recognized on the accrual basis except where collection is in doubt. Discounts are accreted and premiums are amortized over the life of the respective securities. Most expenses of the Fund can be directly attributed to a particular Portfolio. Expenses which cannot be directly attributed are apportioned among the Portfolios based upon relative net assets or other appropriate methods. Income, expenses (other than class specific expenses — distribution, transfer agency and sub transfer agency fees) and realized and unrealized gains or losses are allocated to each class of shares based upon their relative net assets.
The Portfolio owns shares of REITs which report information on the source of their distributions annually in the following calendar year. A portion of distributions received from REITs during the year is estimated to be a return of capital and is recorded as a reduction of their cost.
B. Advisory Fees: The Adviser, a wholly-owned subsidiary of Morgan Stanley, provides the Portfolio with advisory services under the terms of an Investment Advisory Agreement, paid quarterly, at the annual rate based on the average daily net assets as follows:
First $1
billion | | Next $1
billion | | Next $1
billion | | Over $3
billion | |
| | 0.50 | % | | | 0.45 | % | | | 0.40 | % | | | 0.35 | % | |
For the year ended December 31, 2013, the advisory fee rate (net of waivers/rebate) was equivalent to an annual effective rate of 0.49% of the Portfolio's daily net assets.
The Adviser has agreed to reduce its advisory fee and/or reimburse the Portfolio so that total annual portfolio operating expenses, excluding certain investment related expenses, taxes, interest and other extraordinary expenses (including litigation), will not exceed 0.88% for Class I shares, 1.13% for Class A shares and 1.63% for Class L shares. Effective September 16, 2013, the Adviser has agreed to limit the ratio of expenses to average net assets to the maximum ratios of 1.23%, 1.73% and 0.81% for Class A, Class L and Class IS shares, respectively. The fee waivers and/or expense reimbursements will continue for at least one year or until such time that the Directors act to discontinue all or a portion of such waivers and/or reimbursements when it deems such action is appropriate. For the year ended December 31, 2013, approximately $20,000 of advisory
fees were waived and less than $500 of other expenses were reimbursed by the Adviser pursuant to this arrangement.
C. Administration Fees: The Adviser also serves as Administrator to the Fund and provides administrative services pursuant to an Administration Agreement for an annual fee, accrued daily and paid monthly, of 0.08% of the Portfolio's average daily net assets. Under a Sub-Administration Agreement between the Administrator and State Street Bank and Trust Company ("State Street"), State Street provides certain administrative services to the Fund. For such services, the Administrator pays State Street a portion of the fee the Administrator receives from the Portfolio.
D. Distribution and Shareholder Services Fees: Morgan Stanley Distribution, Inc. ("MSDI" or the "Distributor"), a wholly-owned subsidiary of the Adviser, and an indirect subsidiary of Morgan Stanley, serves as the Fund's Distributor of Portfolio shares pursuant to a Distribution Agreement. The Fund has adopted a Shareholder Services Plan with respect to Class A shares pursuant to Rule 12b-1 under the Act. Under the Shareholder Services Plan, the Portfolio pays the Distributor a shareholder services fee, accrued daily and paid monthly, at an annual rate of 0.25% of the Portfolio's average daily net assets attributable to Class A shares.
The Fund has adopted a Distribution and Shareholder Services Plan with respect to Class L shares pursuant to Rule 12b-1 under the Act. Under the Distribution and Shareholder Services Plan, the Portfolio pays the Distributor a distribution fee, accrued daily and paid monthly, at an annual rate of 0.50% and a shareholder services fee, accrued daily and paid monthly, at an annual rate of 0.25% of the Portfolio's average daily net assets attributable to Class L shares.
The distribution and shareholder services fees are used to support the expenses associated with servicing and maintaining accounts. The Distributor may compensate other parties for providing shareholder support services to investors who purchase Class A and Class L shares.
E. Dividend Disbursing and Transfer Agent: The Fund's dividend disbursing and transfer agent was Morgan Stanley Services Company Inc. ("Morgan Stanley Services"). Pursuant to a Transfer Agency Agreement, the Fund paid Morgan Stanley Services a fee based on the number of classes, accounts and transactions relating to the Portfolios of the Fund. Effective July 1, 2013, the Directors approved changing the transfer agent to Boston Financial Data Services, Inc.
21
Morgan Stanley Institutional Fund, Inc.
Annual Report — December 31, 2013
Notes to Financial Statements (cont'd)
F. Custodian Fees: State Street (the "Custodian") serves as Custodian for the Fund in accordance with a Custodian Agreement. The Custodian holds cash, securities, and other assets of the Fund as required by the Act. Custody fees are payable monthly based on assets held in custody, investment purchases and sales activity and account maintenance fees, plus reimbursement for certain out-of-pocket expenses.
G. Security Transactions and Transactions with Affiliates: For the year ended December 31, 2013, purchases and sales of investment securities for the Portfolio, other than long-term U.S. Government securities and short-term investments, were approximately $46,538,000 and $99,988,000, respectively. There were no purchases and sales of long-term U.S. Government securities for the year ended December 31, 2013.
The Portfolio invests in the Institutional Class of the Morgan Stanley Institutional Liquidity Funds — Money Market Portfolio (the "Liquidity Funds"), an open-end management investment company managed by the Adviser. Advisory fees paid by the Portfolio are reduced by an amount equal to its pro-rata share of the advisory and administration fees paid by the Portfolio due to its investment in the Liquidity Funds. For the year ended December 31, 2013, advisory fees paid were reduced by approximately $10,000 relating to the Portfolio's investment in the Liquidity Funds.
A summary of the Portfolio's transactions in shares of the Liquidity Funds during the year ended December 31, 2013 is as follows:
Value
December 31,
2012
(000) | | Purchases
at Cost
(000) | | Sales
(000) | | Dividend
Income
(000) | | Value
December 31,
2013
(000) | |
| $ | 2,580 | | | $ | 74,865 | | | $ | 70,012 | | | $ | 6 | | | $ | 7,433 | | |
H. Federal Income Taxes: It is the Portfolio's intention to continue to qualify as a regulated investment company and distribute all of its taxable and tax-exempt income. Accordingly, no provision for Federal income taxes is required in the financial statements.
The Portfolio may be subject to taxes imposed by countries in which it invests. Such taxes are generally based on income and/or capital gains earned or repatriated. Taxes are accrued based on net investment income, net realized gains and net unrealized appreciation as such income and/or gains are earned. Taxes may also be based on transactions in foreign currency and are accrued based on the value of investments denominated in such currency.
FASB ASC 740-10, Income Taxes — Overall, sets forth a minimum threshold for financial statement recognition of the benefit of a tax position taken or expected to be taken in a tax return. Management has concluded there are no significant uncertain tax positions that would require recognition in the financial statements. If applicable, the Portfolio recognizes interest accrued related to unrecognized tax benefits in "Interest Expense" and penalties in "Other Expenses" in the Statement of Operations. The Portfolio files tax returns with the U.S. Internal Revenue Service, New York and various states. Each of the tax years in the four-year period ended December 31, 2013, remains subject to examination by taxing authorities.
The tax character of distributions paid may differ from the character of distributions shown in the Statements of Changes in Net Assets due to short-term capital gains being treated as ordinary income for tax purposes. The tax character of distributions paid during fiscal years 2013 and 2012 was as follows:
2013
Distributions
Paid From: | | 2012
Distributions
Paid From: | |
Ordinary
Income
(000) | | Long-Term
Capital Gain
(000) | | Ordinary
Income
(000) | | Long-Term
Capital Gain
(000) | |
| | — | | | $ | 25,601 | | | | — | | | | — | | |
The amount and character of income and gains to be distributed are determined in accordance with income tax regulations which may differ from GAAP. These book/tax differences are either considered temporary or permanent in nature.
Temporary differences are attributable to differing book and tax treatments for the timing of the recognition of gains (losses) on certain investment transactions and the timing of the deductibility of certain expenses.
Permanent differences, primarily due to differing treatments of gains (losses) related to foreign currency transactions and a net operating loss, resulted in the following reclassifications among the components of net assets at December 31, 2013:
Undistributed
(Distributions in
Excess of) Net
Investment
Income (Loss)
(000) | | Accumulated
Undistributed
Net Realized
Gain (Loss)
(000) | | Paid-in-Capital
(000) | |
| $ | 452 | | | $ | (183 | ) | | $ | (269 | ) | |
At December 31, 2013, the components of distributable earnings for the Portfolio on a tax basis were as follows:
Undistributed
Ordinary
Income
(000) | | Undistributed
Long-Term
Capital Gain
(000) | |
| $ | 392 | | | $ | 937 | | |
22
Morgan Stanley Institutional Fund, Inc.
Annual Report — December 31, 2013
Notes to Financial Statements (cont'd)
At December 31, 2013, the aggregate cost for Federal income tax purposes is approximately $154,545,000. The aggregate gross unrealized appreciation is approximately $109,999,000 and the aggregate gross unrealized depreciation is approximately $6,382,000 resulting in net unrealized appreciation of approximately $103,617,000.
I. Other (unaudited): At December 31, 2013, the Portfolio had otherwise unaffiliated record owners of 10% or greater. Investment activities of these shareholders could have a material impact on the Portfolio. The aggregate percentage of such owners was 81% and 10%, for Class I and Class L shares, respectively.
J. Results of Special Shareholder Meeting (unaudited): On June 5, 2013 as adjourned to June 24, 2013, July 17, 2013, July 24, 2013 and July 26, 2013, a Joint Special Shareholder Meeting was held for Class H shareholders of the Portfolio to approve the Articles of Amendment to the Fund's Articles of Amendment and Restatement and a Plan of Reclassification for the Portfolio pursuant to which Class H shares would be reclassified as Class P shares. The results with respect to this proposal were as follows:
| For | | Against | | Abstain | |
| | 4,661,572 | | | | 254,384 | | | | 435,370 | | |
K. Accounting Pronouncement: In June 2013, FASB issued Accounting Standards Update 2013-08 Financial Services — Investment Companies (Topic 946) — Amendments to the Scope, Measurement, and Disclosure Requirements ("ASU 2013-08") which is effective for interim and annual reporting periods in fiscal years that begin after December 15, 2013. ASU 2013-08 sets forth a methodology for determining whether an entity should be characterized as an investment company and prescribes fair value accounting for an investment company's non-controlling ownership interest in another investment company. FASB has determined that a fund registered under the Investment Company Act of 1940 automatically meets ASU 2013-08's criteria for an investment company. Although still evaluating the potential impacts of ASU 2013-08 to the Portfolio, management expects that the impact of the Portfolio's adoption will be limited to additional financial statement disclosures.
23
Morgan Stanley Institutional Fund, Inc.
Annual Report — December 31, 2013
Report of Independent Registered Public Accounting Firm
To the Shareholders and Board of Directors of
Morgan Stanley Institutional Fund, Inc. —
Opportunity Portfolio
We have audited the accompanying statement of assets and liabilities, including the portfolio of investments, of Opportunity Portfolio (one of the portfolios constituting Morgan Stanley Institutional Fund, Inc.) (the "Portfolio") as of December 31, 2013, and the related statement of operations for the year then ended, the statements of changes in net assets for each of the two years in the period then ended, and the financial highlights for each of the periods indicated therein. These financial statements and financial highlights are the responsibility of the Portfolio's management. Our responsibility is to express an opinion on these financial statements and financial highlights based on our audits.
We conducted our audits in accordance with the standards of the Public Company Accounting Oversight Board (United States). Those standards require that we plan and perform the audit to obtain reasonable assurance about whether the financial statements and financial highlights are free of material misstatement. We were not engaged to perform an audit of the Portfolio's internal control over financial reporting. Our audits included consideration of internal control over financial reporting as a basis for designing audit procedures that are appropriate in the circumstances, but not for the purpose of expressing an opinion on the effectiveness of the Portfolio's internal control over financial reporting. Accordingly, we express no such opinion. An audit also includes examining, on a test basis, evidence supporting the amounts and disclosures in the financial statements and financial highlights, assessing the accounting principles used and significant estimates made by management, and evaluating the overall financial statement presentation. Our procedures included confirmation of securities owned as of December 31, 2013, by correspondence with the custodian and others or by other appropriate auditing procedures where replies from others were not received. We believe that our audits provide a reasonable basis for our opinion.
In our opinion, the financial statements and financial highlights referred to above present fairly, in all material respects, the financial position of Opportunity Portfolio (one of the portfolios constituting Morgan Stanley Institutional Fund, Inc.) at December 31, 2013, the results of its operations for the year then ended, the changes in its net assets for each of the two years in the period then ended, and the financial highlights for each of the periods indicated therein, in conformity with U.S. generally accepted accounting principles.

Boston, Massachusetts
February 26, 2014
24
Morgan Stanley Institutional Fund, Inc.
Annual Report — December 31, 2013
Federal Tax Notice (unaudited)
For Federal income tax purposes, the following information is furnished with respect to the distributions paid by the Portfolio during its taxable year ended December 31, 2013.
The Portfolio designated and paid approximately $25,601,000 as a long-term capital gain distribution.
In January, the Portfolio provides tax information to shareholders for the preceding calendar year.
25
Morgan Stanley Institutional Fund, Inc.
Annual Report — December 31, 2013
U.S. Privacy Policy (unaudited)
AN IMPORTANT NOTICE CONCERNING OUR U.S. PRIVACY POLICY
This privacy notice describes the U.S. privacy policy of Morgan Stanley Distribution, Inc., and the Morgan Stanley family of mutual funds ("us", "our", "we").
We are required by federal law to provide you with notice of our U.S. privacy policy ("Policy"). This Policy applies to both our current and former clients unless we state otherwise and is intended for individual clients who purchase products or receive services from us for personal, family or household purposes. This Policy is not applicable to partnerships, corporations, trusts or other non-individual clients or account holders, nor is this Policy applicable to individuals who are either beneficiaries of a trust for which we serve as trustee or participants in an employee benefit plan administered or advised by us. This Policy is, however, applicable to individuals who select us to be a custodian of securities or assets in individual retirement accounts, 401(k) accounts, or accounts subject to the Uniform Gifts to Minors Act.
This notice sets out our business practices to protect your privacy; how we collect and share personal information about you; and how you can limit our sharing or certain uses by others of this information. We may amend this Policy at any time, and will inform you of any changes to our Policy as required by law.
WE RESPECT YOUR PRIVACY
We appreciate that you have provided us with your personal financial information and understand your concerns about your information. We strive to safeguard the information our clients entrust to us. Protecting the confidentiality and security of client information is an important part of how we conduct our business.
This notice describes what personal information we collect about you, how we collect it, when we may share it with others, and how certain others may use it. It discusses the steps you may take to limit our sharing of certain information about you with our affiliated companies, including, but not limited to our affiliated banking businesses, brokerage firms and credit service affiliates. It also discloses how you may limit our affiliates' use of shared information for marketing purposes.
Throughout this Policy, we refer to the nonpublic information that personally identifies you as "personal information." We also use the term "affiliated company" in this notice. An affiliated company is a company in our family of companies and includes companies with the Morgan Stanley name. These affiliated companies are financial institutions such as broker-dealers, banks, investment advisers and credit card issuers. We refer to any company that is not an affiliated company as a nonaffiliated third party. For purposes of Section 5 of this notice, and your ability to limit certain uses of personal information by our affiliates, this notice applies to the use of personal information by our affiliated companies.
1. WHAT PERSONAL INFORMATION DO WE COLLECT FROM YOU?
We may collect the following types of information about you: (i) information provided by you, including information from applications and other forms we receive from you, (ii) information about your transactions with us or our affiliates, (iii) information about your transactions with nonaffiliated third parties, (iv) information from consumer reporting agencies, (v) information obtained from our websites, and (vi) information obtained from other sources. For example:
• We collect information such as your name, address, e-mail address, telephone/fax numbers, assets, income and investment objectives through applications and other forms you submit to us.
• We may obtain information about account balances, your use of account(s) and the types of products and services you prefer to receive from us through your dealings and transactions with us and other sources.
• We may obtain information about your creditworthiness and credit history from consumer reporting agencies.
• We may collect background information from and through third-party vendors to verify representations you have made and to comply with various regulatory requirements.
2. WHEN DO WE DISCLOSE PERSONAL INFORMATION WE COLLECT ABOUT YOU?
We may disclose personal information we collect about you in each of the categories listed above to affiliated and nonaffiliated third parties.
26
Morgan Stanley Institutional Fund, Inc.
Annual Report — December 31, 2013
U.S. Privacy Policy (unaudited) (cont'd)
a. Information we disclose to affiliated companies.
We may disclose personal information that we collect about you to our affiliated companies to manage your account(s) effectively, to service and process your transactions, and to let you know about products and services offered by us and affiliated companies, to manage our business, and as otherwise required or permitted by law. Offers for products and services from affiliated companies are developed under conditions designed to safeguard your personal information.
b. Information we disclose to third parties.
We may disclose personal information that we collect about you to nonaffiliated third parties to provide marketing services on our behalf or to other financial institutions with whom we have joint marketing agreements. We may also disclose all of the information we collect to other nonaffiliated third parties for our everyday business purposes, such as to process transactions, maintain account(s), respond to court orders and legal investigations, report to credit bureaus, offer our own products and services, protect against fraud, for institutional risk control, to perform services on our behalf, and as otherwise required or permitted by law.
When we share personal information about you with a nonaffiliated third party, they are required to limit their use of personal information about you to the particular purpose for which it was shared and they are not allowed to share personal information about you with others except to fulfill that limited purpose or as may be permitted or required by law.
3. HOW DO WE PROTECT THE SECURITY AND CONFIDENTIALITY OF PERSONAL INFORMATION WE COLLECT ABOUT YOU?
We maintain physical, electronic and procedural security measures that comply with applicable law and regulations to help safeguard the personal information we collect about you. We have internal policies governing the proper handling of client information by employees. Third parties that provide support or marketing services on our behalf may also receive personal information about you, and we require them to adhere to appropriate security standards with respect to such information.
4. HOW CAN YOU LIMIT OUR SHARING CERTAIN PERSONAL INFORMATION ABOUT YOU WITH OUR AFFILIATED COMPANIES FOR ELIGIBILITY DETERMINATION?
By following the opt-out procedures in Section 6 below, you may limit the extent to which we share with our affiliated companies, personal information that was collected to determine your eligibility for products and services such as your credit reports and other information that you have provided to us or that we may obtain from third parties ("eligibility information"). Eligibility information does not include your identification information or personal information pertaining to our transactions or experiences with you. Please note that, even if you direct us not to share eligibility information with our affiliated companies, we may still share your personal information, including eligibility information, with our affiliated companies under circumstances that are permitted under applicable law, such as to process transactions or to service your account.
5. HOW CAN YOU LIMIT THE USE OF CERTAIN PERSONAL INFORMATION ABOUT YOU BY OUR AFFILIATED COMPANIES FOR MARKETING?
By following the opt-out instructions in Section 6 below, you may limit our affiliated companies from marketing their products or services to you based on personal information we disclose to them. This information may include, for example, your income and account history with us. Please note that, even if you choose to limit our affiliated companies from using personal information about you that we may share with them for marketing their products and services to you, our affiliated companies may use your personal information that they obtain from us to market to you in circumstances permitted by law, such as if the affiliated party has its own relationship with you.
27
Morgan Stanley Institutional Fund, Inc.
Annual Report — December 31, 2013
U.S. Privacy Policy (unaudited) (cont'd)
6. HOW CAN YOU SEND US AN OPT-OUT INSTRUCTION?
If you wish to limit our sharing of eligibility information about you with our affiliated companies, or our affiliated companies' use of personal information for marketing purposes, as described in this notice, you may do so by:
• Calling us at (800) 548-7786
Monday–Friday between 8a.m. and 5p.m. (EST)
• Writing to us at the following address:
Boston Financial Data Services, Inc.
c/o Privacy Coordinator
P.O. Box 219804
Kansas City, Missouri 64121
If you choose to write to us, your request should include: your name, address, telephone number and account number(s) to which the opt-out applies and whether you are opting out with respect to sharing of eligibility information (Section 4 above), or information used for marketing (Section 5 above), or both. Written opt-out requests should not be sent with any other correspondence. In order to process your request, we require that the request be provided by you directly and not through a third party. Once you have informed us about your privacy preferences, your opt-out preference will remain in effect with respect to this Policy (as it may be amended) until you notify us otherwise. If you are a joint account owner, we will accept instructions from any one of you and apply those instructions to the entire account.
Please understand that if you limit our sharing or our affiliated companies' use of personal information, you and any joint account holder(s) may not receive information about our affiliated companies' products and services, including products or services that could help you manage your financial resources and achieve your investment objectives.
If you have more than one account or relationship with us, please specify the accounts to which you would like us to apply your privacy choices. If you have accounts or relationships with our affiliates, you may receive multiple privacy policies from them, and will need to separately notify those companies of your privacy choices for those accounts or relationships.
7. WHAT IF AN AFFILIATED COMPANY BECOMES A NONAFFILIATED THIRD PARTY?
If, at any time in the future, an affiliated company becomes a nonaffiliated third party, further disclosures of personal information made to the former affiliated company will be limited to those described in Section 2(b) above relating to nonaffiliated third parties. If you elected under Section 6 to limit disclosures we make to affiliated companies, or use of personal information by affiliated companies, your election will not apply to use by any former affiliated company of your personal information in their possession once it becomes a nonaffiliated third party.
SPECIAL NOTICE TO RESIDENTS OF VERMONT
The following section supplements our Policy with respect to our individual clients who have a Vermont address and supersedes anything to the contrary in the above Policy with respect to those clients only.
The State of Vermont requires financial institutions to obtain your consent prior to sharing personal information that they collect about you with nonaffiliated third parties, or eligibility information with affiliated companies, other than in certain limited circumstances. Except as permitted by law, we will not share personal information we collect about you with nonaffiliated third parties or eligibility information with affiliated companies, unless you provide us with your written consent to share such information.
SPECIAL NOTICE TO RESIDENTS OF CALIFORNIA
The following section supplements our Policy with respect to our individual clients who have a California address and supersedes anything to the contrary in the above Policy with respect to those clients only.
In response to a California law, if your account has a California home address, your personal information will not be disclosed to nonaffiliated third parties except as permitted by applicable California law, and we will limit sharing such personal information with our affiliates to comply with California privacy laws that apply to us.
28
Morgan Stanley Institutional Fund, Inc.
Annual Report — December 31, 2013
Director and Officer Information (unaudited)
Independent Director:
Name, Age and Address of
Independent Director | | Position(s)
Held with
Registrant | | Length of Time
Served* | | Principal Occupation(s) During Past 5 Years | | Number of
Portfolios in
Fund Complex
Overseen by
Independent
Director** | | Other Directorships
Held by Independent
Director*** | |
Frank L. Bowman (69)
c/o Kramer Levin Naftalis &
Frankel LLP
Counsel to the Independent
Directors
1177 Avenue of the Americas
New York, NY 10036 | | Director | | Since
August
2006 | | President, Strategic Decisions, LLC (consulting) (since February 2009); Director or Trustee of various Morgan Stanley Funds (since August 2006); Chairperson of the Insurance Sub-Committee of the Compliance and Insurance Committee (since February 2007); served as President and Chief Executive Officer of the Nuclear Energy Institute (policy organization) (February 2005-November 2008); retired as Admiral, U.S. Navy after serving over 38 years on active duty including 8 years as Director of the Naval Nuclear Propulsion Program in the Department of the Navy and the U.S. Department of Energy (1996-2004); served as Chief of Naval Personnel (July 1994-September 1996); and on the Joint Staff as Director of Political Military Affairs (June 1992-July 1994); knighted as Honorary Knight Commander of the Most Excellent Order of the British Empire; awarded the Officier de l'Orde National du Mérite by the French Government; elected to the National Academy of Engineering (2009). | | | 98 | | | Director of BP p.l.c.; Director of Naval and Nuclear Technologies LLP; Director of the Armed Services YMCA of the USA and the U.S. Naval Submarine League; Director of the American Shipbuilding Suppliers Association; Member of the National Security Advisory Council of the Center for U.S. Global Engagement and a member of the CNA Military Advisory Board; Chairman, J Street Cup Golf Charity, Trustee Fairhaven United Methodist Church. | |
Michael Bozic (73)
c/o Kramer Levin Naftalis & Frankel LLP
Counsel to the Independent Directors
1177 Avenue of the Americas New York, NY 10036 | | Director | | Since
April
1994 | | Private investor and a member of the advisory board of American Road Group LLC (retail) (since June 2000); Chairperson of the Compliance and Insurance Committee (since October 2006); Director or Trustee of various Morgan Stanley Funds (since April 1994); formerly, Chairperson of the Insurance Committee (July 2006-September 2006); Vice Chairman of Kmart Corporation (December 1998-October 2000), Chairman and Chief Executive Officer of Levitz Furniture Corporation (November 1995-November 1998) and President and Chief Executive Officer of Hills Department Stores (May 1991-July 1995); variously Chairman, Chief Executive Officer, President and Chief Operating Officer (1987-1991) of the Sears Merchandise Group of Sears, Roebuck & Co. | | | 100 | | | Trustee and member of the Hillsdale College Board of Trustees. | |
Kathleen A. Dennis (60)
c/o Kramer Levin Naftalis & Frankel LLP
Counsel to the Independent Directors
1177 Avenue of the Americas New York, NY 10036 | | Director | | Since
August
2006 | | President, Cedarwood Associates (mutual fund and investment management consulting) (since July 2006); Chairperson of the Money Market and Alternatives Sub-Committee of the Investment Committee (since October 2006) and Director or Trustee of various Morgan Stanley Funds (since August 2006); formerly, Senior Managing Director of Victory Capital Management (1993-2006). | | | 98 | | | Director of various non-profit organizations. | |
Dr. Manuel H. Johnson (65)
c/o Johnson Smick
Group, Inc.
888 16th Street, N.W.
Suite 740
Washington, D.C. 20006 | | Director | | Since
July
1991 | | Senior Partner, Johnson Smick International, Inc. (consulting firm); Chairperson of the Investment Committee (since October 2006) and Director or Trustee of various Morgan Stanley Funds (since July 1991); Co-Chairman and a founder of the Group of Seven Council (G7C) (international economic commission); formerly, Chairperson of the Audit Committee (July 1991-September 2006), Vice Chairman of the Board of Governors of the Federal Reserve System and Assistant Secretary of the U.S. Treasury. | | | 101 | | | Director of NVR, Inc. (home construction). | |
29
Morgan Stanley Institutional Fund, Inc.
Annual Report — December 31, 2013
Director and Officer Information (unaudited) (cont'd)
Independent Director: (cont'd)
Name, Age and Address of
Independent Director | | Position(s)
Held with
Registrant | | Length of Time
Served* | | Principal Occupation(s) During Past 5 Years | | Number of
Portfolios in
Fund Complex
Overseen by
Independent
Director** | | Other Directorships
Held by Independent
Director*** | |
Joseph J. Kearns (71)
c/o Kearns & Associates LLC PMB754
22631 Pacific Coast Highway
Malibu, CA 90265 | | Director | | Since
August
1994 | | President, Kearns & Associates LLC (investment consulting); Chairperson of the Audit Committee (since October 2006) and Director or Trustee of various Morgan Stanley Funds (since August 1994); formerly, Deputy Chairperson of the Audit Committee (July 2003-September 2006) and Chairperson of the Audit Committee of various Morgan Stanley Funds (since August 1994); CFO of the J. Paul Getty Trust. | | | 101 | | | Director of Electro Rent Corporation (equipment leasing) and The Ford Family Foundation. | |
Michael F. Klein (55)
c/o Kramer Levin Naftalis & Frankel LLP
Counsel to the Independent Directors
1177 Avenue of the Americas New York, NY 10036 | | Director | | Since
August
2006 | | Managing Director, Aetos Capital, LLC (since March 2000) and Co-President, Aetos Alternatives Management, LLC (since January 2004); and Co-Chief Executive Officer of Aetos Capital LLC (since August 2013); Chairperson of the Fixed Income Sub-Committee of the Investment Committee (since October 2006) and Director or Trustee of various Morgan Stanley Funds (since August 2006); formerly, Managing Director, Morgan Stanley & Co. Inc. and Morgan Stanley Dean Witter Investment Management, President, various Morgan Stanley Funds (June 1998-March 2000) and Principal, Morgan Stanley & Co. Inc. and Morgan Stanley Dean Witter Investment Management (August 1997-December 1999). | | | 98 | | | Director of certain investment funds managed or sponsored by Aetos Capital, LLC. Director of Sanitized AG and Sanitized Marketing AG (specialty chemicals). | |
Michael E. Nugent (77)
522 Fifth Avenue
New York, NY 10036 | | Chairperson
of the
Board and Director | | Chairperson of the Boards since July 2006 and Director since July 1991 | | Chairperson of the Boards of various Morgan Stanley Funds (since July 2006); Chairperson of the Closed-End Fund Committee (since June 2012) and Director or Trustee of various Morgan Stanley Funds (since July 1991); formerly, Chairperson of the Insurance Committee (until July 2006); General Partner, Triumph Capital, L.P. (private investment partnership) (1988-2013) | | | 100 | | | None. | |
W. Allen Reed (66)
c/o Kramer Levin Naftalis & Frankel LLP
Counsel to the Independent Directors
1177 Avenue of the Americas New York, NY 10036 | | Director | | Since
August
2006 | | Chairperson of the Equity Sub-Committee of the Investment Committee (since October 2006) and Director or Trustee of various Morgan Stanley Funds (since August 2006); formerly, President and CEO of General Motors Asset Management; Chairman and Chief Executive Officer of the GM Trust Bank and Corporate Vice President of General Motors Corporation (August 1994-December 2005). | | | 98 | | | Director of Temple-Inland Industries (packaging and forest products); Director of Legg Mason, Inc. and Director of the Auburn University Foundation. | |
Fergus Reid (81)
c/o Joe Pietryka, Inc.
85 Charles Colman Blvd. Pawling, NY 12564 | | Director | | Since
June
1992 | | Chairman, Joe Pietryka, Inc.; Chairperson of the Governance Committee and Director or Trustee of various Morgan Stanley Funds (since June 1992). | | | 101 | | | Through December 31, 2012, Trustee and Director of certain Investment companies in the JP Morgan Fund Complex. | |
30
Morgan Stanley Institutional Fund, Inc.
Annual Report — December 31, 2013
Director and Officer Information (unaudited) (cont'd)
Interested Director:
Name, Age and Address of
Interested Director | | Position(s)
Held with
Registrant | | Length of
Time Served* | | Principal Occupation(s) During Past 5 Years | | Number of
Portfolios in
Fund Complex
Overseen by
Interested
Director** | | Other Directorships
Held by Interested
Director*** | |
James F. Higgins (66)
One New York Plaza
New York, NY 10004 | | Director | | Since
June
2000 | | Director or Trustee of various Morgan Stanley Funds (since June 2000); Senior Advisor of Morgan Stanley (since August 2000). | | | 99 | | | Formerly, Director of AXA Financial, Inc. and AXA Equitable Life Insurance Company (2002-2011) and Director of AXA MONY Life Insurance Company and AXA MONY Life Insurance Company of America (2004-2011). | |
* Each Director serves an indefinite term, until his or her successor is elected.
** The Fund Complex includes (as of December 31, 2013) all open-end and closed-end funds (including all of their portfolios) advised by Morgan Stanley Investment Management Inc. (the "Adviser") and any funds that have an adviser that is an affiliated person of the Adviser (including, but not limited to, Morgan Stanley AIP GP LP).
*** This includes any directorships at public companies and registered investment companies held by the Director at any time during the past five years.
31
Morgan Stanley Institutional Fund, Inc.
Annual Report — December 31, 2013
Director and Officer Information (unaudited) (cont'd)
Executive Officers:
Name, Age and Address of Executive Officer | | Position(s) Held
with
Registrant | | Length of
Time Served* | | Principal Occupation(s) During Past 5 Years | |
John H. Gernon (50)
522 Fifth Avenue
New York, NY 10036 | | President and Principal Executive Officer—Equity, Fixed Income and AIP Funds | | Since
September
2013 | | President and Principal Executive Officer of the Equity and Fixed Income Funds and the Morgan Stanley AIP Funds (since September 2013) in the Fund Complex; Managing Director of the Adviser. | |
Stefanie V. Chang Yu (47)
522 Fifth Avenue
New York, NY 10036 | | Chief Compliance Officer | | Since
January
2014 | | Managing Director of the Adviser and various entities affiliated with the Adviser; Chief Compliance Officer of various Morgan Stanley Funds and the Adviser (since January 2014). Formerly, Vice President of various Morgan Stanley Funds (December 1997-January 2014). | |
Joseph C. Benedetti (48)
522 Fifth Avenue
New York, NY 10036 | | Vice President | | Since
January
2014 | | Managing Director of the Adviser and various entities affiliated with the Adviser; Vice President of various Morgan Stanley Funds (since January 2014). | |
Francis J. Smith (48)
522 Fifth Avenue
New York, NY 10036 | | Treasurer and Principal Financial Officer | | Treasurer since July 2003 and Principal Financial Officer since September 2002 | | Executive Director of the Adviser and various entities affiliated with the Adviser; Treasurer and Principal Financial Officer of various Morgan Stanley Funds (since July 2003). | |
Mary E. Mullin (46)
522 Fifth Avenue
New York, NY 10036 | | Secretary | | Since
June
1999 | | Executive Director of the Adviser and various entities affiliated with the Adviser; Secretary of various Morgan Stanley Funds (since June 1999). | |
* Each officer serves an indefinite term, until his or her successor is elected.
32
Morgan Stanley Institutional Fund, Inc.
Annual Report — December 31, 2013
Adviser and Administrator
Morgan Stanley Investment Management Inc.
522 Fifth Avenue
New York, New York 10036
Distributor
Morgan Stanley Distribution, Inc.
522 Fifth Avenue
New York, New York 10036
Dividend Disbursing and Transfer Agent
Boston Financial Data Services, Inc.
2000 Crown Colony Drive
Quincy, Massachusetts 02169
Custodian
State Street Bank and Trust Company
One Lincoln Street
Boston, Massachusetts 02111
Legal Counsel
Dechert LLP
1095 Avenue of the Americas
New York, New York 10036
Counsel to the Independent Directors
Kramer Levin Naftalis & Frankel LLP
1177 Avenue of the Americas
New York, New York 10036
Independent Registered Public Accounting Firm
Ernst & Young LLP
200 Clarendon Street
Boston, Massachusetts 02116
Reporting to Shareholders
Each Morgan Stanley fund provides a complete schedule of portfolio holdings in its semi-annual and annual reports within 60 days of the end of the fund's second and fourth fiscal quarters by filing the schedule electronically with the Securities and Exchange Commission (SEC). The semi-annual reports are filed on Form N-CSRS and the annual reports are filed on Form N-CSR. Morgan Stanley also delivers the semi-annual and annual reports to fund shareholders and makes these reports available on its public website, www.morganstanley.com/im. Each Morgan Stanley fund also files a complete schedule of portfolio holdings with the SEC for the fund's first and third fiscal quarters on Form N-Q. Morgan Stanley does not deliver the reports for the first and third fiscal quarters to shareholders, nor are the reports posted to the Morgan Stanley public website. You may, however, obtain the Form N-Q filings (as well as the Form N-CSR and N-CSRS filings) by accessing the SEC's website, www.sec.gov. You may also review and copy them at the SEC's Public Reference Room in Washington, DC. Information on the operation of the SEC's Public Reference Room may be obtained by calling the SEC toll free at 1 (800) SEC-0330. You can also request copies of these materials, upon payment of a duplicating fee, by electronic request at the SEC's email address (publicinfo@sec.gov) or by writing the Public Reference Room of the SEC, Washington, DC 20549-0102.
Proxy Voting Policies and Procedures and Proxy Voting Record
You may obtain a copy of the Fund's Proxy Voting Policy and Procedures and information regarding how the Fund voted proxies relating to portfolio securities during the most recent twelve-month period ended June 30, without charge, upon request, by calling toll free 1 (800) 548-7786 or by visiting our website at www.morganstanley.com/im. This information is also available on the SEC's website at www.sec.gov.
This report is authorized for distribution only when preceded or accompanied by a prospectus of the Morgan Stanley Institutional Fund, Inc. which describes in detail each Investment Portfolio's investment policies, risks, fees and expenses. Please read the prospectus carefully before you invest or send money. For additional information, including information regarding the investments comprising the Portfolio, please visit our website at www.morganstanley.com/im or call toll free 1 (800) 548-7786.
33
Printed in U.S.A.
This Report has been prepared for shareholders and may be distributed to others only if preceded or accompanied by a current prospectus.
Morgan Stanley Investment Management Inc.
522 Fifth Avenue
New York, New York 10036
© 2014 Morgan Stanley. Morgan Stanley Distribution, Inc.

IFIOPPANN
809318 Exp 2.28.15

Morgan Stanley Institutional Fund, Inc.
Global Opportunity Portfolio
Annual Report
December 31, 2013

Morgan Stanley Institutional Fund, Inc.
Annual Report — December 31, 2013
Shareholders' Letter | | | 2 | | |
Expense Example | | | 3 | | |
Investment Overview | | | 4 | | |
Portfolio of Investments | | | 6 | | |
Statement of Assets and Liabilities | | | 8 | | |
Statement of Operations | | | 10 | | |
Statements of Changes in Net Assets | | | 11 | | |
Financial Highlights | | | 13 | | |
Notes to Financial Statements | | | 17 | | |
Report of Independent Registered Public Accounting Firm | | | 26 | | |
Federal Tax Notice | | | 27 | | |
U.S. Privacy Policy | | | 28 | | |
Director and Officer Information | | | 31 | | |
This report is authorized for distribution only when preceded or accompanied by prospectuses of the Morgan Stanley Institutional Fund, Inc. To receive a prospectus and/or statement of additional information (SAI), which contains more complete information such as investment objectives, charges, expenses, policies for voting proxies, risk considerations, and describes in detail each of the Portfolio's investment policies to the prospective investor, please call toll free 1 (800) 548-7786. Please read the prospectuses carefully before you invest or send money.
Additionally, you can access portfolio information including performance, characteristics, and investment team commentary through Morgan Stanley Investment Management's website: www.morganstanley.com/im.
Market forecasts provided in this report may not necessarily come to pass. There is no guarantee that any sectors mentioned will continue to perform as discussed herein or that securities in such sectors will be held by the Portfolio in the future. There is no assurance that a Portfolio will achieve its investment objective. Portfolios are subject to market risk, which is the possibility that market values of securities owned by the Portfolio will decline and, therefore, the value of the Portfolio's shares may be less than what you paid for them. Accordingly, you can lose money investing in the Portfolio. Please see the prospectus for more complete information on investment risks.
1
Morgan Stanley Institutional Fund, Inc.
Annual Report — December 31, 2013
Shareholders' Letter (unaudited)
Dear Shareholders,
We are pleased to provide this Annual report, in which you will learn how your investment in Global Opportunity Portfolio (the "Portfolio") performed during the latest twelve-month period.
Morgan Stanley Investment Management is a client-centric, investor-led organization. Our global presence, intellectual capital, and breadth of products and services enable us to partner with investors to meet the evolving challenges of today's financial markets. We aim to deliver superior investment service and to empower our clients to make the informed decisions that help them reach their investment goals.
As always, we thank you for selecting Morgan Stanley Investment Management, and look forward to working with you in the months and years ahead.
Sincerely,

John H. Gernon
President and Principal Executive Officer
January 2014
2
Morgan Stanley Institutional Fund, Inc.
Annual Report — December 31, 2013
Expense Example (unaudited)
Global Opportunity Portfolio
As a shareholder of the Portfolio, you incur two types of costs: (1) transactional costs; and (2) ongoing costs, including advisory fees, administration fees, distribution and shareholder services fees and other Portfolio expenses. This example is intended to help you understand your ongoing costs (in dollars) of investing in the Portfolio and to compare these costs with the ongoing costs of investing in other mutual funds.
This example is based on an investment of $1,000 invested at the beginning of the six-month period ended December 31, 2013 and held for the entire six-month period.
Actual Expenses
The table below provides information about actual account values and actual expenses. You may use the information in this table, together with the amount you invested, to estimate the expenses that you paid over the period. Simply divide your account value by $1,000 (for example, an $8,600 account value divided by $1,000 = 8.6), then multiply the result by the number in the table under the heading entitled "Actual Expenses Paid During Period" to estimate the expenses you paid on your account during this period.
Hypothetical Example for Comparison Purposes
The table below provides information about hypothetical account values and hypothetical expenses based on the Portfolio's actual expense ratio and an assumed rate of return of 5% per year before expenses, which is not the Portfolio's actual return. The hypothetical account values and expenses may not be used to estimate the actual ending account balance or expenses you paid for the period. You may use this information to compare the ongoing costs of investing in the Portfolio and other funds. To do so, compare this 5% hypothetical example with the 5% hypothetical examples that appear in the shareholder reports of the other funds.
Please note that the expenses shown in the table are meant to highlight your ongoing costs only and do not reflect any transactional costs, such as sales charges (loads). Therefore, the information for each class in the table is useful in comparing ongoing costs only, and will not help you determine the relative total costs of owning different funds. In addition, if these transactional costs were included, your costs would have been higher.
| | | Beginning
Account
Value
7/1/13 | | Actual Ending
Account
Value
12/31/13 | | Hypothetical
Ending Account
Value | | Actual
Expenses
Paid
During
Period | | Hypothetical
Expenses Paid
During Period | | Net
Expense
Ratio
During
Period*** | |
Global Opportunity Portfolio Class I | | $ | 1,000.00 | | | $ | 1,365.90 | | | $ | 1,019.00 | | | $ | 7.33 | * | | $ | 6.26 | * | | | 1.23 | % | |
Global Opportunity Portfolio Class A@ | | | 1,000.00 | | | | 1,363.80 | | | | 1,017.19 | | | | 9.47 | * | | | 8.08 | * | | | 1.59 | | |
Global Opportunity Portfolio Class L | | | 1,000.00 | | | | 1,363.40 | | | | 1,017.09 | | | | 9.59 | * | | | 8.19 | * | | | 1.61 | | |
Global Opportunity Portfolio Class IS | | | 1,000.00 | | | | 1,183.50 | | | | 1,011.20 | | | | 3.78 | ** | | | 3.48 | ** | | | 1.18 | | |
* Expenses are calculated using each Portfolio Class' annualized net expense ratio (as disclosed), multiplied by the average account value over the period, and multiplied by 184/365 (to reflect the most recent one-half year period).
** Expenses are calculated using the Portfolio Class' annualized net expense ratio (as disclosed), multiplied by the average account value over the period, and multiplied by 107/365 (to reflect the actual days in the period).
*** Annualized.
@ Effective September 9, 2013, Class P and Class H shares were renamed Class A shares.
3
Morgan Stanley Institutional Fund, Inc.
Annual Report — December 31, 2013
Investment Overview (unaudited)
Global Opportunity Portfolio
The Global Opportunity Portfolio seeks long-term capital appreciation by investing primarily in established and emerging franchise companies located throughout the world, with capitalizations within the range of companies included in the Morgan Stanley Capital International (MSCI) All Country World Index.
Performance
For the year ended December 31, 2013, the Portfolio had a total return based on net asset value and reinvestment of distributions per share of 40.12%, net of fees, for Class I shares. The Portfolio's Class I shares outperformed against its benchmark, the MSCI All Country World Index (the "Index"), which returned 22.80%. Please keep in mind that high double-digit returns are highly unusual and cannot be sustained.
Factors Affecting Performance
• Global equity performance in 2013 was driven by strong results in the developed world, which continued to benefit from accommodative monetary policy, along with signs of more sustainable economic progress in the U.S. and stabilization in the eurozone. By comparison, emerging market equities languished. Uncertainties about a slowdown in China's economy, the negative implications of the expected tapering of U.S. quantitative easing, and pockets of regional and country-specific political conflict were among the factors weighing on investor sentiment for the asset class.
• The information technology sector contributed nearly all of the Portfolio's relative gain during the period. Performance was led by a position in a U.S. online social networking company.
• Stock selection and an overweight in the consumer discretionary sector also buoyed relative performance. A holding in an after-school tutoring services provider based in China added the most to relative performance in the sector.
• An underweight in the materials sector was beneficial, as the sector was the Index's worst performing group and the only sector with a negative return for the period. Stock selection in materials also aided performance, with strong results from a holding in a U.S. agriculture products company.
• Detracting from relative performance was stock selection in the consumer staples sector, where exposure to a liquor producer in China (which is not represented in the Index) dampened performance.i
• Performance in the financials sector was disadvantageous too, with weak stock selection overwhelming a modest relative gain from an underweight there.
• No exposure to the health care sector was unfavorable to relative returns, as the sector was among the best performing groups in the Index during the period.
Management Strategies
• We look for high-quality growth companies that we believe have these attributes: sustainable competitive advantages, above-average business visibility, rising return on invested capital, strong free cash flow generation and a favorable risk/reward. We find these companies through intense fundamental research. Our emphasis is on secular growth, and as a result short-term market events are not as meaningful in the stock selection process.
i To gain exposure to the stock, the Portfolio utilized a P-note (participation note), which is intended to mirror the performance of the underlying stock. There is no leverage associated with P-notes.
* Minimum Investment for Class I shares
** Commenced Operations on May 30, 2008.
In accordance with SEC regulations, Portfolio's performance shown assumes that all recurring fees (including management fees) were deducted and all dividends and distributions were reinvested. The performance of Class A+, L and IS shares will vary from Class I shares based upon their different inception dates and will be negatively impacted by additional fees assessed to those classes (if applicable).
4
Morgan Stanley Institutional Fund, Inc.
Annual Report — December 31, 2013
Investment Overview (unaudited) (cont'd)
Global Opportunity Portfolio
Performance Compared to the Morgan Stanley Capital International (MSCI) All Country World Index(1) and the Lipper Global Multi-Cap Growth Funds Index(2)
| | | Period Ended December 31, 2013
Total Returns(3) | |
| | | | | Average Annual | |
| | | One
Year | | Five
Years | | Ten
Years | | Since
Inception(6) | |
Portfolio — Class I Shares
w/o sales charges(4) | | | 40.12 | % | | | 27.43 | % | | | — | | | | 10.00 | % | |
MSCI All Country World Index | | | 22.80 | | | | 14.92 | | | | — | | | | 3.18 | | |
Lipper Global Multi-Cap
Growth Funds Index | | | 25.75 | | | | 16.77 | | | | — | | | | 4.37 | | |
Portfolio — Class A+ Shares
w/o sales charges(4) | | | 39.80 | | | | — | | | | — | | | | 20.29 | | |
Portfolio — Class A+ Shares
with maximum 5.25%
sales charges(4) | | | 32.41 | | | | — | | | | — | | | | 18.50 | | |
MSCI All Country World Index | | | 22.80 | | | | — | | | | — | | | | 14.09 | | |
Lipper Global Multi-Cap
Growth Funds Index | | | 25.75 | | | | — | | | | — | | | | 14.40 | | |
Portfolio — Class L Shares
w/o sales charges(4) | | | 39.79 | | | | 26.99 | | | | — | | | | 9.66 | | |
MSCI All Country World Index | | | 22.80 | | | | 14.92 | | | | — | | | | 3.18 | | |
Lipper Global Multi-Cap
Growth Funds Index | | | 25.75 | | | | 16.77 | | | | — | | | | 4.37 | | |
Portfolio — Class IS Shares
w/o sales charges(5) | | | — | | | | — | | | | — | | | | 18.35 | | |
MSCI All Country World Index | | | — | | | | — | | | | — | | | | 8.05 | | |
Lipper Global Multi-Cap
Growth Funds Index | | | — | | | | — | | | | — | | | | 9.39 | | |
Performance data quoted represents past performance, which is no guarantee of future results, and current performance may be lower or higher than the figures shown. Performance assumes that all dividends and distributions, if any, were reinvested. For the most recent month-end performance figures, please visit www.morganstanley.com/im. Investment return and principal value will fluctuate so that Portfolio shares, when redeemed, may be worth more or less than their original cost. Total returns do not reflect the deduction of taxes that a shareholder would pay on Portfolio distributions or the redemption of Portfolio shares. Returns for periods less than one year ar not annualized. Performance of share classes will vary due to difference in sales charges and expenses.
+ Effective September 9, 2013, Class P shares were renamed Class A shares.
(1) The Morgan Stanley Capital International (MSCI) All Country World Index (ACWI) is a free float-adjusted market capitalization weighted index designed to measure the equity market performance of developed and emerging markets. The term "free float" represents the portion of shares outstanding that are deemed to be available for purchase in the public equity markets by investors. The Index is unmanaged and its returns do not include any sales charges or fees. Such costs would lower performance. It is not possible to invest directly in an index.
(2) The Lipper Global Multi-Cap Growth Funds Index is an equally weighted performance index of the largest qualifying funds (based on net assets) in the Lipper Global Multi-Cap Growth Funds classification. The Index, which is adjusted for capital gains distributions and income dividends, is unmanaged and should
not be considered an investment. There are currently 30 funds represented in this Index. As of the date of this report, the Portfolio is in the Lipper Global Multi-Cap Growth Funds classification.
(3) Total returns for the Portfolio reflect fees waived and expenses reimbursed, if applicable, by the Adviser. Without such waivers and reimbursements, total returns would have been lower. The fee waivers and/or expense reimbursements will continue for at least one year or until such time as the Fund's Board of Directors acts to discontinue all or a portion of such waivers and/or expense reimbursements when it deems that such action is appropriate. The Distributor has agreed to waive for at least one year the 12b-1 fee on Class L shares of the Portfolio to the extent it exceeds 0.30% of the average daily net assets of such shares on an annualized basis.
(4) On May 21, 2010 Class C and Class I shares of Van Kampen Global Growth Fund ("the Predecessor Fund") were reorganized into Class L and Class I shares of Morgan Stanley Global Growth Portfolio ("the Portfolio"), respectively. Class L and Class I shares' returns of the Portfolio will differ from the Predecessor Fund as they have different expenses. Performance shown for the Portfolio's Class I and Class L shares reflects the performance of the shares of the Predecessor Fund for periods prior to May 21, 2010. The Class C and I shares of the Predecessor Fund commenced operations on May 30, 2008. Class P shares, which were renamed Class A shares effective September 9, 2013, commenced operations on May 21, 2010. In October 2010, the Morgan Stanley Global Growth Portfolio changed its name to the Morgan Stanley Global Opportunity Portfolio.
(5) Commenced offering on September 13, 2013.
(6) For comparative purposes, average annual since inception returns listed for the Indexes refer to the inception date or initial offering of the respective share class of the Portfolio, not the inception of the Index. Returns for periods less than one year are not annualized.
Portfolio Composition
Classification | | Percentage of
Total Investments | |
Other* | | | 30.1 | % | |
Internet Software & Services | | | 25.9 | | |
Information Technology Services | | | 12.8 | | |
Internet & Catalog Retail | | | 10.2 | | |
Hotels, Restaurants & Leisure | | | 8.4 | | |
Diversified Consumer Services | | | 7.6 | | |
Beverages | | | 5.0 | | |
Total Investments | | | 100.0 | % | |
* Industries and/or investment types representing less than 5% of total investments.
5
Morgan Stanley Institutional Fund, Inc.
Annual Report — December 31, 2013
Portfolio of Investments
Global Opportunity Portfolio
| | | Shares | | Value
(000) | |
Common Stocks (94.1%) | |
Australia (0.0%) | |
AET&D Holdings No. 1 Ltd. (a)(b)(c) | | | 36,846 | | | $ | — | | |
Belgium (1.4%) | |
Anheuser-Busch InBev N.V. | | | 1,519 | | | | 162 | | |
Brazil (2.5%) | |
CETIP SA - Mercados Organizados | | | 29,448 | | | | 302 | | |
Canada (3.2%) | |
Brookfield Asset Management, Inc., Class A | | | 4,840 | | | | 188 | | |
Brookfield Infrastructure Partners LP | | | 4,759 | | | | 187 | | |
| | | | 375 | | |
China (9.7%) | |
Autohome, Inc. ADR (a) | | | 3,970 | | | | 145 | | |
Baidu, Inc. ADR (a) | | | 1,532 | | | | 273 | | |
New Oriental Education & Technology
Group, Inc. ADR | | | 9,495 | | | | 299 | | |
Qihoo 360 Technology Co., Ltd. ADR (a) | | | 5,355 | | | | 439 | | |
| | | | 1,156 | | |
Denmark (4.6%) | |
DSV A/S | | | 16,587 | | | | 544 | | |
Hong Kong (1.8%) | |
Louis XIII Holdings Ltd. | | | 211,620 | | | | 213 | | |
India (4.7%) | |
Adani Ports and Special Economic Zone | | | 89,452 | | | | 225 | | |
Jubilant Foodworks Ltd. (a) | | | 15,296 | | | | 314 | | |
Nestle India Ltd. | | | 264 | | | | 23 | | |
| | | | 562 | | |
Italy (1.2%) | |
Prada SpA (d) | | | 16,200 | | | | 144 | | |
Japan (1.4%) | |
Calbee, Inc. | | | 6,900 | | | | 167 | | |
Korea, Republic of (5.7%) | |
Hotel Shilla Co., Ltd. (a) | | | 4,263 | | | | 269 | | |
NAVER Corp. (a) | | | 588 | | | | 403 | | |
| | | | 672 | | |
South Africa (3.1%) | |
Naspers Ltd., Class N | | | 3,567 | | | | 373 | | |
Switzerland (1.4%) | |
Kuehne & Nagel International AG (Registered) | | | 1,221 | | | | 160 | | |
United Kingdom (4.3%) | |
Burberry Group PLC | | | 13,648 | | | | 343 | | |
Intertek Group PLC | | | 3,263 | | | | 170 | | |
| | | | 513 | | |
United States (49.1%) | |
Amazon.com, Inc. (a) | | | 2,117 | | | | 844 | | |
Cognizant Technology Solutions Corp., Class A (a) | | | 3,060 | | | | 309 | | |
Facebook, Inc., Class A (a) | | | 14,656 | | | | 801 | | |
Google, Inc., Class A (a) | | | 631 | | | | 707 | | |
Greenlight Capital Re Ltd., Class A (a) | | | 5,935 | | | | 200 | | |
Luxoft Holding, Inc. (a) | | | 13,798 | | | | 524 | | |
Mastercard, Inc., Class A | | | 432 | | | | 361 | | |
| | | Shares | | Value
(000) | |
Monsanto Co. | | | 1,695 | | | $ | 198 | | |
MSCI, Inc. (a) | | | 3,787 | | | | 166 | | |
Priceline.com, Inc. (a) | | | 305 | | | | 354 | | |
TAL Education Group ADR (a) | | | 27,267 | | | | 600 | | |
Twitter, Inc. (a) | | | 4,328 | | | | 275 | | |
Visa, Inc., Class A | | | 1,412 | | | | 314 | | |
Wynn Resorts Ltd. | | | 961 | | | | 187 | | |
| | | | 5,840 | | |
Total Common Stocks (Cost $6,362) | | | 11,183 | | |
Preferred Stock (0.4%) | |
India (0.4%) | |
Flipkart Online Services Pvt Ltd.
Series D (a)(b)(c)(e)
(acquisition cost — $51; acquired 10/4/13)
(Cost $51) | | | 2,242 | | | | 53 | | |
Convertible Preferred Stock (0.0%) | |
China (0.0%) | |
Youku Tudou, Inc., Class A (a)(b)(c)(e)
(acquisition cost — $@; acquired 9/16/10)
(Cost —@) | | | 9 | | | | — | @ | |
Participation Notes (3.5%) | |
China (3.5%) | |
Kweichow Moutai Co., Ltd., Class A,
Equity Linked Notes, expires 2/20/14 | | | 14,080 | | | | 299 | | |
Kweichow Moutai Co., Ltd., Class A,
Equity Linked Notes, expires 3/4/21 | | | 5,750 | | | | 122 | | |
Total Participation Notes (Cost $505) | | | 421 | | |
| | Notional
Amount | | | |
Call Options Purchased (0.1%) | |
Foreign Currency Options (0.1%) | |
USD/CNY December 2014 @ CNY 6.50 | | | 134,154 | | | | — | @ | |
USD/CNY December 2014 @ CNY 6.50 | | | 1,665,755 | | | | 3 | | |
USD/CNY December 2014 @ CNY 6.50 | | | 1,869,554 | | | | 3 | | |
Total Call Options Purchased (Cost $12) | | | 6 | | |
| | | Shares | | | |
Short-Term Investment (0.7%) | |
Investment Company (0.7%) | |
Morgan Stanley Institutional Liquidity
Funds — Money Market Portfolio —
Institutional Class (See Note G)
(Cost $88) | | | 88,371 | | | | 88 | | |
Total Investments (98.8%) (Cost $7,018) | | | 11,751 | | |
Other Assets in Excess of Liabilities (1.2%) | | | 137 | | |
Net Assets (100.0%) | | $ | 11,888 | | |
(a) Non-income producing security.
(b) At December 31, 2013, the Portfolio held fair valued securities valued at approximately $53,000, representing 0.4% of net assets. These securities have been fair valued as determined in good faith under procedures established by and under the general supervision of the Fund's Directors.
The accompanying notes are an integral part of the financial statements.
6
Morgan Stanley Institutional Fund, Inc.
Annual Report — December 31, 2013
Portfolio of Investments (cont'd)
Global Opportunity Portfolio
(c) Security has been deemed illiquid at December 31, 2013.
(d) Security trades on the Hong Kong exchange.
(e) Security cannot be offered for public resale without first being registered under the Securities Act of 1933 and related rules ("restricted security"). Acquisition date represents the day on which an enforceable right to acquire such security is obtained and is presented along with related cost in the security description. The Portfolio has registration rights for certain restricted securities. Any costs related to such registration are borne by the issuer. The aggregate value of restricted securities (excluding 144A holdings) at December 31, 2013 amounts to approximately $53,000 and represents 0.4% of net assets.
@ Value is less than $500.
ADR American Depositary Receipt.
CNY Chinese Yuan Renminbi
USD United States Dollar
The accompanying notes are an integral part of the financial statements.
7
Morgan Stanley Institutional Fund, Inc.
Annual Report — December 31, 2013
Global Opportunity Portfolio
Statement of Assets and Liabilities | | December 31, 2013
(000) | |
Assets: | |
Investments in Securities of Unaffiliated Issuers, at Value (Cost $6,930) | | $ | 11,663 | | |
Investment in Security of Affiliated Issuer, at Value (Cost $88) | | | 88 | | |
Total Investments in Securities, at Value (Cost $7,018) | | | 11,751 | | |
Foreign Currency, at Value (Cost $—@) | | | — | @ | |
Cash | | | 2 | | |
Receivable for Investments Sold | | | 100 | | |
Due from Adviser | | | 41 | | |
Dividends Receivable | | | 3 | | |
Tax Reclaim Receivable | | | 2 | | |
Receivable from Affiliate | | | — | @ | |
Other Assets | | | 19 | | |
Total Assets | | | 11,918 | | |
Liabilities: | |
Payable for Professional Fees | | | 6 | | |
Payable for Transfer Agent Fees | | | 4 | | |
Payable for Transfer Agent Fees — Class I | | | — | @ | |
Payable for Transfer Agent Fees — Class A* | | | 2 | | |
Payable for Transfer Agent Fees — Class L | | | — | @ | |
Payable for Sub Transfer Agency Fees | | | 4 | | |
Payable for Sub Transfer Agency Fees — Class I | | | — | @ | |
Payable for Sub Transfer Agency Fees — Class A* | | | — | @ | |
Payable for Sub Transfer Agency Fees — Class L | | | — | @ | |
Deferred Capital Gain Country Tax | | | 4 | | |
Payable for Administration Fees | | | 1 | | |
Payable for Directors' Fees and Expenses | | | 1 | | |
Payable for Custodian Fees | | | — | @ | |
Payable for Shareholder Services Fees — Class A* | | | 1 | | |
Payable for Distribution and Shareholder Services Fees — Class L | | | — | @ | |
Other Liabilities | | | 7 | | |
Total Liabilities | | | 30 | | |
Net Assets | | $ | 11,888 | | |
Net Assets Consist Of: | |
Paid-in-Capital | | $ | 6,883 | | |
Accumulated Net Investment Loss | | | (— | @) | |
Accumulated Net Realized Gain | | | 276 | | |
Unrealized Appreciation (Depreciation) on: | |
Investments (Net of approximately $4 Deferred Capital Gain Country Tax) | | | 4,729 | | |
Foreign Currency Translations | | | — | @ | |
Net Assets | | $ | 11,888 | | |
The accompanying notes are an integral part of the financial statements.
8
Morgan Stanley Institutional Fund, Inc.
Annual Report — December 31, 2013
Global Opportunity Portfolio
Statement of Assets and Liabilities (cont'd) | | December 31, 2013
(000) | |
CLASS I: | |
Net Assets | | $ | 7,293 | | |
| Shares Outstanding $0.001 par value shares of beneficial interest (500,000,000 shares authorized) (not in 000's) | | | 534,483 | | |
Net Asset Value, Offering and Redemption Price Per Share | | $ | 13.65 | | |
CLASS A*: | |
Net Assets | | $ | 4,057 | | |
| Shares Outstanding $0.001 par value shares of beneficial interest (500,000,000 shares authorized) (not in 000's) | | | 300,973 | | |
Net Asset Value, Redemption Price Per Share | | $ | 13.48 | | |
Maximum Sales Load§§ | | | 5.25 | % | |
Maximum Sales Charge | | $ | 0.75 | | |
Maximum Offering Price Per Share | | $ | 14.23 | | |
CLASS L: | |
Net Assets | | $ | 527 | | |
| Shares Outstanding $0.001 par value shares of beneficial interest (500,000,000 shares authorized) (not in 000's) | | | 39,396 | | |
Net Asset Value, Offering and Redemption Price Per Share | | $ | 13.38 | | |
CLASS IS: | |
Net Assets | | $ | 11 | | |
| Shares Outstanding $0.001 par value shares of beneficial interest (500,000,000 shares authorized) (not in 000's) | | | 805 | | |
Net Asset Value, Offering and Redemption Price Per Share | | $ | 13.65 | | |
@ Amount is less than $500.
* Effective September 9, 2013, Class P and Class H shares were renamed Class A shares.
§§ Effective February 25, 2013, the Directors approved the imposition of a maximum initial sales charge of 5.25% on purchases of Class A shares of the Portfolio.
The accompanying notes are an integral part of the financial statements.
9
Morgan Stanley Institutional Fund, Inc.
Annual Report — December 31, 2013
Global Opportunity Portfolio
Statement of Operations | | Year Ended
December 31, 2013
(000) | |
Investment Income: | |
Dividends from Securities of Unaffiliated Issuers (Net of $7 of Foreign Taxes Withheld) | | $ | 102 | | |
Dividends from Security of Affiliated Issuer (Note G) | | | — | @ | |
Total Investment Income | | | 102 | | |
Expenses: | |
Professional Fees | | | 107 | | |
Advisory Fees (Note B) | | | 91 | | |
Registration Fees | | | 36 | | |
Transfer Agency Fees (Note E) | | | 25 | | |
Transfer Agency Fees — Class I (Note E) | | | — | @ | |
Transfer Agency Fees — Class A* (Note E) | | | 2 | | |
Transfer Agency Fees — Class L (Note E) | | | 1 | | |
Transfer Agency Fees — Class IS (Note E) | | | — | @ | |
Shareholder Reporting Fees | | | 22 | | |
Custodian Fees (Note F) | | | 17 | | |
Administration Fees (Note C) | | | 8 | | |
Sub Transfer Agency Fees | | | 7 | | |
Sub Transfer Agency Fees — Class I | | | — | @ | |
Sub Transfer Agency Fees — Class A* | | | — | @ | |
Sub Transfer Agency Fees — Class L | | | — | @ | |
Shareholder Services Fees — Class A* (Note D) | | | 9 | | |
Distribution and Shareholder Services Fees — Class L (Note D) | | | 3 | | |
Pricing Fees | | | 5 | | |
Directors' Fees and Expenses | | | 1 | | |
Other Expenses | | | 17 | | |
Total Expenses | | | 351 | | |
Expenses Reimbursed by Adviser (Note B) | | | (122 | ) | |
Waiver of Advisory Fees (Note B) | | | (91 | ) | |
Distribution Fees — Class L Shares Waived (Note D) | | | (2 | ) | |
Reimbursement of Class Specific Expenses — Class A* (Note B) | | | (1 | ) | |
Reimbursement of Class Specific Expenses — Class L (Note B) | | | (— | @) | |
Reimbursement of Class Specific Expenses — Class IS (Note B) | | | (— | @) | |
Rebate from Morgan Stanley Affiliate (Note G) | | | (— | @) | |
Net Expenses | | | 135 | | |
Net Investment Loss | | | (33 | ) | |
Realized Gain (Loss): | |
Investments Sold | | | 1,191 | | |
Foreign Currency Transactions | | | (1 | ) | |
Net Realized Gain | | | 1,190 | | |
Change in Unrealized Appreciation (Depreciation): | |
Investments (Net of increase in Deferred Capital Gain Country Tax of approximately $2) | | | 2,357 | | |
Foreign Currency Translations | | | — | @ | |
Net Change in Unrealized Appreciation (Depreciation) | | | 2,357 | | |
Net Realized Gain and Change in Unrealized Appreciation (Depreciation) | | | 3,547 | | |
Net Increase in Net Assets Resulting from Operations | | $ | 3,514 | | |
@ Amount is less than $500.
* Effective September 9, 2013, Class P and Class H shares were renamed Class A shares.
The accompanying notes are an integral part of the financial statements.
10
Morgan Stanley Institutional Fund, Inc.
Annual Report — December 31, 2013
Global Opportunity Portfolio
Statements of Changes in Net Assets | | Year Ended
December 31,
2013
(000) | | Year Ended
December 31,
2012
(000) | |
Increase (Decrease) in Net Assets: | |
Operations: | |
Net Investment Loss | | $ | (33 | ) | | $ | (4 | ) | |
Net Realized Gain | | | 1,190 | | | | 822 | | |
Net Change in Unrealized Appreciation (Depreciation) | | | 2,357 | | | | 300 | | |
Net Increase in Net Assets Resulting from Operations | | | 3,514 | | | | 1,118 | | |
Distributions from and/or in Excess of: | |
Class I: | |
Net Realized Gain | | | (730 | ) | | | (220 | ) | |
Class A*: | |
Net Realized Gain | | | (289 | ) | | | (4 | ) | |
Class H@@@: | |
Net Realized Gain | | | (98 | )** | | | (164 | ) | |
Class L: | |
Net Realized Gain | | | (51 | ) | | | (16 | ) | |
Class IS: | |
Net Realized Gain | | | (1 | )*** | | | — | | |
Total Distributions | | | (1,169 | ) | | | (404 | ) | |
Capital Share Transactions:(1) | |
Class I: | |
Subscribed | | | 717 | | | | 1,675 | | |
Distributions Reinvested | | | 93 | | | | 18 | | |
Redeemed | | | (60 | ) | | | (5,439 | ) | |
Class A*: | |
Subscribed | | | 237 | | | | 89 | | |
Distributions Reinvested | | | 288 | | | | 3 | | |
Conversion from Class H | | | 3,201 | | | | — | | |
Redeemed | | | (182 | ) | | | (15 | ) | |
Class H@@@: | |
Subscribed | | | 5 | ** | | | 45 | | |
Distributions Reinvested | | | 97 | ** | | | 161 | | |
Conversion to Class A | | | (3,201 | ) | | | — | | |
Redeemed | | | (1,340 | )** | | | (1,082 | ) | |
Class L: | |
Subscribed | | | 26 | | | | 112 | | |
Distributions Reinvested | | | 37 | | | | 12 | | |
Redeemed | | | (33 | ) | | | (256 | ) | |
Class IS: | |
Subscribed | | | 10 | *** | | | — | | |
Net Decrease in Net Assets Resulting from Capital Share Transactions | | | (105 | ) | | | (4,677 | ) | |
Total Increase (Decrease) in Net Assets | | | 2,240 | | | | (3,963 | ) | |
Net Assets: | |
Beginning of Period | | | 9,648 | | | | 13,611 | | |
End of Period (Including Accumulated Undistributed Net Investment Income (Loss) of $(—@) and $1) | | $ | 11,888 | | | $ | 9,648 | | |
The accompanying notes are an integral part of the financial statements.
11
Morgan Stanley Institutional Fund, Inc.
Annual Report — December 31, 2013
Global Opportunity Portfolio
Statements of Changes in Net Assets (cont'd) | | Year Ended
December 31,
2013
(000) | | Year Ended
December 31,
2012
(000) | |
(1) Capital Share Transactions: | |
Class I: | |
Shares Subscribed | | | 64 | | | | 153 | | |
Shares Issued on Distributions Reinvested | | | 7 | | | | 2 | | |
Shares Redeemed | | | (4 | ) | | | (504 | ) | |
Net Increase (Decrease) in Class I Shares Outstanding | | | 67 | | | | (349 | ) | |
Class A*: | |
Shares Subscribed | | | 18 | | | | 8 | | |
Shares Issued on Distributions Reinvested | | | 22 | | | | — | @@ | |
Conversion from Class H | | | 268 | | | | — | | |
Shares Redeemed | | | (15 | ) | | | (1 | ) | |
Net Increase in Class A* Shares Outstanding | | | 293 | | | | 7 | | |
Class H@@@: | |
Shares Subscribed | | | 1 | ** | | | 4 | | |
Shares Issued on Distributions Reinvested | | | 9 | ** | | | 15 | | |
Conversion to Class A | | | (268 | ) | | | — | | |
Shares Redeemed | | | (124 | )** | | | (100 | ) | |
Net Decrease in Class H Shares Outstanding | | | (382 | ) | | | (81 | ) | |
Class L: | |
Shares Subscribed | | | 2 | | | | 10 | | |
Shares Issued on Distributions Reinvested | | | 3 | | | | 1 | | |
Shares Redeemed | | | (3 | ) | | | (24 | ) | |
Net Increase (Decrease) in Class L Shares Outstanding | | | 2 | | | | (13 | ) | |
Class IS: | |
Shares Subscribed | | | 1 | *** | | | — | | |
Net Increase in Class IS Shares Outstanding | | | 1 | | | | — | | |
@@ Amount is less than 500 shares.
@@@ Effective September 9, 2013, Class H shares converted into Class A shares.
* Effective September 9, 2013, Class P shares were renamed Class A shares.
** For the period January 1, 2013 through September 6, 2013.
*** For the period September 13, 2013 through December 31, 2013.
The accompanying notes are an integral part of the financial statements.
12
Morgan Stanley Institutional Fund, Inc.
Annual Report — December 31, 2013
Financial Highlights
Global Opportunity Portfolio
| | | Class I** | |
| | | Year Ended December 31, | | Period from
April 1,
2010 to
December 31, | | Year Ended
March 31, | | Period from
May 30,
2008^ to
March 31, | |
Selected Per Share Data and Ratios | | 2013 | | 2012 | | 2011 | | 2010 | | 2010 | | 2009 | |
Net Asset Value, Beginning of Period | | $ | 10.84 | | | $ | 10.26 | | | $ | 11.58 | | | $ | 9.53 | | | $ | 5.08 | | | $ | 10.00 | | |
Income (Loss) from Investment Operations: | |
Net Investment Income (Loss)† | | | (0.02 | ) | | | 0.01 | | | | 0.02 | | | | (0.00 | )‡ | | | 0.01 | | | | (0.02 | ) | |
Net Realized and Unrealized Gain (Loss) | | | 4.21 | | | | 1.01 | | | | (0.57 | ) | | | 2.05 | | | | 4.47 | | | | (4.90 | ) | |
Total from Investment Operations | | | 4.19 | | | | 1.02 | | | | (0.55 | ) | | | 2.05 | | | | 4.48 | | | | (4.92 | ) | |
Distributions from and/or in Excess of: | |
Net Investment Income | | | — | | | | — | | | | — | | | | — | | | | (0.03 | ) | | | — | | |
Net Realized Gain | | | (1.38 | ) | | | (0.44 | ) | | | (0.77 | ) | | | — | | | | — | | | | — | | |
Total Distributions | | | (1.38 | ) | | | (0.44 | ) | | | (0.77 | ) | | | — | | | | (0.03 | ) | | | — | | |
Redemption Fees | | | — | | | | — | | | | 0.00 | ‡ | | | — | | | | — | | | | — | | |
Net Asset Value, End of Period | | $ | 13.65 | | | $ | 10.84 | | | $ | 10.26 | | | $ | 11.58 | | | $ | 9.53 | | | $ | 5.08 | | |
Total Return++ | | | 40.12 | % | | | 9.99 | % | | | (4.90 | )% | | | 21.51 | %# | | | 88.32 | % | | | (49.20 | )%# | |
Ratios and Supplemental Data: | |
Net Assets, End of Period (Millions) | | $ | 7.3 | | | $ | 5.1 | | | $ | 8.4 | | | $ | 5.4 | | | $ | 5.6 | | | $ | 2.3 | | |
Ratio of Expenses to Average Net Assets (1) | | | 1.24 | %+ | | | 1.25 | %+†† | | | 1.25 | %+†† | | | 1.25 | %+††* | | | 1.25 | % | | | 1.25 | %* | |
Ratio of Expenses to Average Net Assets Excluding
Non Operating Expenses | | | N/A | | | | N/A | | | | N/A | | | | 1.07 | %+††* | | | N/A | | | | N/A | | |
Ratio of Net Investment Income (Loss) to Average Net Assets (1) | | | (0.21 | )%+ | | | 0.06 | %+†† | | | 0.13 | %+†† | | | (0.01 | )%+††* | | | 0.09 | % | | | (0.34 | )%* | |
Ratio of Rebate from Morgan Stanley Affiliates to Average Net Assets | | | 0.00 | %§ | | | 0.00 | %††§ | | | 0.00 | %††§ | | | 0.01 | %††* | | | N/A | | | | N/A | | |
Portfolio Turnover Rate | | | 38 | % | | | 33 | % | | | 39 | % | | | 19 | %# | | | 17 | % | | | 32 | %# | |
(1) Supplemental Information on the Ratios to Average Net Assets: | |
Ratios Before Expense Limitation: | |
Expenses to Average Net Assets | | | 3.36 | % | | | 2.57 | %†† | | | 2.92 | %†† | | | 2.77 | %+††* | | | 4.51 | % | | | 12.66 | %* | |
Net Investment Loss to Average Net Assets | | | (2.33 | )% | | | (1.26 | )%†† | | | (1.54 | )%†† | | | (1.53 | )%+††* | | | (3.17 | )% | | | (11.75 | )%* | |
** On May 21, 2010, the Portfolio acquired substantially all of the assets and liabilities of the Van Kampen Global Growth Fund ("the Predecessor Fund"). Therefore, the per share data and ratios of Class I shares for the period ended December 31, 2010 and prior years reflect the historical per share data of Class I shares of the Predecessor Fund.
^ Commencement of Operations.
† Per share amount is based on average shares outstanding.
‡ Amount is less than $0.005 per share.
++ Calculated based on the net asset value as of the last business day of the period.
+ The Ratios of Expenses and Net Investment Income (Loss) reflect the rebate of certain Portfolio expenses in connection with the investments in Morgan Stanley affiliates during the period. The effect of the rebate on the ratios is disclosed in the above table as "Ratio of Rebate from Morgan Stanley Affiliates to Average Net Assets."
†† Reflects overall Portfolio ratios for investment income and non-class specific expenses.
§ Amount is less than 0.005%.
# Not Annualized.
* Annualized.
The accompanying notes are an integral part of the financial statements.
13
Morgan Stanley Institutional Fund, Inc.
Annual Report — December 31, 2013
Financial Highlights
Global Opportunity Portfolio
| | | Class A@ | |
| | | Year Ended December 31, | | Period from
May 21,
2010^ to
December 31, | |
Selected Per Share Data and Ratios | | 2013 | | 2012 | | 2011 | | 2010 | |
Net Asset Value, Beginning of Period | | $ | 10.75 | | | $ | 10.21 | | | $ | 11.56 | | | $ | 8.62 | | |
Income (Loss) from Investment Operations: | |
Net Investment Loss† | | | (0.15 | ) | | | (0.02 | ) | | | (0.01 | ) | | | (0.06 | ) | |
Net Realized and Unrealized Gain (Loss) | | | 4.26 | | | | 1.00 | | | | (0.57 | ) | | | 3.00 | | |
Total from Investment Operations | | | 4.11 | | | | 0.98 | | | | (0.58 | ) | | | 2.94 | | |
Distributions from and/or in Excess of: | |
Net Realized Gain | | | (1.38 | ) | | | (0.44 | ) | | | (0.77 | ) | | | — | | |
Redemption Fees | | | — | | | | — | | | | 0.00 | ‡ | | | — | | |
Net Asset Value, End of Period | | $ | 13.48 | | | $ | 10.75 | | | $ | 10.21 | | | $ | 11.56 | | |
Total Return++ | | | 39.80 | % | | | 9.65 | % | | | (5.16 | )% | | | 34.11 | %# | |
Ratios and Supplemental Data: | |
Net Assets, End of Period (Thousands) | | $ | 4,057 | | | $ | 87 | | | $ | 10 | | | $ | 11 | | |
Ratio of Expenses to Average Net Assets (1) | | | 1.59 | %+^^ | | | 1.50 | %+†† | | | 1.50 | %+†† | | | 1.53 | %+* | |
Ratio of Expenses to Average Net Assets Excluding Non Operating Expenses | | | N/A | | | | N/A | | | | N/A | | | | 0.87 | %+* | |
Ratio of Net Investment Loss to Average Net Assets (1) | | | (1.15 | )%+ | | | (0.19 | )%+†† | | | (0.12 | )%+†† | | | (0.89 | )%+* | |
Ratio of Rebate from Morgan Stanley Affiliates to Average Net Assets | | | 0.00 | %§ | | | 0.00 | %††§ | | | 0.00 | %††§ | | | 0.01 | %* | |
Portfolio Turnover Rate | | | 38 | % | | | 33 | % | | | 39 | % | | | 19 | %# | |
(1) Supplemental Information on the Ratios to Average Net Assets: | |
Ratios Before Expense Limitation: | |
Expenses to Average Net Assets | | | 3.93 | % | | | 2.82 | %†† | | | 3.17 | %†† | | | 4.52 | %+* | |
Net Investment Loss to Average Net Assets | | | (3.49 | )% | | | (1.51 | )%†† | | | (1.79 | )%†† | | | (3.88 | )%+* | |
@ Effective September 9, 2013, Class P and Class H shares were renamed Class A shares.
^ Commencement of Operations.
† Per share amount is based on average shares outstanding.
‡ Amount is less than $0.005 per share.
++ Calculated based on the net asset value which does not reflect sales charges, if applicable, as of the last business day of the period.
+ The Ratios of Expenses and Net Investment Loss reflect the rebate of certain Portfolio expenses in connection with the investments in Morgan Stanley affiliates during the period. The effect of the rebate on the ratios is disclosed in the above table as "Ratio of Rebate from Morgan Stanley Affiliates to Average Net Assets."
^^ Effective September 16, 2013, the Adviser has agreed to limit the ratio of expenses to average net assets to the maximum ratio of 1.60% for Class A shares. Prior to September 16, 2013, the maximum ratio was 1.50% for Class A shares.
†† Reflects overall Portfolio ratios for investment income and non-class specific expenses.
§ Amount is less than 0.005%.
# Not Annualized.
* Annualized.
The accompanying notes are an integral part of the financial statements.
14
Morgan Stanley Institutional Fund, Inc.
Annual Report — December 31, 2013
Financial Highlights
Global Opportunity Portfolio
| | | Class L** | |
| | | Year Ended December 31, | | Period from
April 1,
2010 to
December 31, | | Year Ended
March 31, | | Period from
May 30,
2008^ to
March 31, | |
Selected Per Share Data and Ratios | | 2013 | | 2012 | | 2011 | | 2010 | | 2010 | | 2009 | |
Net Asset Value, Beginning of Period | | $ | 10.68 | | | $ | 10.15 | | | $ | 11.50 | | | $ | 9.48 | | | $ | 5.08 | | | $ | 10.00 | | |
Income (Loss) from Investment Operations: | |
Net Investment Loss† | | | (0.07 | ) | | | (0.03 | ) | | | (0.02 | ) | | | (0.04 | ) | | | (0.09 | ) | | | (0.02 | ) | |
Net Realized and Unrealized Gain (Loss) | | | 4.15 | | | | 1.00 | | | | (0.56 | ) | | | 2.06 | | | | 4.51 | | | | (4.90 | ) | |
Total from Investment Operations | | | 4.08 | | | | 0.97 | | | | (0.58 | ) | | | 2.02 | | | | 4.42 | | | | (4.92 | ) | |
Distributions from and/or in Excess of: | |
Net Investment Income | | | — | | | | — | | | | — | | | | — | | | | (0.02 | ) | | | — | | |
Net Realized Gain | | | (1.38 | ) | | | (0.44 | ) | | | (0.77 | ) | | | — | | | | — | | | | — | | |
Total Distributions | | | (1.38 | ) | | | (0.44 | ) | | | (0.77 | ) | | | — | | | | (0.02 | ) | | | — | | |
Redemption Fees | | | — | | | | — | | | | 0.00 | ‡ | | | — | | | | — | | | | — | | |
Net Asset Value, End of Period | | $ | 13.38 | | | $ | 10.68 | | | $ | 10.15 | | | $ | 11.50 | | | $ | 9.48 | | | $ | 5.08 | | |
Total Return++ | | | 39.79 | % | | | 9.61 | % | | | (5.19 | )% | | | 21.31 | %# | | | 87.08 | % | | | (49.20 | )%# | |
Ratios and Supplemental Data: | |
Net Assets, End of Period (Millions) | | $ | 0.5 | | | $ | 0.4 | | | $ | 0.5 | | | $ | 0.7 | | | $ | 1.4 | | | $ | 0.1 | | |
Ratio of Expenses to Average Net Assets (1) | | | 1.58 | %+^^ | | | 1.55 | %+†† | | | 1.55 | %+†† | | | 2.09 | %+††* | | | 2.11 | % | | | 1.31 | %* | |
Ratio of Expenses to Average Net Assets Excluding
Non Operating Expenses | | | N/A | | | | N/A | | | | N/A | | | | 1.91 | %+††* | | | N/A | | | | N/A | | |
Ratio of Net Investment Loss to Average Net Assets (1) | | | (0.57 | )%+ | | | (0.24 | )%+†† | | | (0.17 | )%+†† | | | (0.85 | )%+††* | | | (1.03 | )% | | | (0.39 | )%* | |
Ratio of Rebate from Morgan Stanley Affiliates to Average
Net Assets | | | 0.00 | %§ | | | 0.00 | %††§ | | | 0.00 | %††§ | | | 0.01 | %††* | | | N/A | | | | N/A | | |
Portfolio Turnover Rate | | | 38 | % | | | 33 | % | | | 39 | % | | | 19 | %# | | | 17 | % | | | 32 | %# | |
(1) Supplemental Information on the Ratios to Average Net Assets: | |
Ratios Before Expense Limitation: | |
Expenses to Average Net Assets | | | 4.23 | % | | | 3.32 | %†† | | | 3.67 | %†† | | | 3.61 | %+††* | | | 5.37 | % | | | 12.85 | %* | |
Net Investment Loss to Average Net Assets | | | (3.22 | )% | | | (2.01 | )%†† | | | (2.29 | )%†† | | | (2.37 | )%+††* | | | (4.29 | )% | | | (11.93 | )%* | |
** On May 21, 2010, the Portfolio acquired substantially all of the assets and liabilities of the Van Kampen Global Growth Fund ("the Predecessor Fund"). Therefore, the per share data and ratios of Class L shares for the period ended December 31, 2010 and prior years reflect the historical per share data of Class C shares of the Predecessor Fund.
^ Commencement of Operations.
† Per share amount is based on average shares outstanding.
‡ Amount is less than $0.005 per share.
++ Calculated based on the net asset value as of the last business day of the period.
+ The Ratios of Expenses and Net Investment Loss reflect the rebate of certain Portfolio expenses in connection with the investments in Morgan Stanley affiliates during the period. The effect of the rebate on the ratios is disclosed in the above table as "Ratio of Rebate from Morgan Stanley Affiliates to Average Net Assets."
^^ Effective September 16, 2013, the Adviser has agreed to limit the ratio of expenses to average net assets to the maximum ratio of 1.65% for Class L shares. Prior to September 16, 2013, the maximum ratio was 1.55% for Class L shares.
†† Reflects overall Portfolio ratios for investment income and non-class specific expenses.
§ Amount is less than 0.005%.
# Not Annualized.
* Annualized.
The accompanying notes are an integral part of the financial statements.
15
Morgan Stanley Institutional Fund, Inc.
Annual Report — December 31, 2013
Financial Highlights
Global Opportunity Portfolio
| | | Class IS | |
Selected Per Share Data and Ratios | | Period from
September 13, 2013^ to
December 31, 2013 | |
Net Asset Value, Beginning of Period | | $ | 12.43 | | |
Income (Loss) from Investment Operations: | |
Net Investment Loss† | | | (0.03 | ) | |
Net Realized and Unrealized Gain | | | 2.27 | | |
Total from Investment Operations | | | 2.24 | | |
Distributions from and/or in Excess of: | |
Net Realized Gain | | | (1.02 | ) | |
Net Asset Value, End of Period | | $ | 13.65 | | |
Total Return++ | | | 18.35 | %# | |
Ratios and Supplemental Data: | |
Net Assets, End of Period (Thousands) | | $ | 11 | | |
Ratio of Expenses to Average Net Assets (1) | | | 1.18 | %+^^* | |
Ratio of Net Investment Loss to Average Net Assets (1) | | | (0.74 | )%+* | |
Ratio of Rebate from Morgan Stanley Affiliates to Average Net Assets | | | 0.00 | %§* | |
Portfolio Turnover Rate | | | 38 | %# | |
(1) Supplemental Information on the Ratios to Average Net Assets: | |
Ratios Before Expense Limitation | |
Expenses to Average Net Assets | | | 8.44 | %* | |
Net Investment Loss to Average Net Assets | | | (8.00 | )%* | |
^ Commencement of Operations.
† Per share amount is based on average shares outstanding.
++ Calculated based on the net asset value as of the last business day of the period.
+ The Ratios of Expenses and Net Investment Loss reflect the rebate of certain Portfolio expenses in connection with the investments in Morgan Stanley affiliates during the period. The effect of the rebate on the ratios is disclosed in the above table as "Ratio of Rebate from Morgan Stanley Affiliates to Average Net Assets."
^^ Effective September 16, 2013, the Adviser has agreed to limit the ratio of expenses to average net assets to the maximum ratio of 1.18% for Class IS shares.
§ Amount is less than 0.005%.
# Not Annualized.
* Annualized.
The accompanying notes are an integral part of the financial statements.
16
Morgan Stanley Institutional Fund, Inc.
Annual Report — December 31, 2013
Notes to Financial Statements
Morgan Stanley Institutional Fund, Inc. (the "Fund") is registered under the Investment Company Act of 1940, as amended (the "Act"), as an open-end management investment company. The Fund is comprised of twenty-seven separate, active, diversified and non-diversified portfolios (individually referred to as a "Portfolio", collectively as the "Portfolios").
The accompanying financial statements relate to the Global Opportunity Portfolio. The Portfolio seeks long-term capital appreciation by investing primarily in established and emerging franchise companies located throughout the world, with capitalizations within the range of companies included in the MSCI All Country World Index. The Portfolio offers four classes of shares — Class I, Class A, Class L and Class IS.
On September 16, 2013, the Portfolio commenced offering Class IS shares. Effective September 9, 2013, Class P and Class H shares were renamed Class A shares.
A. Significant Accounting Policies: The following significant accounting policies are in conformity with U.S. generally accepted accounting principles ("GAAP"). Such policies are consistently followed by the Fund in the preparation of its financial statements. GAAP may require management to make estimates and assumptions that affect the reported amounts and disclosures in the financial statements. Actual results may differ from those estimates.
1. Security Valuation: (1) An equity portfolio security listed or traded on an exchange is valued at its latest reported sales price (or at the exchange official closing price if such exchange reports an official closing price), if there were no sales on a given day, the security is valued at the mean between the last reported bid and asked prices; (2) all other equity portfolio securities for which over-the-counter market quotations are readily available are valued at its latest reported sales price. In cases where a security is traded on more than one exchange, the security is valued on the exchange designated as the primary market; (3) listed options are valued at the last reported sales price on the exchange on which they are listed (or at the exchange official closing price if such exchange reports an official closing price). If an official closing price or last reported sale price is unavailable, the listed option should be fair valued at the mean between its latest bid and ask prices. Unlisted options are valued by an outside pricing service approved by the Fund's Board of Directors (the "Directors") or quotes from a broker or dealer; (4) when market quotations are not readily available, including circumstances under which
Morgan Stanley Investment Management Inc. (the "Adviser") determines that the closing price, last sale price or the mean between the last reported bid and asked prices are not reflective of a security's market value, portfolio securities are valued at their fair value as determined in good faith under procedures established by and under the general supervision of the Directors. Occasionally, developments affecting the closing prices of securities and other assets may occur between the times at which valuations of such securities are determined (that is, close of the foreign market on which the securities trade) and the close of business of the New York Stock Exchange ("NYSE"). If developments occur during such periods that are expected to materially affect the value of such securities, such valuations may be adjusted to reflect the estimated fair value of such securities as of the close of the NYSE, as determined in good faith by the Directors or by the Adviser using a pricing service and/or procedures approved by the Directors; (5) quotations of foreign portfolio securities, other assets and liabilities and forward contracts stated in foreign currency are translated into U.S. dollar equivalents at the prevailing market rates prior to the close of the NYSE; (6) investments in mutual funds, including the Morgan Stanley Institutional Liquidity Funds, are valued at the net asset value as of the close of each business day; and (7) short-term debt securities with remaining maturities of 60 days or less at the time of purchase may be valued at amortized cost, unless the Adviser determines such valuation does not reflect the securities' market value, in which case these securities will be valued at their fair market value determined by the Adviser.
Under procedures approved by the Directors, the Fund's Adviser has formed a Valuation Committee. The Valuation Committee provides administration and oversight of the Fund's valuation policies and procedures, which are reviewed at least annually by the Directors. These procedures allow the Fund to utilize independent pricing services, quotations from securities and financial instrument dealers, and other market sources to determine fair value.
The Fund has procedures to determine the fair value of securities and other financial instruments for which market prices are not readily available. Under these procedures, the Valuation Committee convenes on a regular and ad hoc basis to review such securities and considers a number of factors, including valuation methodologies
17
Morgan Stanley Institutional Fund, Inc.
Annual Report — December 31, 2013
Notes to Financial Statements (cont'd)
and significant unobservable valuation inputs, when arriving at fair value. The Valuation Committee may employ a market-based approach which may use related or comparable assets or liabilities, recent transactions, market multiples, book values, and other relevant information for the investment to determine the fair value of the investment. An income-based valuation approach may also be used in which the anticipated future cash flows of the investment are discounted to calculate fair value. Discounts may also be applied due to the nature or duration of any restrictions on the disposition of the investments. Due to the inherent uncertainty of valuations of such investments, the fair values may differ significantly from the values that would have been used had an active market existed. The Valuation Committee employs various methods for calibrating these valuation approaches including a regular review of valuation methodologies, key inputs and assumptions, transactional back-testing or disposition analysis, and reviews of any related market activity.
2. Fair Value Measurement: Financial Accounting Standards Board ("FASB") Accounting Standards CodificationTM ("ASC") 820, "Fair Value Measurements and Disclosures" ("ASC 820"), defines fair value as the value that the Fund would receive to sell an investment or pay to transfer a liability in a timely transaction with an independent buyer in the principal market, or in the absence of a principal market the most advantageous market for the investment or liability. ASC 820 establishes a three-tier hierarchy to distinguish between (1) inputs that reflect the assumptions market participants would use in valuing an asset or liability developed based on market data obtained from sources independent of the reporting entity (observable inputs) and (2) inputs that reflect the reporting entity's own assumptions about the assumptions market participants would use in valuing an asset or liability developed based on the best information available in the circumstances (unobservable inputs) and to establish classification of fair value measurements for disclosure purposes. Various inputs are used in determining the value of the Fund's investments. The inputs are summarized in the three broad levels listed below.
• Level 1 – unadjusted quoted prices in active markets for identical investments
• Level 2 – other significant observable inputs (including quoted prices for similar investments, interest rates, prepayment speeds, credit risk, etc.)
• Level 3 – significant unobservable inputs including the Fund's own assumptions in determining the fair value of investments. Factors considered in making this determination may include, but are not limited to, information obtained by contacting the issuer, analysts, or the appropriate stock exchange (for exchange-traded securities), analysis of the issuer's financial statements or other available documents and, if necessary, available information concerning other securities in similar circumstances
The inputs or methodology used for valuing securities are not necessarily an indication of the risk associated with investing in those securities and the determination of the significance of a particular input to the fair value measurement in its entirety requires judgment and considers factors specific to each security.
The following is a summary of the inputs used to value the Portfolio's investments as of December 31, 2013.
Investment Type | | Level 1
Unadjusted
quoted
prices
(000) | | Level 2
Other
significant
observable
inputs
(000) | | Level 3
Significant
unobservable
inputs
(000) | | Total
(000) | |
Assets: | |
Common Stocks | |
Beverages | | $ | 162 | | | $ | — | | | $ | — | | | $ | 162 | | |
Capital Markets | | | 302 | | | | — | | | | — | | | | 302 | | |
Chemicals | | | 198 | | | | — | | | | — | | | | 198 | | |
Diversified Consumer
Services | | | 899 | | | | — | | | | — | | | | 899 | | |
Diversified Financial
Services | | | 166 | | | | — | | | | — | | | | 166 | | |
Electric Utilities | | | 187 | | | | — | | | | — | † | | | 187 | | |
Food Products | | | 190 | | | | — | | | | — | | | | 190 | | |
Hotels, Restaurants &
Leisure | | | 983 | | | | — | | | | — | | | | 983 | | |
Information Technology
Services | | | 1,508 | | | | — | | | | — | | | | 1,508 | | |
Insurance | | | 200 | | | | — | | | | — | | | | 200 | | |
Internet & Catalog Retail | | | 1,198 | | | | — | | | | — | | | | 1,198 | | |
Internet Software &
Services | | | 3,043 | | | | — | | | | — | | | | 3,043 | | |
Marine | | | 160 | | | | — | | | | — | | | | 160 | | |
Media | | | 373 | | | | — | | | | — | | | | 373 | | |
Professional Services | | | 170 | | | | — | | | | — | | | | 170 | | |
Real Estate Management &
Development | | | 188 | | | | — | | | | — | | | | 188 | | |
Road & Rail | | | 544 | | | | — | | | | — | | | | 544 | | |
Textiles, Apparel &
Luxury Goods | | | 487 | | | | — | | | | — | | | | 487 | | |
18
Morgan Stanley Institutional Fund, Inc.
Annual Report — December 31, 2013
Notes to Financial Statements (cont'd)
Investment Type | | Level 1
Unadjusted
quoted
prices
(000) | | Level 2
Other
significant
observable
inputs
(000) | | Level 3
Significant
unobservable
inputs
(000) | | Total
(000) | |
Common Stocks (cont'd) | |
Transportation
Infrastructure | | $ | 225 | | | $ | — | | | $ | — | | | $ | 225 | | |
Total Common Stocks | | | 11,183 | | | | — | | | | — | † | | | 11,183 | | |
Preferred Stock | | | — | | | | — | | | | 53 | | | | 53 | | |
Convertible Preferred
Stock | | | — | | | | — | | | | — | @ | | | — | @ | |
Participation Notes | | | — | | | | 421 | | | | — | | | | 421 | | |
Call Options Purchased | | | — | | | | 6 | | | | — | | | | 6 | | |
Short-Term Investment —
Investment Company | | | 88 | | | | — | | | | — | | | | 88 | | |
Total Assets | | $ | 11,271 | | | $ | 427 | | | $ | 53 | † | | $ | 11,751 | | |
@ Value is less than $500.
† Includes one security which is valued at zero.
Transfers between investment levels may occur as the markets fluctuate and/or the availability of data used in an investment's valuation changes. The Portfolio recognizes transfers between the levels as of the end of the period. As of December 31, 2013, securities with a total value of approximately $2,274,000 transferred from Level 2 to Level 1. At December 31, 2012, the fair value of certain securities were adjusted due to developments which occurred
between the time of the close of the foreign markets on which they trade and the close of business on the NYSE which resulted in their Level 2 classification.
Following is a reconciliation of investments in which significant unobservable inputs (Level 3) were used in determining fair value.
| | | Common
Stock
(000) | | Convertible
Preferred
Stock
(000) | | Preferred
Stock
(000) | |
Beginning Balance | | $ | — | † | | $ | 9 | | | $ | — | | |
Purchases | | | — | | | | — | | | | 51 | | |
Sales | | | — | | | | — | | | | — | | |
Amortization of discount | | | — | | | | — | | | | — | | |
Transfers in | | | — | | | | — | | | | — | | |
Transfers out | | | — | | | | — | | | | — | | |
Change in unrealized appreciation/
depreciation | | | — | | | | 69 | | | | 2 | | |
Realized gains (losses) | | | — | | | | (78 | ) | | | — | | |
Ending Balance | | $ | — | † | | $ | — | @ | | $ | 53 | | |
Net change in unrealized appreciation/
depreciation from investments still
held as of December 31, 2013 | | $ | — | | | $ | — | @ | | $ | 2 | | |
† Includes one security which is valued at zero.
@ Value is less than $500.
The following table presents additional information about valuation techniques and inputs used for investments that are measured at fair value and categorized within Level 3 as of December 31, 2013.
| | | Fair Value at
December 31, 2013
(000) | | Valuation
Technique | | Unobservable
Input | | Range | | Weighted
Average | | Impact to
Valuation from an
Increase in Input | |
Internet & Catalog Retail | |
Preferred Stock | | $ | 53 | | | Market Transaction
Method | | Precedent Transaction
of Preferred Stock | | $ | 22.947 | | | $ | 22.947 | | | $ | 22.947 | | | Increase | |
| | | | | Discounted Cash Flow | | Weighted Average
Cost of Capital | | | 17.0 | % | | | 19.0 | % | | | 18.0 | % | | Decrease | |
| | | | | | | Perpetual Growth Rate | | | 3.5 | % | | | 4.5 | % | | | 4.0 | % | | Increase | |
| | | | | Market Comparable
Companies | | Enterprise Value/
Revenue | | | 3.1 | x | | | 7.5 | x | | | 5.7 | x | | Increase | |
| | | | | | | Discount for Lack
of Marketability | | | 15.0 | % | | | 15.0 | % | | | 15.0 | % | | Decrease | |
3. Foreign Currency Translation and Foreign Investments: The books and records of the Portfolio are maintained in U.S. dollars. Foreign currency amounts are translated into U.S. dollars as follows:
– investments, other assets and liabilities at the prevailing rate of exchange on the valuation date;
– investment transactions and investment income at the prevailing rates of exchange on the dates of such transactions.
Although the net assets of the Portfolio are presented at the foreign exchange rates and market values at the close of the period, the Portfolio does not isolate that portion of the results of operations arising as a result of changes in the foreign exchange rates from the fluctuations arising from changes in the market prices of securities held at period end. Similarly, the Portfolio does not isolate the effect of changes in foreign exchange rates from the fluctuations arising from changes in the market prices of securities sold during the period. Accordingly, realized
19
Morgan Stanley Institutional Fund, Inc.
Annual Report — December 31, 2013
Notes to Financial Statements (cont'd)
and unrealized foreign currency gains (losses) on investments in securities are included in the reported net realized and unrealized gains (losses) on investment transactions and balances. However, pursuant to U.S. Federal income tax regulations, gains and losses from certain foreign currency transactions and the foreign currency portion of gains and losses realized on sales and maturities of foreign denominated debt securities are treated as ordinary income for U.S. Federal income tax purposes.
Net realized gains (losses) on foreign currency transactions represent net foreign exchange gains (losses) from foreign currency forward exchange contracts, disposition of foreign currencies, currency gains (losses) realized between the trade and settlement dates on securities transactions, and the difference between the amount of investment income and foreign withholding taxes recorded on the Portfolio's books and the U.S. dollar equivalent amounts actually received or paid. Net unrealized currency gains (losses) from valuing foreign currency denominated assets and liabilities at period end exchange rates are reflected as a component of unrealized appreciation (depreciation) on the Statement of Assets and Liabilities. The change in unrealized currency gains (losses) on foreign currency translations for the period is reflected in the Statement of Operations.
Foreign security and currency transactions may involve certain considerations and risks not typically associated with those of U.S. dollar denominated transactions as a result of, among other factors, fluctuations of exchange rates in relation to the U.S. dollar, the possibility of lower levels of governmental supervision and regulation of foreign securities markets and the possibility of political or economic instability.
The net assets of the Portfolio include foreign denominated securities and currency. Changes in currency exchange rates will affect the U.S. Dollar value of and investment income from such securities.
Governmental approval for foreign investments may be required in advance of making an investment under certain circumstances in some countries, and the extent of foreign investments in domestic companies may be subject to limitation in other countries. Foreign ownership limitations also may be imposed by the charters of individual companies to prevent, among other concerns,
violations of foreign investment limitations. As a result, an additional class of shares (identified as "Foreign" in the Portfolio of Investments) may be created and offered for investment. The "local" and "foreign shares" market values may differ. In the absence of trading of the foreign shares in such markets, the Portfolio values the foreign shares at the closing exchange price of the local shares.
4. Derivatives: The Portfolio may, but is not required to, use derivative instruments for a variety of purposes, including hedging, risk management, portfolio management or to earn income. Derivatives are financial instruments whose value is based, in part, on the value of an underlying asset, interest rate, index or financial instrument. Prevailing interest rates and volatility levels, among other things, also affect the value of derivative instruments. A derivative instrument often has risks similar to its underlying asset and may have additional risks, including imperfect correlation between the value of the derivative and the underlying asset, risks of default by the counterparty to certain transactions, magnification of losses incurred due to changes in the market value of the securities, instruments, indices or interest rates to which they relate, and risks that the transactions may not be liquid. The use of derivatives involves risks that are different from, and possibly greater than, the risks associated with other portfolio investments. Derivatives may involve the use of highly specialized instruments that require investment techniques and risk analyses different from those associated with other portfolio investments. All of the Portfolio's holdings, including derivative instruments, are marked-to-market each day with the change in value reflected in unrealized appreciation (depreciation). Upon disposition, a realized gain or loss is recognized.
Certain derivative transactions may give rise to a form of leverage. Leverage magnifies the potential for gain and the risk of loss. Leverage associated with derivative transactions may cause the Portfolio to liquidate portfolio positions when it may not be advantageous to do so to satisfy its obligations or to meet earmarking or segregation requirements, pursuant to applicable Securities and Exchange Commission rules and regulations, or may cause the Portfolio to be more volatile than if the Portfolio had not been leveraged. Although the Adviser seeks to use derivatives to further the Portfolio's investment objectives, there is no assurance that the use of derivatives will achieve this result.
20
Morgan Stanley Institutional Fund, Inc.
Annual Report — December 31, 2013
Notes to Financial Statements (cont'd)
Following is a description of the derivative instruments and techniques that the Portfolio used during the period and their associated risks:
Options: In respect to options, the Portfolio is subject to equity risk, interest rate risk and foreign currency exchange risk in the normal course of pursuing its investment objectives. If the Portfolio buys an option, it buys a legal contract giving it the right to buy or sell a specific amount of the underlying instrument or futures contract on the underlying instrument such a as security, currency or index, at an agreed upon price typically in exchange for a premium paid by the Portfolio. The Portfolio may purchase put and call options. Purchasing call options tends to increase the Portfolio's exposure to the underlying (or similar) instrument. Purchasing put options tends to decrease the Portfolio's exposure to the underlying (or similar) instrument. When entering into purchased option contracts, the Portfolio bears the risk of interest or exchange rates or securities prices moving unexpectedly, in which case, the Portfolio may not achieve the anticipated benefits of the purchased option contracts; however the risk of loss is limited to the premium paid. Purchased options are reported as part of "Total Investments" on the Statement of Assets and Liabilities. Premium paid for purchasing options which expired are treated as realized losses. If the Portfolio sells an option, it sells to another party the right to buy from or sell to the Portfolio a specific amount of the underlying instrument or futures contract on the underlying instrument at an agreed upon price typically in exchange for a premium received by the Portfolio. There is the risk the Portfolio may not be able to enter into a closing transaction because of an illiquid market. A decision as to whether, when and how to use options involves the exercise of skill and judgment and even a well conceived option transaction may be unsuccessful because of market behavior or unexpected events. The prices of options can be highly volatile and the use of options can lower total returns.
FASB ASC 815, "Derivatives and Hedging: Overall" ("ASC 815"), is intended to improve financial reporting about derivative instruments by requiring enhanced disclosures to enable investors to better understand how and why the Portfolio uses derivative instruments, how these derivative instruments are accounted for and their
effects on the Portfolio's financial position and results of operations.
The following table sets forth the fair value of the Portfolio's derivative contracts by primary risk exposure as of December 31, 2013.
| | | Asset Derivatives
Statement of Assets and
Liabilities Location | | Primary Risk
Exposure | | Value
(000) | |
Options Purchased | | Investments, at Value
(Options Purchased) | | Currency Risk | | $ | 6 | + | |
+ Amounts are included in Investments in the Statement of Assets and Liabilities.
The following table sets forth by primary risk exposure the Portfolio's change in unrealized appreciation (depreciation) by type of derivative contract for the year ended December 31, 2013 in accordance with ASC 815.
Change in Unrealized Appreciation (Depreciation) | |
Primary Risk Exposure | | Derivative Type | | Value
(000) | |
Currency Risk
| | Investments
(Options Purchased) | | $ | (6 | )++ | |
++ Amounts are included in Investments in the Statement of Operations.
At December 31, 2013, the Portfolio's derivative assets and liabilities are as follows:
Gross Amounts of Assets and Liabilities Presented in the
Statement of Assets and Liabilities | |
Derivative | | Assets(a)
(000) | | Liabilities(a)
(000) | |
Options Purchased | | $ | 6 | | | | — | | |
(a) Absent an event of default or early termination, OTC derivative assets and liabilities are presented gross and not offset in the Statement of Assets and Liabilities.
The following table presents derivatives financial instruments that are subject to enforceable netting arrangements as of December 31, 2013.
Gross Amounts Not Offset in the Statement of Assets and Liabilities | |
Counterparty | | Gross Asset
Derivatives
Presented in Statement of
Assets and Liabilities
(000) | | Financial
Instrument
(000) | | Collateral
Received
(000) | | Net
Amount
(not less
than 0)
(000) | |
Royal Bank of Scotland | | $ | 6 | | | | — | | | | — | | | $ | 6 | | |
For the year ended December 31, 2013, the approximate average monthly amount outstanding for each derivative type is as follows:
Options Purchased:
| Average monthly notional amount | | | 306,000 | | |
5. Structured Investments: The Portfolio invested a portion of its assets in structured investments. A structured investment is a derivative security designed to offer a return linked to a particular underlying security, currency, commodity or market. Structured investments may come in
21
Morgan Stanley Institutional Fund, Inc.
Annual Report — December 31, 2013
Notes to Financial Statements (cont'd)
various forms including notes (such as exchange-traded notes), warrants and options to purchase securities. The Portfolio will typically use structured investments to gain exposure to a permitted underlying security, currency, commodity or market when direct access to a market is limited or inefficient from a tax or cost standpoint. Investments in structured investments involve risks including issuer risk, counterparty risk and market risk. Holders of structured investments bear risks of the underlying investment and are subject to issuer or counterparty risk because the Portfolio is relying on the creditworthiness of such issuer or counterparty and has no rights with respect to the underlying investment. Certain structured investments may be thinly traded or have a limited trading market and may have the effect of increasing the Portfolio's illiquidity to the extent that the Portfolio, at a particular time, may be unable to find qualified buyers for these securities.
6. Restricted Securities: The Portfolio invests in unregistered or otherwise restricted securities. The term "restricted securities" refers to securities that are unregistered or are held by control persons of the issuer and securities that are subject to contractual restrictions on their resale. As a result, restricted securities may be more difficult to value and the Portfolio may have difficulty disposing of such assets either in a timely manner or for a reasonable price. In order to dispose of an unregistered security, the Portfolio, where it has contractual rights to do so, may have to cause such security to be registered. A considerable period may elapse between the time the decision is made to sell the security and the time the security is registered so that the Portfolio could sell it. Contractual restrictions on the resale of securities vary in length and scope and are generally the result of a negotiation between the issuer and acquirer of the securities. The Portfolio would, in either case, bear market risks during that period. Restricted Securities are identified in the Portfolio of Investments.
7. Indemnifications: The Fund enters into contracts that contain a variety of indemnifications. The Fund's maximum exposure under these arrangements is unknown. However, the Fund has not had prior claims or losses pursuant to these contracts and expects the risk of loss to be remote.
8. Dividends and Distributions to Shareholders: Dividend income and distributions to shareholders are recorded on the ex-dividend date. Dividends from net
investment income, if any, are declared and paid semiannually. Net realized capital gains, if any, are distributed at least annually.
9. Security Transactions, Income and Expenses: Security transactions are accounted for on the trade date (date the order to buy or sell is executed). Realized gains and losses on the sale of investment securities are determined on the specific identified cost method. Dividend income and other distributions are recorded on the ex-dividend date (except for certain foreign dividends which may be recorded as soon as the Portfolio is informed of such dividends) net of applicable withholding taxes. Interest income is recognized on the accrual basis except where collection is in doubt. Discounts are accreted and premiums are amortized over the life of the respective securities. Most expenses of the Fund can be directly attributed to a particular Portfolio. Expenses which cannot be directly attributed are apportioned among the Portfolios based upon relative net assets or other appropriate methods. Income, expenses (other than class specific expenses — distribution, transfer agency and sub transfer agency fees) and realized and unrealized gains or losses are allocated to each class of shares based upon their relative net assets.
B. Advisory Fees: The Adviser, a wholly-owned subsidiary of Morgan Stanley, provides the Portfolio with advisory services under the terms of an Investment Advisory Agreement, paid quarterly, at the annual rate based on the average daily net assets as follows:
First $750
million | | Next $750
million | | Over $1.5
billion | |
| | 0.90 | % | | | 0.85 | % | | | 0.80 | % | |
For the year ended December 31, 2013, the advisory fee rate (net of waivers/rebate/reimbursement) was equivalent to an annual effective rate of 0.00% of the Portfolio's daily net assets.
The Adviser has agreed to reduce its advisory fee and/or reimburse the Portfolio so that total annual portfolio operating expenses, excluding certain investment related expenses, taxes, interest and other extraordinary expenses (including litigation), will not exceed 1.25% for Class I shares, 1.50% for Class A shares and 1.55% for Class L shares. Effective September 16, 2013, the Adviser has agreed to limit the ratio of expenses to average net assets to the maximum ratio of 1.60%, 1.65% and 1.18% for Class A, Class L and Class IS shares, respectively. The fee waivers and/or expense reimbursements will continue for at least one year or until such time that the Directors act to
22
Morgan Stanley Institutional Fund, Inc.
Annual Report — December 31, 2013
Notes to Financial Statements (cont'd)
discontinue all or a portion of such waivers and/or reimbursements when it deems such action is appropriate. For the year ended December 31, 2013, approximately $91,000 of advisory fees were waived and approximately $123,000 of other expenses were reimbursed by the Adviser pursuant to this arrangement.
C. Administration Fees: The Adviser also serves as Administrator to the Fund and provides administrative services pursuant to an Administration Agreement for an annual fee, accrued daily and paid monthly, of 0.08% of the Portfolio's average daily net assets. Under a Sub-Administration Agreement between the Administrator and State Street Bank and Trust Company ("State Street"), State Street provides certain administrative services to the Fund. For such services, the Administrator pays State Street a portion of the fee the Administrator receives from the Portfolio.
D. Distribution and Shareholder Services Fees: Morgan Stanley Distribution, Inc. ("MSDI" or the "Distributor"), a wholly-owned subsidiary of the Adviser, and an indirect subsidiary of Morgan Stanley, serves as the Fund's Distributor of Portfolio shares pursuant to a Distribution Agreement. The Fund has adopted a Shareholder Services Plan with respect to Class A shares pursuant to Rule 12b-1 under the Act. Under the Shareholder Services Plan, the Portfolio pays the Distributor a shareholder services fee, accrued daily and paid monthly, at an annual rate of 0.25% of the Portfolio's average daily net assets attributable to Class A shares.
The Fund has adopted a Distribution and Shareholder Services Plan with respect to Class L shares pursuant to Rule 12b-1 under the Act. Under the Distribution and Shareholder Services Plan, the Portfolio pays the Distributor a distribution fee, accrued daily and paid monthly, at an annual rate of 0.50% and a shareholder services fee, accrued daily and paid monthly, at an annual rate of 0.25% of the Portfolio's average daily net assets attributable to Class L shares. The Distributor has agreed to waive for at least one year the 12b-1 fees on Class L shares of the Portfolio to the extent it exceeds 0.30% of the average daily net assets of such shares on an annualized basis. For the year ended December 31, 2013, this waiver amounted to approximately $2,000.
The distribution and shareholder services fees are used to support the expenses associated with servicing and maintaining accounts. The Distributor may compensate other parties for providing shareholder support services to investors who purchase Class A and Class L shares.
E. Dividend Disbursing and Transfer Agent: The Fund's dividend disbursing and transfer agent was Morgan Stanley Services Company Inc. ("Morgan Stanley Services"). Pursuant to a Transfer Agency Agreement, the Fund paid Morgan Stanley Services a fee based on the number of classes, accounts and transactions relating to the Portfolios of the Fund. Effective July 1, 2013, the Directors approved changing the transfer agent to Boston Financial Data Services, Inc.
F. Custodian Fees: State Street (the "Custodian") serves as Custodian for the Fund in accordance with a Custodian Agreement. The Custodian holds cash, securities, and other assets of the Fund as required by the Act. Custody fees are payable monthly based on assets held in custody, investment purchases and sales activity and account maintenance fees, plus reimbursement for certain out-of-pocket expenses.
G. Security Transactions and Transactions with Affiliates: For the year ended December 31, 2013, purchases and sales of investment securities for the Portfolio, other than long-term U.S. Government securities and short-term investments, were approximately $3,752,000 and $5,283,000, respectively. There were no purchases and sales of long-term U.S. Government securities for the year ended December 31, 2013.
The Portfolio invests in the Institutional Class of the Morgan Stanley Institutional Liquidity Funds — Money Market Portfolio (the "Liquidity Funds"), an open-end management investment company managed by the Adviser. Advisory fees paid by the Portfolio are reduced by an amount equal to its pro-rata share of the advisory and administration fees paid by the Portfolio due to its investment in the Liquidity Funds. For the year ended December 31, 2013, advisory fees paid were reduced by less than $500 relating to the Portfolio's investment in the Liquidity Funds.
A summary of the Portfolio's transactions in shares of the Liquidity Funds during the year ended December 31, 2013 is as follows:
Value
December 31,
2012
(000) | | Purchases
at Cost
(000) | | Sales
(000) | | Dividend
Income
(000) | | Value
December 31,
2013
(000) | |
| $ | 39 | | | $ | 3,236 | | | $ | 3,187 | | | $ | — | @ | | $ | 88 | | |
@ Amount is less than $500.
H. Federal Income Taxes: It is the Portfolio's intention to continue to qualify as a regulated investment company and distribute all of its taxable and tax-exempt income. Accordingly, no provision for Federal income taxes is required in the financial statements.
23
Morgan Stanley Institutional Fund, Inc.
Annual Report — December 31, 2013
Notes to Financial Statements (cont'd)
The Portfolio may be subject to taxes imposed by countries in which it invests. Such taxes are generally based on income and/or capital gains earned or repatriated. Taxes are accrued based on net investment income, net realized gains and net unrealized appreciation as such income and/or gains are earned. Taxes may also be based on transactions in foreign currency and are accrued based on the value of investments denominated in such currency.
FASB ASC 740-10 "Income Taxes — Overall" sets forth a minimum threshold for financial statement recognition of the benefit of a tax position taken or expected to be taken in a tax return. Management has concluded there are no significant uncertain tax positions that would require recognition in the financial statements. If applicable, the Portfolio recognizes interest accrued related to unrecognized tax benefits in "Interest Expense" and penalties in "Other Expenses" in the Statement of Operations. The Portfolio files tax returns with the U.S. Internal Revenue Service, New York and various states. Generally, each of the tax years in the four-year period ended December 31, 2013, remains subject to examination by taxing authorities.
The tax character of distributions paid may differ from the character of distributions shown in the Statements of Changes in Net Assets due to short-term capital gains being treated as ordinary income for tax purposes. The tax character of distributions paid during fiscal years 2013 and 2012 was as follows:
2013
Distributions
Paid From: | | 2012
Distributions
Paid From: | |
Ordinary
Income
(000) | | Long-Term
Capital Gain
(000) | | Ordinary
Income
(000) | | Long-Term
Capital Gain
(000) | |
| $ | 25 | | | $ | 1,144 | | | | — | | | $ | 405 | | |
The amount and character of income and gains to be distributed are determined in accordance with income tax regulations which may differ from GAAP. These book/tax differences are either considered temporary or permanent in nature.
Temporary differences are primarily due to differing book and tax treatments in the timing of the recognition of gains (losses) on certain investment transactions and the timing of the deductibility of certain expenses.
Permanent differences, primarily due to differing treatments of gains (losses) related to foreign currency transactions, basis adjustments on certain equity securities designated as passive foreign investment companies and partnerships, a non-taxable dividend adjustment to income and a net operating loss, resulted in the following reclassifications among the components of net assets at December 31, 2013:
Accumulated
Undistributed
Net Investment
Income
(000) | | Accumulated
Net Realized
Gain
(000) | | Paid-in-
Capital
(000) | |
| $ | 32 | | | $ | (18 | ) | | $ | (14 | ) | |
At December 31, 2013, the components of distributable earnings for the Portfolio on a tax basis were as follows:
Undistributed
Ordinary
Income
(000) | | Undistributed
Long-Term
Capital Gain
(000) | |
| $ | 54 | | | $ | 241 | | |
At December 31, 2013, the aggregate cost for Federal income tax purposes is $7,037,000. The aggregate gross unrealized appreciation is $4,871,000 and the aggregate gross unrealized depreciation is $157,000 resulting in net unrealized appreciation of $4,714,000.
I. Other (unaudited): At December 31, 2013, the Portfolio had otherwise unaffiliated record owners of 10% or greater. Investment activities of these shareholders could have a material impact on the Portfolio. The aggregate percentage of such owners was 32% and 31%, for Class A and Class L shares, respectively.
J. Results of Special Shareholder Meeting (unaudited): On June 5, 2013, a Joint Special Shareholder Meeting was held for Class H shareholders of the Portfolio to approve the Articles of Amendment to the Fund's Articles of Amendment and Restatement and a Plan of Reclassification for the Portfolio pursuant to which Class H shares would be reclassified as Class P shares. The results with respect to this proposal were as follows:
| For | | Against | | Abstain | |
| | 127,024 | | | | 16,325 | | | | 18,294 | | |
K. Accounting Pronouncement: In June 2013, FASB issued Accounting Standards Update 2013-08 Financial Services — Investment Companies (Topic 946) — Amendments to the Scope, Measurement, and Disclosure Requirements
24
Morgan Stanley Institutional Fund, Inc.
Annual Report — December 31, 2013
Notes to Financial Statements (cont'd)
("ASU 2013-08") which is effective for interim and annual reporting periods in fiscal years that begin after December 15, 2013. ASU 2013-08 sets forth a methodology for determining whether an entity should be characterized as an investment company and prescribes fair value accounting for an investment company's non-controlling ownership interest in another investment company. FASB has determined that a fund registered under the Investment Company Act of 1940 automatically meets ASU 2013-08's criteria for an investment company. Although still evaluating the potential impacts of ASU 2013-08 to the Portfolio, management expects that the impact of the Portfolio's adoption will be limited to additional financial statement disclosures.
25
Morgan Stanley Institutional Fund, Inc.
Annual Report — December 31, 2013
Report of Independent Registered Public Accounting Firm
To the Shareholders and Board of Directors of
Morgan Stanley Institutional Fund, Inc. —
Global Opportunity Portfolio
We have audited the accompanying statement of assets and liabilities, including the portfolio of investments, of Global Opportunity Portfolio (one of the portfolios constituting Morgan Stanley Institutional Fund, Inc.) (the "Portfolio") as of December 31, 2013, and the related statement of operations for the year then ended, the statements of changes in net assets for each of the two years in the period then ended, and the financial highlights for each of the periods indicated therein. These financial statements and financial highlights are the responsibility of the Portfolio's management. Our responsibility is to express an opinion on these financial statements and financial highlights based on our audits.
We conducted our audits in accordance with the standards of the Public Company Accounting Oversight Board (United States). Those standards require that we plan and perform the audit to obtain reasonable assurance about whether the financial statements and financial highlights are free of material misstatement. We were not engaged to perform an audit of the Portfolio's internal control over financial reporting. Our audits included consideration of internal control over financial reporting as a basis for designing audit procedures that are appropriate in the circumstances, but not for the purpose of expressing an opinion on the effectiveness of the Portfolio's internal control over financial reporting. Accordingly, we express no such opinion. An audit also includes examining, on a test basis, evidence supporting the amounts and disclosures in the financial statements and financial highlights, assessing the accounting principles used and significant estimates made by management, and evaluating the overall financial statement presentation. Our procedures included confirmation of securities owned as of December 31, 2013, by correspondence with the custodian and others. We believe that our audits provide a reasonable basis for our opinion.
In our opinion, the financial statements and financial highlights referred to above present fairly, in all material respects, the financial position of Global Opportunity Portfolio (one of the portfolios constituting Morgan Stanley Institutional Fund, Inc.) at December 31, 2013, the results of its operations for the year then ended, the changes in its net assets for each of the two years in the period then ended, and the financial highlights for each of the periods indicated therein, in conformity with U.S. generally accepted accounting principles.

Boston, Massachusetts
February 26, 2014
26
Morgan Stanley Institutional Fund, Inc.
Annual Report — December 31, 2013
Federal Tax Notice (unaudited)
For Federal income tax purposes, the following information is furnished with respect to the distributions paid by the Portfolio during its taxable year ended December 31, 2013. For corporate shareholders, 33.1% of the dividends qualified for the dividends received deduction.
The Portfolio designated and paid approximately $1,144,000 as a long-term capital gain distribution.
For Federal income tax purposes, the following information is furnished with respect to the Portfolio's earnings for its taxable year ended December 31, 2013. When distributed, certain earnings may be subject to a maximum tax rate of 15% as provided for the Jobs and Growth Tax Relief Reconciliation Act of 2003. The Portfolio designated up to a maximum of $25,000 as taxable at this lower rate.
In January, the Portfolio provides tax information to shareholders for the preceding calendar year.
27
Morgan Stanley Institutional Fund, Inc.
Annual Report — December 31, 2013
U.S. Privacy Policy (unaudited)
AN IMPORTANT NOTICE CONCERNING OUR U.S. PRIVACY POLICY
This privacy notice describes the U.S. privacy policy of Morgan Stanley Distribution, Inc., and the Morgan Stanley family of mutual funds ("us", "our", "we").
We are required by federal law to provide you with notice of our U.S. privacy policy ("Policy"). This Policy applies to both our current and former clients unless we state otherwise and is intended for individual clients who purchase products or receive services from us for personal, family or household purposes. This Policy is not applicable to partnerships, corporations, trusts or other non-individual clients or account holders, nor is this Policy applicable to individuals who are either beneficiaries of a trust for which we serve as trustee or participants in an employee benefit plan administered or advised by us. This Policy is, however, applicable to individuals who select us to be a custodian of securities or assets in individual retirement accounts, 401(k) accounts, or accounts subject to the Uniform Gifts to Minors Act.
This notice sets out our business practices to protect your privacy; how we collect and share personal information about you; and how you can limit our sharing or certain uses by others of this information. We may amend this Policy at any time, and will inform you of any changes to our Policy as required by law.
WE RESPECT YOUR PRIVACY
We appreciate that you have provided us with your personal financial information and understand your concerns about your information. We strive to safeguard the information our clients entrust to us. Protecting the confidentiality and security of client information is an important part of how we conduct our business.
This notice describes what personal information we collect about you, how we collect it, when we may share it with others, and how certain others may use it. It discusses the steps you may take to limit our sharing of certain information about you with our affiliated companies, including, but not limited to our affiliated banking businesses, brokerage firms and credit service affiliates. It also discloses how you may limit our affiliates' use of shared information for marketing purposes.
Throughout this Policy, we refer to the nonpublic information that personally identifies you as "personal information." We also use the term "affiliated company" in this notice. An affiliated company is a company in our family of companies and includes companies with the Morgan Stanley name. These affiliated companies are financial institutions such as broker-dealers, banks, investment advisers and credit card issuers. We refer to any company that is not an affiliated company as a nonaffiliated third party. For purposes of Section 5 of this notice, and your ability to limit certain uses of personal information by our affiliates, this notice applies to the use of personal information by our affiliated companies.
1. WHAT PERSONAL INFORMATION DO WE COLLECT FROM YOU?
We may collect the following types of information about you: (i) information provided by you, including information from applications and other forms we receive from you, (ii) information about your transactions with us or our affiliates, (iii) information about your transactions with nonaffiliated third parties, (iv) information from consumer reporting agencies, (v) information obtained from our websites, and (vi) information obtained from other sources. For example:
• We collect information such as your name, address, e-mail address, telephone/fax numbers, assets, income and investment objectives through applications and other forms you submit to us.
• We may obtain information about account balances, your use of account(s) and the types of products and services you prefer to receive from us through your dealings and transactions with us and other sources.
• We may obtain information about your creditworthiness and credit history from consumer reporting agencies.
• We may collect background information from and through third-party vendors to verify representations you have made and to comply with various regulatory requirements.
2. WHEN DO WE DISCLOSE PERSONAL INFORMATION WE COLLECT ABOUT YOU?
We may disclose personal information we collect about you in each of the categories listed above to affiliated and nonaffiliated third parties.
28
Morgan Stanley Institutional Fund, Inc.
Annual Report — December 31, 2013
U.S. Privacy Policy (unaudited) (cont'd)
a. Information we disclose to affiliated companies.
We may disclose personal information that we collect about you to our affiliated companies to manage your account(s) effectively, to service and process your transactions, and to let you know about products and services offered by us and affiliated companies, to manage our business, and as otherwise required or permitted by law. Offers for products and services from affiliated companies are developed under conditions designed to safeguard your personal information.
b. Information we disclose to third parties.
We may disclose personal information that we collect about you to nonaffiliated third parties to provide marketing services on our behalf or to other financial institutions with whom we have joint marketing agreements. We may also disclose all of the information we collect to other nonaffiliated third parties for our everyday business purposes, such as to process transactions, maintain account(s), respond to court orders and legal investigations, report to credit bureaus, offer our own products and services, protect against fraud, for institutional risk control, to perform services on our behalf, and as otherwise required or permitted by law.
When we share personal information about you with a nonaffiliated third party, they are required to limit their use of personal information about you to the particular purpose for which it was shared and they are not allowed to share personal information about you with others except to fulfill that limited purpose or as may be permitted or required by law.
3. HOW DO WE PROTECT THE SECURITY AND CONFIDENTIALITY OF PERSONAL INFORMATION WE COLLECT ABOUT YOU?
We maintain physical, electronic and procedural security measures that comply with applicable law and regulations to help safeguard the personal information we collect about you. We have internal policies governing the proper handling of client information by employees. Third parties that provide support or marketing services on our behalf may also receive personal information about you, and we require them to adhere to appropriate security standards with respect to such information.
4. HOW CAN YOU LIMIT OUR SHARING CERTAIN PERSONAL INFORMATION ABOUT YOU WITH OUR AFFILIATED COMPANIES FOR ELIGIBILITY DETERMINATION?
By following the opt-out procedures in Section 6 below, you may limit the extent to which we share with our affiliated companies, personal information that was collected to determine your eligibility for products and services such as your credit reports and other information that you have provided to us or that we may obtain from third parties ("eligibility information"). Eligibility information does not include your identification information or personal information pertaining to our transactions or experiences with you. Please note that, even if you direct us not to share eligibility information with our affiliated companies, we may still share your personal information, including eligibility information, with our affiliated companies under circumstances that are permitted under applicable law, such as to process transactions or to service your account.
5. HOW CAN YOU LIMIT THE USE OF CERTAIN PERSONAL INFORMATION ABOUT YOU BY OUR AFFILIATED COMPANIES FOR MARKETING?
By following the opt-out instructions in Section 6 below, you may limit our affiliated companies from marketing their products or services to you based on personal information we disclose to them. This information may include, for example, your income and account history with us. Please note that, even if you choose to limit our affiliated companies from using personal information about you that we may share with them for marketing their products and services to you, our affiliated companies may use your personal information that they obtain from us to market to you in circumstances permitted by law, such as if the affiliated party has its own relationship with you.
29
Morgan Stanley Institutional Fund, Inc.
Annual Report — December 31, 2013
U.S. Privacy Policy (unaudited) (cont'd)
6. HOW CAN YOU SEND US AN OPT-OUT INSTRUCTION?
If you wish to limit our sharing of eligibility information about you with our affiliated companies, or our affiliated companies' use of personal information for marketing purposes, as described in this notice, you may do so by:
• Calling us at (800) 548-7786
Monday–Friday between 8a.m. and 5p.m. (EST)
• Writing to us at the following address:
Boston Financial Data Services, Inc.
c/o Privacy Coordinator
P.O. Box 219804
Kansas City, Missouri 64121
If you choose to write to us, your request should include: your name, address, telephone number and account number(s) to which the opt-out applies and whether you are opting out with respect to sharing of eligibility information (Section 4 above), or information used for marketing (Section 5 above), or both. Written opt-out requests should not be sent with any other correspondence. In order to process your request, we require that the request be provided by you directly and not through a third party. Once you have informed us about your privacy preferences, your opt-out preference will remain in effect with respect to this Policy (as it may be amended) until you notify us otherwise. If you are a joint account owner, we will accept instructions from any one of you and apply those instructions to the entire account.
Please understand that if you limit our sharing or our affiliated companies' use of personal information, you and any joint account holder(s) may not receive information about our affiliated companies' products and services, including products or services that could help you manage your financial resources and achieve your investment objectives.
If you have more than one account or relationship with us, please specify the accounts to which you would like us to apply your privacy choices. If you have accounts or relationships with our affiliates, you may receive multiple privacy policies from them, and will need to separately notify those companies of your privacy choices for those accounts or relationships.
7. WHAT IF AN AFFILIATED COMPANY BECOMES A NONAFFILIATED THIRD PARTY?
If, at any time in the future, an affiliated company becomes a nonaffiliated third party, further disclosures of personal information made to the former affiliated company will be limited to those described in Section 2(b) above relating to nonaffiliated third parties. If you elected under Section 6 to limit disclosures we make to affiliated companies, or use of personal information by affiliated companies, your election will not apply to use by any former affiliated company of your personal information in their possession once it becomes a nonaffiliated third party.
SPECIAL NOTICE TO RESIDENTS OF VERMONT
The following section supplements our Policy with respect to our individual clients who have a Vermont address and supersedes anything to the contrary in the above Policy with respect to those clients only.
The State of Vermont requires financial institutions to obtain your consent prior to sharing personal information that they collect about you with nonaffiliated third parties, or eligibility information with affiliated companies, other than in certain limited circumstances. Except as permitted by law, we will not share personal information we collect about you with nonaffiliated third parties or eligibility information with affiliated companies, unless you provide us with your written consent to share such information.
SPECIAL NOTICE TO RESIDENTS OF CALIFORNIA
The following section supplements our Policy with respect to our individual clients who have a California address and supersedes anything to the contrary in the above Policy with respect to those clients only.
In response to a California law, if your account has a California home address, your personal information will not be disclosed to nonaffiliated third parties except as permitted by applicable California law, and we will limit sharing such personal information with our affiliates to comply with California privacy laws that apply to us.
30
Morgan Stanley Institutional Fund, Inc.
Annual Report — December 31, 2013
Director and Officer Information (unaudited)
Independent Director:
Name, Age and Address of
Independent Director | | Position(s)
Held with
Registrant | | Length of Time
Served* | | Principal Occupation(s) During Past 5 Years | | Number of
Portfolios in
Fund Complex
Overseen by
Independent
Director** | | Other Directorships
Held by Independent
Director*** | |
Frank L. Bowman (69)
c/o Kramer Levin Naftalis &
Frankel LLP
Counsel to the Independent
Directors
1177 Avenue of the Americas
New York, NY 10036 | | Director | | Since
August
2006 | | President, Strategic Decisions, LLC (consulting) (since February 2009); Director or Trustee of various Morgan Stanley Funds (since August 2006); Chairperson of the Insurance Sub-Committee of the Compliance and Insurance Committee (since February 2007); served as President and Chief Executive Officer of the Nuclear Energy Institute (policy organization) (February 2005-November 2008); retired as Admiral, U.S. Navy after serving over 38 years on active duty including 8 years as Director of the Naval Nuclear Propulsion Program in the Department of the Navy and the U.S. Department of Energy (1996-2004); served as Chief of Naval Personnel (July 1994-September 1996); and on the Joint Staff as Director of Political Military Affairs (June 1992-July 1994); knighted as Honorary Knight Commander of the Most Excellent Order of the British Empire; awarded the Officier de l'Orde National du Mérite by the French Government; elected to the National Academy of Engineering (2009). | | | 98 | | | Director of BP p.l.c.; Director of Naval and Nuclear Technologies LLP; Director of the Armed Services YMCA of the USA and the U.S. Naval Submarine League; Director of the American Shipbuilding Suppliers Association; Member of the National Security Advisory Council of the Center for U.S. Global Engagement and a member of the CNA Military Advisory Board; Chairman of the Charity J Street Cup Golf; Trustee of Fairhaven United Methodist Church. | |
Michael Bozic (73)
c/o Kramer Levin Naftalis & Frankel LLP
Counsel to the Independent Directors
1177 Avenue of the Americas New York, NY 10036 | | Director | | Since
April
1994 | | Private investor and a member of the advisory board of American Road Group LLC (retail) (since June 2000); Chairperson of the Compliance and Insurance Committee (since October 2006); Director or Trustee of various Morgan Stanley Funds (since April 1994); formerly, Chairperson of the Insurance Committee (July 2006-September 2006); Vice Chairman of Kmart Corporation (December 1998-October 2000); Chairman and Chief Executive Officer of Levitz Furniture Corporation (November 1995-November 1998) and President and Chief Executive Officer of Hills Department Stores (May 1991-July 1995); variously Chairman, Chief Executive Officer, President and Chief Operating Officer (1987-1991) of the Sears Merchandise Group of Sears, Roebuck & Co. | | | 100 | | | Trustee and member of the Hillsdale College Board of Trustees. | |
Kathleen A. Dennis (60)
c/o Kramer Levin Naftalis & Frankel LLP
Counsel to the Independent Directors
1177 Avenue of the Americas New York, NY 10036 | | Director | | Since
August
2006 | | President, Cedarwood Associates (mutual fund and investment management consulting) (since July 2006); Chairperson of the Money Market and Alternatives Sub-Committee of the Investment Committee (since October 2006) and Director or Trustee of various Morgan Stanley Funds (since August 2006); formerly, Senior Managing Director of Victory Capital Management (1993-2006). | | | 98 | | | Director of various non-profit organizations. | |
Dr. Manuel H. Johnson (65)
c/o Johnson Smick
International, Inc.
220 I Street, NE — Suite 200
Washington, D.C. 20002 | | Director | | Since
July
1991 | | Senior Partner, Johnson Smick International, Inc. (consulting firm); Chairperson of the Investment Committee (since October 2006) and Director or Trustee of various Morgan Stanley Funds (since July 1991); Co-Chairman and a founder of the Group of Seven Council (G7C) (international economic commission); formerly, Chairperson of the Audit Committee (July 1991-September 2006), Vice Chairman of the Board of Governors of the Federal Reserve System and Assistant Secretary of the U.S. Treasury. | | | 101 | | | Director of NVR, Inc. (home construction). | |
31
Morgan Stanley Institutional Fund, Inc.
Annual Report — December 31, 2013
Director and Officer Information (unaudited) (cont'd)
Independent Director: (cont'd)
Name, Age and Address of
Independent Director | | Position(s)
Held with
Registrant | | Length of Time
Served* | | Principal Occupation(s) During Past 5 Years | | Number of
Portfolios in
Fund Complex
Overseen by
Independent
Director** | | Other Directorships
Held by Independent
Director*** | |
Joseph J. Kearns (71)
c/o Kearns & Associates LLC PMB754
22631 Pacific Coast Highway
Malibu, CA 90265 | | Director | | Since
August
1994 | | President, Kearns & Associates LLC (investment consulting); Chairperson of the Audit Committee (since October 2006) and Director or Trustee of various Morgan Stanley Funds (since August 1994); formerly, Deputy Chairperson of the Audit Committee (July 2003-September 2006) and Chairperson of the Audit Committee of various Morgan Stanley Funds (since August 1994); CFO of the J. Paul Getty Trust. | | | 101 | | | Director of Electro Rent Corporation (equipment leasing) and The Ford Family Foundation. | |
Michael F. Klein (55)
c/o Kramer Levin Naftalis & Frankel LLP
Counsel to the Independent Directors
1177 Avenue of the Americas New York, NY 10036 | | Director | | Since
August
2006 | | Managing Director, Aetos Capital, LLC (since March 2000); Co-President, Aetos Alternatives Management, LLC (since January 2004) and Co-Chief Executive Officer of Aetos Capital, LLC (since August 2013); Chairperson of the Fixed Income Sub-Committee of the Investment Committee (since October 2006) and Director or Trustee of various Morgan Stanley Funds (since August 2006); formerly, Managing Director, Morgan Stanley & Co. Inc. and Morgan Stanley Dean Witter Investment Management, President, various Morgan Stanley Funds (June 1998-March 2000) and Principal, Morgan Stanley & Co. Inc. and Morgan Stanley Dean Witter Investment Management (August 1997-December 1999). | | | 98 | | | Director of certain investment funds managed or sponsored by Aetos Capital, LLC. Director of Sanitized AG and Sanitized Marketing AG (specialty chemicals). | |
Michael E. Nugent (77)
522 Fifth Avenue
New York, NY 10036 | | Chairperson
of the
Board and Director | | Chairperson of the Boards since July 2006 and Director since July 1991 | | Chairperson of the Boards of various Morgan Stanley Funds (since July 2006); Chairperson of the Closed-End Fund Committee (since June 2012) and Director or Trustee of various Morgan Stanley Funds (since July 1991); formerly, Chairperson of the Insurance Committee (until July 2006); General Partner, Triumph Capital, L.P. (private investment partnership) (1988-2013). | | | 100 | | | None. | |
W. Allen Reed (66)
c/o Kramer Levin Naftalis & Frankel LLP
Counsel to the Independent Directors
1177 Avenue of the Americas New York, NY 10036 | | Director | | Since
August
2006 | | Chairperson of the Equity Sub-Committee of the Investment Committee (since October 2006) and Director or Trustee of various Morgan Stanley Funds (since August 2006); formerly, President and CEO of General Motors Asset Management; Chairman and Chief Executive Officer of the GM Trust Bank and Corporate Vice President of General Motors Corporation (August 1994-December 2005). | | | 98 | | | Director of Temple-Inland Industries (packaging and forest products); Director of Legg Mason, Inc. and Director of the Auburn University Foundation. | |
Fergus Reid (81)
c/o Joe Pietryka, Inc.
85 Charles Colman Blvd. Pawling, NY 12564 | | Director | | Since
June
1992 | | Chairman, Joe Pietryka, Inc.; Chairperson of the Governance Committee and Director or Trustee of various Morgan Stanley Funds (since June 1992). | | | 101 | | | Through December 31, 2012, Trustee and Director of certain Investment companies in the JPMorgan Fund Complex. | |
32
Morgan Stanley Institutional Fund, Inc.
Annual Report — December 31, 2013
Director and Officer Information (unaudited) (cont'd)
Interested Director:
Name, Age and Address of
Interested Director | | Position(s)
Held with
Registrant | | Length of
Time Served* | | Principal Occupation(s) During Past 5 Years | | Number of
Portfolios in
Fund Complex
Overseen by
Interested
Director** | | Other Directorships
Held by Interested
Director*** | |
James F. Higgins (66)
One New York Plaza
New York, New York 10004 | | Director | | Since
June
2000 | | Director or Trustee of various Morgan Stanley Funds (since June 2000); Senior Advisor of Morgan Stanley (since August 2000). | | | 99 | | | Formerly, Director of AXA Financial, Inc. and AXA Equitable Life Insurance Company (2002-2011) and Director of AXA MONY Life Insurance Company and AXA MONY Life Insurance Company of America (2004-2011). | |
* Each Director serves an indefinite term, until his or her successor is elected.
** The Fund Complex includes (as of December 31, 2013) all open-end and closed-end funds (including all of their portfolios) advised by Morgan Stanley Investment Management Inc. (the "Adviser") and any funds that have an adviser that is an affiliated person of the Adviser (including, but not limited to, Morgan Stanley AIP GP LP).
*** This includes any directorships at public companies and registered investment companies held by the Director at any time during the past five years.
33
Morgan Stanley Institutional Fund, Inc.
Annual Report — December 31, 2013
Director and Officer Information (unaudited) (cont'd)
Executive Officers:
Name, Age and Address of Executive Officer | | Position(s) Held
with
Registrant | | Length of
Time Served* | | Principal Occupation(s) During Past 5 Years | |
John H. Gernon (50)
522 Fifth Avenue
New York, NY 10036 | | President and Principal Executive Officer—Equity, Fixed Income and AIP Funds | | Since
September
2013 | | President and Principal Executive Officer of the Equity and Fixed Income Funds and the Morgan Stanley AIP Funds (since September 2013) in the Fund Complex. Managing Director of the Adviser. | |
Stefanie V. Chang Yu (47)
522 Fifth Avenue
New York, NY 10036 | | Chief Compliance Officer | | Since
January
2014 | | Managing Director of the Adviser and various entities affiliated with the Adviser; Chief Compliance Officer of various Morgan Stanley Funds and the Adviser (since January 2014). Formerly Vice President of various Morgan Stanley Funds (December 1997-January 2014). | |
Joseph C. Benedetti (48)
522 Fifth Avenue
New York, NY 10036 | | Vice President | | Since
January
2014 | | Managing Director of the Adviser and various entities affiliated with the Adviser; Vice President of various Morgan Stanley Funds (since January 2014). Formerly, Assistant Secretary of various Morgan Stanley Funds (October 2004-January 2014). | |
Francis J. Smith (48)
522 Fifth Avenue
New York, NY 10036 | | Treasurer and Principal Financial Officer | | Treasurer since July 2003 and Principal Financial Officer since September 2002 | | Executive Director of the Adviser and various entities affiliated with the Adviser; Treasurer and Principal Financial Officer of various Morgan Stanley Funds (since July 2003). | |
Mary E. Mullin (46)
522 Fifth Avenue
New York, NY 10036 | | Secretary | | Since
June
1999 | | Executive Director of the Adviser and various entities affiliated with the Adviser; Secretary of various Morgan Stanley Funds (since June 1999). | |
* Each officer serves an indefinite term, until his or her successor is elected.
34
Morgan Stanley Institutional Fund, Inc.
Annual Report — December 31, 2013
Adviser and Administrator
Morgan Stanley Investment Management Inc.
522 Fifth Avenue
New York, New York 10036
Distributor
Morgan Stanley Distribution, Inc.
522 Fifth Avenue
New York, New York 10036
Dividend Disbursing and Transfer Agent
Boston Financial Data Services, Inc.
2000 Crown Colony Drive
Quincy, Massachusetts 02169
Custodian
State Street Bank and Trust Company
One Lincoln Street
Boston, Massachusetts 02111
Legal Counsel
Dechert LLP
1095 Avenue of the Americas
New York, New York 10036
Counsel to the Independent Directors
Kramer Levin Naftalis & Frankel LLP
1177 Avenue of the Americas
New York, New York 10036
Independent Registered Public Accounting Firm
Ernst & Young LLP
200 Clarendon Street
Boston, Massachusetts 02116
Reporting to Shareholders
Each Morgan Stanley fund provides a complete schedule of portfolio holdings in its semi-annual and annual reports within 60 days of the end of the fund's second and fourth fiscal quarters by filing the schedule electronically with the Securities and Exchange Commission (SEC). The semi-annual reports are filed on Form N-CSRS and the annual reports are filed on Form N-CSR. Morgan Stanley also delivers the semi-annual and annual reports to fund shareholders and makes these reports available on its public website, www.morganstanley.com/im. Each Morgan Stanley fund also files a complete schedule of portfolio holdings with the SEC for the fund's first and third fiscal quarters on Form N-Q. Morgan Stanley does not deliver the reports for the first and third fiscal quarters to shareholders, nor are the reports posted to the Morgan Stanley public website. You may, however, obtain the Form N-Q filings (as well as the Form N-CSR and N-CSRS filings) by accessing the SEC's website, www.sec.gov. You may also review and copy them at the SEC's Public Reference Room in Washington, DC. Information on the operation of the SEC's Public Reference Room may be obtained by calling the SEC toll free at 1 (800) SEC-0330. You can also request copies of these materials, upon payment of a duplicating fee, by electronic request at the SEC's email address (publicinfo@sec.gov) or by writing the Public Reference Room of the SEC, Washington, DC 20549-0102.
Proxy Voting Policies and Procedures and Proxy Voting Record
You may obtain a copy of the Fund's Proxy Voting Policy and Procedures and information regarding how the Fund voted proxies relating to portfolio securities during the most recent twelve-month period ended June 30, without charge, upon request, by calling toll free 1 (800) 548-7786 or by visiting our website at www.morganstanley.com/im. This information is also available on the SEC's website at www.sec.gov.
This report is authorized for distribution only when preceded or accompanied by a prospectus of the Morgan Stanley Institutional Fund, Inc. which describes in detail each Investment Portfolio's investment policies, risks, fees and expenses. Please read the prospectus carefully before you invest or send money. For additional information, including information regarding the investments comprising the Portfolio, please visit our website at www.morganstanley.com/im or call toll free 1 (800) 548-7786.
35
(This Page has been left blank intentionally.)
(This Page has been left blank intentionally.)
Printed in U.S.A.
This Report has been prepared for shareholders and may be distributed to others only if preceded or accompanied by a current prospectus.
Morgan Stanley Investment Management Inc.
522 Fifth Avenue
New York, New York 10036
© 2014 Morgan Stanley. Morgan Stanley Distribution, Inc.

IFIGOANN
809461 EXP 2.28.15

Morgan Stanley Institutional Fund, Inc.
Advantage Portfolio
Annual Report
December 31, 2013

Morgan Stanley Institutional Fund, Inc.
Annual Report — December 31, 2013
Shareholders' Letter | | | 2 | | |
Expense Example | | | 3 | | |
Investment Overview | | | 4 | | |
Portfolio of Investments | | | 6 | | |
Statement of Assets and Liabilities | | | 7 | | |
Statement of Operations | | | 9 | | |
Statements of Changes in Net Assets | | | 10 | | |
Financial Highlights | | | 12 | | |
Notes to Financial Statements | | | 16 | | |
Report of Independent Registered Public Accounting Firm | | | 24 | | |
Federal Tax Notice | | | 25 | | |
U.S. Privacy Policy | | | 26 | | |
Director and Officer Information | | | 29 | | |
This report is authorized for distribution only when preceded or accompanied by prospectuses of the Morgan Stanley Institutional Fund, Inc. To receive a prospectus and/or statement of additional information (SAI), which contains more complete information such as investment objectives, charges, expenses, policies for voting proxies, risk considerations, and describes in detail each of the Portfolio's investment policies to the prospective investor, please call toll free 1 (800) 548-7786. Please read the prospectuses carefully before you invest or send money.
Additionally, you can access portfolio information including performance, characteristics, and investment team commentary through Morgan Stanley Investment Management's website: www.morganstanley.com/im.
Market forecasts provided in this report may not necessarily come to pass. There is no guarantee that any sectors mentioned will continue to perform as discussed herein or that securities in such sectors will be held by the Portfolio in the future. There is no assurance that a Portfolio will achieve its investment objective. Portfolios are subject to market risk, which is the possibility that market values of securities owned by the Portfolio will decline and, therefore, the value of the Portfolio's shares may be less than what you paid for them. Accordingly, you can lose money investing in the Portfolio. Please see the prospectus for more complete information on investment risks.
1
Morgan Stanley Institutional Fund, Inc.
Annual Report — December 31, 2013
Shareholders' Letter (unaudited)
Dear Shareholders,
We are pleased to provide this Annual report, in which you will learn how your investment in Advantage Portfolio (the "Portfolio") performed during the latest twelve-month period.
Morgan Stanley Investment Management is a client-centric, investor-led organization. Our global presence, intellectual capital, and breadth of products and services enable us to partner with investors to meet the evolving challenges of today's financial markets. We aim to deliver superior investment service and to empower our clients to make the informed decisions that help them reach their investment goals.
As always, we thank you for selecting Morgan Stanley Investment Management, and look forward to working with you in the months and years ahead.
Sincerely,

John H. Gernon
President and Principal Executive Officer
January 2014
2
Morgan Stanley Institutional Fund, Inc.
Annual Report — December 31, 2013
Expense Example (unaudited)
Advantage Portfolio
As a shareholder of the Portfolio, you incur two types of costs: (1) transactional costs; and (2) ongoing costs, including advisory fees, administration fees, distribution and shareholder services fees and other Portfolio expenses. This example is intended to help you understand your ongoing costs (in dollars) of investing in the Portfolio and to compare these costs with the ongoing costs of investing in other mutual funds.
This example is based on an investment of $1,000 invested at the beginning of the six-month period ended December 31, 2013 and held for the entire six-month period.
Actual Expenses
The table below provides information about actual account values and actual expenses. You may use the information in this table, together with the amount you invested, to estimate the expenses that you paid over the period. Simply divide your account value by $1,000 (for example, an $8,600 account value divided by $1,000 = 8.6), then multiply the result by the number in the table under the heading entitled "Actual Expenses Paid During Period" to estimate the expenses you paid on your account during this period.
Hypothetical Example for Comparison Purposes
The table below provides information about hypothetical account values and hypothetical expenses based on the Portfolio's actual expense ratio and an assumed rate of return of 5% per year before expenses, which is not the Portfolio's actual return. The hypothetical account values and expenses may not be used to estimate the actual ending account balance or expenses you paid for the period. You may use this information to compare the ongoing costs of investing in the Portfolio and other funds. To do so, compare this 5% hypothetical example with the 5% hypothetical examples that appear in the shareholder reports of the other funds.
Please note that the expenses shown in the table are meant to highlight your ongoing costs only and do not reflect any transactional costs, such as sales charges (loads). Therefore, the information for each class in the table is useful in comparing ongoing costs only, and will not help you determine the relative total costs of owning different funds. In addition, if these transactional costs were included, your costs would have been higher.
| | | Beginning
Account
Value
7/1/13 | | Actual Ending
Account
Value
12/31/13 | | Hypothetical
Ending Account
Value | | Actual
Expenses
Paid
During
Period | | Hypothetical
Expenses Paid
During Period | | Net
Expense
Ratio
During
Period*** | |
Advantage Portfolio Class I | | $ | 1,000.00 | | | $ | 1,257.50 | | | $ | 1,019.96 | | | $ | 5.92 | * | | $ | 5.30 | * | | | 1.04 | % | |
Advantage Portfolio Class A@ | | | 1,000.00 | | | | 1,255.10 | | | | 1,018.40 | | | | 7.67 | * | | | 6.87 | * | | | 1.35 | | |
Advantage Portfolio Class L | | | 1,000.00 | | | | 1,256.40 | | | | 1,019.76 | | | | 6.14 | * | | | 5.50 | * | | | 1.08 | | |
Advantage Portfolio Class IS | | | 1,000.00 | | | | 1,151.50 | | | | 1,011.70 | | | | 3.19 | ** | | | 2.98 | ** | | | 1.01 | | |
* Expenses are calculated using each Portfolio Class' annualized net expense ratio (as disclosed), multiplied by the average account value over the period, and multiplied by 184/365 (to reflect the most recent one-half year period).
** Expenses are calculated using the Portfolio Class' annualized net expense ratio (as disclosed), multiplied by the average account value over the period, and multiplied by 107/365 (to reflect the actual days in the period).
*** Annualized.
@ Effective September 9, 2013, Class P and Class H shares were renamed Class A shares.
3
Morgan Stanley Institutional Fund, Inc.
Annual Report — December 31, 2013
Investment Overview (unaudited)
Advantage Portfolio
The Advantage Portfolio seeks long-term capital appreciation.
Performance
For the year ended December 31, 2013, the Portfolio had a total return based on net asset value and reinvestment of distributions per share of 37.11%, net of fees, for Class I shares. The Portfolio's Class I shares outperformed against its benchmark, the Russell 1000® Growth Index (the "Index"), which returned 33.48%. Please keep in mind that high double-digit returns are highly unusual and cannot be sustained.
Factors Affecting Performance
• U.S. stocks turned in a strong performance for the year ended December 31, 2013. As in 2012, the expectation that accommodative monetary policy by the U.S. Federal Reserve (Fed) would continue for some time helped drive the prices of risky assets including stocks higher in 2013. However, as the U.S. economy began to look stronger, the Fed started signaling its intention to reduce the pace of its asset purchase program (known as quantitative easing or QE) if economic data warranted. Uncertainty as to the timing and magnitude of this tapering led to volatility across the capital markets. When the Fed unexpectedly left its QE program intact after its September meeting, stocks rallied strongly. The market's advance paused in October, disrupted by a partial government shutdown and political gridlock over whether to raise the debt ceiling, but resumed in the final months of the period on expectations — and later confirmation by the Fed — that QE tapering would begin in 2014.
• The Portfolio's relative outperformance was driven almost entirely by the technology sector, where stock selection and an underweight were both additive. Performance was led by a holding in an online social networking company.
• Stock selection and an overweight in the financial services sector also boosted relative performance. Here, a holding in a credit card and transaction processing company was the top contributor.
• The Portfolio's zero exposure to the materials and processing sector was beneficial as well.
• Detractors from relative performance included stock selection and an underweight in producer durables.
Although most of the Fund's holdings performed well, a lack of exposure to strong-performing areas such as aerospace and diversified manufacturing operations dampened relative returns.
• Stock selection in the consumer discretionary sector resulted in relative losses, with a position in a weight loss products and services company the main laggard. This position was eliminated during the year to fund other investments that we believe had more favorable risk/reward.
• Stock selection in health care was favorable to performance but the relative gain was more than offset by the negative impact of an underweight in the sector.
Management Strategies
• We look for high-quality growth companies that have these attributes: sustainable competitive advantages, above-average business visibility, rising return on invested capital, strong free cash flow generation and a favorable risk/reward. We find these companies through intense fundamental research. Our emphasis is on secular growth, and as a result short-term market events are not as meaningful in the stock selection process.
* Minimum Investment for Class I shares
** Commenced Operations on June 30, 2008.
In accordance with SEC regulations, Portfolio's performance shown assumes that all recurring fees (including management fees) were deducted and all dividends and distributions were reinvested. The performance of Class A+, L and IS shares will vary from Class I shares based upon their different inception dates and will be negatively impacted by additional fees assessed to those classes (if applicable).
4
Morgan Stanley Institutional Fund, Inc.
Annual Report — December 31, 2013
Investment Overview (unaudited) (cont'd)
Advantage Portfolio
Performance Compared to the Russell 1000® Growth Index(1) and the Lipper Large-Cap Growth Funds Index(2)
| | | Period Ended December 31, 2013
Total Returns(3) | |
| | | | | Average Annual | |
| | | One
Year | | Five
Years | | Ten
Years | | Since
Inception(6) | |
Portfolio — Class I Shares
w/o sales charges(4) | | | 37.11 | % | | | 24.71 | % | | | — | | | | 12.11 | % | |
Russell 1000® Growth Index | | | 33.48 | | | | 20.39 | | | | — | | | | 10.26 | | |
Lipper Large-Cap Growth Funds Index | | | 35.41 | | | | 19.43 | | | | — | | | | 8.77 | | |
Portfolio — Class A+ Shares
w/o sales charges(4) | | | 36.65 | | | | — | | | | — | | | | 21.44 | | |
Portfolio — Class A+ Shares with
maximum 5.25% sales charges(4) | | | 29.44 | | | | — | | | | — | | | | 19.63 | | |
Russell 1000® Growth Index | | | 33.48 | | | | — | | | | — | | | | 19.29 | | |
Lipper Large-Cap Growth Funds Index | | | 35.41 | | | | — | | | | — | | | | 18.17 | | |
Portfolio — Class L Shares
w/o sales charges(4) | | | 36.97 | | | | 24.59 | | | | — | | | | 11.96 | | |
Russell 1000® Growth Index | | | 33.48 | | | | 20.39 | | | | — | | | | 10.26 | | |
Lipper Large-Cap Growth Funds Index | | | 35.41 | | | | 19.43 | | | | — | | | | 8.77 | | |
Portfolio — Class IS Shares
w/o sales charges(5) | | | — | | | | — | | | | — | | | | 15.15 | | |
Russell 1000® Growth Index | | | — | | | | — | | | | — | | | | 11.03 | | |
Lipper Large-Cap Growth Funds Index | | | — | | | | — | | | | — | | | | 11.82 | | |
Performance data quoted represents past performance, which is no guarantee of future results, and current performance may be lower or higher than the figures shown. Performance assumes that all dividends and distributions, if any, were reinvested. For the most recent month-end performance figures, please visit www.morganstanley.com/im. Investment return and principal value will fluctuate so that Portfolio shares, when redeemed, may be worth more or less than their original cost. Total returns do not reflect the deduction of taxes that a shareholder would pay on Portfolio distributions or the redemption of Portfolio shares. Returns for periods less than one year are not annualized. Performance of share classes will vary due to difference in sales charges and expenses.
+ Effective September 9, 2013, Class P shares were renamed Class A shares.
(1) The Russell 1000® Growth Index measures the performance of the large-cap growth segment of the U.S. equity universe. It includes those Russell 1000® Index companies with higher price-to-book ratios and higher forecasted growth values. The Russell 1000® Index is an index of approximately 1,000 of the largest U.S. companies based on a combination of market capitalization and current index membership. The Index is unmanaged and its returns do not include any sales charges or fees. Such costs would lower performance. It is not possible to invest directly in an index.
(2) The Lipper Large-Cap Growth Funds Index is an equally weighted performance index of the largest qualifying funds (based on net assets) in the Lipper Large-Cap Growth Funds classification. The Index, which is adjusted for capital gains distributions and income dividends, is unmanaged and should not be considered an investment. There are currently 30 funds represented in this Index. As of the date of this report, the Portfolio was in the Lipper Large-Cap Growth Funds classification.
(3) Total returns for the Portfolio reflect fees waived and expenses reimbursed, if applicable, by the Adviser. Without such waivers and reimbursements, total returns would have been lower. The fee waivers and/or expense reimbursements will continue for at least one year or until such time as the Fund's Board of Directors acts to discontinue all or a portion of such waivers and/or expense
reimbursements when it deems that such action is appropriate. The Distributor has agreed to waive for at least one year the 12b-1 fee on Class L shares of the Portfolio to the extent it exceeds 0.04% of the average daily net assets of such shares on an annualized basis.
(4) On May 21, 2010 Class C and Class I shares of Van Kampen Core Growth Fund ("the Predecessor Fund") were reorganized into Class L and Class I shares of Morgan Stanley Advantage Portfolio ("the Portfolio"), respectively. Class L and Class I shares' returns of the Portfolio will differ from the Predecessor Fund as they have different expenses. Performance shown for the Portfolio's Class I and Class L shares reflects the performance of the shares of the Predecessor Fund for periods prior to May 21, 2010. The Class C and I shares of the Predecessor Fund commenced operations on June 30, 2008. Class P shares, which were renamed Class A shares effective September 9, 2013, commenced operations on May 21, 2010.
(5) Commenced offering on September 13, 2013.
(6) For comparative purposes, average annual since inception returns listed for the Indexes refer to the inception date or initial offering of the respective share class of the Portfolio, not the inception of the Index. Returns for periods less than one year are not annualized.
Portfolio Composition
Classification | | Percentage of
Total Investments | |
Other* | | | 34.4 | % | |
Computer Services, Software & Systems | | | 19.3 | | |
Diversified Retail | | | 11.2 | | |
Consumer Lending | | | 9.6 | | |
Pharmaceuticals | | | 8.5 | | |
Restaurants | | | 5.9 | | |
Textiles Apparel & Shoes | | | 5.7 | | |
Beverage: Soft Drinks | | | 5.4 | | |
Total Investments | | | 100.0 | % | |
* Industries and/or investment types representing less than 5% of total investments.
5
Morgan Stanley Institutional Fund, Inc.
Annual Report — December 31, 2013
Portfolio of Investments
Advantage Portfolio
| | | Shares | | Value
(000) | |
Common Stocks (95.1%) | |
Asset Management & Custodian (1.5%) | |
Eurazeo SA (France) | | | 4,175 | | | $ | 327 | | |
Beverage: Soft Drinks (5.4%) | |
Dr. Pepper Snapple Group, Inc. | | | 10,192 | | | | 497 | | |
Monster Beverage Corp. (a) | | | 3,571 | | | | 242 | | |
PepsiCo, Inc. | | | 5,124 | | | | 425 | | |
| | | | 1,164 | | |
Commercial Services (2.7%) | |
eBay, Inc. (a) | | | 5,180 | | | | 284 | | |
Intertek Group PLC (United Kingdom) | | | 5,978 | | | | 312 | | |
| | | | 596 | | |
Communications Technology (2.9%) | |
Motorola Solutions, Inc. | | | 9,208 | | | | 622 | | |
Computer Services, Software & Systems (19.2%) | |
Cognizant Technology Solutions Corp., Class A (a) | | | 2,193 | | | | 221 | | |
Facebook, Inc., Class A (a) | | | 32,192 | | | | 1,760 | | |
Google, Inc., Class A (a) | | | 1,459 | | | | 1,635 | | |
Twitter, Inc. (a) | | | 8,891 | | | | 566 | | |
| | | | 4,182 | | |
Computer Technology (3.0%) | |
Apple, Inc. | | | 1,154 | | | | 647 | | |
Consumer Lending (9.6%) | |
Berkshire Hathaway, Inc., Class B (a) | | | 3,928 | | | | 466 | | |
Mastercard, Inc., Class A | | | 1,019 | | | | 851 | | |
Visa, Inc., Class A | | | 3,466 | | | | 772 | | |
| | | | 2,089 | | |
Diversified Media (3.0%) | |
McGraw Hill Financial, Inc. | | | 4,097 | | | | 320 | | |
Naspers Ltd., Class N (South Africa) | | | 3,186 | | | | 333 | | |
| | | | 653 | | |
Diversified Retail (11.2%) | |
Amazon.com, Inc. (a) | | | 4,390 | | | | 1,751 | | |
Dollar Tree, Inc. (a) | | | 8,293 | | | | 468 | | |
Moncler SpA (Italy) (a) | | | 10,037 | | | | 218 | | |
| | | | 2,437 | | |
Financial Data & Systems (2.9%) | |
MSCI, Inc. (a) | | | 7,019 | | | | 307 | | |
Verisk Analytics, Inc., Class A (a) | | | 4,847 | | | | 318 | | |
| | | | 625 | | |
Foods (4.2%) | |
McCormick & Co., Inc. | | | 6,033 | | | | 416 | | |
Nestle SA ADR (Switzerland) | | | 6,830 | | | | 502 | | |
| | | | 918 | | |
Insurance: Property-Casualty (4.5%) | |
Arch Capital Group Ltd. (a) | | | 4,853 | | | | 290 | | |
Progressive Corp. (The) | | | 25,444 | | | | 694 | | |
| | | | 984 | | |
| | | Shares | | Value
(000) | |
Pharmaceuticals (8.5%) | |
Abbott Laboratories | | | 13,453 | | | $ | 516 | | |
Mead Johnson Nutrition Co. | | | 9,605 | | | | 804 | | |
Valeant Pharmaceuticals International, Inc.
(Canada) (a) | | | 4,436 | | | | 521 | | |
| | | | 1,841 | | |
Recreational Vehicles & Boats (2.5%) | |
Edenred (France) | | | 16,104 | | | | 539 | | |
Restaurants (5.9%) | |
Dunkin' Brands Group, Inc. | | | 6,398 | | | | 309 | | |
Panera Bread Co., Class A (a) | | | 1,590 | | | | 281 | | |
Starbucks Corp. | | | 8,960 | | | | 702 | | |
| | | | 1,292 | | |
Scientific Instruments: Gauges & Meters (2.5%) | |
Thermo Fisher Scientific, Inc. | | | 4,944 | | | | 550 | | |
Textiles Apparel & Shoes (5.6%) | |
Burberry Group PLC (United Kingdom) | | | 9,601 | | | | 241 | | |
Carter's, Inc. | | | 3,982 | | | | 286 | | |
Christian Dior SA (France) | | | 3,708 | | | | 700 | | |
| | | | 1,227 | | |
Total Common Stocks (Cost $14,487) | | | 20,693 | | |
| | Notional
Amount | | | |
Call Options Purchased (0.1%) | |
Foreign Currency Options (0.1%) | |
USD/CNY December 2014 @ CNY 6.50 | | | 233,898 | | | | — | @ | |
USD/CNY December 2014 @ CNY 6.50 | | | 2,895,653 | | | | 5 | | |
USD/CNY December 2014 @ CNY 6.50 | | | 3,294,474 | | | | 6 | | |
Total Call Options Purchased (Cost $20) | | | 11 | | |
| | | Shares | | | |
Short-Term Investment (4.5%) | |
Investment Company (4.5%) | |
Morgan Stanley Institutional Liquidity
Funds — Money Market Portfolio —
Institutional Class (See Note G)
(Cost $992) | | | 991,626 | | | | 992 | | |
Total Investments (99.7%) (Cost $15,499) | | | 21,696 | | |
Other Assets in Excess of Liabilities (0.3%) | | | 69 | | |
Net Assets (100.0%) | | $ | 21,765 | | |
(a) Non-income producing security.
@ Value is less than $500.
ADR American Depositary Receipt.
CNY Chinese Yuan Renminbi
USD United States Dollar
The accompanying notes are an integral part of the financial statements.
6
Morgan Stanley Institutional Fund, Inc.
Annual Report — December 31, 2013
Statement of Assets and Liabilities | | December 31, 2013
(000) | |
Assets: | |
Investments in Securities of Unaffiliated Issuers, at Value (Cost $14,507) | | $ | 20,704 | | |
Investment in Security of Affiliated Issuer, at Value (Cost $992) | | | 992 | | |
Total Investments in Securities, at Value (Cost $15,499) | | | 21,696 | | |
Foreign Currency, at Value (Cost $—@) | | | — | @ | |
Due from Adviser | | | 27 | | |
Receivable for Investments Sold | | | 26 | | |
Dividends Receivable | | | 17 | | |
Tax Reclaim Receivable | | | 4 | | |
Receivable for Portfolio Shares Sold | | | 1 | | |
Receivable from Affiliate | | | — | @ | |
Other Assets | | | 17 | | |
Total Assets | | | 21,788 | | |
Liabilities: | |
Payable for Professional Fees | | | 6 | | |
Payable for Custodian Fees | | | 5 | | |
Payable for Investments Purchased | | | 5 | | |
Payable for Sub Transfer Agency Fees | | | 2 | | |
Payable for Sub Transfer Agency Fees — Class I | | | 1 | | |
Payable for Sub Transfer Agency Fees — Class L | | | — | @ | |
Payable for Transfer Agent Fees — Class I | | | — | @ | |
Payable for Transfer Agent Fees — Class A* | | | — | @ | |
Payable for Transfer Agent Fees — Class L | | | — | @ | |
Payable for Portfolio Shares Redeemed | | | 1 | | |
Payable for Administration Fees | | | 1 | | |
Payable for Directors' Fees and Expenses | | | 1 | | |
Payable for Shareholder Services Fees — Class A* | | | 1 | | |
Payable for Distribution and Shareholder Services Fees — Class L | | | — | @ | |
Other Liabilities | | | — | @ | |
Total Liabilities | | | 23 | | |
Net Assets | | $ | 21,765 | | |
Net Assets Consist Of: | |
Paid-in-Capital | | $ | 15,272 | | |
Accumulated Undistributed Net Investment Income | | | 10 | | |
Accumulated Net Realized Gain | | | 286 | | |
Unrealized Appreciation (Depreciation) on: | |
Investments | | | 6,197 | | |
Foreign Currency Translations | | | — | @ | |
Net Assets | | $ | 21,765 | | |
The accompanying notes are an integral part of the financial statements.
7
Morgan Stanley Institutional Fund, Inc.
Annual Report — December 31, 2013
Statement of Assets and Liabilities (cont'd) | | December 31, 2013
(000) | |
CLASS I: | |
Net Assets | | $ | 14,712 | | |
| Shares Outstanding $0.001 par value shares of beneficial interest (500,000,000 shares authorized) (not in 000's) | | | 896,703 | | |
Net Asset Value, Offering and Redemption Price Per Share | | $ | 16.41 | | |
CLASS A*: | |
Net Assets | | $ | 3,134 | | |
| Shares Outstanding $0.001 par value shares of beneficial interest (500,000,000 shares authorized) (not in 000's) | | | 191,735 | | |
Net Asset Value, Redemption Price Per Share | | $ | 16.34 | | |
Maximum Sales Load§§ | | | 5.25 | % | |
Maximum Sales Charge | | $ | 0.91 | | |
Maximum Offering Price Per Share | | $ | 17.25 | | |
CLASS L: | |
Net Assets | | $ | 3,908 | | |
| Shares Outstanding $0.001 par value shares of beneficial interest (500,000,000 shares authorized) (not in 000's) | | | 237,936 | | |
Net Asset Value, Offering and Redemption Price Per Share | | $ | 16.42 | | |
CLASS IS: | |
Net Assets | | $ | 11 | | |
| Shares Outstanding $0.001 par value shares of beneficial interest (500,000,000 shares authorized) (not in 000's) | | | 685 | | |
Net Asset Value, Offering and Redemption Price Per Share | | $ | 16.41 | | |
@ Amount is less than $500.
* Effective September 9, 2013, Class P and Class H shares were renamed Class A shares.
§§ Effective February 25, 2013, the Directors approved the imposition of a maximum initial sales charge of 5.25% on purchases of Class A shares of the Portfolio.
The accompanying notes are an integral part of the financial statements.
8
Morgan Stanley Institutional Fund, Inc.
Annual Report — December 31, 2013
Statement of Operations | | Year Ended
December 31, 2013
(000) | |
Investment Income: | |
Dividends from Securities of Unaffiliated Issuers (Net of $7 of Foreign Taxes Withheld) | | $ | 188 | | |
Dividends from Security of Affiliated Issuer (Note G) | | | 1 | | |
Total Investment Income | | | 189 | | |
Expenses: | |
Advisory Fees (Note B) | | | 125 | | |
Professional Fees | | | 110 | | |
Registration Fees | | | 61 | | |
Custodian Fees (Note F) | | | 26 | | |
Shareholder Services Fees — Class A* (Note D) | | | 7 | | |
Distribution and Shareholder Services Fees — Class L (Note D) | | | 14 | | |
Shareholder Reporting Fees | | | 17 | | |
Administration Fees (Note C) | | | 13 | | |
Transfer Agency Fees (Note E) | | | 9 | | |
Transfer Agency Fees — Class I (Note E) | | | — | @ | |
Transfer Agency Fees — Class A* (Note E) | | | 1 | | |
Transfer Agency Fees — Class L (Note E) | | | — | @ | |
Transfer Agency Fees — Class IS (Note E) | | | — | @ | |
Sub Transfer Agency Fees | | | 5 | | |
Sub Transfer Agency Fees — Class I | | | 1 | | |
Sub Transfer Agency Fees — Class A* | | | — | @ | |
Sub Transfer Agency Fees — Class L | | | — | @ | |
Pricing Fees | | | 5 | | |
Directors' Fees and Expenses | | | 1 | | |
Other Expenses | | | 18 | | |
Total Expenses | | | 413 | | |
Waiver of Advisory Fees (Note B) | | | (125 | ) | |
Expenses Reimbursed by Adviser (Note B) | | | (90 | ) | |
Distribution Fees — Class L Shares Waived (Note D) | | | (14 | ) | |
Rebate from Morgan Stanley Affiliate (Note G) | | | (1 | ) | |
Waiver of Transfer Agency Fees — Class IS (Note E) | | | (— | @) | |
Net Expenses | | | 183 | | |
Net Investment Income | | | 6 | | |
Realized Gain: | |
Investments Sold | | | 781 | | |
Foreign Currency Transactions | | | 1 | | |
Net Realized Gain | | | 782 | | |
Change in Unrealized Appreciation (Depreciation): | |
Investments | | | 4,685 | | |
Foreign Currency Translations | | | — | @ | |
Net Change in Unrealized Appreciation (Depreciation) | | | 4,685 | | |
Net Realized Gain and Change in Unrealized Appreciation (Depreciation) | | | 5,467 | | |
Net Increase in Net Assets Resulting from Operations | | $ | 5,473 | | |
@ Amount is less than $500.
* Effective September 9, 2013, Class P and Class H shares were renamed Class A shares.
The accompanying notes are an integral part of the financial statements.
9
Morgan Stanley Institutional Fund, Inc.
Annual Report — December 31, 2013
Statements of Changes in Net Assets | | Year Ended
December 31,
2013
(000) | | Year Ended
December 31,
2012
(000) | |
Increase (Decrease) in Net Assets: | |
Operations: | |
Net Investment Income | | $ | 6 | | | $ | 124 | | |
Net Realized Gain | | | 782 | | | | 972 | | |
Net Change in Unrealized Appreciation (Depreciation) | | | 4,685 | | | | 358 | | |
Net Increase in Net Assets Resulting from Operations | | | 5,473 | | | | 1,454 | | |
Distributions from and/or in Excess of: | |
Class I: | |
Net Investment Income | | | — | | | | (71 | ) | |
Net Realized Gain | | | (472 | ) | | | (503 | ) | |
Class A*: | |
Net Investment Income | | | — | | | | (— | @) | |
Net Realized Gain | | | (73 | ) | | | (1 | ) | |
Class H**: | |
Net Investment Income | | | — | | | | (22 | ) | |
Net Realized Gain | | | (28 | )*** | | | (209 | ) | |
Class L: | |
Net Investment Income | | | — | | | | (5 | ) | |
Net Realized Gain | | | (98 | ) | | | (35 | ) | |
Class IS: | |
Net Realized Gain | | | (— | @)@@ | | | — | | |
Total Distributions | | | (671 | ) | | | (846 | ) | |
Capital Share Transactions:(1) | |
Class I: | |
Subscribed | | | 2,820 | | | | 750 | | |
Distributions Reinvested | | | 225 | | | | 185 | | |
Redeemed | | | (324 | ) | | | (198 | ) | |
Class A*: | |
Subscribed | | | 269 | | | | — | | |
Distributions Reinvested | | | 73 | | | | — | | |
Conversion from Class H | | | 2,456 | | | | — | | |
Redeemed | | | (87 | ) | | | — | | |
Class H**: | |
Subscribed | | | 259 | *** | | | 3,052 | | |
Distributions Reinvested | | | 28 | *** | | | 222 | | |
Conversion to Class A | | | (2,456 | )*** | | | — | | |
Redeemed | | | (1,896 | )*** | | | (591 | ) | |
Class L: | |
Subscribed | | | 3,193 | | | | 537 | | |
Distributions Reinvested | | | 88 | | | | 25 | | |
Redeemed | | | (688 | ) | | | (51 | ) | |
Class IS: | |
Subscribed | | | 10 | @@ | | | — | | |
Net Increase in Net Assets Resulting from Capital Share Transactions | | | 3,970 | | | | 3,931 | | |
Total Increase in Net Assets | | | 8,772 | | | | 4,539 | | |
Net Assets: | |
Beginning of Period | | | 12,993 | | | | 8,454 | | |
End of Period (Including Undistributed Net Investment Income of $10 and $4) | | $ | 21,765 | | | $ | 12,993 | | |
The accompanying notes are an integral part of the financial statements.
10
Morgan Stanley Institutional Fund, Inc.
Annual Report — December 31, 2013
Statements of Changes in Net Assets (cont'd) | | Year Ended
December 31,
2013
(000) | | Year Ended
December 31,
2012
(000) | |
(1) Capital Share Transactions: | |
Class I: | |
Shares Subscribed | | | 211 | | | | 57 | | |
Shares Issued on Distributions Reinvested | | | 15 | | | | 15 | | |
Shares Redeemed | | | (22 | ) | | | (15 | ) | |
Net Increase in Class I Shares Outstanding | | | 204 | | | | 57 | | |
Class A*: | |
Shares Subscribed | | | 20 | | | | — | | |
Shares Issued on Distributions Reinvested | | | 5 | | | | — | | |
Conversion from Class H | | | 172 | | | | — | | |
Shares Redeemed | | | (6 | ) | | | — | | |
Net Increase in Class A Shares Outstanding | | | 191 | | | | — | | |
Class H**: | |
Shares Subscribed | | | 20 | *** | | | 237 | | |
Shares Issued on Distributions Reinvested | | | 2 | *** | | | 18 | | |
Conversion to Class A | | | (172 | )*** | | | — | | |
Shares Redeemed | | | (146 | )*** | | | (47 | ) | |
Net Increase (Decrease) in Class H Shares Outstanding | | | (296 | ) | | | 208 | | |
Class L: | |
Shares Subscribed | | | 222 | | | | 42 | | |
Shares Issued on Distributions Reinvested | | | 6 | | | | 2 | | |
Shares Redeemed | | | (48 | ) | | | (4 | ) | |
Net Increase in Class L Shares Outstanding | | | 180 | | | | 40 | | |
Class IS: | |
Shares Subscribed | | | 1 | @@ | | | — | | |
@ Amount is less than $500.
@@ For the period September 13, 2013 through December 31, 2013.
* Effective September 9, 2013, Class P shares were renamed Class A shares.
** Effective September 9, 2013, Class H shares converted into Class A shares.
*** For the period January 1, 2013 through September 6, 2013.
The accompanying notes are an integral part of the financial statements.
11
Morgan Stanley Institutional Fund, Inc.
Annual Report — December 31, 2013
Financial Highlights
Advantage Portfolio
| | | Class I** | |
| | | Year Ended December 31, | | Period from
September 1, 2010
to December 31, | | Year Ended August 31, | |
Selected Per Share Data and Ratios | | 2013 | | 2012 | | 2011 | | 2010 | | 2010 | | 2009 | |
Net Asset Value, Beginning of Period | | $ | 12.40 | | | $ | 11.38 | | | $ | 10.87 | | | $ | 9.15 | | | $ | 7.97 | | | $ | 9.55 | | |
Income (Loss) from Investment Operations: | |
Net Investment Income† | | | 0.01 | | | | 0.14 | | | | 0.04 | | | | 0.01 | | | | 0.04 | | | | 0.03 | | |
Net Realized and Unrealized Gain (Loss) | | | 4.54 | | | | 1.72 | | | | 0.54 | | | | 1.74 | | | | 1.19 | | | | (1.50 | ) | |
Total from Investment Operations | | | 4.55 | | | | 1.86 | | | | 0.58 | | | | 1.75 | | | | 1.23 | | | | (1.47 | ) | |
Distributions from and/or in Excess of: | |
Net Investment Income | | | — | | | | (0.10 | ) | | | (0.07 | ) | | | (0.03 | ) | | | (0.05 | ) | | | (0.11 | ) | |
Net Realized Gain | | | (0.54 | ) | | | (0.74 | ) | | | — | | | | — | | | | — | | | | — | | |
Total Distributions | | | (0.54 | ) | | | (0.84 | ) | | | (0.07 | ) | | | (0.03 | ) | | | (0.05 | ) | | | (0.11 | ) | |
Net Asset Value, End of Period | | $ | 16.41 | | | $ | 12.40 | | | $ | 11.38 | | | $ | 10.87 | | | $ | 9.15 | | | $ | 7.97 | | |
Total Return++ | | | 37.11 | % | | | 16.38 | % | | | 5.33 | % | | | 19.30 | %# | | | 15.34 | % | | | (15.05 | )% | |
Ratios and Supplemental Data: | |
Net Assets, End of Period (Thousands) | | $ | 14,712 | | | $ | 8,595 | | | $ | 7,239 | | | $ | 5,015 | | | $ | 4,223 | | | $ | 3,667 | | |
Ratio of Expenses to Average Net Assets (1) | | | 1.04 | %+ | | | 1.05 | %+†† | | | 1.05 | %+†† | | | 1.02 | %+††* | | | 1.05 | % | | | 1.05 | % | |
Ratio of Expenses to Average Net Assets Excluding
Non Operating Expenses | | | N/A | | | | N/A | | | | N/A | | | | 0.25 | %+††* | | | N/A | | | | N/A | | |
Ratio of Net Investment Income to Average
Net Assets (1) | | | 0.11 | %+ | | | 1.08 | %+†† | | | 0.39 | %+†† | | | 0.42 | %+††* | | | 0.49 | % | | | 0.49 | % | |
Ratio of Rebate from Morgan Stanley Affiliates to
Average Net Assets | | | 0.01 | % | | | 0.00 | %††§ | | | 0.00 | %††§ | | | 0.03 | %††* | | | N/A | | | | N/A | | |
Portfolio Turnover Rate | | | 36 | % | | | 50 | % | | | 28 | % | | | 33 | %# | | | 32 | % | | | 14 | % | |
(1) Supplemental Information on the Ratios to Average Net Assets: | |
Ratios Before Expense Limitation: | |
Expenses to Average Net Assets | | | 2.33 | % | | | 2.34 | %†† | | | 3.43 | %†† | | | 3.49 | %+††* | | | 4.49 | % | | | 11.78 | % | |
Net Investment Loss to Average Net Assets | | | (1.18 | )% | | | (0.21 | )%†† | | | (1.99 | )%†† | | | (2.05 | )%+††* | | | (2.95 | )% | | | (10.24 | )% | |
** On May 21, 2010, the Portfolio acquired substantially all of the assets and liabilities of the Van Kampen Core Growth Fund ("the Predecessor Fund"). Therefore, the per share data and ratios of Class I shares for the 12-month period ended August 31, 2010 and prior years reflect the historical per share data of Class I shares of the Predecessor Fund.
† Per share amount is based on average shares outstanding.
++ Calculated based on the net asset value as of the last business day of the period.
+ The Ratios of Expenses and Net Investment Income reflect the rebate of certain Portfolio expenses in connection with the investments in Morgan Stanley affiliates during the period. The effect of the rebate on the ratios is disclosed in the above table as "Ratio of Rebate from Morgan Stanley Affiliates to Average Net Assets."
†† Reflects overall Portfolio ratios for investment income and non-class specific expenses.
§ Amount is less than 0.005%.
# Not Annualized.
* Annualized.
The accompanying notes are an integral part of the financial statements.
12
Morgan Stanley Institutional Fund, Inc.
Annual Report — December 31, 2013
Financial Highlights
Advantage Portfolio
| | | Class A@ | |
| | | Year Ended December 31, | | Period from
September 1, 2010
to December 31, | | Period from
May 21, 2010^
to August 31, | |
Selected Per Share Data and Ratios | | 2013 | | 2012 | | 2011 | | 2010 | | 2010 | |
Net Asset Value, Beginning of Period | | $ | 12.39 | | | $ | 11.37 | | | $ | 10.86 | | | $ | 9.15 | | | $ | 9.00 | | |
Income (Loss) from Investment Operations: | |
Net Investment Income (Loss)† | | | (0.07 | ) | | | 0.11 | | | | 0.02 | | | | 0.01 | | | | 0.01 | | |
Net Realized and Unrealized Gain | | | 4.56 | | | | 1.72 | | | | 0.53 | | | | 1.73 | | | | 0.14 | | |
Total from Investment Operations | | | 4.49 | | | | 1.83 | | | | 0.55 | | | | 1.74 | | | | 0.15 | | |
Distributions from and/or in Excess of: | |
Net Investment Income | | | — | | | | (0.07 | ) | | | (0.04 | ) | | | (0.03 | ) | | | — | | |
Net Realized Gain | | | (0.54 | ) | | | (0.74 | ) | | | — | | | | — | | | | — | | |
Total Distributions | | | (0.54 | ) | | | (0.81 | ) | | | (0.04 | ) | | | (0.03 | ) | | | — | | |
Net Asset Value, End of Period | | $ | 16.34 | | | $ | 12.39 | | | $ | 11.37 | | | $ | 10.86 | | | $ | 9.15 | | |
Total Return++ | | | 36.65 | % | | | 16.11 | % | | | 5.07 | % | | | 19.16 | %# | | | 1.56 | %# | |
Ratios and Supplemental Data: | |
Net Assets, End of Period (Thousands) | | $ | 3,134 | | | $ | 12 | | | $ | 11 | | | $ | 10 | | | $ | 1 | | |
Ratio of Expenses to Average Net Assets (1) | | | 1.35 | %+^^ | | | 1.30 | %+†† | | | 1.30 | %+†† | | | 1.29 | %+††* | | | 1.30 | %††* | |
Ratio of Expenses to Average Net Assets Excluding
Non Operating Expenses | | | N/A | | | | N/A | | | | N/A | | | | 0.52 | %+††* | | | N/A | | |
Ratio of Net Investment Income (Loss) to Average Net Assets (1) | | | (0.44 | )%+ | | | 0.83 | %+†† | | | 0.14 | %+†† | | | 0.15 | %+††* | | | 0.27 | %††* | |
Ratio of Rebate from Morgan Stanley Affiliates to Average Net Assets | | | 0.00 | %§ | | | 0.00 | %§†† | | | 0.00 | %§†† | | | 0.03 | %††* | | | N/A | | |
Portfolio Turnover Rate | | | 36 | % | | | 50 | % | | | 28 | % | | | 33 | %# | | | 32 | %# | |
(1) Supplemental Information on the Ratios to Average Net Assets: | |
Ratios Before Expense Limitation: | |
Expenses to Average Net Assets | | | 2.68 | % | | | 2.59 | %†† | | | 3.68 | %†† | | | 3.76 | %+†† | | | 2.59 | %††* | |
Net Investment Loss to Average Net Assets | | | (1.77 | )% | | | (0.46 | )%†† | | | (2.24 | )%†† | | | (2.32 | )%+†† | | | (1.02 | )%††* | |
@ Effective September 9, 2013, Class P and Class H shares were renamed Class A shares.
^ Commencement of Operations.
† Per share amount is based on average shares outstanding.
++ Calculated based on the net asset value which does not reflect sales charges, if applicable, as of the last business day of the period.
+ The Ratios of Expenses and Net Investment Income (Loss) reflect the rebate of certain Portfolio expenses in connection with the investments in Morgan Stanley affiliates during the period. The effect of the rebate on the ratios is disclosed in the above table as "Ratio of Rebate from Morgan Stanley Affiliates to Average Net Assets."
^^ Effective September 16, 2013, the Adviser has agreed to limit the ratio of expenses to average net assets to the maximum ratio of 1.40% for Class A shares. Prior to September 16, 2013, the maximum ratio was 1.30% for Class A shares.
†† Reflects overall Portfolio ratios for investment income and non-class specific expenses.
§ Amount is less than 0.005%.
# Not Annualized.
* Annualized.
The accompanying notes are an integral part of the financial statements.
13
Morgan Stanley Institutional Fund, Inc.
Annual Report — December 31, 2013
Financial Highlights
Advantage Portfolio
| | | Class L** | |
| | | Year Ended December 31, | | Period from
September 1, 2010
to December 31, | | Year Ended August 31, | |
Selected Per Share Data and Ratios | | 2013 | | 2012 | | 2011 | | 2010 | | 2010 | | 2009 | |
Net Asset Value, Beginning of Period | | $ | 12.42 | | | $ | 11.39 | | | $ | 10.89 | | | $ | 9.16 | | | $ | 7.96 | | | $ | 9.54 | | |
Income (Loss) from Investment Operations: | |
Net Investment Income (Loss)† | | | (0.01 | ) | | | 0.13 | | | | 0.04 | | | | 0.01 | | | | 0.04 | | | | 0.00 | ‡ | |
Net Realized and Unrealized Gain (Loss) | | | 4.55 | | | | 1.74 | | | | 0.52 | | | | 1.75 | | | | 1.19 | | | | (1.50 | ) | |
Total from Investment Operations | | | 4.54 | | | | 1.87 | | | | 0.56 | | | | 1.76 | | | | 1.23 | | | | (1.50 | ) | |
Distributions from and/or in Excess of: | |
Net Investment Income | | | — | | | | (0.10 | ) | | | (0.06 | ) | | | (0.03 | ) | | | (0.03 | ) | | | (0.08 | ) | |
Net Realized Gain | | | (0.54 | ) | | | (0.74 | ) | | | — | | | | — | | | | — | | | | — | | |
Total Distributions | | | (0.54 | ) | | | (0.84 | ) | | | (0.06 | ) | | | (0.03 | ) | | | (0.03 | ) | | | (0.08 | ) | |
Net Asset Value, End of Period | | $ | 16.42 | | | $ | 12.42 | | | $ | 11.39 | | | $ | 10.89 | | | $ | 9.16 | | | $ | 7.96 | | |
Total Return++ | | | 36.97 | % | | | 16.42 | % | | | 5.19 | % | | | 19.20 | %# | | | 15.43 | % | | | (15.40 | )% | |
Ratios and Supplemental Data: | |
Net Assets, End of Period (Thousands) | | $ | 3,908 | | | $ | 722 | | | $ | 208 | | | $ | 155 | | | $ | 156 | | | $ | 160 | | |
Ratio of Expenses to Average Net Assets (1) | | | 1.08 | %+^ | | | 1.09 | %+†† | | | 1.09 | %+†† | | | 1.06 | %+††* | | | 1.08 | % | | | 1.48 | % | |
Ratio of Expenses to Average Net Assets Excluding
Non Operating Expenses | | | N/A | | | | N/A | | | | N/A | | | | 0.29 | %+††* | | | N/A | | | | N/A | | |
Ratio of Net Investment Income (Loss) to Average
Net Assets (1) | | | (0.06 | )%+ | | | 1.04 | %+†† | | | 0.35 | %+†† | | | 0.38 | %+††* | | | 0.45 | % | | | (0.01 | )% | |
Ratio of Rebate from Morgan Stanley Affiliates to
Average Net Assets | | | 0.01 | % | | | 0.00 | %††§ | | | 0.00 | %††§ | | | 0.03 | %††* | | | N/A | | | | N/A | | |
Portfolio Turnover Rate | | | 36 | % | | | 50 | % | | | 28 | % | �� | | 33 | %# | | | 32 | % | | | 14 | % | |
(1) Supplemental Information on the Ratios to Average Net Assets: | |
Ratios Before Expense Limitation: | |
Expenses to Average Net Assets | | | 3.10 | % | | | 3.09 | %†† | | | 4.18 | %†† | | | 3.53 | %+††* | | | 4.53 | % | | | 12.27 | % | |
Net Investment Loss to Average Net Assets | | | (2.08 | )% | | | (0.96 | )%†† | | | (2.74 | )%†† | | | (2.09 | )%+††* | | | (3.00 | )% | | | (10.80 | )% | |
** On May 21, 2010, the Portfolio acquired substantially all of the assets and liabilities of the Van Kampen Core Growth Fund ("the Predecessor Fund"). Therefore, the per share data and ratios of Class L shares for the 12-month period ended August 31, 2010 and prior years reflect the historical per share data of Class C shares of the Predecessor Fund.
† Per share amount is based on average shares outstanding.
‡ Amount is less than $0.005 per share.
++ Calculated based on the net asset value as of the last business day of the period.
+ The Ratios of Expenses and Net Investment Income (Loss) reflect the rebate of certain Portfolio expenses in connection with the investments in Morgan Stanley affiliates during the period. The effect of the rebate on the ratios is disclosed in the above table as "Ratio of Rebate from Morgan Stanley Affiliates to Average Net Assets."
^ Effective September 16, 2013, the Adviser has agreed to limit the ratio of expenses to average net assets to the maximum ratio of 1.19% for Class L shares. Prior to September 16, 2013, the maximum ratio was 1.09% for Class L shares.
†† Reflects overall Portfolio ratios for investment income and non-class specific expenses.
§ Amount is less than 0.005%.
# Not Annualized.
* Annualized.
The accompanying notes are an integral part of the financial statements.
14
Morgan Stanley Institutional Fund, Inc.
Annual Report — December 31, 2013
Financial Highlights
Advantage Portfolio
| | | Class IS | |
Selected Per Share Data and Ratios | | Period from
September 13, 2013^ to
December 31, 2013 | |
Net Asset Value, Beginning of Period | | $ | 14.59 | | |
Income (Loss) from Investment Operations: | |
Net Investment Loss† | | | (0.01 | ) | |
Net Realized and Unrealized Gain | | | 2.21 | | |
Total from Investment Operations | | | 2.20 | | |
Distributions from and/or in Excess of: | |
Net Realized Gain | | | (0.38 | ) | |
Net Asset Value, End of Period | | $ | 16.41 | | |
Total Return++ | | | 15.15 | %# | |
Ratios and Supplemental Data: | |
Net Assets, End of Period (Thousands) | | $ | 11 | | |
Ratio of Expenses to Average Net Assets (1) | | | 1.01 | %+^^* | |
Ratio of Net Investment Loss to Average Net Assets (1) | | | (0.25 | )%+* | |
Ratio of Rebate from Morgan Stanley Affiliates to Average Net Assets | | | 0.00 | %§* | |
Portfolio Turnover Rate | | | 36 | %# | |
(1) Supplemental Information on the Ratios to Average Net Assets: | |
Ratios Before Expense Limitation: | |
Expenses to Average Net Assets | | | 7.31 | %* | |
Net Investment Loss to Average Net Assets | | | (6.55 | )%* | |
^ Commencement of Operations.
† Per share amount is based on average shares outstanding.
++ Calculated based on the net asset value as of the last business day of the period.
+ The Ratios of Expenses and Net Investment Loss reflect the rebate of certain Portfolio expenses in connection with the investments in Morgan Stanley affiliates during the period. The effect of the rebate on the ratios is disclosed in the above table as "Ratio of Rebate from Morgan Stanley Affiliates to Average Net Assets."
^^ Effective September 16, 2013, the Adviser has agreed to limit the ratio of expenses to average net assets to the maximum ratio of 1.01% for Class IS shares.
§ Amount is less than 0.005%.
# Not Annualized.
* Annualized.
The accompanying notes are an integral part of the financial statements.
15
Morgan Stanley Institutional Fund, Inc.
Annual Report — December 31, 2013
Notes to Financial Statements
Morgan Stanley Institutional Fund, Inc. (the "Fund") is registered under the Investment Company Act of 1940, as amended (the "Act"), as an open-end management investment company. The Fund is comprised of twenty-seven separate, active, diversified and non-diversified portfolios (individually referred to as a "Portfolio", collectively as the "Portfolios").
The accompanying financial statements relate to the Advantage Portfolio. The Portfolio seeks long-term capital appreciation. The Portfolio seeks to achieve the investment objective by investing primarily in established companies with capitalizations within the range of companies included in the Russell 1000® Growth Index. The Portfolio offers four classes of shares — Class I, Class A, Class L and Class IS.
On September 16, 2013, the Portfolio commenced offering Class IS shares. Effective September 9, 2013, Class P and Class H shares were renamed Class A shares.
A. Significant Accounting Policies: The following significant accounting policies are in conformity with U.S. generally accepted accounting principles ("GAAP"). Such policies are consistently followed by the Fund in the preparation of its financial statements. GAAP may require management to make estimates and assumptions that affect the reported amounts and disclosures in the financial statements. Actual results may differ from those estimates.
1. Security Valuation: (1) An equity portfolio security listed or traded on an exchange is valued at its latest reported sales price (or at the exchange official closing price if such exchange reports an official closing price), if there were no sales on a given day, the security is valued at the mean between the last reported bid and asked prices; (2) all other equity portfolio securities for which over-the-counter market quotations are readily available are valued at its latest reported sales price. In cases where a security is traded on more than one exchange, the security is valued on the exchange designated as the primary market; (3) listed options are valued at the last reported sales price on the exchange on which they are listed (or at the exchange official closing price if such exchange reports an official closing price). If an official closing price or last reported sale price is unavailable, the listed option should be fair valued at the mean between its latest bid and ask prices. Unlisted options are valued by an outside pricing service approved by the Fund's Board of Directors (the "Directors") or quotes from a broker or dealer; (4) when market quotations are not readily available, including circumstances under which
Morgan Stanley Investment Management Inc. (the "Adviser") determines that the closing price, last sale price or the mean between the last reported bid and asked prices are not reflective of a security's market value, portfolio securities are valued at their fair value as determined in good faith under procedures established by and under the general supervision of the Directors. Occasionally, developments affecting the closing prices of securities and other assets may occur between the times at which valuations of such securities are determined (that is, close of the foreign market on which the securities trade) and the close of business of the New York Stock Exchange ("NYSE"). If developments occur during such periods that are expected to materially affect the value of such securities, such valuations may be adjusted to reflect the estimated fair value of such securities as of the close of the NYSE, as determined in good faith by the Directors or by the Adviser using a pricing service and/or procedures approved by the Directors; (5) quotations of foreign portfolio securities, other assets and liabilities and forward contracts stated in foreign currency are translated into U.S. dollar equivalents at the prevailing market rates prior to the close of the NYSE; (6) investments in mutual funds, including the Morgan Stanley Institutional Liquidity Funds, are valued at the net asset value as of the close of each business day; and (7) short-term debt securities with remaining maturities of 60 days or less at the time of purchase may be valued at amortized cost, unless the Adviser determines such valuation does not reflect the securities' market value, in which case these securities will be valued at their fair market value determined by the Adviser.
Under procedures approved by the Directors, the Fund's Adviser has formed a Valuation Committee. The Valuation Committee provides administration and oversight of the Fund's valuation policies and procedures, which are reviewed at least annually by the Directors. These procedures allow the Fund to utilize independent pricing services, quotations from securities and financial instrument dealers, and other market sources to determine fair value.
The Fund has procedures to determine the fair value of securities and other financial instruments for which market prices are not readily available. Under these procedures, the Valuation Committee convenes on a regular and ad hoc basis to review such securities and considers a number of factors, including valuation methodologies
16
Morgan Stanley Institutional Fund, Inc.
Annual Report — December 31, 2013
Notes to Financial Statements (cont'd)
and significant unobservable valuation inputs, when arriving at fair value. The Valuation Committee may employ a market-based approach which may use related or comparable assets or liabilities, recent transactions, market multiples, book values, and other relevant information for the investment to determine the fair value of the investment. An income-based valuation approach may also be used in which the anticipated future cash flows of the investment are discounted to calculate fair value. Discounts may also be applied due to the nature or duration of any restrictions on the disposition of the investments. Due to the inherent uncertainty of valuations of such investments, the fair values may differ significantly from the values that would have been used had an active market existed. The Valuation Committee employs various methods for calibrating these valuation approaches including a regular review of valuation methodologies, key inputs and assumptions, transactional back-testing or disposition analysis, and reviews of any related market activity.
2. Fair Value Measurement: Financial Accounting Standards Board ("FASB") Accounting Standards CodificationTM ("ASC") 820, "Fair Value Measurements and Disclosures" ("ASC 820"), defines fair value as the value that the Fund would receive to sell an investment or pay to transfer a liability in a timely transaction with an independent buyer in the principal market, or in the absence of a principal market the most advantageous market for the investment or liability. ASC 820 establishes a three-tier hierarchy to distinguish between (1) inputs that reflect the assumptions market participants would use in valuing an asset or liability developed based on market data obtained from sources independent of the reporting entity (observable inputs) and (2) inputs that reflect the reporting entity's own assumptions about the assumptions market participants would use in valuing an asset or liability developed based on the best information available in the circumstances (unobservable inputs) and to establish classification of fair value measurements for disclosure purposes. Various inputs are used in determining the value of the Fund's investments. The inputs are summarized in the three broad levels listed below.
• Level 1 – unadjusted quoted prices in active markets for identical investments
• Level 2 – other significant observable inputs (including quoted prices for similar investments, interest rates, prepayment speeds, credit risk, etc.)
• Level 3 – significant unobservable inputs including the Fund's own assumptions in determining the fair value of investments. Factors considered in making this determination may include, but are not limited to, information obtained by contacting the issuer, analysts, or the appropriate stock exchange (for exchange-traded securities), analysis of the issuer's financial statements or other available documents and, if necessary, available information concerning other securities in similar circumstances
The inputs or methodology used for valuing securities are not necessarily an indication of the risk associated with investing in those securities and the determination of the significance of a particular input to the fair value measurement in its entirety requires judgment and considers factors specific to each security.
The following is a summary of the inputs used to value the Portfolio's investments as of December 31, 2013.
Investment Type | | Level 1
Unadjusted
quoted
prices
(000) | | Level 2
Other
significant
observable
inputs
(000) | | Level 3
Significant
unobservable
inputs
(000) | | Total
(000) | |
Assets: | |
Common Stocks | |
Asset Management &
Custodian | | $ | 327 | | | $ | — | | | $ | — | | | $ | 327 | | |
Beverage: Soft Drinks | | | 1,164 | | | | — | | | | — | | | | 1,164 | | |
Commercial Services | | | 596 | | | | — | | | | — | | | | 596 | | |
Communications
Technology | | | 622 | | | | — | | | | — | | | | 622 | | |
Computer Services,
Software & Systems | | | 4,182 | | | | — | | | | — | | | | 4,182 | | |
Computer Technology | | | 647 | | | | — | | | | — | | | | 647 | | |
Consumer Lending | | | 2,089 | | | | — | | | | — | | | | 2,089 | | |
Diversified Media | | | 653 | | | | — | | | | — | | | | 653 | | |
Diversified Retail | | | 2,437 | | | | — | | | | — | | | | 2,437 | | |
Financial Data & Systems | | | 625 | | | | — | | | | — | | | | 625 | | |
Foods | | | 918 | | | | — | | | | — | | | | 918 | | |
Insurance:
Property-Casualty | | | 984 | | | | — | | | | — | | | | 984 | | |
Pharmaceuticals | | | 1,841 | | | | — | | | | — | | | | 1,841 | | |
Recreational Vehicles &
Boats | | | 539 | | | | — | | | | — | | | | 539 | | |
Restaurants | | | 1,292 | | | | — | | | | — | | | | 1,292 | | |
Scientific Instruments:
Gauges & Meters | | | 550 | | | | — | | | | — | | | | 550 | | |
Textiles Apparel & Shoes | | | 1,227 | | | | — | | | | — | | | | 1,227 | | |
Total Common Stocks | | | 20,693 | | | | — | | | | — | | | | 20,693 | | |
Call Options Purchased | | | — | | | | 11 | | | | — | | | | 11 | | |
Short-Term Investments | |
Investment Company | | | 992 | | | | — | | | | — | | | | 992 | | |
Total Assets | | $ | 21,685 | | | $ | 11 | | | $ | — | | | $ | 21,696 | | |
17
Morgan Stanley Institutional Fund, Inc.
Annual Report — December 31, 2013
Notes to Financial Statements (cont'd)
Transfers between investment levels may occur as the markets fluctuate and/or the availability of data used in an investment's valuation changes. The Portfolio recognizes transfers between the levels as of the end of the period. As of December 31, 2013, securities with a total value of approximately $1,092,000 transferred from Level 2 to Level 1. At December 31, 2012, the fair value of certain securities were adjusted due to developments which occurred between the time of the close of the foreign markets on which they trade and the close of business on the NYSE which resulted in their Level 2 classification.
Following is a reconciliation of investments in which significant unobservable inputs (Level 3) were used in determining fair value.
Advantage | | Convertible
Preferred
Stock
(000) | |
Beginning Balance | | $ | 4 | | |
Purchases | | | — | | |
Sales | | | — | | |
Amortization of discount | | | — | | |
Transfers in | | | — | | |
Transfers out | | | — | | |
Change in unrealized appreciation/depreciation | | | 28 | | |
Realized gains (losses) | | | (32 | ) | |
Ending Balance | | $ | — | | |
Net change in unrealized appreciation/depreciation from
investments still held as of December 31, 2013 | | $ | — | | |
3. Foreign Currency Translation and Foreign Investments: The books and records of the Portfolio are maintained in U.S. dollars. Foreign currency amounts are translated into U.S. dollars as follows:
– investments, other assets and liabilities at the prevailing rate of exchange on the valuation date;
– investment transactions and investment income at the prevailing rates of exchange on the dates of such transactions.
Although the net assets of the Portfolio are presented at the foreign exchange rates and market values at the close of the period, the Portfolio does not isolate that portion of the results of operations arising as a result of changes in the foreign exchange rates from the fluctuations arising from changes in the market prices of securities held at period end. Similarly, the Portfolio does not isolate the effect of changes in foreign exchange rates from the fluctuations arising from changes in the market prices of
securities sold during the period. Accordingly, realized and unrealized foreign currency gains (losses) on investments in securities are included in the reported net realized and unrealized gains (losses) on investment transactions and balances. However, pursuant to U.S. Federal income tax regulations, gains and losses from certain foreign currency transactions and the foreign currency portion of gains and losses realized on sales and maturities of foreign denominated debt securities are treated as ordinary income for U.S. Federal income tax purposes.
Net realized gains (losses) on foreign currency transactions represent net foreign exchange gains (losses) from foreign currency forward exchange contracts, disposition of foreign currencies, currency gains (losses) realized between the trade and settlement dates on securities transactions, and the difference between the amount of investment income and foreign withholding taxes recorded on the Portfolio's books and the U.S. dollar equivalent amounts actually received or paid. Net unrealized currency gains (losses) from valuing foreign currency denominated assets and liabilities at period end exchange rates are reflected as a component of unrealized appreciation (depreciation) on the Statement of Assets and Liabilities. The change in unrealized currency gains (losses) on foreign currency translations for the period is reflected in the Statement of Operations.
Foreign security and currency transactions may involve certain considerations and risks not typically associated with those of U.S. dollar denominated transactions as a result of, among other factors, fluctuations of exchange rates in relation to the U.S. dollar, the possibility of lower levels of governmental supervision and regulation of foreign securities markets and the possibility of political or economic instability.
Governmental approval for foreign investments may be required in advance of making an investment under certain circumstances in some countries, and the extent of foreign investments in domestic companies may be subject to limitation in other countries. Foreign ownership limitations also may be imposed by the charters of individual companies to prevent, among other concerns, violations of foreign investment limitations. As a result, an additional class of shares (identified as "Foreign" in the Portfolio of Investments) may be created and offered
18
Morgan Stanley Institutional Fund, Inc.
Annual Report — December 31, 2013
Notes to Financial Statements (cont'd)
for investment. The "local" and "foreign shares" market values may differ. In the absence of trading of the foreign shares in such markets, the Portfolio values the foreign shares at the closing exchange price of the local shares.
4. Derivatives: The Portfolio may, but is not required to, use derivative instruments for a variety of purposes, including hedging, risk management, portfolio management or to earn income. Derivatives are financial instruments whose value is based, in part, on the value of an underlying asset, interest rate, index or financial instrument. Prevailing interest rates and volatility levels, among other things, also affect the value of derivative instruments. A derivative instrument often has risks similar to its underlying asset and may have additional risks, including imperfect correlation between the value of the derivative and the underlying asset, risks of default by the counterparty to certain transactions, magnification of losses incurred due to changes in the market value of the securities, instruments, indices or interest rates to which they relate, and risks that the transactions may not be liquid. The use of derivatives involves risks that are different from, and possibly greater than, the risks associated with other portfolio investments. Derivatives may involve the use of highly specialized instruments that require investment techniques and risk analyses different from those associated with other portfolio investments. All of the Portfolio's holdings, including derivative instruments, are marked-to-market each day with the change in value reflected in unrealized appreciation (depreciation). Upon disposition, a realized gain or loss is recognized.
Certain derivative transactions may give rise to a form of leverage. Leverage magnifies the potential for gain and the risk of loss. Leverage associated with derivative transactions may cause the Portfolio to liquidate portfolio positions when it may not be advantageous to do so to satisfy its obligations or to meet earmarking or segregation requirements, pursuant to applicable Securities and Exchange Commission rules and regulations, or may cause the Portfolio to be more volatile than if the Portfolio had not been leveraged. Although the Adviser seeks to use derivatives to further the Portfolio's investment objectives, there is no assurance that the use of derivatives will achieve this result.
Following is a description of the derivative instruments and techniques that the Portfolio used during the period and their associated risks:
Options: In respect to options, the Portfolio is subject to equity risk, interest rate risk and foreign currency exchange risk in the normal course of pursuing its investment objectives. If the Portfolio buys an option, it buys a legal contract giving it the right to buy or sell a specific amount of the underlying instrument or futures contract on the underlying instrument such a as security, currency or index, at an agreed upon price typically in exchange for a premium paid by the Portfolio. The Portfolio may purchase put and call options. Purchasing call options tends to increase the Portfolio's exposure to the underlying (or similar) instrument. Purchasing put options tends to decrease the Portfolio's exposure to the underlying (or similar) instrument. When entering into purchased option contracts, the Portfolio bears the risk of interest or exchange rates or securities prices moving unexpectedly, in which case, the Portfolio may not achieve the anticipated benefits of the purchased option contracts; however the risk of loss is limited to the premium paid. Purchased options are reported as part of "Total Investments" on the Statement of Assets and Liabilities. Premium paid for purchasing options which expired are treated as realized losses. If the Portfolio sells an option, it sells to another party the right to buy from or sell to the Portfolio a specific amount of the underlying instrument or futures contract on the underlying instrument at an agreed upon price typically in exchange for a premium received by the Portfolio. There is the risk the Portfolio may not be able to enter into a closing transaction because of an illiquid market. A decision as to whether, when and how to use options involves the exercise of skill and judgment and even a well-conceived option transaction may be unsuccessful because of market behavior or unexpected events. The prices of options can be highly volatile and the use of options can lower total returns.
FASB ASC 815, "Derivatives and Hedging: Overall" ("ASC 815"), is intended to improve financial reporting about derivative instruments by requiring enhanced disclosures to enable investors to better understand how and why the Portfolio uses derivative instruments, how these derivative instruments are accounted for and their
19
Morgan Stanley Institutional Fund, Inc.
Annual Report — December 31, 2013
Notes to Financial Statements (cont'd)
effects on the Portfolio's financial position and results of operations.
The following table sets forth the fair value of the Portfolio's derivative contracts by primary risk exposure as of December 31, 2013.
| | | Asset Derivatives
Statement of Assets and
Liabilities Location | | Primary Risk
Exposure | | Value
(000) | |
Options Purchased | | Investments, at Value
(Options Purchased) | | Currency Risk | | $ | 11 | + | |
+ Amounts are included in Investments in the Statement of Assets and Liabilities.
The following table set forth by primary risk exposure the Portfolio's change in unrealized appreciation (depreciation) by type of derivative contract for the year ended December 31, 2013 in accordance with ASC 815.
Change in Unrealized Appreciation (Depreciation) | |
Primary Risk Exposure | | Derivative Type | | Value
(000) | |
Currency Risk | | Investments
(Options Purchased) | | $ | (9 | )++ | |
++ Amounts are included in Investments in the Statement of Operations.
At December 31, 2013, the Portfolio's derivative assets and liabilities are as follows:
Gross Amounts of Assets and Liabilities Presented in the
Statement of Assets and Liabilities | |
Derivatives | | Assets(a)
(000) | | Liabilities(a)
(000) | |
Options Purchased | | $ | 11 | | | | — | | |
(a) Absent an event of default or early termination, OTC derivative assets and liabilities are presented gross and not offset in the Statement of Assets and Liabilities.
The following table presents derivative financial instruments that are subject to enforceable netting arrangements as of December 31, 2013.
Gross Amounts Not Offset in the Statement of Assets and Liabilities | |
Counterparty | | Gross Asset
Derivatives
Presented in
Statement of
Assets and Liabilities
(000) | | Financial
Instrument
(000) | | Collateral
Received
(000) | | Net Amount
(not less
than 0)
(000) | |
Royal Bank of Scotland | | $ | 11 | | | | — | | | | — | | | $ | 11 | | |
For the year ended December 31, 2013, the approximate average monthly amount outstanding for each derivative type is as follows:
Options Purchased: | |
Average monthly notional amount | | | 535,000 | | |
5. Indemnifications: The Fund enters into contracts that contain a variety of indemnifications. The Fund's maximum exposure under these arrangements is unknown. However, the Fund has not had prior claims or losses
pursuant to these contracts and expects the risk of loss to be remote.
6. Dividends and Distributions to Shareholders: Dividend income and distributions to shareholders are recorded on the ex-dividend date. Dividends from net investment income, if any, are declared and paid semiannually. Net realized capital gains, if any, are distributed at least annually.
7. Security Transactions, Income and Expenses: Security transactions are accounted for on the trade date (date the order to buy or sell is executed). Realized gains and losses on the sale of investment securities are determined on the specific identified cost method. Dividend income and other distributions are recorded on the ex-dividend date (except for certain foreign dividends which may be recorded as soon as the Portfolio is informed of such dividends) net of applicable withholding taxes. Interest income is recognized on the accrual basis except where collection is in doubt. Discounts are accreted and premiums are amortized over the life of the respective securities. Most expenses of the Fund can be directly attributed to a particular Portfolio. Expenses which cannot be directly attributed are apportioned among the Portfolios based upon relative net assets or other appropriate methods. Income, expenses (other than class specific expenses — distribution, transfer agency and sub transfer agency fees) and realized and unrealized gains or losses are allocated to each class of shares based upon their relative net assets.
B. Advisory Fees: The Adviser, a wholly-owned subsidiary of Morgan Stanley, provides the Portfolio with advisory services under the terms of an Investment Advisory Agreement, paid quarterly, at the annual rate based on the average daily net assets as follows:
First $750
million | | Next $750
million | | Over $1.5
billion | |
| | 0.75 | % | | | 0.70 | % | | | 0.65 | % | |
For the year ended December 31, 2013, the advisory fee rate (net of waivers/rebate/reimbursement) was equivalent to an annual effective rate of 0.00% of the Portfolio's daily net assets.
The Adviser has agreed to reduce its advisory fee and/or reimburse the Portfolio so that total annual portfolio operating expenses, excluding certain investment related expenses, taxes, interest and other extraordinary expenses (including litigation), will not exceed 1.05% for Class I shares, 1.30% for Class A shares, 1.09% for Class L shares. Effective September 16, 2013, the Adviser has agreed to limit the ratio of expenses to
20
Morgan Stanley Institutional Fund, Inc.
Annual Report — December 31, 2013
Notes to Financial Statements (cont'd)
average net assets to the maximum ratio of 1.40%, 1.19% and 1.01% for Class A, Class L and Class IS shares, respectively. The fee waivers and/or expense reimbursements will continue for at least one year or until such time that the Directors act to discontinue all or a portion of such waivers and/or reimbursements when it deems such action is appropriate. For the year ended December 31, 2013, approximately $125,000 of advisory fees were waived and approximately $90,000 of other expenses were reimbursed by the Adviser pursuant to this arrangement.
C. Administration Fees: The Adviser also serves as Administrator to the Fund and provides administrative services pursuant to an Administration Agreement for an annual fee, accrued daily and paid monthly, of 0.08% of the Portfolio's average daily net assets. Under a Sub-Administration Agreement between the Administrator and State Street Bank and Trust Company ("State Street"), State Street provides certain administrative services to the Fund. For such services, the Administrator pays State Street a portion of the fee the Administrator receives from the Portfolio.
D. Distribution and Shareholder Services Fees: Morgan Stanley Distribution, Inc. ("MSDI" or the "Distributor"), a wholly-owned subsidiary of the Adviser, and an indirect subsidiary of Morgan Stanley, serves as the Fund's Distributor of Portfolio shares pursuant to a Distribution Agreement. The Fund has adopted a Shareholder Services Plan with respect to Class A shares pursuant to Rule 12b-1 under the Act. Under the Shareholder Services Plan, the Portfolio pays the Distributor a shareholder services fee, accrued daily and paid monthly, at an annual rate of 0.25% of the Portfolio's average daily net assets attributable to Class A shares.
The Fund has adopted a Distribution and Shareholder Services Plan with respect to Class L shares pursuant to Rule 12b-1 under the Act. Under the Distribution and Shareholder Services Plan, the Portfolio pays the Distributor a distribution fee, accrued daily and paid monthly, at an annual rate of 0.50% and a shareholder services fee, accrued daily and paid monthly, at an annual rate of 0.25% of the Portfolio's average daily net assets attributable to Class L shares. The Distributor has agreed to waive for at least one year the 12b-1 fees on Class L shares of the Portfolio to the extent it exceeds 0.04% of the average daily net assets of such shares on an annualized basis. For the year ended December 31, 2013, this waiver amounted to approximately $14,000.
The distribution and shareholder services fees are used to support the expenses associated with servicing and maintaining
accounts. The Distributor may compensate other parties for providing shareholder support services to investors who purchase Class A and Class L shares.
E. Dividend Disbursing and Transfer Agent: The Fund's dividend disbursing and transfer agent was Morgan Stanley Services Company Inc. ("Morgan Stanley Services"). Pursuant to a Transfer Agency Agreement, the Fund paid Morgan Stanley Services a fee based on the number of classes, accounts and transactions relating to the Portfolios of the Fund. Effective July 1, 2013, the Directors approved changing the transfer agent to Boston Financial Data Services, Inc.
F. Custodian Fees: State Street (the "Custodian") serves as Custodian for the Fund in accordance with a Custodian Agreement. The Custodian holds cash, securities, and other assets of the Fund as required by the Act. Custody fees are payable monthly based on assets held in custody, investment purchases and sales activity and account maintenance fees, plus reimbursement for certain out-of-pocket expenses.
G. Security Transactions and Transactions with Affiliates: For the year ended December 31, 2013, purchases and sales of investment securities for the Portfolio, other than long-term U.S. Government securities and short-term investments, were approximately $8,570,000 and $5,788,000, respectively. There were no purchases and sales of long-term U.S. Government securities for the year ended December 31, 2013.
The Portfolio invests in the Institutional Class of the Morgan Stanley Institutional Liquidity Funds — Money Market Portfolio (the "Liquidity Funds"), an open-end management investment company managed by the Adviser. Advisory fees paid by the Portfolio are reduced by an amount equal to its pro-rata share of the advisory and administration fees paid by the Portfolio due to its investment in the Liquidity Funds. For the year ended December 31, 2013, advisory fees paid were reduced by approximately $1,000 relating to the Portfolio's investment in the Liquidity Funds.
A summary of the Portfolio's transactions in shares of the Liquidity Funds during the year ended December 31, 2013 is as follows:
Value
December 31,
2012
(000) | | Purchases
at Cost
(000) | | Sales
(000) | | Dividend
Income
(000) | | Value
December 31,
2013
(000) | |
| $ | 315 | | | $ | 7,376 | | | $ | 6,699 | | | $ | 1 | | | $ | 992 | | |
During the year ended December 31, 2013, the Portfolio incurred less than $500 in brokerage commissions with Morgan Stanley & Co., LLC, an affiliate of the Adviser, Administrator
21
Morgan Stanley Institutional Fund, Inc.
Annual Report — December 31, 2013
Notes to Financial Statements (cont'd)
and Distributor, for portfolio transactions executed on behalf of the Portfolio.
From January 1, 2013 to June 30, 2013, the Portfolio incurred less than $500 in brokerage commissions with Citigroup, Inc., and its affiliated broker-dealers, which may be deemed affiliates of the Adviser, Administrator and Distributor under Section 17 of the Act, for portfolio transactions executed on behalf of the Portfolio. Citigroup, Inc. and its affiliated broker-dealers ceased to be affiliates of the Portfolio pursuant to Section 17 of the Act as of July 1, 2013.
H. Federal Income Taxes: It is the Portfolio's intention to continue to qualify as a regulated investment company and distribute all of its taxable and tax-exempt income. Accordingly, no provision for Federal income taxes is required in the financial statements.
The Portfolio may be subject to taxes imposed by countries in which it invests. Such taxes are generally based on income and/or capital gains earned or repatriated. Taxes are accrued based on net investment income, net realized gains and net unrealized appreciation as such income and/or gains are earned. Taxes may also be based on transactions in foreign currency and are accrued based on the value of investments denominated in such currency.
FASB ASC 740-10 "Income Taxes — Overall" sets forth a minimum threshold for financial statement recognition of the benefit of a tax position taken or expected to be taken in a tax return. Management has concluded there are no significant uncertain tax positions that would require recognition in the financial statements. If applicable, the Portfolio recognizes interest accrued related to unrecognized tax benefits in "Interest Expense" and penalties in "Other Expenses" in the Statement of Operations. The Portfolio files tax returns with the U.S. Internal Revenue Service, New York and various states. Generally, each of the tax years in the four-year period ended December 31, 2013, remains subject to examination by taxing authorities.
The tax character of distributions paid may differ from the character of distributions shown in the Statements of Changes in Net Assets due to short-term capital gains being treated as ordinary income for tax purposes. The tax character of distributions paid during fiscal 2013 and 2012 was as follows:
2013
Distributions
Paid From: | | 2012
Distributions
Paid From: | |
Ordinary
Income
(000) | | Long-Term
Capital Gain
(000) | | Ordinary
Income
(000) | | Long-Term
Capital Gain
(000) | |
| $ | 251 | | | $ | 420 | | | $ | 98 | | | $ | 748 | | |
The amount and character of income and gains to be distributed are determined in accordance with income tax regulations which may differ from GAAP. These book/tax differences are either considered temporary or permanent in nature.
Temporary differences are primarily due to differing book and tax treatments in the timing of the recognition of gains (losses) on certain investment transactions and the timing of the deductibility of certain expenses.
Permanent differences, primarily due to differing treatments of gains (losses) related to foreign currency transactions and return of capital distributions received by the Portfolio, resulted in the following reclassifications among the components of net assets at December 31, 2013:
Accumulated
Undistributed
Net Investment
Income
(000) | | Accumulated
Net Realized
Gain
(000) | | Paid-in-
Capital
(000) | |
| $ | — | @ | | $ | (— | @) | | | — | | |
@ Amount is less than $500.
At December 31, 2013, the components of distributable earnings for the Portfolio on a tax basis were as follows:
Undistributed
Ordinary
Income
(000) | | Undistributed
Long-Term
Capital Gain
(000) | |
| $ | 121 | | | $ | 177 | | |
At December 31, 2013, the aggregate cost for federal income tax purposes is $15,501,000. The aggregate gross unrealized appreciation is $6,218,000 and the aggregate gross unrealized depreciation is $23,000 resulting in net unrealized appreciation of $6,195,000.
I. Other (unaudited): At December 31, 2013, the Portfolio had otherwise unaffiliated record owners of 10% or greater. Investment activities of these shareholders could have a material impact on the Portfolio. The aggregate percentage of such owners was 22%, 61% and 52%, for Class I, Class A and Class L shares, respectively.
J. Results of Special Shareholder Meeting (unaudited): On June 5, 2013 as adjourned to June 24, 2013 and July 17, 2013, a Joint Special Shareholder Meeting was held for Class H shareholders of the Portfolio to approve the Articles of
22
Morgan Stanley Institutional Fund, Inc.
Annual Report — December 31, 2013
Notes to Financial Statements (cont'd)
Amendment to the Fund's Articles of Amendment and Restatement and a Plan of Reclassification for the Portfolio pursuant to which Class H shares would be reclassified as Class P shares. The results with respect to this proposal were as follows:
| For | | Against | | Abstain | |
| | 63,794 | | | | 0 | | | | 22,443 | | |
K. Accounting Pronouncement: In June 2013, FASB issued Accounting Standards Update 2013-08 Financial Services — Investment Companies (Topic 946) — Amendments to the Scope, Measurement, and Disclosure Requirements ("ASU 2013-08") which is effective for interim and annual reporting periods in fiscal years that begin after December 15, 2013. ASU 2013-08 sets forth a methodology for determining whether an entity should be characterized as an investment company and prescribes fair value accounting for an investment company's non-controlling ownership interest in another investment company. FASB has determined that a fund registered under the Investment Company Act of 1940 automatically meets ASU 2013-08's criteria for an investment company. Although still evaluating the potential impacts of ASU 2013-08 to the Portfolio, management expects that the impact of the Portfolio's adoption will be limited to additional financial statement disclosures.
23
Morgan Stanley Institutional Fund, Inc.
Annual Report — December 31, 2013
Report of Independent Registered Public Accounting Firm
To the Shareholders and Board of Directors of
Morgan Stanley Institutional Fund, Inc. —
Advantage Portfolio
We have audited the accompanying statement of assets and liabilities, including the portfolio of investments, of Advantage Portfolio (one of the portfolios constituting Morgan Stanley Institutional Fund, Inc.) (the "Portfolio") as of December 31, 2013, and the related statement of operations for the year then ended, the statements of changes in net assets for each of the two years in the period then ended, and the financial highlights for each of the periods indicated therein. These financial statements and financial highlights are the responsibility of the Portfolio's management. Our responsibility is to express an opinion on these financial statements and financial highlights based on our audits.
We conducted our audits in accordance with the standards of the Public Company Accounting Oversight Board (United States). Those standards require that we plan and perform the audit to obtain reasonable assurance about whether the financial statements and financial highlights are free of material misstatement. We were not engaged to perform an audit of the Portfolio's internal control over financial reporting. Our audits included consideration of internal control over financial reporting as a basis for designing audit procedures that are appropriate in the circumstances, but not for the purpose of expressing an opinion on the effectiveness of the Portfolio's internal control over financial reporting. Accordingly, we express no such opinion. An audit also includes examining, on a test basis, evidence supporting the amounts and disclosures in the financial statements and financial highlights, assessing the accounting principles used and significant estimates made by management, and evaluating the overall financial statement presentation. Our procedures included confirmation of securities owned as of December 31, 2013, by correspondence with the custodian and others or by other appropriate auditing procedures where replies from others were not received. We believe that our audits provide a reasonable basis for our opinion.
In our opinion, the financial statements and financial highlights referred to above present fairly, in all material respects, the financial position of Advantage Portfolio (one of the portfolios constituting Morgan Stanley Institutional Fund, Inc.) at December 31, 2013, the results of its operations for the year then ended, the changes in its net assets for each of the two years in the period then ended, and the financial highlights for each of the periods indicated therein, in conformity with U.S. generally accepted accounting principles.

Boston, Massachusetts
February 26, 2014
24
Morgan Stanley Institutional Fund, Inc.
Annual Report — December 31, 2013
Federal Tax Notice (unaudited)
For Federal income tax purposes, the following information is furnished with respect to the distributions paid by the Portfolio during its taxable year ended December 31, 2013. For corporate shareholders, 34.24% of the dividends qualified for the dividends received deduction.
The Portfolio designated and paid $420,000 as a long-term capital gain distribution.
For Federal income tax purposes, the following information is furnished with respect to the Portfolio's earnings for its taxable year ended December 31, 2013. When distributed, certain earnings may be subject to a maximum tax rate of 15% as provided for the Jobs and Growth Tax Relief Reconciliation Act of 2003. The Portfolio designated up to a maximum of $191,000 as taxable at this lower rate.
In January, the Portfolio provides tax information to shareholders for the preceding calendar year.
25
Morgan Stanley Institutional Fund, Inc.
Annual Report — December 31, 2013
U.S. Privacy Policy (unaudited)
AN IMPORTANT NOTICE CONCERNING OUR U.S. PRIVACY POLICY
This privacy notice describes the U.S. privacy policy of Morgan Stanley Distribution, Inc., and the Morgan Stanley family of mutual funds ("us", "our", "we").
We are required by federal law to provide you with notice of our U.S. privacy policy ("Policy"). This Policy applies to both our current and former clients unless we state otherwise and is intended for individual clients who purchase products or receive services from us for personal, family or household purposes. This Policy is not applicable to partnerships, corporations, trusts or other non-individual clients or account holders, nor is this Policy applicable to individuals who are either beneficiaries of a trust for which we serve as trustee or participants in an employee benefit plan administered or advised by us. This Policy is, however, applicable to individuals who select us to be a custodian of securities or assets in individual retirement accounts, 401(k) accounts, or accounts subject to the Uniform Gifts to Minors Act.
This notice sets out our business practices to protect your privacy; how we collect and share personal information about you; and how you can limit our sharing or certain uses by others of this information. We may amend this Policy at any time, and will inform you of any changes to our Policy as required by law.
WE RESPECT YOUR PRIVACY
We appreciate that you have provided us with your personal financial information and understand your concerns about your information. We strive to safeguard the information our clients entrust to us. Protecting the confidentiality and security of client information is an important part of how we conduct our business.
This notice describes what personal information we collect about you, how we collect it, when we may share it with others, and how certain others may use it. It discusses the steps you may take to limit our sharing of certain information about you with our affiliated companies, including, but not limited to our affiliated banking businesses, brokerage firms and credit service affiliates. It also discloses how you may limit our affiliates' use of shared information for marketing purposes.
Throughout this Policy, we refer to the nonpublic information that personally identifies you as "personal information." We also use the term "affiliated company" in this notice. An affiliated company is a company in our family of companies and includes companies with the Morgan Stanley name. These affiliated companies are financial institutions such as broker-dealers, banks, investment advisers and credit card issuers. We refer to any company that is not an affiliated company as a nonaffiliated third party. For purposes of Section 5 of this notice, and your ability to limit certain uses of personal information by our affiliates, this notice applies to the use of personal information by our affiliated companies.
1. WHAT PERSONAL INFORMATION DO WE COLLECT FROM YOU?
We may collect the following types of information about you: (i) information provided by you, including information from applications and other forms we receive from you, (ii) information about your transactions with us or our affiliates, (iii) information about your transactions with nonaffiliated third parties, (iv) information from consumer reporting agencies, (v) information obtained from our websites, and (vi) information obtained from other sources. For example:
• We collect information such as your name, address, e-mail address, telephone/fax numbers, assets, income and investment objectives through applications and other forms you submit to us.
• We may obtain information about account balances, your use of account(s) and the types of products and services you prefer to receive from us through your dealings and transactions with us and other sources.
• We may obtain information about your creditworthiness and credit history from consumer reporting agencies.
• We may collect background information from and through third-party vendors to verify representations you have made and to comply with various regulatory requirements.
2. WHEN DO WE DISCLOSE PERSONAL INFORMATION WE COLLECT ABOUT YOU?
We may disclose personal information we collect about you in each of the categories listed above to affiliated and nonaffiliated third parties.
26
Morgan Stanley Institutional Fund, Inc.
Annual Report — December 31, 2013
U.S. Privacy Policy (unaudited) (cont'd)
a. Information we disclose to affiliated companies.
We may disclose personal information that we collect about you to our affiliated companies to manage your account(s) effectively, to service and process your transactions, and to let you know about products and services offered by us and affiliated companies, to manage our business, and as otherwise required or permitted by law. Offers for products and services from affiliated companies are developed under conditions designed to safeguard your personal information.
b. Information we disclose to third parties.
We may disclose personal information that we collect about you to nonaffiliated third parties to provide marketing services on our behalf or to other financial institutions with whom we have joint marketing agreements. We may also disclose all of the information we collect to other nonaffiliated third parties for our everyday business purposes, such as to process transactions, maintain account(s), respond to court orders and legal investigations, report to credit bureaus, offer our own products and services, protect against fraud, for institutional risk control, to perform services on our behalf, and as otherwise required or permitted by law.
When we share personal information about you with a nonaffiliated third party, they are required to limit their use of personal information about you to the particular purpose for which it was shared and they are not allowed to share personal information about you with others except to fulfill that limited purpose or as may be permitted or required by law.
3. HOW DO WE PROTECT THE SECURITY AND CONFIDENTIALITY OF PERSONAL INFORMATION WE COLLECT ABOUT YOU?
We maintain physical, electronic and procedural security measures that comply with applicable law and regulations to help safeguard the personal information we collect about you. We have internal policies governing the proper handling of client information by employees. Third parties that provide support or marketing services on our behalf may also receive personal information about you, and we require them to adhere to appropriate security standards with respect to such information.
4. HOW CAN YOU LIMIT OUR SHARING CERTAIN PERSONAL INFORMATION ABOUT YOU WITH OUR AFFILIATED COMPANIES FOR ELIGIBILITY DETERMINATION?
By following the opt-out procedures in Section 6 below, you may limit the extent to which we share with our affiliated companies, personal information that was collected to determine your eligibility for products and services such as your credit reports and other information that you have provided to us or that we may obtain from third parties ("eligibility information"). Eligibility information does not include your identification information or personal information pertaining to our transactions or experiences with you. Please note that, even if you direct us not to share eligibility information with our affiliated companies, we may still share your personal information, including eligibility information, with our affiliated companies under circumstances that are permitted under applicable law, such as to process transactions or to service your account.
5. HOW CAN YOU LIMIT THE USE OF CERTAIN PERSONAL INFORMATION ABOUT YOU BY OUR AFFILIATED COMPANIES FOR MARKETING?
By following the opt-out instructions in Section 6 below, you may limit our affiliated companies from marketing their products or services to you based on personal information we disclose to them. This information may include, for example, your income and account history with us. Please note that, even if you choose to limit our affiliated companies from using personal information about you that we may share with them for marketing their products and services to you, our affiliated companies may use your personal information that they obtain from us to market to you in circumstances permitted by law, such as if the affiliated party has its own relationship with you.
27
Morgan Stanley Institutional Fund, Inc.
Annual Report — December 31, 2013
U.S. Privacy Policy (unaudited) (cont'd)
6. HOW CAN YOU SEND US AN OPT-OUT INSTRUCTION?
If you wish to limit our sharing of eligibility information about you with our affiliated companies, or our affiliated companies' use of personal information for marketing purposes, as described in this notice, you may do so by:
• Calling us at (800) 548-7786
Monday–Friday between 8a.m. and 5p.m. (EST)
• Writing to us at the following address:
Boston Financial Data Services, Inc.
c/o Privacy Coordinator
P.O. Box 219804
Kansas City, Missouri 64121
If you choose to write to us, your request should include: your name, address, telephone number and account number(s) to which the opt-out applies and whether you are opting out with respect to sharing of eligibility information (Section 4 above), or information used for marketing (Section 5 above), or both. Written opt-out requests should not be sent with any other correspondence. In order to process your request, we require that the request be provided by you directly and not through a third party. Once you have informed us about your privacy preferences, your opt-out preference will remain in effect with respect to this Policy (as it may be amended) until you notify us otherwise. If you are a joint account owner, we will accept instructions from any one of you and apply those instructions to the entire account.
Please understand that if you limit our sharing or our affiliated companies' use of personal information, you and any joint account holder(s) may not receive information about our affiliated companies' products and services, including products or services that could help you manage your financial resources and achieve your investment objectives.
If you have more than one account or relationship with us, please specify the accounts to which you would like us to apply your privacy choices. If you have accounts or relationships with our affiliates, you may receive multiple privacy policies from them, and will need to separately notify those companies of your privacy choices for those accounts or relationships.
7. WHAT IF AN AFFILIATED COMPANY BECOMES A NONAFFILIATED THIRD PARTY?
If, at any time in the future, an affiliated company becomes a nonaffiliated third party, further disclosures of personal information made to the former affiliated company will be limited to those described in Section 2(b) above relating to nonaffiliated third parties. If you elected under Section 6 to limit disclosures we make to affiliated companies, or use of personal information by affiliated companies, your election will not apply to use by any former affiliated company of your personal information in their possession once it becomes a nonaffiliated third party.
SPECIAL NOTICE TO RESIDENTS OF VERMONT
The following section supplements our Policy with respect to our individual clients who have a Vermont address and supersedes anything to the contrary in the above Policy with respect to those clients only.
The State of Vermont requires financial institutions to obtain your consent prior to sharing personal information that they collect about you with nonaffiliated third parties, or eligibility information with affiliated companies, other than in certain limited circumstances. Except as permitted by law, we will not share personal information we collect about you with nonaffiliated third parties or eligibility information with affiliated companies, unless you provide us with your written consent to share such information.
SPECIAL NOTICE TO RESIDENTS OF CALIFORNIA
The following section supplements our Policy with respect to our individual clients who have a California address and supersedes anything to the contrary in the above Policy with respect to those clients only.
In response to a California law, if your account has a California home address, your personal information will not be disclosed to nonaffiliated third parties except as permitted by applicable California law, and we will limit sharing such personal information with our affiliates to comply with California privacy laws that apply to us.
28
Morgan Stanley Institutional Fund, Inc.
Annual Report — December 31, 2013
Director and Officer Information (unaudited)
Independent Director:
Name, Age and Address of
Independent Director | | Position(s)
Held with
Registrant | | Length of Time
Served* | | Principal Occupation(s) During Past 5 Years | | Number of
Portfolios in
Fund Complex
Overseen by
Independent
Director** | | Other Directorships
Held by Independent
Director*** | |
Frank L. Bowman (69)
c/o Kramer Levin Naftalis &
Frankel LLP
Counsel to the Independent
Directors
1177 Avenue of the Americas
New York, NY 10036 | | Director | | Since
August
2006 | | President, Strategic Decisions, LLC (consulting) (since February 2009); Director or Trustee of various Morgan Stanley Funds (since August 2006); Chairperson of the Insurance Sub-Committee of the Compliance and Insurance Committee (since February 2007); served as President and Chief Executive Officer of the Nuclear Energy Institute (policy organization) (February 2005-November 2008); retired as Admiral, U.S. Navy after serving over 38 years on active duty including 8 years as Director of the Naval Nuclear Propulsion Program in the Department of the Navy and the U.S. Department of Energy (1996-2004); served as Chief of Naval Personnel (July 1994-September 1996); and on the Joint Staff as Director of Political Military Affairs (June 1992-July 1994); knighted as Honorary Knight Commander of the Most Excellent Order of the British Empire; awarded the Officier de l'Orde National du Mérite by the French Government; elected to the National Academy of Engineering (2009). | | | 98 | | | Director of BP p.l.c.; Director of Naval and Nuclear Technologies LLP; Director of the Armed Services YMCA of the USA and the U.S. Naval Submarine League; Director of the American Shipbuilding Suppliers Association; Member of the National Security Advisory Council of the Center for U.S. Global Engagement and a member of the CNA Military Advisory Board; Chairman of the charity J Street Cup Golf; Trustee of the Fairhaven United Methodist Church. | |
Michael Bozic (73)
c/o Kramer Levin Naftalis & Frankel LLP
Counsel to the Independent Directors
1177 Avenue of the Americas New York, NY 10036 | | Director | | Since
April
1994 | | Private investor and a member of the advisory board of American Road Group LLC (retail) (since June 2000); Chairperson of the Compliance and Insurance Committee (since October 2006); Director or Trustee of various Morgan Stanley Funds (since April 1994); formerly, Chairperson of the Insurance Committee (July 2006-September 2006); Vice Chairman of Kmart Corporation (December 1998-October 2000), Chairman and Chief Executive Officer of Levitz Furniture Corporation (November 1995-November 1998) and President and Chief Executive Officer of Hills Department Stores (May 1991-July 1995); variously Chairman, Chief Executive Officer, President and Chief Operating Officer (1987-1991) of the Sears Merchandise Group of Sears, Roebuck & Co. | | | 100 | | | Trustee and member of the Hillsdale College Board of Trustees. | |
Kathleen A. Dennis (60)
c/o Kramer Levin Naftalis & Frankel LLP
Counsel to the Independent Directors
1177 Avenue of the Americas New York, NY 10036 | | Director | | Since
August
2006 | | President, Cedarwood Associates (mutual fund and investment management consulting) (since July 2006); Chairperson of the Money Market and Alternatives Sub-Committee of the Investment Committee (since October 2006) and Director or Trustee of various Morgan Stanley Funds (since August 2006); formerly, Senior Managing Director of Victory Capital Management (1993-2006). | | | 98 | | | Director of various non-profit organizations. | |
Dr. Manuel H. Johnson (65)
c/o Johnson Smick
International, Inc.
220 I Street, NE
Suite 200
Washington, D.C. 20002 | | Director | | Since
July
1991 | | Senior Partner, Johnson Smick International, Inc. (consulting firm); Chairperson of the Investment Committee (since October 2006) and Director or Trustee of various Morgan Stanley Funds (since July 1991); Co-Chairman and a founder of the Group of Seven Council (G7C) (international economic commission); formerly, Chairperson of the Audit Committee (July 1991-September 2006), Vice Chairman of the Board of Governors of the Federal Reserve System and Assistant Secretary of the U.S. Treasury. | | | 101 | | | Director of NVR, Inc. (home construction). | |
29
Morgan Stanley Institutional Fund, Inc.
Annual Report — December 31, 2013
Director and Officer Information (unaudited) (cont'd)
Independent Director: (cont'd)
Name, Age and Address of
Independent Director | | Position(s)
Held with
Registrant | | Length of Time
Served* | | Principal Occupation(s) During Past 5 Years | | Number of
Portfolios in
Fund Complex
Overseen by
Independent
Director** | | Other Directorships
Held by Independent
Director*** | |
Joseph J. Kearns (71)
c/o Kearns & Associates LLC PMB754
22631 Pacific Coast Highway
Malibu, CA 90265 | | Director | | Since
August
1994 | | President, Kearns & Associates LLC (investment consulting); Chairperson of the Audit Committee (since October 2006) and Director or Trustee of various Morgan Stanley Funds (since August 1994); formerly, Deputy Chairperson of the Audit Committee (July 2003-September 2006) and Chairperson of the Audit Committee of various Morgan Stanley Funds (since August 1994); CFO of the J. Paul Getty Trust. | | | 101 | | | Director of Electro Rent Corporation (equipment leasing) and The Ford Family Foundation. | |
Michael F. Klein (55)
c/o Kramer Levin Naftalis & Frankel LLP
Counsel to the Independent Directors
1177 Avenue of the Americas New York, NY 10036 | | Director | | Since
August
2006 | | Managing Director, Aetos Capital, LLC (since March 2000) and Co-President, Aetos Alternatives Management, LLC (since January 2004) and Co-Chief Executive Officer of Aetos Capital LLC (since August 2013); Chairperson of the Fixed Income Sub-Committee of the Investment Committee (since October 2006) and Director or Trustee of various Morgan Stanley Funds (since August 2006); formerly, Managing Director, Morgan Stanley & Co. Inc. and Morgan Stanley Dean Witter Investment Management, President, various Morgan Stanley Funds (June 1998-March 2000) and Principal, Morgan Stanley & Co. Inc. and Morgan Stanley Dean Witter Investment Management (August 1997-December 1999). | | | 98 | | | Director of certain investment funds managed or sponsored by Aetos Capital, LLC. Director of Sanitized AG and Sanitized Marketing AG (specialty chemicals). | |
Michael E. Nugent (77)
522 Fifth Avenue
New York, NY 10036 | | Chairperson
of the
Board and Director | | Chairperson of the Boards since July 2006 and Director since July 1991 | | Chairperson of the Boards of various Morgan Stanley Funds (since July 2006); Chairperson of the Closed-End Fund Committee (since June 2012) and Director or Trustee of various Morgan Stanley Funds (since July 1991); formerly, Chairperson of the Insurance Committee (until July 2006); General Partner, Triumph Capital, L.P. (private investment partnership) (1988-2013) | | | 100 | | | None. | |
W. Allen Reed (66)
c/o Kramer Levin Naftalis & Frankel LLP
Counsel to the Independent Directors
1177 Avenue of the Americas New York, NY 10036 | | Director | | Since
August
2006 | | Chairperson of the Equity Sub-Committee of the Investment Committee (since October 2006) and Director or Trustee of various Morgan Stanley Funds (since August 2006); formerly, President and CEO of General Motors Asset Management; Chairman and Chief Executive Officer of the GM Trust Bank and Corporate Vice President of General Motors Corporation (August 1994-December 2005). | | | 98 | | | Director of Temple-Inland Industries (packaging and forest products); Director of Legg Mason, Inc. and Director of the Auburn University Foundation. | |
Fergus Reid (81)
c/o Joe Pietryka, Inc.
85 Charles Colman Blvd. Pawling, NY 12564 | | Director | | Since
June
1992 | | Chairman, Joe Pietryka, Inc.; Chairperson of the Governance Committee and Director or Trustee of various Morgan Stanley Funds (since June 1992). | | | 101 | | | Through December 31, 2012, Trustee and Director of certain Investment companies in the JP Morgan Fund Complex. | |
30
Morgan Stanley Institutional Fund, Inc.
Annual Report — December 31, 2013
Director and Officer Information (unaudited) (cont'd)
Interested Director:
Name, Age and Address of
Interested Director | | Position(s)
Held with
Registrant | | Length of
Time Served* | | Principal Occupation(s) During Past 5 Years | | Number of
Portfolios in
Fund Complex
Overseen by
Interested
Director** | | Other Directorships
Held by Interested
Director*** | |
James F. Higgins (66)
One New York Plaza
New York, NY 10004 | | Director | | Since
June
2000 | | Director or Trustee of various Morgan Stanley Funds (since June 2000); Senior Advisor of Morgan Stanley (since August 2000). | | | 99 | | | Formerly, Director of AXA Financial, Inc. and AXA Equitable Life Insurance Company (2002-2011) and Director of AXA MONY Life Insurance Company and AXA MONY Life Insurance Company of America (2004-2011). | |
* Each Director serves an indefinite term, until his or her successor is elected.
** The Fund Complex includes (as of December 31, 2013) all open-end and closed-end funds (including all of their portfolios) advised by Morgan Stanley Investment Management Inc. (the "Adviser") and any funds that have an adviser that is an affiliated person of the Adviser (including, but not limited to, Morgan Stanley AIP GP LP).
*** This includes any directorships at public companies and registered investment companies held by the Director at any time during the past five years.
31
Morgan Stanley Institutional Fund, Inc.
Annual Report — December 31, 2013
Director and Officer Information (unaudited) (cont'd)
Executive Officers:
Name, Age and Address of Executive Officer | | Position(s) Held
with
Registrant | | Length of
Time Served* | | Principal Occupation(s) During Past 5 Years | |
John H. Gernon (50)
522 Fifth Avenue
New York, NY 10036 | | President and Principal Executive Officer—Equity, Fixed Income and AIP Funds | | Since
September
2013 | | President and Principal Executive Officer of the Equity and Fixed Income Funds and the Morgan Stanley AIP Funds (since September 2013) in the Fund Complex. Managing Director of the Adviser. | |
Stefanie V. Chang Yu (47)
522 Fifth Avenue
New York, NY 10036 | | Chief Compliance Officer | | Since
January
2014 | | Managing Director of the Adviser and various entities affiliated with the Adviser; Chief Compliance Officer of various Morgan Stanley Funds and the Adviser (since January 2014). Formerly, Vice President of various Morgan Stanley Funds (December 1997-January 2014). | |
Joseph C. Benedetti (48)
522 Fifth Avenue
New York, NY 10036 | | Vice President | | Since
January
2014 | | Managing Director of the Adviser and various entities affiliated with the Adviser; Vice President of various Morgan Stanley Funds (since January 2014). Formerly, Assistant Secretary of various Morgan Stanley Funds (October 2004-January 2014). | |
Francis J. Smith (48)
522 Fifth Avenue
New York, NY 10036 | | Treasurer and Principal Financial Officer | | Treasurer since July 2003 and Principal Financial Officer since September 2002 | | Executive Director of the Adviser and various entities affiliated with the Adviser; Treasurer and Principal Financial Officer of various Morgan Stanley Funds (since July 2003). | |
Mary E. Mullin (46)
522 Fifth Avenue
New York, NY 10036 | | Secretary | | Since
June
1999 | | Executive Director of the Adviser and various entities affiliated with the Adviser; Secretary of various Morgan Stanley Funds (since June 1999). | |
* Each officer serves an indefinite term, until his or her successor is elected.
32
Morgan Stanley Institutional Fund, Inc.
Annual Report — December 31, 2013
Adviser and Administrator
Morgan Stanley Investment Management Inc.
522 Fifth Avenue
New York, New York 10036
Distributor
Morgan Stanley Distribution, Inc.
522 Fifth Avenue
New York, New York 10036
Dividend Disbursing and Transfer Agent
Boston Financial Data Services, Inc.
2000 Crown Colony Drive
Quincy, Massachusetts 02169
Custodian
State Street Bank and Trust Company
One Lincoln Street
Boston, Massachusetts 02111
Legal Counsel
Dechert LLP
1095 Avenue of the Americas
New York, New York 10036
Counsel to the Independent Directors
Kramer Levin Naftalis & Frankel LLP
1177 Avenue of the Americas
New York, New York 10036
Independent Registered Public Accounting Firm
Ernst & Young LLP
200 Clarendon Street
Boston, Massachusetts 02116
Reporting to Shareholders
Each Morgan Stanley fund provides a complete schedule of portfolio holdings in its semi-annual and annual reports within 60 days of the end of the fund's second and fourth fiscal quarters by filing the schedule electronically with the Securities and Exchange Commission (SEC). The semi-annual reports are filed on Form N-CSRS and the annual reports are filed on Form N-CSR. Morgan Stanley also delivers the semi-annual and annual reports to fund shareholders and makes these reports available on its public website, www.morganstanley.com/im. Each Morgan Stanley fund also files a complete schedule of portfolio holdings with the SEC for the fund's first and third fiscal quarters on Form N-Q. Morgan Stanley does not deliver the reports for the first and third fiscal quarters to shareholders, nor are the reports posted to the Morgan Stanley public website. You may, however, obtain the Form N-Q filings (as well as the Form N-CSR and N-CSRS filings) by accessing the SEC's website, www.sec.gov. You may also review and copy them at the SEC's Public Reference Room in Washington, DC. Information on the operation of the SEC's Public Reference Room may be obtained by calling the SEC toll free at 1 (800) SEC-0330. You can also request copies of these materials, upon payment of a duplicating fee, by electronic request at the SEC's email address (publicinfo@sec.gov) or by writing the Public Reference Room of the SEC, Washington, DC 20549-0102.
Proxy Voting Policies and Procedures and Proxy Voting Record
You may obtain a copy of the Fund's Proxy Voting Policy and Procedures and information regarding how the Fund voted proxies relating to portfolio securities during the most recent twelve-month period ended June 30, without charge, upon request, by calling toll free 1 (800) 548-7786 or by visiting our website at www.morganstanley.com/im. This information is also available on the SEC's website at www.sec.gov.
This report is authorized for distribution only when preceded or accompanied by a prospectus of the Morgan Stanley Institutional Fund, Inc. which describes in detail each Investment Portfolio's investment policies, risks, fees and expenses. Please read the prospectus carefully before you invest or send money. For additional information, including information regarding the investments comprising the Portfolio, please visit our website at www.morganstanley.com/im or call toll free 1 (800) 548-7786.
33
Printed in U.S.A.
This Report has been prepared for shareholders and may be distributed to others only if preceded or accompanied by a current prospectus.
Morgan Stanley Investment Management Inc.
522 Fifth Avenue
New York, New York 10036
© 2014 Morgan Stanley. Morgan Stanley Distribution, Inc.

IFIADVANN
808478 EXP 2.28.15

Morgan Stanley Institutional Fund, Inc.
Global Advantage Portfolio
Annual Report
December 31, 2013

Morgan Stanley Institutional Fund, Inc.
Annual Report — December 31, 2013
Shareholders' Letter | | | 2 | | |
Expense Example | | | 3 | | |
Investment Overview | | | 4 | | |
Portfolio of Investments | | | 6 | | |
Statement of Assets and Liabilities | | | 7 | | |
Statement of Operations | | | 9 | | |
Statements of Changes in Net Assets | | | 10 | | |
Financial Highlights | | | 11 | | |
Notes to Financial Statements | | | 14 | | |
Report of Independent Registered Public Accounting Firm | | | 22 | | |
Federal Tax Notice | | | 23 | | |
U.S. Privacy Policy | | | 24 | | |
Director and Officer Information | | | 27 | | |
This report is authorized for distribution only when preceded or accompanied by prospectuses of the Morgan Stanley Institutional Fund, Inc. To receive a prospectus and/or statement of additional information (SAI), which contains more complete information such as investment objectives, charges, expenses, policies for voting proxies, risk considerations, and describes in detail each of the Portfolio's investment policies to the prospective investor, please call toll free 1 (800) 548-7786. Please read the prospectuses carefully before you invest or send money.
Additionally, you can access portfolio information including performance, characteristics, and investment team commentary through Morgan Stanley Investment Management's website: www.morganstanley.com/im.
Market forecasts provided in this report may not necessarily come to pass. There is no guarantee that any sectors mentioned will continue to perform as discussed herein or that securities in such sectors will be held by the Portfolio in the future. There is no assurance that a Portfolio will achieve its investment objective. Portfolios are subject to market risk, which is the possibility that market values of securities owned by the Portfolio will decline and, therefore, the value of the Portfolio's shares may be less than what you paid for them. Accordingly, you can lose money investing in the Portfolio. Please see the prospectus for more complete information on investment risks.
1
Morgan Stanley Institutional Fund, Inc.
Annual Report — December 31, 2013
Shareholders' Letter (unaudited)
Dear Shareholders,
We are pleased to provide this Annual report, in which you will learn how your investment in Global Advantage Portfolio (the "Portfolio") performed during the latest twelve-month period.
Morgan Stanley Investment Management is a client-centric, investor-led organization. Our global presence, intellectual capital, and breadth of products and services enable us to partner with investors to meet the evolving challenges of today's financial markets. We aim to deliver superior investment service and to empower our clients to make the informed decisions that help them reach their investment goals.
As always, we thank you for selecting Morgan Stanley Investment Management, and look forward to working with you in the months and years ahead.
Sincerely,

John H. Gernon
President and Principal Executive Officer
January 2014
2
Morgan Stanley Institutional Fund, Inc.
Annual Report — December 31, 2013
Expense Example (unaudited)
Global Advantage Portfolio
As a shareholder of the Portfolio, you incur two types of costs: (1) transactional costs; and (2) ongoing costs, including advisory fees, administration fees, distribution and shareholder services fees and other Portfolio expenses. This example is intended to help you understand your ongoing costs (in dollars) of investing in the Portfolio and to compare these costs with the ongoing costs of investing in other mutual funds.
This example is based on an investment of $1,000 invested at the beginning of the six-month period ended December 31, 2013 and held for the entire six-month period.
Actual Expenses
The table below provides information about actual account values and actual expenses. You may use the information in this table, together with the amount you invested, to estimate the expenses that you paid over the period. Simply divide your account value by $1,000 (for example, an $8,600 account value divided by $1,000 = 8.6), then multiply the result by the number in the table under the heading entitled "Actual Expenses Paid During Period" to estimate the expenses you paid on your account during this period.
Hypothetical Example for Comparison Purposes
The table below provides information about hypothetical account values and hypothetical expenses based on the Portfolio's actual expense ratio and an assumed rate of return of 5% per year before expenses, which is not the Portfolio's actual return. The hypothetical account values and expenses may not be used to estimate the actual ending account balance or expenses you paid for the period. You may use this information to compare the ongoing costs of investing in the Portfolio and other funds. To do so, compare this 5% hypothetical example with the 5% hypothetical examples that appear in the shareholder reports of the other funds.
Please note that the expenses shown in the table are meant to highlight your ongoing costs only and do not reflect any transactional costs, such as sales charges (loads). Therefore, the information for each class in the table is useful in comparing ongoing costs only, and will not help you determine the relative total costs of owning different funds. In addition, if these transactional costs were included, your costs would have been higher.
| | | Beginning
Account
Value
7/1/13 | | Actual Ending
Account
Value
12/31/13 | | Hypothetical
Ending Account
Value | | Actual
Expenses
Paid
During
Period* | | Hypothetical
Expenses Paid
During Period* | | Net
Expense
Ratio
During
Period** | |
Global Advantage Portfolio Class I | | $ | 1,000.00 | | | $ | 1,240.40 | | | $ | 1,018.70 | | | $ | 7.28 | | | $ | 6.56 | | | | 1.29 | % | |
Global Advantage Portfolio Class A@ | | | 1,000.00 | | | | 1,239.20 | | | | 1,017.04 | | | | 9.14 | | | | 8.24 | | | | 1.62 | | |
Global Advantage Portfolio Class L | | | 1,000.00 | | | | 1,235.60 | | | | 1,014.57 | | | | 11.89 | | | | 10.71 | | | | 2.11 | | |
* Expenses are calculated using each Portfolio Class' annualized net expense ratio (as disclosed), multiplied by the average account value over the period, and multiplied by 184/365 (to reflect the most recent one-half year period).
** Annualized.
@ Effective September 9, 2013, Class P and Class H shares were renamed Class A shares.
3
Morgan Stanley Institutional Fund, Inc.
Annual Report — December 31, 2013
Investment Overview (unaudited)
Global Advantage Portfolio
The Global Advantage Portfolio seeks long-term capital appreciation by investing primarily in established companies located throughout the world, with capitalizations within the range of companies included in the Morgan Stanley Capital International (MSCI) All Country World Index.
Performance
For the year ended December 31, 2013, the Portfolio had a total return based on net asset value and reinvestment of distributions per share of 29.71%, net of fees, for Class I shares. The Portfolio's Class I shares outperformed against its benchmark, the MSCI All Country World Index (the "Index"), which returned 22.80%. Please keep in mind that high double-digit returns are highly unusual and cannot be sustained.
Factors Affecting Performance
• Global equity performance in 2013 was driven by strong results in the developed world, which continued to benefit from accommodative monetary policy, along with signs of more sustainable economic progress in the U.S. and stabilization in the eurozone. By comparison, emerging market equities languished. Uncertainties about a slowdown in China's economy, the negative implications of the expected tapering of U.S. quantitative easing, and pockets of regional and country-specific political conflict were among the factors weighing on investor sentiment for the asset class.
• The information technology sector provided nearly all of the Portfolio's relative gains, with especially strong results from our stock selection and a more modest contribution from an overweight in the sector. A U.S.-based online social networking provider was the most additive holding during the period.
• An overweight in the consumer discretionary sector, which was the Index's top-performing sector during the period, was favorable as well, although the positive impact was partially offset by relatively weak stock selection.
• The Portfolio had no exposure to the materials sector, which was beneficial because the sector was the worst-performing group in the Index during the period.
• Detractors from performance included stock selection in the industrials sector. A position in a multinational conglomerate with businesses focused on the Asia-Pacific region was the most detrimental to performance in the sector.
• An underweight in the health care sector was disadvantageous as well, as the sector was among the best-performing groups in the Index during the period.
Management Strategies
• We look for high-quality growth companies that we believe have these attributes: sustainable competitive advantages, above-average business visibility, rising return on invested capital, strong free cash flow generation and a favorable risk/reward. We find these companies through intense fundamental research. Our emphasis is on secular growth, and as a result short-term market events are not as meaningful in the stock selection process.
* Minimum Investment for Class I shares
** Commenced Operations on December 28, 2010.
In accordance with SEC regulations, Portfolio's performance shown assumes that all recurring fees (including management fees) were deducted and all dividends and distributions were reinvested. The performance of Class A+ and L shares will vary from Class I shares and will be negatively impacted by additional fees assessed to those classes.
4
Morgan Stanley Institutional Fund, Inc.
Annual Report — December 31, 2013
Investment Overview (unaudited) (cont'd)
Global Advantage Portfolio
Performance Compared to the Morgan Stanley Capital International (MSCI) All Country World Index(1) and the Lipper Global Multi-Cap Growth Funds Index(2)
| | | Period Ended December 31, 2013
Total Returns(3) | |
| | | | | Average Annual | |
| | | One
Year | | Five
Years | | Ten
Years | | Since
Inception(5) | |
Portfolio — Class I Shares
w/o sales charges(4) | | | 29.71 | % | | | — | | | | — | | | | 16.92 | % | |
MSCI All Country World Index | | | 22.80 | | | | — | | | | — | | | | 9.93 | | |
Lipper Global Multi-Cap Growth Index | | | 25.75 | | | | — | | | | — | | | | 9.08 | | |
Portfolio — Class A+ Shares
w/o sales charges(4) | | | 29.48 | | | | — | | | | — | | | | 16.62 | | |
Portfolio — Class A+ Shares with
maximum 5.25% sales charges(4) | | | 22.68 | | | | — | | | | — | | | | 14.56 | | |
MSCI All Country World Index | | | 22.80 | | | | — | | | | — | | | | 9.93 | | |
Lipper Global Multi-Cap Growth Index | | | 25.75 | | | | — | | | | — | | | | 9.08 | | |
Portfolio — Class L Shares
w/o sales charges(4) | | | 28.78 | | | | — | | | | — | | | | 16.04 | | |
MSCI All Country World Index | | | 22.80 | | | | — | | | | — | | | | 9.93 | | |
Lipper Global Multi-Cap Growth Index | | | 25.75 | | | | — | | | | — | | | | 9.08 | | |
Performance data quoted represents past performance, which is no guarantee of future results, and current performance may be lower or higher than the figures shown. Performance assumes that all dividends and distributions, if any, were reinvested. For the most recent month-end performance figures, please visit www.morganstanley.com/im. Investment return and principal value will fluctuate so that Portfolio shares, when redeemed, may be worth more or less than their original cost. Total returns do not reflect the deduction of taxes that a shareholder would pay on Portfolio distributions or the redemption of Portfolio shares. Performance of share classes will vary due to difference in expenses.
+ Effective September 9, 2013, Class P shares were renamed Class A shares.
(1) The Morgan Stanley Capital International (MSCI) All Country World Index (ACWI) is a free float-adjusted market capitalization weighted index designed to measure the equity market performance of developed and emerging markets. The term "free float" represents the portion of shares outstanding that are deemed to be available for purchase in the public equity markets by investors. It is not possible to invest directly in an index. The Index is unmanaged and its returns do not include any sales charges or fees. Such costs would lower performance. It is not possible to invest directly in an index.
(2) The Lipper Global Multi-Cap Growth Funds Index is an equally weighted performance index of the largest qualifying funds (based on net assets) in the Lipper Global Multi-Cap Growth Funds classification. The Index, which is adjusted for capital gains distributions and income dividends, is unmanaged and should not be considered an investment. There are currently 30 funds represented in this Index. As of the date of this report, the Portfolio is in the Lipper Global Multi-Cap Growth Funds classification.
(3) Total returns for the Portfolio reflect fees waived and expenses reimbursed, if applicable, by the Adviser. Without such waivers and reimbursements, total returns would have been lower. The fee waivers and/or expense reimbursements will continue for at least one year or until such time as the Fund's Board of Directors acts to discontinue all or a portion of such waivers and/or expense reimbursements when it deems that such action is appropriate.
(4) Commenced operations on December 28, 2010.
(5) For comparative purposes, average annual since inception returns listed for the Indexes refer to the inception date or initial offering of the respective share class of the Portfolio, not the inception of the Index.
Portfolio Composition
Classification | | Percentage of
Total Investments | |
Other* | | | 31.2 | % | |
Internet Software & Services | | | 15.1 | | |
Textiles, Apparel & Luxury Goods | | | 9.5 | | |
Media | | | 8.1 | | |
Short-Term Investments | | | 7.5 | | |
Internet & Catalog Retail | | | 6.5 | | |
Diversified Financial Services | | | 6.0 | | |
Food Products | | | 5.8 | | |
Information Technology Services | | | 5.3 | | |
Insurance | | | 5.0 | | |
Total Investments | | | 100.0 | % | |
* Industries and/or investment types representing less than 5% of total investments.
5
Morgan Stanley Institutional Fund, Inc.
Annual Report — December 31, 2013
Portfolio of Investments
Global Advantage Portfolio
| | | Shares | | Value
(000) | |
Common Stocks (93.8%) | |
Brazil (1.9%) | |
JHSF Participacoes SA | | | 26,973 | | | $ | 49 | | |
Prumo Logistica SA (a) | | | 51,964 | | | | 24 | | |
| | | | 73 | | |
Canada (7.3%) | |
Aimia, Inc. | | | 7,182 | | | | 132 | | |
Fairfax Financial Holdings Ltd. | | | 145 | | | | 58 | | |
Valeant Pharmaceuticals International, Inc. (a) | | | 759 | | | | 89 | | |
| | | | 279 | | |
France (12.5%) | |
Christian Dior SA | | | 853 | | | | 161 | | |
Edenred | | | 4,052 | | | | 136 | | |
Eurazeo SA | | | 2,301 | | | | 180 | | |
| | | | 477 | | |
Hong Kong (2.9%) | |
L'Occitane International SA | | | 52,750 | | | | 112 | | |
Italy (4.5%) | |
Brunello Cucinelli SpA | | | 1,529 | | | | 54 | | |
Moncler SpA (a) | | | 2,598 | | | | 57 | | |
Tamburi Investment Partners SpA | | | 19,126 | | | | 60 | | |
| | | | 171 | | |
Japan (1.0%) | |
FANUC Corp. | | | 200 | | | | 37 | | |
Singapore (3.5%) | |
Jardine Matheson Holdings Ltd. | | | 1,655 | | | | 87 | | |
Mandarin Oriental International Ltd. | | | 29,000 | | | | 48 | | |
| | | | 135 | | |
South Africa (3.3%) | |
Naspers Ltd., Class N | | | 1,209 | | | | 126 | | |
Switzerland (3.2%) | |
Nestle SA ADR | | | 1,637 | | | | 120 | | |
United Kingdom (9.0%) | |
Burberry Group PLC | | | 3,788 | | | | 95 | | |
Diageo PLC ADR | | | 477 | | | | 63 | | |
Intertek Group PLC | | | 2,503 | | | | 131 | | |
Manchester United PLC, Class A (a) | | | 3,400 | | | | 53 | | |
| | | | 342 | | |
United States (44.7%) | |
Amazon.com, Inc. (a) | | | 635 | | | | 253 | | |
Anheuser-Busch InBev N.V. ADR | | | 685 | | | | 73 | | |
Apple, Inc. | | | 138 | | | | 77 | | |
Arch Capital Group Ltd. (a) | | | 856 | | | | 51 | | |
Berkshire Hathaway, Inc., Class B (a) | | | 423 | | | | 50 | | |
Facebook, Inc., Class A (a) | | | 4,471 | | | | 244 | | |
Google, Inc., Class A (a) | | | 211 | | | | 237 | | |
Mastercard, Inc., Class A | | | 126 | | | | 105 | | |
Mead Johnson Nutrition Co. | | | 1,232 | | | | 103 | | |
Motorola Solutions, Inc. | | | 1,095 | | | | 74 | | |
| | | Shares | | Value
(000) | |
Progressive Corp. (The) | | | 3,139 | | | $ | 86 | | |
Starbucks Corp. | | | 1,106 | | | | 87 | | |
Thermo Fisher Scientific, Inc. | | | 516 | | | | 57 | | |
Twitter, Inc. (a) | | | 1,579 | | | | 101 | | |
Visa, Inc., Class A | | | 452 | | | | 101 | | |
| | | | 1,699 | | |
Total Common Stocks (Cost $2,747) | | | 3,571 | | |
| | Notional
Amount | | | |
Call Options Purchased (0.1%) | |
Foreign Currency Options (0.1%) | |
USD/CNY December 2014 @ CNY 6.50 | | | 36,590 | | | | — | @ | |
USD/CNY December 2014 @ CNY 6.50 | | | 452,559 | | | | 1 | | |
USD/CNY December 2014 @ CNY 6.50 | | | 529,736 | | | | 1 | | |
Total Call Options Purchased (Cost $3) | | | 2 | | |
| | Shares | | | |
Short-Term Investment (7.6%) | |
Investment Company (7.6%) | |
Morgan Stanley Institutional Liquidity
Funds — Money Market Portfolio —
Institutional Class (See Note G)
(Cost $288) | | | 288,466 | | | | 288 | | |
Total Investments (101.5%) (Cost $3,038) | | | 3,861 | | |
Liabilities in Excess of Other Assets (-1.5%) | | | (58 | ) | |
Net Assets (100.0%) | | $ | 3,803 | | |
(a) Non-income producing security.
@ Value is less than $500.
ADR American Depositary Receipt.
CNY Chinese Yuan Renminbi
USD United State Dollar
The accompanying notes are an integral part of the financial statements.
6
Morgan Stanley Institutional Fund, Inc.
Annual Report — December 31, 2013
Global Advantage Portfolio
Statement of Assets and Liabilities | | December 31, 2013
(000) | |
Assets: | |
Investments in Securities of Unaffiliated Issuers, at Value (Cost $2,750) | | $ | 3,573 | | |
Investment in Security of Affiliated Issuer, at Value (Cost $288) | | | 288 | | |
Total Investments in Securities, at Value (Cost $3,038) | | | 3,861 | | |
Foreign Currency, at Value (Cost $10) | | | 10 | | |
Due from Adviser | | | 51 | | |
Receivable for Investments Sold | | | 7 | | |
Dividends Receivable | | | 1 | | |
Tax Reclaim Receivable | | | 1 | | |
Receivable from Affiliate | | | — | @ | |
Other Assets | | | — | @ | |
Total Assets | | | 3,931 | | |
Liabilities: | |
Payable for Investments Purchased | | | 116 | | |
Payable for Custodian Fees | | | 3 | | |
Payable for Professional Fees | | | 3 | | |
Payable for Transfer Agent Fees — Class I | | | — | @ | |
Payable for Transfer Agent Fees — Class A* | | | — | @ | |
Payable for Transfer Agent Fees — Class L | | | — | @ | |
Payable for Administration Fees | | | — | @ | |
Payable for Shareholder Services Fees — Class A* | | | — | @ | |
Payable for Distribution and Shareholder Services Fees — Class L | | | — | @ | |
Other Liabilities | | | 6 | | |
Total Liabilities | | | 128 | | |
Net Assets | | $ | 3,803 | | |
Net Assets Consist Of: | |
Paid-in-Capital | | $ | 2,876 | | |
Distributions in Excess of Net Investment Income | | | (10 | ) | |
Accumulated Net Realized Gain | | | 114 | | |
Unrealized Appreciation (Depreciation) on: | |
Investments | | | 823 | | |
Foreign Currency Translations | | | — | @ | |
Net Assets | | $ | 3,803 | | |
The accompanying notes are an integral part of the financial statements.
7
Morgan Stanley Institutional Fund, Inc.
Annual Report — December 31, 2013
Global Advantage Portfolio
Statement of Assets and Liabilities (cont'd) | | December 31, 2013
(000) | |
CLASS I: | |
Net Assets | | $ | 2,868 | | |
| Shares Outstanding $0.001 par value shares of beneficial interest (500,000,000 shares authorized) (not in 000's) | | | 211,387 | | |
Net Asset Value, Offering and Redemption Price Per Share | | $ | 13.57 | | |
CLASS A*: | |
Net Assets | | $ | 681 | | |
| Shares Outstanding $0.001 par value shares of beneficial interest (500,000,000 shares authorized) (not in 000's) | | | 50,227 | | |
Net Asset Value, Redemption Price Per Share | | $ | 13.57 | | |
Maximum Sales Load§§ | | | 5.25 | % | |
Maximum Sales Charge | | $ | 0.75 | | |
Maximum Offering Price Per Share | | $ | 14.32 | | |
CLASS L: | |
Net Assets | | $ | 254 | | |
| Shares Outstanding $0.001 par value shares of beneficial interest (500,000,000 shares authorized) (not in 000's) | | | 18,830 | | |
Net Asset Value, Offering and Redemption Price Per Share | | $ | 13.50 | | |
@ Amount is less than $500.
* Effective September 9, 2013, Class P and Class H shares were renamed Class A shares.
§§ Effective February 25, 2013, the Directors approved the imposition of a maximum initial sales charge of 5.25% on purchases of Class A shares of the Portfolio.
The accompanying notes are an integral part of the financial statements.
8
Morgan Stanley Institutional Fund, Inc.
Annual Report — December 31, 2013
Global Advantage Portfolio
Statement of Operations | | Year Ended
December 31,
2013
(000) | |
Investment Income: | |
Dividends from Securities of Unaffiliated Issuers (Net of $4 of Foreign Taxes Withheld) | | $ | 48 | | |
Interest from Securities of Unaffiliated Issuers | | | 1 | | |
Dividends from Security of Affiliated Issuer (Note G) | | | — | @ | |
Total Investment Income | | | 49 | | |
Expenses: | |
Professional Fees | | | 87 | | |
Registration Fees | | | 70 | | |
Advisory Fees (Note B) | | | 29 | | |
Custodian Fees (Note F) | | | 23 | | |
Shareholder Reporting Fees | | | 12 | | |
Transfer Agency Fees (Note E) | | | 9 | | |
Transfer Agency Fees — Class I (Note E) | | | — | @ | |
Transfer Agency Fees — Class A* (Note E) | | | — | @ | |
Transfer Agency Fees — Class L (Note E) | | | — | @ | |
Pricing Fees | | | 6 | | |
Administration Fees (Note C) | | | 3 | | |
Shareholder Services Fees — Class A* (Note D) | | | 2 | | |
Distribution and Shareholder Services Fees — Class L (Note D) | | | 1 | | |
Directors' Fees and Expenses | | | 1 | | |
Other Expenses | | | 16 | | |
Total Expenses | | | 259 | | |
Expenses Reimbursed by Adviser (Note B) | | | (186 | ) | |
Waiver of Advisory Fees (Note B) | | | (29 | ) | |
Reimbursement of Class Specific Expenses — Class I (Note B) | | | (— | @) | |
Reimbursement of Class Specific Expenses — Class A* (Note B) | | | (— | @) | |
Reimbursement of Class Specific Expenses — Class L (Note B) | | | (— | @) | |
Rebate from Morgan Stanley Affiliate (Note G) | | | (— | @) | |
Net Expenses | | | 44 | | |
Net Investment Income | | | 5 | | |
Realized Gain (Loss): | |
Investments Sold | | | 321 | | |
Foreign Currency Transactions | | | (— | @) | |
Net Realized Gain | | | 321 | | |
Change in Unrealized Appreciation (Depreciation): | |
Investments | | | 523 | | |
Foreign Currency Translations | | | — | @ | |
Net Change in Unrealized Appreciation (Depreciation) | | | 523 | | |
Net Realized Gain and Change in Unrealized Appreciation (Depreciation) | | | 844 | | |
Net Increase in Net Assets Resulting from Operations | | $ | 849 | | |
@ Amount is less than $500.
* Effective September 9, 2013, Class P and Class H shares were renamed Class A shares.
The accompanying notes are an integral part of the financial statements.
9
Morgan Stanley Institutional Fund, Inc.
Annual Report — December 31, 2013
Global Advantage Portfolio
Statements of Changes in Net Assets | | Year Ended
December 31,
2013
(000) | | Year Ended
December 31,
2012
(000) | |
Increase (Decrease) in Net Assets: | |
Operations: | |
Net Investment Income | | $ | 5 | | | $ | 32 | | |
Net Realized Gain | | | 321 | | | | 207 | | |
Net Change in Unrealized Appreciation (Depreciation) | | | 523 | | | | 282 | | |
Net Increase in Net Assets Resulting from Operations | | | 849 | | | | 521 | | |
Distributions from and/or in Excess of: | |
Class I: | |
Net Investment Income | | | (15 | ) | | | (11 | ) | |
Net Realized Gain | | | (203 | ) | | | (73 | ) | |
Class A*: | |
Net Investment Income | | | (1 | ) | | | (1 | ) | |
Net Realized Gain | | | (27 | ) | | | (8 | ) | |
Class H**: | |
Net Investment Income | | | — | | | | (9 | ) | |
Net Realized Gain | | | (5 | )*** | | | (74 | ) | |
Class L: | |
Net Investment Income | | | (— | @) | | | (— | @) | |
Net Realized Gain | | | (18 | ) | | | (8 | ) | |
Total Distributions | | | (269 | ) | | | (184 | ) | |
Capital Share Transactions:(1) | |
Class I: | |
Subscribed | | | 1,881 | | | | 268 | | |
Distributions Reinvested | | | 162 | | | | 40 | | |
Redeemed | | | (749 | ) | | | (969 | ) | |
Class A*: | |
Subscribed | | | 248 | | | | — | | |
Distributions Reinvested | | | 9 | | | | — | | |
Conversion from Class H | | | 266 | | | | — | | |
Class H**: | |
Subscribed | | | — | | | | 100 | | |
Distributions Reinvested | | | 3 | *** | | | 75 | | |
Conversion to Class A | | | (266 | )*** | | | — | | |
Redeemed | | | (994 | )*** | | | — | | |
Class L: | |
Subscribed | | | 115 | | | | — | | |
Distributions Reinvested | | | 7 | | | | — | | |
Redeemed | | | (8 | ) | | | — | | |
Net Increase (Decrease) in Net Assets Resulting from Capital Share Transactions | | | 674 | | | | (486 | ) | |
Total Increase (Decrease) in Net Assets | | | 1,254 | | | | (149 | ) | |
Net Assets: | |
Beginning of Period | | | 2,549 | | | | 2,698 | | |
End of Period (Including Distributions in Excess of Net Investment Income of $(10) and $(—@)) | | $ | 3,803 | | | $ | 2,549 | | |
(1) Capital Share Transactions: | |
Class I: | |
Shares Subscribed | | | 157 | | | | 24 | | |
Shares Issued on Distributions Reinvested | | | 13 | | | | 3 | | |
Shares Redeemed | | | (58 | ) | | | (89 | ) | |
Net Increase (Decrease) in Class I Shares Outstanding | | | 112 | | | | (62 | ) | |
Class A*: | |
Shares Subscribed | | | 18 | | | | — | | |
Shares Issued on Distributions Reinvested | | | 1 | | | | — | | |
Conversion from Class H | | | 21 | | | | — | | |
Net Increase in Class A Shares Outstanding | | | 40 | | | | — | | |
Class H**: | |
Shares Subscribed | | | — | | | | 9 | | |
Shares Issued on Distributions Reinvested | | | — | @*** | | | 6 | | |
Conversion to Class A | | | (21 | )*** | | | — | | |
Shares Redeemed | | | (84 | )*** | | | — | | |
Net Increase (Decrease) in Class H Shares Outstanding | | | (105 | ) | | | 15 | | |
Class L: | |
Shares Subscribed | | | 9 | | | | — | | |
Shares Issued on Distributions Reinvested | | | 1 | | | | — | | |
Shares Redeemed | | | (1 | ) | | | — | | |
Net Increase in Class L Shares Outstanding | | | 9 | | | | — | | |
@ Amount is less than $500.
* Effective September 9, 2013, Class P shares were renamed Class A shares.
** Effective September 9, 2013, Class H shares converted into Class A shares.
*** For the period January 1, 2013 through September 6, 2013.
The accompanying notes are an integral part of the financial statements.
10
Morgan Stanley Institutional Fund, Inc.
Annual Report — December 31, 2013
Financial Highlights
Global Advantage Portfolio
| | | Class I | |
| | | Year Ended December 31, | | Period from
December 28, 2010^ to | |
Selected Per Share Data and Ratios | | 2013 | | 2012 | | 2011 | | December 31, 2010 | |
Net Asset Value, Beginning of Period | | $ | 11.37 | | | $ | 9.97 | | | $ | 10.01 | | | $ | 10.00 | | |
Income (Loss) from Investment Operations: | |
Net Investment Income (Loss)† | | | 0.04 | | | | 0.16 | | | | 0.06 | | | | (0.00 | )‡ | |
Net Realized and Unrealized Gain (Loss) | | | 3.27 | | | | 2.12 | | | | (0.03 | ) | | | 0.01 | | |
Total from Investment Operations | | | 3.31 | | | | 2.28 | | | | 0.03 | | | | 0.01 | | |
Distributions from and/or in Excess of: | |
Net Investment Income | | | (0.08 | ) | | | (0.12 | ) | | | (0.07 | ) | | | — | | |
Net Realized Gain | | | (1.03 | ) | | | (0.76 | ) | | | — | | | | — | | |
Total Distributions | | | (1.11 | ) | | | (0.88 | ) | | | (0.07 | ) | | | — | | |
Net Asset Value, End of Period | | $ | 13.57 | | | $ | 11.37 | | | $ | 9.97 | | | $ | 10.01 | | |
Total Return++ | | | 29.71 | % | | | 22.83 | % | | | 0.34 | % | | | 0.10 | %# | |
Ratios and Supplemental Data: | |
Net Assets, End of Period (Thousands) | | $ | 2,868 | | | $ | 1,129 | | | $ | 1,603 | | | $ | 701 | | |
Ratio of Expenses to Average Net Assets (1) | | | 1.29 | %+ | | | 1.30 | %+†† | | | 1.30 | %+†† | | | 1.30 | %††* | |
Ratio of Net Investment Income (Loss) to Average Net Assets (1) | | | 0.29 | %+ | | | 1.39 | %+†† | | | 0.57 | %+†† | | | (1.10 | )%††* | |
Ratio of Rebate from Morgan Stanley Affiliates to Average Net Assets | | | 0.01 | % | | | 0.00 | %§†† | | | 0.00 | %§†† | | | N/A | | |
Portfolio Turnover Rate | | | 57 | % | | | 63 | % | | | 42 | % | | | 0.00 | %# | |
(1) Supplemental Information on the Ratios to Average Net Assets: | |
Ratios Before Expense Limitation: | |
Expenses to Average Net Assets | | | 8.07 | % | | | 7.28 | %†† | | | 7.31 | %†† | | | 245.42 | %††* | |
Net Investment Loss to Average Net Assets | | | (6.49 | )% | | | (4.59 | )%†† | | | (5.44 | )%†† | | | (245.22 | )%††* | |
^ Commencement of Operations.
† Per share amount is based on average shares outstanding.
‡ Amount is less than $0.005 per share.
++ Calculated based on the net asset value as of the last business day of the period.
+ The Ratios of Expenses and Net Investment Income (Loss) reflect the rebate of certain Portfolio expenses in connection with the investments in Morgan Stanley affiliates during the period. The effect of the rebate on the ratios is disclosed in the above table as "Ratio of Rebate from Morgan Stanley Affiliates to Average Net Assets."
†† Reflects overall Portfolio ratios for investment income and non-class specific expenses.
§ Amount is less than 0.005%.
# Not Annualized.
* Annualized.
The accompanying notes are an integral part of the financial statements.
11
Morgan Stanley Institutional Fund, Inc.
Annual Report — December 31, 2013
Financial Highlights
Global Advantage Portfolio
| | | Class A@ | |
| | | Year Ended December 31, | | Period from
December 28, 2010^ to | |
Selected Per Share Data and Ratios | | 2013 | | 2012 | | 2011 | | December 31, 2010 | |
Net Asset Value, Beginning of Period | | $ | 11.36 | | | $ | 9.97 | | | $ | 10.01 | | | $ | 10.00 | | |
Income (Loss) from Investment Operations: | |
Net Investment Income (Loss)† | | | (0.04 | ) | | | 0.13 | | | | 0.03 | | | | (0.00 | )‡ | |
Net Realized and Unrealized Gain (Loss) | | | 3.31 | | | | 2.11 | | | | (0.02 | ) | | | 0.01 | | |
Total from Investment Operations | | | 3.27 | | | | 2.24 | | | | 0.01 | | | | 0.01 | | |
Distributions from and/or in Excess of: | |
Net Investment Income | | | (0.03 | ) | | | (0.09 | ) | | | (0.05 | ) | | | — | | |
Net Realized Gain | | | (1.03 | ) | | | (0.76 | ) | | | — | | | | — | | |
Total Distributions | | | (1.06 | ) | | | (0.85 | ) | | | (0.05 | ) | | | — | | |
Net Asset Value, End of Period | | $ | 13.57 | | | $ | 11.36 | | | $ | 9.97 | | | $ | 10.01 | | |
Total Return++ | | | 29.48 | % | | | 22.44 | % | | | 0.07 | % | | | 0.10 | %# | |
Ratios and Supplemental Data: | |
Net Assets, End of Period (Thousands) | | $ | 681 | | | $ | 114 | | | $ | 100 | | | $ | 100 | | |
Ratio of Expenses to Average Net Assets (1) | | | 1.60 | %+^^ | | | 1.55 | %+†† | | | 1.55 | %+†† | | | 1.55 | %††* | |
Ratio of Net Investment Income (Loss) to Average Net Assets (1) | | | (0.35 | )%+ | | | 1.14 | %+†† | | | 0.32 | %+†† | | | (1.35 | )%††* | |
Ratio of Rebate from Morgan Stanley Affiliates to Average Net Assets | | | 0.01 | % | | | 0.00 | %§†† | | | 0.00 | %§†† | | | N/A | | |
Portfolio Turnover Rate | | | 57 | % | | | 63 | % | | | 42 | % | | | 0.00 | %# | |
(1) Supplemental Information on the Ratios to Average Net Assets: | |
Ratios Before Expense Limitation: | |
Expenses to Average Net Assets | | | 8.43 | % | | | 7.53 | %†† | | | 7.56 | %†† | | | 245.67 | %††* | |
Net Investment Loss to Average Net Assets | | | (7.18 | )% | | | (4.84 | )%†† | | | (5.69 | )%†† | | | (245.47 | )%††* | |
@ Effective September 9, 2013, Class P and Class H shares were renamed Class A shares.
^ Commencement of Operations.
† Per share amount is based on average shares outstanding.
‡ Amount is less than $0.005 per share.
++ Calculated based on the net asset value which does not reflect sales charges, if applicable, as of the last business day of the period.
+ The Ratios of Expenses and Net Investment Income (Loss) reflect the rebate of certain Portfolio expenses in connection with the investments in Morgan Stanley affiliates during the period. The effect of the rebate on the ratios is disclosed in the above table as "Ratio of Rebate from Morgan Stanley Affiliates to Average Net Assets."
^^ Effective September 16, 2013, the Adviser has agreed to limit the ratio of expenses to average net assets to the maximum ratio of 1.65% for Class A shares. Prior to September 16, 2013, the maximum ratio was 1.55% for Class A shares.
†† Reflects overall Portfolio ratios for investment income and non-class specific expenses.
§ Amount is less than 0.005%.
# Not Annualized.
* Annualized.
The accompanying notes are an integral part of the financial statements.
12
Morgan Stanley Institutional Fund, Inc.
Annual Report — December 31, 2013
Financial Highlights
Global Advantage Portfolio
| | | Class L | |
| | | Year Ended December 31, | | Period from
December 28, 2010^ to | |
Selected Per Share Data and Ratios | | 2013 | | 2012 | | 2011 | | December 31, 2010 | |
Net Asset Value, Beginning of Period | | $ | 11.35 | | | $ | 9.96 | | | $ | 10.01 | | | $ | 10.00 | | |
Income (Loss) from Investment Operations: | |
Net Investment Income (Loss)† | | | (0.09 | ) | | | 0.07 | | | | (0.02 | ) | | | (0.00 | )‡ | |
Net Realized and Unrealized Gain (Loss) | | | 3.28 | | | | 2.11 | | | | (0.02 | ) | | | 0.01 | | |
Total from Investment Operations | | | 3.19 | | | | 2.18 | | | | (0.04 | ) | | | 0.01 | | |
Distributions from and/or in Excess of: | |
Net Investment Income | | | (0.01 | ) | | | (0.03 | ) | | | (0.01 | ) | | | — | | |
Net Realized Gain | | | (1.03 | ) | | | (0.76 | ) | | | — | | | | — | | |
Total Distributions | | | (1.04 | ) | | | (0.79 | ) | | | (0.01 | ) | | | — | | |
Net Asset Value, End of Period | | $ | 13.50 | | | $ | 11.35 | | | $ | 9.96 | | | $ | 10.01 | | |
Total Return++ | | | 28.78 | % | | | 21.89 | % | | | (0.44 | )% | | | 0.10 | %# | |
Ratios and Supplemental Data: | |
Net Assets, End of Period (Thousands) | | $ | 254 | | | $ | 113 | | | $ | 100 | | | $ | 100 | | |
Ratio of Expenses to Average Net Assets (1) | | | 2.09 | %+^^ | | | 2.05 | %+†† | | | 2.05 | %+†† | | | 2.05 | %††* | |
Ratio of Net Investment Income (Loss) to Average Net Assets (1) | | | (0.71 | )%+ | | | 0.64 | %+†† | | | (0.18 | )%+†† | | | (1.85 | )%††* | |
Ratio of Rebate from Morgan Stanley Affiliates to Average Net Assets | | | 0.01 | % | | | 0.00 | %§†† | | | 0.00 | %§†† | | | N/A | | |
Portfolio Turnover Rate | | | 57 | % | | | 63 | % | | | 42 | % | | | 0.00 | %# | |
(1) Supplemental Information on the Ratios to Average Net Assets: | |
Ratios Before Expense Limitation: | |
Expenses to Average Net Assets | | | 9.07 | % | | | 8.03 | %†† | | | 8.06 | %†† | | | 246.17 | %††* | |
Net Investment Loss to Average Net Assets | | | (7.69 | )% | | | (5.34 | )%†† | | | (6.19 | )%†† | | | (245.97 | )%††* | |
^ Commencement of Operations.
† Per share amount is based on average shares outstanding.
‡ Amount is less than $0.005 per share.
++ Calculated based on the net asset value as of the last business day of the period.
+ The Ratios of Expenses and Net Investment Income (Loss) reflect the rebate of certain Portfolio expenses in connection with the investments in Morgan Stanley affiliates during the period. The effect of the rebate on the ratios is disclosed in the above table as "Ratio of Rebate from Morgan Stanley Affiliates to Average Net Assets."
^^ Effective September 16, 2013, the Adviser has agreed to limit the ratio of expenses to average net assets to the maximum ratio of 2.15% for Class L shares. Prior to September 16, 2013, the maximum ratio was 2.05% for Class L shares.
†† Reflects overall Portfolio ratios for investment income and non-class specific expenses.
§ Amount is less than 0.005%.
# Not Annualized.
* Annualized.
The accompanying notes are an integral part of the financial statements.
13
Morgan Stanley Institutional Fund, Inc.
Annual Report — December 31, 2013
Notes to Financial Statements
Morgan Stanley Institutional Fund, Inc. (the "Fund") is registered under the Investment Company Act of 1940, as amended (the "Act"), as an open-end management investment company. The Fund is comprised of twenty-seven separate, active, diversified and non-diversified portfolios (individually referred to as a "Portfolio", collectively as the "Portfolios").
The accompanying financial statements relate to the Global Advantage Portfolio. The Portfolio seeks long-term capital appreciation by investing primarily in established companies located throughout the world, with capitalizations within the range of companies included in the MSCI All Country World Index. The Portfolio offers three classes of shares — Class I, Class A and Class L.
Effective September 9, 2013, Class P and Class H shares were renamed Class A shares.
A. Significant Accounting Policies: The following significant accounting policies are in conformity with U.S. generally accepted accounting principles ("GAAP"). Such policies are consistently followed by the Fund in the preparation of its financial statements. GAAP may require management to make estimates and assumptions that affect the reported amounts and disclosures in the financial statements. Actual results may differ from those estimates.
1. Security Valuation: (1) An equity portfolio security listed or traded on an exchange is valued at its latest reported sales price (or at the exchange official closing price if such exchange reports an official closing price), if there were no sales on a given day, the security is valued at the mean between the last reported bid and asked prices; (2) all other equity portfolio securities for which over-the-counter market quotations are readily available are valued at its latest reported sales price. In cases where a security is traded on more than one exchange, the security is valued on the exchange designated as the primary market; (3) listed options are valued at the last reported sales price on the exchange on which they are listed (or at the exchange official closing price if such exchange reports an official closing price). If an official closing price or last reported sale price is unavailable, the listed option should be fair valued at the mean between its latest bid and ask prices. Unlisted options are valued by an outside pricing service approved by the Fund's Board of Directors (the "Directors") or quotes from a broker or dealer; (4) when market quotations are not readily available, including circumstances under which Morgan Stanley Investment
Management Inc. (the "Adviser") determines that the closing price, last sale price or the mean between the last reported bid and asked prices are not reflective of a security's market value, portfolio securities are valued at their fair value as determined in good faith under procedures established by and under the general supervision of the Directors. Occasionally, developments affecting the closing prices of securities and other assets may occur between the times at which valuations of such securities are determined (that is, close of the foreign market on which the securities trade) and the close of business of the New York Stock Exchange ("NYSE"). If developments occur during such periods that are expected to materially affect the value of such securities, such valuations may be adjusted to reflect the estimated fair value of such securities as of the close of the NYSE, as determined in good faith by the Directors or by the Adviser using a pricing service and/or procedures approved by the Directors; (5) quotations of foreign portfolio securities, other assets and liabilities and forward contracts stated in foreign currency are translated into U.S. dollar equivalents at the prevailing market rates prior to the close of the NYSE; (6) investments in mutual funds, including the Morgan Stanley Institutional Liquidity Funds, are valued at the net asset value as of the close of each business day; and (7) short-term debt securities with remaining maturities of 60 days or less at the time of purchase may be valued at amortized cost, unless the Adviser determines such valuation does not reflect the securities' market value, in which case these securities will be valued at their fair market value determined by the Adviser.
Under procedures approved by the Directors, the Fund's Adviser has formed a Valuation Committee. The Valuation Committee provides administration and oversight of the Fund's valuation policies and procedures, which are reviewed at least annually by the Directors. These procedures allow the Fund to utilize independent pricing services, quotations from securities and financial instrument dealers, and other market sources to determine fair value.
The Fund has procedures to determine the fair value of securities and other financial instruments for which market prices are not readily available. Under these procedures, the Valuation Committee convenes on a regular and ad hoc basis to review such securities and considers a number of factors, including valuation methodologies and significant unobservable valuation inputs, when
14
Morgan Stanley Institutional Fund, Inc.
Annual Report — December 31, 2013
Notes to Financial Statements (cont'd)
arriving at fair value. The Valuation Committee may employ a market-based approach which may use related or comparable assets or liabilities, recent transactions, market multiples, book values, and other relevant information for the investment to determine the fair value of the investment. An income-based valuation approach may also be used in which the anticipated future cash flows of the investment are discounted to calculate fair value. Discounts may also be applied due to the nature or duration of any restrictions on the disposition of the investments. Due to the inherent uncertainty of valuations of such investments, the fair values may differ significantly from the values that would have been used had an active market existed. The Valuation Committee employs various methods for calibrating these valuation approaches including a regular review of valuation methodologies, key inputs and assumptions, transactional back-testing or disposition analysis, and reviews of any related market activity.
2. Fair Value Measurement: Financial Accounting Standards Board ("FASB") Accounting Standards CodificationTM ("ASC") 820, "Fair Value Measurements and Disclosures" ("ASC 820"), defines fair value as the value that the Fund would receive to sell an investment or pay to transfer a liability in a timely transaction with an independent buyer in the principal market, or in the absence of a principal market the most advantageous market for the investment or liability. ASC 820 establishes a three-tier hierarchy to distinguish between (1) inputs that reflect the assumptions market participants would use in valuing an asset or liability developed based on market data obtained from sources independent of the reporting entity (observable inputs) and (2) inputs that reflect the reporting entity's own assumptions about the assumptions market participants would use in valuing an asset or liability developed based on the best information available in the circumstances (unobservable inputs) and to establish classification of fair value measurements for disclosure purposes. Various inputs are used in determining the value of the Fund's investments. The inputs are summarized in the three broad levels listed below.
• Level 1 – unadjusted quoted prices in active markets for identical investments
• Level 2 – other significant observable inputs (including quoted prices for similar investments, interest rates, prepayment speeds, credit risk, etc.)
• Level 3 – significant unobservable inputs including the Fund's own assumptions in determining the fair value of investments. Factors considered in making this determination may include, but are not limited to, information obtained by contacting the issuer, analysts, or the appropriate stock exchange (for exchange-traded securities), analysis of the issuer's financial statements or other available documents and, if necessary, available information concerning other securities in similar circumstances
The inputs or methodology used for valuing securities are not necessarily an indication of the risk associated with investing in those securities and the determination of the significance of a particular input to the fair value measurement in its entirety requires judgment and considers factors specific to each security.
The following is a summary of the inputs used to value the Portfolio's investments as of December 31, 2013.
Investment Type | | Level 1
Unadjusted
quoted
prices
(000) | | Level 2
Other
significant
observable
inputs
(000) | | Level 3
Significant
unobservable
inputs
(000) | | Total
(000) | |
Assets: | |
Common Stocks | |
Beverages | | $ | 136 | | | $ | — | | | $ | — | | | $ | 136 | | |
Capital Markets | | | 60 | | | | — | | | | — | | | | 60 | | |
Commercial Services &
Supplies | | | 136 | | | | — | | | | — | | | | 136 | | |
Communications
Equipment | | | 74 | | | | — | | | | — | | | | 74 | | |
Computers & Peripherals | | | 77 | | | | — | | | | — | | | | 77 | | |
Diversified Financial
Services | | | 230 | | | | — | | | | — | | | | 230 | | |
Food Products | | | 223 | | | | — | | | | — | | | | 223 | | |
Hotels, Restaurants &
Leisure | | | 135 | | | | — | | | | — | | | | 135 | | |
Industrial Conglomerates | | | 87 | | | | — | | | | — | | | | 87 | | |
Information Technology
Services | | | 206 | | | | — | | | | — | | | | 206 | | |
Insurance | | | 195 | | | | — | | | | — | | | | 195 | | |
Internet & Catalog Retail | | | 253 | | | | — | | | | — | | | | 253 | | |
Internet Software &
Services | | | 582 | | | | — | | | | — | | | | 582 | | |
Life Sciences Tools &
Services | | | 57 | | | | — | | | | — | | | | 57 | | |
Machinery | | | 37 | | | | — | | | | — | | | | 37 | | |
Media | | | 311 | | | | — | | | | — | | | | 311 | | |
Pharmaceuticals | | | 89 | | | | — | | | | — | | | | 89 | | |
15
Morgan Stanley Institutional Fund, Inc.
Annual Report — December 31, 2013
Notes to Financial Statements (cont'd)
Investment Type | | Level 1
Unadjusted
quoted
prices
(000) | | Level 2
Other
significant
observable
inputs
(000) | | Level 3
Significant
unobservable
inputs
(000) | | Total
(000) | |
Common Stocks (cont'd) | |
Professional Services | | $ | 131 | | | $ | — | | | $ | — | | | $ | 131 | | |
Real Estate Management &
Development | | | 49 | | | | — | | | | — | | | | 49 | | |
Specialty Retail | | | 112 | | | | — | | | | — | | | | 112 | | |
Textiles, Apparel & Luxury
Goods | | | 367 | | | | — | | | | — | | | | 367 | | |
Transportation
Infrastructure | | | 24 | | | | — | | | | — | | | | 24 | | |
Total Common Stocks | | | 3,571 | | | | — | | | | — | | | | 3,571 | | |
Call Options Purchased | | | — | | | | 2 | | | | — | | | | 2 | | |
Short-Term Investment
Investment Company | | | 288 | | | | — | | | | — | | | | 288 | | |
Total Assets | | $ | 3,859 | | | $ | 2 | | | $ | — | | | $ | 3,861 | | |
Transfers between investment levels may occur as the markets fluctuate and/or the availability of data used in an investment's valuation changes. The Portfolio recognizes transfers between the levels as of the end of the period. As of December 31, 2013, securities with a total value of approximately $1,100,000 transferred from Level 2 to Level 1. At December 31, 2012, the fair value of certain securities were adjusted due to developments which occurred between the time of the close of the foreign markets on which they trade and the close of business on the NYSE which resulted in their Level 2 classification.
3. Foreign Currency Translation and Foreign Investments: The books and records of the Portfolio are maintained in U.S. dollars. Foreign currency amounts are translated into U.S. dollars as follows:
– investments, other assets and liabilities at the prevailing rate of exchange on the valuation date;
– investment transactions and investment income at the prevailing rates of exchange on the dates of such transactions.
Although the net assets of the Portfolio are presented at the foreign exchange rates and market values at the close of the period, the Portfolio does not isolate that portion of the results of operations arising as a result of changes in the foreign exchange rates from the fluctuations arising from changes in the market prices of securities held at period end. Similarly, the Portfolio does not isolate the effect of changes in foreign exchange rates from the fluctuations arising from changes in the market prices of
securities sold during the period. Accordingly, realized and unrealized foreign currency gains (losses) on investments in securities are included in the reported net realized and unrealized gains (losses) on investment transactions and balances. However, pursuant to U.S. Federal income tax regulations, gains and losses from certain foreign currency transactions and the foreign currency portion of gains and losses realized on sales and maturities of foreign denominated debt securities are treated as ordinary income for U.S. Federal income tax purposes.
Net realized gains (losses) on foreign currency transactions represent net foreign exchange gains (losses) from foreign currency forward exchange contracts, disposition of foreign currencies, currency gains (losses) realized between the trade and settlement dates on securities transactions, and the difference between the amount of investment income and foreign withholding taxes recorded on the Portfolio's books and the U.S. dollar equivalent amounts actually received or paid. Net unrealized currency gains (losses) from valuing foreign currency denominated assets and liabilities at period end exchange rates are reflected as a component of unrealized appreciation (depreciation) on the Statement of Assets and Liabilities. The change in unrealized currency gains (losses) on foreign currency translations for the period is reflected in the Statement of Operations.
Foreign security and currency transactions may involve certain considerations and risks not typically associated with those of U.S. dollar denominated transactions as a result of, among other factors, fluctuations of exchange rates in relation to the U.S. dollar, the possibility of lower levels of governmental supervision and regulation of foreign securities markets and the possibility of political or economic instability.
The net assets of the Portfolio include foreign denominated securities and currency. Changes in currency exchange rates will affect the U.S. Dollar value of and investment income from such securities.
Governmental approval for foreign investments may be required in advance of making an investment under certain circumstances in some countries, and the extent of foreign investments in domestic companies may be subject to limitation in other countries. Foreign ownership limitations also may be imposed by the charters of
16
Morgan Stanley Institutional Fund, Inc.
Annual Report — December 31, 2013
Notes to Financial Statements (cont'd)
individual companies to prevent, among other concerns, violations of foreign investment limitations. As a result, an additional class of shares (identified as "Foreign" in the Portfolio of Investments) may be created and offered for investment. The "local" and "foreign shares" market values may differ. In the absence of trading of the foreign shares in such markets, the Portfolio values the foreign shares at the closing exchange price of the local shares.
4. Derivatives: The Portfolio may, but is not required to, use derivative instruments for a variety of purposes, including hedging, risk management, portfolio management or to earn income. Derivatives are financial instruments whose value is based, in part, on the value of an underlying asset, interest rate, index or financial instrument. Prevailing interest rates and volatility levels, among other things, also affect the value of derivative instruments. A derivative instrument often has risks similar to its underlying asset and may have additional risks, including imperfect correlation between the value of the derivative and the underlying asset, risks of default by the counterparty to certain transactions, magnification of losses incurred due to changes in the market value of the securities, instruments, indices or interest rates to which they relate, and risks that the transactions may not be liquid. The use of derivatives involves risks that are different from, and possibly greater than, the risks associated with other portfolio investments. Derivatives may involve the use of highly specialized instruments that require investment techniques and risk analyses different from those associated with other portfolio investments. All of the Portfolio's holdings, including derivative instruments, are marked-to-market each day with the change in value reflected in unrealized appreciation (depreciation). Upon disposition, a realized gain or loss is recognized.
Certain derivative transactions may give rise to a form of leverage. Leverage magnifies the potential for gain and the risk of loss. Leverage associated with derivative transactions may cause the Portfolio to liquidate portfolio positions when it may not be advantageous to do so to satisfy its obligations or to meet earmarking or segregation requirements, pursuant to applicable Securities and Exchange Commission rules and regulations, or may cause the Portfolio to be more volatile than if the Portfolio had not been leveraged. Although the Adviser seeks to use derivatives to further the Portfolio's
investment objectives, there is no assurance that the use of derivatives will achieve this result.
Following is a description of the derivative instruments and techniques that the Portfolio used during the period and their associated risks:
Options: In respect to options, the Portfolio is subject to equity risk, interest rate risk and foreign currency exchange risk in the normal course of pursuing its investment objectives. If the Portfolio buys an option, it buys a legal contract giving it the right to buy or sell a specific amount of the underlying instrument or futures contract on the underlying instrument such a as security, currency or index, at an agreed upon price typically in exchange for a premium paid by the Portfolio. The Portfolio may purchase put and call options. Purchasing call options tends to increase the Portfolio's exposure to the underlying (or similar) instrument. Purchasing put options tends to decrease the Portfolio's exposure to the underlying (or similar) instrument. When entering into purchased option contracts, the Portfolio bears the risk of interest or exchange rates or securities prices moving unexpectedly, in which case, the Portfolio may not achieve the anticipated benefits of the purchased option contracts; however the risk of loss is limited to the premium paid. Purchased options are reported as part of "Total Investments" on the Statement of Assets and Liabilities. Premium paid for purchasing options which expired are treated as realized losses. If the Portfolio sells an option, it sells to another party the right to buy from or sell to the Portfolio a specific amount of the underlying instrument or futures contract on the underlying instrument at an agreed upon price typically in exchange for a premium received by the Portfolio. There is the risk the Portfolio may not be able to enter into a closing transaction because of an illiquid market. A decision as to whether, when and how to use options involves the exercise of skill and judgment and even a well-conceived option transaction may be unsuccessful because of market behavior or unexpected events. The prices of options can be highly volatile and the use of options can lower total returns.
FASB ASC 815, "Derivatives and Hedging: Overall" ("ASC 815"), is intended to improve financial reporting about derivative instruments by requiring enhanced disclosures to enable investors to better understand how and why the Portfolio uses derivative instruments, how
17
Morgan Stanley Institutional Fund, Inc.
Annual Report — December 31, 2013
Notes to Financial Statements (cont'd)
these derivative instruments are accounted for and their effects on the Portfolio's financial position and results of operations.
The following table sets forth the fair value of the Portfolio's derivative contracts by primary risk exposure as of December 31, 2013.
| | | Asset Derivatives
Statement of Assets and
Liabilities Location | | Primary Risk
Exposure | | Value
(000) | |
Options Purchased
| | Investments, at Value
(Options Purchased) | |
Currency Risk | | $ | 2 | † | |
† Amounts are included in Investments in the Statement of Assets and Liabilities.
The following table sets forth by primary risk exposure the Portfolio's change in unrealized appreciation (depreciation) by type of derivative contract for the year ended December 31, 2013 in accordance with ASC 815.
Change in Unrealized Appreciation (Depreciation) | |
Primary Risk Exposure | | Derivative Type | | Value
(000) | |
Currency Risk
| | Investments
(Options Purchased) | | $ | (1 | )†† | |
†† Amounts are included in Investments in the Statement of Operations.
At December 31, 2013, the Portfolio's derivative assets and liabilities are as follows:
Gross Amounts of Assets and Liabilities Presented in the
Statement of Assets and Liabilities | |
Derivatives | | Assets(a)
(000) | | Liabilities(a)
(000) | |
Options Purchased | | $ | 2 | | | $ | — | | |
(a) Absent an event of default or early termination, OTC derivative assets and liabilities are presented gross and not offset in the Statement of Assets and Liabilities.
The following table presents derivative financial instruments that are subject to enforceable netting arrangements as of December 31, 2013.
Gross Amounts Not Offset in the Statement of Assets and Liabilities | |
Counterparty | | Gross Asset
Derivatives
Presented in
Statement of
Assets and Liabilities
(000) | | Financial
Instrument
(000) | | Collateral
Received
(000) | | Net Amount
(not less
than 0)
(000) | |
Royal Bank of Scotland | | $ | 2 | | | $ | — | | | $ | — | | | $ | 2 | | |
For the year ended December 31, 2013, the approximate average monthly amount outstanding for each derivative type is as follows:
Options Purchased: | |
| Average monthly notional amount | | | 85,000 | | |
5. Indemnifications: The Fund enters into contracts that contain a variety of indemnifications. The Fund's
maximum exposure under these arrangements is unknown. However, the Fund has not had prior claims or losses pursuant to these contracts and expects the risk of loss to be remote.
6. Dividends and Distributions to Shareholders: Dividend income and distributions to shareholders are recorded on the ex-dividend date. Dividends from net investment income, if any, are declared and paid semiannually. Net realized capital gains, if any, are distributed at least annually.
7. Security Transactions, Income and Expenses: Security transactions are accounted for on the trade date (date the order to buy or sell is executed). Realized gains and losses on the sale of investment securities are determined on the specific identified cost method. Dividend income and other distributions are recorded on the ex-dividend date (except for certain foreign dividends which may be recorded as soon as the Portfolio is informed of such dividends) net of applicable withholding taxes. Interest income is recognized on the accrual basis except where collection is in doubt. Discounts are accreted and premiums are amortized over the life of the respective securities. Most expenses of the Fund can be directly attributed to a particular Portfolio. Expenses which cannot be directly attributed are apportioned among the Portfolios based upon relative net assets or other appropriate methods. Income, expenses (other than class specific expenses — distribution, transfer agency and sub transfer agency fees) and realized and unrealized gains or losses are allocated to each class of shares based upon their relative net assets.
B. Advisory Fees: The Adviser, a wholly-owned subsidiary of Morgan Stanley, provides the Portfolio with advisory services under the terms of an Investment Advisory Agreement, paid quarterly, at the annual rate based on the average daily net assets as follows:
First $1
billion | | Over $1
billion | |
| | 0.90 | % | | | 0.85 | % | |
For the year ended December 31, 2013, the advisory fee rate (net of waivers/rebate) was equivalent to an annual effective rate of 0.00% of the Portfolio's daily net assets.
The Adviser has agreed to reduce its advisory fee and/or reimburse the Portfolio so that total annual portfolio operating expenses, excluding certain investment related expenses, taxes, interest and other extraordinary expenses (including litigation),
18
Morgan Stanley Institutional Fund, Inc.
Annual Report — December 31, 2013
Notes to Financial Statements (cont'd)
will not exceed 1.30% for Class I shares, 1.55% for Class A shares and 2.05% for Class L shares. Effective September 16, 2013, the Adviser has agreed to limit the ratio of expenses to average net assets to the maximum ratio of 1.65% and 2.15% for Class A and Class L shares, respectively. The fee waivers and/or expense reimbursements will continue for at least one year or until such time that the Directors act to discontinue all or a portion of such waivers and/or reimbursements when it deems such action is appropriate. For the year ended December 31, 2013, approximately $29,000 of advisory fees were waived and approximately $186,000 of other expenses were reimbursed by the Adviser pursuant to this arrangement.
C. Administration Fees: The Adviser also serves as Administrator to the Fund and provides administrative services pursuant to an Administration Agreement for an annual fee, accrued daily and paid monthly, of 0.08% of the Portfolio's average daily net assets. Under a Sub-Administration Agreement between the Administrator and State Street Bank and Trust Company ("State Street"), State Street provides certain administrative services to the Fund. For such services, the Administrator pays State Street a portion of the fee the Administrator receives from the Portfolio.
D. Distribution and Shareholder Services Fees: Morgan Stanley Distribution, Inc. ("MSDI" or the "Distributor"), a wholly-owned subsidiary of the Adviser, and an indirect subsidiary of Morgan Stanley, serves as the Fund's Distributor of Portfolio shares pursuant to a Distribution Agreement. The Fund has adopted a Shareholder Services Plan with respect to Class A shares pursuant to Rule 12b-1 under the Act. Under the Shareholder Services Plan, the Portfolio pays the Distributor a shareholder services fee, accrued daily and paid monthly, at an annual rate of 0.25% of the Portfolio's average daily net assets attributable to Class A shares.
The Fund has adopted a Distribution and Shareholder Services Plan with respect to Class L shares pursuant to Rule 12b-1 under the Act. Under the Distribution and Shareholder Services Plan, the Portfolio pays the Distributor a distribution fee, accrued daily and paid monthly, at an annual rate of 0.50% and a shareholder services fee, accrued daily and paid monthly, at an annual rate of 0.25% of the Portfolio's average daily net assets attributable to Class L shares.
The distribution and shareholder services fees are used to support the expenses associated with servicing and maintaining
accounts. The Distributor may compensate other parties for providing shareholder support services to investors who purchase Class A and Class L shares.
E. Dividend Disbursing and Transfer Agent: The Fund's dividend disbursing and transfer agent was Morgan Stanley Services Company Inc. ("Morgan Stanley Services"). Pursuant to a Transfer Agency Agreement, the Fund paid Morgan Stanley Services a fee based on the number of classes, accounts and transactions relating to the Portfolios of the Fund. Effective July 1, 2013, the Directors approved changing the transfer agent to Boston Financial Data Services, Inc.
F. Custodian Fees: State Street (the "Custodian") serves as Custodian for the Fund in accordance with a Custodian Agreement. The Custodian holds cash, securities, and other assets of the Fund as required by the Act. Custody fees are payable monthly based on assets held in custody, investment purchases and sales activity and account maintenance fees, plus reimbursement for certain out-of-pocket expenses.
G. Security Transactions and Transactions with Affiliates: For the year ended December 31, 2013, purchases and sales of investment securities for the Portfolio, other than long-term U.S. Government securities and short-term investments, were approximately $1,992,000 and $1,707,000, respectively. There were no purchases and sales of long-term U.S. Government securities for the year ended December 31, 2013.
The Portfolio invests in the Institutional Class of the Morgan Stanley Institutional Liquidity Funds — Money Market Portfolio (the "Liquidity Funds"), an open-end management investment company managed by the Adviser. Advisory fees paid by the Portfolio are reduced by an amount equal to its pro-rata share of the advisory and administration fees paid by the Portfolio due to its investment in the Liquidity Funds. For the year ended December 31, 2013, advisory fees paid were reduced by less than $500 relating to the Portfolio's investment in the Liquidity Funds.
A summary of the Portfolio's transactions in shares of the Liquidity Funds during the year ended December 31, 2013 is as follows:
Value
December 31,
2012
(000) | | Purchases
at Cost
(000) | | Sales
(000) | | Dividend
Income
(000) | | Value
December 31,
2013
(000) | |
| $ | 65 | | | $ | 2,078 | | | $ | 1,855 | | | $ | — | @ | | $ | 288 | | |
@ Amount is less than $500.
19
Morgan Stanley Institutional Fund, Inc.
Annual Report — December 31, 2013
Notes to Financial Statements (cont'd)
During the year ended December 31, 2013, the Portfolio incurred less than $500 in brokerage commissions with Morgan Stanley & Co., LLC, an affiliate of the Adviser, Administrator and Distributor, for portfolio transactions executed on behalf of the Portfolio.
From January 1, 2013 to June 30, 2013, the Portfolio incurred less than $500 in brokerage commissions with Citigroup, Inc., and its affiliated broker-dealers, which may be deemed affiliates of the Adviser, Distributor and Administrator under Section 17 of the Act, for portfolio transactions executed on behalf of the Portfolio. Citigroup, Inc. and its affiliated broker-dealers ceased to be affiliates of the Portfolio pursuant to Section 17 of the Act as of July 1, 2013.
H. Federal Income Taxes: It is the Portfolio's intention to continue to qualify as a regulated investment company and distribute all of its taxable and tax-exempt income. Accordingly, no provision for Federal income taxes is required in the financial statements.
The Portfolio may be subject to taxes imposed by countries in which it invests. Such taxes are generally based on income and/or capital gains earned or repatriated. Taxes are accrued based on net investment income, net realized gains and net unrealized appreciation as such income and/or gains are earned. Taxes may also be based on transactions in foreign currency and are accrued based on the value of investments denominated in such currency.
FASB ASC 740-10 "Income Taxes — Overall" sets forth a minimum threshold for financial statement recognition of the benefit of a tax position taken or expected to be taken in a tax return. Management has concluded there are no significant uncertain tax positions that would require recognition in the financial statements. If applicable, the Portfolio recognizes interest accrued related to unrecognized tax benefits in "Interest Expense" and penalties in ''Other Expenses" in the Statement of Operations. The Portfolio files tax returns with the U.S. Internal Revenue Service, New York and various states. Generally, each of the tax years in the four-year period ended December 31, 2013, remains subject to examination by taxing authorities.
The tax character of distributions paid may differ from the character of distributions shown in the Statements of Changes in Net Assets due to short-term capital gains being treated as
ordinary income for tax purposes. The tax character of distributions paid during fiscal 2013 and 2012 was as follows:
2013
Distributions
Paid From: | | 2012
Distributions
Paid From: | |
Ordinary
Income
(000) | | Long-Term
Capital Gain
(000) | | Ordinary
Income
(000) | | Long-Term
Capital Gain
(000) | |
| $ | 107 | | | $ | 162 | | | $ | 46 | | | $ | 137 | | |
The amount and character of income and gains to be distributed are determined in accordance with income tax regulations which may differ from GAAP. These book/tax differences are either considered temporary or permanent in nature.
Temporary differences are primarily due to differing book and tax treatments in the timing of the recognition of gains (losses) on certain investment transactions and the timing of the deductibility of certain expenses.
Permanent differences, primarily due to differing treatments of gains (losses) related to foreign currency transactions and basis adjustments on certain equity securities designated as passive foreign investment companies, resulted in the following reclassifications among the components of net assets at December 31, 2013:
Distributions in
Excess of
Net Investment
Income
(000) | | Accumulated
Net Realized
Gain
(000) | | Paid-in-
Capital
(000) | |
| $ | 1 | | | $ | (1 | ) | | $ | — | | |
At December 31, 2013, the components of distributable earnings for the Portfolio on a tax basis were as follows:
Undistributed
Ordinary
Income
(000) | | Undistributed
Long-Term
Capital Gain
(000) | |
| $ | 58 | | | $ | 72 | | |
At December 31, 2013, the aggregate cost for federal income tax purposes is $3,065,000. The aggregate gross unrealized appreciation is $868,000 and the aggregate gross unrealized depreciation is $72,000 resulting in net unrealized appreciation of $796,000.
I. Other (unaudited): At December 31, 2013, the Portfolio had otherwise unaffiliated record owners of 10% or greater. Investment activities of these shareholders could have a material impact on the Portfolio. The aggregate percentage of such owners was 23% for Class A .
J. Results of Special Shareholder Meeting (unaudited): On June 5, 2013, a Joint Special Shareholder Meeting was held For Class H shareholders of the Portfolio to approve the
20
Morgan Stanley Institutional Fund, Inc.
Annual Report — December 31, 2013
Notes to Financial Statements (cont'd)
Articles of Amendment to the Fund's Articles of Amendment and Restatement and a Plan of Reclassification for the Portfolio pursuant to which Class H shares would be reclassified as Class P shares. The results with respect to this proposal were as follows:
| For | | Against | | Abstain | |
| | 20,886 | | | | 0 | | | | 0 | | |
K. Accounting Pronouncement: In June 2013, FASB issued Accounting Standards Update 2013-08 Financial Services — Investment Companies (Topic 946) — Amendments to the Scope, Measurement, and Disclosure Requirements ("ASU 2013-08") which is effective for interim and annual reporting periods in fiscal years that begin after December 15, 2013. ASU 2013-08 sets forth a methodology for determining whether an entity should be characterized as an investment company and prescribes fair value accounting for an investment company's non-controlling ownership interest in another investment company. FASB has determined that a fund registered under the Investment Company Act of 1940 automatically meets ASU 2013-08's criteria for an investment company. Although still evaluating the potential impacts of ASU 2013-08 to the Portfolio, management expects that the impact of the Portfolio's adoption will be limited to additional financial statement disclosures.
21
Morgan Stanley Institutional Fund, Inc.
Annual Report — December 31, 2013
Report of Independent Registered Public Accounting Firm
To the Shareholders and Board of Directors of
Morgan Stanley Institutional Fund, Inc. —
Global Advantage Portfolio
We have audited the accompanying statement of assets and liabilities, including the portfolio of investments, of Global Advantage Portfolio (one of the portfolios constituting Morgan Stanley Institutional Fund, Inc.) (the "Portfolio") as of December 31, 2013, and the related statement of operations for the year then ended, the statements of changes in net assets for each of the two years in the period then ended, and the financial highlights for each of the periods indicated therein. These financial statements and financial highlights are the responsibility of the Portfolio's management. Our responsibility is to express an opinion on these financial statements and financial highlights based on our audits.
We conducted our audits in accordance with the standards of the Public Company Accounting Oversight Board (United States). Those standards require that we plan and perform the audit to obtain reasonable assurance about whether the financial statements and financial highlights are free of material misstatement. We were not engaged to perform an audit of the Portfolio's internal control over financial reporting. Our audits included consideration of internal control over financial reporting as a basis for designing audit procedures that are appropriate in the circumstances, but not for the purpose of expressing an opinion on the effectiveness of the Portfolio's internal control over financial reporting. Accordingly, we express no such opinion. An audit also includes examining, on a test basis, evidence supporting the amounts and disclosures in the financial statements and financial highlights, assessing the accounting principles used and significant estimates made by management, and evaluating the overall financial statement presentation. Our procedures included confirmation of securities owned as of December 31, 2013, by correspondence with the custodian and others or by other appropriate auditing procedures where replies from others were not received. We believe that our audits provide a reasonable basis for our opinion.
In our opinion, the financial statements and financial highlights referred to above present fairly, in all material respects, the financial position of Global Advantage Portfolio (one of the portfolios constituting Morgan Stanley Institutional Fund, Inc.) at December 31, 2013, the results of its operations for the year then ended, the changes in its net assets for each of the two years in the period then ended, and the financial highlights for each of the periods indicated therein, in conformity with U.S. generally accepted accounting principles.

Boston, Massachusetts
February 26, 2014
22
Morgan Stanley Institutional Fund, Inc.
Annual Report — December 31, 2013
Federal Tax Notice (unaudited)
For Federal income tax purposes, the following information is furnished with respect to the distributions paid by the Portfolio during its taxable year ended December 31, 2013. For corporate shareholders, 6.7% of the dividends qualified for the dividends received deduction.
The Portfolio designated and paid $162,000 as a long-term capital gain distribution.
For Federal income tax purposes, the following information is furnished with respect to the Portfolio's earnings for its taxable year ended December 31, 2013. When distributed, certain earnings may be subject to a maximum tax rate of 15% as provided for the Jobs and Growth Tax Relief Reconciliation Act of 2003. The Portfolio designated up to a maximum of $46,000 as taxable at this lower rate.
In January, the Portfolio provides tax information to shareholders for the preceding calendar year.
23
Morgan Stanley Institutional Fund, Inc.
Annual Report — December 31, 2013
U.S. Privacy Policy (unaudited)
AN IMPORTANT NOTICE CONCERNING OUR U.S. PRIVACY POLICY
This privacy notice describes the U.S. privacy policy of Morgan Stanley Distribution, Inc., and the Morgan Stanley family of mutual funds ("us", "our", "we").
We are required by federal law to provide you with notice of our U.S. privacy policy ("Policy"). This Policy applies to both our current and former clients unless we state otherwise and is intended for individual clients who purchase products or receive services from us for personal, family or household purposes. This Policy is not applicable to partnerships, corporations, trusts or other non-individual clients or account holders, nor is this Policy applicable to individuals who are either beneficiaries of a trust for which we serve as trustee or participants in an employee benefit plan administered or advised by us. This Policy is, however, applicable to individuals who select us to be a custodian of securities or assets in individual retirement accounts, 401(k) accounts, or accounts subject to the Uniform Gifts to Minors Act.
This notice sets out our business practices to protect your privacy; how we collect and share personal information about you; and how you can limit our sharing or certain uses by others of this information. We may amend this Policy at any time, and will inform you of any changes to our Policy as required by law.
WE RESPECT YOUR PRIVACY
We appreciate that you have provided us with your personal financial information and understand your concerns about your information. We strive to safeguard the information our clients entrust to us. Protecting the confidentiality and security of client information is an important part of how we conduct our business.
This notice describes what personal information we collect about you, how we collect it, when we may share it with others, and how certain others may use it. It discusses the steps you may take to limit our sharing of certain information about you with our affiliated companies, including, but not limited to our affiliated banking businesses, brokerage firms and credit service affiliates. It also discloses how you may limit our affiliates' use of shared information for marketing purposes.
Throughout this Policy, we refer to the nonpublic information that personally identifies you as "personal information." We also use the term "affiliated company" in this notice. An affiliated company is a company in our family of companies and includes companies with the Morgan Stanley name. These affiliated companies are financial institutions such as broker-dealers, banks, investment advisers and credit card issuers. We refer to any company that is not an affiliated company as a nonaffiliated third party. For purposes of Section 5 of this notice, and your ability to limit certain uses of personal information by our affiliates, this notice applies to the use of personal information by our affiliated companies.
1. WHAT PERSONAL INFORMATION DO WE COLLECT FROM YOU?
We may collect the following types of information about you: (i) information provided by you, including information from applications and other forms we receive from you, (ii) information about your transactions with us or our affiliates, (iii) information about your transactions with nonaffiliated third parties, (iv) information from consumer reporting agencies, (v) information obtained from our websites, and (vi) information obtained from other sources. For example:
• We collect information such as your name, address, e-mail address, telephone/fax numbers, assets, income and investment objectives through applications and other forms you submit to us.
• We may obtain information about account balances, your use of account(s) and the types of products and services you prefer to receive from us through your dealings and transactions with us and other sources.
• We may obtain information about your creditworthiness and credit history from consumer reporting agencies.
• We may collect background information from and through third-party vendors to verify representations you have made and to comply with various regulatory requirements.
2. WHEN DO WE DISCLOSE PERSONAL INFORMATION WE COLLECT ABOUT YOU?
We may disclose personal information we collect about you in each of the categories listed above to affiliated and nonaffiliated third parties.
24
Morgan Stanley Institutional Fund, Inc.
Annual Report — December 31, 2013
U.S. Privacy Policy (unaudited) (cont'd)
a. Information we disclose to affiliated companies.
We may disclose personal information that we collect about you to our affiliated companies to manage your account(s) effectively, to service and process your transactions, and to let you know about products and services offered by us and affiliated companies, to manage our business, and as otherwise required or permitted by law. Offers for products and services from affiliated companies are developed under conditions designed to safeguard your personal information.
b. Information we disclose to third parties.
We may disclose personal information that we collect about you to nonaffiliated third parties to provide marketing services on our behalf or to other financial institutions with whom we have joint marketing agreements. We may also disclose all of the information we collect to other nonaffiliated third parties for our everyday business purposes, such as to process transactions, maintain account(s), respond to court orders and legal investigations, report to credit bureaus, offer our own products and services, protect against fraud, for institutional risk control, to perform services on our behalf, and as otherwise required or permitted by law.
When we share personal information about you with a nonaffiliated third party, they are required to limit their use of personal information about you to the particular purpose for which it was shared and they are not allowed to share personal information about you with others except to fulfill that limited purpose or as may be permitted or required by law.
3. HOW DO WE PROTECT THE SECURITY AND CONFIDENTIALITY OF PERSONAL INFORMATION WE COLLECT ABOUT YOU?
We maintain physical, electronic and procedural security measures that comply with applicable law and regulations to help safeguard the personal information we collect about you. We have internal policies governing the proper handling of client information by employees. Third parties that provide support or marketing services on our behalf may also receive personal information about you, and we require them to adhere to appropriate security standards with respect to such information.
4. HOW CAN YOU LIMIT OUR SHARING CERTAIN PERSONAL INFORMATION ABOUT YOU WITH OUR AFFILIATED COMPANIES FOR ELIGIBILITY DETERMINATION?
By following the opt-out procedures in Section 6 below, you may limit the extent to which we share with our affiliated companies, personal information that was collected to determine your eligibility for products and services such as your credit reports and other information that you have provided to us or that we may obtain from third parties ("eligibility information"). Eligibility information does not include your identification information or personal information pertaining to our transactions or experiences with you. Please note that, even if you direct us not to share eligibility information with our affiliated companies, we may still share your personal information, including eligibility information, with our affiliated companies under circumstances that are permitted under applicable law, such as to process transactions or to service your account.
5. HOW CAN YOU LIMIT THE USE OF CERTAIN PERSONAL INFORMATION ABOUT YOU BY OUR AFFILIATED COMPANIES FOR MARKETING?
By following the opt-out instructions in Section 6 below, you may limit our affiliated companies from marketing their products or services to you based on personal information we disclose to them. This information may include, for example, your income and account history with us. Please note that, even if you choose to limit our affiliated companies from using personal information about you that we may share with them for marketing their products and services to you, our affiliated companies may use your personal information that they obtain from us to market to you in circumstances permitted by law, such as if the affiliated party has its own relationship with you.
25
Morgan Stanley Institutional Fund, Inc.
Annual Report — December 31, 2013
U.S. Privacy Policy (unaudited) (cont'd)
6. HOW CAN YOU SEND US AN OPT-OUT INSTRUCTION?
If you wish to limit our sharing of eligibility information about you with our affiliated companies, or our affiliated companies' use of personal information for marketing purposes, as described in this notice, you may do so by:
• Calling us at (800) 548-7786
Monday–Friday between 8a.m. and 5p.m. (EST)
• Writing to us at the following address:
Boston Financial Data Services, Inc.
c/o Privacy Coordinator
P.O. Box 219804
Kansas City, Missouri 64121
If you choose to write to us, your request should include: your name, address, telephone number and account number(s) to which the opt-out applies and whether you are opting out with respect to sharing of eligibility information (Section 4 above), or information used for marketing (Section 5 above), or both. Written opt-out requests should not be sent with any other correspondence. In order to process your request, we require that the request be provided by you directly and not through a third party. Once you have informed us about your privacy preferences, your opt-out preference will remain in effect with respect to this Policy (as it may be amended) until you notify us otherwise. If you are a joint account owner, we will accept instructions from any one of you and apply those instructions to the entire account.
Please understand that if you limit our sharing or our affiliated companies' use of personal information, you and any joint account holder(s) may not receive information about our affiliated companies' products and services, including products or services that could help you manage your financial resources and achieve your investment objectives.
If you have more than one account or relationship with us, please specify the accounts to which you would like us to apply your privacy choices. If you have accounts or relationships with our affiliates, you may receive multiple privacy policies from them, and will need to separately notify those companies of your privacy choices for those accounts or relationships.
7. WHAT IF AN AFFILIATED COMPANY BECOMES A NONAFFILIATED THIRD PARTY?
If, at any time in the future, an affiliated company becomes a nonaffiliated third party, further disclosures of personal information made to the former affiliated company will be limited to those described in Section 2(b) above relating to nonaffiliated third parties. If you elected under Section 6 to limit disclosures we make to affiliated companies, or use of personal information by affiliated companies, your election will not apply to use by any former affiliated company of your personal information in their possession once it becomes a nonaffiliated third party.
SPECIAL NOTICE TO RESIDENTS OF VERMONT
The following section supplements our Policy with respect to our individual clients who have a Vermont address and supersedes anything to the contrary in the above Policy with respect to those clients only.
The State of Vermont requires financial institutions to obtain your consent prior to sharing personal information that they collect about you with nonaffiliated third parties, or eligibility information with affiliated companies, other than in certain limited circumstances. Except as permitted by law, we will not share personal information we collect about you with nonaffiliated third parties or eligibility information with affiliated companies, unless you provide us with your written consent to share such information.
SPECIAL NOTICE TO RESIDENTS OF CALIFORNIA
The following section supplements our Policy with respect to our individual clients who have a California address and supersedes anything to the contrary in the above Policy with respect to those clients only.
In response to a California law, if your account has a California home address, your personal information will not be disclosed to nonaffiliated third parties except as permitted by applicable California law, and we will limit sharing such personal information with our affiliates to comply with California privacy laws that apply to us.
26
Morgan Stanley Institutional Fund, Inc.
Annual Report — December 31, 2013
Director and Officer Information (unaudited)
Independent Director:
Name, Age and Address of
Independent Director | | Position(s)
Held with
Registrant | | Length of Time
Served* | | Principal Occupation(s) During Past 5 Years | | Number of
Portfolios in
Fund Complex
Overseen by
Independent
Director** | | Other Directorships
Held by Independent
Director*** | |
Frank L. Bowman (69)
c/o Kramer Levin Naftalis &
Frankel LLP
Counsel to the Independent Directors
1177 Avenue of the Americas
New York, NY 10036 | | Director | | Since
August
2006 | | President, Strategic Decisions, LLC (consulting) (since February 2009); Director or Trustee of various Morgan Stanley Funds (since August 2006); Chairperson of the Insurance Sub-Committee of the Compliance and Insurance Committee (since February 2007); served as President and Chief Executive Officer of the Nuclear Energy Institute (policy organization) (February 2005-November 2008); retired as Admiral, U.S. Navy after serving over 38 years on active duty including 8 years as Director of the Naval Nuclear Propulsion Program in the Department of the Navy and the U.S. Department of Energy (1996-2004); served as Chief of Naval Personnel (July 1994-September 1996); and on the Joint Staff as Director of Political Military Affairs (June 1992-July 1994); knighted as Honorary Knight Commander of the Most Excellent Order of the British Empire; awarded the Officier de l'Orde National du Mérite by the French Government; elected to the National Academy of Engineering (2009). | | | 98 | | | Director of BP p.l.c.; Director of Naval and Nuclear Technologies LLP; Director of the Armed Services YMCA of the USA and the U.S. Naval Submarine League; Director of the American Shipbuilding Suppliers Association; Member of the National Security Advisory Council of the Center for U.S. Global Engagement and a member of the CNA Military Advisory Board; Chairman of the charity J Street Cup Golf; Trustee of the Fairhaven United Methodist Church. | |
Michael Bozic (73)
c/o Kramer Levin Naftalis & Frankel LLP
Counsel to the Independent Directors
1177 Avenue of the Americas
New York, NY 10036 | | Director | | Since
April
1994 | | Private investor and a member of the advisory board of American Road Group LLC (retail) (since June 2000); Chairperson of the Compliance and Insurance Committee (since October 2006); Director or Trustee of various Morgan Stanley Funds (since April 1994); formerly, Chairperson of the Insurance Committee (July 2006-September 2006); Vice Chairman of Kmart Corporation (December 1998-October 2000), Chairman and Chief Executive Officer of Levitz Furniture Corporation (November 1995-November 1998) and President and Chief Executive Officer of Hills Department Stores (May 1991-July 1995); variously Chairman, Chief Executive Officer, President and Chief Operating Officer (1987-1991) of the Sears Merchandise Group of Sears, Roebuck & Co. | | | 100 | | | Trustee and member of the Hillsdale College Board of Trustees. | |
Kathleen A. Dennis (60)
c/o Kramer Levin Naftalis & Frankel LLP
Counsel to the Independent Directors
1177 Avenue of the Americas
New York, NY 10036 | | Director | | Since
August
2006 | | President, Cedarwood Associates (mutual fund and investment management consulting) (since July 2006); Chairperson of the Money Market and Alternatives Sub-Committee of the Investment Committee (since October 2006) and Director or Trustee of various Morgan Stanley Funds (since August 2006); formerly, Senior Managing Director of Victory Capital Management (1993-2006). | | | 98 | | | Director of various non-profit organizations. | |
Dr. Manuel H. Johnson (65)
c/o Johnson Smick
International, Inc.
220 I Street, NE
Suite 200
Washington, D.C. 20002 | | Director | | Since
July
1991 | | Senior Partner, Johnson Smick International, Inc. (consulting firm); Chairperson of the Investment Committee (since October 2006) and Director or Trustee of various Morgan Stanley Funds (since July 1991); Co-Chairman and a founder of the Group of Seven Council (G7C) (international economic commission); formerly, Chairperson of the Audit Committee (July 1991-September 2006), Vice Chairman of the Board of Governors of the Federal Reserve System and Assistant Secretary of the U.S. Treasury. | | | 101 | | | Director of NVR, Inc. (home construction). | |
27
Morgan Stanley Institutional Fund, Inc.
Annual Report — December 31, 2013
Director and Officer Information (unaudited) (cont'd)
Independent Director: (cont'd)
Name, Age and Address of
Independent Director | | Position(s)
Held with
Registrant | | Length of Time
Served* | | Principal Occupation(s) During Past 5 Years | | Number of
Portfolios in
Fund Complex
Overseen by
Independent
Director** | | Other Directorships
Held by Independent
Director*** | |
Joseph J. Kearns (71)
c/o Kearns & Associates LLC
PMB754
22631 Pacific Coast Highway
Malibu, CA 90265 | | Director | | Since
August
1994 | | President, Kearns & Associates LLC (investment consulting); Chairperson of the Audit Committee (since October 2006) and Director or Trustee of various Morgan Stanley Funds (since August 1994); formerly, Deputy Chairperson of the Audit Committee (July 2003-September 2006) and Chairperson of the Audit Committee of various Morgan Stanley Funds (since August 1994); CFO of the J. Paul Getty Trust. | | | 101 | | | Director of Electro Rent Corporation (equipment leasing) and The Ford Family Foundation. | |
Michael F. Klein (55)
c/o Kramer Levin Naftalis & Frankel LLP
Counsel to the
Independent Directors
1177 Avenue of the Americas
New York, NY 10036 | | Director | | Since
August
2006 | | Managing Director, Aetos Capital, LLC (since March 2000) and Co-President, Aetos Alternatives Management, LLC (since January 2004) and Co-Chief Executive Officer of Aetos Capital LLC (since August 2013); Chairperson of the Fixed Income Sub-Committee of the Investment Committee (since October 2006) and Director or Trustee of various Morgan Stanley Funds (since August 2006); formerly, Managing Director, Morgan Stanley & Co. Inc. and Morgan Stanley Dean Witter Investment Management, President, various Morgan Stanley Funds (June 1998-March 2000) and Principal, Morgan Stanley & Co. Inc. and Morgan Stanley Dean Witter Investment Management (August 1997-December 1999). | | | 98 | | | Director of certain investment funds managed or sponsored by Aetos Capital, LLC. Director of Sanitized AG and Sanitized Marketing AG (specialty chemicals). | |
Michael E. Nugent (77)
522 Fifth Avenue
New York, NY 10036 | | Chairperson of the Board and Director | | Chairperson of the Boards since July 2006 and Director since July 1991 | | Chairperson of the Boards of various Morgan Stanley Funds (since July 2006); Chairperson of the Closed-End Fund Committee (since June 2012) and Director or Trustee of various Morgan Stanley Funds (since July 1991); formerly, Chairperson of the Insurance Committee (until July 2006); General Partner, Triumph Capital, L.P. (private investment partnership) (1988-2013) | | | 100 | | | None. | |
W. Allen Reed (66)
c/o Kramer Levin Naftalis & Frankel LLP
Counsel to the
Independent Directors
1177 Avenue of the Americas
New York, NY 10036 | | Director | | Since
August
2006 | | Chairperson of the Equity Sub-Committee of the Investment Committee (since October 2006) and Director or Trustee of various Morgan Stanley Funds (since August 2006); formerly, President and CEO of General Motors Asset Management; Chairman and Chief Executive Officer of the GM Trust Bank and Corporate Vice President of General Motors Corporation (August 1994-December 2005). | | | 98 | | | Director of Temple-Inland Industries (packaging and forest products); Director of Legg Mason, Inc. and Director of the Auburn University Foundation. | |
Fergus Reid (81)
c/o Joe Pietryka, Inc.
85 Charles Colman Blvd.
Pawling, NY 12564 | | Director | | Since
June
1992 | | Chairman, Joe Pietryka, Inc.; Chairperson of the Governance Committee and Director or Trustee of various Morgan Stanley Funds (since June 1992). | | | 101 | | | Through December 31, 2012, Trustee and Director of certain Investment companies in the JP Morgan Fund Complex. | |
28
Morgan Stanley Institutional Fund, Inc.
Annual Report — December 31, 2013
Director and Officer Information (unaudited) (cont'd)
Interested Director:
Name, Age and Address of
Interested Director | | Position(s) Held
with Registrant | | Length of
Time Served* | | Principal Occupation(s) During Past 5 Years | | Number of
Portfolios in
Fund Complex
Overseen by
Interested
Director** | | Other Directorships
Held by Interested
Director*** | |
James F. Higgins (66)
One New York Plaza
New York, NY 10004 | | Director | | Since
June
2000 | | Director or Trustee of various Morgan Stanley Funds (since June 2000); Senior Advisor of Morgan Stanley (since August 2000). | | | 99 | | | Formerly, Director of AXA Financial, Inc. and AXA Equitable Life Insurance Company (2002-2011) and Director of AXA MONY Life Insurance Company and AXA MONY Life Insurance Company of America (2004-2011). | |
* Each Director serves an indefinite term, until his or her successor is elected.
** The Fund Complex includes (as of December 31, 2013) all open-end and closed-end funds (including all of their portfolios) advised by Morgan Stanley Investment Management Inc. (the "Adviser") and any funds that have an adviser that is an affiliated person of the Adviser (including, but not limited to, Morgan Stanley AIP GP LP).
*** This includes any directorships at public companies and registered investment companies held by the Director at any time during the past five years.
29
Morgan Stanley Institutional Fund, Inc.
Annual Report — December 31, 2013
Director and Officer Information (unaudited) (cont'd)
Executive Officers:
Name, Age and Address of Executive Officer | | Position(s) Held
with
Registrant | | Length of
Time Served* | | Principal Occupation(s) During Past 5 Years | |
John H. Gernon (50)
522 Fifth Avenue
New York, NY 10036 | | President and Principal Executive Officer—Equity, Fixed Income and AIP Funds | | Since September 2013 | | President and Principal Executive Officer of the Equity and Fixed Income Funds and the Morgan Stanley AIP Funds (since September 2013) in the Fund Complex. Managing Director of the Adviser. | |
Stefanie V. Chang Yu (47)
522 Fifth Avenue
New York, NY 10036 | | Chief Compliance Officer | | Since
January
2014 | | Managing Director of the Adviser and various entities affiliated with the Adviser; Chief Compliance Officer of various Morgan Stanley Funds and the Adviser (since January 2014). Formerly, Vice President of various Morgan Stanley Funds (December 1997-January 2014). | |
Joseph C. Benedetti (48)
522 Fifth Avenue
New York, NY 10036 | | Vice President | | Since
January
2014 | | Managing Director of the Adviser and various entities affiliated with the Adviser; Vice President of various Morgan Stanley Funds (since January 2014). Formerly, Assistant Secretary of various Morgan Stanley Funds (October 2004-January 2014). | |
Francis J. Smith (48)
522 Fifth Avenue
New York, NY 10036 | | Treasurer and Principal Financial Officer | | Treasurer since July 2003 and Principal Financial Officer since September 2002 | | Executive Director of the Adviser and various entities affiliated with the Adviser; Treasurer and Principal Financial Officer of various Morgan Stanley Funds (since July 2003). | |
Mary E. Mullin (46)
522 Fifth Avenue
New York, NY 10036 | | Secretary | | Since
June
1999 | | Executive Director of the Adviser and various entities affiliated with the Adviser; Secretary of various Morgan Stanley Funds (since June 1999). | |
* Each officer serves an indefinite term, until his or her successor is elected.
30
Morgan Stanley Institutional Fund, Inc.
Annual Report — December 31, 2013
Adviser and Administrator
Morgan Stanley Investment Management Inc.
522 Fifth Avenue
New York, New York 10036
Distributor
Morgan Stanley Distribution, Inc.
522 Fifth Avenue
New York, New York 10036
Dividend Disbursing and Transfer Agent
Boston Financial Data Services, Inc.
2000 Crown Colony Drive
Quincy, Massachusetts 02169
Custodian
State Street Bank and Trust Company
One Lincoln Street
Boston, Massachusetts 02111
Legal Counsel
Dechert LLP
1095 Avenue of the Americas
New York, New York 10036
Counsel to the Independent Directors
Kramer Levin Naftalis & Frankel LLP
1177 Avenue of the Americas
New York, New York 10036
Independent Registered Public Accounting Firm
Ernst & Young LLP
200 Clarendon Street
Boston, Massachusetts 02116
Reporting to Shareholders
Each Morgan Stanley fund provides a complete schedule of portfolio holdings in its semi-annual and annual reports within 60 days of the end of the fund's second and fourth fiscal quarters by filing the schedule electronically with the Securities and Exchange Commission (SEC). The semi-annual reports are filed on Form N-CSRS and the annual reports are filed on Form N-CSR. Morgan Stanley also delivers the semi-annual and annual reports to fund shareholders and makes these reports available on its public website, www.morganstanley.com/im. Each Morgan Stanley fund also files a complete schedule of portfolio holdings with the SEC for the fund's first and third fiscal quarters on Form N-Q. Morgan Stanley does not deliver the reports for the first and third fiscal quarters to shareholders, nor are the reports posted to the Morgan Stanley public website. You may, however, obtain the Form N-Q filings (as well as the Form N-CSR and N-CSRS filings) by accessing the SEC's website, www.sec.gov. You may also review and copy them at the SEC's Public Reference Room in Washington, DC. Information on the operation of the SEC's Public Reference Room may be obtained by calling the SEC toll free at 1 (800) SEC-0330. You can also request copies of these materials, upon payment of a duplicating fee, by electronic request at the SEC's email address (publicinfo@sec.gov) or by writing the Public Reference Room of the SEC, Washington, DC 20549-0102.
Proxy Voting Policies and Procedures and Proxy Voting Record
You may obtain a copy of the Fund's Proxy Voting Policy and Procedures and information regarding how the Fund voted proxies relating to portfolio securities during the most recent twelve-month period ended June 30, without charge, upon request, by calling toll free 1 (800) 548-7786 or by visiting our website at www.morganstanley.com/im. This information is also available on the SEC's website at www.sec.gov.
This report is authorized for distribution only when preceded or accompanied by a prospectus of the Morgan Stanley Institutional Fund, Inc. which describes in detail each Investment Portfolio's investment policies, risks, fees and expenses. Please read the prospectus carefully before you invest or send money. For additional information, including information regarding the investments comprising the Portfolio, please visit our website at www.morganstanley.com/im or call toll free 1 (800) 548-7786.
31
(This Page has been left blank intentionally.)
Printed in U.S.A.
This Report has been prepared for shareholders and may be distributed to others only if preceded or accompanied by a current prospectus.
Morgan Stanley Investment Management Inc.
522 Fifth Avenue
New York, New York 10036
© 2014 Morgan Stanley. Morgan Stanley Distribution, Inc.

IFIGAANN
808969 EXP 2.28.15

Morgan Stanley Institutional Fund, Inc.
Global Discovery Portfolio
Annual Report
December 31, 2013

Morgan Stanley Institutional Fund, Inc.
Annual Report — December 31, 2013
Shareholders' Letter | | | 2 | | |
Expense Example | | | 3 | | |
Investment Overview | | | 4 | | |
Portfolio of Investments | | | 6 | | |
Statement of Assets and Liabilities | | | 8 | | |
Statement of Operations | | | 10 | | |
Statements of Changes in Net Assets | | | 11 | | |
Financial Highlights | | | 13 | | |
Notes to Financial Statements | | | 16 | | |
Report of Independent Registered Public Accounting Firm | | | 25 | | |
Federal Tax Notice | | | 26 | | |
U.S. Privacy Policy | | | 27 | | |
Director and Officer Information | | | 30 | | |
This report is authorized for distribution only when preceded or accompanied by prospectuses of the Morgan Stanley Institutional Fund, Inc. To receive a prospectus and/or statement of additional information (SAI), which contains more complete information such as investment objectives, charges, expenses, policies for voting proxies, risk considerations, and describes in detail each of the Portfolio's investment policies to the prospective investor, please call toll free 1 (800) 548-7786. Please read the prospectuses carefully before you invest or send money.
Additionally, you can access portfolio information including performance, characteristics, and investment team commentary through Morgan Stanley Investment Management's website: www.morganstanley.com/im.
Market forecasts provided in this report may not necessarily come to pass. There is no guarantee that any sectors mentioned will continue to perform as discussed herein or that securities in such sectors will be held by the Portfolio in the future. There is no assurance that a Portfolio will achieve its investment objective. Portfolios are subject to market risk, which is the possibility that market values of securities owned by the Portfolio will decline and, therefore, the value of the Portfolio's shares may be less than what you paid for them. Accordingly, you can lose money investing in the Portfolio. Please see the prospectus for more complete information on investment risks.
1
Morgan Stanley Institutional Fund, Inc.
Annual Report — December 31, 2013
Shareholders' Letter (unaudited)
Dear Shareholders,
We are pleased to provide this Annual report, in which you will learn how your investment in Global Discovery Portfolio (the "Portfolio") performed during the latest twelve-month period.
Morgan Stanley Investment Management is a client-centric, investor-led organization. Our global presence, intellectual capital, and breadth of products and services enable us to partner with investors to meet the evolving challenges of today's financial markets. We aim to deliver superior investment service and to empower our clients to make the informed decisions that help them reach their investment goals.
As always, we thank you for selecting Morgan Stanley Investment Management, and look forward to working with you in the months and years ahead.
Sincerely,

John H. Gernon
President and Principal Executive Officer
January 2014
2
Morgan Stanley Institutional Fund, Inc.
Annual Report — December 31, 2013
Expense Example (unaudited)
Global Discovery Portfolio
As a shareholder of the Portfolio, you incur two types of costs: (1) transactional costs; and (2) ongoing costs, including advisory fees, administration fees, distribution and shareholder services fees and other Portfolio expenses. This example is intended to help you understand your ongoing costs (in dollars) of investing in the Portfolio and to compare these costs with the ongoing costs of investing in other mutual funds.
This example is based on an investment of $1,000 invested at the beginning of the six-month period ended December 31, 2013 and held for the entire six-month period.
Actual Expenses
The table below provides information about actual account values and actual expenses. You may use the information in this table, together with the amount you invested, to estimate the expenses that you paid over the period. Simply divide your account value by $1,000 (for example, an $8,600 account value divided by $1,000 = 8.6), then multiply the result by the number in the table under the heading entitled "Actual Expenses Paid During Period" to estimate the expenses you paid on your account during this period.
Hypothetical Example for Comparison Purposes
The table below provides information about hypothetical account values and hypothetical expenses based on the Portfolio's actual expense ratio and an assumed rate of return of 5% per year before expenses, which is not the Portfolio's actual return. The hypothetical account values and expenses may not be used to estimate the actual ending account balance or expenses you paid for the period. You may use this information to compare the ongoing costs of investing in the Portfolio and other funds. To do so, compare this 5% hypothetical example with the 5% hypothetical examples that appear in the shareholder reports of the other funds.
Please note that the expenses shown in the table are meant to highlight your ongoing costs only and do not reflect any transactional costs, such as sales charges (loads). Therefore, the information for each class in the table is useful in comparing ongoing costs only, and will not help you determine the relative total costs of owning different funds. In addition, if these transactional costs were included, your costs would have been higher.
| | | Beginning
Account
Value
7/1/13 | | Actual Ending
Account
Value
12/31/13 | | Hypothetical
Ending Account
Value | | Actual
Expenses
Paid
During
Period* | | Hypothetical
Expenses Paid
During Period* | | Net
Expense
Ratio
During
Period** | |
Global Discovery Portfolio Class I | | $ | 1,000.00 | | | $ | 1,221.40 | | | $ | 1,018.45 | | | $ | 7.50 | | | $ | 6.82 | | | | 1.34 | % | |
Global Discovery Portfolio Class A@ | | | 1,000.00 | | | | 1,220.00 | | | | 1,016.84 | | | | 9.29 | | | | 8.44 | | | | 1.66 | | |
Global Discovery Portfolio Class L | | | 1,000.00 | | | | 1,216.20 | | | | 1,014.37 | | | | 12.01 | | | | 10.92 | | | | 2.15 | | |
* Expenses are calculated using each Portfolio Class' annualized net expense ratio (as disclosed), multiplied by the average account value over the period, and multiplied by 184/365 (to reflect the most recent one-half year period).
** Annualized.
@ Effective September 9, 2013, Class P and Class H shares were renamed Class A shares.
3
Morgan Stanley Institutional Fund, Inc.
Annual Report — December 31, 2013
Investment Overview (unaudited)
Global Discovery Portfolio
The Global Discovery Portfolio seeks long-term capital appreciation by investing primarily in established and emerging franchise companies located throughout the world, with capitalizations within the range of companies included in the Morgan Stanley Capital International (MSCI) All Country World Index.
Performance
For the year ended December 31, 2013, the Portfolio had a total return based on net asset value and reinvestment of distributions per share of 40.72%, net of fees, for Class I shares. The Portfolio's Class I shares outperformed against its benchmark, the MSCI All Country World Index (the "Index"), which returned 22.80%. Please keep in mind that high double-digit returns are highly unusual and cannot be sustained.
Factors Affecting Performance
• Global equity performance in 2013 was driven by strong results in the developed world, which continued to benefit from accommodative monetary policy, along with signs of more sustainable economic progress in the U.S. and stabilization in the eurozone. By comparison, emerging market equities languished. Uncertainties about a slowdown in China's economy, the negative implications of the expected tapering of U.S. quantitative easing, and pockets of regional and country-specific political conflict were among the factors weighing on investor sentiment for the asset class.
• The information technology sector provided nearly all of the Portfolio's relative gains, with especially strong results from our stock selection there. A holding in a U.S. solar panel maker was the primary contributor to performance.
• Stock selection and an overweight in consumer discretionary also bolstered relative performance, led by a holding in a U.S. restaurant chain owner/operator.
• The materials sector outperformed as well, due to stock selection and an overweight there. A position in a Greek cement producer was the most additive.
• Both stock selection and an underweight in the health care sector were unfavorable to relative
returns. Exposure to a U.S. maker of non-invasive, robotic surgical systems was detrimental.
• The industrials sector was the only other relative detractor at the sector level, with a negative results from both stock selection and an underweight there. A position in a port logistics and infrastructure services company in Brazil was the main laggard.
Management Strategies
• We look for high-quality growth companies that we believe have these attributes: sustainable competitive advantages, above-average business visibility, rising return on invested capital, strong free cash flow generation and a favorable risk/reward. We find these companies through intense fundamental research. Our emphasis is on secular growth, and as a result short-term market events are not as meaningful in the stock selection process.
* Minimum Investment for Class I shares
** Commenced Operations on December 28, 2010.
In accordance with SEC regulations, Portfolio's performance shown assumes that all recurring fees (including management fees) were deducted and all dividends and distributions were reinvested. The performance of Class A+ and L shares will vary from Class I shares and will be negatively impacted by additional fees assessed to those classes.
4
Morgan Stanley Institutional Fund, Inc.
Annual Report — December 31, 2013
Investment Overview (unaudited) (cont'd)
Global Discovery Portfolio
Performance Compared to the Morgan Stanley Capital International (MSCI) All Country World Index(1) and the Lipper Global Multi-Cap Growth Funds Index(2)
| | | Period Ended December 31, 2013
Total Returns(3) | |
| | | | | Average Annual | |
| | | One
Year | | Five
Years | | Ten
Years | | Since
Inception(5) | |
Portfolio — Class I Shares
w/o sales charges(4) | | | 40.72 | % | | | — | | | | — | | | | 19.39 | % | |
MSCI All Country World Index | | | 22.80 | | | | — | | | | — | | | | 9.93 | | |
Lipper Global Multi-Cap Growth
Funds Index | | | 25.75 | | | | — | | | | — | | | | 9.08 | | |
Portfolio — Class A+ Shares
w/o sales charges(4) | | | 40.33 | | | | — | | | | — | | | | 19.10 | | |
Portfolio — Class A+ Shares with
maximum 5.25% sales charges(4) | | | 32.92 | | | | — | | | | — | | | | 16.99 | | |
MSCI All Country World Index | | | 22.80 | | | | — | | | | — | | | | 9.93 | | |
Lipper Global Multi-Cap Growth
Funds Index | | | 25.75 | | | | — | | | | — | | | | 9.08 | | |
Portfolio — Class L Shares
w/o sales charges(4) | | | 39.68 | | | | — | | | | — | | | | 18.49 | | |
MSCI All Country World Index | | | 22.80 | | | | — | | | | — | | | | 9.93 | | |
Lipper Global Multi-Cap Growth
Funds Index | | | 25.75 | | | | — | | | | — | | | | 9.08 | | |
Performance data quoted represents past performance, which is no guarantee of future results, and current performance may be lower or higher than the figures shown. Performance assumes that all dividends and distributions, if any, were reinvested. For the most recent month-end performance figures, please visit www.morganstanley.com/im. Investment return and principal value will fluctuate so that Portfolio shares, when redeemed, may be worth more or less than their original cost. Total returns do not reflect the deduction of taxes that a shareholder would pay on Portfolio distributions or the redemption of Portfolio shares. Performance of share classes will vary due to difference in expenses.
+ Effective September 9, 2013, Class P shares were renamed Class A shares.
(1) The Morgan Stanley Capital International (MSCI) All Country World Index (ACWI) is a free float-adjusted market capitalization weighted index designed to measure the equity market performance of developed and emerging markets. The term "free float" represents the portion of shares outstanding that are deemed to be available for purchase in the public equity markets by investors. The Index is unmanaged and its returns do not include any sales charges or fees. Such costs would lower performance. It is not possible to invest directly in an index.
(2) The Lipper Global Multi-Cap Growth Funds Index is an equally weighted performance index of the largest qualifying funds (based on net assets) in the Lipper Global Multi-Cap Growth Funds classification. The Index, which is adjusted for capital gains distributions and income dividends, is unmanaged and should not be considered an investment. There are currently 30 funds represented in this Index. As of the date of this report, the Portfolio is in the Lipper Global Multi-Cap Growth Funds classification.
(3) Total returns for the Portfolio reflect fees waived and expenses reimbursed, if applicable, by the Adviser. Without such waivers and reimbursements, total returns would have been lower. The fee waivers and/or expense reimbursements will continue for at least one year or until such time as the Fund's Board of Directors acts to discontinue all or a portion of such waivers and/or expense reimbursements when it deems that such action is appropriate.
(4) Commenced operations on December 28, 2010.
(5) For comparative purposes, average annual since inception returns listed for the Indexes refer to the inception date or initial offering of the respective share class of the Portfolio, not the inception of the Index.
Portfolio Composition
Classification | | Percentage of
Total Investments | |
Other* | | | 36.0 | % | |
Hotels, Restaurants & Leisure | | | 15.9 | | |
Textiles, Apparel & Luxury Goods | | | 15.7 | | |
Internet Software & Services | | | 10.9 | | |
Diversified Financial Services | | | 6.1 | | |
Commercial Services & Supplies | | | 5.3 | | |
Metals & Mining | | | 5.1 | | |
Investment Company | | | 5.0 | | |
Total Investments | | | 100.0 | % | |
* Industries and/or investment types representing less than 5% of total investments.
5
Morgan Stanley Institutional Fund, Inc.
Annual Report — December 31, 2013
Portfolio of Investments
Global Discovery Portfolio
| | | Shares | | Value
(000) | |
Common Stocks (86.0%) | |
Brazil (6.2%) | |
GAEC Educacao SA (a) | | | 28,034 | | | $ | 252 | | |
JHSF Participacoes SA | | | 171,771 | | | | 310 | | |
Prumo Logistica SA (a) | | | 153,437 | | | | 70 | | |
| | | | 632 | | |
Canada (2.7%) | |
Second Cup Ltd. (The) | | | 59,759 | | | | 279 | | |
France (22.8%) | |
Christian Dior SA | | | 6,281 | | | | 1,187 | | |
Edenred | | | 15,914 | | | | 533 | | |
Eurazeo SA | | | 7,751 | | | | 607 | | |
| | | | 2,327 | | |
Germany (3.5%) | |
ThyssenKrupp AG (a) | | | 14,638 | | | | 356 | | |
Greece (1.2%) | |
Titan Cement Co., SA (Preference) (a) | | | 10,292 | | | | 126 | | |
Hong Kong (4.4%) | |
L'Occitane International SA | | | 184,750 | | | | 393 | | |
Louis XIII Holdings Ltd. | | | 56,740 | | | | 57 | | |
| | | | 450 | | |
Ireland (1.7%) | |
Mincon Group PLC (a) | | | 132,233 | | | | 172 | | |
Italy (4.8%) | |
Moncler SpA (a) | | | 9,671 | | | | 210 | | |
Tamburi Investment Partners SpA | | | 90,507 | | | | 285 | | |
| | | | 495 | | |
Singapore (2.6%) | |
Mandarin Oriental International Ltd. | | | 161,000 | | | | 269 | | |
Switzerland (2.2%) | |
Nestle SA (Registered) | | | 3,030 | | | | 222 | | |
United Kingdom (1.8%) | |
Mulberry Group PLC | | | 11,449 | | | | 181 | | |
United States (32.1%) | |
Akamai Technologies, Inc. (a) | | | 7,085 | | | | 334 | | |
BJ's Restaurants, Inc. (a) | | | 22,786 | | | | 708 | | |
Dropbox, Inc. (a)(b)(c)(d)
(acquisition cost — $25; acquired 5/1/12) | | | 2,743 | | | | 38 | | |
Facebook, Inc., Class A (a) | | | 7,536 | | | | 412 | | |
Fairway Group Holdings Corp. (a) | | | 4,129 | | | | 75 | | |
Fiesta Restaurant Group, Inc. (a) | | | 4,504 | | | | 235 | | |
Fox Factory Holding Corp. (a) | | | 9,102 | | | | 160 | | |
Mosaic Co. (The) | | | 3,989 | | | | 189 | | |
Potbelly Corp. (a) | | | 2,105 | | | | 51 | | |
Progressive Corp. (The) | | | 4,725 | | | | 129 | | |
Roundy's, Inc. | | | 18,964 | | | | 187 | | |
Solera Holdings, Inc. | | | 4,874 | | | | 345 | | |
Textura Corp. (a) | | | 5,148 | | | | 154 | | |
Twitter, Inc. (a) | | | 2,438 | | | | 155 | | |
Workday, Inc., Class A (a) | | | 558 | | | | 46 | | |
zulily, Inc., Class A (a) | | | 1,374 | | | | 57 | | |
| | | | 3,275 | | |
Total Common Stocks (Cost $7,479) | | | 8,784 | | |
| | | Shares | | Value
(000) | |
Preferred Stocks (0.7%) | |
India (0.5%) | |
Flipkart Online Services Pvt Ltd. Series D (a)(b)(c)(d)
(acquisition cost — $44; acquired 10/4/13) | | | 1,910 | | | $ | 45 | | |
United States (0.2%) | |
Palantir Technologies, Inc. Series G (a)(b)(c)(d)
(acquisition cost — $9; acquired 7/19/12) | | | 2,935 | | | | 10 | | |
Palantir Technologies, Inc. Series H (a)(b)(c)(d)
(acquisition cost — $6; acquired 10/25/13) | | | 1,572 | | | | 6 | | |
Palantir Technologies, Inc. Series H1 (a)(b)(c)(d)
(acquisition cost — $6; acquired 10/25/13) | | | 1,572 | | | | 6 | | |
| | | | 22 | | |
Total Preferred Stocks (Cost $65) | | | 67 | | |
Convertible Preferred Stock (0.0%) | |
United States (0.0%) | |
Dropbox, Inc. Series A (a)(b)(c)(d)
(acquisition cost — $3; acquired 5/25/12)
(Cost $3) | | | 277 | | | | 4 | | |
| | Notional
Amount | | | |
Call Options Purchased (5.2%) | |
United States (5.2%) | |
Hillshire Brands Co. January 2014 @ $15 | | | 19 | | | | 13 | | |
Hillshire Brands Co. January 2014 @ $20 | | | 155 | | | | 31 | | |
Intuitive Surgical, Inc. January 2015 @ $300 | | | 3 | | | | 30 | | |
Intuitive Surgical, Inc. January 2016 @ $300 | | | 22 | | | | 254 | | |
Motorola Solutions, Inc. January 2015 @ $45 | | | 91 | | | | 206 | | |
Total Call Options Purchased (Cost $514) | | | 534 | | |
| | | Face
Amount
(000) | | | |
Corporate Bond (1.5%) | |
United States (1.5%) | |
Molycorp, Inc.
5.50%, 2/1/18 (Cost $159) | | $ | 167 | | | | 157 | | |
| | | Shares | | | |
Short-Term Investment (5.0%) | |
Investment Company (5.0%) | |
Morgan Stanley Institutional Liquidity
Funds — Money Market Portfolio —
Institutional Class (See Note G)
(Cost $505) | | | 505,241 | | | | 505 | | |
Total Investments (98.4%) (Cost $8,725) | | | 10,051 | | |
Other Assets in Excess of Liabilities (1.6%) | | | 166 | | |
Net Assets (100.0%) | | $ | 10,217 | | |
(a) Non-income producing security.
The accompanying notes are an integral part of the financial statements.
6
Morgan Stanley Institutional Fund, Inc.
Annual Report — December 31, 2013
Portfolio of Investments (cont'd)
Global Discovery Portfolio
(b) Security cannot be offered for public resale without first being registered under the Securities Act of 1933 and related rules ("restricted security"). Acquisition date represents the day on which an enforceable right to acquire such security is obtained and is presented along with related cost in the security description. The Portfolio has registration rights for certain restricted securities. Any costs related to such registration are borne by the issuer. The aggregate value of restricted securities (excluding 144A holdings) at December 31, 2013 amounts to approximately $109,000 and represents 1.1% of net assets.
(c) At December 31, 2013, the Portfolio held fair valued securities valued at approximately $109,000, representing 1.1% of net assets. These securities have been fair valued as determined in good faith under procedures established by and under the general supervision of the Fund's Directors.
(d) Security has been deemed illiquid at December 31, 2013.
The accompanying notes are an integral part of the financial statements.
7
Morgan Stanley Institutional Fund, Inc.
Annual Report — December 31, 2013
Global Discovery Portfolio
Statement of Assets and Liabilities | | December 31, 2013
(000) | |
Assets: | |
Investments in Securities of Unaffiliated Issuers, at Value (Cost $8,220) | | $ | 9,546 | | |
Investment in Security of Affiliated Issuer, at Value (Cost $505) | | | 505 | | |
Total Investments in Securities, at Value (Cost $8,725) | | | 10,051 | | |
Foreign Currency, at Value (Cost $@) | | | — | @ | |
Receivable for Investments Sold | | | 153 | | |
Due from Adviser | | | 29 | | |
Interest Receivable | | | 4 | | |
Tax Reclaim Receivable | | | 1 | | |
Dividends Receivable | | | — | @ | |
Receivable from Affiliate | | | — | @ | |
Other Assets | | | 3 | | |
Total Assets | | | 10,241 | | |
Liabilities: | |
Payable for Investments Purchased | | | 11 | | |
Payable for Custodian Fees | | | 5 | | |
Payable for Professional Fees | | | 3 | | |
Payable for Transfer Agent Fees — Class I | | | — | @ | |
Payable for Transfer Agent Fees — Class A* | | | — | @ | |
Payable for Transfer Agent Fees — Class L | | | — | @ | |
Payable for Administration Fees | | | 1 | | |
Dividends Declared | | | — | @ | |
Payable for Shareholder Services Fees — Class A* | | | — | @ | |
Payable for Distribution and Shareholder Services Fees — Class L | | | — | @ | |
Other Liabilities | | | 4 | | |
Total Liabilities | | | 24 | | |
Net Assets | | $ | 10,217 | | |
Net Assets Consist Of: | |
Paid-in-Capital | | $ | 8,161 | | |
Distributions in Excess of Net Investment Income | | | (66 | ) | |
Accumulated Net Realized Gain | | | 796 | | |
Unrealized Appreciation (Depreciation) on: | |
Investments | | | 1,326 | | |
Foreign Currency Translations | | | — | @ | |
Net Assets | | $ | 10,217 | | |
The accompanying notes are an integral part of the financial statements.
8
Morgan Stanley Institutional Fund, Inc.
Annual Report — December 31, 2013
Global Discovery Portfolio
Statement of Assets and Liabilities (cont'd) | | December 31, 2013
(000) | |
CLASS I: | |
Net Assets | | $ | 8,493 | | |
| Shares Outstanding $0.001 par value shares of beneficial interest (500,000,000 shares authorized) (not in 000's) | | | 620,042 | | |
Net Asset Value, Offering and Redemption Price Per Share | | $ | 13.70 | | |
CLASS A*: | |
Net Assets | | $ | 1,455 | | |
| Shares Outstanding $0.001 par value shares of beneficial interest (500,000,000 shares authorized) (not in 000's) | | | 106,248 | | |
Net Asset Value, Redemption Price Per Share | | $ | 13.69 | | |
Maximum Sales Load§§ | | | 5.25 | % | |
Maximum Sales Charge | | $ | 0.76 | | |
Maximum Offering Price Per Share | | $ | 14.45 | | |
CLASS L: | |
Net Assets | | $ | 269 | | |
| Shares Outstanding $0.001 par value shares of beneficial interest (500,000,000 shares authorized) (not in 000's) | | | 19,688 | | |
Net Asset Value, Offering and Redemption Price Per Share | | $ | 13.64 | | |
@ Amount is less than $500.
* Effective September 9, 2013, Class P and Class H shares were renamed Class A shares.
§§ Effective February 25, 2013, the Directors approved the imposition of a maximum initial sales charge of 5.25% on purchases of Class A shares of the Portfolio.
The accompanying notes are an integral part of the financial statements.
9
Morgan Stanley Institutional Fund, Inc.
Annual Report — December 31, 2013
Global Discovery Portfolio
Statement of Operations | | Year Ended
December 31, 2013
(000) | |
Investment Income: | |
Dividends from Securities of Unaffiliated Issuers (Net of $13 of Foreign Taxes Withheld) | | $ | 98 | | |
Interest from Securities of Unaffiliated Issuers | | | 5 | | |
Dividends from Security of Affiliated Issuer (Note G) | | | — | @ | |
Total Investment Income | | | 103 | | |
Expenses: | |
Professional Fees | | | 92 | | |
Advisory Fees (Note B) | | | 75 | | |
Registration Fees | | | 61 | | |
Custodian Fees (Note F) | | | 24 | | |
Shareholder Reporting Fees | | | 14 | | |
Transfer Agency Fees (Note E) | | | 9 | | |
Transfer Agency Fees — Class I (Note E) | | | — | @ | |
Transfer Agency Fees — Class A* (Note E) | | | — | @ | |
Transfer Agency Fees — Class L (Note E) | | | — | @ | |
Administration Fees (Note C) | | | 7 | | |
Pricing Fees | | | 6 | | |
Shareholder Services Fees — Class A* (Note D) | | | 3 | | |
Distribution and Shareholder Services Fees — Class L (Note D) | | | 1 | | |
Directors' Fees and Expenses | | | 1 | | |
Sub Transfer Agency Fees — Class A* | | | — | @ | |
Other Expenses | | | 16 | | |
Total Expenses | | | 309 | | |
Expenses Reimbursed by Adviser (Note B) | | | (117 | ) | |
Waiver of Advisory Fees (Note B) | | | (75 | ) | |
Rebate from Morgan Stanley Affiliate (Note G) | | | (1 | ) | |
Reimbursement of Class Specific Expenses — Class I (Note B) | | | (— | @) | |
Reimbursement of Class Specific Expenses — Class A* (Note B) | | | (— | @) | |
Reimbursement of Class Specific Expenses — Class L (Note B) | | | (— | @) | |
Net Expenses | | | 116 | | |
Net Investment Loss | | | (13 | ) | |
Realized Gain (Loss): | |
Investments Sold | | | 1,934 | | |
Foreign Currency Transactions | | | (1 | ) | |
Net Realized Gain | | | 1,933 | | |
Change in Unrealized Appreciation (Depreciation): | |
Investments | | | 806 | | |
Foreign Currency Translations | | | — | @ | |
Net Change in Unrealized Appreciation (Depreciation) | | | 806 | | |
Net Realized Gain and Change in Unrealized Appreciation (Depreciation) | | | 2,739 | | |
Net Increase in Net Assets Resulting from Operations | | $ | 2,726 | | |
@ Amount is less than $500.
* Effective September 9, 2013, Class P and Class H shares were renamed Class A shares.
The accompanying notes are an integral part of the financial statements.
10
Morgan Stanley Institutional Fund, Inc.
Annual Report — December 31, 2013
Global Discovery Portfolio
Statements of Changes in Net Assets | | Year Ended
December 31,
2013
(000) | | Year Ended
December 31,
2012
(000) | |
Increase (Decrease) in Net Assets: | |
Operations: | |
Net Investment Income (Loss) | | $ | (13 | ) | | $ | 117 | | |
Net Realized Gain | | | 1,933 | | | | 281 | | |
Net Change in Unrealized Appreciation (Depreciation) | | | 806 | | | | 778 | | |
Net Increase in Net Assets Resulting from Operations | | | 2,726 | | | | 1,176 | | |
Distributions from and/or in Excess of: | |
Class I: | |
Net Investment Income | | | (39 | ) | | | (88 | ) | |
Net Realized Gain | | | (983 | ) | | | (154 | ) | |
Class A*: | |
Net Investment Income | | | (3 | ) | | | (3 | ) | |
Net Realized Gain | | | (168 | ) | | | (6 | ) | |
Class H@@@: | |
Net Investment Income | | | (1 | )** | | | (37 | ) | |
Net Realized Gain | | | (11 | )** | | | (70 | ) | |
Class L: | |
Net Investment Income | | | (— | @) | | | (2 | ) | |
Net Realized Gain | | | (31 | ) | | | (5 | ) | |
Total Distributions | | | (1,236 | ) | | | (365 | ) | |
Capital Share Transactions:(1) | |
Class I: | |
Subscribed | | | 5,809 | | | | 2,208 | | |
Distributions Reinvested | | | 894 | | | | 185 | | |
Redeemed | | | (2,877 | ) | | | (1,918 | ) | |
Class A*: | |
Subscribed | | | 712 | | | | 28 | | |
Distributions Reinvested | | | 131 | | | | 2 | | |
Conversion from Class H | | | 799 | | | | — | | |
Redeemed | | | (357 | ) | | | (2 | ) | |
Class H@@@: | |
Subscribed | | | 197 | ** | | | 83 | | |
Distributions Reinvested | | | 10 | ** | | | 95 | | |
Conversion to Class A | | | (799 | )** | | | — | | |
Redeemed | | | (1,194 | )** | | | — | | |
Class L: | |
Subscribed | | | 111 | | | | — | | |
Distributions Reinvested | | | 14 | | | | — | | |
Net Increase in Net Assets Resulting from Capital Share Transactions | | | 3,450 | | | | 681 | | |
Total Increase in Net Assets | | | 4,940 | | | | 1,492 | | |
Net Assets: | |
Beginning of Period | | | 5,277 | | | | 3,785 | | |
End of Period (Including Distributions in Excess of Net Investment Income of $(66) and $(12)) | | $ | 10,217 | | | $ | 5,277 | | |
The accompanying notes are an integral part of the financial statements.
11
Morgan Stanley Institutional Fund, Inc.
Annual Report — December 31, 2013
Global Discovery Portfolio
Statements of Changes in Net Assets (cont'd) | | Year Ended
December 31,
2013
(000) | | Year Ended
December 31,
2012
(000) | |
(1) Capital Share Transactions: | |
Class I: | |
Shares Subscribed | | | 450 | | | | 211 | | |
Shares Issued on Distributions Reinvested | | | 68 | | | | 17 | | |
Shares Redeemed | | | (207 | ) | | | (189 | ) | |
Net Increase in Class I Shares Outstanding | | | 311 | | | | 39 | | |
Class A*: | |
Shares Subscribed | | | 51 | | | | 2 | | |
Shares Issued on Distributions Reinvested | | | 10 | | | | — | @@ | |
Conversion from Class H | | | 60 | | | | — | | |
Shares Redeemed | | | (27 | ) | | | (— | @@) | |
Net Increase in Class A Shares Outstanding | | | 94 | | | | 2 | | |
Class H@@@: | |
Shares Subscribed | | | 15 | ** | | | 7 | | |
Shares Issued on Distributions Reinvested | | | 1 | ** | | | 9 | | |
Conversion to Class A | | | (60 | )** | | | — | | |
Shares Redeemed | | | (100 | )** | | | — | | |
Net Increase (Decrease) in Class H@@@ Shares Outstanding | | | (144 | )** | | | 16 | | |
Class L: | |
Shares Subscribed | | | 9 | | | | — | | |
Shares Issued on Distributions Reinvested | | | 1 | | | | — | | |
Net Increase in Class L Shares Outstanding | | | 10 | | | | — | | |
@ Amount is less than $500.
@@ Amount is less than 500 shares.
@@@ Effective September 9, 2013, Class H shares converted into Class A shares.
* Effective September 9, 2013, Class P shares were renamed Class A shares.
** For the period January 1, 2013 through September 6, 2013.
The accompanying notes are an integral part of the financial statements.
12
Morgan Stanley Institutional Fund, Inc.
Annual Report — December 31, 2013
Financial Highlights
Global Discovery Portfolio
| | | Class I | |
| | | Year Ended December 31, | | Period from
December 28, 2010^ to | |
Selected Per Share Data and Ratios | | 2013 | | 2012 | | 2011 | | December 31, 2010 | |
Net Asset Value, Beginning of Period | | $ | 11.11 | | | $ | 9.06 | | | $ | 9.97 | | | $ | 10.00 | | |
Income (Loss) from Investment Operations: | |
Net Investment Income (Loss)† | | | (0.01 | ) | | | 0.25 | | | | 0.13 | | | | (0.00 | )‡ | |
Net Realized and Unrealized Gain (Loss) | | | 4.43 | | | | 2.62 | | | | (0.92 | ) | | | (0.03 | ) | |
Total from Investment Operations | | | 4.42 | | | | 2.87 | | | | (0.79 | ) | | | (0.03 | ) | |
Distributions from and/or in Excess of: | |
Net Investment Income | | | (0.07 | ) | | | (0.30 | ) | | | (0.12 | ) | | | — | | |
Net Realized Gain | | | (1.76 | ) | | | (0.52 | ) | | | (0.00 | )‡ | | | — | | |
Total Distributions | | | (1.83 | ) | | | (0.82 | ) | | | (0.12 | ) | | | — | | |
Net Asset Value, End of Period | | $ | 13.70 | | | $ | 11.11 | | | $ | 9.06 | | | $ | 9.97 | | |
Total Return++ | | | 40.72 | % | | | 31.64 | % | | | (7.72 | )% | | | (0.30 | )%# | |
Ratios and Supplemental Data: | |
Net Assets, End of Period (Thousands) | | $ | 8,493 | | | $ | 3,432 | | | $ | 2,446 | | | $ | 697 | | |
Ratio of Expenses to Average Net Assets (1) | | | 1.34 | %+ | | | 1.35 | %+†† | | | 1.35 | %+†† | | | 1.35 | %††* | |
Ratio of Net Investment Income (Loss) to Average Net Assets (1) | | | (0.07 | )%+ | | | 2.41 | %+†† | | | 1.39 | %+†† | | | (1.14 | )%††* | |
Ratio of Rebate from Morgan Stanley Affiliates to Average Net Assets | | | 0.01 | % | | | 0.00 | %††§ | | | 0.00 | %††§ | | | N/A | | |
Portfolio Turnover Rate | | | 100 | % | | | 96 | % | | | 83 | % | | | 0.00 | %# | |
(1) Supplemental Information on the Ratios to Average Net Assets: | |
Ratios Before Expense Limitation: | |
Expenses to Average Net Assets | | | 3.65 | % | | | 4.33 | %†† | | | 5.52 | %†† | | | 238.14 | %††* | |
Net Investment Loss to Average Net Assets | | | (2.38 | )% | | | (0.57 | )%†† | | | (2.78 | )%†† | | | (237.93 | )%††* | |
^ Commencement of Operations.
† Per share amount is based on average shares outstanding.
‡ Amount is less than $0.005 per share.
++ Calculated based on the net asset value as of the last business day of the period.
+ The Ratios of Expenses and Net Investment Income (Loss) reflect the rebate of certain Portfolio expenses in connection with the investments in Morgan Stanley affiliates during the period. The effect of the rebate on the ratios is disclosed in the above table as "Ratio of Rebate from Morgan Stanley Affiliates to Average Net Assets."
†† Reflects overall Portfolio ratios for investment income and non-class specific expenses.
§ Amount is less than 0.005%.
# Not Annualized.
* Annualized.
The accompanying notes are an integral part of the financial statements.
13
Morgan Stanley Institutional Fund, Inc.
Annual Report — December 31, 2013
Financial Highlights
Global Discovery Portfolio
| | | Class A@ | |
| | | Year Ended December 31, | | Period from
December 28, 2010^ to | |
Selected Per Share Data and Ratios | | 2013 | | 2012 | | 2011 | | December 31, 2010 | |
Net Asset Value, Beginning of Period | | $ | 11.11 | | | $ | 9.07 | | | $ | 9.97 | | | $ | 10.00 | | |
Income (Loss) from Investment Operations: | |
Net Investment Income (Loss)† | | | (0.09 | ) | | | 0.22 | | | | 0.12 | | | | (0.00 | )‡ | |
Net Realized and Unrealized Gain (Loss) | | | 4.47 | | | | 2.62 | | | | (0.92 | ) | | | (0.03 | ) | |
Total from Investment Operations | | | 4.38 | | | | 2.84 | | | | (0.80 | ) | | | (0.03 | ) | |
Distributions from and/or in Excess of: | |
Net Investment Income | | | (0.04 | ) | | | (0.28 | ) | | | (0.10 | ) | | | — | | |
Net Realized Gain | | | (1.76 | ) | | | (0.52 | ) | | | (0.00 | )‡ | | | — | | |
Total Distributions | | | (1.80 | ) | | | (0.80 | ) | | | (0.10 | ) | | | — | | |
Net Asset Value, End of Period | | $ | 13.69 | | | $ | 11.11 | | | $ | 9.07 | | | $ | 9.97 | | |
Total Return++ | | | 40.33 | % | | | 31.40 | % | | | (7.98 | )% | | | (0.30 | )%# | |
Ratios and Supplemental Data: | |
Net Assets, End of Period (Thousands) | | $ | 1,455 | | | $ | 137 | | | $ | 91 | | | $ | 100 | | |
Ratio of Expenses to Average Net Assets (1) | | | 1.65 | %+^^ | | | 1.60 | %+†† | | | 1.60 | %+†† | | | 1.60 | %††* | |
Ratio of Net Investment Income (Loss) to Average Net Assets (1) | | | (0.66 | )%+ | | | 2.16 | %+†† | | | 1.14 | %+†† | | | (1.39 | )%††* | |
Ratio of Rebate from Morgan Stanley Affiliates to Average Net Assets | | | 0.01 | % | | | 0.00 | %††§ | | | 0.00 | %††§ | | | N/A | | |
Portfolio Turnover Rate | | | 100 | % | | | 96 | % | | | 83 | % | | | 0.00 | %# | |
(1) Supplemental Information on the Ratios to Average Net Assets: | |
Ratios Before Expense Limitation: | |
Expenses to Average Net Assets | | | 3.87 | % | | | 4.58 | %†† | | | 5.77 | %†† | | | 238.39 | %††* | |
Net Investment Loss to Average Net Assets | | | (2.88 | )% | | | (0.82 | )%†† | | | (3.03 | )%†† | | | (238.18 | )%††* | |
@ Effective September 9, 2013, Class P and Class H shares were renamed Class A shares.
^ Commencement of Operations.
† Per share amount is based on average shares outstanding.
‡ Amount is less than $0.005 per share.
++ Calculated based on the net asset value which does not reflect sales charges, if applicable, as of the last business day of the period.
+ The Ratios of Expenses and Net Investment Income (Loss) reflect the rebate of certain Portfolio expenses in connection with the investments in Morgan Stanley affiliates during the period. The effect of the rebate on the ratios is disclosed in the above table as "Ratio of Rebate from Morgan Stanley Affiliates to Average Net Assets."
^^ Effective September 16, 2013, the Adviser has agreed to limit the ratio of expenses to average net assets to the maximum ratio of 1.70% for Class A Shares. Prior to September 16, 2013, the maximum ratio was 1.60% for Class A Shares.
†† Reflects overall Portfolio ratios for investment income and non-class specific expenses.
§ Amount is less than 0.005%.
# Not Annualized.
* Annualized.
The accompanying notes are an integral part of the financial statements.
14
Morgan Stanley Institutional Fund, Inc.
Annual Report — December 31, 2013
Financial Highlights
Global Discovery Portfolio
| | | Class L | |
| | | Year Ended December 31, | | Period from
December 28, 2010^ to | |
Selected Per Share Data and Ratios | | 2013 | | 2012 | | 2011 | | December 31, 2010 | |
Net Asset Value, Beginning of Period | | $ | 11.11 | | | $ | 9.07 | | | $ | 9.97 | | | $ | 10.00 | | |
Income (Loss) from Investment Operations: | |
Net Investment Income (Loss)† | | | (0.14 | ) | | | 0.17 | | | | 0.06 | | | | (0.00 | )‡ | |
Net Realized and Unrealized Gain (Loss) | | | 4.45 | | | | 2.61 | | | | (0.91 | ) | | | (0.03 | ) | |
Total from Investment Operations | | | 4.31 | | | | 2.78 | | | | (0.85 | ) | | | (0.03 | ) | |
Distributions from and/or in Excess of: | |
Net Investment Income | | | (0.02 | ) | | | (0.22 | ) | | | (0.05 | ) | | | — | | |
Net Realized Gain | | | (1.76 | ) | | | (0.52 | ) | | | (0.00 | )‡ | | | — | | |
Total Distributions | | | (1.78 | ) | | | (0.74 | ) | | | (0.05 | ) | | | — | | |
Net Asset Value, End of Period | | $ | 13.64 | | | $ | 11.11 | | | $ | 9.07 | | | $ | 9.97 | | |
Total Return++ | | | 39.68 | % | | | 30.62 | % | | | (8.41 | )% | | | (0.30 | )%# | |
Ratios and Supplemental Data: | |
Net Assets, End of Period (Thousands) | | $ | 269 | | | $ | 111 | | | $ | 91 | | | $ | 100 | | |
Ratio of Expenses to Average Net Assets (1) | | | 2.13 | %+^^ | | | 2.10 | %+†† | | | 2.10 | %+†† | | | 2.10 | %††* | |
Ratio of Net Investment Income (Loss) to Average Net Assets (1) | | | (1.05 | )%+ | | | 1.66 | %+†† | | | 0.64 | %+†† | | | (1.89 | )%††* | |
Ratio of Rebate from Morgan Stanley Affiliates to Average Net Assets | | | 0.01 | % | | | 0.00 | %††§ | | | 0.00 | %††§ | | | N/A | | |
Portfolio Turnover Rate | | | 100 | % | | | 96 | % | | | 83 | % | | | 0.00 | %# | |
(1) Supplemental Information on the Ratios to Average Net Assets: | |
Ratios Before Expense Limitation: | |
Expenses to Average Net Assets | | | 4.62 | % | | | 5.08 | %†† | | | 6.27 | %†† | | | 238.89 | %††* | |
Net Investment Loss to Average Net Assets | | | (3.54 | )% | | | (1.32 | )%†† | | | (3.53 | )%†† | | | (238.68 | )%††* | |
^ Commencement of Operations.
† Per share amount is based on average shares outstanding.
‡ Amount is less than $0.005 per share.
++ Calculated based on the net asset value as of the last business day of the period.
+ The Ratios of Expenses and Net Investment Income (Loss) reflect the rebate of certain Portfolio expenses in connection with the investments in Morgan Stanley affiliates during the period. The effect of the rebate on the ratios is disclosed in the above table as "Ratio of Rebate from Morgan Stanley Affiliates to Average Net Assets."
^^ Effective September 16, 2013, the Adviser has agreed to limit the ratio of expenses to average net assets to the maximum ratio of 2.20% for Class L Shares. Prior to September 16, 2013, the maximum ratio was 2.10% for Class L Shares.
†† Reflects overall Portfolio ratios for investment income and non-class specific expenses.
§ Amount is less than 0.005%.
# Not Annualized.
* Annualized.
The accompanying notes are an integral part of the financial statements.
15
Morgan Stanley Institutional Fund, Inc.
Annual Report — December 31, 2013
Notes to Financial Statements
Morgan Stanley Institutional Fund, Inc. (the "Fund") is registered under the Investment Company Act of 1940, as amended (the "Act"), as an open-end management investment company. The Fund is comprised of twenty-seven separate, active, diversified and non-diversified portfolios (individually referred to as a "Portfolio", collectively as the "Portfolios").
The accompanying financial statements relate to the Global Discovery Portfolio. The Portfolio seeks long-term capital appreciation by investing primarily in established and emerging franchise companies located throughout the world, with capitalizations within the range of companies included in the MSCI All Country World Index. The Portfolio offers three classes of shares — Class I, Class A and Class L.
Effective September 9, 2013, Class P and Class H shares were renamed Class A shares.
A. Significant Accounting Policies: The following significant accounting policies are in conformity with U.S. generally accepted accounting principles ("GAAP"). Such policies are consistently followed by the Fund in the preparation of its financial statements. GAAP may require management to make estimates and assumptions that affect the reported amounts and disclosures in the financial statements. Actual results may differ from those estimates.
1. Security Valuation: (1) Certain portfolio securities may be valued by an outside pricing service approved by the Fund's Board of Directors (the "Directors"). The pricing service may utilize a matrix system or other model incorporating attributes such as security quality, maturity and coupon as the evaluation model parameters, and/or research evaluations by its staff, including review of broker-dealer market price quotations in determining what it believes is the fair valuation of the portfolios securities valued by such pricing service; (2) an equity portfolio security listed or traded on an exchange is valued at its latest reported sales price (or at the exchange official closing price if such exchange reports an official closing price), if there were no sales on a given day, the security is valued at the mean between the last reported bid and asked prices; (3) all other equity portfolio securities for which over-the-counter market quotations are readily available are valued at its latest reported sales price. In cases where a security is traded on more than one exchange, the security is valued on the exchange designated as the primary market; (4) listed options are valued at the last reported sales price on the exchange on which they are listed (or at the exchange official
closing price if such exchange reports an official closing price). If an official closing price or last reported sale price is unavailable, the listed option should be fair valued at the mean between its latest bid and ask prices. Unlisted options are valued by an outside pricing service approved by the Directors or quotes from a broker or dealer; (5) when market quotations are not readily available, including circumstances under which Morgan Stanley Investment Management Inc. (the "Adviser") determines that the closing price, last sale price or the mean between the last reported bid and asked prices are not reflective of a security's market value, portfolio securities are valued at their fair value as determined in good faith under procedures established by and under the general supervision of the Directors. Occasionally, developments affecting the closing prices of securities and other assets may occur between the times at which valuations of such securities are determined (that is, close of the foreign market on which the securities trade) and the close of business of the New York Stock Exchange ("NYSE"). If developments occur during such periods that are expected to materially affect the value of such securities, such valuations may be adjusted to reflect the estimated fair value of such securities as of the close of the NYSE, as determined in good faith by the Directors or by the Adviser using a pricing service and/or procedures approved by the Directors; (6) quotations of foreign portfolio securities, other assets and liabilities and forward contracts stated in foreign currency are translated into U.S. dollar equivalents at the prevailing market rates prior to the close of the NYSE; (7) investments in mutual funds, including the Morgan Stanley Institutional Liquidity Funds, are valued at the net asset value as of the close of each business day; and (8) short-term debt securities with remaining maturities of 60 days or less at the time of purchase may be valued at amortized cost, unless the Adviser determines such valuation does not reflect the securities' market value, in which case these securities will be valued at their fair market value determined by the Adviser.
Under procedures approved by the Directors, the Fund's Adviser has formed a Valuation Committee. The Valuation Committee provides administration and oversight of the Fund's valuation policies and procedures, which are reviewed at least annually by the Directors. These procedures allow the Fund to utilize independent pricing services, quotations from securities and financial instrument dealers, and other market sources to determine fair value.
16
Morgan Stanley Institutional Fund, Inc.
Annual Report — December 31, 2013
Notes to Financial Statements (cont'd)
The Fund has procedures to determine the fair value of securities and other financial instruments for which market prices are not readily available. Under these procedures, the Valuation Committee convenes on a regular and ad hoc basis to review such securities and considers a number of factors, including valuation methodologies and significant unobservable valuation inputs, when arriving at fair value. The Valuation Committee may employ a market-based approach which may use related or comparable assets or liabilities, recent transactions, market multiples, book values, and other relevant information for the investment to determine the fair value of the investment. An income-based valuation approach may also be used in which the anticipated future cash flows of the investment are discounted to calculate fair value. Discounts may also be applied due to the nature or duration of any restrictions on the disposition of the investments. Due to the inherent uncertainty of valuations of such investments, the fair values may differ significantly from the values that would have been used had an active market existed. The Valuation Committee employs various methods for calibrating these valuation approaches including a regular review of valuation methodologies, key inputs and assumptions, transactional back-testing or disposition analysis, and reviews of any related market activity.
2. Fair Value Measurement: Financial Accounting Standards Board ("FASB") Accounting Standards CodificationTM ("ASC") 820, "Fair Value Measurements and Disclosures" ("ASC 820"), defines fair value as the value that the Fund would receive to sell an investment or pay to transfer a liability in a timely transaction with an independent buyer in the principal market, or in the absence of a principal market the most advantageous market for the investment or liability. ASC 820 establishes a three-tier hierarchy to distinguish between (1) inputs that reflect the assumptions market participants would use in valuing an asset or liability developed based on market data obtained from sources independent of the reporting entity (observable inputs) and (2) inputs that reflect the reporting entity's own assumptions about the assumptions market participants would use in valuing an asset or liability developed based on the best information available in the circumstances (unobservable inputs) and to establish classification of fair value measurements for disclosure purposes. Various inputs are used in determining the value of the Fund's
investments. The inputs are summarized in the three broad levels listed below.
• Level 1 – unadjusted quoted prices in active markets for identical investments
• Level 2 – other significant observable inputs (including quoted prices for similar investments, interest rates, prepayment speeds, credit risk, etc.)
• Level 3 – significant unobservable inputs including the Fund's own assumptions in determining the fair value of investments. Factors considered in making this determination may include, but are not limited to, information obtained by contacting the issuer, analysts, or the appropriate stock exchange (for exchange-traded securities), analysis of the issuer's financial statements or other available documents and, if necessary, available information concerning other securities in similar circumstances
The inputs or methodology used for valuing securities are not necessarily an indication of the risk associated with investing in those securities and the determination of the significance of a particular input to the fair value measurement in its entirety requires judgment and considers factors specific to each security.
The following is a summary of the inputs used to value the Portfolio's investments as of December 31, 2013.
Investment Type | | Level 1
Unadjusted
quoted
prices
(000) | | Level 2
Other
significant
observable
inputs
(000) | | Level 3
Significant
unobservable
inputs
(000) | | Total
(000) | |
Assets: | |
Common Stocks | |
Auto Components | | $ | 160 | | | $ | — | | | $ | — | | | $ | 160 | | |
Capital Markets | | | 285 | | | | — | | | | — | | | | 285 | | |
Chemicals | | | 189 | | | | — | | | | — | | | | 189 | | |
Commercial Services &
Supplies | | | 533 | | | | — | | | | — | | | | 533 | | |
Construction Materials | | | 126 | | | | — | | | | — | | | | 126 | | |
Diversified Consumer
Services | | | 252 | | | | — | | | | — | | | | 252 | | |
Diversified Financial
Services | | | 607 | | | | — | | | | — | | | | 607 | | |
Food & Staples Retailing | | | 262 | | | | — | | | | — | | | | 262 | | |
Food Products | | | 222 | | | | — | | | | — | | | | 222 | | |
Hotels, Restaurants &
Leisure | | | 1,599 | | | | — | | | | — | | | | 1,599 | | |
Insurance | | | 129 | | | | — | | | | — | | | | 129 | | |
Internet & Catalog Retail | | | 57 | | | | — | | | | — | | | | 57 | | |
Internet Software &
Services | | | 1,055 | | | | — | | | | 38 | | | | 1,093 | | |
17
Morgan Stanley Institutional Fund, Inc.
Annual Report — December 31, 2013
Notes to Financial Statements (cont'd)
Investment Type | | Level 1
Unadjusted
quoted
prices
(000) | | Level 2
Other
significant
observable
inputs
(000) | | Level 3
Significant
unobservable
inputs
(000) | | Total
(000) | |
Common Stocks (cont'd) | |
Machinery | | $ | 172 | | | $ | — | | | $ | — | | | $ | 172 | | |
Metals & Mining | | | 356 | | | | — | | | | — | | | | 356 | | |
Real Estate
Management &
Development | | | 310 | | | | — | | | | — | | | | 310 | | |
Software | | | 391 | | | | — | | | | — | | | | 391 | | |
Specialty Retail | | | 393 | | | | — | | | | — | | | | 393 | | |
Textiles, Apparel & Luxury
Goods | | | 1,578 | | | | — | | | | — | | | | 1,578 | | |
Transportation
Infrastructure | | | 70 | | | | — | | | | — | | | | 70 | | |
Total Common Stocks | | | 8,746 | | | | — | | | | 38 | | | | 8,784 | | |
Preferred Stocks | | | — | | | | — | | | | 67 | | | | 67 | | |
Convertible Preferred
Stock | | | — | | | | — | | | | 4 | | | | 4 | | |
Call Options Purchased | | | 534 | | | | — | | | | — | | | | 534 | | |
Fixed Income
Securities —
Corporate Bond | | | — | | | | 157 | | | | — | | | | 157 | | |
Short-Term Investment
Investment Company | | | 505 | | | | — | | | | — | | | | 505 | | |
Total Assets | | $ | 9,785 | | | $ | 157 | | | $ | 109 | | | $ | 10,051 | | |
Transfers between investment levels may occur as the markets fluctuate and/or the availability of data used in an investment's valuation changes. The Portfolio recognizes transfers between the levels as of the end of the period.
As of December 31, 2013, securities with a total value of approximately $3,281,000 transferred from Level 2 to Level 1. At December 31, 2012, the fair value of certain securities were adjusted due to developments which occurred between the time of the close of the foreign markets on which they trade and the close of business on the NYSE which resulted in their Level 2 classification.
Following is a reconciliation of investments in which significant unobservable inputs (Level 3) were used in determining fair value.
| | | Common
Stock
(000) | | Preferred
Stock
(000) | | Convertible
Preferred
Stock
(000) | |
Beginning Balance | | $ | 25 | | | $ | 9 | | | $ | 5 | | |
Purchases | | | — | | | | 55 | | | | — | | |
Sales | | | — | | | | — | | | | — | | |
Beginning Balance | | | — | | | | — | | | | — | | |
Transfers in | | | — | | | | — | | | | — | | |
Transfers out | | | — | | | | — | | | | — | | |
Corporate action | | | — | | | | — | | | | — | | |
Change in unrealized appreciation/
depreciation | | | 13 | | | | 3 | | | | 28 | | |
Realized gains (losses) | | | — | | | | — | | | | (29 | ) | |
Ending Balance | | $ | 38 | | | $ | 67 | | | $ | 4 | | |
Net change in unrealized appreciation/
depreciation from investments still
held as of December 31, 2013 | | $ | 13 | | | $ | 1 | | | $ | 1 | | |
The following table presents additional information about valuation techniques and inputs used for investments that are measured at fair value and categorized within Level 3 as of December 31, 2013.
| | | Fair Value at
December 31, 2013
(000) | | Valuation
Technique | | Unobservable
Input | | Range | | Weighted
Average | | Impact to
Valuation from an
Increase in Input | |
Computer Services, Software & Systems | |
Preferred Stocks | | $ | 22 | | | Market Transaction
Method | | Precedent Transaction
of Preferred Stock | | $ | 3.51 | | | $ | 3.51 | | | $ | 3.51 | | | Increase | |
Internet & Catalog Retail | |
Preferred Stock | | $ | 45 | | | Market Transaction
Method | | Precedent Transaction
of Preferred Stock | | $ | 22.947 | | | $ | 22.947 | | | $ | 22.947 | | | Increase | |
| | | | | Discounted Cash Flow | | Weighted Average
Cost of Capital | | | 17.0 | % | | | 19.0 | % | | | 18.0 | % | | Decrease | |
| | | | | | | Perpetual Growth Rate | | | 3.5 | % | | | 4.5 | % | | | 4.0 | % | | Increase | |
| | | | | Market Comparable
Companies | | Enterprise Value/
Revenue | | | 3.1 | x | | | 7.5 | x | | | 5.7 | x | | Increase | |
| | | | | | | Discount for Lack
of Marketability | | | 15.0 | % | | | 15.0 | % | | | 15.0 | % | | Decrease | |
18
Morgan Stanley Institutional Fund, Inc.
Annual Report — December 31, 2013
Notes to Financial Statements (cont'd)
| | | Fair Value at
December 31, 2013
(000) | | Valuation
Technique | | Unobservable
Input | | Range | | Weighted
Average | | Impact to
Valuation from an
Increase in Input | |
Internet Software & Services | |
Precedent Transaction
Market Transaction of Common and
Common Stock | | $ | 38 | | | Method | | Preferred Stock | | $ | 11.50 | | | $ | 11.50 | | | $ | 11.50 | | | Increase | |
Convertible Preferred
Stock | | $ | 4 | | | Discounted Cash Flow | | Weighted Average
Cost of Capital | | | 16.0 | % | | | 18.0 | % | | | 17.0 | % | | Decrease | |
| | | | | | | Perpetual Growth Rate | | | 2.5 | % | | | 3.5 | % | | | 3.0 | % | | Increase | |
| | | | | Market Comparable
Companies | | Enterprise Value/
Revenue | | | 9.1 | x | | | 17.6 | x | | | 12.8x | | | Increase | |
| | | | | | | Discount for Lack
of Marketability | | | 15.0 | % | | | 15.0 | % | | | 15.0 | % | | Decrease | |
3. Foreign Currency Translation and Foreign Investments: The books and records of the Portfolio are maintained in U.S. dollars. Foreign currency amounts are translated into U.S. dollars as follows:
– investments, other assets and liabilities at the prevailing rate of exchange on the valuation date;
– investment transactions and investment income at the prevailing rates of exchange on the dates of such transactions.
Although the net assets of the Portfolio are presented at the foreign exchange rates and market values at the close of the period, the Portfolio does not isolate that portion of the results of operations arising as a result of changes in the foreign exchange rates from the fluctuations arising from changes in the market prices of securities held at period end. Similarly, the Portfolio does not isolate the effect of changes in foreign exchange rates from the fluctuations arising from changes in the market prices of securities sold during the period. Accordingly, realized and unrealized foreign currency gains (losses) on investments in securities are included in the reported net realized and unrealized gains (losses) on investment transactions and balances. However, pursuant to U.S. Federal income tax regulations, gains and losses from certain foreign currency transactions and the foreign currency portion of gains and losses realized on sales and maturities of foreign denominated debt securities are treated as ordinary income for U.S. Federal income tax purposes.
Net realized gains (losses) on foreign currency transactions represent net foreign exchange gains (losses) from foreign currency forward exchange contracts, disposition of foreign currencies, currency gains (losses)
realized between the trade and settlement dates on securities transactions, and the difference between the amount of investment income and foreign withholding taxes recorded on the Portfolio's books and the U.S. dollar equivalent amounts actually received or paid. Net unrealized currency gains (losses) from valuing foreign currency denominated assets and liabilities at period end exchange rates are reflected as a component of unrealized appreciation (depreciation) on the Statement of Assets and Liabilities. The change in unrealized currency gains (losses) on foreign currency translations for the period is reflected in the Statement of Operations.
Foreign security and currency transactions may involve certain considerations and risks not typically associated with those of U.S. dollar denominated transactions as a result of, among other factors, fluctuations of exchange rates in relation to the U.S. dollar, the possibility of lower levels of governmental supervision and regulation of foreign securities markets and the possibility of political or economic instability.
The net assets of the Portfolio include foreign denominated securities and currency. Changes in currency exchange rates will affect the U.S. Dollar value of and investment income from such securities.
Governmental approval for foreign investments may be required in advance of making an investment under certain circumstances in some countries, and the extent of foreign investments in domestic companies may be subject to limitation in other countries. Foreign ownership limitations also may be imposed by the charters of individual companies to prevent, among other concerns, violations of foreign investment limitations. As a result,
19
Morgan Stanley Institutional Fund, Inc.
Annual Report — December 31, 2013
Notes to Financial Statements (cont'd)
an additional class of shares (identified as "Foreign" in the Portfolio of Investments) may be created and offered for investment. The "local" and "foreign shares" market values may differ. In the absence of trading of the foreign shares in such markets, the Portfolio values the foreign shares at the closing exchange price of the local shares.
4. Derivatives: The Portfolio may, but is not required to, use derivative instruments for a variety of purposes, including hedging, risk management, portfolio management or to earn income. Derivatives are financial instruments whose value is based, in part, on the value of an underlying asset, interest rate, index or financial instrument. Prevailing interest rates and volatility levels, among other things, also affect the value of derivative instruments. A derivative instrument often has risks similar to its underlying asset and may have additional risks, including imperfect correlation between the value of the derivative and the underlying asset, risks of default by the counterparty to certain transactions, magnification of losses incurred due to changes in the market value of the securities, instruments, indices or interest rates to which they relate, and risks that the transactions may not be liquid. The use of derivatives involves risks that are different from, and possibly greater than, the risks associated with other portfolio investments. Derivatives may involve the use of highly specialized instruments that require investment techniques and risk analyses different from those associated with other portfolio investments. All of the Portfolio's holdings, including derivative instruments, are marked-to-market each day with the change in value reflected in unrealized appreciation (depreciation). Upon disposition, a realized gain or loss is recognized.
Certain derivative transactions may give rise to a form of leverage. Leverage magnifies the potential for gain and the risk of loss. Leverage associated with derivative transactions may cause the Portfolio to liquidate portfolio positions when it may not be advantageous to do so to satisfy its obligations or to meet earmarking or segregation requirements, pursuant to applicable Securities and Exchange Commission rules and regulations, or may cause the Portfolio to be more volatile than if the Portfolio had not been leveraged. Although the Adviser seeks to use derivatives to further the Portfolio's investment objectives, there is no assurance that the use of derivatives will achieve this result.
Following is a description of the derivative instruments and techniques that the Portfolio used during the period and their associated risks:
Options: In respect to options, the Portfolio is subject to equity risk, interest rate risk and foreign currency exchange risk in the normal course of pursuing its investment objectives. If the Portfolio buys an option, it buys a legal contract giving it the right to buy or sell a specific amount of the underlying instrument or futures contract on the underlying instrument such a as security, currency or index, at an agreed upon price typically in exchange for a premium paid by the Portfolio. The Portfolio may purchase put and call options. Purchasing call options tends to increase the Portfolio's exposure to the underlying (or similar) instrument. Purchasing put options tends to decrease the Portfolio's exposure to the underlying (or similar) instrument. When entering into purchased option contracts, the Portfolio bears the risk of interest or exchange rates or securities prices moving unexpectedly, in which case, the Portfolio may not achieve the anticipated benefits of the purchased option contracts; however the risk of loss is limited to the premium paid. Purchased options are reported as part of "Total Investments" on the Statement of Assets and Liabilities. Premium paid for purchasing options which expired are treated as realized losses. If the Portfolio sells an option, it sells to another party the right to buy from or sell to the Portfolio a specific amount of the underlying instrument or futures contract on the underlying instrument at an agreed upon price typically in exchange for a premium received by the Portfolio. There is the risk the Portfolio may not be able to enter into a closing transaction because of an illiquid market. A decision as to whether, when and how to use options involves the exercise of skill and judgment and even a well-conceived option transaction may be unsuccessful because of market behavior or unexpected events. The prices of options can be highly volatile and the use of options can lower total returns.
FASB ASC 815, "Derivatives and Hedging: Overall" ("ASC 815"), is intended to improve financial reporting about derivative instruments by requiring enhanced disclosures to enable investors to better understand how and why the Portfolio uses derivative instruments, how these derivative instruments are accounted for and their effects on the Portfolio's financial position and results of operations.
20
Morgan Stanley Institutional Fund, Inc.
Annual Report — December 31, 2013
Notes to Financial Statements (cont'd)
The following table sets forth the fair value of the Portfolio's derivative contracts by primary risk exposure as of December 31, 2013.
| | | Asset Derivatives
Statement of Assets and
Liabilities Location | | Primary Risk
Exposure | | Value
(000) | |
Options Purchased | | Investments, at Value
(Options Purchased) | |
Equity Risk | | $ | 534 | † | |
† Amounts are included in Investments in the Statement of Assets and Liabilities.
The following table sets forth by primary risk exposure the Portfolio's and change in unrealized appreciation (depreciation) by type of derivative contract for the year ended December 31, 2013 in accordance with ASC 815.
Change in Unrealized Appreciation (Depreciation) | |
Primary Risk Exposure | | Derivative Type | | Value
(000) | |
Equity Risk | | Investments
(Options Purchased) | | $ | 56 | †† | |
†† Amounts are included in Investments in the Statement of Operations.
At December 31, 2013, the Portfolio's derivative assets and liabilities are as follows:
Gross Amounts of Assets and Liabilities Presented in the
Statement of Assets and Liabilities | |
Derivatives | | Assets(a)
(000) | | Liabilities(a)
(000) | |
Options Purchased | | $ | 534 | | | $ | — | | |
(a) Absent an event of default or early termination, OTC derivative assets and liabilities are presented gross and not offset in the Statement of Assets and Liabilities.
The following table presents derivative financial instruments that are subject to enforceable netting arrangements as of December 31, 2013.
Gross Amounts Not Offset in the Statement of Assets and Liabilities | |
Counterparty | | Gross Asset
Derivatives
Presented in Statement of
Assets and Liabilities
(000) | | Financial
Instrument
(000) | | Collateral
Pledged
(000) | | Net
Amount
(not less
than 0)
(000) | |
Morgan Stanley & Co. LLC | | $ | 254 | | | $ | — | | | $ | — | | | $ | 254 | | |
UBS AG | | | 280 | | | | — | | | | — | | | | 280 | | |
Total | | $ | 534 | | | $ | — | | | $ | — | | | $ | 534 | | |
For the year ended December 31, 2013, the approximate average monthly amount outstanding for each derivative type is as follows:
Options Purchased: | |
| Average monthly notional amount | | | 22,000 | | |
5. Restricted Securities: The Portfolio invests in unregistered or otherwise restricted securities. The term "restricted securities" refers to securities that are unregistered or are held by control persons of the issuer and securities that are subject to contractual restrictions on their resale. As a result,
restricted securities may be more difficult to value and the Portfolio may have difficulty disposing of such assets either in a timely manner or for a reasonable price. In order to dispose of an unregistered security, the Portfolio, where it has contractual rights to do so, may have to cause such security to be registered. A considerable period may elapse between the time the decision is made to sell the security and the time the security is registered so that the Portfolio could sell it. Contractual restrictions on the resale of securities vary in length and scope and are generally the result of a negotiation between the issuer and acquirer of the securities. The Portfolio would, in either case, bear market risks during that period. Restricted Securities are identified in the Portfolio of Investments.
6. Indemnifications: The Fund enters into contracts that contain a variety of indemnifications. The Fund's maximum exposure under these arrangements is unknown. However, the Fund has not had prior claims or losses pursuant to these contracts and expects the risk of loss to be remote.
7. Dividends and Distributions to Shareholders: Dividend income and distributions to shareholders are recorded on the ex-dividend date. Dividends from net investment income, if any, are declared and paid semiannually. Net realized capital gains, if any, are distributed at least annually.
8. Security Transactions, Income and Expenses: Security transactions are accounted for on the trade date (date the order to buy or sell is executed). Realized gains and losses on the sale of investment securities are determined on the specific identified cost method. Dividend income and other distributions are recorded on the ex-dividend date (except for certain foreign dividends which may be recorded as soon as the Portfolio is informed of such dividends) net of applicable withholding taxes. Interest income is recognized on the accrual basis except where collection is in doubt. Discounts are accreted and premiums are amortized over the life of the respective securities. Most expenses of the Fund can be directly attributed to a particular Portfolio. Expenses which cannot be directly attributed are apportioned among the Portfolios based upon relative net assets or other appropriate methods. Income, expenses (other than class specific expenses — distribution, transfer agency and sub transfer agency fees) and realized and unrealized gains or losses are
21
Morgan Stanley Institutional Fund, Inc.
Annual Report — December 31, 2013
Notes to Financial Statements (cont'd)
allocated to each class of shares based upon their relative net assets.
B. Advisory Fees: The Adviser, a wholly-owned subsidiary of Morgan Stanley, provides the Portfolio with advisory services under the terms of an Investment Advisory Agreement, paid quarterly, at the annual rate based on the average daily net assets as follows:
First $1
billion | | Over $1
billion | |
| | 0.90 | % | | | 0.85 | % | |
For the year ended December 31, 2013, the advisory fee rate (net of waivers/rebate) was equivalent to an annual effective rate of 0.00% of the Portfolio's daily net assets.
The Adviser has agreed to reduce its advisory fee and/or reimburse the Portfolio so that total annual portfolio operating expenses, excluding certain investment related expenses, taxes, interest and other extraordinary expenses (including litigation), will not exceed 1.35% for Class I shares, 1.60% for Class A shares and 2.10% for Class L shares. Effective September 16, 2013, the Adviser has agreed to limit the ratio of expenses to average net assets to the maximum ratio of 1.70% and 2.20% for Class A and Class L shares, respectively. The fee waivers and/or expense reimbursements will continue for at least one year or until such time that the Directors act to discontinue all or a portion of such waivers and/or reimbursements when it deems such action is appropriate. For the year ended December 31, 2013, approximately $75,000 of advisory fees were waived and approximately $117,000 of other expenses were reimbursed by the Adviser pursuant to this arrangement.
C. Administration Fees: The Adviser also serves as Administrator to the Fund and provides administrative services pursuant to an Administration Agreement for an annual fee, accrued daily and paid monthly, of 0.08% of the Portfolio's average daily net assets. Under a Sub-Administration Agreement between the Administrator and State Street Bank and Trust Company ("State Street"), State Street provides certain administrative services to the Fund. For such services, the Administrator pays State Street a portion of the fee the Administrator receives from the Portfolio.
D. Distribution and Shareholder Services Fees: Morgan Stanley Distribution, Inc. ("MSDI" or the "Distributor"), a wholly-owned subsidiary of the Adviser, and an indirect subsidiary of Morgan Stanley, serves as the Fund's Distributor of Portfolio shares pursuant to a Distribution Agreement. The Fund has adopted a Shareholder Services Plan with respect to Class A shares pursuant to Rule 12b-1 under
the Act. Under the Shareholder Services Plan, the Portfolio pays the Distributor a shareholder services fee, accrued daily and paid monthly, at an annual rate of 0.25% of the Portfolio's average daily net assets attributable to Class A shares.
The Fund has adopted a Distribution and Shareholder Services Plan with respect to Class L shares pursuant to Rule 12b-1 under the Act. Under the Distribution and Shareholder Services Plan, the Portfolio pays the Distributor a distribution fee, accrued daily and paid monthly, at an annual rate of 0.50% and a shareholder services fee, accrued daily and paid monthly, at an annual rate of 0.25% of the Portfolio's average daily net assets attributable to Class L shares.
The distribution and shareholder services fees are used to support the expenses associated with servicing and maintaining accounts. The Distributor may compensate other parties for providing shareholder support services to investors who purchase Class A and Class L shares.
E. Dividend Disbursing and Transfer Agent: The Fund's dividend disbursing and transfer agent was Morgan Stanley Services Company Inc. ("Morgan Stanley Services"). Pursuant to a Transfer Agency Agreement, the Fund paid Morgan Stanley Services a fee based on the number of classes, accounts and transactions relating to the Portfolios of the Fund. Effective July 1, 2013, the Directors approved changing the transfer agent to Boston Financial Data Services, Inc.
F. Custodian Fees: State Street (the "Custodian") serves as Custodian for the Fund in accordance with a Custodian Agreement. The Custodian holds cash, securities, and other assets of the Fund as required by the Act. Custody fees are payable monthly based on assets held in custody, investment purchases and sales activity and account maintenance fees, plus reimbursement for certain out-of-pocket expenses.
G. Security Transactions and Transactions with Affiliates: For the year ended December 31, 2013, purchases and sales of investment securities for the Portfolio, other than long-term U.S. Government securities and short-term investments, were approximately $9,648,000 and $7,924,000, respectively. There were no purchases and sales of long-term U.S. Government securities for the year ended December 31, 2013.
The Portfolio invests in the Institutional Class of the Morgan Stanley Institutional Liquidity Funds — Money Market Portfolio (the "Liquidity Funds"), an open-end management investment company managed by the Adviser. Advisory fees paid by the Portfolio are reduced by an amount equal to its pro-rata
22
Morgan Stanley Institutional Fund, Inc.
Annual Report — December 31, 2013
Notes to Financial Statements (cont'd)
share of the advisory and administration fees paid by the Portfolio due to its investment in the Liquidity Funds. For the year ended December 31, 2013, advisory fees paid were reduced by approximately $1,000 relating to the Portfolio's investment in the Liquidity Funds.
A summary of the Portfolio's transactions in shares of the Liquidity Funds during the year ended December 31, 2013 is as follows:
Value
December 31,
2012
(000) | | Purchases
at Cost
(000) | | Sales
(000) | | Dividend
Income
(000) | | Value
December 31,
2013
(000) | |
| $ | 123 | | | $ | 8,885 | | | $ | 8,503 | | | $ | — | @ | | $ | 505 | | |
@ Amount is less than $500.
During the year ended December 31, 2013, the Portfolio incurred approximately $1,000 in brokerage commissions with Morgan Stanley & Co., LLC, an affiliate of the Adviser, Administrator and Distributor, for portfolio transactions executed on behalf of the Portfolio.
From January 1, 2013 to June 30, 2013, the Portfolio incurred approximately $1,000 in brokerage commissions with Citigroup, Inc., and its affiliated broker-dealers, which may be deemed affiliates of the Adviser, Administrator and Distributor under Section 17 of the Act, for portfolio transactions executed on behalf of the Portfolio. Citigroup, Inc. and its affiliated broker-dealers ceased to be affiliates of the Portfolio pursuant to Section 17 of the Act as of July 1, 2013.
H. Federal Income Taxes: It is the Portfolio's intention to continue to qualify as a regulated investment company and distribute all of its taxable and tax-exempt income. Accordingly, no provision for Federal income taxes is required in the financial statements.
The Portfolio may be subject to taxes imposed by countries in which it invests. Such taxes are generally based on income and/or capital gains earned or repatriated. Taxes are accrued based on net investment income, net realized gains and net unrealized appreciation as such income and/or gains are earned. Taxes may also be based on transactions in foreign currency and are accrued based on the value of investments denominated in such currency.
FASB ASC 740-10 "Income Taxes — Overall" sets forth a minimum threshold for financial statement recognition of the benefit of a tax position taken or expected to be taken in a tax return. Management has concluded there are no significant uncertain tax positions that would require recognition in the financial statements. If applicable, the Portfolio recognizes
interest accrued related to unrecognized tax benefits in "Interest Expense" and penalties in "Other Expenses" in the Statement of Operations. The Portfolio files tax returns with the U.S. Internal Revenue Service, New York and various states. Generally, each of the tax years in the four-year period ended December 31, 2013, remains subject to examination by taxing authorities.
The tax character of distributions paid may differ from the character of distributions shown in the Statements of Changes in Net Assets due to short-term capital gains being treated as ordinary income for tax purposes. The tax character of distributions paid during fiscal 2013 and 2012 was as follows:
2013
Distributions
Paid From: | | 2012
Distributions
Paid From: | |
Ordinary
Income
(000) | | Long-Term
Capital Gain
(000) | | Ordinary
Income
(000) | | Long-Term
Capital Gain
(000) | |
| $ | 405 | | | $ | 831 | | | $ | 234 | | | $ | 132 | | |
The amount and character of income and gains to be distributed are determined in accordance with income tax regulations which may differ from GAAP. These book/tax differences are either considered temporary or permanent in nature.
Temporary differences are primarily due to differing book and tax treatments in the timing of the recognition of gains (losses) on certain investment transactions and the timing of the deductibility of certain expenses.
Permanent differences, primarily due to differing treatments of gains (losses) related to foreign currency transactions and basis adjustments on certain equity securities designated as passive foreign investment companies, resulted in the following reclassifications among the components of net assets at December 31, 2013:
Distributions in
Excess of
Net Investment
Income
(000) | | Accumulated
Net Realized
Gain
(000) | | Paid-in-
Capital
(000) | |
| $ | 2 | | | $ | (2 | ) | | $ | — | | |
At December 31, 2013, the components of distributable earnings for the Portfolio on a tax basis were as follows:
Undistributed
Ordinary
Income
(000) | | Undistributed
Long-Term
Capital Gain
(000) | |
| $ | 172 | | | $ | 665 | | |
At December 31, 2013, the aggregate cost for federal income tax purposes is $8,833,000. The aggregate gross unrealized appreciation is $1,568,000 and the aggregate gross unrealized
23
Morgan Stanley Institutional Fund, Inc.
Annual Report — December 31, 2013
Notes to Financial Statements (cont'd)
depreciation is $350,000 resulting in net unrealized appreciation of $1,218,000.
I. Other (unaudited): At December 31, 2013, the Portfolio had otherwise unaffiliated record owners of 10% or greater. Investment activities of these shareholders could have a material impact on the Portfolio. The aggregate percentage of such owners was 24%, 24% and 44%, for Class I, Class A and Class L shares, respectively.
J. Results of Special Shareholder Meeting (unaudited): On June 5, 2013, a Joint Special Shareholder Meeting was held for Class H shareholders of the Portfolio to approve the Articles of Amendment to the Fund's Articles of Amendment and Restatement and a Plan of Reclassification for the Portfolio pursuant to which Class H shares would be reclassified as Class P shares. The results with respect to this proposal were as follows:
| For | | Against | | Abstain | |
| | 36,389 | | | | 0 | | | | 0 | | |
K. Accounting Pronouncement: In June 2013, FASB issued Accounting Standards Update 2013-08 Financial Services — Investment Companies (Topic 946) — Amendments to the Scope, Measurement, and Disclosure Requirements ("ASU 2013-08") which is effective for interim and annual reporting periods in fiscal years that begin after December 15, 2013. ASU 2013-08 sets forth a methodology for determining whether an entity should be characterized as an investment company and prescribes fair value accounting for an investment company's non-controlling ownership interest in another investment company. FASB has determined that a fund registered under the Investment Company Act of 1940 automatically meets ASU 2013-08's criteria for an investment company. Although still evaluating the potential impacts of ASU 2013-08 to the Portfolio, management expects that the impact of the Portfolio's adoption will be limited to additional financial statement disclosures.
24
Morgan Stanley Institutional Fund, Inc.
Annual Report — December 31, 2013
Report of Independent Registered Public Accounting Firm
To the Shareholders and Board of Directors of
Morgan Stanley Institutional Fund, Inc. —
Global Discovery Portfolio
We have audited the accompanying statement of assets and liabilities, including the portfolio of investments, of Global Discovery Portfolio (one of the portfolios constituting Morgan Stanley Institutional Fund, Inc.) (the "Portfolio") as of December 31, 2013, and the related statement of operations for the year then ended, the statements of changes in net assets for each of the two years in the period then ended, and the financial highlights for each of the periods indicated therein. These financial statements and financial highlights are the responsibility of the Portfolio's management. Our responsibility is to express an opinion on these financial statements and financial highlights based on our audits.
We conducted our audits in accordance with the standards of the Public Company Accounting Oversight Board (United States). Those standards require that we plan and perform the audit to obtain reasonable assurance about whether the financial statements and financial highlights are free of material misstatement. We were not engaged to perform an audit of the Portfolio's internal control over financial reporting. Our audits included consideration of internal control over financial reporting as a basis for designing audit procedures that are appropriate in the circumstances, but not for the purpose of expressing an opinion on the effectiveness of the Portfolio's internal control over financial reporting. Accordingly, we express no such opinion. An audit also includes examining, on a test basis, evidence supporting the amounts and disclosures in the financial statements and financial highlights, assessing the accounting principles used and significant estimates made by management, and evaluating the overall financial statement presentation. Our procedures included confirmation of securities owned as of December 31, 2013, by correspondence with the custodian and others or by other appropriate auditing procedures where replies from others were not received. We believe that our audits provide a reasonable basis for our opinion.
In our opinion, the financial statements and financial highlights referred to above present fairly, in all material respects, the financial position of Global Discovery Portfolio (one of the portfolios constituting Morgan Stanley Institutional Fund, Inc.) at December 31, 2013, the results of its operations for the year then ended, the changes in its net assets for each of the two years in the period then ended, and the financial highlights for each of the periods indicated therein, in conformity with U.S. generally accepted accounting principles.

Boston, Massachusetts
February 26 2014
25
Morgan Stanley Institutional Fund, Inc.
Annual Report — December 31, 2013
Federal Tax Notice (unaudited)
For Federal income tax purposes, the following information is furnished with respect to the distributions paid by the Portfolio during its taxable year ended December 31, 2013. For corporate shareholders, 4.0% of the dividends qualified for the dividends received deduction.
The Portfolio designated and paid $831,000 as a long-term capital gain distribution.
When distributed, certain earnings may be subject to a maximum tax rate of 15% as provided for the Jobs and Growth Tax Relief Reconciliation Act of 2003. The Portfolio designated up to a maximum of $11,000 as taxable at this lower rate.
In January, the Portfolio provides tax information to shareholders for the preceding calendar year.
26
Morgan Stanley Institutional Fund, Inc.
Annual Report — December 31, 2013
U.S. Privacy Policy (unaudited)
AN IMPORTANT NOTICE CONCERNING OUR U.S. PRIVACY POLICY
This privacy notice describes the U.S. privacy policy of Morgan Stanley Distribution, Inc., and the Morgan Stanley family of mutual funds ("us", "our", "we").
We are required by federal law to provide you with notice of our U.S. privacy policy ("Policy"). This Policy applies to both our current and former clients unless we state otherwise and is intended for individual clients who purchase products or receive services from us for personal, family or household purposes. This Policy is not applicable to partnerships, corporations, trusts or other non-individual clients or account holders, nor is this Policy applicable to individuals who are either beneficiaries of a trust for which we serve as trustee or participants in an employee benefit plan administered or advised by us. This Policy is, however, applicable to individuals who select us to be a custodian of securities or assets in individual retirement accounts, 401(k) accounts, or accounts subject to the Uniform Gifts to Minors Act.
This notice sets out our business practices to protect your privacy; how we collect and share personal information about you; and how you can limit our sharing or certain uses by others of this information. We may amend this Policy at any time, and will inform you of any changes to our Policy as required by law.
WE RESPECT YOUR PRIVACY
We appreciate that you have provided us with your personal financial information and understand your concerns about your information. We strive to safeguard the information our clients entrust to us. Protecting the confidentiality and security of client information is an important part of how we conduct our business.
This notice describes what personal information we collect about you, how we collect it, when we may share it with others, and how certain others may use it. It discusses the steps you may take to limit our sharing of certain information about you with our affiliated companies, including, but not limited to our affiliated banking businesses, brokerage firms and credit service affiliates. It also discloses how you may limit our affiliates' use of shared information for marketing purposes.
Throughout this Policy, we refer to the nonpublic information that personally identifies you as "personal information." We also use the term "affiliated company" in this notice. An affiliated company is a company in our family of companies and includes companies with the Morgan Stanley name. These affiliated companies are financial institutions such as broker-dealers, banks, investment advisers and credit card issuers. We refer to any company that is not an affiliated company as a nonaffiliated third party For purposes of Section 5 of this notice, and your ability to limit certain uses of personal information by our affiliates, this notice applies to the use of personal information by our affiliated companies.
1. WHAT PERSONAL INFORMATION DO WE COLLECT FROM YOU?
We may collect the following types of information about you: (i) information provided by you, including information from applications and other forms we receive from you, (ii) information about your transactions with us or our affiliates, (iii) information about your transactions with nonaffiliated third parties, (iv) information from consumer reporting agencies, (v) information obtained from our websites, and (vi) information obtained from other sources. For example:
• We collect information such as your name, address, e-mail address, telephone/fax numbers, assets, income and investment objectives through applications and other forms you submit to us.
• We may obtain information about account balances, your use of account(s) and the types of products and services you prefer to receive from us through your dealings and transactions with us and other sources.
• We may obtain information about your creditworthiness and credit history from consumer reporting agencies.
• We may collect background information from and through third-party vendors to verify representations you have made and to comply with various regulatory requirements.
2. WHEN DO WE DISCLOSE PERSONAL INFORMATION WE COLLECT ABOUT YOU?
We may disclose personal information we collect about you in each of the categories listed above to affiliated and nonaffiliated third parties.
27
Morgan Stanley Institutional Fund, Inc.
Annual Report — December 31, 2013
U.S. Privacy Policy (unaudited) (cont'd)
a. Information we disclose to affiliated companies.
We may disclose personal information that we collect about you to our affiliated companies to manage your account(s) effectively, to service and process your transactions, and to let you know about products and services offered by us and affiliated companies, to manage our business, and as otherwise required or permitted by law. Offers for products and services from affiliated companies are developed under conditions designed to safeguard your personal information.
b. Information we disclose to third parties.
We may disclose personal information that we collect about you to nonaffiliated third parties to provide marketing services on our behalf or to other financial institutions with whom we have joint marketing agreements. We may also disclose all of the information we collect to other nonaffiliated third parties for our everyday business purposes, such as to process transactions, maintain account(s), respond to court orders and legal investigations, report to credit bureaus, offer our own products and services, protect against fraud, for institutional risk control, to perform services on our behalf, and as otherwise required or permitted by law.
When we share personal information about you with a nonaffiliated third party, they are required to limit their use of personal information about you to the particular purpose for which it was shared and they are not allowed to share personal information about you with others except to fulfill that limited purpose or as may be permitted or required by law.
3. HOW DO WE PROTECT THE SECURITY AND CONFIDENTIALITY OF PERSONAL INFORMATION WE COLLECT ABOUT YOU?
We maintain physical, electronic and procedural security measures that comply with applicable law and regulations to help safeguard the personal information we collect about you. We have internal policies governing the proper handling of client information by employees. Third parties that provide support or marketing services on our behalf may also receive personal information about you, and we require them to adhere to appropriate security standards with respect to such information.
4. HOW CAN YOU LIMIT OUR SHARING CERTAIN PERSONAL INFORMATION ABOUT YOU WITH OUR AFFILIATED COMPANIES FOR ELIGIBILITY DETERMINATION?
By following the opt-out procedures in Section 6 below, you may limit the extent to which we share with our affiliated companies, personal information that was collected to determine your eligibility for products and services such as your credit reports and other information that you have provided to us or that we may obtain from third parties ("eligibility information"). Eligibility information does not include your identification information or personal information pertaining to our transactions or experiences with you. Please note that, even if you direct us not to share eligibility information with our affiliated companies, we may still share your personal information, including eligibility information, with our affiliated companies under circumstances that are permitted under applicable law, such as to process transactions or to service your account.
5. HOW CAN YOU LIMIT THE USE OF CERTAIN PERSONAL INFORMATION ABOUT YOU BY OUR AFFILIATED COMPANIES FOR MARKETING?
By following the opt-out instructions in Section 6 below, you may limit our affiliated companies from marketing their products or services to you based on personal information we disclose to them. This information may include, for example, your income and account history with us. Please note that, even if you choose to limit our affiliated companies from using personal information about you that we may share with them for marketing their products and services to you, our affiliated companies may use your personal information that they obtain from us to market to you in circumstances permitted by law, such as if the affiliated party has its own relationship with you.
28
Morgan Stanley Institutional Fund, Inc.
Annual Report — December 31, 2013
U.S. Privacy Policy (unaudited) (cont'd)
6. HOW CAN YOU SEND US AN OPT-OUT INSTRUCTION?
If you wish to limit our sharing of eligibility information about you with our affiliated companies, or our affiliated companies' use of personal information for marketing purposes, as described in this notice, you may do so by:
• Calling us at (800) 548-7786
Monday–Friday between 8a.m. and 5p.m. (EST)
• Writing to us at the following address:
Boston Financial Data Services, Inc.
c/o Privacy Coordinator
P.O. Box 219804
Kansas City, Missouri 64121
If you choose to write to us, your request should include: your name, address, telephone number and account number(s) to which the opt-out applies and whether you are opting out with respect to sharing of eligibility information (Section 4 above), or information used for marketing (Section 5 above), or both. Written opt-out requests should not be sent with any other correspondence. In order to process your request, we require that the request be provided by you directly and not through a third party. Once you have informed us about your privacy preferences, your opt-out preference will remain in effect with respect to this Policy (as it may be amended) until you notify us otherwise. If you are a joint account owner, we will accept instructions from any one of you and apply those instructions to the entire account.
Please understand that if you limit our sharing or our affiliated companies' use of personal information, you and any joint account holder(s) may not receive information about our affiliated companies' products and services, including products or services that could help you manage your financial resources and achieve your investment objectives.
If you have more than one account or relationship with us, please specify the accounts to which you would like us to apply your privacy choices. If you have accounts or relationships with our affiliates, you may receive multiple privacy policies from them, and will need to separately notify those companies of your privacy choices for those accounts or relationships.
7. WHAT IF AN AFFILIATED COMPANY BECOMES A NONAFFILIATED THIRD PARTY?
If, at any time in the future, an affiliated company becomes a nonaffiliated third party, further disclosures of personal information made to the former affiliated company will be limited to those described in Section 2(b) above relating to nonaffiliated third parties. If you elected under Section 6 to limit disclosures we make to affiliated companies, or use of personal information by affiliated companies, your election will not apply to use by any former affiliated company of your personal information in their possession once it becomes a nonaffiliated third party.
SPECIAL NOTICE TO RESIDENTS OF VERMONT
The following section supplements our Policy with respect to our individual clients who have a Vermont address and supersedes anything to the contrary in the above Policy with respect to those clients only.
The State of Vermont requires financial institutions to obtain your consent prior to sharing personal information that they collect about you with nonaffiliated third parties, or eligibility information with affiliated companies, other than in certain limited circumstances. Except as permitted by law, we will not share personal information we collect about you with nonaffiliated third parties or eligibility information with affiliated companies, unless you provide us with your written consent to share such information.
SPECIAL NOTICE TO RESIDENTS OF CALIFORNIA
The following section supplements our Policy with respect to our individual clients who have a California address and supersedes anything to the contrary in the above Policy with respect to those clients only.
In response to a California law, if your account has a California home address, your personal information will not be disclosed to nonaffiliated third parties except as permitted by applicable California law, and we will limit sharing such personal information with our affiliates to comply with California privacy laws that apply to us.
29
Morgan Stanley Institutional Fund, Inc.
Annual Report — December 31, 2013
Director and Officer Information (unaudited)
Independent Director:
Name, Age and Address of
Independent Director | | Position(s)
Held with
Registrant | | Length of Time
Served* | | Principal Occupation(s) During Past 5 Years | | Number of
Portfolios in
Fund Complex
Overseen by
Independent
Director** | | Other Directorships
Held by Independent
Director*** | |
Frank L. Bowman (69)
c/o Kramer Levin Naftalis &
Frankel LLP
Counsel to the Independent Directors
1177 Avenue of the Americas
New York, NY 10036 | | Director | | Since
August
2006 | | President, Strategic Decisions, LLC (consulting) (since February 2009); Director or Trustee of various Morgan Stanley Funds (since August 2006); Chairperson of the Insurance Sub-Committee of the Compliance and Insurance Committee (since February 2007); served as President and Chief Executive Officer of the Nuclear Energy Institute (policy organization) (February 2005-November 2008); retired as Admiral, U.S. Navy after serving over 38 years on active duty including 8 years as Director of the Naval Nuclear Propulsion Program in the Department of the Navy and the U.S. Department of Energy (1996-2004); served as Chief of Naval Personnel (July 1994-September 1996); and on the Joint Staff as Director of Political Military Affairs (June 1992-July 1994); knighted as Honorary Knight Commander of the Most Excellent Order of the British Empire; awarded the Officier de l'Orde National du Mérite by the French Government; elected to the National Academy of Engineering (2009). | | | 98 | | | Director of BP p.l.c.; Director of Naval and Nuclear Technologies LLP; Director of the Armed Services YMCA of the USA and the U.S. Naval Submarine League; Director of the American Shipbuilding Suppliers Association; Member of the National Security Advisory Council of the Center for U.S. Global Engagement and a member of the CNA Military Advisory Board; Chairman of the charity J Street Cup, Trustee of the Fairhaven United Methodist Church. | |
Michael Bozic (73)
c/o Kramer Levin Naftalis & Frankel LLP
Counsel to the Independent Directors
1177 Avenue of the Americas
New York, NY 10036 | | Director | | Since
April
1994 | | Private investor and a member of the advisory board of American Road Group LLC (retail) (since June 2000); Chairperson of the Compliance and Insurance Committee (since October 2006); Director or Trustee of various Morgan Stanley Funds (since April 1994); formerly, Chairperson of the Insurance Committee (July 2006-September 2006); Vice Chairman of Kmart Corporation (December 1998-October 2000), Chairman and Chief Executive Officer of Levitz Furniture Corporation (November 1995-November 1998) and President and Chief Executive Officer of Hills Department Stores (May 1991-July 1995); variously Chairman, Chief Executive Officer, President and Chief Operating Officer (1987-1991) of the Sears Merchandise Group of Sears, Roebuck & Co. | | | 100 | | | Trustee and member of the Hillsdale College Board of Trustees. | |
Kathleen A. Dennis (60)
c/o Kramer Levin Naftalis & Frankel LLP
Counsel to the Independent Directors
1177 Avenue of the Americas
New York, NY 10036 | | Director | | Since
August
2006 | | President, Cedarwood Associates (mutual fund and investment management consulting) (since July 2006); Chairperson of the Money Market and Alternatives Sub-Committee of the Investment Committee (since October 2006) and Director or Trustee of various Morgan Stanley Funds (since August 2006); formerly, Senior Managing Director of Victory Capital Management (1993-2006). | | | 98 | | | Director of various non-profit organizations. | |
Dr. Manuel H. Johnson (65)
c/o Johnson Smick
International, Inc.
220 I Street, NE
Suite 200
Washington, D.C. 20002 | | Director | | Since
July
1991 | | Senior Partner, Johnson Smick International, Inc. (consulting firm); Chairperson of the Investment Committee (since October 2006) and Director or Trustee of various Morgan Stanley Funds (since July 1991); Co-Chairman and a founder of the Group of Seven Council (G7C) (international economic commission); formerly, Chairperson of the Audit Committee (July 1991-September 2006), Vice Chairman of the Board of Governors of the Federal Reserve System and Assistant Secretary of the U.S. Treasury. | | | 101 | | | Director of NVR, Inc. (home construction). | |
30
Morgan Stanley Institutional Fund, Inc.
Annual Report — December 31, 2013
Director and Officer Information (unaudited) (cont'd)
Independent Director: (cont'd)
Name, Age and Address of
Independent Director | | Position(s)
Held with
Registrant | | Length of Time
Served* | | Principal Occupation(s) During Past 5 Years | | Number of
Portfolios in
Fund Complex
Overseen by
Independent
Director** | | Other Directorships
Held by Independent
Director*** | |
Joseph J. Kearns (71)
c/o Kearns & Associates LLC
PMB754
22631 Pacific Coast Highway
Malibu, CA 90265 | | Director | | Since
August
1994 | | President, Kearns & Associates LLC (investment consulting); Chairperson of the Audit Committee (since October 2006) and Director or Trustee of various Morgan Stanley Funds (since August 1994); formerly, Deputy Chairperson of the Audit Committee (July 2003-September 2006) and Chairperson of the Audit Committee of various Morgan Stanley Funds (since August 1994); CFO of the J. Paul Getty Trust. | | | 101 | | | Director of Electro Rent Corporation (equipment leasing) and The Ford Family Foundation. | |
Michael F. Klein (55)
c/o Kramer Levin Naftalis & Frankel LLP
Counsel to the
Independent Directors
1177 Avenue of the Americas
New York, NY 10036 | | Director | | Since
August
2006 | | Managing Director, Aetos Capital, LLC (since March 2000) and Co-President, Aetos Alternatives Management, LLC (since January 2004) and Co-Chief Executive Officer of Aetos Capital LLC (since August 2013); Chairperson of the Fixed Income Sub-Committee of the Investment Committee (since October 2006) and Director or Trustee of various Morgan Stanley Funds (since August 2006); formerly, Managing Director, Morgan Stanley & Co. Inc. and Morgan Stanley Dean Witter Investment Management, President, various Morgan Stanley Funds (June 1998-March 2000) and Principal, Morgan Stanley & Co. Inc. and Morgan Stanley Dean Witter Investment Management (August 1997-December 1999). | | | 98 | | | Director of certain investment funds managed or sponsored by Aetos Capital, LLC. Director of Sanitized AG and Sanitized Marketing AG (specialty chemicals). | |
Michael E. Nugent (77)
522 Fifth Avenue
New York, NY 10036 | | Chairperson of the Board and Director | | Chairperson of the Boards since July 2006 and Director since July 1991 | | Chairperson of the Boards of various Morgan Stanley Funds (since July 2006); Chairperson of the Closed-End Fund Committee (since June 2012) and Director or Trustee of various Morgan Stanley Funds (since July 1991); formerly, Chairperson of the Insurance Committee (until July 2006); General Partner, Triumph Capital, L.P. (private investment partnership) (1988-2013) | | | 100 | | | None. | |
W. Allen Reed (66)
c/o Kramer Levin Naftalis & Frankel LLP
Counsel to the
Independent Directors
1177 Avenue of the Americas
New York, NY 10036 | | Director | | Since
August
2006 | | Chairperson of the Equity Sub-Committee of the Investment Committee (since October 2006) and Director or Trustee of various Morgan Stanley Funds (since August 2006); formerly, President and CEO of General Motors Asset Management; Chairman and Chief Executive Officer of the GM Trust Bank and Corporate Vice President of General Motors Corporation (August 1994-December 2005). | | | 98 | | | Director of Temple-Inland Industries (packaging and forest products); Director of Legg Mason, Inc. and Director of the Auburn University Foundation. | |
Fergus Reid (81)
c/o Joe Pietryka, Inc.
85 Charles Colman Blvd.
Pawling, NY 12564 | | Director | | Since
June
1992 | | Chairman, Joe Pietryka, Inc.; Chairperson of the Governance Committee and Director or Trustee of various Morgan Stanley Funds (since June 1992). | | | 101 | | | Through December 31, 2012, Trustee and Director of certain Investment companies in the JP Morgan Fund Complex. | |
31
Morgan Stanley Institutional Fund, Inc.
Annual Report — December 31, 2013
Director and Officer Information (unaudited) (cont'd)
Interested Director:
Name, Age and Address of
Interested Director | | Position(s) Held
with Registrant | | Length of
Time Served* | | Principal Occupation(s) During Past 5 Years | | Number of
Portfolios in
Fund Complex
Overseen by
Interested
Director** | | Other Directorships
Held by Interested
Director*** | |
James F. Higgins (66)
One New York Plaza
New York, NY 10004 | | Director | | Since
June
2000 | | Director or Trustee of various Morgan Stanley Funds (since June 2000); Senior Advisor of Morgan Stanley (since August 2000). | | | 99 | | | Formerly, Director of AXA Financial, Inc. and AXA Equitable Life Insurance Company (2002-2011) and Director of AXA MONY Life Insurance Company and AXA MONY Life Insurance Company of America (2004-2011). | |
* Each Director serves an indefinite term, until his or her successor is elected.
** The Fund Complex includes (as of December 31, 2013) all open-end and closed-end funds (including all of their portfolios) advised by Morgan Stanley Investment Management Inc. (the "Adviser") and any funds that have an adviser that is an affiliated person of the Adviser (including, but not limited to, Morgan Stanley AIP GP LP).
*** This includes any directorships at public companies and registered investment companies held by the Director at any time during the past five years.
32
Morgan Stanley Institutional Fund, Inc.
Annual Report — December 31, 2013
Director and Officer Information (unaudited) (cont'd)
Executive Officers:
Name, Age and Address of Executive Officer | | Position(s) Held
with
Registrant | | Length of
Time Served* | | Principal Occupation(s) During Past 5 Years | |
John H. Gernon (50)
522 Fifth Avenue
New York, NY 10036 | | President and Principal Executive Officer—Equity, Fixed Income and AIP Funds | | Since September 2013 | | President and Principal Executive Officer of the Equity and Fixed Income Funds and the Morgan Stanley AIP Funds (since September 2013) in the Fund Complex. Managing Director of the Adviser. | |
Stefanie V. Chang Yu (47)
522 Fifth Avenue
New York, NY 10036 | | Chief Compliance Officer | | Since
January
2014 | | Managing Director of the Adviser and various entities affiliated with the Adviser; Chief Compliance Officer of various Morgan Stanley Funds and the Adviser (since January 2014). Formerly, Vice President of various Morgan Stanley Funds (December 1997-January 2014). | |
Joseph C. Benedetti (48)
522 Fifth Avenue
New York, NY 10036 | | Vice President | | Since
January
2014 | | Managing Director of the Adviser and various entities affiliated with the Adviser; Vice President of various Morgan Stanley Funds (since January 2014). Formerly, Assistant Secretary of various Morgan Stanley Funds (October 2004-January 2014). | |
Francis J. Smith (48)
522 Fifth Avenue
New York, NY 10036 | | Treasurer and Principal Financial Officer | | Treasurer since July 2003 and Principal Financial Officer since September 2002 | | Executive Director of the Adviser and various entities affiliated with the Adviser; Treasurer and Principal Financial Officer of various Morgan Stanley Funds (since July 2003). | |
Mary E. Mullin (46)
522 Fifth Avenue
New York, NY 10036 | | Secretary | | Since
June
1999 | | Executive Director of the Adviser and various entities affiliated with the Adviser; Secretary of various Morgan Stanley Funds (since June 1999). | |
* Each officer serves an indefinite term, until his or her successor is elected.
33
Morgan Stanley Institutional Fund, Inc.
Annual Report — December 31, 2013
Adviser and Administrator
Morgan Stanley Investment Management Inc.
522 Fifth Avenue
New York, New York 10036
Distributor
Morgan Stanley Distribution, Inc.
522 Fifth Avenue
New York, New York 10036
Dividend Disbursing and Transfer Agent
Boston Financial Data Services, Inc.
2000 Crown Colony Drive
Quincy, Massachusetts 02169
Custodian
State Street Bank and Trust Company
One Lincoln Street
Boston, Massachusetts 02111
Legal Counsel
Dechert LLP
1095 Avenue of the Americas
New York, New York 10036
Counsel to the Independent Directors
Kramer Levin Naftalis & Frankel LLP
1177 Avenue of the Americas
New York, New York 10036
Independent Registered Public Accounting Firm
Ernst & Young LLP
200 Clarendon Street
Boston, Massachusetts 02116
Reporting to Shareholders
Each Morgan Stanley fund provides a complete schedule of portfolio holdings in its semi-annual and annual reports within 60 days of the end of the fund's second and fourth fiscal quarters by filing the schedule electronically with the Securities and Exchange Commission (SEC). The semi-annual reports are filed on Form N-CSRS and the annual reports are filed on Form N-CSR. Morgan Stanley also delivers the semi-annual and annual reports to fund shareholders and makes these reports available on its public website, www.morganstanley.com/im. Each Morgan Stanley fund also files a complete schedule of portfolio holdings with the SEC for the fund's first and third fiscal quarters on Form N-Q. Morgan Stanley does not deliver the reports for the first and third fiscal quarters to shareholders, nor are the reports posted to the Morgan Stanley public website. You may, however, obtain the Form N-Q filings (as well as the Form N-CSR and N-CSRS filings) by accessing the SEC's website, www.sec.gov. You may also review and copy them at the SEC's Public Reference Room in Washington, DC. Information on the operation of the SEC's Public Reference Room may be obtained by calling the SEC toll free at 1 (800) SEC-0330. You can also request copies of these materials, upon payment of a duplicating fee, by electronic request at the SEC's email address (publicinfo@sec.gov) or by writing the Public Reference Room of the SEC, Washington, DC 20549-0102.
Proxy Voting Policies and Procedures and Proxy Voting Record
You may obtain a copy of the Fund's Proxy Voting Policy and Procedures and information regarding how the Fund voted proxies relating to portfolio securities during the most recent twelve-month period ended June 30, without charge, upon request, by calling toll free 1 (800) 548-7786 or by visiting our website at www.morganstanley.com/im. This information is also available on the SEC's website at www.sec.gov.
This report is authorized for distribution only when preceded or accompanied by a prospectus of the Morgan Stanley Institutional Fund, Inc. which describes in detail each Investment Portfolio's investment policies, risks, fees and expenses. Please read the prospectus carefully before you invest or send money. For additional information, including information regarding the investments comprising the Portfolio, please visit our website at www.morganstanley.com/im or call toll free 1 (800) 548-7786.
34
(This Page has been left blank intentionally.)
(This Page has been left blank intentionally.)
Printed in U.S.A.
This Report has been prepared for shareholders and may be distributed to others only if preceded or accompanied by a current prospectus.
Morgan Stanley Investment Management Inc.
522 Fifth Avenue
New York, New York 10036
© 2014 Morgan Stanley. Morgan Stanley Distribution, Inc.

IFIGDANN
808996 EXP 2.28.15

Morgan Stanley Institutional Fund, Inc.
Global Franchise Portfolio
Annual Report
December 31, 2013

Morgan Stanley Institutional Fund, Inc.
Annual Report — December 31, 2013
Shareholders' Letter | | | 2 | | |
Expense Example | | | 3 | | |
Investment Overview | | | 4 | | |
Portfolio of Investments | | | 7 | | |
Statement of Assets and Liabilities | | | 8 | | |
Statement of Operations | | | 10 | | |
Statements of Changes in Net Assets | | | 11 | | |
Financial Highlights | | | 13 | | |
Notes to Financial Statements | | | 16 | | |
Report of Independent Registered Public Accounting Firm | | | 23 | | |
Federal Tax Notice | | | 24 | | |
U.S. Privacy Policy | | | 25 | | |
Director and Officer Information | | | 28 | | |
This report is authorized for distribution only when preceded or accompanied by prospectuses of the Morgan Stanley Institutional Fund, Inc. To receive a prospectus and/or statement of additional information (SAI), which contains more complete information such as investment objectives, charges, expenses, policies for voting proxies, risk considerations, and describes in detail each of the Portfolio's investment policies to the prospective investor, please call toll free 1 (800) 548-7786. Please read the prospectuses carefully before you invest or send money.
Additionally, you can access portfolio information including performance, characteristics, and investment team commentary through Morgan Stanley Investment Management's website: www.morganstanley.com/im.
Market forecasts provided in this report may not necessarily come to pass. There is no guarantee that any sectors mentioned will continue to perform as discussed herein or that securities in such sectors will be held by the Portfolio in the future. There is no assurance that a Portfolio will achieve its investment objective. Portfolios are subject to market risk, which is the possibility that market values of securities owned by the Portfolio will decline and, therefore, the value of the Portfolio's shares may be less than what you paid for them. Accordingly, you can lose money investing in the Portfolio. Please see the prospectus for more complete information on investment risks.
1
Morgan Stanley Institutional Fund, Inc.
Annual Report — December 31, 2013
Shareholders' Letter (unaudited)
Dear Shareholders,
We are pleased to provide this Annual report, in which you will learn how your investment in Global Franchise Portfolio (the "Portfolio") performed during the latest twelve-month period.
Morgan Stanley Investment Management is a client-centric, investor-led organization. Our global presence, intellectual capital, and breadth of products and services enable us to partner with investors to meet the evolving challenges of today's financial markets. We aim to deliver superior investment service and to empower our clients to make the informed decisions that help them reach their investment goals.
As always, we thank you for selecting Morgan Stanley Investment Management, and look forward to working with you in the months and years ahead.
Sincerely,

John H. Gernon
President and Principal Executive Officer
January 2014
2
Morgan Stanley Institutional Fund, Inc.
Annual Report — December 31, 2013
Expense Example (unaudited)
Global Franchise Portfolio
As a shareholder of the Portfolio, you incur two types of costs: (1) transactional costs; and (2) ongoing costs, including advisory fees, administration fees, distribution and shareholder services fees and other Portfolio expenses. This example is intended to help you understand your ongoing costs (in dollars) of investing in the Portfolio and to compare these costs with the ongoing costs of investing in other mutual funds.
This example is based on an investment of $1,000 invested at the beginning of the six-month period ended December 31, 2013 and held for the entire six-month period.
Actual Expenses
The table below provides information about actual account values and actual expenses. You may use the information in this table, together with the amount you invested, to estimate the expenses that you paid over the period. Simply divide your account value by $1,000 (for example, an $8,600 account value divided by $1,000 = 8.6), then multiply the result by the number in the table under the heading entitled "Actual Expenses Paid During Period" to estimate the expenses you paid on your account during this period.
Hypothetical Example for Comparison Purposes
The table below provides information about hypothetical account values and hypothetical expenses based on the Portfolio's actual expense ratio and an assumed rate of return of 5% per year before expenses, which is not the Portfolio's actual return. The hypothetical account values and expenses may not be used to estimate the actual ending account balance or expenses you paid for the period. You may use this information to compare the ongoing costs of investing in the Portfolio and other funds. To do so, compare this 5% hypothetical example with the 5% hypothetical examples that appear in the shareholder reports of the other funds.
Please note that the expenses shown in the table are meant to highlight your ongoing costs only and do not reflect any transactional costs, such as sales charges (loads). Therefore, the information for each class in the table is useful in comparing ongoing costs only, and will not help you determine the relative total costs of owning different funds. In addition, if these transactional costs were included, your costs would have been higher.
| | | Beginning
Account
Value
7/1/13 | | Actual Ending
Account
Value
12/31/13 | | Hypothetical
Ending Account
Value | | Actual
Expenses
Paid
During
Period* | | Hypothetical
Expenses Paid
During Period* | | Net
Expense
Ratio
During
Period** | |
Global Franchise Portfolio Class I | | $ | 1,000.00 | | | $ | 1,104.50 | | | $ | 1,020.47 | | | $ | 4.99 | | | $ | 4.79 | | | | 0.94 | % | |
Global Franchise Portfolio Class A@ | | | 1,000.00 | | | | 1,103.40 | | | | 1,019.16 | | | | 6.36 | | | | 6.11 | | | | 1.20 | | |
Global Franchise Portfolio Class L | | | 1,000.00 | | | | 1,100.80 | | | | 1,016.69 | | | | 8.95 | | | | 8.59 | | | | 1.69 | | |
* Expenses are calculated using each Portfolio Class' annualized net expense ratio (as disclosed), multiplied by the average account value over the period, and multiplied by 184/365 (to reflect the most recent one-half year period).
** Annualized.
@ Effective September 9, 2013, Class P and Class H shares were renamed Class A shares.
3
Morgan Stanley Institutional Fund, Inc.
Annual Report — December 31, 2013
Investment Overview (unaudited)
Global Franchise Portfolio
The Global Franchise Portfolio seeks long-term capital appreciation.
Performance
For the year ended December 31, 2013, the Portfolio had a total return based on net asset value and reinvestment of distributions per share of 19.71%, net of fees, for Class I shares. The Portfolio's Class I shares underperformed against its benchmark, the Morgan Stanley Capital International (MSCI) World Index (the "Index"), which returned 26.68%. Please keep in mind that high double-digit returns are highly unusual and cannot be sustained.
Factors Affecting Performance
• 2013 has joined 2012 as another year of "re-rating" — that is, the market changing its view of a company, causing a stock's price to move. This more recent multiple expansion is more likely due to a mix of optimism about future earnings growth potential and the lack of investment alternatives in a world of low interest rates.
• In line with the positive market performance in 2013, the Portfolio returned strong absolute performance, however underperformed relative to the Index. Long-term performance remains strong with the Portfolio outperforming its benchmark since the inception of the Portfolio (November 28, 2001).
• The primary driver of the Portfolio's underperformance was sector allocation, mainly due to the Portfolio's overweight position in consumer staples. Even with the sector delivering a double-digit positive return, it lagged the even higher return of the Index. Although the sector offered better earnings prospects and higher dividend yields than the overall market, consumer staples stocks simply did not re-rate as fast as the market. Strong returns from industrials and consumer discretionary were not enough to offset the overall drag to the Portfolio. No exposure in materials, energy and utilities were positive contributors.
• Stock selection within consumer staples also contributed to the underperformance in 2013. The primary culprit was the performance of the tobacco sub-sector, which trailed well behind the staples sector as a whole for 2013. A secondary issue was the Portfolio's country exposure within the sector, as a relative underweight allocation in U.S. staples
stocks and overweight in European staples stocks detracted from performance.
Management Strategies
• While the talk in developed markets has been of an economic acceleration (of sorts), emerging markets have been slowing down. The talk of the U.S. Federal Reserve tapering its bond buying has caused turmoil in emerging markets, due to fear of money heading back to the U.S. as interest rates rose. This has caused a slowdown in growth forecasts, which have dropped next year for Asia ex-Japan, and has also weakened currencies in countries with current account deficits such as India and Indonesia.
• Although the Global Franchise Portfolio does not have any direct exposure to stocks listed in emerging markets, more than one-third of the revenues of the companies held in the Portfolio are derived in these markets, including BAT, Unilever, Mead Johnson, Philip Morris International and Nestle†,††. These global staples companies have been affected by the emerging markets slowdown and currency turbulence. Top-line growth in these markets has been tempered, and there have been headwinds where local currencies have weakened, which has helped to restrict the staples sector's 2013 earnings growth. Along with these mild economic effects, there has also been a worsening of market sentiment directed to companies exposed to emerging markets consumption, as the market has chased the more exciting and higher beta plays (that is, stocks with greater sensitivity to market movements) linked to developed markets.
• Our view is that exposure to emerging markets consumption remains positive. Even post the slowdown, the staples companies in the Portfolio have recorded high-single- to low-double-digit sales growth in emerging markets, well above that which is sustainable, or even likely, in the near-to-medium term in developed markets. While any resumption in tapering may drive a recurrence of last year's volatility, the emerging markets economies as a whole could continue to see decent overall gross domestic product (GDP) growth, underpinned by growing middle classes and a potential rebalancing towards consumption.
† Please see page 6 for Portfolio Composition.
†† The information contained in this overview regarding specific securities is for informational purposes only and should not be construed as a recommendation to purchase or sell the securities mentioned.
4
Morgan Stanley Institutional Fund, Inc.
Annual Report — December 31, 2013
Investment Overview (unaudited) (cont'd)
Global Franchise Portfolio
• Our focus remains on high-quality companies that we believe will continue to compound shareholder wealth, by offering steady top-line growth, resilient margins and high unlevered returns on capital at reasonable valuations. In the short-term, returns can be driven by re-rating, as has certainly been the case in 2012 and 2013, but in the long-term, the ability to compound has historically won out. Our belief is that well-managed global staples companies remain an excellent source, but by no means the only source, of compounders.
* Minimum Investment for Class I shares
In accordance with SEC regulations, Portfolio's performance shown assumes that all recurring fees (including management fees) were deducted and all dividends and distributions were reinvested. The performance of Class A+ and L shares will vary from Class I shares based upon their different inception dates and will be negatively impacted by additional fees assessed to those classes.
Performance Compared to the Morgan Stanley Capital International (MSCI) World Index(1) and the Lipper Global Large-Cap Growth Funds Index(2)
| | | Period Ended December 31, 2013
Total Returns(3) | |
| | | | | Average Annual | |
| | | One
Year | | Five
Years | | Ten
Years | | Since
Inception(6) | |
Portfolio — Class I Shares
w/o sales charges(4) | | | 19.71 | % | | | 17.45 | % | | | 10.43 | % | | | 11.93 | % | |
MSCI World Index | | | 26.68 | | | | 15.02 | | | | 6.98 | | | | 6.45 | | |
Lipper Global Large-Cap Growth
Funds Index | | | 23.51 | | | | 15.80 | | | | 7.07 | | | | 5.83 | | |
Portfolio — Class A+ Shares
w/o sales charges(4) | | | 19.42 | | | | 17.13 | | | | 10.14 | | | | 11.63 | | |
Portfolio — Class A+ Shares with
maximum 5.25% sales charges(4) | | | 13.15 | | | | 15.88 | | | | 9.55 | | | | 11.14 | | |
MSCI World Index | | | 26.68 | | | | 15.02 | | | | 6.98 | | | | 6.45 | | |
Lipper Global Large-Cap Growth
Funds Index | | | 23.51 | | | | 15.80 | | | | 7.07 | | | | 5.83 | | |
Portfolio — Class L Shares
w/o sales charges(5) | | | 18.78 | | | | — | | | | — | | | | 11.69 | | |
MSCI World Index | | | 26.68 | | | | — | | | | — | | | | 18.28 | | |
Lipper Global Large-Cap Growth
Funds Index | | | 23.51 | | | | — | | | | — | | | | 15.60 | | |
Performance data quoted represents past performance, which is no guarantee of future results, and current performance may be lower or higher than the figures shown. Performance assumes that all dividends and distributions, if any, were reinvested. For the most recent month-end performance figures, please visit www.morganstanley.com/im. Investment return and principal value will fluctuate so that Portfolio shares, when redeemed, may be worth more or less than their original cost. Total returns do not reflect the deduction of taxes that a shareholder would pay on Portfolio distributions or the redemption of Portfolio shares. Performance of share classes will vary due to difference in expenses.
+ Effective September 9, 2013, Class P shares were renamed Class A shares.
(1) The Morgan Stanley Capital International (MSCI) World Index is a free float-adjusted market capitalization weighted index that is designed to measure the global equity market performance of developed markets. The term "free float" represents the portion of shares outstanding that are deemed to be available for purchase in the public equity markets by investors. The MSCI World Index currently consists of 23 developed market country indices. The performance of the Index is listed in U.S. dollars and assumes reinvestment of net dividends. The Index is unmanaged and its returns do not include any sales charges or fees. Such costs would lower performance. It is not possible to invest directly in an index.
(2) The Lipper Global Large-Cap Growth Funds Index is an equally weighted performance index of the largest qualifying funds (based on net assets) in the Lipper Global Large-Cap Growth Funds classification. The Index, which is adjusted for capital gains distributions and income dividends, is unmanaged and should not be considered an investment. There are currently 10 funds represented in this Index. As of the date of this report, the Portfolio is in the Lipper Global Large-Cap Growth Funds classification.
5
Morgan Stanley Institutional Fund, Inc.
Annual Report — December 31, 2013
Investment Overview (unaudited) (cont'd)
Global Franchise Portfolio
(3) Total returns for the Portfolio reflect fees waived and expenses reimbursed, if applicable, by the Adviser. Without such waivers and reimbursements, total returns would have been lower. The fee waivers and/or expense reimbursements will continue for at least one year or until such time as the Fund's Board of Directors acts to discontinue all or a portion of such waivers and/or expense reimbursements when it deems that such action is appropriate.
(4) Commenced operations on November 28, 2001.
(5) Commenced offering on April 27, 2012.
(6) For comparative purposes, average annual since inception returns listed for the Indexes refer to the inception date or initial offering of the respective share class of the Portfolio, not the inception of the Index.
Portfolio Composition
Classification | | Percentage of
Total Investments | |
Food Products | | | 23.5 | % | |
Tobacco | | | 19.6 | | |
Other* | | | 13.7 | | |
Household Products | | | 10.4 | | |
Software | | | 9.5 | | |
Beverages | | | 9.4 | | |
Information Technology Services | | | 8.1 | | |
Pharmaceuticals | | | 5.8 | | |
Total Investments | | | 100.0 | % | |
* Industries and/or investment types representing less than 5% of total investments.
6
Morgan Stanley Institutional Fund, Inc.
Annual Report — December 31, 2013
Portfolio of Investments
Global Franchise Portfolio
| | | Shares | | Value
(000) | |
Common Stocks (97.9%) | |
France (8.8%) | |
LVMH Moet Hennessy Louis Vuitton SA | | | 67,288 | | | $ | 12,275 | | |
Pernod-Ricard SA | | | 66,443 | | | | 7,569 | | |
Sanofi | | | 363,189 | | | | 38,532 | | |
| | | | 58,376 | | |
Germany (4.8%) | |
SAP AG | | | 371,747 | | | | 31,866 | | |
Italy (1.0%) | |
Davide Campari-Milano SpA | | | 806,917 | | | | 6,750 | | |
Sweden (2.1%) | |
Swedish Match AB | | | 424,120 | | | | 13,630 | | |
Switzerland (9.6%) | |
Nestle SA (Registered) | | | 866,781 | | | | 63,450 | | |
United Kingdom (34.3%) | |
Admiral Group PLC | | | 208,040 | | | | 4,513 | | |
British American Tobacco PLC | | | 1,176,084 | | | | 63,061 | | |
Diageo PLC | | | 968,794 | | | | 32,086 | | |
Experian PLC | | | 516,142 | | | | 9,521 | | |
Imperial Tobacco Group PLC | | | 550,967 | | | | 21,331 | | |
Reckitt Benckiser Group PLC | | | 566,358 | | | | 44,952 | | |
Unilever PLC | | | 1,265,937 | | | | 52,031 | | |
| | | | 227,495 | | |
United States (37.3%) | |
3M Co. | | | 137,465 | | | | 19,279 | | |
Accenture PLC, Class A | | | 383,324 | | | | 31,517 | | |
Dr. Pepper Snapple Group, Inc. | | | 318,631 | | | | 15,524 | | |
Herbalife Ltd. | | | 127,111 | | | | 10,004 | | |
Intuit, Inc. | | | 98,223 | | | | 7,496 | | |
Kraft Foods Group, Inc. | | | 159,020 | | | | 8,574 | | |
Mead Johnson Nutrition Co. | | | 75,419 | | | | 6,317 | | |
Microsoft Corp. | | | 618,764 | | | | 23,160 | | |
Mondelez International, Inc., Class A | | | 707,352 | | | | 24,970 | | |
Moody's Corp. | | | 172,292 | | | | 13,520 | | |
NIKE, Inc., Class B | | | 132,007 | | | | 10,381 | | |
Philip Morris International, Inc. | | | 356,773 | | | | 31,086 | | |
Procter & Gamble Co. (The) | | | 294,133 | | | | 23,945 | | |
Visa, Inc., Class A | | | 96,816 | | | | 21,559 | | |
| | | | 247,332 | | |
Total Common Stocks (Cost $531,355) | | | 648,899 | | |
Short-Term Investment (1.7%) | |
Investment Company (1.7%) | |
Morgan Stanley Institutional Liquidity
Funds — Treasury Securities Portfolio —
Institutional Class (See Note G)
(Cost $10,972) | | | 10,972,223 | | | | 10,972 | | |
Total Investments (99.6%) (Cost $542,327) | | | 659,871 | | |
Other Assets in Excess of Liabilities (0.4%) | | | 2,637 | | |
Net Assets (100.0%) | | $ | 662,508 | | |
The accompanying notes are an integral part of the financial statements.
7
Morgan Stanley Institutional Fund, Inc.
Annual Report — December 31, 2013
Global Franchise Portfolio
Statement of Assets and Liabilities | | December 31, 2013
(000) | |
Assets: | |
Investments in Securities of Unaffiliated Issuers, at Value (Cost $531,355) | | $ | 648,899 | | |
Investment in Security of Affiliated Issuer, at Value (Cost $10,972) | | | 10,972 | | |
Total Investments in Securities, at Value (Cost $542,327) | | | 659,871 | | |
Foreign Currency, at Value (Cost $347) | | | 351 | | |
Receivable for Portfolio Shares Sold | | | 2,842 | | |
Dividends Receivable | | | 760 | | |
Tax Reclaim Receivable | | | 406 | | |
Receivable from Affiliate | | | — | @ | |
Other Assets | | | 8 | | |
Total Assets | | | 664,238 | | |
Liabilities: | |
Payable for Advisory Fees | | | 1,270 | | |
Payable for Portfolio Shares Redeemed | | | 264 | | |
Payable for Sub Transfer Agency Fees | | | 34 | | |
Payable for Sub Transfer Agency Fees — Class I | | | 17 | | |
Payable for Sub Transfer Agency Fees — Class A* | | | — | @ | |
Payable for Sub Transfer Agency Fees — Class L | | | — | @ | |
Payable for Administration Fees | | | 44 | | |
Payable for Investments Purchased | | | 19 | | |
Payable for Shareholder Services Fees — Class A* | | | 17 | | |
Payable for Distribution and Shareholder Services Fees — Class L | | | 6 | | |
Payable for Custodian Fees | | | 11 | | |
Payable for Professional Fees | | | 6 | | |
Payable for Directors' Fees and Expenses | | | 6 | | |
Payable for Transfer Agent Fees | | | 2 | | |
Payable for Transfer Agent Fees — Class I | | | 1 | | |
Payable for Transfer Agent Fees — Class A* | | | — | @ | |
Payable for Transfer Agent Fees — Class L | | | — | @ | |
Other Liabilities | | | 33 | | |
Total Liabilities | | | 1,730 | | |
Net Assets | | $ | 662,508 | | |
Net Assets Consist Of: | |
Paid-in-Capital | | $ | 544,205 | | |
Distributions in Excess of Net Investment Income | | | (1 | ) | |
Accumulated Net Realized Gain | | | 739 | | |
Unrealized Appreciation (Depreciation) on: | |
Investments | | | 117,544 | | |
Foreign Currency Translations | | | 21 | | |
Net Assets | | $ | 662,508 | | |
The accompanying notes are an integral part of the financial statements.
8
Morgan Stanley Institutional Fund, Inc.
Annual Report — December 31, 2013
Global Franchise Portfolio
Statement of Assets and Liabilities (cont'd) | | December 31, 2013
(000) | |
CLASS I: | |
Net Assets | | $ | 570,261 | | |
| Shares Outstanding $0.001 par value shares of beneficial interest (500,000,000 shares authorized) (not in 000's) | | | 27,450,229 | | |
Net Asset Value, Offering and Redemption Price Per Share | | $ | 20.77 | | |
CLASS A*: | |
Net Assets | | $ | 83,135 | | |
| Shares Outstanding $0.001 par value shares of beneficial interest (500,000,000 shares authorized) (not in 000's) | | | 4,067,459 | | |
Net Asset Value, Redemption Price Per Share | | $ | 20.44 | | |
Maximum Sales Load§§ | | | 5.25 | % | |
Maximum Sales Charge | | $ | 1.13 | | |
Maximum Offering Price Per Share | | $ | 21.57 | | |
CLASS L: | |
Net Assets | | $ | 9,112 | | |
| Shares Outstanding $0.001 par value shares of beneficial interest (500,000,000 shares authorized) (not in 000's) | | | 446,928 | | |
Net Asset Value, Offering and Redemption Price Per Share | | $ | 20.39 | | |
@ Amount is less than $500.
* Effective September 9, 2013, Class P and Class H shares were renamed Class A shares.
§§ Effective February 25, 2013, the Trustees approved the imposition of a maximum initial sales charge of 5.25% on purchases of Class A shares of the Portfolio.
The accompanying notes are an integral part of the financial statements.
9
Morgan Stanley Institutional Fund, Inc.
Annual Report — December 31, 2013
Global Franchise Portfolio
Statement of Operations | | Year Ended
December 31, 2013
(000) | |
Investment Income: | |
Dividends from Securities of Unaffiliated Issuers (Net of $589 of Foreign Taxes Withheld) | | $ | 15,960 | | |
Dividends from Security of Affiliated Issuer (Note G) | | | 2 | | |
Total Investment Income | | | 15,962 | | |
Expenses: | |
Advisory Fees (Note B) | | | 4,638 | | |
Administration Fees (Note C) | | | 468 | | |
Shareholder Services Fees — Class A* (Note D) | | | 165 | | |
Distribution and Shareholder Services Fees — Class L (Note D) | | | 60 | | |
Sub Transfer Agency Fees | | | 104 | | |
Sub Transfer Agency Fees — Class I | | | 27 | | |
Sub Transfer Agency Fees — Class A* | | | 5 | | |
Sub Transfer Agency Fees — Class L | | | — | @ | |
Professional Fees | | | 88 | | |
Custodian Fees (Note F) | | | 78 | | |
Registration Fees | | | 72 | | |
Shareholder Reporting Fees | | | 30 | | |
Transfer Agency Fees (Note E) | | | 21 | | |
Transfer Agency Fees — Class I (Note E) | | | 1 | | |
Transfer Agency Fees — Class A* (Note E) | | | 1 | | |
Transfer Agency Fees — Class L (Note E) | | | — | @ | |
Directors' Fees and Expenses | | | 13 | | |
Pricing Fees | | | 5 | | |
Other Expenses | | | 24 | | |
Total Expenses | | | 5,800 | | |
Rebate from Morgan Stanley Affiliate (Note G) | | | (25 | ) | |
Net Expenses | | | 5,775 | | |
Net Investment Income | | | 10,187 | | |
Realized Gain: | |
Investments Sold | | | 18,003 | | |
Foreign Currency Transactions | | | 375 | | |
Net Realized Gain | | | 18,378 | | |
Change in Unrealized Appreciation (Depreciation): | |
Investments | | | 73,829 | | |
Foreign Currency Translations | | | 20 | | |
Net Change in Unrealized Appreciation (Depreciation) | | | 73,849 | | |
Net Realized Gain and Change in Unrealized Appreciation (Depreciation) | | | 92,227 | | |
Net Increase in Net Assets Resulting from Operations | | $ | 102,414 | | |
@ Amount is less than $500.
* Effective September 9, 2013, Class P and Class H shares were renamed Class A shares.
The accompanying notes are an integral part of the financial statements.
10
Morgan Stanley Institutional Fund, Inc.
Annual Report — December 31, 2013
Global Franchise Portfolio
Statements of Changes in Net Assets | | Year Ended
December 31,
2013
(000) | | Year Ended
December 31,
2012
(000) | |
Increase (Decrease) in Net Assets: | |
Operations: | |
Net Investment Income | | $ | 10,187 | | | $ | 7,273 | | |
Net Realized Gain | | | 18,378 | | | | 11,092 | | |
Net Change in Unrealized Appreciation (Depreciation) | | | 73,849 | | | | 23,926 | | |
Net Increase in Net Assets Resulting from Operations | | | 102,414 | | | | 42,291 | | |
Distributions from and/or in Excess of: | |
Class I: | |
Net Investment Income | | | (9,241 | ) | | | (6,790 | ) | |
Net Realized Gain | | | (14,373 | ) | | | (6,174 | ) | |
Class A*: | |
Net Investment Income | | | (1,197 | ) | | | (552 | ) | |
Net Realized Gain | | | (2,068 | ) | | | (563 | ) | |
Class H@@@: | |
Net Investment Income | | | — | | | | (42 | )*** | |
Net Realized Gain | | | (25 | )** | | | (40 | )*** | |
Class L: | |
Net Investment Income | | | (92 | ) | | | (65 | )*** | |
Net Realized Gain | | | (239 | ) | | | (73 | )*** | |
Total Distributions | | | (27,235 | ) | | | (14,299 | ) | |
Capital Share Transactions:(1) | |
Class I: | |
Subscribed | | | 150,236 | | | | 241,173 | | |
Distributions Reinvested | | | 21,553 | | | | 11,075 | | |
Redeemed | | | (72,574 | ) | | | (85,392 | ) | |
Class A*: | |
Subscribed | | | 54,199 | | | | 20,381 | | |
Distributions Reinvested | | | 3,252 | | | | 1,084 | | |
Conversion from Class H | | | 6,820 | | | | — | | |
Redeemed | | | (24,795 | ) | | | (2,657 | ) | |
Class H@@@: | |
Subscribed | | | 3,887 | ** | | | 2,694 | *** | |
Distributions Reinvested | | | 25 | ** | | | 82 | *** | |
Conversion to Class A | | | (6,820 | )** | | | — | | |
Redeemed | | | (21 | )** | | | (3 | )*** | |
Class L: | |
Subscribed | | | 5,720 | | | | 4,857 | *** | |
Distributions Reinvested | | | 330 | | | | 138 | *** | |
Redeemed | | | (2,411 | ) | | | (500 | )*** | |
Net Increase in Net Assets Resulting from Capital Share Transactions | | | 139,401 | | | | 192,932 | | |
Total Increase in Net Assets | | | 214,580 | | | | 220,924 | | |
Net Assets: | |
Beginning of Period | | | 447,928 | | | | 227,004 | | |
End of Period (Including Distributions in Excess of Net Investment Income of $(1) and $(24)) | | $ | 662,508 | | | $ | 447,928 | | |
The accompanying notes are an integral part of the financial statements.
11
Morgan Stanley Institutional Fund, Inc.
Annual Report — December 31, 2013
Global Franchise Portfolio
Statements of Changes in Net Assets (cont'd) | | Year Ended
December 31,
2013
(000) | | Year Ended
December 31,
2012
(000) | |
(1) Capital Share Transactions: | |
Class I: | |
Shares Subscribed | | | 7,674 | | | | 13,532 | | |
Shares Issued on Distributions Reinvested | | | 1,084 | | | | 600 | | |
Shares Redeemed | | | (3,629 | ) | | | (4,849 | ) | |
Net Increase in Class I Shares Outstanding | | | 5,129 | | | | 9,283 | | |
Class A*: | |
Shares Subscribed | | | 2,785 | | | | 1,144 | | |
Shares Issued on Distributions Reinvested | | | 166 | | | | 60 | | |
Conversion from Class H | | | 354 | | | | — | | |
Shares Redeemed | | | (1,248 | ) | | | (151 | ) | |
Net Increase in Class A* Shares Outstanding | | | 2,057 | | | | 1,053 | | |
Class H@@@: | |
Shares Subscribed | | | 200 | ** | | | 149 | *** | |
Shares Issued on Distributions Reinvested | | | 1 | ** | | | 5 | *** | |
Conversion to Class A | | | (354 | )** | | | — | | |
Shares Redeemed | | | (1 | )** | | | (— | @@)*** | |
Net Increase (Decrease) in Class H Shares Outstanding | | | (154 | ) | | | 154 | | |
Class L: | |
Shares Subscribed | | | 297 | | | | 273 | *** | |
Shares Issued on Distributions Reinvested | | | 17 | | | | 8 | *** | |
Shares Redeemed | | | (121 | ) | | | (27 | )*** | |
Net Increase in Class L Shares Outstanding | | | 193 | | | | 254 | | |
@@ Amount is less than 500 shares.
@@@ Effective September 9, 2013, Class H shares converted into Class A shares.
* Effective September 9, 2013, Class P shares were renamed Class A shares.
** For the period January 1, 2013 through September 6, 2013.
*** For the period April 27, 2012 to December 31, 2012.
The accompanying notes are an integral part of the financial statements.
12
Morgan Stanley Institutional Fund, Inc.
Annual Report — December 31, 2013
Financial Highlights
Global Franchise Portfolio
| | | Class I | |
| | | Year Ended December 31, | |
Selected Per Share Data and Ratios | | 2013 | | 2012 | | 2011 | | 2010 | | 2009 | |
Net Asset Value, Beginning of Period | | $ | 18.13 | | | $ | 16.24 | | | $ | 15.29 | | | $ | 13.81 | | | $ | 10.82 | | |
Income from Investment Operations: | |
Net Investment Income† | | | 0.36 | | | | 0.40 | | | | 0.31 | | | | 0.32 | | | | 0.19 | | |
Net Realized and Unrealized Gain | | | 3.17 | | | | 2.11 | | | | 1.11 | | | | 1.62 | | | | 2.98 | | |
Total from Investment Operations | | | 3.53 | | | | 2.51 | | | | 1.42 | | | | 1.94 | | | | 3.17 | | |
Distributions from and/or in Excess of: | |
Net Investment Income | | | (0.35 | ) | | | (0.32 | ) | | | (0.30 | ) | | | (0.46 | ) | | | (0.18 | ) | |
Net Realized Gain | | | (0.54 | ) | | | (0.30 | ) | | | (0.17 | ) | | | — | | | | — | | |
Total Distributions | | | (0.89 | ) | | | (0.62 | ) | | | (0.47 | ) | | | (0.46 | ) | | | (0.18 | ) | |
Net Asset Value, End of Period | | $ | 20.77 | | | $ | 18.13 | | | $ | 16.24 | | | $ | 15.29 | | | $ | 13.81 | | |
Total Return++ | | | 19.71 | % | | | 15.38 | % | | | 9.38 | % | | | 14.07 | % | | | 29.65 | % | |
Ratios and Supplemental Data: | |
Net Assets, End of Period (Thousands) | | $ | 570,261 | | | $ | 404,762 | | | $ | 211,677 | | | $ | 89,666 | | | $ | 111,852 | | |
Ratio of Expenses to Average Net Assets (1) | | | 0.95 | %+ | | | 0.98 | %+ | | | 1.00 | %+†† | | | 1.00 | %+†† | | | 1.00 | %+ | |
Ratio of Expenses to Average Net Assets Excluding Non Operating Expenses | | | N/A | | | | N/A | | | | N/A | | | | 1.00 | %+†† | | | 1.00 | %+ | |
Ratio of Net Investment Income to Average Net Assets (1) | | | 1.79 | %+ | | | 2.21 | %+ | | | 1.87 | %+†† | | | 2.19 | %+†† | | | 1.62 | %+ | |
Ratio of Rebate from Morgan Stanley Affiliates to Average Net Assets | | | 0.00 | %§ | | | 0.01 | % | | | 0.00 | %††§ | | | 0.00 | %††§ | | | 0.00 | %§ | |
Portfolio Turnover Rate | | | 24 | % | | | 34 | % | | | 30 | % | | | 74 | % | | | 18 | % | |
(1) Supplemental Information on the Ratios to Average Net Assets: | |
Ratios Before Expense Limitation: | |
Expenses to Average Net Assets | | | N/A | | | | N/A | | | | 1.01 | %†† | | | 1.08 | %+†† | | | 1.01 | %+ | |
Net Investment Income to Average Net Assets | | | N/A | | | | N/A | | | | 1.86 | %†† | | | 2.11 | %+†† | | | 1.61 | %+ | |
† Per share amount is based on average shares outstanding.
++ Calculated based on the net asset value as of the last business day of the period.
+ The Ratios of Expenses and Net Investment Income reflect the rebate of certain Portfolio expenses in connection with the investments in Morgan Stanley affiliates during the period. The effect of the rebate on the ratios is disclosed in the above table as "Ratio of Rebate from Morgan Stanley Affiliates to Average Net Assets."
†† Reflects overall Portfolio ratios for investment income and non-class specific expenses.
§ Amount is less than 0.005%.
The accompanying notes are an integral part of the financial statements.
13
Morgan Stanley Institutional Fund, Inc.
Annual Report — December 31, 2013
Financial Highlights
Global Franchise Portfolio
| | | Class A@ | |
| | | Year Ended December 31, | |
Selected Per Share Data and Ratios | | 2013 | | 2012 | | 2011 | | 2010 | | 2009 | |
Net Asset Value, Beginning of Period | | $ | 17.86 | | | $ | 16.01 | | | $ | 15.10 | | | $ | 13.65 | | | $ | 10.71 | | |
Income from Investment Operations: | |
Net Investment Income† | | | 0.28 | | | | 0.35 | | | | 0.26 | | | | 0.28 | | | | 0.11 | | |
Net Realized and Unrealized Gain | | | 3.14 | | | | 2.09 | | | | 1.09 | | | | 1.59 | | | | 2.99 | | |
Total from Investment Operations | | | 3.42 | | | | 2.44 | | | | 1.35 | | | | 1.87 | | | | 3.10 | | |
Distributions from and/or in Excess of: | |
Net Investment Income | | | (0.30 | ) | | | (0.29 | ) | | | (0.27 | ) | | | (0.42 | ) | | | (0.16 | ) | |
Net Realized Gain | | | (0.54 | ) | | | (0.30 | ) | | | (0.17 | ) | | | — | | | | — | | |
Total Distributions | | | (0.84 | ) | | | (0.59 | ) | | | (0.44 | ) | | | (0.42 | ) | | | (0.16 | ) | |
Net Asset Value, End of Period | | $ | 20.44 | | | $ | 17.86 | | | $ | 16.01 | | | $ | 15.10 | | | $ | 13.65 | | |
Total Return++ | | | 19.42 | % | | | 15.14 | % | | | 8.98 | % | | | 13.83 | % | | | 29.24 | % | |
Ratios and Supplemental Data: | |
Net Assets, End of Period (Thousands) | | $ | 83,135 | | | $ | 35,901 | | | $ | 15,327 | | | $ | 9,653 | | | $ | 9,332 | | |
Ratio of Expenses to Average Net Assets (1) | | | 1.20 | %+^ | | | 1.23 | %+ | | | 1.25 | %+†† | | | 1.25 | %+†† | | | 1.25 | %+ | |
Ratio of Expenses to Average Net Assets Excluding Non Operating Expenses | | | N/A | | | | N/A | | | | N/A | | | | 1.25 | %+†† | | | 1.25 | %+ | |
Ratio of Net Investment Income to Average Net Assets (1) | | | 1.42 | % | | | 1.99 | %+ | | | 1.62 | %+†† | | | 1.94 | %+†† | | | 0.92 | %+ | |
Ratio of Rebate from Morgan Stanley Affiliates to Average Net Assets | | | 0.00 | %§ | | | 0.01 | % | | | 0.00 | %††§ | | | 0.00 | %††§ | | | 0.00 | %§ | |
Portfolio Turnover Rate | | | 24 | % | | | 34 | % | | | 30 | % | | | 74 | % | | | 18 | % | |
(1) Supplemental Information on the Ratios to Average Net Assets: | |
Ratios Before Expense Limitation: | |
Expenses to Average Net Assets | | | N/A | | | | N/A | | | | 1.26 | %†† | | | 1.33 | %+†† | | | 1.26 | %+ | |
Net Investment Income to Average Net Assets | | | N/A | | | | N/A | | | | 1.61 | %†† | | | 1.86 | %+†† | | | 0.91 | %+ | |
@ Effective September 9, 2013, Class P and Class H shares were renamed Class A shares.
† Per share amount is based on average shares outstanding.
‡ Amount is less than $0.005 per share.
++ Calculated based on the net asset value which does not reflect sales charges, if applicable, as of the last business day of the period.
+ The Ratios of Expenses and Net Investment Income reflect the rebate of certain Portfolio expenses in connection with the investments in Morgan Stanley affiliates during the period. The effect of the rebate on the ratios is disclosed in the above table as "Ratio of Rebate from Morgan Stanley Affiliates to Average Net Assets."
^ Effective September 16, 2013, the Adviser has agreed to limit the ratio of expenses to average net assets to the maximum ratio of 1.35% for Class A shares. Prior to September 16, 2013, the maximum ratio was 1.25% for Class A shares.
†† Reflects overall Portfolio ratios for investment income and non-class specific expenses.
§ Amount is less than 0.005%.
The accompanying notes are an integral part of the financial statements.
14
Morgan Stanley Institutional Fund, Inc.
Annual Report — December 31, 2013
Financial Highlights
Global Franchise Portfolio
| | | Class L | |
Selected Per Share Data and Ratios | | Year Ended
December 31,
2013 | | Period from
April 27, 2012^ to
December 31, 2012 | |
Net Asset Value, Beginning of Period | | $ | 17.83 | | | $ | 18.13 | | |
Income from Investment Operations: | |
Net Investment Income† | | | 0.20 | | | | 0.10 | | |
Net Realized and Unrealized Gain | | | 3.11 | | | | 0.16 | | |
Total from Investment Operations | | | 3.31 | | | | 0.26 | | |
Distributions from and/or in Excess of: | |
Net Investment Income | | | (0.21 | ) | | | (0.26 | ) | |
Net Realized Gain | | | (0.54 | ) | | | (0.30 | ) | |
Total Distributions | | | (0.75 | ) | | | (0.56 | ) | |
Net Asset Value, End of Period | | $ | 20.39 | | | $ | 17.83 | | |
Total Return++ | | | 18.78 | % | | | 1.36 | %# | |
Ratios and Supplemental Data: | |
Net Assets, End of Period (Thousands) | | $ | 9,112 | | | $ | 4,525 | | |
Ratio of Expenses to Average Net Assets | | | 1.70 | %+^^ | | | 1.73 | %+* | |
Ratio of Net Investment Income to Average Net Assets | | | 1.03 | %+ | | | 0.84 | %+* | |
Ratio of Rebate from Morgan Stanley Affiliates to Average Net Assets | | | 0.00 | %§ | | | 0.01 | %* | |
Portfolio Turnover Rate | | | 24 | % | | | 34 | %# | |
^ Commencement of Operations.
† Per share amount is based on average shares outstanding.
++ Calculated based on the net asset value as of the last business day of the period.
+ The Ratios of Expenses and Net Investment Income reflect the rebate of certain Portfolio expenses in connection with the investments in Morgan Stanley affiliates during the period. The effect of the rebate on the ratios is disclosed in the above table as "Ratio of Rebate from Morgan Stanley Affiliates to Average Net Assets."
^^ Effective September 16, 2013, the Adviser has agreed to limit the ratio of expenses to average net assets to the maximum ratio of 1.85% for Class L shares. Prior to September 16, 2013, the maximum ratio was 1.75% for Class L shares.
§ Amount is less than 0.005%.
* Annualized.
# Not Annualized.
The accompanying notes are an integral part of the financial statements.
15
Morgan Stanley Institutional Fund, Inc.
Annual Report — December 31, 2013
Notes to Financial Statements
Morgan Stanley Institutional Fund, Inc. (the "Fund") is registered under the Investment Company Act of 1940, as amended (the "Act"), as an open-end management investment company. The Fund is comprised of twenty-seven separate, active, diversified and non-diversified portfolios (individually referred to as a "Portfolio", collectively as the "Portfolios").
The accompanying financial statements relate to the Global Franchise Portfolio. The Portfolio's adviser, Morgan Stanley Investment Management Inc. (the "Adviser") and sub-advisers, Morgan Stanley Investment Management Limited ("MSIM Limited") and Morgan Stanley Investment Management Company ("MSIM Company") (together, the "Sub-Advisers"), seek long-term capital appreciation by investing primarily in equity securities of issuers located throughout the world that they believe have, among other things, resilient business franchises and growth potential. The Portfolio offers three classes of shares — Class I, Class A and Class L.
Effective September 9, 2013, Class P and Class H shares were renamed Class A shares. Effective at the close of business on November 29, 2013, the Fund suspended offering Class I, Class A and Class L shares of the Portfolio to new investors, except as follows. The Fund will continue to offer shares of the Portfolio (1) through certain retirement plan accounts, (2) to clients of certain registered investment advisors who currently offer shares of the Portfolio in their asset allocation programs, (3) to directors and trustees of the Morgan Stanley Funds, (4) to Morgan Stanley affiliates and their employees and (5) to benefit plans sponsored by Morgan Stanley and its affiliates. The Fund will continue to offer Class I, Class A and Class L shares of the Portfolio to existing shareholders. The Fund may recommence offering Class I, Class A and Class L shares of the Portfolio to new investors in the future. Any such offerings of the Portfolio's Class I, Class A and Class L shares may be limited in amount and may commence and terminate without any prior notice.
A. Significant Accounting Policies: The following significant accounting policies are in conformity with U.S. generally accepted accounting principles ("GAAP"). Such policies are consistently followed by the Fund in the preparation of its financial statements. GAAP may require management to make estimates and assumptions that affect the reported amounts and disclosures in the financial statements. Actual results may differ from those estimates.
1. Security Valuation: (1) An equity portfolio security listed or traded on an exchange is valued at its latest
reported sales price (or at the exchange official closing price if such exchange reports an official closing price), if there were no sales on a given day, the security is valued at the mean between the last reported bid and asked prices; (2) all other equity portfolio securities for which over-the-counter market quotations are readily available are valued at its latest reported sales price. In cases where a security is traded on more than one exchange, the security is valued on the exchange designated as the primary market; (3) when market quotations are not readily available, including circumstances under which the Adviser determines that the closing price, last sale price or the mean between the last reported bid and asked prices are not reflective of a security's market value, portfolio securities are valued at their fair value as determined in good faith under procedures established by and under the general supervision of the Fund's Board of Directors (the "Directors"). Occasionally, developments affecting the closing prices of securities and other assets may occur between the times at which valuations of such securities are determined (that is, close of the foreign market on which the securities trade) and the close of business of the New York Stock Exchange ("NYSE"). If developments occur during such periods that are expected to materially affect the value of such securities, such valuations may be adjusted to reflect the estimated fair value of such securities as of the close of the NYSE, as determined in good faith by the Directors or by the Adviser using a pricing service and/or procedures approved by the Directors; (4) quotations of foreign portfolio securities, other assets and liabilities and forward contracts stated in foreign currency are translated into U.S. dollar equivalents at the prevailing market rates prior to the close of the NYSE; (5) investments in mutual funds, including the Morgan Stanley Institutional Liquidity Funds, are valued at the net asset value as of the close of each business day; and (6) short-term debt securities with remaining maturities of 60 days or less at the time of purchase may be valued at amortized cost, unless the Adviser determines such valuation does not reflect the securities' market value, in which case these securities will be valued at their fair market value determined by the Adviser.
Under procedures approved by the Directors, the Fund's Adviser has formed a Valuation Committee. The Valuation Committee provides administration and oversight of the Fund's valuation policies and procedures, which are reviewed at least annually by the Directors. These
16
Morgan Stanley Institutional Fund, Inc.
Annual Report — December 31, 2013
Notes to Financial Statements (cont'd)
procedures allow the Fund to utilize independent pricing services, quotations from securities and financial instrument dealers, and other market sources to determine fair value.
The Fund has procedures to determine the fair value of securities and other financial instruments for which market prices are not readily available. Under these procedures, the Valuation Committee convenes on a regular and ad hoc basis to review such securities and considers a number of factors, including valuation methodologies and significant unobservable valuation inputs, when arriving at fair value. The Valuation Committee may employ a market-based approach which may use related or comparable assets or liabilities, recent transactions, market multiples, book values, and other relevant information for the investment to determine the fair value of the investment. An income-based valuation approach may also be used in which the anticipated future cash flows of the investment are discounted to calculate fair value. Discounts may also be applied due to the nature or duration of any restrictions on the disposition of the investments. Due to the inherent uncertainty of valuations of such investments, the fair values may differ significantly from the values that would have been used had an active market existed. The Valuation Committee employs various methods for calibrating these valuation approaches including a regular review of valuation methodologies, key inputs and assumptions, transactional back-testing or disposition analysis, and reviews of any related market activity.
2. Fair Value Measurement: Financial Accounting Standards Board ("FASB") Accounting Standards CodificationTM ("ASC") 820, "Fair Value Measurements and Disclosures" ("ASC 820"), defines fair value as the value that the Fund would receive to sell an investment or pay to transfer a liability in a timely transaction with an independent buyer in the principal market, or in the absence of a principal market the most advantageous market for the investment or liability. ASC 820 establishes a three-tier hierarchy to distinguish between (1) inputs that reflect the assumptions market participants would use in valuing an asset or liability developed based on market data obtained from sources independent of the reporting entity (observable inputs) and (2) inputs that reflect the reporting entity's own assumptions about the assumptions market participants would use in valuing an asset or
liability developed based on the best information available in the circumstances (unobservable inputs) and to establish classification of fair value measurements for disclosure purposes. Various inputs are used in determining the value of the Fund's investments. The inputs are summarized in the three broad levels listed below.
• Level 1 – unadjusted quoted prices in active markets for identical investments
• Level 2 – other significant observable inputs (including quoted prices for similar investments, interest rates, prepayment speeds, credit risk, etc.)
• Level 3 – significant unobservable inputs including the Fund's own assumptions in determining the fair value of investments. Factors considered in making this determination may include, but are not limited to, information obtained by contacting the issuer, analysts, or the appropriate stock exchange (for exchange-traded securities), analysis of the issuer's financial statements or other available documents and, if necessary, available information concerning other securities in similar circumstances
The inputs or methodology used for valuing securities are not necessarily an indication of the risk associated with investing in those securities and the determination of the significance of a particular input to the fair value measurement in its entirety requires judgment and considers factors specific to each security.
The following is a summary of the inputs used to value the Portfolio's investments as of December 31, 2013.
Investment Type | | Level 1
Unadjusted
quoted
prices
(000) | | Level 2
Other
significant
observable
inputs
(000) | | Level 3
Significant
unobservable
inputs
(000) | | Total
(000) | |
Assets: | |
Common Stocks | |
Beverages | | $ | 61,929 | | | $ | — | | | $ | — | | | $ | 61,929 | | |
Diversified Financial
Services | | | 13,520 | | | | — | | | | — | | | | 13,520 | | |
Food Products | | | 155,342 | | | | — | | | | — | | | | 155,342 | | |
Household Products | | | 68,897 | | | | — | | | | — | | | | 68,897 | | |
Industrial Conglomerates | | | 19,279 | | | | — | | | | — | | | | 19,279 | | |
Information Technology
Services | | | 53,076 | | | | — | | | | — | | | | 53,076 | | |
Insurance | | | 4,513 | | | | — | | | | — | | | | 4,513 | | |
Personal Products | | | 10,004 | | | | — | | | | — | | | | 10,004 | | |
Pharmaceuticals | | | 38,532 | | | | — | | | | — | | | | 38,532 | | |
17
Morgan Stanley Institutional Fund, Inc.
Annual Report — December 31, 2013
Notes to Financial Statements (cont'd)
Investment Type | | Level 1
Unadjusted
quoted
prices
(000) | | Level 2
Other
significant
observable
inputs
(000) | | Level 3
Significant
unobservable
inputs
(000) | | Total
(000) | |
Common Stocks (cont'd) | |
Professional Services | | $ | 9,521 | | | $ | — | | | $ | — | | | $ | 9,521 | | |
Software | | | 62,522 | | | | — | | | | — | | | | 62,522 | | |
Textiles, Apparel &
Luxury Goods | | | 22,656 | | | | — | | | | — | | | | 22,656 | | |
Tobacco | | | 129,108 | | | | — | | | | — | | | | 129,108 | | |
Total Common Stocks | | | 648,899 | | | | — | | | | — | | | | 648,899 | | |
Short-Term Investment | |
Investment Company | | | 10,972 | | | | — | | | | — | | | | 10,972 | | |
Total Assets | | $ | 659,871 | | | $ | — | | | $ | — | | | $ | 659,871 | | |
Transfers between investment levels may occur as the markets fluctuate and/or the availability of data used in an investment's valuation changes. The Portfolio recognizes transfers between the levels as of the end of the period. As of December 31, 2013, securities with a total value of approximately $381,723,000 transferred from Level 2 to Level 1. At December 31, 2012, the fair value of certain securities were adjusted due to developments which occurred between the time of the close of the foreign markets on which they trade and the close of business on the NYSE which resulted in their Level 2 classification.
3. Foreign Currency Translation and Foreign Investments: The books and records of the Portfolio are maintained in U.S. dollars. Foreign currency amounts are translated into U.S. dollars as follows:
– investments, other assets and liabilities at the prevailing rate of exchange on the valuation date;
– investment transactions and investment income at the prevailing rates of exchange on the dates of such transactions.
Although the net assets of the Portfolio are presented at the foreign exchange rates and market values at the close of the period, the Portfolio does not isolate that portion of the results of operations arising as a result of changes in the foreign exchange rates from the fluctuations arising from changes in the market prices of securities held at period end. Similarly, the Portfolio does not isolate the effect of changes in foreign exchange rates from the fluctuations arising from changes in the market prices of securities sold during the period. Accordingly, realized and unrealized foreign currency gains (losses) on investments in securities are included in the reported net realized and unrealized gains (losses) on investment transactions and balances. However, pursuant to U.S. Federal income tax
regulations, gains and losses from certain foreign currency transactions and the foreign currency portion of gains and losses realized on sales and maturities of foreign denominated debt securities are treated as ordinary income for U.S. Federal income tax purposes.
Net realized gains (losses) on foreign currency transactions represent net foreign exchange gains (losses) from foreign currency forward exchange contracts, disposition of foreign currencies, currency gains (losses) realized between the trade and settlement dates on securities transactions, and the difference between the amount of investment income and foreign withholding taxes recorded on the Portfolio's books and the U.S. dollar equivalent amounts actually received or paid. Net unrealized currency gains (losses) from valuing foreign currency denominated assets and liabilities at period end exchange rates are reflected as a component of unrealized appreciation (depreciation) on the Statement of Assets and Liabilities. The change in unrealized currency gains (losses) on foreign currency translations for the period is reflected in the Statement of Operations.
Foreign security and currency transactions may involve certain considerations and risks not typically associated with those of U.S. dollar denominated transactions as a result of, among other factors, fluctuations of exchange rates in relation to the U.S. dollar, the possibility of lower levels of governmental supervision and regulation of foreign securities markets and the possibility of political or economic instability.
The net assets of the Portfolio include foreign denominated securities and currency. Changes in currency exchange rates will affect the U.S. Dollar value of and investment income from such securities.
Governmental approval for foreign investments may be required in advance of making an investment under certain circumstances in some countries, and the extent of foreign investments in domestic companies may be subject to limitation in other countries. Foreign ownership limitations also may be imposed by the charters of individual companies to prevent, among other concerns, violations of foreign investment limitations. As a result, an additional class of shares (identified as "Foreign" in the Portfolio of Investments) may be created and offered for investment. The "local" and "foreign shares" market values may differ. In the absence of trading of the foreign
18
Morgan Stanley Institutional Fund, Inc.
Annual Report — December 31, 2013
Notes to Financial Statements (cont'd)
shares in such markets, the Portfolio values the foreign shares at the closing exchange price of the local shares.
4. Indemnifications: The Fund enters into contracts that contain a variety of indemnifications. The Fund's maximum exposure under these arrangements is unknown. However, the Fund has not had prior claims or losses pursuant to these contracts and expects the risk of loss to be remote.
5. Dividends and Distributions to Shareholders: Dividend income and distributions to shareholders are recorded on the ex-dividend date. Dividends from net investment income, if any, are declared and paid semiannually. Net realized capital gains, if any, are distributed at least annually.
6. Security Transactions, Income and Expenses: Security transactions are accounted for on the trade date (date the order to buy or sell is executed). Realized gains and losses on the sale of investment securities are determined on the specific identified cost method. Dividend income and other distributions are recorded on the ex-dividend date (except for certain foreign dividends which may be recorded as soon as the Portfolio is informed of such dividends) net of applicable withholding taxes. Interest income is recognized on the accrual basis except where collection is in doubt. Discounts are accreted and premiums are amortized over the life of the respective securities. Most expenses of the Fund can be directly attributed to a particular Portfolio. Expenses which cannot be directly attributed are apportioned among the Portfolios based upon relative net assets or other appropriate methods. Income, expenses (other than class specific expenses — distribution, transfer agency and sub transfer agency fees) and realized and unrealized gains or losses are allocated to each class of shares based upon their relative net assets.
B. Advisory/Sub-Advisory Fees: The Adviser, a wholly-owned subsidiary of Morgan Stanley, provides the Portfolio with advisory services under the terms of an Investment Advisory Agreement, paid quarterly, at the annual rate based on the average daily net assets as follows:
First $500
million | | Next $500
million | | Over $1
billion | |
| | 0.80 | % | | | 0.75 | % | | | 0.70 | % | |
For the year ended December 31, 2013, the advisory fee rate (net of rebate) was equivalent to an annual effective rate of 0.79% of the Portfolio's daily net assets.
The Adviser has agreed to reduce its advisory fee and/or reimburse the Portfolio so that total annual portfolio operating expenses, excluding certain investment related expenses, taxes, interest and other extraordinary expenses (including litigation), will not exceed 1.00% for Class I shares, 1.25% for Class A shares and 1.75% for Class L shares. Effective September 16, 2013, the Adviser has agreed to limit the ratio of expenses to average net assets to the maximum ratio of 1.35% and 1.85% for Class A and Class L shares, respectively. The fee waivers and/or expense reimbursements will continue for at least one year or until such time that the Directors act to discontinue all or a portion of such waivers and/or reimbursements when it deems such action is appropriate.
The Adviser has entered into a Sub-Advisory Agreement with the Sub-Advisers, each a wholly-owned subsidiary of Morgan Stanley. The Sub-Advisers provide the Portfolio with advisory services subject to the overall supervision of the Adviser and the Fund's Officers and Directors. The Adviser pays the Sub-Advisers on a monthly basis a portion of the net advisory fees the Adviser receives from the Portfolio.
C. Administration Fees: The Adviser also serves as Administrator to the Fund and provides administrative services pursuant to an Administration Agreement for an annual fee, accrued daily and paid monthly, of 0.08% of the Portfolio's average daily net assets. Under a Sub-Administration Agreement between the Administrator and State Street Bank and Trust Company ("State Street"), State Street provides certain administrative services to the Fund. For such services, the Administrator pays State Street a portion of the fee the Administrator receives from the Portfolio.
D. Distribution and Shareholder Services Fees: Morgan Stanley Distribution, Inc. ("MSDI" or the "Distributor"), a wholly-owned subsidiary of the Adviser and an indirect subsidiary of Morgan Stanley, serves as the Fund's Distributor of Portfolio shares pursuant to a Distribution Agreement. The Fund has adopted a Shareholder Services Plan with respect to Class A shares pursuant to Rule 12b-1 under the Act. Under the Shareholder Services Plan, the Portfolio pays the Distributor a shareholder services fee, accrued daily and paid monthly, at an annual rate of 0.25% of the Portfolio's average daily net assets attributable to Class A shares.
The Fund has adopted a Distribution and Shareholder Services Plan with respect to Class L shares pursuant to Rule 12b-1 under the Act. Under the Distribution and Shareholder Services Plan, the Portfolio pays the Distributor a distribution fee,
19
Morgan Stanley Institutional Fund, Inc.
Annual Report — December 31, 2013
Notes to Financial Statements (cont'd)
accrued daily and paid monthly, at an annual rate of 0.50% and a shareholder services fee, accrued daily and paid monthly, at an annual rate of 0.25% of the Portfolio's average daily net assets attributable to Class L shares.
The distribution and shareholder services fees are used to support the expenses associated with servicing and maintaining accounts. The Distributor may compensate other parties for providing shareholder support services to investors who purchase Class A and Class L shares.
E. Dividend Disbursing and Transfer Agent: The Fund's dividend disbursing and transfer agent was Morgan Stanley Services Company Inc. ("Morgan Stanley Services"). Pursuant to a Transfer Agency Agreement, the Fund paid Morgan Stanley Services a fee based on the number of classes, accounts and transactions relating to the Portfolios of the Fund. Effective July 1, 2013, the Directors approved changing the transfer agent to Boston Financial Data Services, Inc.
F. Custodian Fees: State Street (the "Custodian") serves as Custodian for the Fund in accordance with a Custodian Agreement. The Custodian holds cash, securities, and other assets of the Fund as required by the Act. Custody fees are payable monthly based on assets held in custody, investment purchases and sales activity and account maintenance fees, plus reimbursement for certain out-of-pocket expenses.
G. Security Transactions and Transactions with Affiliates: For the year ended December 31, 2013, purchases and sales of investment securities for the Portfolio, other than long-term U.S. Government securities and short-term investments, were approximately $260,987,000 and $133,578,000, respectively. There were no purchases and sales of long-term U.S. Government securities for the year ended December 31, 2013.
The Portfolio invests in the Institutional Class of the Morgan Stanley Institutional Liquidity Funds — Treasury Securities Portfolio (the "Liquidity Funds"), an open-end management investment company managed by the Adviser. Advisory fees paid by the Portfolio are reduced by an amount equal to its pro-rata share of the advisory and administration fees paid by the Portfolio due to its investment in the Liquidity Funds. For the year ended December 31, 2013, advisory fees paid were reduced by approximately $25,000 relating to the Portfolio's investment in the Liquidity Funds.
A summary of the Portfolio's transactions in shares of the Liquidity Funds during the year ended December 31, 2013 is as follows:
Value
December 31,
2012
(000) | | Purchases
at Cost
(000) | | Sales
(000) | | Dividend
Income
(000) | | Value
December 31,
2013
(000) | |
| $ | 18,510 | | | $ | 199,072 | | | $ | 206,610 | | | $ | 2 | | | $ | 10,972 | | |
During the year ended December 31, 2013, the Portfolio incurred approximately $1,000 in brokerage commissions with Morgan Stanley & Co., LLC, an affiliate of the Adviser, Sub-Advisers, Administrator and Distributor, for portfolio transactions executed on behalf of the Portfolio.
From January 1, 2013 to June 30, 2013, the Portfolio incurred less than $500 in brokerage commissions with Citigroup, Inc., and its affiliated broker-dealers, which may be deemed affiliates of the Adviser, Sub-Advisers, Distributor and Administrator under Section 17 of the Act, for portfolio transactions executed on behalf of the Portfolio. Citigroup, Inc. and its affiliated broker-dealers ceased to be affiliates of the Portfolio pursuant to Section 17 of the Act as of July 1, 2013.
H. Federal Income Taxes: It is the Portfolio's intention to continue to qualify as a regulated investment company and distribute all of its taxable and tax-exempt income. Accordingly, no provision for Federal income taxes is required in the financial statements.
The Portfolio may be subject to taxes imposed by countries in which it invests. Such taxes are generally based on income and/or capital gains earned or repatriated. Taxes are accrued based on net investment income, net realized gains and net unrealized appreciation as such income and/or gains are earned. Taxes may also be based on transactions in foreign currency and are accrued based on the value of investments denominated in such currency.
FASB ASC 740-10 "Income Taxes — Overall" sets forth a minimum threshold for financial statement recognition of the benefit of a tax position taken or expected to be taken in a tax return. Management has concluded there are no significant uncertain tax positions that would require recognition in the financial statements. If applicable, the Portfolio recognizes interest accrued related to unrecognized tax benefits in "Interest Expense" and penalties in ''Other Expenses" in the Statement of Operations. The Portfolio files tax returns with the U.S. Internal Revenue Service, New York and various states. Generally, each of the tax years in the four-year period ended December 31, 2013, remains subject to examination by taxing authorities.
20
Morgan Stanley Institutional Fund, Inc.
Annual Report — December 31, 2013
Notes to Financial Statements (cont'd)
The tax character of distributions paid may differ from the character of distributions shown in the Statements of Changes in Net Assets due to short-term capital gains being treated as ordinary income for tax purposes. The tax character of distributions paid during fiscal years 2013 and 2012 was as follows:
2013
Distributions
Paid From: | | 2012
Distributions
Paid From: | |
Ordinary
Income
(000) | | Long-Term
Capital Gain
(000) | | Ordinary
Income
(000) | | Long-Term
Capital Gain
(000) | |
| $ | 12,961 | | | $ | 14,274 | | | $ | 7,414 | | | $ | 6,886 | | |
The amount and character of income and gains to be distributed are determined in accordance with income tax regulations which may differ from GAAP. These book/tax differences are either considered temporary or permanent in nature.
Temporary differences are primarily due to differing book and tax treatments in the timing of the recognition of gains (losses) on certain investment transactions and the timing of the deductibility of certain expenses.
Permanent differences, primarily due to differing treatments of gains (losses) related to foreign currency transactions and a dividend redesignation, resulted in the following reclassifications among the components of net assets at December 31, 2013:
Distributions in
Excess of
Net Investment
Income
(000) | | Accumulated
Net Realized
Gain
(000) | | Paid-in-
Capital
(000) | |
| $ | 366 | | | ($ | 366 | ) | | $ | — | | |
At December 31, 2013, the components of distributable earnings for the Portfolio on a tax basis were as follows:
Undistributed
Ordinary
Income
(000) | | Undistributed
Long-Term
Capital Gain
(000) | |
| $ | — | | | $ | 4,036 | | |
At December 31, 2013, the aggregate cost for Federal income tax purposes is $543,989,000. The aggregate gross unrealized appreciation is $117,037,000 and the aggregate gross unrealized depreciation is $1,155,000 resulting in net unrealized appreciation of $115,882,000.
At December 31, 2013, the Portfolio had available capital loss carryforwards to offset future net capital gains, to the extent provided by regulations, of approximately $274,000 which will expire on December 31, 2017. These losses may be subject to limitation under IRC Section 382 in future years.
To the extent that capital loss carryforwards are used to offset any future capital gains realized during the carryover period as provided by U.S. Federal income tax regulations, no capital gains tax liability will be incurred by the Portfolio for gains realized and not distributed. To the extent that capital gains are offset, such gains will not be distributed to the shareholders. During the year ended December 31, 2013, the Portfolio utilized capital loss carryforwards for U. S. Federal income tax purposes of approximately $1,588,000.
Capital losses and specified ordinary losses, including currency losses, incurred after October 31 but within the taxable year are deemed to arise on the first day of the Portfolio's next taxable year. For the year ended December 31, 2013, the Portfolio deferred to January 1, 2014 for U.S. Federal income tax purposes the following losses:
Post-October
Currency and
Specified
Ordinary
Losses
(000) | | Post-October
Capital Losses
(000) | |
| | — | | | $ | 1,358 | | |
I. Other (unaudited): At December 31, 2013, the Portfolio had otherwise unaffiliated record owners of 10% or greater. Investment activities of these shareholders could have a material impact on the Portfolio. The aggregate percentage of such owners was 15% and 52%, for Class I and Class A shares, respectively.
J. Results of Special Shareholder Meeting (unaudited): On June 5, 2013, a Joint Special Shareholder Meeting was held for Class H shareholders of the Portfolio to approve the Articles of Amendment to the Fund's Articles of Amendment and Restatement and a Plan of Reclassification for the Portfolio pursuant to which Class H shares would be reclassified as Class P shares. The results with respect to this proposal were as follows:
| For | | Against | | Abstain | |
| | 88,797 | | | | 0 | | | | 20,804 | | |
K. Accounting Pronouncement: In June 2013, FASB issued Accounting Standards Update 2013-08 Financial Services — Investment Companies (Topic 946) — Amendments to the Scope, Measurement, and Disclosure Requirements ("ASU 2013-08") which is effective for interim and annual reporting periods in fiscal years that begin after December 15, 2013. ASU 2013-08 sets forth a methodology for determining whether an entity should be characterized as an investment company and prescribes fair value accounting
21
Morgan Stanley Institutional Fund, Inc.
Annual Report — December 31, 2013
Notes to Financial Statements (cont'd)
for an investment company's non-controlling ownership interest in another investment company. FASB has determined that a fund registered under the Investment Company Act of 1940 automatically meets ASU 2013-08's criteria for an investment company. Although still evaluating the potential impacts of ASU 2013-08 to the Portfolio, management expects that the impact of the Portfolio's adoption will be limited to additional financial statement disclosures.
22
Morgan Stanley Institutional Fund, Inc.
Annual Report — December 31, 2013
Report of Independent Registered Public Accounting Firm
To the Shareholders and Board of Directors of
Morgan Stanley Institutional Fund, Inc. —
Global Franchise Portfolio
We have audited the accompanying statement of assets and liabilities, including the portfolio of investments, of Global Franchise Portfolio (one of the portfolios constituting Morgan Stanley Institutional Fund, Inc.) (the "Portfolio") as of December 31, 2013, and the related statement of operations for the year then ended, the statements of changes in net assets for each of the two years in the period then ended, and the financial highlights for each of the periods indicated therein. These financial statements and financial highlights are the responsibility of the Portfolio's management. Our responsibility is to express an opinion on these financial statements and financial highlights based on our audits.
We conducted our audits in accordance with the standards of the Public Company Accounting Oversight Board (United States). Those standards require that we plan and perform the audit to obtain reasonable assurance about whether the financial statements and financial highlights are free of material misstatement. We were not engaged to perform an audit of the Portfolio's internal control over financial reporting. Our audits included consideration of internal control over financial reporting as a basis for designing audit procedures that are appropriate in the circumstances, but not for the purpose of expressing an opinion on the effectiveness of the Portfolio's internal control over financial reporting. Accordingly, we express no such opinion. An audit also includes examining, on a test basis, evidence supporting the amounts and disclosures in the financial statements and financial highlights, assessing the accounting principles used and significant estimates made by management, and evaluating the overall financial statement presentation. Our procedures included confirmation of securities owned as of December 31, 2013, by correspondence with the custodian or by other appropriate auditing procedures where replies from others were not received. We believe that our audits provide a reasonable basis for our opinion.
In our opinion, the financial statements and financial highlights referred to above present fairly, in all material respects, the financial position of Global Franchise Portfolio (one of the portfolios constituting Morgan Stanley Institutional Fund, Inc.) at December 31, 2013, the results of its operations for the year then ended, the changes in its net assets for each of the two years in the period then ended, and the financial highlights for each of the periods indicated therein, in conformity with U.S. generally accepted accounting principles.

Boston, Massachusetts
February 26, 2014
23
Morgan Stanley Institutional Fund, Inc.
Annual Report — December 31, 2013
Federal Tax Notice (unaudited)
For Federal income tax purposes, the following information is furnished with respect to the distributions paid by the Portfolio during its taxable year ended December 31, 2013. For corporate shareholders, 31.7% of the dividends qualified for the dividends received deduction.
The Portfolio designated and paid approximately $14,274,000 as a long-term capital gain distribution.
For Federal income tax purposes, the following information is furnished with respect to the Portfolio's earnings for the taxable year ended December 31, 2013. When distributed, certain earnings may be subject to a maximum tax rate of 15% as provided for the Jobs and Growth Tax Relief Reconciliation Act of 2003. The Portfolio designated up to a maximum of approximately $13,549,000 as taxable at this lower rate.
The Portfolio intends to pass through foreign tax credits of approximately $589,000, and has derived net income from sources within foreign countries amounting to approximately $11,940,000.
In January, the Portfolio provides tax information to shareholders for the preceding calendar year.
24
Morgan Stanley Institutional Fund, Inc.
Annual Report — December 31, 2013
U.S. Privacy Policy (unaudited)
AN IMPORTANT NOTICE CONCERNING OUR U.S. PRIVACY POLICY
This privacy notice describes the U.S. privacy policy of Morgan Stanley Distribution, Inc., and the Morgan Stanley family of mutual funds ("us", "our", "we").
We are required by federal law to provide you with notice of our U.S. privacy policy ("Policy"). This Policy applies to both our current and former clients unless we state otherwise and is intended for individual clients who purchase products or receive services from us for personal, family or household purposes. This Policy is not applicable to partnerships, corporations, trusts or other non-individual clients or account holders, nor is this Policy applicable to individuals who are either beneficiaries of a trust for which we serve as trustee or participants in an employee benefit plan administered or advised by us. This Policy is, however, applicable to individuals who select us to be a custodian of securities or assets in individual retirement accounts, 401(k) accounts, or accounts subject to the Uniform Gifts to Minors Act.
This notice sets out our business practices to protect your privacy; how we collect and share personal information about you; and how you can limit our sharing or certain uses by others of this information. We may amend this Policy at any time, and will inform you of any changes to our Policy as required by law.
WE RESPECT YOUR PRIVACY
We appreciate that you have provided us with your personal financial information and understand your concerns about your information. We strive to safeguard the information our clients entrust to us. Protecting the confidentiality and security of client information is an important part of how we conduct our business.
This notice describes what personal information we collect about you, how we collect it, when we may share it with others, and how certain others may use it. It discusses the steps you may take to limit our sharing of certain information about you with our affiliated companies, including, but not limited to our affiliated banking businesses, brokerage firms and credit service affiliates. It also discloses how you may limit our affiliates' use of shared information for marketing purposes.
Throughout this Policy, we refer to the nonpublic information that personally identifies you as "personal information." We also use the term "affiliated company" in this notice. An affiliated company is a company in our family of companies and includes companies with the Morgan Stanley name. These affiliated companies are financial institutions such as broker-dealers, banks, investment advisers and credit card issuers. We refer to any company that is not an affiliated company as a nonaffiliated third party. For purposes of Section 5 of this notice, and your ability to limit certain uses of personal information by our affiliates, this notice applies to the use of personal information by our affiliated companies.
1. WHAT PERSONAL INFORMATION DO WE COLLECT FROM YOU?
We may collect the following types of information about you: (i) information provided by you, including information from applications and other forms we receive from you, (ii) information about your transactions with us or our affiliates, (iii) information about your transactions with nonaffiliated third parties, (iv) information from consumer reporting agencies, (v) information obtained from our websites, and (vi) information obtained from other sources. For example:
• We collect information such as your name, address, e-mail address, telephone/fax numbers, assets, income and investment objectives through applications and other forms you submit to us.
• We may obtain information about account balances, your use of account(s) and the types of products and services you prefer to receive from us through your dealings and transactions with us and other sources.
• We may obtain information about your creditworthiness and credit history from consumer reporting agencies.
• We may collect background information from and through third-party vendors to verify representations you have made and to comply with various regulatory requirements.
2. WHEN DO WE DISCLOSE PERSONAL INFORMATION WE COLLECT ABOUT YOU?
We may disclose personal information we collect about you in each of the categories listed above to affiliated and nonaffiliated third parties.
25
Morgan Stanley Institutional Fund, Inc.
Annual Report — December 31, 2013
U.S. Privacy Policy (unaudited) (cont'd)
a. Information we disclose to affiliated companies.
We may disclose personal information that we collect about you to our affiliated companies to manage your account(s) effectively, to service and process your transactions, and to let you know about products and services offered by us and affiliated companies, to manage our business, and as otherwise required or permitted by law. Offers for products and services from affiliated companies are developed under conditions designed to safeguard your personal information.
b. Information we disclose to third parties.
We may disclose personal information that we collect about you to nonaffiliated third parties to provide marketing services on our behalf or to other financial institutions with whom we have joint marketing agreements. We may also disclose all of the information we collect to other nonaffiliated third parties for our everyday business purposes, such as to process transactions, maintain account(s), respond to court orders and legal investigations, report to credit bureaus, offer our own products and services, protect against fraud, for institutional risk control, to perform services on our behalf, and as otherwise required or permitted by law.
When we share personal information about you with a nonaffiliated third party, they are required to limit their use of personal information about you to the particular purpose for which it was shared and they are not allowed to share personal information about you with others except to fulfill that limited purpose or as may be permitted or required by law.
3. HOW DO WE PROTECT THE SECURITY AND CONFIDENTIALITY OF PERSONAL INFORMATION WE COLLECT ABOUT YOU?
We maintain physical, electronic and procedural security measures that comply with applicable law and regulations to help safeguard the personal information we collect about you. We have internal policies governing the proper handling of client information by employees. Third parties that provide support or marketing services on our behalf may also receive personal information about you, and we require them to adhere to appropriate security standards with respect to such information.
4. HOW CAN YOU LIMIT OUR SHARING CERTAIN PERSONAL INFORMATION ABOUT YOU WITH OUR AFFILIATED COMPANIES FOR ELIGIBILITY DETERMINATION?
By following the opt-out procedures in Section 6 below, you may limit the extent to which we share with our affiliated companies, personal information that was collected to determine your eligibility for products and services such as your credit reports and other information that you have provided to us or that we may obtain from third parties ("eligibility information"). Eligibility information does not include your identification information or personal information pertaining to our transactions or experiences with you. Please note that, even if you direct us not to share eligibility information with our affiliated companies, we may still share your personal information, including eligibility information, with our affiliated companies under circumstances that are permitted under applicable law, such as to process transactions or to service your account.
5. HOW CAN YOU LIMIT THE USE OF CERTAIN PERSONAL INFORMATION ABOUT YOU BY OUR AFFILIATED COMPANIES FOR MARKETING?
By following the opt-out instructions in Section 6 below, you may limit our affiliated companies from marketing their products or services to you based on personal information we disclose to them. This information may include, for example, your income and account history with us. Please note that, even if you choose to limit our affiliated companies from using personal information about you that we may share with them for marketing their products and services to you, our affiliated companies may use your personal information that they obtain from us to market to you in circumstances permitted by law, such as if the affiliated party has its own relationship with you.
26
Morgan Stanley Institutional Fund, Inc.
Annual Report — December 31, 2013
U.S. Privacy Policy (unaudited) (cont'd)
6. HOW CAN YOU SEND US AN OPT-OUT INSTRUCTION?
If you wish to limit our sharing of eligibility information about you with our affiliated companies, or our affiliated companies' use of personal information for marketing purposes, as described in this notice, you may do so by:
• Calling us at (800) 548-7786
Monday–Friday between 8a.m. and 5p.m. (EST)
• Writing to us at the following address:
Boston Financial Data Services, Inc.
c/o Privacy Coordinator
P.O. Box 219804
Kansas City, Missouri 64121
If you choose to write to us, your request should include: your name, address, telephone number and account number(s) to which the opt-out applies and whether you are opting out with respect to sharing of eligibility information (Section 4 above), or information used for marketing (Section 5 above), or both. Written opt-out requests should not be sent with any other correspondence. In order to process your request, we require that the request be provided by you directly and not through a third party. Once you have informed us about your privacy preferences, your opt-out preference will remain in effect with respect to this Policy (as it may be amended) until you notify us otherwise. If you are a joint account owner, we will accept instructions from any one of you and apply those instructions to the entire account.
Please understand that if you limit our sharing or our affiliated companies' use of personal information, you and any joint account holder(s) may not receive information about our affiliated companies' products and services, including products or services that could help you manage your financial resources and achieve your investment objectives.
If you have more than one account or relationship with us, please specify the accounts to which you would like us to apply your privacy choices. If you have accounts or relationships with our affiliates, you may receive multiple privacy policies from them, and will need to separately notify those companies of your privacy choices for those accounts or relationships.
7. WHAT IF AN AFFILIATED COMPANY BECOMES A NONAFFILIATED THIRD PARTY?
If, at any time in the future, an affiliated company becomes a nonaffiliated third party, further disclosures of personal information made to the former affiliated company will be limited to those described in Section 2(b) above relating to nonaffiliated third parties. If you elected under Section 6 to limit disclosures we make to affiliated companies, or use of personal information by affiliated companies, your election will not apply to use by any former affiliated company of your personal information in their possession once it becomes a nonaffiliated third party.
SPECIAL NOTICE TO RESIDENTS OF VERMONT
The following section supplements our Policy with respect to our individual clients who have a Vermont address and supersedes anything to the contrary in the above Policy with respect to those clients only.
The State of Vermont requires financial institutions to obtain your consent prior to sharing personal information that they collect about you with nonaffiliated third parties, or eligibility information with affiliated companies, other than in certain limited circumstances. Except as permitted by law, we will not share personal information we collect about you with nonaffiliated third parties or eligibility information with affiliated companies, unless you provide us with your written consent to share such information.
SPECIAL NOTICE TO RESIDENTS OF CALIFORNIA
The following section supplements our Policy with respect to our individual clients who have a California address and supersedes anything to the contrary in the above Policy with respect to those clients only.
In response to a California law, if your account has a California home address, your personal information will not be disclosed to nonaffiliated third parties except as permitted by applicable California law, and we will limit sharing such personal information with our affiliates to comply with California privacy laws that apply to us.
27
Morgan Stanley Institutional Fund, Inc.
Annual Report — December 31, 2013
Director and Officer Information (unaudited)
Independent Director:
Name, Age and Address of
Independent Director | | Position(s)
Held with
Registrant | | Length of Time
Served* | | Principal Occupation(s) During Past 5 Years | | Number of
Portfolios in
Fund Complex
Overseen by
Independent
Director** | | Other Directorships
Held by Independent
Director*** | |
Frank L. Bowman (69)
c/o Kramer Levin Naftalis &
Frankel LLP
Counsel to the Independent
Directors
1177 Avenue of the Americas
New York, NY 10036 | | Director | | Since
August
2006 | | President, Strategic Decisions, LLC (consulting) (since February 2009); Director or Trustee of various Morgan Stanley Funds (since August 2006); Chairperson of the Insurance Sub-Committee of the Compliance and Insurance Committee (since February 2007); served as President and Chief Executive Officer of the Nuclear Energy Institute (policy organization) (February 2005-November 2008); retired as Admiral, U.S. Navy after serving over 38 years on active duty including 8 years as Director of the Naval Nuclear Propulsion Program in the Department of the Navy and the U.S. Department of Energy (1996-2004); served as Chief of Naval Personnel (July 1994-September 1996); and on the Joint Staff as Director of Political Military Affairs (June 1992-July 1994); knighted as Honorary Knight Commander of the Most Excellent Order of the British Empire; awarded the Officier de l'Orde National du Mérite by the French Government; elected to the National Academy of Engineering (2009). | | | 98 | | | Director of BP p.l.c.; Director of Naval and Nuclear Technologies LLP; Director of the Armed Services YMCA of the USA and the U.S. Naval Submarine League; Director of the American Shipbuilding Suppliers Association; Member of the National Security Advisory Council of the Center for U.S. Global Engagement and a member of the CNA Military Advisory Board; Chairman of the Charity J Street Cup Golf; Trustee of Fairhaven United Methodist Church. | |
Michael Bozic (73)
c/o Kramer Levin Naftalis & Frankel LLP
Counsel to the Independent Directors
1177 Avenue of the Americas New York, NY 10036 | | Director | | Since
April
1994 | | Private investor and a member of the advisory board of American Road Group LLC (retail) (since June 2000); Chairperson of the Compliance and Insurance Committee (since October 2006); Director or Trustee of various Morgan Stanley Funds (since April 1994); formerly, Chairperson of the Insurance Committee (July 2006-September 2006); Vice Chairman of Kmart Corporation (December 1998-October 2000); Chairman and Chief Executive Officer of Levitz Furniture Corporation (November 1995-November 1998) and President and Chief Executive Officer of Hills Department Stores (May 1991-July 1995); variously Chairman, Chief Executive Officer, President and Chief Operating Officer (1987-1991) of the Sears Merchandise Group of Sears, Roebuck & Co. | | | 100 | | | Trustee and member of the Hillsdale College Board of Trustees. | |
Kathleen A. Dennis (60)
c/o Kramer Levin Naftalis & Frankel LLP
Counsel to the Independent Directors
1177 Avenue of the Americas New York, NY 10036 | | Director | | Since
August
2006 | | President, Cedarwood Associates (mutual fund and investment management consulting) (since July 2006); Chairperson of the Money Market and Alternatives Sub-Committee of the Investment Committee (since October 2006) and Director or Trustee of various Morgan Stanley Funds (since August 2006); formerly, Senior Managing Director of Victory Capital Management (1993-2006). | | | 98 | | | Director of various non-profit organizations. | |
Dr. Manuel H. Johnson (65)
c/o Johnson Smick
International, Inc.
220 I Street, NE-Suite 200
Washington, D.C. 20002 | | Director | | Since
July
1991 | | Senior Partner, Johnson Smick International, Inc. (consulting firm); Chairperson of the Investment Committee (since October 2006) and Director or Trustee of various Morgan Stanley Funds (since July 1991); Co-Chairman and a founder of the Group of Seven Council (G7C) (international economic commission); formerly, Chairperson of the Audit Committee (July 1991-September 2006); Vice Chairman of the Board of Governors of the Federal Reserve System and Assistant Secretary of the U.S. Treasury. | | | 101 | | | Director of NVR, Inc. (home construction). | |
28
Morgan Stanley Institutional Fund, Inc.
Annual Report — December 31, 2013
Director and Officer Information (unaudited) (cont'd)
Independent Director: (cont'd)
Name, Age and Address of
Independent Director | | Position(s)
Held with
Registrant | | Length of Time
Served* | | Principal Occupation(s) During Past 5 Years | | Number of
Portfolios in
Fund Complex
Overseen by
Independent
Director** | | Other Directorships
Held by Independent
Director*** | |
Joseph J. Kearns (71)
c/o Kearns & Associates LLC PMB754
22631 Pacific Coast Highway
Malibu, CA 90265 | | Director | | Since
August
1994 | | President, Kearns & Associates LLC (investment consulting); Chairperson of the Audit Committee (since October 2006) and Director or Trustee of various Morgan Stanley Funds (since August 1994); formerly, Deputy Chairperson of the Audit Committee (July 2003-September 2006) and Chairperson of the Audit Committee of various Morgan Stanley Funds (since August 1994); CFO of the J. Paul Getty Trust. | | | 101 | | | Director of Electro Rent Corporation (equipment leasing) and The Ford Family Foundation. | |
Michael F. Klein (55)
c/o Kramer Levin Naftalis & Frankel LLP
Counsel to the Independent Directors
1177 Avenue of the Americas New York, NY 10036 | | Director | | Since
August
2006 | | Managing Director, Aetos Capital, LLC (since March 2000); Co-President and Co-Chief Executive Officer of Aetos Capital LLC (since August 2013); Aetos Alternatives Management, LLC (since January 2004); Chairperson of the Fixed Income Sub-Committee of the Investment Committee (since October 2006) and Director or Trustee of various Morgan Stanley Funds (since August 2006); formerly, Managing Director, Morgan Stanley & Co. Inc. and Morgan Stanley Dean Witter Investment Management, President, various Morgan Stanley Funds (June 1998-March 2000) and Principal, Morgan Stanley & Co. Inc. and Morgan Stanley Dean Witter Investment Management (August 1997-December 1999). | | | 98 | | | Director of certain investment funds managed or sponsored by Aetos Capital, LLC. Director of Sanitized AG and Sanitized Marketing AG (specialty chemicals). | |
Michael E. Nugent (77)
522 Fifth Avenue
New York, NY 10036 | | Chairperson
of the
Board and Director | | Chairperson of the Boards since July 2006 and Director since July 1991 | | Chairperson of the Boards of various Morgan Stanley Funds (since July 2006); Chairperson of the Closed-End Fund Committee (since June 2012) and Director or Trustee of various Morgan Stanley Funds (since July 1991); formerly, Chairperson of the Insurance Committee (until July 2006); General Partner, Triumph Capital, L.P. (private investment partnership) (1988-2013). | | | 100 | | | None. | |
W. Allen Reed (66)
c/o Kramer Levin Naftalis & Frankel LLP
Counsel to the Independent Directors
1177 Avenue of the Americas New York, NY 10036 | | Director | | Since
August
2006 | | Chairperson of the Equity Sub-Committee of the Investment Committee (since October 2006) and Director or Trustee of various Morgan Stanley Funds (since August 2006); formerly, President and CEO of General Motors Asset Management; Chairman and Chief Executive Officer of the GM Trust Bank and Corporate Vice President of General Motors Corporation (August 1994-December 2005). | | | 98 | | | Director of Temple-Inland Industries (packaging and forest products); Director of Legg Mason, Inc. and Director of the Auburn University Foundation. | |
Fergus Reid (81)
c/o Joe Pietryka, Inc.
85 Charles Colman Blvd. Pawling, NY 12564 | | Director | | Since
June
1992 | | Chairman, Joe Pietryka, Inc.; Chairperson of the Governance Committee and Director or Trustee of various Morgan Stanley Funds (since June 1992). | | | 101 | | | Through December 31, 2012, Trustee and Director of certain Investment companies in the JPMorgan Fund Complex. | |
29
Morgan Stanley Institutional Fund, Inc.
Annual Report — December 31, 2013
Director and Officer Information (unaudited) (cont'd)
Interested Director:
Name, Age and Address of
Interested Director | | Position(s)
Held with
Registrant | | Length of Time
Served* | | Principal Occupation(s) During Past 5 Years | | Number of
Portfolios in
Fund Complex
Overseen by
Interested
Director** | | Other Directorships
Held by Interested
Director*** | |
James F. Higgins (66)
One New York Plaza
New York, NY 10004 | | Director | | Since
June
2000 | | Director or Trustee of various Morgan Stanley Funds (since June 2000); Senior Advisor of Morgan Stanley (since August 2000). | | | 99 | | | Formerly, Director of AXA Financial, Inc. and AXA Equitable Life Insurance Company (2002-2011) and Director of AXA MONY Life Insurance Company and AXA MONY Life Insurance Company of America (2004-2011). | |
* Each Director serves an indefinite term, until his or her successor is elected.
** The Fund Complex includes (as of December 31, 2013) all open-end and closed-end funds (including all of their portfolios) advised by Morgan Stanley Investment Management Inc. (the "Adviser") and any funds that have an adviser that is an affiliated person of the Adviser (including, but not limited to, Morgan Stanley AIP GP LP).
*** This includes any directorships at public companies and registered investment companies held by the Director at any time during the past five years.
30
Morgan Stanley Institutional Fund, Inc.
Annual Report — December 31, 2013
Director and Officer Information (unaudited) (cont'd)
Executive Officers:
Name, Age and Address of Executive Officer | | Position(s) Held
with
Registrant | | Length of Time
Served* | | Principal Occupation(s) During Past 5 Years | |
John H. Gernon (50)
522 Fifth Avenue
New York, NY 10036 | | President and Principal Executive Officer—Equity, Fixed Income and AIP Funds | | Since
September
2013 | | President and Principal Executive Officer of the Equity and Fixed Income Funds and the Morgan Stanley AIP Funds (since September 2013) in the Fund Complex. Managing Director of the Adviser. | |
Stefanie V. Chang Yu (47)
522 Fifth Avenue
New York, NY 10036 | | Chief Compliance Officer | | Since
January
2014 | | Managing Director of the Adviser and various entities affiliated with the Adviser; Chief Compliance Officer of various Morgan Stanley Funds and the Adviser (since January 2014). Formerly, Vice President of various Morgan Stanley Funds (December 1997-January 2014). | |
Joseph C. Benedetti (48)
522 Fifth Avenue
New York, NY 10036 | | Vice President | | Since
January
2014 | | Managing Director of the Adviser and various entities affiliated with the Adviser; Vice President of various Morgan Stanley Funds (since January 2014). Formerly, Assistant Secretary of various Morgan Stanley Funds (October 2004-January 2014). | |
Francis J. Smith (48)
522 Fifth Avenue
New York, NY 10036 | | Treasurer and Principal Financial Officer | | Treasurer since July 2003 and Principal Financial Officer since September 2002 | | Executive Director of the Adviser and various entities affiliated with the Adviser; Treasurer and Principal Financial Officer of various Morgan Stanley Funds (since July 2003). | |
Mary E. Mullin (46)
522 Fifth Avenue
New York, NY 10036 | | Secretary | | Since
June
1999 | | Executive Director of the Adviser and various entities affiliated with the Adviser; Secretary of various Morgan Stanley Funds (since June 1999). | |
* Each officer serves an indefinite term, until his or her successor is elected.
31
Morgan Stanley Institutional Fund, Inc.
Annual Report — December 31, 2013
Adviser and Administrator
Morgan Stanley Investment Management Inc.
522 Fifth Avenue
New York, New York 10036
Sub-Advisers
Morgan Stanley Investment Management Limited
25 Cabot Square, Canary Wharf
London, E14 4QA, England
Morgan Stanley Investment Management Company
23 Church Street
16-01 Capital Square 049481 Singapore
Distributor
Morgan Stanley Distribution, Inc.
522 Fifth Avenue
New York, New York 10036
Dividend Disbursing and Transfer Agent
Boston Financial Data Services, Inc.
2000 Crown Colony Drive
Quincy, Massachusetts 02169
Custodian
State Street Bank and Trust Company
One Lincoln Street
Boston, Massachusetts 02111
Legal Counsel
Dechert LLP
1095 Avenue of the Americas
New York, New York 10036
Counsel to the Independent Directors
Kramer Levin Naftalis & Frankel LLP
1177 Avenue of the Americas
New York, New York 10036
Independent Registered Public Accounting Firm
Ernst & Young LLP
200 Clarendon Street
Boston, Massachusetts 02116
Reporting to Shareholders
Each Morgan Stanley fund provides a complete schedule of portfolio holdings in its semi-annual and annual reports within 60 days of the end of the fund's second and fourth fiscal quarters by filing the schedule electronically with the Securities and Exchange Commission (SEC). The semi-annual reports are filed on Form N-CSRS and the annual reports are filed on Form N-CSR. Morgan Stanley also delivers the semi-annual and annual reports to fund shareholders and makes these reports available on its public website, www.morganstanley.com/im. Each Morgan Stanley fund also files a complete schedule of portfolio holdings with the SEC for the fund's first and third fiscal quarters on Form N-Q. Morgan Stanley does not deliver the reports for the first and third fiscal quarters to shareholders, nor are the reports posted to the Morgan Stanley public website. You may, however, obtain the Form N-Q filings (as well as the Form N-CSR and N-CSRS filings) by accessing the SEC's website, www.sec.gov. You may also review and copy them at the SEC's Public Reference Room in Washington, DC. Information on the operation of the SEC's Public Reference Room may be obtained by calling the SEC toll free at 1 (800) SEC-0330. You can also request copies of these materials, upon payment of a duplicating fee, by electronic request at the SEC's email address (publicinfo@sec.gov) or by writing the Public Reference Room of the SEC, Washington, DC 20549-0102.
Proxy Voting Policies and Procedures and Proxy Voting Record
You may obtain a copy of the Fund's Proxy Voting Policy and Procedures and information regarding how the Fund voted proxies relating to portfolio securities during the most recent twelve-month period ended June 30, without charge, upon request, by calling toll free 1 (800) 548-7786 or by visiting our website at www.morganstanley.com/im. This information is also available on the SEC's website at www.sec.gov.
This report is authorized for distribution only when preceded or accompanied by a prospectus of the Morgan Stanley Institutional Fund, Inc. which describes in detail each Investment Portfolio's investment policies, risks, fees and expenses. Please read the prospectus carefully before you invest or send money. For additional information, including information regarding the investments comprising the Portfolio, please visit our website at www.morganstanley.com/im or call toll free 1 (800) 548-7786.
32
(This Page has been left blank intentionally.)
Printed in U.S.A.
This Report has been prepared for shareholders and may be distributed to others only if preceded or accompanied by a current prospectus.
Morgan Stanley Investment Management Inc.
522 Fifth Avenue
New York, New York 10036
© 2014 Morgan Stanley. Morgan Stanley Distribution, Inc.

IFIGFANN
808739 EXP 2.28.15

Morgan Stanley Institutional Fund, Inc.
Frontier Emerging Markets Portfolio
Annual Report
December 31, 2013

Morgan Stanley Institutional Fund, Inc.
Annual Report — December 31, 2013
Shareholders' Letter | | | 2 | | |
Expense Example | | | 3 | | |
Investment Overview | | | 4 | | |
Portfolio of Investments | | | 7 | | |
Statement of Assets and Liabilities | | | 9 | | |
Statement of Operations | | | 10 | | |
Statements of Changes in Net Assets | | | 11 | | |
Financial Highlights | | | 13 | | |
Notes to Financial Statements | | | 16 | | |
Report of Independent Registered Public Accounting Firm | | | 23 | | |
Federal Tax Notice | | | 24 | | |
U.S. Privacy Policy | | | 25 | | |
Director and Officer Information | | | 28 | | |
This report is authorized for distribution only when preceded or accompanied by prospectuses of the Morgan Stanley Institutional Fund, Inc. To receive a prospectus and/or statement of additional information (SAI), which contains more complete information such as investment objectives, charges, expenses, policies for voting proxies, risk considerations, and describes in detail each of the Portfolio's investment policies to the prospective investor, please call toll free 1 (800) 548-7786. Please read the prospectuses carefully before you invest or send money.
Additionally, you can access portfolio information including performance, characteristics, and investment team commentary through Morgan Stanley Investment Management's website: www.morganstanley.com/im.
Market forecasts provided in this report may not necessarily come to pass. There is no guarantee that any sectors mentioned will continue to perform as discussed herein or that securities in such sectors will be held by the Portfolio in the future. There is no assurance that a Portfolio will achieve its investment objective. Portfolios are subject to market risk, which is the possibility that market values of securities owned by the Portfolio will decline and, therefore, the value of the Portfolio's shares may be less than what you paid for them. Accordingly, you can lose money investing in the Portfolio. Please see the prospectus for more complete information on investment risks.
1
Morgan Stanley Institutional Fund, Inc.
Annual Report — December 31, 2013
Shareholders' Letter (unaudited)
Dear Shareholders,
We are pleased to provide this Annual report, in which you will learn how your investment in Frontier Emerging Markets Portfolio (the "Portfolio") performed during the latest twelve-month period.
Morgan Stanley Investment Management is a client-centric, investor-led organization. Our global presence, intellectual capital, and breadth of products and services enable us to partner with investors to meet the evolving challenges of today's financial markets. We aim to deliver superior investment service and to empower our clients to make the informed decisions that help them reach their investment goals.
As always, we thank you for selecting Morgan Stanley Investment Management, and look forward to working with you in the months and years ahead.
Sincerely,

John H. Gernon
President and Principal Executive Officer
January 2014
2
Morgan Stanley Institutional Fund, Inc.
Annual Report — December 31, 2013
Expense Example (unaudited)
Frontier Emerging Markets Portfolio
As a shareholder of the Portfolio, you incur two types of costs: (1) transactional costs, including redemptions fees; and (2) ongoing costs, including advisory fees, administration fees, distribution and shareholder services fees and other Portfolio expenses. This example is intended to help you understand your ongoing costs (in dollars) of investing in the Portfolio and to compare these costs with the ongoing costs of investing in other mutual funds.
This example is based on an investment of $1,000 invested at the beginning of the six-month period ended December 31, 2013 and held for the entire six-month period.
Actual Expenses
The table below provides information about actual account values and actual expenses. You may use the information in this table, together with the amount you invested, to estimate the expenses that you paid over the period. Simply divide your account value by $1,000 (for example, an $8,600 account value divided by $1,000 = 8.6), then multiply the result by the number in the table under the heading entitled "Actual Expenses Paid During Period" to estimate the expenses you paid on your account during this period.
Hypothetical Example for Comparison Purposes
The table below provides information about hypothetical account values and hypothetical expenses based on the Portfolio's actual expense ratio and an assumed rate of return of 5% per year before expenses, which is not the Portfolio's actual return. The hypothetical account values and expenses may not be used to estimate the actual ending account balance or expenses you paid for the period. You may use this information to compare the ongoing costs of investing in the Portfolio and other funds. To do so, compare this 5% hypothetical example with the 5% hypothetical examples that appear in the shareholder reports of the other funds.
Please note that the expenses shown in the table are meant to highlight your ongoing costs only and do not reflect any transactional costs, such as sales charges (loads) and redemption fees. Therefore, the information for each class in the table is useful in comparing ongoing costs only, and will not help you determine the relative total costs of owning different funds. In addition, if these transactional costs were included, your costs would have been higher.
| | | Beginning
Account
Value
7/1/13 | | Actual Ending
Account
Value
12/31/13 | | Hypothetical
Ending Account
Value | | Actual
Expenses
Paid
During
Period* | | Hypothetical
Expenses Paid
During Period* | | Net
Expense
Ratio
During
Period** | |
Frontier Emerging Markets Portfolio Class I | | $ | 1,000.00 | | | $ | 1,157.90 | | | $ | 1,016.43 | | | $ | 9.46 | | | $ | 8.84 | | | | 1.74 | % | |
Frontier Emerging Markets Portfolio Class A@ | | | 1,000.00 | | | | 1,156.80 | | | | 1,015.43 | | | | 10.55 | | | | 9.86 | | | | 1.94 | | |
Frontier Emerging Markets Portfolio Class L | | | 1,000.00 | | | | 1,153.20 | | | | 1,012.50 | | | | 13.68 | | | | 12.78 | | | | 2.52 | | |
* Expenses are calculated using each Portfolio Class' annualized net expense ratio (as disclosed), multiplied by the average account value over the period, and multiplied by 184/365 (to reflect the most recent one-half year period).
** Annualized.
@ Effective September 9, 2013, Class P and Class H shares were renamed Class A shares.
3
Morgan Stanley Institutional Fund, Inc.
Annual Report — December 31, 2013
Investment Overview (unaudited)
Frontier Emerging Markets Portfolio
The Frontier Emerging Markets Portfolio seeks long-term capital appreciation.
Performance
For the year ended December 31, 2013, the Portfolio had a total return based on net asset value and reinvestment of distributions per share of 32.95%, net of fees, for Class I shares. The Portfolio's Class I shares outperformed against its benchmark, the Morgan Stanley Capital International (MSCI) Frontier Markets Index (the "Index"), which returned 25.89%. Please keep in mind that high double-digit returns are highly unusual and cannot be sustained.
Factors Affecting Performance
• For the 12-month period ended December 31, 2013, the Index returned 25.89%, significantly outperforming the mainstream emerging markets, which fell 2.60%, as reflected by the MSCI Emerging Markets Index.
• During the period, the performance dispersion across the frontier markets remained high with Bulgaria up 97.82% and the United Arab Emirates up 90.02%. Argentina also posted strong results, up 65.97%. The worst-performing markets included Ukraine (-15.61%), Tunisia (-5.86%) and Jordan (-5.51%).
• Stock selection and country allocation both added to the Portfolio's performance.
• Positive performance in the Portfolio was led by stock selection in and an underweight to Kuwait, followed by stock selection in Qatar, and stock selection in and an overweight allocation to Argentina.
• On a sector basis, stock selection in and an overweight allocation to the energy sector drove gains, as did stock selection in financials and industrials.
• The main detractors from performance were stock selection in and an underweight allocation to the United Arab Emirates, followed by an allocation to a sub-Saharan consumer staples company and an allocation to Saudi Arabia.
• On a sector basis, an overweight to the consumer discretionary sector and stock selection in the consumer staples sector were the primary underperformers.
• As of the date of this report, the Portfolio is in the Lipper Emerging Markets Funds classification. We would note that the Lipper Emerging Markets Funds Classification includes both frontier and emerging market funds. There currently is not a separate Lipper classification that includes only those funds focused specifically on frontier markets.
Management Strategies
• We utilize a rigorous, fundamental research-driven approach that integrates top-down country allocation based on relative economic, political and social fundamentals; stock valuations; and investor sentiment. Our bottom-up fundamental analysis seeks to identify issuers that we believe have strong earnings growth potential and positive long-term prospects.
• We believe long-term prospects for frontier market equities remain constructive given the compelling economic, demographic and productivity characteristics of many frontier markets, despite several well-known challenges. Battles in areas in the Middle East and North Africa continue to present political risk for regional markets. We seek out themes that offer investment opportunities like Saudi Arabia's Saudization policy, wherein the government has focused on integrating more Saudi nationals into the workforce. We believe higher Saudi employment could benefit the economy, particularly in consumer discretionary spending and financials. We are becoming more constructive on Kuwait following a recent research trip where we think there is the potential for the non-oil segment of gross domestic product (GDP) growth to turn positive.
• We continue to believe in the benefits of new leadership, specifically within previously troubled countries, like in Pakistan where Nawaz Sharif became prime minister in June 2013. The new leader has pledged to change the reputation of the country known for extremism and poverty to one known for good governance and prosperity. Additionally, as we assess our "rules of the road" for investing across the emerging markets, many frontier economies also appear well-positioned from an analysis of their credit cycles.
4
Morgan Stanley Institutional Fund, Inc.
Annual Report — December 31, 2013
Investment Overview (unaudited) (cont'd)
Frontier Emerging Markets Portfolio
• Structural problems and sluggish recoveries in the developed countries combined with slowing growth in many mainstream emerging countries continue to dampen equity performance generally. While individual frontier markets face specific, isolated challenges, many are better positioned from a macro perspective relative to some of the larger emerging markets; especially as we look at various fundamentals including the exposure to a China slowdown, the implications of Fed tapering and the effects of a lower-growth world.
• In terms of portfolio positioning, we continue to focus on countries where we believe GDP growth, fiscal policy and reform agendas remain constructive and on companies with strong earnings visibility, sensible management and solid balance sheets. We continue to search for oversold opportunities where valuations are not reflecting underlying fundamentals. We remain overweight in the Portfolio in such countries as Saudi Arabia, Laos, Pakistan, Romania and Panama, where there is sustainable reform-led growth and reasonable inflation. Kuwait, Kazakhstan and Oman remain our largest underweight country positions relative to the Index.
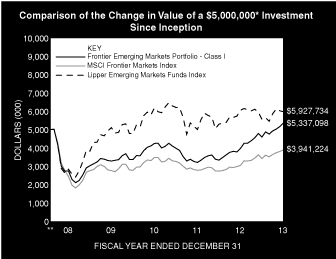
* Minimum Investment for Class I shares
** Commenced Operations on August 25, 2008. Performance shown for the Portfolio's Class I shares reflects the performance of the common shares of the Predecessor Fund for periods prior to September 17, 2012.
In accordance with SEC regulations, Portfolio's performance shown assumes that all recurring fees (including management fees) were deducted and all dividends and distributions were reinvested. The performance of Class A+ and L shares will vary from Class I shares based upon their different inception dates and will be negatively impacted by additional fees assessed to those classes.
Performance Compared to the Morgan Stanley Capital International (MSCI) Frontier Markets Index(1) and the Lipper Emerging Markets Funds Index(2)
| | | Period Ended December 31, 2013
Total Returns(3) | |
| | | | | Average Annual | |
| | | One
Year | | Five
Years | | Ten
Years | | Since
Inception(6) | |
Portfolio — Class I Shares
w/o sales charges(4) | | | 32.95 | % | | | 13.45 | % | | | — | | | | 1.23 | % | |
MSCI Frontier Markets Index | | | 25.89 | | | | 9.00 | | | | — | | | | -4.35 | | |
Lipper Emerging Markets Funds Index | | | -1.29 | | | | 15.17 | | | | — | | | | 3.23 | | |
Portfolio — Class A+ Shares
w/o sales charges(5) | | | 32.53 | | | | — | | | | — | | | | 29.52 | | |
Portfolio — Class A+ Shares with
maximum 5.25% sales charges(5) | | | 25.55 | | | | — | | | | — | | | | 24.26 | | |
MSCI Frontier Markets Index | | | 25.89 | | | | — | | | | — | | | | 24.02 | | |
Lipper Emerging Markets Funds Index | | | -1.29 | | | | — | | | | — | | | | 2.74 | | |
Portfolio — Class L Shares
w/o sales charges(5) | | | 31.81 | | | | — | | | | — | | | | 28.84 | | |
MSCI Frontier Markets Index | | | 25.89 | | | | — | | | | — | | | | 24.02 | | |
Lipper Emerging Markets Funds Index | | | -1.29 | | | | — | | | | — | | | | 2.74 | | |
Performance data quoted represents past performance, which is no guarantee of future results, and current performance may be lower or higher than the figures shown. Performance assumes that all dividends and distributions, if any, were reinvested. For the most recent month-end performance figures, please visit www.morganstanley.com/im. Investment return and principal value will fluctuate so that Portfolio shares, when redeemed, may be worth more or less than their original cost. Total returns do not reflect the deduction of taxes that a shareholder would pay on Portfolio distributions or the redemption of Portfolio shares. Performance of share classes will vary due to difference in sales charges and expenses.
+ Effective September 9, 2013, Class P shares were renamed Class A shares.
(1) The Morgan Stanley Capital International (MSCI) Frontier Markets Index is a free float-adjusted market capitalization index that is designed to measure equity market performance of frontier markets. The MSCI Frontier Markets Index currently consists of 26 frontier market country indices. The performance of the Index is calculated in U.S. dollars and assumes reinvestment of net dividends. "Net dividends" reflects a reduction in dividends after taking into account withholding of taxes by certain foreign countries represented in the Index. The Index is unmanaged and its returns do not include any sales charges or fees. Such costs would lower performance. It is not possible to invest directly in an index.
(2) The Lipper Emerging Markets Funds Index is an equally weighted performance index of the largest qualifying funds (based on net assets) in the Lipper Emerging Markets Funds classification. The Index, which is adjusted for capital gains distributions and income dividends, is unmanaged and should not be considered an investment. There are currently 30 funds represented in this Index. As of the date of this report, the Portfolio is in the Lipper Emerging Markets Funds classification.
(3) Total returns for the Portfolio reflect fees waived and expenses reimbursed, if applicable, by the Adviser. Without such waivers and reimbursements, total returns would have been lower. The fee waivers and/or expense reimbursements will continue for at least one year or until such time as the Fund's Board of Directors acts to discontinue all or a portion of such waivers and/or expense reimbursements when it deems that such action is appropriate.
5
Morgan Stanley Institutional Fund, Inc.
Annual Report — December 31, 2013
Investment Overview (unaudited) (cont'd)
Frontier Emerging Markets Portfolio
(4) On September 17, 2012, all assets of Morgan Stanley Frontier Emerging Markets Fund, Inc. (the "Predecessor Fund") were reorganized into Class I shares of Morgan Stanley Institutional Fund, Inc. Frontier Emerging Markets Portfolio. Performance shown for Class I shares reflects the performance of the shares of the Predecessor Fund for periods prior to September 17, 2012. The Predecessor Fund may have performed differently if it were an open-end fund since closed-end funds are generally not subject to the cash flow fluctuations of an open-end fund. In addition, Class I shares' returns of the Portfolio will differ from the Predecessor Fund as they have different expenses. The Predecessor Fund commenced operations on August 25, 2008.
(5) Commenced operations on September 14, 2012.
(6) For comparative purposes, average annual since inception returns listed for the Indexes refer to the inception date or initial offering of the respective share class of the Portfolio, not the inception of the Index.
Portfolio Composition
Classification | | Percentage of
Total Investments | |
Other* | | | 38.2 | % | |
Commercial Banks | | | 30.5 | | |
Oil, Gas & Consumable Fuels | | | 12.7 | | |
Diversified Telecommunication Services | | | 6.8 | | |
Investment Company | | | 6.1 | | |
Wireless Telecommunication Services | | | 5.7 | | |
Total Investments | | | 100.0 | % | |
* Industries and/or investment types representing less than 5% of total investments.
6
Morgan Stanley Institutional Fund, Inc.
Annual Report — December 31, 2013
Portfolio of Investments
Frontier Emerging Markets Portfolio
| | | Shares | | Value
(000) | |
Common Stocks (80.8%) | |
Argentina (7.0%) | |
Banco Macro SA ADR (a) | | | 156,728 | | | $ | 3,804 | | |
Telecom Argentina SA ADR | | | 186,453 | | | | 3,214 | | |
YPF SA ADR | | | 350,900 | | | | 11,566 | | |
| | | 18,584 | | |
Austria (1.5%) | |
OMV AG | | | 83,386 | | | | 3,991 | | |
Bangladesh (2.0%) | |
GrameenPhone Ltd. | | | 1,537,272 | | | | 3,976 | | |
Islami Bank Bangladesh Ltd. | | | 2,986,918 | | | | 1,331 | | |
| | | 5,307 | | |
Egypt (1.2%) | |
Ghabbour Auto | | | 605,361 | | | | 3,136 | | |
Kenya (3.7%) | |
Kenya Commercial Bank Ltd. | | | 8,958,988 | | | | 4,931 | | |
Safaricom Ltd. | | | 38,189,236 | | | | 4,823 | | |
| | | 9,754 | | |
Kuwait (2.5%) | |
Burgan Bank SAK | | | 3,484,226 | | | | 6,786 | | |
Laos (2.5%) | |
Kolao Holdings (a) | | | 262,514 | | | | 6,729 | | |
Nigeria (14.3%) | |
Access Bank PLC | | | 65,632,666 | | | | 3,939 | | |
Afren PLC (a) | | | 3,413,613 | | | | 9,564 | | |
Dangote Cement PLC | | | 4,417,966 | | | | 5,816 | | |
Guaranty Trust Bank PLC | | | 21,598,819 | | | | 3,677 | | |
Nigerian Breweries PLC | | | 7,721,013 | | | | 8,105 | | |
Zenith Bank PLC | | | 40,572,921 | | | | 6,918 | | |
| | | 38,019 | | |
Pakistan (8.0%) | |
Engro Foods Ltd. (a) | | | 4,142,468 | | | | 4,127 | | |
Lucky Cement Ltd. | | | 2,216,182 | | | | 6,321 | | |
Oil & Gas Development Co., Ltd. | | | 2,330,011 | | | | 6,146 | | |
United Bank Ltd. | | | 3,732,397 | | | | 4,701 | | |
| | | 21,295 | | |
Panama (2.8%) | |
Copa Holdings SA, Class A | | | 45,991 | | | | 7,364 | | |
Qatar (12.2%) | |
Gulf International Services OSC | | | 570,308 | | | | 9,553 | | |
Ooredoo QSC | | | 249,353 | | | | 9,395 | | |
Qatar Islamic Bank | | | 147,450 | | | | 2,794 | | |
Qatar National Bank SAQ | | | 228,029 | | | | 10,771 | | |
| | | 32,513 | | |
Romania (5.0%) | |
Banca Transilvania (a) | | | 11,434,018 | | | | 5,803 | | |
Fondul Proprietatea SA | | | 16,303,886 | | | | 4,180 | | |
Societatea Nationala de Gaze Naturale
ROMGAZ SA GDR (a)(b) | | | 302,095 | | | | 3,066 | | |
| | | Shares | | Value
(000) | |
Societatea Nationala de Gaze Naturale
ROMGAZ SA (a) | | | 38,120 | | | $ | 401 | | |
| | | 13,450 | | |
Sri Lanka (3.5%) | |
Commercial Bank of Ceylon PLC | | | 5,071,751 | | | | 4,668 | | |
John Keells Holdings PLC | | | 2,725,221 | | | | 4,736 | | |
| | | 9,404 | | |
United Arab Emirates (13.1%) | |
Air Arabia PJSC | | | 11,043,886 | | | | 4,661 | | |
Aramex PJSC | | | 4,754,932 | | | | 3,935 | | |
Drake & Scull International (a) | | | 14,911,914 | | | | 5,846 | | |
Emaar Properties PJSC | | | 5,878,277 | | | | 12,227 | | |
First Gulf Bank PJSC | | | 1,625,821 | | | | 8,322 | | |
| | | 34,991 | | |
Vietnam (1.5%) | |
Viet Nam Dairy Products JSC | | | 590,580 | | | �� | 3,975 | | |
Total Common Stocks (Cost $183,065) | | | 215,298 | | |
Participation Notes (15.4%) | |
Saudi Arabia (11.2%) | |
Al Rajhi Bank Series 0002,
Equity Linked Notes, expires 2/16/15 | | | 301,229 | | | | 5,863 | | |
Alinma Bank,
Equity Linked Notes, expires 9/27/16 (a) | | | 244,897 | | | | 973 | | |
Alinma Bank Series 0001,
Equity Linked Notes, expires 5/9/16 (a) | | | 743,684 | | | | 2,955 | | |
Etihad Etisalat Co.,
Equity Linked Notes, expires 9/27/16 | | | 115,789 | | | | 2,640 | | |
Etihad Etisalat Co. Series 0002,
Equity Linked Notes, expires 5/9/16 (b) | | | 175,208 | | | | 3,994 | | |
Jarir Marketing Co.,
Equity Linked Notes, expires 12/12/16 (a)(b) | | | 91,624 | | | | 3,884 | | |
Saudi Airlines Catering Co.,
Equity Linked Notes, expires 5/23/17 | | | 121,730 | | | | 4,593 | | |
Saudi Hollandi Bank Series 0002,
Equity Linked Notes, expires 3/7/16 | | | 441,070 | | | | 4,916 | | |
| | | 29,818 | | |
United Arab Emirates (3.6%) | |
Aramex PJSC,
Equity Linked Notes, expires 3/30/16 (a) | | | 4,521,512 | | | | 3,742 | | |
Emirates Telecommunications Corp.,
Equity Linked Notes, expires 4/14/14 | | | 1,840,648 | | | | 5,863 | | |
| | | 9,605 | | |
Vietnam (0.6%) | |
Viet Nam Dairy Products JSC,
Equity Linked Notes, expires 7/22/19 | | | 141,330 | | | | 952 | | |
Viet Nam Dairy Products JSC Series 000K,
Equity Linked Notes, expires 10/23/14 | | | 92,590 | | | | 623 | | |
| | | 1,575 | | |
| Total Participation Notes (Cost $38,763) | | | 40,998 | | |
The accompanying notes are an integral part of the financial statements.
7
Morgan Stanley Institutional Fund, Inc.
Annual Report — December 31, 2013
Portfolio of Investments (cont'd)
Frontier Emerging Markets Portfolio
| | | Shares | | Value
(000) | |
Short-Term Investment (6.2%) | |
Investment Company (6.2%) | |
Morgan Stanley Institutional Liquidity
Funds — Money Market Portfolio —
Institutional Class (See Note G)
(Cost $16,542) | | | 16,542,076 | | | $ | 16,542 | | |
Total Investments (102.4%) (Cost $238,370) | | | 272,838 | | |
Liabilities in Excess of Other Assets (-2.4%) | | | (6,486 | ) | |
Net Assets (100.0%) | | $ | 266,352 | | |
(a) Non-income producing security.
(b) 144A security — Certain conditions for public sale may exist. Unless otherwise noted, these securities are deemed to be liquid.
ADR American Depositary Receipt.
GDR Global Depositary Receipt.
PJSC Public Joint Stock Company.
The accompanying notes are an integral part of the financial statements.
8
Morgan Stanley Institutional Fund, Inc.
Annual Report — December 31, 2013
Frontier Emerging Markets Portfolio
Statement of Assets and Liabilities | | December 31, 2013
(000) | |
Assets: | |
Investments in Securities of Unaffiliated Issuers, at Value (Cost $221,828) | | $ | 256,296 | | |
Investment in Security of Affiliated Issuer, at Value (Cost $16,542) | | | 16,542 | | |
Total Investments in Securities, at Value (Cost $238,370) | | | 272,838 | | |
Foreign Currency, at Value (Cost $1,673) | | | 1,672 | | |
Receivable for Portfolio Shares Sold | | | 2,003 | | |
Dividends Receivable | | | 184 | | |
Receivable for Investments Sold | | | 10 | | |
Tax Reclaim Receivable | | | 5 | | |
Receivable from Affiliate | | | 1 | | |
Other Assets | | | 36 | | |
Total Assets | | | 276,749 | | |
Liabilities: | |
Payable for Investments Purchased | | | 9,224 | | |
Payable for Advisory Fees | | | 632 | | |
Deferred Capital Gain Country Tax | | | 218 | | |
Payable for Portfolio Shares Redeemed | | | 111 | | |
Payable for Reorganization Expense | | | 109 | | |
Payable for Custodian Fees | | | 30 | | |
Payable for Professional Fees | | | 28 | | |
Payable for Administration Fees | | | 17 | | |
Payable for Transfer Agent Fees | | | 8 | | |
Payable for Transfer Agent Fees — Class I | | | 2 | | |
Payable for Transfer Agent Fees — Class A* | | | — | @ | |
Payable for Transfer Agent Fees — Class L | | | — | @ | |
Payable for Sub Transfer Agency Fees — Class I | | | 6 | | |
Payable for Shareholder Services Fees — Class A* | | | 4 | | |
Payable for Distribution and Shareholder Services Fees — Class L | | | 2 | | |
Other Liabilities | | | 6 | | |
Total Liabilities | | | 10,397 | | |
Net Assets | | $ | 266,352 | | |
Net Assets Consist Of: | |
Paid-in-Capital | | $ | 269,192 | | |
Distributions in Excess of Net Investment Income | | | (602 | ) | |
Accumulated Net Realized Loss | | | (36,476 | ) | |
Unrealized Appreciation (Depreciation) on: | |
Investments (Net of $218 Deferred Capital Gain Country Tax) | | | 34,250 | | |
Foreign Currency Translations | | | (12 | ) | |
Net Assets | | $ | 266,352 | | |
CLASS I: | |
Net Assets | | $ | 239,378 | | |
| Shares Outstanding $0.001 par value shares of beneficial interest (500,000,000 shares authorized) (not in 000's) | | | 12,694,130 | | |
Net Asset Value, Offering and Redemption Price Per Share | | $ | 18.86 | | |
CLASS A*: | |
Net Assets | | $ | 23,762 | | |
| Shares Outstanding $0.001 par value shares of beneficial interest (500,000,000 shares authorized) (not in 000's) | | | 1,265,608 | | |
Net Asset Value, Redemption Price Per Share | | $ | 18.78 | | |
Maximum Sales Load§§ | | | 5.25 | % | |
Maximum Sales Charge | | $ | 1.04 | | |
Maximum Offering Price Per Share | | $ | 19.82 | | |
CLASS L: | |
Net Assets | | $ | 3,212 | | |
| Shares Outstanding $0.001 par value shares of beneficial interest (500,000,000 shares authorized) (not in 000's) | | | 171,666 | | |
Net Asset Value, Offering and Redemption Price Per Share | | $ | 18.71 | | |
* Effective September 9, 2013, Class P and Class H shares were renamed Class A shares.
@ Amount is less than $500.
§§ Effective February 25, 2013, the Directors approved the imposition of a maximum initial sales charge of 5.25% on purchases of Class A shares of the Portfolio.
The accompanying notes are an integral part of the financial statements.
9
Morgan Stanley Institutional Fund, Inc.
Annual Report — December 31, 2013
Frontier Emerging Markets Portfolio
Statement of Operations | | Year Ended
December 31, 2013
(000) | |
Investment Income: | |
Dividends from Securities of Unaffiliated Issuers (Net of $165 of Foreign Taxes Withheld) | | $ | 2,564 | | |
Dividends from Security of Affiliated Issuer (Note G) | | | 6 | | |
Interest from Securities of Unaffiliated Issuers (Net of $—@ Foreign Taxes Withheld) | | | — | @ | |
Total Investment Income | | | 2,570 | | |
Expenses: | |
Advisory Fees (Note B) | | | 1,418 | | |
Custodian Fees (Note F) | | | 258 | | |
Professional Fees | | | 159 | | |
Administration Fees (Note C) | | | 91 | | |
Offering Costs | | | 89 | | |
Registration Fees | | | 37 | | |
Shareholder Services Fees — Class A* (Note D) | | | 10 | | |
Distribution and Shareholder Services Fees — Class L (Note D) | | | 9 | | |
Sub Transfer Agency Fees | | | 9 | | |
Sub Transfer Agency Fees — Class I | | | 10 | | |
Sub Transfer Agency Fees — Class A* | | | — | @ | |
Shareholder Reporting Fees | | | 17 | | |
Transfer Agency Fees (Note E) | | | 10 | | |
Transfer Agency Fees — Class I (Note E) | | | 3 | | |
Transfer Agency Fees — Class A* (Note E) | | | — | @ | |
Transfer Agency Fees — Class L (Note E) | | | — | @ | |
Pricing Fees | | | 6 | | |
Directors' Fees and Expenses | | | 3 | | |
Other Expenses | | | 23 | | |
Total Expenses | | | 2,152 | | |
Waiver of Advisory Fees (Note B) | | | (118 | ) | |
Rebate from Morgan Stanley Affiliate (Note G) | | | (10 | ) | |
Reimbursement of Class Specific Expenses — Class L (Note B) | | | (— | @) | |
Net Expenses | | | 2,024 | | |
Net Investment Income | | | 546 | | |
Realized Gain (Loss): | |
Investments Sold (Net of $10 Capital Gain Country Tax) | | | 2,958 | | |
Foreign Currency Transactions | | | (295 | ) | |
Net Realized Gain | | | 2,663 | | |
Change in Unrealized Appreciation (Depreciation): | |
Investments (Net of Increase in Deferred Capital Gain Country Tax of $199) | | | 28,727 | | |
Foreign Currency Translations | | | (13 | ) | |
Net Change in Unrealized Appreciation (Depreciation) | | | 28,714 | | |
Net Realized Gain and Change in Unrealized Appreciation (Depreciation) | | | 31,377 | | |
Net Increase in Net Assets Resulting from Operations | | $ | 31,923 | | |
* Effective September 9, 2013, Class P and Class H shares were renamed Class A shares.
@ Amount is less than $500.
The accompanying notes are an integral part of the financial statements.
10
Morgan Stanley Institutional Fund, Inc.
Annual Report — December 31, 2013
Frontier Emerging Markets Portfolio
Statements of Changes in Net Assets | | Year Ended
December 31,
2013
(000) | | Period from
November 1,
2012 to
December 31,
2012
(000) | | Year Ended
October 31,
2012
(000) | |
Increase (Decrease) in Net Assets: | |
Operations: | |
Net Investment Income (Loss) | | $ | 546 | | | $ | (110 | ) | | $ | 1,225 | | |
Net Realized Gain | | | 2,663 | | | | 3,778 | | | | (2,058 | ) | |
Net Change in Unrealized Appreciation (Depreciation) | | | 28,714 | | | | (1,730 | ) | | | 10,319 | | |
Net Increase in Net Assets Resulting from Operations | | | 31,923 | | | | 1,938 | | | | 9,486 | | |
Distributions from and/or in Excess of: | |
Class I: | |
Net Investment Income | | | (854 | ) | | | (1,092 | ) | | | (1,445 | ) | |
Class A*: | |
Net Investment Income | | | (60 | ) | | | (— | @) | | | — | | |
Class H@@: | |
Net Investment Income | | | — | | | | (1 | ) | | | — | | |
Class L: | |
Net Investment Income | | | (1 | ) | | | (— | @) | | | — | | |
Total Distributions | | | (915 | ) | | | (1,093 | ) | | | (1,445 | ) | |
Capital Share Transactions:(1) | |
Class I: | |
Subscribed | | | 178,020 | | | | 770 | | | | 618 | | |
Distributions Reinvested | | | 537 | | | | 903 | | | | — | | |
Redeemed | | | (20,156 | ) | | | (9,855 | ) | | | (35,040 | ) | |
Class A*: | |
Subscribed | | | 24,432 | | | | — | | | | 10 | ** | |
Distributions Reinvested | | | 60 | | | | — | | | | — | | |
Conversion from Class H | | | 780 | | | | — | | | | — | | |
Redeemed | | | (2,709 | ) | | | — | | | | — | | |
Class H@@: | |
Subscribed | | | 720 | *** | | | 100 | | | | 10 | ** | |
Distributions Reinvested | | | — | | | | 1 | | | | — | | |
Conversion to Class A | | | (780 | )*** | | | — | | | | — | | |
Redeemed | | | (43 | )*** | | | (25 | ) | | | — | | |
Class L: | |
Subscribed | | | 5,119 | | | | — | | | | 10 | ** | |
Distributions Reinvested | | | 1 | | | | — | | | | — | | |
Redeemed | | | (2,171 | ) | | | — | | | | — | | |
Net Increase (Decrease) in Net Assets Resulting from Capital Share Transactions | | | 183,810 | | | | (8,106 | ) | | | (34,392 | ) | |
Redemption Fees | | | 12 | | | | 24 | | | | 148 | | |
Total Increase (Decrease) in Net Assets | | | 214,830 | | | | (7,237 | ) | | | (26,203 | ) | |
Net Assets: | |
Beginning of Period | | | 51,522 | | | | 58,759 | | | | 84,962 | | |
End of Period (Including Distributions in Excess of Net Investment Income of
$(602), $(2)and $1,092) | | $ | 266,352 | | | $ | 51,522 | | | $ | 58,759 | | |
The accompanying notes are an integral part of the financial statements.
11
Morgan Stanley Institutional Fund, Inc.
Annual Report — December 31, 2013
Frontier Emerging Markets Portfolio
Statements of Changes in Net Assets (cont'd) | | Year Ended
December 31,
2013
(000) | | Period from
November 1,
2012 to
December 31,
2012
(000) | | Year Ended
October 31,
2012
(000) | |
(1) Capital Share Transactions: | |
Class I: | |
Shares Subscribed | | | 10,282 | | | | 55 | | | | 45 | | |
Shares Issued on Distributions Reinvested | | | 29 | | | | 65 | | | | — | | |
Shares Redeemed | | | (1,228 | ) | | | (703 | ) | | | (2,514 | ) | |
Net Increase (Decrease) in Class I Shares Outstanding | | | 9,083 | | | | (583 | ) | | | (2,469 | ) | |
Class A*: | |
Shares Subscribed | | | 1,368 | | | | — | | | | 1 | ** | |
Shares Issued on Distributions Reinvested | | | 3 | | | | — | | | | — | | |
Conversion from Class H | | | 47 | | | | — | | | | — | | |
Shares Redeemed | | | (153 | ) | | | — | | | | — | | |
Net Increase in Class A* Shares Outstanding | | | 1,265 | | | | — | | | | 1 | ** | |
Class H@@: | |
Shares Subscribed | | | 43 | *** | | | 7 | | | | 1 | ** | |
Shares Issued on Distributions Reinvested | | | — | | | | — | @@@ | | | — | | |
Conversion to Class A | | | (47 | )*** | | | — | | | | — | | |
Shares Redeemed | | | (2 | )*** | | | (2 | ) | | | — | | |
Net Increase (Decrease) in Class H Shares Outstanding | | | (6 | ) | | | 5 | | | | 1 | ** | |
Class L: | |
Shares Subscribed | | | 296 | | | | — | | | | 1 | ** | |
Shares Issued on Distributions Reinvested | | | — | @@@ | | | — | | | | — | | |
Shares Redeemed | | | (125 | ) | | | — | | | | — | | |
Net Increase in Class L Shares Outstanding | | | 171 | | | | — | | | | 1 | ** | |
@ Amount is less than $500.
@@ Effective September 9, 2013, Class H shares converted into Class A shares.
@@@ Amount is less than 500 Shares.
* Effective September 9, 2013, Class P shares were renamed Class A shares.
** For the period September 17, 2012 (commencement of operations) to October 31, 2012.
*** For the period January 1, 2013 through September 6, 2013.
The accompanying notes are an integral part of the financial statements.
12
Morgan Stanley Institutional Fund, Inc.
Annual Report — December 31, 2013
Financial Highlights
Frontier Emerging Markets Portfolio
| | | Class I | |
| | | Year Ended
December 31, | | Period from
November 1,
2012 to
December 31, | | Year Ended October 31, | |
Selected Per Share Data and Ratios | | 2013 | | 2012 | | 2012 | | 2011 | | 2010 | | 2009 | |
Net Asset Value, Beginning of Period | | $ | 14.24 | | | $ | 14.00 | | | $ | 12.75 | | | $ | 15.26 | | | $ | 13.19 | | | $ | 11.79 | | |
Income (Loss) from Investment Operations: | |
Net Investment Income (Loss)† | | | 0.09 | | | | (0.03 | ) | | | 0.19 | | | | 0.34 | | | | 0.13 | | | | 0.21 | | |
Net Realized and Unrealized Gain (Loss) | | | 4.60 | | | | 0.56 | | | | 1.26 | | | | (2.65 | ) | | | 2.06 | | | | 1.18 | | |
Total from Investment Operations | | | 4.69 | | | | 0.53 | | | | 1.45 | | | | (2.31 | ) | | | 2.19 | | | | 1.39 | | |
Distributions from and/or in Excess of: | |
Net Investment Income | | | (0.07 | ) | | | (0.30 | ) | | | (0.22 | ) | | | (0.20 | ) | | | (0.21 | ) | | | — | | |
Anti-Dilutive Effect of Share Repurchase Program | | | — | | | | — | | | | — | | | | — | | | | 0.09 | | | | 0.01 | | |
Redemption Fees | | | 0.00 | ‡ | | | 0.01 | | | | 0.02 | | | | — | | | | — | | | | — | | |
Net Asset Value, End of Period | | $ | 18.86 | | | $ | 14.24 | | | $ | 14.00 | | | $ | 12.75 | | | $ | 15.26 | | | $ | 13.19 | | |
Total Return++ | | | 32.95 | % | | | 3.94 | %# | | | 12.03 | % | | | (15.35 | )% | | | 17.95 | % | | | 11.87 | % | |
Ratios and Supplemental Data: | |
Net Assets, End of Period (Thousands) | | $ | 239,378 | | | $ | 51,415 | | | $ | 58,729 | | | $ | 84,962 | | | $ | 101,662 | | | $ | 93,038 | | |
Ratio of Expenses to Average Net Assets (1) | | | 1.77 | %+ | | | 1.85 | %+††* | | | 2.38 | %+ | | | 2.03 | %+ | | | 2.13 | %+ | | | 2.05 | %+ | |
Ratio of Expenses to Average Net Assets
Excluding Non Operating Expenses | | | N/A | | | | N/A | | | | 2.38 | %+ | | | N/A | | | | N/A | | | | N/A | | |
Ratio of Net Investment Income (Loss) to Average Net Assets (1) | | | 0.54 | %+ | | | (1.23 | )%+††* | | | 1.47 | %+ | | | 2.32 | %+ | | | 1.00 | %+ | | | 1.89 | %+ | |
Ratio of Rebate from Morgan Stanley Affiliates to Average Net Assets | | | 0.01 | % | | | 0.00 | %*§ | | | 0.01 | % | | | 0.00 | %§ | | | 0.00 | %§ | | | 0.01 | % | |
Portfolio Turnover Rate | | | 34 | % | | | 13 | %# | | | 59 | % | | | 60 | % | | | 42 | % | | | 54 | % | |
(1) Supplemental Information on the Ratios to Average Net Assets: | |
Ratios Before Expense Limitation: | |
Expenses to Average Net Assets | | | 1.89 | % | | | 3.31 | %††* | | | 2.47 | % | | | N/A | | | | N/A | | | | N/A | | |
Net Investment Income (Loss) to Average Net Assets | | | 0.42 | % | | | (2.69 | )%††* | | | 1.38 | % | | | N/A | | | | N/A | | | | N/A | | |
† Per share amount is based on average shares outstanding.
‡ Amount is less than $0.005 per share.
++ Calculated based on the net asset value as of the last business day of the period.
+ The Ratios of Expenses and Net Investment Income (Loss) reflect the rebate of certain Portfolio expenses in connection with the investments in Morgan Stanley affiliates during the period. The effect of the rebate on the ratios is disclosed in the above table as "Ratio of Rebate from Morgan Stanley Affiliates to Average Net Assets."
†† Reflects overall Portfolio ratios for investment income and non-class specific expenses.
§ Amount is less than 0.005%.
# Not Annualized.
* Annualized.
The accompanying notes are an integral part of the financial statements.
13
Morgan Stanley Institutional Fund, Inc.
Annual Report — December 31, 2013
Financial Highlights
Frontier Emerging Markets Portfolio
| | | Class A@ | |
Selected Per Share Data and Ratios | | Year Ended
December 31,
2013 | | Period from
November 1,
2012 to
December 31,
2012 | | Period from
September 14
2012^ to
October 31,
2012 | |
Net Asset Value, Beginning of Period | | $ | 14.20 | | | $ | 13.97 | | | $ | 13.76 | | |
Income (Loss) from Investment Operations: | |
Net Investment Loss† | | | (0.15 | ) | | | (0.03 | ) | | | (0.02 | ) | |
Net Realized and Unrealized Gain | | | 4.79 | | | | 0.56 | | | | 0.23 | | |
Total from Investment Operations | | | 4.64 | | | | 0.53 | | | | 0.21 | | |
Distributions from and/or in Excess of: | |
Net Investment Income | | | (0.06 | ) | | | (0.30 | ) | | | — | | |
Redemption Fees | | | 0.00 | ‡ | | | — | | | | — | | |
Net Asset Value, End of Period | | $ | 18.78 | | | $ | 14.20 | | | $ | 13.97 | | |
Total Return++ | | | 32.53 | % | | | 3.77 | %# | | | 1.67 | %# | |
Ratios and Supplemental Data: | |
Net Assets, End of Period (Thousands) | | $ | 23,762 | | | $ | 10 | | | $ | 10 | | |
Ratio of Expenses to Average Net Assets (1) | | | 1.95 | %+^^ | | | 2.10 | %+††* | | | 2.10 | %*+ | |
Ratio of Expenses to Average Net Assets Excluding Non Operating Expenses | | | N/A | | | | N/A | | | | 2.09 | %*+ | |
Ratio of Net Investment Loss to Average Net Assets (1) | | | (0.81 | )%+ | | | (1.48 | )%+††* | | | (0.88 | )%*+ | |
Ratio of Rebate from Morgan Stanley Affiliates to Average Net Assets | | | 0.01 | % | | | 0.00 | %*§ | | | 0.01 | %* | |
Portfolio Turnover Rate | | | 34 | % | | | 13 | %# | | | 59 | %# | |
(1) Supplemental Information on the Ratios to Average Net Assets: | |
Ratios Before Expense Limitation: | |
Expenses to Average Net Assets | | | N/A | | | | 3.56 | %††* | | | 2.92 | %* | |
Net Investment Loss to Average Net Assets | | | N/A | | | | (2.94 | )%††* | | | (1.70 | )%* | |
@ Effective September 9, 2013, Class P and Class H shares were renamed Class A shares.
^ Commencement of Operations.
† Per share amount is based on average shares outstanding.
‡ Amount is less than $0.005 per share.
++ Calculated based on the net asset value which does not reflect sales charges, if applicable, as of the last business day of the period.
+ The Ratios of Expenses and Net Investment Loss reflect the rebate of certain Portfolio expenses in connection with the investments in Morgan Stanley affiliates during the period. The effect of the rebate on the ratios is disclosed in the above table as "Ratio of Rebate from Morgan Stanley Affiliates to Average Net Assets."
^^ Effective September 16, 2013, the Adviser has agreed to limit the ratio of expenses to average net assets to the maximum ratio of 2.20% for Class A shares. Prior to September 16, 2013, the maximum ratio was 2.10% for Class A shares.
†† Reflects overall Portfolio ratios for investment income and non-class specific expenses.
§ Amount is less than 0.005%.
# Not Annualized.
* Annualized.
The accompanying notes are an integral part of the financial statements.
14
Morgan Stanley Institutional Fund, Inc.
Annual Report — December 31, 2013
Financial Highlights
Frontier Emerging Markets Portfolio
| | | Class L | |
Selected Per Share Data and Ratios | | Year Ended
December 31,
2013 | | Period from
November 1,
2012 to
December 31,
2012 | | Period from
September 14
2012^ to
October 31,
2012 | |
Net Asset Value, Beginning of Period | | $ | 14.19 | | | $ | 13.96 | | | $ | 13.76 | | |
Income (Loss) from Investment Operations: | |
Net Investment Loss† | | | (0.16 | ) | | | (0.05 | ) | | | (0.02 | ) | |
Net Realized and Unrealized Gain | | | 4.69 | | | | 0.57 | | | | 0.22 | | |
Total from Investment Operations | | | 4.53 | | | | 0.52 | | | | 0.20 | | |
Distributions from and/or in Excess of: | |
Net Investment Income | | | (0.01 | ) | | | (0.29 | ) | | | — | | |
Redemption Fees | | | 0.00 | ‡ | | | — | | | | — | | |
Net Asset Value, End of Period | | $ | 18.71 | | | $ | 14.19 | | | $ | 13.96 | | |
Total Return++ | | | 31.81 | % | | | 3.71 | %# | | | 1.60 | %# | |
Ratios and Supplemental Data: | |
Net Assets, End of Period (Thousands) | | $ | 3,212 | | | $ | 10 | | | $ | 10 | | |
Ratio of Expenses to Average Net Assets (1) | | | 2.53 | %+^^ | | | 2.60 | %+††* | | | 2.60 | %*+ | |
Ratio of Expenses to Average Net Assets Excluding Non Operating Expenses | | | N/A | | | | N/A | | | | 2.59 | %*+ | |
Ratio of Net Investment Loss to Average Net Assets (1) | | | (0.92 | )%+ | | | (1.98 | )%+††* | | | (1.37 | )%*+ | |
Ratio of Rebate from Morgan Stanley Affiliates to Average Net Assets | | | 0.00 | %§ | | | 0.00 | %*§ | | | 0.01 | %* | |
Portfolio Turnover Rate | | | 34 | % | | | 13 | %# | | | 59 | %# | |
(1) Supplemental Information on the Ratios to Average Net Assets: | |
Ratios Before Expense Limitation: | |
Expenses to Average Net Assets | | | N/A | | | | 4.08 | %††* | | | 3.49 | %* | |
Net Investment Loss to Average Net Assets | | | N/A | | | | (3.46 | )%††* | | | (2.26 | )%* | |
^ Commencement of Operations.
† Per share amount is based on average shares outstanding.
‡ Amount is less than $0.005 per share.
++ Calculated based on the net asset value as of the last business day of the period.
+ The Ratios of Expenses and Net Investment Loss reflect the rebate of certain Portfolio expenses in connection with the investments in Morgan Stanley affiliates during the period. The effect of the rebate on the ratios is disclosed in the above table as "Ratio of Rebate from Morgan Stanley Affiliates to Average Net Assets."
^^ Effective September 16, 2013, the Adviser has agreed to limit the ratio of expenses to average net assets to the maximum ratio of 2.70% for Class L shares. Prior to September 16, 2013, the maximum ratio was 2.60% for Class L shares.
†† Reflects overall Portfolio ratios for investment income and non-class specific expenses.
§ Amount is less than 0.005%.
# Not Annualized.
* Annualized.
The accompanying notes are an integral part of the financial statements.
15
Morgan Stanley Institutional Fund, Inc.
Annual Report — December 31, 2013
Notes to Financial Statements
Morgan Stanley Institutional Fund, Inc. (the "Fund") is registered under the Investment Company Act of 1940, as amended (the "Act"), as an open-end management investment company. The Fund is comprised of twenty-seven separate, active, diversified and non-diversified portfolios (individually referred to as a "Portfolio", collectively as the "Portfolios").
The accompanying financial statements relate to the Frontier Emerging Markets Portfolio. The Portfolio seeks long-term capital appreciation. The Portfolio offers three classes of shares — Class I, Class A and Class L.
On September 17, 2012, the Frontier Emerging Markets Portfolio acquired all of the assets and liabilities of Morgan Stanley Frontier Emerging Markets Fund, Inc. ("Frontier Emerging Markets Fund, Inc."), a closed-end investment company, in exchange for Class I shares of the Portfolio. Based on the respective valuations as of the close of business on September 14, 2012, pursuant to a Plan of Reorganization approved by the shareholders of Frontier Emerging Markets Fund, Inc. on August 22, 2012 ("Reorganization"). The net assets of Frontier Emerging Markets Fund, Inc. before the Reorganization were approximately $91,975,000, including unrealized appreciation of approximately $12,776,000. Immediately after the Reorganization, the net assets of the Portfolio were approximately $91,975,000.
Effective September 9, 2013, Class P and Class H shares were renamed Class A shares.
A. Significant Accounting Policies: The following significant accounting policies are in conformity with U.S. generally accepted accounting principles ("GAAP"). Such policies are consistently followed by the Fund in the preparation of its financial statements. GAAP may require management to make estimates and assumptions that affect the reported amounts and disclosures in the financial statements. Actual results may differ from those estimates.
1. Security Valuation: (1) An equity portfolio security listed or traded on an exchange is valued at its latest reported sales price (or at the exchange official closing price if such exchange reports an official closing price), if there were no sales on a given day, the security is valued at the mean between the last reported bid and asked prices; (2) all other equity portfolio securities for which over-the-counter market quotations are readily available are valued at its latest reported sales price. In cases where a security is traded on more than one exchange, the security is valued on the exchange designated as the primary market; (3) when market quotations are not readily available, including circumstances under which Morgan Stanley Investment Management Inc.
(the "Adviser") determines that the closing price, last sale price or the mean between the last reported bid and asked prices are not reflective of a security's market value, portfolio securities are valued at their fair value as determined in good faith under procedures established by and under the general supervision of the Fund's Board of Directors (the "Directors"). Occasionally, developments affecting the closing prices of securities and other assets may occur between the times at which valuations of such securities are determined (that is, close of the foreign market on which the securities trade) and the close of business of the New York Stock Exchange ("NYSE"). If developments occur during such periods that are expected to materially affect the value of such securities, such valuations may be adjusted to reflect the estimated fair value of such securities as of the close of the NYSE, as determined in good faith by the Directors or by the Adviser using a pricing service and/or procedures approved by the Directors; (4) quotations of foreign portfolio securities, other assets and liabilities and forward contracts stated in foreign currency are translated into U.S. dollar equivalents at the prevailing market rates prior to the close of the NYSE; (5) investments in mutual funds, including the Morgan Stanley Institutional Liquidity Funds, are valued at the net asset value as of the close of each business day; and (6) short-term debt securities with remaining maturities of 60 days or less at the time of purchase may be valued at amortized cost, unless the Adviser determines such valuation does not reflect the securities' market value, in which case these securities will be valued at their fair market value determined by the Adviser.
Under procedures approved by the Directors, the Fund's Adviser has formed a Valuation Committee. The Valuation Committee provides administration and oversight of the Fund's valuation policies and procedures, which are reviewed at least annually by the Directors. These procedures allow the Fund to utilize independent pricing services, quotations from securities and financial instrument dealers, and other market sources to determine fair value.
The Fund has procedures to determine the fair value of securities and other financial instruments for which market prices are not readily available. Under these procedures, the Valuation Committee convenes on a regular and ad hoc basis to review such securities and considers a number of factors, including valuation methodologies and significant unobservable valuation inputs, when arriving at fair value. The Valuation Committee may employ a market-based approach which may use related or
16
Morgan Stanley Institutional Fund, Inc.
Annual Report — December 31, 2013
Notes to Financial Statements (cont'd)
comparable assets or liabilities, recent transactions, market multiples, book values, and other relevant information for the investment to determine the fair value of the investment. An income-based valuation approach may also be used in which the anticipated future cash flows of the investment are discounted to calculate fair value. Discounts may also be applied due to the nature or duration of any restrictions on the disposition of the investments. Due to the inherent uncertainty of valuations of such investments, the fair values may differ significantly from the values that would have been used had an active market existed. The Valuation Committee employs various methods for calibrating these valuation approaches including a regular review of valuation methodologies, key inputs and assumptions, transactional back-testing or disposition analysis, and reviews of any related market activity.
2. Fair Value Measurement: Financial Accounting Standards Board ("FASB") Accounting Standards CodificationTM ("ASC") 820, "Fair Value Measurements and Disclosures" ("ASC 820"), defines fair value as the value that the Fund would receive to sell an investment or pay to transfer a liability in a timely transaction with an independent buyer in the principal market, or in the absence of a principal market the most advantageous market for the investment or liability. ASC 820 establishes a three-tier hierarchy to distinguish between (1) inputs that reflect the assumptions market participants would use in valuing an asset or liability developed based on market data obtained from sources independent of the reporting entity (observable inputs) and (2) inputs that reflect the reporting entity's own assumptions about the assumptions market participants would use in valuing an asset or liability developed based on the best information available in the circumstances (unobservable inputs) and to establish classification of fair value measurements for disclosure purposes. Various inputs are used in determining the value of the Fund's investments. The inputs are summarized in the three broad levels listed below.
• Level 1 – unadjusted quoted prices in active markets for identical investments
• Level 2 – other significant observable inputs (including quoted prices for similar investments, interest rates, prepayment speeds, credit risk, etc.)
• Level 3 – significant unobservable inputs including the Fund's own assumptions in determining the fair value of investments. Factors considered in making this determination may include,
but are not limited to, information obtained by contacting the issuer, analysts, or the appropriate stock exchange (for exchange-traded securities), analysis of the issuer's financial statements or other available documents and, if necessary, available information concerning other securities in similar circumstances
The inputs or methodology used for valuing securities are not necessarily an indication of the risk associated with investing in those securities and the determination of the significance of a particular input to the fair value measurement in its entirety requires judgment and considers factors specific to each security.
The following is a summary of the inputs used to value the Portfolio's investments as of December 31, 2013.
Investment Type | | Level 1
Unadjusted
quoted
prices
(000) | | Level 2
Other
significant
observable
inputs
(000) | | Level 3
Significant
unobservable
inputs
(000) | | Total
(000) | |
Assets: | |
Common Stocks | |
Air Freight & Logistics | | $ | 3,935 | | | $ | — | | | $ | — | | | $ | 3,935 | | |
Airlines | | | 12,025 | | | | — | | | | — | | | | 12,025 | | |
Automobiles | | | 3,136 | | | | — | | | | — | | | | 3,136 | | |
Beverages | | | 8,105 | | | | — | | | | — | | | | 8,105 | | |
Commercial Banks | | | 68,445 | | | | — | | | | — | | | | 68,445 | | |
Construction &
Engineering | | | 5,846 | | | | — | | | | — | | | | 5,846 | | |
Construction Materials | | | 12,137 | | | | — | | | | — | | | | 12,137 | | |
Diversified Financial
Services | | | 4,180 | | | | — | | | | — | | | | 4,180 | | |
Diversified
Telecommunication
Services | | | 12,609 | | | | — | | | | — | | | | 12,609 | | |
Energy Equipment &
Services | | | 9,553 | | | | — | | | | — | | | | 9,553 | | |
Food Products | | | 4,127 | | | | 3,975 | | | | — | | | | 8,102 | | |
Industrial Conglomerates | | | 4,736 | | | | — | | | | — | | | | 4,736 | | |
Oil, Gas & Consumable
Fuels | | | 31,668 | | | | 3,066 | | | | — | | | | 34,734 | | |
Real Estate
Management &
Development | | | 12,227 | | | | — | | | | — | | | | 12,227 | | |
Specialty Retail | | | 6,729 | | | | — | | | | — | | | | 6,729 | | |
Wireless
Telecommunication
Services | | | 8,799 | | | | — | | | | — | | | | 8,799 | | |
Total Common Stocks | | | 208,257 | | | | 7,041 | | | | — | | | | 215,298 | | |
Participation Notes | | | — | | | | 40,998 | | | | — | | | | 40,998 | | |
Short-Term Investment —
Investment Company | | | 16,542 | | | | — | | | | — | | | | 16,542 | | |
Total Assets | | $ | 224,799 | | | $ | 48,039 | | | $ | — | | | $ | 272,838 | | |
Transfers between investment levels may occur as the markets fluctuate and/or the availability of data used in an investment's valuation changes. The Portfolio recognizes
17
Morgan Stanley Institutional Fund, Inc.
Annual Report — December 31, 2013
Notes to Financial Statements (cont'd)
transfers between the levels as of the end of the period. As of December 31, 2013, securities with a total value of approximately $93,364,000 transferred from Level 2 to Level 1. At December 31, 2012, the fair value of certain securities were adjusted due to developments which occurred between the time of the close of the foreign markets on which they trade and the close of business on the NYSE which resulted in their Level 2 classification.
3. Foreign Currency Translation: The books and records of the Portfolio are maintained in U.S. dollars. Foreign currency amounts are translated into U.S. dollars as follows:
– investments, other assets and liabilities at the prevailing rate of exchange on the valuation date;
– investment transactions and investment income at the prevailing rates of exchange on the dates of such transactions.
Although the net assets of the Portfolio are presented at the foreign exchange rates and market values at the close of the period, the Portfolio does not isolate that portion of the results of operations arising as a result of changes in the foreign exchange rates from the fluctuations arising from changes in the market prices of securities held at period end. Similarly, the Portfolio does not isolate the effect of changes in foreign exchange rates from the fluctuations arising from changes in the market prices of securities sold during the period. Accordingly, realized and unrealized foreign currency gains (losses) on investments in securities are included in the reported net realized and unrealized gains (losses) on investment transactions and balances. However, pursuant to U.S. Federal income tax regulations, gains and losses from certain foreign currency transactions and the foreign currency portion of gains and losses realized on sales and maturities of foreign denominated debt securities are treated as ordinary income for U.S. Federal income tax purposes.
Net realized gains (losses) on foreign currency transactions represent net foreign exchange gains (losses) from foreign currency forward exchange contracts, disposition of foreign currencies, currency gains (losses) realized between the trade and settlement dates on securities transactions, and the difference between the amount of investment income and foreign withholding taxes recorded on the Portfolio's books and the U.S. dollar
equivalent amounts actually received or paid. Net unrealized currency gains (losses) from valuing foreign currency denominated assets and liabilities at period end exchange rates are reflected as a component of unrealized appreciation (depreciation) on the Statement of Assets and Liabilities. The change in unrealized currency gains (losses) on foreign currency translations for the period is reflected in the Statement of Operations.
A significant portion of the Portfolio's net assets consist of securities of issuers located in emerging markets, which are denominated in foreign currencies. Such securities may be concentrated in a limited number of countries and regions and may vary throughout the year. Changes in currency exchange rates will affect the value of and investment income from foreign currency denominated securities. Emerging market securities are often subject to greater price volatility, limited capitalization and liquidity, and higher rates of inflation than U.S. securities. In addition, emerging market issuers may be subject to substantial governmental involvement in the economy and greater social, economic and political uncertainty.
The net assets of the Portfolio include foreign denominated securities and currency. Changes in currency exchange rates will affect the U.S. Dollar value of and investment income from such securities.
Governmental approval for foreign investments may be required in advance of making an investment under certain circumstances in some countries, and the extent of foreign investments in domestic companies may be subject to limitation in other countries. Foreign ownership limitations also may be imposed by the charters of individual companies to prevent, among other concerns, violations of foreign investment limitations. As a result, an additional class of shares (identified as "Foreign" in the Portfolio of Investments) may be created and offered for investment. The "local" and "foreign shares" market values may differ. In the absence of trading of the foreign shares in such markets, the Portfolio values the foreign shares at the closing exchange price of the local shares.
4. Structured Investments: The Portfolio invested a portion of its assets in structured investments. A structured investment is a derivative security designed to offer a return linked to a particular underlying security, currency, commodity or market. Structured investments may come
18
Morgan Stanley Institutional Fund, Inc.
Annual Report — December 31, 2013
Notes to Financial Statements (cont'd)
in various forms including notes (such as exchange-traded notes), warrants and options to purchase securities. The Portfolio will typically use structured investments to gain exposure to a permitted underlying security, currency, commodity or market when direct access to a market is limited or inefficient from a tax or cost standpoint. Investments in structured investments involve risks including issuer risk, counterparty risk and market risk. Holders of structured investments bear risks of the underlying investment and are subject to issuer or counterparty risk because the Portfolio is relying on the creditworthiness of such issuer or counterparty and has no rights with respect to the underlying investment. Certain structured investments may be thinly traded or have a limited trading market and may have the effect of increasing the Portfolio's illiquidity to the extent that the Portfolio, at a particular time, may be unable to find qualified buyers for these securities.
5. Redemption Fees: The Portfolio will assess a 2% redemption fee, on Class I shares, Class A shares and Class L shares, which is paid directly to the Portfolio, for shares redeemed or exchanged within thirty days of purchase, subject to certain exceptions. The redemption fee is designed to protect the Portfolio and its remaining shareholders from the effects of short-term trading. These fees, if any, are included in the Statements of Changes in Net Assets.
6. Indemnifications: The Fund enters into contracts that contain a variety of indemnifications. The Fund's maximum exposure under these arrangements is unknown. However, the Fund has not had prior claims or losses pursuant to these contracts and expects the risk of loss to be remote.
7. Dividends and Distributions to Shareholders: Dividend income and distributions to shareholders are recorded on the ex-dividend date. Dividends from net investment income, if any, are declared and paid semiannually. Net realized capital gains, if any, are distributed at least annually.
8. Security Transactions, Income and Expenses: Security transactions are accounted for on the trade date (date the order to buy or sell is executed). Realized gains and losses on the sale of investment securities are determined on the specific identified cost method. Dividend income and other distributions are recorded on the ex-dividend date (except for certain foreign dividends which may be recorded as
soon as the Portfolio is informed of such dividends) net of applicable withholding taxes. Interest income is recognized on the accrual basis except where collection is in doubt. Discounts are accreted and premiums are amortized over the life of the respective securities. Most expenses of the Fund can be directly attributed to a particular Portfolio. Expenses which cannot be directly attributed are apportioned among the Portfolios based upon relative net assets or other appropriate methods. Income, expenses (other than class specific expenses — distribution, transfer agency and sub transfer agency fees) and realized and unrealized gains or losses are allocated to each class of shares based upon their relative net assets.
B. Advisory Fees: The Adviser, a wholly-owned subsidiary of Morgan Stanley, provides the Portfolio with advisory services under the terms of an Investment Advisory Agreement, paid quarterly, at an annual rate of 1.25% of the average daily net assets of the Portfolio.
The Adviser has agreed to reduce its advisory fee and/or reimburse the Portfolio so that total annual portfolio operating expenses, excluding certain investment related expenses, taxes, interest and other extraordinary expenses (including litigation), will not exceed 1.85% for Class I shares, 2.10% for Class A shares and 2.60% for Class L shares. Effective September 16, 2013, the Adviser has agreed to limit the ratio of expenses to average net assets to the maximum ratio of 2.20% and 2.70% for Class A and Class L shares, respectively. The fee waivers and/or expense reimbursements will continue for at least one year or until such time that the Directors act to discontinue all or a portion of such waivers and/or reimbursements when it deems such action is appropriate. For the year ended December 31, 2013, approximately $118,000 of advisory fees were waived and less than $500 of other expenses were reimbursed by the Adviser pursuant to this arrangement.
C. Administration Fees: The Adviser also serves as Administrator to the Fund and provides administrative services pursuant to an Administration Agreement for an annual fee, accrued daily and paid monthly, of 0.08% of the Portfolio's average daily net assets. Under a Sub-Administration Agreement between the Administrator and State Street Bank and Trust Company ("State Street"), State Street provides certain administrative services to the Fund. For such services, the Administrator pays State Street a portion of the fee the Administrator receives from the Portfolio.
19
Morgan Stanley Institutional Fund, Inc.
Annual Report — December 31, 2013
Notes to Financial Statements (cont'd)
D. Distribution and Shareholder Services Fees: Morgan Stanley Distribution, Inc. ("MSDI" or the "Distributor"), a wholly-owned subsidiary of the Adviser, and an indirect subsidiary of Morgan Stanley, serves as the Fund's Distributor of Portfolio shares pursuant to a Distribution Agreement. The Fund has adopted a Shareholder Services Plan with respect to Class A shares pursuant to Rule 12b-1 under the Act. Under the Shareholder Services Plan, the Portfolio pays the Distributor a shareholder services fee, accrued daily and paid monthly, at an annual rate of 0.25% of the Portfolio's average daily net assets attributable to Class A shares.
The Fund has adopted a Distribution and Shareholder Services Plan with respect to Class L shares pursuant to Rule 12b-1 under the Act. Under the Distribution and Shareholder Services Plan, the Portfolio pays the Distributor a distribution fee, accrued daily and paid monthly, at an annual rate of 0.50% and a shareholder services fee, accrued daily and paid monthly, at an annual rate of 0.25% of the Portfolio's average daily net assets attributable to Class L shares.
The distribution and shareholder services fees are used to support the expenses associated with servicing and maintaining accounts. The Distributor may compensate other parties for providing shareholder support services to investors who purchase Class A and Class L shares.
E. Dividend Disbursing and Transfer Agent: The Fund's dividend disbursing and transfer agent was Morgan Stanley Services Company Inc. ("Morgan Stanley Services"). Pursuant to a Transfer Agency Agreement, the Fund paid Morgan Stanley Services a fee based on the number of classes, accounts and transactions relating to the Portfolios of the Fund. Effective July 1, 2013, the Directors approved changing the transfer agent to Boston Financial Data Services, Inc.
F. Custodian Fees: State Street (the "Custodian") serves as Custodian for the Fund in accordance with a Custodian Agreement. The Custodian holds cash, securities, and other assets of the Fund as required by the Act. Custody fees are payable monthly based on assets held in custody, investment purchases and sales activity and account maintenance fees, plus reimbursement for certain out-of-pocket expenses.
G. Security Transactions and Transactions with Affiliates: For the year ended December 31, 2013, purchases and sales of investment securities for the Portfolio, other than long-term U.S. Government securities and short-term investments, were approximately $211,829,000 and $37,251,000, respectively. There were no purchases and sales
of long-term U.S. Government securities for the year ended December 31, 2013.
The Portfolio invests in the Institutional Class of the Morgan Stanley Institutional Liquidity Funds — Money Market Portfolio (the "Liquidity Funds"), an open-end management investment company managed by the Adviser. Advisory fees paid by the Portfolio are reduced by an amount equal to its pro-rata share of the advisory and administration fees paid by the Portfolio due to its investment in the Liquidity Funds. For the year ended December 31, 2013, advisory fees paid were reduced by approximately $10,000 relating to the Portfolio's investment in the Liquidity Funds.
A summary of the Portfolio's transactions in shares of the Liquidity Funds during the year ended December 31, 2013 is as follows:
Value
December 31,
2012
(000) | | Purchases
at Cost
(000) | | Sales
(000) | | Dividend
Income
(000) | | Value
December 31,
2013
(000) | |
| $ | 1,948 | | | $ | 135,859 | | | $ | 121,265 | | | $ | 6 | | | $ | 16,542 | | |
During the year ended December 31, 2013, the Portfolio incurred approximately $14,000 in brokerage commissions with Morgan Stanley & Co., LLC, an affiliate of the Adviser, Administrator and Distributor, for portfolio transactions executed on behalf of the Portfolio.
From January 1, 2013 to June 30, 2013, the Portfolio incurred approximately $3,000 in brokerage commissions with Citigroup, Inc., and its affiliated broker-dealers, which may be deemed affiliates of the Adviser, Administrator and Distributor under Section 17 of the Act, for portfolio transactions executed on behalf of the Portfolio. Citigroup, Inc. and its affiliated broker-dealers ceased to be affiliates of the Portfolio pursuant to Section 17 of the Act as of July 1, 2013.
The Portfolio has an unfunded Deferred Compensation Plan (the "Compensation Plan"), which allows each independent Director to defer payment of all, or a portion, of the fees he or she receives for serving on the Board of Directors. Each eligible Director generally may elect to have the deferred amounts credited with a return equal to the total return on one or more of the Morgan Stanley funds that are offered as investment options under the Compensation Plan. Appreciation/depreciation and distributions received from these investments are recorded with an offsetting increase/decrease in the deferred compensation obligation and do not affect the net asset value of the Portfolio.
20
Morgan Stanley Institutional Fund, Inc.
Annual Report — December 31, 2013
Notes to Financial Statements (cont'd)
H. Federal Income Taxes: It is the Portfolio's intention to continue to qualify as a regulated investment company and distribute all of its taxable and tax-exempt income. Accordingly, no provision for Federal income taxes is required in the financial statements.
The Portfolio may be subject to taxes imposed by countries in which it invests. Such taxes are generally based on income and/or capital gains earned or repatriated. Taxes are accrued based on net investment income, net realized gains and net unrealized appreciation as such income and/or gains are earned. Taxes may also be based on transactions in foreign currency and are accrued based on the value of investments denominated in such currency.
FASB ASC 740-10 "Income Taxes — Overall" sets forth a minimum threshold for financial statement recognition of the benefit of a tax position taken or expected to be taken in a tax return. Management has concluded there are no significant uncertain tax positions that would require recognition in the financial statements. If applicable, the Portfolio recognizes interest accrued related to unrecognized tax benefits in "Interest Expense" and penalties in "Other Expenses" in the Statement of Operations. The Portfolio files tax returns with the U.S. Internal Revenue Service, New York and various states. Generally, each of the tax periods from the tax period ended October 31, 2011 through the tax period ended December 31, 2013, remains subject to examination by taxing authorities.
The tax character of distributions paid may differ from the character of distributions shown in the Statements of Changes in Net Assets due to short-term capital gains being treated as ordinary income for tax purposes. The tax character of distributions paid during fiscal years 2013 and 2012 was as follows:
Year Ended
December 31, 2013
Distributions
Paid From: | | Period from
November 1
through
December 31, 2012
Distributions
Paid From: | | Year Ended
October 31, 2012
Distributions
Paid From: | |
Ordinary
Income
(000) | | Long-Term
Capital Gain
(000) | | Ordinary
Income
(000) | | Long-Term
Capital Gain
(000) | | Ordinary
Income
(000) | | Long-Term
Capital Gain
(000) | |
| $ | 915 | | | | — | | | $ | 1,093 | | | | — | | | $ | 1,445 | | | | — | | |
The amount and character of income and gains to be distributed are determined in accordance with income tax regulations which may differ from GAAP. These book/tax differences are either considered temporary or permanent in nature.
Temporary differences are attributable to differing book and tax treatments for the timing of the recognition of gains
(losses) on certain investment transactions and the timing of the deductibility of certain expenses.
Permanent differences, primarily due to differing treatments of gains (losses) related to foreign currency transactions, basis adjustments on certain equity securities designated as passive foreign investment companies and foreign taxes paid on capital gains, resulted in the following reclassifications among the components of net assets at December 31, 2013:
Distributions in
Excess of
Net Investment
Income
(000) | | Accumulated
Net Realized
Loss
(000) | | Paid-in-
Capital
(000) | |
| $ | (231 | ) | | $ | 296 | | | $ | (65 | ) | |
At December 31, 2013, the components of distributable earnings for the Portfolio on a tax basis were as follows:
Undistributed
Ordinary
Income
(000) | | Undistributed
Long-Term
Capital Gain
(000) | |
| $ | 323 | | | | — | | |
At December 31, 2013, the aggregate cost for Federal income tax purposes is $239,404,000. The aggregate gross unrealized appreciation is $35,523,000 and the aggregate gross unrealized depreciation is $2,089,000, resulting in net unrealized appreciation of $33,434,000.
At December 31, 2013, the Portfolio had available for Federal income tax purposes unused capital losses which will expire on the indicated dates:
Amount
(000) | | Expiration | |
| $ | 4,750 | | | December 31, 2015 | |
| | 26,532 | | | December 31, 2016 | |
| | 4,191 | | | December 31, 2017 | |
To the extent that capital loss carryforwards are used to offset any future capital gains realized during the carryover period as provided by U.S. Federal income tax regulations, no capital gains tax liability will be incurred by the Portfolio for gains realized and not distributed. To the extent that capital gains are offset, such gains will not be distributed to the shareholders. During the year ended December 31, 2013, the Portfolio utilized capital loss carryforwards for U. S. Federal income tax purposes of approximately $3,832,000.
Capital losses and specified ordinary losses, including currency losses, incurred after October 31 but within the taxable year are deemed to arise on the first day of the Portfolio's next taxable year. For the year ended December 31, 2013, the Portfolio
21
Morgan Stanley Institutional Fund, Inc.
Annual Report — December 31, 2013
Notes to Financial Statements (cont'd)
deferred to January 1, 2014 for U.S. Federal income tax purposes the following losses:
Post-October
Currency and
Specified Ordinary
Losses
(000) | | Post-October
Capital Losses
(000) | |
| | — | | | $ | 893 | | |
I. Other (unaudited): At December 31, 2013, the Portfolio had otherwise unaffiliated record owners of 10% or greater. Investment activities of these shareholders could have a material impact on the Portfolio. The aggregate percentage of such owners was 50% and 80% for Class I and Class A shares, respectively.
J. Results of Special Shareholder Meeting (unaudited): On June 5, 2013 as adjourned to June 24, 2013, a Joint Special Shareholder Meeting was held for Class H shareholders of the Portfolio to approve the Articles of Amendment to the Fund's Articles of Amendment and Restatement and a Plan of Reclassification for the Portfolio pursuant to which Class H shares would be reclassified as Class P shares. The results with respect to this proposal were as follows:
| For | | Against | | Abstain | |
| | 9,992 | | | | 0 | | | | 0 | | |
K. Accounting Pronouncement: In June 2013, FASB issued Accounting Standards Update 2013-08 Financial Services — Investment Companies (Topic 946) — Amendments to the Scope, Measurement, and Disclosure Requirements ("ASU 2013-08") which is effective for interim and annual reporting periods in fiscal years that begin after December 15, 2013. ASU 2013-08 sets forth a methodology for determining whether an entity should be characterized as an investment company and prescribes fair value accounting for an investment company's non-controlling ownership interest in another investment company. FASB has determined that a fund registered under the Investment Company Act of 1940 automatically meets ASU 2013-08's criteria for an investment company. Although still evaluating the potential impacts of ASU 2013-08 to the Portfolio, management expects that the impact of the Portfolio's adoption will be limited to additional financial statement disclosures.
22
Morgan Stanley Institutional Fund, Inc.
Annual Report — December 31, 2013
Report of Independent Registered Public Accounting Firm
To the Shareholders and Board of Directors of
Morgan Stanley Institutional Fund, Inc. —
Frontier Emerging Markets Portfolio
We have audited the accompanying statement of assets and liabilities, including the portfolio of investments, of Frontier Emerging Markets Portfolio (one of the portfolios constituting Morgan Stanley Institutional Fund, Inc.) (the "Portfolio") as of December 31, 2013, and the related statement of operations for the year then ended, and the statements of changes in net assets and the financial highlights for each of the periods indicated therein. These financial statements and financial highlights are the responsibility of the Portfolio's management. Our responsibility is to express an opinion on these financial statements and financial highlights based on our audits.
We conducted our audits in accordance with the standards of the Public Company Accounting Oversight Board (United States). Those standards require that we plan and perform the audit to obtain reasonable assurance about whether the financial statements and financial highlights are free of material misstatement. We were not engaged to perform an audit of the Portfolio's internal control over financial reporting. Our audits included consideration of internal control over financial reporting as a basis for designing audit procedures that are appropriate in the circumstances, but not for the purpose of expressing an opinion on the effectiveness of the Portfolio's internal control over financial reporting. Accordingly, we express no such opinion. An audit also includes examining, on a test basis, evidence supporting the amounts and disclosures in the financial statements and financial highlights, assessing the accounting principles used and significant estimates made by management, and evaluating the overall financial statement presentation. Our procedures included confirmation of securities owned as of December 31, 2013, by correspondence with the custodian and others or by other appropriate auditing procedures where replies from others were not received. We believe that our audits provide a reasonable basis for our opinion.
In our opinion, the financial statements and financial highlights referred to above present fairly, in all material respects, the financial position of Frontier Emerging Markets Portfolio (one of the portfolios constituting Morgan Stanley Institutional Fund, Inc.) at December 31, 2013, the results of its operations for the year then ended and the changes in its net assets and the financial highlights for each of the periods indicated therein, in conformity with U.S. generally accepted accounting principles.

Boston, Massachusetts
February 26, 2014
23
Morgan Stanley Institutional Fund, Inc.
Annual Report — December 31, 2013
Federal Tax Notice (unaudited)
For Federal income tax purposes, the following information is furnished with respect to the Portfolio's earnings for its taxable period ended December 31, 2013. When distributed, certain earnings may be subject to a maximum tax rate of 15% as provided for the Jobs and Growth Tax Relief Reconciliation Act of 2003. The Portfolio designated up to a maximum of $938,000 as taxable at this lower rate.
The Portfolio intends to pass through foreign tax credits of approximately $140,000 and has derived net income from sources within foreign countries amounting to approximately $2,563,000.
In January, the Portfolio provides tax information to shareholders for the preceding calendar year.
24
Morgan Stanley Institutional Fund, Inc.
Annual Report — December 31, 2013
U.S. Privacy Policy (unaudited)
AN IMPORTANT NOTICE CONCERNING OUR U.S. PRIVACY POLICY
This privacy notice describes the U.S. privacy policy of Morgan Stanley Distribution, Inc., and the Morgan Stanley family of mutual funds ("us", "our", "we").
We are required by federal law to provide you with notice of our U.S. privacy policy ("Policy"). This Policy applies to both our current and former clients unless we state otherwise and is intended for individual clients who purchase products or receive services from us for personal, family or household purposes. This Policy is not applicable to partnerships, corporations, trusts or other non-individual clients or account holders, nor is this Policy applicable to individuals who are either beneficiaries of a trust for which we serve as trustee or participants in an employee benefit plan administered or advised by us. This Policy is, however, applicable to individuals who select us to be a custodian of securities or assets in individual retirement accounts, 401(k) accounts, or accounts subject to the Uniform Gifts to Minors Act.
This notice sets out our business practices to protect your privacy; how we collect and share personal information about you; and how you can limit our sharing or certain uses by others of this information. We may amend this Policy at any time, and will inform you of any changes to our Policy as required by law.
WE RESPECT YOUR PRIVACY
We appreciate that you have provided us with your personal financial information and understand your concerns about your information. We strive to safeguard the information our clients entrust to us. Protecting the confidentiality and security of client information is an important part of how we conduct our business.
This notice describes what personal information we collect about you, how we collect it, when we may share it with others, and how certain others may use it. It discusses the steps you may take to limit our sharing of certain information about you with our affiliated companies, including, but not limited to our affiliated banking businesses, brokerage firms and credit service affiliates. It also discloses how you may limit our affiliates' use of shared information for marketing purposes.
Throughout this Policy, we refer to the nonpublic information that personally identifies you as "personal information." We also use the term "affiliated company" in this notice. An affiliated company is a company in our family of companies and includes companies with the Morgan Stanley name. These affiliated companies are financial institutions such as broker-dealers, banks, investment advisers and credit card issuers. We refer to any company that is not an affiliated company as a nonaffiliated third party. For purposes of Section 5 of this notice, and your ability to limit certain uses of personal information by our affiliates, this notice applies to the use of personal information by our affiliated companies.
1. WHAT PERSONAL INFORMATION DO WE COLLECT FROM YOU?
We may collect the following types of information about you: (i) information provided by you, including information from applications and other forms we receive from you, (ii) information about your transactions with us or our affiliates, (iii) information about your transactions with nonaffiliated third parties, (iv) information from consumer reporting agencies, (v) information obtained from our websites, and (vi) information obtained from other sources. For example:
• We collect information such as your name, address, e-mail address, telephone/fax numbers, assets, income and investment objectives through applications and other forms you submit to us.
• We may obtain information about account balances, your use of account(s) and the types of products and services you prefer to receive from us through your dealings and transactions with us and other sources.
• We may obtain information about your creditworthiness and credit history from consumer reporting agencies.
• We may collect background information from and through third-party vendors to verify representations you have made and to comply with various regulatory requirements.
2. WHEN DO WE DISCLOSE PERSONAL INFORMATION WE COLLECT ABOUT YOU?
We may disclose personal information we collect about you in each of the categories listed above to affiliated and nonaffiliated third parties.
25
Morgan Stanley Institutional Fund, Inc.
Annual Report — December 31, 2013
U.S. Privacy Policy (unaudited) (cont'd)
a. Information we disclose to affiliated companies.
We may disclose personal information that we collect about you to our affiliated companies to manage your account(s) effectively, to service and process your transactions, and to let you know about products and services offered by us and affiliated companies, to manage our business, and as otherwise required or permitted by law. Offers for products and services from affiliated companies are developed under conditions designed to safeguard your personal information.
b. Information we disclose to third parties.
We may disclose personal information that we collect about you to nonaffiliated third parties to provide marketing services on our behalf or to other financial institutions with whom we have joint marketing agreements. We may also disclose all of the information we collect to other nonaffiliated third parties for our everyday business purposes, such as to process transactions, maintain account(s), respond to court orders and legal investigations, report to credit bureaus, offer our own products and services, protect against fraud, for institutional risk control, to perform services on our behalf, and as otherwise required or permitted by law.
When we share personal information about you with a nonaffiliated third party, they are required to limit their use of personal information about you to the particular purpose for which it was shared and they are not allowed to share personal information about you with others except to fulfill that limited purpose or as may be permitted or required by law.
3. HOW DO WE PROTECT THE SECURITY AND CONFIDENTIALITY OF PERSONAL INFORMATION WE COLLECT ABOUT YOU?
We maintain physical, electronic and procedural security measures that comply with applicable law and regulations to help safeguard the personal information we collect about you. We have internal policies governing the proper handling of client information by employees. Third parties that provide support or marketing services on our behalf may also receive personal information about you, and we require them to adhere to appropriate security standards with respect to such information.
4. HOW CAN YOU LIMIT OUR SHARING CERTAIN PERSONAL INFORMATION ABOUT YOU WITH OUR AFFILIATED COMPANIES FOR ELIGIBILITY DETERMINATION?
By following the opt-out procedures in Section 6 below, you may limit the extent to which we share with our affiliated companies, personal information that was collected to determine your eligibility for products and services such as your credit reports and other information that you have provided to us or that we may obtain from third parties ("eligibility information"). Eligibility information does not include your identification information or personal information pertaining to our transactions or experiences with you. Please note that, even if you direct us not to share eligibility information with our affiliated companies, we may still share your personal information, including eligibility information, with our affiliated companies under circumstances that are permitted under applicable law, such as to process transactions or to service your account.
5. HOW CAN YOU LIMIT THE USE OF CERTAIN PERSONAL INFORMATION ABOUT YOU BY OUR AFFILIATED COMPANIES FOR MARKETING?
By following the opt-out instructions in Section 6 below, you may limit our affiliated companies from marketing their products or services to you based on personal information we disclose to them. This information may include, for example, your income and account history with us. Please note that, even if you choose to limit our affiliated companies from using personal information about you that we may share with them for marketing their products and services to you, our affiliated companies may use your personal information that they obtain from us to market to you in circumstances permitted by law, such as if the affiliated party has its own relationship with you.
26
Morgan Stanley Institutional Fund, Inc.
Annual Report — December 31, 2013
U.S. Privacy Policy (unaudited) (cont'd)
6. HOW CAN YOU SEND US AN OPT-OUT INSTRUCTION?
If you wish to limit our sharing of eligibility information about you with our affiliated companies, or our affiliated companies' use of personal information for marketing purposes, as described in this notice, you may do so by:
• Calling us at (800) 548-7786
Monday–Friday between 8a.m. and 5p.m. (EST)
• Writing to us at the following address:
Boston Financial Data Services, Inc.
c/o Privacy Coordinator
P.O. Box 219804
Kansas City, Missouri 64121
If you choose to write to us, your request should include: your name, address, telephone number and account number(s) to which the opt-out applies and whether you are opting out with respect to sharing of eligibility information (Section 4 above), or information used for marketing (Section 5 above), or both. Written opt-out requests should not be sent with any other correspondence. In order to process your request, we require that the request be provided by you directly and not through a third party. Once you have informed us about your privacy preferences, your opt-out preference will remain in effect with respect to this Policy (as it may be amended) until you notify us otherwise. If you are a joint account owner, we will accept instructions from any one of you and apply those instructions to the entire account.
Please understand that if you limit our sharing or our affiliated companies' use of personal information, you and any joint account holder(s) may not receive information about our affiliated companies' products and services, including products or services that could help you manage your financial resources and achieve your investment objectives.
If you have more than one account or relationship with us, please specify the accounts to which you would like us to apply your privacy choices. If you have accounts or relationships with our affiliates, you may receive multiple privacy policies from them, and will need to separately notify those companies of your privacy choices for those accounts or relationships.
7. WHAT IF AN AFFILIATED COMPANY BECOMES A NONAFFILIATED THIRD PARTY?
If, at any time in the future, an affiliated company becomes a nonaffiliated third party, further disclosures of personal information made to the former affiliated company will be limited to those described in Section 2(b) above relating to nonaffiliated third parties. If you elected under Section 6 to limit disclosures we make to affiliated companies, or use of personal information by affiliated companies, your election will not apply to use by any former affiliated company of your personal information in their possession once it becomes a nonaffiliated third party.
SPECIAL NOTICE TO RESIDENTS OF VERMONT
The following section supplements our Policy with respect to our individual clients who have a Vermont address and supersedes anything to the contrary in the above Policy with respect to those clients only.
The State of Vermont requires financial institutions to obtain your consent prior to sharing personal information that they collect about you with nonaffiliated third parties, or eligibility information with affiliated companies, other than in certain limited circumstances. Except as permitted by law, we will not share personal information we collect about you with nonaffiliated third parties or eligibility information with affiliated companies, unless you provide us with your written consent to share such information.
SPECIAL NOTICE TO RESIDENTS OF CALIFORNIA
The following section supplements our Policy with respect to our individual clients who have a California address and supersedes anything to the contrary in the above Policy with respect to those clients only.
In response to a California law, if your account has a California home address, your personal information will not be disclosed to nonaffiliated third parties except as permitted by applicable California law, and we will limit sharing such personal information with our affiliates to comply with California privacy laws that apply to us.
27
Morgan Stanley Institutional Fund, Inc.
Annual Report — December 31, 2013
Director and Officer Information (unaudited)
Independent Director:
Name, Age and Address of
Independent Director | | Position(s)
Held with
Registrant | | Length of Time
Served* | | Principal Occupation(s) During Past 5 Years | | Number of
Portfolios in
Fund Complex
Overseen by
Independent
Director** | | Other Directorships
Held by Independent
Director*** | |
Frank L. Bowman (69)
c/o Kramer Levin Naftalis &
Frankel LLP
Counsel to the Independent
Directors
1177 Avenue of the Americas
New York, NY 10036 | | Director | | Since
August
2006 | | President, Strategic Decisions, LLC (consulting) (since February 2009); Director or Trustee of various Morgan Stanley Funds (since August 2006); Chairperson of the Insurance Sub-Committee of the Compliance and Insurance Committee (since February 2007); served as President and Chief Executive Officer of the Nuclear Energy Institute (policy organization) (February 2005-November 2008); retired as Admiral, U.S. Navy after serving over 38 years on active duty including 8 years as Director of the Naval Nuclear Propulsion Program in the Department of the Navy and the U.S. Department of Energy (1996-2004); served as Chief of Naval Personnel (July 1994-September 1996); and on the Joint Staff as Director of Political Military Affairs (June 1992-July 1994); knighted as Honorary Knight Commander of the Most Excellent Order of the British Empire; awarded the Officier de l'Orde National du Mérite by the French Government; elected to the National Academy of Engineering (2009). | | | 98 | | | Director of BP p.l.c.; Director of Naval and Nuclear Technologies LLP; Director of the Armed Services YMCA of the USA and the U.S. Naval Submarine League; Director of the American Shipbuilding Suppliers Association; Member of the National Security Advisory Council of the Center for U.S. Global Engagement and a member of the CNA Military Advisory Board; Chairman of the Charity J Street Cup Golf; Trustee of Fairhaven United Methodist Church. | |
Michael Bozic (73)
c/o Kramer Levin Naftalis & Frankel LLP
Counsel to the Independent Directors
1177 Avenue of the Americas New York, NY 10036 | | Director | | Since
April
1994 | | Private investor and a member of the advisory board of American Road Group LLC (retail) (since June 2000); Chairperson of the Compliance and Insurance Committee (since October 2006); Director or Trustee of various Morgan Stanley Funds (since April 1994); formerly, Chairperson of the Insurance Committee (July 2006-September 2006); Vice Chairman of Kmart Corporation (December 1998-October 2000); Chairman and Chief Executive Officer of Levitz Furniture Corporation (November 1995-November 1998) and President and Chief Executive Officer of Hills Department Stores (May 1991-July 1995); variously Chairman, Chief Executive Officer, President and Chief Operating Officer (1987-1991) of the Sears Merchandise Group of Sears, Roebuck & Co. | | | 100 | | | Trustee and member of the Hillsdale College Board of Trustees. | |
Kathleen A. Dennis (60)
c/o Kramer Levin Naftalis & Frankel LLP
Counsel to the Independent Directors
1177 Avenue of the Americas New York, NY 10036 | | Director | | Since
August
2006 | | President, Cedarwood Associates (mutual fund and investment management consulting) (since July 2006); Chairperson of the Money Market and Alternatives Sub-Committee of the Investment Committee (since October 2006) and Director or Trustee of various Morgan Stanley Funds (since August 2006); formerly, Senior Managing Director of Victory Capital Management (1993-2006). | | | 98 | | | Director of various non-profit organizations. | |
Dr. Manuel H. Johnson (65)
c/o Johnson Smick
International, Inc.
220 I Street, NE
Suite 200
Washington, D.C. 20002 | | Director | | Since
July
1991 | | Senior Partner, Johnson Smick International, Inc. (consulting firm); Chairperson of the Investment Committee (since October 2006) and Director or Trustee of various Morgan Stanley Funds (since July 1991); Co-Chairman and a founder of the Group of Seven Council (G7C) (international economic commission); formerly, Chairperson of the Audit Committee (July 1991-September 2006); Vice Chairman of the Board of Governors of the Federal Reserve System and Assistant Secretary of the U.S. Treasury. | | | 101 | | | Director of NVR, Inc. (home construction). | |
28
Morgan Stanley Institutional Fund, Inc.
Annual Report — December 31, 2013
Director and Officer Information (unaudited) (cont'd)
Independent Director: (cont'd)
Name, Age and Address of
Independent Director | | Position(s)
Held with
Registrant | | Length of Time
Served* | | Principal Occupation(s) During Past 5 Years | | Number of
Portfolios in
Fund Complex
Overseen by
Independent
Director** | | Other Directorships
Held by Independent
Director*** | |
Joseph J. Kearns (71)
c/o Kearns & Associates LLC PMB754
22631 Pacific Coast Highway
Malibu, CA 90265 | | Director | | Since
August
1994 | | President, Kearns & Associates LLC (investment consulting); Chairperson of the Audit Committee (since October 2006) and Director or Trustee of various Morgan Stanley Funds (since August 1994); formerly, Deputy Chairperson of the Audit Committee (July 2003-September 2006) and Chairperson of the Audit Committee of various Morgan Stanley Funds (since August 1994); CFO of the J. Paul Getty Trust. | | | 101 | | | Director of Electro Rent Corporation (equipment leasing) and The Ford Family Foundation. | |
Michael F. Klein (55)
c/o Kramer Levin Naftalis & Frankel LLP
Counsel to the Independent Directors
1177 Avenue of the Americas New York, NY 10036 | | Director | | Since
August
2006 | | Managing Director, Aetos Capital, LLC (since March 2000) and Co-President, Aetos Alternatives Management, LLC (since January 2004) and Co-Chief Executive Officer of Aetos Capital LLC (since August 2013); Chairperson of the Fixed Income Sub-Committee of the Investment Committee (since October 2006) and Director or Trustee of various Morgan Stanley Funds (since August 2006); formerly, Managing Director, Morgan Stanley & Co. Inc. and Morgan Stanley Dean Witter Investment Management, President, various Morgan Stanley Funds (June 1998-March 2000) and Principal, Morgan Stanley & Co. Inc. and Morgan Stanley Dean Witter Investment Management (August 1997-December 1999). | | | 98 | | | Director of certain investment funds managed or sponsored by Aetos Capital, LLC. Director of Sanitized AG and Sanitized Marketing AG (specialty chemicals). | |
Michael E. Nugent (77)
522 Fifth Avenue
New York, NY 10036 | | Chairperson
of the
Board and Director | | Chairperson of the Boards since July 2006 and Director since July 1991 | | Chairperson of the Boards of various Morgan Stanley Funds (since July 2006); Chairperson of the Closed-End Fund Committee (since June 2012) and Director or Trustee of various Morgan Stanley Funds (since July 1991); formerly, Chairperson of the Insurance Committee (until July 2006); General Partner, Triumph Capital, L.P. (private investment partnership) (1988-2013). | | | 100 | | | None. | |
W. Allen Reed (66)
c/o Kramer Levin Naftalis & Frankel LLP
Counsel to the Independent Directors
1177 Avenue of the Americas New York, NY 10036 | | Director | | Since
August
2006 | | Chairperson of the Equity Sub-Committee of the Investment Committee (since October 2006) and Director or Trustee of various Morgan Stanley Funds (since August 2006); formerly, President and CEO of General Motors Asset Management; Chairman and Chief Executive Officer of the GM Trust Bank and Corporate Vice President of General Motors Corporation (August 1994-December 2005). | | | 98 | | | Director of Temple-Inland Industries (packaging and forest products); Director of Legg Mason, Inc. and Director of the Auburn University Foundation. | |
Fergus Reid (81)
c/o Joe Pietryka, Inc.
85 Charles Colman Blvd. Pawling, NY 12564 | | Director | | Since
June
1992 | | Chairman, Joe Pietryka, Inc.; Chairperson of the Governance Committee and Director or Trustee of various Morgan Stanley Funds (since June 1992). | | | 101 | | | Through December 31, 2012, Trustee and Director of certain Investment companies in the JP Morgan Fund Complex. | |
29
Morgan Stanley Institutional Fund, Inc.
Annual Report — December 31, 2013
Director and Officer Information (unaudited) (cont'd)
Interested Director:
Name, Age and Address of
Interested Director | | Position(s)
Held with
Registrant | | Length of
Time Served* | | Principal Occupation(s) During Past 5 Years | | Number of
Portfolios in
Fund Complex
Overseen by
Interested
Director** | | Other Directorships
Held by Interested
Director*** | |
James F. Higgins (66)
One New York Plaza
New York, NY 10004 | | Director | | Since
June
2000 | | Director or Trustee of various Morgan Stanley Funds (since June 2000); Senior Advisor of Morgan Stanley (since August 2000). | | | 99 | | | Formerly, Director of AXA Financial, Inc. and AXA Equitable Life Insurance Company (2002-2011) and Director of AXA MONY Life Insurance Company and AXA MONY Life Insurance Company of America (2004-2011). | |
* Each Director serves an indefinite term, until his or her successor is elected.
** The Fund Complex includes (as of December 31, 2013) all open-end and closed-end funds (including all of their portfolios) advised by Morgan Stanley Investment Management Inc. (the "Adviser") and any funds that have an adviser that is an affiliated person of the Adviser (including, but not limited to, Morgan Stanley AIP GP LP).
*** This includes any directorships at public companies and registered investment companies held by the Director at any time during the past five years.
30
Morgan Stanley Institutional Fund, Inc.
Annual Report — December 31, 2013
Director and Officer Information (unaudited) (cont'd)
Executive Officers:
Name, Age and Address of Executive Officer | | Position(s) Held
with
Registrant | | Length of
Time Served* | | Principal Occupation(s) During Past 5 Years | |
John H. Gernon (50)
522 Fifth Avenue
New York, NY 10036 | | President and Principal Executive Officer—Equity, Fixed Income and AIP Funds | | Since
September
2013 | | President and Principal Executive Officer of the Equity and Fixed Income Funds and the Morgan Stanley AIP Funds (since September 2013) in the Fund Complex. Managing Director of the Adviser. | |
Stefanie V. Chang Yu (47)
522 Fifth Avenue
New York, NY 10036 | | Chief Compliance Officer | | Since
January
2014 | | Managing Director of the Adviser and various entities affiliated with the Adviser; Chief Compliance Officer of various Morgan Stanley Funds and the Adviser (since January 2014); formerly, Vice President of various Morgan Stanley Funds (December 1997-January 2014). | |
Joseph C. Benedetti (48)
522 Fifth Avenue
New York, NY 10036 | | Vice President | | Since
January
2014 | | Managing Director of the Adviser and various entities affiliated with the Adviser; Vice President of various Morgan Stanley Funds (since January 2014); formerly, Assistant Secretary of various Morgan Stanley Funds (October 2004-January 2014). | |
Francis J. Smith (48)
522 Fifth Avenue
New York, NY 10036 | | Treasurer and Principal Financial Officer | | Treasurer since July 2003 and Principal Financial Officer since September 2002 | | Executive Director of the Adviser and various entities affiliated with the Adviser; Treasurer and Principal Financial Officer of various Morgan Stanley Funds (since July 2003). | |
Mary E. Mullin (46)
522 Fifth Avenue
New York, NY 10036 | | Secretary | | Since
June
1999 | | Executive Director of the Adviser and various entities affiliated with the Adviser; Secretary of various Morgan Stanley Funds (since June 1999). | |
* Each officer serves an indefinite term, until his or her successor is elected.
31
Morgan Stanley Institutional Fund, Inc.
Annual Report — December 31, 2013
Adviser and Administrator
Morgan Stanley Investment Management Inc.
522 Fifth Avenue
New York, New York 10036
Distributor
Morgan Stanley Distribution, Inc.
522 Fifth Avenue
New York, New York 10036
Dividend Disbursing and Transfer Agent
Boston Financial Data Services, Inc.
2000 Crown Colony Drive
Quincy, Massachusetts 02169
Custodian
State Street Bank and Trust Company
One Lincoln Street
Boston, Massachusetts 02111
Legal Counsel
Dechert LLP
1095 Avenue of the Americas
New York, New York 10036
Counsel to the Independent Directors
Kramer Levin Naftalis & Frankel LLP
1177 Avenue of the Americas
New York, New York 10036
Independent Registered Public Accounting Firm
Ernst & Young LLP
200 Clarendon Street
Boston, Massachusetts 02116
Reporting to Shareholders
Each Morgan Stanley fund provides a complete schedule of portfolio holdings in its semi-annual and annual reports within 60 days of the end of the fund's second and fourth fiscal quarters by filing the schedule electronically with the Securities and Exchange Commission (SEC). The semi-annual reports are filed on Form N-CSRS and the annual reports are filed on Form N-CSR. Morgan Stanley also delivers the semi-annual and annual reports to fund shareholders and makes these reports available on its public website, www.morganstanley.com/im. Each Morgan Stanley fund also files a complete schedule of portfolio holdings with the SEC for the fund's first and third fiscal quarters on Form N-Q. Morgan Stanley does not deliver the reports for the first and third fiscal quarters to shareholders, nor are the reports posted to the Morgan Stanley public website. You may, however, obtain the Form N-Q filings (as well as the Form N-CSR and N-CSRS filings) by accessing the SEC's website, www.sec.gov. You may also review and copy them at the SEC's Public Reference Room in Washington, DC. Information on the operation of the SEC's Public Reference Room may be obtained by calling the SEC toll free at 1 (800) SEC-0330. You can also request copies of these materials, upon payment of a duplicating fee, by electronic request at the SEC's email address (publicinfo@sec.gov) or by writing the Public Reference Room of the SEC, Washington, DC 20549-0102.
Proxy Voting Policies and Procedures and Proxy Voting Record
You may obtain a copy of the Fund's Proxy Voting Policy and Procedures and information regarding how the Fund voted proxies relating to portfolio securities during the most recent twelve-month period ended June 30, without charge, upon request, by calling toll free 1 (800) 548-7786 or by visiting our website at www.morganstanley.com/im. This information is also available on the SEC's website at www.sec.gov.
This report is authorized for distribution only when preceded or accompanied by a prospectus of the Morgan Stanley Institutional Fund, Inc. which describes in detail each Investment Portfolio's investment policies, risks, fees and expenses. Please read the prospectus carefully before you invest or send money. For additional information, including information regarding the investments comprising the Portfolio, please visit our website at www.morganstanley.com/im or call toll free 1 (800) 548-7786.
32
(This Page has been left blank intentionally.)
Printed in U.S.A.
This Report has been prepared for shareholders and may be distributed to others only if preceded or accompanied by a current prospectus.
Morgan Stanley Investment Management Inc.
522 Fifth Avenue
New York, New York 10036
© 2014 Morgan Stanley. Morgan Stanley Distribution, Inc.

IFIFEMANN
811209 EXP 2.28.15

Morgan Stanley Institutional Fund, Inc.
Small Company Growth Portfolio
Annual Report
December 31, 2013

Morgan Stanley Institutional Fund, Inc.
Annual Report — December 31, 2013
Shareholders' Letter | | | 2 | | |
Expense Example | | | 3 | | |
Investment Overview | | | 4 | | |
Portfolio of Investments | | | 6 | | |
Statement of Assets and Liabilities | | | 9 | | |
Statement of Operations | | | 11 | | |
Statements of Changes in Net Assets | | | 12 | | |
Financial Highlights | | | 14 | | |
Notes to Financial Statements | | | 18 | | |
Report of Independent Registered Public Accounting Firm | | | 28 | | |
Federal Tax Notice | | | 29 | | |
U.S. Privacy Policy | | | 30 | | |
Director and Officer Information | | | 33 | | |
This report is authorized for distribution only when preceded or accompanied by prospectuses of the Morgan Stanley Institutional Fund, Inc. To receive a prospectus and/or statement of additional information (SAI), which contains more complete information such as investment objectives, charges, expenses, policies for voting proxies, risk considerations, and describes in detail each of the Portfolio's investment policies to the prospective investor, please call toll free 1 (800) 548-7786. Please read the prospectuses carefully before you invest or send money.
Additionally, you can access portfolio information including performance, characteristics, and investment team commentary through Morgan Stanley Investment Management's website: www.morganstanley.com/im.
Market forecasts provided in this report may not necessarily come to pass. There is no guarantee that any sectors mentioned will continue to perform as discussed herein or that securities in such sectors will be held by the Portfolio in the future. There is no assurance that a Portfolio will achieve its investment objective. Portfolios are subject to market risk, which is the possibility that market values of securities owned by the Portfolio will decline and, therefore, the value of the Portfolio's shares may be less than what you paid for them. Accordingly, you can lose money investing in the Portfolio. Please see the prospectus for more complete information on investment risks.
1
Morgan Stanley Institutional Fund, Inc.
Annual Report — December 31, 2013
Shareholders' Letter (unaudited)
Dear Shareholders,
We are pleased to provide this Annual report, in which you will learn how your investment in Small Company Growth Portfolio (the "Portfolio") performed during the latest twelve-month period.
Morgan Stanley Investment Management is a client-centric, investor-led organization. Our global presence, intellectual capital, and breadth of products and services enable us to partner with investors to meet the evolving challenges of today's financial markets. We aim to deliver superior investment service and to empower our clients to make the informed decisions that help them reach their investment goals.
As always, we thank you for selecting Morgan Stanley Investment Management, and look forward to working with you in the months and years ahead.
Sincerely,

John H. Gernon
President and Principal Executive Officer
January 2014
2
Morgan Stanley Institutional Fund, Inc.
Annual Report — December 31, 2013
Expense Example (unaudited)
Small Company Growth Portfolio
As a shareholder of the Portfolio, you incur two types of costs: (1) transactional costs, including redemptions fees; and (2) ongoing costs, including advisory fees, administration fees, distribution and shareholder services fees and other Portfolio expenses. This example is intended to help you understand your ongoing costs (in dollars) of investing in the Portfolio and to compare these costs with the ongoing costs of investing in other mutual funds.
This example is based on an investment of $1,000 invested at the beginning of the six-month period ended December 31, 2013 and held for the entire six-month period.
Actual Expenses
The table below provides information about actual account values and actual expenses. You may use the information in this table, together with the amount you invested, to estimate the expenses that you paid over the period. Simply divide your account value by $1,000 (for example, an $8,600 account value divided by $1,000 = 8.6), then multiply the result by the number in the table under the heading entitled "Actual Expenses Paid During Period" to estimate the expenses you paid on your account during this period.
Hypothetical Example for Comparison Purposes
The table below provides information about hypothetical account values and hypothetical expenses based on the Portfolio's actual expense ratio and an assumed rate of return of 5% per year before expenses, which is not the Portfolio's actual return. The hypothetical account values and expenses may not be used to estimate the actual ending account balance or expenses you paid for the period. You may use this information to compare the ongoing costs of investing in the Portfolio and other funds. To do so, compare this 5% hypothetical example with the 5% hypothetical examples that appear in the shareholder reports of the other funds.
Please note that the expenses shown in the table are meant to highlight your ongoing costs only and do not reflect any transactional costs, such as sales charges (loads) and redemption fees. Therefore, the information for each class in the table is useful in comparing ongoing costs only, and will not help you determine the relative total costs of owning different funds. In addition, if these transactional costs were included, your costs would have been higher.
| | | Beginning
Account
Value
7/1/13 | | Actual Ending
Account
Value
12/31/13 | | Hypothetical
Ending Account
Value | | Actual
Expenses
Paid
During
Period | | Hypothetical
Expenses Paid
During Period | | Net
Expense
Ratio
During
Period*** | |
Small Company Growth Portfolio Class I | | $ | 1,000.00 | | | $ | 1,311.40 | | | $ | 1,019.96 | | | $ | 6.06 | * | | $ | 5.30 | * | | | 1.04 | % | |
Small Company Growth Portfolio Class A@ | | | 1,000.00 | | | | 1,309.60 | | | | 1,018.55 | | | | 7.68 | * | | | 6.72 | * | | | 1.32 | | |
Small Company Growth Portfolio Class L | | | 1,000.00 | | | | 1,305.80 | | | | 1,015.83 | | | | 10.81 | * | | | 9.45 | * | | | 1.86 | | |
Small Company Growth Portfolio Class IS | | | 1,000.00 | | | | 1,165.00 | | | | 1,011.81 | | | | 3.08 | ** | | | 2.86 | ** | | | 0.97 | | |
* Expenses are calculated using each Portfolio Class' annualized net expense ratio (as disclosed), multiplied by the average account value over the period, and multiplied by 184/365 (to reflect the most recent one-half year period).
** Expenses are calculated using the Portfolio Class' annualized net expense ratio (as disclosed), multiplied by the average account value over the period, and multiplied by 107/365 (to reflect the actual days in the period).
*** Annualized.
@ Effective September 9, 2013, Class P and Class H shares were renamed Class A shares.
3
Morgan Stanley Institutional Fund, Inc.
Annual Report — December 31, 2013
Investment Overview (unaudited)
Small Company Growth Portfolio
The Small Company Growth Portfolio seeks long-term capital appreciation by investing primarily in growth-oriented equity securities of small capitalization companies.
Performance
For the year ended December 31, 2013, the Portfolio had a total return based on net asset value and reinvestment of distributions per share of 62.26%, net of fees, for Class I shares. The Portfolio's Class I shares outperformed against its benchmark, the Russell 2000® Growth Index (the "Index"), which returned 43.30%. Please keep in mind that high double-digit returns are highly unusual and cannot be sustained.
Factors Affecting Performance
• U.S. stocks turned in a strong performance for the year ended December 31, 2013. As in 2012, the expectation that accommodative monetary policy by the U.S. Federal Reserve (Fed) would continue for some time helped drive the prices of risky assets including stocks higher in 2013. However, as the U.S. economy began to look stronger, the Fed started signaling its intention to reduce the pace of its asset purchase program (known as quantitative easing or QE) if economic data warranted. Uncertainty as to the timing and magnitude of this tapering led to volatility across the capital markets. When the Fed unexpectedly left its QE program intact after its September meeting, stocks rallied strongly. The market's advance paused in October, disrupted by a partial government shutdown and political gridlock over whether to raise the debt ceiling, but resumed in the final months of the period on expectations — and later confirmation by the Fed — that QE tapering would begin in 2014.
• Stock selection in two sectors — technology and consumer discretionary — drove the majority of the Portfolio's outperformance relative to the Index. In the technology sector, performance was led by a position in an online global communications platform. A holding in a restaurant owner/operator drove relative gains in the consumer discretionary sector.
• The third largest contributor was the consumer staples sector, where stock selection and an overweight in the sector were both beneficial to
relative performance. The Portfolio's exposure to a U.K.-based online grocer, which is not represented in the Index, added the most to performance within the sector.
• The only sector-level detractor from relative performance during the period was health care. Both stock selection and an underweight in the sector dampened relative returns. A holding in a medical claims processor was the most detrimental to performance in the sector.
Management Strategies
• We look for high-quality growth companies that we believe have these attributes: sustainable competitive advantages, above-average business visibility, rising returns on invested capital, strong free cash flow generation and an attractive risk/reward. We find these companies through intense fundamental research. Our emphasis is on secular growth, and as a result short-term market events are not as meaningful in the stock selection process.
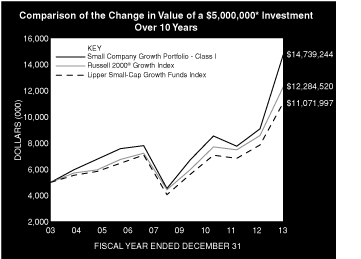
* Minimum Investment for Class I shares
In accordance with SEC regulations, Portfolio's performance shown assumes that all recurring fees (including management fees) were deducted and all dividends and distributions were reinvested. The performance of Class A+, L and IS shares will vary from Class I shares based upon their different inception dates and will be negatively impacted by additional fees assessed to those classes (if applicable).
4
Morgan Stanley Institutional Fund, Inc.
Annual Report — December 31, 2013
Investment Overview (unaudited) (cont'd)
Small Company Growth Portfolio
Performance Compared to the Russell 2000® Growth Index(1) and the Lipper Small-Cap Growth Funds Index(2)
| | | Period Ended December 31, 2013
Total Returns(3) | |
| | | | | Average Annual | |
| | | One
Year | | Five
Years | | Ten
Years | | Since
Inception(8) | |
Portfolio — Class I Shares
w/o sales charges(4) | | | 62.26 | % | | | 26.58 | % | | | 11.42 | % | | | 12.43 | % | |
Russell 2000® Growth Index | | | 43.30 | | | | 22.58 | | | | 9.41 | | | | 8.05 | | |
Lipper Small-Cap Growth
Funds Index | | | 40.99 | | | | 22.20 | | | | 8.27 | | | | 9.73 | | |
Portfolio — Class A+. Shares
w/o sales charges(5) | | | 61.88 | | | | 26.23 | | | | 11.13 | | | | 11.84 | | |
Portfolio — Class A+ Shares
with maximum 5.25%
sales charges(5) | | | 53.35 | | | | 24.87 | | | | 10.53 | | | | 11.50 | | |
Russell 2000® Growth Index | | | 43.30 | | | | 22.58 | | | | 9.41 | | | | 6.78 | | |
Lipper Small-Cap Growth
Funds Index | | | 40.99 | | | | 22.20 | | | | 8.27 | | | | 7.91 | | |
Portfolio — Class L Shares
w/o sales charges(6) | | | 60.97 | | | | — | | | | — | | | | 31.81 | | |
Russell 2000® Growth Index | | | 43.30 | | | | — | | | | — | | | | 25.38 | | |
Lipper Small-Cap Growth
Funds Index | | | 40.99 | | | | — | | | | — | | | | 24.35 | | |
Portfolio — Class IS Shares
w/o sales charges(7) | | | — | | | | — | | | | — | | | | 16.50 | | |
Russell 2000® Growth Index | | | — | | | | — | | | | — | | | | 10.38 | | |
Lipper Small-Cap Growth
Funds Index | | | — | | | | — | | | | — | | | | 9.68 | | |
Performance data quoted represents past performance, which is no guarantee of future results, and current performance may be lower or higher than the figures shown. Performance assumes that all dividends and distributions, if any, were reinvested. For the most recent month-end performance figures, please visit www.morganstanley.com/im. Investment return and principal value will fluctuate so that Portfolio shares, when redeemed, may be worth more or less than their original cost. Total returns do not reflect the deduction of taxes that a shareholder would pay on Portfolio distributions or the redemption of Portfolio shares. Returns for periods less than one year are not annualized. Performance of share classes will vary due to difference in expenses.
+ Effective September 9, 2013, Class P shares were renamed Class A shares.
(1) The Russell 2000® Growth Index measures the performance of the small-cap growth segment of the U.S. equity universe. It includes those Russell 2000® Index companies with higher price-to-book ratios and higher forecasted growth values. The Russell 2000® Index is a subset of the Russell 3000® Index representing approximately 10% of the total market capitalization of that index. It includes approximately 2,000 of the smallest securities based on a combination of their market capitalization and current index membership. The Index is unmanaged and its returns do not include any sales charges or fees. Such costs would lower performance. It is not possible to invest directly in an index.
(2) The Lipper Small-Cap Growth Funds Index is an equally weighted performance index of the largest qualifying funds (based on net assets) in the Lipper Small-Cap Growth Funds classification. The Index, which is adjusted for capital gains distributions and income dividends, is unmanaged and should not be considered an investment. There are currently 30 funds represented in this Index. As of the date of this report, the Portfolio is in the Lipper Small-Cap Growth Funds classification.
(3) Total returns for the Portfolio reflect fees waived and expenses reimbursed, if applicable, by the Adviser. Without such waivers and reimbursements, total returns would have been lower. The fee waivers and/or expense reimbursements will continue for at least one year or until such time as the Fund's Board of Directors acts to discontinue all or a portion of such waivers and/or expense reimbursements when it deems that such action is appropriate.
(4) Commenced operations on November 1, 1989.
(5) Commenced offering on January 2, 1996.
(6) Commenced offering on November 11, 2011.
(7) Commenced offering on September 13, 2013.
(8) For comparative purposes, average annual since inception returns listed for the Indexes refer to the inception date or initial offering of the respective share class of the Portfolio, not the inception of the Index. Returns for periods less than one year are not annualized.
Portfolio Composition*
Classification | | Percentage of
Total Investments | |
Other** | | | 43.7 | % | |
Computer Services, Software & Systems | | | 17.5 | | |
Commercial Services | | | 10.4 | | |
Foods | | | 9.7 | | |
Computer Technology | | | 6.9 | | |
Diversified Retail | | | 6.5 | | |
Investment Company | | | 5.3 | | |
Total Investments | | | 100.0 | % | |
* Percentages indicated are based upon total investmest (excluding Securities held as Collateral on Loaned Securities) as of December 31, 2013.
** Industries and/or investment types representing less than 5% of total investments.
5
Morgan Stanley Institutional Fund, Inc.
Annual Report — December 31, 2013
Portfolio of Investments
Small Company Growth Portfolio
| | | Shares | | Value
(000) | |
Common Stocks (88.7%) | |
Advertising Agencies (2.6%) | |
Aimia, Inc. (Canada) | | | 2,939,103 | | | $ | 53,981 | | |
Criteo SA ADR (France) (a) | | | 259,377 | | | | 8,871 | | |
| | | | 62,852 | | |
Air Transport (1.4%) | |
XPO Logistics, Inc. (a)(b) | | | 1,251,876 | | | | 32,912 | | |
Asset Management & Custodian (4.4%) | |
Eurazeo SA (France) | | | 698,145 | | | | 54,726 | | |
Greenhill & Co., Inc. | | | 887,438 | | | | 51,418 | | |
| | | | 106,144 | | |
Auto Parts (0.8%) | |
Fox Factory Holding Corp. (a) | | | 1,137,266 | | | | 20,039 | | |
Banks: Diversified (1.1%) | |
Financial Engines, Inc. | | | 382,389 | | | | 26,568 | | |
Beverage: Brewers & Distillers (1.3%) | |
Boston Beer Co., Inc. (The), Class A (a)(b) | | | 95,799 | | | | 23,163 | | |
Crimson Wine Group Ltd. (a) | | | 977,858 | | | | 8,645 | | |
| | | | 31,808 | | |
Biotechnology (0.7%) | |
Alnylam Pharmaceuticals, Inc. (a) | | | 92,789 | | | | 5,969 | | |
Intrexon Corp. (a)(b) | | | 268,243 | | | | 6,384 | | |
Organovo Holdings, Inc. (a)(b) | | | 449,231 | | | | 4,973 | | |
| | | | 17,326 | | |
Building Materials (0.8%) | |
Louis XIII Holdings Ltd. (Hong Kong) | | | 19,806,680 | | | | 19,949 | | |
Cement (0.9%) | |
Eagle Materials, Inc. | | | 283,964 | | | | 21,987 | | |
Chemicals: Diversified (0.3%) | |
Tronox Ltd., Class A | | | 352,642 | | | | 8,136 | | |
Commercial Services (10.4%) | |
Advisory Board Co. (The) (a) | | | 1,642,043 | | | | 104,549 | | |
Corporate Executive Board Co. (The) | | | 1,345,950 | | | | 104,217 | | |
CoStar Group, Inc. (a) | | | 122,479 | | | | 22,607 | | |
MercadoLibre, Inc. (Brazil) | | | 201,192 | | | | 21,687 | | |
| | | | 253,060 | | |
Computer Services, Software & Systems (12.1%) | |
Autohome, Inc. ADR (China) (a) | | | 375,671 | | | | 13,746 | | |
Cornerstone OnDemand, Inc. (a) | | | 474,642 | | | | 25,317 | | |
Dealertrack Technologies, Inc. (a) | | | 278,578 | | | | 13,394 | | |
FireEye, Inc. (a) | | | 450,603 | | | | 19,651 | | |
Guidewire Software, Inc. (a) | | | 470,809 | | | | 23,103 | | |
MakeMyTrip Ltd. (India) (a) | | | 1,002,686 | | | | 19,312 | | |
OpenTable, Inc. (a) | | | 388,959 | | | | 30,872 | | |
RealPage, Inc. (a) | | | 516,218 | | | | 12,069 | | |
Solera Holdings, Inc. | | | 864,869 | | | | 61,198 | | |
Tangoe, Inc. (a) | | | 763,395 | | | | 13,749 | | |
Veeva Systems, Inc., Class A (a)(b) | | | 427,172 | | | | 13,712 | | |
Xoom Corp. (a) | | | 635,206 | | | | 17,385 | | |
| | | Shares | | Value
(000) | |
Yelp, Inc. (a) | | | 331,980 | | | $ | 22,890 | | |
Zynga, Inc., Class A (a) | | | 2,125,298 | | | | 8,076 | | |
| | | | 294,474 | | |
Computer Technology (7.0%) | |
Benefitfocus, Inc. (a)(b) | | | 939,255 | | | | 54,233 | | |
FleetMatics Group PLC (Ireland) (a) | | | 308,915 | | | | 13,361 | | |
Nimble Storage, Inc. (a) | | | 345,029 | | | | 15,630 | | |
Textura Corp. (a)(b) | | | 1,506,730 | | | | 45,111 | | |
Youku Tudou, Inc. ADR (China) (a) | | | 721,827 | | | | 21,871 | | |
Zillow, Inc., Class A (a)(b) | | | 225,946 | | | | 18,466 | | |
| | | | 168,672 | | |
Consumer Electronics (0.6%) | |
Sohu.com, Inc. (China) (a)(b) | | | 206,100 | | | | 15,031 | | |
Diversified Financial Services (1.8%) | |
Capitol Acquisition Corp. II (Units) (a)(c) | | | 803,544 | | | | 8,007 | | |
Ellie Mae, Inc. (a) | | | 405,259 | | | | 10,889 | | |
WageWorks, Inc. (a) | | | 420,404 | | | | 24,989 | | |
| | | | 43,885 | | |
Diversified Retail (6.1%) | |
Blue Nile, Inc. (a) | | | 1,168,636 | | | | 55,031 | | |
Citi Trends, Inc. (a) | | | 692,335 | | | | 11,770 | | |
Groupon, Inc. (a) | | | 4,333,583 | | | | 51,006 | | |
Krispy Kreme Doughnuts, Inc. (a) | | | 1,606,173 | | | | 30,983 | | |
| | | | 148,790 | | |
Electronic Components (1.0%) | |
3D Systems Corp. (a)(b) | | | 254,411 | | | | 23,642 | | |
Electronics (1.4%) | |
QIWI plc ADR | | | 588,206 | | | | 32,940 | | |
Entertainment (2.3%) | |
Legend Pictures LLC Ltd. (a)(d)(e)(f)
(acquisition cost — $5,829; acquired 3/8/12) | | | 5,452 | | | | 7,178 | | |
Vail Resorts, Inc. | | | 636,538 | | | | 47,887 | | |
| | | | 55,065 | | |
Foods (9.7%) | |
Annie's, Inc. (a) | | | 501,836 | | | | 21,599 | | |
Fairway Group Holdings Corp. (a)(b) | | | 1,126,174 | | | | 20,406 | | |
Fiesta Restaurant Group, Inc. (a) | | | 1,885,338 | | | | 98,490 | | |
Ocado Group PLC (United Kingdom) (a) | | | 6,293,622 | | | | 46,023 | | |
Potbelly Corp. (a)(b) | | | 2,041,865 | | | | 49,577 | | |
| | | | 236,095 | | |
Health Care Management Services (1.7%) | |
HMS Holdings Corp. (a) | | | 1,795,925 | | | | 40,821 | | |
Health Care Services (3.6%) | |
athenahealth, Inc. (a) | | | 656,807 | | | | 88,341 | | |
Household Appliances (0.9%) | |
SodaStream International Ltd. (Israel) (a)(b) | | | 450,924 | | | | 22,384 | | |
Insurance: Multi-Line (1.3%) | |
Greenlight Capital Re Ltd., Class A (a) | | | 957,133 | | | | 32,265 | | |
Leisure Time (0.4%) | |
Qunar Cayman Islands Ltd. ADR (China) (a) | | | 393,239 | | | | 10,433 | | |
The accompanying notes are an integral part of the financial statements.
6
Morgan Stanley Institutional Fund, Inc.
Annual Report — December 31, 2013
Portfolio of Investments (cont'd)
Small Company Growth Portfolio
| | | Shares | | Value
(000) | |
Medical & Dental Instruments & Supplies (1.0%) | |
Techne Corp. | | | 254,955 | | | $ | 24,137 | | |
Medical Services (2.9%) | |
Medidata Solutions, Inc. (a) | | | 1,173,650 | | | | 71,088 | | |
Oil: Crude Producers (0.8%) | |
Gulfport Energy Corp. (a) | | | 303,610 | | | | 19,173 | | |
Pharmaceuticals (0.7%) | |
Agios Pharmaceuticals, Inc. (a)(b) | | | 149,326 | | | | 3,576 | | |
Ironwood Pharmaceuticals, Inc. (a) | | | 1,035,146 | | | | 12,018 | | |
| | | | 15,594 | | |
Restaurants (1.6%) | |
BJ's Restaurants, Inc. (a) | | | 1,263,393 | | | | 39,241 | | |
Semiconductors & Components (1.7%) | |
First Solar, Inc. (a) | | | 361,296 | | | | 19,741 | | |
Tessera Technologies, Inc. | | | 1,041,128 | | | | 20,521 | | |
| | | | 40,262 | | |
Specialty Retail (1.6%) | |
Five Below, Inc. (a) | | | 889,794 | | | | 38,439 | | |
Technology: Miscellaneous (1.5%) | |
iRobot Corp. (a) | | | 432,022 | | | | 15,021 | | |
Tableau Software, Inc., Class A (a) | | | 323,685 | | | | 22,312 | | |
| | | | 37,333 | | |
Telecommunications Equipment (1.8%) | |
Angie's List, Inc. (a)(b) | | | 1,552,637 | | | | 23,522 | | |
Pandora Media, Inc. (a) | | | 774,694 | | | | 20,607 | | |
| | | | 44,129 | | |
Truckers (0.5%) | |
Prumo Logistica SA (Brazil) (a) | | | 26,024,691 | | | | 11,913 | | |
Utilities: Electrical (0.0%) | |
AET&D Holdings No. 1 Ltd. (Australia) (a)(d)(f) | | | 6,682,555 | | | | — | | |
Total Common Stocks (Cost $1,352,168) | | | 2,154,928 | | |
Preferred Stocks (1.0%) | |
Advertising Agencies (0.1%) | |
Glam Media, Inc. Series M-1 (a)(d)(e)(f)
(acquisition cost — $5,449;
acquired 3/19/08) | | | 361,920 | | | | 1,067 | | |
Glam Media, Inc. Escrow Series M-1 (a)(d)(e)(f)
(acquisition cost — $506;
acquired 3/19/08) | | | 51,702 | | | | 88 | | |
| | | | 1,155 | | |
Diversified Retail (0.4%) | |
Flipkart Online Services Pvt Ltd.
Series D (a)(d)(e)(f)
(acquisition cost — $9,579;
acquired 10/4/13) | | | 417,464 | | | | 9,890 | | |
Health Care Services (0.5%) | |
Castlight Health, Inc. (a)(d)(e)(f)
(acquisition cost — $7,387;
acquired 6/4/10) | | | 1,796,926 | | | | 12,219 | | |
Total Preferred Stocks (Cost $22,921) | | | 23,264 | | |
| | | Shares | | Value
(000) | |
Convertible Preferred Stocks (5.4%) | |
Computer Services, Software & Systems (5.4%) | |
Twitter, Inc. Series E (a)(e)(f)
(acquisition cost — $6,019;
acquired 9/24/09) | | | 2,259,658 | | | $ | 131,851 | | |
Computer Technology (0.0%) | |
Youku Tudou, Inc., Class A (China) (a)(d)(e)(f)
(acquisition cost — $—@;
acquired 9/16/10) | | | 1 | | | | — | @ | |
Total Convertible Preferred Stocks (Cost $6,019) | | | 131,851 | | |
| | | Face
Amount
(000) | | | |
Promissory Notes (0.0%) | |
Advertising Agencies (0.0%) | |
Glam Media, Inc.
9.00%, 12/3/19 (a)(d)(e)(f)
(acquisition cost — $2,301;
acquired 3/19/08) | | $ | 793 | | | | 702 | | |
Glam Media, Inc. Escrow
9.00%, 12/3/19 (a)(d)(e)(f)
(acquisition cost — $55;
acquired 3/19/08) | | | 29 | | | | 13 | | |
Total Promissory Notes (Cost $2,356) | | | 715 | | |
| | Notional
Amount | | | |
Call Options Purchased (0.1%) | |
Foreign Currency Options (0.1%) | |
USD/CNY December 2014 CNY | | | 317,437,335 | | | | 532 | | |
USD/CNY December 2014 CNY | | | 363,861,150 | | | | 618 | | |
USD/CNY December 2014 CNY | | | 25,442,473 | | | | 42 | | |
Total Call Options Purchased (Cost $2,228) | | | 1,192 | | |
| | | Shares | | | |
Short-Term Investments (10.7%) | |
Securities held as Collateral on Loaned Securities (5.3%) | |
Investment Company (4.6%) | |
Morgan Stanley Institutional Liquidity
Funds — Money Market Portfolio —
Institutional Class (See Note G) | | | 111,152,650 | | | | 111,153 | | |
| | | Face
Amount
(000) | | | |
Repurchase Agreements (0.7%) | |
BNP Paribas Securities Corp. (0.01%,
dated 12/31/13, due 1/2/14;
proceeds $10,012; fully collateralized
by various U.S. Government
Obligations; 0.63% — 3.63%
due 8/15/16 — 2/15/21;
valued at $10,212) | | $ | 10,012 | | | | 10,012 | | |
The accompanying notes are an integral part of the financial statements.
7
Morgan Stanley Institutional Fund, Inc.
Annual Report — December 31, 2013
Portfolio of Investments (cont'd)
Small Company Growth Portfolio
| | | Face
Amount
(000) | | Value
(000) | |
Repurchase Agreements (cont'd) | |
Merrill Lynch & Co., Inc. (0.18%,
dated 12/31/13, due 1/2/14;
proceeds $7,151; fully collateralized
by various Common Stocks and
Exchange Traded Funds;
valued at $7,728) | | $ | 7,151 | | | $ | 7,151 | | |
| | | | 17,163 | | |
Total Securities held as Collateral on Loaned
Securities (Cost $128,316) | | | 128,316 | | |
| | | Shares | | | |
Investment Company (5.4%) | |
Morgan Stanley Institutional Liquidity
Funds — Money Market Portfolio —
Institutional Class (See Note G)
(Cost $130,456) | | | 130,456,398 | | | | 130,456 | | |
Total Short-Term Investments (Cost $258,772) | | | 258,772 | | |
Total Investments (105.9%) (Cost $1,644,464)
Including $147,653 of Securities Loaned | | | 2,570,722 | | |
Liabilities in Excess of Other Assets (-5.9%) | | | (142,549 | ) | |
Net Assets (100.0%) | | $ | 2,428,173 | | |
(a) Non-income producing security.
(b) All or a portion of this security was on loan at December 31, 2013.
(c) Consists of one or more classes of securities traded together as a unit; stocks with attached warrants.
(d) At December 31, 2013, the Portfolio held fair valued securities valued at approximately $31,157,000, representing 1.3% of net assets. These securities have been fair valued as determined in good faith under procedures established by and under the general supervision of the Fund's Directors.
(e) Security cannot be offered for public resale without first being registered under the Securities Act of 1933 and related rules ("restricted security"). Acquisition date represents the day on which an enforceable right to acquire such security is obtained and is presented along with related cost in the security description. The Portfolio has registration rights for certain restricted securities. Any costs related to such registration are borne by the issuer. The aggregate value of restricted securities (excluding 144A holdings) at December 31, 2013 amounts to approximately $163,008,000 and represents 6.7% of net assets.
(f) Security has been deemed illiquid at December 31, 2013.
@ Value is less than $500.
ADR American Depositary Receipt.
The accompanying notes are an integral part of the financial statements.
8
Morgan Stanley Institutional Fund, Inc.
Annual Report — December 31, 2013
Small Company Growth Portfolio
Statement of Assets and Liabilities | | December 31, 2013
(000) | |
Assets: | |
Investments in Securities of Unaffiliated Issuers, at Value (Cost $1,402,855) | | $ | 2,329,113 | | |
Investment in Security of Affiliated Issuer, at Value (Cost $241,609) | | | 241,609 | | |
Total Investments in Securities, at Value (Cost $1,644,464) | | | 2,570,722 | | |
Foreign Currency, at Value (Cost $399) | | | 400 | | |
Cash | | | 3,921 | | |
Receivable for Portfolio Shares Sold | | | 2,635 | | |
Dividends Receivable | | | 208 | | |
Receivable from Affiliate | | | 8 | | |
Other Assets | | | 110 | | |
Total Assets | | | 2,578,004 | | |
Liabilities: | |
Collateral on Securities Loaned, at Value | | | 132,237 | | |
Payable for Investments Purchased | | | 6,121 | | |
Payable for Advisory Fees | | | 4,695 | | |
Payable for Portfolio Shares Redeemed | | | 3,821 | | |
Due to Broker | | | 1,520 | | |
Payable for Sub Transfer Agency Fees | | | 772 | | |
Payable for Sub Transfer Agency Fees — Class I | | | 245 | | |
Payable for Sub Transfer Agency Fees — Class A* | | | 68 | | |
Payable for Sub Transfer Agency Fees — Class L | | | 2 | | |
Payable for Administration Fees | | | 158 | | |
Payable for Shareholder Services Fees — Class A* | | | 59 | | |
Payable for Distribution and Shareholder Services Fees — Class L | | | 2 | | |
Payable for Transfer Agent Fees | | | 25 | | |
Payable for Transfer Agent Fees — Class I | | | 2 | | |
Payable for Transfer Agent Fees — Class A* | | | 3 | | |
Payable for Transfer Agent Fees — Class L | | | 1 | | |
Payable for Custodian Fee | | | 11 | | |
Payable for Directors' Fees and Expenses | | | 8 | | |
Payable for Professional Fees | | | 3 | | |
Other Liabilities | | | 78 | | |
Total Liabilities | | | 149,831 | | |
Net Assets | | $ | 2,428,173 | | |
Net Assets Consist Of: | |
Paid-in-Capital | | $ | 1,450,856 | | |
Accumulated Net Investment Loss | | | (331 | ) | |
Accumulated Net Realized Gain | | | 51,389 | | |
Unrealized Appreciation (Depreciation) on: | |
Investments | | | 926,258 | | |
Foreign Currency Translations | | | 1 | | |
Net Assets | | $ | 2,428,173 | | |
The accompanying notes are an integral part of the financial statements.
9
Morgan Stanley Institutional Fund, Inc.
Annual Report — December 31, 2013
Small Company Growth Portfolio
Statement of Assets and Liabilities (cont'd) | | December 31, 2013
(000) | |
CLASS I: | |
Net Assets | | $ | 2,017,558 | | |
| Shares Outstanding $0.001 par value shares of beneficial interest (500,000,000 shares authorized) (not in 000's) | | | 98,199,062 | | |
Net Asset Value, Offering and Redemption Price Per Share | | $ | 20.55 | | |
CLASS A*: | |
Net Assets | | $ | 282,632 | | |
| Shares Outstanding $0.001 par value shares of beneficial interest (500,000,000 shares authorized) (not in 000's) | | | 15,011,826 | | |
Net Asset Value, Redemption Price Per Share | | $ | 18.83 | | |
Maximum Sales Load§§ | | | 5.25 | % | |
Maximum Sales Charge | | $ | 1.04 | | |
Maximum Offering Price Per Share | | $ | 19.87 | | |
CLASS L: | |
Net Assets | | $ | 2,632 | | |
| Shares Outstanding $0.001 par value shares of beneficial interest (500,000,000 shares authorized) (not in 000's) | | | 141,486 | | |
Net Asset Value, Offering and Redemption Price Per Share | | $ | 18.60 | | |
CLASS IS: | |
Net Assets | | $ | 125,351 | | |
| Shares Outstanding $0.001 par value shares of beneficial interest (500,000,000 shares authorized) (not in 000's) | | | 6,100,954 | | |
Net Asset Value, Offering and Redemption Price Per Share | | $ | 20.55 | | |
(1) Including:
Securities on Loan, at Value: | | $ | 147,653 | | |
* Effective September 9, 2013, Class P and Class H shares were renamed Class A shares.
§§ Effective February 25, 2013, the Trustees approved the imposition of a maximum initial sales charge of 5.25% on purchases of Class A shares of the Portfolio.
The accompanying notes are an integral part of the financial statements.
10
Morgan Stanley Institutional Fund, Inc.
Annual Report — December 31, 2013
Small Company Growth Portfolio
Statement of Operations | | Year Ended
December 31, 2013
(000) | |
Investment Income: | |
Dividends from Securities of Unaffiliated Issuers (Net of $190 of Foreign Taxes Withheld) | | $ | 9,220 | | |
Income from Securities Loaned — Net | | | 566 | | |
Dividends from Security of Affiliated Issuer (Note G) | | | 74 | | |
Total Investment Income | | | 9,860 | | |
Expenses: | |
Advisory Fees (Note B) | | | 15,617 | | |
Administration Fees (Note C) | | | 1,417 | | |
Sub Transfer Agency Fees | | | 1,260 | | |
Sub Transfer Agency Fees — Class I | | | 363 | | |
Sub Transfer Agency Fees — Class A* | | | 83 | | |
Sub Transfer Agency Fees — Class L | | | 2 | | |
Shareholder Services Fees — Class A* (Note D) | | | 555 | | |
Distribution and Shareholder Services Fees — Class L (Note D) | | | 16 | | |
Professional Fees | | | 126 | | |
Custodian Fees (Note F) | | | 94 | | |
Shareholder Reporting Fees | | | 79 | | |
Registration Fees | | | 65 | | |
Directors' Fees and Expenses | | | 36 | | |
Transfer Agency Fees (Note E) | | | 15 | | |
Transfer Agency Fees — Class I (Note E) | | | 3 | | |
Transfer Agency Fees — Class A* (Note E) | | | 4 | | |
Transfer Agency Fees — Class L (Note E) | | | 1 | | |
Transfer Agency Fees — Class IS (Note E) | | | — | @ | |
Pricing Fees | | | 6 | | |
Other Expenses | | | 35 | | |
Total Expenses | | | 19,777 | | |
Waiver of Advisory Fees (Note B) | | | (594 | ) | |
Rebate from Morgan Stanley Affiliate (Note G) | | | (113 | ) | |
Reimbursement of Class Specific Expenses — Class L (Note B) | | | (1 | ) | |
Reimbursement of Class Specific Expenses — Class IS (Note B) | | | (— | @) | |
Net Expenses | | | 19,069 | | |
Net Investment Loss | | | (9,209 | ) | |
Realized Gain (Loss): | |
Investments Sold | | | 285,850 | | |
Foreign Currency Transactions | | | (19 | ) | |
Net Realized Gain | | | 285,831 | | |
Change in Unrealized Appreciation (Depreciation): | |
Investments | | | 581,505 | | |
Foreign Currency Translations | | | 1 | | |
Net Change in Unrealized Appreciation (Depreciation) | | | 581,506 | | |
Net Realized Gain and Change in Unrealized Appreciation (Depreciation) | | | 867,337 | | |
Net Increase in Net Assets Resulting from Operations | | $ | 858,128 | | |
@ Amount is less than $500.
* Effective September 9, 2013, Class P and Class H shares were renamed Class A shares.
The accompanying notes are an integral part of the financial statements.
11
Morgan Stanley Institutional Fund, Inc.
Annual Report — December 31, 2013
Small Company Growth Portfolio
Statements of Changes in Net Assets | | Year Ended
December 31,
2013
(000) | | Year Ended
December 31,
2012
(000) | |
Increase (Decrease) in Net Assets: | |
Operations: | |
Net Investment Loss | | $ | (9,209 | ) | | $ | (3,411 | ) | |
Net Realized Gain | | | 285,831 | | | | 74,072 | | |
Net Change in Unrealized Appreciation (Depreciation) | | | 581,506 | | | | 151,012 | | |
Net Increase in Net Assets Resulting from Operations | | | 858,128 | | | | 221,673 | | |
Distributions from and/or in Excess of: | |
Class I: | |
Net Realized Gain | | | (199,473 | ) | | | (49,670 | ) | |
Class A*: | |
Net Realized Gain | | | (30,381 | ) | | | (7,977 | ) | |
Class H@: | |
Net Realized Gain | | | (444 | )** | | | (1,517 | ) | |
Class L: | |
Net Realized Gain | | | (288 | ) | | | (80 | ) | |
Class IS: | |
Net Realized Gain | | | (11,450 | )*** | | | — | | |
Total Distributions | | | (242,036 | ) | | | (59,244 | ) | |
Capital Share Transactions:(1) | |
Class I: | |
Subscribed | | | 569,339 | | | | 151,108 | | |
Distributions Reinvested | | | 179,899 | | | | 44,622 | | |
Redeemed | | | (419,274 | ) | | | (254,616 | ) | |
Class A*: | |
Subscribed | | | 51,772 | | | | 25,076 | | |
Distributions Reinvested | | | 30,284 | | | | 7,977 | | |
Conversion from Class H | | | 40,275 | | | | — | | |
Redeemed | | | (63,380 | ) | | | (189,797 | ) | |
Class H@: | |
Subscribed | | | 365 | ** | | | 334 | | |
Distributions Reinvested | | | 432 | ** | | | 1,472 | | |
Conversion to Class A | | | (40,275 | )** | | | — | | |
Redeemed | | | (2,876 | )** | | | (5,104 | ) | |
Class L: | |
Subscribed | | | 277 | | | | 11 | | |
Distributions Reinvested | | | 286 | | | | 78 | | |
Redeemed | | | (333 | ) | | | (225 | ) | |
Class IS: | |
Subscribed | | | 119,724 | *** | | | — | | |
Distributions Reinvested | | | 11,449 | *** | | | — | | |
Redeemed | | | (413 | )*** | | | — | | |
Net Increase (Decrease) in Net Assets Resulting from Capital Share Transactions | | | 477,551 | | | | (219,064 | ) | |
Redemption Fees | | | 83 | | | | 39 | | |
Total Increase (Decrease) in Net Assets | | | 1,093,726 | | | | (56,596 | ) | |
Net Assets: | |
Beginning of Period | | | 1,334,447 | | | | 1,391,043 | | |
End of Period (Including Accumulated Net Investment Loss of $(331) and $(407)) | | $ | 2,428,173 | | | $ | 1,334,447 | | |
The accompanying notes are an integral part of the financial statements.
12
Morgan Stanley Institutional Fund, Inc.
Annual Report — December 31, 2013
Small Company Growth Portfolio
Statements of Changes in Net Assets (cont'd) | | Year Ended
December 31,
2013
(000) | | Year Ended
December 31,
2012
(000) | |
(1) Capital Share Transactions: | |
Class I: | |
Shares Subscribed | | | 30,361 | | | | 10,863 | | |
Shares Issued on Distributions Reinvested | | | 9,194 | | | | 3,171 | | |
Shares Redeemed | | | (22,130 | ) | | | (18,256 | ) | |
Net Increase (Decrease) in Class I Shares Outstanding | | | 17,425 | | | | (4,222 | ) | |
Class A*: | |
Shares Subscribed | | | 3,064 | | | | 1,938 | | |
Shares Issued on Distributions Reinvested | | | 1,685 | | | | 611 | | |
Conversion from Class H | | | 2,320 | | | | — | | |
Shares Redeemed | | | (3,998 | ) | | | (14,598 | ) | |
Net Increase (Decrease) in Class A* Shares Outstanding | | | 3,071 | | | | (12,049 | ) | |
Class H@: | |
Shares Subscribed | | | 23 | ** | | | 25 | | |
Shares Issued on Distributions Reinvested | | | 27 | ** | | | 113 | | |
Conversion to Class A | | | (2,319 | )** | | | — | | |
Shares Redeemed | | | (188 | )** | | | (393 | ) | |
Net Decrease in Class H Shares Outstanding | | | (2,457 | ) | | | (255 | ) | |
Class L: | |
Shares Subscribed | | | 16 | | | | 1 | | |
Shares Issued on Distributions Reinvested | | | 16 | | | | 6 | | |
Shares Redeemed | | | (20 | ) | | | (18 | ) | |
Net Increase (Decrease) in Class L Shares Outstanding | | | 12 | | | | (11 | ) | |
Class IS: | |
Shares Subscribed | | | 5,542 | *** | | | — | | |
Shares Issued on Distributions Reinvested | | | 579 | *** | | | — | | |
Shares Redeemed | | | (20 | )*** | | | — | | |
Net Increase in Class IS Shares Outstanding | | | 6,101 | | | | — | | |
@ Effective September 9, 2013, Class H shares converted into Class A shares.
* Effective September 9, 2013, Class P shares were renamed Class A shares.
** For the period January 1, 2013 through September 6, 2013.
*** For the period September 13, 2013 through December 31, 2013.
The accompanying notes are an integral part of the financial statements.
13
Morgan Stanley Institutional Fund, Inc.
Annual Report — December 31, 2013
Financial Highlights
Small Company Growth Portfolio
| | | Class I | |
| | | Year Ended December 31, | |
Selected Per Share Data and Ratios | | 2013 | | 2012 | | 2011 | | 2010 | | 2009 | |
Net Asset Value, Beginning of Period | | $ | 14.16 | | | $ | 12.64 | | | $ | 14.17 | | | $ | 11.14 | | | $ | 7.64 | | |
Income (Loss) from Investment Operations: | |
Net Investment Income (Loss)† | | | (0.09 | ) | | | (0.03 | ) | | | (0.04 | ) | | | 0.01 | | | | (0.03 | ) | |
Net Realized and Unrealized Gain (Loss) | | | 8.77 | | | | 2.19 | | | | (1.25 | ) | | | 3.02 | | | | 3.68 | | |
Total from Investment Operations | | | 8.68 | | | | 2.16 | | | | (1.29 | ) | | | 3.03 | | | | 3.65 | | |
Distributions from and/or in Excess of: | |
Net Investment Income | | | — | | | | — | | | | — | | | | — | | | | (0.01 | ) | |
Net Realized Gain | | | (2.29 | ) | | | (0.64 | ) | | | (0.24 | ) | | | — | | | | (0.14 | ) | |
Total Distributions | | | (2.29 | ) | | | (0.64 | ) | | | (0.24 | ) | | | — | | | | (0.15 | ) | |
Redemption Fees | | | 0.00 | ‡ | | | 0.00 | ‡ | | | 0.00 | ‡ | | | 0.00 | ‡ | | | 0.00 | ‡ | |
Net Asset Value, End of Period | | $ | 20.55 | | | $ | 14.16 | | | $ | 12.64 | | | $ | 14.17 | | | $ | 11.14 | | |
Total Return++ | | | 62.26 | % | | | 17.10 | % | | | (9.12 | )% | | | 27.20 | % | | | 47.92 | % | |
Ratios and Supplemental Data: | |
Net Assets, End of Period (Thousands) | | $ | 2,017,558 | | | $ | 1,143,640 | | | $ | 1,074,392 | | | $ | 1,227,782 | | | $ | 977,515 | | |
Ratio of Expenses to Average Net Assets (1) | | | 1.04 | %+ | | | 1.05 | %+†† | | | 1.05 | %+ | | | 1.05 | %+†† | | | 1.05 | %+ | |
Ratio of Expenses to Average Net Assets Excluding Non Operating Expenses | | | N/A | | | | N/A | | | | 1.05 | %+ | | | 1.05 | %+†† | | | 1.05 | %+ | |
Ratio of Net Investment Income (Loss) to Average Net Assets (1) | | | (0.49 | )%+ | | | (0.20 | )%+†† | | | (0.29 | )%+ | | | 0.10 | %+†† | | | (0.28 | )%+ | |
Ratio of Rebate from Morgan Stanley Affiliates to Average Net Assets | | | 0.01 | % | | | 0.00 | %††§ | | | 0.00 | %§ | | | 0.00 | %††§ | | | 0.00 | %§ | |
Portfolio Turnover Rate | | | 43 | % | | | 22 | % | | | 26 | % | | | 26 | % | | | 27 | % | |
(1) Supplemental Information on the Ratios to Average Net Assets: | |
Ratios Before Expense Limitation: | |
Expenses to Average Net Assets | | | 1.08 | % | | | 1.12 | %†† | | | 1.10 | % | | | 1.12 | %+†† | | | 1.07 | %+ | |
Net Investment Income (Loss) to Average Net Assets | | | (0.53 | )% | | | (0.27 | )%†† | | | (0.34 | )% | | | 0.03 | %+†† | | | (0.30 | )%+ | |
† Per share amount is based on average shares outstanding.
‡ Amount is less than $0.005 per share.
++ Calculated based on the net asset value as of the last business day of the period.
+ The Ratios of Expenses and Net Investment Income (Loss) reflect the rebate of certain Portfolio expenses in connection with the investments in Morgan Stanley affiliates during the period. The effect of the rebate on the ratios is disclosed in the above table as "Ratio of Rebate from Morgan Stanley Affiliates to Average Net Assets."
†† Reflects overall Portfolio ratios for investment income and non-class specific expenses.
§ Amount is less than 0.005%.
The accompanying notes are an integral part of the financial statements.
14
Morgan Stanley Institutional Fund, Inc.
Annual Report — December 31, 2013
Financial Highlights
Small Company Growth Portfolio
| | | Class A@ | |
| | | Year Ended December 31, | |
Selected Per Share Data and Ratios | | 2013 | | 2012 | | 2011 | | 2010 | | 2009 | |
Net Asset Value, Beginning of Period | | $ | 13.13 | | | $ | 11.80 | | | $ | 13.27 | | | $ | 10.46 | | | $ | 7.19 | | |
Income (Loss) from Investment Operations: | |
Net Investment Loss† | | | (0.13 | ) | | | (0.06 | ) | | | (0.07 | ) | | | (0.02 | ) | | | (0.05 | ) | |
Net Realized and Unrealized Gain (Loss) | | | 8.12 | | | | 2.03 | | | | (1.16 | ) | | | 2.83 | | | | 3.46 | | |
Total from Investment Operations | | | 7.99 | | | | 1.97 | | | | (1.23 | ) | | | 2.81 | | | | 3.41 | | |
Distributions from and/or in Excess of: | |
Net Realized Gain | | | (2.29 | ) | | | (0.64 | ) | | | (0.24 | ) | | | — | | | | (0.14 | ) | |
Redemption Fees | | | 0.00 | ‡ | | | 0.00 | ‡ | | | 0.00 | ‡ | | | 0.00 | ‡ | | | 0.00 | ‡ | |
Net Asset Value, End of Period | | $ | 18.83 | | | $ | 13.13 | | | $ | 11.80 | | | $ | 13.27 | | | $ | 10.46 | | |
Total Return++ | | | 61.88 | % | | | 16.70 | % | | | (9.28 | )% | | | 26.86 | % | | | 47.41 | % | |
Ratios and Supplemental Data: | |
Net Assets, End of Period (Thousands) | | $ | 282,632 | | | $ | 156,824 | | | $ | 282,988 | | | $ | 530,123 | | | $ | 536,329 | | |
Ratio of Expenses to Average Net Assets (1) | | | 1.31 | %+^ | | | 1.30 | %+†† | | | 1.30 | %+ | | | 1.30 | %+†† | | | 1.30 | %+ | |
Ratio of Expenses to Average Net Assets Excluding Non Operating Expenses | | | N/A | | | | N/A | | | | 1.30 | %+ | | | 1.30 | %+†† | | | 1.30 | %+ | |
Ratio of Net Investment Loss to Average Net Assets (1) | | | (0.75 | )%+ | | | (0.45 | )%+†† | | | (0.54 | )%+ | | | (0.15 | )%+†† | | | (0.53 | )%+ | |
Ratio of Rebate from Morgan Stanley Affiliates to Average Net Assets | | | 0.01 | % | | | 0.00 | %††§ | | | 0.00 | %§ | | | 0.00 | %††§ | | | 0.00 | %§ | |
Portfolio Turnover Rate | | | 43 | % | | | 22 | % | | | 26 | % | | | 26 | % | | | 27 | % | |
(1) Supplemental Information on the Ratios to Average Net Assets: | |
Ratios Before Expense Limitation: | |
Expenses to Average Net Assets | | | 1.35 | % | | | 1.37 | %†† | | | 1.35 | % | | | 1.37 | %+†† | | | 1.32 | %+ | |
Net Investment Loss to Average Net Assets | | | (0.79 | )% | | | (0.52 | )%†† | | | (0.59 | )% | | | (0.22 | )%+†† | | | (0.55 | )%+ | |
@ Effective September 9, 2013, Class P and Class H shares were renamed Class A shares.
† Per share amount is based on average shares outstanding.
‡ Amount is less than $0.005 per share.
++ Calculated based on the net asset value which does not reflect sales charges, if applicable, as of the last business day of the period.
+ The Ratios of Expenses and Net Investment Loss reflect the rebate of certain Portfolio expenses in connection with the investments in Morgan Stanley affiliates during the period. The effect of the rebate on the ratios is disclosed in the above table as "Ratio of Rebate from Morgan Stanley Affiliates to Average Net Assets."
^ Effective September 16, 2013, the Adviser has agreed to limit the ratio of expenses to average net assets to the maximum ratio of 1.40% for Class A shares. Prior to September 16, 2013, the maximum ratio was 1.30% for Class A shares.
†† Reflects overall Portfolio ratios for investment income and non-class specific expenses.
§ Amount is less than 0.005%.
The accompanying notes are an integral part of the financial statements.
15
Morgan Stanley Institutional Fund, Inc.
Annual Report — December 31, 2013
Financial Highlights
Small Company Growth Portfolio
| | | Class L | |
| | | Year Ended
December 31, | | Period from
November 11, 2011^ to | |
Selected Per Share Data and Ratios | | 2013 | | 2012 | | December 31, 2011 | |
Net Asset Value, Beginning of Period | | $ | 13.06 | | | $ | 11.79 | | | $ | 12.47 | | |
Income (Loss) from Investment Operations: | |
Net Investment Income (Loss)† | | | (0.21 | ) | | | (0.12 | ) | | | (0.01 | ) | |
Net Realized and Unrealized Gain (Loss) | | | 8.04 | | | | 2.03 | | | | (0.43 | ) | |
Total from Investment Operations | | | 7.83 | | | | 1.91 | | | | (0.44 | ) | |
Distributions from and/or in Excess of: | |
Net Realized Gain | | | (2.29 | ) | | | (0.64 | ) | | | (0.24 | ) | |
Redemption Fees | | | 0.00 | ‡ | | | 0.00 | ‡ | | | 0.00 | ‡ | |
Net Asset Value, End of Period | | $ | 18.60 | | | $ | 13.06 | | | $ | 11.79 | | |
Total Return++ | | | 60.97 | % | | | 16.21 | % | | | (3.54 | )%# | |
Ratios and Supplemental Data: | |
Net Assets, End of Period (Thousands) | | $ | 2,632 | | | $ | 1,696 | | | $ | 1,657 | | |
Ratio of Expenses to Average Net Assets (1) | | | 1.83 | %+^^ | | | 1.80 | %+†† | | | 1.80 | %+* | |
Ratio of Net Investment Loss to Average Net Assets (1) | | | (1.27 | )%+ | | | (0.95 | )%+†† | | | (0.77 | )%+* | |
Ratio of Rebate from Morgan Stanley Affiliates to Average Net Assets | | | 0.01 | % | | | 0.00 | %††§ | | | 0.00 | %§* | |
Portfolio Turnover Rate | | | 43 | % | | | 22 | % | | | 26 | %* | |
(1) Supplemental Information on the Ratios to Average Net Assets: | |
Ratios Before Expense Limitation: | |
Expenses to Average Net Assets | | | 1.92 | % | | | 1.87 | %†† | | | 1.85 | %* | |
Net Investment Loss to Average Net Assets | | | (1.36 | )% | | | (1.02 | )%†† | | | (0.82 | )%* | |
^ Commencement of Operations.
† Per share amount is based on average shares outstanding.
‡ Amount is less than $0.005 per share.
++ Calculated based on the net asset value as of the last business day of the period.
+ The Ratios of Expenses and Net Investment Loss reflect the rebate of certain Portfolio expenses in connection with the investments in Morgan Stanley affiliates during the period. The effect of the rebate on the ratios is disclosed in the above table as "Ratio of Rebate from Morgan Stanley Affiliates to Average Net Assets."
^^ Effective September 16, 2013, the Adviser has agreed to limit the ratio of expenses to average net assets to the maximum ratio of 1.90% for Class L shares. Prior to September 16, 2013, the maximum ratio was 1.80% for Class L shares.
†† Reflects overall Portfolio ratios for investment income and non-class specific expenses.
§ Amount is less than 0.005%.
# Not Annualized.
* Annualized.
The accompanying notes are an integral part of the financial statements.
16
Morgan Stanley Institutional Fund, Inc.
Annual Report — December 31, 2013
Financial Highlights
Small Company Growth Portfolio
| | | Class IS | |
Selected Per Share Data and Ratios | | Period from
September 13, 2013^ to
December 31, 2013 | |
Net Asset Value, Beginning of Period | | $ | 19.51 | | |
Income from Investment Operations: | |
Net Investment Loss† | | | (0.02 | ) | |
Net Realized and Unrealized Gain | | | 3.15 | | |
Total from Investment Operations | | | 3.13 | | |
Distributions from and/or in Excess of: | |
Net Realized Gain | | | (2.09 | ) | |
Redemption Fees | | | 0.00 | ‡ | |
Net Asset Value, End of Period | | $ | 20.55 | | |
Total Return++ | | | 16.50 | %# | |
Ratios and Supplemental Data: | |
Net Assets, End of Period (Thousands) | | $ | 125,351 | | |
Ratio of Expenses to Average Net Assets (1) | | | 0.97 | %+^^* | |
Ratio of Net Investment Loss to Average Net Assets (1) | | | (0.30 | )%+* | |
Ratio of Rebate from Morgan Stanley Affiliates to Average Net Assets | | | 0.01 | %* | |
Portfolio Turnover Rate | | | 43 | %# | |
(1) Supplemental Information on the Ratios to Average Net Assets: | |
Ratios Before Expense Limitation: | |
Expenses to Average Net Assets | | | 0.99 | %* | |
Net Investment Loss to Average Net Assets | | | (0.32 | )%* | |
^ Commencement of Operations.
† Per share amount is based on average shares outstanding.
‡ Amount is less than $0.005 per share.
++ Calculated based on the net asset value as of the last business day of the period.
+ The Ratios of Expenses and Net Investment Loss reflect the rebate of certain Portfolio expenses in connection with the investments in Morgan Stanley affiliates during the period. The effect of the rebate on the ratios is disclosed in the above table as "Ratio of Rebate from Morgan Stanley Affiliates to Average Net Assets."
^^ Effective September 16, 2013, the Adviser has agreed to limit the ratio of expenses to average net assets to the maximum ratio of 0.98% for Class IS shares.
§ Amount is less than 0.005%.
# Not Annualized.
* Annualized.
The accompanying notes are an integral part of the financial statements.
17
Morgan Stanley Institutional Fund, Inc.
Annual Report — December 31, 2013
Notes to Financial Statements
Morgan Stanley Institutional Fund, Inc. (the "Fund") is registered under the Investment Company Act of 1940, as amended (the "Act"), as an open-end management investment company. The Fund is comprised of twenty-seven separate, active, diversified and non-diversified portfolios (individually referred to as a "Portfolio", collectively as the "Portfolios").
The accompanying financial statements relate to the Small Company Growth Portfolio. The Portfolio seeks long-term capital appreciation by investing primarily in growth-oriented equity securities of small capitalization companies. The Portfolio offers four classes of shares — Class I, Class A, Class L and Class IS.
The Fund had suspended offering shares of the Small Company Growth Portfolio to new investors. The Fund will continue to offer shares of the Portfolio to existing shareholders. As of April 30, 2013, the Portfolio recommenced offering only Class I shares.
On September 16, 2013, the Portfolio commenced offering Class IS shares. Effective September 9, 2013, Class P and Class H shares were renamed Class A shares.
A. Significant Accounting Policies: The following significant accounting policies are in conformity with U.S. generally accepted accounting principles ("GAAP"). Such policies are consistently followed by the Fund in the preparation of its financial statements. GAAP may require management to make estimates and assumptions that affect the reported amounts and disclosures in the financial statements. Actual results may differ from those estimates.
1. Security Valuation: (1) An equity portfolio security listed or traded on an exchange is valued at its latest reported sales price (or at the exchange official closing price if such exchange reports an official closing price), if there were no sales on a given day, the security is valued at the mean between the last reported bid and asked prices; (2) all other equity portfolio securities for which over-the-counter market quotations are readily available are valued at its latest reported sales price. In cases where a security is traded on more than one exchange, the security is valued on the exchange designated as the primary market; (3) listed options are valued at the last reported sales price on the exchange on which they are listed (or at the exchange official closing price if such exchange reports an official closing price). If an official closing price or last reported sales price is unavailable, the listed option should
be fair valued at the mean between their latest bid and asked price. Unlisted options are valued by an outside pricing service approved by the Fund's Board of Directors (the "Directors") or quotes from a broker or dealer; (4) when market quotations are not readily available, including circumstances under which Morgan Stanley Investment Management Inc. (the "Adviser") determines that the closing price, last sale price or the mean between the last reported bid and asked prices are not reflective of a security's market value, portfolio securities are valued at their fair value as determined in good faith under procedures established by and under the general supervision of the Directors. Occasionally, developments affecting the closing prices of securities and other assets may occur between the times at which valuations of such securities are determined (that is, close of the foreign market on which the securities trade) and the close of business of the New York Stock Exchange ("NYSE"). If developments occur during such periods that are expected to materially affect the value of such securities, such valuations may be adjusted to reflect the estimated fair value of such securities as of the close of the NYSE, as determined in good faith by the Directors or by the Adviser using a pricing service and/or procedures approved by the Directors; (5) quotations of foreign portfolio securities, other assets and liabilities and forward contracts stated in foreign currency are translated into U.S. dollar equivalents at the prevailing market rates prior to the close of the NYSE; (6) investments in mutual funds, including the Morgan Stanley Institutional Liquidity Funds, are valued at the net asset value as of the close of each business day; and (7) short-term debt securities with remaining maturities of 60 days or less at the time of purchase may be valued at amortized cost, unless the Adviser determines such valuation does not reflect the securities' market value, in which case these securities will be valued at their fair market value determined by the Adviser.
Under procedures approved by the Directors, the Fund's Adviser has formed a Valuation Committee. The Valuation Committee provides administration and oversight of the Fund's valuation policies and procedures, which are reviewed at least annually by the Directors. These procedures allow the Fund to utilize independent pricing services, quotations from securities and financial instrument dealers, and other market sources to determine fair value.
18
Morgan Stanley Institutional Fund, Inc.
Annual Report — December 31, 2013
Notes to Financial Statements (cont'd)
The Fund has procedures to determine the fair value of securities and other financial instruments for which market prices are not readily available. Under these procedures, the Valuation Committee convenes on a regular and ad hoc basis to review such securities and considers a number of factors, including valuation methodologies and significant unobservable valuation inputs, when arriving at fair value. The Valuation Committee may employ a market-based approach which may use related or comparable assets or liabilities, recent transactions, market multiples, book values, and other relevant information for the investment to determine the fair value of the investment. An income-based valuation approach may also be used in which the anticipated future cash flows of the investment are discounted to calculate fair value. Discounts may also be applied due to the nature or duration of any restrictions on the disposition of the investments. Due to the inherent uncertainty of valuations of such investments, the fair values may differ significantly from the values that would have been used had an active market existed. The Valuation Committee employs various methods for calibrating these valuation approaches including a regular review of valuation methodologies, key inputs and assumptions, transactional back-testing or disposition analysis, and reviews of any related market activity.
2. Fair Value Measurement: Financial Accounting Standards Board ("FASB") Accounting Standards CodificationTM ("ASC") 820, "Fair Value Measurements and Disclosures" ("ASC 820"), defines fair value as the value that the Fund would receive to sell an investment or pay to transfer a liability in a timely transaction with an independent buyer in the principal market, or in the absence of a principal market the most advantageous market for the investment or liability. ASC 820 establishes a three-tier hierarchy to distinguish between (1) inputs that reflect the assumptions market participants would use in valuing an asset or liability developed based on market data obtained from sources independent of the reporting entity (observable inputs) and (2) inputs that reflect the reporting entity's own assumptions about the assumptions market participants would use in valuing an asset or liability developed based on the best information available in the circumstances (unobservable inputs) and to establish classification of fair value measurements for disclosure purposes. Various inputs are used in determining the value of
the Fund's investments. The inputs are summarized in the three broad levels listed below.
• Level 1 – unadjusted quoted prices in active markets for identical investments
• Level 2 – other significant observable inputs (including quoted prices for similar investments, interest rates, prepayment speeds, credit risk, etc.)
• Level 3 – significant unobservable inputs including the Fund's own assumptions in determining the fair value of investments. Factors considered in making this determination may include, but are not limited to, information obtained by contacting the issuer, analysts, or the appropriate stock exchange (for exchange-traded securities), analysis of the issuer's financial statements or other available documents and, if necessary, available information concerning other securities in similar circumstances
The inputs or methodology used for valuing securities are not necessarily an indication of the risk associated with investing in those securities and the determination of the significance of a particular input to the fair value measurement in its entirety requires judgment and considers factors specific to each security.
The following is a summary of the inputs used to value the Portfolio's investments as of December 31, 2013.
Investment Type | | Level 1
Unadjusted
quoted
prices
(000) | | Level 2
Other
significant
observable
inputs
(000) | | Level 3
Significant
unobservable
inputs
(000) | | Total
(000) | |
Assets: | |
Common Stocks | |
Advertising Agencies | | $ | 62,852 | | | $ | — | | | $ | — | | | $ | 62,852 | | |
Air Transport | | | 32,912 | | | | — | | | | — | | | | 32,912 | | |
Asset Management &
Custodian | | | 106,144 | | | | — | | | | — | | | | 106,144 | | |
Auto Parts | | | 20,039 | | | | — | | | | — | | | | 20,039 | | |
Banks: Diversified | | | 26,568 | | | | — | | | | — | | | | 26,568 | | |
Beverage: Brewers &
Distillers | | | 31,808 | | | | — | | | | — | | | | 31,808 | | |
Biotechnology | | | 17,326 | | | | — | | | | — | | | | 17,326 | | |
Building Materials | | | 19,949 | | | | — | | | | — | | | | 19,949 | | |
Cement | | | 21,987 | | | | — | | | | — | | | | 21,987 | | |
Chemicals: Diversified | | | 8,136 | | | | — | | | | — | | | | 8,136 | | |
Commercial Services | | | 253,060 | | | | — | | | | — | | | | 253,060 | | |
Computer Services,
Software & Systems | | | 294,474 | | | | — | | | | — | | | | 294,474 | | |
19
Morgan Stanley Institutional Fund, Inc.
Annual Report — December 31, 2013
Notes to Financial Statements (cont'd)
Investment Type | | Level 1
Unadjusted
quoted
prices
(000) | | Level 2
Other
significant
observable
inputs
(000) | | Level 3
Significant
unobservable
inputs
(000) | | Total
(000) | |
Common Stocks (cont'd) | |
Computer Technology | | $ | 168,672 | | | $ | — | | | $ | — | | | $ | 168,672 | | |
Consumer Electronics | | | 15,031 | | | | — | | | | — | | | | 15,031 | | |
Diversified Financial
Services | | | 35,878 | | | | 8,007 | | | | — | | | | 43,885 | | |
Diversified Retail | | | 148,790 | | | | — | | | | — | | | | 148,790 | | |
Electronic Components | | | 23,642 | | | | — | | | | — | | | | 23,642 | | |
Electronics | | | 32,940 | | | | — | | | | — | | | | 32,940 | | |
Entertainment | | | 47,887 | | | | — | | | | 7,178 | | | | 55,065 | | |
Foods | | | 236,095 | | | | — | | | | — | | | | 236,095 | | |
Health Care
Management
Services | | | 40,821 | | | | — | | | | — | | | | 40,821 | | |
Health Care Services | | | 88,341 | | | | — | | | | — | | | | 88,341 | | |
Household Appliances | | | 22,384 | | | | — | | | | — | | | | 22,384 | | |
Insurance: Multi-Line | | | 32,265 | | | | — | | | | — | | | | 32,265 | | |
Leisure Time | | | 10,433 | | | | — | | | | — | | | | 10,433 | | |
Medical & Dental
Instruments &
Supplies | | | 24,137 | | | | — | | | | — | | | | 24,137 | | |
Medical Services | | | 71,088 | | | | — | | | | — | | | | 71,088 | | |
Oil: Crude Producers | | | 19,173 | | | | — | | | | — | | | | 19,173 | | |
Pharmaceuticals | | | 15,594 | | | | — | | | | — | | | | 15,594 | | |
Restaurants | | | 39,241 | | | | — | | | | — | | | | 39,241 | | |
Semiconductors &
Components | | | 40,262 | | | | — | | | | — | | | | 40,262 | | |
Specialty Retail | | | 38,439 | | | | — | | | | — | | | | 38,439 | | |
Technology:
Miscellaneous | | | 37,333 | | | | — | | | | — | | | | 37,333 | | |
Telecommunications
Equipment | | | 44,129 | | | | — | | | | — | | | | 44,129 | | |
Truckers | | | 11,913 | | | | — | | | | — | | | | 11,913 | | |
Utilities: Electrical | | | — | | | | — | | | | — | † | | | — | † | |
Total Common
Stocks | | | 2,139,743 | | | | 8,007 | | | | 7,178 | † | | | 2,154,928 | | |
Preferred Stocks | | | — | | | | — | | | | 23,264 | | | | 23,264 | | |
Convertible Preferred
Stocks | | | — | | | | 131,851 | | | | — | @ | | | 131,851 | | |
Fixed Income
Securities —
Promissory Notes | | | — | | | | — | | | | 715 | | | | 715 | | |
Call Options
Purchased | | | — | | | | 1,192 | | | | — | | | | 1,192 | | |
Short-Term Investments | |
Investment Company | | | 241,609 | | | | — | | | | — | | | | 241,609 | | |
Repurchase Agreements | | | — | | | | 17,163 | | | | — | | | | 17,163 | | |
Total Short-Term
Investments | | | 241,609 | | | | 17,163 | | | | — | | | | 258,772 | | |
Total Assets | | $ | 2,381,352 | | | $ | 158,213 | | | $ | 31,157 | † | | $ | 2,570,722 | | |
† Includes one security which is valued at zero.
@ Value is less than $500.
Transfers between investment levels may occur as the markets fluctuate and/or the availability of data used in an investment's valuation changes. The Portfolio recognizes transfers between the levels as of the end of the period. As of December 31, 2013, securities with a total value of approximately $57,937,000 transferred from Level 2 to Level 1. At December 31, 2012, the fair value of certain securities were adjusted due to developments which occurred between the time of the close of the foreign markets on which they trade and the close of business on the NYSE which resulted in their Level 2 classification. At December 31, 2013, the Portfolio held a security with a value of approximately $131,851,000 that transferred from Level 3 to Level 2. This security was valued using significant unobservable inputs at December 31, 2012 and was valued using other significant observable inputs at December 31, 2013.
Following is a reconciliation of investments in which significant unobservable inputs (Level 3) were used in determining fair value.
| | | Common
Stocks
(000) | | Preferred
Stocks
(000) | | Convertible
Preferred
Stocks
(000) | | Promissory
Notes
(000) | |
Beginning Balance | | $ | 10,104 | † | | $ | 12,313 | | | $ | 53,571 | | | $ | 822 | | |
Purchases | | | — | | | | 9,580 | | | | — | | | | — | | |
Sales | | | — | | | | — | | | | — | | | | — | | |
Amortization of discount | | | — | | | | — | | | | — | | | | — | | |
Transfers in | | | — | | | | — | | | | — | | | | — | | |
Transfers out | | | — | | | | — | | | | (131,851 | ) | | | — | | |
Corporate action | | | — | | | | — | | | | (18,249 | ) | | | — | | |
Change in unrealized
appreciation/
depreciation | | | (2,926 | ) | | | 1,371 | | | | 96,529 | | | | 52 | | |
Realized gains (losses) | | | — | | | | — | | | | — | | | | (159 | ) | |
Ending Balance | | $ | 7,178 | † | | $ | 23,264 | | | $ | — | @ | | $ | 715 | | |
Net change in unrealized
appreciation/depreciation
from investments
still held as of
December 31, 2013 | | $ | (2,926 | ) | | $ | 1,371 | | | $ | 1,036 | | | $ | 52 | | |
† Includes one security which is valued at zero.
@ Value is less than $500.
20
Morgan Stanley Institutional Fund, Inc.
Annual Report — December 31, 2013
Notes to Financial Statements (cont'd)
The following table presents additional information about valuation techniques and inputs used for investments that are measured at fair value and categorized within Level 3 as of December 31, 2013.
| | | Fair Value at
December 31, 2013
(000) | | Valuation
Technique | | Unobservable
Input | | Range | | Weighted
Average | | Impact to
Valuation from an
Increase in Input | |
Advertising Agencies | |
Preferred Stock | | $ | 1,067 | | | Market Transaction | | Precedent Transaction | | $ | 4.18 | | | $ | 4.18 | | | $ | 4.18 | | | Increase | |
| | | | | Discounted Cash Flow | | Weighted Average
Cost of Capital | | | 13.0 | % | | | 15.0 | % | | | 14.0 | % | | Decrease | |
| | | | | | | Perpetual Growth Rate | | | 2.0 | % | | | 3.0 | % | | | 2.5 | % | | Increase | |
| | | | | Market Comparable
Companies | | Enterprise Value/
Revenue | | | 2.9 | x | | | 9.9 | x | | | 6.0 | x | | Increase | |
| | | | | | | Discount for Lack
of Marketability | | | 15.0 | % | | | 15.0 | % | | | 15.0 | % | | Decrease | |
| Preferred Stock — Escrow | | $ | 88 | | | | | Discount for Escrow | | | 42.7 | % | | | 42.7 | % | | | 42.7 | % | | Decrease | |
Promissory Note | | $ | 702 | | | Market Transaction | | Valuation at Issuance
as a Percentage
of Principal | | | 100.00 | % | | | 100.00 | % | | | 100.00 | % | | Increase | |
| | | | | | | Cost of Debt | | | 12.1 | % | | | 12.1 | % | | | 12.1 | % | | Decrease | |
| | | | | | | Valuation as a Percentage
of Principal | | | 88.4 | % | | | 88.4 | % | | | 88.4 | % | | Increase | |
| Promissory Note — Escrow | | $ | 13 | | | Valuation as a Percentage
Market Transaction | | of Principal | | | 45.7 | % | | | 45.7 | % | | | 45.7 | % | | Increase | |
Diversified Retail | |
Preferred Stock | | $ | 9,890 | | | Market Transaction
Method | | Precedent Transaction
of Preferred Stock | | $ | 22.95 | | | $ | 22.95 | | | $ | 22.95 | | | Increase | |
| | | | | Discounted Cash Flow | | Weighted Average
Cost of Capital | | | 17.0 | % | | | 19.0 | % | | | 18.0 | % | | Decrease | |
| | | | | | | Perpetual Growth Rate | | | 3.5 | % | | | 4.5 | % | | | 4.0 | % | | Increase | |
| | | | | Market Comparable
Companies | | Enterprise Value/
Revenue | | | 3.1 | x | | | 7.5 | x | | | 5.7 | x | | Increase | |
| | | | | | | Discount for Lack
of Marketability | | | 15.0 | % | | | 15.0 | % | | | 15.0 | % | | Decrease | |
Entertainment | |
Common Stock | | $ | 7,178 | | | Market Transaction
Method | | Precedent Transaction | | $ | 1,853.18 | | | $ | 1,853.18 | | | $ | 1,853.18 | | | Increase | |
| | | | | Discounted Cash Flow | | Weighted Average
Cost of Capital | | | 15.0 | % | | | 16.0 | % | | | 15.6 | % | | Decrease | |
| | | | | | | Perpetual Growth Rate | | | 3.5 | % | | | 4.5 | % | | | 4.0 | % | | Increase | |
| | | | | Market Comparable
Companies | | Enterprise Value/
EBITDA | | | 9.6 | x | | | 24.9 | x | | | 21.1 | x | | Increase | |
| | | | | | | Discount for Lack
of Marketability | | | 15.0 | % | | | 15.0 | % | | | 15.0 | % | | Decrease | |
Health Care Services | |
Preferred Stock | | $ | 12,219 | | | Discounted Cash Flow | | Weighted Average
Cost of Capital | | | 17.0 | % | | | 19.0 | % | | | 18.0 | % | | Decrease | |
| | | | | | | Perpetual Growth Rate | | | 3.5 | % | | | 4.5 | % | | | 4.0 | % | | Increase | |
| | | | | Market Comparable
Companies | | Enterprise Value/
Revenue | | | 11.0 | x | | | 21.7x | | | | 15.5x | | | Increase | |
| | | | | | | Discount for Lack
of Marketability | | | 15.0 | % | | | 15.0 | % | | | 15.0 | % | | Decrease | |
21
Morgan Stanley Institutional Fund, Inc.
Annual Report — December 31, 2013
Notes to Financial Statements (cont'd)
3. Derivatives: The Portfolio may, but is not required to, use derivative instruments for a variety of purposes, including hedging, risk management, portfolio management or to earn income. Derivatives are financial instruments whose value is based, in part, on the value of an underlying asset, interest rate, index or financial instrument. Prevailing interest rates and volatility levels, among other things, also affect the value of derivative instruments. A derivative instrument often has risks similar to its underlying asset and may have additional risks, including imperfect correlation between the value of the derivative and the underlying asset, risks of default by the counterparty to certain transactions, magnification of losses incurred due to changes in the market value of the securities, instruments, indices or interest rates to which they relate, and risks that the transactions may not be liquid. The use of derivatives involves risks that are different from, and possibly greater than, the risks associated with other portfolio investments. Derivatives may involve the use of highly specialized instruments that require investment techniques and risk analyses different from those associated with other portfolio investments. All of the Portfolio's holdings, including derivative instruments, are marked-to-market each day with the change in value reflected in unrealized appreciation (depreciation). Upon disposition, a realized gain or loss is recognized.
Certain derivative transactions may give rise to a form of leverage. Leverage magnifies the potential for gain and the risk of loss. Leverage associated with derivative transactions may cause the Portfolio to liquidate portfolio positions when it may not be advantageous to do so to satisfy its obligations or to meet earmarking or segregation requirements, pursuant to applicable Securities and Exchange Commission rules and regulations, or may cause the Portfolio to be more volatile than if the Portfolio had not been leveraged. Although the Adviser seeks to use derivatives to further the Portfolio's investment objectives, there is no assurance that the use of derivatives will achieve this result.
Following is a description of the derivative instruments and techniques that the Portfolio used during the period and their associated risks:
Options: In respect to options, the Portfolio is subject to equity risk, interest rate risk and foreign currency exchange risk in the normal course of pursuing its investment objectives. If the Portfolio buys an option, it buys a legal contract giving it the right to buy or sell a specific amount of the underlying instrument or futures contract on the underlying instrument such a as security, currency or index, at an agreed upon price typically in exchange for a premium paid by the Portfolio. The Portfolio may purchase put and call options. Purchasing call options tends to increase the Portfolio's exposure to the underlying (or similar) instrument. Purchasing put options tends to decrease the Portfolio's exposure to the underlying (or similar) instrument. When entering into purchased option contracts, the Portfolio bears the risk of interest or exchange rates or securities prices moving unexpectedly, in which case, the Portfolio may not achieve the anticipated benefits of the purchased option contracts; however the risk of loss is limited to the premium paid. Purchased options are reported as part of "Total Investments" on the Statement of Assets and Liabilities. Premium paid for purchasing options which expired are treated as realized losses. If the Portfolio sells an option, it sells to another party the right to buy from or sell to the Portfolio a specific amount of the underlying instrument or futures contract on the underlying instrument at an agreed upon price typically in exchange for a premium received by the Portfolio. There is the risk the Portfolio may not be able to enter into a closing transaction because of an illiquid market. A decision as to whether, when and how to use options involves the exercise of skill and judgment and even a well-conceived option transaction may be unsuccessful because of market behavior or unexpected events. The prices of options can be highly volatile and the use of options can lower total returns.
FASB ASC 815, "Derivatives and Hedging: Overall" ("ASC 815"), is intended to improve financial reporting about derivative instruments by requiring enhanced disclosures to enable investors to better understand how and why the Portfolio uses derivative instruments, how these derivative instruments are accounted for and their effects on the Portfolio's financial position and results of operations.
22
Morgan Stanley Institutional Fund, Inc.
Annual Report — December 31, 2013
Notes to Financial Statements (cont'd)
The following table sets forth the fair value of the Portfolio's derivative contracts by primary risk exposure as of December 31, 2013.
| | | Asset Derivatives
Statement of Assets and
Liabilities Location | | Primary Risk
Exposure | | Value
(000) | |
Options Purchased | | Investments, at Value
(Options Purchased) | | Equity Risk | | $ | 1,192 | + | |
+ Amounts are included in Investments in the Statement of Assets and Liabilities.
The following table sets forth by primary risk exposure the Portfolio's change in unrealized appreciation (depreciation) by type of derivative contract for the year ended December 31, 2013 in accordance with ASC 815.
Change in Unrealized Appreciation (Depreciation) | |
Primary Risk Exposure | | Derivative Type | | Value
(000) | |
Currency Risk | | Investments
(Options Purchased) | | $ | (1,036 | )++ | |
++ Amounts are included in Investments in the Statement of Operations.
At December 31, 2013, the Portfolio's derivative assets and liabilities are as follows:
Gross Amounts of Assets and Liabilities Presented in the
Statement of Assets and Liabilities | |
Derivatives | | Assets(a)
(000) | | Liabilities(a)
(000) | |
Options Purchased | | $ | 1,192 | | | $ | — | | |
(a) Absent an event of default or early termination, OTC derivative assets and liabilities are presented gross and not offset in the Statement of Assets and Liabilities.
The following table presents derivatives financial instruments that are subject to enforceable netting arrangements as of December 31, 2013.
Gross Amounts Not Offset in the Statement of Assets and Liabilities | |
Counterparty | | Gross Asset
Derivatives
Presented in
Statement of
Assets and Liabilities
(000) | | Financial
Instrument
(000) | | Collateral
Received
(000) | | Net
Amount
(not less
than 0)
(000) | |
Royal Bank of Scotland | | $ | 1,192 | | | | — | | | $ | (1,192 | )(1) | | $ | 0 | | |
(1) The actual collateral received is greater than the amount shown here due to overcollateralization.
For the year ended December 31, 2013, the approximate average monthly amount outstanding for each derivative type is as follows:
Options Purchased: | |
| Average monthly notional amount | | | 58,895,000 | | |
4. Foreign Currency Translation and Foreign Investments: The books and records of the Portfolio are maintained in U.S. dollars. Foreign currency amounts are translated into U.S. dollars as follows:
– investments, other assets and liabilities at the prevailing rate of exchange on the valuation date;
– investment transactions and investment income at the prevailing rates of exchange on the dates of such transactions.
Although the net assets of the Portfolio are presented at the foreign exchange rates and market values at the close of the period, the Portfolio does not isolate that portion of the results of operations arising as a result of changes in the foreign exchange rates from the fluctuations arising from changes in the market prices of securities held at period end. Similarly, the Portfolio does not isolate the effect of changes in foreign exchange rates from the fluctuations arising from changes in the market prices of securities sold during the period. Accordingly, realized and unrealized foreign currency gains (losses) on investments in securities are included in the reported net realized and unrealized gains (losses) on investment transactions and balances. However, pursuant to U.S. Federal income tax regulations, gains and losses from certain foreign currency transactions and the foreign currency portion of gains and losses realized on sales and maturities of foreign denominated debt securities are treated as ordinary income for U.S. Federal income tax purposes.
Net realized gains (losses) on foreign currency transactions represent net foreign exchange gains (losses) from foreign currency forward exchange contracts, disposition of foreign currencies, currency gains (losses) realized between the trade and settlement dates on securities transactions, and the difference between the amount of investment income and foreign withholding taxes recorded on the Portfolio's books and the U.S. dollar equivalent amounts actually received or paid. Net unrealized currency gains (losses) from valuing foreign currency denominated assets and liabilities at period end exchange rates are reflected as a component of unrealized appreciation (depreciation) on the Statement of Assets and Liabilities. The change in unrealized currency gains (losses) on foreign currency translations for the period is reflected in the Statement of Operations.
23
Morgan Stanley Institutional Fund, Inc.
Annual Report — December 31, 2013
Notes to Financial Statements (cont'd)
Foreign security and currency transactions may involve certain considerations and risks not typically associated with those of U.S. dollar denominated transactions as a result of, among other factors, fluctuations of exchange rates in relation to the U.S. dollar, the possibility of lower levels of governmental supervision and regulation of foreign securities markets and the possibility of political or economic instability.
Governmental approval for foreign investments may be required in advance of making an investment under certain circumstances in some countries, and the extent of foreign investments in domestic companies may be subject to limitation in other countries. Foreign ownership limitations also may be imposed by the charters of individual companies to prevent, among other concerns, violations of foreign investment limitations. As a result, an additional class of shares (identified as "Foreign" in the Portfolio of Investments) may be created and offered for investment. The "local" and "foreign shares" market values may differ. In the absence of trading of the foreign shares in such markets, the Portfolio values the foreign shares at the closing exchange price of the local shares.
5. Securities Lending: The Portfolio lends securities to qualified financial institutions, such as broker-dealers, to earn additional income. Any increase or decrease in the fair value of the securities loaned that might occur and any interest earned or dividends declared on those securities during the term of the loan would remain in the Portfolio. The Portfolio would receive cash or securities as collateral in an amount equal to or exceeding 100% of the current fair value of the loaned securities. The collateral is marked-to-market daily, by State Street Bank and Trust Company ("State Street"), the securities lending agent, to ensure that a minimum of 100% collateral coverage is maintained.
Based on pre-established guidelines, the securities lending agent invests any cash collateral that is received in an affiliated money market portfolio and repurchase agreements. Securities lending income is generated from the earnings on the invested collateral and borrowing fees, less any rebates owed to the borrowers and compensation to the lending agent, and is recorded as "Income from Securities Loaned-Net" in the Portfolio's Statement of Operations. Risks in securities lending transactions are that a borrower may not provide additional collateral when required or return the securities when due, and
that the value of the short-term investments will be less than the amount of cash collateral plus any rebate that is required to be returned to the borrower.
The Portfolio has the right under the lending agreement to recover the securities from the borrower on demand.
The following table presents financial instruments that are subject to enforceable netting arrangements as of December 31, 2013.
Gross Amounts Not Offset in the Statement of Assets and Liabilities | |
Gross Asset
Amounts
Presented in
Statement of
Assets and
Liabilities
(000) | | Financial
Instrument
(000) | | Collateral
Received
(000) | | Net Amount
(not less than 0)
(000) | |
| $ | 147,653 | (a) | | | — | | | $ | (147,653 | )(b)(c) | | $ | 0 | | |
(a) Represents market value of loaned securities at period end.
(b) The Portfolio received cash collateral of approximately $132,237,000, of which approximately $128,316,000 was subsequently invested in Repurchase Agreements and Morgan Stanley Institutional Liquidity Funds as reported in the Portfolio of Investments. As of December 31, 2013 there was uninvested cash of approximately $3,921,000, which is not reflected in the Portfolio of Investments. In addition, the Portfolio received non-cash collateral of approximately $18,135,000 in the form of U.S. government obligations, which the Portfolio cannot sell or repledge, and accordingly are not reflected in the Portfolio of Investments.
(c) The actual collateral received is greater than the amount shown here due to overcollateralization.
6. Restricted Securities: The Portfolio invests in unregistered or otherwise restricted securities. The term "restricted securities" refers to securities that are unregistered or are held by control persons of the issuer and securities that are subject to contractual restrictions on their resale. As a result, restricted securities may be more difficult to value and the Portfolio may have difficulty disposing of such assets either in a timely manner or for a reasonable price. In order to dispose of an unregistered security, the Portfolio, where it has contractual rights to do so, may have to cause such security to be registered. A considerable period may elapse between the time the decision is made to sell the security and the time the security is registered so that the Portfolio could sell it. Contractual restrictions on the resale of securities vary in length and scope and are generally the result of a negotiation between the issuer and acquirer of the securities. The Portfolio would, in either case, bear market risks during that period. Restricted Securities are identified in the Portfolio of Investments.
7. Redemption Fees: The Portfolio will assess a 2% redemption fee, on Class I shares, Class A shares, Class L
24
Morgan Stanley Institutional Fund, Inc.
Annual Report — December 31, 2013
Notes to Financial Statements (cont'd)
shares and Class IS shares, which is paid directly to the Portfolio, for shares redeemed or exchanged within thirty days of purchase, subject to certain exceptions. The redemption fee is designed to protect the Portfolio and its remaining shareholders from the effects of short-term trading. These fees, if any, are included in the Statements of Changes in Net Assets.
8. Indemnifications: The Fund enters into contracts that contain a variety of indemnifications. The Fund's maximum exposure under these arrangements is unknown. However, the Fund has not had prior claims or losses pursuant to these contracts and expects the risk of loss to be remote.
9. Dividends and Distributions to Shareholders: Dividend income and distributions to shareholders are recorded on the ex-dividend date. Dividends from net investment income, if any, are declared and paid semiannually. Net realized capital gains, if any, are distributed at least annually.
10. Security Transactions, Income and Expenses: Security transactions are accounted for on the trade date (date the order to buy or sell is executed). Realized gains and losses on the sale of investment securities are determined on the specific identified cost method. Dividend income and other distributions are recorded on the ex-dividend date (except for certain foreign dividends which may be recorded as soon as the Portfolio is informed of such dividends) net of applicable withholding taxes. Interest income is recognized on the accrual basis except where collection is in doubt. Discounts are accreted and premiums are amortized over the life of the respective securities. Most expenses of the Fund can be directly attributed to a particular Portfolio. Expenses which cannot be directly attributed are apportioned among the Portfolios based upon relative net assets or other appropriate methods. Income, expenses (other than class specific expenses — distribution, transfer agency and sub transfer agency fees) and realized and unrealized gains or losses are allocated to each class of shares based upon their relative net assets.
B. Advisory Fees: The Adviser, a wholly-owned subsidiary of Morgan Stanley, provides the Portfolio with advisory services under the terms of an Investment Advisory Agreement,
paid quarterly, at the annual rate based on the average daily net assets as follows:
First $1
billion | | Next $500
million | | Over $1.5
billion | |
| | 0.92 | % | | | 0.85 | % | | | 0.80 | % | |
For the year ended December 31, 2013, the advisory fee rate (net of waivers/rebate) was equivalent to an annual effective rate of 0.84% of the Portfolio's daily net assets.
The Adviser has agreed to reduce its advisory fee and/or reimburse the Portfolio so that total annual portfolio operating expenses, excluding certain investment related expenses, taxes, interest and other extraordinary expenses (including litigation), will not exceed 1.05% for Class I shares, 1.30% for Class A shares and 1.80% for Class L shares. Effective September 16, 2013, the Adviser has agreed to limit the ratio of expenses to average net assets to the maximum ratio of 1.40%, 1.90% and 0.98% for Class A, Class L and Class IS shares, respectively. The fee waivers and/or expense reimbursements will continue for at least one year or until such time that the Directors act to discontinue all or a portion of such waivers and/or reimbursements when it deems such action is appropriate. For the year ended December 31, 2013, approximately $594,000 of advisory fees were waived and approximately $1,000 of other expenses were reimbursed by the Adviser pursuant to this arrangement.
C. Administration Fees: The Adviser also serves as Administrator to the Fund and provides administrative services pursuant to an Administration Agreement for an annual fee, accrued daily and paid monthly, of 0.08% of the Portfolio's average daily net assets. Under a Sub-Administration Agreement between the Administrator and State Street, State Street provides certain administrative services to the Fund. For such services, the Administrator pays State Street a portion of the fee the Administrator receives from the Portfolio.
D. Distribution and Shareholder Services Fees: Morgan Stanley Distribution, Inc. ("MSDI" or the "Distributor"), a wholly-owned subsidiary of the Adviser, and an indirect subsidiary of Morgan Stanley, serves as the Fund's Distributor of Portfolio shares pursuant to a Distribution Agreement. The Fund has adopted a Shareholder Services Plan with respect to Class A shares pursuant to Rule 12b-1 under the Act. Under the Shareholder Services Plan, the Portfolio pays the Distributor a shareholder services fee, accrued daily and paid monthly, at an annual rate of 0.25% of the Portfolio's average daily net assets attributable to Class A shares.
25
Morgan Stanley Institutional Fund, Inc.
Annual Report — December 31, 2013
Notes to Financial Statements (cont'd)
The Fund has adopted a Distribution and Shareholder Services Plan with respect to Class L shares pursuant to Rule 12b-1 under the Act. Under the Distribution and Shareholder Services Plan, the Portfolio pays the Distributor a distribution fee, accrued daily and paid monthly, at an annual rate of 0.50% and a shareholder services fee, accrued daily and paid monthly, at an annual rate of 0.25% of the Portfolio's average daily net assets attributable to Class L shares.
The distribution and shareholder services fees are used to support the expenses associated with servicing and maintaining accounts. The Distributor may compensate other parties for providing shareholder support services to investors who purchase Class A and Class L shares.
E. Dividend Disbursing and Transfer Agent: The Fund's dividend disbursing and transfer agent was Morgan Stanley Services Company Inc. ("Morgan Stanley Services"). Pursuant to a Transfer Agency Agreement, the Fund paid Morgan Stanley Services a fee based on the number of classes, accounts and transactions relating to the Portfolios of the Fund. Effective July 1, 2013, the Directors approved changing the transfer agent to Boston Financial Data Services, Inc.
F. Custodian Fees: State Street (the "Custodian") serves as Custodian for the Fund in accordance with a Custodian Agreement. The Custodian holds cash, securities, and other assets of the Fund as required by the Act. Custody fees are payable monthly based on assets held in custody, investment purchases and sales activity and account maintenance fees, plus reimbursement for certain out-of-pocket expenses.
G. Security Transactions and Transactions with Affiliates: For the year ended December 31, 2013, purchases and sales of investment securities for the Portfolio, other than long-term U.S. Government securities and short-term investments, were approximately $836,276,000 and $726,211,000, respectively. There were no purchases and sales of long-term U.S. Government securities for the year ended December 31, 2013.
The Portfolio invests in the Institutional Class of the Morgan Stanley Institutional Liquidity Funds — Money Market Portfolio (the "Liquidity Funds"), an open-end management investment company managed by the Adviser, both directly, and as a portion of the securities held as collateral on loaned securities. Advisory fees paid by the Portfolio are reduced by an amount equal to its pro-rata share of the advisory and administration fees paid by the Portfolio due to its investment in the Liquidity Funds. For the year ended December 31, 2013, advisory fees
paid were reduced by approximately $113,000 relating to the Portfolio's investment in the Liquidity Funds.
A summary of the Portfolio's transactions in shares of the Liquidity Funds during the year ended December 31, 2013 is as follows:
Value
December 31,
2012
(000) | | Purchases
at Cost
(000) | | Sales
(000) | | Dividend
Income
(000) | | Value
December 31,
2013
(000) | |
| $ | 21,929 | | | $ | 773,337 | | | $ | 553,657 | | | $ | 74 | | | $ | 241,609 | | |
From January 1, 2013 to June 30, 2013, the Portfolio incurred less than $500 in brokerage commissions with Citigroup, Inc., and its affiliated broker-dealers, which may be deemed affiliates of the Adviser, Administrator and Distributor under Section 17 of the Act, for portfolio transactions executed on behalf of the Portfolio. Citigroup, Inc. and its affiliated broker-dealers ceased to be affiliates of the Portfolio pursuant to Section 17 of the Act as of July 1, 2013.
H. Federal Income Taxes: It is the Portfolio's intention to continue to qualify as a regulated investment company and distribute all of its taxable and tax-exempt income. Accordingly, no provision for Federal income taxes is required in the financial statements.
The Portfolio may be subject to taxes imposed by countries in which it invests. Such taxes are generally based on income and/or capital gains earned or repatriated. Taxes are accrued based on net investment income, net realized gains and net unrealized appreciation as such income and/or gains are earned. Taxes may also be based on transactions in foreign currency and are accrued based on the value of investments denominated in such currency.
FASB ASC 740-10, Income Taxes — Overall, sets forth a minimum threshold for financial statement recognition of the benefit of a tax position taken or expected to be taken in a tax return. Management has concluded there are no significant uncertain tax positions that would require recognition in the financial statements. If applicable, the Portfolio recognizes interest accrued related to unrecognized tax benefits in "Interest Expense" and penalties in "Other Expenses" in the Statement of Operations. The Portfolio files tax returns with the U.S. Internal Revenue Service, New York and various states. Each of the tax years in the four-year period ended December 31, 2013, remains subject to examination by taxing authorities.
The tax character of distributions paid may differ from the character of distributions shown in the Statements of Changes in Net Assets due to short-term capital gains being treated as
26
Morgan Stanley Institutional Fund, Inc.
Annual Report — December 31, 2013
Notes to Financial Statements (cont'd)
ordinary income for tax purposes. The tax character of distributions paid during fiscal years 2013 and 2012 was as follows:
2013
Distributions
Paid From: | | 2012
Distributions
Paid From: | |
Ordinary
Income
(000) | | Long-Term
Capital Gain
(000) | | Ordinary
Income
(000) | | Long-Term
Capital Gain
(000) | |
| $ | 1,519 | | | $ | 240,517 | | | $ | 11,266 | | | $ | 47,978 | | |
The amount and character of income and gains to be distributed are determined in accordance with income tax regulations which may differ from GAAP. These book/tax differences are either considered temporary or permanent in nature.
Temporary differences are attributable to differing book and tax treatments for the timing of the recognition of gains (losses) on certain investment transactions and the timing of the deductibility of certain expenses.
Permanent differences, primarily due to differing treatments of gains (losses) related to foreign currency transactions, a net operating loss, return of capital distributions from real estate investment trusts and basis adjustments on certain equity securities designated as passive foreign investment companies and partnerships, resulted in the following reclassifications among the components of net assets at December 31, 2013:
Accumulated
Net Investment
Loss
(000) | | Accumulated
Net Realized
Gain
(000) | | Paid-in-
Capital
(000) | |
| $ | 9,285 | | | $ | (2,638 | ) | | $ | (6,647 | ) | |
At December 31, 2013, the components of distributable earnings for the Portfolio on a tax basis were as follows:
Undistributed
Ordinary
Income
(000) | | Undistributed
Long-Term
Capital Gain
(000) | |
| | — | | | $ | 56,820 | | |
At December 31, 2013, the aggregate cost for Federal income tax purposes is approximately $1,649,896,000. The aggregate gross unrealized appreciation is approximately $965,846,000 and the aggregate gross unrealized depreciation is approximately $45,019,000 resulting in net unrealized appreciation of approximately $920,827,000.
To the extent that capital loss carryforwards are used to offset any future capital gains realized during the carryover period as provided by U.S. Federal income tax regulations, no capital gains tax liability will be incurred by the Portfolio for gains realized and not distributed. To the extent that capital gains are offset, such gains will not be distributed to the shareholders. During the year ended December 31, 2013, the Portfolio
utilized capital loss carryforwards for U. S. Federal income tax purposes of approximately $1,263,000.
Capital losses and specified ordinary losses, including currency losses, incurred after October 31 but within the taxable year are deemed to arise on the first day of the Portfolio's next taxable year. For the year ended December 31, 2013, the Portfolio deferred to January 1, 2014 for U.S. Federal income tax purposes the following losses:
Post-October
Currency And
Specified
Ordinary
Losses
(000) | | Post-October
Capital Losses
(000) | |
| $ | 18 | | | | — | | |
I. Other (unaudited): At December 31, 2013, the Portfolio had otherwise unaffiliated record owners of 10% or greater. Investment activities of these shareholders could have a material impact on the Portfolio. The aggregate percentage of such owners was 55%, 62% and 99%, for Class I, Class A and Class IS shares, respectively.
J. Results of Special Shareholder Meeting (unaudited): On June 5, 2013 as adjourned to June 24, 2013 and July 17, 2013, a Joint Special Shareholder Meeting was held for Class H shareholders of the Portfolio to approve the Articles of Amendment to the Fund's Articles of Amendment and Restatement and a Plan of Reclassification for the Portfolio pursuant to which Class H shares would be reclassified as Class P shares. The results with respect to this proposal were as follows:
| For | | Against | | Abstain | |
| | 986,589 | | | | 64,037 | | | | 143,127 | | |
K. Accounting Pronouncement: In June 2013, FASB issued Accounting Standards Update 2013-08 Financial Services — Investment Companies (Topic 946) — Amendments to the Scope, Measurement, and Disclosure Requirements ("ASU 2013-08") which is effective for interim and annual reporting periods in fiscal years that begin after December 15, 2013. ASU 2013-08 sets forth a methodology for determining whether an entity should be characterized as an investment company and prescribes fair value accounting for an investment company's non-controlling ownership interest in another investment company. FASB has determined that a fund registered under the Investment Company Act of 1940 automatically meets ASU 2013-08's criteria for an investment company. Although still evaluating the potential impacts of ASU 2013-08 to the Portfolio, management expects that the impact of the Portfolio's adoption will be limited to additional financial statement disclosures.
27
Morgan Stanley Institutional Fund, Inc.
Annual Report — December 31, 2013
Report of Independent Registered Public Accounting Firm
To the Shareholders and Board of Directors of
Morgan Stanley Institutional Fund, Inc. —
Small Company Growth Portfolio
We have audited the accompanying statement of assets and liabilities, including the portfolio of investments, of Small Company Growth Portfolio (one of the portfolios constituting Morgan Stanley Institutional Fund, Inc.) (the "Portfolio") as of December 31, 2013, and the related statement of operations for the year then ended, the statements of changes in net assets for each of the two years in the period then ended, and the financial highlights for each of the periods indicated therein. These financial statements and financial highlights are the responsibility of the Portfolio's management. Our responsibility is to express an opinion on these financial statements and financial highlights based on our audits.
We conducted our audits in accordance with the standards of the Public Company Accounting Oversight Board (United States). Those standards require that we plan and perform the audit to obtain reasonable assurance about whether the financial statements and financial highlights are free of material misstatement. We were not engaged to perform an audit of the Portfolio's internal control over financial reporting. Our audits included consideration of internal control over financial reporting as a basis for designing audit procedures that are appropriate in the circumstances, but not for the purpose of expressing an opinion on the effectiveness of the Portfolio's internal control over financial reporting. Accordingly, we express no such opinion. An audit also includes examining, on a test basis, evidence supporting the amounts and disclosures in the financial statements and financial highlights, assessing the accounting principles used and significant estimates made by management, and evaluating the overall financial statement presentation. Our procedures included confirmation of securities owned as of December 31, 2013, by correspondence with the custodian and others or by other appropriate auditing procedures where replies from others were not received. We believe that our audits provide a reasonable basis for our opinion.
In our opinion, the financial statements and financial highlights referred to above present fairly, in all material respects, the financial position of Small Company Growth Portfolio (one of the portfolios constituting Morgan Stanley Institutional Fund, Inc.) at December 31, 2013, the results of its operations for the year then ended, the changes in its net assets for each of the two years in the period then ended, and the financial highlights for each of the periods indicated therein, in conformity with U.S. generally accepted accounting principles.

Boston, Massachusetts
February 26, 2014
28
Morgan Stanley Institutional Fund, Inc.
Annual Report — December 31, 2013
Federal Tax Notice (unaudited)
For Federal income tax purposes, the following information is furnished with respect to the distributions paid by the Portfolio during its taxable year ended December 31, 2013. For corporate shareholders, 56.5% of the dividends qualified for the dividends received deduction.
The Portfolio designated and paid approximately $240,517,000 as a long-term capital gain distribution.
For Federal income tax purposes, the following information is furnished with respect to the Portfolio's earnings for its taxable year ended December 31, 2013.
When distributed, certain earnings may be subject to a maximum tax rate of 15% as provided for the Jobs and Growth Tax Relief Reconciliation Act of 2003. The Portfolio designated up to a maximum of approximately $8,996,000 as taxable at this lower rate.
In January, the Portfolio provides tax information to shareholders for the preceding calendar year.
29
Morgan Stanley Institutional Fund, Inc.
Annual Report — December 31, 2013
U.S. Privacy Policy (unaudited)
AN IMPORTANT NOTICE CONCERNING OUR U.S. PRIVACY POLICY
This privacy notice describes the U.S. privacy policy of Morgan Stanley Distribution, Inc., and the Morgan Stanley family of mutual funds ("us", "our", "we").
We are required by federal law to provide you with notice of our U.S. privacy policy ("Policy"). This Policy applies to both our current and former clients unless we state otherwise and is intended for individual clients who purchase products or receive services from us for personal, family or household purposes. This Policy is not applicable to partnerships, corporations, trusts or other non-individual clients or account holders, nor is this Policy applicable to individuals who are either beneficiaries of a trust for which we serve as trustee or participants in an employee benefit plan administered or advised by us. This Policy is, however, applicable to individuals who select us to be a custodian of securities or assets in individual retirement accounts, 401(k) accounts, or accounts subject to the Uniform Gifts to Minors Act.
This notice sets out our business practices to protect your privacy; how we collect and share personal information about you; and how you can limit our sharing or certain uses by others of this information. We may amend this Policy at any time, and will inform you of any changes to our Policy as required by law.
WE RESPECT YOUR PRIVACY
We appreciate that you have provided us with your personal financial information and understand your concerns about your information. We strive to safeguard the information our clients entrust to us. Protecting the confidentiality and security of client information is an important part of how we conduct our business.
This notice describes what personal information we collect about you, how we collect it, when we may share it with others, and how certain others may use it. It discusses the steps you may take to limit our sharing of certain information about you with our affiliated companies, including, but not limited to our affiliated banking businesses, brokerage firms and credit service affiliates. It also discloses how you may limit our affiliates' use of shared information for marketing purposes.
Throughout this Policy, we refer to the nonpublic information that personally identifies you as "personal information." We also use the term "affiliated company" in this notice. An affiliated company is a company in our family of companies and includes companies with the Morgan Stanley name. These affiliated companies are financial institutions such as broker-dealers, banks, investment advisers and credit card issuers. We refer to any company that is not an affiliated company as a nonaffiliated third party. For purposes of Section 5 of this notice, and your ability to limit certain uses of personal information by our affiliates, this notice applies to the use of personal information by our affiliated companies.
1. WHAT PERSONAL INFORMATION DO WE COLLECT FROM YOU?
We may collect the following types of information about you: (i) information provided by you, including information from applications and other forms we receive from you, (ii) information about your transactions with us or our affiliates, (iii) information about your transactions with nonaffiliated third parties, (iv) information from consumer reporting agencies, (v) information obtained from our websites, and (vi) information obtained from other sources. For example:
• We collect information such as your name, address, e-mail address, telephone/fax numbers, assets, income and investment objectives through applications and other forms you submit to us.
• We may obtain information about account balances, your use of account(s) and the types of products and services you prefer to receive from us through your dealings and transactions with us and other sources.
• We may obtain information about your creditworthiness and credit history from consumer reporting agencies.
• We may collect background information from and through third-party vendors to verify representations you have made and to comply with various regulatory requirements.
2. WHEN DO WE DISCLOSE PERSONAL INFORMATION WE COLLECT ABOUT YOU?
We may disclose personal information we collect about you in each of the categories listed above to affiliated and nonaffiliated third parties.
30
Morgan Stanley Institutional Fund, Inc.
Annual Report — December 31, 2013
U.S. Privacy Policy (unaudited) (cont'd)
a. Information we disclose to affiliated companies.
We may disclose personal information that we collect about you to our affiliated companies to manage your account(s) effectively, to service and process your transactions, and to let you know about products and services offered by us and affiliated companies, to manage our business, and as otherwise required or permitted by law. Offers for products and services from affiliated companies are developed under conditions designed to safeguard your personal information.
b. Information we disclose to third parties.
We may disclose personal information that we collect about you to nonaffiliated third parties to provide marketing services on our behalf or to other financial institutions with whom we have joint marketing agreements. We may also disclose all of the information we collect to other nonaffiliated third parties for our everyday business purposes, such as to process transactions, maintain account(s), respond to court orders and legal investigations, report to credit bureaus, offer our own products and services, protect against fraud, for institutional risk control, to perform services on our behalf, and as otherwise required or permitted by law.
When we share personal information about you with a nonaffiliated third party, they are required to limit their use of personal information about you to the particular purpose for which it was shared and they are not allowed to share personal information about you with others except to fulfill that limited purpose or as may be permitted or required by law.
3. HOW DO WE PROTECT THE SECURITY AND CONFIDENTIALITY OF PERSONAL INFORMATION WE COLLECT ABOUT YOU?
We maintain physical, electronic and procedural security measures that comply with applicable law and regulations to help safeguard the personal information we collect about you. We have internal policies governing the proper handling of client information by employees. Third parties that provide support or marketing services on our behalf may also receive personal information about you, and we require them to adhere to appropriate security standards with respect to such information.
4. HOW CAN YOU LIMIT OUR SHARING CERTAIN PERSONAL INFORMATION ABOUT YOU WITH OUR AFFILIATED COMPANIES FOR ELIGIBILITY DETERMINATION?
By following the opt-out procedures in Section 6 below, you may limit the extent to which we share with our affiliated companies, personal information that was collected to determine your eligibility for products and services such as your credit reports and other information that you have provided to us or that we may obtain from third parties ("eligibility information"). Eligibility information does not include your identification information or personal information pertaining to our transactions or experiences with you. Please note that, even if you direct us not to share eligibility information with our affiliated companies, we may still share your personal information, including eligibility information, with our affiliated companies under circumstances that are permitted under applicable law, such as to process transactions or to service your account.
5. HOW CAN YOU LIMIT THE USE OF CERTAIN PERSONAL INFORMATION ABOUT YOU BY OUR AFFILIATED COMPANIES FOR MARKETING?
By following the opt-out instructions in Section 6 below, you may limit our affiliated companies from marketing their products or services to you based on personal information we disclose to them. This information may include, for example, your income and account history with us. Please note that, even if you choose to limit our affiliated companies from using personal information about you that we may share with them for marketing their products and services to you, our affiliated companies may use your personal information that they obtain from us to market to you in circumstances permitted by law, such as if the affiliated party has its own relationship with you.
31
Morgan Stanley Institutional Fund, Inc.
Annual Report — December 31, 2013
U.S. Privacy Policy (unaudited) (cont'd)
6. HOW CAN YOU SEND US AN OPT-OUT INSTRUCTION?
If you wish to limit our sharing of eligibility information about you with our affiliated companies, or our affiliated companies' use of personal information for marketing purposes, as described in this notice, you may do so by:
• Calling us at (800) 548-7786
Monday–Friday between 8a.m. and 5p.m. (EST)
• Writing to us at the following address:
Boston Financial Data Services, Inc.
c/o Privacy Coordinator
P.O. Box 219804
Kansas City, Missouri 64121
If you choose to write to us, your request should include: your name, address, telephone number and account number(s) to which the opt-out applies and whether you are opting out with respect to sharing of eligibility information (Section 4 above), or information used for marketing (Section 5 above), or both. Written opt-out requests should not be sent with any other correspondence. In order to process your request, we require that the request be provided by you directly and not through a third party. Once you have informed us about your privacy preferences, your opt-out preference will remain in effect with respect to this Policy (as it may be amended) until you notify us otherwise. If you are a joint account owner, we will accept instructions from any one of you and apply those instructions to the entire account.
Please understand that if you limit our sharing or our affiliated companies' use of personal information, you and any joint account holder(s) may not receive information about our affiliated companies' products and services, including products or services that could help you manage your financial resources and achieve your investment objectives.
If you have more than one account or relationship with us, please specify the accounts to which you would like us to apply your privacy choices. If you have accounts or relationships with our affiliates, you may receive multiple privacy policies from them, and will need to separately notify those companies of your privacy choices for those accounts or relationships.
7. WHAT IF AN AFFILIATED COMPANY BECOMES A NONAFFILIATED THIRD PARTY?
If, at any time in the future, an affiliated company becomes a nonaffiliated third party, further disclosures of personal information made to the former affiliated company will be limited to those described in Section 2(b) above relating to nonaffiliated third parties. If you elected under Section 6 to limit disclosures we make to affiliated companies, or use of personal information by affiliated companies, your election will not apply to use by any former affiliated company of your personal information in their possession once it becomes a nonaffiliated third party.
SPECIAL NOTICE TO RESIDENTS OF VERMONT
The following section supplements our Policy with respect to our individual clients who have a Vermont address and supersedes anything to the contrary in the above Policy with respect to those clients only.
The State of Vermont requires financial institutions to obtain your consent prior to sharing personal information that they collect about you with nonaffiliated third parties, or eligibility information with affiliated companies, other than in certain limited circumstances. Except as permitted by law, we will not share personal information we collect about you with nonaffiliated third parties or eligibility information with affiliated companies, unless you provide us with your written consent to share such information.
SPECIAL NOTICE TO RESIDENTS OF CALIFORNIA
The following section supplements our Policy with respect to our individual clients who have a California address and supersedes anything to the contrary in the above Policy with respect to those clients only.
In response to a California law, if your account has a California home address, your personal information will not be disclosed to nonaffiliated third parties except as permitted by applicable California law, and we will limit sharing such personal information with our affiliates to comply with California privacy laws that apply to us.
32
Morgan Stanley Institutional Fund, Inc.
Annual Report — December 31, 2013
Director and Officer Information (unaudited)
Independent Director:
Name, Age and Address of
Independent Director | | Position(s)
Held with
Registrant | | Length of Time
Served* | | Principal Occupation(s) During Past 5 Years | | Number of
Portfolios in
Fund Complex
Overseen by
Independent
Director** | | Other Directorships
Held by Independent
Director*** | |
Frank L. Bowman (69)
c/o Kramer Levin Naftalis &
Frankel LLP
Counsel to the Independent
Directors
1177 Avenue of the Americas
New York, NY 10036 | | Director | | Since
August
2006 | | President, Strategic Decisions, LLC (consulting) (since February 2009); Director or Trustee of various Morgan Stanley Funds (since August 2006); Chairperson of the Insurance Sub-Committee of the Compliance and Insurance Committee (since February 2007); served as President and Chief Executive Officer of the Nuclear Energy Institute (policy organization) (February 2005-November 2008); retired as Admiral, U.S. Navy after serving over 38 years on active duty including 8 years as Director of the Naval Nuclear Propulsion Program in the Department of the Navy and the U.S. Department of Energy (1996-2004); served as Chief of Naval Personnel (July 1994-September 1996); and on the Joint Staff as Director of Political Military Affairs (June 1992-July 1994); knighted as Honorary Knight Commander of the Most Excellent Order of the British Empire; awarded the Officier de l'Orde National du Mérite by the French Government; elected to the National Academy of Engineering (2009). | | | 98 | | | Director of BP p.l.c.; Director of Naval and Nuclear Technologies LLP; Director of the Armed Services YMCA of the USA and the U.S. Naval Submarine League; Director of the American Shipbuilding Suppliers Association; Member of the National Security Advisory Council of the Center for U.S. Global Engagement and a member of the CNA Military Advisory Board; Chairman of the Charity J Street Cup Golf; Trustee of Fairhaven United Methodist Church. | |
Michael Bozic (73)
c/o Kramer Levin Naftalis & Frankel LLP
Counsel to the Independent Directors
1177 Avenue of the Americas New York, NY 10036 | | Director | | Since
April
1994 | | Private investor and a member of the advisory board of American Road Group LLC (retail) (since June 2000); Chairperson of the Compliance and Insurance Committee (since October 2006); Director or Trustee of various Morgan Stanley Funds (since April 1994); formerly, Chairperson of the Insurance Committee (July 2006-September 2006); Vice Chairman of Kmart Corporation (December 1998-October 2000); Chairman and Chief Executive Officer of Levitz Furniture Corporation (November 1995-November 1998) and President and Chief Executive Officer of Hills Department Stores (May 1991-July 1995); variously Chairman, Chief Executive Officer, President and Chief Operating Officer (1987-1991) of the Sears Merchandise Group of Sears, Roebuck & Co. | | | 100 | | | Trustee and member of the Hillsdale College Board of Trustees. | |
Kathleen A. Dennis (60)
c/o Kramer Levin Naftalis & Frankel LLP
Counsel to the Independent Directors
1177 Avenue of the Americas New York, NY 10036 | | Director | | Since
August
2006 | | President, Cedarwood Associates (mutual fund and investment management consulting) (since July 2006); Chairperson of the Money Market and Alternatives Sub-Committee of the Investment Committee (since October 2006) and Director or Trustee of various Morgan Stanley Funds (since August 2006); formerly, Senior Managing Director of Victory Capital Management (1993-2006). | | | 98 | | | Director of various non-profit organizations. | |
Dr. Manuel H. Johnson (65)
c/o Johnson Smick
International, Inc.
220 I Street, NE
Suite 200
Washington, D.C. 20002 | | Director | | Since
July
1991 | | Senior Partner, Johnson Smick International, Inc. (consulting firm); Chairperson of the Investment Committee (since October 2006) and Director or Trustee of various Morgan Stanley Funds (since July 1991); Co-Chairman and a founder of the Group of Seven Council (G7C) (international economic commission); formerly, Chairperson of the Audit Committee (July 1991-September 2006); Vice Chairman of the Board of Governors of the Federal Reserve System and Assistant Secretary of the U.S. Treasury. | | | 101 | | | Director of NVR, Inc. (home construction). | |
33
Morgan Stanley Institutional Fund, Inc.
Annual Report — December 31, 2013
Director and Officer Information (unaudited) (cont'd)
Independent Director: (cont'd)
Name, Age and Address of
Independent Director | | Position(s)
Held with
Registrant | | Length of Time
Served* | | Principal Occupation(s) During Past 5 Years | | Number of
Portfolios in
Fund Complex
Overseen by
Independent
Director** | | Other Directorships
Held by Independent
Director*** | |
Joseph J. Kearns (71)
c/o Kearns & Associates LLC PMB754
22631 Pacific Coast Highway
Malibu, CA 90265 | | Director | | Since
August
1994 | | President, Kearns & Associates LLC (investment consulting); Chairperson of the Audit Committee (since October 2006) and Director or Trustee of various Morgan Stanley Funds (since August 1994); formerly, Deputy Chairperson of the Audit Committee (July 2003-September 2006) and Chairperson of the Audit Committee of various Morgan Stanley Funds (since August 1994); CFO of the J. Paul Getty Trust. | | | 101 | | | Director of Electro Rent Corporation (equipment leasing) and The Ford Family Foundation. | |
Michael F. Klein (55)
c/o Kramer Levin Naftalis & Frankel LLP
Counsel to the Independent Directors
1177 Avenue of the Americas New York, NY 10036 | | Director | | Since
August
2006 | | Managing Director, Aetos Capital, LLC (since March 2000) and Co-President, Aetos Alternatives Management, LLC (since January 2004) and Co-Chief Executive Officer of Aetos Capital LLC (since August 2013); Chairperson of the Fixed Income Sub-Committee of the Investment Committee (since October 2006) and Director or Trustee of various Morgan Stanley Funds (since August 2006); formerly, Managing Director, Morgan Stanley & Co. Inc. and Morgan Stanley Dean Witter Investment Management, President, various Morgan Stanley Funds (June 1998-March 2000) and Principal, Morgan Stanley & Co. Inc. and Morgan Stanley Dean Witter Investment Management (August 1997-December 1999). | | | 98 | | | Director of certain investment funds managed or sponsored by Aetos Capital, LLC. Director of Sanitized AG and Sanitized Marketing AG (specialty chemicals). | |
Michael E. Nugent (77)
522 Fifth Avenue
New York, NY 10036 | | Chairperson
of the
Board and Director | | Chairperson of the Boards since July 2006 and Director since July 1991 | | Chairperson of the Boards of various Morgan Stanley Funds (since July 2006); Chairperson of the Closed-End Fund Committee (since June 2012) and Director or Trustee of various Morgan Stanley Funds (since July 1991); formerly, Chairperson of the Insurance Committee (until July 2006); General Partner, Triumph Capital, L.P. (private investment partnership) (1988-2013). | | | 100 | | | None. | |
W. Allen Reed (66)
c/o Kramer Levin Naftalis & Frankel LLP
Counsel to the Independent Directors
1177 Avenue of the Americas New York, NY 10036 | | Director | | Since
August
2006 | | Chairperson of the Equity Sub-Committee of the Investment Committee (since October 2006) and Director or Trustee of various Morgan Stanley Funds (since August 2006); formerly, President and CEO of General Motors Asset Management; Chairman and Chief Executive Officer of the GM Trust Bank and Corporate Vice President of General Motors Corporation (August 1994-December 2005). | | | 98 | | | Director of Temple-Inland Industries (packaging and forest products); Director of Legg Mason, Inc. and Director of the Auburn University Foundation. | |
Fergus Reid (81)
c/o Joe Pietryka, Inc.
85 Charles Colman Blvd. Pawling, NY 12564 | | Director | | Since
June
1992 | | Chairman, Joe Pietryka, Inc.; Chairperson of the Governance Committee and Director or Trustee of various Morgan Stanley Funds (since June 1992). | | | 101 | | | Through December 31, 2012, Trustee and Director of certain Investment companies in the JPMorgan Fund Complex. | |
34
Morgan Stanley Institutional Fund, Inc.
Annual Report — December 31, 2013
Director and Officer Information (unaudited) (cont'd)
Interested Director:
Name, Age and Address of
Interested Director | | Position(s)
Held with
Registrant | | Length of
Time Served* | | Principal Occupation(s) During Past 5 Years | | Number of
Portfolios in
Fund Complex
Overseen by
Interested
Director** | | Other Directorships
Held by Interested
Director*** | |
James F. Higgins (66)
One New York Plaza
New York, NY 10004 | | Director | | Since
June
2000 | | Director or Trustee of various Morgan Stanley Funds (since June 2000); Senior Advisor of Morgan Stanley (since August 2000). | | | 99 | | | Formerly, Director of AXA Financial, Inc. and The Equitable Life Insurance Company (2002-2011) and Director of AXA MONY Life Insurance Company and AXA MONY Life Insurance Company of America (2004-2011). | |
* Each Director serves an indefinite term, until his or her successor is elected.
** The Fund Complex includes (as of December 31, 2013) all open-end and closed-end funds (including all of their portfolios) advised by Morgan Stanley Investment Management Inc. (the "Adviser") and any funds that have an adviser that is an affiliated person of the Adviser (including, but not limited to, Morgan Stanley AIP GP LP).
*** This includes any directorships at public companies and registered investment companies held by the Director at any time during the past five years.
35
Morgan Stanley Institutional Fund, Inc.
Annual Report — December 31, 2013
Director and Officer Information (unaudited) (cont'd)
Executive Officers:
Name, Age and Address of Executive Officer | | Position(s) Held
with
Registrant | | Length of
Time Served* | | Principal Occupation(s) During Past 5 Years | |
John H. Gernon (50)
522 Fifth Avenue
New York, NY 10036 | | President and Principal Executive Officer—Equity, Fixed Income and AIP Funds | | Since
September
2013 | | President and Principal Executive Officer of the Equity and Fixed Income Funds and the Morgan Stanley AIP Funds (since September 2013) in the Fund Complex. Managing Director of the Adviser. | |
Stefanie V. Chang Yu (47)
522 Fifth Avenue
New York, NY 10036 | | Chief Compliance Officer | | Since
January
2014 | | Managing Director of the Adviser and various entities affiliated with the Adviser; Chief Compliance Officer of various Morgan Stanley Funds and the Adviser (since January 2014); formerly, Vice President of various Morgan Stanley Funds (December 1997-January 2014). | |
Joseph C. Benedetti (48)
522 Fifth Avenue
New York, NY 10036 | | Vice President | | Since
January
2014 | | Managing Director of the Adviser and various entities affiliated with the Adviser; Vice President of various Morgan Stanley Funds (since January 2014); formerly, Assistant Secretary of various Morgan Stanley Funds (October 2004-January 2014). | |
Francis J. Smith (48)
522 Fifth Avenue
New York, NY 10036 | | Treasurer and Principal Financial Officer | | Treasurer since July 2003 and Principal Financial Officer since September 2002 | | Executive Director of the Adviser and various entities affiliated with the Adviser; Treasurer and Principal Financial Officer of various Morgan Stanley Funds (since July 2003). | |
Mary E. Mullin (46)
522 Fifth Avenue
New York, NY 10036 | | Secretary | | Since
June
1999 | | Executive Director of the Adviser and various entities affiliated with the Adviser; Secretary of various Morgan Stanley Funds (since June 1999). | |
* Each officer serves an indefinite term, until his or her successor is elected.
36
Morgan Stanley Institutional Fund, Inc.
Annual Report — December 31, 2013
Adviser and Administrator
Morgan Stanley Investment Management Inc.
522 Fifth Avenue
New York, New York 10036
Distributor
Morgan Stanley Distribution, Inc.
522 Fifth Avenue
New York, New York 10036
Dividend Disbursing and Transfer Agent
Boston Financial Data Services, Inc.
2000 Crown Colony Drive
Quincy, Massachusetts 02169
Custodian
State Street Bank and Trust Company
One Lincoln Street
Boston, Massachusetts 02111
Legal Counsel
Dechert LLP
1095 Avenue of the Americas
New York, New York 10036
Counsel to the Independent Directors
Kramer Levin Naftalis & Frankel LLP
1177 Avenue of the Americas
New York, New York 10036
Independent Registered Public Accounting Firm
Ernst & Young LLP
200 Clarendon Street
Boston, Massachusetts 02116
Reporting to Shareholders
Each Morgan Stanley fund provides a complete schedule of portfolio holdings in its semi-annual and annual reports within 60 days of the end of the fund's second and fourth fiscal quarters by filing the schedule electronically with the Securities and Exchange Commission (SEC). The semi-annual reports are filed on Form N-CSRS and the annual reports are filed on Form N-CSR. Morgan Stanley also delivers the semi-annual and annual reports to fund shareholders and makes these reports available on its public website, www.morganstanley.com/im. Each Morgan Stanley fund also files a complete schedule of portfolio holdings with the SEC for the fund's first and third fiscal quarters on Form N-Q. Morgan Stanley does not deliver the reports for the first and third fiscal quarters to shareholders, nor are the reports posted to the Morgan Stanley public website. You may, however, obtain the Form N-Q filings (as well as the Form N-CSR and N-CSRS filings) by accessing the SEC's website, www.sec.gov. You may also review and copy them at the SEC's Public Reference Room in Washington, DC. Information on the operation of the SEC's Public Reference Room may be obtained by calling the SEC toll free at 1 (800) SEC-0330. You can also request copies of these materials, upon payment of a duplicating fee, by electronic request at the SEC's email address (publicinfo@sec.gov) or by writing the Public Reference Room of the SEC, Washington, DC 20549-0102.
Proxy Voting Policies and Procedures and Proxy Voting Record
You may obtain a copy of the Fund's Proxy Voting Policy and Procedures and information regarding how the Fund voted proxies relating to portfolio securities during the most recent twelve-month period ended June 30, without charge, upon request, by calling toll free 1 (800) 548-7786 or by visiting our website at www.morganstanley.com/im. This information is also available on the SEC's website at www.sec.gov.
This report is authorized for distribution only when preceded or accompanied by a prospectus of the Morgan Stanley Institutional Fund, Inc. which describes in detail each Investment Portfolio's investment policies, risks, fees and expenses. Please read the prospectus carefully before you invest or send money. For additional information, including information regarding the investments comprising the Portfolio, please visit our website at www.morganstanley.com/im or call toll free 1 (800) 548-7786.
37
Printed in U.S.A.
This Report has been prepared for shareholders and may be distributed to others only if preceded or accompanied by a current prospectus.
Morgan Stanley Investment Management Inc.
522 Fifth Avenue
New York, New York 10036
© 2014 Morgan Stanley. Morgan Stanley Distribution, Inc.

IFISCGANN
810265 EXP 2.28.15

Morgan Stanley Institutional Fund, Inc.
Asian Equity Portfolio
Annual Report
December 31, 2013

Morgan Stanley Institutional Fund, Inc.
Annual Report — December 31, 2013
Shareholders' Letter | | | 2 | | |
Expense Example | | | 3 | | |
Investment Overview | | | 4 | | |
Portfolio of Investments | | | 7 | | |
Statement of Assets and Liabilities | | | 9 | | |
Statement of Operations | | | 10 | | |
Statements of Changes in Net Assets | | | 11 | | |
Financial Highlights | | | 12 | | |
Notes to Financial Statements | | | 15 | | |
Report of Independent Registered Public Accounting Firm | | | 23 | | |
Federal Tax Notice | | | 24 | | |
U.S. Privacy Policy | | | 25 | | |
Director and Officer Information | | | 28 | | |
This report is authorized for distribution only when preceded or accompanied by prospectuses of the Morgan Stanley Institutional Fund, Inc. To receive a prospectus and/or statement of additional information (SAI), which contains more complete information such as investment objectives, charges, expenses, policies for voting proxies, risk considerations, and describes in detail each of the Portfolio's investment policies to the prospective investor, please call toll free 1 (800) 548-7786. Please read the prospectuses carefully before you invest or send money.
Additionally, you can access portfolio information including performance, characteristics, and investment team commentary through Morgan Stanley Investment Management's website: www.morganstanley.com/im.
Market forecasts provided in this report may not necessarily come to pass. There is no guarantee that any sectors mentioned will continue to perform as discussed herein or that securities in such sectors will be held by the Portfolio in the future. There is no assurance that a Portfolio will achieve its investment objective. Portfolios are subject to market risk, which is the possibility that market values of securities owned by the Portfolio will decline and, therefore, the value of the Portfolio's shares may be less than what you paid for them. Accordingly, you can lose money investing in the Portfolio. Please see the prospectus for more complete information on investment risks.
1
Morgan Stanley Institutional Fund, Inc.
Annual Report — December 31, 2013
Shareholders' Letter (unaudited)
Dear Shareholders,
We are pleased to provide this Annual report, in which you will learn how your investment in Asian Equity Portfolio (the "Portfolio") performed during the latest twelve-month period.
Morgan Stanley Investment Management is a client-centric, investor-led organization. Our global presence, intellectual capital, and breadth of products and services enable us to partner with investors to meet the evolving challenges of today's financial markets. We aim to deliver superior investment service and to empower our clients to make the informed decisions that help them reach their investment goals.
As always, we thank you for selecting Morgan Stanley Investment Management, and look forward to working with you in the months and years ahead.
Sincerely,

John H. Gernon
President and Principal Executive Officer
January 2014
2
Morgan Stanley Institutional Fund, Inc.
Annual Report — December 31, 2013
Expense Example (unaudited)
Asian Equity Portfolio
As a shareholder of the Portfolio, you incur two types of costs: (1) transactional costs, including redemptions fees; and (2) ongoing costs, including advisory fees, administration fees, distribution and shareholder services fees and other Portfolio expenses. This example is intended to help you understand your ongoing costs (in dollars) of investing in the Portfolio and to compare these costs with the ongoing costs of investing in other mutual funds.
This example is based on an investment of $1,000 invested at the beginning of the six-month period ended December 31, 2013 and held for the entire six-month period.
Actual Expenses
The table below provides information about actual account values and actual expenses. You may use the information in this table, together with the amount you invested, to estimate the expenses that you paid over the period. Simply divide your account value by $1,000 (for example, an $8,600 account value divided by $1,000 = 8.6), then multiply the result by the number in the table under the heading entitled "Actual Expenses Paid During Period" to estimate the expenses you paid on your account during this period.
Hypothetical Example for Comparison Purposes
The table below provides information about hypothetical account values and hypothetical expenses based on the Portfolio's actual expense ratio and an assumed rate of return of 5% per year before expenses, which is not the Portfolio's actual return. The hypothetical account values and expenses may not be used to estimate the actual ending account balance or expenses you paid for the period. You may use this information to compare the ongoing costs of investing in the Portfolio and other funds. To do so, compare this 5% hypothetical example with the 5% hypothetical examples that appear in the shareholder reports of the other funds.
Please note that the expenses shown in the table are meant to highlight your ongoing costs only and do not reflect any transactional costs, such as sales charges (loads) and redemption fees. Therefore, the information for each class in the table is useful in comparing ongoing costs only, and will not help you determine the relative total costs of owning different funds. In addition, if these transactional costs were included, your costs would have been higher.
| | | Beginning
Account
Value
7/1/13 | | Actual Ending
Account
Value
12/31/13 | | Hypothetical
Ending Account
Value | | Actual
Expenses
Paid
During
Period* | | Hypothetical
Expenses Paid
During Period* | | Net
Expense
Ratio
During
Period** | |
Asian Equity Portfolio Class I | | $ | 1,000.00 | | | $ | 1,047.90 | | | $ | 1,017.90 | | | $ | 7.48 | | | $ | 7.38 | | | | 1.45 | % | |
Asian Equity Portfolio Class A@ | | | 1,000.00 | | | | 1,047.00 | | | | 1,016.33 | | | | 9.08 | | | | 8.94 | | | | 1.76 | | |
Asian Equity Portfolio Class L | | | 1,000.00 | | | | 1,045.10 | | | | 1,013.86 | | | | 11.60 | | | | 11.42 | | | | 2.25 | | |
* Expenses are calculated using each Portfolio Class' annualized net expense ratio (as disclosed), multiplied by the average account value over the period, and multiplied by 184/365 (to reflect the most recent one-half year period).
** Annualized.
@ Effective September 9, 2013, Class P and Class H shares were renamed Class A shares.
3
Morgan Stanley Institutional Fund, Inc.
Annual Report — December 31, 2013
Investment Overview (unaudited)
Asian Equity Portfolio
The Asian Equity Portfolio seeks long-term capital appreciation by investing primarily in equity securities of companies in the Asia-Pacific region, excluding Japan.
Performance
For the year ended December 31, 2013, the Portfolio had a total return based on net asset value and reinvestment of distributions per share of -0.05%, net of fees, for Class I shares. The Portfolio's Class I shares underperformed against its benchmark, the Morgan Stanley Capital International (MSCI) All Country Asia Ex-Japan Index (the "Index"), which returned 3.07%.
Factors Affecting Performance
• In 2013, the Index returned 3.07% to outperform the broad emerging markets, which returned -2.6%, but underperformed developed markets, which rose 22.8%, during this period (as represented by the MSCI Emerging Markets Index and MSCI EAFE Index, respectively). There was a wide divergence in performance as markets in North Asia outperformed their emerging market peers in Southeast Asia. Hong Kong's market led the region, rising 11.1%, followed by Taiwan, Korea and China. Malaysia's market also outperformed the overall Index as investors consider it a defensive market. Emerging Southeast Asia markets bore the brunt of the correction in the third quarter of 2013 — over the course of the year, Indonesia returned -23.5%, followed by Thailand and the Philippines, which posted -14.6% and -2.7% returns, respectively, as represented by their respective MSCI country indexes.
• 2013 began with rhetoric from the fourth quarter of 2012 coming to fruition with the launch of Bank of Japan Governor Haruhiko Kuroda's initiatives in the first quarter of 2013, which were intended to double the country's monetary base with large quantitative easing across the spectrum of Japanese government bonds and included yield curve and inflation targeting. These initiatives led to yen depreciation. This was not negative for all of Asia — for those economies that heavily consume Japanese products and run a trade deficit with Japan, this made Japanese goods cheaper and improved liquidity through a more favorable trade balance. Also, stronger growth in the second largest economy in the region was positive for the global
growth outlook. However, from a market perspective, Japan pulled fund flows out of Asia, especially North Asian markets such as Korea, Taiwan, China and Hong Kong. In the first half of the year, Korea's market was the most adversely affected by a weakening Japanese yen, as the competitiveness of Korea's export sector, which represents a significant portion of the economy as well as the stock market, suffered.
• The year marked a key turning point in the developed world economic cycle. As the year progressed, Japan, the U.K., core Europe and the European Union (EU) periphery joined the U.S. as countries with increasing evidence of some degree of economic recovery. Developed markets materially outperformed emerging markets during this period. Although economic fundamentals were relatively unchanged for most Asia Pacific ex-Japan economies, most markets across the region suffered a correction in the first quarter of 2013, largely due to external concerns regarding Fed tapering and currency weakness. As a result, the overall Index fell more than 5% in the first half of the year. The Asia ex-Japan region recovered in the second half of the year to rise more than 9%. However, as mentioned above, the recovery was not felt across all markets; in fact, the dispersion in returns was significant with the best-performing market, Hong Kong, rising 11.1% versus the weakest market, Indonesia, falling 23.5% for the year overall. As expectations of tightening liquidity and slowing growth tempered investors' risk tolerance, countries with twin deficits such as India and Indonesia experienced a sharp correction in the third quarter, while developed/quasi-developed markets experienced a boost from their perceived "safe haven" characteristics.
• For the Portfolio overall, stock selection was a positive contributor to relative performance. However, this was offset by negative country allocation.
• From a top-down perspective, our underweight exposures to Taiwan and Hong Kong, together with overweight positions in Thailand and Indonesia detracted from performance.
• From a bottom-up angle, stock selection in China (overweight health care and internet software and
4
Morgan Stanley Institutional Fund, Inc.
Annual Report — December 31, 2013
Investment Overview (unaudited) (cont'd)
Asian Equity Portfolio
services, underweight energy) and Thailand (overweight telecommunication services, underweight energy) were relative contributors, while stock selection in Indonesia (overweight energy, financials, and consumer discretionary), the Philippines (overweight financials) and India (overweight consumer staples and health care) were relative detractors.
Management Strategies
• The Portfolio seeks long-term capital appreciation and integrates top-down country allocation and bottom-up stock selection. The Portfolio will invest primarily in listed equity securities in markets within the Asia ex-Japan universe across the full market-cap range.
• As of the end of the period, on a relative basis, the Portfolio has overweight exposures to the information technology, health care and consumer staples sectors, while maintaining underweight exposures to the financials, materials and energy sectors. At the country level, the Portfolio had overweight exposures to Korea, Thailand and the Philippines and underweight exposures to Singapore, Taiwan and China/Hong Kong.
• Country allocation was relatively unchanged until we neutralized our overweight exposure to Indonesia in the fourth quarter following an investment research trip. We see some cyclical headwinds in the next 18 months coming from weakening political leadership and economic challenges such as the significant current account deficit, declining terms of trade (still a net oil-importing country) and slowing gross domestic product (GDP) growth. Indonesia has been seeing downgrades to GDP growth and the 5% rate is expected to be broken on the downside. This cyclical downside notwithstanding, we believe that Indonesia's economic fundamentals remain sound, with consumption and investment still at a very low base and therefore having the potential to be multi-year phenomena. For the structural story to restart, Indonesia needs to get through the next general election in 2014. Only after the new economic managers are in place could we see the next stage of reforms to push along this economy. The foundations for a strong economy are present but reforms of the last two terms of President Susilo
Bambang Yudhoyono have run their course. A new round of initiatives is needed. We are likely to maintain our toehold in the market due to a potential positive change in leadership in the second half of 2014. We see the frontrunner, Joko Widodo, as possibly bringing a renewed reform agenda which could help alleviate some of the country's economic woes and improve the prospects for the current account, terms of trade, credit growth and manufacturing and investments.
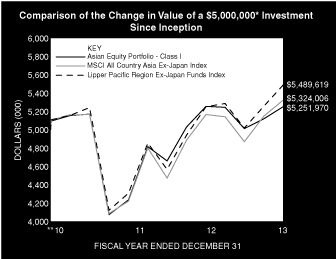
* Minimum Investment for Class I shares
** Commenced Operations on December 28, 2010.
In accordance with SEC regulations, Portfolio's performance shown assumes that all recurring fees (including management fees) were deducted and all dividends and distributions were reinvested. The performance of Class A+ and L shares will vary from Class I shares and will be negatively impacted by additional fees assessed to those classes.
5
Morgan Stanley Institutional Fund, Inc.
Annual Report — December 31, 2013
Investment Overview (unaudited) (cont'd)
Asian Equity Portfolio
Performance Compared to the Morgan Stanley Capital International (MSCI) All Country Asia Ex-Japan Index(1) and the Lipper Pacific Region Ex-Japan Funds Index(2)
| | | Period Ended December 31, 2013
Total Returns(3) | |
| | | | | Average Annual | |
| | | One
Year | | Five
Years | | Ten
Years | | Since
Inception(5) | |
Portfolio — Class I Shares
w/o sales charges(4) | | | -0.05 | % | | | — | | | | — | | | | 1.65 | % | |
MSCI All Country Asia Ex-Japan Index | | | 3.07 | | | | — | | | | — | | | | 2.11 | | |
Lipper Pacific Region Ex-Japan
Funds Index | | | 4.53 | | | | — | | | | — | | | | 3.15 | | |
Portfolio — Class A+ Shares
w/o sales charges(4) | | | -0.15 | | | | — | | | | — | | | | 1.45 | | |
Portfolio — Class A+ Shares with
maximum 5.25% sales charges(4) | | | -5.35 | | | | — | | | | — | | | | -0.34 | | |
MSCI All Country Asia Ex-Japan Index | | | 3.07 | | | | — | | | | — | | | | 2.11 | | |
Lipper Pacific Region Ex-Japan
Funds Index | | | 4.53 | | | | — | | | | — | | | | 3.15 | | |
Portfolio — Class L Shares
w/o sales charges(4) | | | -0.56 | | | | — | | | | — | | | | 0.95 | | |
MSCI All Country Asia Ex-Japan Index | | | 3.07 | | | | — | | | | — | | | | 2.11 | | |
Lipper Pacific Region Ex-Japan
Funds Index | | | 4.53 | | | | — | | | | — | | | | 3.15 | | |
Performance data quoted represents past performance, which is no guarantee of future results, and current performance may be lower or higher than the figures shown. Performance assumes that all dividends and distributions, if any, were reinvested. For the most recent month-end performance figures, please visit www.morganstanley.com/im. Investment return and principal value will fluctuate so that Portfolio shares, when redeemed, may be worth more or less than their original cost. Total returns do not reflect the deduction of taxes that a shareholder would pay on Portfolio distributions or the redemption of Portfolio shares. Performance of share classes will vary due to difference in expenses.
+ Effective September 9, 2013, Class P shares were renamed Class A shares.
(1) The Morgan Stanley Capital International (MSCI) All Country Asia Ex-Japan Index is a free float-adjusted market capitalization weighted index that is designed to measure the equity market performance of Asia, excluding Japan. The performance of the Index is listed in U.S. dollars and assumes reinvestment of net dividends. The Index is unmanaged and its returns do not include any sales charges or fees. Such costs would lower performance. It is not possible to invest directly in an index.
(2) The Lipper Pacific Region Ex-Japan Funds Index is an equally weighted performance index of the largest qualifying funds (based on net assets) in the Lipper Pacific Region Ex-Japan Funds classification. The Index, which is adjusted for capital gains distributions and income dividends, is unmanaged and should not be considered an investment. There are currently 10 funds represented in this Index. As of the date of this report, the Portfolio was in the Lipper Pacific Region Ex-Japan Funds classification.
(3) Total returns for the Portfolio reflect fees waived and expenses reimbursed, if applicable, by the Adviser. Without such waivers and reimbursements, total returns would have been lower. The fee waivers and/or expense reimbursements will continue for at least one year or until such time as the Fund's Board of Directors acts to discontinue all or a portion of such waivers and/or expense reimbursements when it deems that such action is appropriate.
(4) Commenced operations on December 28, 2010.
(5) For comparative purposes, average annual since inception returns listed for the Indexes refer to the inception date or initial offering of the respective share class of the Portfolio, not the inception of the Index.
Portfolio Composition
Classification | | Percentage of
Total Investments | |
Other* | | | 46.2 | % | |
Semiconductors & Semiconductor Equipment | | | 15.0 | | |
Commercial Banks | | | 14.5 | | |
Real Estate Management & Development | | | 6.8 | | |
Internet Software & Services | | | 6.6 | | |
Industrial Conglomerates | | | 5.8 | | |
Wireless Telecommunication Services | | | 5.1 | | |
Total Investments | | | 100.0 | % | |
* Industries and/or investment types representing less than 5% of total investments.
6
Morgan Stanley Institutional Fund, Inc.
Annual Report — December 31, 2013
Portfolio of Investments
Asian Equity Portfolio
| | | Shares | | Value
(000) | |
Common Stocks (93.1%) | |
China (23.2%) | |
Autohome, Inc. ADR (a) | | | 285 | | | $ | 10 | | |
Bank of China Ltd. H Shares (b) | | | 593,000 | | | | 273 | | |
Beijing Enterprises Holdings Ltd. (b) | | | 9,500 | | | | 94 | | |
China Construction Bank Corp. H Shares (b) | | | 74,000 | | | | 56 | | |
China Mengniu Dairy Co., Ltd. (b) | | | 17,000 | | | | 81 | | |
China Mobile Ltd. (b) | | | 12,500 | | | | 130 | | |
China Oilfield Services Ltd. H Shares (b) | | | 28,000 | | | | 87 | | |
China Overseas Grand Oceans Group Ltd. (b) | | | 44,000 | | | | 42 | | |
China Overseas Land & Investment Ltd. (b) | | | 16,000 | | | | 45 | | |
China Pacific Insurance Group Co., Ltd.
H Shares (b) | | | 24,000 | | | | 94 | | |
Chongqing Changan Automobile Co., Ltd.
B Shares | | | 37,600 | | | | 74 | | |
NetEase, Inc. ADR | | | 700 | | | | 55 | | |
Qihoo 360 Technology Co., Ltd. ADR (a) | | | 853 | | | | 70 | | |
Sihuan Pharmaceutical Holdings Group Ltd. (b) | | | 61,000 | | | | 56 | | |
Sino Biopharmaceutical Ltd. (b) | | | 66,800 | | | | 53 | | |
Tencent Holdings Ltd. (b) | | | 3,300 | | | | 210 | | |
| | | | 1,430 | | |
Hong Kong (10.4%) | |
BOC Hong Kong Holdings Ltd. | | | 40,000 | | | | 128 | | |
Cheung Kong Holdings Ltd. | | | 7,000 | | | | 111 | | |
HKT Trust/HKT Ltd. | | | 47,000 | | | | 46 | | |
Hutchison Whampoa Ltd. | | | 13,000 | | | | 177 | | |
Samsonite International SA | | | 27,900 | | | | 85 | | |
Wharf Holdings Ltd. | | | 12,400 | | | | 95 | | |
| | | | 642 | | |
India (2.5%) | |
HDFC Bank Ltd. ADR | | | 1,525 | | | | 52 | | |
Infosys Ltd. ADR | | | 701 | | | | 40 | | |
ITC Ltd. GDR | | | 11,949 | | | | 62 | | |
| | | | 154 | | |
Indonesia (3.3%) | |
Ace Hardware Indonesia Tbk PT | | | 581,000 | | | | 28 | | |
Bank Tabungan Negara Persero Tbk PT | | | 419,500 | | | | 30 | | |
Electronic City Indonesia Tbk PT (a) | | | 76,000 | | | | 18 | | |
Kalbe Farma Tbk PT | | | 711,000 | | | | 73 | | |
Matahari Department Store Tbk PT (a) | | | 29,000 | | | | 26 | | |
Nippon Indosari Corpindo Tbk PT | | | 357,500 | | | | 30 | | |
| | | | 205 | | |
Korea, Republic of (23.2%) | |
Cosmax, Inc. (a) | | | 2,020 | | | | 95 | | |
GS Retail Co., Ltd. (a) | | | 1,870 | | | | 50 | | |
Hyundai Engineering & Construction Co., Ltd. (a) | | | 1,590 | | | | 92 | | |
Hyundai Glovis Co., Ltd. (a) | | | 212 | | | | 46 | | |
Hyundai Motor Co. (a) | | | 599 | | | | 134 | | |
KEPCO Plant Service & Engineering Co., Ltd. (a) | | | 225 | | | | 12 | | |
KT Skylife Co., Ltd. (a) | | | 500 | | | | 14 | | |
LG Fashion Corp. (a) | | | 170 | | | | 5 | | |
LG Household & Health Care Ltd. (a) | | | 88 | | | | 46 | | |
| | | Shares | | Value
(000) | |
LG Uplus Corp. (a) | | | 5,950 | | | $ | 61 | | |
NAVER Corp. (a) | | | 86 | | | | 59 | | |
NCSoft Corp. (a) | | | 444 | | | | 105 | | |
Orion Corp. (a) | | | 3 | | | | 3 | | |
Paradise Co., Ltd. (a) | | | 2,530 | | | | 63 | | |
Samsung Electronics Co., Ltd. | | | 334 | | | | 434 | | |
Samsung Electronics Co., Ltd. (Preference) | | | 77 | | | | 74 | | |
SK Hynix, Inc. (a) | | | 1,520 | | | | 53 | | |
SK Telecom Co., Ltd. | | | 309 | | | | 67 | | |
SK Telecom Co., Ltd. ADR | | | 500 | | | | 12 | | |
| | | | 1,425 | | |
Laos (1.4%) | |
Kolao Holdings (a) | | | 3,325 | | | | 85 | | |
Macau (0.4%) | |
Melco Crown Entertainment Ltd. ADR (a) | | | 600 | | | | 23 | | |
Malaysia (4.7%) | |
Astro Malaysia Holdings Bhd | | | 35,800 | | | | 33 | | |
CIMB Group Holdings Bhd | | | 27,835 | | | | 65 | | |
IHH Healthcare Bhd (a) | | | 60,800 | | | | 71 | | |
IJM Corp., Bhd | | | 45,600 | | | | 82 | | |
UEM Sunrise Bhd | | | 55,300 | | | | 40 | | |
| | | | 291 | | |
Philippines (4.3%) | |
BDO Unibank, Inc. | | | 39,200 | | | | 61 | | |
DMCI Holdings, Inc. | | | 48,730 | | | | 61 | | |
International Container Terminal Services, Inc. | | | 18,200 | | | | 42 | | |
Rizal Commercial Banking Corp. | | | 49,970 | | | | 48 | | |
STI Education Systems Holdings | | | 3,691,000 | | | | 53 | | |
| | | | 265 | | |
Singapore (2.6%) | |
DBS Group Holdings Ltd. | | | 7,000 | | | | 95 | | |
Keppel Corp., Ltd. | | | 3,000 | | | | 26 | | |
Singapore Telecommunications Ltd. | | | 14,000 | | | | 41 | | |
| | | | 162 | | |
Taiwan (11.7%) | |
Chailease Holding Co., Ltd. | | | 28,800 | | | | 76 | | |
Cleanaway Co., Ltd. | | | 7,000 | | | | 46 | | |
Delta Electronics, Inc. | | | 9,000 | | | | 51 | | |
Fubon Financial Holding Co., Ltd. | | | 28,000 | | | | 41 | | |
Ginko International Co., Ltd. | | | 5,000 | | | | 94 | | |
Hermes Microvision, Inc. GDR (a) | | | 974 | | | | 32 | | |
MediaTek, Inc. | | | 9,000 | | | | 134 | | |
Taiwan Semiconductor Manufacturing Co., Ltd. | | | 55,000 | | | | 195 | | |
Uni-President Enterprises Corp. | | | 27,451 | | | | 49 | | |
| | | | 718 | | |
Thailand (5.4%) | |
Advanced Info Service PCL (Foreign) | | | 4,600 | | | | 28 | | |
Bangkok Bank PCL NVDR | | | 8,700 | | | | 47 | | |
Land and Houses PCL NVDR | | | 192,900 | | | | 52 | | |
Minor International PCL (Foreign) | | | 49,400 | | | | 31 | | |
Supalai PCL (Foreign) | | | 67,600 | | | | 30 | | |
The accompanying notes are an integral part of the financial statements.
7
Morgan Stanley Institutional Fund, Inc.
Annual Report — December 31, 2013
Portfolio of Investments (cont'd)
Asian Equity Portfolio
| | | Shares | | Value
(000) | |
Thailand (cont'd) | |
Thai Union Frozen Products PCL (Foreign) | | | 40,600 | | | $ | 89 | | |
Total Access Communication PCL (Foreign) | | | 13,200 | | | | 39 | | |
VGI Global Media PCL (Foreign) | | | 42,744 | | | | 13 | | |
| | | | 329 | | |
Total Common Stocks (Cost $5,394) | | | 5,729 | | |
Investment Company (0.7%) | |
Thailand (0.7%) | |
BTS Rail Mass Transit Growth Infrastructure Fund
(Foreign) (Units) (c) (Cost $64) | | | 172,057 | | | | 45 | | |
Participation Notes (4.5%) | |
India (4.5%) | |
Asian Paints Ltd., Equity Linked Notes,
expires 5/31/18 | | | 4,293 | | | | 34 | | |
Glenmark Pharmaceuticals Ltd., Equity Linked
Notes, expires 5/10/17 | | | 6,300 | | | | 54 | | |
Idea Cellular Ltd., Equity Linked Notes,
expires 6/7/18 | | | 13,542 | | | | 37 | | |
IndusInd Bank Ltd., Equity Linked Notes,
expires 12/14/15 | | | 3,434 | | | | 23 | | |
ING Vysya Bank Ltd., Equity Linked Notes,
expires 4/11/18 | | | 950 | | | | 10 | | |
Sun Pharmaceutical Industries Ltd., Equity
Linked Notes, expires 7/27/18 (a) | | | 1,846 | | | | 17 | | |
Tata Consultancy Services Ltd., Equity Linked
Notes, expires 12/14/15 | | | 1,623 | | | | 57 | | |
Zee Entertainment Enterprises Ltd., Equity
Linked Notes, expires 12/9/15 | | | 10,800 | | | | 48 | | |
Total Participation Notes (Cost $286) | | | 280 | | |
Short-Term Investment (1.4%) | |
Investment Company (1.4%) | |
Morgan Stanley Institutional Liquidity
Funds — Money Market Portfolio —
Institutional Class (See Note G)
(Cost $85) | | | 84,731 | | | | 85 | | |
Total Investments (99.7%) (Cost $5,829) | | | 6,139 | | |
Other Assets in Excess of Liabilities (0.3%) | | | 18 | | |
Net Assets (100.0%) | | $ | 6,157 | | |
(a) Non-income producing security.
(b) Security trades on the Hong Kong exchange.
(c) Consists of one or more classes of securities traded together as a unit; stocks with attached warrants.
ADR American Depositary Receipt.
GDR Global Depositary Receipt.
NVDR Non-Voting Depositary Receipt.
The accompanying notes are an integral part of the financial statements.
8
Morgan Stanley Institutional Fund, Inc.
Annual Report — December 31, 2013
Statement of Assets and Liabilities | | December 31, 2013
(000) | |
Assets: | |
Investments in Securities of Unaffiliated Issuers, at Value (Cost $5,744) | | $ | 6,054 | | |
Investment in Security of Affiliated Issuer, at Value (Cost $85) | | | 85 | | |
Total Investments in Securities, at Value (Cost $5,829) | | | 6,139 | | |
Foreign Currency, at Value (Cost $—@) | | | — | @ | |
Due from Adviser | | | 33 | | |
Receivable for Investments Sold | | | 15 | | |
Dividends Receivable | | | 1 | | |
Receivable from Affiliate | | | — | @ | |
Other Assets | | | 13 | | |
Total Assets | | | 6,201 | | |
Liabilities: | |
Payable for Custodian Fees | | | 18 | | |
Payable for Investments Purchased | | | 13 | | |
Payable for Transfer Agent Fees | | | 1 | | |
Payable for Transfer Agent Fees — Class I | | | — | @ | |
Payable for Transfer Agent Fees — Class A* | | | — | @ | |
Payable for Transfer Agent Fees — Class L | | | — | @ | |
Deferred Capital Gain Country Tax | | | 2 | | |
Payable for Professional Fees | | | 1 | | |
Payable for Administration Fees | | | — | @ | |
Payable for Shareholder Services Fees — Class A* | | | — | @ | |
Payable for Distribution and Shareholder Services Fees — Class L | | | — | @ | |
Other Liabilities | | | 9 | | |
Total Liabilities | | | 44 | | |
Net Assets | | $ | 6,157 | | |
Net Assets Consist Of: | |
Paid-in-Capital | | $ | 5,677 | | |
Distributions in Excess of Net Investment Income | | | (18 | ) | |
Accumulated Net Realized Gain | | | 190 | | |
Unrealized Appreciation (Depreciation) on: | |
Investments (Net of approximately $2 Deferred Capital Gain Country Tax) | | | 308 | | |
Foreign Currency Translations | | | (— | @) | |
Net Assets | | $ | 6,157 | | |
CLASS I: | |
Net Assets | | $ | 4,753 | | |
| Shares Outstanding $0.001 par value shares of beneficial interest (500,000,000 shares authorized) (not in 000's) | | | 460,269 | | |
Net Asset Value, Offering and Redemption Price Per Share | | $ | 10.33 | | |
CLASS A*: | |
Net Assets | | $ | 1,302 | | |
| Shares Outstanding $0.001 par value shares of beneficial interest (500,000,000 shares authorized) (not in 000's) | | | 126,270 | | |
Net Asset Value, Redemption Price Per Share | | $ | 10.31 | | |
Maximum Sales Load§§ | | | 5.25 | % | |
Maximum Sales Charge | | $ | 0.57 | | |
Maximum Offering Price Per Share | | $ | 10.88 | | |
CLASS L: | |
Net Assets | | $ | 102 | | |
| Shares Outstanding $0.001 par value shares of beneficial interest (500,000,000 shares authorized) (not in 000's) | | | 10,000 | | |
Net Asset Value, Offering and Redemption Price Per Share | | $ | 10.23 | | |
@ Amount is less than $500.
* Effective September 9, 2013, Class P and Class H shares were renamed Class A shares.
§§ Effective February 25, 2013, the Directors approved the imposition of a maximum initial sales charge of 5.25% on purchases of Class A shares of the Portfolio.
The accompanying notes are an integral part of the financial statements.
9
Morgan Stanley Institutional Fund, Inc.
Annual Report — December 31, 2013
Statement of Operations | | Year Ended
December 31, 2013
(000) | |
Investment Income: | |
Dividends from Securities of Unaffiliated Issuers (Net of $18 of Foreign Taxes Withheld) | | $ | 151 | | |
Dividends from Security of Affiliated Issuer (Note G) | | | — | @ | |
Interest from Securities of Unaffiliated Issuers | | | — | @ | |
Total Investment Income | | | 151 | | |
Expenses: | |
Professional Fees | | | 86 | | |
Custodian Fees (Note F) | | | 80 | | |
Advisory Fees (Note B) | | | 74 | | |
Registration Fees | | | 39 | | |
Shareholder Reporting Fees | | | 17 | | |
Transfer Agency Fees (Note E) | | | 9 | | |
Transfer Agency Fees — Class I (Note E) | | | — | @ | |
Transfer Agency Fees — Class A* (Note E) | | | — | @ | |
Transfer Agency Fees — Class L (Note E) | | | — | @ | |
Pricing Fees | | | 9 | | |
Administration Fees (Note C) | | | 6 | | |
Shareholder Services Fees — Class A* (Note D) | | | 3 | | |
Distribution and Shareholder Services Fees — Class L (Note D) | | | 1 | | |
Directors' Fees and Expenses | | | 1 | | |
Other Expenses | | | 15 | | |
Total Expenses | | | 340 | | |
Expenses Reimbursed by Adviser (Note B) | | | (148 | ) | |
Waiver of Advisory Fees (Note B) | | | (74 | ) | |
Reimbursement of Class Specific Expenses — Class I (Note B) | | | (— | @) | |
Reimbursement of Class Specific Expenses — Class A* (Note B) | | | (— | @) | |
Reimbursement of Class Specific Expenses — Class L (Note B) | | | (— | @) | |
Rebate from Morgan Stanley Affiliate (Note G) | | | (— | @) | |
Net Expenses | | | 118 | | |
Net Investment Income | | | 33 | | |
Realized Gain (Loss): | |
Investments Sold (Net of approximately $12 Capital Gain Country Tax) | | | 307 | | |
Foreign Currency Forward Exchange Contracts | | | 7 | | |
Foreign Currency Transactions | | | (17 | ) | |
Net Realized Gain | | | 297 | | |
Change in Unrealized Appreciation (Depreciation): | |
Investments (Net of Decrease in Deferred Capital Country Tax Accrual of approximately $2) | | | (214 | ) | |
Foreign Currency Forward Exchange Contracts | | | (1 | ) | |
Foreign Currency Translations | | | — | @ | |
Net Change in Unrealized Appreciation (Depreciation) | | | (215 | ) | |
Net Realized Gain and Change in Unrealized Appreciation (Depreciation) | | | 82 | | |
Net Increase in Net Assets Resulting from Operations | | $ | 115 | | |
@ Amount is less than $500.
* Effective September 9, 2013, Class P and Class H shares were renamed Class A shares.
The accompanying notes are an integral part of the financial statements.
10
Morgan Stanley Institutional Fund, Inc.
Annual Report — December 31, 2013
Statements of Changes in Net Assets | | Year Ended
December 31, 2013
(000) | | Year Ended
December 31, 2012
(000) | |
Increase (Decrease) in Net Assets: | |
Operations: | |
Net Investment Income | | $ | 33 | | | $ | 17 | | |
Net Realized Gain (Loss) | | | 297 | | | | (13 | ) | |
Net Change in Unrealized Appreciation (Depreciation) | | | (215 | ) | | | 682 | | |
Net Increase in Net Assets Resulting from Operations | | | 115 | | | | 686 | | |
Distributions from and/or in Excess of: | |
Class I: | |
Net Investment Income | | | (36 | ) | | | (41 | ) | |
Class A*: | |
Net Investment Income | | | (5 | ) | | | (10 | ) | |
Class H**: | |
Net Investment Income | | | (— | @)*** | | | (1 | ) | |
Class L: | |
Net Investment Income | | | (— | @) | | | (— | @) | |
Total Distributions | | | (41 | ) | | | (52 | ) | |
Capital Share Transactions:(1) | |
Class I: | |
Subscribed | | | 4,125 | | | | 3,216 | | |
Distributions Reinvested | | | 28 | | | | 28 | | |
Redeemed | | | (3,473 | ) | | | (936 | ) | |
Class A*: | |
Subscribed | | | 165 | | | | 1,000 | | |
Distributions Reinvested | | | 5 | | | | 9 | | |
Conversion from Class H | | | 98 | | | | — | | |
Redeemed | | | (171 | ) | | | — | | |
Class H**: | |
Conversion to Class A | | | (98 | )*** | | | — | | |
Net Increase in Net Assets Resulting from Capital Share Transactions | | | 679 | | | | 3,317 | | |
Total Increase in Net Assets | | | 753 | | | | 3,951 | | |
Net Assets: | |
Beginning of Period | | | 5,404 | | | | 1,453 | | |
End of Period (Including Distributions in Excess of Net Investment Income of $(18) and $(26)) | | $ | 6,157 | | | $ | 5,404 | | |
(1) Capital Share Transactions: | |
Class I: | |
Shares Subscribed | | | 399 | | | | 334 | | |
Shares Issued on Distributions Reinvested | | | 3 | | | | 3 | | |
Shares Redeemed | | | (326 | ) | | | (95 | ) | |
Net Increase in Class I Shares Outstanding | | | 76 | | | | 242 | | |
Class A*: | |
Shares Subscribed | | | 17 | | | | 105 | | |
Shares Issued on Distributions Reinvested | | | — | @@ | | | 1 | | |
Conversion from Class H | | | 10 | | | | — | | |
Shares Redeemed | | | (17 | ) | | | — | | |
Net Increase in Class A Shares Outstanding | | | 10 | | | | 106 | | |
Class H**: | |
Conversion to Class A | | | (10 | )*** | | | — | | |
@ Amount is less than $500.
@@ Amount is less than 500 shares.
* Effective September 9, 2013, Class P shares were renamed Class A shares.
** Effective September 9, 2013, Class H shares converted into Class A shares.
*** For the period January 1, 2013 through September 6, 2013.
The accompanying notes are an integral part of the financial statements.
11
Morgan Stanley Institutional Fund, Inc.
Annual Report — December 31, 2013
Financial Highlights
Asian Equity Portfolio
| | | Class I | |
| | | Year Ended December 31, | | Period from
December 28, 2010^ to | |
Selected Per Share Data and Ratios | | 2013 | | 2012 | | 2011 | | December 31, 2010 | |
Net Asset Value, Beginning of Period | | $ | 10.40 | | | $ | 8.47 | | | $ | 10.19 | | | $ | 10.00 | | |
Income (Loss) from Investment Operations: | |
Net Investment Income (Loss)† | | | 0.05 | | | | 0.04 | | | | 0.00 | ‡ | | | (0.00 | )‡ | |
Net Realized and Unrealized Gain (Loss) | | | (0.05 | ) | | | 2.00 | | | | (1.72 | ) | | | 0.19 | | |
Total from Investment Operations | | | — | | | | 2.04 | | | | (1.72 | ) | | | 0.19 | | |
Distributions from and/or in Excess of: | |
Net Investment Income | | | (0.07 | ) | | | (0.11 | ) | | | — | | | | — | | |
Net Asset Value, End of Period | | $ | 10.33 | | | $ | 10.40 | | | $ | 8.47 | | | $ | 10.19 | | |
Total Return++ | | | (0.05 | )% | | | 24.08 | % | | | (16.88 | )% | | | 1.90 | %# | |
Ratios and Supplemental Data: | |
Net Assets, End of Period (Thousands) | | $ | 4,753 | | | $ | 3,996 | | | $ | 1,201 | | | $ | 1,223 | | |
Ratio of Expenses to Average Net Assets (1) | | | 1.45 | %+ | | | 1.45 | %+†† | | | 1.45 | %+†† | | | 1.45 | %††* | |
Ratio of Net Investment Income (Loss) to Average Net Assets (1) | | | 0.52 | %+ | | | 0.39 | %+†† | | | 0.01 | %+†† | | | (1.34 | )%††* | |
Ratio of Rebate from Morgan Stanley Affiliates to Average Net Assets | | | 0.00 | %§ | | | 0.00 | %††§ | | | 0.00 | %††§ | | | N/A | | |
Portfolio Turnover Rate | | | 114 | % | | | 80 | % | | | 38 | % | | | 0.00 | %††# | |
(1) Supplemental Information on the Ratios to Average Net Assets: | |
Ratios Before Expense Limitation: | |
Expenses to Average Net Assets | | | 4.28 | % | | | 5.79 | %†† | | | 11.86 | %†† | | | 176.73 | %††* | |
Net Investment Loss to Average Net Assets | | | (2.31 | )% | | | (3.95 | )%†† | | | (10.40 | )%†† | | | (176.62 | )%††* | |
^ Commencement of Operations.
† Per share amount is based on average shares outstanding.
‡ Amount is less than $0.005 per share.
++ Calculated based on the net asset value as of the last business day of the period.
+ The Ratios of Expenses and Net Investment Income (Loss) reflect the rebate of certain Portfolio expenses in connection with the investments in Morgan Stanley affiliates during the period. The effect of the rebate on the ratios is disclosed in the above table as "Ratio of Rebate from Morgan Stanley Affiliates to Average Net Assets."
†† Reflects overall Portfolio ratios for investment income and non-class specific expenses.
§ Amount is less than 0.005%.
# Not Annualized.
* Annualized.
The accompanying notes are an integral part of the financial statements.
12
Morgan Stanley Institutional Fund, Inc.
Annual Report — December 31, 2013
Financial Highlights
Asian Equity Portfolio
| | | Class A@ | |
| | | Year Ended December 31, | | Period from
December 28, 2010^ to | |
Selected Per Share Data and Ratios | | 2013 | | 2012 | | 2011 | | December 31, 2010 | |
Net Asset Value, Beginning of Period | | $ | 10.37 | | | $ | 8.45 | | | $ | 10.19 | | | $ | 10.00 | | |
Income (Loss) from Investment Operations: | |
Net Investment Income (Loss)† | | | 0.01 | | | | 0.01 | | | | (0.02 | ) | | | (0.00 | )‡ | |
Net Realized and Unrealized Gain (Loss) | | | (0.03 | ) | | | 2.00 | | | | (1.72 | ) | | | 0.19 | | |
Total from Investment Operations | | | (0.02 | ) | | | 2.01 | | | | (1.74 | ) | | | 0.19 | | |
Distributions from and/or in Excess of: | |
Net Investment Income | | | (0.04 | ) | | | (0.09 | ) | | | — | | | | — | | |
Net Asset Value, End of Period | | $ | 10.31 | | | $ | 10.37 | | | $ | 8.45 | | | $ | 10.19 | | |
Total Return++ | | | (0.15 | )% | | | 23.76 | % | | | (17.08 | )% | | | 1.90 | %# | |
Ratios and Supplemental Data: | |
Net Assets, End of Period (Thousands) | | $ | 1,302 | | | $ | 1,201 | †† | | $ | 84 | | | $ | 102 | | |
Ratio of Expenses to Average Net Assets (1) | | | 1.73 | %+^^ | | | 1.70 | %+†† | | | 1.70 | %+†† | | | 1.70 | %††* | |
Ratio of Net Investment Income (Loss) to Average Net Assets (1) | | | 0.09 | %+ | | | 0.14 | %+†† | | | (0.24 | )%+†† | | | (1.59 | )%††* | |
Ratio of Rebate from Morgan Stanley Affiliates to Average Net Assets | | | 0.00 | %§ | | | 0.00 | %††§ | | | 0.00 | %††§ | | | N/A | | |
Portfolio Turnover Rate | | | 114 | % | | | 80 | % | | | 38 | % | | | 0.00 | %††# | |
(1) Supplemental Information on the Ratios to Average Net Assets: | |
Ratios Before Expense Limitation: | |
Expenses to Average Net Assets | | | 4.68 | % | | | 6.04 | %†† | | | 12.11 | %†† | | | 176.98 | %††* | |
Net Investment Loss to Average Net Assets | | | (2.86 | )% | | | (4.20 | )%†† | | | (10.65 | )%†† | | | (176.87 | )%††* | |
@ Effective September 9, 2013, Class P and Class H shares were renamed Class A shares.
^ Commencement of Operations.
† Per share amount is based on average shares outstanding.
‡ Amount is less than $0.005 per share.
++ Calculated based on the net asset value which does not reflect sales charges, if applicable, as of the last business day of the period.
+ The Ratios of Expenses and Net Investment Income (Loss) reflect the rebate of certain Portfolio expenses in connection with the investments in Morgan Stanley affiliates during the period. The effect of the rebate on the ratios is disclosed in the above table as "Ratio of Rebate from Morgan Stanley Affiliates to Average Net Assets."
^^ Effective September 16, 2013, the Adviser has agreed to limit the ratio of expenses to average net assets to the maximum ratio of 1.80% for Class A Shares. Prior to September 16, 2013, the maximum ratio was 1.70% for Class A Shares.
†† Reflects overall Portfolio ratios for investment income and non-class specific expenses.
§ Amount is less than 0.005%.
# Not Annualized.
* Annualized.
The accompanying notes are an integral part of the financial statements.
13
Morgan Stanley Institutional Fund, Inc.
Annual Report — December 31, 2013
Financial Highlights
Asian Equity Portfolio
| | | Class L | |
| | | Year Ended December 31, | | Period from
December 28, 2010^ to | |
Selected Per Share Data and Ratios | | 2013 | | 2012 | | 2011 | | December 31, 2010 | |
Net Asset Value, Beginning of Period | | $ | 10.31 | | | $ | 8.40 | | | $ | 10.19 | | | $ | 10.00 | | |
Income (Loss) from Investment Operations: | |
Net Investment Loss† | | | (0.04 | ) | | | (0.03 | ) | | | (0.07 | ) | | | (0.00 | )‡ | |
Net Realized and Unrealized Gain (Loss) | | | (0.03 | ) | | | 1.98 | | | | (1.72 | ) | | | 0.19 | | |
Total from Investment Operations | | | (0.07 | ) | | | 1.95 | | | | (1.79 | ) | | | 0.19 | | |
Distributions from and/or in Excess of: | |
Net Investment Income | | | (0.01 | ) | | | (0.04 | ) | | | — | | | | — | | |
Net Asset Value, End of Period | | $ | 10.23 | | | $ | 10.31 | | | $ | 8.40 | | | $ | 10.19 | | |
Total Return++ | | | (0.56 | )% | | | 23.18 | % | | | (17.57 | )% | | | 1.90 | %# | |
Ratios and Supplemental Data: | |
Net Assets, End of Period (Thousands) | | $ | 102 | | | $ | 103 | | | $ | 84 | | | $ | 102 | | |
Ratio of Expenses to Average Net Assets (1) | | | 2.22 | %+^^ | | | 2.20 | %+†† | | | 2.20 | %+†† | | | 2.20 | %††* | |
Ratio of Net Investment Loss to Average Net Assets (1) | | | (0.35 | )%+ | | | (0.36 | )%+†† | | | (0.74 | )%+†† | | | (2.09 | )%††* | |
Ratio of Rebate from Morgan Stanley Affiliates to Average Net Assets | | | 0.00 | %§ | | | 0.00 | %††§ | | | 0.00 | %††§ | | | N/A | | |
Portfolio Turnover Rate | | | 114 | % | | | 80 | % | | | 38 | % | | | 0.00 | %# | |
(1) Supplemental Information on the Ratios to Average Net Assets: | |
Ratios Before Expense Limitation: | |
Expenses to Average Net Assets | | | 5.59 | % | | | 6.54 | %†† | | | 12.61 | %†† | | | 177.48 | %††* | |
Net Investment Loss to Average Net Assets | | | (3.72 | )% | | | (4.70 | )%†† | | | (11.15 | )%†† | | | (177.37 | )%††* | |
^ Commencement of Operations.
† Per share amount is based on average shares outstanding.
‡ Amount is less than $0.005 per share.
++ Calculated based on the net asset value as of the last business day of the period.
+ The Ratios of Expenses and Net Investment Loss reflect the rebate of certain Portfolio expenses in connection with the investments in Morgan Stanley affiliates during the period. The effect of the rebate on the ratios is disclosed in the above table as "Ratio of Rebate from Morgan Stanley Affiliates to Average Net Assets."
^^ Effective September 16, 2013, the Adviser has agreed to limit the ratio of expenses to average net assets to the maximum ratio of 2.30% for Class L Shares. Prior to September 16, 2013, the maximum ratio was 2.20% for Class L Shares.
†† Reflects overall Portfolio ratios for investment income and non-class specific expenses.
§ Amount is less than 0.005%.
# Not Annualized.
* Annualized.
The accompanying notes are an integral part of the financial statements.
14
Morgan Stanley Institutional Fund, Inc.
Annual Report — December 31, 2013
Notes to Financial Statements
Morgan Stanley Institutional Fund, Inc. (the "Fund") is registered under the Investment Company Act of 1940, as amended (the "Act"), as an open-end management investment company. The Fund is comprised of twenty-seven separate, active, diversified and non-diversified portfolios (individually referred to as a "Portfolio", collectively as the "Portfolios").
The accompanying financial statements relate to the Asian Equity Portfolio. The Portfolio's adviser, Morgan Stanley Investment Management Inc. (the "Adviser") and sub-adviser, Morgan Stanley Investment Management Company ("MSIM Company") (the "Sub-Adviser"), seek long-term capital appreciation by investing primarily in equity securities of companies in the Asia-Pacific region, excluding Japan. The Portfolio offers three classes of shares — Class I, Class A and Class L.
Effective September 9, 2013, Class P and Class H shares were renamed Class A shares.
A. Significant Accounting Policies: The following significant accounting policies are in conformity with U.S. generally accepted accounting principles ("GAAP"). Such policies are consistently followed by the Fund in the preparation of its financial statements. GAAP may require management to make estimates and assumptions that affect the reported amounts and disclosures in the financial statements. Actual results may differ from those estimates.
1. Security Valuation: (1) An equity portfolio security listed or traded on an exchange is valued at its latest reported sales price (or at the exchange official closing price if such exchange reports an official closing price), if there were no sales on a given day, the security is valued at the mean between the last reported bid and asked prices; (2) all other equity portfolio securities for which over-the-counter market quotations are readily available are valued at its latest reported sales price. In cases where a security is traded on more than one exchange, the security is valued on the exchange designated as the primary market; (3) when market quotations are not readily available, including circumstances under which the Adviser determines that the closing price, last sale price or the mean between the last reported bid and asked prices are not reflective of a security's market value, portfolio securities are valued at their fair value as determined in good faith under procedures established by and under the general supervision of the Fund's Board of Directors (the "Directors"). Occasionally, developments affecting the closing prices of securities and
other assets may occur between the times at which valuations of such securities are determined (that is, close of the foreign market on which the securities trade) and the close of business of the New York Stock Exchange ("NYSE"). If developments occur during such periods that are expected to materially affect the value of such securities, such valuations may be adjusted to reflect the estimated fair value of such securities as of the close of the NYSE, as determined in good faith by the Directors or by the Adviser using a pricing service and/or procedures approved by the Directors; (4) quotations of foreign portfolio securities, other assets and liabilities and forward contracts stated in foreign currency are translated into U.S. dollar equivalents at the prevailing market rates prior to the close of the NYSE; (5) investments in mutual funds, including the Morgan Stanley Institutional Liquidity Funds, are valued at the net asset value as of the close of each business day; and (6) short-term debt securities with remaining maturities of 60 days or less at the time of purchase may be valued at amortized cost, unless the Adviser determines such valuation does not reflect the securities' market value, in which case these securities will be valued at their fair market value determined by the Adviser.
Under procedures approved by the Directors, the Fund's Adviser has formed a Valuation Committee. The Valuation Committee provides administration and oversight of the Fund's valuation policies and procedures, which are reviewed at least annually by the Directors. These procedures allow the Fund to utilize independent pricing services, quotations from securities and financial instrument dealers, and other market sources to determine fair value.
The Fund has procedures to determine the fair value of securities and other financial instruments for which market prices are not readily available. Under these procedures, the Valuation Committee convenes on a regular and ad hoc basis to review such securities and considers a number of factors, including valuation methodologies and significant unobservable valuation inputs, when arriving at fair value. The Valuation Committee may employ a market-based approach which may use related or comparable assets or liabilities, recent transactions, market multiples, book values, and other relevant information for the investment to determine the fair value of the investment. An income-based valuation approach may also be used in which the anticipated future cash flows of the investment are discounted to calculate fair value. Discounts may also
15
Morgan Stanley Institutional Fund, Inc.
Annual Report — December 31, 2013
Notes to Financial Statements (cont'd)
be applied due to the nature or duration of any restrictions on the disposition of the investments. Due to the inherent uncertainty of valuations of such investments, the fair values may differ significantly from the values that would have been used had an active market existed. The Valuation Committee employs various methods for calibrating these valuation approaches including a regular review of valuation methodologies, key inputs and assumptions, transactional back-testing or disposition analysis, and reviews of any related market activity.
2. Fair Value Measurement: Financial Accounting Standards Board ("FASB") Accounting Standards CodificationTM ("ASC") 820, "Fair Value Measurements and Disclosures" ("ASC 820"), defines fair value as the value that the Fund would receive to sell an investment or pay to transfer a liability in a timely transaction with an independent buyer in the principal market, or in the absence of a principal market the most advantageous market for the investment or liability. ASC 820 establishes a three-tier hierarchy to distinguish between (1) inputs that reflect the assumptions market participants would use in valuing an asset or liability developed based on market data obtained from sources independent of the reporting entity (observable inputs) and (2) inputs that reflect the reporting entity's own assumptions about the assumptions market participants would use in valuing an asset or liability developed based on the best information available in the circumstances (unobservable inputs) and to establish classification of fair value measurements for disclosure purposes. Various inputs are used in determining the value of the Fund's investments. The inputs are summarized in the three broad levels listed below.
• Level 1 – unadjusted quoted prices in active markets for identical investments
• Level 2 – other significant observable inputs (including quoted prices for similar investments, interest rates, prepayment speeds, credit risk, etc.)
• Level 3 – significant unobservable inputs including the Fund's own assumptions in determining the fair value of investments. Factors considered in making this determination may include, but are not limited to, information obtained by contacting the issuer, analysts, or the appropriate stock exchange (for exchange-traded securities), analysis of the issuer's financial
statements or other available documents and, if necessary, available information concerning other securities in similar circumstances
The inputs or methodology used for valuing securities are not necessarily an indication of the risk associated with investing in those securities and the determination of the significance of a particular input to the fair value measurement in its entirety requires judgment and considers factors specific to each security.
The following is a summary of the inputs used to value the Portfolio's investments as of December 31, 2013.
Investment Type | | Level 1
Unadjusted
quoted
prices
(000) | | Level 2
Other
significant
observable
inputs
(000) | | Level 3
Significant
unobservable
inputs
(000) | | Total
(000) | |
Assets: | |
Common Stocks | |
Air Freight & Logistics | | $ | 46 | | | $ | — | | | $ | — | | | $ | 46 | | |
Automobiles | | | 208 | | | | — | | | | — | | | | 208 | | |
Commercial Banks | | | 855 | | | | — | | | | — | | | | 855 | | |
Commercial
Services & Supplies | | | 58 | | | | — | | | | — | | | | 58 | | |
Construction &
Engineering | | | 174 | | | | — | | | | — | | | | 174 | | |
Diversified Financial
Services | | | 170 | | | | — | | | | — | | | | 170 | | |
Diversified
Telecommunication
Services | | | 148 | | | | — | | | | — | | | | 148 | | |
Electronic Equipment,
Instruments &
Components | | | 51 | | | | — | | | | — | | | | 51 | | |
Energy
Equipment & Services | | | 87 | | | | — | | | | — | | | | 87 | | |
Food & Staples Retailing | | | 50 | | | | — | | | | — | | | | 50 | | |
Food Products | | | 163 | | | | 89 | | | | — | | | | 252 | | |
Health Care
Equipment & Supplies | | | 94 | | | | — | | | | — | | | | 94 | | |
Health Care
Providers & Services | | | 71 | | | | — | | | | — | | | | 71 | | |
Hotels,
Restaurants & Leisure | | | 86 | | | | 31 | | | | — | | | | 117 | | |
Household Products | | | 46 | | | | — | | | | — | | | | 46 | | |
Industrial Conglomerates | | | 358 | | | | — | | | | — | | | | 358 | | |
Information
Technology
Services | | | 40 | | | | — | | | | — | | | | 40 | | |
Insurance | | | 94 | | | | — | | | | — | | | | 94 | | |
Internet
Software & Services | | | 404 | | | | — | | | | — | | | | 404 | | |
Media | | | 47 | | | | 13 | | | | — | | | | 60 | | |
Multi-line Retail | | | 26 | | | | — | | | | — | | | | 26 | | |
Personal Products | | | 95 | | | | — | | | | — | | | | 95 | | |
Pharmaceuticals | | | 182 | | | | — | | | | — | | | | 182 | | |
16
Morgan Stanley Institutional Fund, Inc.
Annual Report — December 31, 2013
Notes to Financial Statements (cont'd)
Investment Type | | Level 1
Unadjusted
quoted
prices
(000) | | Level 2
Other
significant
observable
inputs
(000) | | Level 3
Significant
unobservable
inputs
(000) | | Total
(000) | |
Common Stocks (cont'd) | |
Real Estate
Management &
Development | | $ | 385 | | | $ | 30 | | | $ | — | | | $ | 415 | | |
Semiconductors &
Semiconductor
Equipment | | | 922 | | | | — | | | | — | | | | 922 | | |
Software | | | 105 | | | | — | | | | — | | | | 105 | | |
Specialty Retail | | | 131 | | | | — | | | | — | | | | 131 | | |
Textiles, Apparel &
Luxury Goods | | | 90 | | | | — | | | | — | | | | 90 | | |
Tobacco | | | 62 | | | | — | | | | — | | | | 62 | | |
Transportation
Infrastructure | | | 42 | | | | — | | | | — | | | | 42 | | |
Wireless
Telecommunication
Services | | | 209 | | | | 67 | | | | — | | | | 276 | | |
Total Common Stocks | | | 5,499 | | | | 230 | | | | — | | | | 5,729 | | |
Investment Company | | | — | | | | 45 | | | | — | | | | 45 | | |
Participation Notes | | | — | | | | 280 | | | | — | | | | 280 | | |
Short-Term Investment | |
Investment Company | | | 85 | | | | — | | | | — | | | | 85 | | |
Total Assets | | $ | 5,584 | | | $ | 555 | | | $ | — | | | $ | 6,139 | | |
Transfers between investment levels may occur as the markets fluctuate and/or the availability of data used in an investment's valuation changes. The Portfolio recognizes transfers between the levels as of the end of the period. As of December 31, 2013, securities with a total value of approximately $3,768,000 transferred from Level 2 to Level 1. At December 31, 2012, the fair value of certain securities were adjusted due to developments which occurred between the time of the close of the foreign markets on which they trade and the close of business on the NYSE which resulted in their Level 2 classification.
3. Foreign Currency Translation and Foreign Investments: The books and records of the Portfolio are maintained in U.S. dollars. Foreign currency amounts are translated into U.S. dollars as follows:
– investments, other assets and liabilities at the prevailing rate of exchange on the valuation date;
– investment transactions and investment income at the prevailing rates of exchange on the dates of such transactions.
Although the net assets of the Portfolio are presented at the foreign exchange rates and market values at the close of the period, the Portfolio does not isolate that portion of the results of operations arising as a result of changes in the foreign exchange rates from the fluctuations arising
from changes in the market prices of securities held at period end. Similarly, the Portfolio does not isolate the effect of changes in foreign exchange rates from the fluctuations arising from changes in the market prices of securities sold during the period. Accordingly, realized and unrealized foreign currency gains (losses) on investments in securities are included in the reported net realized and unrealized gains (losses) on investment transactions and balances. However, pursuant to U.S. Federal income tax regulations, gains and losses from certain foreign currency transactions and the foreign currency portion of gains and losses realized on sales and maturities of foreign denominated debt securities are treated as ordinary income for U.S. Federal income tax purposes.
Net realized gains (losses) on foreign currency transactions represent net foreign exchange gains (losses) from foreign currency forward exchange contracts, disposition of foreign currencies, currency gains (losses) realized between the trade and settlement dates on securities transactions, and the difference between the amount of investment income and foreign withholding taxes recorded on the Portfolio's books and the U.S. dollar equivalent amounts actually received or paid. Net unrealized currency gains (losses) from valuing foreign currency denominated assets and liabilities at period end exchange rates are reflected as a component of unrealized appreciation (depreciation) on the Statement of Assets and Liabilities. The change in unrealized currency gains (losses) on foreign currency translations for the period is reflected in the Statement of Operations.
Foreign security and currency transactions may involve certain considerations and risks not typically associated with those of U.S. dollar denominated transactions as a result of, among other factors, fluctuations of exchange rates in relation to the U.S. dollar, the possibility of lower levels of governmental supervision and regulation of foreign securities markets and the possibility of political or economic instability.
The net assets of the Portfolio include foreign denominated securities and currency exchange rates will affect the U.S. Dollar value of and investment income from such securities.
Governmental approval for foreign investments may be required in advance of making an investment under certain circumstances in some countries, and the extent
17
Morgan Stanley Institutional Fund, Inc.
Annual Report — December 31, 2013
Notes to Financial Statements (cont'd)
of foreign investments in domestic companies may be subject to limitation in other countries. Foreign ownership limitations also may be imposed by the charters of individual companies to prevent, among other concerns, violations of foreign investment limitations. As a result, an additional class of shares (identified as "Foreign" in the Portfolio of Investments) may be created and offered for investment. The "local" and "foreign shares" market values may differ. In the absence of trading of the foreign shares in such markets, the Portfolio values the foreign shares at the closing exchange price of the local shares.
4. Derivatives: The Portfolio may, but is not required to, use derivative instruments for a variety of purposes, including hedging, risk management, portfolio management or to earn income. Derivatives are financial instruments whose value is based, in part, on the value of an underlying asset, interest rate, index or financial instrument. Prevailing interest rates and volatility levels, among other things, also affect the value of derivative instruments. A derivative instrument often has risks similar to its underlying asset and may have additional risks, including imperfect correlation between the value of the derivative and the underlying asset, risks of default by the counterparty to certain transactions, magnification of losses incurred due to changes in the market value of the securities, instruments, indices or interest rates to which they relate, and risks that the transactions may not be liquid. The use of derivatives involves risks that are different from, and possibly greater than, the risks associated with other portfolio investments. Derivatives may involve the use of highly specialized instruments that require investment techniques and risk analyses different from those associated with other portfolio investments. All of the Portfolio's holdings, including derivative instruments, are marked-to-market each day with the change in value reflected in unrealized appreciation (depreciation). Upon disposition, a realized gain or loss is recognized.
Certain derivative transactions may give rise to a form of leverage. Leverage magnifies the potential for gain and the risk of loss. Leverage associated with derivative transactions may cause the Portfolio to liquidate portfolio positions when it may not be advantageous to do so to satisfy its obligations or to meet earmarking or segregation requirements, pursuant to applicable Securities and Exchange Commission rules and regulations, or
may cause the Portfolio to be more volatile than if the Portfolio had not been leveraged. Although the Adviser and/or Sub-Adviser seek to use derivatives to further the Portfolio's investment objectives, there is no assurance that the use of derivatives will achieve this result.
Following is a description of the derivative instruments and techniques that the Portfolio used during the period and their associated risks:
Foreign Currency Forward Exchange Contracts: In connection with its investments in foreign securities, the Portfolio also entered into contracts with banks, brokers or dealers to purchase or sell securities or foreign currencies at a future date. A foreign currency forward exchange contract ("currency contract") is a negotiated agreement between the contracting parties to exchange a specified amount of currency at a specified future time at a specified rate. The rate can be higher or lower than the spot rate between the currencies that are the subject of the contract. Currency contracts may be used to protect against uncertainty in the level of future foreign currency exchange rates or to gain or modify exposure to a particular currency. In addition, the Portfolio may use cross currency hedging or proxy hedging with respect to currencies in which the Portfolio has or expects to have portfolio or currency exposure. Cross currency hedges involve the sale of one currency against the positive exposure to a different currency and may be used for hedging purposes or to establish an active exposure to the exchange rate between any two currencies. There is additional risk that such transactions reduce or preclude the opportunity for gain if the value of the currency should move in the direction opposite to the position taken and that currency contracts create exposure to currencies in which the Portfolio's securities are not denominated. Unanticipated changes in currency prices may result in poorer overall performance for the Portfolio than if it had not entered into such contracts. The use of currency contracts involves the risk of loss from the insolvency or bankruptcy of the counterparty to the contract or the failure of the counterparty to make payments or otherwise comply with the terms of the contract. A currency contract is marked-to-market daily and the change in market value is recorded by the Portfolio as unrealized gain or loss. The Portfolio records realized gains (losses) when the currency contract is closed equal to the difference between the value of the currency
18
Morgan Stanley Institutional Fund, Inc.
Annual Report — December 31, 2013
Notes to Financial Statements (cont'd)
contract at the time it was opened and the value at the time it was closed.
FASB ASC 815, "Derivatives and Hedging: Overall" ("ASC 815"), is intended to improve financial reporting about derivative instruments by requiring enhanced disclosures to enable investors to better understand how and why the Portfolio uses derivative instruments, how these derivative instruments are accounted for and their effects on the Portfolio's financial position and results of operations.
The following tables set forth by primary risk exposure the Portfolio's realized gains (losses) and change in unrealized appreciation (depreciation) by type of derivative contract for the year ended December 31, 2013 in accordance with ASC 815.
Realized Gain (Loss) | |
Primary Risk Exposure | | Derivative Type | | Value
(000) | |
Currency Risk | | Foreign Currency
Forward Exchange Contracts | | $ | 7 | | |
Change in Unrealized Appreciation (Depreciation) | |
Primary Risk Exposure | | Derivative Type | | Value
(000) | |
Currency Risk | | Foreign Currency
Forward Exchange Contracts | | $ | (1 | ) | |
For the year ended December 31, 2013, the approximate average monthly amount outstanding for each derivative type is as follows:
Foreign Currency Forward Exchange Contracts: | |
Average monthly principal amount | | $ | 9,000 | | |
5. Structured Investments: The Portfolio invested a portion of its assets in structured investments. A structured investment is a derivative security designed to offer a return linked to a particular underlying security, currency, commodity or market. Structured investments may come in various forms including notes (such as exchange-traded notes), warrants and options to purchase securities. The Portfolio will typically use structured investments to gain exposure to a permitted underlying security, currency, commodity or market when direct access to a market is limited or inefficient from a tax or cost standpoint. Investments in structured investments involve risks including issuer risk, counterparty risk and market risk. Holders of structured investments bear risks of the underlying investment and are subject to issuer or counterparty risk because the Portfolio is relying on the creditworthiness of such issuer or counterparty and has no rights with respect to the underlying investment. Certain structured investments
may be thinly traded or have a limited trading market and may have the effect of increasing the Portfolio's illiquidity to the extent that the Portfolio, at a particular time, may be unable to find qualified buyers for these securities.
6. Redemption Fees: The Portfolio will assess a 2% redemption fee, on Class I shares, Class A shares and Class L shares, which is paid directly to the Portfolio, for shares redeemed or exchanged within thirty days of purchase, subject to certain exceptions. The redemption fee is designed to protect the Portfolio and its remaining shareholders from the effects of short-term trading. These fees, if any, are included in the Statements of Changes in Net Assets.
7. Indemnifications: The Fund enters into contracts that contain a variety of indemnifications. The Fund's maximum exposure under these arrangements is unknown. However, the Fund has not had prior claims or losses pursuant to these contracts and expects the risk of loss to be remote.
8. Dividends and Distributions to Shareholders: Dividend income and distributions to shareholders are recorded on the ex-dividend date. Dividends from net investment income, if any, are declared and paid semiannually. Net realized capital gains, if any, are distributed at least annually.
9. Security Transactions, Income and Expenses: Security transactions are accounted for on the trade date (date the order to buy or sell is executed). Realized gains and losses on the sale of investment securities are determined on the specific identified cost method. Dividend income and other distributions are recorded on the ex-dividend date (except for certain foreign dividends which may be recorded as soon as the Portfolio is informed of such dividends) net of applicable withholding taxes. Interest income is recognized on the accrual basis except where collection is in doubt. Discounts are accreted and premiums are amortized over the life of the respective securities. Most expenses of the Fund can be directly attributed to a particular Portfolio. Expenses which cannot be directly attributed are apportioned among the Portfolios based upon relative net assets or other appropriate methods. Income, expenses (other than class specific expenses — distribution, transfer agency and sub transfer agency fees) and realized and unrealized gains or losses are allocated to each class of shares based upon their relative net assets.
19
Morgan Stanley Institutional Fund, Inc.
Annual Report — December 31, 2013
Notes to Financial Statements (cont'd)
B. Advisory/Sub-Advisory Fees: The Adviser, a wholly-owned subsidiary of Morgan Stanley, provides the Portfolio with advisory services under the terms of an Investment Advisory Agreement, paid quarterly, at the annual rate based on the average daily net assets as follows:
First $1
billion | | Over $1
billion | |
| | 0.95 | % | | | 0.90 | % | |
For the year ended December 31, 2013, the advisory fee rate (net of waivers/rebate) was equivalent to an annual effective rate of 0.00% of the Portfolio's daily net assets.
The Adviser has agreed to reduce its advisory fee and/or reimburse the Portfolio so that total annual portfolio operating expenses, excluding certain investment related expenses, taxes, interest and other extraordinary expenses (including litigation), will not exceed 1.45% for Class I shares, 1.70% for Class A shares and 2.20% for Class L shares. Effective September 16, 2013, the Adviser has agreed to limit the ratio of expenses to average net assets to the maximum ratio of 1.80% and 2.30% for Class A and Class L shares, respectively. The fee waivers and/or expense reimbursements will continue for at least one year or until such time that the Directors act to discontinue all or a portion of such waivers and/or reimbursements when it deems such action is appropriate. For the year ended December 31, 2013, approximately $74,000 of advisory fees were waived and approximately $148,000 of other expenses were reimbursed by the Adviser pursuant to this arrangement.
The Adviser has entered into a Sub-Advisory Agreement with the Sub-Adviser, a wholly-owned subsidiary of Morgan Stanley. The Sub-Adviser provides the Portfolio with advisory services subject to the overall supervision of the Adviser and the Fund's Officers and Directors. The Adviser pays the Sub-Adviser on a monthly basis a portion of the net advisory fees the Adviser receives from the Portfolio.
C. Administration Fees: The Adviser also serves as Administrator to the Fund and provides administrative services pursuant to an Administration Agreement for an annual fee, accrued daily and paid monthly, of 0.08% of the Portfolio's average daily net assets. Under a Sub-Administration Agreement between the Administrator and State Street Bank and Trust Company ("State Street"), State Street provides certain administrative services to the Fund. For such services, the Administrator pays State Street a portion of the fee the Administrator receives from the Portfolio.
D. Distribution and Shareholder Services Fees: Morgan Stanley Distribution, Inc. ("MSDI" or the "Distributor"), a wholly-owned subsidiary of the Adviser, and an indirect subsidiary of Morgan Stanley, serves as the Fund's Distributor of Portfolio shares pursuant to a Distribution Agreement. The Fund has adopted a Shareholder Services Plan with respect to Class A shares pursuant to Rule 12b-1 under the Act. Under the Shareholder Services Plan, the Portfolio pays the Distributor a shareholder services fee, accrued daily and paid monthly, at an annual rate of 0.25% of the Portfolio's average daily net assets attributable to Class A shares.
The Fund has adopted a Distribution and Shareholder Services Plan with respect to Class L shares pursuant to Rule 12b-1 under the Act. Under the Distribution and Shareholder Services Plan, the Portfolio pays the Distributor a distribution fee, accrued daily and paid monthly, at an annual rate of 0.50% and a shareholder services fee, accrued daily and paid monthly, at an annual rate of 0.25% of the Portfolio's average daily net assets attributable to Class L shares.
The distribution and shareholder services fees are used to support the expenses associated with servicing and maintaining accounts. The Distributor may compensate other parties for providing shareholder support services to investors who purchase Class A and Class L shares.
E. Dividend Disbursing and Transfer Agent: The Fund's dividend disbursing and transfer agent was Morgan Stanley Services Company Inc. ("Morgan Stanley Services"). Pursuant to a Transfer Agency Agreement, the Fund paid Morgan Stanley Services a fee based on the number of classes, accounts and transactions relating to the Portfolios of the Fund. Effective July 1, 2013, the Directors approved changing the transfer agent to Boston Financial Data Services, Inc.
F. Custodian Fees: State Street (the "Custodian") serves as Custodian for the Fund in accordance with a Custodian Agreement. The Custodian holds cash, securities, and other assets of the Fund as required by the Act. Custody fees are payable monthly based on assets held in custody, investment purchases and sales activity and account maintenance fees, plus reimbursement for certain out-of-pocket expenses.
G. Security Transactions and Transactions with Affiliates: For the year ended December 31, 2013, purchases and sales of investment securities for the Portfolio, other than long-term U.S. Government securities and short-term investments, were approximately $9,263,000 and $8,654,000, respectively. There were no purchases and sales of long-term U.S. Government securities for the year ended December 31, 2013.
20
Morgan Stanley Institutional Fund, Inc.
Annual Report — December 31, 2013
Notes to Financial Statements (cont'd)
The Portfolio invests in the Institutional Class of the Morgan Stanley Institutional Liquidity Funds — Money Market Portfolio (the "Liquidity Funds"), an open-end management investment company managed by the Adviser. Advisory fees paid by the Portfolio are reduced by an amount equal to its pro-rata share of the advisory and administration fees paid by the Portfolio due to its investment in the Liquidity Funds. For the year ended December 31, 2013, advisory fees paid were reduced by less than $500 relating to the Portfolio's investment in the Liquidity Funds.
A summary of the Portfolio's transactions in shares of the Liquidity Funds during the year ended December 31, 2013 is as follows:
Value
December 31,
2012
(000) | | Purchases
at Cost
(000) | | Sales
(000) | | Dividend
Income
(000) | | Value
December 31,
2013
(000) | |
| $ | 12 | | | $ | 7,001 | | | $ | 6,928 | | | $ | — | @ | | $ | 85 | | |
@ Amount is less than $500.
During the year ended December 31, 2013, the Portfolio incurred approximately $1,000 in brokerage commissions with Morgan Stanley & Co., LLC, an affiliate of the Adviser, Sub-Adviser, Administrator and Distributor, for portfolio transactions executed on behalf of the Portfolio.
From January 1, 2013 to June 30, 2013, the Portfolio incurred less than $500 in brokerage commissions with Citigroup, Inc., and its affiliated broker-dealers, which may be deemed affiliates of the Adviser, Sub-Adviser, Distributor and Administrator under Section 17 of the Act, for portfolio transactions executed on behalf of the Portfolio. Citigroup, Inc. and its affiliated broker-dealers ceased to be affiliates of the Portfolio pursuant to Section 17 of the Act as of July 1, 2013.
H. Federal Income Taxes: It is the Portfolio's intention to continue to qualify as a regulated investment company and distribute all of its taxable and tax-exempt income. Accordingly, no provision for Federal income taxes is required in the financial statements.
The Portfolio may be subject to taxes imposed by countries in which it invests. Such taxes are generally based on income and/or capital gains earned or repatriated. Taxes are accrued based on net investment income, net realized gains and net unrealized appreciation as such income and/or gains are earned. Taxes may also be based on transactions in foreign currency and are accrued based on the value of investments denominated in such currency.
FASB ASC 740-10 "Income Taxes — Overall" sets forth a minimum threshold for financial statement recognition of the benefit of a tax position taken or expected to be taken in a tax return. Management has concluded there are no significant uncertain tax positions that would require recognition in the financial statements. If applicable, the Portfolio recognizes interest accrued related to unrecognized tax benefits in "Interest Expense" and penalties in ''Other Expenses" in the Statement of Operations. The Portfolio files tax returns with the U.S. Internal Revenue Service, New York and various states. Generally, each of the tax years in the four-year period ended December 31, 2013, remains subject to examination by taxing authorities.
The tax character of distributions paid may differ from the character of distributions shown in the Statements of Changes in Net Assets due to short-term capital gains being treated as ordinary income for tax purposes. The tax character of distributions paid during fiscal 2013 and 2012 was as follows:
2013
Distributions
Paid From: | | 2012
Distributions
Paid From: | |
Ordinary
Income
(000) | | Long-Term
Capital Gain
(000) | | Ordinary
Income
(000) | | Long-Term
Capital Gain
(000) | |
| $ | 38 | | | $ | 3 | | | $ | 52 | | | | — | | |
The amount and character of income and gains to be distributed are determined in accordance with income tax regulations which may differ from GAAP. These book/tax differences are either considered temporary or permanent in nature.
Temporary differences are primarily due to differing book and tax treatments in the timing of the recognition of gains (losses) on certain investment transactions and the timing of the deductibility of certain expenses.
Permanent differences, primarily due to differing treatments of gains (losses) related to foreign currency transactions, basis adjustments on certain equity securities designated as passive foreign investment companies, distribution redesignations and foreign taxes paid on capital gains, resulted in the following reclassifications among the components of net assets at December 31, 2013:
Distributions
in Excess of
Net Investment
Income
(000) | | Accumulated
Net Realized
Gain
(000) | | Paid-in-
Capital
(000) | |
| $ | 16 | | | $ | (16 | ) | | | — | | |
21
Morgan Stanley Institutional Fund, Inc.
Annual Report — December 31, 2013
Notes to Financial Statements (cont'd)
At December 31, 2013, the components of distributable earnings for the Portfolio on a tax basis were as follows:
Undistributed
Ordinary
Income
(000) | | Undistributed
Long-Term
Capital Gain
(000) | |
| | — | | | $ | 203 | | |
At December 31, 2013, the aggregate cost for federal income tax purposes is $5,859,000. The aggregate gross unrealized appreciation is $640,000 and the aggregate gross unrealized depreciation is $360,000 resulting in net unrealized appreciation of $280,000.
To the extent that capital loss carryforwards are used to offset any future capital gains realized during the carryover period as provided by U.S. Federal income tax regulations, no capital gains tax liability will be incurred by the Portfolio for gains realized and not distributed. To the extent that capital gains are offset, such gains will not be distributed to the shareholders. During the year ended December 31, 2013, the Portfolio utilized capital loss carryforwards for U. S. Federal income tax purposes of approximately $63,000.
I. Results of Special Shareholder Meeting (unaudited): On June 5, 2013, a Joint Special Shareholder Meeting was held for Class H shareholders of the Portfolio to approve the Articles of Amendment to the Fund's Articles of Amendment and Restatement and a Plan of Reclassification for the Portfolio pursuant to which Class H shares would be reclassified as Class P shares. The results with respect to this proposal were as follows:
| For | | Against | | Abstain | |
| | 10,000 | | | | 0 | | | | 0 | | |
J. Accounting Pronouncement: In June 2013, FASB issued Accounting Standards Update 2013-08 Financial Services — Investment Companies (Topic 946) — Amendments to the Scope, Measurement, and Disclosure Requirements ("ASU 2013-08") which is effective for interim and annual reporting periods in fiscal years that begin after December 15, 2013. ASU 2013-08 sets forth a methodology for determining whether an entity should be characterized as an investment company and prescribes fair value accounting for an investment company's non-controlling ownership interest in another investment company. FASB has determined that a fund registered under the Investment Company Act of 1940 automatically meets ASU 2013-08's criteria for an investment company. Although still evaluating the potential impacts of ASU 2013-08 to the Portfolio, management expects that the impact of the Portfolio's adoption will be limited to additional financial statement disclosures.
22
Morgan Stanley Institutional Fund, Inc.
Annual Report — December 31, 2013
Report of Independent Registered Public Accounting Firm
To the Shareholders and Board of Directors of
Morgan Stanley Institutional Fund, Inc. —
Asian Equity Portfolio
We have audited the accompanying statement of assets and liabilities, including the portfolio of investments, of Asian Equity Portfolio (one of the portfolios constituting Morgan Stanley Institutional Fund, Inc.) (the "Portfolio") as of December 31, 2013, and the related statement of operations for the year then ended, the statements of changes in net assets for each of the two years in the period then ended, and the financial highlights for each of the periods indicated therein. These financial statements and financial highlights are the responsibility of the Portfolio's management. Our responsibility is to express an opinion on these financial statements and financial highlights based on our audits.
We conducted our audits in accordance with the standards of the Public Company Accounting Oversight Board (United States). Those standards require that we plan and perform the audit to obtain reasonable assurance about whether the financial statements and financial highlights are free of material misstatement. We were not engaged to perform an audit of the Portfolio's internal control over financial reporting. Our audits included consideration of internal control over financial reporting as a basis for designing audit procedures that are appropriate in the circumstances, but not for the purpose of expressing an opinion on the effectiveness of the Portfolio's internal control over financial reporting. Accordingly, we express no such opinion. An audit also includes examining, on a test basis, evidence supporting the amounts and disclosures in the financial statements and financial highlights, assessing the accounting principles used and significant estimates made by management, and evaluating the overall financial statement presentation. Our procedures included confirmation of securities owned as of December 31, 2013, by correspondence with the custodian and others or by other appropriate auditing procedures where replies from others were not received. We believe that our audits provide a reasonable basis for our opinion.
In our opinion, the financial statements and financial highlights referred to above present fairly, in all material respects, the financial position of Asian Equity Portfolio (one of the portfolios constituting Morgan Stanley Institutional Fund, Inc.) at December 31, 2013, the results of its operations for the year then ended, the changes in its net assets for each of the two years in the period then ended, and the financial highlights for each of the periods indicated therein, in conformity with U.S. generally accepted accounting principles.

Boston, Massachusetts
February 26, 2014
23
Morgan Stanley Institutional Fund, Inc.
Annual Report — December 31, 2013
Federal Tax Notice (unaudited)
For Federal income tax purposes, the following information is furnished with respect to the distributions paid by the Portfolio during its taxable year ended December 31, 2013. The Portfolio designated and paid approximately $3,000 as a long-term capital gain distribution.
For Federal income tax purposes, the following information is furnished with respect to the Portfolio's earnings for its taxable year ended December 31, 2013. When distributed, certain earnings may be subject to a maximum tax rate of 15% as provided for the Jobs and Growth Tax Relief Reconciliation Act of 2003. The Portfolio designated up to a maximum of $59,000 as taxable at this lower rate.
The Portfolio intends to pass through foreign tax credits of approximately $17,000 and has derived net income from sources within foreign countries amounting to approximately $169,000.
In January, the Portfolio provides tax information to shareholders for the preceding calendar year.
24
Morgan Stanley Institutional Fund, Inc.
Annual Report — December 31, 2013
U.S. Privacy Policy (unaudited)
AN IMPORTANT NOTICE CONCERNING OUR U.S. PRIVACY POLICY
This privacy notice describes the U.S. privacy policy of Morgan Stanley Distribution, Inc., and the Morgan Stanley family of mutual funds ("us", "our", "we").
We are required by federal law to provide you with notice of our U.S. privacy policy ("Policy"). This Policy applies to both our current and former clients unless we state otherwise and is intended for individual clients who purchase products or receive services from us for personal, family or household purposes. This Policy is not applicable to partnerships, corporations, trusts or other non-individual clients or account holders, nor is this Policy applicable to individuals who are either beneficiaries of a trust for which we serve as trustee or participants in an employee benefit plan administered or advised by us. This Policy is, however, applicable to individuals who select us to be a custodian of securities or assets in individual retirement accounts, 401(k) accounts, or accounts subject to the Uniform Gifts to Minors Act.
This notice sets out our business practices to protect your privacy; how we collect and share personal information about you; and how you can limit our sharing or certain uses by others of this information. We may amend this Policy at any time, and will inform you of any changes to our Policy as required by law.
WE RESPECT YOUR PRIVACY
We appreciate that you have provided us with your personal financial information and understand your concerns about your information. We strive to safeguard the information our clients entrust to us. Protecting the confidentiality and security of client information is an important part of how we conduct our business.
This notice describes what personal information we collect about you, how we collect it, when we may share it with others, and how certain others may use it. It discusses the steps you may take to limit our sharing of certain information about you with our affiliated companies, including, but not limited to our affiliated banking businesses, brokerage firms and credit service affiliates. It also discloses how you may limit our affiliates' use of shared information for marketing purposes.
Throughout this Policy, we refer to the nonpublic information that personally identifies you as "personal information." We also use the term "affiliated company" in this notice. An affiliated company is a company in our family of companies and includes companies with the Morgan Stanley name. These affiliated companies are financial institutions such as broker-dealers, banks, investment advisers and credit card issuers. We refer to any company that is not an affiliated company as a nonaffiliated third party. For purposes of Section 5 of this notice, and your ability to limit certain uses of personal information by our affiliates, this notice applies to the use of personal information by our affiliated companies.
1. WHAT PERSONAL INFORMATION DO WE COLLECT FROM YOU?
We may collect the following types of information about you: (i) information provided by you, including information from applications and other forms we receive from you, (ii) information about your transactions with us or our affiliates, (iii) information about your transactions with nonaffiliated third parties, (iv) information from consumer reporting agencies, (v) information obtained from our websites, and (vi) information obtained from other sources. For example:
• We collect information such as your name, address, e-mail address, telephone/fax numbers, assets, income and investment objectives through applications and other forms you submit to us.
• We may obtain information about account balances, your use of account(s) and the types of products and services you prefer to receive from us through your dealings and transactions with us and other sources.
• We may obtain information about your creditworthiness and credit history from consumer reporting agencies.
• We may collect background information from and through third-party vendors to verify representations you have made and to comply with various regulatory requirements.
2. WHEN DO WE DISCLOSE PERSONAL INFORMATION WE COLLECT ABOUT YOU?
We may disclose personal information we collect about you in each of the categories listed above to affiliated and nonaffiliated third parties.
25
Morgan Stanley Institutional Fund, Inc.
Annual Report — December 31, 2013
U.S. Privacy Policy (unaudited) (cont'd)
a. Information we disclose to affiliated companies.
We may disclose personal information that we collect about you to our affiliated companies to manage your account(s) effectively, to service and process your transactions, and to let you know about products and services offered by us and affiliated companies, to manage our business, and as otherwise required or permitted by law. Offers for products and services from affiliated companies are developed under conditions designed to safeguard your personal information.
b. Information we disclose to third parties.
We may disclose personal information that we collect about you to nonaffiliated third parties to provide marketing services on our behalf or to other financial institutions with whom we have joint marketing agreements. We may also disclose all of the information we collect to other nonaffiliated third parties for our everyday business purposes, such as to process transactions, maintain account(s), respond to court orders and legal investigations, report to credit bureaus, offer our own products and services, protect against fraud, for institutional risk control, to perform services on our behalf, and as otherwise required or permitted by law.
When we share personal information about you with a nonaffiliated third party, they are required to limit their use of personal information about you to the particular purpose for which it was shared and they are not allowed to share personal information about you with others except to fulfill that limited purpose or as may be permitted or required by law.
3. HOW DO WE PROTECT THE SECURITY AND CONFIDENTIALITY OF PERSONAL INFORMATION WE COLLECT ABOUT YOU?
We maintain physical, electronic and procedural security measures that comply with applicable law and regulations to help safeguard the personal information we collect about you. We have internal policies governing the proper handling of client information by employees. Third parties that provide support or marketing services on our behalf may also receive personal information about you, and we require them to adhere to appropriate security standards with respect to such information.
4. HOW CAN YOU LIMIT OUR SHARING CERTAIN PERSONAL INFORMATION ABOUT YOU WITH OUR AFFILIATED COMPANIES FOR ELIGIBILITY DETERMINATION?
By following the opt-out procedures in Section 6 below, you may limit the extent to which we share with our affiliated companies, personal information that was collected to determine your eligibility for products and services such as your credit reports and other information that you have provided to us or that we may obtain from third parties ("eligibility information"). Eligibility information does not include your identification information or personal information pertaining to our transactions or experiences with you. Please note that, even if you direct us not to share eligibility information with our affiliated companies, we may still share your personal information, including eligibility information, with our affiliated companies under circumstances that are permitted under applicable law, such as to process transactions or to service your account.
5. HOW CAN YOU LIMIT THE USE OF CERTAIN PERSONAL INFORMATION ABOUT YOU BY OUR AFFILIATED COMPANIES FOR MARKETING?
By following the opt-out instructions in Section 6 below, you may limit our affiliated companies from marketing their products or services to you based on personal information we disclose to them. This information may include, for example, your income and account history with us. Please note that, even if you choose to limit our affiliated companies from using personal information about you that we may share with them for marketing their products and services to you, our affiliated companies may use your personal information that they obtain from us to market to you in circumstances permitted by law, such as if the affiliated party has its own relationship with you.
26
Morgan Stanley Institutional Fund, Inc.
Annual Report — December 31, 2013
U.S. Privacy Policy (unaudited) (cont'd)
6. HOW CAN YOU SEND US AN OPT-OUT INSTRUCTION?
If you wish to limit our sharing of eligibility information about you with our affiliated companies, or our affiliated companies' use of personal information for marketing purposes, as described in this notice, you may do so by:
• Calling us at (800) 548-7786
Monday–Friday between 8a.m. and 5p.m. (EST)
• Writing to us at the following address:
Boston Financial Data Services, Inc.
c/o Privacy Coordinator
P.O. Box 219804
Kansas City, Missouri 64121
If you choose to write to us, your request should include: your name, address, telephone number and account number(s) to which the opt-out applies and whether you are opting out with respect to sharing of eligibility information (Section 4 above), or information used for marketing (Section 5 above), or both. Written opt-out requests should not be sent with any other correspondence. In order to process your request, we require that the request be provided by you directly and not through a third party. Once you have informed us about your privacy preferences, your opt-out preference will remain in effect with respect to this Policy (as it may be amended) until you notify us otherwise. If you are a joint account owner, we will accept instructions from any one of you and apply those instructions to the entire account.
Please understand that if you limit our sharing or our affiliated companies' use of personal information, you and any joint account holder(s) may not receive information about our affiliated companies' products and services, including products or services that could help you manage your financial resources and achieve your investment objectives.
If you have more than one account or relationship with us, please specify the accounts to which you would like us to apply your privacy choices. If you have accounts or relationships with our affiliates, you may receive multiple privacy policies from them, and will need to separately notify those companies of your privacy choices for those accounts or relationships.
7. WHAT IF AN AFFILIATED COMPANY BECOMES A NONAFFILIATED THIRD PARTY?
If, at any time in the future, an affiliated company becomes a nonaffiliated third party, further disclosures of personal information made to the former affiliated company will be limited to those described in Section 2(b) above relating to nonaffiliated third parties. If you elected under Section 6 to limit disclosures we make to affiliated companies, or use of personal information by affiliated companies, your election will not apply to use by any former affiliated company of your personal information in their possession once it becomes a nonaffiliated third party.
SPECIAL NOTICE TO RESIDENTS OF VERMONT
The following section supplements our Policy with respect to our individual clients who have a Vermont address and supersedes anything to the contrary in the above Policy with respect to those clients only.
The State of Vermont requires financial institutions to obtain your consent prior to sharing personal information that they collect about you with nonaffiliated third parties, or eligibility information with affiliated companies, other than in certain limited circumstances. Except as permitted by law, we will not share personal information we collect about you with nonaffiliated third parties or eligibility information with affiliated companies, unless you provide us with your written consent to share such information.
SPECIAL NOTICE TO RESIDENTS OF CALIFORNIA
The following section supplements our Policy with respect to our individual clients who have a California address and supersedes anything to the contrary in the above Policy with respect to those clients only.
In response to a California law, if your account has a California home address, your personal information will not be disclosed to nonaffiliated third parties except as permitted by applicable California law, and we will limit sharing such personal information with our affiliates to comply with California privacy laws that apply to us.
27
Morgan Stanley Institutional Fund, Inc.
Annual Report — December 31, 2013
Director and Officer Information (unaudited)
Independent Director:
Name, Age and Address of
Independent Director | | Position(s)
Held with
Registrant | | Length of Time
Served* | | Principal Occupation(s) During Past 5 Years | | Number of
Portfolios in
Fund Complex
Overseen by
Independent
Director** | | Other Directorships
Held by Independent
Director*** | |
Frank L. Bowman (69)
c/o Kramer Levin Naftalis &
Frankel LLP
Counsel to the Independent Directors
1177 Avenue of the Americas
New York, NY 10036 | | Director | | Since
August
2006 | | President, Strategic Decisions, LLC (consulting) (since February 2009); Director or Trustee of various Morgan Stanley Funds (since August 2006); Chairperson of the Insurance Sub-Committee of the Compliance and Insurance Committee (since February 2007); served as President and Chief Executive Officer of the Nuclear Energy Institute (policy organization) (February 2005-November 2008); retired as Admiral, U.S. Navy after serving over 38 years on active duty including 8 years as Director of the Naval Nuclear Propulsion Program in the Department of the Navy and the U.S. Department of Energy (1996-2004); served as Chief of Naval Personnel (July 1994-September 1996); and on the Joint Staff as Director of Political Military Affairs (June 1992-July 1994); knighted as Honorary Knight Commander of the Most Excellent Order of the British Empire; awarded the Officier de l'Orde National du Mérite by the French Government; elected to the National Academy of Engineering (2009). | | | 98 | | | Director of BP p.l.c.; Director of Naval and Nuclear Technologies LLP; Director of the Armed Services YMCA of the USA and the U.S. Naval Submarine League; Director of the American Shipbuilding Suppliers Association; Member of the National Security Advisory Council of the Center for U.S. Global Engagement and a member of the CNA Military Advisory Board; Chairman of the Charity J Street Cup Golf; Trustee of Fairhaven United Methodist Church. | |
Michael Bozic (73)
c/o Kramer Levin Naftalis & Frankel LLP
Counsel to the Independent Directors
1177 Avenue of the Americas
New York, NY 10036 | | Director | | Since
April
1994 | | Private investor and a member of the advisory board of American Road Group LLC (retail) (since June 2000); Chairperson of the Compliance and Insurance Committee (since October 2006); Director or Trustee of various Morgan Stanley Funds (since April 1994); formerly, Chairperson of the Insurance Committee (July 2006-September 2006); Vice Chairman of Kmart Corporation (December 1998-October 2000), Chairman and Chief Executive Officer of Levitz Furniture Corporation (November 1995-November 1998) and President and Chief Executive Officer of Hills Department Stores (May 1991-July 1995); variously Chairman, Chief Executive Officer, President and Chief Operating Officer (1987-1991) of the Sears Merchandise Group of Sears, Roebuck & Co. | | | 100 | | | Trustee and member of the Hillsdale College Board of Trustees. | |
Kathleen A. Dennis (60)
c/o Kramer Levin Naftalis & Frankel LLP
Counsel to the Independent Directors
1177 Avenue of the Americas
New York, NY 10036 | | Director | | Since
August
2006 | | President, Cedarwood Associates (mutual fund and investment management consulting) (since July 2006); Chairperson of the Money Market and Alternatives Sub-Committee of the Investment Committee (since October 2006) and Director or Trustee of various Morgan Stanley Funds (since August 2006); formerly, Senior Managing Director of Victory Capital Management (1993-2006). | | | 98 | | | Director of various non-profit organizations. | |
Dr. Manuel H. Johnson (65)
c/o Johnson Smick International, Inc.
220 I Street, NE
Suite 200
Washington, D.C. 20002 | | Director | | Since
July
1991 | | Senior Partner, Johnson Smick International, Inc. (consulting firm); Chairperson of the Investment Committee (since October 2006) and Director or Trustee of various Morgan Stanley Funds (since July 1991); Co-Chairman and a founder of the Group of Seven Council (G7C) (international economic commission); formerly, Chairperson of the Audit Committee (July 1991-September 2006), Vice Chairman of the Board of Governors of the Federal Reserve System and Assistant Secretary of the U.S. Treasury. | | | 101 | | | Director of NVR, Inc. (home construction). | |
28
Morgan Stanley Institutional Fund, Inc.
Annual Report — December 31, 2013
Director and Officer Information (unaudited) (cont'd)
Independent Director: (cont'd)
Name, Age and Address of
Independent Director | | Position(s)
Held with
Registrant | | Length of Time
Served* | | Principal Occupation(s) During Past 5 Years | | Number of
Portfolios in
Fund Complex
Overseen by
Independent
Director** | | Other Directorships
Held by Independent
Director*** | |
Joseph J. Kearns (71)
c/o Kearns & Associates LLC
PMB754
22631 Pacific Coast Highway
Malibu, CA 90265 | | Director | | Since
August
1994 | | President, Kearns & Associates LLC (investment consulting); Chairperson of the Audit Committee (since October 2006) and Director or Trustee of various Morgan Stanley Funds (since August 1994); formerly, Deputy Chairperson of the Audit Committee (July 2003-September 2006) and Chairperson of the Audit Committee of various Morgan Stanley Funds (since August 1994); CFO of the J. Paul Getty Trust. | | | 101 | | | Director of Electro Rent Corporation (equipment leasing) and The Ford Family Foundation. | |
Michael F. Klein (55)
c/o Kramer Levin Naftalis & Frankel LLP
Counsel to the
Independent Directors
1177 Avenue of the Americas
New York, NY 10036 | | Director | | Since
August
2006 | | Managing Director, Aetos Capital, LLC (since March 2000) and Co-President, Aetos Alternatives Management, LLC (since January 2004); and Co-Chief Executive Officer of Aetos Capital LLC (since August 2013); Chairperson of the Fixed Income Sub-Committee of the Investment Committee (since October 2006) and Director or Trustee of various Morgan Stanley Funds (since August 2006); formerly, Managing Director, Morgan Stanley & Co. Inc. and Morgan Stanley Dean Witter Investment Management, President, various Morgan Stanley Funds (June 1998-March 2000) and Principal, Morgan Stanley & Co. Inc. and Morgan Stanley Dean Witter Investment Management (August 1997-December 1999). | | | 98 | | | Director of certain investment funds managed or sponsored by Aetos Capital, LLC. Director of Sanitized AG and Sanitized Marketing AG (specialty chemicals). | |
Michael E. Nugent (77)
522 Fifth Avenue
New York, NY 10036 | | Chairperson of the Board and Director | | Chairperson of the Boards since July 2006 and Director since July 1991 | | Chairperson of the Boards of various Morgan Stanley Funds (since July 2006); Chairperson of the Closed-End Fund Committee (since June 2012) and Director or Trustee of various Morgan Stanley Funds (since July 1991); formerly, Chairperson of the Insurance Committee (until July 2006); General Partner, Triumph Capital, L.P. (private investment partnership) (1988-2013) | | | 100 | | | None. | |
W. Allen Reed (66)
c/o Kramer Levin Naftalis & Frankel LLP
Counsel to the
Independent Directors
1177 Avenue of the Americas
New York, NY 10036 | | Director | | Since
August
2006 | | Chairperson of the Equity Sub-Committee of the Investment Committee (since October 2006) and Director or Trustee of various Morgan Stanley Funds (since August 2006); formerly, President and CEO of General Motors Asset Management; Chairman and Chief Executive Officer of the GM Trust Bank and Corporate Vice President of General Motors Corporation (August 1994-December 2005). | | | 98 | | | Director of Temple-Inland Industries (packaging and forest products); Director of Legg Mason, Inc. and Director of the Auburn University Foundation. | |
Fergus Reid (81)
c/o Joe Pietryka, Inc.
85 Charles Colman Blvd.
Pawling, NY 12564 | | Director | | Since
June
1992 | | Chairman, Joe Pietryka, Inc.; Chairperson of the Governance Committee and Director or Trustee of various Morgan Stanley Funds (since June 1992). | | | 101 | | | Through December 31, 2012, Trustee and Director of certain Investment companies in the JP Morgan Fund Complex. | |
29
Morgan Stanley Institutional Fund, Inc.
Annual Report — December 31, 2013
Director and Officer Information (unaudited) (cont'd)
Interested Director:
Name, Age and Address of
Interested Director | | Position(s) Held
with Registrant | | Length of
Time Served* | | Principal Occupation(s) During Past 5 Years | | Number of
Portfolios in
Fund Complex
Overseen by
Interested
Director** | | Other Directorships
Held by Interested
Director*** | |
James F. Higgins (66)
One New York Plaza
New York, New York 10004 | | Director | | Since
June
2000 | | Director or Trustee of various Morgan Stanley Funds (since June 2000); Senior Advisor of Morgan Stanley (since August 2000). | | | 99 | | | Formerly, Director of AXA Financial, Inc. and AXA Equitable Life Insurance Company (2002-2011) and Director of AXA MONY Life Insurance Company and AXA MONY Life Insurance Company of America (2004-2011). | |
* Each Director serves an indefinite term, until his or her successor is elected.
** The Fund Complex includes (as of December 31, 2013) all open-end and closed-end funds (including all of their portfolios) advised by Morgan Stanley Investment Management Inc. (the "Adviser") and any funds that have an adviser that is an affiliated person of the Adviser (including, but not limited to, Morgan Stanley AIP GP LP).
*** This includes any directorships at public companies and registered investment companies held by the Director at any time during the past five years.
30
Morgan Stanley Institutional Fund, Inc.
Annual Report — December 31, 2013
Director and Officer Information (unaudited) (cont'd)
Executive Officers:
Name, Age and Address of Executive Officer | | Position(s) Held
with
Registrant | | Length of
Time Served* | | Principal Occupation(s) During Past 5 Years | |
John H. Gernon (50)
522 Fifth Avenue
New York, NY 10036 | | President and Principal Executive Officer—Equity, Fixed Income and AIP Funds | | Since September 2013 | | President and Principal Executive Officer of the Equity and Fixed Income Funds and the Morgan Stanley AIP Funds (since September 2013) in the Fund Complex. Managing Director of the Adviser. | |
Stefanie V. Chang Yu (47)
522 Fifth Avenue
New York, NY 10036 | | Chief Compliance Officer | | Since
January
2014 | | Managing Director of the Adviser and various entities affiliated with the Adviser; Chief Compliance Officer of various Morgan Stanley Funds and the Adviser (since January 2014); formerly, Vice President of various Morgan Stanley Funds (December 1997-January 2014). | |
Joseph C. Benedetti (48)
522 Fifth Avenue
New York, NY 10036 | | Vice President | | Since
January
2014 | | Managing Director of the Adviser and various entities affiliated with the Adviser; Vice President of various Morgan Stanley Funds (since January 2014); formerly, Assistant Secretary of various Morgan Stanley Funds (October 2004-January 2014). | |
Francis J. Smith (48)
522 Fifth Avenue
New York, NY 10036 | | Treasurer and Principal Financial Officer | | Treasurer since July 2003 and Principal Financial Officer since September 2002 | | Executive Director of the Adviser and various entities affiliated with the Adviser; Treasurer and Principal Financial Officer of various Morgan Stanley Funds (since July 2003). | |
Mary E. Mullin (46)
522 Fifth Avenue
New York, NY 10036 | | Secretary | | Since
June
1999 | | Executive Director of the Adviser and various entities affiliated with the Adviser; Secretary of various Morgan Stanley Funds (since June 1999). | |
* Each officer serves an indefinite term, until his or her successor is elected.
31
Morgan Stanley Institutional Fund, Inc.
Annual Report — December 31, 2013
Adviser and Administrator
Morgan Stanley Investment Management Inc.
522 Fifth Avenue
New York, New York 10036
Sub-Adviser
Morgan Stanley Investment Management Company
23 Church Street
16-01 Capital Square 049481 Singapore
Distributor
Morgan Stanley Distribution, Inc.
522 Fifth Avenue
New York, New York 10036
Dividend Disbursing and Transfer Agent
Boston Financial Data Services, Inc.
2000 Crown Colony Drive
Quincy, Massachusetts 02169
Custodian
State Street Bank and Trust Company
One Lincoln Street
Boston, Massachusetts 02111
Legal Counsel
Dechert LLP
1095 Avenue of the Americas
New York, New York 10036
Counsel to the Independent Directors
Kramer Levin Naftalis & Frankel LLP
1177 Avenue of the Americas
New York, New York 10036
Independent Registered Public Accounting Firm
Ernst & Young LLP
200 Clarendon Street
Boston, Massachusetts 02116
Reporting to Shareholders
Each Morgan Stanley fund provides a complete schedule of portfolio holdings in its semi-annual and annual reports within 60 days of the end of the fund's second and fourth fiscal quarters by filing the schedule electronically with the Securities and Exchange Commission (SEC). The semi-annual reports are filed on Form N-CSRS and the annual reports are filed on Form N-CSR. Morgan Stanley also delivers the semi-annual and annual reports to fund shareholders and makes these reports available on its public website, www.morganstanley.com/im. Each Morgan Stanley fund also files a complete schedule of portfolio holdings with the SEC for the fund's first and third fiscal quarters on Form N-Q. Morgan Stanley does not deliver the reports for the first and third fiscal quarters to shareholders, nor are the reports posted to the Morgan Stanley public website. You may, however, obtain the Form N-Q filings (as well as the Form N-CSR and N-CSRS filings) by accessing the SEC's website, www.sec.gov. You may also review and copy them at the SEC's Public Reference Room in Washington, DC. Information on the operation of the SEC's Public Reference Room may be obtained by calling the SEC toll free at 1 (800) SEC-0330. You can also request copies of these materials, upon payment of a duplicating fee, by electronic request at the SEC's email address (publicinfo@sec.gov) or by writing the Public Reference Room of the SEC, Washington, DC 20549-0102.
Proxy Voting Policies and Procedures and Proxy Voting Record
You may obtain a copy of the Fund's Proxy Voting Policy and Procedures and information regarding how the Fund voted proxies relating to portfolio securities during the most recent twelve-month period ended June 30, without charge, upon request, by calling toll free 1 (800) 548-7786 or by visiting our website at www.morganstanley.com/im. This information is also available on the SEC's website at www.sec.gov.
This report is authorized for distribution only when preceded or accompanied by a prospectus of Morgan Stanley Institutional Fund, Inc. which describes in detail each Investment Portfolio's investment policies, risks, fees and expenses. Please read the prospectus carefully before you invest or send money. For additional information, including information regarding the investments comprising the Portfolio, please visit our website at www.morganstanley.com/im or call toll free 1 (800) 548-7786.
32
Printed in U.S.A.
This Report has been prepared for shareholders and may be distributed to others only if preceded or accompanied by a current prospectus.
Morgan Stanley Investment Management Inc.
522 Fifth Avenue
New York, New York 10036
© 2014 Morgan Stanley. Morgan Stanley Distribution, Inc.

IFIAEANN
809004 EXP 2.28.15

Morgan Stanley Institutional Fund, Inc.
International Small Cap Portfolio
Annual Report
December 31, 2013

Morgan Stanley Institutional Fund, Inc.
Annual Report — December 31, 2013
Shareholders' Letter | | | 2 | | |
Expense Example | | | 3 | | |
Investment Overview | | | 4 | | |
Portfolio of Investments | | | 6 | | |
Statement of Assets and Liabilities | | | 7 | | |
Statement of Operations | | | 8 | | |
Statements of Changes in Net Assets | | | 9 | | |
Financial Highlights | | | 11 | | |
Notes to Financial Statements | | | 14 | | |
Report of Independent Registered Public Accounting Firm | | | 21 | | |
Federal Tax Notice | | | 22 | | |
U.S. Privacy Policy | | | 23 | | |
Director and Officer Information | | | 26 | | |
This report is authorized for distribution only when preceded or accompanied by prospectuses of the Morgan Stanley Institutional Fund, Inc. To receive a prospectus and/or statement of additional information (SAI), which contains more complete information such as investment objectives, charges, expenses, policies for voting proxies, risk considerations, and describes in detail each of the Portfolio's investment policies to the prospective investor, please call toll free 1 (800) 548-7786. Please read the prospectuses carefully before you invest or send money.
Additionally, you can access portfolio information including performance, characteristics, and investment team commentary through Morgan Stanley Investment Management's website: www.morganstanley.com/im.
Market forecasts provided in this report may not necessarily come to pass. There is no guarantee that any sectors mentioned will continue to perform as discussed herein or that securities in such sectors will be held by the Portfolio in the future. There is no assurance that a Portfolio will achieve its investment objective. Portfolios are subject to market risk, which is the possibility that market values of securities owned by the Portfolio will decline and, therefore, the value of the Portfolio's shares may be less than what you paid for them. Accordingly, you can lose money investing in the Portfolio. Please see the prospectus for more complete information on investment risks.
1
Morgan Stanley Institutional Fund, Inc.
Annual Report — December 31, 2013
Shareholders' Letter (unaudited)
Dear Shareholders,
We are pleased to provide this Annual report, in which you will learn how your investment in International Small Cap Portfolio (the "Portfolio") performed during the latest twelve-month period.
Morgan Stanley Investment Management is a client-centric, investor-led organization. Our global presence, intellectual capital, and breadth of products and services enable us to partner with investors to meet the evolving challenges of today's financial markets. We aim to deliver superior investment service and to empower our clients to make the informed decisions that help them reach their investment goals.
As always, we thank you for selecting Morgan Stanley Investment Management, and look forward to working with you in the months and years ahead.
Sincerely,

John H. Gernon
President and Principal Executive Officer
January 2014
2
Morgan Stanley Institutional Fund, Inc.
Annual Report — December 31, 2013
Expense Example (unaudited)
International Small Cap Portfolio
As a shareholder of the Portfolio, you incur two types of costs: (1) transactional costs, including redemptions fees; and (2) ongoing costs, including advisory fees, administration fees, distribution and shareholder services fees and other Portfolio expenses. This example is intended to help you understand your ongoing costs (in dollars) of investing in the Portfolio and to compare these costs with the ongoing costs of investing in other mutual funds.
This example is based on an investment of $1,000 invested at the beginning of the six-month period ended December 31, 2013 and held for the entire six-month period.
Actual Expenses
The table below provides information about actual account values and actual expenses. You may use the information in this table, together with the amount you invested, to estimate the expenses that you paid over the period. Simply divide your account value by $1,000 (for example, an $8,600 account value divided by $1,000 = 8.6), then multiply the result by the number in the table under the heading entitled "Actual Expenses Paid During Period" to estimate the expenses you paid on your account during this period.
Hypothetical Example for Comparison Purposes
The table below provides information about hypothetical account values and hypothetical expenses based on the Portfolio's actual expense ratio and an assumed rate of return of 5% per year before expenses, which is not the Portfolio's actual return. The hypothetical account values and expenses may not be used to estimate the actual ending account balance or expenses you paid for the period. You may use this information to compare the ongoing costs of investing in the Portfolio and other funds. To do so, compare this 5% hypothetical example with the 5% hypothetical examples that appear in the shareholder reports of the other funds.
Please note that the expenses shown in the table are meant to highlight your ongoing costs only and do not reflect any transactional costs, such as sales charges (loads) and redemption fees. Therefore, the information for each class in the table is useful in comparing ongoing costs only, and will not help you determine the relative total costs of owning different funds. In addition, if these transactional costs were included, your costs would have been higher.
| | | Beginning
Account
Value
7/1/13 | | Actual Ending
Account
Value
12/31/13 | | Hypothetical
Ending Account
Value | | Actual
Expenses
Paid
During
Period* | | Hypothetical
Expenses Paid
During Period* | | Net
Expense
Ratio
During
Period** | |
International Small Cap Portfolio Class I | | $ | 1,000.00 | | | $ | 1,194.60 | | | $ | 1,019.41 | | | $ | 6.36 | | | $ | 5.85 | | | | 1.15 | % | |
International Small Cap Portfolio Class A@ | | | 1,000.00 | | | | 1,193.00 | | | | 1,017.80 | | | | 8.13 | | | | 7.48 | | | | 1.47 | | |
International Small Cap Portfolio Class L | | | 1,000.00 | | | | 1,189.80 | | | | 1,015.32 | | | | 10.82 | | | | 9.96 | | | | 1.96 | | |
@ Effective September 9, 2013, Class P and Class H shares were renamed Class A shares.
* Expenses are calculated using each Portfolio Class' annualized net expense ratio (as disclosed), multiplied by the average account value over the period, and multiplied by 184/365 (to reflect the most recent one-half year period).
** Annualized.
3
Morgan Stanley Institutional Fund, Inc.
Annual Report — December 31, 2013
Investment Overview (unaudited)
International Small Cap Portfolio
The International Small Cap Portfolio seeks long-term capital appreciation by investing primarily in equity securities of small non-U.S. companies.
Performance
For the year ended December 31, 2013, the Portfolio had a total return based on net asset value and reinvestment of distributions per share of 25.75%, net of fees, for Class I shares. The Portfolio's Class I shares underperformed against its benchmark, the Morgan Stanley Capital International (MSCI) EAFE Small Cap Total Return Index (the "Index"), which returned 29.30%. Please keep in mind that high double-digit returns are highly unusual and cannot be sustained.
Factors Affecting Performance
• International small-cap equities were up 29.30% in 2013 as measured by the Index. Developed market equities led, with Europe and Japan both rising more than 20% for the year (as measured by the MSCI Europe Index and MSCI Japan Index, respectively). In Europe, turmoil in Italy's elections and a bank bailout in Cyprus triggered volatility in eurozone equities early in the year. But investor sentiment turned more optimistic as Europe exited recession and austerity measures were relaxed, helping eurozone stocks to perform especially well. Japan also returned to economic expansion in 2013. Its stocks rallied strongly as a massive quantitative easing plan announced by the Bank of Japan in April led to depreciation in the yen. By comparison, emerging market equities languished. Uncertainties about a slowdown in China's economy, the negative implications of the expected tapering of U.S. quantitative easing, and pockets of regional and country-specific political conflict were among the factors weighing on investor sentiment for the asset class.
• The Portfolio's relative returns were diminished by stock selection and an underweight position in the industrials sector.
• Stock selection and an underweight position in health care factored into the Portfolio's relative underperformance.
• The Portfolio's lower exposure to the Index's best-performing sector, information technology, had an adverse effect on relative performance.
• Positive contributions from stock selection and an underweight in allocation to the materials sector helped relative performance.
• Stock selection in the financials sector was advantageous, bolstered by strong results from an investment company based in France.
• Beneficial to relative performance was the Portfolio's underweight exposure to the energy sector, which posted a loss and was the weakest-performing sector in the Index during the period.
Management Strategies
• We seek to invest primarily in established and emerging franchise companies on an international basis, with capitalizations within the range of companies included in the MSCI EAFE Small Cap Total Return Index. We emphasize a bottom-up stock selection process, seeking attractive investments on an individual company basis. We look for franchises that we believe have sustainable competitive advantages, which may include characteristics such as strong cash generation, attractive returns on capital, hard-to-replicate assets and a favorable risk/reward.
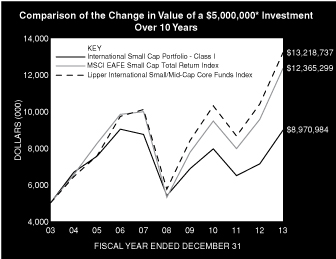
* Minimum Investment for Class I shares
In accordance with SEC regulations, Portfolio's performance shown assumes that all recurring fees (including management fees) were deducted and all dividends and distributions were reinvested. The performance of Class A+ and L shares will vary from Class I shares based upon their different inception dates and will be negatively impacted by additional fees assessed to those classes.
4
Morgan Stanley Institutional Fund, Inc.
Annual Report — December 31, 2013
Investment Overview (unaudited) (cont'd)
International Small Cap Portfolio
Performance Compared to the Morgan Stanley Capital International (MSCI) EAFE Small Cap Total Return Index(1) and the Lipper International Small/Mid-Cap Core Funds Index(2)
| | | Period Ended December 31, 2013
Total Returns(3) | |
| | | | | Average Annual | |
| | | One
Year | | Five
Years | | Ten
Years | | Since
Inception(7) | |
Portfolio — Class I Shares
w/o sales charges(4) | | | 25.75 | % | | | 10.73 | % | | | 6.02 | % | | | 9.14 | % | |
MSCI EAFE Small Cap Total Return
Index | | | 29.30 | | | | 18.50 | | | | 9.48 | | | | 6.66 | | |
Lipper International Small/Mid-Cap
Core Funds Index | | | 26.97 | | | | 18.17 | | | | 10.21 | | | | N/A | | |
Portfolio — Class A+ Shares
w/o sales charges(5) | | | 25.32 | | | | 10.45 | | | | — | | | | 10.36 | | |
Portfolio — Class A+ Shares with
maximum 5.25% sales charges(5) | | | 18.74 | | | | 9.26 | | | | — | | | | 9.23 | | |
MSCI EAFE Small Cap Total Return
Index | | | 29.30 | | | | 18.50 | | | | — | | | | 16.75 | | |
Lipper International Small/Mid-Cap
Core Funds Index | | | 26.97 | | | | 18.17 | | | | — | | | | 17.21 | | |
Portfolio — Class L Shares
w/o sales charges(6) | | | 24.72 | | | | — | | | | — | | | | 11.66 | | |
MSCI EAFE Small Cap Total Return
Index | | | 29.30 | | | | — | | | | — | | | | 20.07 | | |
Lipper International Small/Mid-Cap
Core Funds Index | | | 26.97 | | | | — | | | | — | | | | 18.75 | | |
Performance data quoted represents past performance, which is no guarantee of future results, and current performance may be lower or higher than the figures shown. Performance assumes that all dividends and distributions, if any, were reinvested. For the most recent month-end performance figures, please visit www.morganstanley.com/im. Investment return and principal value will fluctuate so that Portfolio shares, when redeemed, may be worth more or less than their original cost. Total returns do not reflect the deduction of taxes that a shareholder would pay on Portfolio distributions or the redemption of Portfolio shares. Performance of share classes will vary due to difference in expenses.
+ Effective September 9, 2013, Class P shares were renamed Class A shares.
(1) The Morgan Stanley Capital International (MSCI) EAFE Small Cap Total Return Index is an unmanaged, market value weighted average of the performance of over 900 securities of companies listed on the stock exchanges of countries in Europe, Australasia and the Far East, including price performance and income from dividend payments. The MSCI EAFE Small Cap Total Return Index commenced as of January 31, 2002. Returns, including periods prior to January 31, 2002, are calculated using the return data of the MSCI EAFE Small Cap Index through January 30, 2002 and the return data of the MSCI EAFE Small Cap Total Return Index since January 31, 2002. The Index is unmanaged and its returns do not include any sales charges or fees. Such costs would lower performance. It is not possible to invest directly in an index.
(2) The Lipper International Small/Mid-Cap Core Funds Index is an equally weighted performance index of the largest qualifying funds (based on net assets) in the Lipper International Small/Mid-Cap Core Funds classification. The Index, which is adjusted for capital gains distributions and income dividends, is unmanaged and should not be considered an investment. There are currently 10 funds represented in this Index. As of the date of this report, the Portfolio was in the Lipper International Small/Mid-Cap Core Funds classification.
(3) Total returns for the Portfolio reflect fees waived and expenses reimbursed, if applicable, by the Adviser. Without such waivers and reimbursements, total returns would have been lower. The fee waivers and/or expense reimbursements
will continue for at least one year or until such time as the Fund's Board of Directors acts to discontinue all or a portion of such waivers and/or expense reimbursements when it deems that such action is appropriate.
(4) Commenced operations on December 15, 1992.
(5) Commenced offering on October 21, 2008.
(6) Commenced offering on April 27, 2012.
(7) For comparative purposes, average annual since inception returns listed for the Indexes refer to the inception date or initial offering of the respective share class of the Portfolio, not the inception of the Index.
Portfolio Composition
Classification | | Percentage of
Total Investments | |
Other* | | | 38.7 | % | |
Hotels, Restaurants & Leisure | | | 15.7 | | |
Specialty Retail | | | 10.3 | | |
Diversified Financial Services | | | 10.2 | | |
Beverages | | | 7.1 | | |
Textiles, Apparel & Luxury Goods | | | 6.5 | | |
Machinery | | | 5.9 | | |
Capital Markets | | | 5.6 | | |
Total Investments | | | 100.0 | % | |
* Industries and/or investment types representing less than 5% of total investments.
5
Morgan Stanley Institutional Fund, Inc.
Annual Report — December 31, 2013
Portfolio of Investments
International Small Cap Portfolio
| | | Shares | | Value
(000) | |
Common Stocks (99.0%) | |
Australia (1.5%) | |
Infomedia Ltd. | | | 2,009,626 | | | $ | 1,062 | | |
Lynas Corp., Ltd. (a) | | | 905,042 | | | | 239 | | |
| | | | 1,301 | | |
Brazil (14.8%) | |
Cremer SA | | | 325,661 | | | | 2,161 | | |
Fleury SA | | | 145,777 | | | | 1,137 | | |
GAEC Educacao SA (a) | | | 242,801 | | | | 2,182 | | |
JHSF Participacoes SA | | | 1,300,825 | | | | 2,349 | | |
Porto Seguro SA | | | 126,097 | | | | 1,590 | | |
Prumo Logistica SA (a) | | | 2,852,293 | | | | 1,306 | | |
Restoque Comercio e Confeccoes de Roupas SA | | | 361,159 | | | | 918 | | |
Tegma Gestao Logistica | | | 177,969 | | | | 1,358 | | |
| | | | 13,001 | | |
Canada (6.7%) | |
Big Rock Brewery, Inc. | | | 55,698 | | | | 917 | | |
Sears Canada, Inc. | | | 119,402 | | | | 1,461 | | |
Second Cup Ltd. (The) | | | 742,996 | | | | 3,463 | | |
| | | | 5,841 | | |
China (0.2%) | |
Autohome, Inc. ADR (a) | | | 4,372 | | | | 160 | | |
France (14.3%) | |
Eurazeo SA | | | 113,745 | | | | 8,916 | | |
Faiveley Transport SA | | | 32,466 | | | | 2,341 | | |
Laurent-Perrier | | | 14,669 | | | | 1,302 | | |
| | | | 12,559 | | |
Germany (3.5%) | |
Draegerwerk AG & Co., KGaA (Preference) | | | 11,942 | | | | 1,559 | | |
Washtec AG | | | 102,503 | | | | 1,509 | | |
| | | | 3,068 | | |
Greece (4.1%) | |
Titan Cement Co., SA (a) | | | 75,203 | | | | 2,049 | | |
Titan Cement Co., SA (Preference) (a) | | | 123,969 | | | | 1,514 | | |
| | | | 3,563 | | |
Hong Kong (5.4%) | |
China High Precision Automation
Group Ltd. (a)(b)(c) | | | 3,968,000 | | | | 141 | | |
L'Occitane International SA | | | 1,907,250 | | | | 4,059 | | |
Louis XIII Holdings Ltd. | | | 546,350 | | | | 550 | | |
| | | | 4,750 | | |
Ireland (3.6%) | |
C&C Group PLC | | | 325,253 | | | | 1,902 | | |
Mincon Group PLC (a) | | | 999,687 | | | | 1,302 | | |
| | | | 3,204 | | |
Italy (15.8%) | |
Autogrill SpA (a) | | | 479,747 | | | | 4,052 | | |
Brunello Cucinelli SpA | | | 33,803 | | | | 1,201 | | |
Moncler SpA (a) | | | 83,051 | | | | 1,805 | | |
Tamburi Investment Partners SpA | | | 1,565,127 | | | | 4,931 | | |
World Duty Free SpA (a) | | | 152,980 | | | | 1,924 | | |
| | | | 13,913 | | |
| | | Shares | | Value
(000) | |
Japan (3.6%) | |
Milbon Co., Ltd. | | | 80,760 | | | $ | 3,159 | | |
Netherlands (1.7%) | |
Delta Lloyd N.V. | | | 60,075 | | | | 1,491 | | |
Norway (1.8%) | |
Veripos, Inc. | | | 262,292 | | | | 1,613 | | |
Portugal (0.4%) | |
CTT-Correios de Portugal SA (a) | | | 49,138 | | | | 378 | | |
Romania (0.8%) | |
Societatea Nationala de Gaze Naturale
ROMGAZ SA GDR (a)(d) | | | 66,460 | | | | 674 | | |
Singapore (6.5%) | |
Mandarin Oriental International Ltd. | | | 3,416,000 | | | | 5,705 | | |
South Africa (0.4%) | |
Taste Holdings Ltd. | | | 1,077,398 | | | | 385 | | |
Spain (2.4%) | |
Baron de Ley (a) | | | 25,996 | | | | 2,110 | | |
Sweden (3.5%) | |
Byggmax Group AB | | | 219,714 | | | | 1,653 | | |
Mekonomen AB | | | 45,400 | | | | 1,398 | | |
| | | | 3,051 | | |
United Arab Emirates (2.2%) | |
Aramex PJSC | | | 2,313,391 | | | | 1,915 | | |
United Kingdom (3.9%) | |
Anglo-Eastern Plantations | | | 103,303 | | | | 1,151 | | |
Mulberry Group PLC | | | 112,834 | | | | 1,784 | | |
Ocado Group PLC (a) | | | 65,072 | | | | 476 | | |
| | | | 3,411 | | |
United States (1.9%) | |
Fox Factory Holding Corp. (a) | | | 94,644 | | | | 1,667 | | |
Total Common Stocks (Cost $81,847) | | | 86,919 | | |
Short-Term Investment (0.8%) | |
Investment Company (0.8%) | |
Morgan Stanley Institutional Liquidity
Funds — Money Market Portfolio —
Institutional Class (See Note G)
(Cost $663) | | | 663,085 | | | | 663 | | |
Total Investments (99.8%) (Cost $82,510) | | | 87,582 | | |
Other Assets in Excess of Liabilities (0.2%) | | | 168 | | |
Net Assets (100.0%) | | $ | 87,750 | | |
(a) Non-income producing security.
(b) Security has been deemed illiquid at December 31, 2013.
(c) At December 31, 2013, the Portfolio held a fair valued security valued at approximately $141,000, representing 0.2% of net assets. This security has been fair valued as determined in good faith under procedures established by and under the general supervision of the Fund's Directors.
(d) 144A security — Certain conditions for public sale may exist. Unless otherwise noted, these securities are deemed to be liquid.
ADR American Depositary Receipt.
GDR Global Depositary Receipt.
PJSC Public Joint Stock Company.
The accompanying notes are an integral part of the financial statements.
6
Morgan Stanley Institutional Fund, Inc.
Annual Report — December 31, 2013
International Small Cap Portfolio
Statement of Assets and Liabilities | | December 31, 2013
(000) | |
Assets: | |
Investments in Securities of Unaffiliated Issuers, at Value (Cost $81,847) | | $ | 86,919 | | |
Investment in Security of Affiliated Issuer, at Value (Cost $663) | | | 663 | | |
Total Investments in Securities, at Value (Cost $82,510) | | | 87,582 | | |
Foreign Currency, at Value (Cost $19) | | | 19 | | |
Cash | | | 400 | | |
Dividends Receivable | | | 87 | | |
Tax Reclaim Receivable | | | 4 | | |
Receivable for Investments Sold | | | — | @ | |
Receivable from Affiliate | | | — | @ | |
Other Assets | | | 16 | | |
Total Assets | | | 88,108 | | |
Liabilities: | |
Payable for Advisory Fees | | | 158 | | |
Payable for Investments Purchased | | | 74 | | |
Payable for Sub Transfer Agency Fees | | | 40 | | |
Payable for Sub Transfer Agency Fees — Class I | | | 27 | | |
Payable for Sub Transfer Agency Fees — Class A* | | | 2 | | |
Payable for Custodian Fees | | | 14 | | |
Payable for Directors' Fees and Expenses | | | 12 | | |
Payable for Administration Fees | | | 6 | | |
Payable for Professional Fees | | | 3 | | |
Payable for Transfer Agent Fees — Class I | | | 1 | | |
Payable for Transfer Agent Fees — Class A* | | | — | @ | |
Payable for Transfer Agent Fees — Class L | | | — | @ | |
Payable for Shareholder Services Fees — Class A* | | | — | @ | |
Payable for Distribution and Shareholder Services Fees — Class L | | | — | @ | |
Other Liabilities | | | 21 | | |
Total Liabilities | | | 358 | | |
Net Assets | | $ | 87,750 | | |
Net Assets Consist Of: | |
Paid-in-Capital | | $ | 196,733 | | |
Distributions in Excess of Net Investment Income | | | (646 | ) | |
Accumulated Net Realized Loss | | | (113,405 | ) | |
Unrealized Appreciation (Depreciation) on: | |
Investments | | | 5,072 | | |
Foreign Currency Translations | | | (4 | ) | |
Net Assets | | $ | 87,750 | | |
CLASS I: | |
Net Assets | | $ | 87,532 | | |
| Shares Outstanding $0.001 par value shares of beneficial interest (500,000,000 shares authorized) (not in 000's) | | | 6,262,140 | | |
Net Asset Value, Offering and Redemption Price Per Share | | $ | 13.98 | | |
CLASS A*: | |
Net Assets | | $ | 90 | | |
| Shares Outstanding $0.001 par value shares of beneficial interest (500,000,000 shares authorized) (not in 000's) | | | 5,987 | | |
Net Asset Value, Redemption Price Per Share | | $ | 14.99 | | |
Maximum Sales Load§§ | | | 5.25 | % | |
Maximum Sales Charge | | $ | 0.83 | | |
Maximum Offering Price Per Share | | $ | 15.82 | | |
CLASS L: | |
Net Assets | | $ | 128 | | |
| Shares Outstanding $0.001 par value shares of beneficial interest (500,000,000 shares authorized) (not in 000's) | | | 9,259 | | |
Net Asset Value, Offering and Redemption Price Per Share | | $ | 13.81 | | |
* Effective September 9, 2013, Class P and Class H shares were renamed Class A shares.
@ Amount is less than $500.
§§ Effective February 25, 2013, the Directors approved the imposition of a maximum initial sales charge of 5.25% on purchases of Class A shares of the Portfolio.
The accompanying notes are an integral part of the financial statements.
7
Morgan Stanley Institutional Fund, Inc.
Annual Report — December 31, 2013
International Small Cap Portfolio
Statement of Operations | | Year Ended
December 31, 2013
(000) | |
Investment Income: | |
Dividends from Securities of Unaffiliated Issuers (Net of $454 of Foreign Taxes Withheld) | | $ | 3,428 | | |
Dividends from Security of Affiliated Issuer (Note G) | | | 1 | | |
Total Investment Income | | | 3,429 | | |
Expenses: | |
Advisory Fees (Note B) | | | 904 | | |
Custodian Fees (Note F) | | | 87 | | |
Professional Fees | | | 85 | | |
Administration Fees (Note C) | | | 76 | | |
Sub Transfer Agency Fees | | | 38 | | |
Sub Transfer Agency Fees — Class I | | | 28 | | |
Sub Transfer Agency Fees — Class A* | | | 2 | | |
Registration Fees | | | 45 | | |
Shareholder Reporting Fees | | | 20 | | |
Transfer Agency Fees (Note E) | | | 9 | | |
Transfer Agency Fees — Class I (Note E) | | | 1 | | |
Transfer Agency Fees — Class A* (Note E) | | | — | @ | |
Transfer Agency Fees — Class L (Note E) | | | — | @ | |
Pricing Fees | | | 5 | | |
Directors' Fees and Expenses | | | 3 | | |
Shareholder Services Fees — Class A* (Note D) | | | — | @ | |
Distribution and Shareholder Services Fees — Class L (Note D) | | | — | @ | |
Other Expenses | | | 20 | | |
Total Expenses | | | 1,323 | | |
Waiver of Advisory Fees (Note B) | | | (196 | ) | |
Reimbursement of Class Specific Expenses — Class I (Note B) | | | (29 | ) | |
Reimbursement of Class Specific Expenses — Class A* (Note B) | | | (2 | ) | |
Reimbursement of Class Specific Expenses — Class L (Note B) | | | (— | @) | |
Rebate from Morgan Stanley Affiliate (Note G) | | | (2 | ) | |
Net Expenses | | | 1,094 | | |
Net Investment Income | | | 2,335 | | |
Realized Gain (Loss): | |
Investments Sold | | | 16,836 | | |
Foreign Currency Transactions | | | (47 | ) | |
Net Realized Gain | | | 16,789 | | |
Change in Unrealized Appreciation (Depreciation): | |
Investments | | | 2,966 | | |
Foreign Currency Translations | | | (93 | ) | |
Net Change in Unrealized Appreciation (Depreciation) | | | 2,873 | | |
Net Realized Gain and Change in Unrealized Appreciation (Depreciation) | | | 19,662 | | |
Net Increase in Net Assets Resulting from Operations | | $ | 21,997 | | |
* Effective September 9, 2013, Class P and Class H shares were renamed Class A shares.
@ Amount is less than $500.
The accompanying notes are an integral part of the financial statements.
8
Morgan Stanley Institutional Fund, Inc.
Annual Report — December 31, 2013
International Small Cap Portfolio
Statements of Changes in Net Assets | | Year Ended
December 31,
2013
(000) | | Year Ended
December 31,
2012
(000) | |
Increase (Decrease) in Net Assets: | |
Operations: | |
Net Investment Income | | $ | 2,335 | | | $ | 4,056 | | |
Net Realized Gain (Loss) | | | 16,789 | | | | (52,795 | ) | |
Net Change in Unrealized Appreciation (Depreciation) | | | 2,873 | | | | 71,560 | | |
Net Increase in Net Assets Resulting from Operations | | | 21,997 | | | | 22,821 | | |
Distributions from and/or in Excess of: | |
Class I: | |
Net Investment Income | | | (7,185 | ) | | | (2,527 | ) | |
Class A*: | |
Net Investment Income | | | (2 | ) | | | — | | |
Class H@@@: | |
Net Investment Income | | | (1 | )** | | | (— | @)*** | |
Class L: | |
Net Investment Income | | | (4 | ) | | | (— | @)*** | |
Total Distributions | | | (7,192 | ) | | | (2,527 | ) | |
Capital Share Transactions:(1) | |
Class I: | |
Subscribed | | | 486 | | | | 12,736 | | |
Distributions Reinvested | | | 2,292 | | | | 1,574 | | |
Redeemed | | | (52,364 | ) | | | (127,267 | ) | |
Class A*: | |
Subscribed | | | 96 | | | | 140 | | |
Distributions Reinvested | | | 2 | | | | — | | |
Conversion from Class H | | | 10 | | | | — | | |
Redeemed | | | (1,122 | ) | | | (80,196 | ) | |
Class H@@@: | |
Subscribed | | | 100 | ** | | | 10 | *** | |
Conversion to Class A | | | (10 | )** | | | — | | |
Redeemed | | | (103 | )** | | | — | | |
Class L: | |
Subscribed | | | 100 | | | | 10 | *** | |
Distributions Reinvested | | | 3 | | | | — | | |
Net Decrease in Net Assets Resulting from Capital Share Transactions | | | (50,510 | ) | | | (192,993 | ) | |
Redemption Fees | | | — | | | | 1 | | |
Total Decrease in Net Assets | | | (35,705 | ) | | | (172,698 | ) | |
Net Assets: | |
Beginning of Period | | | 123,455 | | | | 296,153 | | |
End of Period (Including Undistributed (Distributions in Excess of) Net Investment Income of $(646) and $4,255) | | $ | 87,750 | | | $ | 123,455 | | |
The accompanying notes are an integral part of the financial statements.
9
Morgan Stanley Institutional Fund, Inc.
Annual Report — December 31, 2013
International Small Cap Portfolio
Statements of Changes in Net Assets (cont'd) | | Year Ended
December 31,
2013
(000) | | Year Ended
December 31,
2012
(000) | |
(1) Capital Share Transactions: | |
Class I: | |
Shares Subscribed | | | 37 | | | | 1,087 | | |
Shares Issued on Distributions Reinvested | | | 183 | | | | 138 | | |
Shares Redeemed | | | (4,022 | ) | | | (10,152 | ) | |
Net Decrease in Class I Shares Outstanding | | | (3,802 | ) | | | (8,927 | ) | |
Class A*: | |
Shares Subscribed | | | 6 | | | | 12 | | |
Shares Issued on Distributions Reinvested | | | — | @@ | | | — | | |
Conversion from Class H | | | 1 | | | | — | | |
Shares Redeemed | | | (85 | ) | | | (7,268 | ) | |
Net Decrease in Class A* Shares Outstanding | | | (78 | ) | | | (7,256 | ) | |
Class H@@@: | |
Shares Subscribed | | | 8 | ** | | | 1 | *** | |
Conversion to Class A | | | (1 | )** | | | — | | |
Shares Redeemed | | | (8 | )** | | | — | | |
Net Increase (Decrease) in Class H Shares Outstanding | | | (1 | ) | | | 1 | | |
Class L: | |
Shares Subscribed | | | 8 | | | | 1 | *** | |
Shares Issued on Distributions Reinvested | | | — | @@ | | | — | | |
Net Increase in Class L Shares Outstanding | | | 8 | | | | 1 | | |
@ Amount is less than $500.
@@ Amount is less than 500 shares.
@@@ Effective September 9, 2013, Class H shares converted into Class A shares.
* Effective September 9, 2013, Class P shares were renamed Class A shares.
** For the period January 1, 2013 through September 6, 2013.
*** For the period April 27, 2012 to December 31, 2012.
The accompanying notes are an integral part of the financial statements.
10
Morgan Stanley Institutional Fund, Inc.
Annual Report — December 31, 2013
Financial Highlights
International Small Cap Portfolio
| | | Class I | |
| | | Year Ended December 31, | |
Selected Per Share Data and Ratios | | 2013 | | 2012 | | 2011 | | 2010 | | 2009 | |
Net Asset Value, Beginning of Period | | $ | 12.16 | | | $ | 11.27 | | | $ | 13.80 | | | $ | 11.97 | | | $ | 9.53 | | |
Income (Loss) from Investment Operations: | |
Net Investment Income† | | | 0.32 | | | | 0.24 | | | | 0.18 | | | | 0.11 | | | | 0.14 | | |
Net Realized and Unrealized Gain (Loss) | | | 2.65 | | | | 0.86 | | | | (2.71 | ) | | | 1.76 | | | | 2.47 | | |
Total from Investment Operations | | | 2.97 | | | | 1.10 | | | | (2.53 | ) | | | 1.87 | | | | 2.61 | | |
Distributions from and/or in Excess of: | |
Net Investment Income | | | (1.15 | ) | | | (0.21 | ) | | | — | | | | (0.04 | ) | | | (0.17 | ) | |
Redemption Fees | | | — | | | | 0.00 | ‡ | | | 0.00 | ‡ | | | 0.00 | ‡ | | | 0.00 | ‡ | |
Net Asset Value, End of Period | | $ | 13.98 | | | $ | 12.16 | | | $ | 11.27 | | | $ | 13.80 | | | $ | 11.97 | | |
Total Return++ | | | 25.75 | % | | | 9.90 | % | | | (18.33 | )% | | | 15.72 | % | | | 27.45 | % | |
Ratios and Supplemental Data: | |
Net Assets, End of Period (Thousands) | | $ | 87,532 | | | $ | 122,402 | | | $ | 213,983 | | | $ | 320,362 | | | $ | 349,589 | | |
Ratio of Expenses to Average Net Assets (1) | | | 1.15 | %+ | | | 1.15 | %+ | | | 1.15 | %+†† | | | 1.15 | %+†† | | | 1.14 | %+ | |
Ratio of Expenses to Average Net Assets Excluding Non Operating Expenses | | | N/A | | | | 1.15 | %+ | | | N/A | | | | 1.15 | %+†† | | | 1.14 | %+ | |
Ratio of Net Investment Income to Average Net Assets (1) | | | 2.46 | %+ | | | 1.97 | %+ | | | 1.33 | %+†† | | | 0.87 | %+†† | | | 1.31 | %+ | |
Ratio of Rebate from Morgan Stanley Affiliates to Average Net Assets | | | 0.00 | %§ | | | 0.00 | %§ | | | 0.00 | %††§ | | | 0.00 | %††§ | | | 0.00 | %§ | |
Portfolio Turnover Rate | | | 33 | % | | | 114 | % | | | 64 | % | | | 66 | % | | | 127 | % | |
(1) Supplemental Information on the Ratios to Average Net Assets: | |
Ratios Before Expense Limitation: | |
Expenses to Average Net Assets | | | 1.39 | % | | | 1.28 | % | | | 1.19 | %†† | | | 1.18 | %+†† | | | N/A | | |
Net Investment Income to Average Net Assets | | | 2.22 | % | | | 1.84 | % | | | 1.29 | %†† | | | 0.84 | %+†† | | | N/A | | |
† Per share amount is based on average shares outstanding.
‡ Amount is less than $0.005 per share.
++ Calculated based on the net asset value as of the last business day of the period.
+ The Ratios of Expenses and Net Investment Income reflect the rebate of certain Portfolio expenses in connection with the investments in Morgan Stanley affiliates during the period. The effect of the rebate on the ratios is disclosed in the above table as "Ratio of Rebate from Morgan Stanley Affiliates to Average Net Assets."
†† Reflects overall Portfolio ratios for investment income and non-class specific expenses.
§ Amount is less than 0.005%.
The accompanying notes are an integral part of the financial statements.
11
Morgan Stanley Institutional Fund, Inc.
Annual Report — December 31, 2013
Financial Highlights
International Small Cap Portfolio
| | | Class A^ | |
| | | Year Ended December 31, | |
Selected Per Share Data and Ratios | | 2013 | | 2012 | | 2011 | | 2010 | | 2009 | |
Net Asset Value, Beginning of Period | | $ | 12.28 | | | $ | 11.19 | | | $ | 13.74 | | | $ | 11.95 | | | $ | 9.53 | | |
Income (Loss) from Investment Operations: | |
Net Investment Income (Loss)† | | | (0.02 | ) | | | 0.25 | | | | 0.14 | | | | 0.07 | | | | 0.01 | | |
Net Realized and Unrealized Gain (Loss) | | | 3.12 | | | | 0.84 | | | | (2.69 | ) | | | 1.76 | | | | 2.57 | | |
Total from Investment Operations | | | 3.10 | | | | 1.09 | | | | (2.55 | ) | | | 1.83 | | | | 2.58 | | |
Distributions from and/or in Excess of: | |
Net Investment Income | | | (0.39 | ) | | | — | | | | — | | | | (0.04 | ) | | | (0.16 | ) | |
Redemption Fees | | | — | | | | 0.00 | ‡ | | | 0.00 | ‡ | | | 0.00 | ‡ | | | 0.00 | ‡ | |
Net Asset Value, End of Period | | $ | 14.99 | | | $ | 12.28 | | | $ | 11.19 | | | $ | 13.74 | | | $ | 11.95 | | |
Total Return++ | | | 25.32 | % | | | 9.74 | % | | | (18.56 | )% | | | 15.41 | % | | | 27.14 | % | |
Ratios and Supplemental Data: | |
Net Assets, End of Period (Thousands) | | $ | 90 | | | $ | 1,034 | | | $ | 82,170 | | | $ | 101,074 | | | $ | 63,326 | | |
Ratio of Expenses to Average Net Assets (1) | | | 1.41 | %+^^ | | | 1.40 | %+ | | | 1.40 | %+††** | | | 1.40 | %+††** | | | 1.37 | %+** | |
Ratio of Expenses to Average Net Assets Excluding Non Operating Expenses | | | N/A | | | | 1.40 | %+ | | | N/A | | | | 1.40 | %+††** | | | 1.37 | %+** | |
Ratio of Net Investment Income (Loss) to Average Net Assets (1) | | | (0.14 | )%+ | | | 2.05 | %+ | | | 1.08 | %+†† | | | 0.62 | %+†† | | | 0.12 | %+ | |
Ratio of Rebate from Morgan Stanley Affiliates to Average Net Assets§ | | | 0.00 | %§ | | | 0.00 | %§ | | | 0.00 | %††§ | | | 0.00 | %††§ | | | 0.00 | %§ | |
Portfolio Turnover Rate | | | 33 | % | | | 114 | % | | | 64 | % | | | 66 | % | | | 127 | % | |
(1) Supplemental Information on the Ratios to Average Net Assets: | |
Ratios Before Expense Limitation: | |
Expenses to Average Net Assets | | | 3.69 | % | | | 1.47 | % | | | 1.44 | %†† | | | 1.43 | %+†† | | | N/A | | |
Net Investment Income (Loss) to Average Net Assets | | | (2.42 | )% | | | 1.98 | % | | | 1.04 | %†† | | | 0.59 | %+†† | | | N/A | | |
^ Effective September 9, 2013, Class P and Class H shares were renamed Class A shares.
† Per share amount is based on average shares outstanding.
‡ Amount is less than $0.005 per share.
++ Calculated based on the net asset value which does not reflect sales charges, if applicable, as of the last business day of the period.
+ The Ratios of Expenses and Net Investment Income (Loss) reflect the rebate of certain Portfolio expenses in connection with the investments in Morgan Stanley affiliates during the period. The effect of the rebate on the ratios is disclosed in the above table as "Ratio of Rebate from Morgan Stanley Affiliates to Average Net Assets."
^^ Effective September 16, 2013, the Adviser has agreed to limit the ratio of expenses to average net assets to the maximum ratio of 1.50% for Class A Shares. Prior to September 16, 2013, the maximum ratio was 1.40% for Class A Shares.
†† Reflects overall Portfolio ratios for investment income and non-class specific expenses.
** Ratios of Expenses to Average Net Assets for Class A may vary by more than the shareholder servicing fees due to fluctuations in daily net asset amounts.
§ Amount is less than 0.005%.
The accompanying notes are an integral part of the financial statements.
12
Morgan Stanley Institutional Fund, Inc.
Annual Report — December 31, 2013
Financial Highlights
International Small Cap Portfolio
| | | Class L | |
Selected Per Share Data and Ratios | | Year Ended
December 31,
2013 | | Period from
April 27, 2012^ to
December 31, 2012 | |
Net Asset Value, Beginning of Period | | $ | 12.02 | | | $ | 12.69 | | |
Income (Loss) from Investment Operations: | |
Net Investment Income† | | | 0.29 | | | | 0.10 | | |
Net Realized and Unrealized Gain (Loss) | | | 2.54 | | | | (0.56 | ) | |
Total from Investment Operations | | | 2.83 | | | | (0.46 | ) | |
Distributions from and/or in Excess of: | |
Net Investment Income | | | (1.04 | ) | | | (0.21 | ) | |
Net Asset Value, End of Period | | $ | 13.81 | | | $ | 12.02 | | |
Total Return++ | | | 24.72 | % | | | (3.50 | )%# | |
Ratios and Supplemental Data: | |
Net Assets, End of Period (Thousands) | | $ | 128 | | | $ | 9 | | |
Ratio of Expenses to Average Net Assets (1) | | | 1.96 | %+^^ | | | 1.90 | %+* | |
Ratio of Expenses to Average Net Assets Excluding Non Operating Expenses | | | N/A | | | | 1.89 | %+* | |
Ratio of Net Investment Income to Average Net Assets (1) | | | 2.23 | %+ | | | 1.36 | %+* | |
Ratio of Rebate from Morgan Stanley Affiliates to Average Net Assets | | | 0.00 | %§ | | | 0.01 | %* | |
Portfolio Turnover Rate | | | 33 | % | | | 114 | %# | |
(1) Supplemental Information on the Ratios to Average Net Assets: | |
Ratios Before Expense Limitation: | |
Expenses to Average Net Assets | | | 2.73 | % | | | 2.13 | %* | |
Net Investment Income to Average Net Assets | | | 1.46 | % | | | 1.13 | %* | |
^ Commencement of Operations.
† Per share amount is based on average shares outstanding.
++ Calculated based on the net asset value as of the last business day of the period.
+ The Ratios of Expenses and Net Investment Income reflect the rebate of certain Portfolio expenses in connection with the investments in Morgan Stanley affiliates during the period. The effect of the rebate on the ratios is disclosed in the above table as "Ratio of Rebate from Morgan Stanley Affiliates to Average Net Assets."
^^ Effective September 16, 2013, the Adviser has agreed to limit the ratio of expenses to average net assets to the maximum ratio of 2.00% for Class L shares. Prior to September 16, 2013, the maximum ratio was 1.90% for Class L shares.
§ Amount is less than 0.005%.
# Not Annualized.
* Annualized.
The accompanying notes are an integral part of the financial statements.
13
Morgan Stanley Institutional Fund, Inc.
Annual Report — December 31, 2013
Notes to Financial Statements
Morgan Stanley Institutional Fund, Inc. (the "Fund") is registered under the Investment Company Act of 1940, as amended (the "Act"), as an open-end management investment company. The Fund is comprised of twenty-seven separate, active, diversified and non-diversified portfolios (individually referred to as a "Portfolio", collectively as the "Portfolios").
The accompanying financial statements relate to the International Small Cap Portfolio. The Portfolio seeks long-term capital appreciation by investing primarily in equity securities of small non-U.S. companies. The Portfolio offers three classes of shares — Class I, Class A and Class L.
Effective September 9, 2013, Class P and Class H shares were renamed Class A shares.
A. Significant Accounting Policies: The following significant accounting policies are in conformity with U.S. generally accepted accounting principles ("GAAP"). Such policies are consistently followed by the Fund in the preparation of its financial statements. GAAP may require management to make estimates and assumptions that affect the reported amounts and disclosures in the financial statements. Actual results may differ from those estimates.
1. Security Valuation: (1) An equity portfolio security listed or traded on an exchange is valued at its latest reported sales price (or at the exchange official closing price if such exchange reports an official closing price), if there were no sales on a given day, the security is valued at the mean between the last reported bid and asked prices; (2) all other equity portfolio securities for which over-the-counter market quotations are readily available are valued at its latest reported sales price. In cases where a security is traded on more than one exchange, the security is valued on the exchange designated as the primary market; (3) when market quotations are not readily available, including circumstances under which Morgan Stanley Investment Management Inc. (the "Adviser") determines that the closing price, last sale price or the mean between the last reported bid and asked prices are not reflective of a security's market value, portfolio securities are valued at their fair value as determined in good faith under procedures established by and under the general supervision of the Fund's Board of Directors (the "Directors"). Occasionally, developments affecting the closing prices of securities and other assets may occur between the times at which valuations of such securities are determined (that is, close of the foreign market on which the securities trade) and the close of business of the New York Stock Exchange
("NYSE"). If developments occur during such periods that are expected to materially affect the value of such securities, such valuations may be adjusted to reflect the estimated fair value of such securities as of the close of the NYSE, as determined in good faith by the Directors or by the Adviser using a pricing service and/or procedures approved by the Directors; (4) quotations of foreign portfolio securities, other assets and liabilities and forward contracts stated in foreign currency are translated into U.S. dollar equivalents at the prevailing market rates prior to the close of the NYSE; (5) investments in mutual funds, including the Morgan Stanley Institutional Liquidity Funds, are valued at the net asset value as of the close of each business day; and (6) short-term debt securities with remaining maturities of 60 days or less at the time of purchase may be valued at amortized cost, unless the Adviser determines such valuation does not reflect the securities' market value, in which case these securities will be valued at their fair market value determined by the Adviser.
Under procedures approved by the Directors, the Fund's Adviser has formed a Valuation Committee. The Valuation Committee provides administration and oversight of the Fund's valuation policies and procedures, which are reviewed at least annually by the Directors. These procedures allow the Fund to utilize independent pricing services, quotations from securities and financial instrument dealers, and other market sources to determine fair value.
The Fund has procedures to determine the fair value of securities and other financial instruments for which market prices are not readily available. Under these procedures, the Valuation Committee convenes on a regular and ad hoc basis to review such securities and considers a number of factors, including valuation methodologies and significant unobservable valuation inputs, when arriving at fair value. The Valuation Committee may employ a market-based approach which may use related or comparable assets or liabilities, recent transactions, market multiples, book values, and other relevant information for the investment to determine the fair value of the investment. An income-based valuation approach may also be used in which the anticipated future cash flows of the investment are discounted to calculate fair value. Discounts may also be applied due to the nature or duration of any restrictions on the disposition of the investments. Due to the inherent uncertainty of valuations of such investments, the fair values may differ significantly from the values that
14
Morgan Stanley Institutional Fund, Inc.
Annual Report — December 31, 2013
Notes to Financial Statements (cont'd)
would have been used had an active market existed. The Valuation Committee employs various methods for calibrating these valuation approaches including a regular review of valuation methodologies, key inputs and assumptions, transactional back-testing or disposition analysis, and reviews of any related market activity.
2. Fair Value Measurement: Financial Accounting Standards Board ("FASB") Accounting Standards CodificationTM ("ASC") 820, "Fair Value Measurements and Disclosures" ("ASC 820"), defines fair value as the value that the Fund would receive to sell an investment or pay to transfer a liability in a timely transaction with an independent buyer in the principal market, or in the absence of a principal market the most advantageous market for the investment or liability. ASC 820 establishes a three-tier hierarchy to distinguish between (1) inputs that reflect the assumptions market participants would use in valuing an asset or liability developed based on market data obtained from sources independent of the reporting entity (observable inputs) and (2) inputs that reflect the reporting entity's own assumptions about the assumptions market participants would use in valuing an asset or liability developed based on the best information available in the circumstances (unobservable inputs) and to establish classification of fair value measurements for disclosure purposes. Various inputs are used in determining the value of the Fund's investments. The inputs are summarized in the three broad levels listed below.
• Level 1 – unadjusted quoted prices in active markets for identical investments
• Level 2 – other significant observable inputs (including quoted prices for similar investments, interest rates, prepayment speeds, credit risk, etc.)
• Level 3 – significant unobservable inputs including the Fund's own assumptions in determining the fair value of investments. Factors considered in making this determination may include, but are not limited to, information obtained by contacting the issuer, analysts, or the appropriate stock exchange (for exchange-traded securities), analysis of the issuer's financial statements or other available documents and, if necessary, available information concerning other securities in similar circumstances
The inputs or methodology used for valuing securities are not necessarily an indication of the risk associated with investing in those securities and the determination of the significance of a particular input to the fair value measurement in its entirety requires judgment and considers factors specific to each security.
The following is a summary of the inputs used to value the Portfolio's investments as of December 31, 2013.
Investment Type | | Level 1
Unadjusted
quoted
prices
(000) | | Level 2
Other
significant
observable
inputs
(000) | | Level 3
Significant
unobservable
inputs
(000) | | Total
(000) | |
Assets: | |
Common Stocks | |
Air Freight & Logistics | | $ | 2,293 | | | $ | — | | | $ | — | | | $ | 2,293 | | |
Auto Components | | | 1,667 | | | | — | | | | — | | | | 1,667 | | |
Beverages | | | 6,231 | | | | — | | | | — | | | | 6,231 | | |
Capital Markets | | | 4,931 | | | | — | | | | — | | | | 4,931 | | |
Construction Materials | | | 3,563 | | | | — | | | | — | | | | 3,563 | | |
Distributors | | | 385 | | | | — | | | | — | | | | 385 | | |
Diversified Consumer
Services | | | 2,182 | | | | — | | | | — | | | | 2,182 | | |
Diversified Financial
Services | | | 8,916 | | | | — | | | | — | | | | 8,916 | | |
Electronic Equipment,
Instruments &
Components | | | — | | | | — | | | | 141 | | | | 141 | | |
Food Products | | | 1,151 | | | | — | | | | — | | | | 1,151 | | |
Health Care Equipment &
Supplies | | | 3,720 | | | | — | | | | — | | | | 3,720 | | |
Health Care Providers &
Services | | | 1,137 | | | | — | | | | — | | | | 1,137 | | |
Hotels, Restaurants &
Leisure | | | 13,770 | | | | — | | | | — | | | | 13,770 | | |
Insurance | | | 3,081 | | | | — | | | | — | | | | 3,081 | | |
Internet & Catalog Retail | | | 476 | | | | — | | | | — | | | | 476 | | |
Internet Software &
Services | | | 160 | | | | — | | | | — | | | | 160 | | |
Machinery | | | 5,152 | | | | — | | | | — | | | | 5,152 | | |
Metals & Mining | | | 239 | | | | — | | | | — | | | | 239 | | |
Multi-line Retail | | | 1,461 | | | | — | | | | — | | | | 1,461 | | |
Oil, Gas & Consumable
Fuels | | | — | | | | 674 | | | | — | | | | 674 | | |
Personal Products | | | 3,159 | | | | — | | | | — | | | | 3,159 | | |
Real Estate Management &
Development | | | 2,349 | | | | — | | | | — | | | | 2,349 | | |
Road & Rail | | | 1,358 | | | | — | | | | — | | | | 1,358 | | |
Software | | | 1,062 | | | | — | | | | — | | | | 1,062 | | |
Specialty Retail | | | 9,034 | | | | — | | | | — | | | | 9,034 | | |
Textiles, Apparel & Luxury
Goods | | | 5,708 | | | | — | | | | — | | | | 5,708 | | |
Transportation
Infrastructure | | | 2,919 | | | | — | | | | — | | | | 2,919 | | |
Total Common Stocks | | | 86,104 | | | | 674 | | | | 141 | | | | 86,919 | | |
Short-Term Investment | |
Investment Company | | | 663 | | | | — | | | | — | | | | 663 | | |
Total Assets | | $ | 86,767 | | | $ | 674 | | | $ | 141 | | | $ | 87,582 | | |
15
Morgan Stanley Institutional Fund, Inc.
Annual Report — December 31, 2013
Notes to Financial Statements (cont'd)
Transfers between investment levels may occur as the markets fluctuate and/or the availability of data used in an investment's valuation changes. The Portfolio recognizes transfers between the levels as of the end of the period. As of December 31, 2013, securities with a total value of approximately $57,664,000 transferred from Level 2 to Level 1. At December 31, 2012, the fair value of certain securities were adjusted due to developments which occurred between the time of the close of the foreign markets on which they trade and the close of business on the NYSE which resulted in their Level 2 classification.
Following is a reconciliation of investments in which significant unobservable inputs (Level 3) were used in determining fair value.
| | | Common
Stock
(000) | |
Beginning Balance | | $ | 318 | | |
Purchases | | | — | | |
Sales | | | — | | |
Amortization of discount | | | — | | |
Transfers in | | | — | | |
Transfers out | | | — | | |
Change in unrealized appreciation/depreciation | | | (177 | ) | |
Realized gains (losses) | | | — | | |
Ending Balance | | $ | 141 | | |
Net change in unrealized appreciation/depreciation from investments
still held as of December 31, 2013 | | $ | (177 | ) | |
The following table presents additional information about valuation techniques and inputs used for investments that are measured at fair value and categorized within Level 3 as of December 31, 2013.
| | | Fair Value at
December 31, 2013
(000) | | Valuation
Technique | | Unobservable
Input | | Range | | Weighted
Average | | Impact to
Valuation from an
Increase in Input | |
Electronic Equipment,
Instruments & Components | |
Common Stock | | $ | 141 | | | Asset Approach | | Net Tangible Assets | | $ | 0.30 | | | $ | 0.30 | | | $ | 0.30 | | | Increase | |
| | | | | | | Discount for Lack
of Marketability | | | 40.0 | % | | | 40.0 | % | | | 40.0 | % | | Decrease | |
| | | | | | | Discount for Company
Size vs. Index | | | 25.0 | % | | | 25.0 | % | | | 25.0 | % | | Decrease | |
| | | | | Market Approach | | Price/Earnings | | | 9.3 | x | | | 9.3 | x | | | 9.3 | x | | Increase | |
| | | | | | | Discount for Lack of
Marketability | | | 40.0 | % | | | 40.0 | % | | | 40.0 | % | | Decrease | |
| | | | | | | Discount for Company
Size vs. Index | | | 25.0 | % | | | 25.0 | % | | | 25.0 | % | | Decrease | |
| | | | | Income Approach | | Cost of Equity | | | 18.0 | % | | | 18.0 | % | | | 18.0 | % | | Decrease | |
| | | | | | | Discount for Lack
of Marketability | | | 40.0 | % | | | 40.0 | % | | | 40.0 | % | | Decrease | |
| | | | | | | Discount for Company
Size vs. Index | | | 25.0 | % | | | 25.0 | % | | | 25.0 | % | | Decrease | |
3. Foreign Currency Translation and Foreign Investments: The books and records of the Portfolio are maintained in U.S. dollars. Foreign currency amounts are translated into U.S. dollars as follows:
– investments, other assets and liabilities at the prevailing rate of exchange on the valuation date;
– investment transactions and investment income at the prevailing rates of exchange on the dates of such transactions.
Although the net assets of the Portfolio are presented at the foreign exchange rates and market values at the close of the period, the Portfolio does not isolate that portion of the results of operations arising as a result of changes in the foreign exchange rates from the fluctuations arising from changes in the market prices of securities held at period end. Similarly, the Portfolio does not isolate the effect of changes in foreign exchange rates from the fluctuations arising from changes in the market prices of securities sold during the period. Accordingly, realized and unrealized foreign currency gains (losses) on
16
Morgan Stanley Institutional Fund, Inc.
Annual Report — December 31, 2013
Notes to Financial Statements (cont'd)
investments in securities are included in the reported net realized and unrealized gains (losses) on investment transactions and balances. However, pursuant to U.S. Federal income tax regulations, gains and losses from certain foreign currency transactions and the foreign currency portion of gains and losses realized on sales and maturities of foreign denominated debt securities are treated as ordinary income for U.S. Federal income tax purposes.
Net realized gains (losses) on foreign currency transactions represent net foreign exchange gains (losses) from foreign currency forward exchange contracts, disposition of foreign currencies, currency gains (losses) realized between the trade and settlement dates on securities transactions, and the difference between the amount of investment income and foreign withholding taxes recorded on the Portfolio's books and the U.S. dollar equivalent amounts actually received or paid. Net unrealized currency gains (losses) from valuing foreign currency denominated assets and liabilities at period end exchange rates are reflected as a component of unrealized appreciation (depreciation) on the Statement of Assets and Liabilities. The change in unrealized currency gains (losses) on foreign currency translations for the period is reflected in the Statement of Operations.
Foreign security and currency transactions may involve certain considerations and risks not typically associated with those of U.S. dollar denominated transactions as a result of, among other factors, fluctuations of exchange rates in relation to the U.S. dollar, the possibility of lower levels of governmental supervision and regulation of foreign securities markets and the possibility of political or economic instability.
The net assets of the Portfolio include foreign denominated securities and currency. Changes in currency exchange rates will affect the U.S. Dollar value of and investment income from such securities.
Governmental approval for foreign investments may be required in advance of making an investment under certain circumstances in some countries, and the extent of foreign investments in domestic companies may be subject to limitation in other countries. Foreign ownership limitations also may be imposed by the charters of individual companies to prevent, among other concerns, violations of foreign investment limitations. As a result, an additional class of shares (identified as "Foreign" in the
Portfolio of Investments) may be created and offered for investment. The "local" and "foreign shares" market values may differ. In the absence of trading of the foreign shares in such markets, the Portfolio values the foreign shares at the closing exchange price of the local shares.
4. Redemption Fees: The Portfolio will assess a 2% redemption fee, on Class I shares, Class A shares and Class L shares, which is paid directly to the Portfolio, for shares redeemed or exchanged within thirty days of purchase, subject to certain exceptions. The redemption fee is designed to protect the Portfolio and its remaining shareholders from the effects of short-term trading. These fees, if any, are included in the Statements of Changes in Net Assets.
5. Indemnifications: The Fund enters into contracts that contain a variety of indemnifications. The Fund's maximum exposure under these arrangements is unknown. However, the Fund has not had prior claims or losses pursuant to these contracts and expects the risk of loss to be remote.
6. Dividends and Distributions to Shareholders: Dividend income and distributions to shareholders are recorded on the ex-dividend date. Dividends from net investment income, if any, are declared and paid semiannually. Net realized capital gains, if any, are distributed at least annually.
7. Security Transactions, Income and Expenses: Security transactions are accounted for on the trade date (date the order to buy or sell is executed). Realized gains and losses on the sale of investment securities are determined on the specific identified cost method. Dividend income and other distributions are recorded on the ex-dividend date (except for certain foreign dividends which may be recorded as soon as the Portfolio is informed of such dividends) net of applicable withholding taxes. Interest income is recognized on the accrual basis except where collection is in doubt. Discounts are accreted and premiums are amortized over the life of the respective securities. Most expenses of the Fund can be directly attributed to a particular Portfolio. Expenses which cannot be directly attributed are apportioned among the Portfolios based upon relative net assets or other appropriate methods. Income, expenses (other than class specific expenses — distribution, transfer agency and sub transfer agency fees) and realized and unrealized gains or losses are allocated to each class of shares based upon their relative net assets.
17
Morgan Stanley Institutional Fund, Inc.
Annual Report — December 31, 2013
Notes to Financial Statements (cont'd)
B. Advisory Fees: The Adviser, a wholly-owned subsidiary of Morgan Stanley, provides the Portfolio with advisory services under the terms of an Investment Advisory Agreement, paid quarterly, at the annual rate based on the average daily net assets as follows:
First $1.5
billion | | Over $1.5
billion | |
| | 0.95 | % | | | 0.90 | % | |
For the year ended December 31, 2013, the advisory fee rate (net of waivers/rebate) was equivalent to an annual effective rate of 0.74% of the Portfolio's daily net assets.
The Adviser has agreed to reduce its advisory fee and/or reimburse the Portfolio so that total annual portfolio operating expenses, excluding certain investment related expenses, taxes, interest and other extraordinary expenses (including litigation), will not exceed 1.15% for Class I shares, 1.40% for Class A shares and 1.90% for Class L shares. Effective September 16, 2013, the Adviser has agreed to limit the ratio of the expenses to average net assets to the maximum ratio of 1.50% and 2.00% for Class A and Class L shares, respectively. The fee waivers and/or expense reimbursements will continue for at least one year or until such time that the Directors act to discontinue all or a portion of such waivers and/or reimbursements when it deems such action is appropriate. For the year ended December 31, 2013, approximately $196,000 of advisory fees were waived and approximately $31,000 of other expenses were reimbursed by the Adviser pursuant to this arrangement.
C. Administration Fees: The Adviser also serves as Administrator to the Fund and provides administrative services pursuant to an Administration Agreement for an annual fee, accrued daily and paid monthly, of 0.08% of the Portfolio's average daily net assets. Under a Sub-Administration Agreement between the Administrator and State Street Bank and Trust Company ("State Street"), State Street provides certain administrative services to the Fund. For such services, the Administrator pays State Street a portion of the fee the Administrator receives from the Portfolio.
D. Distribution and Shareholder Services Fees: Morgan Stanley Distribution, Inc. ("MSDI" or the "Distributor"), a wholly-owned subsidiary of the Adviser, and an indirect subsidiary of Morgan Stanley, serves as the Fund's Distributor of Portfolio shares pursuant to a Distribution Agreement. The Fund has adopted a Shareholder Services Plan with respect to Class A shares pursuant to Rule 12b-1 under the Act. Under the Shareholder Services Plan, the Portfolio
pays the Distributor a shareholder services fee, accrued daily and paid monthly, at an annual rate of 0.25% of the Portfolio's average daily net assets attributable to Class A shares.
The Fund has adopted a Distribution and Shareholder Services Plan with respect to Class L shares pursuant to Rule 12b-1 under the Act. Under the Distribution and Shareholder Services Plan, the Portfolio pays the Distributor a distribution fee, accrued daily and paid monthly, at an annual rate of 0.50% and a shareholder services fee, accrued daily and paid monthly, at an annual rate of 0.25% of the Portfolio's average daily net assets attributable to Class L shares.
The distribution and shareholder services fees are used to support the expenses associated with servicing and maintaining accounts. The Distributor may compensate other parties for providing shareholder support services to investors who purchase Class A and Class L shares.
E. Dividend Disbursing and Transfer Agent: The Fund's dividend disbursing and transfer agent was Morgan Stanley Services Company Inc. ("Morgan Stanley Services"). Pursuant to a Transfer Agency Agreement, the Fund paid Morgan Stanley Services a fee based on the number of classes, accounts and transactions relating to the Portfolios of the Fund. Effective July 1, 2013, the Directors approved changing the transfer agent to Boston Financial Data Services, Inc.
F. Custodian Fees: State Street (the "Custodian") serves as Custodian for the Fund in accordance with a Custodian Agreement. The Custodian holds cash, securities, and other assets of the Fund as required by the Act. Custody fees are payable monthly based on assets held in custody, investment purchases and sales activity and account maintenance fees, plus reimbursement for certain out-of-pocket expenses.
G. Security Transactions and Transactions with Affiliates: For the year ended December 31, 2013, purchases and sales of investment securities for the Portfolio, other than long-term U.S. Government securities and short-term investments, were approximately $31,190,000 and $88,522,000, respectively. There were no purchases and sales of long-term U.S. Government securities for the year ended December 31, 2013.
The Portfolio invests in the Institutional Class of the Morgan Stanley Institutional Liquidity Funds — Money Market Portfolio (the "Liquidity Funds"), an open-end management investment company managed by the Adviser. Advisory fees paid by the Portfolio are reduced by an amount equal to its pro-rata share of the advisory and administration fees paid by
18
Morgan Stanley Institutional Fund, Inc.
Annual Report — December 31, 2013
Notes to Financial Statements (cont'd)
the Portfolio due to its investment in the Liquidity Funds. For the year ended December 31, 2013, advisory fees paid were reduced by approximately $2,000 relating to the Portfolio's investment in the Liquidity Funds.
A summary of the Portfolio's transactions in shares of the Liquidity Funds during the year ended December 31, 2013 is as follows:
Value
December 31,
2012
(000) | | Purchases
at Cost
(000) | | Sales
(000) | | Dividend
Income
(000) | | Value
December 31,
2013
(000) | |
| | — | | | $ | 46,735 | | | $ | 46,072 | | | $ | 1 | | | $ | 663 | | |
During the year ended December 31, 2013, the Portfolio incurred approximately $3,000 in brokerage commissions with Morgan Stanley & Co., LLC, an affiliate of the Adviser, Administrator and Distributor, for portfolio transactions executed on behalf of the Portfolio.
From January 1, 2013 to June 30, 2013, the Portfolio incurred approximately $3,000 in brokerage commissions with Citigroup, Inc., and its affiliated broker-dealers, which may be deemed affiliates of the Adviser, Administrator and Distributor under Section 17 of the Act, for portfolio transactions executed on behalf of the Portfolio. Citigroup, Inc. and its affiliated broker-dealers ceased to be affiliates of the Portfolio pursuant to Section 17 of the Act as of July 1, 2013.
H. Federal Income Taxes: It is the Portfolio's intention to continue to qualify as a regulated investment company and distribute all of its taxable and tax-exempt income. Accordingly, no provision for Federal income taxes is required in the financial statements.
The Portfolio may be subject to taxes imposed by countries in which it invests. Such taxes are generally based on income and/or capital gains earned or repatriated. Taxes are accrued based on net investment income, net realized gains and net unrealized appreciation as such income and/or gains are earned. Taxes may also be based on transactions in foreign currency and are accrued based on the value of investments denominated in such currency.
FASB ASC 740-10, Income Taxes — Overall, sets forth a minimum threshold for financial statement recognition of the benefit of a tax position taken or expected to be taken in a tax return. Management has concluded there are no significant uncertain tax positions that would require recognition in the financial statements. If applicable, the Portfolio recognizes interest accrued related to unrecognized tax benefits in "Interest Expense" and penalties in "Other Expenses" in the Statement of
Operations. The Portfolio files tax returns with the U.S. Internal Revenue Service, New York and various states. Each of the tax years in the four-year period ended December 31, 2013, remains subject to examination by taxing authorities.
The tax character of distributions paid may differ from the character of distributions shown in the Statements of Changes in Net Assets due to short-term capital gains being treated as ordinary income for tax purposes. The tax character of distributions paid during fiscal years 2013 and 2012 was as follows:
2013
Distributions
Paid From: | | 2012
Distributions
Paid From: | |
Ordinary
Income
(000) | | Long-Term
Capital Gain
(000) | | Ordinary
Income
(000) | | Long-Term
Capital Gain
(000) | |
| $ | 7,192 | | | | — | | | $ | 2,527 | | | | — | | |
The amount and character of income and gains to be distributed are determined in accordance with income tax regulations which may differ from GAAP. These book/tax differences are either considered temporary or permanent in nature.
Temporary differences are attributable to differing book and tax treatments for the timing of the recognition of gains (losses) on certain investment transactions and the timing of the deductibility of certain expenses.
Permanent differences, primarily due to differing treatments of gains (losses) related to foreign currency transactions and basis adjustments on certain equity securities designated as passive foreign investment companies, resulted in the following reclassifications among the components of net assets at December 31, 2013:
Distributions
in Excess of
Net Investment
Income
(000) | | Accumulated
Net Realized
Loss
(000) | | Paid-in-
Capital
(000) | |
| $ | (44 | ) | | $ | 44 | | | | — | | |
At December 31, 2013, the components of distributable earnings for the Portfolio on a tax basis were as follows:
Undistributed
Ordinary
Income
(000) | | Undistributed
Long-Term
Capital Gain
(000) | |
| $ | 1,263 | | | | — | | |
At December 31, 2013, the aggregate cost for Federal income tax purposes is approximately $84,460,000. The aggregate gross unrealized appreciation is approximately $15,157,000 and the aggregate gross unrealized depreciation is approximately $12,035,000 resulting in net unrealized appreciation of approximately $3,122,000.
19
Morgan Stanley Institutional Fund, Inc.
Annual Report — December 31, 2013
Notes to Financial Statements (cont'd)
At December 31, 2013, the Portfolio had available for Federal income tax purposes unused long term capital losses of approximately $47,034,000 that do not have an expiration date.
In addition, at December 31, 2013, the Portfolio had available capital loss carryforwards to offset future net capital gains, to the extent provided by regulations, of approximately $66,323,000, which will expire on December 31, 2017.
To the extent that capital loss carryforwards are used to offset any future capital gains realized during the carryover period as provided by U.S. Federal income tax regulations, no capital gains tax liability will be incurred by the Portfolio for gains realized and not distributed. To the extent that capital gains are offset, such gains will not be distributed to the shareholders. During the year ended December 31, 2013, the Portfolio utilized capital loss carryforwards for U. S. Federal income tax purposes of approximately $16,873,000.
I. Other (unaudited): At December 31, 2013, the Portfolio had otherwise unaffiliated record owners of 10% or greater. Investment activities of these shareholders could have a material impact on the Portfolio. The aggregate percentage of such owners was 80%, 13% and 91%, for Class I, Class A and Class L shares, respectively.
J. Results of Special Shareholder Meeting (unaudited): On June 5, 2013, a Joint Special Shareholder Meeting was held for Class H shareholders of the Portfolio to approve the Articles of Amendment to the Fund's Articles of Amendment and Restatement and a Plan of Reclassification for the Portfolio pursuant to which Class H shares would be reclassified as Class P shares. The results with respect to this proposal were as follows:
| For | | Against | | Abstain | |
| | 782 | | | | 0 | | | | 0 | | |
K. Accounting Pronouncement: In June 2013, FASB issued Accounting Standards Update 2013-08 Financial Services — Investment Companies (Topic 946) — Amendments to the Scope, Measurement, and Disclosure Requirements ("ASU 2013-08") which is effective for interim and annual reporting periods in fiscal years that begin after December 15, 2013. ASU 2013-08 sets forth a methodology for determining whether an entity should be characterized as an investment company and prescribes fair value accounting for an investment company's non-controlling ownership interest in another investment company. FASB has determined that a fund registered under the Investment Company Act of 1940 automatically meets ASU 2013-08's criteria for an investment company. Although still
evaluating the potential impacts of ASU 2013-08 to the Portfolio, management expects that the impact of the Portfolio's adoption will be limited to additional financial statement disclosures.
20
Morgan Stanley Institutional Fund, Inc.
Annual Report — December 31, 2013
Report of Independent Registered Public Accounting Firm
To the Shareholders and Board of Directors of
Morgan Stanley Institutional Fund, Inc. —
International Small Cap Portfolio
We have audited the accompanying statement of assets and liabilities, including the portfolio of investments, of International Small Cap Portfolio (one of the portfolios constituting Morgan Stanley Institutional Fund, Inc.) (the "Portfolio") as of December 31, 2013, and the related statement of operations for the year then ended, the statements of changes in net assets for each of the two years in the period then ended, and the financial highlights for each of the periods indicated therein. These financial statements and financial highlights are the responsibility of the Portfolio's management. Our responsibility is to express an opinion on these financial statements and financial highlights based on our audits.
We conducted our audits in accordance with the standards of the Public Company Accounting Oversight Board (United States). Those standards require that we plan and perform the audit to obtain reasonable assurance about whether the financial statements and financial highlights are free of material misstatement. We were not engaged to perform an audit of the Portfolio's internal control over financial reporting. Our audits included consideration of internal control over financial reporting as a basis for designing audit procedures that are appropriate in the circumstances, but not for the purpose of expressing an opinion on the effectiveness of the Portfolio's internal control over financial reporting. Accordingly, we express no such opinion. An audit also includes examining, on a test basis, evidence supporting the amounts and disclosures in the financial statements and financial highlights, assessing the accounting principles used and significant estimates made by management, and evaluating the overall financial statement presentation. Our procedures included confirmation of securities owned as of December 31, 2013, by correspondence with the custodian and others or by other appropriate auditing procedures where replies from others were not received. We believe that our audits provide a reasonable basis for our opinion.
In our opinion, the financial statements and financial highlights referred to above present fairly, in all material respects, the financial position of International Small Cap Portfolio (one of the portfolios constituting Morgan Stanley Institutional Fund, Inc.) at December 31, 2013, the results of its operations for the year then ended, the changes in its net assets for each of the two years in the period then ended, and the financial highlights for each of the periods indicated therein, in conformity with U.S. generally accepted accounting principles.

Boston, Massachusetts
February 26, 2014
21
Morgan Stanley Institutional Fund, Inc.
Annual Report — December 31, 2013
Federal Tax Notice (unaudited)
For Federal income tax purposes, the following information is furnished with respect to the Portfolio's earnings for its taxable year ended December 31, 2013. When distributed, certain earnings may be subject to a maximum tax rate of 15% as provided for the Jobs and Growth Tax Relief Reconciliation Act of 2003. The Portfolio designated up to a maximum of approximately $7,539,000 as taxable at this lower rate.
During the taxable year ended December 31, 2013, the Portfolio intends to pass through foreign tax credits of approximately $560,000 and has derived net income from sources within foreign countries amounting to approximately $4,595,000.
In January, the Portfolio provides tax information to shareholders for the preceding calendar year.
22
Morgan Stanley Institutional Fund, Inc.
Annual Report — December 31, 2013
U.S. Privacy Policy (unaudited)
AN IMPORTANT NOTICE CONCERNING OUR U.S. PRIVACY POLICY
This privacy notice describes the U.S. privacy policy of Morgan Stanley Distribution, Inc., and the Morgan Stanley family of mutual funds ("us", "our", "we").
We are required by federal law to provide you with notice of our U.S. privacy policy ("Policy"). This Policy applies to both our current and former clients unless we state otherwise and is intended for individual clients who purchase products or receive services from us for personal, family or household purposes. This Policy is not applicable to partnerships, corporations, trusts or other non-individual clients or account holders, nor is this Policy applicable to individuals who are either beneficiaries of a trust for which we serve as trustee or participants in an employee benefit plan administered or advised by us. This Policy is, however, applicable to individuals who select us to be a custodian of securities or assets in individual retirement accounts, 401(k) accounts, or accounts subject to the Uniform Gifts to Minors Act.
This notice sets out our business practices to protect your privacy; how we collect and share personal information about you; and how you can limit our sharing or certain uses by others of this information. We may amend this Policy at any time, and will inform you of any changes to our Policy as required by law.
WE RESPECT YOUR PRIVACY
We appreciate that you have provided us with your personal financial information and understand your concerns about your information. We strive to safeguard the information our clients entrust to us. Protecting the confidentiality and security of client information is an important part of how we conduct our business.
This notice describes what personal information we collect about you, how we collect it, when we may share it with others, and how certain others may use it. It discusses the steps you may take to limit our sharing of certain information about you with our affiliated companies, including, but not limited to our affiliated banking businesses, brokerage firms and credit service affiliates. It also discloses how you may limit our affiliates' use of shared information for marketing purposes.
Throughout this Policy, we refer to the nonpublic information that personally identifies you as "personal information." We also use the term "affiliated company" in this notice. An affiliated company is a company in our family of companies and includes companies with the Morgan Stanley name. These affiliated companies are financial institutions such as broker-dealers, banks, investment advisers and credit card issuers. We refer to any company that is not an affiliated company as a nonaffiliated third party. For purposes of Section 5 of this notice, and your ability to limit certain uses of personal information by our affiliates, this notice applies to the use of personal information by our affiliated companies.
1. WHAT PERSONAL INFORMATION DO WE COLLECT FROM YOU?
We may collect the following types of information about you: (i) information provided by you, including information from applications and other forms we receive from you, (ii) information about your transactions with us or our affiliates, (iii) information about your transactions with nonaffiliated third parties, (iv) information from consumer reporting agencies, (v) information obtained from our websites, and (vi) information obtained from other sources. For example:
• We collect information such as your name, address, e-mail address, telephone/fax numbers, assets, income and investment objectives through applications and other forms you submit to us.
• We may obtain information about account balances, your use of account(s) and the types of products and services you prefer to receive from us through your dealings and transactions with us and other sources.
• We may obtain information about your creditworthiness and credit history from consumer reporting agencies.
• We may collect background information from and through third-party vendors to verify representations you have made and to comply with various regulatory requirements.
2. WHEN DO WE DISCLOSE PERSONAL INFORMATION WE COLLECT ABOUT YOU?
We may disclose personal information we collect about you in each of the categories listed above to affiliated and nonaffiliated third parties.
23
Morgan Stanley Institutional Fund, Inc.
Annual Report — December 31, 2013
U.S. Privacy Policy (unaudited) (cont'd)
a. Information we disclose to affiliated companies.
We may disclose personal information that we collect about you to our affiliated companies to manage your account(s) effectively, to service and process your transactions, and to let you know about products and services offered by us and affiliated companies, to manage our business, and as otherwise required or permitted by law. Offers for products and services from affiliated companies are developed under conditions designed to safeguard your personal information.
b. Information we disclose to third parties.
We may disclose personal information that we collect about you to nonaffiliated third parties to provide marketing services on our behalf or to other financial institutions with whom we have joint marketing agreements. We may also disclose all of the information we collect to other nonaffiliated third parties for our everyday business purposes, such as to process transactions, maintain account(s), respond to court orders and legal investigations, report to credit bureaus, offer our own products and services, protect against fraud, for institutional risk control, to perform services on our behalf, and as otherwise required or permitted by law.
When we share personal information about you with a nonaffiliated third party, they are required to limit their use of personal information about you to the particular purpose for which it was shared and they are not allowed to share personal information about you with others except to fulfill that limited purpose or as may be permitted or required by law.
3. HOW DO WE PROTECT THE SECURITY AND CONFIDENTIALITY OF PERSONAL INFORMATION WE COLLECT ABOUT YOU?
We maintain physical, electronic and procedural security measures that comply with applicable law and regulations to help safeguard the personal information we collect about you. We have internal policies governing the proper handling of client information by employees. Third parties that provide support or marketing services on our behalf may also receive personal information about you, and we require them to adhere to appropriate security standards with respect to such information.
4. HOW CAN YOU LIMIT OUR SHARING CERTAIN PERSONAL INFORMATION ABOUT YOU WITH OUR AFFILIATED COMPANIES FOR ELIGIBILITY DETERMINATION?
By following the opt-out procedures in Section 6 below, you may limit the extent to which we share with our affiliated companies, personal information that was collected to determine your eligibility for products and services such as your credit reports and other information that you have provided to us or that we may obtain from third parties ("eligibility information"). Eligibility information does not include your identification information or personal information pertaining to our transactions or experiences with you. Please note that, even if you direct us not to share eligibility information with our affiliated companies, we may still share your personal information, including eligibility information, with our affiliated companies under circumstances that are permitted under applicable law, such as to process transactions or to service your account.
5. HOW CAN YOU LIMIT THE USE OF CERTAIN PERSONAL INFORMATION ABOUT YOU BY OUR AFFILIATED COMPANIES FOR MARKETING?
By following the opt-out instructions in Section 6 below, you may limit our affiliated companies from marketing their products or services to you based on personal information we disclose to them. This information may include, for example, your income and account history with us. Please note that, even if you choose to limit our affiliated companies from using personal information about you that we may share with them for marketing their products and services to you, our affiliated companies may use your personal information that they obtain from us to market to you in circumstances permitted by law, such as if the affiliated party has its own relationship with you.
24
Morgan Stanley Institutional Fund, Inc.
Annual Report — December 31, 2013
U.S. Privacy Policy (unaudited) (cont'd)
6. HOW CAN YOU SEND US AN OPT-OUT INSTRUCTION?
If you wish to limit our sharing of eligibility information about you with our affiliated companies, or our affiliated companies' use of personal information for marketing purposes, as described in this notice, you may do so by:
• Calling us at (800) 548-7786
Monday–Friday between 8a.m. and 5p.m. (EST)
• Writing to us at the following address:
Boston Financial Data Services, Inc.
c/o Privacy Coordinator
P.O. Box 219804
Kansas City, Missouri 64121
If you choose to write to us, your request should include: your name, address, telephone number and account number(s) to which the opt-out applies and whether you are opting out with respect to sharing of eligibility information (Section 4 above), or information used for marketing (Section 5 above), or both. Written opt-out requests should not be sent with any other correspondence. In order to process your request, we require that the request be provided by you directly and not through a third party. Once you have informed us about your privacy preferences, your opt-out preference will remain in effect with respect to this Policy (as it may be amended) until you notify us otherwise. If you are a joint account owner, we will accept instructions from any one of you and apply those instructions to the entire account.
Please understand that if you limit our sharing or our affiliated companies' use of personal information, you and any joint account holder(s) may not receive information about our affiliated companies' products and services, including products or services that could help you manage your financial resources and achieve your investment objectives.
If you have more than one account or relationship with us, please specify the accounts to which you would like us to apply your privacy choices. If you have accounts or relationships with our affiliates, you may receive multiple privacy policies from them, and will need to separately notify those companies of your privacy choices for those accounts or relationships.
7. WHAT IF AN AFFILIATED COMPANY BECOMES A NONAFFILIATED THIRD PARTY?
If, at any time in the future, an affiliated company becomes a nonaffiliated third party, further disclosures of personal information made to the former affiliated company will be limited to those described in Section 2(b) above relating to nonaffiliated third parties. If you elected under Section 6 to limit disclosures we make to affiliated companies, or use of personal information by affiliated companies, your election will not apply to use by any former affiliated company of your personal information in their possession once it becomes a nonaffiliated third party.
SPECIAL NOTICE TO RESIDENTS OF VERMONT
The following section supplements our Policy with respect to our individual clients who have a Vermont address and supersedes anything to the contrary in the above Policy with respect to those clients only.
The State of Vermont requires financial institutions to obtain your consent prior to sharing personal information that they collect about you with nonaffiliated third parties, or eligibility information with affiliated companies, other than in certain limited circumstances. Except as permitted by law, we will not share personal information we collect about you with nonaffiliated third parties or eligibility information with affiliated companies, unless you provide us with your written consent to share such information.
SPECIAL NOTICE TO RESIDENTS OF CALIFORNIA
The following section supplements our Policy with respect to our individual clients who have a California address and supersedes anything to the contrary in the above Policy with respect to those clients only.
In response to a California law, if your account has a California home address, your personal information will not be disclosed to nonaffiliated third parties except as permitted by applicable California law, and we will limit sharing such personal information with our affiliates to comply with California privacy laws that apply to us.
25
Morgan Stanley Institutional Fund, Inc.
Annual Report — December 31, 2013
Director and Officer Information (unaudited)
Independent Director:
Name, Age and Address of
Independent Director | | Position(s)
Held with
Registrant | | Length of Time
Served* | | Principal Occupation(s) During Past 5 Years | | Number of
Portfolios in
Fund Complex
Overseen by
Independent
Director** | | Other Directorships
Held by Independent
Director*** | |
Frank L. Bowman (69)
c/o Kramer Levin Naftalis &
Frankel LLP
Counsel to the Independent
Directors
1177 Avenue of the Americas
New York, NY 10036 | | Director | | Since
August
2006 | | President, Strategic Decisions, LLC (consulting) (since February 2009); Director or Trustee of various Morgan Stanley Funds (since August 2006); Chairperson of the Insurance Sub-Committee of the Compliance and Insurance Committee (since February 2007); served as President and Chief Executive Officer of the Nuclear Energy Institute (policy organization) (February 2005-November 2008); retired as Admiral, U.S. Navy after serving over 38 years on active duty including 8 years as Director of the Naval Nuclear Propulsion Program in the Department of the Navy and the U.S. Department of Energy (1996-2004); served as Chief of Naval Personnel (July 1994-September 1996); and on the Joint Staff as Director of Political Military Affairs (June 1992-July 1994); knighted as Honorary Knight Commander of the Most Excellent Order of the British Empire; awarded the Officier de l'Orde National du Mérite by the French Government; elected to the National Academy of Engineering (2009). | | | 98 | | | Director of BP p.l.c.; Director of Naval and Nuclear Technologies LLP; Director of the Armed Services YMCA of the USA and the U.S. Naval Submarine League; Director of the American Shipbuilding Suppliers Association; Member of the National Security Advisory Council of the Center for U.S. Global Engagement and a member of the CNA Military Advisory Board; Chairman of the Charity J Street Cup Golf; Trustee of Fairhaven United Methodist Church. | |
Michael Bozic (73)
c/o Kramer Levin Naftalis & Frankel LLP
Counsel to the Independent Directors
1177 Avenue of the Americas New York, NY 10036 | | Director | | Since
April
1994 | | Private investor and a member of the advisory board of American Road Group LLC (retail) (since June 2000); Chairperson of the Compliance and Insurance Committee (since October 2006); Director or Trustee of various Morgan Stanley Funds (since April 1994); formerly, Chairperson of the Insurance Committee (July 2006-September 2006); Vice Chairman of Kmart Corporation (December 1998-October 2000); Chairman and Chief Executive Officer of Levitz Furniture Corporation (November 1995-November 1998) and President and Chief Executive Officer of Hills Department Stores (May 1991-July 1995); variously Chairman, Chief Executive Officer, President and Chief Operating Officer (1987-1991) of the Sears Merchandise Group of Sears, Roebuck & Co. | | | 100 | | | Trustee and member of the Hillsdale College Board of Trustees. | |
Kathleen A. Dennis (60)
c/o Kramer Levin Naftalis & Frankel LLP
Counsel to the Independent Directors
1177 Avenue of the Americas New York, NY 10036 | | Director | | Since
August
2006 | | President, Cedarwood Associates (mutual fund and investment management consulting) (since July 2006); Chairperson of the Money Market and Alternatives Sub-Committee of the Investment Committee (since October 2006) and Director or Trustee of various Morgan Stanley Funds (since August 2006); formerly, Senior Managing Director of Victory Capital Management (1993-2006). | | | 98 | | | Director of various non-profit organizations. | |
Dr. Manuel H. Johnson (65)
c/o Johnson Smick
International, Inc.
220 I Street,
NE Suite 200
Washington, D.C. 20002 | | Director | | Since
July
1991 | | Senior Partner, Johnson Smick International, Inc. (consulting firm); Chairperson of the Investment Committee (since October 2006) and Director or Trustee of various Morgan Stanley Funds (since July 1991); Co-Chairman and a founder of the Group of Seven Council (G7C) (international economic commission); formerly, Chairperson of the Audit Committee (July 1991-September 2006); Vice Chairman of the Board of Governors of the Federal Reserve System and Assistant Secretary of the U.S. Treasury. | | | 101 | | | Director of NVR, Inc. (home construction). | |
26
Morgan Stanley Institutional Fund, Inc.
Annual Report — December 31, 2013
Director and Officer Information (unaudited) (cont'd)
Independent Director: (cont'd)
Name, Age and Address of
Independent Director | | Position(s)
Held with
Registrant | | Length of Time
Served* | | Principal Occupation(s) During Past 5 Years | | Number of
Portfolios in
Fund Complex
Overseen by
Independent
Director** | | Other Directorships
Held by Independent
Director*** | |
Joseph J. Kearns (71)
c/o Kearns & Associates LLC PMB754
22631 Pacific Coast Highway
Malibu, CA 90265 | | Director | | Since
August
1994 | | President, Kearns & Associates LLC (investment consulting); Chairperson of the Audit Committee (since October 2006) and Director or Trustee of various Morgan Stanley Funds (since August 1994); formerly, Deputy Chairperson of the Audit Committee (July 2003-September 2006) and Chairperson of the Audit Committee of various Morgan Stanley Funds (since August 1994); CFO of the J. Paul Getty Trust. | | | 101 | | | Director of Electro Rent Corporation (equipment leasing) and The Ford Family Foundation. | |
Michael F. Klein (55)
c/o Kramer Levin Naftalis & Frankel LLP
Counsel to the
Independent Directors
1177 Avenue of the Americas New York, NY 10036 | | Director | | Since
August
2006 | | Managing Director, Aetos Capital, LLC (since March 2000) and Co-President, Aetos Alternatives Management, LLC (since January 2004) and Co-Chief Executive Officer of Aetos Capital LLC (since August 2013); Chairperson of the Fixed Income Sub-Committee of the Investment Committee (since October 2006) and Director or Trustee of various Morgan Stanley Funds (since August 2006); formerly, Managing Director, Morgan Stanley & Co. Inc. and Morgan Stanley Dean Witter Investment Management, President, various Morgan Stanley Funds (June 1998-March 2000) and Principal, Morgan Stanley & Co. Inc. and Morgan Stanley Dean Witter Investment Management (August 1997-December 1999). | | | 98 | | | Director of certain investment funds managed or sponsored by Aetos Capital, LLC. Director of Sanitized AG and Sanitized Marketing AG (specialty chemicals). | |
Michael E. Nugent (77)
522 Fifth Avenue
New York, NY 10036 | | Chairperson
of the
Board and Director | | Chairperson of the Boards since July 2006 and Director since July 1991 | | Chairperson of the Boards of various Morgan Stanley Funds (since July 2006); Chairperson of the Closed-End Fund Committee (since June 2012) and Director or Trustee of various Morgan Stanley Funds (since July 1991); formerly, Chairperson of the Insurance Committee (until July 2006); General Partner, Triumph Capital, L.P. (private investment partnership) (1988-2013). | | | 100 | | | None. | |
W. Allen Reed (66)
c/o Kramer Levin Naftalis & Frankel LLP
Counsel to the Independent
Directors
1177 Avenue of the Americas New York, NY 10036 | | Director | | Since
August
2006 | | Chairperson of the Equity Sub-Committee of the Investment Committee (since October 2006) and Director or Trustee of various Morgan Stanley Funds (since August 2006); formerly, President and CEO of General Motors Asset Management; Chairman and Chief Executive Officer of the GM Trust Bank and Corporate Vice President of General Motors Corporation (August 1994-December 2005). | | | 98 | | | Director of Temple-Inland Industries (packaging and forest products); Director of Legg Mason, Inc. and Director of the Auburn University Foundation. | |
Fergus Reid (81)
c/o Joe Pietryka, Inc.
85 Charles Colman Blvd. Pawling, NY 12564 | | Director | | Since
June
1992 | | Chairman, Joe Pietryka, Inc.; Chairperson of the Governance Committee and Director or Trustee of various Morgan Stanley Funds (since June 1992). | | | 101 | | | Through December 31, 2012, Trustee and Director of certain Investment companies in the JPMorgan Fund Complex. | |
27
Morgan Stanley Institutional Fund, Inc.
Annual Report — December 31, 2013
Director and Officer Information (unaudited) (cont'd)
Interested Director:
Name, Age and Address of
Interested Director | | Position(s)
Held with
Registrant | | Length of
Time Served* | | Principal Occupation(s) During Past 5 Years | | Number of
Portfolios in
Fund Complex
Overseen by
Interested
Director** | | Other Directorships
Held by Interested
Director*** | |
James F. Higgins (66)
One New York Plaza
New York, NY 10004 | | Director | | Since
June
2000 | | Director or Trustee of various Morgan Stanley Funds (since June 2000); Senior Advisor of Morgan Stanley (since August 2000). | | | 99 | | | Formerly, Director of AXA Financial, Inc. and AXA Equitable Life Insurance Company (2002-2011) and Director of AXA MONY Life Insurance Company and AXA MONY Life Insurance Company of America (2004-2011). | |
* Each Director serves an indefinite term, until his or her successor is elected.
** The Fund Complex includes (as of December 31, 2013) all open-end and closed-end funds (including all of their portfolios) advised by Morgan Stanley Investment Management Inc. (the "Adviser") and any funds that have an adviser that is an affiliated person of the Adviser (including, but not limited to, Morgan Stanley AIP GP LP).
*** This includes any directorships at public companies and registered investment companies held by the Director at any time during the past five years.
28
Morgan Stanley Institutional Fund, Inc.
Annual Report — December 31, 2013
Director and Officer Information (unaudited) (cont'd)
Executive Officers:
Name, Age and Address of Executive Officer | | Position(s) Held
with
Registrant | | Length of
Time Served* | | Principal Occupation(s) During Past 5 Years | |
John H. Gernon (50)
522 Fifth Avenue
New York, NY 10036 | | President and Principal Executive Officer—Equity, Fixed Income and AIP Funds | | Since
September
2013 | | President and Principal Executive Officer of the Equity and Fixed Income Funds and the Morgan Stanley AIP Funds (since September 2013) in the Fund Complex. Managing Director of the Adviser. | |
Stefanie V. Chang Yu (47)
522 Fifth Avenue
New York, NY 10036 | | Chief Compliance Officer | | Since
January
2014 | | Managing Director of the Adviser and various entities affiliated with the Adviser; Chief Compliance Officer of various Morgan Stanley Funds and the Adviser (since January 2014); formerly, Vice President of various Morgan Stanley Funds (December 1997-January 2014). | |
Joseph C. Benedetti (48)
522 Fifth Avenue
New York, NY 10036 | | Vice President | | Since
January
2014 | | Managing Director of the Adviser and various entities affiliated with the Adviser; Vice President of various Morgan Stanley Funds (since January 2014); formerly, Assistant Secretary of various Morgan Stanley Funds (October 2004-January 2014). | |
Francis J. Smith (48)
522 Fifth Avenue
New York, NY 10036 | | Treasurer and Principal Financial Officer | | Treasurer since July 2003 and Principal Financial Officer since September 2002 | | Executive Director of the Adviser and various entities affiliated with the Adviser; Treasurer and Principal Financial Officer of various Morgan Stanley Funds (since July 2003). | |
Mary E. Mullin (46)
522 Fifth Avenue
New York, NY 10036 | | Secretary | | Since
June
1999 | | Executive Director of the Adviser and various entities affiliated with the Adviser; Secretary of various Morgan Stanley Funds (since June 1999). | |
* Each officer serves an indefinite term, until his or her successor is elected.
29
Morgan Stanley Institutional Fund, Inc.
Annual Report — December 31, 2013
Adviser and Administrator
Morgan Stanley Investment Management Inc.
522 Fifth Avenue
New York, New York 10036
Distributor
Morgan Stanley Distribution, Inc.
522 Fifth Avenue
New York, New York 10036
Dividend Disbursing and Transfer Agent
Boston Financial Data Services, Inc.
2000 Crown Colony Drive
Quincy, Massachusetts 02169
Custodian
State Street Bank and Trust Company
One Lincoln Street
Boston, Massachusetts 02111
Legal Counsel
Dechert LLP
1095 Avenue of the Americas
New York, New York 10036
Counsel to the Independent Directors
Kramer Levin Naftalis & Frankel LLP
1177 Avenue of the Americas
New York, New York 10036
Independent Registered Public Accounting Firm
Ernst & Young LLP
200 Clarendon Street
Boston, Massachusetts 02116
Reporting to Shareholders
Each Morgan Stanley fund provides a complete schedule of portfolio holdings in its semi-annual and annual reports within 60 days of the end of the fund's second and fourth fiscal quarters by filing the schedule electronically with the Securities and Exchange Commission (SEC). The semi-annual reports are filed on Form N-CSRS and the annual reports are filed on Form N-CSR. Morgan Stanley also delivers the semi-annual and annual reports to fund shareholders and makes these reports available on its public website, www.morganstanley.com/im. Each Morgan Stanley fund also files a complete schedule of portfolio holdings with the SEC for the fund's first and third fiscal quarters on Form N-Q. Morgan Stanley does not deliver the reports for the first and third fiscal quarters to shareholders, nor are the reports posted to the Morgan Stanley public website. You may, however, obtain the Form N-Q filings (as well as the Form N-CSR and N-CSRS filings) by accessing the SEC's website, www.sec.gov. You may also review and copy them at the SEC's Public Reference Room in Washington, DC. Information on the operation of the SEC's Public Reference Room may be obtained by calling the SEC toll free at 1 (800) SEC-0330. You can also request copies of these materials, upon payment of a duplicating fee, by electronic request at the SEC's email address (publicinfo@sec.gov) or by writing the Public Reference Room of the SEC, Washington, DC 20549-0102.
Proxy Voting Policies and Procedures and Proxy Voting Record
You may obtain a copy of the Fund's Proxy Voting Policy and Procedures and information regarding how the Fund voted proxies relating to portfolio securities during the most recent twelve-month period ended June 30, without charge, upon request, by calling toll free 1 (800) 548-7786 or by visiting our website at www.morganstanley.com/im. This information is also available on the SEC's website at www.sec.gov.
This report is authorized for distribution only when preceded or accompanied by a prospectus of the Morgan Stanley Institutional Fund, Inc. which describes in detail each Investment Portfolio's investment policies, risks, fees and expenses. Please read the prospectus carefully before you invest or send money. For additional information, including information regarding the investments comprising the Portfolio, please visit our website at www.morganstanley.com/im or call toll free 1 (800) 548-7786.
30
(This Page has been left blank intentionally.)
(This Page has been left blank intentionally.)
(This Page has been left blank intentionally.)
Printed in U.S.A.
This Report has been prepared for shareholders and may be distributed to others only if preceded or accompanied by a current prospectus.
Morgan Stanley Investment Management Inc.
522 Fifth Avenue
New York, New York 10036
© 2014 Morgan Stanley. Morgan Stanley Distribution, Inc.

IFIISCANN
809949 EXP 2.28.15

Morgan Stanley Institutional Fund, Inc.
International Opportunity Portfolio
Annual Report
December 31, 2013

Morgan Stanley Institutional Fund, Inc.
Annual Report — December 31, 2013
Shareholders' Letter | | | 2 | | |
Expense Example | | | 3 | | |
Investment Overview | | | 4 | | |
Portfolio of Investments | | | 6 | | |
Statement of Assets and Liabilities | | | 8 | | |
Statement of Operations | | | 9 | | |
Statements of Changes in Net Assets | | | 10 | | |
Financial Highlights | | | 12 | | |
Notes to Financial Statements | | | 16 | | |
Report of Independent Registered Public Accounting Firm | | | 25 | | |
Federal Tax Notice | | | 26 | | |
U.S. Privacy Policy | | | 27 | | |
Director and Officer Information | | | 30 | | |
This report is authorized for distribution only when preceded or accompanied by prospectuses of the Morgan Stanley Institutional Fund, Inc. To receive a prospectus and/or statement of additional information (SAI), which contains more complete information such as investment objectives, charges, expenses, policies for voting proxies, risk considerations, and describes in detail each of the Portfolio's investment policies to the prospective investor, please call toll free 1 (800) 548-7786. Please read the prospectuses carefully before you invest or send money.
Additionally, you can access portfolio information including performance, characteristics, and investment team commentary through Morgan Stanley Investment Management's website: www.morganstanley.com/im.
Market forecasts provided in this report may not necessarily come to pass. There is no guarantee that any sectors mentioned will continue to perform as discussed herein or that securities in such sectors will be held by the Portfolio in the future. There is no assurance that a Portfolio will achieve its investment objective. Portfolios are subject to market risk, which is the possibility that market values of securities owned by the Portfolio will decline and, therefore, the value of the Portfolio's shares may be less than what you paid for them. Accordingly, you can lose money investing in the Portfolio. Please see the prospectus for more complete information on investment risks.
1
Morgan Stanley Institutional Fund, Inc.
Annual Report — December 31, 2013
Shareholders' Letter (unaudited)
Dear Shareholders,
We are pleased to provide this Annual report, in which you will learn how your investment in International Opportunity Portfolio (the "Portfolio") performed during the latest twelve-month period.
Morgan Stanley Investment Management is a client-centric, investor-led organization. Our global presence, intellectual capital, and breadth of products and services enable us to partner with investors to meet the evolving challenges of today's financial markets. We aim to deliver superior investment service and to empower our clients to make the informed decisions that help them reach their investment goals.
As always, we thank you for selecting Morgan Stanley Investment Management, and look forward to working with you in the months and years ahead.
Sincerely,

John H. Gernon
President and Principal Executive Officer
January 2014
2
Morgan Stanley Institutional Fund, Inc.
Annual Report — December 31, 2013
Expense Example (unaudited)
International Opportunity Portfolio
As a shareholder of the Portfolio, you incur two types of costs: (1) transactional costs, including redemptions fees; and (2) ongoing costs, including advisory fees, administration fees, distribution and shareholder services fees and other Portfolio expenses. This example is intended to help you understand your ongoing costs (in dollars) of investing in the Portfolio and to compare these costs with the ongoing costs of investing in other mutual funds.
This example is based on an investment of $1,000 invested at the beginning of the six-month period ended December 31, 2013 and held for the entire six-month period.
Actual Expenses
The table below provides information about actual account values and actual expenses. You may use the information in this table, together with the amount you invested, to estimate the expenses that you paid over the period. Simply divide your account value by $1,000 (for example, an $8,600 account value divided by $1,000 = 8.6), then multiply the result by the number in the table under the heading entitled "Actual Expenses Paid During Period" to estimate the expenses you paid on your account during this period.
Hypothetical Example for Comparison Purposes
The table below provides information about hypothetical account values and hypothetical expenses based on the Portfolio's actual expense ratio and an assumed rate of return of 5% per year before expenses, which is not the Portfolio's actual return. The hypothetical account values and expenses may not be used to estimate the actual ending account balance or expenses you paid for the period. You may use this information to compare the ongoing costs of investing in the Portfolio and other funds. To do so, compare this 5% hypothetical example with the 5% hypothetical examples that appear in the shareholder reports of the other funds.
Please note that the expenses shown in the table are meant to highlight your ongoing costs only and do not reflect any transactional costs, such as sales charges (loads) and redemption fees. Therefore, the information for each class in the table is useful in comparing ongoing costs only, and will not help you determine the relative total costs of owning different funds. In addition, if these transactional costs were included, your costs would have been higher.
| | | Beginning
Account
Value
7/1/13 | | Actual Ending
Account
Value
12/31/13 | | Hypothetical
Ending Account
Value | | Actual
Expenses
Paid
During
Period | | Hypothetical
Expenses Paid
During Period | | Net
Expense
Ratio
During
Period*** | |
International Opportunity Portfolio Class I | | $ | 1,000.00 | | | $ | 1,242.50 | | | $ | 1,019.56 | | | $ | 6.33 | * | | $ | 5.70 | * | | | 1.12 | % | |
International Opportunity Portfolio Class A@ | | | 1,000.00 | | | | 1,241.20 | | | | 1,017.80 | | | | 8.30 | * | | | 7.48 | * | | | 1.47 | | |
International Opportunity Portfolio Class L | | | 1,000.00 | | | | 1,237.20 | | | | 1,015.38 | | | | 11.00 | * | | | 9.91 | * | | | 1.95 | | |
International Opportunity Portfolio Class IS | | | 1,000.00 | | | | 1,109.60 | | | | 1,011.49 | | | | 3.34 | ** | | | 3.18 | ** | | | 1.08 | | |
* Expenses are calculated using each Portfolio Class' annualized net expense ratio (as disclosed), multiplied by the average account value over the period, and multiplied by 184/365 (to reflect the most recent one-half year period).
** Expenses are calculated using the Portfolio Class' annualized net expense ratio (as disclosed), multiplied by the average account value over the period, and multiplied by 107/365 (to reflect the actual days in the period).
*** Annualized.
@ Effective September 9, 2013, Class P and Class H shares were renamed Class A shares.
3
Morgan Stanley Institutional Fund, Inc.
Annual Report — December 31, 2013
Investment Overview (unaudited)
International Opportunity Portfolio
The International Opportunity Portfolio seeks long-term capital appreciation by investing primarily in established and emerging franchise companies on an international basis with capitalization within the range of companies included in the Morgan Stanley Capital International (MSCI) All Country World Ex-U.S. Index.
Performance
For the year ended December 31, 2013, the Portfolio had a total return based on net asset value and reinvestment of distributions per share of 26.47%, net of fees, for Class I shares. The Portfolio's Class I shares outperformed against its benchmark, the MSCI All Country World ex-US Index (the "Index"), which returned 15.29%. Please keep in mind that high double-digit returns are highly unusual and cannot be sustained.
Factors Affecting Performance
• International equities were up 15.29% in 2013 as measured by the Index. Developed market equities led, with Europe and Japan both rising more than 20% for the year (as measured by the MSCI Europe Index and MSCI Japan Index, respectively). In Europe, turmoil in Italy's elections and a bank bailout in Cyprus triggered volatility in eurozone equities early in the year. But investor sentiment turned more optimistic as Europe exited the recession and austerity measures were relaxed, helping eurozone stocks to perform especially well. Japan also returned to economic expansion in 2013. Its stocks rallied strongly as a massive quantitative easing plan announced by the Bank of Japan in April led to depreciation in the yen. By comparison, emerging market equities languished. Uncertainties about a slowdown in China's economy, the negative implications of the expected tapering of U.S. quantitative easing, and pockets of regional and country-specific political conflict were among the factors weighing on investor sentiment for the asset class.
• By far, the main contributor to relative outperformance was stock selection in the information technology sector, led by a holding in a Chinese internet security software developer.
• Stock selection and an overweight in the consumer discretionary sector were favorable to relative results. A holding in an after-school tutoring services provider based in China drove relative gains in the sector.
• The Portfolio benefited from no exposure to the materials sector, which posted a loss for the period and was the weakest-performing sector in the Index.
• Stock selection in the consumer staples dampened relative performance. Here, exposure to a liquor producer in China (which is not represented in the Index) was the main detractor.(i)
• The financials sector had an adverse effect on relative returns, due to both stock selection and an underweight there. Within the sector, a holding in a Brazil-based securities clearinghouse lagged the most.
• The Portfolio had no exposure to the telecommunication services sector, which was disadvantageous to performance, given the sector's relatively strong return for the period.
Management Strategies
• We look for high-quality growth companies that we believe have these attributes: sustainable competitive advantages, above-average business visibility, rising return on invested capital, strong free cash flow generation and a favorable risk/reward. We find these companies through intense fundamental research. Our emphasis is on secular growth, and as a result, short-term market events are not as meaningful in the stock selection process.
(i) To gain exposure to the stock, the Portfolio utilized a P-note (participation note), which is intended to mirror the performance of the underlying stock. There is no leverage associated with P-notes.
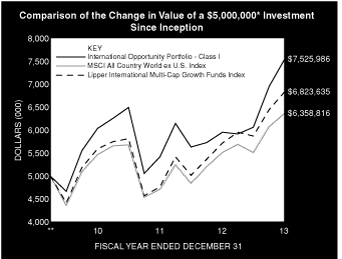
* Minimum Investment for Class I shares
** Commenced Operations on March 31, 2010.
In accordance with SEC regulations, Portfolio's performance shown assumes that all recurring fees (including management fees) were deducted and all dividends and distributions were reinvested. The performance of Class A+, L and IS shares will vary from Class I shares and will be negatively impacted by additional fees assessed to those classes (if applicable).
4
Morgan Stanley Institutional Fund, Inc.
Annual Report — December 31, 2013
Investment Overview (unaudited) (cont'd)
International Opportunity Portfolio
Performance Compared to the Morgan Stanley Capital International (MSCI) All Country World ex U.S. Index(1) and the Lipper International Multi-Cap Growth Funds Index(2)
| | | Period Ended December 31, 2013
Total Returns(3) | |
| | | | | Average Annual | |
| | | One
Year | | Five
Years | | Ten
Years | | Since
Inception(6) | |
Portfolio — Class I Shares
w/o sales charges(4) | | | 26.47 | % | | | — | | | | — | | | | 11.51 | % | |
MSCI All Country World ex U.S. Index | | | 15.29 | | | | — | | | | — | | | | 6.61 | | |
Lipper International Multi-Cap Growth
Funds Index | | | 19.33 | | | | — | | | | — | | | | 8.64 | | |
Portfolio — Class A+ Shares
w/o sales charges(4) | | | 26.12 | | | | — | | | | — | | | | 11.23 | | |
Portfolio — Class A+ Shares with
maximum 5.25% sales charges(4) | | | 19.49 | | | | — | | | | — | | | | 9.65 | | |
MSCI All Country World ex U.S. Index | | | 15.29 | | | | — | | | | — | | | | 6.61 | | |
Lipper International Multi-Cap Growth
Funds Index | | | 19.33 | | | | — | | | | — | | | | 8.64 | | |
Portfolio — Class L Shares
w/o sales charges(4) | | | 25.49 | | | | — | | | | — | | | | 10.66 | | |
MSCI All Country World ex U.S. Index | | | 15.29 | | | | — | | | | — | | | | 6.61 | | |
Lipper International Multi-Cap Growth
Funds Index | | | 19.33 | | | | — | | | | — | | | | 8.64 | | |
Portfolio — Class IS Shares
w/o sales charges(5) | | | — | | | | — | | | | — | | | | 10.96 | | |
MSCI All Country World ex U.S. Index | | | — | | | | — | | | | — | | | | 6.35 | | |
Lipper International Multi-Cap Growth
Funds Index | | | — | | | | — | | | | — | | | | 7.54 | | |
Performance data quoted represents past performance, which is no guarantee of future results, and current performance may be lower or higher than the figures shown. Performance assumes that all dividends and distributions, if any, were reinvested. For the most recent month-end performance figures, please visit www.morganstanley.com/im. Investment return and principal value will fluctuate so that Portfolio shares, when redeemed, may be worth more or less than their original cost. Total returns do not reflect the deduction of taxes that a shareholder would pay on Portfolio distributions or the redemption of Portfolio shares. Returns for periods less than one year are not annualized. Performance of share classes will vary due to difference in sales charges and expenses.
+ Effective September 9, 2013, Class P shares were renamed Class A shares.
(1) The Morgan Stanley Capital International (MSCI) All Country World ex U.S. Index is a free float-adjusted market capitalization weighted index designed to measure the equity market performance of developed and emerging markets, excluding the U.S. The term "free float" represents the portion of shares outstanding that are deemed to be available for purchase in the public equity markets by investors. The Index is unmanaged and its returns do not include any sales charges or fees. Such costs would lower performance. It is not possible to invest directly in an index.
(2) The Lipper International Multi-Cap Growth Funds Index is an equally weighted performance index of the largest qualifying funds (based on net assets) in the Lipper International Multi-Cap Growth Funds classification. The Index, which is adjusted for capital gains distributions and income dividends, is unmanaged and should not be considered an investment. There are currently 30 funds
represented in this Index. As of the date of this report, the Portfolio was in the Lipper International Multi-Cap Growth Funds classification.
(3) Total returns for the Portfolio reflect fees waived and expenses reimbursed, if applicable, by the Adviser. Without such waivers and reimbursements, total returns would have been lower. The fee waivers and/or expense reimbursements will continue for at least one year or until such time as the Fund's Board of Directors acts to discontinue all or a portion of such waivers and/or expense reimbursements when it deems that such action is appropriate.
(4) Commenced operations on March 31, 2010.
(5) Commenced offering on September 13, 2013.
(6) For comparative purposes, average annual since inception returns listed for the Indexes refer to the inception date or initial offering of the respective share class of the Portfolio, not the inception of the Index. Returns for periods less than one year are not annualized.
Portfolio Composition
Classification | | Percentage of
Total Investments | |
Other* | | | 27.3 | % | |
Textiles, Apparel & Luxury Goods | | | 12.5 | | |
Internet Software & Services | | | 12.2 | | |
Beverages | | | 9.7 | | |
Food Products | | | 8.4 | | |
Diversified Consumer Services | | | 8.3 | | |
Information Technology Services | | | 7.7 | | |
Hotels, Restaurants & Leisure | | | 7.3 | | |
Road & Rail | | | 6.6 | | |
Total Investments | | | 100.0 | % | |
* Industries and/or investment types representing less than 5% of total investments.
5
Morgan Stanley Institutional Fund, Inc.
Annual Report — December 31, 2013
Portfolio of Investments
International Opportunity Portfolio
| | | Shares | | Value
(000) | |
Common Stocks (95.0%) | |
Australia (0.0%) | |
AET&D Holdings No. 1 Ltd. (a)(b)(c) | | | 16,699 | | | $ | — | | |
Belgium (2.2%) | |
Anheuser-Busch InBev N.V. | | | 1,678 | | | | 178 | | |
Brazil (2.8%) | |
CETIP SA — Mercados Organizados | | | 21,659 | | | | 222 | | |
Canada (5.5%) | |
Brookfield Asset Management, Inc., Class A | | | 5,756 | | | | 223 | | |
Brookfield Infrastructure Partners LP | | | 5,652 | | | | 222 | | |
| | | | 445 | | |
China (14.5%) | |
Autohome, Inc. ADR (a) | | | 2,723 | | | | 100 | | |
Baidu, Inc. ADR (a) | | | 1,148 | | | | 204 | | |
New Oriental Education & Technology Group ADR | | | 7,086 | | | | 223 | | |
Qihoo 360 Technology Co., Ltd. ADR (a) | | | 4,594 | | | | 377 | | |
Uni-President China Holdings Ltd. (d) | | | 77,000 | | | | 78 | | |
Wynn Macau Ltd. (d) | | | 41,600 | | | | 189 | | |
| | | | 1,171 | | |
Denmark (6.5%) | |
DSV A/S | | | 16,061 | | | | 527 | | |
France (6.7%) | |
Christian Dior SA | | | 930 | | | | 176 | | |
Danone | | | 1,427 | | | | 103 | | |
Hermes International | | | 310 | | | | 112 | | |
Pernod-Ricard SA | | | 1,291 | | | | 147 | | |
| | | | 538 | | |
Germany (2.4%) | |
Adidas AG | | | 1,511 | | | | 193 | | |
Hong Kong (1.4%) | |
Louis XIII Holdings Ltd. | | | 112,500 | | | | 113 | | |
India (1.4%) | |
MakeMyTrip Ltd. (a) | | | 6,078 | | | | 117 | | |
Indonesia (0.4%) | |
Hero Supermarket Tbk PT (a) | | | 172,000 | | | | 34 | | |
Italy (2.0%) | |
Prada SpA (d) | | | 17,900 | | | | 159 | | |
Japan (2.4%) | |
Calbee, Inc. | | | 8,000 | | | | 194 | | |
Korea, Republic of (8.5%) | |
Hotel Shilla Co., Ltd. (a) | | | 3,000 | | | | 189 | | |
Medy-Tox, Inc. | | | 1,258 | | | | 202 | | |
NAVER Corp. (a) | | | 431 | | | | 296 | | |
| | | | 687 | | |
Singapore (1.2%) | |
Mandarin Oriental International Ltd. | | | 56,000 | | | | 94 | | |
South Africa (3.4%) | |
Naspers Ltd., Class N | | | 2,633 | | | | 275 | | |
| | | Shares | | Value
(000) | |
Switzerland (4.7%) | |
Kuehne & Nagel International AG (Registered) | | | 1,353 | | | $ | 178 | | |
Nestle SA (Registered) | | | 2,708 | | | | 198 | | |
| | | | 376 | | |
Taiwan (1.2%) | |
Wei Chuan Foods Corp. | | | 57,000 | | | | 100 | | |
United Kingdom (12.0%) | |
Burberry Group PLC | | | 14,310 | | | | 359 | | |
Diageo PLC ADR | | | 1,274 | | | | 169 | | |
Intertek Group PLC | | | 3,850 | | | | 201 | | |
Reckitt Benckiser Group PLC | | | 1,491 | | | | 118 | | |
Tesco PLC | | | 21,360 | | | | 118 | | |
| | | | 965 | | |
United States (15.8%) | |
Cognizant Technology Solutions Corp., Class A (a) | | | 2,262 | | | | 228 | | |
Greenlight Capital Re Ltd., Class A (a) | | | 6,600 | | | | 223 | | |
Luxoft Holding, Inc. (a) | | | 10,159 | | | | 386 | | |
TAL Education Group ADR (a) | | | 19,911 | | | | 438 | | |
| | | | 1,275 | | |
Total Common Stocks (Cost $5,468) | | | 7,663 | | |
Preferred Stock (0.5%) | |
India (0.5%) | |
Flipkart Online Services Pvt Ltd. Series D (a)(b)(c)(e)
(acquisition cost — $36; acquired 10/4/13)
(Cost $36) | | | 1,590 | | | | 38 | | |
Convertible Preferred Stock (0.0%) | |
China (0.0%) | |
Youku Tudou, Inc., Class A (a)(b)(c)(e)
(acquisition cost — $@; acquired 9/16/10)
(Cost $—@) | | | 6 | | | | — | @ | |
Participation Notes (3.4%) | |
China (3.4%) | |
Kweichow Moutai Co., Ltd.,
Class A, Equity Linked Notes,
expires 2/20/14 | | | 7,810 | | | | 166 | | |
Kweichow Moutai Co., Ltd.,
Class A, Equity Linked Notes, expires 3/4/21 | | | 5,260 | | | | 111 | | |
Total Participation Notes (Cost $329) | | | 277 | | |
| | Notional
Amount | | | |
Call Options Purchased (0.0%) | |
Foreign Currency Options (0.0%) | |
USD/CNY December 2014 @ CNY 6.50 | | | 1,090,234 | | | | 2 | | |
USD/CNY December 2014 @ CNY 6.50 | | | 88,344 | | | | — | @ | |
USD/CNY December 2014 @ CNY 6.50 | | | 1,241,940 | | | | 2 | | |
| | Shares | | | |
Total Call Options Purchased (Cost $8) | | | 4 | | |
Total Investments (98.9%) (Cost $5,841) | | | 7,982 | | |
Other Assets in Excess of Liabilities (1.1%) | | | 88 | | |
Net Assets (100.0%) | | $ | 8,070 | | |
The accompanying notes are an integral part of the financial statements.
6
Morgan Stanley Institutional Fund, Inc.
Annual Report — December 31, 2013
Portfolio of Investments (cont'd)
International Opportunity Portfolio
(a) Non-income producing security.
(b) At December 31, 2013, the Portfolio held fair valued securities valued at approximately $38,000, representing 0.5% of net assets. These securities have been fair valued as determined in good faith under procedures established by and under the general supervision of the Fund's Directors.
(c) Security has been deemed illiquid at December 31, 2013.
(d) Security trades on the Hong Kong exchange.
(e) Security cannot be offered for public resale without first being registered under the Securities Act of 1933 and related rules ("restricted security"). Acquisition date represents the day on which an enforceable right to acquire such security is obtained and is presented along with related cost in the security description. The Portfolio has registration rights for certain restricted securities. Any costs related to such registration are borne by the issuer. The aggregate value of restricted securities (excluding 144A holdings) at December 31, 2013 amounts to approximately $38,000 and represents 0.5% of net assets.
@ Value is less than $500.
ADR American Depositary Receipt.
CNY Chinese Yuan Renminbi
USD United States Dollar
The accompanying notes are an integral part of the financial statements.
7
Morgan Stanley Institutional Fund, Inc.
Annual Report — December 31, 2013
International Opportunity Portfolio
Statement of Assets and Liabilities | | December 31, 2013
(000) | |
Assets: | |
Investments in Securities of Unaffiliated Issuers, at Value (Cost $5,841) | | $ | 7,982 | | |
Due from Adviser | | | 55 | | |
Receivable for Investments Sold | | | 34 | | |
Tax Reclaim Receivable | | | 6 | | |
Dividends Receivable | | | 4 | | |
Receivable from Affiliate | | | — | @ | |
Other Assets | | | 10 | | |
Total Assets | | | 8,091 | | |
Liabilities: | |
Payable for Professional Fees | | | 8 | | |
Payable for Bank Overdraft | | | 6 | | |
Payable for Transfer Agent Fees | | | 1 | | |
Payable for Transfer Agent Fees — Class I | | | — | @ | |
Payable for Transfer Agent Fees — Class A* | | | — | @ | |
Payable for Transfer Agent Fees — Class L | | | — | @ | |
Payable for Administration Fees | | | 1 | | |
Payable for Investments Purchased | | | — | @ | |
Payable for Shareholder Services Fees — Class A* | | | — | @ | |
Payable for Distribution and Shareholder Services Fees — Class L | | | — | @ | |
Other Liabilities | | | 5 | | |
Total Liabilities | | | 21 | | |
Net Assets | | $ | 8,070 | | |
Net Assets Consist Of: | |
Paid-in-Capital | | $ | 5,899 | | |
Accumulated Undistributed Net Investment Income | | | 3 | | |
Accumulated Net Realized Gain | | | 27 | | |
Unrealized Appreciation (Depreciation) on: | |
Investments | | | 2,141 | | |
Foreign Currency Translations | | | — | @ | |
Net Assets | | $ | 8,070 | | |
CLASS I: | |
Net Assets | | $ | 7,647 | | |
| Shares Outstanding $0.001 par value shares of beneficial interest (500,000,000 shares authorized) (not in 000's) | | | 555,204 | | |
Net Asset Value, Offering and Redemption Price Per Share | | $ | 13.77 | | |
CLASS A*: | |
Net Assets | | $ | 275 | | |
| Shares Outstanding $0.001 par value shares of beneficial interest (500,000,000 shares authorized) (not in 000's) | | | 19,999 | | |
Net Asset Value, Redemption Price Per Share | | $ | 13.78 | | |
Maximum Sales Load§§ | | | 5.25 | % | |
Maximum Sales Charge | | $ | 0.76 | | |
Maximum Offering Price Per Share | | $ | 14.54 | | |
CLASS L: | |
Net Assets | | $ | 137 | | |
| Shares Outstanding $0.001 par value shares of beneficial interest (500,000,000 shares authorized) (not in 000's) | | | 10,000 | | |
Net Asset Value, Offering and Redemption Price Per Share | | $ | 13.68 | | |
CLASS IS: | |
Net Assets | | $ | 11 | | |
| Shares Outstanding $0.001 par value shares of beneficial interest (500,000,000 shares authorized) (not in 000's) | | | 784 | | |
Net Asset Value, Offering and Redemption Price Per Share | | $ | 13.77 | | |
@ Amount is less than $500.
* Effective September 9, 2013, Class P and Class H shares were renamed Class A shares.
§§ Effective February 25, 2013, the Directors approved the imposition of a maximum initial sales charge of 5.25% on purchases of Class A shares of the Portfolio.
The accompanying notes are an integral part of the financial statements.
8
Morgan Stanley Institutional Fund, Inc.
Annual Report — December 31, 2013
International Opportunity Portfolio
Statement of Operations | | Year Ended
December 31, 2013
(000) | |
Investment Income: | |
Dividends from Securities of Unaffiliated Issuers (Net of $11 of Foreign Taxes Withheld) | | $ | 133 | | |
Dividends from Security of Affiliated Issuer (Note G) | | | — | @ | |
Total Investment Income | | | 133 | | |
Expenses: | |
Professional Fees | | | 101 | | |
Advisory Fees (Note B) | | | 62 | | |
Registration Fees | | | 34 | | |
Shareholder Reporting Fees | | | 20 | | |
Custodian Fees (Note F) | | | 10 | | |
Transfer Agency Fees (Note E) | | | 9 | | |
Transfer Agency Fees — Class I (Note E) | | | — | @ | |
Transfer Agency Fees — Class A* (Note E) | | | — | @ | |
Transfer Agency Fees — Class L (Note E) | | | — | @ | |
Transfer Agency Fees — Class IS (Note E) | | | — | @ | |
Administration Fees (Note C) | | | 6 | | |
Pricing Fees | | | 5 | | |
Shareholder Services Fees — Class A* (Note D) | | | 1 | | |
Distribution and Shareholder Services Fees — Class L (Note D) | | | 1 | | |
Directors' Fees and Expenses | | | 1 | | |
Other Expenses | | | 17 | | |
Total Expenses | | | 267 | | |
Expenses Reimbursed by Adviser (Note B) | | | (125 | ) | |
Waiver of Advisory Fees (Note B) | | | (62 | ) | |
Rebate from Morgan Stanley Affiliate (Note G) | | | (1 | ) | |
Reimbursement of Class Specific Expenses — Class A* (Note B) | | | (— | @) | |
Reimbursement of Class Specific Expenses — Class L (Note B) | | | (— | @) | |
Reimbursement of Class Specific Expenses — Class IS (Note B) | | | (— | @) | |
Net Expenses | | | 79 | | |
Net Investment Income | | | 54 | | |
Realized Gain (Loss): | |
Investments Sold | | | 386 | | |
Foreign Currency Transactions | | | (1 | ) | |
Net Realized Gain | | | 385 | | |
Change in Unrealized Appreciation (Depreciation): | |
Investments | | | 1,258 | | |
Foreign Currency Translations | | | — | @ | |
Net Change in Unrealized Appreciation (Depreciation) | | | 1,258 | | |
Net Realized Gain and Change in Unrealized Appreciation (Depreciation) | | | 1,643 | | |
Net Increase in Net Assets Resulting from Operations | | $ | 1,697 | | |
@ Amount is less than $500.
* Effective September 9, 2013, Class P and Class H shares were renamed Class A shares.
The accompanying notes are an integral part of the financial statements.
9
Morgan Stanley Institutional Fund, Inc.
Annual Report — December 31, 2013
International Opportunity Portfolio
Statements of Changes in Net Assets | | Year Ended
December 31,
2013
(000) | | Year Ended
December 31,
2012
(000) | |
Increase (Decrease) in Net Assets: | |
Operations: | |
Net Investment Income | | $ | 54 | | | $ | 39 | | |
Net Realized Gain (Loss) | | | 385 | | | | (132 | ) | |
Net Change in Unrealized Appreciation (Depreciation) | | | 1,258 | | | | 654 | | |
Net Increase (Decrease) in Net Assets Resulting from Operations | | | 1,697 | | | | 561 | | |
Distributions from and/or in Excess of: | |
Class I: | |
Net Investment Income | | | (50 | ) | | | (33 | ) | |
Net Realized Gain | | | (153 | ) | | | — | | |
Class A*: | |
Net Investment Income | | | (1 | ) | | | (— | @) | |
Net Realized Gain | | | (6 | ) | | | — | | |
Class H@@@: | |
Net Investment Income | | | (— | @)** | | | (4 | ) | |
Class L: | |
Net Realized Gain | | | (3 | ) | | | — | | |
Class IS: | |
Net Investment Income | | | (— | @)*** | | | — | | |
Net Realized Gain | | | (— | @)*** | | | — | | |
Total Distributions | | | (213 | ) | | | (37 | ) | |
Capital Share Transactions:(1) | |
Class I: | |
Subscribed | | | 951 | | | | — | | |
Distributions Reinvested | | | 30 | | | | — | | |
Class A*: | |
Subscribed | | | 35 | | | | — | | |
Distributions Reinvested | | | 1 | | | | — | | |
Conversion from Class H | | | 124 | | | | |
Redeemed | | | (35 | ) | | | — | | |
Class H@@@: | |
Subscribed | | | — | ** | | | 101 | | |
Distributions Reinvested | | | — | ** | | | 3 | | |
Conversion to Class A | | | (124 | )** | | | |
Redeemed | | | (826 | )** | | | — | | |
Class L: | |
Redeemed | | | — | @ | | | — | | |
Class IS: | |
Subscribed | | | 10 | *** | | | — | | |
Net Increase in Net Assets Resulting from Capital Share Transactions | | | 166 | | | | 104 | | |
Total Increase in Net Assets | | | 1,650 | | | | 628 | | |
Net Assets: | |
Beginning of Period | | | 6,420 | | | | 5,792 | | |
End of Period (Including Accumulated Undistributed Net Investment Income of $3 and $1) | | $ | 8,070 | | | $ | 6,420 | | |
The accompanying notes are an integral part of the financial statements.
10
Morgan Stanley Institutional Fund, Inc.
Annual Report — December 31, 2013
International Opportunity Portfolio
Statements of Changes in Net Assets (cont'd) | | Year Ended
December 31,
2013
(000) | | Year Ended
December 31,
2012
(000) | |
(1) Capital Share Transactions: | |
Class I: | |
Shares Subscribed | | | 83 | | | | — | | |
Shares Issued on Distributions Reinvested | | | 2 | | | | — | | |
Net Increase in Class I Shares Outstanding | | | 85 | | | | — | | |
Class A*: | |
Shares Subscribed | | | 3 | | | | — | | |
Shares Issued on Distributions Reinvested | | | — | ** | | | — | | |
Conversion from Class H | | | 10 | | | | |
Shares Redeemed | | | (3 | ) | | | — | | |
Net Increase in Class A* Shares Outstanding | | | 10 | | | | — | | |
Class H@@@: | |
Shares Subscribed | | | — | ** | | | 9 | | |
Shares Issued on Distributions Reinvested | | | — | | | | — | @@ | |
Conversion to Class A | | | (10 | )** | | | |
Shares Redeemed | | | (74 | )** | | | — | | |
Net Increase (Decrease) in Class H Shares Outstanding | | | (84 | ) | | | 9 | | |
Class IS: | |
Shares Subscribed | | | 1 | *** | | | — | | |
Net Increase in Class IS Shares Outstanding | | | 1 | | | | — | | |
@ Amount is less than $500.
@@ Share amount is less than 500.
@@@ Effective September 9, 2013, Class H shares converted into Class A shares.
* Effective September 9, 2013, Class P shares were renamed Class A shares.
** For the period January 1, 2013 through September 6, 2013.
*** For the period September 13, 2013 through December 31, 2013.
The accompanying notes are an integral part of the financial statements.
11
Morgan Stanley Institutional Fund, Inc.
Annual Report — December 31, 2013
Financial Highlights
International Opportunity Portfolio
| | | Class I | |
| | | Year Ended December 31, | | Period from
March 31, 2010^ to | |
Selected Per Share Data and Ratios | | 2013 | | 2012 | | 2011 | | December 31, 2010 | |
Net Asset Value, Beginning of Period | | $ | 11.19 | | | $ | 10.26 | | | $ | 12.07 | | | $ | 10.00 | | |
Income (Loss) from Investment Operations: | |
Net Investment Income† | | | 0.10 | | | | 0.08 | | | | 0.08 | | | | 0.03 | | |
Net Realized and Unrealized Gain (Loss) | | | 2.85 | | | | 0.92 | | | | (1.31 | ) | | | 2.04 | | |
Total from Investment Operations | | | 2.95 | | | | 1.00 | | | | (1.23 | ) | | | 2.07 | | |
Distributions from and/or in Excess of: | |
Net Investment Income | | | (0.09 | ) | | | (0.07 | ) | | | (0.10 | ) | | | — | | |
Net Realized Gain | | | (0.28 | ) | | | — | | | | (0.48 | ) | | | — | | |
Total Distributions | | | (0.37 | ) | | | (0.07 | ) | | | (0.58 | ) | | | — | | |
Net Asset Value, End of Period | | $ | 13.77 | | | $ | 11.19 | | | $ | 10.26 | | | $ | 12.07 | | |
Total Return++ | | | 26.47 | % | | | 9.76 | % | | | (10.16 | )% | | | 20.70 | %# | |
Ratios and Supplemental Data: | |
Net Assets, End of Period (Thousands) | | $ | 7,647 | | | $ | 5,259 | | | $ | 4,822 | | | $ | 5,672 | | |
Ratio of Expenses to Average Net Assets (1) | | | 1.13 | %+ | | | 1.14 | %+†† | | | 1.15 | %+†† | | | 1.15 | %+††* | |
Ratio of Net Investment Income to Average Net Assets (1) | | | 0.82 | %+ | | | 0.70 | %+†† | | | 0.67 | %+†† | | | 0.33 | %+††* | |
Ratio of Rebate from Morgan Stanley Affiliates to Average Net Assets | | | 0.01 | % | | | 0.01 | %†† | | | 0.00 | %§†† | | | 0.00 | %§††* | |
Portfolio Turnover Rate | | | 40 | % | | | 33 | % | | | 37 | % | | | 18 | %# | |
(1) Supplemental Information on the Ratios to Average Net Assets: | |
Ratios Before Expense Limitation: | |
Expenses to Average Net Assets | | | 3.84 | % | | | 3.87 | %†† | | | 3.82 | %†† | | | 4.79 | %+††* | |
Net Investment Loss to Average Net Assets | | | (1.89 | )% | | | (2.03 | )%†† | | | (2.00 | )%†† | | | (3.31 | )%+††* | |
^ Commencement of Operations.
† Per share amount is based on average shares outstanding.
++ Calculated based on the net asset value as of the last business day of the period.
+ The Ratios of Expenses and Net Investment Income reflect the rebate of certain Portfolio expenses in connection with the investments in Morgan Stanley affiliates during the period. The effect of the rebate on the ratios is disclosed in the above table as "Ratio of Rebate from Morgan Stanley Affiliates to Average Net Assets."
†† Reflects overall Portfolio ratios for investment income and non-class specific expenses.
§ Amount is less than 0.005%.
# Not Annualized.
* Annualized.
The accompanying notes are an integral part of the financial statements.
12
Morgan Stanley Institutional Fund, Inc.
Annual Report — December 31, 2013
Financial Highlights
International Opportunity Portfolio
| | | Class A@ | |
| | | Year Ended December 31, | | Period from
March 31, 2010^ to | |
Selected Per Share Data and Ratios | | 2013 | | 2012 | | 2011 | | December 31, 2010 | |
Net Asset Value, Beginning of Period | | $ | 11.19 | | | $ | 10.26 | | | $ | 12.04 | | | $ | 10.00 | | |
Income (Loss) from Investment Operations: | |
Net Investment Income† | | | 0.02 | | | | 0.05 | | | | 0.05 | | | | 0.01 | | |
Net Realized and Unrealized Gain (Loss) | | | 2.89 | | | | 0.92 | | | | (1.30 | ) | | | 2.03 | | |
Total from Investment Operations | | | 2.91 | | | | 0.97 | | | | (1.25 | ) | | | 2.04 | | |
Distributions from and/or in Excess of: | |
Net Investment Income | | | (0.04 | ) | | | (0.04 | ) | | | (0.05 | ) | | | — | | |
Net Realized Gain | | | (0.28 | ) | | | — | | | | (0.48 | ) | | | — | | |
Total Distributions | | | (0.32 | ) | | | (0.04 | ) | | | (0.53 | ) | | | — | | |
Net Asset Value, End of Period | | $ | 13.78 | | | $ | 11.19 | | | $ | 10.26 | | | $ | 12.04 | | |
Total Return++ | | | 26.12 | % | | | 9.49 | % | | | (10.33 | )% | | | 20.40 | %# | |
Ratios and Supplemental Data: | |
Net Assets, End of Period (Thousands) | | $ | 275 | | | $ | 112 | | | $ | 103 | | | $ | 120 | | |
Ratio of Expenses to Average Net Assets (1) | | | 1.44 | %+^^ | | | 1.39 | %+†† | | | 1.40 | %+†† | | | 1.40 | %+††* | |
Ratio of Net Investment Income to Average Net Assets (1) | | | 0.13 | %+ | | | 0.45 | %+†† | | | 0.42 | %+†† | | | 0.08 | %+††* | |
Ratio of Rebate from Morgan Stanley Affiliates to Average Net Assets | | | 0.01 | % | | | 0.01 | %†† | | | 0.00 | %§†† | | | 0.00 | %§††* | |
Portfolio Turnover Rate | | | 40 | % | | | 33 | % | | | 37 | % | | | 18 | %# | |
(1) Supplemental Information on the Ratios to Average Net Assets: | |
Ratios Before Expense Limitation: | |
Expenses to Average Net Assets | | | 4.49 | % | | | 4.12 | %†† | | | 4.07 | %†† | | | 5.04 | %+††* | |
Net Investment Loss to Average Net Assets | | | (2.92 | )% | | | (2.28 | )%†† | | | (2.25 | )%†† | | | (3.56 | )%+††* | |
@ Effective September 9, 2013, Class P and Class H shares were renamed Class A shares.
^ Commencement of Operations.
† Per share amount is based on average shares outstanding.
++ Calculated based on the net asset value which does not reflect sales charges, if applicable, as of the last business day of the period.
+ The Ratios of Expenses and Net Investment Income reflect the rebate of certain Portfolio expenses in connection with the investments in Morgan Stanley affiliates during the period. The effect of the rebate on the ratios is disclosed in the above table as "Ratio of Rebate from Morgan Stanley Affiliates to Average Net Assets."
^^ Effective September 16, 2013, the Adviser has agreed to limit the ratio of expenses to average net assets to the maximum ratio of 1.50% for Class A shares. Prior to September 16, 2013, the maximum ratio was 1.40% for Class A shares.
†† Reflects overall Portfolio ratios for investment income and non-class specific expenses.
§ Amount is less than 0.005%.
# Not Annualized.
* Annualized.
The accompanying notes are an integral part of the financial statements.
13
Morgan Stanley Institutional Fund, Inc.
Annual Report — December 31, 2013
Financial Highlights
International Opportunity Portfolio
| | | Class L | |
| | | Year Ended December 31, | | Period from
March 31, 2010^ to | |
Selected Per Share Data and Ratios | | 2013 | | 2012 | | 2011 | | December 31, 2010 | |
Net Asset Value, Beginning of Period | | $ | 11.13 | | | $ | 10.22 | | | $ | 12.00 | | | $ | 10.00 | | |
Income (Loss) from Investment Operations: | |
Net Investment Loss† | | | (0.00 | )‡ | | | (0.01 | ) | | | (0.01 | ) | | | (0.03 | ) | |
Net Realized and Unrealized Gain (Loss) | | | 2.83 | | | | 0.92 | | | | (1.29 | ) | | | 2.03 | | |
Total from Investment Operations | | | 2.83 | | | | 0.91 | | | | (1.30 | ) | | | 2.00 | | |
Distributions from and/or in Excess of: | |
Net Realized Gain | | | (0.28 | ) | | | — | | | | (0.48 | ) | | | — | | |
Net Asset Value, End of Period | | $ | 13.68 | | | $ | 11.13 | | | $ | 10.22 | | | $ | 12.00 | | |
Total Return++ | | | 25.49 | % | | | 8.90 | % | | | (10.81 | )% | | | 20.00 | %# | |
Ratios and Supplemental Data: | |
Net Assets, End of Period (Thousands) | | $ | 137 | | | $ | 112 | | | $ | 102 | | | $ | 120 | | |
Ratio of Expenses to Average Net Assets (1) | | | 1.92 | %+^^ | | | 1.89 | %+†† | | | 1.90 | %+†† | | | 1.90 | %+††* | |
Ratio of Net Investment Loss to Average Net Assets (1) | | | (0.00 | )%+§ | | | (0.05 | )%+†† | | | (0.08 | )%+†† | | | (0.42 | )%+††* | |
Ratio of Rebate from Morgan Stanley Affiliates to Average Net Assets | | | 0.01 | % | | | 0.01 | %†† | | | 0.00 | %§†† | | | 0.00 | %§††* | |
Portfolio Turnover Rate | | | 40 | % | | | 33 | % | | | 37 | % | | | 18 | %# | |
(1) Supplemental Information on the Ratios to Average Net Assets: | |
Ratios Before Expense Limitation: | |
Expenses to Average Net Assets | | | 4.91 | % | | | 4.62 | %†† | | | 4.57 | %†† | | | 5.54 | %+††* | |
Net Investment Loss to Average Net Assets | | | (2.99 | )% | | | (2.78 | )%†† | | | (2.75 | )%†† | | | (4.06 | )%+††* | |
^ Commencement of Operations.
† Per share amount is based on average shares outstanding.
‡ Amount is less than $0.005 per share.
++ Calculated based on the net asset value as of the last business day of the period.
+ The Ratios of Expenses and Net Investment Loss reflect the rebate of certain Portfolio expenses in connection with the investments in Morgan Stanley affiliates during the period. The effect of the rebate on the ratios is disclosed in the above table as "Ratio of Rebate from Morgan Stanley Affiliates to Average Net Assets."
^^ Effective September 16, 2013, the Adviser has agreed to limit the ratio of expenses to average net assets to the maximum ratio of 2.00% for Class L shares. Prior to September 16, 2013, the maximum ratio was 1.90% for Class L shares.
†† Reflects overall Portfolio ratios for investment income and non-class specific expenses.
§ Amount is less than 0.005%.
# Not Annualized.
* Annualized.
The accompanying notes are an integral part of the financial statements.
14
Morgan Stanley Institutional Fund, Inc.
Annual Report — December 31, 2013
Financial Highlights
International Opportunity Portfolio
| | | Class IS | |
Selected Per Share Data and Ratios | | Period from
September 13, 2013^ to
December 31, 2013 | |
Net Asset Value, Beginning of Period | | $ | 12.75 | | |
Income (Loss) from Investment Operations: | |
Net Investment Loss† | | | (0.02 | ) | |
Net Realized and Unrealized Gain | | | 1.41 | | |
Total from Investment Operations | | | 1.39 | | |
Distributions from and/or in Excess of: | |
Net Investment Income | | | (0.09 | ) | |
Net Realized Gain | | | (0.28 | ) | |
Total Distributions | | | (0.37 | ) | |
Net Asset Value, End of Period | | $ | 13.77 | | |
Total Return++ | | | 10.96 | %# | |
Ratios and Supplemental Data: | |
Net Assets, End of Period (Thousands) | | $ | 11 | | |
Ratio of Expenses to Average Net Assets (1) | | | 1.08 | %+^^* | |
Ratio of Net Investment Loss to Average Net Assets (1) | | | (0.47 | )%+* | |
Ratio of Rebate from Morgan Stanley Affiliates to Average Net Assets | | | 0.01 | %* | |
Portfolio Turnover Rate | | | 40 | %# | |
(1) Supplemental Information on the Ratios to Average Net Assets: | |
Ratios Before Expense Limitation | |
Expenses to Average Net Assets | | | 9.61 | %* | |
Net Investment Loss to Average Net Assets | | | (9.00 | )%* | |
^ Commencement of Operations.
† Per share amount is based on average shares outstanding.
++ Calculated based on the net asset value as of the last business day of the period.
+ The Ratios of Expenses and Net Investment Loss reflect the rebate of certain Portfolio expenses in connection with the investments in Morgan Stanley affiliates during the period. The effect of the rebate on the ratios is disclosed in the above table as "Ratio of Rebate from Morgan Stanley Affiliates to Average Net Assets."
^^ Effective September 16, 2013, the Adviser has agreed to limit the ratio of expenses to average net assets to the maximum ratio of 1.09% for Class IS shares.
# Not Annualized.
* Annualized.
The accompanying notes are an integral part of the financial statements.
15
Morgan Stanley Institutional Fund, Inc.
Annual Report — December 31, 2013
Notes to Financial Statements
Morgan Stanley Institutional Fund, Inc. (the "Fund") is registered under the Investment Company Act of 1940, as amended (the "Act"), as an open-end management investment company. The Fund is comprised of twenty-seven separate, active, diversified and non-diversified portfolios (individually referred to as a "Portfolio", collectively as the "Portfolios").
The accompanying financial statements relate to the International Opportunity Portfolio. The Portfolio seeks long-term capital appreciation by investing primarily in established and emerging franchise companies on an international basis, with capitalizations within the range of companies included in the MSCI All Country World Ex-United States Index. The Portfolio offers four classes of shares — Class I, Class A, Class L and Class IS.
On September 16, 2013, the Portfolio commenced offering Class IS shares. Effective September 9, 2013, Class P and Class H shares were renamed Class A shares.
A. Significant Accounting Policies: The following significant accounting policies are in conformity with U.S. generally accepted accounting principles ("GAAP"). Such policies are consistently followed by the Fund in the preparation of its financial statements. GAAP may require management to make estimates and assumptions that affect the reported amounts and disclosures in the financial statements. Actual results may differ from those estimates.
1. Security Valuation: (1) An equity portfolio security listed or traded on an exchange is valued at its latest reported sales price (or at the exchange official closing price if such exchange reports an official closing price), if there were no sales on a given day, the security is valued at the mean between the last reported bid and asked prices; (2) all other equity portfolio securities for which over-the-counter market quotations are readily available are valued at its latest reported sales price. In cases where a security is traded on more than one exchange, the security is valued on the exchange designated as the primary market; (3) listed options are valued at the last reported sales price on the exchange on which they are listed (or at the exchange official closing price if such exchange reports an official closing price). If an official closing price or last reported sale price is unavailable, the listed option should be fair valued at the mean between its latest bid and ask prices. Unlisted options are valued by an outside pricing service approved by Fund's Board of Directors (the "Directors") or quotes from a broker or dealer; (4) when market quotations are not readily available, including circumstances under which Morgan Stanley Investment
Management Inc. (the "Adviser") determines that the closing price, last sale price or the mean between the last reported bid and asked prices are not reflective of a security's market value, portfolio securities are valued at their fair value as determined in good faith under procedures established by and under the general supervision of the Directors. Occasionally, developments affecting the closing prices of securities and other assets may occur between the times at which valuations of such securities are determined (that is, close of the foreign market on which the securities trade) and the close of business of the New York Stock Exchange ("NYSE"). If developments occur during such periods that are expected to materially affect the value of such securities, such valuations may be adjusted to reflect the estimated fair value of such securities as of the close of the NYSE, as determined in good faith by the Directors or by the Adviser using a pricing service and/or procedures approved by the Directors; (5) quotations of foreign portfolio securities, other assets and liabilities and forward contracts stated in foreign currency are translated into U.S. dollar equivalents at the prevailing market rates prior to the close of the NYSE; (6) investments in mutual funds, including the Morgan Stanley Institutional Liquidity Funds, are valued at the net asset value as of the close of each business day; and (7) short-term debt securities with remaining maturities of 60 days or less at the time of purchase may be valued at amortized cost, unless the Adviser determines such valuation does not reflect the securities' market value, in which case these securities will be valued at their fair market value determined by the Adviser.
Under procedures approved by the Directors, the Fund's Adviser has formed a Valuation Committee. The Valuation Committee provides administration and oversight of the Fund's valuation policies and procedures, which are reviewed at least annually by the Directors. These procedures allow the Fund to utilize independent pricing services, quotations from securities and financial instrument dealers, and other market sources to determine fair value.
The Fund has procedures to determine the fair value of securities and other financial instruments for which market prices are not readily available. Under these procedures, the Valuation Committee convenes on a regular and ad hoc basis to review such securities and considers a number of factors, including valuation methodologies and significant unobservable valuation inputs, when arriving at fair value. The Valuation Committee may employ a market-based approach which may use related or comparable assets or liabilities, recent transactions,
16
Morgan Stanley Institutional Fund, Inc.
Annual Report — December 31, 2013
Notes to Financial Statements (cont'd)
market multiples, book values, and other relevant information for the investment to determine the fair value of the investment. An income-based valuation approach may also be used in which the anticipated future cash flows of the investment are discounted to calculate fair value. Discounts may also be applied due to the nature or duration of any restrictions on the disposition of the investments. Due to the inherent uncertainty of valuations of such investments, the fair values may differ significantly from the values that would have been used had an active market existed. The Valuation Committee employs various methods for calibrating these valuation approaches including a regular review of valuation methodologies, key inputs and assumptions, transactional back-testing or disposition analysis, and reviews of any related market activity.
2. Fair Value Measurement: Financial Accounting Standards Board ("FASB") Accounting Standards CodificationTM ("ASC") 820, "Fair Value Measurements and Disclosures" ("ASC 820"), defines fair value as the value that the Fund would receive to sell an investment or pay to transfer a liability in a timely transaction with an independent buyer in the principal market, or in the absence of a principal market the most advantageous market for the investment or liability. ASC 820 establishes a three-tier hierarchy to distinguish between (1) inputs that reflect the assumptions market participants would use in valuing an asset or liability developed based on market data obtained from sources independent of the reporting entity (observable inputs) and (2) inputs that reflect the reporting entity's own assumptions about the assumptions market participants would use in valuing an asset or liability developed based on the best information available in the circumstances (unobservable inputs) and to establish classification of fair value measurements for disclosure purposes. Various inputs are used in determining the value of the Fund's investments. The inputs are summarized in the three broad levels listed below.
• Level 1 – unadjusted quoted prices in active markets for identical investments
• Level 2 – other significant observable inputs (including quoted prices for similar investments, interest rates, prepayment speeds, credit risk, etc.)
• Level 3 – significant unobservable inputs including the Fund's own assumptions in determining the fair value of investments. Factors considered in making this determination
may include, but are not limited to, information obtained by contacting the issuer, analysts, or the appropriate stock exchange (for exchange-traded securities), analysis of the issuer's financial statements or other available documents and, if necessary, available information concerning other securities in similar circumstances
The inputs or methodology used for valuing securities are not necessarily an indication of the risk associated with investing in those securities and the determination of the significance of a particular input to the fair value measurement in its entirety requires judgment and considers factors specific to each security.
The following is a summary of the inputs used to value the Portfolio's investments as of December 31, 2013.
Investment Type | | prices
(000) | | Level 2
Level 1
Unadjusted
quoted
inputs
(000) | | Other
significant
observable
inputs
(000) | | Level 3
Significant
unobservable
Total
(000) | |
Assets: | |
Common Stocks | |
Beverages | | $ | 494 | | | $ | — | | | $ | — | | | $ | 494 | | |
Biotechnology | | | 202 | | | | — | | | | — | | | | 202 | | |
Capital Markets | | | 222 | | | | — | | | | — | | | | 222 | | |
Diversified Consumer
Services | | | 661 | | | | — | | | | — | | | | 661 | | |
Electric Utilities | | | 222 | | | | — | | | | — | † | | | 222 | | |
Food & Staples Retailing | | | 152 | | | | — | | | | — | | | | 152 | | |
Food Products | | | 673 | | | | — | | | | — | | | | 673 | | |
Hotels, Restaurants &
Leisure | | | 585 | | | | — | | | | — | | | | 585 | | |
Household Products | | | 118 | | | | — | | | | — | | | | 118 | | |
Information Technology
Services | | | 614 | | | | — | | | | — | | | | 614 | | |
Insurance | | | 223 | | | | — | | | | — | | | | 223 | | |
Internet & Catalog Retail | | | 117 | | | | — | | | | — | | | | 117 | | |
Internet Software &
Services | | | 977 | | | | — | | | | — | | | | 977 | | |
Marine | | | 178 | | | | — | | | | — | | | | 178 | | |
Media | | | 275 | | | | — | | | | — | | | | 275 | | |
Professional Services | | | 201 | | | | — | | | | — | | | | 201 | | |
Real Estate Management &
Development | | | 223 | | | | — | | | | — | | | | 223 | | |
Road & Rail | | | 527 | | | | — | | | | — | | | | 527 | | |
Textiles, Apparel & Luxury
Goods | | | 999 | | | | — | | | | — | | | | 999 | | |
Total Common Stocks | | | 7,663 | | | | — | | | | — | † | | | 7,663 | | |
Preferred Stock | | | — | | | | — | | | | 38 | | | | 38 | | |
Convertible Preferred
Stock | | | — | | | | — | | | | — | @ | | | — | @ | |
Participation Notes | | | — | | | | 277 | | | | — | | | | 277 | | |
Call Options Purchased | | | — | | | | 4 | | | | — | | | | 4 | | |
Total Assets | | $ | 7,663 | | | $ | 281 | | | $ | 38 | | | $ | 7,982 | | |
† Includes one security which is valued at zero.
@ Value is less than $500.
17
Morgan Stanley Institutional Fund, Inc.
Annual Report — December 31, 2013
Notes to Financial Statements (cont'd)
Transfers between investment levels may occur as the markets fluctuate and/or the availability of data used in an investment's valuation changes. The Portfolio recognizes transfers between the levels as of the end of the period. As of December 31, 2013, securities with a total value of approximately $2,919,000 transferred from Level 2 to Level 1. At December 31, 2012, the fair value of certain securities were adjusted due to developments which occurred between the time of the close of the foreign markets on which they trade and the close of business on the NYSE which resulted in their Level 2 classification.
Following is a reconciliation of investments in which significant unobservable inputs (Level 3) were used in determining fair value.
| | | Common
Stock
(000) | | Convertible
Preferred
Stock
(000) | | Preferred
Stock
(000) | |
Beginning Balance | | $ | — | † | | $ | 3 | | | $ | — | | |
Purchases | | | — | | | | — | | | | 36 | | |
Sales | | | — | | | | — | | | | — | | |
Amortization of discount | | | — | | | | — | | | | — | | |
Transfers in | | | — | | | | — | | | | — | | |
Transfers out | | | — | | | | — | | | | — | | |
Change in unrealized appreciation/
depreciation | | | — | | | | 46 | | | | 2 | | |
Realized gains (losses) | | | — | | | | (49 | ) | | | — | | |
Ending Balance | | $ | — | † | | $ | — | | | $ | 38 | | |
Net change in unrealized appreciation/
depreciation from investments still
held as of December 31, 2013 | | $ | — | | | $ | — | @ | | $ | 2 | | |
@ Value is less than $500.
† Includes one security which is valued at zero.
The following table presents additional information about valuation techniques and inputs used for investments that are measured at fair value and categorized within Level 3 as of December 31, 2013.
| | | Fair Value at
December 31, 2013
(000) | | Valuation
Technique | | Unobservable
Input | | Range | | Weighted
Average | | Impact to
Valuation from an
Increase in Input | |
Internet & Catalog Retail | |
Preferred Stock | | $ | 38 | | | Market Transaction
Method | | Precedent Transaction
of Preferred Stock | | $ | 22.947 | | | $ | 22.947 | | | $ | 22.947 | | | Increase | |
| | | | | Discounted Cash Flow | | Weighted Average
Cost of Capital | | | 17.0 | % | | | 19.0 | % | | | 18.0 | % | | Decrease | |
| | | | | | | Perpetual Growth Rate | | | 3.5 | % | | | 4.5 | % | | | 4.0 | % | | Increase | |
| | | | | Market Comparable
Companies | | Enterprise Value/
Revenue
Discount for Lack
of Marketability | | | 3.1
15.0% | x | | | 7.5
15.0% | x | | | 5.7
15.0% | x | | Increase
Decrease | |
3. Foreign Currency Translation and Foreign Investments: The books and records of the Portfolio are maintained in U.S. dollars. Foreign currency amounts are translated into U.S. dollars as follows:
– investments, other assets and liabilities at the prevailing rate of exchange on the valuation date;
– investment transactions and investment income at the prevailing rates of exchange on the dates of such transactions.
Although the net assets of the Portfolio are presented at the foreign exchange rates and market values at the close of the period, the Portfolio does not isolate that portion
of the results of operations arising as a result of changes in the foreign exchange rates from the fluctuations arising from changes in the market prices of securities held at period end. Similarly, the Portfolio does not isolate the effect of changes in foreign exchange rates from the fluctuations arising from changes in the market prices of securities sold during the period. Accordingly, realized and unrealized foreign currency gains (losses) on investments in securities are included in the reported net realized and unrealized gains (losses) on investment transactions and balances. However, pursuant to U.S. Federal income tax regulations, gains and losses from certain foreign currency transactions and the foreign
18
Morgan Stanley Institutional Fund, Inc.
Annual Report — December 31, 2013
Notes to Financial Statements (cont'd)
currency portion of gains and losses realized on sales and maturities of foreign denominated debt securities are treated as ordinary income for U.S. Federal income tax purposes.
Net realized gains (losses) on foreign currency transactions represent net foreign exchange gains (losses) from foreign currency forward exchange contracts, disposition of foreign currencies, currency gains (losses) realized between the trade and settlement dates on securities transactions, and the difference between the amount of investment income and foreign withholding taxes recorded on the Portfolio's books and the U.S. dollar equivalent amounts actually received or paid. Net unrealized currency gains (losses) from valuing foreign currency denominated assets and liabilities at period end exchange rates are reflected as a component of unrealized appreciation (depreciation) on the Statement of Assets and Liabilities. The change in unrealized currency gains (losses) on foreign currency translations for the period is reflected in the Statement of Operations.
Foreign security and currency transactions may involve certain considerations and risks not typically associated with those of U.S. dollar denominated transactions as a result of, among other factors, fluctuations of exchange rates in relation to the U.S. dollar, the possibility of lower levels of governmental supervision and regulation of foreign securities markets and the possibility of political or economic instability.
The net assets of the Portfolio include foreign denominated securities and currency. Changes in currency exchange rates will affect the U.S. Dollar value of and investment income from such securities.
Governmental approval for foreign investments may be required in advance of making an investment under certain circumstances in some countries, and the extent of foreign investments in domestic companies may be subject to limitation in other countries. Foreign ownership limitations also may be imposed by the charters of individual companies to prevent, among other concerns, violations of foreign investment limitations. As a result, an additional class of shares (identified as "Foreign" in the Portfolio of Investments) may be created and offered for investment. The "local" and "foreign shares" market values may differ. In the absence of trading of the foreign shares in such markets, the Portfolio values the
foreign shares at the closing exchange price of the local shares.
4. Derivatives: The Portfolio may, but is not required to, use derivative instruments for a variety of purposes, including hedging, risk management, portfolio management or to earn income. Derivatives are financial instruments whose value is based, in part, on the value of an underlying asset, interest rate, index or financial instrument. Prevailing interest rates and volatility levels, among other things, also affect the value of derivative instruments. A derivative instrument often has risks similar to its underlying asset and may have additional risks, including imperfect correlation between the value of the derivative and the underlying asset, risks of default by the counterparty to certain transactions, magnification of losses incurred due to changes in the market value of the securities, instruments, indices or interest rates to which they relate, and risks that the transactions may not be liquid. The use of derivatives involves risks that are different from, and possibly greater than, the risks associated with other portfolio investments. Derivatives may involve the use of highly specialized instruments that require investment techniques and risk analyses different from those associated with other portfolio investments. All of the Portfolio's holdings, including derivative instruments, are marked-to-market each day with the change in value reflected in unrealized appreciation (depreciation). Upon disposition, a realized gain or loss is recognized.
Certain derivative transactions may give rise to a form of leverage. Leverage magnifies the potential for gain and the risk of loss. Leverage associated with derivative transactions may cause the Portfolio to liquidate portfolio positions when it may not be advantageous to do so to satisfy its obligations or to meet earmarking or segregation requirements, pursuant to applicable Securities and Exchange Commission rules and regulations, or may cause the Portfolio to be more volatile than if the Portfolio had not been leveraged. Although the Adviser seeks to use derivatives to further the Portfolio's investment objectives, there is no assurance that the use of derivatives will achieve this result.
19
Morgan Stanley Institutional Fund, Inc.
Annual Report — December 31, 2013
Notes to Financial Statements (cont'd)
Following is a description of the derivative instruments and techniques that the Portfolio used during the period and their associated risks:
Options: In respect to options, the Portfolio is subject to equity risk, interest rate risk and foreign currency exchange risk in the normal course of pursuing its investment objectives. If the Portfolio buys an option, it buys a legal contract giving it the right to buy or sell a specific amount of the underlying instrument or futures contract on the underlying instrument such a as security, currency or index, at an agreed upon price typically in exchange for a premium paid by the Portfolio. The Portfolio may purchase put and call options. Purchasing call options tends to increase the Portfolio's exposure to the underlying (or similar) instrument. Purchasing put options tends to decrease the Portfolio's exposure to the underlying (or similar) instrument. When entering into purchased option contracts, the Portfolio bears the risk of interest or exchange rates or securities prices moving unexpectedly, in which case, the Portfolio may not achieve the anticipated benefits of the purchased option contracts; however the risk of loss is limited to the premium paid. Purchased options are reported as part of "Total Investments" on the Statement of Assets and Liabilities. Premium paid for purchasing options which expired are treated as realized losses. If the Portfolio sells an option, it sells to another party the right to buy from or sell to the Portfolio a specific amount of the underlying instrument or futures contract on the underlying instrument at an agreed upon price typically in exchange for a premium received by the Portfolio. There is the risk the Portfolio may not be able to enter into a closing transaction because of an illiquid market. A decision as to whether, when and how to use options involves the exercise of skill and judgment and even a well conceived option transaction may be unsuccessful because of market behavior or unexpected events. The prices of options can be highly volatile and the use of options can lower total returns.
FASB ASC 815, "Derivatives and Hedging: Overall" ("ASC 815"), is intended to improve financial reporting about derivative instruments by requiring enhanced disclosures to enable investors to better understand how and why the Portfolio uses derivative instruments, how these derivative instruments are accounted for and their effects on the Portfolio's financial position and results of operations.
The following table sets forth the fair value of the Portfolio's derivative contracts by primary risk exposure as of December 31, 2013.
| | | Asset Derivatives
Statement of Assets and
Liabilities Location | | Primary Risk
Exposure | | Value
(000) | |
Options Purchased | | Investments, at Value
(Options Purchased) | | Currency Risk | | $ | 4 | + | |
+ Amounts are included in Investments in the Statement of Operations.
The following table sets forth by primary risk exposure the Portfolio's change in unrealized appreciation (depreciation) by type of derivative contract for the year ended December 31, 2013 in accordance with ASC 815.
Change in Unrealized Appreciation (Depreciation) | |
Primary Risk Exposure | | Derivative Type | | Value
(000) | |
Currency Risk | | Investments
(Options Purchased) | | $ | (4 | )++ | |
++ Amounts are included in Investments in the Statement of Operations.
At December 31, 2013, the Portfolio's derivative assets and liabilities are as follows:
Gross Amounts of Assets and Liabilities Presented in the
Statement of Assets and Liabilities | |
Derivative | | Assets(a)
(000) | | Liabilities(a)
(000) | |
Options Purchased | | $ | 4 | | | | — | | |
(a) Absent an event of default or early termination, OTC derivative assets and liabilities are presented gross and not offset in the Statement of Assets and Liabilities.
The following table presents derivative financial instruments that are subject to enforceable netting arrangements as of December 31, 2013.
Gross Amounts Not Offset in the Statement of Assets and Liabilities | |
Counterparty | | Gross Asset
Derivatives
Presented in Statement of
Assets and Liabilities
(000) | | Financial
Instrument
(000) | | Collateral
Received
(000) | | Net
Amount
(not less
than 0)
(000) | |
Royal Bank of Scotland | | $ | 4 | | | | — | | | | — | | | $ | 4 | | |
For the year ended December 31, 2013, the approximate average monthly amount outstanding for each derivative type is as follows:
Options Purchased: | |
| Average monthly notional amount | | | 202,000 | | |
5. Structured Investments: The Portfolio invested a portion of its assets in structured investments. A structured investment is a derivative security designed to offer a return linked to a particular underlying security, currency, commodity or market. Structured investments may come
20
Morgan Stanley Institutional Fund, Inc.
Annual Report — December 31, 2013
Notes to Financial Statements (cont'd)
in various forms including notes (such as exchange-traded notes), warrants and options to purchase securities. The Portfolio will typically use structured investments to gain exposure to a permitted underlying security, currency, commodity or market when direct access to a market is limited or inefficient from a tax or cost standpoint. Investments in structured investments involve risks including issuer risk, counterparty risk and market risk. Holders of structured investments bear risks of the underlying investment and are subject to issuer or counterparty risk because the Portfolio is relying on the creditworthiness of such issuer or counterparty and has no rights with respect to the underlying investment. Certain structured investments may be thinly traded or have a limited trading market and may have the effect of increasing the Portfolio's illiquidity to the extent that the Portfolio, at a particular time, may be unable to find qualified buyers for these securities.
6. Restricted Securities: The Portfolio invests in unregistered or otherwise restricted securities. The term "restricted securities" refers to securities that are unregistered or are held by control persons of the issuer and securities that are subject to contractual restrictions on their resale. As a result, restricted securities may be more difficult to value and the Portfolio may have difficulty disposing of such assets either in a timely manner or for a reasonable price. In order to dispose of an unregistered security, the Portfolio, where it has contractual rights to do so, may have to cause such security to be registered. A considerable period may elapse between the time the decision is made to sell the security and the time the security is registered so that the Portfolio could sell it. Contractual restrictions on the resale of securities vary in length and scope and are generally the result of a negotiation between the issuer and acquirer of the securities. The Portfolio would, in either case, bear market risks during that period. Restricted Securities are identified in the Portfolio of Investments.
7. Redemption Fees: The Portfolio will assess a 2% redemption fee, on Class I shares, Class A shares, Class L shares and Class IS shares, which is paid directly to the Portfolio, for shares redeemed or exchanged within thirty days of purchase, subject to certain exceptions. The redemption fee is designed to protect the Portfolio and its remaining shareholders from the effects of short-term
trading. These fees, if any, are included in the Statements of Changes in Net Assets.
8. Indemnifications: The Fund enters into contracts that contain a variety of indemnifications. The Fund's maximum exposure under these arrangements is unknown. However, the Fund has not had prior claims or losses pursuant to these contracts and expects the risk of loss to be remote.
9. Dividends and Distributions to Shareholders: Dividend income and distributions to shareholders are recorded on the ex-dividend date. Dividends from net investment income, if any, are declared and paid semiannually. Net realized capital gains, if any, are distributed at least annually.
10. Security Transactions, Income and Expenses: Security transactions are accounted for on the trade date (date the order to buy or sell is executed). Realized gains and losses on the sale of investment securities are determined on the specific identified cost method. Dividend income and other distributions are recorded on the ex-dividend date (except for certain foreign dividends which may be recorded as soon as the Portfolio is informed of such dividends) net of applicable withholding taxes. Interest income is recognized on the accrual basis except where collection is in doubt. Discounts are accreted and premiums are amortized over the life of the respective securities. Most expenses of the Fund can be directly attributed to a particular Portfolio. Expenses which cannot be directly attributed are apportioned among the Portfolios based upon relative net assets or other appropriate methods. Income, expenses (other than class specific expenses — distribution, transfer agency and sub transfer agency fees) and realized and unrealized gains or losses are allocated to each class of shares based upon their relative net assets.
B. Advisory Fees: The Adviser, a wholly-owned subsidiary of Morgan Stanley, provides the Portfolio with advisory services under the terms of an Investment Advisory Agreement, paid quarterly, at the annual rate based on the average daily net assets as follows:
First $1
billion | | Over $1
billion | |
| | 0.90 | % | | | 0.85 | % | |
21
Morgan Stanley Institutional Fund, Inc.
Annual Report — December 31, 2013
Notes to Financial Statements (cont'd)
For the year ended December 31, 2013, the advisory fee rate (net of waivers/rebate) was equivalent to an annual effective rate of 0.00% of the Portfolio's daily net assets.
The Adviser has agreed to reduce its advisory fee and/or reimburse the Portfolio so that total annual portfolio operating expenses, excluding certain investment related expenses, taxes, interest and other extraordinary expenses (including litigation), will not exceed 1.15% for Class I shares, 1.40% for Class A shares and 1.90% for Class L shares. Effective September 16, 2013, the Adviser has agreed to limit the ratio of expense to average net assets to the maximum ratio of 1.50%, 2.00% and 1.09% for Class A, Class L and Class IS shares, respectively. The fee waivers and/or expense reimbursements will continue for at least one year or until such time that the Directors act to discontinue all or a portion of such waivers and/or reimbursements when it deems such action is appropriate. For the year ended December 31, 2013, approximately $62,000 of advisory fees were waived and approximately $125,000 of other expenses were reimbursed by the Adviser pursuant to this arrangement.
C. Administration Fees: The Adviser also serves as Administrator to the Fund and provides administrative services pursuant to an Administration Agreement for an annual fee, accrued daily and paid monthly, of 0.08% of the Portfolio's average daily net assets. Under a Sub-Administration Agreement between the Administrator and State Street Bank and Trust Company ("State Street"), State Street provides certain administrative services to the Fund. For such services, the Administrator pays State Street a portion of the fee the Administrator receives from the Portfolio.
D. Distribution and Shareholder Services Fees: Morgan Stanley Distribution, Inc. ("MSDI" or the "Distributor"), a wholly-owned subsidiary of the Adviser, and an indirect subsidiary of Morgan Stanley, serves as the Fund's Distributor of Portfolio shares pursuant to a Distribution Agreement. The Fund has adopted a Shareholder Services Plan with respect to Class A shares pursuant to Rule 12b-1 under the Act. Under the Shareholder Services Plan, the Portfolio pays the Distributor a shareholder services fee, accrued daily and paid monthly, at an annual rate of 0.25% of the Portfolio's average daily net assets attributable to Class A shares.
The Fund has adopted a Distribution and Shareholder Services Plan with respect to Class L shares pursuant to Rule 12b-1 under the Act. Under the Distribution and Shareholder
Services Plan, the Portfolio pays the Distributor a distribution fee, accrued daily and paid monthly, at an annual rate of 0.50% and a shareholder services fee, accrued daily and paid monthly, at an annual rate of 0.25% of the Portfolio's average daily net assets attributable to Class L shares.
The distribution and shareholder services fees are used to support the expenses associated with servicing and maintaining accounts. The Distributor may compensate other parties for providing shareholder support services to investors who purchase Class A and Class L shares.
E. Dividend Disbursing and Transfer Agent: The Fund's dividend disbursing and transfer agent was Morgan Stanley Services Company Inc. ("Morgan Stanley Services"). Pursuant to a Transfer Agency Agreement, the Fund paid Morgan Stanley Services a fee based on the number of classes, accounts and transactions relating to the Portfolios of the Fund. Effective July 1, 2013, the Directors approved changing the transfer agent to Boston Financial Data Services, Inc.
F. Custodian Fees: State Street (the "Custodian") serves as Custodian for the Fund in accordance with a Custodian Agreement. The Custodian holds cash, securities, and other assets of the Fund as required by the Act. Custody fees are payable monthly based on assets held in custody, investment purchases and sales activity and account maintenance fees, plus reimbursement for certain out-of-pocket expenses.
G. Security Transactions and Transactions with Affiliates: For the year ended December 31, 2013, purchases and sales of investment securities for the Portfolio, other than long-term U.S. Government securities and short-term investments, were approximately $2,940,000 and $2,575,000, respectively. There were no purchases and sales of long-term U.S. Government securities for the year ended December 31, 2013.
The Portfolio invests in the Institutional Class of the Morgan Stanley Institutional Liquidity Funds — Money Market Portfolio (the "Liquidity Funds"), an open-end management investment company managed by the Adviser. Advisory fees paid by the Portfolio are reduced by an amount equal to its pro-rata share of the advisory and administration fees paid by the Portfolio due to its investment in the Liquidity Funds. For the year ended December 31, 2013, advisory fees paid were reduced by approximately $1,000 relating to the Portfolio's investment in the Liquidity Funds.
22
Morgan Stanley Institutional Fund, Inc.
Annual Report — December 31, 2013
Notes to Financial Statements (cont'd)
A summary of the Portfolio's transactions in shares of the Liquidity Funds during the year ended December 31, 2013 is as follows:
Value
December 31,
2012
(000) | | Purchases
at Cost
(000) | | Sales
(000) | | Dividend
Income
(000) | | Value
December 31,
2013
(000) | |
| $ | 473 | | | $ | 1,538 | | | $ | 2,011 | | | $ | — | @ | | | — | | |
@ Amount is less than $500.
H. Federal Income Taxes: It is the Portfolio's intention to continue to qualify as a regulated investment company and distribute all of its taxable and tax-exempt income. Accordingly, no provision for Federal income taxes is required in the financial statements.
The Portfolio may be subject to taxes imposed by countries in which it invests. Such taxes are generally based on income and/or capital gains earned or repatriated. Taxes are accrued based on net investment income, net realized gains and net unrealized appreciation as such income and/or gains are earned. Taxes may also be based on transactions in foreign currency and are accrued based on the value of investments denominated in such currency.
FASB ASC 740-10, Income Taxes — Overall, sets forth a minimum threshold for financial statement recognition of the benefit of a tax position taken or expected to be taken in a tax return. Management has concluded there are no significant uncertain tax positions that would require recognition in the financial statements. If applicable, the Portfolio recognizes interest accrued related to unrecognized tax benefits in "Interest Expense" and penalties in "Other Expenses" in the Statement of Operations. The Portfolio files tax returns with the U.S. Internal Revenue Service, New York and various states. Each of the tax years in the four-year period ended December 31, 2013, remains subject to examination by taxing authorities.
The tax character of distributions paid may differ from the character of distributions shown in the Statements of Changes in Net Assets due to short-term capital gains being treated as ordinary income for tax purposes. The tax character of distributions paid during fiscal years 2013 and 2012 was as follows:
2013
Distributions
Paid From: | | 2012
Distributions
Paid From: | |
Ordinary
Income
(000) | | Long-Term
Capital Gain
(000) | | Ordinary
Income
(000) | | Long-Term
Capital Gain
(000) | |
| $ | 51 | | | $ | 162 | | | $ | 37 | | | | — | | |
The amount and character of income and gains to be distributed are determined in accordance with income tax regulations which may differ from GAAP. These book/tax differences are either considered temporary or permanent in nature.
Temporary differences are attributable to differing book and tax treatments for the timing of the recognition of gains (losses) on certain investment transactions and the timing of the deductibility of certain expenses.
Permanent differences, primarily due to differing treatments of gains (losses) related to foreign currency transactions, resulted in the following reclassifications among the components of net assets at December 31, 2013:
Accumulated
Undistributed
Net Investment
Income
(000) | | Accumulated
Net Realized
Gain
(000) | | Paid-in-Capital
(000) | |
| $ | (1 | ) | | $ | 1 | | | $ | (— | @) | |
@ Amount is less than $500.
At December 31, 2013, the components of distributable earnings for the Portfolio on a tax basis were as follows:
Undistributed
Ordinary
Income
(000) | | Undistributed
Long-Term
Capital Gain
(000) | |
| $ | 3 | | | $ | 23 | | |
At December 31, 2013, the aggregate cost for Federal income tax purposes is approximately $5,837,000. The aggregate gross unrealized appreciation is approximately $2,336,000 and the aggregate gross unrealized depreciation is approximately $191,000 resulting in net unrealized appreciation of approximately $2,145,000.
To the extent that capital loss carryforwards are used to offset any future capital gains realized during the carryover period as provided by U.S. Federal income tax regulations, no capital gains tax liability will be incurred by the Portfolio for gains realized and not distributed. To the extent that capital gains are offset, such gains will not be distributed to the shareholders. During the year ended December 31, 2013, the Portfolio utilized capital loss carryforwards for U. S. Federal income tax purposes of approximately $198,000.
I. Result of Special Shareholder Meeting (unaudited): On June 5, 2013, a Joint Special Shareholder Meeting was held for Class H shareholders of the Portfolio to approve the Articles of Amendment to the Fund's Articles of Amendment and Restatement and a Plan of Reclassification for the Portfolio
23
Morgan Stanley Institutional Fund, Inc.
Annual Report — December 31, 2013
Notes to Financial Statements (cont'd)
pursuant to which Class H shares would be reclassified as Class P shares. The results with respect to this proposal were as follows:
| For | | Against | | Abstain | |
| | 10,000 | | | | 0 | | | | 0 | | |
J. Accounting Pronouncement: In June 2013, FASB issued Accounting Standards Update 2013-08 Financial Services — Investment Companies (Topic 946) — Amendments to the Scope, Measurement, and Disclosure Requirements ("ASU 2013-08") which is effective for interim and annual reporting periods in fiscal years that begin after December 15, 2013. ASU 2013-08 sets forth a methodology for determining whether an entity should be characterized as an investment company and prescribes fair value accounting for an investment company's non-controlling ownership interest in another investment company. FASB has determined that a fund registered under the Investment Company Act of 1940 automatically meets ASU 2013-08's criteria for an investment company. Although still evaluating the potential impacts of ASU 2013-08 to the Portfolio, management expects that the impact of the Portfolio's adoption will be limited to additional financial statement disclosures.
24
Morgan Stanley Institutional Fund, Inc.
Annual Report — December 31, 2013
Report of Independent Registered Public Accounting Firm
To the Shareholders and Board of Directors of
Morgan Stanley Institutional Fund, Inc. —
International Opportunity Portfolio
We have audited the accompanying statement of assets and liabilities, including the portfolio of investments, of International Opportunity Portfolio (one of the portfolios constituting Morgan Stanley Institutional Fund, Inc.) (the "Portfolio) as of December 31, 2013, and the related statement of operations for the year then ended, the statements of changes in net assets for each of the two years in the period then ended, and the financial highlights for each of the periods indicated therein. These financial statements and financial highlights are the responsibility of the Portfolio's management. Our responsibility is to express an opinion on these financial statements and financial highlights based on our audits.
We conducted our audits in accordance with the standards of the Public Company Accounting Oversight Board (United States). Those standards require that we plan and perform the audit to obtain reasonable assurance about whether the financial statements and financial highlights are free of material misstatement. We were not engaged to perform an audit of the Portfolio's internal control over financial reporting. Our audits included consideration of internal control over financial reporting as a basis for designing audit procedures that are appropriate in the circumstances, but not for the purpose of expressing an opinion on the effectiveness of the Portfolio's internal control over financial reporting. Accordingly, we express no such opinion. An audit also includes examining, on a test basis, evidence supporting the amounts and disclosures in the financial statements and financial highlights, assessing the accounting principles used and significant estimates made by management, and evaluating the overall financial statement presentation. Our procedures included confirmation of securities owned as of December 31, 2013, by correspondence with the custodian and others or by other appropriate auditing procedures where replies from others were not received. We believe that our audits provide a reasonable basis for our opinion.
In our opinion, the financial statements and financial highlights referred to above present fairly, in all material respects, the financial position of International Opportunity Portfolio (one of the portfolios constituting Morgan Stanley Institutional Fund, Inc.) at December 31, 2013, the results of its operations for the year then ended, the changes in its net assets for each of the two years in the period then ended, and the financial highlights for each of the periods indicated therein, in conformity with U.S. generally accepted accounting principles.

Boston, Massachusetts
February 26, 2014
25
Morgan Stanley Institutional Fund, Inc.
Annual Report — December 31, 2013
Federal Tax Notice (unaudited)
For Federal income tax purposes, the following information is furnished with respect to the distributions paid by the Portfolio during its taxable year ended December 31, 2013.
The Portfolio designated and paid approximately $162,000 as a long-term capital gain distribution.
In January, the Portfolio provides tax information to shareholders for the preceding calendar year.
26
Morgan Stanley Institutional Fund, Inc.
Annual Report — December 31, 2013
U.S. Privacy Policy (unaudited)
AN IMPORTANT NOTICE CONCERNING OUR U.S. PRIVACY POLICY
This privacy notice describes the U.S. privacy policy of Morgan Stanley Distribution, Inc., and the Morgan Stanley family of mutual funds ("us", "our", "we").
We are required by federal law to provide you with notice of our U.S. privacy policy ("Policy"). This Policy applies to both our current and former clients unless we state otherwise and is intended for individual clients who purchase products or receive services from us for personal, family or household purposes. This Policy is not applicable to partnerships, corporations, trusts or other non-individual clients or account holders, nor is this Policy applicable to individuals who are either beneficiaries of a trust for which we serve as trustee or participants in an employee benefit plan administered or advised by us. This Policy is, however, applicable to individuals who select us to be a custodian of securities or assets in individual retirement accounts, 401(k) accounts, or accounts subject to the Uniform Gifts to Minors Act.
This notice sets out our business practices to protect your privacy; how we collect and share personal information about you; and how you can limit our sharing or certain uses by others of this information. We may amend this Policy at any time, and will inform you of any changes to our Policy as required by law.
WE RESPECT YOUR PRIVACY
We appreciate that you have provided us with your personal financial information and understand your concerns about your information. We strive to safeguard the information our clients entrust to us. Protecting the confidentiality and security of client information is an important part of how we conduct our business.
This notice describes what personal information we collect about you, how we collect it, when we may share it with others, and how certain others may use it. It discusses the steps you may take to limit our sharing of certain information about you with our affiliated companies, including, but not limited to our affiliated banking businesses, brokerage firms and credit service affiliates. It also discloses how you may limit our affiliates' use of shared information for marketing purposes.
Throughout this Policy, we refer to the nonpublic information that personally identifies you as "personal information." We also use the term "affiliated company" in this notice. An affiliated company is a company in our family of companies and includes companies with the Morgan Stanley name. These affiliated companies are financial institutions such as broker-dealers, banks, investment advisers and credit card issuers. We refer to any company that is not an affiliated company as a nonaffiliated third party. For purposes of Section 5 of this notice, and your ability to limit certain uses of personal information by our affiliates, this notice applies to the use of personal information by our affiliated companies.
1. WHAT PERSONAL INFORMATION DO WE COLLECT FROM YOU?
We may collect the following types of information about you: (i) information provided by you, including information from applications and other forms we receive from you, (ii) information about your transactions with us or our affiliates, (iii) information about your transactions with nonaffiliated third parties, (iv) information from consumer reporting agencies, (v) information obtained from our websites, and (vi) information obtained from other sources. For example:
• We collect information such as your name, address, e-mail address, telephone/fax numbers, assets, income and investment objectives through applications and other forms you submit to us.
• We may obtain information about account balances, your use of account(s) and the types of products and services you prefer to receive from us through your dealings and transactions with us and other sources.
• We may obtain information about your creditworthiness and credit history from consumer reporting agencies.
• We may collect background information from and through third-party vendors to verify representations you have made and to comply with various regulatory requirements.
2. WHEN DO WE DISCLOSE PERSONAL INFORMATION WE COLLECT ABOUT YOU?
We may disclose personal information we collect about you in each of the categories listed above to affiliated and nonaffiliated third parties.
27
Morgan Stanley Institutional Fund, Inc.
Annual Report — December 31, 2013
U.S. Privacy Policy (unaudited) (cont'd)
a. Information we disclose to affiliated companies.
We may disclose personal information that we collect about you to our affiliated companies to manage your account(s) effectively, to service and process your transactions, and to let you know about products and services offered by us and affiliated companies, to manage our business, and as otherwise required or permitted by law. Offers for products and services from affiliated companies are developed under conditions designed to safeguard your personal information.
b. Information we disclose to third parties.
We may disclose personal information that we collect about you to nonaffiliated third parties to provide marketing services on our behalf or to other financial institutions with whom we have joint marketing agreements. We may also disclose all of the information we collect to other nonaffiliated third parties for our everyday business purposes, such as to process transactions, maintain account(s), respond to court orders and legal investigations, report to credit bureaus, offer our own products and services, protect against fraud, for institutional risk control, to perform services on our behalf, and as otherwise required or permitted by law.
When we share personal information about you with a nonaffiliated third party, they are required to limit their use of personal information about you to the particular purpose for which it was shared and they are not allowed to share personal information about you with others except to fulfill that limited purpose or as may be permitted or required by law.
3. HOW DO WE PROTECT THE SECURITY AND CONFIDENTIALITY OF PERSONAL INFORMATION WE COLLECT ABOUT YOU?
We maintain physical, electronic and procedural security measures that comply with applicable law and regulations to help safeguard the personal information we collect about you. We have internal policies governing the proper handling of client information by employees. Third parties that provide support or marketing services on our behalf may also receive personal information about you, and we require them to adhere to appropriate security standards with respect to such information.
4. HOW CAN YOU LIMIT OUR SHARING CERTAIN PERSONAL INFORMATION ABOUT YOU WITH OUR AFFILIATED COMPANIES FOR ELIGIBILITY DETERMINATION?
By following the opt-out procedures in Section 6 below, you may limit the extent to which we share with our affiliated companies, personal information that was collected to determine your eligibility for products and services such as your credit reports and other information that you have provided to us or that we may obtain from third parties ("eligibility information"). Eligibility information does not include your identification information or personal information pertaining to our transactions or experiences with you. Please note that, even if you direct us not to share eligibility information with our affiliated companies, we may still share your personal information, including eligibility information, with our affiliated companies under circumstances that are permitted under applicable law, such as to process transactions or to service your account.
5. HOW CAN YOU LIMIT THE USE OF CERTAIN PERSONAL INFORMATION ABOUT YOU BY OUR AFFILIATED COMPANIES FOR MARKETING?
By following the opt-out instructions in Section 6 below, you may limit our affiliated companies from marketing their products or services to you based on personal information we disclose to them. This information may include, for example, your income and account history with us. Please note that, even if you choose to limit our affiliated companies from using personal information about you that we may share with them for marketing their products and services to you, our affiliated companies may use your personal information that they obtain from us to market to you in circumstances permitted by law, such as if the affiliated party has its own relationship with you.
28
Morgan Stanley Institutional Fund, Inc.
Annual Report — December 31, 2013
U.S. Privacy Policy (unaudited) (cont'd)
6. HOW CAN YOU SEND US AN OPT-OUT INSTRUCTION?
If you wish to limit our sharing of eligibility information about you with our affiliated companies, or our affiliated companies' use of personal information for marketing purposes, as described in this notice, you may do so by:
• Calling us at (800) 548-7786
Monday–Friday between 8a.m. and 5p.m. (EST)
• Writing to us at the following address:
Boston Financial Data Services, Inc.
c/o Privacy Coordinator
P.O. Box 219804
Kansas City, Missouri 64121
If you choose to write to us, your request should include: your name, address, telephone number and account number(s) to which the opt-out applies and whether you are opting out with respect to sharing of eligibility information (Section 4 above), or information used for marketing (Section 5 above), or both. Written opt-out requests should not be sent with any other correspondence. In order to process your request, we require that the request be provided by you directly and not through a third party. Once you have informed us about your privacy preferences, your opt-out preference will remain in effect with respect to this Policy (as it may be amended) until you notify us otherwise. If you are a joint account owner, we will accept instructions from any one of you and apply those instructions to the entire account.
Please understand that if you limit our sharing or our affiliated companies' use of personal information, you and any joint account holder(s) may not receive information about our affiliated companies' products and services, including products or services that could help you manage your financial resources and achieve your investment objectives.
If you have more than one account or relationship with us, please specify the accounts to which you would like us to apply your privacy choices. If you have accounts or relationships with our affiliates, you may receive multiple privacy policies from them, and will need to separately notify those companies of your privacy choices for those accounts or relationships.
7. WHAT IF AN AFFILIATED COMPANY BECOMES A NONAFFILIATED THIRD PARTY?
If, at any time in the future, an affiliated company becomes a nonaffiliated third party, further disclosures of personal information made to the former affiliated company will be limited to those described in Section 2(b) above relating to nonaffiliated third parties. If you elected under Section 6 to limit disclosures we make to affiliated companies, or use of personal information by affiliated companies, your election will not apply to use by any former affiliated company of your personal information in their possession once it becomes a nonaffiliated third party.
SPECIAL NOTICE TO RESIDENTS OF VERMONT
The following section supplements our Policy with respect to our individual clients who have a Vermont address and supersedes anything to the contrary in the above Policy with respect to those clients only.
The State of Vermont requires financial institutions to obtain your consent prior to sharing personal information that they collect about you with nonaffiliated third parties, or eligibility information with affiliated companies, other than in certain limited circumstances. Except as permitted by law, we will not share personal information we collect about you with nonaffiliated third parties or eligibility information with affiliated companies, unless you provide us with your written consent to share such information.
SPECIAL NOTICE TO RESIDENTS OF CALIFORNIA
The following section supplements our Policy with respect to our individual clients who have a California address and supersedes anything to the contrary in the above Policy with respect to those clients only.
In response to a California law, if your account has a California home address, your personal information will not be disclosed to nonaffiliated third parties except as permitted by applicable California law, and we will limit sharing such personal information with our affiliates to comply with California privacy laws that apply to us.
29
Morgan Stanley Institutional Fund, Inc.
Annual Report — December 31, 2013
Director and Officer Information (unaudited)
Independent Director:
Name, Age and Address of
Independent Director | | Position(s)
Held with
Registrant | | Length of Time
Served* | | Principal Occupation(s) During Past 5 Years | | Number of
Portfolios in
Fund Complex
Overseen by
Independent
Director** | | Other Directorships
Held by Independent
Director*** | |
Frank L. Bowman (69)
c/o Kramer Levin Naftalis &
Frankel LLP
Counsel to the Independent
Directors
1177 Avenue of the Americas
New York, NY 10036 | | Director | | Since
August
2006 | | President, Strategic Decisions, LLC (consulting) (since February 2009); Director or Trustee of various Morgan Stanley Funds (since August 2006); Chairperson of the Insurance Sub-Committee of the Compliance and Insurance Committee (since February 2007); served as President and Chief Executive Officer of the Nuclear Energy Institute (policy organization) (February 2005-November 2008); retired as Admiral, U.S. Navy after serving over 38 years on active duty including 8 years as Director of the Naval Nuclear Propulsion Program in the Department of the Navy and the U.S. Department of Energy (1996-2004); served as Chief of Naval Personnel (July 1994-September 1996); and on the Joint Staff as Director of Political Military Affairs (June 1992-July 1994); knighted as Honorary Knight Commander of the Most Excellent Order of the British Empire; awarded the Officier de l'Orde National du Mérite by the French Government; elected to the National Academy of Engineering (2009). | | | 98 | | | Director of BP p.l.c.; Director of Naval and Nuclear Technologies LLP; Director of the Armed Services YMCA of the USA and the U.S. Naval Submarine League; Director of the American Shipbuilding Suppliers Association; Member of the National Security Advisory Council of the Center for U.S. Global Engagement and a member of the CNA Military Advisory Board; Chairman of the charity J Street Cup Golf; Trustee of Fairhaven United Methodist Church. | |
Michael Bozic (73)
c/o Kramer Levin Naftalis & Frankel LLP
Counsel to the Independent Directors
1177 Avenue of the Americas New York, NY 10036 | | Director | | Since
April
1994 | | Private investor and a member of the advisory board of American Road Group LLC (retail) (since June 2000); Chairperson of the Compliance and Insurance Committee (since October 2006); Director or Trustee of various Morgan Stanley Funds (since April 1994); formerly, Chairperson of the Insurance Committee (July 2006-September 2006); Vice Chairman of Kmart Corporation (December 1998-October 2000); Chairman and Chief Executive Officer of Levitz Furniture Corporation (November 1995-November 1998) and President and Chief Executive Officer of Hills Department Stores (May 1991-July 1995); variously Chairman, Chief Executive Officer, President and Chief Operating Officer (1987-1991) of the Sears Merchandise Group of Sears, Roebuck & Co. | | | 100 | | | Trustee and member of the Hillsdale College Board of Trustees. | |
Kathleen A. Dennis (60)
c/o Kramer Levin Naftalis & Frankel LLP
Counsel to the Independent Directors
1177 Avenue of the Americas New York, NY 10036 | | Director | | Since
August
2006 | | President, Cedarwood Associates (mutual fund and investment management consulting) (since July 2006); Chairperson of the Money Market and Alternatives Sub-Committee of the Investment Committee (since October 2006) and Director or Trustee of various Morgan Stanley Funds (since August 2006); formerly, Senior Managing Director of Victory Capital Management (1993-2006). | | | 98 | | | Director of various non-profit organizations. | |
Dr. Manuel H. Johnson (65)
c/o Johnson Smick
International, Inc.
220 I Street, NE — Suite 200
Washington, D.C. 20002 | | Director | | Since
July
1991 | | Senior Partner, Johnson Smick International, Inc. (consulting firm); Chairperson of the Investment Committee (since October 2006) and Director or Trustee of various Morgan Stanley Funds (since July 1991); Co-Chairman and a founder of the Group of Seven Council (G7C) (international economic commission); formerly, Chairperson of the Audit Committee (July 1991-September 2006), Vice Chairman of the Board of Governors of the Federal Reserve System and Assistant Secretary of the U.S. Treasury. | | | 101 | | | Director of NVR, Inc. (home construction). | |
30
Morgan Stanley Institutional Fund, Inc.
Annual Report — December 31, 2013
Director and Officer Information (unaudited) (cont'd)
Independent Director: (cont'd)
Name, Age and Address of
Independent Director | | Position(s)
Held with
Registrant | | Length of Time
Served* | | Principal Occupation(s) During Past 5 Years | | Number of
Portfolios in
Fund Complex
Overseen by
Independent
Director** | | Other Directorships
Held by Independent
Director*** | |
Joseph J. Kearns (71)
c/o Kearns & Associates LLC PMB754
22631 Pacific Coast Highway
Malibu, CA 90265 | | Director | | Since
August
1994 | | President, Kearns & Associates LLC (investment consulting); Chairperson of the Audit Committee (since October 2006) and Director or Trustee of various Morgan Stanley Funds (since August 1994); formerly, Deputy Chairperson of the Audit Committee (July 2003-September 2006) and Chairperson of the Audit Committee of various Morgan Stanley Funds (since August 1994); CFO of the J. Paul Getty Trust. | | | 101 | | | Director of Electro Rent Corporation (equipment leasing) and The Ford Family Foundation. | |
Michael F. Klein (55)
c/o Kramer Levin Naftalis & Frankel LLP
Counsel to the
Independent Directors
1177 Avenue of the Americas New York, NY 10036 | | Director | | Since
August
2006 | | Managing Director, Aetos Capital, LLC (since March 2000); Co-President, Aetos Alternatives Management, LLC (since January 2004) and Co-Chief Executive Officer of Aetos Capital LLC (since August 2013); Chairperson of the Fixed Income Sub-Committee of the Investment Committee (since October 2006) and Director or Trustee of various Morgan Stanley Funds (since August 2006); formerly, Managing Director, Morgan Stanley & Co. Inc. and Morgan Stanley Dean Witter Investment Management, President, various Morgan Stanley Funds (June 1998-March 2000) and Principal, Morgan Stanley & Co. Inc. and Morgan Stanley Dean Witter Investment Management (August 1997-December 1999). | | | 98 | | | Director of certain investment funds managed or sponsored by Aetos Capital, LLC. Director of Sanitized AG and Sanitized Marketing AG (specialty chemicals). | |
Michael E. Nugent (77)
522 Fifth Avenue
New York, NY 10036 | | Chairperson
of the
Board and Director | | Chairperson of the Boards since July 2006 and Director since July 1991 | | Chairperson of the Boards of various Morgan Stanley Funds (since July 2006); Chairperson of the Closed-End Fund Committee (since June 2012) and Director or Trustee of various Morgan Stanley Funds (since July 1991); formerly, Chairperson of the Insurance Committee (until July 2006); General Partner, Triumph Capital, L.P. (private investment partnership) (1988-2013). | | | 100 | | | None. | |
W. Allen Reed (66)
c/o Kramer Levin Naftalis & Frankel LLP
Counsel to the
Independent Directors
1177 Avenue of the Americas New York, NY 10036 | | Director | | Since
August
2006 | | Chairperson of the Equity Sub-Committee of the Investment Committee (since October 2006) and Director or Trustee of various Morgan Stanley Funds (since August 2006); formerly, President and CEO of General Motors Asset Management; Chairman and Chief Executive Officer of the GM Trust Bank and Corporate Vice President of General Motors Corporation (August 1994-December 2005). | | | 98 | | | Director of Temple-Inland Industries (packaging and forest products); Director of Legg Mason, Inc. and Director of the Auburn University Foundation. | |
Fergus Reid (81)
c/o Joe Pietryka, Inc.
85 Charles Colman Blvd. Pawling, NY 12564 | | Director | | Since
June
1992 | | Chairman, Joe Pietryka, Inc.; Chairperson of the Governance Committee and Director or Trustee of various Morgan Stanley Funds (since June 1992). | | | 101 | | | Through December 31, 2012, Trustee and Director of certain Investment companies in the JPMorgan Fund Complex. | |
31
Morgan Stanley Institutional Fund, Inc.
Annual Report — December 31, 2013
Director and Officer Information (unaudited) (cont'd)
Interested Director:
Name, Age and Address of
Interested Director | | Position(s)
Held with
Registrant | | Length of
Time Served* | | Principal Occupation(s) During Past 5 Years | | Number of
Portfolios in
Fund Complex
Overseen by
Interested
Director** | | Other Directorships
Held by Interested
Director*** | |
James F. Higgins (66)
One New York Plaza
New York, NY 10004 | | Director | | Since
June
2000 | | Director or Trustee of various Morgan Stanley Funds (since June 2000); Senior Advisor of Morgan Stanley (since August 2000). | �� | | 99 | | | Formerly, Director of AXA Financial, Inc. and AXA Equitable Life Insurance Company (2002-2011) and Director of AXA MONY Life Insurance Company and AXA MONY Life Insurance Company of America (2004-2011). | |
* Each Director serves an indefinite term, until his or her successor is elected.
** The Fund Complex includes (as of December 31, 2013) all open-end and closed-end funds (including all of their portfolios) advised by Morgan Stanley Investment Management Inc. (the "Adviser") and any funds that have an adviser that is an affiliated person of the Adviser (including, but not limited to, Morgan Stanley AIP GP LP).
*** This includes any directorships at public companies and registered investment companies held by the Director at any time during the past five years.
32
Morgan Stanley Institutional Fund, Inc.
Annual Report — December 31, 2013
Director and Officer Information (unaudited) (cont'd)
Executive Officers:
Name, Age and Address of Executive Officer | | Position(s) Held
with
Registrant | | Length of
Time Served* | | Principal Occupation(s) During Past 5 Years | |
John H. Gernon (50)
522 Fifth Avenue
New York, NY 10036 | | President and Principal Executive Officer—Equity, Fixed Income and AIP Funds | | Since
September
2013 | | President and Principal Executive Officer of the Equity and Fixed Income Funds and the Morgan Stanley AIP Funds (since September 2013) in the Fund Complex. Managing Director of the Adviser. | |
Stefanie V. Chang Yu (47)
522 Fifth Avenue
New York, NY 10036 | | Chief Compliance Officer | | Since
January
2014 | | Managing Director of the Adviser and various entities affiliated with the Adviser; Chief Compliance Officer of various Morgan Stanley Funds and the Adviser (since January 2014). Formerly, Vice President of various Morgan Stanley Funds (December 1997-January 2014). | |
Joseph C. Benedetti (48)
522 Fifth Avenue
New York, NY 10036 | | Vice President | | Since
January
2014 | | Managing Director of the Adviser and various entities affiliated with the Adviser; Vice President of various Morgan Stanley Funds (since January 2014). Formerly, Assistant Secretary of various Morgan Stanley Funds (October 2004-January 2014). | |
Francis J. Smith (48)
522 Fifth Avenue
New York, NY 10036 | | Treasurer and Principal Financial Officer | | Treasurer since July 2003 and Principal Financial Officer since September 2002 | | Executive Director of the Adviser and various entities affiliated with the Adviser; Treasurer and Principal Financial Officer of various Morgan Stanley Funds (since July 2003). | |
Mary E. Mullin (46)
522 Fifth Avenue
New York, NY 10036 | | Secretary | | Since
June
1999 | | Executive Director of the Adviser and various entities affiliated with the Adviser; Secretary of various Morgan Stanley Funds (since June 1999). | |
* Each officer serves an indefinite term, until his or her successor is elected.
33
Morgan Stanley Institutional Fund, Inc.
Annual Report — December 31, 2013
Adviser and Administrator
Morgan Stanley Investment Management Inc.
522 Fifth Avenue
New York, New York 10036
Distributor
Morgan Stanley Distribution, Inc.
522 Fifth Avenue
New York, New York 10036
Dividend Disbursing and Transfer Agent
Boston Financial Data Services, Inc.
2000 Crown Colony Drive
Quincy, Massachusetts 02169
Custodian
State Street Bank and Trust Company
One Lincoln Street
Boston, Massachusetts 02111
Legal Counsel
Dechert LLP
1095 Avenue of the Americas
New York, New York 10036
Counsel to the Independent Directors
Kramer Levin Naftalis & Frankel LLP
1177 Avenue of the Americas
New York, New York 10036
Independent Registered Public Accounting Firm
Ernst & Young LLP
200 Clarendon Street
Boston, Massachusetts 02116
Reporting to Shareholders
Each Morgan Stanley fund provides a complete schedule of portfolio holdings in its semi-annual and annual reports within 60 days of the end of the fund's second and fourth fiscal quarters by filing the schedule electronically with the Securities and Exchange Commission (SEC). The semi-annual reports are filed on Form N-CSRS and the annual reports are filed on Form N-CSR. Morgan Stanley also delivers the semi-annual and annual reports to fund shareholders and makes these reports available on its public website, www.morganstanley.com/im. Each Morgan Stanley fund also files a complete schedule of portfolio holdings with the SEC for the fund's first and third fiscal quarters on Form N-Q. Morgan Stanley does not deliver the reports for the first and third fiscal quarters to shareholders, nor are the reports posted to the Morgan Stanley public website. You may, however, obtain the Form N-Q filings (as well as the Form N-CSR and N-CSRS filings) by accessing the SEC's website, www.sec.gov. You may also review and copy them at the SEC's Public Reference Room in Washington, DC. Information on the operation of the SEC's Public Reference Room may be obtained by calling the SEC toll free at 1 (800) SEC-0330. You can also request copies of these materials, upon payment of a duplicating fee, by electronic request at the SEC's email address (publicinfo@sec.gov) or by writing the Public Reference Room of the SEC, Washington, DC 20549-0102.
Proxy Voting Policies and Procedures and Proxy Voting Record
You may obtain a copy of the Fund's Proxy Voting Policy and Procedures and information regarding how the Fund voted proxies relating to portfolio securities during the most recent twelve-month period ended June 30, without charge, upon request, by calling toll free 1 (800) 548-7786 or by visiting our website at www.morganstanley.com/im. This information is also available on the SEC's website at www.sec.gov.
This report is authorized for distribution only when preceded or accompanied by a prospectus of the Morgan Stanley Institutional Fund, Inc. which describes in detail each Investment Portfolio's investment policies, risks, fees and expenses. Please read the prospectus carefully before you invest or send money. For additional information, including information regarding the investments comprising the Portfolio, please visit our website at www.morganstanley.com/im or call toll free 1 (800) 548-7786.
34
(This Page has been left blank intentionally.)
(This Page has been left blank intentionally.)
(This Page has been left blank intentionally.)
Printed in U.S.A.
This Report has been prepared for shareholders and may be distributed to others only if preceded or accompanied by a current prospectus.
Morgan Stanley Investment Management Inc.
522 Fifth Avenue
New York, New York 10036
© 2014 Morgan Stanley. Morgan Stanley Distribution, Inc.

IFIIIOANN
810187 EXP 2.28.15

Morgan Stanley Institutional Fund, Inc.
Select Global Infrastructure Portfolio
Annual Report
December 31, 2013

Morgan Stanley Institutional Fund, Inc.
Annual Report — December 31, 2013
Shareholders' Letter | | | 2 | | |
Expense Example | | | 3 | | |
Investment Overview | | | 4 | | |
Portfolio of Investments | | | 8 | | |
Statement of Assets and Liabilities | | | 10 | | |
Statement of Operations | | | 12 | | |
Statements of Changes in Net Assets | | | 13 | | |
Financial Highlights | | | 15 | | |
Notes to Financial Statements | | | 19 | | |
Report of Independent Registered Public Accounting Firm | | | 26 | | |
Federal Tax Notice | | | 27 | | |
U.S. Privacy Policy | | | 28 | | |
Director and Officer Information | | | 31 | | |
This report is authorized for distribution only when preceded or accompanied by prospectuses of the Morgan Stanley Institutional Fund, Inc. To receive a prospectus and/or statement of additional information (SAI), which contains more complete information such as investment objectives, charges, expenses, policies for voting proxies, risk considerations, and describes in detail each of the Portfolio's investment policies to the prospective investor, please call toll free 1 (800) 548-7786. Please read the prospectuses carefully before you invest or send money.
Additionally, you can access portfolio information including performance, characteristics, and investment team commentary through Morgan Stanley Investment Management's website: www.morganstanley.com/im.
Market forecasts provided in this report may not necessarily come to pass. There is no guarantee that any sectors mentioned will continue to perform as discussed herein or that securities in such sectors will be held by the Portfolio in the future. There is no assurance that a Portfolio will achieve its investment objective. Portfolios are subject to market risk, which is the possibility that market values of securities owned by the Portfolio will decline and, therefore, the value of the Portfolio's shares may be less than what you paid for them. Accordingly, you can lose money investing in the Portfolio. Please see the prospectus for more complete information on investment risks.
1
Morgan Stanley Institutional Fund, Inc.
Annual Report — December 31, 2013
Shareholders' Letter (unaudited)
Dear Shareholders,
We are pleased to provide this Annual report, in which you will learn how your investment in Select Global Infrastructure Portfolio (the "Portfolio") performed during the latest twelve-month period.
Morgan Stanley Investment Management is a client-centric, investor-led organization. Our global presence, intellectual capital, and breadth of products and services enable us to partner with investors to meet the evolving challenges of today's financial markets. We aim to deliver superior investment service and to empower our clients to make the informed decisions that help them reach their investment goals.
As always, we thank you for selecting Morgan Stanley Investment Management, and look forward to working with you in the months and years ahead.
Sincerely,

John H. Gernon
President and Principal Executive Officer
January 2014
2
Morgan Stanley Institutional Fund, Inc.
Annual Report — December 31, 2013
Expense Example (unaudited)
Select Global Infrastructure Portfolio
As a shareholder of the Portfolio, you incur two types of costs: (1) transactional costs; and (2) ongoing costs, including advisory fees, administration fees, distribution and shareholder services fees and other Portfolio expenses. This example is intended to help you understand your ongoing costs (in dollars) of investing in the Portfolio and to compare these costs with the ongoing costs of investing in other mutual funds.
This example is based on an investment of $1,000 invested at the beginning of the six-month period ended December 31, 2013 and held for the entire six-month period.
Actual Expenses
The table below provides information about actual account values and actual expenses. You may use the information in this table, together with the amount you invested, to estimate the expenses that you paid over the period. Simply divide your account value by $1,000 (for example, an $8,600 account value divided by $1,000 = 8.6), then multiply the result by the number in the table under the heading entitled "Actual Expenses Paid During Period" to estimate the expenses you paid on your account during this period.
Hypothetical Example for Comparison Purposes
The table below provides information about hypothetical account values and hypothetical expenses based on the Portfolio's actual expense ratio and an assumed rate of return of 5% per year before expenses, which is not the Portfolio's actual return. The hypothetical account values and expenses may not be used to estimate the actual ending account balance or expenses you paid for the period. You may use this information to compare the ongoing costs of investing in the Portfolio and other funds. To do so, compare this 5% hypothetical example with the 5% hypothetical examples that appear in the shareholder reports of the other funds.
Please note that the expenses shown in the table are meant to highlight your ongoing costs only and do not reflect any transactional costs, such as sales charges (loads). Therefore, the information for each class in the table is useful in comparing ongoing costs only, and will not help you determine the relative total costs of owning different funds. In addition, if these transactional costs were included, your costs would have been higher.
| | | Beginning
Account
Value
7/1/13 | | Actual Ending
Account
Value
12/31/13 | | Hypothetical
Ending Account
Value | | Actual
Expenses
Paid
During
Period | | Hypothetical
Expenses Paid
During Period | | Net
Expense
Ratio
During
Period*** | |
Select Global Infrastructure Portfolio Class I | | $ | 1,000.00 | | | $ | 1,121.80 | | | $ | 1,019.61 | * | | $ | 5.94 | * | | $ | 5.65 | | | | 1.11 | % | |
Select Global Infrastructure Portfolio Class A^ | | | 1,000.00 | | | | 1,120.40 | | | | 1,018.30 | * | | | 7.32 | * | | | 6.97 | | | | 1.37 | | |
Select Global Infrastructure Portfolio Class L | | | 1,000.00 | | | | 1,117.00 | | | | 1,015.38 | * | | | 10.41 | * | | | 9.91 | | | | 1.95 | | |
Select Global Infrastructure Portfolio Class IS | | | 1,000.00 | | | | 1,096.00 | | | | 1,011.52 | ** | | | 3.29 | ** | | | 3.15 | | | | 1.07 | | |
* Expenses are calculated using each Portfolio Class' annualized net expense ratio (as disclosed), multiplied by the average account value over the period, and multiplied by 184/365 (to reflect the most recent one-half year period).
** Expenses are calculated using the Portfolio Class' annualized net expense ratio (as disclosed), multiplied by the average account value over the period, and multiplied by 107/365 (to reflect the actual days in the period).
*** Annualized.
^ Effective September 9, 2013, Class P and Class H shares were renamed Class A shares.
3
Morgan Stanley Institutional Fund, Inc.
Annual Report — December 31, 2013
Investment Overview (unaudited)
Select Global Infrastructure Portfolio
The Select Global Infrastructure Portfolio seeks to provide both capital appreciation and income.
Performance
For the year ended December 31, 2013, the Portfolio had a total return based on net asset value and reinvestment of distributions per share of 17.91%, net of fees, for Class I shares. The Portfolio's Class I shares outperformed against its benchmark, the Dow Jones Brookfield Global Infrastructure IndexSM (the "Index"), which returned 15.89%, and underperformed against its benchmark, the S&P Global BMI Index, a proxy for global equities, which returned 24.12%. Please keep in mind that high double-digit returns are highly unusual and cannot be sustained.
Factors Affecting Performance
• Infrastructure shares appreciated 15.89% during the period, as measured by the Index. Among the major infrastructure sectors, the gas midstream, toll roads, gas distribution utilities, and European regulated utilities outperformed the Index, while the pipeline companies, electricity transmission and distribution, and communications sectors underperformed the Index. Among sectors with more modest benchmark weightings, the diversified and airports sectors exhibited meaningful outperformance relative to the benchmark.
• For full-year 2013, the Portfolio realized meaningful outperformance from bottom-up stock selection, only partially offset by adverse top-down positioning. From a bottom-up perspective, stock selection was neutral or provided positive attribution in all sectors aside from toll roads. From a top-down perspective, the Portfolio benefited from underweights to the electricity transmission and distribution and gas distribution sectors, as well as an overweight to the airports sector, offset by relative weakness from an overweight to pipeline companies and an underweight to gas midstream and European regulated utilities. Cash held in the Portfolio detracted from relative performance.
• 2013 global equity performance reflected a more positive outlook toward economic growth and the belief that many economies have "turned a corner" — in particular the developed markets of the U.S. and Europe (and to a lesser extent Japan). This was partially offset by concerns over the impact of rising interest rates in the U.S. and their effect on U.S. equity valuations as well as the
spillover impact for emerging market economies, currencies, and equity markets. The equity securities of infrastructure companies were not entirely immune to these broad trends in 2013, and were generally visible in the strong performance of more gross domestic product (GDP) — leveraged transportation sectors such as rails, toll roads, and airports and the weakness in more stable sectors that were viewed by the market as "bond proxies" such as electricity transmission and distribution, communications, and pipeline companies. However, on a local currency basis, favorable returns were realized within all broad regions.
• Favorable performance for the European regulated utilities sector was the result of improved clarity and a more positive outlook for transmission company regulation in Spain (in particular on the electricity side) as well as the resolution of gas network regulation in Italy, which underscored the stability of regulation in the country despite ongoing uncertainty in Italian politics and the potential for political interference. Ongoing merger and acquisition (M&A) interest in U.K. utility assets, in particular in the water space, also provided an uplift for the sector.
• Underperformance for the electricity transmission and distribution sector was broadly attributable to concerns over valuation in the context of rising U.S. interest rates. Challenges to company returns on capital by customers and other stakeholders, as well as by adverse regulatory rulings, also had a modest negative impact on the sector.
• Within the gas distribution utilities sector, the potential for midstream asset (MLP) spin-offs as well as M&A speculation favorably impacted U.S.-based gas distribution utilities in 2013. Within Chinese gas distribution, ongoing support by the central government for natural gas (as a way to de-carbonize the environment), coupled with resilient company operating results despite a slowing Chinese economy, drove favorable results.
• Underperformance in pipeline companies broadly reflected a negative view on valuation in a rising interest rate environment, despite robust operating fundamentals, with company capital programs at record highs. Negative performance by a Canadian company weighed heavily on sector results, due to the general view that the northern leg of the
4
Morgan Stanley Institutional Fund, Inc.
Annual Report — December 31, 2013
Investment Overview (unaudited) (cont'd)
Select Global Infrastructure Portfolio
Keystone XL pipeline will not be approved by the Obama administration.
• The gas midstream sector's outperformance reflected ongoing rapid cash flow growth supported by sizable capital programs, as well as a number of spinoff and restructuring transactions which highlighted the value of general partner economics embedded within many c-corp energy infrastructure companies.
• In the communications sector, weakness in wireless tower companies reflected concerns over valuation in a rising interest rate environment, as well as concerns regarding a slowdown in lease up activity by the big four wireless carriers in the U.S.
• Outperformance of the toll roads, airports and ports sector in 2013 was largely the result of an improved outlook for traffic/container volumes associated with an improving global economy. However, it is important to note that for many of the transportation companies, in particular those in Europe, strong share price performance was associated with multiple expansion (i.e., the expectation of a recovery), as operating fundamentals and underlying cash flows still reflected little growth. For airports, despite lackluster traffic growth in general, strong retail performance and a moderation in the capital expenditures (capex) cycle helped returns.
• Modest underperformance was realized in the water sector in 2013 as relatively robust performance in the U.S. was offset by negative absolute performance in Brazil, where the regulatory outlook remained uncertain over the near term and share prices suffered alongside the broader Brazilian equity market.
Management Strategies
• Given recent strong performance and a narrowing gap between our view of intrinsic, private market infrastructure value and share prices in a number of infrastructure sectors, we begin 2014 with lower expected returns for the sector. However, we believe an allocation to global listed infrastructure securities can continue to provide investors with favorable risk-adjusted absolute returns and little overlap to the broader equity markets. Furthermore, we continue to be able to invest in companies that we believe trade at meaningful discounts to intrinsic value. Imbedded into our current view on valuation
is a belief that capex programs in certain sectors, most notably energy infrastructure and the wireless tower portion of the communications sector, could begin to moderate in the medium term (from record-high, industry-wide capital spending in the tens of billions of U.S. dollars). We would also reiterate that we view rising interest rates and the impact of the Federal Reserve "taper" — commonly cited as the most significant headwind for the sector — as more of a near-term, manageable risk, given that many infrastructure companies have various methods to adjust cash flows to accommodate higher debt costs, and we do not believe share prices reflected the low in cost of capital during the past period of low interest rates.
• In terms of opportunities for 2014, we would note the following:
1) Valuations in the fixed satellite services (FSS) portion of the communications sector look increasingly attractive (in spite of some near to medium-term operating headwinds), as do a number of companies in the energy infrastructure and utilities sectors, even though sector-wide valuations appear less compelling.
2) More opportunities may develop in the transportation-leveraged sectors, in particular in Europe, as the global economy recovers. While we maintain a more cautious view on continental Europe and a global recovery overall — and have reflected this view in our company-specific underwriting — we acknowledge that there is scope for upside as recent data points seem to indicate an upturn in economic activity in a number of regions.
3) We view a number of emerging markets infrastructure companies as increasingly attractive from a valuation standpoint, as country-level macro concerns are overwhelming stable company-level operating fundamentals in a number of cases. As a reminder, the Portfolio historically has and will continue to focus on developed market infrastructure companies which manage brownfield infrastructure assets, but we may look to invest a small portion of the Portfolio in greenfield infrastructure assets in emerging markets should the return prospects be appropriate relative to the level of risk.
• We remain committed to our core investment philosophy as an infrastructure value investor. As
5
Morgan Stanley Institutional Fund, Inc.
Annual Report — December 31, 2013
Investment Overview (unaudited) (cont'd)
Select Global Infrastructure Portfolio
value-oriented, bottom-up driven investors, our investment perspective is that over the medium- and long-term, the key factor in determining the performance of infrastructure securities will be underlying infrastructure asset values. Given the large and growing private infrastructure market, we believe that there are limits as to the level of premium or discount at which the public sector should trade relative to its underlying private infrastructure value. These limits can be viewed as the point at which the arbitrage opportunity between owning infrastructure in the private versus public markets becomes compelling. In aiming to achieve core infrastructure exposure in a cost-effective manner, we invest in equity securities of publicly listed infrastructure companies we believe offer the best value relative to their underlying infrastructure value and Net Asset Value growth prospects.
• Our research currently leads us to an overweighting in the Portfolio (amongst the largest sectors) to a group of companies in the pipeline, communications and toll road sectors, and an underweighting to companies in the gas distribution utilities, gas midstream, European regulated utilities, and electricity transmission and distribution sectors. Amongst the smaller sectors, we maintain an overweight to airports and have initiated an overweight to the water sector.
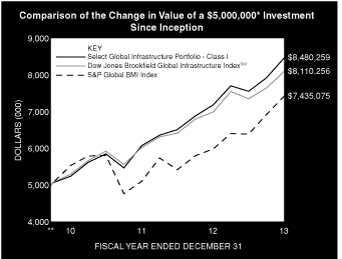
* Minimum Investment for Class I shares
** Commenced Operations on September 20, 2010.
In accordance with SEC regulations, Portfolio's performance shown assumes that all recurring fees (including management fees) were deducted and all dividends and distributions were reinvested. The performance of Class A+, L and IS shares will
vary from Class I shares and will be negatively impacted by additional fees assessed to those classes (if applicable).
Performance Compared to the Dow Jones Brookfield Global Infrastructure IndexSM(1) and the S&P Global BMI Index(2)
| | | Period Ended December 31, 2013
Total Returns(3) | |
| | | | | Average Annual | |
| | | One
Year | | Five
Years | | Ten
Years | | Since
Inception(6) | |
Portfolio — Class I Shares
w/o sales charges(4) | | | 17.91 | % | | | — | | | | — | | | | 17.48 | % | |
Dow Jones Brookfield Global
Infrastructure IndexSM | | | 15.89 | | | | — | | | | — | | | | 15.89 | | |
S&P Global BMI Index | | | 24.12 | | | | — | | | | — | | | | 12.86 | | |
Portfolio — Class A+ Shares
w/o sales charges(4) | | | 17.69 | | | | — | | | | — | | | | 17.19 | | |
Portfolio — Class A+ Shares
with maximum 5.25% sales
charges(4) | | | 11.55 | | | | — | | | | — | | | | 15.29 | | |
Dow Jones Brookfield
Global Infrastructure IndexSM | | | 15.89 | | | | — | | | | — | | | | 15.89 | | |
S&P Global BMI Index | | | 24.12 | | | | — | | | | — | | | | 12.86 | | |
Portfolio — Class L Shares
w/o sales charges(4) | | | 16.98 | | | | — | | | | — | | | | 16.59 | | |
Dow Jones Brookfield
Global Infrastructure IndexSM | | | 15.89 | | | | — | | | | — | | | | 15.89 | | |
S&P Global BMI Index | | | 24.12 | | | | — | | | | — | | | | 12.86 | | |
Portfolio — Class IS Shares
w/o sales charges(5) | | | — | | | | — | | | | — | | | | 9.60 | | |
Dow Jones Brookfield
Global Infrastructure IndexSM | | | — | | | | — | | | | — | | | | 8.96 | | |
S&P Global BMI Index | | | — | | | | — | | | | — | | | | 8.25 | | |
Performance data quoted represents past performance, which is no guarantee of future results, and current performance may be lower or higher than the figures shown. Performance assumes that all dividends and distributions, if any, were reinvested. For the most recent month-end performance figures, please visit www.morganstanley.com/im. Investment return and principal value will fluctuate so that Portfolio shares, when redeemed, may be worth more or less than their original cost. Total returns do not reflect the deduction of taxes that a shareholder would pay on Portfolio distributions or the redemption of Portfolio shares. Returns for periods less than one year are not annualized. Performance of share classes will vary due to difference in sales charges and expenses.
+ Effective September 9, 2013, Class P shares were renamed Class A shares.
(1) The Dow Jones Brookfield Global Infrastructure IndexSM is a float-adjusted market capitalization weighted index that measures the stock performance of companies that exhibit strong infrastructure characteristics. The Index intends to measure all sectors of the infrastructure market. The Index is unmanaged and its returns do not include any sales charges or fees. Such costs would lower performance. It is not possible to invest directly in an index.
(2) The Standard & Poor's Global BMI Index (S&P Global BMI Index) is a broad market index designed to capture exposure to equities in all countries in the world that meet minimum size and liquidity requirements. As of the date of this Report, there are approximately 11,000 index members representing 26 developed and 20 emerging market countries. The Index is unmanaged and its returns do not include any sales charges or fees. Such costs would lower performance. It is not possible to invest directly in an index.
6
Morgan Stanley Institutional Fund, Inc.
Annual Report — December 31, 2013
Investment Overview (unaudited) (cont'd)
Select Global Infrastructure Portfolio
(3) Total returns for the Portfolio reflect fees waived and expenses reimbursed, if applicable, by the Adviser. Without such waivers and reimbursements, total returns would have been lower. The fee waivers and/or expense reimbursements will continue for at least one year or until such time as the Fund's Board of Directors acts to discontinue all or a portion of such waivers and/or expense reimbursements when it deems that such action is appropriate.
(4) Commenced operations on September 20, 2010.
(5) Commenced offering on September 13, 2013.
(6) For comparative purposes, average annual since inception returns listed for the Indexes refer to the inception date or initial offering of the respective share class of the Portfolio, not the inception of the Index. Returns for periods less than one year are not annualized.
Portfolio Composition
Classification* | | Percentage of
Total Investments | |
Oil & Gas Storage & Transportation | | | 45.2 | % | |
Communications | | | 14.8 | | |
Transmission & Distribution | | | 13.2 | | |
Investment Company | | | 6.0 | | |
Water | | | 5.7 | | |
Toll Roads | | | 5.4 | | |
Airports | | | 5.0 | | |
Other** | | | 4.7 | | |
Total Investments | | | 100.0 | % | |
* Percentages indicated are based upon total investment (excluding Securities held as Collateral on Loaned Securities) as of December 31, 2013.
** Industries and/or investment types representing less than 5% of total investments.
7
Morgan Stanley Institutional Fund, Inc.
Annual Report — December 31, 2013
Portfolio of Investments
Select Global Infrastructure Portfolio
| | | Shares | | Value
(000) | |
Common Stocks (94.3%) | |
Australia (3.6%) | |
APA Group (a) | | | 6,817 | | | $ | 36 | | |
DUET Group (a) | | | 45,208 | | | | 81 | | |
Macquarie Atlas Roads Group | | | 66,816 | | | | 164 | | |
Spark Infrastructure Group | | | 51,867 | | | | 75 | | |
Sydney Airport | | | 43,217 | | | | 147 | | |
Transurban Group (a) | | | 97,545 | | | | 596 | | |
| | | | 1,099 | | |
Austria (1.1%) | |
Flughafen Wien AG | | | 4,107 | | | | 345 | | |
Brazil (2.1%) | |
CCR SA | | | 7,800 | | | | 59 | | |
Cia de Saneamento Basico do Estado
de Sao Paulo ADR (a) | | | 52,256 | | | | 592 | | |
| | | | 651 | | |
Canada (13.2%) | |
Enbridge, Inc. (a) | | | 35,001 | | | | 1,529 | | |
TransCanada Corp. (a) | | | 55,170 | | | | 2,521 | | |
| | | | 4,050 | | |
China (4.1%) | |
Beijing Enterprises Holdings Ltd. (b) | | | 47,500 | | | | 471 | | |
China Gas Holdings Ltd. (b) | | | 122,000 | | | | 179 | | |
China Merchants Holdings
International Co., Ltd. (b) | | | 31,527 | | | | 115 | | |
ENN Energy Holdings Ltd. (b) | | | 22,000 | | | | 163 | | |
Guangdong Investment Ltd. (b) | | | 174,000 | | | | 170 | | |
Jiangsu Expressway Co., Ltd. H Shares (b) | | | 122,000 | | | | 150 | | |
| | | | 1,248 | | |
France (3.6%) | |
Eutelsat Communications SA | | | 18,721 | | | | 584 | | |
SES SA | | | 16,317 | | | | 528 | | |
| | | | 1,112 | | |
Germany (2.2%) | |
Fraport AG Frankfurt Airport Services Worldwide | | | 9,250 | | | | 692 | | |
Italy (6.0%) | |
Atlantia SpA (a) | | | 24,695 | | | | 554 | | |
Snam SpA | | | 176,799 | | | | 989 | | |
Societa Iniziative Autostradali e Servizi SpA | | | 5,176 | | | | 52 | | |
Terna Rete Elettrica Nazionale SpA | | | 49,843 | | | | 249 | | |
| | | | 1,844 | | |
Japan (1.9%) | |
Tokyo Gas Co., Ltd. | | | 119,000 | | | | 585 | | |
Luxembourg (1.1%) | |
Intelsat SA (c) | | | 14,700 | | | | 331 | | |
Netherlands (1.5%) | |
Koninklijke Vopak N.V. | | | 7,959 | | | | 466 | | |
Spain (2.1%) | |
Abertis Infraestructuras SA (a) | | | 7,440 | | | | 165 | | |
Ferrovial SA | | | 16,650 | | | | 322 | | |
Red Electrica Corp., SA (a) | | | 2,360 | | | | 158 | | |
| | | | 645 | | |
| | | Shares | | Value
(000) | |
Switzerland (1.2%) | |
Flughafen Zuerich AG (Registered) | | | 631 | | | $ | 369 | | |
United Kingdom (7.1%) | |
National Grid PLC | | | 118,644 | | | | 1,548 | | |
Pennon Group PLC | | | 14,630 | | | | 160 | | |
Severn Trent PLC | | | 11,450 | | | | 323 | | |
United Utilities Group PLC | | | 12,350 | | | | 137 | | |
| | | | 2,168 | | |
United States (43.5%) | |
American Tower Corp. REIT | | | 16,740 | | | | 1,336 | | |
American Water Works Co., Inc. | | | 12,880 | | | | 544 | | |
Atmos Energy Corp. | | | 4,130 | | | | 188 | | |
CenterPoint Energy, Inc. | | | 32,230 | | | | 747 | | |
Cheniere Energy, Inc. (c) | | | 7,720 | | | | 333 | | |
Crown Castle International Corp. (c) | | | 15,430 | | | | 1,133 | | |
Enbridge Energy Management LLC (a)(c) | | | 11,399 | | | | 327 | | |
ITC Holdings Corp. | | | 9,611 | | | | 921 | | |
Kinder Morgan, Inc. | | | 19,654 | | | | 707 | | |
NiSource, Inc. | | | 13,110 | | | | 431 | | |
Northeast Utilities | | | 11,480 | | | | 487 | | |
Oneok, Inc. | | | 15,110 | | | | 939 | | |
PG&E Corp. | | | 15,500 | | | | 624 | | |
Plains GP Holdings LP, Class A (c) | | | 13,588 | | | | 364 | | |
SBA Communications Corp., Class A (c) | | | 7,290 | | | | 655 | | |
SemGroup Corp., Class A | | | 3,320 | | | | 217 | | |
Sempra Energy | | | 12,430 | | | | 1,116 | | |
Spectra Energy Corp. | | | 30,930 | | | | 1,102 | | |
Williams Cos., Inc. (The) | | | 31,140 | | | | 1,201 | | |
| | | | 13,372 | | |
Total Common Stocks (Cost $24,206) | | | 28,977 | | |
Short-Term Investments (21.5%) | |
Securities held as Collateral on Loaned Securities (15.5%) | |
Investment Company (13.4%) | |
Morgan Stanley Institutional Liquidity
Funds — Money Market Portfolio —
Institutional Class (See Note G) | | | 4,127,654 | | | | 4,128 | | |
| | | Face
Amount
(000) | | | |
Repurchase Agreements (2.1%) | |
BNP Paribas Securities Corp., (0.01%,
dated 12/31/13, due 1/2/14; proceeds
$372; fully collateralized by various
U.S. Government Obligations;
0.63% - 3.63% due 8/15/16 - 2/15/21;
valued at $379) | | $ | 372 | | | | 372 | | |
Merrill Lynch & Co., Inc., (0.18%,
dated 12/31/13, due 1/2/14; proceeds
$265; fully collateralized by various
Common Stocks and Exchange Traded
Funds; valued at $287) | | | 265 | | | | 265 | | |
| | | | 637 | | |
Total Securities held as Collateral on
Loaned Securities (Cost $4,765) | | | 4,765 | | |
The accompanying notes are an integral part of the financial statements.
8
Morgan Stanley Institutional Fund, Inc.
Annual Report — December 31, 2013
Portfolio of Investments (cont'd)
Select Global Infrastructure Portfolio
| | | Shares | | Value
(000) | |
Investment Company (6.0%) | |
Morgan Stanley Institutional Liquidity
Funds — Treasury Portfolio —
Institutional Class (See Note G)
(Cost $1,836) | | | 1,836,442 | | | $ | 1,836 | | |
Total Short-Term Investments (Cost $6,601) | | | 6,601 | | |
Total Investments (115.8%) (Cost $30,807)
Including $5,208 of Securities Loaned | | | 35,578 | | |
Liabilities in Excess of Other Assets (-15.8%) | | | (4,861 | ) | |
Net Assets (100.0%) | | $ | 30,717 | | |
(a) All or a portion of this security was on loan at December 31, 2013.
(b) Security trades on the Hong Kong exchange.
(c) Non-income producing security.
ADR American Depositary Receipt.
REIT Real Estate Investment Trust.
The accompanying notes are an integral part of the financial statements.
9
Morgan Stanley Institutional Fund, Inc.
Annual Report — December 31, 2013
Select Global Infrastructure Portfolio
Statement of Assets and Liabilities | | December 31, 2013
(000) | |
Assets: | |
Investments in Securities of Unaffiliated Issuers, at Value(1) (Cost $24,843) | | $ | 29,614 | | |
Investment in Security of Affiliated Issuer, at Value (Cost $5,964) | | | 5,964 | | |
Total Investments in Securities, at Value (Cost $30,807) | | | 35,578 | | |
Foreign Currency, at Value (Cost $13) | | | 13 | | |
Cash | | | 146 | | |
Receivable for Investments Sold | | | 123 | | |
Dividends Receivable | | | 96 | | |
Due from Adviser | | | 22 | | |
Receivable for Portfolio Shares Sold | | | 17 | | |
Tax Reclaim Receivable | | | 5 | | |
Receivable from Affiliate | | | — | @ | |
Other Assets | | | — | @ | |
Total Assets | | | 36,000 | | |
Liabilities: | |
Collateral on Securities Loaned, at Value | | | 4,911 | | |
Payable for Portfolio Shares Redeemed | | | 263 | | |
Payable for Investments Purchased | | | 78 | | |
Payable for Custodian Fees | | | 10 | | |
Payable for Professional Fees | | | 8 | | |
Payable for Administration Fees | | | 2 | | |
Payable for Transfer Agent Fees — Class I | | | — | @ | |
Payable for Transfer Agent Fees — Class A* | | | — | @ | |
Payable for Transfer Agent Fees — Class L | | | — | @ | |
Payable for Shareholder Services Fees — Class A* | | | 1 | | |
Payable for Distribution and Shareholder Services Fees — Class L | | | — | @ | |
Payable for Sub Transfer Agency Fees | | | — | @ | |
Payable for Sub Transfer Agency Fees — Class I | | | — | @ | |
Payable for Sub Transfer Agency Fees — Class A* | | | — | @ | |
Other Liabilities | | | 10 | | |
Total Liabilities | | | 5,283 | | |
Net Assets | | $ | 30,717 | | |
Net Assets Consist Of: | |
Paid-in-Capital | | $ | 25,554 | | |
Distributions in Excess of Net Investment Income | | | (1 | ) | |
Accumulated Net Realized Gain | | | 392 | | |
Unrealized Appreciation (Depreciation) on: | |
Investments | | | 4,771 | | |
Foreign Currency Translations | | | 1 | | |
Net Assets | | $ | 30,717 | | |
The accompanying notes are an integral part of the financial statements.
10
Morgan Stanley Institutional Fund, Inc.
Annual Report — December 31, 2013
Select Global Infrastructure Portfolio
Statement of Assets and Liabilities (cont'd) | | December 31, 2013
(000) | |
CLASS I: | |
Net Assets | | $ | 26,428 | | |
| Shares Outstanding $0.001 par value shares of beneficial interest (500,000,000 shares authorized) (not in 000's) | | | 1,853,467 | | |
Net Asset Value, Offering and Redemption Price Per Share | | $ | 14.26 | | |
CLASS A*: | |
Net Assets | | $ | 3,706 | | |
| Shares Outstanding $0.001 par value shares of beneficial interest (500,000,000 shares authorized) (not in 000's) | | | 260,084 | | |
Net Asset Value, Redemption Price Per Share | | $ | 14.25 | | |
Maximum Sales Load§§ | | | 5.25 | % | |
Maximum Sales Charge | | $ | 0.79 | | |
Maximum Offering Price Per Share | | $ | 15.04 | | |
CLASS L: | |
Net Assets | | $ | 573 | | |
| Shares Outstanding $0.001 par value shares of beneficial interest (500,000,000 shares authorized) (not in 000's) | | | 40,278 | | |
Net Asset Value, Offering and Redemption Price Per Share | | $ | 14.22 | | |
CLASS IS: | |
Net Assets | | $ | 10 | | |
| Shares Outstanding $0.001 par value shares of beneficial interest (500,000,000 shares authorized) (not in 000's) | | | 728 | | |
Net Asset Value, Offering and Redemption Price Per Share | | $ | 14.26 | | |
(1) Including:
Securities on Loan, at Value: | | $ | 5,208 | | |
@ Amount is less than $500.
* Effective September 9, 2013, Class P and Class H shares were renamed Class A shares.
§§ Effective February 25, 2013, the Directors approved the imposition of a maximum initial sales charge of 5.25% on purchases of Class A shares of the Portfolio.
The accompanying notes are an integral part of the financial statements.
11
Morgan Stanley Institutional Fund, Inc.
Annual Report — December 31, 2013
Select Global Infrastructure Portfolio
Statement of Operations | | Year Ended
December 31, 2013
(000) | |
Investment Income: | |
Dividends from Securities of Unaffiliated Issuers (Net of $50 of Foreign Taxes Withheld) | | $ | 707 | | |
Income from Securities Loaned — Net | | | 9 | | |
Dividends from Securities of Affiliated Issuers (Note G) | | | — | @ | |
Total Investment Income | | | 716 | | |
Expenses: | |
Advisory Fees (Note B) | | | 202 | | |
Professional Fees | | | 106 | | |
Registration Fees | | | 56 | | |
Custodian Fees (Note F) | | | 48 | | |
Shareholder Reporting Fees | | | 22 | | |
Administration Fees (Note C) | | | 19 | | |
Transfer Agency Fees (Note E) | | | 9 | | |
Transfer Agency Fees — Class I (Note E) | | | — | @ | |
Transfer Agency Fees — Class A* (Note E) | | | — | @ | |
Transfer Agency Fees — Class L (Note E) | | | — | @ | |
Transfer Agency Fees — Class IS (Note E) | | | — | @ | |
Shareholder Services Fees — Class A* (Note D) | | | 7 | | |
Distribution and Shareholder Services Fees — Class L (Note D) | | | 3 | | |
Pricing Fees | | | 7 | | |
Directors' Fees and Expenses | | | 1 | | |
Sub Transfer Agency Fees — Class I | | | — | @ | |
Sub Transfer Agency Fees — Class A* | | | — | @ | |
Sub Transfer Agency Fees | | | — | @ | |
Other Expenses | | | 16 | | |
Total Expenses | | | 496 | | |
Waiver of Advisory Fees (Note B) | | | (202 | ) | |
Expenses Reimbursed by Adviser (Note B) | | | (14 | ) | |
Rebate from Morgan Stanley Affiliate (Note G) | | | (1 | ) | |
Reimbursement of Class Specific Expenses — Class L (Note B) | | | (— | @) | |
Reimbursement of Class Specific Expenses — Class IS (Note B) | | | (— | @) | |
Net Expenses | | | 279 | | |
Net Investment Income | | | 437 | | |
Realized Gain: | |
Investments Sold | | | 1,595 | | |
Foreign Currency Transactions | | | 4 | | |
Net Realized Gain | | | 1,599 | | |
Change in Unrealized Appreciation (Depreciation): | |
Investments | | | 1,898 | | |
Foreign Currency Translations | | | 1 | | |
Net Change in Unrealized Appreciation (Depreciation) | | | 1,899 | | |
Net Realized Gain and Change in Unrealized Appreciation (Depreciation) | | | 3,498 | | |
Net Increase in Net Assets Resulting from Operations | | $ | 3,935 | | |
@ Amount is less than $500.
* Effective September 9, 2013, Class P and Class H shares were renamed Class A shares.
The accompanying notes are an integral part of the financial statements.
12
Morgan Stanley Institutional Fund, Inc.
Annual Report — December 31, 2013
Select Global Infrastructure Portfolio
Statements of Changes in Net Assets | | Year Ended
December 31,
2013
(000) | | Year Ended
December 31,
2012
(000) | |
Increase (Decrease) in Net Assets: | |
Operations: | |
Net Investment Income | | $ | 437 | | | $ | 320 | | |
Net Realized Gain | | | 1,599 | | | | 728 | | |
Net Change in Unrealized Appreciation (Depreciation) | | | 1,899 | | | | 1,406 | | |
Net Increase in Net Assets Resulting from Operations | | | 3,935 | | | | 2,454 | | |
Distributions from and/or in Excess of: | |
Class I: | |
Net Investment Income | | | (455 | ) | | | (306 | ) | |
Net Realized Gain | | | (1,150 | ) | | | (498 | ) | |
Class A*: | |
Net Investment Income | | | (55 | ) | | | (2 | ) | |
Net Realized Gain | | | (127 | ) | | | (4 | ) | |
Class H^: | |
Net Investment Income | | | (— | @)*** | | | (22 | ) | |
Net Realized Gain | | | (31 | )*** | | | (31 | ) | |
Class L: | |
Net Investment Income | | | (6 | ) | | | (2 | ) | |
Net Realized Gain | | | (25 | ) | | | (4 | ) | |
Class IS: | |
Net Investment Income | | | (— | @)** | | | — | | |
Net Realized Gain | | | (— | @)** | | | — | | |
Total Distributions | | | (1,849 | ) | | | (869 | ) | |
Capital Share Transactions:(1) | |
Class I: | |
Subscribed | | | 11,506 | | | | 2,575 | | |
Distributions Reinvested | | | 706 | | | | 150 | | |
Redeemed | | | (3,326 | ) | | | (1,185 | ) | |
Class A*: | |
Subscribed | | | 1,264 | | | | — | | |
Distributions Reinvested | | | 166 | | | | — | | |
Conversion from Class H | | | 3,280 | | | | — | | |
Redeemed | | | (1,330 | ) | | | — | | |
Class H^: | |
Subscribed | | | 2,166 | *** | | | 1,112 | | |
Distributions Reinvested | | | 30 | *** | | | 47 | | |
Conversion to Class A | | | (3,280 | ) | | | — | | |
Redeemed | | | (191 | )*** | | | — | | |
Class L: | |
Subscribed | | | 389 | | | | — | | |
Distributions Reinvested | | | 23 | | | | — | | |
Class IS: | |
Subscribed | | | 10 | ** | | | — | | |
Net Increase in Net Assets Resulting from Capital Share Transactions | | | 11,413 | | | | 2,699 | | |
Redemption Fees | | | — | | | | — | @ | |
Total Increase in Net Assets | | | 13,499 | | | | 4,284 | | |
Net Assets: | |
Beginning of Period | | | 17,218 | | | | 12,934 | | |
End of Period (Including Undistributed (Distributions in Excess of) Net Investment Income of $(1) and $1) | | $ | 30,717 | | | $ | 17,218 | | |
The accompanying notes are an integral part of the financial statements.
13
Morgan Stanley Institutional Fund, Inc.
Annual Report — December 31, 2013
Select Global Infrastructure Portfolio
Statements of Changes in Net Assets (cont'd) | | Year Ended
December 31,
2013
(000) | | Year Ended
December 31,
2012
(000) | |
(1) Capital Share Transactions: | |
Class I: | |
Shares Subscribed | | | 820 | | | | 209 | | |
Shares Issued on Distributions Reinvested | | | 52 | | | | 12 | | |
Shares Redeemed | | | (236 | ) | | | (99 | ) | |
Net Increase in Class I Shares Outstanding | | | 636 | | | | 122 | | |
Class A*: | |
Shares Subscribed | | | 89 | | | | — | | |
Shares Issued on Distributions Reinvested | | | 12 | | | | — | | |
Conversion from Class H | | | 242 | | | | — | | |
Shares Redeemed | | | (93 | ) | | | — | | |
Net Increase in Class A Shares Outstanding | | | 250 | | | | — | | |
Class H^: | |
Shares Subscribed | | | 156 | *** | | | 83 | | |
Shares Issued on Distributions Reinvested | | | 2 | *** | | | 4 | | |
Conversion to Class A | | | (242 | ) | | | — | | |
Shares Redeemed | | | (13 | )*** | | | — | | |
Net Increase (Decrease) in Class H Shares Outstanding | | | (97 | ) | | | 87 | | |
Class L: | |
Shares Subscribed | | | 28 | | | | — | | |
Shares Issued on Distributions Reinvested | | | 2 | | | | — | | |
Net Increase in Class L Shares Outstanding | | | 30 | | | | — | | |
Class IS: | |
Shares Subscribed | | | 1 | ** | | | — | | |
Net Increase in Class IS Shares Outstanding | | | 1 | | | | — | | |
@ Amount is less than $500.
^ Effective September 9, 2013, Class H shares converted into Class A shares.
* Effective September 9, 2013, Class P shares were renamed Class A shares.
** For the period September 13, 2013 through December 31, 2013.
*** For the period January 1, 2013 through September 6, 2013.
The accompanying notes are an integral part of the financial statements.
14
Morgan Stanley Institutional Fund, Inc.
Annual Report — December 31, 2013
Financial Highlights
Select Global Infrastructure Portfolio
| | | Class I | |
| | | Year Ended December 31, | | Period from
September 20, 2010^ to | |
Selected Per Share Data and Ratios | | 2013 | | 2012 | | 2011 | | December 31, 2010 | |
Net Asset Value, Beginning of Period | | $ | 12.91 | | | $ | 11.50 | | | $ | 10.40 | | | $ | 10.00 | | |
Income from Investment Operations: | |
Net Investment Income† | | | 0.26 | | | | 0.27 | | | | 0.23 | | | | 0.08 | | |
Net Realized and Unrealized Gain | | | 2.00 | | | | 1.82 | | | | 1.42 | | | | 0.40 | | |
Total from Investment Operations | | | 2.26 | | | | 2.09 | | | | 1.65 | | | | 0.48 | | |
Distributions from and/or in Excess of: | |
Net Investment Income | | | (0.25 | ) | | | (0.26 | ) | | | (0.22 | ) | | | (0.08 | ) | |
Net Realized Gain | | | (0.66 | ) | | | (0.42 | ) | | | (0.33 | ) | | | — | | |
Total Distributions | | | (0.91 | ) | | | (0.68 | ) | | | (0.55 | ) | | | (0.08 | ) | |
Net Asset Value, End of Period | | $ | 14.26 | | | $ | 12.91 | | | $ | 11.50 | | | $ | 10.40 | | |
Total Return++ | | | 17.91 | % | | | 18.21 | % | | | 15.95 | % | | | 4.94 | %# | |
Ratios and Supplemental Data: | |
Net Assets, End of Period (Thousands) | | $ | 26,428 | | | $ | 15,707 | | | $ | 12,589 | | | $ | 10,086 | | |
Ratio of Expenses to Average Net Assets (1) | | | 1.12 | %+ | | | 1.15 | %+†† | | | 1.15 | %+†† | | | 1.14 | %+††* | |
Ratio of Net Investment Income to Average Net Assets (1) | | | 1.87 | %+ | | | 2.18 | %+†† | | | 2.09 | %+†† | | | 2.71 | %+††* | |
Ratio of Rebate from Morgan Stanley Affiliates to Average Net Assets | | | 0.01 | % | | | 0.00 | %††§ | | | 0.00 | %††§ | | | 0.01 | %††* | |
Portfolio Turnover Rate | | | 30 | % | | | 33 | % | | | 51 | % | | | 6 | %# | |
(1) Supplemental Information on the Ratios to Average Net Assets: | |
Ratios Before Expense Limitation: | |
Expenses to Average Net Assets | | | 2.04 | % | | | 2.39 | %†† | | | 2.93 | %†† | | | 3.61 | %+††* | |
Net Investment Income to Average Net Assets | | | 0.95 | % | | | 0.94 | %†† | | | 0.31 | %†† | | | 0.24 | %+††* | |
^ Commencement of Operations.
† Per share amount is based on average shares outstanding.
++ Calculated based on the net asset value as of the last business day of the period.
+ The Ratios of Expenses and Net Investment Income reflect the rebate of certain Portfolio expenses in connection with the investments in Morgan Stanley affiliates during the period. The effect of the rebate on the ratios is disclosed in the above table as "Ratio of Rebate from Morgan Stanley Affiliates to Average Net Assets."
†† Reflects overall Portfolio ratios for investment income and non-class specific expenses.
§ Amount is less than 0.005%.
# Not Annualized.
* Annualized.
The accompanying notes are an integral part of the financial statements.
15
Morgan Stanley Institutional Fund, Inc.
Annual Report — December 31, 2013
Financial Highlights
Select Global Infrastructure Portfolio
| | | Class A** | |
| | | Year Ended December 31, | | Period from
September 20, 2010^ to | |
Selected Per Share Data and Ratios | | 2013 | | 2012 | | 2011 | | December 31, 2010 | |
Net Asset Value, Beginning of Period | | $ | 12.90 | | | $ | 11.50 | | | $ | 10.40 | | | $ | 10.00 | | |
Income from Investment Operations: | |
Net Investment Income† | | | 0.26 | | | | 0.24 | | | | 0.21 | | | | 0.07 | | |
Net Realized and Unrealized Gain | | | 1.97 | | | | 1.80 | | | | 1.41 | | | | 0.41 | | |
Total from Investment Operations | | | 2.23 | | | | 2.04 | | | | 1.62 | | | | 0.48 | | |
Distributions from and/or in Excess of: | |
Net Investment Income | | | (0.22 | ) | | | (0.22 | ) | | | (0.19 | ) | | | (0.08 | ) | |
Net Realized Gain | | | (0.66 | ) | | | (0.42 | ) | | | (0.33 | ) | | | — | | |
Total Distributions | | | (0.88 | ) | | | (0.64 | ) | | | (0.52 | ) | | | (0.08 | ) | |
Net Asset Value, End of Period | | $ | 14.25 | | | $ | 12.90 | | | $ | 11.50 | | | $ | 10.40 | | |
Total Return++ | | | 17.69 | % | | | 17.85 | % | | | 15.67 | % | | | 4.86 | %# | |
Ratios and Supplemental Data: | |
Net Assets, End of Period (Thousands) | | $ | 3,706 | | | $ | 129 | | | $ | 115 | | | $ | 104 | | |
Ratio of Expenses to Average Net Assets (1) | | | 1.37 | %+^^ | | | 1.40 | %+†† | | | 1.40 | %+†† | | | 1.39 | %+††* | |
Ratio of Net Investment Income to Average Net Assets (1) | | | 1.81 | %+ | | | 1.93 | %+†† | | | 1.84 | %+†† | | | 2.46 | %+††* | |
Ratio of Rebate from Morgan Stanley Affiliates to Average Net Assets | | | 0.01 | % | | | 0.00 | %††§ | | | 0.00 | %††§ | | | 0.01 | %††* | |
Portfolio Turnover Rate | | | 30 | % | | | 33 | % | | | 51 | % | | | 6 | %# | |
(1) Supplemental Information on the Ratios to Average Net Assets: | |
Ratios Before Expense Limitation: | |
Expenses to Average Net Assets | | | 2.43 | % | | | 2.64 | %†† | | | 3.18 | %†† | | | 3.86 | %+††* | |
Net Investment Income (Loss) to Average Net Assets | | | 0.75 | % | | | 0.69 | %†† | | | 0.06 | %†† | | | (0.01 | )%+††* | |
** Effective September 9, 2013, Class P and Class H shares were renamed Class A shares.
^ Commencement of Operations.
† Per share amount is based on average shares outstanding.
++ Calculated based on the net asset value which does not reflect sales charges, if applicable, as of the last business day of the period.
+ The Ratios of Expenses and Net Investment Income reflect the rebate of certain Portfolio expenses in connection with the investments in Morgan Stanley affiliates during the period. The effect of the rebate on the ratios is disclosed in the above table as "Ratio of Rebate from Morgan Stanley Affiliates to Average Net Assets."
†† Reflects overall Portfolio ratios for investment income and non-class specific expenses.
^^ Effective September 16, 2013, the Adviser has agreed to limit the ratio of expenses to average net assets to the maximum ratio of 1.50% for Class A shares. Prior to September 16, 2013, the maximum ratio was 1.40% for Class A shares.
§ Amount is less than 0.005%.
# Not Annualized.
* Annualized.
The accompanying notes are an integral part of the financial statements.
16
Morgan Stanley Institutional Fund, Inc.
Annual Report — December 31, 2013
Financial Highlights
Select Global Infrastructure Portfolio
| | | Class L | |
| | | Year Ended December 31, | | Period from
September 20, 2010^ to | |
Selected Per Share Data and Ratios | | 2013 | | 2012 | | 2011 | | December 31, 2010 | |
Net Asset Value, Beginning of Period | | $ | 12.90 | | | $ | 11.50 | | | $ | 10.40 | | | $ | 10.00 | | |
Income from Investment Operations: | |
Net Investment Income† | | | 0.16 | | | | 0.18 | | | | 0.15 | | | | 0.06 | | |
Net Realized and Unrealized Gain | | | 1.98 | | | | 1.80 | | | | 1.42 | | | | 0.40 | | |
Total from Investment Operations | | | 2.14 | | | | 1.98 | | | | 1.57 | | | | 0.46 | | |
Distributions from and/or in Excess of: | |
Net Investment Income | | | (0.16 | ) | | | (0.16 | ) | | | (0.14 | ) | | | (0.06 | ) | |
Net Realized Gain | | | (0.66 | ) | | | (0.42 | ) | | | (0.33 | ) | | | — | | |
Total Distributions | | | (0.82 | ) | | | (0.58 | ) | | | (0.47 | ) | | | (0.06 | ) | |
Net Asset Value, End of Period | | $ | 14.22 | | | $ | 12.90 | | | $ | 11.50 | | | $ | 10.40 | | |
Total Return++ | | | 16.98 | % | | | 17.31 | % | | | 15.12 | % | | | 4.72 | %# | |
Ratios and Supplemental Data: | |
Net Assets, End of Period (Thousands) | | $ | 573 | | | $ | 129 | | | $ | 115 | | | $ | 104 | | |
Ratio of Expenses to Average Net Assets (1) | | | 1.93 | %+^^ | | | 1.90 | %+†† | | | 1.90 | %+†† | | | 1.89 | %+††* | |
Ratio of Net Investment Income to Average Net Assets (1) | | | 1.16 | %+ | | | 1.43 | %+†† | | | 1.34 | %+†† | | | 1.96 | %+††* | |
Ratio of Rebate from Morgan Stanley Affiliates to Average Net Assets | | | 0.00 | %§ | | | 0.00 | %††§ | | | 0.00 | %††§ | | | 0.01 | %††* | |
Portfolio Turnover Rate | | | 30 | % | | | 33 | % | | | 51 | % | | | 6 | %# | |
(1) Supplemental Information on the Ratios to Average Net Assets: | |
Ratios Before Expense Limitation: | |
Expenses to Average Net Assets | | | 2.86 | % | | | 3.14 | %†† | | | 3.68 | %†† | | | 4.36 | %+††* | |
Net Investment Income (Loss) to Average Net Assets | | | 0.23 | % | | | 0.19 | %†† | | | (0.44 | )%†† | | | (0.51 | )%+††* | |
^ Commencement of Operations.
† Per share amount is based on average shares outstanding.
++ Calculated based on the net asset value as of the last business day of the period.
+ The Ratios of Expenses and Net Investment Income reflect the rebate of certain Portfolio expenses in connection with the investments in Morgan Stanley affiliates during the period. The effect of the rebate on the ratios is disclosed in the above table as "Ratio of Rebate from Morgan Stanley Affiliates to Average Net Assets."
^^ Effective September 16, 2013, the Adviser has agreed to limit the ratio of expenses to average net assets to the maximum ratio of 2.00% for Class L shares. Prior to September 16, 2013, the maximum ratio was 1.90% for Class L shares.
†† Reflects overall Portfolio ratios for investment income and non-class specific expenses.
§ Amount is less than 0.005%.
# Not Annualized.
* Annualized.
The accompanying notes are an integral part of the financial statements.
17
Morgan Stanley Institutional Fund, Inc.
Annual Report — December 31, 2013
Financial Highlights
Select Global Infrastructure Portfolio
| | | Class IS | |
Selected Per Share Data and Ratios | | Period from
September 13, 2013^ to
December 31, 2013 | |
Net Asset Value, Beginning of Period | | $ | 13.73 | | |
Income from Investment Operations: | |
Net Investment Income† | | | 0.09 | | |
Net Realized and Unrealized Gain | | | 1.20 | | |
Total from Investment Operations | | | 1.29 | | |
Distributions from and/or in Excess of: | |
Net Investment Income | | | (0.25 | ) | |
Net Realized Gain | | | (0.51 | ) | |
Total Distributions | | | (0.76 | ) | |
Net Asset Value, End of Period | | $ | 14.26 | | |
Total Return++ | | | 9.60 | %# | |
Ratios and Supplemental Data: | |
Net Assets, End of Period (Thousands) | | $ | 10 | | |
Ratio of Expenses to Average Net Assets (1) | | | 1.07 | %+^^* | |
Ratio of Net Investment Income to Average Net Assets (1) | | | 2.13 | %+* | |
Ratio of Rebate from Morgan Stanley Affiliates to Average Net Assets | | | 0.01 | %* | |
Portfolio Turnover Rate | | | 30 | %# | |
(1) Supplemental Information on the Ratios to Average Net Assets: | |
Ratios Before Expense Limitation | |
Expenses to Average Net Assets | | | 7.27 | %* | |
Net Investment Loss to Average Net Assets | | | (4.07 | )%* | |
^ Commencement of Operations.
† Per share amount is based on average shares outstanding.
++ Calculated based on the net asset value as of the last business day of the period.
+ The Ratios of Expenses and Net Investment Income reflect the rebate of certain Portfolio expenses in connection with the investments in Morgan Stanley affiliates during the period. The effect of the rebate on the ratios is disclosed in the above table as "Ratio of Rebate from Morgan Stanley Affiliates to Average Net Assets."
^^ Effective September 16, 2013, the Adviser has agreed to limit the ratio of expenses to average net assets to the maximum ratio of 1.08% for Class IS shares.
§ Amount is less than 0.005%.
# Not Annualized.
* Annualized.
The accompanying notes are an integral part of the financial statements.
18
Morgan Stanley Institutional Fund, Inc.
Annual Report — December 31, 2013
Notes to Financial Statements
Morgan Stanley Institutional Fund, Inc. (the "Fund") is registered under the Investment Company Act of 1940, as amended (the "Act"), as an open-end management investment company. The Fund is comprised of twenty-seven separate, active, diversified and non-diversified portfolios (individually referred to as a "Portfolio", collectively as the "Portfolios").
The accompanying financial statements relate to the Select Global Infrastructure Portfolio. The Portfolio's adviser, Morgan Stanley Investment Management Inc. (the "Adviser") and sub-advisers, Morgan Stanley Investment Management Limited ("MSIM Limited") and Morgan Stanley Investment Management Company ("MSIM Company") (together, the "Sub-Advisers"), seek to provide both capital appreciation and income by investing primarily in equity securities issued by companies located throughout the world that are engaged in the infrastructure business. Using internal proprietary research, the Adviser seeks to identify public infrastructure companies that are believed to offer the best value relative to their underlying assets and growth prospects. The Portfolio offers four classes of shares — Class I, Class A, Class L and Class IS.
On September 16, 2013, the Portfolio commenced offering Class IS shares. Effective September 9, 2013, Class P and Class H shares were renamed Class A shares.
A. Significant Accounting Policies: The following significant accounting policies are in conformity with U.S. generally accepted accounting principles ("GAAP"). Such policies are consistently followed by the Fund in the preparation of its financial statements. GAAP may require management to make estimates and assumptions that affect the reported amounts and disclosures in the financial statements. Actual results may differ from those estimates.
1. Security Valuation: (1) An equity portfolio security listed or traded on an exchange is valued at its latest reported sales price (or at the exchange official closing price if such exchange reports an official closing price), if there were no sales on a given day, the security is valued at the mean between the last reported bid and asked prices; (2) all other equity portfolio securities for which over-the-counter market quotations are readily available are valued at its latest reported sales price. In cases where a security is traded on more than one exchange, the security is valued on the exchange designated as the primary market; (3) when market quotations are not readily available, including circumstances under which the Adviser determines that the closing price, last sale price or the mean between
the last reported bid and asked prices are not reflective of a security's market value, portfolio securities are valued at their fair value as determined in good faith under procedures established by and under the general supervision of the Fund's Board of Directors (the "Directors"). Occasionally, developments affecting the closing prices of securities and other assets may occur between the times at which valuations of such securities are determined (that is, close of the foreign market on which the securities trade) and the close of business of the New York Stock Exchange ("NYSE"). If developments occur during such periods that are expected to materially affect the value of such securities, such valuations may be adjusted to reflect the estimated fair value of such securities as of the close of the NYSE, as determined in good faith by the Directors or by the Adviser using a pricing service and/or procedures approved by the Directors; (4) quotations of foreign portfolio securities, other assets and liabilities and forward contracts stated in foreign currency are translated into U.S. dollar equivalents at the prevailing market rates prior to the close of the NYSE; (5) investments in mutual funds, including the Morgan Stanley Institutional Liquidity Funds, are valued at the net asset value as of the close of each business day; and (6) short-term debt securities with remaining maturities of 60 days or less at the time of purchase may be valued at amortized cost, unless the Adviser determines such valuation does not reflect the securities' market value, in which case these securities will be valued at their fair market value determined by the Adviser.
Under procedures approved by the Directors, the Fund's Adviser has formed a Valuation Committee. The Valuation Committee provides administration and oversight of the Fund's valuation policies and procedures, which are reviewed at least annually by the Directors. These procedures allow the Fund to utilize independent pricing services, quotations from securities and financial instrument dealers, and other market sources to determine fair value.
The Fund has procedures to determine the fair value of securities and other financial instruments for which market prices are not readily available. Under these procedures, the Valuation Committee convenes on a regular and ad hoc basis to review such securities and considers a number of factors, including valuation methodologies and significant unobservable valuation inputs, when arriving at fair value. The Valuation Committee may
19
Morgan Stanley Institutional Fund, Inc.
Annual Report — December 31, 2013
Notes to Financial Statements (cont'd)
employ a market-based approach which may use related or comparable assets or liabilities, recent transactions, market multiples, book values, and other relevant information for the investment to determine the fair value of the investment. An income-based valuation approach may also be used in which the anticipated future cash flows of the investment are discounted to calculate fair value. Discounts may also be applied due to the nature or duration of any restrictions on the disposition of the investments. Due to the inherent uncertainty of valuations of such investments, the fair values may differ significantly from the values that would have been used had an active market existed. The Valuation Committee employs various methods for calibrating these valuation approaches including a regular review of valuation methodologies, key inputs and assumptions, transactional back-testing or disposition analysis, and reviews of any related market activity.
2. Fair Value Measurement: Financial Accounting Standards Board ("FASB") Accounting Standards CodificationTM ("ASC") 820, "Fair Value Measurements and Disclosures" ("ASC 820"), defines fair value as the value that the Fund would receive to sell an investment or pay to transfer a liability in a timely transaction with an independent buyer in the principal market, or in the absence of a principal market the most advantageous market for the investment or liability. ASC 820 establishes a three-tier hierarchy to distinguish between (1) inputs that reflect the assumptions market participants would use in valuing an asset or liability developed based on market data obtained from sources independent of the reporting entity (observable inputs) and (2) inputs that reflect the reporting entity's own assumptions about the assumptions market participants would use in valuing an asset or liability developed based on the best information available in the circumstances (unobservable inputs) and to establish classification of fair value measurements for disclosure purposes. Various inputs are used in determining the value of the Fund's investments. The inputs are summarized in the three broad levels listed below.
• Level 1 – unadjusted quoted prices in active markets for identical investments
• Level 2 – other significant observable inputs (including quoted prices for similar investments, interest rates, prepayment speeds, credit risk, etc.)
• Level 3 – significant unobservable inputs including the Fund's own assumptions in determining the fair value of investments. Factors considered in making this determination may include, but are not limited to, information obtained by contacting the issuer, analysts, or the appropriate stock exchange (for exchange-traded securities), analysis of the issuer's financial statements or other available documents and, if necessary, available information concerning other securities in similar circumstances
The inputs or methodology used for valuing securities are not necessarily an indication of the risk associated with investing in those securities and the determination of the significance of a particular input to the fair value measurement in its entirety requires judgment and considers factors specific to each security.
The following is a summary of the inputs used to value the Portfolio's investments as of December 31, 2013.
Investment Type | | Level 1
Unadjusted
quoted
prices
(000) | | Level 2
Other
significant
observable
inputs
(000) | | Level 3
Significant
unobservable
inputs
(000) | | Total
(000) | |
Assets: | |
Common Stocks | |
Airports | | $ | 1,553 | | | $ | — | | | $ | — | | | $ | 1,553 | | |
Communications | | | 4,567 | | | | — | | | | — | | | | 4,567 | | |
Diversified | | | 1,320 | | | | — | | | | — | | | | 1,320 | | |
Oil & Gas Storage &
Transportation | | | 13,923 | | | | — | | | | — | | | | 13,923 | | |
Ports | | | 115 | | | | — | | | | — | | | | 115 | | |
Toll Roads | | | 1,681 | | | | — | | | | — | | | | 1,681 | | |
Transmission &
Distribution | | | 4,062 | | | | — | | | | — | | | | 4,062 | | |
Water | | | 1,756 | | | | — | | | | — | | | | 1,756 | | |
Total Common Stocks | | | 28,977 | | | | — | | | | — | | | | 28,977 | | |
Short-Term Investments | |
Investment Companies | | | 5,964 | | | | — | | | | — | | | | 5,964 | | |
Repurchase Agreements | | | — | | | | 637 | | | | — | | | | 637 | | |
Total Short-Term
Investments | | | 5,964 | | | | 637 | | | | — | | | | 6,601 | | |
Total Assets | | $ | 34,941 | | | $ | 637 | | | $ | — | | | $ | 35,578 | | |
Transfers between investment levels may occur as the markets fluctuate and/or the availability of data used in an investment's valuation changes. The Portfolio recognizes transfers between the levels as of the end of the period. As of December 31, 2013, securities with a total value of approximately $9,665,000 transferred from Level 2 to Level 1. At December 31, 2012, the fair value of certain securities were adjusted due to developments which
20
Morgan Stanley Institutional Fund, Inc.
Annual Report — December 31, 2013
Notes to Financial Statements (cont'd)
occurred between the time of the close of the foreign markets on which they trade and the close of business on the NYSE which resulted in their Level 2 classification.
3. Foreign Currency Translation and Foreign Investments: The books and records of the Portfolio are maintained in U.S. dollars. Foreign currency amounts are translated into U.S. dollars as follows:
– investments, other assets and liabilities at the prevailing rate of exchange on the valuation date;
– investment transactions and investment income at the prevailing rates of exchange on the dates of such transactions.
Although the net assets of the Portfolio are presented at the foreign exchange rates and market values at the close of the period, the Portfolio does not isolate that portion of the results of operations arising as a result of changes in the foreign exchange rates from the fluctuations arising from changes in the market prices of securities held at period end. Similarly, the Portfolio does not isolate the effect of changes in foreign exchange rates from the fluctuations arising from changes in the market prices of securities sold during the period. Accordingly, realized and unrealized foreign currency gains (losses) on investments in securities are included in the reported net realized and unrealized gains (losses) on investment transactions and balances. However, pursuant to U.S. Federal income tax regulations, gains and losses from certain foreign currency transactions and the foreign currency portion of gains and losses realized on sales and maturities of foreign denominated debt securities are treated as ordinary income for U.S. Federal income tax purposes.
Net realized gains (losses) on foreign currency transactions represent net foreign exchange gains (losses) from foreign currency forward exchange contracts, disposition of foreign currencies, currency gains (losses) realized between the trade and settlement dates on securities transactions, and the difference between the amount of investment income and foreign withholding taxes recorded on the Portfolio's books and the U.S. dollar equivalent amounts actually received or paid. Net unrealized currency gains (losses) from valuing foreign currency denominated assets and liabilities at period end exchange rates are reflected as a component of unrealized appreciation (depreciation) on the Statement
of Assets and Liabilities. The change in unrealized currency gains (losses) on foreign currency translations for the period is reflected in the Statement of Operations.
Foreign security and currency transactions may involve certain considerations and risks not typically associated with those of U.S. dollar denominated transactions as a result of, among other factors, fluctuations of exchange rates in relation to the U.S. dollar, the possibility of lower levels of governmental supervision and regulation of foreign securities markets and the possibility of political or economic instability.
The net assets of the Portfolio include foreign denominated securities and currency. Changes in currency exchange rates will affect the U.S. dollar value and investment income from such securities.
Governmental approval for foreign investments may be required in advance of making an investment under certain circumstances in some countries, and the extent of foreign investments in domestic companies may be subject to limitation in other countries. Foreign ownership limitations also may be imposed by the charters of individual companies to prevent, among other concerns, violations of foreign investment limitations. As a result, an additional class of shares (identified as "Foreign" in the Portfolio of Investments) may be created and offered for investment. The "local" and "foreign shares" market values may differ. In the absence of trading of the foreign shares in such markets, the Portfolio values the foreign shares at the closing exchange price of the local shares.
4. Securities Lending: The Portfolio lends securities to qualified financial institutions, such as broker-dealers, to earn additional income. Any increase or decrease in the fair value of the securities loaned that might occur and any interest earned or dividends declared on those securities during the term of the loan would remain in the Portfolio. The Portfolio would receive cash or securities as collateral in an amount equal to or exceeding 100% of the current fair value of the loaned securities. The collateral is marked-to-market daily, by State Street Bank and Trust Company ("State Street"), the securities lending agent, to ensure that a minimum of 100% collateral coverage is maintained.
Based on pre-established guidelines, the securities lending agent invests any cash collateral that is received in an affiliated money market portfolio and repurchase agreements. Securities lending income is generated from the
21
Morgan Stanley Institutional Fund, Inc.
Annual Report — December 31, 2013
Notes to Financial Statements (cont'd)
earnings on the invested collateral and borrowing fees, less any rebates owed to the borrowers and compensation to the lending agent, and is recorded as "Income from Securities Loaned-Net" in the Portfolio's Statement of Operations. Risks in securities lending transactions are that a borrower may not provide additional collateral when required or return the securities when due, and that the value of the short-term investments will be less than the amount of cash collateral plus any rebate that is required to be returned to the borrower.
The Portfolio has the right under the lending agreement to recover the securities from the borrower on demand.
The following table presents financial instruments that are subject to enforceable netting arrangements as of December 31, 2013.
Gross Amounts Not Offset in the Statement of Assets and Liabilities | |
Gross Asset
Amounts
Presented in
Statement of
Assets and
Liabilities
(000) | | Financial
Instrument
(000) | | Collateral
Received
(000) | | Net Amount
(not less than 0)
(000) | |
| $ | 5,208 | (a) | | | — | | | $ | (5,208 | )(b)(c) | | $ | 0 | | |
(a) Represents market value of loaned securities at period end.
(b) The Portfolio received cash collateral of approximately $4,911,000, of which approximately $4,765,000 was subsequently invested in Repurchase Agreements and Morgan Stanley Institutional Liquidity Funds as reported in the Portfolio of Investments. As of December 31, 2013 there was uninvested cash of approximately $146,000, which is not reflected in the Portfolio of Investments. In addition, the Portfolio received non-cash collateral of approximately $537,000 in the form of U.S. government obligations, which the Portfolio cannot sell or repledge, and accordingly are not reflected in the Portfolio of Investments.
(c) The actual collateral received is greater than the amount shown here due to overcollateralization.
5. Indemnifications: The Fund enters into contracts that contain a variety of indemnifications. The Fund's maximum exposure under these arrangements is unknown. However, the Fund has not had prior claims or losses pursuant to these contracts and expects the risk of loss to be remote.
6. Dividends and Distributions to Shareholders: Dividend income and distributions to shareholders are recorded on the ex-dividend date. Dividends from net investment income, if any, are declared and paid semiannually. Net realized capital gains, if any, are distributed at least annually.
7. Security Transactions, Income and Expenses: Security transactions are accounted for on the trade date (date the order to buy or sell is executed). Realized gains
and losses on the sale of investment securities are determined on the specific identified cost method. Dividend income and other distributions are recorded on the ex-dividend date (except for certain foreign dividends which may be recorded as soon as the Portfolio is informed of such dividends) net of applicable withholding taxes. Interest income is recognized on the accrual basis except where collection is in doubt. Discounts are accreted and premiums are amortized over the life of the respective securities. Most expenses of the Fund can be directly attributed to a particular Portfolio. Expenses which cannot be directly attributed are apportioned among the Portfolios based upon relative net assets or other appropriate methods. Income, expenses (other than class specific expenses — distribution, transfer agency and sub transfer agency fees) and realized and unrealized gains or losses are allocated to each class of shares based upon their relative net assets.
The Portfolio owns shares of REITs which report information on the source of their distributions annually in the following calendar year. A portion of distributions received from REITs during the year is estimated to be a return of capital and is recorded as a reduction of their cost.
B. Advisory/Sub-Advisory Fees: The Adviser, a wholly-owned subsidiary of Morgan Stanley, provides the Portfolio with advisory services under the terms of an Investment Advisory Agreement, paid quarterly, at an annual rate of 0.85% of the Portfolio's average net assets.
The Adviser has agreed to reduce its advisory fee and/or reimburse the Portfolio so that total annual portfolio operating expenses, excluding certain investment related expenses, taxes, interest and other extraordinary expenses (including litigation), will not exceed 1.15% for Class I shares, 1.40% for Class A shares and 1.90% for Class L shares. Effective September 16, 2013, the Adviser has agreed to limit the ratio of expenses to average net assets to the maximum ratios of 1.50%, 2.00% and 1.08% for Class A, Class L and Class IS shares, respectively. The fee waivers and/or expense reimbursements will continue for at least one year or until such time that the Directors act to discontinue all or a portion of such waivers and/or reimbursements when it deems such action is appropriate. For the year ended December 31, 2013, approximately $202,000 of advisory fees were waived and approximately $14,000 of other expenses were reimbursed by the Adviser pursuant to this arrangement.
22
Morgan Stanley Institutional Fund, Inc.
Annual Report — December 31, 2013
Notes to Financial Statements (cont'd)
The Adviser has entered into a Sub-Advisory Agreement with the Sub-Advisers, each a wholly-owned subsidiary of Morgan Stanley. The Sub-Advisers provide the Portfolio with advisory services subject to the overall supervision of the Adviser and the Fund's Officers and Directors. The Adviser pays the Sub-Advisers on a monthly basis a portion of the net advisory fees the Adviser receives from the Portfolio.
C. Administration Fees: The Adviser also serves as Administrator to the Fund and provides administrative services pursuant to an Administration Agreement for an annual fee, accrued daily and paid monthly, of 0.08% of the Portfolio's average daily net assets. Under a Sub-Administration Agreement between the Administrator and State Street, State Street provides certain administrative services to the Fund. For such services, the Administrator pays State Street a portion of the fee the Administrator receives from the Portfolio.
D. Distribution and Shareholder Services Fees: Morgan Stanley Distribution, Inc. ("MSDI" or the "Distributor"), a wholly-owned subsidiary of the Adviser, and an indirect subsidiary of Morgan Stanley, serves as the Fund's Distributor of Portfolio shares pursuant to a Distribution Agreement. The Fund has adopted a Shareholder Services Plan with respect to Class A shares pursuant to Rule 12b-1 under the Act. Under the Shareholder Services Plan, the Portfolio pays the Distributor a shareholder services fee, accrued daily and paid monthly, at an annual rate of 0.25% of the Portfolio's average daily net assets attributable to Class A shares.
The Fund has adopted a Distribution and Shareholder Services Plan with respect to Class L shares pursuant to Rule 12b-1 under the Act. Under the Distribution and Shareholder Services Plan, the Portfolio pays the Distributor a distribution fee, accrued daily and paid monthly, at an annual rate of 0.50% and a shareholder services fee, accrued daily and paid monthly, at an annual rate of 0.25% of the Portfolio's average daily net assets attributable to Class L shares.
The distribution and shareholder services fees are used to support the expenses associated with servicing and maintaining accounts. The Distributor may compensate other parties for providing shareholder support services to investors who purchase Class A and Class L shares.
E. Dividend Disbursing and Transfer Agent: The Fund's dividend disbursing and transfer agent was Morgan Stanley Services Company Inc. ("Morgan Stanley Services"). Pursuant to a Transfer Agency Agreement, the Fund paid Morgan Stanley Services a fee based on the number of classes, accounts and transactions relating to the Portfolios of the
Fund. Effective July 1, 2013, the Directors approved changing the transfer agent to Boston Financial Data Services, Inc.
F. Custodian Fees: State Street (the "Custodian") serves as Custodian for the Fund in accordance with a Custodian Agreement. The Custodian holds cash, securities, and other assets of the Fund as required by the Act. Custody fees are payable monthly based on assets held in custody, investment purchases and sales activity and account maintenance fees, plus reimbursement for certain out-of-pocket expenses.
G. Security Transactions and Transactions with Affiliates: For the year ended December 31, 2013, purchases and sales of investment securities for the Portfolio, other than long-term U.S. Government securities and short-term investments, were approximately $15,748,000 and $6,870,000, respectively. There were no purchases and sales of long-term U.S. Government securities for the year ended December 31, 2013.
The Portfolio invests in the Institutional Class of the Morgan Stanley Institutional Liquidity Funds (the "Liquidity Funds"), an open-end management investment company managed by the Adviser, both directly, and as a portion of the securities held as collateral on loaned securities. Advisory fees paid by the Portfolio are reduced by an amount equal to its pro-rata share of the advisory and administration fees paid by the Portfolio due to its investment in the Liquidity Funds. For the year ended December 31, 2013, advisory fees paid were reduced by approximately $1,000 relating to the Portfolio's investment in the Liquidity Funds.
A summary of the Portfolio's transactions in shares of the Liquidity Funds during the year ended December 31, 2013 is as follows:
Value
December 31,
2012
(000) | | Purchases
at Cost
(000) | | Sales
(000) | | Dividend
Income
(000) | | Value
December 31,
2013
(000) | |
| $ | 590 | | | $ | 20,889 | | | $ | 15,515 | | | $ | — | @ | | $ | 5,964 | | |
@ Amount is less than $500.
From January 1, 2013 to June 30, 2013, the Portfolio incurred less than $500 in brokerage commissions with Citigroup, Inc., and its affiliated broker-dealers, which may be deemed affiliates of the Adviser, Sub-Advisers, Distributor and Administrator under Section 17 of the Act, for portfolio transactions executed on behalf of the Portfolio. Citigroup, Inc. and its affiliated broker-dealers ceased to be affiliates of the Portfolio pursuant to Section 17 of the Act as of July 1, 2013.
H. Federal Income Taxes: It is the Portfolio's intention to continue to qualify as a regulated investment company and
23
Morgan Stanley Institutional Fund, Inc.
Annual Report — December 31, 2013
Notes to Financial Statements (cont'd)
distribute all of its taxable and tax-exempt income. Accordingly, no provision for Federal income taxes is required in the financial statements.
The Portfolio may be subject to taxes imposed by countries in which it invests. Such taxes are generally based on income and/or capital gains earned or repatriated. Taxes are accrued based on net investment income, net realized gains and net unrealized appreciation as such income and/or gains are earned. Taxes may also be based on transactions in foreign currency and are accrued based on the value of investments denominated in such currency.
FASB ASC 740-10, Income Taxes — Overall, sets forth a minimum threshold for financial statement recognition of the benefit of a tax position taken or expected to be taken in a tax return. Management has concluded there are no significant uncertain tax positions that would require recognition in the financial statements. If applicable, the Portfolio recognizes interest accrued related to unrecognized tax benefits in "Interest Expense" and penalties in "Other Expenses" in the Statement of Operations. The Portfolio files tax returns with the U.S. Internal Revenue Service, New York and various states. Each of the tax years in the four-year period ended December 31, 2013, remains subject to examination by taxing authorities.
The tax character of distributions paid may differ from the character of distributions shown in the Statements of Changes in Net Assets due to short-term capital gains being treated as ordinary income for tax purposes. The tax character of distributions paid during fiscal years 2013 and 2012 was as follows:
2013
Distributions
Paid From: | | 2012
Distributions
Paid From: | |
Ordinary
Income
(000) | | Long-Term
Capital Gain
(000) | | Ordinary
Income
(000) | | Long-Term
Capital Gain
(000) | |
| $ | 573 | | | $ | 1,276 | | | $ | 332 | | | $ | 537 | | |
The amount and character of income and gains to be distributed are determined in accordance with income tax regulations which may differ from GAAP. These book/tax differences are either considered temporary or permanent in nature.
Temporary differences are attributable to differing book and tax treatments for the timing of the recognition of gains (losses) on certain investment transactions and the timing of the deductibility of certain expenses.
Permanent differences, primarily due to differing treatments of gains (losses) related to foreign currency transactions and
distribution redesignations, resulted in the following reclassifications among the components of net assets at December 31, 2013:
Undistributed
(Distributions
in Excess of)
Net Investment
Income (Loss)
(000) | | Accumulated
Undistributed
Net Realized
Gain (Loss)
(000) | | Paid-in-Capital
(000) | |
| $ | 77 | | | $ | (77 | ) | | $ | — | | |
At December 31, 2013, the components of distributable earnings for the Portfolio on a tax basis were as follows:
Undistributed
Ordinary
Income
(000) | | Undistributed
Long-Term
Capital Gain
(000) | |
| $ | — | | | $ | 438 | | |
At December 31, 2013, the aggregate cost for Federal income tax purposes is approximately $30,853,000. The aggregate gross unrealized appreciation is approximately $4,770,000 and the aggregate gross unrealized depreciation is approximately $44,000 resulting in net unrealized appreciation of approximately $4,726,000.
Capital losses and specified ordinary losses, including currency losses, incurred after October 31 but within the taxable year are deemed to arise on the first day of the Portfolio's next taxable year. For the year ended December 31, 2013, the Portfolio deferred to January 1, 2014 for U.S. Federal income tax purposes the following losses:
Post-October
Currency and
Specified Ordinary
Losses
(000) | | Post-October
Capital Losses
(000) | |
| $ | 1 | | | | — | | |
I. Other (unaudited): At December 31, 2013, the Portfolio had otherwise unaffiliated record owners of 10% or greater. Investment activities of these shareholders could have a material impact on the Portfolio. The aggregate percentage of such owners was 19% for Class I shares.
J. Results of Special Shareholder Meeting (unaudited): On June 5, 2013 as adjourned to June 24, 2013 and July 17, 2013, a Joint Special Shareholder Meeting was held for Class H shareholders of the Portfolio to approve the Articles of Amendment to the Fund's Articles of Amendment and Restatement and a Plan of Reclassification for the Portfolio pursuant to which Class H shares would be reclassified as Class P shares. The results with respect to this proposal were as follows:
| For | | Against | | Abstain | |
| | 92,743 | | | | 0 | | | | 0 | | |
24
Morgan Stanley Institutional Fund, Inc.
Annual Report — December 31, 2013
Notes to Financial Statements (cont'd)
K. Accounting Pronouncement: In June 2013, FASB issued Accounting Standards Update 2013-08 Financial Services — Investment Companies (Topic 946) — Amendments to the Scope, Measurement, and Disclosure Requirements ("ASU 2013-08") which is effective for interim and annual reporting periods in fiscal years that begin after December 15, 2013. ASU 2013-08 sets forth a methodology for determining whether an entity should be characterized as an investment company and prescribes fair value accounting for an investment company's non-controlling ownership interest in another investment company. FASB has determined that a fund registered under the Investment Company Act of 1940 automatically meets ASU 2013-08's criteria for an investment company. Although still evaluating the potential impacts of ASU 2013-08 to the Portfolio, management expects that the impact of the Portfolio's adoption will be limited to additional financial statement disclosures.
25
Morgan Stanley Institutional Fund, Inc.
Annual Report — December 31, 2013
Report of Independent Registered Public Accounting Firm
To the Shareholders and Board of Directors of
Morgan Stanley Institutional Fund, Inc. —
Select Global Infrastructure Portfolio
We have audited the accompanying statement of assets and liabilities, including the portfolio of investments, of Select Global Infrastructure Portfolio (one of the portfolios constituting Morgan Stanley Institutional Fund, Inc.) (the "Portfolio") as of December 31, 2013, and the related statement of operations for the year then ended, the statements of changes in net assets for each of the two years in the period then ended, and the financial highlights for each of the periods indicated therein. These financial statements and financial highlights are the responsibility of the Portfolio's management. Our responsibility is to express an opinion on these financial statements and financial highlights based on our audits.
We conducted our audits in accordance with the standards of the Public Company Accounting Oversight Board (United States). Those standards require that we plan and perform the audit to obtain reasonable assurance about whether the financial statements and financial highlights are free of material misstatement. We were not engaged to perform an audit of the Portfolio's internal control over financial reporting. Our audits included consideration of internal control over financial reporting as a basis for designing audit procedures that are appropriate in the circumstances, but not for the purpose of expressing an opinion on the effectiveness of the Portfolio's internal control over financial reporting. Accordingly, we express no such opinion. An audit also includes examining, on a test basis, evidence supporting the amounts and disclosures in the financial statements and financial highlights, assessing the accounting principles used and significant estimates made by management, and evaluating the overall financial statement presentation. Our procedures included confirmation of securities owned as of December 31, 2013, by correspondence with the custodian and others or by other appropriate auditing procedures where replies from others were not received. We believe that our audits provide a reasonable basis for our opinion.
In our opinion, the financial statements and financial highlights referred to above present fairly, in all material respects, the financial position of Select Global Infrastructure Portfolio (one of the portfolios constituting Morgan Stanley Institutional Fund, Inc.) at December 31, 2013, the results of its operations for the year then ended, the changes in its net assets for each of the two years in the period then ended, and the financial highlights for each of the periods indicated therein, in conformity with U.S. generally accepted accounting principles.

Boston, Massachusetts
February 26, 2014
26
Morgan Stanley Institutional Fund, Inc.
Annual Report — December 31, 2013
Federal Tax Notice (unaudited)
For Federal income tax purposes, the following information is furnished with respect to the distributions paid by the Portfolio during its taxable year ended December 31, 2013. For corporate shareholders, 36.5% of the dividends qualified for the dividends received deduction.
The Portfolio designated and paid approximately $1,276,000 as a long-term capital gain distribution.
For Federal income tax purposes, the following information is furnished with respect to the Portfolio's earnings for its taxable year ended December 31, 2013. When distributed, certain earnings may be subject to a maximum tax rate of 15% as provided for the Jobs and Growth Tax Relief Reconciliation Act of 2003. The Portfolio designated up to a maximum of $463,000 as taxable at this lower rate.
During the taxable year ended December 31, 2013 the Portfolio intends to pass through foreign tax credits of approximately $28,000 and has derived net income from sources within foreign countries amounting to approximately $464,000.
In January, the Portfolio provides tax information to shareholders for the preceding calendar year.
27
Morgan Stanley Institutional Fund, Inc.
Annual Report — December 31, 2013
U.S. Privacy Policy (unaudited)
AN IMPORTANT NOTICE CONCERNING OUR U.S. PRIVACY POLICY
This privacy notice describes the U.S. privacy policy of Morgan Stanley Distribution, Inc., and the Morgan Stanley family of mutual funds ("us", "our", "we").
We are required by federal law to provide you with notice of our U.S. privacy policy ("Policy"). This Policy applies to both our current and former clients unless we state otherwise and is intended for individual clients who purchase products or receive services from us for personal, family or household purposes. This Policy is not applicable to partnerships, corporations, trusts or other non-individual clients or account holders, nor is this Policy applicable to individuals who are either beneficiaries of a trust for which we serve as trustee or participants in an employee benefit plan administered or advised by us. This Policy is, however, applicable to individuals who select us to be a custodian of securities or assets in individual retirement accounts, 401(k) accounts, or accounts subject to the Uniform Gifts to Minors Act.
This notice sets out our business practices to protect your privacy; how we collect and share personal information about you; and how you can limit our sharing or certain uses by others of this information. We may amend this Policy at any time, and will inform you of any changes to our Policy as required by law.
WE RESPECT YOUR PRIVACY
We appreciate that you have provided us with your personal financial information and understand your concerns about your information. We strive to safeguard the information our clients entrust to us. Protecting the confidentiality and security of client information is an important part of how we conduct our business.
This notice describes what personal information we collect about you, how we collect it, when we may share it with others, and how certain others may use it. It discusses the steps you may take to limit our sharing of certain information about you with our affiliated companies, including, but not limited to our affiliated banking businesses, brokerage firms and credit service affiliates. It also discloses how you may limit our affiliates' use of shared information for marketing purposes.
Throughout this Policy, we refer to the nonpublic information that personally identifies you as "personal information." We also use the term "affiliated company" in this notice. An affiliated company is a company in our family of companies and includes companies with the Morgan Stanley name. These affiliated companies are financial institutions such as broker-dealers, banks, investment advisers and credit card issuers. We refer to any company that is not an affiliated company as a nonaffiliated third party. For purposes of Section 5 of this notice, and your ability to limit certain uses of personal information by our affiliates, this notice applies to the use of personal information by our affiliated companies.
1. WHAT PERSONAL INFORMATION DO WE COLLECT FROM YOU?
We may collect the following types of information about you: (i) information provided by you, including information from applications and other forms we receive from you, (ii) information about your transactions with us or our affiliates, (iii) information about your transactions with nonaffiliated third parties, (iv) information from consumer reporting agencies, (v) information obtained from our websites, and (vi) information obtained from other sources. For example:
• We collect information such as your name, address, e-mail address, telephone/fax numbers, assets, income and investment objectives through applications and other forms you submit to us.
• We may obtain information about account balances, your use of account(s) and the types of products and services you prefer to receive from us through your dealings and transactions with us and other sources.
• We may obtain information about your creditworthiness and credit history from consumer reporting agencies.
• We may collect background information from and through third-party vendors to verify representations you have made and to comply with various regulatory requirements.
2. WHEN DO WE DISCLOSE PERSONAL INFORMATION WE COLLECT ABOUT YOU?
We may disclose personal information we collect about you in each of the categories listed above to affiliated and nonaffiliated third parties.
28
Morgan Stanley Institutional Fund, Inc.
Annual Report — December 31, 2013
U.S. Privacy Policy (unaudited) (cont'd)
a. Information we disclose to affiliated companies.
We may disclose personal information that we collect about you to our affiliated companies to manage your account(s) effectively, to service and process your transactions, and to let you know about products and services offered by us and affiliated companies, to manage our business, and as otherwise required or permitted by law. Offers for products and services from affiliated companies are developed under conditions designed to safeguard your personal information.
b. Information we disclose to third parties.
We may disclose personal information that we collect about you to nonaffiliated third parties to provide marketing services on our behalf or to other financial institutions with whom we have joint marketing agreements. We may also disclose all of the information we collect to other nonaffiliated third parties for our everyday business purposes, such as to process transactions, maintain account(s), respond to court orders and legal investigations, report to credit bureaus, offer our own products and services, protect against fraud, for institutional risk control, to perform services on our behalf, and as otherwise required or permitted by law.
When we share personal information about you with a nonaffiliated third party, they are required to limit their use of personal information about you to the particular purpose for which it was shared and they are not allowed to share personal information about you with others except to fulfill that limited purpose or as may be permitted or required by law.
3. HOW DO WE PROTECT THE SECURITY AND CONFIDENTIALITY OF PERSONAL INFORMATION WE COLLECT ABOUT YOU?
We maintain physical, electronic and procedural security measures that comply with applicable law and regulations to help safeguard the personal information we collect about you. We have internal policies governing the proper handling of client information by employees. Third parties that provide support or marketing services on our behalf may also receive personal information about you, and we require them to adhere to appropriate security standards with respect to such information.
4. HOW CAN YOU LIMIT OUR SHARING CERTAIN PERSONAL INFORMATION ABOUT YOU WITH OUR AFFILIATED COMPANIES FOR ELIGIBILITY DETERMINATION?
By following the opt-out procedures in Section 6 below, you may limit the extent to which we share with our affiliated companies, personal information that was collected to determine your eligibility for products and services such as your credit reports and other information that you have provided to us or that we may obtain from third parties ("eligibility information"). Eligibility information does not include your identification information or personal information pertaining to our transactions or experiences with you. Please note that, even if you direct us not to share eligibility information with our affiliated companies, we may still share your personal information, including eligibility information, with our affiliated companies under circumstances that are permitted under applicable law, such as to process transactions or to service your account.
5. HOW CAN YOU LIMIT THE USE OF CERTAIN PERSONAL INFORMATION ABOUT YOU BY OUR AFFILIATED COMPANIES FOR MARKETING?
By following the opt-out instructions in Section 6 below, you may limit our affiliated companies from marketing their products or services to you based on personal information we disclose to them. This information may include, for example, your income and account history with us. Please note that, even if you choose to limit our affiliated companies from using personal information about you that we may share with them for marketing their products and services to you, our affiliated companies may use your personal information that they obtain from us to market to you in circumstances permitted by law, such as if the affiliated party has its own relationship with you.
29
Morgan Stanley Institutional Fund, Inc.
Annual Report — December 31, 2013
U.S. Privacy Policy (unaudited) (cont'd)
6. HOW CAN YOU SEND US AN OPT-OUT INSTRUCTION?
If you wish to limit our sharing of eligibility information about you with our affiliated companies, or our affiliated companies' use of personal information for marketing purposes, as described in this notice, you may do so by:
• Calling us at (800) 548-7786
Monday–Friday between 8a.m. and 5p.m. (EST)
• Writing to us at the following address:
Boston Financial Data Services, Inc.
c/o Privacy Coordinator
P.O. Box 219804
Kansas City, Missouri 64121
If you choose to write to us, your request should include: your name, address, telephone number and account number(s) to which the opt-out applies and whether you are opting out with respect to sharing of eligibility information (Section 4 above), or information used for marketing (Section 5 above), or both. Written opt-out requests should not be sent with any other correspondence. In order to process your request, we require that the request be provided by you directly and not through a third party. Once you have informed us about your privacy preferences, your opt-out preference will remain in effect with respect to this Policy (as it may be amended) until you notify us otherwise. If you are a joint account owner, we will accept instructions from any one of you and apply those instructions to the entire account.
Please understand that if you limit our sharing or our affiliated companies' use of personal information, you and any joint account holder(s) may not receive information about our affiliated companies' products and services, including products or services that could help you manage your financial resources and achieve your investment objectives.
If you have more than one account or relationship with us, please specify the accounts to which you would like us to apply your privacy choices. If you have accounts or relationships with our affiliates, you may receive multiple privacy policies from them, and will need to separately notify those companies of your privacy choices for those accounts or relationships.
7. WHAT IF AN AFFILIATED COMPANY BECOMES A NONAFFILIATED THIRD PARTY?
If, at any time in the future, an affiliated company becomes a nonaffiliated third party, further disclosures of personal information made to the former affiliated company will be limited to those described in Section 2(b) above relating to nonaffiliated third parties. If you elected under Section 6 to limit disclosures we make to affiliated companies, or use of personal information by affiliated companies, your election will not apply to use by any former affiliated company of your personal information in their possession once it becomes a nonaffiliated third party.
SPECIAL NOTICE TO RESIDENTS OF VERMONT
The following section supplements our Policy with respect to our individual clients who have a Vermont address and supersedes anything to the contrary in the above Policy with respect to those clients only.
The State of Vermont requires financial institutions to obtain your consent prior to sharing personal information that they collect about you with nonaffiliated third parties, or eligibility information with affiliated companies, other than in certain limited circumstances. Except as permitted by law, we will not share personal information we collect about you with nonaffiliated third parties or eligibility information with affiliated companies, unless you provide us with your written consent to share such information.
SPECIAL NOTICE TO RESIDENTS OF CALIFORNIA
The following section supplements our Policy with respect to our individual clients who have a California address and supersedes anything to the contrary in the above Policy with respect to those clients only.
In response to a California law, if your account has a California home address, your personal information will not be disclosed to nonaffiliated third parties except as permitted by applicable California law, and we will limit sharing such personal information with our affiliates to comply with California privacy laws that apply to us.
30
Morgan Stanley Institutional Fund, Inc.
Annual Report — December 31, 2013
Director and Officer Information (unaudited)
Independent Director:
Name, Age and Address of
Independent Director | | Position(s)
Held with
Registrant | | Length of Time
Served* | | Principal Occupation(s) During Past 5 Years | | Number of
Portfolios in
Fund Complex
Overseen by
Independent
Director** | | Other Directorships
Held by Independent
Director*** | |
Frank L. Bowman (69)
c/o Kramer Levin Naftalis &
Frankel LLP
Counsel to the Independent Directors
1177 Avenue of the Americas
New York, NY 10036 | | Director | | Since
August
2006 | | President, Strategic Decisions, LLC (consulting) (since February 2009); Director or Trustee of various Morgan Stanley Funds (since August 2006); Chairperson of the Insurance Sub-Committee of the Compliance and Insurance Committee (since February 2007); served as President and Chief Executive Officer of the Nuclear Energy Institute (policy organization) (February 2005-November 2008); retired as Admiral, U.S. Navy after serving over 38 years on active duty including 8 years as Director of the Naval Nuclear Propulsion Program in the Department of the Navy and the U.S. Department of Energy (1996-2004); served as Chief of Naval Personnel (July 1994-September 1996); and on the Joint Staff as Director of Political Military Affairs (June 1992-July 1994); knighted as Honorary Knight Commander of the Most Excellent Order of the British Empire; awarded the Officier de l'Orde National du Mérite by the French Government; elected to the National Academy of Engineering (2009). | | | 98 | | | Director of BP p.l.c.; Director of Naval and Nuclear Technologies LLP; Director of the Armed Services YMCA of the USA and the U.S. Naval Submarine League; Director of the American Shipbuilding Suppliers Association; Member of the National Security Advisory Council of the Center for U.S. Global Engagement and a member of the CNA Military Advisory Board. Chairman, J Street Cup Golf Charity, Trustee Fairhaven United Methodist Church. | |
Michael Bozic (73)
c/o Kramer Levin Naftalis & Frankel LLP
Counsel to the Independent Directors
1177 Avenue of the Americas
New York, NY 10036 | | Director | | Since
April
1994 | | Private investor and a member of the advisory board of American Road Group LLC (retail) (since June 2000); Chairperson of the Compliance and Insurance Committee (since October 2006); Director or Trustee of various Morgan Stanley Funds (since April 1994); formerly, Chairperson of the Insurance Committee (July 2006-September 2006); Vice Chairman of Kmart Corporation (December 1998-October 2000), Chairman and Chief Executive Officer of Levitz Furniture Corporation (November 1995-November 1998) and President and Chief Executive Officer of Hills Department Stores (May 1991-July 1995); variously Chairman, Chief Executive Officer, President and Chief Operating Officer (1987-1991) of the Sears Merchandise Group of Sears, Roebuck & Co. | | | 100 | | | Trustee and member of the Hillsdale College Board of Trustees. | |
Kathleen A. Dennis (60)
c/o Kramer Levin Naftalis & Frankel LLP
Counsel to the Independent Directors
1177 Avenue of the Americas
New York, NY 10036 | | Director | | Since
August
2006 | | President, Cedarwood Associates (mutual fund and investment management consulting) (since July 2006); Chairperson of the Money Market and Alternatives Sub-Committee of the Investment Committee (since October 2006) and Director or Trustee of various Morgan Stanley Funds (since August 2006); formerly, Senior Managing Director of Victory Capital Management (1993-2006). | | | 98 | | | Director of various non-profit organizations. | |
Dr. Manuel H. Johnson (65)
c/o Johnson Smick Group, Inc.
888 16th Street, N.W.
Suite 740
Washington, D.C. 20006 | | Director | | Since
July
1991 | | Senior Partner, Johnson Smick International, Inc. (consulting firm); Chairperson of the Investment Committee (since October 2006) and Director or Trustee of various Morgan Stanley Funds (since July 1991); Co-Chairman and a founder of the Group of Seven Council (G7C) (international economic commission); formerly, Chairperson of the Audit Committee (July 1991-September 2006), Vice Chairman of the Board of Governors of the Federal Reserve System and Assistant Secretary of the U.S. Treasury. | | | 101 | | | Director of NVR, Inc. (home construction). | |
31
Morgan Stanley Institutional Fund, Inc.
Annual Report — December 31, 2013
Director and Officer Information (unaudited) (cont'd)
Independent Director: (cont'd)
Name, Age and Address of
Independent Director | | Position(s)
Held with
Registrant | | Length of Time
Served* | | Principal Occupation(s) During Past 5 Years | | Number of
Portfolios in
Fund Complex
Overseen by
Independent
Director** | | Other Directorships
Held by Independent
Director*** | |
Joseph J. Kearns (71)
c/o Kearns & Associates LLC
PMB754
22631 Pacific Coast Highway
Malibu, CA 90265 | | Director | | Since
August
1994 | | President, Kearns & Associates LLC (investment consulting); Chairperson of the Audit Committee (since October 2006) and Director or Trustee of various Morgan Stanley Funds (since August 1994); formerly, Deputy Chairperson of the Audit Committee (July 2003-September 2006) and Chairperson of the Audit Committee of various Morgan Stanley Funds (since August 1994); CFO of the J. Paul Getty Trust. | | | 101 | | | Director of Electro Rent Corporation (equipment leasing) and The Ford Family Foundation. | |
Michael F. Klein (55)
c/o Kramer Levin Naftalis & Frankel LLP
Counsel to the Independent Directors
1177 Avenue of the Americas
New York, NY 10036 | | Director | | Since
August
2006 | | Managing Director, Aetos Capital, LLC (since March 2000) and Co-President, Aetos Alternatives Management, LLC (since January 2004); and Co-Chief Executive Officer of Aetos Capital LLC (since August 2013); Chairperson of the Fixed Income Sub-Committee of the Investment Committee (since October 2006) and Director or Trustee of various Morgan Stanley Funds (since August 2006); formerly, Managing Director, Morgan Stanley & Co. Inc. and Morgan Stanley Dean Witter Investment Management, President, various Morgan Stanley Funds (June 1998-March 2000) and Principal, Morgan Stanley & Co. Inc. and Morgan Stanley Dean Witter Investment Management (August 1997-December 1999). | | | 98 | | | Director of certain investment funds managed or sponsored by Aetos Capital, LLC. Director of Sanitized AG and Sanitized Marketing AG (specialty chemicals). | |
Michael E. Nugent (77)
522 Fifth Avenue
New York, NY 10036 | | Chairperson of the Board and Director | | Chairperson of the Boards since July 2006 and Director since July 1991 | | Chairperson of the Boards of various Morgan Stanley Funds (since July 2006); Chairperson of the Closed-End Fund Committee (since June 2012) and Director or Trustee of various Morgan Stanley Funds (since July 1991); formerly, Chairperson of the Insurance Committee (until July 2006); General Partner, Triumph Capital, L.P. (private investment partnership) (1988-2013) | | | 100 | | | None. | |
W. Allen Reed (66)
c/o Kramer Levin Naftalis & Frankel LLP
Counsel to the Independent Directors
1177 Avenue of the Americas
New York, NY 10036 | | Director | | Since
August
2006 | | Chairperson of the Equity Sub-Committee of the Investment Committee (since October 2006) and Director or Trustee of various Morgan Stanley Funds (since August 2006); formerly, President and CEO of General Motors Asset Management; Chairman and Chief Executive Officer of the GM Trust Bank and Corporate Vice President of General Motors Corporation (August 1994-December 2005). | | | 98 | | | Director of Temple-Inland Industries (packaging and forest products); Director of Legg Mason, Inc. and Director of the Auburn University Foundation. | |
Fergus Reid (81)
c/o Joe Pietryka, Inc.
85 Charles Colman Blvd.
Pawling, NY 12564 | | Director | | Since
June
1992 | | Chairman, Joe Pietryka, Inc.; Chairperson of the Governance Committee and Director or Trustee of various Morgan Stanley Funds (since June 1992). | | | 101 | | | Through December 31, 2012, Trustee and Director of certain Investment companies in the JP Morgan Fund Complex. | |
32
Morgan Stanley Institutional Fund, Inc.
Annual Report — December 31, 2013
Director and Officer Information (unaudited) (cont'd)
Interested Director:
Name, Age and Address of
Interested Director | | Position(s) Held
with Registrant | | Length of
Time Served* | | Principal Occupation(s) During Past 5 Years | | Number of
Portfolios in
Fund Complex
Overseen by
Interested
Director** | | Other Directorships
Held by Interested
Director*** | |
James F. Higgins (66)
One New York Plaza
New York, NY 10004 | | Director | | Since
June
2000 | | Director or Trustee of various Morgan Stanley Funds (since June 2000); Senior Advisor of Morgan Stanley (since August 2000). | | | 99 | | | Formerly, Director of AXA Financial, Inc. and AXA Equitable Life Insurance Company (2002-2011) and Director of AXA MONY Life Insurance Company and AXA MONY Life Insurance Company of America (2004-2011). | |
* Each Director serves an indefinite term, until his or her successor is elected.
** The Fund Complex includes (as of December 31, 2013) all open-end and closed-end funds (including all of their portfolios) advised by Morgan Stanley Investment Management Inc. (the "Adviser") and any funds that have an adviser that is an affiliated person of the Adviser (including, but not limited to, Morgan Stanley AIP GP LP).
*** This includes any directorships at public companies and registered investment companies held by the Director at any time during the past five years.
33
Morgan Stanley Institutional Fund, Inc.
Annual Report — December 31, 2013
Director and Officer Information (unaudited) (cont'd)
Executive Officers:
Name, Age and Address of Executive Officer | | Position(s) Held
with
Registrant | | Length of
Time Served* | | Principal Occupation(s) During Past 5 Years | |
John H. Gernon (50)
522 Fifth Avenue
New York, NY 10036 | | President and Principal Executive Officer—Equity, Fixed Income and AIP Funds | | Since September 2013 | | President and Principal Executive Officer of the Equity and Fixed Income Funds and the Morgan Stanley AIP Funds (since September 2013) in the Fund Complex; Managing Director of the Adviser. | |
Stefanie V. Chang Yu (47)
522 Fifth Avenue
New York, NY 10036 | | Chief Compliance Officer | | Since
January
2014 | | Managing Director of the Adviser and various entities affiliated with the Adviser; Chief Compliance Officer of various Morgan Stanley Funds and the Adviser (since January 2014). Formerly, Vice President of various Morgan Stanley Funds (December 1997-January 2014). | |
Joseph C. Benedetti (48)
522 Fifth Avenue
New York, NY 10036 | | Vice President | | Since
January
2014 | | Managing Director of the Adviser and various entities affiliated with the Adviser; Vice President of various Morgan Stanley Funds (since January 2014). | |
Francis J. Smith (48)
522 Fifth Avenue
New York, NY 10036 | | Treasurer and Principal Financial Officer | | Treasurer since July 2003 and Principal Financial Officer since September 2002 | | Executive Director of the Adviser and various entities affiliated with the Adviser; Treasurer and Principal Financial Officer of various Morgan Stanley Funds (since July 2003). | |
Mary E. Mullin (46)
522 Fifth Avenue
New York, NY 10036 | | Secretary | | Since
June
1999 | | Executive Director of the Adviser and various entities affiliated with the Adviser; Secretary of various Morgan Stanley Funds (since June 1999). | |
* Each officer serves an indefinite term, until his or her successor is elected.
34
Morgan Stanley Institutional Fund, Inc.
Annual Report — December 31, 2013
Adviser and Administrator
Morgan Stanley Investment Management Inc.
522 Fifth Avenue
New York, New York 10036
Sub-Advisers
Morgan Stanley Investment Management Limited
25 Cabot Square, Canary Wharf
London, E14 4QA, England
Morgan Stanley Investment Management Company
23 Church Street
16-01 Capital Square 049481 Singapore
Distributor
Morgan Stanley Distribution, Inc.
522 Fifth Avenue
New York, New York 10036
Dividend Disbursing and Transfer Agent
Boston Financial Data Services, Inc.
2000 Crown Colony Drive
Quincy, Massachusetts 02169
Custodian
State Street Bank and Trust Company
One Lincoln Street
Boston, Massachusetts 02111
Legal Counsel
Dechert LLP
1095 Avenue of the Americas
New York, New York 10036
Counsel to the Independent Directors
Kramer Levin Naftalis & Frankel LLP
1177 Avenue of the Americas
New York, New York 10036
Independent Registered Public Accounting Firm
Ernst & Young LLP
200 Clarendon Street
Boston, Massachusetts 02116
Reporting to Shareholders
Each Morgan Stanley fund provides a complete schedule of portfolio holdings in its semi-annual and annual reports within 60 days of the end of the fund's second and fourth fiscal quarters by filing the schedule electronically with the Securities and Exchange Commission (SEC). The semi-annual reports are filed on Form N-CSRS and the annual reports are filed on Form N-CSR. Morgan Stanley also delivers the semi-annual and annual reports to fund shareholders and makes these reports available on its public website, www.morganstanley.com/im. Each Morgan Stanley fund also files a complete schedule of portfolio holdings with the SEC for the fund's first and third fiscal quarters on Form N-Q. Morgan Stanley does not deliver the reports for the first and third fiscal quarters to shareholders, nor are the reports posted to the Morgan Stanley public website. You may, however, obtain the Form N-Q filings (as well as the Form N-CSR and N-CSRS filings) by accessing the SEC's website, www.sec.gov. You may also review and copy them at the SEC's Public Reference Room in Washington, DC. Information on the operation of the SEC's Public Reference Room may be obtained by calling the SEC toll free at 1 (800) SEC-0330. You can also request copies of these materials, upon payment of a duplicating fee, by electronic request at the SEC's email address (publicinfo@sec.gov) or by writing the Public Reference Room of the SEC, Washington, DC 20549-0102.
Proxy Voting Policies and Procedures and Proxy Voting Record
You may obtain a copy of the Fund's Proxy Voting Policy and Procedures and information regarding how the Fund voted proxies relating to portfolio securities during the most recent twelve-month period ended June 30, without charge, upon request, by calling toll free 1 (800) 548-7786 or by visiting our website at www.morganstanley.com/im. This information is also available on the SEC's website at www.sec.gov.
This report is authorized for distribution only when preceded or accompanied by a prospectus of the Morgan Stanley Institutional Fund, Inc. which describes in detail each Investment Portfolio's investment policies, risks, fees and expenses. Please read the prospectus carefully before you invest or send money. For additional information, including information regarding the investments comprising the Portfolio, please visit our website at www.morganstanley.com/im or call toll free 1 (800) 548-7786.
35
(This Page has been left blank intentionally.)
(This Page has been left blank intentionally.)
Printed in U.S.A.
This Report has been prepared for shareholders and may be distributed to others only if preceded or accompanied by a current prospectus.
Morgan Stanley Investment Management Inc.
522 Fifth Avenue
New York, New York 10036
© 2014 Morgan Stanley. Morgan Stanley Distribution, Inc.

IFISGIANN
809944 Exp 2.28.15

Morgan Stanley Institutional Fund, Inc.
International Advantage Portfolio
Annual Report
December 31, 2013

Morgan Stanley Institutional Fund, Inc.
Annual Report — December 31, 2013
Shareholders' Letter | | | 2 | | |
Expense Example | | | 3 | | |
Investment Overview | | | 4 | | |
Portfolio of Investments | | | 6 | | |
Statement of Assets and Liabilities | | | 7 | | |
Statement of Operations | | | 8 | | |
Statements of Changes in Net Assets | | | 9 | | |
Financial Highlights | | | 10 | | |
Notes to Financial Statements | | | 13 | | |
Report of Independent Registered Public Accounting Firm | | | 21 | | |
Federal Tax Notice | | | 22 | | |
U.S. Privacy Policy | | | 23 | | |
Director and Officer Information | | | 26 | | |
This report is authorized for distribution only when preceded or accompanied by prospectuses of the Morgan Stanley Institutional Fund, Inc. To receive a prospectus and/or statement of additional information (SAI), which contains more complete information such as investment objectives, charges, expenses, policies for voting proxies, risk considerations, and describes in detail each of the Portfolio's investment policies to the prospective investor, please call toll free 1 (800) 548-7786. Please read the prospectuses carefully before you invest or send money.
Additionally, you can access portfolio information including performance, characteristics, and investment team commentary through Morgan Stanley Investment Management's website: www.morganstanley.com/im.
Market forecasts provided in this report may not necessarily come to pass. There is no guarantee that any sectors mentioned will continue to perform as discussed herein or that securities in such sectors will be held by the Portfolio in the future. There is no assurance that a Portfolio will achieve its investment objective. Portfolios are subject to market risk, which is the possibility that market values of securities owned by the Portfolio will decline and, therefore, the value of the Portfolio's shares may be less than what you paid for them. Accordingly, you can lose money investing in the Portfolio. Please see the prospectus for more complete information on investment risks.
1
Morgan Stanley Institutional Fund, Inc.
Annual Report — December 31, 2013
Shareholders' Letter (unaudited)
Dear Shareholders,
We are pleased to provide this Annual report, in which you will learn how your investment in International Advantage Portfolio (the "Portfolio") performed during the latest twelve-month period.
Morgan Stanley Investment Management is a client-centric, investor-led organization. Our global presence, intellectual capital, and breadth of products and services enable us to partner with investors to meet the evolving challenges of today's financial markets. We aim to deliver superior investment service and to empower our clients to make the informed decisions that help them reach their investment goals.
As always, we thank you for selecting Morgan Stanley Investment Management, and look forward to working with you in the months and years ahead.
Sincerely,

John H. Gernon
President and Principal Executive Officer
January 2014
2
Morgan Stanley Institutional Fund, Inc.
Annual Report — December 31, 2013
Expense Example (unaudited)
International Advantage Portfolio
As a shareholder of the Portfolio, you incur two types of costs: (1) transactional costs, including redemptions fees; and (2) ongoing costs, including advisory fees, administration fees, distribution and shareholder services fees and other Portfolio expenses. This example is intended to help you understand your ongoing costs (in dollars) of investing in the Portfolio and to compare these costs with the ongoing costs of investing in other mutual funds.
This example is based on an investment of $1,000 invested at the beginning of the six-month period ended December 31, 2013 and held for the entire six-month period.
Actual Expenses
The table below provides information about actual account values and actual expenses. You may use the information in this table, together with the amount you invested, to estimate the expenses that you paid over the period. Simply divide your account value by $1,000 (for example, an $8,600 account value divided by $1,000 = 8.6), then multiply the result by the number in the table under the heading entitled "Actual Expenses Paid During Period" to estimate the expenses you paid on your account during this period.
Hypothetical Example for Comparison Purposes
The table below provides information about hypothetical account values and hypothetical expenses based on the Portfolio's actual expense ratio and an assumed rate of return of 5% per year before expenses, which is not the Portfolio's actual return. The hypothetical account values and expenses may not be used to estimate the actual ending account balance or expenses you paid for the period. You may use this information to compare the ongoing costs of investing in the Portfolio and other funds. To do so, compare this 5% hypothetical example with the 5% hypothetical examples that appear in the shareholder reports of the other funds.
Please note that the expenses shown in the table are meant to highlight your ongoing costs only and do not reflect any transactional costs, such as sales charges (loads) and redemption fees. Therefore, the information for each class in the table is useful in comparing ongoing costs only, and will not help you determine the relative total costs of owning different funds. In addition, if these transactional costs were included, your costs would have been higher.
| | | Beginning
Account
Value
7/1/13 | | Actual Ending
Account
Value
12/31/13 | | Hypothetical
Ending Account
Value | | Actual
Expenses
Paid
During
Period* | | Hypothetical
Expenses Paid
During Period* | | Net
Expense
Ratio
During
Period** | |
International Advantage Portfolio Class I | | $ | 1,000.00 | | | $ | 1,122.40 | | | $ | 1,018.90 | | | $ | 6.69 | | | $ | 6.36 | | | | 1.25 | % | |
International Advantage Portfolio Class A@ | | | 1,000.00 | | | | 1,120.50 | | | | 1,017.24 | | | | 8.44 | | | | 8.03 | | | | 1.58 | | |
International Advantage Portfolio Class L | | | 1,000.00 | | | | 1,117.80 | | | | 1,014.82 | | | | 11.00 | | | | 10.46 | | | | 2.06 | | |
* Expenses are calculated using each Portfolio Class' annualized net expense ratio (as disclosed), multiplied by the average account value over the period, and multiplied by 184/365 (to reflect the most recent one-half year period).
** Annualized.
@ Effective September 9, 2013, Class P and Class H shares were renamed Class A shares.
3
Morgan Stanley Institutional Fund, Inc.
Annual Report — December 31, 2013
Investment Overview (unaudited)
International Advantage Portfolio
The International Advantage Portfolio seeks long-term capital appreciation by investing primarily in established companies on an international basis, with capitalizations within the range of companies included in the Morgan Stanley Capital International (MSCI) All Country World Ex-U.S. Index.
Performance
For the year ended December 31, 2013, the Portfolio had a total return based on net asset value and reinvestment of distributions per share of 12.72%, net of fees, for Class I shares. The Portfolio's Class I shares underperformed against its benchmark, the MSCI All Country World Ex-U.S. Index (the "Index"), which returned 15.29%.
Factors Affecting Performance
• International equities were up 15.29% in 2013 as measured by the Index. Developed market equities led, with Europe and Japan both rising more than 20% for the year (as measured by the MSCI Europe Index and MSCI Japan Index, respectively). In Europe, turmoil in Italy's elections and a bank bailout in Cyprus triggered volatility in eurozone equities early in the year. But investor sentiment turned more optimistic as Europe exited its recession and austerity measures were relaxed. These factors helped eurozone stocks perform especially well. Japan also resumed economic expansion in 2013. Its stocks rallied strongly as a massive quantitative easing plan announced by the Bank of Japan in April led to depreciation in the yen. By comparison, emerging market equities languished. Uncertainties about a slowdown in China's economy, the negative implications of the expected tapering of U.S. quantitative easing, and pockets of regional and country-specific political conflict were among the factors weighing on investor sentiment for the asset class.
• The Portfolio's relative underperformance was attributable primarily to stock selection in consumer staples, where exposure to a liquor producer in China (which is not represented in the Index) was the main detractor.i An overweight in the sector was unfavorable as well.
• Stock selection and an underweight in the financials sector were detrimental to relative performance. Within the sector, a holding in a Brazil-based securities clearinghouse lagged the most.
• An underweight in the health care sector was unfavorable to relative performance, as the sector
had relatively strong performance in the Index during the period.
• The Portfolio benefited from no exposure to the materials sector, which posted a loss for the period and was the weakest-performing sector in the Index.
• Stock selection in the information technology sector boosted relative returns, driven by a position in a Russia-based software and services provider primarily serving Central and Eastern Europe.
• Although stock selection in the consumer discretionary sector detracted slightly from relative performance, it was more than offset by relative gains from an overweight in the sector.
Management Strategies
• We look for high-quality growth companies that we believe have these attributes: sustainable competitive advantages, above-average business visibility, rising return on invested capital, strong free cash flow generation and a favorable risk/reward. We find these companies through intense fundamental research. Our emphasis is on secular growth, and as a result, short-term market events are not as meaningful in the stock selection process.
i To gain exposure to the stock, the Portfolio utilized a P-note (participation note), which is intended to mirror the performance of the underlying stock. There is no leverage associated with P-notes.
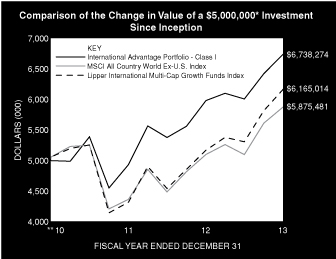
* Minimum Investment for Class I shares
** Commenced Operations on December 28, 2010.
In accordance with SEC regulations, Portfolio's performance shown assumes that all recurring fees (including management fees) were deducted and all dividends and distributions were reinvested. The performance of Class A+ and L shares will vary from Class I shares and will be negatively impacted by additional fees assessed to those classes.
4
Morgan Stanley Institutional Fund, Inc.
Annual Report — December 31, 2013
Investment Overview (unaudited) (cont'd)
International Advantage Portfolio
Performance Compared to the Morgan Stanley Capital International (MSCI) All Country World Ex-U.S. Index(1) and the Lipper International Multi-Cap Growth Funds Index(2)
| | | Period Ended December 31, 2013
Total Returns(3) | |
| | | | | Average Annual | |
| | | One
Year | | Five
Years | | Ten
Years | | Since
Inception(5) | |
Portfolio — Class I Shares
w/o sales charges(4) | | | 12.72 | % | | | — | | | | — | | | | 10.43 | % | |
MSCI All Country World
Ex-U.S. Index | | | 15.29 | | | | — | | | | — | | | | 5.51 | | |
Lipper International Multi-Cap
Growth Funds Index | | | 19.33 | | | | — | | | | — | | | | 7.21 | | |
Portfolio — Class A+ Shares
w/o sales charges(4) | | | 12.43 | | | | — | | | | — | | | | 10.15 | | |
Portfolio — Class A+ Shares
with maximum 5.25%
sales charges(4) | | | 6.55 | | | | — | | | | — | | | | 8.21 | | |
MSCI All Country World
Ex-U.S. Index | | | 15.29 | | | | — | | | | — | | | | 5.51 | | |
Lipper International Multi-Cap
Growth Funds Index | | | 19.33 | | | | — | | | | — | | | | 7.21 | | |
Portfolio — Class L Shares
w/o sales charges(4) | | | 11.88 | | | | — | | | | — | | | | 9.61 | | |
MSCI All Country World
Ex-U.S. Index | | | 15.29 | | | | — | | | | — | | | | 5.51 | | |
Lipper International Multi-Cap
Growth Funds Index | | | 19.33 | | | | — | | | | — | | | | 7.21 | | |
Performance data quoted represents past performance, which is no guarantee of future results, and current performance may be lower or higher than the figures shown. Performance assumes that all dividends and distributions, if any, were reinvested. For the most recent month-end performance figures, please visit www.morganstanley.com/im. Investment return and principal value will fluctuate so that Portfolio shares, when redeemed, may be worth more or less than their original cost. Total returns do not reflect the deduction of taxes that a shareholder would pay on Portfolio distributions or the redemption of Portfolio shares. Performance of share classes will vary due to difference in expenses.
+ Effective September 9, 2013, Class P shares were renamed Class A shares.
(1) The Morgan Stanley Capital International (MSCI) All Country World Ex-U.S. Index is a free float-adjusted market capitalization weighted index designed to measure the equity market performance of developed and emerging markets, excluding the U.S. The term "free float" represents the portion of shares outstanding that are deemed to be available for purchase in the public equity markets by investors. The Index is unmanaged and its returns do not include any sales charges or fees. Such costs would lower performance. It is not possible to invest directly in an index.
(2) The Lipper International Multi-Cap Growth Funds Index is an equally weighted performance index of the largest qualifying funds (based on net assets) in the Lipper International Multi-Cap Growth Funds classification. The Index, which is adjusted for capital gains distributions and income dividends, is unmanaged and should not be considered an investment. There are currently 30 funds represented in this Index. As of the date of this report, the Portfolio was in the Lipper International Multi-Cap Growth Funds classification.
(3) Total returns for the Portfolio reflect fees waived and expenses reimbursed, if applicable, by the Adviser. Without such waivers and reimbursements, total returns would have been lower. The fee waivers and/or expense reimbursements
will continue for at least one year or until such time as the Fund's Board of Directors acts to discontinue all or a portion of such waivers and/or expense reimbursements when it deems that such action is appropriate.
(4) Commenced operations on December 28, 2010.
(5) For comparative purposes, average annual since inception returns listed for the Indexes refer to the inception date or initial offering of the respective share class of the Portfolio, not the inception of the Index.
Portfolio Composition
Classification | | Percentage of
Total Investments | |
Other* | | | 38.3 | % | |
Beverages | | | 15.8 | | |
Textiles, Apparel & Luxury Goods | | | 14.7 | | |
Food Products | | | 10.4 | | |
Information Technology Services | | | 7.9 | | |
Road & Rail | | | 7.3 | | |
Diversified Consumer Services | | | 5.6 | | |
Total Investments | | | 100.0 | % | |
* Industries and/or investment types representing less than 5% of total investments.
5
Morgan Stanley Institutional Fund, Inc.
Annual Report — December 31, 2013
Portfolio of Investments
International Advantage Portfolio
| | | Shares | | Value
(000) | |
Common Stocks (90.5%) | |
Australia (1.4%) | |
Aurizon Holding Ltd. | | | 9,815 | | | $ | 43 | | |
Belgium (4.4%) | |
Anheuser-Busch InBev N.V. | | | 1,227 | | | | 130 | | |
Brazil (2.2%) | |
CETIP SA — Mercados Organizados | | | 6,555 | | | | 67 | | |
Canada (5.5%) | |
Brookfield Asset Management, Inc., Class A | | | 2,136 | | | | 83 | | |
Brookfield Infrastructure Partners LP | | | 2,095 | | | | 82 | | |
| | | | 165 | | |
China (2.8%) | |
New Oriental Education & Technology Group ADR | | | 2,630 | | | | 83 | | |
Denmark (5.7%) | |
DSV A/S | | | 5,214 | | | | 171 | | |
France (11.6%) | |
Christian Dior SA | | | 519 | | | | 98 | | |
Danone | | | 1,162 | | | | 84 | | |
Edenred | | | 1,222 | | | | 41 | | |
Hermes International | | | 119 | | | | 43 | | |
Pernod-Ricard SA | | | 736 | | | | 84 | | |
| | | | 350 | | |
Germany (3.2%) | |
Adidas AG | | | 763 | | | | 97 | | |
Indonesia (0.6%) | |
Hero Supermarket Tbk PT (a) | | | 94,000 | | | | 19 | | |
Italy (2.0%) | |
Prada SpA (b) | | | 6,800 | | | | 61 | | |
Japan (2.7%) | |
Calbee, Inc. | | | 3,300 | | | | 80 | | |
Korea, Republic of (4.7%) | |
Hotel Shilla Co., Ltd. (a) | | | 1,105 | | | | 69 | | |
NAVER Corp. (a) | | | 106 | | | | 73 | | |
| | | | 142 | | |
Norway (1.4%) | |
Telenor ASA | | | 1,771 | | | | 42 | | |
Singapore (1.7%) | |
Mandarin Oriental International Ltd. | | | 31,000 | | | | 52 | | |
South Africa (2.7%) | |
Naspers Ltd., Class N | | | 786 | | | | 82 | | |
Switzerland (8.1%) | |
Kuehne & Nagel International AG (Registered) | | | 770 | | | | 101 | | |
Nestle SA (Registered) | | | 1,936 | | | | 142 | | |
| | | | 243 | | |
United Kingdom (19.4%) | |
British American Tobacco PLC | | | 796 | | | | 43 | | |
Burberry Group PLC | | | 5,321 | | | | 133 | | |
Diageo PLC | | | 2,966 | | | | 98 | | |
Imperial Tobacco Group PLC | | | 1,128 | | | | 44 | | |
| | | Shares | | Value
(000) | |
Intertek Group PLC | | | 1,991 | | | $ | 104 | | |
Reckitt Benckiser Group PLC | | | 1,212 | | | | 96 | | |
Tesco PLC | | | 11,621 | | | | 64 | | |
| | | | 582 | | |
United States (10.4%) | |
Cognizant Technology Solutions Corp., Class A (a) | | | 850 | | | | 86 | | |
Luxoft Holding, Inc. (a) | | | 3,833 | | | | 146 | | |
TAL Education Group ADR (a) | | | 3,694 | | | | 81 | | |
| | | | 313 | | |
Total Common Stocks (Cost $2,213) | | | 2,722 | | |
Participation Notes (5.1%) | |
China (5.1%) | |
Kweichow Moutai Co., Ltd., Class A,
Equity Linked Notes, expires 2/20/14 | | | 1,900 | | | | 40 | | |
Kweichow Moutai Co., Ltd., Class A,
Equity Linked Notes, expires 3/4/21 | | | 5,280 | | | | 112 | | |
Total Participation Notes (Cost $192) | | | 152 | | |
| | Notional
Amount | | | |
Foreign Currency Options (0.1%) | |
Call Options Purchased (0.1%) | |
USD/CNY December 2014 CNY @ 6.50 | | $ | 396,018 | | | | 1 | | |
USD/CNY December 2014 CNY @ 6.50 | | | 32,374 | | | | — | @ | |
USD/CNY December 2014 CNY @ 6.50 | | | 464,184 | | | | 1 | | |
Total Call Options Purchased (Cost $3) | | | 2 | | |
| | Shares | | | |
Short-Term Investment (1.9%) | |
Investment Company (1.9%) | |
Morgan Stanley Institutional Liquidity
Funds — Money Market Portfolio —
Institutional Class (See Note G)
(Cost $59) | | | 58,873 | | | | 59 | | |
Total Investments (97.6%) (Cost $2,467) | | | 2,935 | | |
Other Assets in Excess of Liabilities (2.4%) | | | 73 | | |
Net Assets (100.0%) | | $ | 3,008 | | |
(a) Non-income producing security.
(b) Security trades on the Hong Kong exchange.
@ Value is less than $500.
ADR American Depositary Receipt.
CNY Chinese Yuan Renminbi
USD United States Dollar
The accompanying notes are an integral part of the financial statements.
6
Morgan Stanley Institutional Fund, Inc.
Annual Report — December 31, 2013
International Advantage Portfolio
Statement of Assets and Liabilities | | December 31, 2013
(000) | |
Assets: | |
Investments in Securities of Unaffiliated Issuers, at Value (Cost $2,408) | | $ | 2,876 | | |
Investment in Security of Affiliated Issuer, at Value (Cost $59) | | | 59 | | |
Total Investments in Securities, at Value (Cost $2,467) | | | 2,935 | | |
Foreign Currency, at Value (Cost $—@) | | | — | @ | |
Cash | | | 1 | | |
Due from Adviser | | | 35 | | |
Receivable for Investments Sold | | | 33 | | |
Tax Reclaim Receivable | | | 2 | | |
Dividends Receivable | | | 1 | | |
Receivable from Affiliate | | | — | @ | |
Other Assets | | | 15 | | |
Total Assets | | | 3,022 | | |
Liabilities: | |
Payable for Transfer Agent Fees | | | 1 | | |
Payable for Transfer Agent Fees — Class I | | | — | @ | |
Payable for Transfer Agent Fees — Class A* | | | — | @ | |
Payable for Transfer Agent Fees — Class L | | | — | @ | |
Payable for Custodian Fees | | | 2 | | |
Payable for Professional Fees | | | 1 | | |
Payable for Sub Transfer Agency Fees — Class I | | | — | @ | |
Payable for Administration Fees | | | — | @ | |
Payable for Shareholder Services Fees — Class A* | | | — | @ | |
Payable for Distribution and Shareholder Services Fees — Class L | | | — | @ | |
Other Liabilities | | | 10 | | |
Total Liabilities | | | 14 | | |
Net Assets | | $ | 3,008 | | |
Net Assets Consist Of: | |
Paid-in-Capital | | $ | 2,460 | | |
Accumulated Undistributed Net Investment Income | | | 4 | | |
Accumulated Net Realized Gain | | | 76 | | |
Unrealized Appreciation (Depreciation) on: | |
Investments | | | 468 | | |
Foreign Currency Translations | | | — | @ | |
Net Assets | | $ | 3,008 | | |
CLASS I: | |
Net Assets | | $ | 2,637 | | |
| Shares Outstanding $0.001 par value shares of beneficial interest (500,000,000 shares authorized) (not in 000's) | | | 213,285 | | |
Net Asset Value, Offering and Redemption Price Per Share | | $ | 12.36 | | |
CLASS A*: | |
Net Assets | | $ | 248 | | |
| Shares Outstanding $0.001 par value shares of beneficial interest (500,000,000 shares authorized) (not in 000's) | | | 20,000 | | |
Net Asset Value, Redemption Price Per Share | | $ | 12.38 | | |
Maximum Sales Load§§ | | | 5.25 | % | |
Maximum Sales Charge | | $ | 0.69 | | |
Maximum Offering Price Per Share | | $ | 13.07 | | |
CLASS L: | |
Net Assets | | $ | 123 | | |
| Shares Outstanding $0.001 par value shares of beneficial interest (500,000,000 shares authorized) (not in 000's) | | | 10,000 | | |
Net Asset Value, Offering and Redemption Price Per Share | | $ | 12.36 | | |
* Effective September 9, 2013, Class P and Class H shares were renamed Class A shares.
@ Amount is less than $500.
§§ Effective February 25, 2013, the Directors approved the imposition of a maximum initial sales charge of 5.25% on purchases of Class A shares of the Portfolio.
The accompanying notes are an integral part of the financial statements.
7
Morgan Stanley Institutional Fund, Inc.
Annual Report — December 31, 2013
International Advantage Portfolio
Statement of Operations | | Year Ended
December 31, 2013
(000) | |
Investment Income: | |
Dividends from Securities of Unaffiliated Issuers (Net of $7 of Foreign Taxes Withheld) | | $ | 66 | | |
Dividends from Security of Affiliated Issuer (Note G) | | | — | @ | |
Total Investment Income | | | 66 | | |
Expenses: | |
Professional Fees | | | 67 | | |
Registration Fees | | | 35 | | |
Advisory Fees (Note B) | | | 26 | | |
Shareholder Reporting Fees | | | 14 | | |
Custodian Fees (Note F) | | | 11 | | |
Transfer Agency Fees (Note E) | | | 9 | | |
Transfer Agency Fees — Class I (Note E) | | | — | @ | |
Transfer Agency Fees — Class A* (Note E) | | | — | @ | |
Transfer Agency Fees — Class L (Note E) | | | — | @ | |
Pricing Fees | | | 5 | | |
Administration Fees (Note C) | | | 2 | | |
Shareholder Services Fees — Class A* (Note D) | | | 1 | | |
Distribution and Shareholder Services Fees — Class L (Note D) | | | 1 | | |
Directors' Fees and Expenses | | | 1 | | |
Sub Transfer Agency Fees — Class I | | | — | @ | |
Other Expenses | | | 16 | | |
Total Expenses | | | 188 | | |
Expenses Reimbursed by Adviser (Note B) | | | (123 | ) | |
Waiver of Advisory Fees (Note B) | | | (26 | ) | |
Reimbursement of Class Specific Expenses — Class I (Note B) | | | (— | @) | |
Reimbursement of Class Specific Expenses — Class A* (Note B) | | | (— | @) | |
Reimbursement of Class Specific Expenses — Class L (Note B) | | | (— | @) | |
Rebate from Morgan Stanley Affiliate (Note G) | | | (— | @) | |
Net Expenses | | | 39 | | |
Net Investment Income | | | 27 | | |
Realized Gain: | |
Investments Sold | | | 214 | | |
Foreign Currency Transactions | | | — | @ | |
Net Realized Gain | | | 214 | | |
Change in Unrealized Appreciation (Depreciation): | |
Investments | | | 118 | | |
Foreign Currency Translations | | | — | @ | |
Net Change in Unrealized Appreciation (Depreciation) | | | 118 | | |
Net Realized Gain and Change in Unrealized Appreciation (Depreciation) | | | 332 | | |
Net Increase in Net Assets Resulting from Operations | | $ | 359 | | |
* Effective September 9, 2013, Class P and Class H shares were renamed Class A shares.
@ Amount is less than $500.
The accompanying notes are an integral part of the financial statements.
8
Morgan Stanley Institutional Fund, Inc.
Annual Report — December 31, 2013
International Advantage Portfolio
Statements of Changes in Net Assets | | Year Ended
December 31, 2013
(000) | | Year Ended
December 31, 2012
(000) | |
Increase (Decrease) in Net Assets: | |
Operations: | |
Net Investment Income | | $ | 27 | | | $ | 24 | | |
Net Realized Gain | | | 214 | | | | 1 | | |
Net Change in Unrealized Appreciation (Depreciation) | | | 118 | | | | 429 | | |
Net Increase in Net Assets Resulting from Operations | | | 359 | | | | 454 | | |
Distributions from and/or in Excess of: | |
Class I: | |
Net Investment Income | | | (26 | ) | | | (13 | ) | |
Net Realized Gain | | | (117 | ) | | | — | | |
Class A*: | |
Net Investment Income | | | (1 | ) | | | (1 | ) | |
Net Realized Gain | | | (11 | ) | | | — | | |
Class H@@@: | |
Net Investment Income | | | (— | @)** | | | (6 | ) | |
Net Realized Gain | | | (— | @)** | | | — | | |
Class L: | |
Net Investment Income | | | (— | @) | | | (— | @) | |
Net Realized Gain | | | (6 | ) | | | — | | |
Total Distributions | | | (161 | ) | | | (20 | ) | |
Capital Share Transactions:(1) | |
Class I: | |
Subscribed | | | 1,363 | | | | 459 | | |
Distributions Reinvested | | | 80 | | | | 3 | | |
Redeemed | | | (388 | ) | | | (547 | ) | |
Class A*: | |
Conversion from Class H | | | 119 | | | | — | | |
Redeemed | | | (— | @) | | | — | | |
Class H@@@: | |
Subscribed | | | — | @** | | | 100 | | |
Distributions Reinvested | | | — | @** | | | 5 | | |
Conversion to Class A | | | (119 | ) | | | — | | |
Redeemed | | | (831 | )** | | | — | | |
Net Increase in Net Assets Resulting from Capital Share Transactions | | | 224 | | | | 20 | | |
Total Increase in Net Assets | | | 422 | | | | 454 | | |
Net Assets: | |
Beginning of Period | | | 2,586 | | | | 2,132 | | |
End of Period (Including Accumulated Undistributed Net Investment Income of $4 and $5) | | $ | 3,008 | | | $ | 2,586 | | |
(1) Capital Share Transactions: | |
Class I: | |
Shares Subscribed | | | 115 | | | | 43 | | |
Shares Issued on Distributions Reinvested | | | 7 | | | | — | @@ | |
Shares Redeemed | | | (31 | ) | | | (51 | ) | |
Net Increase (Decrease) in Class I Shares Outstanding | | | 91 | | | | (8 | ) | |
Class A*: | |
Conversion from Class H | | | 10 | | | | — | | |
Shares Redeemed | | | (— | @@) | | | — | | |
Net Increase in Class A Shares Outstanding | | | 10 | | | | — | | |
Class H@@@: | |
Shares Subscribed | | | — | @@** | | | 9 | | |
Shares Issued on Distributions Reinvested | | | — | @@** | | | — | @@ | |
Conversion to Class A | | | (10 | ) | | | — | | |
Shares Redeemed | | | (70 | )** | | | — | | |
Net Increase (Decrease) in Class H Shares Outstanding | | | (80 | ) | | | 9 | | |
@ Amount is less than $500.
@@ Amount is less than 500 shares.
@@@ Effective September 9, 2013, Class H shares converted into Class A shares.
* Effective September 9, 2013, Class P shares were renamed Class A shares.
** For the period January 1, 2013 through September 6, 2013.
The accompanying notes are an integral part of the financial statements.
9
Morgan Stanley Institutional Fund, Inc.
Annual Report — December 31, 2013
Financial Highlights
International Advantage Portfolio
| | | Class I | |
| | | Year Ended December 31, | | Period from
December 28, 2010^ to | |
Selected Per Share Data and Ratios | | 2013 | | 2012 | | 2011 | | December 31, 2010 | |
Net Asset Value, Beginning of Period | | $ | 11.60 | | | $ | 9.65 | | | $ | 9.99 | | | $ | 10.00 | | |
Income (Loss) from Investment Operations: | |
Net Investment Income (Loss)† | | | 0.13 | | | | 0.12 | | | | 0.12 | | | | (0.00 | )‡ | |
Net Realized and Unrealized Gain (Loss) | | | 1.32 | | | | 1.93 | | | | (0.26 | ) | | | (0.01 | ) | |
Total from Investment Operations | | | 1.45 | | | | 2.05 | | | | (0.14 | ) | | | (0.01 | ) | |
Distributions from and/or in Excess of: | |
Net Investment Income | | | (0.12 | ) | | | (0.10 | ) | | | (0.11 | ) | | | — | | |
Net Realized Gain | | | (0.57 | ) | | | — | | | | (0.09 | ) | | | — | | |
Total Distributions | | | (0.69 | ) | | | (0.10 | ) | | | (0.20 | ) | | | — | | |
Net Asset Value, End of Period | | $ | 12.36 | | | $ | 11.60 | | | $ | 9.65 | | | $ | 9.99 | | |
Total Return++ | | | 12.72 | % | | | 21.27 | % | | | (1.31 | )% | | | (0.10 | )%# | |
Ratios and Supplemental Data: | |
Net Assets, End of Period (Thousands) | | $ | 2,637 | | | $ | 1,421 | | | $ | 1,255 | | | $ | 1,198 | | |
Ratio of Expenses to Average Net Assets (1) | | | 1.24 | %+ | | | 1.24 | %+†† | | | 1.24 | %+†† | | | 1.25 | %††* | |
Ratio of Net Investment Income (Loss) to Average Net Assets (1) | | | 1.04 | %+ | | | 1.08 | %+†† | | | 1.17 | %+†† | | | (1.09 | )%††* | |
Ratio of Rebate from Morgan Stanley Affiliates to Average Net Assets | | | 0.00 | %§ | | | 0.01 | %†† | | | 0.01 | %†† | | | N/A | | |
Portfolio Turnover Rate | | | 49 | % | | | 40 | % | | | 27 | % | | | 0.00 | %# | |
(1) Supplemental Information on the Ratios to Average Net Assets: | |
Ratios Before Expense Limitation: | |
Expenses to Average Net Assets | | | 6.30 | % | | | 8.89 | %†† | | | 7.08 | %+†† | | | 176.40 | %††* | |
Net Investment Loss to Average Net Assets | | | (4.02 | )% | | | (6.57 | )%†† | | | (4.67 | )%+†† | | | (176.24 | )%††* | |
^ Commencement of Operations.
† Per share amount is based on average shares outstanding.
‡ Amount is less than $0.005 per share.
++ Calculated based on the net asset value as of the last business day of the period.
+ The Ratios of Expenses and Net Investment Income (Loss) reflect the rebate of certain Portfolio expenses in connection with the investments in Morgan Stanley affiliates during the period. The effect of the rebate on the ratios is disclosed in the above table as "Ratio of Rebate from Morgan Stanley Affiliates to Average Net Assets."
†† Reflects overall Portfolio ratios for investment income and non-class specific expenses.
§ Amount is less than 0.005%.
# Not Annualized.
* Annualized.
The accompanying notes are an integral part of the financial statements.
10
Morgan Stanley Institutional Fund, Inc.
Annual Report — December 31, 2013
Financial Highlights
International Advantage Portfolio
| | | Class A@ | |
| | | Year Ended December 31, | | Period from
December 28, 2010^ to | |
Selected Per Share Data and Ratios | | 2013 | | 2012 | | 2011 | | December 31, 2010 | |
Net Asset Value, Beginning of Period | | $ | 11.60 | | | $ | 9.65 | | | $ | 9.99 | | | $ | 10.00 | | |
Income (Loss) from Investment Operations: | |
Net Investment Income (Loss)† | | | 0.04 | | | | 0.09 | | | | 0.09 | | | | (0.00 | )‡ | |
Net Realized and Unrealized Gain (Loss) | | | 1.38 | | | | 1.94 | | | | (0.25 | ) | | | (0.01 | ) | |
Total from Investment Operations | | | 1.42 | | | | 2.03 | | | | (0.16 | ) | | | (0.01 | ) | |
Distributions from and/or in Excess of: | |
Net Investment Income | | | (0.07 | ) | | | (0.08 | ) | | | (0.09 | ) | | | — | | |
Net Realized Gain | | | (0.57 | ) | | | — | | | | (0.09 | ) | | | — | | |
Total Distributions | | | (0.64 | ) | | | (0.08 | ) | | | (0.18 | ) | | | — | | |
Net Asset Value, End of Period | | $ | 12.38 | | | $ | 11.60 | | | $ | 9.65 | | | $ | 9.99 | | |
Total Return++ | | | 12.43 | % | | | 20.99 | % | | | (1.57 | )% | | | (0.10 | )%# | |
Ratios and Supplemental Data: | |
Net Assets, End of Period (Thousands) | | $ | 248 | | | $ | 116 | | | $ | 96 | | | $ | 100 | | |
Ratio of Expenses to Average Net Assets (1) | | | 1.55 | %+^^ | | | 1.49 | %+†† | | | 1.49 | %+†† | | | 1.50 | %††* | |
Ratio of Net Investment Income (Loss) to Average Net Assets (1) | | | 0.29 | %+ | | | 0.83 | %+†† | | | 0.92 | %+†† | | | (1.34 | )%††* | |
Ratio of Rebate from Morgan Stanley Affiliates to Average Net Assets | | | 0.00 | %§ | | | 0.01 | %†† | | | 0.01 | %†† | | | N/A | | |
Portfolio Turnover Rate | | | 49 | % | | | 40 | % | | | 27 | % | | | 0.00 | %# | |
(1) Supplemental Information on the Ratios to Average Net Assets: | |
Ratios Before Expense Limitation: | |
Expenses to Average Net Assets | | | 6.89 | % | | | 9.14 | %†† | | | 7.33 | %+†† | | | 176.65 | %††* | |
Net Investment Loss to Average Net Assets | | | (5.05 | )% | | | (6.82 | )%†† | | | (4.92 | )%+†† | | | (176.49 | )%††* | |
@ Effective September 9, 2013, Class P and Class H shares were renamed Class A shares.
^ Commencement of Operations.
† Per share amount is based on average shares outstanding.
‡ Amount is less than $0.005 per share.
++ Calculated based on the net asset value which does not reflect sales charges, if applicable, as of the last business day of the period.
+ The Ratios of Expenses and Net Investment Income (Loss) reflect the rebate of certain Portfolio expenses in connection with the investments in Morgan Stanley affiliates during the period. The effect of the rebate on the ratios is disclosed in the above table as "Ratio of Rebate from Morgan Stanley Affiliates to Average Net Assets."
^^ Effective September 16, 2013, the Adviser has agreed to limit the ratio of expenses to average net assets to the maximum ratio of 1.60% for Class A shares. Prior to September 16, 2013, the maximum ratio was 1.50% for Class A shares.
†† Reflects overall Portfolio ratios for investment income and non-class specific expenses.
§ Amount is less than 0.005%.
# Not Annualized.
* Annualized.
The accompanying notes are an integral part of the financial statements.
11
Morgan Stanley Institutional Fund, Inc.
Annual Report — December 31, 2013
Financial Highlights
International Advantage Portfolio
| | | Class L | |
| | | Year Ended December 31, | | Period from
December 28, 2010^ to | |
Selected Per Share Data and Ratios | | 2013 | | 2012 | | 2011 | | December 31, 2010 | |
Net Asset Value, Beginning of Period | | $ | 11.60 | | | $ | 9.65 | | | $ | 9.99 | | | $ | 10.00 | | |
Income (Loss) from Investment Operations: | |
Net Investment Income (Loss)† | | | 0.02 | | | | 0.04 | | | | 0.04 | | | | (0.00 | )‡ | |
Net Realized and Unrealized Gain (Loss) | | | 1.34 | | | | 1.93 | | | | (0.25 | ) | | | (0.01 | ) | |
Total from Investment Operations | | | 1.36 | | | | 1.97 | | | | (0.21 | ) | | | (0.01 | ) | |
Distributions from and/or in Excess of: | |
Net Investment Income | | | (0.03 | ) | | | (0.02 | ) | | | (0.04 | ) | | | — | | |
Net Realized Gain | | | (0.57 | ) | | | — | | | | (0.09 | ) | | | — | | |
Total Distributions | | | (0.60 | ) | | | (0.02 | ) | | | (0.13 | ) | | | — | | |
Net Asset Value, End of Period | | $ | 12.36 | | | $ | 11.60 | | | $ | 9.65 | | | $ | 9.99 | | |
Total Return++ | | | 11.88 | % | | | 20.43 | % | | | (2.09 | )% | | | (0.10 | )%# | |
Ratios and Supplemental Data: | |
Net Assets, End of Period (Thousands) | | $ | 123 | | | $ | 116 | | | $ | 97 | | | $ | 100 | | |
Ratio of Expenses to Average Net Assets (1) | | | 2.03 | %+^^ | | | 1.99 | %+†† | | | 1.99 | %+†† | | | 2.00 | %††* | |
Ratio of Net Investment Income (Loss) to Average Net Assets (1) | | | 0.18 | %+ | | | 0.33 | %+†† | | | 0.42 | %+†† | | | (1.84 | )%††* | |
Ratio of Rebate from Morgan Stanley Affiliates to Average Net Assets | | | 0.00 | %§ | | | 0.01 | %†† | | | 0.01 | %†† | | | N/A | | |
Portfolio Turnover Rate | | | 49 | % | | | 40 | % | | | 27 | % | | | 0.00 | %# | |
(1) Supplemental Information on the Ratios to Average Net Assets: | |
Ratios Before Expense Limitation: | |
Expenses to Average Net Assets | | | 7.43 | % | | | 9.64 | %†† | | | 7.83 | %+†† | | | 177.15 | %††* | |
Net Investment Loss to Average Net Assets | | | (5.22 | )% | | | (7.32 | )%†† | | | (5.42 | )%+†† | | | (176.99 | )%††* | |
^ Commencement of Operations.
† Per share amount is based on average shares outstanding.
‡ Amount is less than $0.005 per share.
++ Calculated based on the net asset value as of the last business day of the period.
+ The Ratios of Expenses and Net Investment Income (Loss) reflect the rebate of certain Portfolio expenses in connection with the investments in Morgan Stanley affiliates during the period. The effect of the rebate on the ratios is disclosed in the above table as "Ratio of Rebate from Morgan Stanley Affiliates to Average Net Assets."
^^ Effective September 16, 2013, the Adviser has agreed to limit the ratio of expenses to average net assets to the maximum ratio of 2.10% for Class L shares. Prior to September 16, 2013, the maximum ratio was 2.00% for Class L shares.
†† Reflects overall Portfolio ratios for investment income and non-class specific expenses.
§ Amount is less than 0.005%.
# Not Annualized.
* Annualized.
The accompanying notes are an integral part of the financial statements.
12
Morgan Stanley Institutional Fund, Inc.
Annual Report — December 31, 2013
Notes to Financial Statements
Morgan Stanley Institutional Fund, Inc. (the "Fund") is registered under the Investment Company Act of 1940, as amended (the "Act"), as an open-end management investment company. The Fund is comprised of twenty-seven separate, active, diversified and non-diversified portfolios (individually referred to as a "Portfolio", collectively as the "Portfolios").
The accompanying financial statements relate to the International Advantage Portfolio. The Portfolio seeks long-term capital appreciation. The Portfolio seeks to achieve the investment objective by investing primarily in established companies on an international basis, with capitalizations within the range of companies included in the MSCI All Country World Ex-United States Index. The Portfolio offers three classes of shares — Class I, Class A and Class L.
Effective September 9, 2013, Class P and Class H shares were renamed Class A shares.
A. Significant Accounting Policies: The following significant accounting policies are in conformity with U.S. generally accepted accounting principles ("GAAP"). Such policies are consistently followed by the Fund in the preparation of its financial statements. GAAP may require management to make estimates and assumptions that affect the reported amounts and disclosures in the financial statements. Actual results may differ from those estimates.
1. Security Valuation: (1) An equity portfolio security listed or traded on an exchange is valued at its latest reported sales price (or at the exchange official closing price if such exchange reports an official closing price), if there were no sales on a given day, the security is valued at the mean between the last reported bid and asked prices; (2) all other equity portfolio securities for which over-the-counter market quotations are readily available are valued at its latest reported sales price. In cases where a security is traded on more than one exchange, the security is valued on the exchange designated as the primary market; (3) Listed options are valued at the last reported sales price on the exchange on which they are listed (or at the exchange official closing price if such exchange reports an official closing price). If an official closing price or last reported sale price is unavailable, the listed option should be fair valued at the mean between its latest bid and ask prices. Unlisted options are valued by an outside pricing service approved by the Fund's Board of Directors (the "Directors") or quotes from a broker or dealer; (4) when market quotations are not readily available, including circumstances under which Morgan Stanley Investment Management Inc. (the "Adviser")
determines that the closing price, last sale price or the mean between the last reported bid and asked prices are not reflective of a security's market value, portfolio securities are valued at their fair value as determined in good faith under procedures established by and under the general supervision of the Directors. Occasionally, developments affecting the closing prices of securities and other assets may occur between the times at which valuations of such securities are determined (that is, close of the foreign market on which the securities trade) and the close of business of the New York Stock Exchange ("NYSE"). If developments occur during such periods that are expected to materially affect the value of such securities, such valuations may be adjusted to reflect the estimated fair value of such securities as of the close of the NYSE, as determined in good faith by the Directors or by the Adviser using a pricing service and/or procedures approved by the Directors; (5) quotations of foreign portfolio securities, other assets and liabilities and forward contracts stated in foreign currency are translated into U.S. dollar equivalents at the prevailing market rates prior to the close of the NYSE; (6) investments in mutual funds, including the Morgan Stanley Institutional Liquidity Funds, are valued at the net asset value as of the close of each business day; and (7) short-term debt securities with remaining maturities of 60 days or less at the time of purchase may be valued at amortized cost, unless the Adviser determines such valuation does not reflect the securities' market value, in which case these securities will be valued at their fair market value determined by the Adviser.
Under procedures approved by the Directors, the Fund's Adviser has formed a Valuation Committee. The Valuation Committee provides administration and oversight of the Fund's valuation policies and procedures, which are reviewed at least annually by the Directors. These procedures allow the Fund to utilize independent pricing services, quotations from securities and financial instrument dealers, and other market sources to determine fair value.
The Fund has procedures to determine the fair value of securities and other financial instruments for which market prices are not readily available. Under these procedures, the Valuation Committee convenes on a regular and ad hoc basis to review such securities and considers a number of factors, including valuation methodologies and significant unobservable valuation inputs, when arriving at fair value. The Valuation Committee may employ a market-based approach which may use related or comparable assets or
13
Morgan Stanley Institutional Fund, Inc.
Annual Report — December 31, 2013
Notes to Financial Statements (cont'd)
liabilities, recent transactions, market multiples, book values, and other relevant information for the investment to determine the fair value of the investment. An income-based valuation approach may also be used in which the anticipated future cash flows of the investment are discounted to calculate fair value. Discounts may also be applied due to the nature or duration of any restrictions on the disposition of the investments. Due to the inherent uncertainty of valuations of such investments, the fair values may differ significantly from the values that would have been used had an active market existed. The Valuation Committee employs various methods for calibrating these valuation approaches including a regular review of valuation methodologies, key inputs and assumptions, transactional back-testing or disposition analysis, and reviews of any related market activity.
2. Fair Value Measurement: Financial Accounting Standards Board ("FASB") Accounting Standards CodificationTM ("ASC") 820, "Fair Value Measurements and Disclosures" ("ASC 820"), defines fair value as the value that the Fund would receive to sell an investment or pay to transfer a liability in a timely transaction with an independent buyer in the principal market, or in the absence of a principal market the most advantageous market for the investment or liability. ASC 820 establishes a three-tier hierarchy to distinguish between (1) inputs that reflect the assumptions market participants would use in valuing an asset or liability developed based on market data obtained from sources independent of the reporting entity (observable inputs) and (2) inputs that reflect the reporting entity's own assumptions about the assumptions market participants would use in valuing an asset or liability developed based on the best information available in the circumstances (unobservable inputs) and to establish classification of fair value measurements for disclosure purposes. Various inputs are used in determining the value of the Fund's investments. The inputs are summarized in the three broad levels listed below.
• Level 1 – unadjusted quoted prices in active markets for identical investments
• Level 2 – other significant observable inputs (including quoted prices for similar investments, interest rates, prepayment speeds, credit risk, etc.)
• Level 3 – significant unobservable inputs including the Fund's own assumptions in determining the fair value of investments. Factors considered in making this determination may include, but are not limited to, information
obtained by contacting the issuer, analysts, or the appropriate stock exchange (for exchange-traded securities), analysis of the issuer's financial statements or other available documents and, if necessary, available information concerning other securities in similar circumstances
The inputs or methodology used for valuing securities are not necessarily an indication of the risk associated with investing in those securities and the determination of the significance of a particular input to the fair value measurement in its entirety requires judgment and considers factors specific to each security.
The following is a summary of the inputs used to value the Portfolio's investments as of December 31, 2013.
Investment Type | | Level 1
Unadjusted
quoted
prices
(000) | | Level 2
Other
significant
observable
inputs
(000) | | Level 3
Significant
unobservable
inputs
(000) | | Total
(000) | |
Assets: | |
Common Stocks | |
Beverages | | $ | 312 | | | $ | — | | | $ | — | | | $ | 312 | | |
Capital Markets | | | 67 | | | | — | | | | — | | | | 67 | | |
Commercial Services &
Supplies | | | 41 | | | | — | | | | — | | | | 41 | | |
Diversified Consumer
Services | | | 164 | | | | — | | | | — | | | | 164 | | |
Diversified
Telecommunication
Services | | | 42 | | | | — | | | | — | | | | 42 | | |
Electric Utilities | | | 82 | | | | — | | | | — | | | | 82 | | |
Food & Staples Retailing | | | 83 | | | | — | | | | — | | | | 83 | | |
Food Products | | | 306 | | | | — | | | | — | | | | 306 | | |
Hotels, Restaurants &
Leisure | | | 121 | | | | — | | | | — | | | | 121 | | |
Household Products | | | 96 | | | | — | | | | — | | | | 96 | | |
Information Technology
Services | | | 232 | | | | — | | | | — | | | | 232 | | |
Internet Software &
Services | | | 73 | | | | — | | | | — | | | | 73 | | |
Marine | | | 101 | | | | — | | | | — | | | | 101 | | |
Media | | | 82 | | | | — | | | | — | | | | 82 | | |
Professional Services | | | 104 | | | | — | | | | — | | | | 104 | | |
Real Estate Management &
Development | | | 83 | | | | — | | | | — | | | | 83 | | |
Road & Rail | | | 214 | | | | — | | | | — | | | | 214 | | |
Textiles, Apparel & Luxury
Goods | | | 432 | | | | — | | | | — | | | | 432 | | |
Tobacco | | | 87 | | | | — | | | | — | | | | 87 | | |
Total Common Stocks | | | 2,722 | | | | — | | | | — | | | | 2,722 | | |
Participation Notes | | | — | | | | 152 | | | | — | | | | 152 | | |
Call Options Purchased | | | — | | | | 2 | | | | — | | | | 2 | | |
Short-Term Investment | |
Investment Company | | | 59 | | | | — | | | | — | | | | 59 | | |
Total Assets | | $ | 2,781 | | | $ | 154 | | | $ | — | | | $ | 2,935 | | |
14
Morgan Stanley Institutional Fund, Inc.
Annual Report — December 31, 2013
Notes to Financial Statements (cont'd)
Transfers between investment levels may occur as the markets fluctuate and/or the availability of data used in an investment's valuation changes. The Portfolio recognizes transfers between the levels as of the end of the period. As of December 31, 2013, securities with a total value of approximately $1,598,000 transferred from Level 2 to Level 1. At December 31, 2012, the fair value of certain securities were adjusted due to developments which occurred between the time of the close of the foreign markets on which they trade and the close of business on the NYSE which resulted in their Level 2 classification.
3. Foreign Currency Translation and Foreign Investments: The books and records of the Portfolio are maintained in U.S. dollars. Foreign currency amounts are translated into U.S. dollars as follows:
– investments, other assets and liabilities at the prevailing rate of exchange on the valuation date;
– investment transactions and investment income at the prevailing rates of exchange on the dates of such transactions.
Although the net assets of the Portfolio are presented at the foreign exchange rates and market values at the close of the period, the Portfolio does not isolate that portion of the results of operations arising as a result of changes in the foreign exchange rates from the fluctuations arising from changes in the market prices of securities held at period end. Similarly, the Portfolio does not isolate the effect of changes in foreign exchange rates from the fluctuations arising from changes in the market prices of securities sold during the period. Accordingly, realized and unrealized foreign currency gains (losses) on investments in securities are included in the reported net realized and unrealized gains (losses) on investment transactions and balances. However, pursuant to U.S. Federal income tax regulations, gains and losses from certain foreign currency transactions and the foreign currency portion of gains and losses realized on sales and maturities of foreign denominated debt securities are treated as ordinary income for U.S. Federal income tax purposes.
Net realized gains (losses) on foreign currency transactions represent net foreign exchange gains (losses) from foreign currency forward exchange contracts, disposition of foreign currencies, currency gains (losses) realized between the trade and settlement dates on securities transactions, and the difference between the
amount of investment income and foreign withholding taxes recorded on the Portfolio's books and the U.S. dollar equivalent amounts actually received or paid. Net unrealized currency gains (losses) from valuing foreign currency denominated assets and liabilities at period end exchange rates are reflected as a component of unrealized appreciation (depreciation) on the Statement of Assets and Liabilities. The change in unrealized currency gains (losses) on foreign currency translations for the period is reflected in the Statement of Operations.
Foreign security and currency transactions may involve certain considerations and risks not typically associated with those of U.S. dollar denominated transactions as a result of, among other factors, fluctuations of exchange rates in relation to the U.S. dollar, the possibility of lower levels of governmental supervision and regulation of foreign securities markets and the possibility of political or economic instability.
Governmental approval for foreign investments may be required in advance of making an investment under certain circumstances in some countries, and the extent of foreign investments in domestic companies may be subject to limitation in other countries. Foreign ownership limitations also may be imposed by the charters of individual companies to prevent, among other concerns, violations of foreign investment limitations. As a result, an additional class of shares (identified as "Foreign" in the Portfolio of Investments) may be created and offered for investment. The "local" and "foreign shares" market values may differ. In the absence of trading of the foreign shares in such markets, the Portfolio values the foreign shares at the closing exchange price of the local shares.
Derivatives: The Portfolio may, but is not required to, use derivative instruments for a variety of purposes, including hedging, risk management, portfolio management or to earn income. Derivatives are financial instruments whose value is based, in part, on the value of an underlying asset, interest rate, index or financial instrument. Prevailing interest rates and volatility levels, among other things, also affect the value of derivative instruments. A derivative instrument often has risks similar to its underlying asset and may have additional risks, including imperfect correlation between the value of the derivative and the underlying asset, risks of default by the counterparty to certain transactions, magnification of losses incurred due to changes in the market
15
Morgan Stanley Institutional Fund, Inc.
Annual Report — December 31, 2013
Notes to Financial Statements (cont'd)
value of the securities, instruments, indices or interest rates to which they relate, and risks that the transactions may not be liquid. The use of derivatives involves risks that are different from, and possibly greater than, the risks associated with other portfolio investments. Derivatives may involve the use of highly specialized instruments that require investment techniques and risk analyses different from those associated with other portfolio investments. All of the Portfolio's holdings, including derivative instruments, are marked-to-market each day with the change in value reflected in unrealized appreciation (depreciation). Upon disposition, a realized gain or loss is recognized.
Certain derivative transactions may give rise to a form of leverage. Leverage magnifies the potential for gain and the risk of loss. Leverage associated with derivative transactions may cause the Portfolio to liquidate portfolio positions when it may not be advantageous to do so to satisfy its obligations or to meet earmarking or segregation requirements, pursuant to applicable Securities and Exchange Commission rules and regulations, or may cause the Portfolio to be more volatile than if the Portfolio had not been leveraged. Although the Adviser seeks to use derivatives to further the Portfolio's investment objectives, there is no assurance that the use of derivatives will achieve this result.
Following is a description of the derivative instruments and techniques that the Portfolio used during the period and their associated risks:
Options: In respect to options, the Portfolio is subject to equity risk, interest rate risk and foreign currency exchange risk in the normal course of pursuing its investment objectives. If the Portfolio buys an option, it buys a legal contract giving it the right to buy or sell a specific amount of the underlying instrument or futures contract on the underlying instrument such a as security, currency or index, at an agreed upon price typically in exchange for a premium paid by the Portfolio. The Portfolio may purchase put and call options. Purchasing call options tends to increase the Portfolio's exposure to the underlying (or similar) instrument. Purchasing put options tends to decrease the Portfolio's exposure to the underlying (or similar) instrument. When entering into purchased option contracts, the Portfolio bears the risk of interest or exchange rates or securities prices moving unexpectedly, in which case, the Portfolio may not achieve
the anticipated benefits of the purchased option contracts; however the risk of loss is limited to the premium paid. Purchased options are reported as part of "Total Investments" on the Statement of Assets and Liabilities. Premium paid for purchasing options which expired are treated as realized losses. If the Portfolio sells an option, it sells to another party the right to buy from or sell to the Portfolio a specific amount of the underlying instrument or futures contract on the underlying instrument at an agreed upon price typically in exchange for a premium received by the Portfolio. There is the risk the Portfolio may not be able to enter into a closing transaction because of an illiquid market. A decision as to whether, when and how to use options involves the exercise of skill and judgment and even a well conceived option transaction may be unsuccessful because of market behavior or unexpected events. The prices of options can be highly volatile and the use of options can lower total returns.
FASB ASC 815, "Derivatives and Hedging: Overall" ("ASC 815"), is intended to improve financial reporting about derivative instruments by requiring enhanced disclosures to enable investors to better understand how and why the Portfolio uses derivative instruments, how these derivative instruments are accounted for and their effects on the Portfolio's financial position and results of operations.
The following table sets forth the fair value of the Portfolio's derivative contracts by primary risk exposure as of December 31, 2013.
| | | Asset Derivatives
Statement of Assets and
Liabilities Location | | Primary Risk
Exposure | | Value
(000) | |
Options Purchased
| | Investments, at Value
(Options Purchased) | | Currency Risk | | | $2† | | |
† Amounts are included in Investments in the Statement of Assets and Liabilities.
The following table sets forth by primary risk exposure the Portfolio's change in unrealized appreciation (depreciation) by type of derivative contract for the year ended December 31, 2013 in accordance with ASC 815.
Change in Unrealized Appreciation (Depreciation) | |
Primary Risk Exposure | | Derivative Type | | Value
(000) | |
Currency Risk
| | Investments
(Options Purchased) | | | $(1)†† | | |
†† Amounts are included in Investments in the Statement of Operations.
16
Morgan Stanley Institutional Fund, Inc.
Annual Report — December 31, 2013
Notes to Financial Statements (cont'd)
At December 31, 2013, the Portfolio's derivative assets and liabilities are as follows:
Gross Amounts of Assets and Liabilities Presented in the
Statement of Assets and Liabilities | |
Derivatives | | Assets(a)
(000) | | Liabilities(a)
(000) | |
Options Purchased | | $ | 2 | | | $ | — | | |
(a) Absent an event of default or early termination, OTC derivative assets and liabilities are presented gross and not offset in the Statement of Assets and Liabilities.
The following table presents derivative financial instruments that are subject to enforceable netting arrangements as of December 31, 2013.
Gross Amounts Not Offset in the Statement of Assets and Liabilities | |
Counterparty | | Gross Asset
Derivatives
Presented in
Statement of
Assets and Liabilities
(000) | | Financial
Instrument
(000) | | Collateral
Received
(000) | | Net Amount
(not less
than 0)
(000) | |
Royal Bank of Scotland | | $ | 2 | | | $ | — | | | $ | — | | | $ | 2 | | |
For the year ended December 31, 2013, the approximate average monthly amount outstanding for each derivative type is as follows:
Options Purchased: | |
Average monthly notional amount | | | 74,000 | | |
4. Structured Investments: The Portfolio invested a portion of its assets in structured investments. A structured investment is a derivative security designed to offer a return linked to a particular underlying security, currency, commodity or market. Structured investments may come in various forms including notes (such as exchange-traded notes), warrants and options to purchase securities. The Portfolio will typically use structured investments to gain exposure to a permitted underlying security, currency, commodity or market when direct access to a market is limited or inefficient from a tax or cost standpoint. Investments in structured investments involve risks including issuer risk, counterparty risk and market risk. Holders of structured investments bear risks of the underlying investment and are subject to issuer or counterparty risk because the Portfolio is relying on the creditworthiness of such issuer or counterparty and has no rights with respect to the underlying investment. Certain structured investments may be thinly traded or have a limited trading market and may have the effect of increasing the Portfolio's illiquidity to the extent that the Portfolio, at a particular time, may be unable to find qualified buyers for these securities.
5. Redemption Fees: The Portfolio will assess a 2% redemption fee, on Class I shares, Class A shares and Class L shares, which is paid directly to the Portfolio, for shares redeemed or exchanged within thirty days of purchase, subject to certain exceptions. The redemption fee is designed to protect the Portfolio and its remaining shareholders from the effects of short-term trading. These fees, if any, are included in the Statements of Changes in Net Assets.
6. Indemnifications: The Fund enters into contracts that contain a variety of indemnifications. The Fund's maximum exposure under these arrangements is unknown. However, the Fund has not had prior claims or losses pursuant to these contracts and expects the risk of loss to be remote.
7. Dividends and Distributions to Shareholders: Dividend income and distributions to shareholders are recorded on the ex-dividend date. Dividends from net investment income, if any, are declared and paid semiannually. Net realized capital gains, if any, are distributed at least annually.
8. Security Transactions, Income and Expenses: Security transactions are accounted for on the trade date (date the order to buy or sell is executed). Realized gains and losses on the sale of investment securities are determined on the specific identified cost method. Dividend income and other distributions are recorded on the ex-dividend date (except for certain foreign dividends which may be recorded as soon as the Portfolio is informed of such dividends) net of applicable withholding taxes. Interest income is recognized on the accrual basis except where collection is in doubt. Discounts are accreted and premiums are amortized over the life of the respective securities. Most expenses of the Fund can be directly attributed to a particular Portfolio. Expenses which cannot be directly attributed are apportioned among the Portfolios based upon relative net assets or other appropriate methods. Income, expenses (other than class specific expenses -distribution, transfer agency and sub transfer agency fees) and realized and unrealized gains or losses are allocated to each class of shares based upon their relative net assets.
B. Advisory Fees: The Adviser, a wholly-owned subsidiary of Morgan Stanley, provides the Portfolio with advisory services under the terms of an Investment Advisory Agreement,
17
Morgan Stanley Institutional Fund, Inc.
Annual Report — December 31, 2013
Notes to Financial Statements (cont'd)
paid quarterly, at the annual rate based on the average daily net assets as follows:
First $1
billion | | Over $1
billion | |
| | 0.90 | % | | | 0.85 | % | |
For the year ended December 31, 2013, the advisory fee rate (net of waivers/rebate) was equivalent to an annual effective rate of 0.00% of the Portfolio's daily net assets.
The Adviser has agreed to reduce its advisory fee and/or reimburse the Portfolio so that total annual portfolio operating expenses, excluding certain investment related expenses, taxes, interest and other extraordinary expenses (including litigation), will not exceed 1.25% for Class I shares, 1.50% for Class A shares and 2.00% for Class L shares. Effective September 16, 2013, the Adviser has agreed to limit the ratio of expenses to average net assets to the maximum ratio of 1.60% and 2.10% for Class A and Class L shares, respectively. The fee waivers and/or expense reimbursements will continue for at least one year or until such time that the Directors act to discontinue all or a portion of such waivers and/or reimbursements when it deems such action is appropriate. For the year ended December 31, 2013, approximately $26,000 of advisory fees were waived and approximately $123,000 of other expenses were reimbursed by the Adviser pursuant to this arrangement.
C. Administration Fees: The Adviser also serves as Administrator to the Fund and provides administrative services pursuant to an Administration Agreement for an annual fee, accrued daily and paid monthly, of 0.08% of the Portfolio's average daily net assets. Under a Sub-Administration Agreement between the Administrator and State Street Bank and Trust Company ("State Street"), State Street provides certain administrative services to the Fund. For such services, the Administrator pays State Street a portion of the fee the Administrator receives from the Portfolio.
D. Distribution and Shareholder Services Fees: Morgan Stanley Distribution, Inc. ("MSDI" or the "Distributor"), a wholly-owned subsidiary of the Adviser, and an indirect subsidiary of Morgan Stanley, serves as the Fund's Distributor of Portfolio shares pursuant to a Distribution Agreement. The Fund has adopted a Shareholder Services Plan with respect to Class A shares pursuant to Rule 12b-1 under the Act. Under the Shareholder Services Plan, the Portfolio pays the Distributor a shareholder services fee, accrued daily and paid monthly, at an annual rate of 0.25% of the Portfolio's average daily net assets attributable to Class A shares.
The Fund has adopted a Distribution and Shareholder Services Plan with respect to Class L shares pursuant to Rule 12b-1 under the Act. Under the Distribution and Shareholder Services Plan, the Portfolio pays the Distributor a distribution fee, accrued daily and paid monthly, at an annual rate of 0.50% and a shareholder services fee, accrued daily and paid monthly, at an annual rate of 0.25% of the Portfolio's average daily net assets attributable to Class L shares.
The distribution and shareholder services fees are used to support the expenses associated with servicing and maintaining accounts. The Distributor may compensate other parties for providing shareholder support services to investors who purchase Class A and Class L shares.
E. Dividend Disbursing and Transfer Agent: The Fund's dividend disbursing and transfer agent was Morgan Stanley Services Company Inc. ("Morgan Stanley Services"). Pursuant to a Transfer Agency Agreement, the Fund paid Morgan Stanley Services a fee based on the number of classes, accounts and transactions relating to the Portfolios of the Fund. Effective July 1, 2013, the Directors approved changing the transfer agent to Boston Financial Data Services, Inc.
F. Custodian Fees: State Street (the "Custodian") serves as Custodian for the Fund in accordance with a Custodian Agreement. The Custodian holds cash, securities, and other assets of the Fund as required by the Act. Custody fees are payable monthly based on assets held in custody, investment purchases and sales activity and account maintenance fees, plus reimbursement for certain out-of-pocket expenses.
G. Security Transactions and Transactions with Affiliates: For the year ended December 31, 2013, purchases and sales of investment securities for the Portfolio, other than long-term U.S. Government securities and short-term investments, were approximately $1,459,000 and $1,387,000, respectively. There were no purchases and sales of long-term U.S. Government securities for the year ended December 31, 2013.
The Portfolio invests in the Institutional Class of the Morgan Stanley Institutional Liquidity Funds — Money Market Portfolio (the "Liquidity Funds"), an open-end management investment company managed by the Adviser. Advisory fees paid by the Portfolio are reduced by an amount equal to its pro-rata share of the advisory and administration fees paid by the Portfolio due to its investment in the Liquidity Funds. For the year ended December 31, 2013, advisory fees paid were reduced by less than $500 relating to the Portfolio's investment in the Liquidity Funds.
18
Morgan Stanley Institutional Fund, Inc.
Annual Report — December 31, 2013
Notes to Financial Statements (cont'd)
A summary of the Portfolio's transactions in shares of the Liquidity Funds during the year ended December 31, 2013 is as follows:
Value
December 31,
2012
(000) | | Purchases
at Cost
(000) | | Sales
(000) | | Dividend
Income
(000) | | Value
December 31,
2013
(000) | |
| $ | 106 | | | $ | 1,162 | | | $ | 1,209 | | | $ | — | @ | | $ | 59 | | |
@ Amount is less than $500.
H. Federal Income Taxes: It is the Portfolio's intention to continue to qualify as a regulated investment company and distribute all of its taxable and tax-exempt income. Accordingly, no provision for Federal income taxes is required in the financial statements.
The Portfolio may be subject to taxes imposed by countries in which it invests. Such taxes are generally based on income and/or capital gains earned or repatriated. Taxes are accrued based on net investment income, net realized gains and net unrealized appreciation as such income and/or gains are earned. Taxes may also be based on transactions in foreign currency and are accrued based on the value of investments denominated in such currency.
FASB ASC 740-10, Income Taxes — Overall, sets forth a minimum threshold for financial statement recognition of the benefit of a tax position taken or expected to be taken in a tax return. Management has concluded there are no significant uncertain tax positions that would require recognition in the financial statements. If applicable, the Portfolio recognizes interest accrued related to unrecognized tax benefits in "Interest Expense" and penalties in "Other Expenses" in the Statement of Operations. The Portfolio files tax returns with the U.S. Internal Revenue Service, New York and various states. Each of the tax years in the four-year period ended December 31, 2013, remains subject to examination by taxing authorities.
The tax character of distributions paid may differ from the character of distributions shown in the Statements of Changes in Net Assets due to short-term capital gains being treated as ordinary income for tax purposes. The tax character of distributions paid during fiscal years 2013 and 2012 was as follows:
2013
Distributions
Paid From: | | 2012
Distributions
Paid From: | |
Ordinary
Income
(000) | | Long-Term
Capital Gain
(000) | | Ordinary
Income
(000) | | Long-Term
Capital Gain
(000) | |
| $ | 38 | | | | 123 | | | $ | 20 | | | | — | | |
The amount and character of income and gains to be distributed are determined in accordance with income tax regulations which may differ from GAAP. These book/tax differences are either considered temporary or permanent in nature.
Temporary differences are attributable to differing book and tax treatments for the timing of the recognition of gains (losses) on certain investment transactions and the timing of the deductibility of certain expenses.
Permanent differences, primarily due to differing treatments of gains (losses) related to foreign currency transactions and basis adjustments on partnerships sold, resulted in the following reclassifications among the components of net assets at December 31, 2013:
Accumulated
Undistributed
Net Investment
Income
(000) | | Accumulated
Net Realized
Gain
(000) | | Paid-in-
Capital
(000) | |
| $ | (1 | ) | | $ | 1 | | | | — | | |
At December 31, 2013, the components of distributable earnings for the Portfolio on a tax basis were as follows:
Undistributed
Ordinary
Income
(000) | | Undistributed
Long-Term
Capital Gain
(000) | |
| $ | 18 | | | $ | 73 | | |
At December 31, 2013, the aggregate cost for Federal income tax purposes is approximately $2,478,000. The aggregate gross unrealized appreciation is approximately $550,000 and the aggregate gross unrealized depreciation is approximately $93,000 resulting in net unrealized appreciation of approximately $457,000.
I. Results of Special Shareholder Meeting (unaudited): On June 5, 2013, a Joint Special Shareholder Meeting was held for Class H shareholders of the Portfolio to approve the Articles of Amendment to the Fund's Articles of Amendment and Restatement and a Plan of Reclassification for the Portfolio pursuant to which Class H shares would be reclassified as Class P shares. The results with respect to this proposal were as follows:
| For | | Against | | Abstain | |
| | 10,000 | | | | 0 | | | | 0 | | |
J. Accounting Pronouncement: In June 2013, FASB issued Accounting Standards Update 2013-08 Financial Services — Investment Companies (Topic 946) — Amendments to the Scope, Measurement, and Disclosure Requirements ("ASU 2013-08") which is effective for interim
19
Morgan Stanley Institutional Fund, Inc.
Annual Report — December 31, 2013
Notes to Financial Statements (cont'd)
and annual reporting periods in fiscal years that begin after December 15, 2013. ASU 2013-08 sets forth a methodology for determining whether an entity should be characterized as an investment company and prescribes fair value accounting for an investment company's non-controlling ownership interest in another investment company. FASB has determined that a fund registered under the Investment Company Act of 1940 automatically meets ASU 2013-08's criteria for an investment company. Although still evaluating the potential impacts of ASU 2013-08 to the Portfolio, management expects that the impact of the Portfolio's adoption will be limited to additional financial statement disclosures.
20
Morgan Stanley Institutional Fund, Inc.
Annual Report — December 31, 2013
Report of Independent Registered Public Accounting Firm
To the Shareholders and Board of Directors of
Morgan Stanley Institutional Fund, Inc. —
International Advantage Portfolio
We have audited the accompanying statement of assets and liabilities, including the portfolio of investments, of International Advantage Portfolio (one of the portfolios constituting Morgan Stanley Institutional Fund, Inc.) (the "Portfolio") as of December 31, 2013, and the related statement of operations for the year then ended, the statements of changes in net assets for each of the two years in the period then ended, and the financial highlights for each of the periods indicated therein. These financial statements and financial highlights are the responsibility of the Portfolio's management. Our responsibility is to express an opinion on these financial statements and financial highlights based on our audits.
We conducted our audits in accordance with the standards of the Public Company Accounting Oversight Board (United States). Those standards require that we plan and perform the audit to obtain reasonable assurance about whether the financial statements and financial highlights are free of material misstatement. We were not engaged to perform an audit of the Portfolio's internal control over financial reporting. Our audits included consideration of internal control over financial reporting as a basis for designing audit procedures that are appropriate in the circumstances, but not for the purpose of expressing an opinion on the effectiveness of the Portfolio's internal control over financial reporting. Accordingly, we express no such opinion. An audit also includes examining, on a test basis, evidence supporting the amounts and disclosures in the financial statements and financial highlights, assessing the accounting principles used and significant estimates made by management, and evaluating the overall financial statement presentation. Our procedures included confirmation of securities owned as of December 31, 2013, by correspondence with the custodian and others. We believe that our audits provide a reasonable basis for our opinion.
In our opinion, the financial statements and financial highlights referred to above present fairly, in all material respects, the financial position of International Advantage Portfolio (one of the portfolios constituting Morgan Stanley Institutional Fund, Inc.) at December 31, 2013, the results of its operations for the year then ended, the changes in its net assets for each of the two years in the period then ended, and the financial highlights for each of the periods indicated therein, in conformity with U.S. generally accepted accounting principles.

Boston, Massachusetts
February 26, 2014
21
Morgan Stanley Institutional Fund, Inc.
Annual Report — December 31, 2013
Federal Tax Notice (unaudited)
For Federal income tax purposes, the following information is furnished with respect to the distributions paid by the Portfolio during its taxable year ended December 31, 2013.
The Portfolio designated and paid approximately $123,000 as a long-term capital gain distribution.
In January, the Portfolio provides tax information to shareholders for the preceding calendar year.
22
Morgan Stanley Institutional Fund, Inc.
Annual Report — December 31, 2013
U.S. Privacy Policy (unaudited)
AN IMPORTANT NOTICE CONCERNING OUR U.S. PRIVACY POLICY
This privacy notice describes the U.S. privacy policy of Morgan Stanley Distribution, Inc., and the Morgan Stanley family of mutual funds ("us", "our", "we").
We are required by federal law to provide you with notice of our U.S. privacy policy ("Policy"). This Policy applies to both our current and former clients unless we state otherwise and is intended for individual clients who purchase products or receive services from us for personal, family or household purposes. This Policy is not applicable to partnerships, corporations, trusts or other non-individual clients or account holders, nor is this Policy applicable to individuals who are either beneficiaries of a trust for which we serve as trustee or participants in an employee benefit plan administered or advised by us. This Policy is, however, applicable to individuals who select us to be a custodian of securities or assets in individual retirement accounts, 401(k) accounts, or accounts subject to the Uniform Gifts to Minors Act.
This notice sets out our business practices to protect your privacy; how we collect and share personal information about you; and how you can limit our sharing or certain uses by others of this information. We may amend this Policy at any time, and will inform you of any changes to our Policy as required by law.
WE RESPECT YOUR PRIVACY
We appreciate that you have provided us with your personal financial information and understand your concerns about your information. We strive to safeguard the information our clients entrust to us. Protecting the confidentiality and security of client information is an important part of how we conduct our business.
This notice describes what personal information we collect about you, how we collect it, when we may share it with others, and how certain others may use it. It discusses the steps you may take to limit our sharing of certain information about you with our affiliated companies, including, but not limited to our affiliated banking businesses, brokerage firms and credit service affiliates. It also discloses how you may limit our affiliates' use of shared information for marketing purposes.
Throughout this Policy, we refer to the nonpublic information that personally identifies you as "personal information." We also use the term "affiliated company" in this notice. An affiliated company is a company in our family of companies and includes companies with the Morgan Stanley name. These affiliated companies are financial institutions such as broker-dealers, banks, investment advisers and credit card issuers. We refer to any company that is not an affiliated company as a nonaffiliated third party. For purposes of Section 5 of this notice, and your ability to limit certain uses of personal information by our affiliates, this notice applies to the use of personal information by our affiliated companies.
1. WHAT PERSONAL INFORMATION DO WE COLLECT FROM YOU?
We may collect the following types of information about you: (i) information provided by you, including information from applications and other forms we receive from you, (ii) information about your transactions with us or our affiliates, (iii) information about your transactions with nonaffiliated third parties, (iv) information from consumer reporting agencies, (v) information obtained from our websites, and (vi) information obtained from other sources. For example:
• We collect information such as your name, address, e-mail address, telephone/fax numbers, assets, income and investment objectives through applications and other forms you submit to us.
• We may obtain information about account balances, your use of account(s) and the types of products and services you prefer to receive from us through your dealings and transactions with us and other sources.
• We may obtain information about your creditworthiness and credit history from consumer reporting agencies.
• We may collect background information from and through third-party vendors to verify representations you have made and to comply with various regulatory requirements.
2. WHEN DO WE DISCLOSE PERSONAL INFORMATION WE COLLECT ABOUT YOU?
We may disclose personal information we collect about you in each of the categories listed above to affiliated and nonaffiliated third parties.
23
Morgan Stanley Institutional Fund, Inc.
Annual Report — December 31, 2013
U.S. Privacy Policy (unaudited) (cont'd)
a. Information we disclose to affiliated companies.
We may disclose personal information that we collect about you to our affiliated companies to manage your account(s) effectively, to service and process your transactions, and to let you know about products and services offered by us and affiliated companies, to manage our business, and as otherwise required or permitted by law. Offers for products and services from affiliated companies are developed under conditions designed to safeguard your personal information.
b. Information we disclose to third parties.
We may disclose personal information that we collect about you to nonaffiliated third parties to provide marketing services on our behalf or to other financial institutions with whom we have joint marketing agreements. We may also disclose all of the information we collect to other nonaffiliated third parties for our everyday business purposes, such as to process transactions, maintain account(s), respond to court orders and legal investigations, report to credit bureaus, offer our own products and services, protect against fraud, for institutional risk control, to perform services on our behalf, and as otherwise required or permitted by law.
When we share personal information about you with a nonaffiliated third party, they are required to limit their use of personal information about you to the particular purpose for which it was shared and they are not allowed to share personal information about you with others except to fulfill that limited purpose or as may be permitted or required by law.
3. HOW DO WE PROTECT THE SECURITY AND CONFIDENTIALITY OF PERSONAL INFORMATION WE COLLECT ABOUT YOU?
We maintain physical, electronic and procedural security measures that comply with applicable law and regulations to help safeguard the personal information we collect about you. We have internal policies governing the proper handling of client information by employees. Third parties that provide support or marketing services on our behalf may also receive personal information about you, and we require them to adhere to appropriate security standards with respect to such information.
4. HOW CAN YOU LIMIT OUR SHARING CERTAIN PERSONAL INFORMATION ABOUT YOU WITH OUR AFFILIATED COMPANIES FOR ELIGIBILITY DETERMINATION?
By following the opt-out procedures in Section 6 below, you may limit the extent to which we share with our affiliated companies, personal information that was collected to determine your eligibility for products and services such as your credit reports and other information that you have provided to us or that we may obtain from third parties ("eligibility information"). Eligibility information does not include your identification information or personal information pertaining to our transactions or experiences with you. Please note that, even if you direct us not to share eligibility information with our affiliated companies, we may still share your personal information, including eligibility information, with our affiliated companies under circumstances that are permitted under applicable law, such as to process transactions or to service your account.
5. HOW CAN YOU LIMIT THE USE OF CERTAIN PERSONAL INFORMATION ABOUT YOU BY OUR AFFILIATED COMPANIES FOR MARKETING?
By following the opt-out instructions in Section 6 below, you may limit our affiliated companies from marketing their products or services to you based on personal information we disclose to them. This information may include, for example, your income and account history with us. Please note that, even if you choose to limit our affiliated companies from using personal information about you that we may share with them for marketing their products and services to you, our affiliated companies may use your personal information that they obtain from us to market to you in circumstances permitted by law, such as if the affiliated party has its own relationship with you.
24
Morgan Stanley Institutional Fund, Inc.
Annual Report — December 31, 2013
U.S. Privacy Policy (unaudited) (cont'd)
6. HOW CAN YOU SEND US AN OPT-OUT INSTRUCTION?
If you wish to limit our sharing of eligibility information about you with our affiliated companies, or our affiliated companies' use of personal information for marketing purposes, as described in this notice, you may do so by:
• Calling us at (800) 548-7786
Monday–Friday between 8a.m. and 5p.m. (EST)
• Writing to us at the following address:
Boston Financial Data Services, Inc.
c/o Privacy Coordinator
P.O. Box 219804
Kansas City, Missouri 64121
If you choose to write to us, your request should include: your name, address, telephone number and account number(s) to which the opt-out applies and whether you are opting out with respect to sharing of eligibility information (Section 4 above), or information used for marketing (Section 5 above), or both. Written opt-out requests should not be sent with any other correspondence. In order to process your request, we require that the request be provided by you directly and not through a third party. Once you have informed us about your privacy preferences, your opt-out preference will remain in effect with respect to this Policy (as it may be amended) until you notify us otherwise. If you are a joint account owner, we will accept instructions from any one of you and apply those instructions to the entire account.
Please understand that if you limit our sharing or our affiliated companies' use of personal information, you and any joint account holder(s) may not receive information about our affiliated companies' products and services, including products or services that could help you manage your financial resources and achieve your investment objectives.
If you have more than one account or relationship with us, please specify the accounts to which you would like us to apply your privacy choices. If you have accounts or relationships with our affiliates, you may receive multiple privacy policies from them, and will need to separately notify those companies of your privacy choices for those accounts or relationships.
7. WHAT IF AN AFFILIATED COMPANY BECOMES A NONAFFILIATED THIRD PARTY?
If, at any time in the future, an affiliated company becomes a nonaffiliated third party, further disclosures of personal information made to the former affiliated company will be limited to those described in Section 2(b) above relating to nonaffiliated third parties. If you elected under Section 6 to limit disclosures we make to affiliated companies, or use of personal information by affiliated companies, your election will not apply to use by any former affiliated company of your personal information in their possession once it becomes a nonaffiliated third party.
SPECIAL NOTICE TO RESIDENTS OF VERMONT
The following section supplements our Policy with respect to our individual clients who have a Vermont address and supersedes anything to the contrary in the above Policy with respect to those clients only.
The State of Vermont requires financial institutions to obtain your consent prior to sharing personal information that they collect about you with nonaffiliated third parties, or eligibility information with affiliated companies, other than in certain limited circumstances. Except as permitted by law, we will not share personal information we collect about you with nonaffiliated third parties or eligibility information with affiliated companies, unless you provide us with your written consent to share such information.
SPECIAL NOTICE TO RESIDENTS OF CALIFORNIA
The following section supplements our Policy with respect to our individual clients who have a California address and supersedes anything to the contrary in the above Policy with respect to those clients only.
In response to a California law, if your account has a California home address, your personal information will not be disclosed to nonaffiliated third parties except as permitted by applicable California law, and we will limit sharing such personal information with our affiliates to comply with California privacy laws that apply to us.
25
Morgan Stanley Institutional Fund, Inc.
Annual Report — December 31, 2013
Director and Officer Information (unaudited)
Independent Director:
Name, Age and Address of
Independent Director | | Position(s)
Held with
Registrant | | Length of Time
Served* | | Principal Occupation(s) During Past 5 Years | | Number of
Portfolios in
Fund Complex
Overseen by
Independent
Director** | | Other Directorships
Held by Independent
Director*** | |
Frank L. Bowman (69)
c/o Kramer Levin Naftalis &
Frankel LLP
Counsel to the Independent
Directors
1177 Avenue of the Americas
New York, NY 10036 | | Director | | Since
August
2006 | | President, Strategic Decisions, LLC (consulting) (since February 2009); Director or Trustee of various Morgan Stanley Funds (since August 2006); Chairperson of the Insurance Sub-Committee of the Compliance and Insurance Committee (since February 2007); served as President and Chief Executive Officer of the Nuclear Energy Institute (policy organization) (February 2005-November 2008); retired as Admiral, U.S. Navy after serving over 38 years on active duty including 8 years as Director of the Naval Nuclear Propulsion Program in the Department of the Navy and the U.S. Department of Energy (1996-2004); served as Chief of Naval Personnel (July 1994-September 1996); and on the Joint Staff as Director of Political Military Affairs (June 1992-July 1994); knighted as Honorary Knight Commander of the Most Excellent Order of the British Empire; awarded the Officier de l'Orde National du Mérite by the French Government; elected to the National Academy of Engineering (2009). | | | 98 | | | Director of BP p.l.c.; Director of Naval and Nuclear Technologies LLP; Director of the Armed Services YMCA of the USA and the U.S. Naval Submarine League; Director of the American Shipbuilding Suppliers Association; Member of the National Security Advisory Council of the Center for U.S. Global Engagement and a member of the CNA Military Advisory Board; Chairman of the Charity J Street Cup Golf; Trustee of Fairhaven United Methodist Church. | |
Michael Bozic (73)
c/o Kramer Levin Naftalis & Frankel LLP
Counsel to the Independent Directors
1177 Avenue of the Americas New York, NY 10036 | | Director | | Since
April
1994 | | Private investor and a member of the advisory board of American Road Group LLC (retail) (since June 2000); Chairperson of the Compliance and Insurance Committee (since October 2006); Director or Trustee of various Morgan Stanley Funds (since April 1994); formerly, Chairperson of the Insurance Committee (July 2006-September 2006); Vice Chairman of Kmart Corporation (December 1998-October 2000), Chairman and Chief Executive Officer of Levitz Furniture Corporation (November 1995-November 1998) and President and Chief Executive Officer of Hills Department Stores (May 1991-July 1995); variously Chairman, Chief Executive Officer, President and Chief Operating Officer (1987-1991) of the Sears Merchandise Group of Sears, Roebuck & Co. | | | 100 | | | Trustee and member of the Hillsdale College Board of Trustees. | |
Kathleen A. Dennis (60)
c/o Kramer Levin Naftalis & Frankel LLP
Counsel to the Independent Directors
1177 Avenue of the Americas New York, NY 10036 | | Director | | Since
August
2006 | | President, Cedarwood Associates (mutual fund and investment management consulting) (since July 2006); Chairperson of the Money Market and Alternatives Sub-Committee of the Investment Committee (since October 2006) and Director or Trustee of various Morgan Stanley Funds (since August 2006); formerly, Senior Managing Director of Victory Capital Management (1993-2006). | | | 98 | | | Director of various non-profit organizations. | |
Dr. Manuel H. Johnson (65)
c/o Johnson Smick
International, Inc.
220 I Street, NE
Suite 200
Washington, D.C. 20002 | | Director | | Since
July
1991 | | Senior Partner, Johnson Smick International, Inc. (consulting firm); Chairperson of the Investment Committee (since October 2006) and Director or Trustee of various Morgan Stanley Funds (since July 1991); Co-Chairman and a founder of the Group of Seven Council (G7C) (international economic commission); formerly, Chairperson of the Audit Committee (July 1991-September 2006), Vice Chairman of the Board of Governors of the Federal Reserve System and Assistant Secretary of the U.S. Treasury. | | | 101 | | | Director of NVR, Inc. (home construction). | |
26
Morgan Stanley Institutional Fund, Inc.
Annual Report — December 31, 2013
Director and Officer Information (unaudited) (cont'd)
Independent Director: (cont'd)
Name, Age and Address of
Independent Director | | Position(s)
Held with
Registrant | | Length of Time
Served* | | Principal Occupation(s) During Past 5 Years | | Number of
Portfolios in
Fund Complex
Overseen by
Independent
Director** | | Other Directorships
Held by Independent
Director*** | |
Joseph J. Kearns (71)
c/o Kearns & Associates LLC PMB754
22631 Pacific Coast Highway
Malibu, CA 90265 | | Director | | Since
August
1994 | | President, Kearns & Associates LLC (investment consulting); Chairperson of the Audit Committee (since October 2006) and Director or Trustee of various Morgan Stanley Funds (since August 1994); formerly, Deputy Chairperson of the Audit Committee (July 2003-September 2006) and Chairperson of the Audit Committee of various Morgan Stanley Funds (since August 1994); CFO of the J. Paul Getty Trust. | | | 101 | | | Director of Electro Rent Corporation (equipment leasing) and The Ford Family Foundation. | |
Michael F. Klein (55)
c/o Kramer Levin Naftalis & Frankel LLP
Counsel to the Independent Directors
1177 Avenue of the Americas New York, NY 10036 | | Director | | Since
August
2006 | | Managing Director, Aetos Capital, LLC (since March 2000) and Co-President, Aetos Alternatives Management, LLC (since January 2004) and Co-Chief Executive Officer of Aetos Capital LLC (since August 2013); Chairperson of the Fixed Income Sub-Committee of the Investment Committee (since October 2006) and Director or Trustee of various Morgan Stanley Funds (since August 2006); formerly, Managing Director, Morgan Stanley & Co. Inc. and Morgan Stanley Dean Witter Investment Management, President, various Morgan Stanley Funds (June 1998-March 2000) and Principal, Morgan Stanley & Co. Inc. and Morgan Stanley Dean Witter Investment Management (August 1997-December 1999). | | | 98 | | | Director of certain investment funds managed or sponsored by Aetos Capital, LLC. Director of Sanitized AG and Sanitized Marketing AG (specialty chemicals). | |
Michael E. Nugent (77)
522 Fifth Avenue
New York, NY 10036 | | Chairperson
of the
Board and Director | | Chairperson of the Boards since July 2006 and Director since July 1991 | | Chairperson of the Boards of various Morgan Stanley Funds (since July 2006); Chairperson of the Closed-End Fund Committee (since June 2012) and Director or Trustee of various Morgan Stanley Funds (since July 1991); formerly, Chairperson of the Insurance Committee (until July 2006); General Partner, Triumph Capital, L.P. (private investment partnership) (1988-2013) | | | 100 | | | | None. | | |
W. Allen Reed (66)
c/o Kramer Levin Naftalis & Frankel LLP
Counsel to the Independent Directors
1177 Avenue of the Americas New York, NY 10036 | | Director | | Since
August
2006 | | Chairperson of the Equity Sub-Committee of the Investment Committee (since October 2006) and Director or Trustee of various Morgan Stanley Funds (since August 2006); formerly, President and CEO of General Motors Asset Management; Chairman and Chief Executive Officer of the GM Trust Bank and Corporate Vice President of General Motors Corporation (August 1994-December 2005). | | | 98 | | | Director of Temple-Inland Industries (packaging and forest products); Director of Legg Mason, Inc. and Director of the Auburn University Foundation. | |
Fergus Reid (81)
c/o Joe Pietryka, Inc.
85 Charles Colman Blvd. Pawling, NY 12564 | | Director | | Since
June
1992 | | Chairman, Joe Pietryka, Inc.; Chairperson of the Governance Committee and Director or Trustee of various Morgan Stanley Funds (since June 1992). | | | 101 | | | Through December 31, 2012, Trustee and Director of certain Investment companies in the JP Morgan Fund Complex. | |
27
Morgan Stanley Institutional Fund, Inc.
Annual Report — December 31, 2013
Director and Officer Information (unaudited) (cont'd)
Interested Director:
Name, Age and Address of
Interested Director | | Position(s)
Held with
Registrant | | Length of
Time Served* | | Principal Occupation(s) During Past 5 Years | | Number of
Portfolios in
Fund Complex
Overseen by
Interested
Director** | | Other Directorships
Held by Interested
Director*** | |
James F. Higgins (66)
One New York Plaza
New York, New York 10004 | | Director | | Since
June
2000 | | Director or Trustee of various Morgan Stanley Funds (since June 2000); Senior Advisor of Morgan Stanley (since August 2000). | | | 99 | | | Formerly, Director of AXA Financial, Inc. and AXA Equitable Life Insurance Company (2002-2011) and Director of AXA MONY Life Insurance Company and AXA MONY Life Insurance Company of America (2004-2011). | |
* Each Director serves an indefinite term, until his or her successor is elected.
** The Fund Complex includes (as of December 31, 2013) all open-end and closed-end funds (including all of their portfolios) advised by Morgan Stanley Investment Management Inc. (the "Adviser") and any funds that have an adviser that is an affiliated person of the Adviser (including, but not limited to, Morgan Stanley AIP GP LP).
*** This includes any directorships at public companies and registered investment companies held by the Director at any time during the past five years.
28
Morgan Stanley Institutional Fund, Inc.
Annual Report — December 31, 2013
Director and Officer Information (unaudited) (cont'd)
Executive Officers:
Name, Age and Address of Executive Officer | | Position(s) Held
with
Registrant | | Length of
Time Served* | | Principal Occupation(s) During Past 5 Years | |
John H. Gernon (50)
522 Fifth Avenue
New York, NY 10036 | | President and Principal Executive Officer—Equity, Fixed Income and AIP Funds | | Since
September
2013 | | President and Principal Executive Officer of the Equity and Fixed Income Funds and the Morgan Stanley AIP Funds (since September 2013) in the Fund Complex. Managing Director of the Adviser. | |
Stefanie V. Chang Yu (47)
522 Fifth Avenue
New York, NY 10036 | | Chief Compliance Officer | | Since
January
2014 | | Managing Director of the Adviser and various entities affiliated with the Adviser; Chief Compliance Officer of various Morgan Stanley Funds and the Adviser (since January 2014); formerly, Vice President of various Morgan Stanley Funds (December 1997-January 2014). | |
Joseph C. Benedetti (48)
522 Fifth Avenue
New York, NY 10036 | | Vice President | | Since
January
2014 | | Managing Director of the Adviser and various entities affiliated with the Adviser; Vice President of various Morgan Stanley Funds (since January 2014); formerly, Assistant Secretary of various Morgan Stanley Funds (October 2004-January 2014). | |
Francis J. Smith (48)
522 Fifth Avenue
New York, NY 10036 | | Treasurer and Principal Financial Officer | | Treasurer since July 2003 and Principal Financial Officer since September 2002 | | Executive Director of the Adviser and various entities affiliated with the Adviser; Treasurer and Principal Financial Officer of various Morgan Stanley Funds (since July 2003). | |
Mary E. Mullin (46)
522 Fifth Avenue
New York, NY 10036 | | Secretary | | Since
June
1999 | | Executive Director of the Adviser and various entities affiliated with the Adviser; Secretary of various Morgan Stanley Funds (since June 1999). | |
* Each officer serves an indefinite term, until his or her successor is elected.
29
Morgan Stanley Institutional Fund, Inc.
Annual Report — December 31, 2013
Adviser and Administrator
Morgan Stanley Investment Management Inc.
522 Fifth Avenue
New York, New York 10036
Distributor
Morgan Stanley Distribution, Inc.
522 Fifth Avenue
New York, New York 10036
Dividend Disbursing and Transfer Agent
Boston Financial Data Services, Inc.
2000 Crown Colony Drive
Quincy, Massachusetts 02169
Custodian
State Street Bank and Trust Company
One Lincoln Street
Boston, Massachusetts 02111
Legal Counsel
Dechert LLP
1095 Avenue of the Americas
New York, New York 10036
Counsel to the Independent Directors
Kramer Levin Naftalis & Frankel LLP
1177 Avenue of the Americas
New York, New York 10036
Independent Registered Public Accounting Firm
Ernst & Young LLP
200 Clarendon Street
Boston, Massachusetts 02116
Reporting to Shareholders
Each Morgan Stanley fund provides a complete schedule of portfolio holdings in its semi-annual and annual reports within 60 days of the end of the fund's second and fourth fiscal quarters by filing the schedule electronically with the Securities and Exchange Commission (SEC). The semi-annual reports are filed on Form N-CSRS and the annual reports are filed on Form N-CSR. Morgan Stanley also delivers the semi-annual and annual reports to fund shareholders and makes these reports available on its public website, www.morganstanley.com/im. Each Morgan Stanley fund also files a complete schedule of portfolio holdings with the SEC for the fund's first and third fiscal quarters on Form N-Q. Morgan Stanley does not deliver the reports for the first and third fiscal quarters to shareholders, nor are the reports posted to the Morgan Stanley public website. You may, however, obtain the Form N-Q filings (as well as the Form N-CSR and N-CSRS filings) by accessing the SEC's website, www.sec.gov. You may also review and copy them at the SEC's Public Reference Room in Washington, DC. Information on the operation of the SEC's Public Reference Room may be obtained by calling the SEC toll free at 1 (800) SEC-0330. You can also request copies of these materials, upon payment of a duplicating fee, by electronic request at the SEC's email address (publicinfo@sec.gov) or by writing the Public Reference Room of the SEC, Washington, DC 20549-0102.
Proxy Voting Policies and Procedures and Proxy Voting Record
You may obtain a copy of the Fund's Proxy Voting Policy and Procedures and information regarding how the Fund voted proxies relating to portfolio securities during the most recent twelve-month period ended June 30, without charge, upon request, by calling toll free 1 (800) 548-7786 or by visiting our website at www.morganstanley.com/im. This information is also available on the SEC's website at www.sec.gov.
This report is authorized for distribution only when preceded or accompanied by a prospectus of the Morgan Stanley Institutional Fund, Inc. which describes in detail each Investment Portfolio's investment policies, risks, fees and expenses. Please read the prospectus carefully before you invest or send money. For additional information, including information regarding the investments comprising the Portfolio, please visit our website at www.morganstanley.com/im or call toll free 1 (800) 548-7786.
30
(This Page has been left blank intentionally.)
(This Page has been left blank intentionally.)
(This Page has been left blank intentionally.)
Printed in U.S.A.
This Report has been prepared for shareholders and may be distributed to others only if preceded or accompanied by a current prospectus.
Morgan Stanley Investment Management Inc.
522 Fifth Avenue
New York, New York 10036
© 2014 Morgan Stanley. Morgan Stanley Distribution, Inc.

IFIIAANN
808920 Exp 2.28.15

Morgan Stanley Institutional Fund, Inc.
Global Insight Portfolio
Annual Report
December 31, 2013

Morgan Stanley Institutional Fund, Inc.
Annual Report — December 31, 2013
Shareholders' Letter | | | 2 | | |
Expense Example | | | 3 | | |
Investment Overview | | | 4 | | |
Portfolio of Investments | | | 6 | | |
Statement of Assets and Liabilities | | | 7 | | |
Statement of Operations | | | 8 | | |
Statements of Changes in Net Assets | | | 9 | | |
Financial Highlights | | | 10 | | |
Notes to Financial Statements | | | 13 | | |
Report of Independent Registered Public Accounting Firm | | | 19 | | |
Federal Tax Notice | | | 20 | | |
U.S. Privacy Policy | | | 21 | | |
Director and Officer Information | | | 24 | | |
This report is authorized for distribution only when preceded or accompanied by prospectuses of the Morgan Stanley Institutional Fund, Inc. To receive a prospectus and/or statement of additional information (SAI), which contains more complete information such as investment objectives, charges, expenses, policies for voting proxies, risk considerations, and describes in detail each of the Portfolio's investment policies to the prospective investor, please call toll free 1 (800) 548-7786. Please read the prospectuses carefully before you invest or send money.
Additionally, you can access portfolio information including performance, characteristics, and investment team commentary through Morgan Stanley Investment Management's website: www.morganstanley.com/im.
Market forecasts provided in this report may not necessarily come to pass. There is no guarantee that any sectors mentioned will continue to perform as discussed herein or that securities in such sectors will be held by the Portfolio in the future. There is no assurance that a Portfolio will achieve its investment objective. Portfolios are subject to market risk, which is the possibility that market values of securities owned by the Portfolio will decline and, therefore, the value of the Portfolio's shares may be less than what you paid for them. Accordingly, you can lose money investing in the Portfolio. Please see the prospectus for more complete information on investment risks.
1
Morgan Stanley Institutional Fund, Inc.
Annual Report — December 31, 2013
Shareholders' Letter (unaudited)
Dear Shareholders,
We are pleased to provide this Annual report, in which you will learn how your investment in Global Insight Portfolio (the "Portfolio") performed during the latest twelve-month period.
Morgan Stanley Investment Management is a client-centric, investor-led organization. Our global presence, intellectual capital, and breadth of products and services enable us to partner with investors to meet the evolving challenges of today's financial markets. We aim to deliver superior investment service and to empower our clients to make the informed decisions that help them reach their investment goals.
As always, we thank you for selecting Morgan Stanley Investment Management, and look forward to working with you in the months and years ahead.
Sincerely,

John H. Gernon
President and Principal Executive Officer
January 2014
2
Morgan Stanley Institutional Fund, Inc.
Annual Report — December 31, 2013
Expense Example (unaudited)
Global Insight Portfolio
As a shareholder of the Portfolio, you incur two types of costs: (1) transactional costs; and (2) ongoing costs, including advisory fees, administration fees, distribution and shareholder services fees and other Portfolio expenses. This example is intended to help you understand your ongoing costs (in dollars) of investing in the Portfolio and to compare these costs with the ongoing costs of investing in other mutual funds.
This example is based on an investment of $1,000 invested at the beginning of the six-month period ended December 31, 2013 and held for the entire six-month period.
Actual Expenses
The table below provides information about actual account values and actual expenses. You may use the information in this table, together with the amount you invested, to estimate the expenses that you paid over the period. Simply divide your account value by $1,000 (for example, an $8,600 account value divided by $1,000 = 8.6), then multiply the result by the number in the table under the heading entitled "Actual Expenses Paid During Period" to estimate the expenses you paid on your account during this period.
Hypothetical Example for Comparison Purposes
The table below provides information about hypothetical account values and hypothetical expenses based on the Portfolio's actual expense ratio and an assumed rate of return of 5% per year before expenses, which is not the Portfolio's actual return. The hypothetical account values and expenses may not be used to estimate the actual ending account balance or expenses you paid for the period. You may use this information to compare the ongoing costs of investing in the Portfolio and other funds. To do so, compare this 5% hypothetical example with the 5% hypothetical examples that appear in the shareholder reports of the other funds.
Please note that the expenses shown in the table are meant to highlight your ongoing costs only and do not reflect any transactional costs, such as sales charges (loads). Therefore, the information for each class in the table is useful in comparing ongoing costs only, and will not help you determine the relative total costs of owning different funds. In addition, if these transactional costs were included, your costs would have been higher.
| | | Beginning
Account
Value
7/1/13 | | Actual Ending
Account
Value
12/31/13 | | Hypothetical
Ending Account
Value | | Actual
Expenses
Paid
During
Period* | | Hypothetical
Expenses Paid
During Period* | | Net
Expense
Ratio
During
Period** | |
Global Insight Portfolio Class I | | $ | 1,000.00 | | | $ | 1,234.70 | | | $ | 1,018.40 | | | $ | 7.60 | | | $ | 6.87 | | | | 1.35 | % | |
Global Insight Portfolio Class A@ | | | 1,000.00 | | | | 1,232.20 | | | | 1,017.04 | | | | 9.11 | | | | 8.24 | | | | 1.62 | | |
Global Insight Portfolio Class L | | | 1,000.00 | | | | 1,228.50 | | | | 1,014.27 | | | | 12.19 | | | | 11.02 | | | | 2.17 | | |
* Expenses are calculated using each Portfolio Class' annualized net expense ratio (as disclosed), multiplied by the average account value over the period, and multiplied by 184/365 (to reflect the most recent one-half year period).
** Annualized.
@ Effective September 9, 2013, Class H shares were renamed Class A shares.
3
Morgan Stanley Institutional Fund, Inc.
Annual Report — December 31, 2013
Investment Overview (unaudited)
Global Insight Portfolio
The Global Insight Portfolio seeks long-term capital appreciation.
Performance
For the year ended December 31, 2013, the Portfolio had a total return based on net asset value and reinvestment of distributions per share of 30.89%, net of fees, for Class I shares. The Portfolio's Class I shares outperformed against its benchmark, the Morgan Stanley Capital International (MSCI) All Country World Index (the "Index"), which returned 22.80% for the same period. Please keep in mind that high double-digit returns are highly unusual and cannot be sustained.
Factors Affecting Performance
• Global equity performance in 2013 was driven by strong results in the developed world, which continued to benefit from accommodative monetary policy, along with signs of more sustainable economic progress in the U.S. and stabilization in the eurozone. By comparison, emerging market equities languished. Uncertainties about a slowdown in China's economy, the negative implications of the expected tapering of U.S. quantitative easing, and pockets of regional and country-specific political conflict were among the factors weighing on investor sentiment for the asset class.
• The Portfolio's relative outperformance was driven by the consumer staples sector, where stock selection and an overweight were both beneficial. A cookie and cracker company based in Turkey was the top contributor in the sector.
• Stock selection in the information technology sector boosted relative performance, although an underweight there slightly dampened results. A holding in a U.S. solar panel manufacturer was the most additive.
• Relative gains from stock selection in the materials sector, led by a holding in a Greek cement producer, more than offset the modestly negative impact of an overweight.
• An underweight in the health care sector was a drag on returns, although it was offset slightly by positive results from our stock selection in the sector.
• Stock selection and an underweight in the industrials sector detracted from relative
performance. Within the sector, a position in a Brazil-based logistics and freight company that serves the automotive industry hampered performance.
Management Strategies
• We seek to invest primarily in established and cyclical franchise companies located throughout the world that we believe have strong name recognition, sustainable competitive advantages, and ample growth prospects, and are trading at an attractive discount to future cash flow generation capacity or asset value. We typically favor companies with the ability to generate attractive free cash flow yields. We utilize a bottom-up stock selection process, seeking attractive investments on an individual company basis. The companies we consider have market capitalizations within the range of companies included in the MSCI All Country World Index.
• We continue to focus on assessing company prospects over a three- to five-year time horizon and on owning a portfolio of high-quality companies with diverse business drivers not tied to a particular market environment.
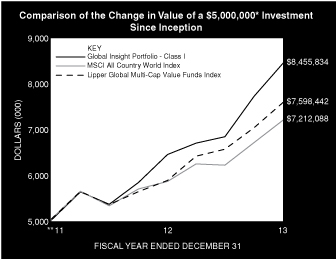
* Minimum Investment for Class I shares
** Commenced Operations on December 28, 2011.
In accordance with SEC regulations, Portfolio's performance shown assumes that all recurring fees (including management fees) were deducted and all dividends and distributions were reinvested. The performance of Class A+ and L shares will vary from Class I shares and will be negatively impacted by additional fees assessed to those classes.
4
Morgan Stanley Institutional Fund, Inc.
Annual Report — December 31, 2013
Investment Overview (unaudited) (cont'd)
Global Insight Portfolio
Performance Compared to the Morgan Stanley Capital International (MSCI) All Country World Index(1) and the Lipper Global Multi-Cap Value Funds Index(2)
| | | Period Ended December 31, 2013
Total Returns(3) | |
| | | | | Average Annual | |
| | | One
Year | | Five
Years | | Ten
Years | | Since
Inception(5) | |
Portfolio — Class I Shares
w/o sales charges(4) | | | 30.89 | % | | | — | | | | — | | | | 29.91 | % | |
MSCI All Country World Index | | | 22.80 | | | | — | | | | — | | | | 20.01 | | |
Lipper Global Multi-Cap Value Funds
Index | | | 28.90 | | | | — | | | | — | | | | 23.18 | | |
Portfolio — Class A+ Shares
w/o sales charges(4) | | | 30.52 | | | | — | | | | — | | | | 29.59 | | |
Portfolio- Class A+ Shares with
maximum 5.25% sales charges(4) | | | 23.71 | | | | — | | | | — | | | | 26.18 | | |
MSCI All Country World Index | | | 22.80 | | | | — | | | | — | | | | 20.01 | | |
Lipper Global Multi-Cap Value Funds
Index | | | 28.90 | | | | — | | | | — | | | | 23.18 | | |
Portfolio — Class L Shares
w/o sales charges(4) | | | 29.82 | | | | — | | | | — | | | | 28.90 | | |
MSCI All Country World Index | | | 22.80 | | | | — | | | | — | | | | 20.01 | | |
Lipper Global Multi-Cap Value Funds
Index | | | 28.90 | | | | — | | | | — | | | | 23.18 | | |
Performance data quoted represents past performance, which is no guarantee of future results, and current performance may be lower or higher than the figures shown. Performance assumes that all dividends and distributions, if any, were reinvested. For the most recent month-end performance figures, please visit www.morganstanley.com/im. Investment return and principal value will fluctuate so that Portfolio shares, when redeemed, may be worth more or less than their original cost. Total returns do not reflect the deduction of taxes that a shareholder would pay on Portfolio distributions or the redemption of Portfolio shares. Performance of share classes will vary due to difference in expenses.
+ Effective September 9, 2013, Class H shares were renamed Class A shares.
(1) The Morgan Stanley Capital International (MSCI) All Country World Index (ACWI) is a free float-adjusted market capitalization weighted index designed to measure the equity market performance of developed and emerging markets. The term "free float" represents the portion of shares outstanding that are deemed to be available for purchase in the public equity markets by investors. The Index is unmanaged and its returns do not include any sales charges or fees. Such costs would lower performance. It is not possible to invest directly in an index.
(2) The Lipper Global Multi-Cap Value Funds Index is an equally weighted performance index of the largest qualifying funds (based on net assets) in the Lipper Global Multi-Cap Value Funds classification. The Index, which is adjusted for capital gains distributions and income dividends, is unmanaged and should not be considered an investment. There are currently 10 funds represented in this Index. As of the date of this report, the Portfolio is in the Lipper Global Multi-Cap Value Funds classification.
(3) Total returns for the Portfolio reflect fees waived and expenses reimbursed, if applicable, by the Adviser. Without such waivers and reimbursements, total returns would have been lower. The fee waivers and/or expense reimbursements will continue for at least one year or until such time as the Fund's Board of Directors acts to discontinue all or a portion of such waivers and/or expense reimbursements when it deems that such action is appropriate.
(4) Commenced operations on December 28, 2011.
(5) For comparative purposes, average annual since inception returns listed for the Indexes refer to the inception date or initial offering of the respective share class of the Portfolio, not the inception of the Index.
Portfolio Composition
Classification | | Percentage of
Total Investments | |
Other* | | | 31.2 | % | |
Hotels, Restaurants & Leisure | | | 19.1 | | |
Metals & Mining | | | 6.6 | | |
Beverages | | | 6.1 | | |
Diversified Financial Services | | | 5.8 | | |
Chemicals | | | 5.6 | | |
Textiles, Apparel & Luxury Goods | | | 5.3 | | |
Communications Equipment | | | 5.2 | | |
Diversified Telecommunication Services | | | 5.1 | | |
Construction Materials | | | 5.0 | | |
Insurance | | | 5.0 | | |
Total Investments | | | 100.0 | % | |
* Industries and/or investment types representing less than 5% of total investments.
5
Morgan Stanley Institutional Fund, Inc.
Annual Report — December 31, 2013
Portfolio of Investments
Global Insight Portfolio
| | | Shares | | Value
(000) | |
Common Stocks (93.6%) | |
Australia (3.5%) | |
DuluxGroup Ltd. | | | 11,799 | | | $ | 56 | | |
Brazil (6.3%) | |
Cremer SA | | | 4,284 | | | | 28 | | |
JHSF Participacoes SA | | | 20,009 | | | | 36 | | |
Tegma Gestao Logistica | | | 1,631 | | | | 13 | | |
Vale SA (Preference) | | | 1,674 | | | | 23 | | |
| | | | 100 | | |
Canada (5.6%) | |
Big Rock Brewery, Inc. | | | 1,108 | | | | 18 | | |
Second Cup Ltd. (The) | | | 9,262 | | | | 43 | | |
Whistler Blackcomb Holdings, Inc. | | | 1,763 | | | | 28 | | |
| | | | 89 | | |
France (14.4%) | |
Christian Dior SA | | | 441 | | | | 83 | | |
Eurazeo SA | | | 1,151 | | | | 90 | | |
Societe BIC SA | | | 251 | | | | 31 | | |
Vivendi SA | | | 1,025 | | | | 27 | | |
| | | | 231 | | |
Germany (3.6%) | |
ThyssenKrupp AG (a) | | | 2,355 | | | | 57 | | |
Greece (4.9%) | |
Titan Cement Co., SA (a) | | | 2,201 | | | | 60 | | |
Titan Cement Co., SA (Preference) (a) | | | 1,462 | | | | 18 | | |
| | | | 78 | | |
Hong Kong (2.9%) | |
Shangri-La Asia Ltd. | | | 24,000 | | | | 47 | | |
Ireland (1.4%) | |
Mincon Group PLC (a) | | | 17,505 | | | | 23 | | |
Italy (5.4%) | |
Autogrill SpA (a) | | | 2,925 | | | | 25 | | |
Tamburi Investment Partners SpA | | | 19,400 | | | | 61 | | |
| | | | 86 | | |
Netherlands (8.6%) | |
Delta Lloyd N.V. | | | 1,866 | | | | 46 | | |
Koninklijke KPN N.V. (a) | | | 15,957 | | | | 52 | | |
Koninklijke Philips N.V. | | | 1,097 | | | | 40 | | |
| | | | 138 | | |
Portugal (0.4%) | |
CTT-Correios de Portugal SA (a) | | | 862 | | | | 7 | | |
Romania (0.8%) | |
Societatea Nationala de Gaze Naturale
ROMGAZ SA GDR (a)(b) | | | 1,165 | | | | 12 | | |
Singapore (5.5%) | |
Mandarin Oriental International Ltd. | | | 53,000 | | | | 88 | | |
Spain (1.5%) | |
Baron de Ley (a) | | | 303 | | | | 25 | | |
Sweden (1.9%) | |
Byggmax Group AB | | | 3,996 | | | | 30 | | |
| | | Shares | | Value
(000) | |
Switzerland (2.1%) | |
Nestle SA (Registered) | | | 457 | | | $ | 33 | | |
Turkey (1.0%) | |
Is Gayrimenkul Yatirim Ortakligi AS REIT | | | 24,099 | | | | 16 | | |
United States (23.8%) | |
BJ's Restaurants, Inc. (a) | | | 1,028 | | | | 32 | | |
Crimson Wine Group Ltd. (a) | | | 3,340 | | | | 30 | | |
Essent Group Ltd. (a) | | | 1,961 | | | | 47 | | |
Ignite Restaurant Group, Inc. (a) | | | 2,602 | | | | 33 | | |
Mosaic Co. (The) | | | 657 | | | | 31 | | |
Motorola Solutions, Inc. | | | 1,197 | | | | 81 | | |
News Corp., Class A (a) | | | 1,745 | | | | 31 | | |
Progressive Corp. (The) | | | 1,145 | | | | 31 | | |
Roundy's, Inc. | | | 6,610 | | | | 65 | | |
| | | | 381 | | |
Total Common Stocks (Cost $1,201) | | | 1,497 | | |
Participation Note (1.3%) | |
China (1.3%) | |
Kweichow Moutai Co., Ltd., Class A,
Equity Linked Notes, expires 3/4/21 (Cost $28) | | | 1,000 | | | | 21 | | |
| | | Face
Amount
(000) | | | |
Corporate Bond (1.5%) | |
United States (1.5%) | |
| Molycorp, Inc. 5.50%, 2/1/18 (Cost $24) | | $ | 24 | | | | 23 | | |
| | | Shares | | | |
Short-Term Investment (0.7%) | |
Investment Company (0.7%) | |
Morgan Stanley Institutional Liquidity
Funds — Money Market Portfolio —
Institutional Class (See Note G) (Cost $11) | | | 11,431 | | | | 11 | | |
Total Investments (97.1%) (Cost $1,264) | | | 1,552 | | |
Other Assets in Excess of Liabilities (2.9%) | | | 47 | | |
Net Assets (100.0%) | | $ | 1,599 | | |
(a) Non-income producing security.
(b) 144A security — Certain conditions for public sale may exist. Unless otherwise noted, these securities are deemed to be liquid.
GDR Global Depositary Receipt.
REIT Real Estate Investment Trust.
The accompanying notes are an integral part of the financial statements.
6
Morgan Stanley Institutional Fund, Inc.
Annual Report — December 31, 2013
Statement of Assets and Liabilities | | December 31, 2013
(000) | |
Assets: | |
Investments in Securities of Unaffiliated Issuers, at Value (Cost $1,253) | | $ | 1,541 | | |
Investment in Security of Affiliated Issuer, at Value (Cost $11) | | | 11 | | |
Total Investments in Securities, at Value (Cost $1,264) | | | 1,552 | | |
Foreign Currency, at Value (Cost $—@) | | | — | @ | |
Due from Adviser | | | 51 | | |
Interest Receivable | | | 1 | | |
Dividends Receivable | | | 1 | | |
Tax Reclaim Receivable | | | 1 | | |
Receivable from Affiliate | | | — | @ | |
Other Assets | | | 10 | | |
Total Assets | | | 1,616 | | |
Liabilities: | |
Payable for Professional Fees | | | 7 | | |
Payable for Custodian Fees | | | 6 | | |
Payable for Transfer Agent Fees | | | 1 | | |
Payable for Transfer Agent Fees — Class I | | | — | @ | |
Payable for Transfer Agent Fees — Class L | | | — | @ | |
Payable for Administration Fees | | | — | @ | |
Payable for Shareholder Services Fees — Class A* | | | — | @ | |
Payable for Distribution and Shareholder Services Fees — Class L | | | — | @ | |
Other Liabilities | | | 3 | | |
Total Liabilities | | | 17 | | |
Net Assets | | $ | 1,599 | | |
Net Assets Consist Of: | |
Paid-in-Capital | | $ | 1,283 | | |
Distributions in Excess of Net Investment Income | | | (36 | ) | |
Accumulated Net Realized Gain | | | 64 | | |
Unrealized Appreciation (Depreciation) on: | |
Investments | | | 288 | | |
Foreign Currency Translations | | | — | @ | |
Net Assets | | $ | 1,599 | | |
CLASS I: | |
Net Assets | | $ | 1,397 | | |
| Shares Outstanding $0.001 par value shares of beneficial interest (500,000,000 shares authorized) (not in 000's) | | | 104,130 | | |
Net Asset Value, Offering and Redemption Price Per Share | | $ | 13.42 | | |
CLASS A*: | |
Net Assets | | $ | 189 | | |
| Shares Outstanding $0.001 par value shares of beneficial interest (500,000,000 shares authorized) (not in 000's) | | | 14,015 | | |
Net Asset Value, Redemption Price Per Share | | $ | 13.45 | | |
Maximum Sales Load | | | 5.25 | % | |
Maximum Sales Charge | | $ | 0.75 | | |
Maximum Offering Price Per Share | | $ | 14.20 | | |
CLASS L: | |
Net Assets | | $ | 13 | | |
| Shares Outstanding $0.001 par value shares of beneficial interest (500,000,000 shares authorized) (not in 000's) | | | 1,000 | | |
Net Asset Value, Offering and Redemption Price Per Share | | $ | 13.39 | | |
@ Amount is less than $500.
* Effective September 9, 2013, Class H shares were renamed Class A shares.
The accompanying notes are an integral part of the financial statements.
7
Morgan Stanley Institutional Fund, Inc.
Annual Report — December 31, 2013
Statement of Operations | | Year Ended
December 31, 2013
(000) | |
Investment Income: | |
Dividends from Securities of Unaffiliated Issuers (Net of $5 of Foreign Taxes Withheld) | | $ | 41 | | |
Interest from Securities of Unaffiliated Issuers | | | 2 | | |
Dividends from Security of Affiliated Issuer (Note G) | | | — | @ | |
Total Investment Income | | | 43 | | |
Expenses: | |
Professional Fees | | | 85 | | |
Registration Fees | | | 31 | | |
Custodian Fees (Note F) | | | 21 | | |
Advisory Fees (Note B) | | | 14 | | |
Shareholder Reporting Fees | | | 11 | | |
Transfer Agency Fees (Note E) | | | 7 | | |
Transfer Agency Fees — Class I (Note E) | | | — | @ | |
Transfer Agency Fees — Class A* (Note E) | | | — | @ | |
Transfer Agency Fees — Class L (Note E) | | | — | @ | |
Pricing Fees | | | 6 | | |
Administration Fees (Note C) | | | 1 | | |
Directors' Fees and Expenses | | | 1 | | |
Shareholder Services Fees — Class A* (Note D) | | | 1 | | |
Distribution and Shareholder Services Fees — Class L (Note D) | | | — | @ | |
Other Expenses | | | 16 | | |
Total Expenses | | | 194 | | |
Expenses Reimbursed by Adviser (Note B) | | | (160 | ) | |
Waiver of Advisory Fees (Note B) | | | (14 | ) | |
Reimbursement of Class Specific Expenses — Class I (Note B) | | | (— | @) | |
Reimbursement of Class Specific Expenses — Class L (Note B) | | | (— | @) | |
Rebate from Morgan Stanley Affiliate (Note G) | | | (— | @) | |
Net Expenses | | | 20 | | |
Net Investment Income | | | 23 | | |
Realized Gain (Loss): | |
Investments Sold | | | 241 | | |
Foreign Currency Transactions | | | (1 | ) | |
Net Realized Gain | | | 240 | | |
Change in Unrealized Appreciation (Depreciation): | |
Investments | | | 110 | | |
Foreign Currency Translations | | | — | @ | |
Net Change in Unrealized Appreciation (Depreciation) | | | 110 | | |
Net Realized Gain and Change in Unrealized Appreciation (Depreciation) | | | 350 | | |
Net Increase in Net Assets Resulting from Operations | | $ | 373 | | |
@ Amount is less than $500.
* Effective September 9, 2013, Class H shares were renamed Class A shares.
The accompanying notes are an integral part of the financial statements.
8
Morgan Stanley Institutional Fund, Inc.
Annual Report — December 31, 2013
Statements of Changes in Net Assets | | Year Ended
December 31,
2013
(000) | | Year Ended
December 31,
2012
(000) | |
Increase (Decrease) in Net Assets: | |
Operations: | |
Net Investment Income | | $ | 23 | | | $ | 24 | | |
Net Realized Gain | | | 240 | | | | 44 | | |
Net Change in Unrealized Appreciation (Depreciation) | | | 110 | | | | 172 | | |
Net Increase in Net Assets Resulting from Operations | | | 373 | | | | 240 | | |
Distributions from and/or in Excess of: | |
Class I: | |
Net Investment Income | | | (40 | ) | | | (— | @) | |
Net Realized Gain | | | (156 | ) | | | (— | @) | |
Class A*: | |
Net Investment Income | | | (4 | ) | | | (41 | ) | |
Net Realized Gain | | | (21 | ) | | | (39 | ) | |
Class L: | |
Net Investment Income | | | (— | @) | | | (— | @) | |
Net Realized Gain | | | (2 | ) | | | (— | @) | |
Total Distributions | | | (223 | ) | | | (80 | ) | |
Capital Share Transactions:(1) | |
Class I: | |
Subscribed | | | 1,100 | | | | — | | |
Distributions Reinvested | | | 194 | | | | — | | |
Class A*: | |
Subscribed | | | 9 | | | | 100 | | |
Distributions Reinvested | | | 23 | | | | 79 | | |
Redeemed | | | (1,052 | ) | | | — | | |
Net Increase in Net Assets Resulting from Capital Share Transactions | | | 274 | | | | 179 | | |
Total Increase in Net Assets | | | 424 | | | | 339 | | |
Net Assets: | |
Beginning of Period | | | 1,175 | | | | 836 | | |
End of Period (Including Distributions in Excess of Net Investment Income of $(36) and $(14)) | | $ | 1,599 | | | $ | 1,175 | | |
(1) | | Capital Share Transactions: | | | |
Class I: | |
Shares Subscribed | | | 88 | | | | — | | |
Shares Issued on Distributions Reinvested | | | 15 | | | | — | | |
Net Increase in Class I Shares Outstanding | | | 103 | | | | — | | |
Class A*: | |
Shares Subscribed | | | 1 | | | | 8 | | |
Shares Issued on Distributions Reinvested | | | 2 | | | | 7 | | |
Shares Redeemed | | | (85 | ) | | | — | | |
Net Increase (Decrease) in Class A* Shares Outstanding | | | (82 | ) | | | 15 | | |
@ Amount is less than $500.
* Effective September 9, 2013, Class H shares were renamed Class A shares.
The accompanying notes are an integral part of the financial statements.
9
Morgan Stanley Institutional Fund, Inc.
Annual Report — December 31, 2013
Financial Highlights
Global Insight Portfolio
| | | Class I | |
| | | Year Ended December 31, | | Period from
December 28, 2011^ to | |
Selected Per Share Data and Ratios | | 2013 | | 2012 | | December 31, 2011 | |
Net Asset Value, Beginning of Period | | $ | 11.99 | | | $ | 10.07 | | | $ | 10.00 | | |
Income from Investment Operations: | |
Net Investment Income (Loss)† | | | 0.30 | | | | 0.31 | | | | (0.00 | )‡ | |
Net Realized and Unrealized Gain | | | 3.32 | | | | 2.53 | | | | 0.07 | | |
Total from Investment Operations | | | 3.62 | | | | 2.84 | | | | 0.07 | | |
Distributions from and/or in Excess of: | |
Net Investment Income | | | (0.45 | ) | | | (0.49 | ) | | | — | | |
Net Realized Gain | | | (1.74 | ) | | | (0.43 | ) | | | — | | |
Total Distributions | | | (2.19 | ) | | | (0.92 | ) | | | — | | |
Net Asset Value, End of Period | | $ | 13.42 | | | $ | 11.99 | | | $ | 10.07 | | |
Total Return++ | | | 30.89 | % | | | 28.31 | % | | | 0.70 | %# | |
Ratios and Supplemental Data: | |
Net Assets, End of Period (Thousands) | | $ | 1,397 | | | $ | 12 | | | $ | 10 | | |
Ratio of Expenses to Average Net Assets (1) | | | 1.35 | %+ | | | 1.35 | %+†† | | | 1.35 | %+††* | |
Ratio of Net Investment Income (Loss) to Average Net Assets (1) | | | 2.17 | %+ | | | 2.74 | %+†† | | | (1.27 | )%+††* | |
Ratio of Rebate from Morgan Stanley Affiliates to Average Net Assets | | | 0.00 | %§ | | | 0.00 | %§†† | | | N/A | | |
Portfolio Turnover Rate | | | 59 | % | | | 41 | % | | | 0 | %# | |
(1) Supplemental Information on the Ratios to Average Net Assets: | |
Ratios Before Expense Limitation: | |
Expenses to Average Net Assets | | | 14.22 | % | | | 16.10 | %†† | | | 381.10 | %††* | |
Net Investment Loss to Average Net Assets | | | (10.70 | )% | | | (12.01 | )%†† | | | (381.02 | )%††* | |
^ Commencement of Operations.
† Per share amount is based on average shares outstanding.
‡ Amount is less than $0.005 per share.
++ Calculated based on the net asset value as of the last business day of the period.
+ The Ratios of Expenses and Net Investment Income (Loss) reflect the rebate of certain Portfolio expenses in connection with the investments in Morgan Stanley affiliates during the period. The effect of the rebate on the ratios is disclosed in the above table as "Ratio of Rebate from Morgan Stanley Affiliates to Average Net Assets."
†† Reflects overall Portfolio ratios for investment income and non-class specific expenses.
§ Amount is less than 0.005%.
# Not Annualized.
* Annualized.
The accompanying notes are an integral part of the financial statements.
10
Morgan Stanley Institutional Fund, Inc.
Annual Report — December 31, 2013
Financial Highlights
Global Insight Portfolio
| | | Class A@ | |
| | | Year Ended December 31, | | Period from
December 28, 2011^ to | |
Selected Per Share Data and Ratios | | 2013 | | 2012 | | December 31, 2011 | |
Net Asset Value, Beginning of Period | | $ | 11.99 | | | $ | 10.07 | | | $ | 10.00 | | |
Income from Investment Operations: | |
| Net Investment Income (Loss)† 0.01 | | | 0.28 | | | | (0.00 | ) | | | ‡ | | |
Net Realized and Unrealized Gain | | | 3.56 | | | | 2.53 | | | | 0.07 | | |
Total from Investment Operations | | | 3.57 | | | | 2.81 | | | | 0.07 | | |
Distributions from and/or in Excess of: | |
Net Investment Income | | | (0.37 | ) | | | (0.46 | ) | | | — | | |
Net Realized Gain | | | (1.74 | ) | | | (0.43 | ) | | | — | | |
Total Distributions | | | (2.11 | ) | | | (0.89 | ) | | | — | | |
Net Asset Value, End of Period | | $ | 13.45 | | | $ | 11.99 | | | $ | 10.07 | | |
Total Return++ | | | 30.52 | % | | | 28.04 | % | | | 0.70 | %# | |
Ratios and Supplemental Data: | |
Net Assets, End of Period (Thousands) | | $ | 189 | | | $ | 1,151 | | | $ | 816 | | |
Ratio of Expenses to Average Net Assets (1) | | | 1.60 | %+^^ | | | 1.60 | %+†† | | | 1.60 | %+††* | |
Ratio of Net Investment Income (Loss) to Average Net Assets (1) | | | 0.07 | %+ | | | 2.49 | %+†† | | | (1.52 | )%+††* | |
Ratio of Rebate from Morgan Stanley Affiliates to Average Net Assets | | | 0.01 | % | | | 0.00 | %§†† | | | N/A | | |
Portfolio Turnover Rate | | | 59 | % | | | 41 | % | | | 0 | %# | |
(1) Supplemental Information on the Ratios to Average Net Assets: | |
Ratios Before Expense Limitation: | |
Expenses to Average Net Assets | | | 13.62 | % | | | 16.35 | %†† | | | 381.35 | %††* | |
Net Investment Loss to Average Net Assets | | | (11.95 | )% | | | (12.26 | )%†† | | | (381.27 | )%††* | |
@ Effective September 9, 2013, Class H shares were renamed Class A shares.
^ Commencement of Operations.
† Per share amount is based on average shares outstanding.
‡ Amount is less than $0.005 per share.
++ Calculated based on the net asset value which does not reflect sales charges, if applicable, as of the last business day of the period.
+ The Ratios of Expenses and Net Investment Income (Loss) reflect the rebate of certain Portfolio expenses in connection with the investments in Morgan Stanley affiliates during the period. The effect of the rebate on the ratios is disclosed in the above table as "Ratio of Rebate from Morgan Stanley Affiliates to Average Net Assets."
^^ Effective September 16, 2013, the Adviser has agreed to limit the ratio of expenses to average net assets to the maximum ratio of 1.70% for Class A shares. Prior to September 16, 2013, the maximum ratio was 1.60% for Class A shares.
†† Reflects overall Portfolio ratios for investment income and non-class specific expenses.
§ Amount is less than 0.005%.
# Not Annualized.
* Annualized.
The accompanying notes are an integral part of the financial statements.
11
Morgan Stanley Institutional Fund, Inc.
Annual Report — December 31, 2013
Financial Highlights
Global Insight Portfolio
| | | Class L | |
| | | Year Ended December 31, | | Period from
December 28, 2011^ to | |
Selected Per Share Data and Ratios | | 2013 | | 2012 | | December 31, 2011 | |
Net Asset Value, Beginning of Period | | $ | 11.98 | | | $ | 10.07 | | | $ | 10.00 | | |
Income from Investment Operations: | |
| Net Investment Income (Loss)† 0.12 | | | 0.23 | | | | (0.00 | ) | | | ‡ | | |
Net Realized and Unrealized Gain | | | 3.37 | | | | 2.51 | | | | 0.07 | | |
Total from Investment Operations | | | 3.49 | | | | 2.74 | | | | 0.07 | | |
Distributions from and/or in Excess of: | |
Net Investment Income | | | (0.34 | ) | | | (0.40 | ) | | | — | | |
Net Realized Gain | | | (1.74 | ) | | | (0.43 | ) | | | — | | |
Total Distributions | | | (2.08 | ) | | | (0.83 | ) | | | — | | |
Net Asset Value, End of Period | | $ | 13.39 | | | $ | 11.98 | | | $ | 10.07 | | |
Total Return++ | | | 29.82 | % | | | 27.36 | % | | | 0.70 | %# | |
Ratios and Supplemental Data: | |
Net Assets, End of Period (Thousands) | | $ | 13 | | | $ | 12 | | | $ | 10 | | |
Ratio of Expenses to Average Net Assets (1) | | | 2.13 | %+^^ | | | 2.10 | %+†† | | | 2.10 | %+††* | |
Ratio of Net Investment Income (Loss) to Average Net Assets (1) | | | 0.93 | %+ | | | 1.99 | %+†† | | | (2.01 | )%+††* | |
Ratio of Rebate from Morgan Stanley Affiliates to Average Net Assets | | | 0.00 | %§ | | | 0.00 | %§†† | | | N/A | | |
Portfolio Turnover Rate | | | 59 | % | | | 41 | % | | | 0 | %# | |
(1) Supplemental Information on the Ratios to Average Net Assets: | |
Ratios Before Expense Limitation: | |
Expenses to Average Net Assets | | | 17.73 | % | | | 16.85 | %†† | | | 381.85 | %††* | |
Net Investment Loss to Average Net Assets | | | (14.67 | )% | | | (12.76 | )%†† | | | (381.76 | )%††* | |
^ Commencement of Operations.
† Per share amount is based on average shares outstanding.
‡ Amount is less than $0.005 per share.
++ Calculated based on the net asset value as of the last business day of the period.
+ The Ratios of Expenses and Net Investment Income (Loss) reflect the rebate of certain Portfolio expenses in connection with the investments in Morgan Stanley affiliates during the period. The effect of the rebate on the ratios is disclosed in the above table as "Ratio of Rebate from Morgan Stanley Affiliates to Average Net Assets."
^^ Effective September 16, 2013, the Adviser has agreed to limit the ratio of expenses to average net assets to the maximum ratio of 2.20% for Class L shares. Prior to September 16, 2013, the maximum ratio was 2.10% for Class L shares.
†† Reflects overall Portfolio ratios for investment income and non-class specific expenses.
§ Amount is less than 0.005%.
# Not Annualized.
* Annualized.
The accompanying notes are an integral part of the financial statements.
12
Morgan Stanley Institutional Fund, Inc.
Annual Report — December 31, 2013
Notes to Financial Statements
Morgan Stanley Institutional Fund, Inc. (the "Fund") is registered under the Investment Company Act of 1940, as amended (the "Act"), as an open-end management investment company. The Fund is comprised of twenty-seven separate, active, diversified and non-diversified portfolios (individually referred to as a "Portfolio", collectively as the "Portfolios").
The accompanying financial statements relate to the Global Insight Portfolio. The Portfolio seeks long-term capital appreciation by investing primarily in established and cyclical franchise companies located throughout the world with market capitalizations within the range of companies included in the MSCI All Country World Index. The Portfolio offers three classes of shares — Class I, Class A and Class L.
Effective September 9, 2013, Class H shares were renamed Class A shares.
A. Significant Accounting Policies: The following significant accounting policies are in conformity with U.S. generally accepted accounting principles ("GAAP"). Such policies are consistently followed by the Fund in the preparation of its financial statements. GAAP may require management to make estimates and assumptions that affect the reported amounts and disclosures in the financial statements. Actual results may differ from those estimates.
1. Security Valuation: (1) Certain portfolio securities may be valued by an outside pricing service approved by the Fund's Board of Directors (the "Directors"). The pricing service may utilize a matrix system or other model incorporating attributes such as security quality, maturity and coupon as the evaluation model parameters, and/or research evaluations by its staff, including review of broker-dealer market price quotations in determining what it believes is the fair valuation of the portfolios securities valued by such pricing service; (2) an equity portfolio security listed or traded on an exchange is valued at its latest reported sales price (or at the exchange official closing price if such exchange reports an official closing price), if there were no sales on a given day, the security is valued at the mean between the last reported bid and asked prices; (3) all other equity portfolio securities for which over-the-counter market quotations are readily available are valued at its latest reported sales price. In cases where a security is traded on more than one exchange, the security is valued on the exchange designated as the primary market; (4) when market quotations are not readily available, including circumstances under which Morgan Stanley Investment Management Inc. (the "Adviser") determines
that the closing price, last sale price or the mean between the last reported bid and asked prices are not reflective of a security's market value, portfolio securities are valued at their fair value as determined in good faith under procedures established by and under the general supervision of the Directors. Occasionally, developments affecting the closing prices of securities and other assets may occur between the times at which valuations of such securities are determined (that is, close of the foreign market on which the securities trade) and the close of business of the New York Stock Exchange ("NYSE"). If developments occur during such periods that are expected to materially affect the value of such securities, such valuations may be adjusted to reflect the estimated fair value of such securities as of the close of the NYSE, as determined in good faith by the Directors or by the Adviser using a pricing service and/or procedures approved by the Directors; (5) quotations of foreign portfolio securities, other assets and liabilities and forward contracts stated in foreign currency are translated into U.S. dollar equivalents at the prevailing market rates prior to the close of the NYSE; (6) investments in mutual funds, including the Morgan Stanley Institutional Liquidity Funds, are valued at the net asset value as of the close of each business day; and (7) short-term debt securities with remaining maturities of 60 days or less at the time of purchase may be valued at amortized cost, unless the Adviser determines such valuation does not reflect the securities' market value, in which case these securities will be valued at their fair market value determined by the Adviser.
Under procedures approved by the Directors, the Fund's Adviser has formed a Valuation Committee. The Valuation Committee provides administration and oversight of the Fund's valuation policies and procedures, which are reviewed at least annually by the Directors. These procedures allow the Fund to utilize independent pricing services, quotations from securities and financial instrument dealers, and other market sources to determine fair value.
The Fund has procedures to determine the fair value of securities and other financial instruments for which market prices are not readily available. Under these procedures, the Valuation Committee convenes on a regular and ad hoc basis to review such securities and considers a number of factors, including valuation methodologies and significant unobservable valuation inputs, when arriving at fair value. The Valuation Committee may
13
Morgan Stanley Institutional Fund, Inc.
Annual Report — December 31, 2013
Notes to Financial Statements (cont'd)
employ a market-based approach which may use related or comparable assets or liabilities, recent transactions, market multiples, book values, and other relevant information for the investment to determine the fair value of the investment. An income-based valuation approach may also be used in which the anticipated future cash flows of the investment are discounted to calculate fair value. Discounts may also be applied due to the nature or duration of any restrictions on the disposition of the investments. Due to the inherent uncertainty of valuations of such investments, the fair values may differ significantly from the values that would have been used had an active market existed. The Valuation Committee employs various methods for calibrating these valuation approaches including a regular review of valuation methodologies, key inputs and assumptions, transactional back-testing or disposition analysis, and reviews of any related market activity.
2. Fair Value Measurement: Financial Accounting Standards Board ("FASB") Accounting Standards CodificationTM ("ASC") 820, "Fair Value Measurements and Disclosures" ("ASC 820"), defines fair value as the value that the Fund would receive to sell an investment or pay to transfer a liability in a timely transaction with an independent buyer in the principal market, or in the absence of a principal market the most advantageous market for the investment or liability. ASC 820 establishes a three-tier hierarchy to distinguish between (1) inputs that reflect the assumptions market participants would use in valuing an asset or liability developed based on market data obtained from sources independent of the reporting entity (observable inputs) and (2) inputs that reflect the reporting entity's own assumptions about the assumptions market participants would use in valuing an asset or liability developed based on the best information available in the circumstances (unobservable inputs) and to establish classification of fair value measurements for disclosure purposes. Various inputs are used in determining the value of the Fund's investments. The inputs are summarized in the three broad levels listed below.
• Level 1 – unadjusted quoted prices in active markets for identical investments
• Level 2 – other significant observable inputs (including quoted prices for similar investments, interest rates, prepayment speeds, credit risk, etc.)
• Level 3 – significant unobservable inputs including the Fund's own assumptions in determining the fair value of investments. Factors considered in making this determination may include, but are not limited to, information obtained by contacting the issuer, analysts, or the appropriate stock exchange (for exchange-traded securities), analysis of the issuer's financial statements or other available documents and, if necessary, available information concerning other securities in similar circumstances
The inputs or methodology used for valuing securities are not necessarily an indication of the risk associated with investing in those securities and the determination of the significance of a particular input to the fair value measurement in its entirety requires judgment and considers factors specific to each security.
The following is a summary of the inputs used to value the Portfolio's investments as of December 31, 2013.
Investment Type | | Level 1
Unadjusted
quoted
prices
(000) | | Level 2
Other
significant
observable
inputs
(000) | | Level 3
Significant
unobservable
inputs
(000) | | Total
(000) | |
Assets: | |
Common Stocks | |
Air Freight & Logistics | | $ | 7 | | | $ | — | | | $ | — | | | $ | 7 | | |
Beverages | | | 73 | | | | — | | | | — | | | | 73 | | |
Capital Markets | | | 61 | | | | — | | | | — | | | | 61 | | |
Chemicals | | | 87 | | | | — | | | | — | | | | 87 | | |
Commercial Services &
Supplies | | | 31 | | | | — | | | | — | | | | 31 | | |
Communications
Equipment | | | 81 | | | | — | | | | — | | | | 81 | | |
Construction Materials | | | 78 | | | | — | | | | — | | | | 78 | | |
Diversified Financial
Services | | | 90 | | | | — | | | | — | | | | 90 | | |
Diversified
Telecommunication
Services | | | 79 | | | | — | | | | — | | | | 79 | | |
Food & Staples Retailing | | | 65 | | | | — | | | | — | | | | 65 | | |
Food Products | | | 33 | | | | — | | | | — | | | | 33 | | |
Health Care Equipment &
Supplies | | | 28 | | | | — | | | | — | | | | 28 | | |
Hotels, Restaurants &
Leisure | | | 296 | | | | — | | | | — | | | | 296 | | |
Industrial Conglomerates | | | 40 | | | | — | | | | — | | | | 40 | | |
Insurance | | | 77 | | | | — | | | | — | | | | 77 | | |
Machinery | | | 23 | | | | — | | | | — | | | | 23 | | |
Media | | | 31 | | | | — | | | | — | | | | 31 | | |
Metals & Mining | | | 80 | | | | — | | | | — | | | | 80 | | |
Oil, Gas & Consumable
Fuels | | | — | | | | 12 | | | | — | | | | 12 | | |
Real Estate Investment
Trusts (REITs) | | | 16 | | | | — | | | | — | | | | 16 | | |
14
Morgan Stanley Institutional Fund, Inc.
Annual Report — December 31, 2013
Notes to Financial Statements (cont'd)
Investment Type | | Level 1
Unadjusted
quoted
prices
(000) | | Level 2
Other
significant
observable
inputs
(000) | | Level 3
Significant
unobservable
inputs
(000) | | Total
(000) | |
Common Stocks (cont'd) | |
Real Estate Management &
Development | | $ | 36 | | | $ | — | | | $ | — | | | $ | 36 | | |
Road & Rail | | | 13 | | | | — | | | | — | | | | 13 | | |
Specialty Retail | | | 30 | | | | — | | | | — | | | | 30 | | |
Textiles, Apparel & Luxury
Goods | | | 83 | | | | — | | | | — | | | | 83 | | |
Thrifts & Mortgage Finance | | | 47 | | | | — | | | | — | | | | 47 | | |
Total Common Stocks | | | 1,485 | | | | 12 | | | | — | | | | 1,497 | | |
Participation Note | | | — | | | | 21 | | | | — | | | | 21 | | |
Corporate Bond | | | — | | | | 23 | | | | — | | | | 23 | | |
Short-Term Investment —
Investment Company | | | 11 | | | | — | | | | — | | | | 11 | | |
Total Assets | | $ | 1,496 | | | $ | 56 | | | $ | — | | | $ | 1,552 | | |
Transfers between investment levels may occur as the markets fluctuate and/or the availability of data used in an investment's valuation changes. The Portfolio recognizes transfers between the levels as of the end of the period. As of December 31, 2013, securities with a total value of approximately $663,000 transferred from Level 2 to Level 1. At December 31, 2012, the fair value of certain securities were adjusted due to developments which occurred between the time of the close of the foreign markets on which they trade and the close of business on the NYSE which resulted in their Level 2 classification.
3. Foreign Currency Translation and Foreign Investments: The books and records of the Portfolio are maintained in U.S. dollars. Foreign currency amounts are translated into U.S. dollars as follows:
– investments, other assets and liabilities at the prevailing rate of exchange on the valuation date;
– investment transactions and investment income at the prevailing rates of exchange on the dates of such transactions.
Although the net assets of the Portfolio are presented at the foreign exchange rates and market values at the close of the period, the Portfolio does not isolate that portion of the results of operations arising as a result of changes in the foreign exchange rates from the fluctuations arising from changes in the market prices of securities held at period end. Similarly, the Portfolio does not isolate the effect of changes in foreign exchange rates from the fluctuations arising from changes in the market prices of securities sold during the period. Accordingly, realized and unrealized foreign currency gains (losses) on investments
in securities are included in the reported net realized and unrealized gains (losses) on investment transactions and balances. However, pursuant to U.S. Federal income tax regulations, gains and losses from certain foreign currency transactions and the foreign currency portion of gains and losses realized on sales and maturities of foreign denominated debt securities are treated as ordinary income for U.S. Federal income tax purposes.
Net realized gains (losses) on foreign currency transactions represent net foreign exchange gains (losses) from foreign currency forward exchange contracts, disposition of foreign currencies, currency gains (losses) realized between the trade and settlement dates on securities transactions, and the difference between the amount of investment income and foreign withholding taxes recorded on the Portfolio's books and the U.S. dollar equivalent amounts actually received or paid. Net unrealized currency gains (losses) from valuing foreign currency denominated assets and liabilities at period end exchange rates are reflected as a component of unrealized appreciation (depreciation) on the Statement of Assets and Liabilities. The change in unrealized currency gains (losses) on foreign currency translations for the period is reflected in the Statement of Operations.
Foreign security and currency transactions may involve certain considerations and risks not typically associated with those of U.S. dollar denominated transactions as a result of, among other factors, fluctuations of exchange rates in relation to the U.S. dollar, the possibility of lower levels of governmental supervision and regulation of foreign securities markets and the possibility of political or economic instability.
The net assets of the Portfolio include foreign denominated securities and currency. Changes in currency exchange rates will affect the U.S. Dollar value of and investment income from such securities.
Governmental approval for foreign investments may be required in advance of making an investment under certain circumstances in some countries, and the extent of foreign investments in domestic companies may be subject to limitation in other countries. Foreign ownership limitations also may be imposed by the charters of individual companies to prevent, among other concerns, violations of foreign investment limitations. As a result, an additional class of shares (identified as "Foreign" in the
15
Morgan Stanley Institutional Fund, Inc.
Annual Report — December 31, 2013
Notes to Financial Statements (cont'd)
Portfolio of Investments) may be created and offered for investment. The "local" and "foreign shares" market values may differ. In the absence of trading of the foreign shares in such markets, the Portfolio values the foreign shares at the closing exchange price of the local shares.
4. Structured Investments: The Portfolio invested a portion of its assets in structured investments. A structured investment is a derivative security designed to offer a return linked to a particular underlying security, currency, commodity or market. Structured investments may come in various forms including notes (such as exchange-traded notes), warrants and options to purchase securities. The Portfolio will typically use structured investments to gain exposure to a permitted underlying security, currency, commodity or market when direct access to a market is limited or inefficient from a tax or cost standpoint. Investments in structured investments involve risks including issuer risk, counterparty risk and market risk. Holders of structured investments bear risks of the underlying investment and are subject to issuer or counterparty risk because the Portfolio is relying on the creditworthiness of such issuer or counterparty and has no rights with respect to the underlying investment. Certain structured investments may be thinly traded or have a limited trading market and may have the effect of increasing the Portfolio's illiquidity to the extent that the Portfolio, at a particular time, may be unable to find qualified buyers for these securities.
5. Indemnifications: The Fund enters into contracts that contain a variety of indemnifications. The Fund's maximum exposure under these arrangements is unknown. However, the Fund has not had prior claims or losses pursuant to these contracts and expects the risk of loss to be remote.
6. Dividends and Distributions to Shareholders: Dividend income and distributions to shareholders are recorded on the ex-dividend date. Dividends from net investment income, if any, are declared and paid semiannually. Net realized capital gains, if any, are distributed at least annually.
7. Security Transactions, Income and Expenses: Security transactions are accounted for on the trade date (date the order to buy or sell is executed). Realized gains and losses on the sale of investment securities are determined on the specific identified cost method. Dividend income and other distributions are recorded on the ex-dividend date (except for certain foreign dividends
which may be recorded as soon as the Portfolio is informed of such dividends) net of applicable withholding taxes. Interest income is recognized on the accrual basis except where collection is in doubt. Discounts are accreted and premiums are amortized over the life of the respective securities. Most expenses of the Fund can be directly attributed to a particular Portfolio. Expenses which cannot be directly attributed are apportioned among the Portfolios based upon relative net assets or other appropriate methods. Income, expenses (other than class specific expenses — distribution, transfer agency and sub transfer agency fees) and realized and unrealized gains or losses are allocated to each class of shares based upon their relative net assets.
The Portfolio owns shares of real estate investment trusts ("REITs") which report information on the source of their distributions annually in the following calendar year. A portion of distributions received from REITs during the year is estimated to be a return of capital and is recorded as a reduction of their cost.
B. Advisory Fees: The Adviser, a wholly-owned subsidiary of Morgan Stanley, provides the Portfolio with advisory services under the terms of an Investment Advisory Agreement, paid quarterly, at the annual rate based on the average daily net assets as follows:
First $1
billion | | Over $1
billion | |
| | 1.00 | % | | | 0.95 | % | |
For the year ended December 31, 2013, the advisory fee rate (net of waivers/rebate) was equivalent to an annual effective rate of 0.00% of the Portfolio's daily net assets.
The Adviser has agreed to reduce its advisory fee and/or reimburse the Portfolio so that total annual portfolio operating expenses, excluding certain investment related expenses, taxes, interest and other extraordinary expenses (including litigation), will not exceed 1.35% for Class I shares, 1.60% for Class A shares and 2.10% for Class L shares. Effective September 16, 2013, the Adviser has agreed to to limit the ratio of the expenses to average net assets to the maximum ratio of 1.70% and 2.20% for Class A and Class L shares, respectively. The fee waivers and/or expense reimbursements will continue for at least one year or until such time that the Directors act to discontinue all or a portion of such waivers and/or reimbursements when it deems such action is appropriate. For the year ended December 31, 2013, approximately $14,000 of advisory fees were waived and approximately $160,000 of other expenses were reimbursed by the Adviser pursuant to this arrangement.
16
Morgan Stanley Institutional Fund, Inc.
Annual Report — December 31, 2013
Notes to Financial Statements (cont'd)
C. Administration Fees: The Adviser also serves as Administrator to the Fund and provides administrative services pursuant to an Administration Agreement for an annual fee, accrued daily and paid monthly, of 0.08% of the Portfolio's average daily net assets. Under a Sub-Administration Agreement between the Administrator and State Street Bank and Trust Company ("State Street"), State Street provides certain administrative services to the Fund. For such services, the Administrator pays State Street a portion of the fee the Administrator receives from the Portfolio.
D. Distribution and Shareholder Services Fees: Morgan Stanley Distribution, Inc. ("MSDI" or the "Distributor"), a wholly-owned subsidiary of the Adviser, and an indirect subsidiary of Morgan Stanley, serves as the Fund's Distributor of Portfolio shares pursuant to a Distribution Agreement. The Fund has adopted a Shareholder Services Plan with respect to Class A shares pursuant to Rule 12b-1 under the Act. Under the Shareholder Services Plan, the Portfolio pays the Distributor a shareholder services fee, accrued daily and paid monthly, at an annual rate of 0.25% of the Portfolio's average daily net assets attributable to Class A shares.
The Fund has adopted a Distribution and Shareholder Services Plan with respect to Class L shares pursuant to Rule 12b-1 under the Act. Under the Distribution and Shareholder Services Plan, the Portfolio pays the Distributor a distribution fee, accrued daily and paid monthly, at an annual rate of 0.50% and a shareholder services fee, accrued daily and paid monthly, at an annual rate of 0.25% of the Portfolio's average daily net assets attributable to Class L shares.
The distribution and shareholder services fees are used to support the expenses associated with servicing and maintaining accounts. The Distributor may compensate other parties for providing shareholder support services to investors who purchase Class A and Class L shares.
E. Dividend Disbursing and Transfer Agent: The Fund's dividend disbursing and transfer agent was Morgan Stanley Services Company Inc. ("Morgan Stanley Services"). Pursuant to a Transfer Agency Agreement, the Fund paid Morgan Stanley Services a fee based on the number of classes, accounts and transactions relating to the Portfolios of the Fund. Effective July 1, 2013, the Directors approved changing the transfer agent to Boston Financial Data Services, Inc.
F. Custodian Fees: State Street (the "Custodian") serves as Custodian for the Fund in accordance with a Custodian Agreement. The Custodian holds cash, securities, and other assets of
the Fund as required by the Act. Custody fees are payable monthly based on assets held in custody, investment purchases and sales activity and account maintenance fees, plus reimbursement for certain out-of-pocket expenses.
G. Security Transactions and Transactions with Affiliates: For the year ended December 31, 2013, purchases and sales of investment securities for the Portfolio, other than long-term U.S. Government securities and short-term investments, were approximately $873,000 and $780,000, respectively. There were no purchases and sales of long-term U.S. Government securities for the year ended December 31, 2013.
The Portfolio invests in the Institutional Class of the Morgan Stanley Institutional Liquidity Funds — Money Market Portfolio (the "Liquidity Funds"), an open-end management investment company managed by the Adviser. Advisory fees paid by the Portfolio are reduced by an amount equal to its pro-rata share of the advisory and administration fees paid by the Portfolio due to its investment in the Liquidity Funds. For the year ended December 31, 2013, advisory fees paid were reduced by less than $500 relating to the Portfolio's investment in the Liquidity Funds.
A summary of the Portfolio's transactions in shares of the Liquidity Funds during the year ended December 31, 2013 is as follows:
Value
December 31,
2012
(000) | | Purchases
at Cost
(000) | | Sales
(000) | | Dividend
Income
(000) | | Value
December 31,
2013
(000) | |
| $ | 73 | | | $ | 674 | | | $ | 736 | | | $ | — | @ | | $ | 11 | | |
@ Amount is less than $500.
From January 1, 2013 to June 30, 2013, the Portfolio incurred less than $500 in brokerage commissions with Morgan Stanley & Co., LLC, an affiliate of the Adviser, Administrator and Distributor, for portfolio transactions executed on behalf of the Portfolio.
During the year ended December 31, 2013, the Portfolio incurred less than $500 in brokerage commissions with Citigroup, Inc., and its affiliated broker-dealers, which may be deemed affiliates of the Adviser, Distributor and Administrator under Section 17 of the Act, for portfolio transactions executed on behalf of the Portfolio. Citigroup, Inc. and its affiliated broker-dealers ceased to be affiliates of the Portfolio pursuant to Section 17 of the Act as of July 1, 2013.
H. Federal Income Taxes: It is the Portfolio's intention to continue to qualify as a regulated investment company and distribute all of its taxable and tax-exempt income. Accordingly,
17
Morgan Stanley Institutional Fund, Inc.
Annual Report — December 31, 2013
Notes to Financial Statements (cont'd)
no provision for Federal income taxes is required in the financial statements.
The Portfolio may be subject to taxes imposed by countries in which it invests. Such taxes are generally based on income and/or capital gains earned or repatriated. Taxes are accrued based on net investment income, net realized gains and net unrealized appreciation as such income and/or gains are earned. Taxes may also be based on transactions in foreign currency and are accrued based on the value of investments denominated in such currency.
FASB ASC 740-10 "Income Taxes — Overall" sets forth a minimum threshold for financial statement recognition of the benefit of a tax position taken or expected to be taken in a tax return. Management has concluded there are no significant uncertain tax positions that would require recognition in the financial statements. If applicable, the Portfolio recognizes interest accrued related to unrecognized tax benefits in "Interest Expense" and penalties in "Other Expenses" in the Statement of Operations. The Portfolio files tax returns with the U.S. Internal Revenue Service, New York and various states. Generally, each of the tax years in the three-year period ended December 31, 2013, remains subject to examination by taxing authorities.
The tax character of distributions paid may differ from the character of distributions shown in the Statements of Changes in Net Assets due to short-term capital gains being treated as ordinary income for tax purposes. The tax character of distributions paid during fiscal years 2013 and 2012 was as follows:
2013
Distributions
Paid From: | | 2012
Distributions
Paid From: | |
Ordinary
Income
(000) | | Long-Term
Capital Gain
(000) | | Ordinary
Income
(000) | | Long-Term
Capital Gain
(000) | |
| $ | 91 | | | $ | 132 | | | $ | 82 | | | | — | | |
The amount and character of income and gains to be distributed are determined in accordance with income tax regulations which may differ from GAAP. These book/tax differences are either considered temporary or permanent in nature.
Temporary differences are primarily due to differing book and tax treatments in the timing of the recognition of gains (losses) on certain investment transactions and the timing of the deductibility of certain expenses.
Permanent differences, primarily due to differing treatments of gains (losses) related to foreign currency transactions and a
nondeductible expense, resulted in the following reclassifications among the components of net assets at December 31, 2013:
Distributions in
Excess of
Net Investment
Income
(000) | | Accumulated
Net Realized
Gain
(000) | | Paid-in-Capital
(000) | |
| $ | (1 | ) | | $ | 1 | | | $ | (— | @) | |
At December 31, 2013, the components of distributable earnings for the Portfolio on a tax basis were as follows:
Undistributed
Ordinary
Income
(000) | | Undistributed
Long-Term
Capital Gain
(000) | |
| $ | 25 | | | $ | 43 | | |
At December 31, 2013, the aggregate cost for Federal income tax purposes is $1,303,000. The aggregate gross unrealized appreciation is $315,000 and the aggregate gross unrealized depreciation is $66,000 resulting in net unrealized appreciation of $249,000.
@ Amount is less than $500.
I. Other (unaudited): At December 31, 2013, the Portfolio had otherwise unaffiliated record owners of 10% or greater. Investment activities of these shareholders could have a material impact on the Portfolio. The aggregate percentage of such owners was 12% and 89% for Class I and Class A shares, respectively.
J. Accounting Pronouncement: In June 2013, FASB issued Accounting Standards Update 2013-08 Financial Services — Investment Companies (Topic 946) — Amendments to the Scope, Measurement, and Disclosure Requirements ("ASU 2013-08") which is effective for interim and annual reporting periods in fiscal years that begin after December 15, 2013. ASU 2013-08 sets forth a methodology for determining whether an entity should be characterized as an investment company and prescribes fair value accounting for an investment company's non-controlling ownership interest in another investment company. FASB has determined that a fund registered under the Investment Company Act of 1940 automatically meets ASU 2013-08's criteria for an investment company. Although still evaluating the potential impacts of ASU 2013-08 to the Portfolio, management expects that the impact of the Portfolio's adoption will be limited to additional financial statement disclosures.
18
Morgan Stanley Institutional Fund, Inc.
Annual Report — December 31, 2013
Report of Independent Registered Public Accounting Firm
To the Shareholders and Board of Directors of
Morgan Stanley Institutional Fund, Inc. —
Global Insight Portfolio
We have audited the accompanying statement of assets and liabilities, including the portfolio of investments, of Global Insight Portfolio (one of the portfolios constituting Morgan Stanley Institutional Fund, Inc.) (the "Portfolio") as of December 31, 2013, and the related statement of operations for the year then ended, the statements of changes in net assets for each of the two years in the period then ended, and the financial highlights for each of the periods indicated therein. These financial statements and financial highlights are the responsibility of the Portfolio's management. Our responsibility is to express an opinion on these financial statements and financial highlights based on our audits.
We conducted our audits in accordance with the standards of the Public Company Accounting Oversight Board (United States). Those standards require that we plan and perform the audit to obtain reasonable assurance about whether the financial statements and financial highlights are free of material misstatement. We were not engaged to perform an audit of the Portfolio's internal control over financial reporting. Our audits included consideration of internal control over financial reporting as a basis for designing audit procedures that are appropriate in the circumstances, but not for the purpose of expressing an opinion on the effectiveness of the Portfolio's internal control over financial reporting. Accordingly, we express no such opinion. An audit also includes examining, on a test basis, evidence supporting the amounts and disclosures in the financial statements and financial highlights, assessing the accounting principles used and significant estimates made by management, and evaluating the overall financial statement presentation. Our procedures included confirmation of securities owned as of December 31, 2013, by correspondence with the custodian and others. We believe that our audits provide a reasonable basis for our opinion.
In our opinion, the financial statements and financial highlights referred to above present fairly, in all material respects, the financial position of Global Insight Portfolio (one of the portfolios constituting Morgan Stanley Institutional Fund, Inc.) at December 31, 2013, the results of its operations for the year then ended, the changes in its net assets for each of the two years in the period then ended, and the financial highlights for each of the periods indicated therein, in conformity with U.S. generally accepted accounting principles.

Boston, Massachusetts
February 26, 2014
19
Morgan Stanley Institutional Fund, Inc.
Annual Report — December 31, 2013
Federal Tax Notice (unaudited)
For Federal income tax purposes, the following information is furnished with respect to the Portfolio's earnings for its taxable year ended December 31, 2013. When distributed, certain earnings may be subject to a maximum tax rate of 15% as provided for the Jobs and Growth Tax Relief Reconciliation Act of 2003. The Portfolio designated up to a maximum of approximately $41,000 as taxable at this lower rate.
The Portfolio designated and paid $132,000 as a long-term capital gain distribution.
In January, the Portfolio provides tax information to shareholders for the preceding calendar year.
20
Morgan Stanley Institutional Fund, Inc.
Annual Report — December 31, 2013
U.S. Privacy Policy (unaudited)
AN IMPORTANT NOTICE CONCERNING OUR U.S. PRIVACY POLICY
This privacy notice describes the U.S. privacy policy of Morgan Stanley Distribution, Inc., and the Morgan Stanley family of mutual funds ("us", "our", "we").
We are required by federal law to provide you with notice of our U.S. privacy policy ("Policy"). This Policy applies to both our current and former clients unless we state otherwise and is intended for individual clients who purchase products or receive services from us for personal, family or household purposes. This Policy is not applicable to partnerships, corporations, trusts or other non-individual clients or account holders, nor is this Policy applicable to individuals who are either beneficiaries of a trust for which we serve as trustee or participants in an employee benefit plan administered or advised by us. This Policy is, however, applicable to individuals who select us to be a custodian of securities or assets in individual retirement accounts, 401(k) accounts, or accounts subject to the Uniform Gifts to Minors Act.
This notice sets out our business practices to protect your privacy; how we collect and share personal information about you; and how you can limit our sharing or certain uses by others of this information. We may amend this Policy at any time, and will inform you of any changes to our Policy as required by law.
WE RESPECT YOUR PRIVACY
We appreciate that you have provided us with your personal financial information and understand your concerns about your information. We strive to safeguard the information our clients entrust to us. Protecting the confidentiality and security of client information is an important part of how we conduct our business.
This notice describes what personal information we collect about you, how we collect it, when we may share it with others, and how certain others may use it. It discusses the steps you may take to limit our sharing of certain information about you with our affiliated companies, including, but not limited to our affiliated banking businesses, brokerage firms and credit service affiliates. It also discloses how you may limit our affiliates' use of shared information for marketing purposes.
Throughout this Policy, we refer to the nonpublic information that personally identifies you as "personal information." We also use the term "affiliated company" in this notice. An affiliated company is a company in our family of companies and includes companies with the Morgan Stanley name. These affiliated companies are financial institutions such as broker-dealers, banks, investment advisers and credit card issuers. We refer to any company that is not an affiliated company as a nonaffiliated third party. For purposes of Section 5 of this notice, and your ability to limit certain uses of personal information by our affiliates, this notice applies to the use of personal information by our affiliated companies.
1. WHAT PERSONAL INFORMATION DO WE COLLECT FROM YOU?
We may collect the following types of information about you: (i) information provided by you, including information from applications and other forms we receive from you, (ii) information about your transactions with us or our affiliates, (iii) information about your transactions with nonaffiliated third parties, (iv) information from consumer reporting agencies, (v) information obtained from our websites, and (vi) information obtained from other sources. For example:
• We collect information such as your name, address, e-mail address, telephone/fax numbers, assets, income and investment objectives through applications and other forms you submit to us.
• We may obtain information about account balances, your use of account(s) and the types of products and services you prefer to receive from us through your dealings and transactions with us and other sources.
• We may obtain information about your creditworthiness and credit history from consumer reporting agencies.
• We may collect background information from and through third-party vendors to verify representations you have made and to comply with various regulatory requirements.
2. WHEN DO WE DISCLOSE PERSONAL INFORMATION WE COLLECT ABOUT YOU?
We may disclose personal information we collect about you in each of the categories listed above to affiliated and nonaffiliated third parties.
21
Morgan Stanley Institutional Fund, Inc.
Annual Report — December 31, 2013
U.S. Privacy Policy (unaudited) (cont'd)
a. Information we disclose to affiliated companies.
We may disclose personal information that we collect about you to our affiliated companies to manage your account(s) effectively, to service and process your transactions, and to let you know about products and services offered by us and affiliated companies, to manage our business, and as otherwise required or permitted by law. Offers for products and services from affiliated companies are developed under conditions designed to safeguard your personal information.
b. Information we disclose to third parties.
We may disclose personal information that we collect about you to nonaffiliated third parties to provide marketing services on our behalf or to other financial institutions with whom we have joint marketing agreements. We may also disclose all of the information we collect to other nonaffiliated third parties for our everyday business purposes, such as to process transactions, maintain account(s), respond to court orders and legal investigations, report to credit bureaus, offer our own products and services, protect against fraud, for institutional risk control, to perform services on our behalf, and as otherwise required or permitted by law.
When we share personal information about you with a nonaffiliated third party, they are required to limit their use of personal information about you to the particular purpose for which it was shared and they are not allowed to share personal information about you with others except to fulfill that limited purpose or as may be permitted or required by law.
3. HOW DO WE PROTECT THE SECURITY AND CONFIDENTIALITY OF PERSONAL INFORMATION WE COLLECT ABOUT YOU?
We maintain physical, electronic and procedural security measures that comply with applicable law and regulations to help safeguard the personal information we collect about you. We have internal policies governing the proper handling of client information by employees. Third parties that provide support or marketing services on our behalf may also receive personal information about you, and we require them to adhere to appropriate security standards with respect to such information.
4. HOW CAN YOU LIMIT OUR SHARING CERTAIN PERSONAL INFORMATION ABOUT YOU WITH OUR AFFILIATED COMPANIES FOR ELIGIBILITY DETERMINATION?
By following the opt-out procedures in Section 6 below, you may limit the extent to which we share with our affiliated companies, personal information that was collected to determine your eligibility for products and services such as your credit reports and other information that you have provided to us or that we may obtain from third parties ("eligibility information"). Eligibility information does not include your identification information or personal information pertaining to our transactions or experiences with you. Please note that, even if you direct us not to share eligibility information with our affiliated companies, we may still share your personal information, including eligibility information, with our affiliated companies under circumstances that are permitted under applicable law, such as to process transactions or to service your account.
5. HOW CAN YOU LIMIT THE USE OF CERTAIN PERSONAL INFORMATION ABOUT YOU BY OUR AFFILIATED COMPANIES FOR MARKETING?
By following the opt-out instructions in Section 6 below, you may limit our affiliated companies from marketing their products or services to you based on personal information we disclose to them. This information may include, for example, your income and account history with us. Please note that, even if you choose to limit our affiliated companies from using personal information about you that we may share with them for marketing their products and services to you, our affiliated companies may use your personal information that they obtain from us to market to you in circumstances permitted by law, such as if the affiliated party has its own relationship with you.
22
Morgan Stanley Institutional Fund, Inc.
Annual Report — December 31, 2013
U.S. Privacy Policy (unaudited) (cont'd)
6. HOW CAN YOU SEND US AN OPT-OUT INSTRUCTION?
If you wish to limit our sharing of eligibility information about you with our affiliated companies, or our affiliated companies' use of personal information for marketing purposes, as described in this notice, you may do so by:
• Calling us at (800) 548-7786
Monday–Friday between 8a.m. and 5p.m. (EST)
• Writing to us at the following address:
Boston Financial Data Services, Inc.
c/o Privacy Coordinator
P.O. Box 219804
Kansas City, Missouri 64121
If you choose to write to us, your request should include: your name, address, telephone number and account number(s) to which the opt-out applies and whether you are opting out with respect to sharing of eligibility information (Section 4 above), or information used for marketing (Section 5 above), or both. Written opt-out requests should not be sent with any other correspondence. In order to process your request, we require that the request be provided by you directly and not through a third party. Once you have informed us about your privacy preferences, your opt-out preference will remain in effect with respect to this Policy (as it may be amended) until you notify us otherwise. If you are a joint account owner, we will accept instructions from any one of you and apply those instructions to the entire account.
Please understand that if you limit our sharing or our affiliated companies' use of personal information, you and any joint account holder(s) may not receive information about our affiliated companies' products and services, including products or services that could help you manage your financial resources and achieve your investment objectives.
If you have more than one account or relationship with us, please specify the accounts to which you would like us to apply your privacy choices. If you have accounts or relationships with our affiliates, you may receive multiple privacy policies from them, and will need to separately notify those companies of your privacy choices for those accounts or relationships.
7. WHAT IF AN AFFILIATED COMPANY BECOMES A NONAFFILIATED THIRD PARTY?
If, at any time in the future, an affiliated company becomes a nonaffiliated third party, further disclosures of personal information made to the former affiliated company will be limited to those described in Section 2(b) above relating to nonaffiliated third parties. If you elected under Section 6 to limit disclosures we make to affiliated companies, or use of personal information by affiliated companies, your election will not apply to use by any former affiliated company of your personal information in their possession once it becomes a nonaffiliated third party.
SPECIAL NOTICE TO RESIDENTS OF VERMONT
The following section supplements our Policy with respect to our individual clients who have a Vermont address and supersedes anything to the contrary in the above Policy with respect to those clients only.
The State of Vermont requires financial institutions to obtain your consent prior to sharing personal information that they collect about you with nonaffiliated third parties, or eligibility information with affiliated companies, other than in certain limited circumstances. Except as permitted by law, we will not share personal information we collect about you with nonaffiliated third parties or eligibility information with affiliated companies, unless you provide us with your written consent to share such information.
SPECIAL NOTICE TO RESIDENTS OF CALIFORNIA
The following section supplements our Policy with respect to our individual clients who have a California address and supersedes anything to the contrary in the above Policy with respect to those clients only.
In response to a California law, if your account has a California home address, your personal information will not be disclosed to nonaffiliated third parties except as permitted by applicable California law, and we will limit sharing such personal information with our affiliates to comply with California privacy laws that apply to us.
23
Morgan Stanley Institutional Fund, Inc.
Annual Report — December 31, 2013
Director and Officer Information (unaudited)
Independent Director:
Name, Age and Address of
Independent Director | | Position(s)
Held with
Registrant | | Length of Time
Served* | | Principal Occupation(s) During Past 5 Years | | Number of
Portfolios in
Fund Complex
Overseen by
Independent
Director** | | Other Directorships
Held by Independent
Director*** | |
Frank L. Bowman (69)
c/o Kramer Levin Naftalis &
Frankel LLP
Counsel to the Independent
Directors
1177 Avenue of the Americas
New York, NY 10036 | | Director | | Since
August
2006 | | President, Strategic Decisions, LLC (consulting) (since February 2009); Director or Trustee of various Morgan Stanley Funds (since August 2006); Chairperson of the Insurance Sub-Committee of the Compliance and Insurance Committee (since February 2007); served as President and Chief Executive Officer of the Nuclear Energy Institute (policy organization) (February 2005-November 2008); retired as Admiral, U.S. Navy after serving over 38 years on active duty including 8 years as Director of the Naval Nuclear Propulsion Program in the Department of the Navy and the U.S. Department of Energy (1996-2004); served as Chief of Naval Personnel (July 1994-September 1996); and on the Joint Staff as Director of Political Military Affairs (June 1992-July 1994); knighted as Honorary Knight Commander of the Most Excellent Order of the British Empire; awarded the Officier de l'Orde National du Mérite by the French Government; elected to the National Academy of Engineering (2009). | | | 98 | | | Director of BP p.l.c.; Director of Naval and Nuclear Technologies LLP; Director of the Armed Services YMCA of the USA and the U.S. Naval Submarine League; Director of the American Shipbuilding Suppliers Association; Member of the National Security Advisory Council of the Center for U.S. Global Engagement and a member of the CNA Military Advisory Board; Chairman of the Charity J Street Cup Golf; Trustee of Fairhaven United Methodist Church. | |
Michael Bozic (73)
c/o Kramer Levin Naftalis & Frankel LLP
Counsel to the Independent Directors
1177 Avenue of the Americas New York, NY 10036 | | Director | | Since
April
1994 | | Private investor and a member of the advisory board of American Road Group LLC (retail) (since June 2000); Chairperson of the Compliance and Insurance Committee (since October 2006); Director or Trustee of various Morgan Stanley Funds (since April 1994); formerly, Chairperson of the Insurance Committee (July 2006-September 2006); Vice Chairman of Kmart Corporation (December 1998-October 2000); Chairman and Chief Executive Officer of Levitz Furniture Corporation (November 1995-November 1998) and President and Chief Executive Officer of Hills Department Stores (May 1991-July 1995); variously Chairman, Chief Executive Officer, President and Chief Operating Officer (1987-1991) of the Sears Merchandise Group of Sears, Roebuck & Co. | | | 100 | | | Trustee and member of the Hillsdale College Board of Trustees. | |
Kathleen A. Dennis (60)
c/o Kramer Levin Naftalis & Frankel LLP
Counsel to the Independent Directors
1177 Avenue of the Americas New York, NY 10036 | | Director | | Since
August
2006 | | President, Cedarwood Associates (mutual fund and investment management consulting) (since July 2006); Chairperson of the Money Market and Alternatives Sub-Committee of the Investment Committee (since October 2006) and Director or Trustee of various Morgan Stanley Funds (since August 2006); formerly, Senior Managing Director of Victory Capital Management (1993-2006). | | | 98 | | | Director of various non-profit organizations. | |
Dr. Manuel H. Johnson (65)
c/o Johnson Smick
International, Inc.
220 I Street NE
Suite 200
Washington, D.C. 20002 | | Director | | Since
July
1991 | | Senior Partner, Johnson Smick International, Inc. (consulting firm); Chairperson of the Investment Committee (since October 2006) and Director or Trustee of various Morgan Stanley Funds (since July 1991); Co-Chairman and a founder of the Group of Seven Council (G7C) (international economic commission); formerly, Chairperson of the Audit Committee (July 1991-September 2006); Vice Chairman of the Board of Governors of the Federal Reserve System and Assistant Secretary of the U.S. Treasury. | | | 101 | | | Director of NVR, Inc. (home construction). | |
24
Morgan Stanley Institutional Fund, Inc.
Annual Report — December 31, 2013
Director and Officer Information (unaudited) (cont'd)
Independent Director: (cont'd)
Name, Age and Address of
Independent Director | | Position(s)
Held with
Registrant | | Length of Time
Served* | | Principal Occupation(s) During Past 5 Years | | Number of
Portfolios in
Fund Complex
Overseen by
Independent
Director** | | Other Directorships
Held by Independent
Director*** | |
Joseph J. Kearns (71)
c/o Kearns & Associates LLC PMB754
22631 Pacific Coast Highway
Malibu, CA 90265 | | Director | | Since
August
1994 | | President, Kearns & Associates LLC (investment consulting); Chairperson of the Audit Committee (since October 2006) and Director or Trustee of various Morgan Stanley Funds (since August 1994); formerly, Deputy Chairperson of the Audit Committee (July 2003-September 2006) and Chairperson of the Audit Committee of various Morgan Stanley Funds (since August 1994); CFO of the J. Paul Getty Trust. | | | 101 | | | Director of Electro Rent Corporation (equipment leasing) and The Ford Family Foundation. | |
Michael F. Klein (55)
c/o Kramer Levin Naftalis & Frankel LLP
Counsel to the Independent Directors
1177 Avenue of the Americas New York, NY 10036 | | Director | | Since
August
2006 | | Managing Director, Aetos Capital, LLC (since March 2000) and Co-President, Aetos Alternatives Management, LLC (since January 2004) and Co-Chief Executive Officer of Aetos Capital LLC (since August 2013); Chairperson of the Fixed Income Sub-Committee of the Investment Committee (since October 2006) and Director or Trustee of various Morgan Stanley Funds (since August 2006); formerly, Managing Director, Morgan Stanley & Co. Inc. and Morgan Stanley Dean Witter Investment Management, President, various Morgan Stanley Funds (June 1998-March 2000) and Principal, Morgan Stanley & Co. Inc. and Morgan Stanley Dean Witter Investment Management (August 1997-December 1999). | | | 98 | | | Director of certain investment funds managed or sponsored by Aetos Capital, LLC. Director of Sanitized AG and Sanitized Marketing AG (specialty chemicals). | |
Michael E. Nugent (77)
522 Fifth Avenue
New York, NY 10036 | | Chairperson
of the
Board and Director | | Chairperson of the Boards since July 2006 and Director since July 1991 | | Chairperson of the Boards of various Morgan Stanley Funds (since July 2006); Chairperson of the Closed-End Fund Committee (since June 2012) and Director or Trustee of various Morgan Stanley Funds (since July 1991); formerly, Chairperson of the Insurance Committee (until July 2006); General Partner, Triumph Capital, L.P. (private investment partnership) (1988-2013). | | | 100 | | | None. | |
W. Allen Reed (66)
c/o Kramer Levin Naftalis & Frankel LLP
Counsel to the Independent Directors
1177 Avenue of the Americas New York, NY 10036 | | Director | | Since
August
2006 | | Chairperson of the Equity Sub-Committee of the Investment Committee (since October 2006) and Director or Trustee of various Morgan Stanley Funds (since August 2006); formerly, President and CEO of General Motors Asset Management; Chairman and Chief Executive Officer of the GM Trust Bank and Corporate Vice President of General Motors Corporation (August 1994-December 2005). | | | 98 | | | Director of Temple-Inland Industries (packaging and forest products); Director of Legg Mason, Inc. and Director of the Auburn University Foundation. | |
Fergus Reid (81)
c/o Joe Pietryka, Inc.
85 Charles Colman Blvd. Pawling, NY 12564 | | Director | | Since
June
1992 | | Chairman, Joe Pietryka, Inc.; Chairperson of the Governance Committee and Director or Trustee of various Morgan Stanley Funds (since June 1992). | | | 101 | | | Through December 31, 2012, Trustee and Director of certain Investment companies in the JPMorgan Fund Complex. | |
25
Morgan Stanley Institutional Fund, Inc.
Annual Report — December 31, 2013
Director and Officer Information (unaudited) (cont'd)
Interested Director:
Name, Age and Address of
Interested Director | | Position(s)
Held with
Registrant | | Length of
Time Served* | | Principal Occupation(s) During Past 5 Years | | Number of
Portfolios in
Fund Complex
Overseen by
Interested
Director** | | Other Directorships
Held by Interested
Director*** | |
James F. Higgins (66)
One New York Plaza
New York, NY 10004 | | Director | | Since
June
2000 | | Director or Trustee of various Morgan Stanley Funds (since June 2000); Senior Advisor of Morgan Stanley (since August 2000). | | | 99 | | | Formerly, Director of AXA Financial, Inc. and AXA Equitable Life Insurance Company (2002-2011) and Director of AXA MONY Life Insurance Company and AXA MONY Life Insurance Company of America (2004-2011). | |
* Each Director serves an indefinite term, until his or her successor is elected.
** The Fund Complex includes (as of December 31, 2013) all open-end and closed-end funds (including all of their portfolios) advised by Morgan Stanley Investment Management Inc. (the "Adviser") and any funds that have an adviser that is an affiliated person of the Adviser (including, but not limited to, Morgan Stanley AIP GP LP).
*** This includes any directorships at public companies and registered investment companies held by the Director at any time during the past five years.
26
Morgan Stanley Institutional Fund, Inc.
Annual Report — December 31, 2013
Director and Officer Information (unaudited) (cont'd)
Executive Officers:
Name, Age and Address of Executive Officer | | Position(s) Held
with
Registrant | | Length of
Time Served* | | Principal Occupation(s) During Past 5 Years | |
John H. Gernon (50)
522 Fifth Avenue
New York, NY 10036 | | President and Principal Executive Officer—Equity, Fixed Income and AIP Funds | | Since
September
2013 | | President and Principal Executive Officer of the Equity and Fixed Income Funds and the Morgan Stanley AIP Funds (since September 2013) in the Fund Complex. Managing Director of the Adviser. | |
Stefanie V. Chang Yu (47)
522 Fifth Avenue
New York, NY 10036 | | Chief Compliance Officer | | Since
January
2014 | | Managing Director of the Adviser and various entities affiliated with the Adviser; Chief Compliance Officer of various Morgan Stanley Funds and the Adviser (since January 2014); formerly, Vice President of various Morgan Stanley Funds(December 1997-January 2014). | |
Joseph C. Benedetti (48)
522 Fifth Avenue
New York, NY 10036 | | Vice President | | Since
January
2014 | | Managing Director of the Adviser and various entities affiliated with the Adviser; Vice President of various Morgan Stanley Funds (since January 2014); formerly, Assistant Secretary of various Morgan Stanley Funds (October 2004-January 2014). | |
Francis J. Smith (48)
522 Fifth Avenue
New York, NY 10036 | | Treasurer and Principal Financial Officer | | Treasurer since July 2003 and Principal Financial Officer since September 2002 | | Executive Director of the Adviser and various entities affiliated with the Adviser; Treasurer and Principal Financial Officer of various Morgan Stanley Funds (since July 2003). | |
Mary E. Mullin (46)
522 Fifth Avenue
New York, NY 10036 | | Secretary | | Since
June
1999 | | Executive Director of the Adviser and various entities affiliated with the Adviser; Secretary of various Morgan Stanley Funds (since June 1999). | |
* Each officer serves an indefinite term, until his or her successor is elected.
27
Morgan Stanley Institutional Fund, Inc.
Annual Report — December 31, 2013
Adviser and Administrator
Morgan Stanley Investment Management Inc.
522 Fifth Avenue
New York, New York 10036
Distributor
Morgan Stanley Distribution, Inc.
522 Fifth Avenue
New York, New York 10036
Dividend Disbursing and Transfer Agent
Boston Financial Data Services, Inc.
2000 Crown Colony Drive
Quincy, Massachusetts 02169
Custodian
State Street Bank and Trust Company
One Lincoln Street
Boston, Massachusetts 02111
Legal Counsel
Dechert LLP
1095 Avenue of the Americas
New York, New York 10036
Counsel to the Independent Directors
Kramer Levin Naftalis & Frankel LLP
1177 Avenue of the Americas
New York, New York 10036
Independent Registered Public Accounting Firm
Ernst & Young LLP
200 Clarendon Street
Boston, Massachusetts 02116
Reporting to Shareholders
Each Morgan Stanley fund provides a complete schedule of portfolio holdings in its semi-annual and annual reports within 60 days of the end of the fund's second and fourth fiscal quarters by filing the schedule electronically with the Securities and Exchange Commission (SEC). The semi-annual reports are filed on Form N-CSRS and the annual reports are filed on Form N-CSR. Morgan Stanley also delivers the semi-annual and annual reports to fund shareholders and makes these reports available on its public website, www.morganstanley.com/im. Each Morgan Stanley fund also files a complete schedule of portfolio holdings with the SEC for the fund's first and third fiscal quarters on Form N-Q. Morgan Stanley does not deliver the reports for the first and third fiscal quarters to shareholders, nor are the reports posted to the Morgan Stanley public website. You may, however, obtain the Form N-Q filings (as well as the Form N-CSR and N-CSRS filings) by accessing the SEC's website, www.sec.gov. You may also review and copy them at the SEC's Public Reference Room in Washington, DC. Information on the operation of the SEC's Public Reference Room may be obtained by calling the SEC toll free at 1 (800) SEC-0330. You can also request copies of these materials, upon payment of a duplicating fee, by electronic request at the SEC's email address (publicinfo@sec.gov) or by writing the Public Reference Room of the SEC, Washington, DC 20549-0102.
Proxy Voting Policies and Procedures and Proxy Voting Record
You may obtain a copy of the Fund's Proxy Voting Policy and Procedures and information regarding how the Fund voted proxies relating to portfolio securities during the most recent twelve-month period ended June 30, without charge, upon request, by calling toll free 1 (800) 548-7786 or by visiting our website at www.morganstanley.com/im. This information is also available on the SEC's website at www.sec.gov.
This report is authorized for distribution only when preceded or accompanied by a prospectus of the Morgan Stanley Institutional Fund, Inc. which describes in detail each Investment Portfolio's investment policies, risks, fees and expenses. Please read the prospectus carefully before you invest or send money. For additional information, including information regarding the investments comprising the Portfolio, please visit our website at www.morganstanley.com/im or call toll free 1 (800) 548-7786.
28
(This Page has been left blank intentionally.)
Printed in U.S.A.
This Report has been prepared for shareholders and may be distributed to others only if preceded or accompanied by a current prospectus.
Morgan Stanley Investment Management Inc.
522 Fifth Avenue
New York, New York 10036
© 2014 Morgan Stanley. Morgan Stanley Distribution, Inc.

IFIGIANN
809496 EXP 2.28.15

Morgan Stanley Institutional Fund, Inc.
International Real Estate Portfolio
Annual Report
December 31, 2013

Morgan Stanley Institutional Fund, Inc.
Annual Report — December 31, 2013
Shareholders' Letter | | | 2 | | |
Expense Example | | | 3 | | |
Investment Overview | | | 4 | | |
Portfolio of Investments | | | 7 | | |
Statement of Assets and Liabilities | | | 9 | | |
Statement of Operations | | | 11 | | |
Statements of Changes in Net Assets | | | 12 | | |
Financial Highlights | | | 14 | | |
Notes to Financial Statements | | | 19 | | |
Report of Independent Registered Public Accounting Firm | | | 26 | | |
Federal Tax Notice | | | 27 | | |
U.S. Privacy Policy | | | 28 | | |
Director and Officer Information | | | 31 | | |
This report is authorized for distribution only when preceded or accompanied by prospectuses of the Morgan Stanley Institutional Fund, Inc. To receive a prospectus and/or statement of additional information (SAI), which contains more complete information such as investment objectives, charges, expenses, policies for voting proxies, risk considerations, and describes in detail each of the Portfolio's investment policies to the prospective investor, please call toll free 1 (800) 548-7786. Please read the prospectuses carefully before you invest or send money.
Additionally, you can access portfolio information including performance, characteristics, and investment team commentary through Morgan Stanley Investment Management's website: www.morganstanley.com/im.
Market forecasts provided in this report may not necessarily come to pass. There is no guarantee that any sectors mentioned will continue to perform as discussed herein or that securities in such sectors will be held by the Portfolio in the future. There is no assurance that a Portfolio will achieve its investment objective. Portfolios are subject to market risk, which is the possibility that market values of securities owned by the Portfolio will decline and, therefore, the value of the Portfolio's shares may be less than what you paid for them. Accordingly, you can lose money investing in the Portfolio. Please see the prospectus for more complete information on investment risks.
1
Morgan Stanley Institutional Fund, Inc.
Annual Report — December 31, 2013
Shareholders' Letter (unaudited)
Dear Shareholders,
We are pleased to provide this Annual report, in which you will learn how your investment in International Real Estate Portfolio (the "Portfolio") performed during the latest twelve-month period.
Morgan Stanley Investment Management is a client-centric, investor-led organization. Our global presence, intellectual capital, and breadth of products and services enable us to partner with investors to meet the evolving challenges of today's financial markets. We aim to deliver superior investment service and to empower our clients to make the informed decisions that help them reach their investment goals.
As always, we thank you for selecting Morgan Stanley Investment Management, and look forward to working with you in the months and years ahead.
Sincerely,

John H. Gernon
President and Principal Executive Officer
January 2014
2
Morgan Stanley Institutional Fund, Inc.
Annual Report — December 31, 2013
Expense Example (unaudited)
International Real Estate Portfolio
As a shareholder of the Portfolio, you incur two types of costs: (1) transactional costs, including redemptions fees; and (2) ongoing costs, including advisory fees, administration fees, distribution and shareholder services fees and other Portfolio expenses. This example is intended to help you understand your ongoing costs (in dollars) of investing in the Portfolio and to compare these costs with the ongoing costs of investing in other mutual funds.
This example is based on an investment of $1,000 invested at the beginning of the six-month period ended December 31, 2013 and held for the entire six-month period.
Actual Expenses
The table below provides information about actual account values and actual expenses. You may use the information in this table, together with the amount you invested, to estimate the expenses that you paid over the period. Simply divide your account value by $1,000 (for example, an $8,600 account value divided by $1,000 = 8.6), then multiply the result by the number in the table under the heading entitled "Actual Expenses Paid During Period" to estimate the expenses you paid on your account during this period.
Hypothetical Example for Comparison Purposes
The table below provides information about hypothetical account values and hypothetical expenses based on the Portfolio's actual expense ratio and an assumed rate of return of 5% per year before expenses, which is not the Portfolio's actual return. The hypothetical account values and expenses may not be used to estimate the actual ending account balance or expenses you paid for the period. You may use this information to compare the ongoing costs of investing in the Portfolio and other funds. To do so, compare this 5% hypothetical example with the 5% hypothetical examples that appear in the shareholder reports of the other funds.
Please note that the expenses shown in the table are meant to highlight your ongoing costs only and do not reflect any transactional costs, such as sales charges (loads) and redemption fees. Therefore, the information for each class in the table is useful in comparing ongoing costs only, and will not help you determine the relative total costs of owning different funds. In addition, if these transactional costs were included, your costs would have been higher.
| | | Beginning
Account
Value
7/1/13 | | Actual Ending
Account
Value
12/31/13 | | Hypothetical
Ending Account
Value | | Actual
Expenses
Paid
During
Period | | Hypothetical
Expenses Paid
During Period | | Net
Expense
Ratio
During
Period*** | |
International Real Estate Portfolio Class I | | $ | 1,000.00 | | | $ | 1,063.50 | | | $ | 1,020.16 | | | $ | 5.20 | * | | $ | 5.09 | * | | | 1.00 | % | |
International Real Estate Portfolio Class A@ | | | 1,000.00 | | | | 1,061.70 | | | | 1,018.65 | | | | 6.76 | * | | | 6.61 | * | | | 1.30 | | |
International Real Estate Portfolio Class H | | | 1,000.00 | | | | 1,061.70 | | | | 1,018.65 | | | | 6.76 | * | | | 6.61 | * | | | 1.30 | | |
International Real Estate Portfolio Class L | | | 1,000.00 | | | | 1,058.90 | | | | 1,015.98 | | | | 9.50 | * | | | 9.30 | * | | | 1.83 | | |
International Real Estate Portfolio Class IS | | | 1,000.00 | | | | 1,016.80 | | | | 1,011.81 | | | | 2.87 | ** | | | 2.86 | ** | | | 0.97 | | |
* Expenses are calculated using each Portfolio Class' annualized net expense ratio (as disclosed), multiplied by the average account value over the period, and multiplied by 184/365 (to reflect the most recent one-half year period).
** Expenses are calculated using the Portfolio Class' annualized net expense ratio (as disclosed), multiplied by the average account value over the period, and multiplied by 107/365 (to reflect the actual days in the period).
*** Annualized.
@ Effective September 9, 2013, Class P shares were renamed Class A shares.
3
Morgan Stanley Institutional Fund, Inc.
Annual Report — December 31, 2013
Investment Overview (unaudited)
International Real Estate Portfolio
The International Real Estate Portfolio seeks to provide current income and long-term capital appreciation by investing primarily in equity securities of companies in the real estate industry located throughout the world (excluding the United States and Canada).
Performance
For the year ended December 31, 2013, the Portfolio had a total return based on net asset value (NAV) and reinvestment of distributions per share of 5.56%, net of fees, for Class I shares. The Portfolio's Class I shares underperformed against its benchmark, the FTSE EPRA/NAREIT Developed ex-North America Real Estate — Net Total Return Index (the "Index"), which returned 7.45%, and underperformed the MSCI EAFE Index, which returned 22.78%.
Factors Affecting Performance
• The international real estate securities market gained 7.45% during the 12-month period ending December 31, 2013, as measured by the Index. Europe outperformed the international average and Asia underperformed the international average.
• During the year, real estate share prices appeared to have been influenced by transactional evidence in the private real estate markets of strong investor demand for core assets at valuations that demonstrate the acceptance of low expected returns as well as investors' search for yield. Share prices also appeared to be impacted by concerns over higher interest rates and U.S. Federal Reserve quantitative easing (QE) tapering, which was announced in December; the growth trajectory in China; and improved economic prospects and sentiment in Europe.
• Performance within the Asian and European regional portfolios contributed to relative performance. Top down global allocation was neutral. In Asia, the Portfolio benefited from stock selection in Japan and the underweight to Singapore and Australia; this was partially offset by the overweight to and stock selection within Hong Kong, and the underweight to Japan, which detracted. In Europe, the Portfolio benefited from stock selection within and the underweight to Germany, and the overweight to and stock selection in the U.K; this was partially offset by the negative impact of stock selection in Sweden.
Management Strategies
• The Portfolio is comprised of two regional portfolios with a global allocation which weights the European and Asian regions relative to the Index based on our view of the relative attractiveness of each region in terms of underlying real estate fundamentals and public market valuations. Moreover, both of the regional portfolios reflect our core investment philosophy as a real estate value investor, which results in the ownership of stocks that we believe provide the best valuation relative to their underlying real estate values, while striving to maintain portfolio diversification. Our company-specific research leads us to specific preferences for sub-segments within each of the property sectors and countries. For the period ended December 31, 2013, the Portfolio was overweight the Asian listed property sector and underweight the European listed property sector.
• The overweight to the Asian region was predominated by the real estate operating companies (REOCs) in Hong Kong and Japan. We continue to believe that the Hong Kong REOCs offer highly attractive value, as there is the widest discrepancy both between private and public valuations, and relative to other public listed property markets. The discounted valuations are further accentuated as the Hong Kong REOCs maintain very modest leverage levels. Sentiment continues to be a significant driver of share price movements and investor sentiment remained negative due to macro and interest rate concerns and the continued uncertainty from residential tightening measures. While we believe that there is some risk to asset values, which are above peak levels, there is no evidence to date for commercial assets. Despite trading at premiums, the Japan REOCs continue to offer attractive value versus the Japanese real estate investment trusts (J-REITs). There is continued favorable sentiment toward the J-REOCs due to aggressive QE measures by the Bank of Japan (BOJ), with property values viewed as a potential key beneficiary of such action. It is notable that current Japan REOC NAVs reflect modest cap rate improvements (awaiting transactional evidence of further cap rate compression) and are based on cash flows and valuations that are near cyclical lows. There are
4
Morgan Stanley Institutional Fund, Inc.
Annual Report — December 31, 2013
Investment Overview (unaudited) (cont'd)
International Real Estate Portfolio
expectations for significant upside to asset values from depressed levels due to BOJ actions to spur asset inflation. As a result, within Japan, we remain overweight the Japan REOCs and underweight the J-REITs. The Portfolio was underweight Singapore on relative valuation.
• In Europe, property stocks in the U.K. and on the Continent ended the year trading at a modest premium to NAVs. In the U.K. there are prospects for NAV improvements going forward, whereas on the Continent there is potential downside risk to asset values due to a weak economy and the lack of a downward adjustment to asset values during the recession. Prime assets in London are attracting significant foreign investment demand and there is continued strength in operating fundamentals. The strength of investment demand is also spreading beyond London. Moreover, the U.K. companies have more defensive balance sheets with less refinancing risk, lower leverage ratios and longer average debt maturities than companies on the Continent. Finally, the U.K. continues to have a better macroeconomic outlook than the eurozone. As a result, we believe the valuations for the U.K. companies are more attractive relative to the prevailing valuations on the Continent, and within Europe we remain overweight the U.K.
• Western markets (and Japan) continue to recover from significant declines in rents and occupancies. The outlook is for a continued recovery in operating fundamentals as economic growth improves and supply remains largely subdued. In Europe, there are easing concerns regarding economic weakness and London continues to show strength. Key Asian markets (Hong Kong and Singapore) feature low vacancy levels and landlords are experiencing increased rents on tenant expirations.
• We continue to maintain a strong conviction to our long-term, value-oriented, bottom-up stock selection driven investment strategy, which is focused on investing in publicly traded real estate securities that offer exposure to the direct property markets at the best value relative to underlying real estate values and NAV growth prospects.
* Minimum Investment for Class I shares
In accordance with SEC regulations, Portfolio's performance shown assumes that all recurring fees (including management fees) were deducted and all dividends and distributions were reinvested. The performance of Class A+, H, L and IS shares will vary from Class I shares based upon their different inception dates and will be negatively impacted by additional fees assessed to those classes (if applicable).
5
Morgan Stanley Institutional Fund, Inc.
Annual Report — December 31, 2013
Investment Overview (unaudited) (cont'd)
International Real Estate Portfolio
Performance Compared to the FTSE EPRA/NAREIT Developed ex-North America Real Estate — Net Total Return Index(1) and the Morgan Stanley Capital International (MSCI) EAFE Index(2)
| | | Period Ended December 31, 2013
Total Returns(3) | |
| | | | | Average Annual | |
| | | One
Year | | Five
Years | | Ten
Years | | Since
Inception(7) | |
Portfolio — Class I Shares
w/o sales charges(4) | | | 5.56 | % | | | 14.34 | % | | | 7.92 | % | | | 8.77 | % | |
FTSE EPRA/NAREIT Developed
ex-North America Real Estate —
Net Total Return Index | | | 7.45 | | | | 15.13 | | | | 9.04 | | | | 6.56 | | |
MSCI EAFE Index | | | 22.78 | | | | 12.44 | | | | 6.91 | | | | 4.81 | | |
Portfolio — Class A+ Shares
w/o sales charges(4) | | | 5.28 | | | | 14.03 | | | | 7.65 | | | | 8.50 | | |
Portfolio — Class A+ Shares with
maximum 5.25% sales charges(4) | | | -0.27 | | | | 12.80 | | | | 7.07 | | | | 8.14 | | |
FTSE EPRA/NAREIT Developed
ex-North America Real Estate —
Net Total Return Index | | | 7.45 | | | | 15.13 | | | | 9.04 | | | | 6.56 | | |
MSCI EAFE Index | | | 22.78 | | | | 12.44 | | | | 6.91 | | | | 4.81 | | |
Portfolio — Class H Shares
w/o sales charges(5) | | | 5.27 | | | | — | | | | — | | | | 15.87 | | |
Portfolio — Class H Shares with
maximum 4.75% sales charges(5) | | | 0.29 | | | | — | | | | — | | | | 12.58 | | |
FTSE EPRA/NAREIT Developed
ex-North America Real Estate —
Net Total Return Index | | | 7.45 | | | | — | | | | — | | | | 16.61 | | |
MSCI EAFE Index | | | 22.78 | | | | — | | | | — | | | | 18.06 | | |
Portfolio — Class L Shares
w/o sales charges(5) | | | 4.73 | | | | — | | | | — | | | | 15.30 | | |
FTSE EPRA/NAREIT Developed
ex-North America Real Estate —
Net Total Return Index | | | 7.45 | | | | — | | | | — | | | | 16.61 | | |
MSCI EAFE Index | | | 22.78 | | | | — | | | | — | | | | 18.06 | | |
Portfolio — Class IS Shares
w/o sales charges(6) | | | — | | | | — | | | | — | | | | 1.68 | | |
FTSE EPRA/NAREIT Developed
ex-North America Real Estate —
Net Total Return Index | | | — | | | | — | | | | — | | | | 2.80 | | |
MSCI EAFE Index | | | — | | | | — | | | | — | | | | 7.78 | | |
Performance data quoted represents past performance, which is no guarantee of future results, and current performance may be lower or higher than the figures shown. Performance assumes that all dividends and distributions, if any, were reinvested. For the most recent month-end performance figures, please visit www.morganstanley.com/im. Investment return and principal value will fluctuate so that Portfolio shares, when redeemed, may be worth more or less than their original cost. Total returns do not reflect the deduction of taxes that a shareholder would pay on Portfolio distributions or the redemption of Portfolio shares. Returns for periods less than one year are not annualized. Performance of share classes will vary due to difference in expenses.
+ Effective September 9, 2013, Class P shares were renamed Class A shares.
(1) The FTSE EPRA/NAREIT Developed ex-North America Real Estate — Net Total Return Index is a free float-adjusted market capitalization weighted index designed to reflect the stock performance of companies engaged in the European and Asian real estate markets. The performance of the Index is listed in U.S. dollars and assumes reinvestment of dividends. "Net Total Return" reflects a reduction in total returns after taking into account the withholding tax on dividends by certain foreign countries represented in the Index for periods after 2/18/05 (gross returns used prior to 2/18/05). The Index is unmanaged and its returns do not include any sales charges or fees. Such costs would lower performance. It is not possible to invest directly in an index.
(2) The Morgan Stanley Capital International (MSCI) EAFE Index (Europe, Australasia, Far East) is a free float-adjusted market capitalization index that is designed to measure the international equity market performance of developed markets, excluding the US & Canada. The term "free float" represents the portion of shares outstanding that are deemed to be available for purchase in the public equity markets by investors. The MSCI EAFE Index currently consists of 21 developed market country indices. The performance of the Index is listed in U.S. dollars and assumes reinvestment of net dividends. The Index is unmanaged and its returns do not include any sales charges or fees. Such costs would lower performance. It is not possible to invest directly in an index.
(3) Total returns for the Portfolio reflect fees waived and expenses reimbursed, if applicable, by the Adviser. Without such waivers and reimbursements, total returns would have been lower. The fee waivers and/or expense reimbursements will continue for at least one year or until such time as the Fund's Board of Directors acts to discontinue all or a portion of such waivers and/or expense reimbursements when it deems that such action is appropriate.
(4) Commenced operations on October 1, 1997.
(5) Commenced offering on April 27, 2012.
(6) Commenced offering on September 13, 2013.
(7) For comparative purposes, average annual since inception returns listed for the Indexes refer to the inception date or initial offering of the respective share class of the Portfolio, not the inception of the Index. Returns for periods less than one year are not annualized.
Portfolio Composition
Classification | | Percentage of
Total Investments | |
Diversified | | | 55.6 | % | |
Retail | | | 22.2 | | |
Office | | | 13.1 | | |
Other* | | | 9.1 | | |
Total Investments | | | 100.0 | % | |
* Industries and/or investment types representing less than 5% of total investments.
6
Morgan Stanley Institutional Fund, Inc.
Annual Report — December 31, 2013
Portfolio of Investments
International Real Estate Portfolio
| | | Shares | | Value
(000) | |
Common Stocks (98.7%) | |
Australia (13.3%) | |
CFS Retail Property Trust Group REIT | | | 294,656 | | | $ | 512 | | |
Commonwealth Property Office Fund REIT | | | 693,606 | | | | 771 | | |
Dexus Property Group REIT | | | 1,080,456 | | | | 970 | | |
Federation Centres Ltd. REIT | | | 471,806 | | | | 986 | | |
Goodman Group REIT | | | 528,254 | | | | 2,231 | | |
GPT Group REIT | | | 528,664 | | | | 1,605 | | |
Investa Office Fund REIT | | | 50,992 | | | | 142 | | |
Mirvac Group REIT | | | 899,275 | | | | 1,349 | | |
Stockland REIT | | | 472,274 | | | | 1,522 | | |
Westfield Group REIT | | | 597,381 | | | | 5,382 | | |
Westfield Retail Trust REIT | | | 856,282 | | | | 2,271 | | |
| | | | 17,741 | | |
Austria (0.3%) | |
Atrium European Real Estate Ltd. (a) | | | 70,343 | | | | 405 | | |
Belgium (0.1%) | |
Cofinimmo REIT | | | 1,082 | | | | 134 | | |
China (2.2%) | |
Agile Property Holdings Ltd. (b) | | | 174,000 | | | | 186 | | |
China Overseas Land & Investment Ltd. (b) | | | 114,000 | | | | 320 | | |
China Resources Land Ltd. (b) | | | 563,000 | | | | 1,395 | | |
Country Garden Holdings Co., Ltd. (b) | | | 765,145 | | | | 462 | | |
Guangzhou R&F Properties Co., Ltd. H Shares (b) | | | 132,400 | | | | 194 | | |
Longfor Properties Co., Ltd. (b) | | | 70,500 | | | | 99 | | |
Shimao Property Holdings Ltd. (b) | | | 106,000 | | | | 244 | | |
| | | | 2,900 | | |
Finland (0.4%) | |
Sponda Oyj | | | 102,197 | | | | 481 | | |
France (6.8%) | |
Altarea REIT | | | 641 | | | | 113 | | |
Fonciere Des Regions REIT | | | 8,309 | | | | 717 | | |
Gecina SA REIT | | | 3,417 | | | | 451 | | |
ICADE REIT | | | 11,301 | | | | 1,052 | | |
Klepierre REIT | | | 13,546 | | | | 628 | | |
Mercialys SA REIT | | | 27,301 | | | | 573 | | |
Unibail-Rodamco SE REIT | | | 21,860 | | | | 5,601 | | |
| | | | 9,135 | | |
Germany (2.4%) | |
Alstria Office AG REIT (a) | | | 20,937 | | | | 264 | | |
Deutsche Annington Immobilien SE (a) | | | 13,055 | | | | 323 | | |
Deutsche Euroshop AG | | | 10,354 | | | | 453 | | |
Deutsche Wohnen AG | | | 29,588 | | | | 571 | | |
Deutsche Wohnen AG (a) | | | 8,626 | | | | 160 | | |
LEG Immobilien AG (a) | | | 21,441 | | | | 1,267 | | |
Prime Office AG REIT (a) | | | 49,322 | | | | 210 | | |
| | | | 3,248 | | |
Hong Kong (22.1%) | |
Hang Lung Properties Ltd. | | | 248,000 | | | | 784 | | |
Henderson Land Development Co., Ltd. | | | 156,271 | | | | 892 | | |
Hongkong Land Holdings Ltd. | | | 697,000 | | | | 4,112 | | |
| | | Shares | | Value
(000) | |
Hysan Development Co., Ltd. | | | 564,836 | | | $ | 2,433 | | |
Kerry Properties Ltd. | | | 296,771 | | | | 1,029 | | |
Link REIT (The) | | | 752,895 | | | | 3,651 | | |
New World Development Co., Ltd. | | | 1,391,672 | | | | 1,757 | | |
Sino Land Co., Ltd. | | | 628,224 | | | | 859 | | |
Sun Hung Kai Properties Ltd. | | | 765,703 | | | | 9,712 | | |
Swire Properties Ltd. | | | 389,100 | | | | 983 | | |
Wharf Holdings Ltd. | | | 427,117 | | | | 3,266 | | |
| | | | 29,478 | | |
Italy (0.3%) | |
Beni Stabili SpA REIT | | | 624,506 | | | | 421 | | |
Japan (27.5%) | |
Activia Properties, Inc. REIT | | | 90 | | | | 708 | | |
Hulic Co., Ltd. | | | 57,100 | | | | 843 | | |
Japan Real Estate Investment Corp. REIT | | | 352 | | | | 1,885 | | |
Japan Retail Fund Investment Corp. REIT | | | 463 | | | | 942 | | |
Mitsubishi Estate Co., Ltd. | | | 349,000 | | | | 10,422 | | |
Mitsui Fudosan Co., Ltd. | | | 258,000 | | | | 9,273 | | |
Nippon Building Fund, Inc. REIT | | | 346 | | | | 2,011 | | |
Nippon Prologis, Inc. REIT | | | 97 | | | | 927 | | |
Nomura Real Estate Holdings, Inc. | | | 7,900 | | | | 178 | | |
NTT Urban Development Corp. | | | 3,600 | | | | 41 | | |
Sumitomo Realty & Development Co., Ltd. | | | 160,000 | | | | 7,946 | | |
Tokyo Tatemono Co., Ltd. | | | 84,000 | | | | 932 | | |
United Urban Investment Corp. REIT | | | 380 | | | | 546 | | |
| | | | 36,654 | | |
Malta (0.0%) | |
BGP Holdings PLC (a)(c)(d) | | | 4,769,371 | | | | — | | |
Netherlands (1.4%) | |
Corio N.V. REIT | | | 17,741 | | | | 795 | | |
Eurocommercial Properties N.V. CVA REIT | | | 12,921 | | | | 548 | | |
Vastned Retail N.V. REIT | | | 3,243 | | | | 147 | | |
Wereldhave N.V. REIT | | | 5,591 | | | | 440 | | |
| | | | 1,930 | | |
Norway (0.3%) | |
Norwegian Property ASA | | | 382,713 | | | | 459 | | |
Singapore (5.9%) | |
Ascendas Real Estate Investment Trust REIT | | | 310,000 | | | | 540 | | |
CapitaCommercial Trust REIT | | | 371,000 | | | | 426 | | |
CapitaLand Ltd. | | | 638,000 | | | | 1,532 | | |
CapitaMall Trust REIT | | | 487,000 | | | | 735 | | |
CapitaMalls Asia Ltd. | | | 218,000 | | | | 339 | | |
City Developments Ltd. | | | 91,000 | | | | 692 | | |
Global Logistic Properties Ltd. | | | 471,000 | | | | 1,079 | | |
Keppel REIT | | | 511,000 | | | | 480 | | |
Mapletree Commercial Trust REIT | | | 165,440 | | | | 156 | | |
SPH REIT (a) | | | 784,000 | | | | 609 | | |
Suntec REIT | | | 392,000 | | | | 478 | | |
UOL Group Ltd. | | | 170,000 | | | | 834 | | |
| | | | 7,900 | | |
The accompanying notes are an integral part of the financial statements.
7
Morgan Stanley Institutional Fund, Inc.
Annual Report — December 31, 2013
Portfolio of Investments (cont'd)
International Real Estate Portfolio
| | | Shares | | Value
(000) | |
Sweden (1.4%) | |
Atrium Ljungberg AB, Class B | | | 25,949 | | | $ | 355 | | |
Castellum AB | | | 23,017 | | | | 358 | | |
Fabege AB | | | 10,861 | | | | 130 | | |
Hufvudstaden AB, Class A | | | 80,929 | | | | 1,084 | | |
| | | | 1,927 | | |
Switzerland (1.9%) | |
Mobimo Holding AG (Registered) (a) | | | 1,080 | | | | 225 | | |
PSP Swiss Property AG (Registered) (a) | | | 20,202 | | | | 1,710 | | |
Swiss Prime Site AG (Registered) (a) | | | 7,622 | | | | 590 | | |
| | | | 2,525 | | |
United Kingdom (12.4%) | |
British Land Co., PLC REIT | | | 305,609 | | | | 3,183 | | |
Capital & Counties Properties PLC | | | 87,910 | | | | 479 | | |
Capital & Regional PLC | | | 527,991 | | | | 385 | | |
Derwent London PLC REIT | | | 25,163 | | | | 1,039 | | |
Grainger PLC | | | 107,099 | | | | 361 | | |
Great Portland Estates PLC REIT | | | 82,248 | | | | 816 | | |
Hammerson PLC REIT | | | 263,647 | | | | 2,192 | | |
Intu Properties PLC REIT | | | 196,318 | | | | 1,007 | | |
Land Securities Group PLC REIT | | | 213,148 | | | | 3,401 | | |
LXB Retail Properties PLC (a) | | | 444,872 | | | | 942 | | |
Quintain Estates & Development PLC (a) | | | 232,389 | | | | 364 | | |
Safestore Holdings PLC REIT | | | 316,537 | | | | 844 | | |
Segro PLC REIT | | | 75,338 | | | | 417 | | |
Shaftesbury PLC REIT | | | 49,406 | | | | 513 | | |
ST Modwen Properties PLC | | | 28,617 | | | | 174 | | |
Unite Group PLC | | | 61,024 | | | | 407 | | |
| | | | 16,524 | | |
Total Common Stocks (Cost $167,744) | | | 131,862 | | |
Short-Term Investment (1.3%) | |
Investment Company (1.3%) | |
Morgan Stanley Institutional Liquidity
Funds — Treasury Portfolio —
Institutional Class (See Note G)
(Cost $1,717) | | | 1,717,352 | | | | 1,717 | | |
Total Investments (100.0%) (Cost $169,461) | | | 133,579 | | |
Liabilities in Excess of Other Assets (0.0%) (e) | | | (31 | ) | |
Net Assets (100.0%) | | $ | 133,548 | | |
(a) Non-income producing security.
(b) Security trades on the Hong Kong exchange.
(c) At December 31, 2013, the Portfolio held a fair valued securitiy valued at $0, representing 0.0% of net assets. This securitiy has been fair valued as determined in good faith under procedures established by and under the general supervision of the Fund's Directors.
(d) Security has been deemed illiquid at December 31, 2013.
(e) Amount is less than 0.05%.
CVA Certificaten Van Aandelen.
REIT Real Estate Investment Trust.
The accompanying notes are an integral part of the financial statements.
8
Morgan Stanley Institutional Fund, Inc.
Annual Report — December 31, 2013
International Real Estate Portfolio
Statement of Assets and Liabilities | | December 31, 2013
(000) | |
Assets: | |
Investments in Securities of Unaffiliated Issuers, at Value (Cost $167,744) | | $ | 131,862 | | |
Investment in Security of Affiliated Issuer, at Value (Cost $1,717) | | | 1,717 | | |
Total Investments in Securities, at Value (Cost $169,461) | | | 133,579 | | |
Foreign Currency, at Value (Cost $58) | | | 59 | | |
Dividends Receivable | | | 246 | | |
Receivable for Investments Sold | | | 146 | | |
Tax Reclaim Receivable | | | 39 | | |
Receivable for Portfolio Shares Sold | | | 8 | | |
Receivable from Affiliate | | | — | @ | |
Other Assets | | | 8 | | |
Total Assets | | | 134,085 | | |
Liabilities: | |
Payable for Advisory Fees | | | 173 | | |
Payable for Investments Purchased | | | 148 | | |
Payable for Portfolio Shares Redeemed | | | 118 | | |
Payable for Sub Transfer Agency Fees | | | 25 | | |
Payable for Sub Transfer Agency Fees — Class I | | | 12 | | |
Payable for Sub Transfer Agency Fees — Class A* | | | 2 | | |
Payable for Custodian Fees | | | 23 | | |
Payable for Administration Fees | | | 9 | | |
Payable for Professional Fees | | | 8 | | |
Payable for Transfer Agent Fees | | | — | @ | |
Payable for Transfer Agent Fees — Class I | | | 1 | | |
Payable for Transfer Agent Fees — Class A* | | | — | @ | |
Payable for Transfer Agent Fees — Class L | | | — | @ | |
Payable for Transfer Agent Fees — Class IS | | | — | @ | |
Payable for Directors' Fees and Expenses | | | 1 | | |
Payable for Shareholder Services Fees — Class A* | | | 1 | | |
Payable for Distribution and Shareholder Services Fees — Class L | | | — | @ | |
Other Liabilities | | | 16 | | |
Total Liabilities | | | 537 | | |
Net Assets | | $ | 133,548 | | |
Net Assets Consist Of: | |
Paid-in-Capital | | $ | 746,055 | | |
Distributions in Excess of Net Investment Income | | | (99 | ) | |
Accumulated Net Realized Loss | | | (576,529 | ) | |
Unrealized Appreciation (Depreciation) on: | |
Investments | | | (35,882 | ) | |
Foreign Currency Translations | | | 3 | | |
Net Assets | | $ | 133,548 | | |
The accompanying notes are an integral part of the financial statements.
9
Morgan Stanley Institutional Fund, Inc.
Annual Report — December 31, 2013
International Real Estate Portfolio
Statement of Assets and Liabilities (cont'd) | | December 31, 2013
(000) | |
CLASS I: | |
Net Assets | | $ | 130,023 | | |
| Shares Outstanding $0.001 par value shares of beneficial interest (500,000,000 shares authorized) (not in 000's) | | | 6,505,353 | | |
Net Asset Value, Offering and Redemption Price Per Share | | $ | 19.99 | | |
CLASS A*: | |
Net Assets | | $ | 3,331 | | |
| Shares Outstanding $0.001 par value shares of beneficial interest (500,000,000 shares authorized) (not in 000's) | | | 166,713 | | |
Net Asset Value, Redemption Price Per Share | | $ | 19.98 | | |
Maximum Sales Load§§ | | | 5.25 | % | |
Maximum Sales Charge | | $ | 1.11 | | |
Maximum Offering Price Per Share | | $ | 21.09 | | |
CLASS H: | |
Net Assets | | $ | 111 | | |
| Shares Outstanding $0.001 par value shares of beneficial interest (500,000,000 shares authorized) (not in 000's) | | | 5,583 | | |
Net Asset Value, Redemption Price Per Share | | $ | 19.95 | | |
Maximum Sales Load | | | 4.75 | % | |
Maximum Sales Charge | | $ | 0.99 | | |
Maximum Offering Price Per Share | | $ | 20.94 | | |
CLASS L: | |
Net Assets | | $ | 73 | | |
| Shares Outstanding $0.001 par value shares of beneficial interest (500,000,000 shares authorized) (not in 000's) | | | 3,655 | | |
Net Asset Value, Offering and Redemption Price Per Share | | $ | 19.86 | | |
CLASS IS: | |
Net Assets | | $ | 10 | | |
| Shares Outstanding $0.001 par value shares of beneficial interest (500,000,000 shares authorized) (not in 000's) | | | 501 | | |
Net Asset Value, Offering and Redemption Price Per Share | | $ | 19.99 | | |
* Effective September 9, 2013, Class P shares were renamed Class A shares.
@ Amount is less than $500.
§§ Effective February 25, 2013, the Directors approved the imposition of a maximum initial sales charge of 5.25% on purchases of Class A shares of the Portfolio.
The accompanying notes are an integral part of the financial statements.
10
Morgan Stanley Institutional Fund, Inc.
Annual Report — December 31, 2013
International Real Estate Portfolio
Statement of Operations | | Year Ended
December 31, 2013
(000) | |
Investment Income: | |
Dividends from Securities of Unaffiliated Issuers (Net of $270 of Foreign Taxes Withheld) | | $ | 4,048 | | |
Interest from Securities of Unaffiliated Issuers | | | 8 | | |
Dividends from Security of Affiliated Issuer (Note G) | | | 1 | | |
Total Investment Income | | | 4,057 | | |
Expenses: | |
Advisory Fees (Note B) | | | 1,084 | | |
Custodian Fees (Note F) | | | 133 | | |
Professional Fees | | | 110 | | |
Administration Fees (Note C) | | | 108 | | |
Sub Transfer Agency Fees | | | 52 | | |
Sub Transfer Agency Fees — Class I | | | 15 | | |
Sub Transfer Agency Fees — Class A* | | | 2 | | |
Sub Transfer Agency Fees — Class H | | | — | @ | |
Registration Fees | | | 66 | | |
Shareholder Reporting Fees | | | 46 | | |
Transfer Agency Fees (Note E) | | | 15 | | |
Transfer Agency Fees — Class I (Note E) | | | 1 | | |
Transfer Agency Fees — Class A* (Note E) | | | 1 | | |
Transfer Agency Fees — Class H (Note E) | | | — | @ | |
Transfer Agency Fees — Class L (Note E) | | | — | @ | |
Pricing Fees | | | 11 | | |
Shareholder Services Fees — Class A* (Note D) | | | 10 | | |
Distribution and Shareholder Services Fees — Class L (Note D) | | | — | @ | |
Directors' Fees and Expenses | | | 4 | | |
Other Expenses | | | 21 | | |
Total Expenses | | | 1,679 | | |
Waiver of Advisory Fees (Note B) | | | (307 | ) | |
Reimbursement of Class Specific Expenses — Class I (Note B) | | | (5 | ) | |
Reimbursement of Class Specific Expenses — Class A* (Note B) | | | (1 | ) | |
Reimbursement of Class Specific Expenses — Class L (Note B) | | | (— | @) | |
Reimbursement of Class Specific Expenses — Class IS (Note B) | | | (— | @) | |
Rebate from Morgan Stanley Affiliate (Note G) | | | (3 | ) | |
Net Expenses | | | 1,363 | | |
Net Investment Income | | | 2,694 | | |
Realized Loss: | |
Investments Sold | | | (15,747 | ) | |
Foreign Currency Transactions | | | (55 | ) | |
Net Realized Loss | | | (15,802 | ) | |
Change in Unrealized Appreciation (Depreciation): | |
Investments | | | 20,479 | | |
Foreign Currency Translations | | | (1 | ) | |
Net Change in Unrealized Appreciation (Depreciation) | | | 20,478 | | |
Net Realized Loss and Change in Unrealized Appreciation (Depreciation) | | | 4,676 | | |
Net Increase in Net Assets Resulting from Operations | | $ | 7,370 | | |
* Effective September 9, 2013, Class P shares were renamed Class A shares.
@ Amount is less than $500.
The accompanying notes are an integral part of the financial statements.
11
Morgan Stanley Institutional Fund, Inc.
Annual Report — December 31, 2013
International Real Estate Portfolio
Statements of Changes in Net Assets | | Year Ended
December 31,
2013
(000) | | Year Ended
December 31,
2012
(000) | |
Increase (Decrease) in Net Assets: | |
Operations: | |
Net Investment Income | | $ | 2,694 | | | $ | 4,386 | | |
Net Realized Loss | | | (15,802 | ) | | | (75,581 | ) | |
Net Change in Unrealized Appreciation (Depreciation) | | | 20,478 | | | | 137,155 | | |
Net Increase in Net Assets Resulting from Operations | | | 7,370 | | | | 65,960 | | |
Distributions from and/or in Excess of: | |
Class I: | |
Net Investment Income | | | (7,544 | ) | | | (7,180 | ) | |
Class A*: | |
Net Investment Income | | | (208 | ) | | | (163 | ) | |
Class H: | |
Net Investment Income | | | (6 | ) | | | (— | @) | |
Class L: | |
Net Investment Income | | | (1 | ) | | | (— | @) | |
Class IS: | |
Net Investment Income | | | (— | @) | | | — | | |
Total Distributions | | | (7,759 | ) | | | (7,343 | ) | |
Capital Share Transactions:(1) | |
Class I: | |
Subscribed | | | 28,835 | | | | 25,115 | | |
Distributions Reinvested | | | 3,974 | | | | 4,054 | | |
Redeemed | | | (40,869 | ) | | | (155,915 | ) | |
Class A*: | |
Subscribed | | | 1,626 | | | | 437 | | |
Distributions Reinvested | | | 184 | | | | 140 | | |
Redeemed | | | (2,856 | ) | | | (719 | ) | |
Class H: | |
Subscribed | | | 97 | | | | 11 | ** | |
Distributions Reinvested | | | 6 | | | | — | @** | |
Redeemed | | | (1 | ) | | | — | | |
Class L: | |
Subscribed | | | 62 | | | | 10 | ** | |
Distributions Reinvested | | | 1 | | | | — | | |
Class IS: | |
Subscribed | | | 10 | *** | | | — | | |
Net Decrease in Net Assets Resulting from Capital Share Transactions | | | (8,931 | ) | | | (126,867 | ) | |
Redemption Fees | | | 22 | | | | 1 | | |
Total Decrease in Net Assets | | | (9,298 | ) | | | (68,249 | ) | |
Net Assets: | |
Beginning of Period | | | 142,846 | | | | 211,095 | | |
End of Period (Including Undistributed (Distributions in Excess of) Net Investment Income of $(99) and $3,726) | | $ | 133,548 | | | $ | 142,846 | | |
The accompanying notes are an integral part of the financial statements.
12
Morgan Stanley Institutional Fund, Inc.
Annual Report — December 31, 2013
International Real Estate Portfolio
Statements of Changes in Net Assets (cont'd) | | Year Ended
December 31,
2013
(000) | | Year Ended
December 31,
2012
(000) | |
(1) Capital Share Transactions: | |
Class I: | |
Shares Subscribed | | | 1,416 | | | | 1,437 | | |
Shares Issued on Distributions Reinvested | | | 206 | | | | 233 | | |
Shares Redeemed | | | (1,982 | ) | | | (8,974 | ) | |
Net Decrease in Class I Shares Outstanding | | | (360 | ) | | | (7,304 | ) | |
Class A*: | |
Shares Subscribed | | | 78 | | | | 23 | | |
Shares Issued on Distributions Reinvested | | | 10 | | | | 8 | | |
Shares Redeemed | | | (141 | ) | | | (43 | ) | |
Net Decrease in Class A Shares Outstanding | | | (53 | ) | | | (12 | ) | |
Class H: | |
Shares Subscribed | | | 5 | | | | 1 | ** | |
Shares Issued on Distributions Reinvested | | | — | @@ | | | — | @@** | |
Shares Redeemed | | | — | @@ | | | — | | |
Net Increase in Class H Shares Outstanding | | | 5 | | | | 1 | ** | |
Class L: | |
Shares Subscribed | | | 3 | | | | 1 | ** | |
Shares Issued on Distributions Reinvested | | | — | @@ | | | — | | |
Net Increase in Class L Shares Outstanding | | | 3 | | | | 1 | ** | |
Class IS: | |
Shares Subscribed | | | 1 | *** | | | — | | |
@ Amount is less than $500.
@@ Amount is less than 500 shares.
* Effective September 9, 2013, Class P shares were renamed Class A shares.
** For the period April 30, 2012 through December 31, 2012.
*** For the period September 13, 2013 through December 31, 2013.
The accompanying notes are an integral part of the financial statements.
13
Morgan Stanley Institutional Fund, Inc.
Annual Report — December 31, 2013
Financial Highlights
International Real Estate Portfolio
| | | Class I | |
| | | Year Ended December 31, | |
Selected Per Share Data and Ratios | | 2013 | | 2012 | | 2011 | | 2010 | | 2009 | |
Net Asset Value, Beginning of Period | | $ | 20.16 | | | $ | 14.66 | | | $ | 18.85 | | | $ | 17.80 | | | $ | 12.59 | | |
Income (Loss) from Investment Operations: | |
Net Investment Income† | | | 0.41 | | | | 0.44 | | | | 0.39 | | | | 0.69 | | | | 0.44 | | |
Net Realized and Unrealized Gain (Loss) | | | 0.65 | | | | 5.89 | | | | (4.04 | ) | | | 0.98 | | | | 5.40 | | |
Total from Investment Operations | | | 1.06 | | | | 6.33 | | | | (3.65 | ) | | | 1.67 | | | | 5.84 | | |
Distributions from and/or in Excess of: | |
Net Investment Income | | | (1.23 | ) | | | (0.83 | ) | | | (0.54 | ) | | | (0.62 | ) | | | (0.63 | ) | |
Redemption Fees | | | 0.00 | ‡ | | | 0.00 | ‡ | | | 0.00 | ‡ | | | 0.00 | ‡ | | | 0.00 | ‡ | |
Net Asset Value, End of Period | | $ | 19.99 | | | $ | 20.16 | | | $ | 14.66 | | | $ | 18.85 | | | $ | 17.80 | | |
Total Return++ | | | 5.56 | % | | | 44.05 | % | | | (19.92 | )% | | | 9.51 | % | | | 46.54 | % | |
Ratios and Supplemental Data: | |
Net Assets, End of Period (Thousands) | | $ | 130,023 | | | $ | 138,390 | | | $ | 207,695 | | | $ | 397,514 | | | $ | 463,649 | | |
Ratio of Expenses to Average Net Assets (1) | | | 1.00 | %+ | | | 1.00 | %+ | | | 1.00 | %+†† | | | 0.98 | %+†† | | | 0.93 | %+ | |
Ratio of Expenses to Average Net Assets Excluding Non Operating Expenses | | | N/A | | | | N/A | | | | N/A | | | | 0.98 | %+†† | | | 0.93 | %+ | |
Ratio of Net Investment Income to Average Net Assets (1) | | | 2.00 | %+ | | | 2.54 | %+ | | | 2.17 | %+†† | | | 3.97 | %+†† | | | 3.04 | %+ | |
Ratio of Rebate from Morgan Stanley Affiliates to Average Net Assets | | | 0.00 | %§ | | | 0.00 | %§ | | | 0.00 | %††§ | | | 0.00 | %††§ | | | 0.00 | %§ | |
Portfolio Turnover Rate | | | 40 | % | | | 31 | % | | | 18 | % | | | 64 | % | | | 56 | % | |
(1) Supplemental Information on the Ratios to Average Net Assets: | |
Ratios Before Expense Limitation: | |
Expenses to Average Net Assets | | | 1.23 | %+ | | | 1.12 | % | | | N/A | | | | N/A | | | | N/A | | |
Net Investment Income to Average Net Assets | | | 1.76 | %+ | | | 2.42 | % | | | N/A | | | | N/A | | | | N/A | | |
† Per share amount is based on average shares outstanding.
‡ Amount is less than $0.005 per share.
++ Calculated based on the net asset value as of the last business day of the period.
+ The Ratios of Expenses and Net Investment Income reflect the rebate of certain Portfolio expenses in connection with the investments in Morgan Stanley affiliates during the period. The effect of the rebate on the ratios is disclosed in the above table as "Ratio of Rebate from Morgan Stanley Affiliates to Average Net Assets."
†† Reflects overall Portfolio ratios for investment income and non-class specific expenses.
§ Amount is less than 0.005%.
The accompanying notes are an integral part of the financial statements.
14
Morgan Stanley Institutional Fund, Inc.
Annual Report — December 31, 2013
Financial Highlights
International Real Estate Portfolio
| | | Class A@ | |
| | | Year Ended December 31, | |
Selected Per Share Data and Ratios | | 2013 | | 2012 | | 2011 | | 2010 | | 2009 | |
Net Asset Value, Beginning of Period | | $ | 20.14 | | | $ | 14.65 | | | $ | 18.83 | | | $ | 17.77 | | | $ | 12.58 | | |
Income (Loss) from Investment Operations: | |
Net Investment Income† | | | 0.35 | | | | 0.39 | | | | 0.34 | | | | 0.64 | | | | 0.39 | | |
Net Realized and Unrealized Gain (Loss) | | | 0.66 | | | | 5.89 | | | | (4.04 | ) | | | 0.98 | | | | 5.39 | | |
Total from Investment Operations | | | 1.01 | | | | 6.28 | | | | (3.70 | ) | | | 1.62 | | | | 5.78 | | |
Distributions from and/or in Excess of: | |
Net Investment Income | | | (1.17 | ) | | | (0.79 | ) | | | (0.48 | ) | | | (0.56 | ) | | | (0.59 | ) | |
Redemption Fees | | | 0.00 | ‡ | | | 0.00 | ‡ | | | 0.00 | ‡ | | | 0.00 | ‡ | | | 0.00 | ‡ | |
Net Asset Value, End of Period | | $ | 19.98 | | | $ | 20.14 | | | $ | 14.65 | | | $ | 18.83 | | | $ | 17.77 | | |
Total Return++ | | | 5.28 | % | | | 43.71 | % | | | (20.16 | )% | | | 9.26 | % | | | 46.08 | % | |
Ratios and Supplemental Data: | |
Net Assets, End of Period (Thousands) | | $ | 3,331 | | | $ | 4,431 | | | $ | 3,400 | | | $ | 5,547 | | | $ | 8,429 | | |
Ratio of Expenses to Average Net Assets (1) | | | 1.27 | %+^ | | | 1.25 | %+ | | | 1.25 | %+†† | | | 1.23 | %+†† | | | 1.18 | %+ | |
Ratio of Expenses to Average Net Assets Excluding Non Operating Expenses | | | N/A | | | | N/A | | | | N/A | | | | 1.23 | %+†† | | | 1.18 | %+ | |
Ratio of Net Investment Income to Average Net Assets (1) | | | 1.72 | %+ | | | 2.23 | %+ | | | 1.92 | %+†† | | | 3.72 | %+†† | | | 2.74 | %+ | |
Ratio of Rebate from Morgan Stanley Affiliates to Average Net Assets | | | 0.00 | %§ | | | 0.00 | %§ | | | 0.00 | %††§ | | | 0.00 | %††§ | | | 0.00 | %§ | |
Portfolio Turnover Rate | | | 40 | % | | | 31 | % | | | 18 | % | | | 64 | % | | | 56 | % | |
(1) Supplemental Information on the Ratios to Average Net Assets: | |
Ratios Before Expense Limitation: | |
Expenses to Average Net Assets | | | 1.53 | %+ | | | 1.38 | % | | | N/A | | | | N/A | | | | N/A | | |
Net Investment Income to Average Net Assets | | | 1.47 | %+ | | | 2.10 | % | | | N/A | | | | N/A | | | | N/A | | |
@ Effective September 9, 2013, Class P shares were renamed Class A shares.
† Per share amount is based on average shares outstanding.
‡ Amount is less than $0.005 per share.
++ Calculated based on the net asset value which does not reflect sales charges, if applicable, as of the last business day of the period.
+ The Ratios of Expenses and Net Investment Income reflect the rebate of certain Portfolio expenses in connection with the investments in Morgan Stanley affiliates during the period. The effect of the rebate on the ratios is disclosed in the above table as "Ratio of Rebate from Morgan Stanley Affiliates to Average Net Assets."
^ Effective September 16, 2013, the Adviser has agreed to limit the ratio of expenses to average net assets to the maximum ratio of 1.35% for Class A shares. Prior to September 16, 2013, the maximum ratio was 1.25% for Class A shares.
†† Reflects overall Portfolio ratios for investment income and non-class specific expenses.
§ Amount is less than 0.005%.
The accompanying notes are an integral part of the financial statements.
15
Morgan Stanley Institutional Fund, Inc.
Annual Report — December 31, 2013
Financial Highlights
International Real Estate Portfolio
| | | Class H | |
Selected Per Share Data and Ratios | | Year Ended
December 31,
2013 | | Period from
April 27, 2012^ to
December 31, 2012 | |
Net Asset Value, Beginning of Period | | $ | 20.13 | | | $ | 17.31 | | |
Income from Investment Operations: | |
Net Investment Income† | | | 0.37 | | | | 0.22 | | |
Net Realized and Unrealized Gain | | | 0.63 | | | | 3.40 | | |
Total from Investment Operations | | | 1.00 | | | | 3.62 | | |
Distributions from and/or in Excess of: | |
Net Investment Income | | | (1.18 | ) | | | (0.80 | ) | |
Net Asset Value, End of Period | | $ | 19.95 | | | $ | 20.13 | | |
Total Return++ | | | 5.27 | % | | | 21.66 | %# | |
Ratios and Supplemental Data: | |
Net Assets, End of Period (Thousands) | | $ | 111 | | | $ | 13 | | |
Ratio of Expenses to Average Net Assets (1) | | | 1.28 | %+^^ | | | 1.25 | %+* | |
Ratio of Net Investment Income to Average Net Assets (1) | | | 1.83 | %+ | | | 1.85 | %+* | |
Ratio of Rebate from Morgan Stanley Affiliates to Average Net Assets | | | 0.00 | %§ | | | 0.00 | %§* | |
Portfolio Turnover Rate | | | 40 | % | | | 31 | %# | |
(1) Supplemental Information on the Ratios to Average Net Assets: | |
Ratios Before Expense Limitation: | |
Expenses to Average Net Assets | | | 1.92 | %+ | | | 1.43 | %* | |
Net Investment Income to Average Net Assets | | | 1.20 | %+ | | | 1.67 | %* | |
^ Commencement of Operations.
† Per share amount is based on average shares outstanding.
++ Calculated based on the net asset value which does not reflect sales charges, if applicable, as of the last business day of the period.
+ The Ratios of Expenses and Net Investment Income reflect the rebate of certain Portfolio expenses in connection with the investments in Morgan Stanley affiliates during the period. The effect of the rebate on the ratios is disclosed in the above table as "Ratio of Rebate from Morgan Stanley Affiliates to Average Net Assets."
^^ Effective September 16, 2013, the Adviser has agreed to limit the ratio of expenses to average net assets to the maximum ratio of 1.35% for Class H shares. Prior to September 16, 2013, the maximum ratio was 1.25% for Class H shares.
§ Amount is less than 0.005%.
# Not Annualized.
* Annualized.
The accompanying notes are an integral part of the financial statements.
16
Morgan Stanley Institutional Fund, Inc.
Annual Report — December 31, 2013
Financial Highlights
International Real Estate Portfolio
| | | Class L | |
Selected Per Share Data and Ratios | | Year Ended
December 31,
2013 | | Period from
April 27, 2012^ to
December 31, 2012 | |
Net Asset Value, Beginning of Period | | $ | 20.13 | | | $ | 17.31 | | |
Income from Investment Operations: | |
Net Investment Income† | | | 0.22 | | | | 0.16 | | |
Net Realized and Unrealized Gain | | | 0.68 | | | | 3.40 | | |
Total from Investment Operations | | | 0.90 | | | | 3.56 | | |
Distributions from and/or in Excess of: | |
Net Investment Income | | | (1.17 | ) | | | (0.74 | ) | |
Net Asset Value, End of Period | | $ | 19.86 | | | $ | 20.13 | | |
Total Return++ | | | 4.73 | % | | | 21.28 | %# | |
Ratios and Supplemental Data: | |
Net Assets, End of Period (Thousands) | | $ | 73 | | | $ | 12 | | |
Ratio of Expenses to Average Net Assets (1) | | | 1.81 | %+^^ | | | 1.75 | %*+ | |
Ratio of Net Investment Income to Average Net Assets (1) | | | 1.08 | %+ | | | 1.37 | %*+ | |
Ratio of Rebate from Morgan Stanley Affiliates to Average Net Assets | | | 0.00 | %§ | | | 0.00 | %§* | |
Portfolio Turnover Rate | | | 40 | % | | | 31 | %# | |
(1) Supplemental Information on the Ratios to Average Net Assets: | |
Ratios Before Expense Limitation: | |
Expenses to Average Net Assets | | | 3.44 | %+ | | | 1.93 | %* | |
Net Investment Income (Loss) to Average Net Assets | | | (0.55 | )%+ | | | 1.19 | %* | |
^ Commencement of Operations.
† Per share amount is based on average shares outstanding.
++ Calculated based on the net asset value as of the last business day of the period.
+ The Ratios of Expenses and Net Investment Income reflect the rebate of certain Portfolio expenses in connection with the investments in Morgan Stanley affiliates during the period. The effect of the rebate on the ratios is disclosed in the above table as "Ratio of Rebate from Morgan Stanley Affiliates to Average Net Assets."
^^ Effective September 16, 2013, the Adviser has agreed to limit the ratio of expenses to average net assets to the maximum ratio of 1.85% for Class L shares. Prior to September 16, 2013, the maximum ratio was 1.75% for Class L shares.
§ Amount is less than 0.005%.
# Not Annualized.
* Annualized.
The accompanying notes are an integral part of the financial statements.
17
Morgan Stanley Institutional Fund, Inc.
Annual Report — December 31, 2013
Financial Highlights
International Real Estate Portfolio
| | | Class IS | |
Selected Per Share Data and Ratios | | Period from
September 13, 2013^ to
December 31, 2013 | |
Net Asset Value, Beginning of Period | | $ | 19.97 | | |
Income from Investment Operations: | |
Net Investment Income† | | | 0.11 | | |
Net Realized and Unrealized Gain | | | 0.22 | | |
Total from Investment Operations | | | 0.33 | | |
Distributions from and/or in Excess of: | |
Net Investment Income | | | (0.31 | ) | |
Net Asset Value, End of Period | | $ | 19.99 | | |
Total Return++ | | | 1.68 | %# | |
Ratios and Supplemental Data: | |
Net Assets, End of Period (Thousands) | | $ | 10 | | |
Ratio of Expenses to Average Net Assets (1) | | | 0.97 | %+^^* | |
Ratio of Net Investment Income to Average Net Assets (1) | | | 1.76 | %+* | |
Ratio of Rebate from Morgan Stanley Affiliates to Average Net Assets | | | 0.00 | %§* | |
Portfolio Turnover Rate | | | 40 | %# | |
(1) Supplemental Information on the Ratios to Average Net Assets: | |
Ratios Before Expense Limitation | |
Expenses to Average Net Assets | | | 6.46 | %* | |
Net Investment Loss to Average Net Assets | | | (3.73 | )%* | |
^ Commencement of Operations.
† Per share amount is based on average shares outstanding.
‡ Amount is less than $0.005 per share.
++ Calculated based on the net asset value as of the last business day of the period.
+ The Ratios of Expenses and Net Investment Income reflect the rebate of certain Portfolio expenses in connection with the investments in Morgan Stanley affiliates during the period. The effect of the rebate on the ratios is disclosed in the above table as "Ratio of Rebate from Morgan Stanley Affiliates to Average Net Assets."
^^ Effective September 16, 2013, the Adviser has agreed to limit the ratio of expenses to average net assets to the maximum ratio of 0.97% for Class IS shares.
§ Amount is less than 0.005%.
# Not Annualized.
* Annualized.
The accompanying notes are an integral part of the financial statements.
18
Morgan Stanley Institutional Fund, Inc.
Annual Report — December 31, 2013
Notes to Financial Statements
Morgan Stanley Institutional Fund, Inc. (the "Fund") is registered under the Investment Company Act of 1940, as amended (the "Act"), as an open-end management investment company. The Fund is comprised of twenty-seven separate, active, diversified and non-diversified portfolios (individually referred to as a "Portfolio", collectively as the "Portfolios").
The accompanying financial statements relate to the International Real Estate Portfolio. The Portfolio's adviser, Morgan Stanley Investment Management Inc. (the "Adviser") and sub-advisers, Morgan Stanley Investment Management Limited ("MSIM Limited") and Morgan Stanley Investment Management Company ("MSIM Company") (together, the "Sub-Advisers"), seek a combination of current income and long-term capital appreciation by investing primarily in equity securities of companies in the real estate industry located throughout the world (excluding the United States and Canada). The Portfolio offers five classes of shares — Class I, Class A, Class H, Class L and Class IS.
Effective August 16, 2013, Class H shares were closed to all future investments. Effective September 9, 2013, Class P shares were renamed Class A shares.
A. Significant Accounting Policies: The following significant accounting policies are in conformity with U.S. generally accepted accounting principles ("GAAP"). Such policies are consistently followed by the Fund in the preparation of its financial statements. GAAP may require management to make estimates and assumptions that affect the reported amounts and disclosures in the financial statements. Actual results may differ from those estimates.
1. Security Valuation: (1) An equity portfolio security listed or traded on an exchange is valued at its latest reported sales price (or at the exchange official closing price if such exchange reports an official closing price), if there were no sales on a given day, the security is valued at the mean between the last reported bid and asked prices; (2) all other equity portfolio securities for which over-the-counter market quotations are readily available are valued at its latest reported sales price. In cases where a security is traded on more than one exchange, the security is valued on the exchange designated as the primary market; (3) when market quotations are not readily available, including circumstances under which the Adviser determines that the closing price, last sale price or the mean between the last reported bid and asked prices are not reflective of a security's market value, portfolio securities are valued at
their fair value as determined in good faith under procedures established by and under the general supervision of the Fund's Board of Directors (the "Directors"). Occasionally, developments affecting the closing prices of securities and other assets may occur between the times at which valuations of such securities are determined (that is, close of the foreign market on which the securities trade) and the close of business of the New York Stock Exchange ("NYSE"). If developments occur during such periods that are expected to materially affect the value of such securities, such valuations may be adjusted to reflect the estimated fair value of such securities as of the close of the NYSE, as determined in good faith by the Directors or by the Adviser using a pricing service and/or procedures approved by the Directors; (4) quotations of foreign portfolio securities, other assets and liabilities and forward contracts stated in foreign currency are translated into U.S. dollar equivalents at the prevailing market rates prior to the close of the NYSE; (5) investments in mutual funds, including the Morgan Stanley Institutional Liquidity Funds, are valued at the net asset value as of the close of each business day; and (6) short-term debt securities with remaining maturities of 60 days or less at the time of purchase may be valued at amortized cost, unless the Adviser determines such valuation does not reflect the securities' market value, in which case these securities will be valued at their fair market value determined by the Adviser.
Under procedures approved by the Directors, the Fund's Adviser has formed a Valuation Committee. The Valuation Committee provides administration and oversight of the Fund's valuation policies and procedures, which are reviewed at least annually by the Directors. These procedures allow the Fund to utilize independent pricing services, quotations from securities and financial instrument dealers, and other market sources to determine fair value.
The Fund has procedures to determine the fair value of securities and other financial instruments for which market prices are not readily available. Under these procedures, the Valuation Committee convenes on a regular and ad hoc basis to review such securities and considers a number of factors, including valuation methodologies and significant unobservable valuation inputs, when arriving at fair value. The Valuation Committee may employ a market-based approach which may use related or comparable assets or liabilities, recent transactions,
19
Morgan Stanley Institutional Fund, Inc.
Annual Report — December 31, 2013
Notes to Financial Statements (cont'd)
market multiples, book values, and other relevant information for the investment to determine the fair value of the investment. An income-based valuation approach may also be used in which the anticipated future cash flows of the investment are discounted to calculate fair value. Discounts may also be applied due to the nature or duration of any restrictions on the disposition of the investments. Due to the inherent uncertainty of valuations of such investments, the fair values may differ significantly from the values that would have been used had an active market existed. The Valuation Committee employs various methods for calibrating these valuation approaches including a regular review of valuation methodologies, key inputs and assumptions, transactional back-testing or disposition analysis, and reviews of any related market activity.
The Portfolio invests a significant portion of its assets in securities of real estate investment trusts ("REITs"). The market's perception of prospective declines in private real estate values and other financial assets may result in increased volatility of market prices that can negatively impact the valuation of certain issuers held by the Portfolio.
2. Fair Value Measurement: Financial Accounting Standards Board ("FASB") Accounting Standards CodificationTM ("ASC") 820, "Fair Value Measurements and Disclosures" ("ASC 820"), defines fair value as the value that the Fund would receive to sell an investment or pay to transfer a liability in a timely transaction with an independent buyer in the principal market, or in the absence of a principal market the most advantageous market for the investment or liability. ASC 820 establishes a three-tier hierarchy to distinguish between (1) inputs that reflect the assumptions market participants would use in valuing an asset or liability developed based on market data obtained from sources independent of the reporting entity (observable inputs) and (2) inputs that reflect the reporting entity's own assumptions about the assumptions market participants would use in valuing an asset or liability developed based on the best information available in the circumstances (unobservable inputs) and to establish classification of fair value measurements for disclosure purposes. Various inputs are used in determining the value of the Fund's investments. The inputs are summarized in the three broad levels listed below.
• Level 1 – unadjusted quoted prices in active markets for identical investments
• Level 2 – other significant observable inputs (including quoted prices for similar investments, interest rates, prepayment speeds, credit risk, etc.)
• Level 3 – significant unobservable inputs including the Fund's own assumptions in determining the fair value of investments. Factors considered in making this determination may include, but are not limited to, information obtained by contacting the issuer, analysts, or the appropriate stock exchange (for exchange-traded securities), analysis of the issuer's financial statements or other available documents and, if necessary, available information concerning other securities in similar circumstances
The inputs or methodology used for valuing securities are not necessarily an indication of the risk associated with investing in those securities and the determination of the significance of a particular input to the fair value measurement in its entirety requires judgment and considers factors specific to each security.
The following is a summary of the inputs used to value the Portfolio's investments as of December 31, 2013.
Investment Type | | Level 1
Unadjusted
quoted
prices
(000) | | Level 2
Other
significant
observable
inputs
(000) | | Level 3
Significant
unobservable
inputs
(000) | | Total
(000) | |
Assets: | |
Common Stocks | |
Diversified | | $ | 74,322 | | | $ | — | | | $ | — | † | | $ | 74,322 | | |
Industrial | | | 5,194 | | | | — | | | | — | | | | 5,194 | | |
Office | | | 17,523 | | | | — | | | | — | | | | 17,523 | | |
Residential | | | 4,397 | | | | — | | | | — | | | | 4,397 | | |
Retail | | | 29,582 | | | | — | | | | — | | | | 29,582 | | |
Self Storage | | | 844 | | | | — | | | | — | | | | 844 | | |
Total Common Stocks | | | 131,862 | | | | — | | | | — | † | | | 131,862 | | |
Short-Term Investment
Investment Company | | | 1,717 | | | | — | | | | — | | | | 1,717 | | |
Total Assets | | $ | 133,579 | | | $ | — | | | $ | — | † | | $ | 133,579 | | |
† Includes one security which is valued at zero.
Transfers between investment levels may occur as the markets fluctuate and/or the availability of data used in an investment's valuation changes. The Portfolio recognizes
20
Morgan Stanley Institutional Fund, Inc.
Annual Report — December 31, 2013
Notes to Financial Statements (cont'd)
transfers between the levels as of the end of the period. As of December 31, 2013, securities with a total value of approximately $124,429,000 transferred from Level 2 to Level 1. At December 31, 2012, the fair value of certain securities were adjusted due to developments which occurred between the time of the close of the foreign markets on which they trade and the close of business on the NYSE which resulted in their Level 2 classification.
Following is a reconciliation of investments in which significant unobservable inputs (Level 3) were used in determining fair value.
| | | Common
Stock
(000) | |
Beginning Balance | | $ | — | † | |
Purchases | | | — | | |
Sales | | | — | | |
Amortization of discount | | | — | | |
Transfers in | | | — | | |
Transfers out | | | — | | |
Change in unrealized appreciation/depreciation | | | — | | |
Realized gains (losses) | | | — | | |
Ending Balance | | $ | — | † | |
Net change in unrealized appreciation/depreciation from investment
still held as of December 31, 2013 | | $ | — | | |
† Includes one security which is valued at zero.
3. Foreign Currency Translation and Foreign Investments: The books and records of the Portfolio are maintained in U.S. dollars. Foreign currency amounts are translated into U.S. dollars as follows:
– investments, other assets and liabilities at the prevailing rate of exchange on the valuation date;
– investment transactions and investment income at the prevailing rates of exchange on the dates of such transactions.
Although the net assets of the Portfolio are presented at the foreign exchange rates and market values at the close of the period, the Portfolio does not isolate that portion of the results of operations arising as a result of changes in the foreign exchange rates from the fluctuations arising from changes in the market prices of securities held at period end. Similarly, the Portfolio does not isolate the effect of changes in foreign exchange rates from the fluctuations arising from changes in the market prices of securities sold during the period. Accordingly, realized and unrealized foreign currency gains (losses) on investments in securities are included in the reported net
realized and unrealized gains (losses) on investment transactions and balances. However, pursuant to U.S. Federal income tax regulations, gains and losses from certain foreign currency transactions and the foreign currency portion of gains and losses realized on sales and maturities of foreign denominated debt securities are treated as ordinary income for U.S. Federal income tax purposes.
Net realized gains (losses) on foreign currency transactions represent net foreign exchange gains (losses) from foreign currency forward exchange contracts, disposition of foreign currencies, currency gains (losses) realized between the trade and settlement dates on securities transactions, and the difference between the amount of investment income and foreign withholding taxes recorded on the Portfolio's books and the U.S. dollar equivalent amounts actually received or paid. Net unrealized currency gains (losses) from valuing foreign currency denominated assets and liabilities at period end exchange rates are reflected as a component of unrealized appreciation (depreciation) on the Statement of Assets and Liabilities. The change in unrealized currency gains (losses) on foreign currency translations for the period is reflected in the Statement of Operations.
Foreign security and currency transactions may involve certain considerations and risks not typically associated with those of U.S. dollar denominated transactions as a result of, among other factors, fluctuations of exchange rates in relation to the U.S. dollar, the possibility of lower levels of governmental supervision and regulation of foreign securities markets and the possibility of political or economic instability.
The net assets of the Portfolio include foreign denominated securities and currency. Changes in currency exchange rates will affect the U.S. Dollar value of and investment income from such securities.
Governmental approval for foreign investments may be required in advance of making an investment under certain circumstances in some countries, and the extent of foreign investments in domestic companies may be subject to limitation in other countries. Foreign ownership limitations also may be imposed by the charters of individual companies to prevent, among other concerns, violations of foreign investment limitations. As a result, an additional class of shares (identified as "Foreign" in the
21
Morgan Stanley Institutional Fund, Inc.
Annual Report — December 31, 2013
Notes to Financial Statements (cont'd)
Portfolio of Investments) may be created and offered for investment. The "local" and "foreign shares" market values may differ. In the absence of trading of the foreign shares in such markets, the Portfolio values the foreign shares at the closing exchange price of the local shares.
4. Redemption Fees: The Portfolio will assess a 2% redemption fee, on Class I shares, Class A shares, Class H shares, Class L shares and Class IS shares, which is paid directly to the Portfolio, for shares redeemed or exchanged within thirty days of purchase, subject to certain exceptions. The redemption fee is designed to protect the Portfolio and its remaining shareholders from the effects of short-term trading. These fees, if any, are included in the Statements of Changes in Net Assets.
5. Indemnifications: The Fund enters into contracts that contain a variety of indemnifications. The Fund's maximum exposure under these arrangements is unknown. However, the Fund has not had prior claims or losses pursuant to these contracts and expects the risk of loss to be remote.
6. Dividends and Distributions to Shareholders: Dividend income and distributions to shareholders are recorded on the ex-dividend date. Dividends from net investment income, if any, are declared and paid semiannually. Net realized capital gains, if any, are distributed at least annually.
7. Security Transactions, Income and Expenses: Security transactions are accounted for on the trade date (date the order to buy or sell is executed). Realized gains and losses on the sale of investment securities are determined on the specific identified cost method. Dividend income and other distributions are recorded on the ex-dividend date (except for certain foreign dividends which may be recorded as soon as the Portfolio is informed of such dividends) net of applicable withholding taxes. Interest income is recognized on the accrual basis except where collection is in doubt. Discounts are accreted and premiums are amortized over the life of the respective securities. Most expenses of the Fund can be directly attributed to a particular Portfolio. Expenses which cannot be directly attributed are apportioned among the Portfolios based upon relative net assets or other appropriate methods. Income, expenses (other than class specific expenses — distribution, transfer agency and sub transfer agency fees) and realized and unrealized gains or losses are allocated to each class of shares based upon their relative net assets.
The Portfolio owns shares of REITs which report information on the source of their distributions annually in the following calendar year. A portion of distributions received from REITs during the year is estimated to be a return of capital and is recorded as a reduction of their cost.
B. Advisory/Sub-Advisory Fees: The Adviser, a wholly-owned subsidiary of Morgan Stanley, provides the Portfolio with advisory services under the terms of an Investment Advisory Agreement, paid quarterly, at an annual rate of 0.80% of the average daily net assets of the Portfolio.
The Adviser has agreed to reduce its advisory fee and/or reimburse the Portfolio so that total annual portfolio operating expenses, excluding certain investment related expenses, taxes, interest and other extraordinary expenses (including litigation), will not exceed 1.00% for Class I shares, 1.25% for Class A shares, 1.25% for Class H shares and 1.75% for Class L shares. Effective September 16, 2013, the Adviser has agreed to limit the ratio of expenses to average net assets to the maximum ratio of 1.35%, 1.35%, 1.85% and 0.97% for Class A, Class H, Class L and Class IS shares, respectively. The fee waivers and/or expense reimbursements will continue for at least one year or until such time that the Directors act to discontinue all or a portion of such waivers and/or reimbursements when it deems such action is appropriate. For the year ended December 31, 2013, approximately $307,000 of advisory fees were waived and approximately $6,000 of other expenses were reimbursed by the Adviser pursuant to this arrangement.
The Adviser has entered into a Sub-Advisory Agreement with the Sub-Advisers, each a wholly-owned subsidiary of Morgan Stanley. The Sub-Advisers provide the Portfolio with advisory services subject to the overall supervision of the Adviser and the Fund's Officers and Directors. The Adviser pays the Sub-Advisers on a monthly basis a portion of the net advisory fees the Adviser receives from the Portfolio.
C. Administration Fees: The Adviser also serves as Administrator to the Fund and provides administrative services pursuant to an Administration Agreement for an annual fee, accrued daily and paid monthly, of 0.08% of the Portfolio's average daily net assets. Under a Sub-Administration Agreement between the Administrator and State Street Bank and Trust Company ("State Street"), State Street provides certain administrative services to the Fund. For such services, the Administrator pays State Street a portion of the fee the Administrator receives from the Portfolio.
22
Morgan Stanley Institutional Fund, Inc.
Annual Report — December 31, 2013
Notes to Financial Statements (cont'd)
D. Distribution and Shareholder Services Fees: Morgan Stanley Distribution, Inc. ("MSDI" or the "Distributor"), a wholly-owned subsidiary of the Adviser, and an indirect subsidiary of Morgan Stanley, serves as the Fund's Distributor of Portfolio shares pursuant to a Distribution Agreement. The Fund has adopted a Shareholder Services Plan with respect to Class A and Class H shares pursuant to Rule 12b-1 under the Act. Under the Shareholder Services Plan, the Portfolio pays the Distributor a shareholder services fee, accrued daily and paid monthly, at an annual rate of 0.25% of the Portfolio's average daily net assets attributable to Class A and Class H shares.
The Fund has adopted a Distribution and Shareholder Services Plan with respect to Class L shares pursuant to Rule 12b-1 under the Act. Under the Distribution and Shareholder Services Plan, the Portfolio pays the Distributor a distribution fee, accrued daily and paid monthly, at an annual rate of 0.50% and a shareholder services fee, accrued daily and paid monthly, at an annual rate of 0.25% of the Portfolio's average daily net assets attributable to Class L shares.
The distribution and shareholder services fees are used to support the expenses associated with servicing and maintaining accounts. The Distributor may compensate other parties for providing shareholder support services to investors who purchase Class A, Class H and Class L shares.
E. Dividend Disbursing and Transfer Agent: The Fund's dividend disbursing and transfer agent was Morgan Stanley Services Company Inc. ("Morgan Stanley Services"). Pursuant to a Transfer Agency Agreement, the Fund paid Morgan Stanley Services a fee based on the number of classes, accounts and transactions relating to the Portfolios of the Fund. Effective July 1, 2013, the Directors approved changing the transfer agent to Boston Financial Data Services, Inc.
F. Custodian Fees: State Street (the "Custodian") serves as Custodian for the Fund in accordance with a Custodian Agreement. The Custodian holds cash, securities, and other assets of the Fund as required by the Act. Custody fees are payable monthly based on assets held in custody, investment purchases and sales activity and account maintenance fees, plus reimbursement for certain out-of-pocket expenses.
G. Security Transactions and Transactions with Affiliates: For the year ended December 31, 2013, purchases and sales of investment securities for the Portfolio, other than long-term U.S. Government securities and short-term investments, were approximately $54,051,000 and $69,310,000,
respectively. There were no purchases and sales of long-term U.S. Government securities for the year ended December 31, 2013.
The Portfolio invests in the Institutional Class of the Morgan Stanley Institutional Liquidity Funds — Treasury Portfolio (the "Liquidity Funds"), an open-end management investment company managed by the Adviser. Advisory fees paid by the Portfolio are reduced by an amount equal to its pro-rata share of the advisory and administration fees paid by the Portfolio due to its investment in the Liquidity Funds. For the year ended December 31, 2013, advisory fees paid were reduced by approximately $3,000 relating to the Portfolio's investment in the Liquidity Funds.
A summary of the Portfolio's transactions in shares of the Liquidity Funds during the year ended December 31, 2013 is as follows:
Value
December 31,
2012
(000) | | Purchases
at Cost
(000) | | Sales
(000) | | Dividend
Income
(000) | | Value
December 31,
2013
(000) | |
| $ | 50 | | | $ | 38,585 | | | $ | 36,918 | | | $ | 1 | | | $ | 1,717 | | |
During the year ended December 31, 2013, the Portfolio incurred less than $500 in brokerage commissions with Morgan Stanley & Co., LLC, an affiliate of the Adviser, Sub-Advisers, Administrator and Distributor, for portfolio transactions executed on behalf of the Portfolio.
From January 1, 2013 to June 30, 2013, the Portfolio incurred approximately $5,000 in brokerage commissions with Citigroup, Inc., and its affiliated broker-dealers, which may be deemed affiliates of the Adviser, Sub-Advisers, Administrator and Distributor under Section 17 of the Act, for portfolio transactions executed on behalf of the Portfolio. Citigroup, Inc. and its affiliated broker-dealers ceased to be affiliates of the Portfolio pursuant to Section 17 of the Act as of July 1, 2013.
H. Federal Income Taxes: It is the Portfolio's intention to continue to qualify as a regulated investment company and distribute all of its taxable and tax-exempt income. Accordingly, no provision for Federal income taxes is required in the financial statements.
The Portfolio may be subject to taxes imposed by countries in which it invests. Such taxes are generally based on income and/or capital gains earned or repatriated. Taxes are accrued based on net investment income, net realized gains and net unrealized appreciation as such income and/or gains are earned. Taxes may also be based on transactions in foreign currency and are accrued based on the value of investments denominated in such currency.
23
Morgan Stanley Institutional Fund, Inc.
Annual Report — December 31, 2013
Notes to Financial Statements (cont'd)
FASB ASC 740-10 "Income Taxes — Overall" sets forth a minimum threshold for financial statement recognition of the benefit of a tax position taken or expected to be taken in a tax return. Management has concluded there are no significant uncertain tax positions that would require recognition in the financial statements. If applicable, the Portfolio recognizes interest accrued related to unrecognized tax benefits in "Interest Expense" and penalties in ''Other Expenses" in the Statement of Operations. The Portfolio files tax returns with the U.S. Internal Revenue Service, New York and various states. Generally, each of the tax years in the four-year period ended December 31, 2013, remains subject to examination by taxing authorities.
The tax character of distributions paid may differ from the character of distributions shown in the Statements of Changes in Net Assets due to short-term capital gains being treated as ordinary income for tax purposes. The tax character of distributions paid during fiscal 2013 and 2012 was as follows:
| 2013 | | 2012 | |
Distributions
Paid From: | | Distributions
Paid From: | |
Ordinary
Income
(000) | | Long-Term
Capital Gain
(000) | | Ordinary
Income
(000) | | Long-Term
Capital Gain
(000) | |
| $ | 7,760 | | | | — | | | $ | 7,343 | | | | — | | |
The amount and character of income and gains to be distributed are determined in accordance with income tax regulations which may differ from GAAP. These book/tax differences are either considered temporary or permanent in nature.
Temporary differences are primarily due to differing book and tax treatments in the timing of the recognition of gains (losses) on certain investment transactions and the timing of the deductibility of certain expenses.
Permanent differences, primarily due to differing treatments of gains (losses) related to foreign currency transactions and basis adjustments on certain equity securities designated as passive foreign investment companies, resulted in the following reclassifications among the components of net assets at December 31, 2013:
Distributions in
Excess of
Net Investment
Income
(000) | | Accumulated
Net Realized
Loss
(000) | | Paid-in-
Capital
(000) | |
| $ | 1,240 | | | $ | (1,240 | ) | | | — | | |
At December 31, 2013, the components of distributable earnings for the Portfolio on a tax basis were as follows:
Undistributed
Ordinary
Income
(000) | | Undistributed
Long-Term
Capital Gain
(000) | |
| $ | 677 | | | | — | | |
At December 31, 2013, the aggregate cost for federal income tax purposes is $172,144,000. The aggregate gross unrealized appreciation is $8,444,000 and the aggregate gross unrealized depreciation is $47,009,000 resulting in net unrealized depreciation of $38,565,000.
At December 31, 2013, the Portfolio had available unused short-term capital losses of $1,896,000 and long-term capital losses of $189,421,000 that do not have an expiration date.
In addition, at December 31, 2013, the Portfolio had available capital loss carryforwards to offset future net capital gains, to the extent provided by regulations, through the indicated expiration dates:
Amount
(000) | | Expiration | |
| $ | 98,798 | | | December 31, 2016 | |
| $ | 217,627 | | | December 31, 2017 | |
| $ | 66,872 | | | December 31, 2018 | |
To the extent that capital loss carryforwards are used to offset any future capital gains realized during the carryover period as provided by U.S. Federal income tax regulations, no capital gains tax liability will be incurred by the Portfolio for gains realized and not distributed. To the extent that capital gains are offset, such gains will not be distributed to the shareholders. During the year ended December 31, 2013, the Portfolio utilized capital loss carryforwards for U.S. Federal income tax purposes of approximately $1,328,000.
I. Other (unaudited): At December 31, 2013, the Portfolio had otherwise unaffiliated record owners of 10% or greater. Investment activities of these shareholders could have a material impact on the Portfolio. The aggregate percentage of such owners was 75% and 84%, for Class I and Class L shares, respectively.
J. Results of Special Shareholder Meeting (unaudited): On June 5, 2013 as adjourned to June 24, 2013, July 17, 2013, July 24, 2013 and July 26, 2013, a Joint Special Shareholder Meeting was held for Class H shareholders of the Portfolio to approve the Articles of Amendment to the Fund's Articles of Amendment and Restatement and a Plan of Reclassification for the Portfolio pursuant to which Class H shares would be reclassified as Class P shares. The Portfolio did not achieve quorum and the proposal did not pass.
24
Morgan Stanley Institutional Fund, Inc.
Annual Report — December 31, 2013
Notes to Financial Statements (cont'd)
K. Accounting Pronouncement: In June 2013, FASB issued Accounting Standards Update 2013-08 Financial Services — Investment Companies (Topic 946) — Amendments to the Scope, Measurement, and Disclosure Requirements ("ASU 2013-08") which is effective for interim and annual reporting periods in fiscal years that begin after December 15, 2013. ASU 2013-08 sets forth a methodology for determining whether an entity should be characterized as an investment company and prescribes fair value accounting for an investment company's non-controlling ownership interest in another investment company. FASB has determined that a fund registered under the Investment Company Act of 1940 automatically meets ASU 2013-08's criteria for an investment company. Although still evaluating the potential impacts of ASU 2013-08 to the Portfolio, management expects that the impact of the Portfolio's adoption will be limited to additional financial statement disclosures.
25
Morgan Stanley Institutional Fund, Inc.
Annual Report — December 31, 2013
Report of Independent Registered Public Accounting Firm
To the Shareholders and Board of Directors of
Morgan Stanley Institutional Fund, Inc. —
International Real Estate Portfolio
We have audited the accompanying statement of assets and liabilities, including the portfolio of investments, of International Real Estate Portfolio (one of the portfolios constituting Morgan Stanley Institutional Fund, Inc.) (the "Portfolio") as of December 31, 2013, and the related statement of operations for the year then ended, the statements of changes in net assets for each of the two years in the period then ended, and the financial highlights for each of the periods indicated therein. These financial statements and financial highlights are the responsibility of the Portfolio's management. Our responsibility is to express an opinion on these financial statements and financial highlights based on our audits.
We conducted our audits in accordance with the standards of the Public Company Accounting Oversight Board (United States). Those standards require that we plan and perform the audit to obtain reasonable assurance about whether the financial statements and financial highlights are free of material misstatement. We were not engaged to perform an audit of the Portfolio's internal control over financial reporting. Our audits included consideration of internal control over financial reporting as a basis for designing audit procedures that are appropriate in the circumstances, but not for the purpose of expressing an opinion on the effectiveness of the Portfolio's internal control over financial reporting. Accordingly, we express no such opinion. An audit also includes examining, on a test basis, evidence supporting the amounts and disclosures in the financial statements and financial highlights, assessing the accounting principles used and significant estimates made by management, and evaluating the overall financial statement presentation. Our procedures included confirmation of securities owned as of December 31, 2013, by correspondence with the custodian and others or by other appropriate auditing procedures where replies from others were not received. We believe that our audits provide a reasonable basis for our opinion.
In our opinion, the financial statements and financial highlights referred to above present fairly, in all material respects, the financial position of International Real Estate Portfolio (one of the portfolios constituting Morgan Stanley Institutional Fund, Inc.) at December 31, 2013 the results of its operations for the year then ended, the changes in its net assets for each of the two years in the period then ended, and the financial highlights for each of the periods indicated therein, in conformity with U.S. generally accepted accounting principles.

Boston, Massachusetts
February 26, 2014
26
Morgan Stanley Institutional Fund, Inc.
Annual Report — December 31, 2013
Federal Tax Notice (unaudited)
For Federal income tax purposes, the following information is furnished with respect to the Portfolio's earnings for the taxable year ended December 31, 2013.
When distributed, certain earnings may be subject to a maximum tax rate of 15% as provided for the Jobs and Growth Tax Relief Reconciliation Act of 2003. The Portfolio designated up to a maximum of $356,000 as taxable at this lower rate.
The Portfolio intends to pass through foreign tax credits of approximately $224,000, and has derived net income from sources within foreign countries amounting to approximately $4,091,000.
In January, the Portfolio provides tax information to shareholders for the preceding calendar year.
27
Morgan Stanley Institutional Fund, Inc.
Annual Report — December 31, 2013
U.S. Privacy Policy (unaudited)
AN IMPORTANT NOTICE CONCERNING OUR U.S. PRIVACY POLICY
This privacy notice describes the U.S. privacy policy of Morgan Stanley Distribution, Inc., and the Morgan Stanley family of mutual funds ("us", "our", "we").
We are required by federal law to provide you with notice of our U.S. privacy policy ("Policy"). This Policy applies to both our current and former clients unless we state otherwise and is intended for individual clients who purchase products or receive services from us for personal, family or household purposes. This Policy is not applicable to partnerships, corporations, trusts or other non-individual clients or account holders, nor is this Policy applicable to individuals who are either beneficiaries of a trust for which we serve as trustee or participants in an employee benefit plan administered or advised by us. This Policy is, however, applicable to individuals who select us to be a custodian of securities or assets in individual retirement accounts, 401(k) accounts, or accounts subject to the Uniform Gifts to Minors Act.
This notice sets out our business practices to protect your privacy; how we collect and share personal information about you; and how you can limit our sharing or certain uses by others of this information. We may amend this Policy at any time, and will inform you of any changes to our Policy as required by law.
WE RESPECT YOUR PRIVACY
We appreciate that you have provided us with your personal financial information and understand your concerns about your information. We strive to safeguard the information our clients entrust to us. Protecting the confidentiality and security of client information is an important part of how we conduct our business.
This notice describes what personal information we collect about you, how we collect it, when we may share it with others, and how certain others may use it. It discusses the steps you may take to limit our sharing of certain information about you with our affiliated companies, including, but not limited to our affiliated banking businesses, brokerage firms and credit service affiliates. It also discloses how you may limit our affiliates' use of shared information for marketing purposes.
Throughout this Policy, we refer to the nonpublic information that personally identifies you as "personal information." We also use the term "affiliated company" in this notice. An affiliated company is a company in our family of companies and includes companies with the Morgan Stanley name. These affiliated companies are financial institutions such as broker-dealers, banks, investment advisers and credit card issuers. We refer to any company that is not an affiliated company as a nonaffiliated third party. For purposes of Section 5 of this notice, and your ability to limit certain uses of personal information by our affiliates, this notice applies to the use of personal information by our affiliated companies.
1. WHAT PERSONAL INFORMATION DO WE COLLECT FROM YOU?
We may collect the following types of information about you: (i) information provided by you, including information from applications and other forms we receive from you, (ii) information about your transactions with us or our affiliates, (iii) information about your transactions with nonaffiliated third parties, (iv) information from consumer reporting agencies, (v) information obtained from our websites, and (vi) information obtained from other sources. For example:
• We collect information such as your name, address, e-mail address, telephone/fax numbers, assets, income and investment objectives through applications and other forms you submit to us.
• We may obtain information about account balances, your use of account(s) and the types of products and services you prefer to receive from us through your dealings and transactions with us and other sources.
• We may obtain information about your creditworthiness and credit history from consumer reporting agencies.
• We may collect background information from and through third-party vendors to verify representations you have made and to comply with various regulatory requirements.
2. WHEN DO WE DISCLOSE PERSONAL INFORMATION WE COLLECT ABOUT YOU?
We may disclose personal information we collect about you in each of the categories listed above to affiliated and nonaffiliated third parties.
28
Morgan Stanley Institutional Fund, Inc.
Annual Report — December 31, 2013
U.S. Privacy Policy (unaudited) (cont'd)
a. Information we disclose to affiliated companies.
We may disclose personal information that we collect about you to our affiliated companies to manage your account(s) effectively, to service and process your transactions, and to let you know about products and services offered by us and affiliated companies, to manage our business, and as otherwise required or permitted by law. Offers for products and services from affiliated companies are developed under conditions designed to safeguard your personal information.
b. Information we disclose to third parties.
We may disclose personal information that we collect about you to nonaffiliated third parties to provide marketing services on our behalf or to other financial institutions with whom we have joint marketing agreements. We may also disclose all of the information we collect to other nonaffiliated third parties for our everyday business purposes, such as to process transactions, maintain account(s), respond to court orders and legal investigations, report to credit bureaus, offer our own products and services, protect against fraud, for institutional risk control, to perform services on our behalf, and as otherwise required or permitted by law.
When we share personal information about you with a nonaffiliated third party, they are required to limit their use of personal information about you to the particular purpose for which it was shared and they are not allowed to share personal information about you with others except to fulfill that limited purpose or as may be permitted or required by law.
3. HOW DO WE PROTECT THE SECURITY AND CONFIDENTIALITY OF PERSONAL INFORMATION WE COLLECT ABOUT YOU?
We maintain physical, electronic and procedural security measures that comply with applicable law and regulations to help safeguard the personal information we collect about you. We have internal policies governing the proper handling of client information by employees. Third parties that provide support or marketing services on our behalf may also receive personal information about you, and we require them to adhere to appropriate security standards with respect to such information.
4. HOW CAN YOU LIMIT OUR SHARING CERTAIN PERSONAL INFORMATION ABOUT YOU WITH OUR AFFILIATED COMPANIES FOR ELIGIBILITY DETERMINATION?
By following the opt-out procedures in Section 6 below, you may limit the extent to which we share with our affiliated companies, personal information that was collected to determine your eligibility for products and services such as your credit reports and other information that you have provided to us or that we may obtain from third parties ("eligibility information"). Eligibility information does not include your identification information or personal information pertaining to our transactions or experiences with you. Please note that, even if you direct us not to share eligibility information with our affiliated companies, we may still share your personal information, including eligibility information, with our affiliated companies under circumstances that are permitted under applicable law, such as to process transactions or to service your account.
5. HOW CAN YOU LIMIT THE USE OF CERTAIN PERSONAL INFORMATION ABOUT YOU BY OUR AFFILIATED COMPANIES FOR MARKETING?
By following the opt-out instructions in Section 6 below, you may limit our affiliated companies from marketing their products or services to you based on personal information we disclose to them. This information may include, for example, your income and account history with us. Please note that, even if you choose to limit our affiliated companies from using personal information about you that we may share with them for marketing their products and services to you, our affiliated companies may use your personal information that they obtain from us to market to you in circumstances permitted by law, such as if the affiliated party has its own relationship with you.
29
Morgan Stanley Institutional Fund, Inc.
Annual Report — December 31, 2013
U.S. Privacy Policy (unaudited) (cont'd)
6. HOW CAN YOU SEND US AN OPT-OUT INSTRUCTION?
If you wish to limit our sharing of eligibility information about you with our affiliated companies, or our affiliated companies' use of personal information for marketing purposes, as described in this notice, you may do so by:
• Calling us at (800) 548-7786
Monday–Friday between 8a.m. and 5p.m. (EST)
• Writing to us at the following address:
Boston Financial Data Services, Inc.
c/o Privacy Coordinator
P.O. Box 219804
Kansas City, Missouri 64121
If you choose to write to us, your request should include: your name, address, telephone number and account number(s) to which the opt-out applies and whether you are opting out with respect to sharing of eligibility information (Section 4 above), or information used for marketing (Section 5 above), or both. Written opt-out requests should not be sent with any other correspondence. In order to process your request, we require that the request be provided by you directly and not through a third party. Once you have informed us about your privacy preferences, your opt-out preference will remain in effect with respect to this Policy (as it may be amended) until you notify us otherwise. If you are a joint account owner, we will accept instructions from any one of you and apply those instructions to the entire account.
Please understand that if you limit our sharing or our affiliated companies' use of personal information, you and any joint account holder(s) may not receive information about our affiliated companies' products and services, including products or services that could help you manage your financial resources and achieve your investment objectives.
If you have more than one account or relationship with us, please specify the accounts to which you would like us to apply your privacy choices. If you have accounts or relationships with our affiliates, you may receive multiple privacy policies from them, and will need to separately notify those companies of your privacy choices for those accounts or relationships.
7. WHAT IF AN AFFILIATED COMPANY BECOMES A NONAFFILIATED THIRD PARTY?
If, at any time in the future, an affiliated company becomes a nonaffiliated third party, further disclosures of personal information made to the former affiliated company will be limited to those described in Section 2(b) above relating to nonaffiliated third parties. If you elected under Section 6 to limit disclosures we make to affiliated companies, or use of personal information by affiliated companies, your election will not apply to use by any former affiliated company of your personal information in their possession once it becomes a nonaffiliated third party.
SPECIAL NOTICE TO RESIDENTS OF VERMONT
The following section supplements our Policy with respect to our individual clients who have a Vermont address and supersedes anything to the contrary in the above Policy with respect to those clients only.
The State of Vermont requires financial institutions to obtain your consent prior to sharing personal information that they collect about you with nonaffiliated third parties, or eligibility information with affiliated companies, other than in certain limited circumstances. Except as permitted by law, we will not share personal information we collect about you with nonaffiliated third parties or eligibility information with affiliated companies, unless you provide us with your written consent to share such information.
SPECIAL NOTICE TO RESIDENTS OF CALIFORNIA
The following section supplements our Policy with respect to our individual clients who have a California address and supersedes anything to the contrary in the above Policy with respect to those clients only.
In response to a California law, if your account has a California home address, your personal information will not be disclosed to nonaffiliated third parties except as permitted by applicable California law, and we will limit sharing such personal information with our affiliates to comply with California privacy laws that apply to us.
30
Morgan Stanley Institutional Fund, Inc.
Annual Report — December 31, 2013
Director and Officer Information (unaudited)
Independent Director:
Name, Age and Address of
Independent Director | | Position(s)
Held with
Registrant | | Length of Time
Served* | | Principal Occupation(s) During Past 5 Years | | Number of
Portfolios in
Fund Complex
Overseen by
Independent
Director** | | Other Directorships
Held by Independent
Director*** | |
Frank L. Bowman (69)
c/o Kramer Levin Naftalis &
Frankel LLP
Counsel to the Independent
Directors
1177 Avenue of the Americas
New York, NY 10036 | | Director | | Since
August
2006 | | President, Strategic Decisions, LLC (consulting) (since February 2009); Director or Trustee of various Morgan Stanley Funds (since August 2006); Chairperson of the Insurance Sub-Committee of the Compliance and Insurance Committee (since February 2007); served as President and Chief Executive Officer of the Nuclear Energy Institute (policy organization) (February 2005-November 2008); retired as Admiral, U.S. Navy after serving over 38 years on active duty including 8 years as Director of the Naval Nuclear Propulsion Program in the Department of the Navy and the U.S. Department of Energy (1996-2004); served as Chief of Naval Personnel (July 1994-September 1996); and on the Joint Staff as Director of Political Military Affairs (June 1992-July 1994); knighted as Honorary Knight Commander of the Most Excellent Order of the British Empire; awarded the Officier de l'Orde National du Mérite by the French Government; elected to the National Academy of Engineering (2009). | | | 98 | | | Director of BP p.l.c.; Director of Naval and Nuclear Technologies LLP; Director of the Armed Services YMCA of the USA and the U.S. Naval Submarine League; Director of the American Shipbuilding Suppliers Association; Member of the National Security Advisory Council of the Center for U.S. Global Engagement and a member of the CNA Military Advisory Board; Chairman of the Charity J Street Cup Golf; Trustee of Fairhaven United Methodist Church. | |
Michael Bozic (73)
c/o Kramer Levin Naftalis & Frankel LLP
Counsel to the Independent Directors
1177 Avenue of the Americas New York, NY 10036 | | Director | | Since
April
1994 | | Private investor and a member of the advisory board of American Road Group LLC (retail) (since June 2000); Chairperson of the Compliance and Insurance Committee (since October 2006); Director or Trustee of various Morgan Stanley Funds (since April 1994); formerly, Chairperson of the Insurance Committee (July 2006-September 2006); Vice Chairman of Kmart Corporation (December 1998-October 2000), Chairman and Chief Executive Officer of Levitz Furniture Corporation (November 1995-November 1998) and President and Chief Executive Officer of Hills Department Stores (May 1991-July 1995); variously Chairman, Chief Executive Officer, President and Chief Operating Officer (1987-1991) of the Sears Merchandise Group of Sears, Roebuck & Co. | | | 100 | | | Trustee and member of the Hillsdale College Board of Trustees. | |
Kathleen A. Dennis (60)
c/o Kramer Levin Naftalis & Frankel LLP
Counsel to the Independent Directors
1177 Avenue of the Americas New York, NY 10036 | | Director | | Since
August
2006 | | President, Cedarwood Associates (mutual fund and investment management consulting) (since July 2006); Chairperson of the Money Market and Alternatives Sub-Committee of the Investment Committee (since October 2006) and Director or Trustee of various Morgan Stanley Funds (since August 2006); formerly, Senior Managing Director of Victory Capital Management (1993-2006). | | | 98 | | | Director of various non-profit organizations. | |
Dr. Manuel H. Johnson (65)
c/o Johnson Smick
Group, Inc.
888 16th Street, N.W.
Suite 740
Washington, D.C. 20006 | | Director | | Since
July
1991 | | Senior Partner, Johnson Smick International, Inc. (consulting firm); Chairperson of the Investment Committee (since October 2006) and Director or Trustee of various Morgan Stanley Funds (since July 1991); Co-Chairman and a founder of the Group of Seven Council (G7C) (international economic commission); formerly, Chairperson of the Audit Committee (July 1991-September 2006), Vice Chairman of the Board of Governors of the Federal Reserve System and Assistant Secretary of the U.S. Treasury. | | | 101 | | | Director of NVR, Inc. (home construction). | |
31
Morgan Stanley Institutional Fund, Inc.
Annual Report — December 31, 2013
Director and Officer Information (unaudited) (cont'd)
Independent Director: (cont'd)
Name, Age and Address of
Independent Director | | Position(s)
Held with
Registrant | | Length of Time
Served* | | Principal Occupation(s) During Past 5 Years | | Number of
Portfolios in
Fund Complex
Overseen by
Independent
Director** | | Other Directorships
Held by Independent
Director*** | |
Joseph J. Kearns (71)
c/o Kearns & Associates LLC PMB754
22631 Pacific Coast Highway
Malibu, CA 90265 | | Director | | Since
August
1994 | | President, Kearns & Associates LLC (investment consulting); Chairperson of the Audit Committee (since October 2006) and Director or Trustee of various Morgan Stanley Funds (since August 1994); formerly, Deputy Chairperson of the Audit Committee (July 2003-September 2006) and Chairperson of the Audit Committee of various Morgan Stanley Funds (since August 1994); CFO of the J. Paul Getty Trust. | | | 101 | | | Director of Electro Rent Corporation (equipment leasing) and The Ford Family Foundation. | |
Michael F. Klein (55)
c/o Kramer Levin Naftalis & Frankel LLP
Counsel to the Independent Directors
1177 Avenue of the Americas New York, NY 10036 | | Director | | Since
August
2006 | | Managing Director, Aetos Capital, LLC (since March 2000); Co-President, Aetos Alternatives Management, LLC (since January 2004) and Co-Chief Executive Officer of Aetos Capital LLC (since August 2013); Chairperson of the Fixed Income Sub-Committee of the Investment Committee (since October 2006) and Director or Trustee of various Morgan Stanley Funds (since August 2006); formerly, Managing Director, Morgan Stanley & Co. Inc. and Morgan Stanley Dean Witter Investment Management, President, various Morgan Stanley Funds (June 1998-March 2000) and Principal, Morgan Stanley & Co. Inc. and Morgan Stanley Dean Witter Investment Management (August 1997-December 1999). | | | 98 | | | Director of certain investment funds managed or sponsored by Aetos Capital, LLC. Director of Sanitized AG and Sanitized Marketing AG (specialty chemicals). | |
Michael E. Nugent (77)
522 Fifth Avenue
New York, NY 10036 | | Chairperson
of the
Board and Director | | Chairperson of the Boards since July 2006 and Director since July 1991 | | Chairperson of the Boards of various Morgan Stanley Funds (since July 2006); Chairperson of the Closed-End Fund Committee (since June 2012) and Director or Trustee of various Morgan Stanley Funds (since July 1991); formerly, Chairperson of the Insurance Committee (until July 2006); General Partner, Triumph Capital, L.P. (private investment partnership) (1988-2013) | | | 100 | | | None. | |
W. Allen Reed (66)
c/o Kramer Levin Naftalis & Frankel LLP
Counsel to the Independent Directors
1177 Avenue of the Americas New York, NY 10036 | | Director | | Since
August
2006 | | Chairperson of the Equity Sub-Committee of the Investment Committee (since October 2006) and Director or Trustee of various Morgan Stanley Funds (since August 2006); formerly, President and CEO of General Motors Asset Management; Chairman and Chief Executive Officer of the GM Trust Bank and Corporate Vice President of General Motors Corporation (August 1994-December 2005). | | | 98 | | | Director of Temple-Inland Industries (packaging and forest products); Director of Legg Mason, Inc. and Director of the Auburn University Foundation. | |
Fergus Reid (81)
c/o Joe Pietryka, Inc.
85 Charles Colman Blvd. Pawling, NY 12564 | | Director | | Since
June
1992 | | Chairman, Joe Pietryka, Inc.; Chairperson of the Governance Committee and Director or Trustee of various Morgan Stanley Funds (since June 1992). | | | 101 | | | Through December 31, 2012, Trustee and Director of certain Investment companies in the JP Morgan Fund Complex. | |
32
Morgan Stanley Institutional Fund, Inc.
Annual Report — December 31, 2013
Director and Officer Information (unaudited) (cont'd)
Interested Director:
Name, Age and Address of
Interested Director | | Position(s)
Held with
Registrant | | Length of
Time Served* | | Principal Occupation(s) During Past 5 Years | | Number of
Portfolios in
Fund Complex
Overseen by
Interested
Director** | | Other Directorships
Held by Interested
Director*** | |
James F. Higgins (66)
One New York Plaza
New York, New York 10004 | | Director | | Since
June
2000 | | Director or Trustee of various Morgan Stanley Funds (since June 2000); Senior Advisor of Morgan Stanley (since August 2000). | | | 99 | | | Formerly, Director of AXA Financial, Inc. and AXA Equitable Life Insurance Company (2002-2011) and Director of AXA MONY Life Insurance Company and AXA MONY Life Insurance Company of America (2004-2011). | |
* Each Director serves an indefinite term, until his or her successor is elected.
** The Fund Complex includes (as of December 31, 2013) all open-end and closed-end funds (including all of their portfolios) advised by Morgan Stanley Investment Management Inc. (the "Adviser") and any funds that have an adviser that is an affiliated person of the Adviser (including, but not limited to, Morgan Stanley AIP GP LP).
*** This includes any directorships at public companies and registered investment companies held by the Director at any time during the past five years.
33
Morgan Stanley Institutional Fund, Inc.
Annual Report — December 31, 2013
Director and Officer Information (unaudited) (cont'd)
Executive Officers:
Name, Age and Address of Executive Officer | | Position(s) Held
with
Registrant | | Length of
Time Served* | | Principal Occupation(s) During Past 5 Years | |
John H. Gernon (50)
522 Fifth Avenue
New York, NY 10036 | | President and Principal Executive Officer—Equity, Fixed Income and AIP Funds | | Since
September
2013 | | President and Principal Executive Officer of the Equity and Fixed Income Funds and the Morgan Stanley AIP Funds (since September 2013) in the Fund Complex. Managing Director of the Adviser. | |
Stefanie V. Chang Yu (47)
522 Fifth Avenue
New York, NY 10036 | | Chief Compliance Officer | | Since
January
2014 | | Managing Director of the Adviser and various entities affiliated with the Adviser; Chief Compliance Officer of various Morgan Stanley Funds and the Adviser (since January 2014) formerly Vice President of various Morgan Stanley Funds (December 1997-January 2014). | |
Joseph C. Benedetti (48)
522 Fifth Avenue
New York, NY 10036 | | Vice President | | Since
January
2014 | | Managing Director of the Adviser and various entities affiliated with the Adviser; Vice President of various Morgan Stanley Funds (since January 2014). Formerly, Assistant Secretary of various Morgan Stanley Funds (October 2004-January 2014). | |
Francis J. Smith (48)
522 Fifth Avenue
New York, NY 10036 | | Treasurer and Principal Financial Officer | | Treasurer since July 2003 and Principal Financial Officer since September 2002 | | Executive Director of the Adviser and various entities affiliated with the Adviser; Treasurer and Principal Financial Officer of various Morgan Stanley Funds (since July 2003). | |
Mary E. Mullin (46)
522 Fifth Avenue
New York, NY 10036 | | Secretary | | Since
June
1999 | | Executive Director of the Adviser and various entities affiliated with the Adviser; Secretary of various Morgan Stanley Funds (since June 1999). | |
* Each officer serves an indefinite term, until his or her successor is elected.
34
Morgan Stanley Institutional Fund, Inc.
Annual Report — December 31, 2013
Adviser and Administrator
Morgan Stanley Investment Management Inc.
522 Fifth Avenue
New York, New York 10036
Sub-Advisers
Morgan Stanley Investment Management Limited
25 Cabot Square, Canary Wharf
London, E14 4QA, England
Morgan Stanley Investment Management Company
23 Church Street
16-01 Capital Square 049481 Singapore
Distributor
Morgan Stanley Distribution, Inc.
522 Fifth Avenue
New York, New York 10036
Dividend Disbursing and Transfer Agent
Boston Financial Data Services, Inc.
2000 Crown Colony Drive
Quincy, Massachusetts 02169
Custodian
State Street Bank and Trust Company
One Lincoln Street
Boston, Massachusetts 02111
Legal Counsel
Dechert LLP
1095 Avenue of the Americas
New York, New York 10036
Counsel to the Independent Directors
Kramer Levin Naftalis & Frankel LLP
1177 Avenue of the Americas
New York, New York 10036
Independent Registered Public Accounting Firm
Ernst & Young LLP
200 Clarendon Street
Boston, Massachusetts 02116
Reporting to Shareholders
Each Morgan Stanley fund provides a complete schedule of portfolio holdings in its semi-annual and annual reports within 60 days of the end of the fund's second and fourth fiscal quarters by filing the schedule electronically with the Securities and Exchange Commission (SEC). The semi-annual reports are filed on Form N-CSRS and the annual reports are filed on Form N-CSR. Morgan Stanley also delivers the semi-annual and annual reports to fund shareholders and makes these reports available on its public website, www.morganstanley.com/im. Each Morgan Stanley fund also files a complete schedule of portfolio holdings with the SEC for the fund's first and third fiscal quarters on Form N-Q. Morgan Stanley does not deliver the reports for the first and third fiscal quarters to shareholders, nor are the reports posted to the Morgan Stanley public website. You may, however, obtain the Form N-Q filings (as well as the Form N-CSR and N-CSRS filings) by accessing the SEC's website, www.sec.gov. You may also review and copy them at the SEC's Public Reference Room in Washington, DC. Information on the operation of the SEC's Public Reference Room may be obtained by calling the SEC toll free at 1 (800) SEC-0330. You can also request copies of these materials, upon payment of a duplicating fee, by electronic request at the SEC's email address (publicinfo@sec.gov) or by writing the Public Reference Room of the SEC, Washington, DC 20549-0102.
Proxy Voting Policies and Procedures and Proxy Voting Record
You may obtain a copy of the Fund's Proxy Voting Policy and Procedures and information regarding how the Fund voted proxies relating to portfolio securities during the most recent twelve-month period ended June 30, without charge, upon request, by calling toll free 1 (800) 548-7786 or by visiting our website at www.morganstanley.com/im. This information is also available on the SEC's website at www.sec.gov.
This report is authorized for distribution only when preceded or accompanied by a prospectus of the Morgan Stanley Institutional Fund, Inc. which describes in detail each Investment Portfolio's investment policies, risks, fees and expenses. Please read the prospectus carefully before you invest or send money. For additional information, including information regarding the investments comprising the Portfolio, please visit our website at www.morganstanley.com/im or call toll free 1 (800) 548-7786.
35
(This Page has been left blank intentionally.)
Printed in U.S.A.
This Report has been prepared for shareholders and may be distributed to others only if preceded or accompanied by a current prospectus.
Morgan Stanley Investment Management Inc.
522 Fifth Avenue
New York, New York 10036
© 2014 Morgan Stanley. Morgan Stanley Distribution, Inc.

IFIIREANN
809929 EXP 2.28.15

Morgan Stanley Institutional Fund, Inc.
Active International Allocation Portfolio
Annual Report
December 31, 2013

Morgan Stanley Institutional Fund, Inc.
Annual Report — December 31, 2013
Shareholders' Letter | | | 2 | | |
Expense Example | | | 3 | | |
Investment Overview | | | 4 | | |
Portfolio of Investments | | | 8 | | |
Statement of Assets and Liabilities | | | 16 | | |
Statement of Operations | | | 18 | | |
Statements of Changes in Net Assets | | | 19 | | |
Financial Highlights | | | 21 | | |
Notes to Financial Statements | | | 24 | | |
Report of Independent Registered Public Accounting Firm | | | 35 | | |
Federal Tax Notice | | | 36 | | |
U.S. Privacy Policy | | | 37 | | |
Director and Officer Information | | | 40 | | |
This report is authorized for distribution only when preceded or accompanied by prospectuses of the Morgan Stanley Institutional Fund, Inc. To receive a prospectus and/or statement of additional information (SAI), which contains more complete information such as investment objectives, charges, expenses, policies for voting proxies, risk considerations, and describes in detail each of the Portfolio's investment policies to the prospective investor, please call toll free 1 (800) 548-7786. Please read the prospectuses carefully before you invest or send money.
Additionally, you can access portfolio information including performance, characteristics, and investment team commentary through Morgan Stanley Investment Management's website: www.morganstanley.com/im.
Market forecasts provided in this report may not necessarily come to pass. There is no guarantee that any sectors mentioned will continue to perform as discussed herein or that securities in such sectors will be held by the Portfolio in the future. There is no assurance that a Portfolio will achieve its investment objective. Portfolios are subject to market risk, which is the possibility that market values of securities owned by the Portfolio will decline and, therefore, the value of the Portfolio's shares may be less than what you paid for them. Accordingly, you can lose money investing in the Portfolio. Please see the prospectus for more complete information on investment risks.
1
Morgan Stanley Institutional Fund, Inc.
Annual Report — December 31, 2013
Shareholders' Letter (unaudited)
Dear Shareholders,
We are pleased to provide this Annual report, in which you will learn how your investment in Active International Allocation Portfolio (the "Portfolio") performed during the latest twelve-month period.
Morgan Stanley Investment Management is a client-centric, investor-led organization. Our global presence, intellectual capital, and breadth of products and services enable us to partner with investors to meet the evolving challenges of today's financial markets. We aim to deliver superior investment service and to empower our clients to make the informed decisions that help them reach their investment goals.
As always, we thank you for selecting Morgan Stanley Investment Management, and look forward to working with you in the months and years ahead.
Sincerely,

John H. Gernon
President and Principal Executive Officer
January 2014
2
Morgan Stanley Institutional Fund, Inc.
Annual Report — December 31, 2013
Expense Example (unaudited)
Active International Allocation Portfolio
As a shareholder of the Portfolio, you incur two types of costs: (1) transactional costs, including redemptions fees; and (2) ongoing costs, including advisory fees, administration fees, distribution and shareholder services fees and other Portfolio expenses. This example is intended to help you understand your ongoing costs (in dollars) of investing in the Portfolio and to compare these costs with the ongoing costs of investing in other mutual funds.
This example is based on an investment of $1,000 invested at the beginning of the six-month period ended December 31, 2013 and held for the entire six-month period.
Actual Expenses
The table below provides information about actual account values and actual expenses. You may use the information in this table, together with the amount you invested, to estimate the expenses that you paid over the period. Simply divide your account value by $1,000 (for example, an $8,600 account value divided by $1,000 = 8.6), then multiply the result by the number in the table under the heading entitled "Actual Expenses Paid During Period" to estimate the expenses you paid on your account during this period.
Hypothetical Example for Comparison Purposes
The table below provides information about hypothetical account values and hypothetical expenses based on the Portfolio's actual expense ratio and an assumed rate of return of 5% per year before expenses, which is not the Portfolio's actual return. The hypothetical account values and expenses may not be used to estimate the actual ending account balance or expenses you paid for the period. You may use this information to compare the ongoing costs of investing in the Portfolio and other funds. To do so, compare this 5% hypothetical example with the 5% hypothetical examples that appear in the shareholder reports of the other funds.
Please note that the expenses shown in the table are meant to highlight your ongoing costs only and do not reflect any transactional costs, such as sales charges (loads) and redemption fees. Therefore, the information for each class in the table is useful in comparing ongoing costs only, and will not help you determine the relative total costs of owning different funds. In addition, if these transactional costs were included, your costs would have been higher.
| | | Beginning
Account
Value
7/1/13 | | Actual Ending
Account
Value
12/31/13 | | Hypothetical
Ending Account
Value | | Actual
Expenses
Paid
During
Period* | | Hypothetical
Expenses Paid
During Period* | | Net
Expense
Ratio
During
Period** | |
Active International Allocation Portfolio Class I | | $ | 1,000.00 | | | $ | 1,171.60 | | | $ | 1,020.77 | | | $ | 4.82 | | | $ | 4.48 | | | | 0.88 | % | |
Active International Allocation Portfolio Class A@ | | | 1,000.00 | | | | 1,170.10 | | | | 1,019.06 | | | | 6.67 | | | | 6.21 | | | | 1.22 | | |
Active International Allocation Portfolio Class L | | | 1,000.00 | | | | 1,167.00 | | | | 1,016.69 | | | | 9.23 | | | | 8.59 | | | | 1.69 | | |
* Expenses are calculated using each Portfolio Class' annualized net expense ratio (as disclosed), multiplied by the average account value over the period, and multiplied by 184/365 (to reflect the most recent one-half year period).
** Annualized.
@ Effective September 9, 2013, Class P and Class H shares were renamed Class A shares.
3
Morgan Stanley Institutional Fund, Inc.
Annual Report — December 31, 2013
Investment Overview (unaudited)
Active International Allocation Portfolio
The Active International Allocation Portfolio seeks long-term capital appreciation by investing primarily, in accordance with country and sector weightings determined by the Adviser, Morgan Stanley Investment Management, Inc., in equity securities of non-U.S. issuers which, in the aggregate, replicate broad market indices.
Performance
For the year ended December 31, 2013, the Portfolio had a total return based on net asset value and reinvestment of distributions per share of 21.38%, net of fees, for Class I shares. The Portfolio's Class I shares underperformed against its benchmark, the Morgan Stanley Capital International (MSCI) EAFE Index (the "Index"), which returned 22.78%. Please keep in mind that high double-digit returns are highly unusual and cannot be sustained.
Factors Affecting Performance
• With the exception of the sell-off induced by the U.S. Federal Reserve's (Fed) "taper talk" — that it would likely begin slowing the pace of its asset purchases known as quantitative easing (QE) — in mid-year, 2013 was a strong year for global equities. International markets, as measured by the Index, gained 22.78% for the one-year period. Regional returns for the 12 months were as follows: U.S. 32%, Japan 27%, Europe 25%, Pacific ex-Japan 6%, and emerging markets -3% (based on their respective MSCI Indexes). The range of sector returns were wider and led by telecommunications, 46%, with materials, 3%, the weakest performer†.
• For the Portfolio, the main detractors from performance were an underweight allocation to the eurozone in the third quarter, an underweight allocation to telecommunications and exposure to financials, particularly European banks. The Portfolio's emerging markets exposure in the first half of the year also dampened performance.
• Positive contributors to relative performance during the period included an underweight allocation to Pacific ex Japan, particularly Australia, and an exposure to Japan. Relative gains were also led by an underweight to energy, overweight to technology and underweight to European materials.
• The Portfolio utilizes stock index futures as an additional vehicle to implement the portfolio manager's macro investment decisions. For 2013, macro investment decisions made with the use of
stock index futures resulted in a realized gain for the Portfolio.
Management Strategies
• As 2014 begins — markets have been a little volatile — as investors take stock of their returns in 2013 — and peer into the new year with some new hopes and some old worries. In spite of the relatively good equity year, concerns over secular stagnation abound due to record levels of global debt, anemic global job and wage growth, a sense of government impotence, whiffs of deflation in Europe and stagflation in the emerging markets. These long-term concerns are real, but we do not believe they will overwhelm the nascent recovery. The steadfast bears point to incredibly low money velocity, stagnant/falling inflation, and flagging bank credit as proof that the recovery will not be self-sustaining. However, the Fed implemented QE in the first place precisely to offset the tight credit channels of the damaged financial system. By now much corporate (and household) deleveraging has occurred, so it is possible that the pockets of inflation evident in services may broaden, business obstacles due to economic and regulatory uncertainty may diminish, and a virtuous, self-sustaining cycle of demand, more investment, rising housing, higher wages/jobs could begin. If this is the case, the Fed will correctly continue to taper, stocks and bond yields can rise gradually together — and the U.S. locomotive could help pull Europe out of its slump — and provide a base from which global trade can improve. Later in the year, we hope results from the push for growth in Japan, the bank asset quality review in Europe, and the roll out of reforms in some emerging markts will help deepen the global recovery as well as bolster investor confidence.
• European equity and bond market returns ended sharply positive in the latter half of 2013. As well, all of the national economies in MSCI Europe Index are projected to move into positive economic and earnings territory in 2014 according to consensus view. While we do not forecast a re-escalation in the euro crisis in 2014 — Europe is vulnerable to renewed market tensions if growth disappoints or if the May European Union (EU) parliament elections unearth too many political fissures. Europe is under huge pressure to push through unpopular pension, labor market, and
4
Morgan Stanley Institutional Fund, Inc.
Annual Report — December 31, 2013
Investment Overview (unaudited) (cont'd)
Active International Allocation Portfolio
trade/regulatory reforms in order to raise trend growth and to cap sovereign debt levels. Spain has made good headway but the task is not complete. Italy and France dragged their feet. In Germany, the new coalition government rolled back some labor and pension reforms. Hopefully, the New Year's call by French Prime Minister Francois Hollande for less governmental red tape and lower taxes in return for more corporate jobs is the harbinger of a new realism. Of all of the global central banks, the European Central Bank (ECB) has been, in large part due to its unclear mandate, the least accommodative to this economic rebalance/transition. The ECB's balance sheet is down 26% since mid-2012†† and as 2014 begins, the euro currency is near its all-time high. Therefore, risks of secular stagnation seem highest to us in Europe and its economic progress in 2014 needs to be watched closely. That said, if all works out, Europe could be the year's outperformer. It is the cheapest of the major regions, on the cusp of economic recovery, potentially able and willing to pursue a fair amount of self-help policy on a macro and micro level.
• Turning to Japan, important steps to pull the economy out of 15 years of deflation and stagnation occurred in 2013. Very aggressive monetary policy succeeded in weakening the yen to pre-Lehman levels, corporate earnings doubled, the stock market rose 55% in local terms (as represented by the MSCI Japan Index), core inflation moved decidedly into positive territory, bond credit spreads tightened, and importantly, Japanese government bonds did NOT sell off. In 2014, some of the heavy lifting must be done on Prime Minister Shinzo Abe's second (fiscal balance) and third (long-term growth) arrows. Wages must rise to avoid a relapse in spending on the part of the roughly 60% of the economy driven by consumers. Corporations gave decent summer and winter bonuses, but they have been reluctant to raise wages without more clarity on the economy, input costs, and future regulations. That said, job-to-applicant ratios have risen steadily and the unemployment rate at 4% is low. Consensus projections for Japanese growth for calendar year 2014 are 1.7% with earnings growth of 9.5%†. This seems achievable, but it is disappointing that the trade surplus has not improved much in spite of the weaker yen — mainly due to the high cost of energy imports. Hence, we will watch to see if the Bank of Japan
(BOJ) continues with its open-ended easing program (especially with the potential purchases of equity exchange traded funds) — but mainly we will keep an eye on the government's announcements and roll out of the second and third arrows. The stock market has risen substantially — but it is still about 30% below its 2007 high (and 50% below the 1989 peak) as measured by TOPIX Index.
• 2013 was a year of a generalized increase in the assessment of risk across the emerging markets. Going forward, we believe investors will distinguish between emerging market countries based on each nation's perceived ability to compete in a less liquid, tougher global environment. It is remarkable to see yet again how an ebbing liquidity tide can reveal stress in emerging markets. Russia, South Africa, and Brazil all seem to be standing by without a plan — as inflation edges up, growth slows down, and capital inflows/sources diminish. Even Turkey is feeling the stress of stagflation — having wasted too much of the good years on consumption, property and political repression — versus building out industry and establishing a book of objective commercial laws that would attract investment. In contrast, the breadth and direction of the proposed Chinese reforms has been well received. Although the need to rein in credit and property prices in a highly indebted corporate and local government environment is fraught with Lehman-like risks, the pragmatism and focus of the new Chinese leadership is impressive. The longer this finesse takes place, the higher the odds that China is rebalancing and economic slowdown will be handled without a crash — and potential global repercussions.
• While globalization and technology improve productivity for the world as a whole, there are extreme winners and losers between countries and within nations. How societies choose to deal with and prepare themselves for these challenges will come to the forefront as half a decade of extraordinary monetary measures (at least in the U.S.) give way to more traditional fiscal policies. These discussions are already underway — evidenced by Congressional debt ceiling debates and Bill de Blasio's mayoral win in New York City, by comedian Beppe Grillo's and Mayor Matteo Renzi's political ascents in Italy, by first time ever
5
Morgan Stanley Institutional Fund, Inc.
Annual Report — December 31, 2013
Investment Overview (unaudited) (cont'd)
Active International Allocation Portfolio
minimum wages in Germany, and anti-corruption/anti-corporatist movements from Madrid to New Delhi. We do not expect politics to up-end the global economic cycle — but political/fiscal decisions will become a more important driver of growth and market multiples as nations differentiate themselves on this side of the Great Financial Crisis.
• In sum, our base case for 2014 is that the global economic recovery from the financial crisis will continue, bringing with it jobs, some inflation, and a capital investment and credit cycle — somewhat per usual. However, competitive pressures will remain fierce — keeping government budgets tight, nominal prices muted — and risks of economic disruption just below the surface. Equity returns could rise in line with earnings and inflation — for 2014, and even beyond — in "The New Normal," "The Second Industrial Revolution," or "The Digital Age," whatever one wants to call it. We believe the best gains, however, will likely be captured by the countries and/or sectors equipped with the innovative institutions, processes and education necessary to compete and gain market (or wallet) share. That is what our team and process will be in search of.
† Source: Bloomberg LP and Factset.
†† Source: Bloomberg, data as of December 26, 2013.
* Minimum Investment for Class I shares
In accordance with SEC regulations, Portfolio's performance shown assumes that all recurring fees (including management fees) were deducted and all dividends and distributions were reinvested. The performance of Class A+ and L shares will vary from Class I shares based upon their different inception dates and will be negatively impacted by additional fees assessed to those classes.
Performance Compared to the Morgan Stanley Capital International (MSCI) EAFE Index(1) and the Lipper International Large-Cap Core Funds Index(2)
| | | Period Ended December 31, 2013
Total Returns(3) | |
| | | | | Average Annual | |
| | One
Year | | Five
Years | | Ten
Years | | Since
Inception(7) | |
Portfolio — Class I Shares
w/o sales charges(4) | | | 21.38 | % | | | 11.02 | % | | | 7.00 | % | | | 6.56 | % | |
MSCI EAFE Index | | | 22.78 | | | | 12.44 | | | | 6.91 | | | | 6.12 | | |
Lipper International Large-Cap Core
Funds Index | | | 20.67 | | | | 11.74 | | | | 6.37 | | | | 7.11 | | |
Portfolio — Class A+ Shares
w/o sales charges(5) | | | 20.94 | | | | 10.75 | | | | 6.73 | | | | 5.88 | | |
Portfolio — Class A+ Shares with
maximum 5.25% sales charges(5) | | | 14.58 | | | | 9.57 | | | | 6.15 | | | | 5.56 | | |
MSCI EAFE Index | | | 22.78 | | | | 12.44 | | | | 6.91 | | | | 5.27 | | |
Lipper International Large-Cap Core
Funds Index | | | 20.67 | | | | 11.74 | | | | 6.37 | | | | 6.23 | | |
Portfolio — Class L Shares
w/o sales charges(6) | | | 20.34 | | | | — | | | | — | | | | 25.97 | | |
MSCI EAFE Index | | | 22.78 | | | | — | | | | — | | | | 27.97 | | |
Lipper International Large-Cap Core
Funds Index | | | 20.67 | | | | — | | | | — | | | | 26.66 | | |
Performance data quoted represents past performance, which is no guarantee of future results, and current performance may be lower or higher than the figures shown. Performance assumes that all dividends and distributions, if any, were reinvested. For the most recent month-end performance figures, please visit www.morganstanley.com/im. Investment return and principal value will fluctuate so that Portfolio shares, when redeemed, may be worth more or less than their original cost. Total returns do not reflect the deduction of taxes that a shareholder would pay on Portfolio distributions or the redemption of Portfolio shares. Performance of share classes will vary due to difference in expenses.
+ Effective September 9, 2013, Class P shares were renamed Class A shares.
(1) The Morgan Stanley Capital International (MSCI) EAFE Index (Europe, Australasia, Far East) is a free float-adjusted market capitalization index that is designed to measure the international equity market performance of developed markets, excluding the US & Canada. The term "free float" represents the portion of shares outstanding that are deemed to be available for purchase in the public equity markets by investors. The MSCI EAFE Index currently consists of 21 developed market country indices. The performance of the Index is listed in U.S. dollars and assumes reinvestment of net dividends. The Index is unmanaged and its returns do not include any sales charges or fees. Such costs would lower performance. It is not possible to invest directly in an index.
(2) The Lipper International Large-Cap Core Funds Index is an equally weighted performance index of the largest qualifying funds (based on net assets) in the Lipper International Large-Cap Core Funds classification. The Index, which is adjusted for capital gains distributions and income dividends, is unmanaged and should not be considered an investment. There are currently 30 funds represented in this Index. As of the date of this report, the Portfolio was in the Lipper International Large-Cap Core Funds classification.
(3) Total returns for the Portfolio reflect fees waived and expenses reimbursed, if applicable, by the Adviser. Without such waivers and reimbursements, total returns would have been lower. The fee waivers and/or expense reimbursements will continue for at least two years from the date of Reorganization or until such time as the Fund's Board of Directors acts to discontinue all or a portion of such
6
Morgan Stanley Institutional Fund, Inc.
Annual Report — December 31, 2013
Investment Overview (unaudited) (cont'd)
Active International Allocation Portfolio
waivers and/or expense reimbursements when it deems that such action is appropriate.
(4) Commenced operations on January 17, 1992.
(5) Commenced offering on January 2, 1996.
(6) Commenced offering on June 14, 2012.
(7) For comparative purposes, average annual since inception returns listed for the Indexes refer to the inception date or initial offering of the respective share class of the Portfolio, not the inception of the Index. Returns for periods less than one year are not annualized.
Portfolio Composition*
Classification | | Percentage of
Total Investments | |
Other** | | | 67.0 | % | |
Commercial Banks | | | 10.9 | | |
Investment Company | | | 8.5 | | |
Pharmaceuticals | | | 7.6 | | |
Insurance | | | 6.0 | | |
Total Investments | | | 100.0 | %*** | |
* Percentages indicated are based upon total investments (excluding Securities held as Collateral on Loaned Securities) as of December 31, 2013.
** Industries and/or investment types representing less than 5% of total investments.
*** Does not include open long futures contracts with an underlying face amount of approximately $35,753,000 and net unrealized appreciation of approximately $1,401,000. Does not include open foreign currency forward exchange contracts with net unrealized appreciation of approximately $326,000.
7
Morgan Stanley Institutional Fund, Inc.
Annual Report — December 31, 2013
Portfolio of Investments
Active International Allocation Portfolio
| | | Shares | | Value
(000) | |
Common Stocks (90.2%) | |
Australia (4.7%) | |
AGL Energy Ltd. (a) | | | 9,934 | | | $ | 133 | | |
ALS Ltd. (a) | | | 5,808 | | | | 46 | | |
Amcor Ltd. | | | 26,121 | | | | 246 | | |
AMP Ltd. | | | 53,504 | | | | 210 | | |
APA Group (a) | | | 13,506 | | | | 72 | | |
Asciano Ltd. | | | 17,074 | | | | 88 | | |
Aurizon Holding Ltd. | | | 29,706 | | | | 129 | | |
Australia & New Zealand Banking Group Ltd. | | | 50,232 | | | | 1,446 | | |
BHP Billiton Ltd. | | | 77,947 | | | | 2,644 | | |
Brambles Ltd. | | | 27,666 | | | | 226 | | |
Coca-Cola Amatil Ltd. (a) | | | 14,191 | | | | 152 | | |
Cochlear Ltd. (a) | | | 994 | | | | 52 | | |
Commonwealth Bank of Australia | | | 26,567 | | | | 1,846 | | |
Crown Resorts Ltd. | | | 7,124 | | | | 107 | | |
CSL Ltd. | | | 8,961 | | | | 552 | | |
Echo Entertainment Group Ltd. | | | 12,876 | | | | 28 | | |
Fortescue Metals Group Ltd. (a) | | | 25,733 | | | | 134 | | |
Goodman Group REIT | | | 32,604 | | | | 138 | | |
Harvey Norman Holdings Ltd. (a) | | | 12,522 | | | | 35 | | |
Iluka Resources Ltd. (a) | | | 9,610 | | | | 74 | | |
Incitec Pivot Ltd. | | | 34,285 | | | | 82 | | |
Insurance Australia Group Ltd. | | | 38,689 | | | | 201 | | |
Leighton Holdings Ltd. (a) | | | 2,408 | | | | 35 | | |
Lend Lease Group REIT | | | 6,276 | | | | 62 | | |
Macquarie Group Ltd. | | | 5,046 | | | | 248 | | |
National Australia Bank Ltd. | | | 38,296 | | | | 1,191 | | |
Orica Ltd. | | | 7,627 | | | | 163 | | |
Origin Energy Ltd. | | | 19,437 | | | | 244 | | |
Orora Ltd. (b) | | | 26,121 | | | | 27 | | |
QBE Insurance Group Ltd. | | | 17,649 | | | | 181 | | |
Rio Tinto Ltd. | | | 10,503 | | | | 639 | | |
Santos Ltd. | | | 16,734 | | | | 219 | | |
Sonic Healthcare Ltd. | | | 7,910 | | | | 117 | | |
Stockland REIT (a) | | | 99,787 | | | | 322 | | |
Suncorp Group Ltd. | | | 21,524 | | | | 252 | | |
Sydney Airport | | | 5,346 | | | | 18 | | |
TABCORP Holdings Ltd. (a) | | | 12,465 | | | | 40 | | |
Tatts Group Ltd. | | | 23,964 | | | | 66 | | |
Telstra Corp., Ltd. | | | 71,186 | | | | 334 | | |
Toll Holdings Ltd. | | | 11,948 | | | | 61 | | |
Transurban Group (a) | | | 23,148 | | | | 141 | | |
Wesfarmers Ltd. | | | 22,358 | | | | 879 | | |
Westfield Group REIT | | | 44,725 | | | | 403 | | |
Westfield Retail Trust REIT | | | 75,859 | | | | 201 | | |
Westpac Banking Corp. | | | 48,249 | | | | 1,395 | | |
Woodside Petroleum Ltd. | | | 11,156 | | | | 388 | | |
Woolworths Ltd. | | | 27,368 | | | | 827 | | |
WorleyParsons Ltd. (a) | | | 3,910 | | | | 58 | | |
| | | | 17,152 | | |
| | | Shares | | Value
(000) | |
Austria (0.5%) | |
Erste Group Bank AG | | | 10,313 | | | $ | 359 | | |
OMV AG | | | 7,766 | | | | 372 | | |
Raiffeisen Bank International AG | | | 999 | | | | 35 | | |
Telekom Austria AG | | | 29,849 | | | | 226 | | |
Vienna Insurance Group AG Wiener
Versicherung Gruppe | | | 822 | | | | 41 | | |
Voestalpine AG | | | 12,611 | | | | 606 | | |
| | | | 1,639 | | |
Belgium (1.0%) | |
Ageas | | | 2,453 | | | | 105 | | |
Anheuser-Busch InBev N.V. | | | 15,164 | | | | 1,612 | | |
Anheuser-Busch InBev N.V. VVPR (b) | | | 20,526 | | | | — | @ | |
Belgacom SA (a) | | | 6,432 | | | | 190 | | |
Groupe Bruxelles Lambert SA | | | 5,717 | | | | 525 | | |
KBC Groep N.V. | | | 2,571 | | | | 146 | | |
Solvay SA, Class A | | | 2,940 | | | | 465 | | |
Telenet Group Holding N.V. | | | 1,608 | | | | 96 | | |
UCB SA | | | 4,423 | | | | 329 | | |
Umicore SA (a) | | | 6,321 | | | | 295 | | |
| | | | 3,763 | | |
Brazil (0.0%) | |
Cia Energetica de Minas Gerais (Preference) | | | 1 | | | | — | @ | |
China (0.0%) | |
Wynn Macau Ltd. (a)(c) | | | 4,000 | | | | 18 | | |
Denmark (1.2%) | |
AP Moeller - Maersk A/S Series B | | | 71 | | | | 771 | | |
DSV A/S | | | 10,568 | | | | 346 | | |
Novo Nordisk A/S Series B | | | 14,264 | | | | 2,615 | | |
Novozymes A/S Series B | | | 11,435 | | | | 483 | | |
TDC A/S | | | 21,278 | | | | 206 | | |
| | | | 4,421 | | |
Finland (1.3%) | |
Elisa Oyj | | | 4,500 | | | | 119 | | |
Fortum Oyj | | | 24,307 | | | | 556 | | |
Kone Oyj, Class B (a) | | | 13,514 | | | | 609 | | |
Metso Oyj (a) | | | 6,251 | | | | 267 | | |
Neste Oil Oyj | | | 5,141 | | | | 102 | | |
Nokia Oyj (b) | | | 121,209 | | | | 970 | | |
Sampo, Class A | | | 20,250 | | | | 995 | | |
Stora Enso Oyj, Class R | | | 32,702 | | | | 328 | | |
UPM-Kymmene Oyj | | | 28,171 | | | | 476 | | |
Wartsila Oyj (a) | | | 8,305 | | | | 409 | | |
| | | | 4,831 | | |
France (8.4%) | |
Accor SA | | | 3,240 | | | | 153 | | |
Air Liquide SA | | | 4,389 | | | | 621 | | |
Alstom SA | | | 8,277 | | | | 301 | | |
AtoS | | | 5,809 | | | | 526 | | |
AXA SA | | | 69,967 | | | | 1,945 | | |
BNP Paribas SA | | | 36,918 | | | | 2,877 | | |
Bouygues SA | | | 10,945 | | | | 413 | | |
The accompanying notes are an integral part of the financial statements.
8
Morgan Stanley Institutional Fund, Inc.
Annual Report — December 31, 2013
Portfolio of Investments (cont'd)
Active International Allocation Portfolio
| | | Shares | | Value
(000) | |
France (cont'd) | |
Cap Gemini SA | | | 9,070 | | | $ | 613 | | |
Carrefour SA | | | 15,805 | | | | 626 | | |
Casino Guichard Perrachon SA | | | 1,873 | | | | 216 | | |
CGG SA (b) | | | 3,798 | | | | 66 | | |
Christian Dior SA | | | 1,002 | | | | 189 | | |
Cie de St-Gobain | | | 16,728 | | | | 920 | | |
Cie Generale des Etablissements Michelin
Series B | | | 5,787 | | | | 615 | | |
CNP Assurances | | | 4,631 | | | | 95 | | |
Credit Agricole SA (b) | | | 16,790 | | | | 215 | | |
Danone | | | 10,708 | | | | 771 | | |
Dassault Systemes SA | | | 1,085 | | | | 135 | | |
Edenred | | | 4,583 | | | | 153 | | |
Electricite de France SA | | | 676 | | | | 24 | | |
Essilor International SA | | | 4,246 | | | | 451 | | |
Eurazeo SA | | | 723 | | | | 57 | | |
European Aeronautic Defense and
Space Co., N.V. | | | 15,337 | | | | 1,178 | | |
Fonciere Des Regions REIT | | | 497 | | | | 43 | | |
GDF Suez | | | 9,458 | | | | 222 | | |
Gecina SA REIT | | | 399 | | | | 53 | | |
ICADE REIT | | | 415 | | | | 39 | | |
Imerys SA (a) | | | 549 | | | | 48 | | |
Kering | | | 989 | | | | 209 | | |
Klepierre REIT | | | 1,710 | | | | 79 | | |
L'Oreal SA | | | 911 | | | | 160 | | |
Lafarge SA | | | 4,640 | | | | 348 | | |
Lagardere SCA | | | 2,911 | | | | 108 | | |
Legrand SA | | | 9,415 | | | | 519 | | |
LVMH Moet Hennessy Louis Vuitton SA | | | 3,984 | | | | 727 | | |
Natixis | | | 19,308 | | | | 113 | | |
Orange SA | | | 42,830 | | | | 530 | | |
Pernod-Ricard SA | | | 525 | | | | 60 | | |
Publicis Groupe SA | | | 4,651 | | | | 426 | | |
Remy Cointreau SA | | | 488 | | | | 41 | | |
Renault SA | | | 10,687 | | | | 859 | | |
Safran SA | | | 9,314 | | | | 647 | | |
Sanofi | | | 28,657 | | | | 3,040 | | |
Schneider Electric SA | | | 20,154 | | | | 1,758 | | |
SCOR SE | | | 3,558 | | | | 130 | | |
Societe BIC SA | | | 771 | | | | 94 | | |
Societe Generale SA | | | 33,843 | | | | 1,966 | | |
Sodexo | | | 1,604 | | | | 162 | | |
STMicroelectronics N.V. (a) | | | 10,970 | | | | 88 | | |
Technip SA | | | 2,431 | | | | 234 | | |
Total SA | | | 36,213 | | | | 2,218 | | |
Unibail-Rodamco SE REIT | | | 1,725 | | | | 442 | | |
Veolia Environnement SA | | | 6,535 | | | | 107 | | |
Vinci SA | | | 21,920 | | | | 1,439 | | |
Vivendi SA | | | 10,430 | | | | 275 | | |
| | | | 30,344 | | |
| | | Shares | | Value
(000) | |
Germany (9.8%) | |
Adidas AG | | | 3,432 | | | $ | 437 | | |
Allianz SE (Registered) | | | 17,237 | | | | 3,091 | | |
Axel Springer SE | | | 1,041 | | | | 67 | | |
BASF SE | | | 22,471 | | | | 2,395 | | |
Bayer AG (Registered) | | | 15,723 | | | | 2,205 | | |
Bayerische Motoren Werke AG | | | 11,248 | | | | 1,319 | | |
Beiersdorf AG | | | 1,970 | | | | 200 | | |
Brenntag AG | | | 1,823 | | | | 338 | | |
Celesio AG | | | 3,780 | | | | 120 | | |
Commerzbank AG (b) | | | 72,344 | | | | 1,165 | | |
Continental AG | | | 1,277 | | | | 280 | | |
Daimler AG (Registered) | | | 30,475 | | | | 2,637 | | |
Deutsche Bank AG (Registered) | | | 38,718 | | | | 1,847 | | |
Deutsche Boerse AG | | | 2,097 | | | | 174 | | |
Deutsche Lufthansa AG (Registered) (b) | | | 24,227 | | | | 514 | | |
Deutsche Post AG (Registered) | | | 30,240 | | | | 1,102 | | |
Deutsche Telekom AG (Registered) | | | 106,889 | | | | 1,828 | | |
E.ON SE | | | 72,971 | | | | 1,347 | | |
Fraport AG Frankfurt Airport Services
Worldwide (a) | | | 979 | | | | 73 | | |
Fresenius Medical Care AG & Co., KGaA | | | 8,351 | | | | 594 | | |
GEA Group AG | | | 7,556 | | | | 360 | | |
Henkel AG & Co., KGaA (Preference) | | | 2,716 | | | | 315 | | |
Lanxess AG (a) | | | 1,922 | | | | 128 | | |
Linde AG | | | 2,957 | | | | 618 | | |
Merck KGaA | | | 1,181 | | | | 212 | | |
Metro AG | | | 13,544 | | | | 656 | | |
Muenchener Rueckversicherungs AG (Registered) | | | 6,517 | | | | 1,436 | | |
Osram Licht AG (b) | | | 2,495 | | | | 141 | | |
Porsche Automobil Holding SE (Preference) | | | 4,658 | | | | 485 | | |
ProSiebenSat.1 Media AG (Registered) | | | 7,215 | | | | 357 | | |
RWE AG | | | 11,199 | | | | 410 | | |
SAP AG | | | 29,151 | | | | 2,499 | | |
Siemens AG (Registered) | | | 24,959 | | | | 3,409 | | |
Telefonica Deutschland Holding AG | | | 9,239 | | | | 76 | | |
ThyssenKrupp AG (b) | | | 7,938 | | | | 193 | | |
United Internet AG (Registered) | | | 3,035 | | | | 129 | | |
Volkswagen AG | | | 4,074 | | | | 1,103 | | |
Volkswagen AG (Preference) | | | 3,887 | | | | 1,092 | | |
| | | | 35,352 | | |
Hong Kong (0.6%) | |
AIA Group Ltd. | | | 32,000 | | | | 161 | | |
Bank of East Asia Ltd. (a) | | | 3,800 | | | | 16 | | |
BOC Hong Kong Holdings Ltd. | | | 10,000 | | | | 32 | | |
Cheung Kong Holdings Ltd. | | | 21,000 | | | | 331 | | |
Cheung Kong Infrastructure Holdings Ltd. | | | 2,000 | | | | 13 | | |
CLP Holdings Ltd. | | | 5,500 | | | | 43 | | |
First Pacific Co., Ltd. (a) | | | 8,000 | | | | 9 | | |
Hang Lung Properties Ltd. | | | 34,000 | | | | 107 | | |
Hang Seng Bank Ltd. (a) | | | 2,300 | | | | 37 | | |
Henderson Land Development Co., Ltd. (a) | | | 17,000 | | | | 97 | | |
Hong Kong & China Gas Co., Ltd. | | | 17,000 | | | | 39 | | |
The accompanying notes are an integral part of the financial statements.
9
Morgan Stanley Institutional Fund, Inc.
Annual Report — December 31, 2013
Portfolio of Investments (cont'd)
Active International Allocation Portfolio
| | | Shares | | Value
(000) | |
Hong Kong (cont'd) | |
Hong Kong Exchanges and Clearing Ltd. | | | 3,100 | | | $ | 52 | | |
Hutchison Whampoa Ltd. | | | 6,000 | | | | 82 | | |
Hysan Development Co., Ltd. | | | 11,000 | | | | 47 | | |
Link REIT (The) | | | 34,000 | | | | 165 | | |
MGM China Holdings Ltd. (a) | | | 2,800 | | | | 12 | | |
MTR Corp., Ltd. | | | 5,500 | | | | 21 | | |
New World Development Co., Ltd. (a) | | | 60,720 | | | | 77 | | |
Power Assets Holdings Ltd. | | | 4,000 | | | | 32 | | |
Sands China Ltd. | | | 6,400 | | | | 52 | | |
Sino Land Co., Ltd. (a) | | | 47,632 | | | | 65 | | |
SJM Holdings Ltd. | | | 5,000 | | | | 17 | | |
Sun Hung Kai Properties Ltd. (a) | | | 24,577 | | | | 312 | | |
Swire Pacific Ltd., Class A | | | 11,000 | | | | 129 | | |
Swire Properties Ltd. | | | 19,000 | | | | 48 | | |
Wharf Holdings Ltd. (a) | | | 23,000 | | | | 176 | | |
Wheelock & Co., Ltd. | | | 14,000 | | | | 64 | | |
| | | | 2,236 | | |
Indonesia (0.0%) | |
Golden Agri-Resources Ltd. (a) | | | 7,315 | | | | 3 | | |
Ireland (0.4%) | |
Bank of Ireland (b) | | | 1,243,749 | | | | 431 | | |
CRH PLC | | | 28,233 | | | | 711 | | |
Kerry Group PLC, Class A | | | 3,163 | | | | 220 | | |
Ryanair Holdings PLC ADR (b) | | | 1,800 | | | | 84 | | |
| | | | 1,446 | | |
Italy (0.9%) | |
Assicurazioni Generali SpA | | | 36,566 | | | | 860 | | |
Fiat SpA (a)(b) | | | 20,544 | | | | 168 | | |
Intesa Sanpaolo SpA | | | 388,635 | | | | 959 | | |
Luxottica Group SpA | | | 2,825 | | | | 152 | | |
UniCredit SpA | | | 142,812 | | | | 1,057 | | |
Unione di Banche Italiane SCPA | | | 10,328 | | | | 70 | | |
| | | | 3,266 | | |
Japan (22.0%) | |
Aeon Co., Ltd. | | | 17,700 | | | | 240 | | |
Aeon Mall Co., Ltd. | | | 3,800 | | | | 106 | | |
Ajinomoto Co., Inc. | | | 22,000 | | | | 318 | | |
Asahi Glass Co., Ltd. (a) | | | 42,300 | | | | 263 | | |
Asahi Group Holdings Ltd. | | | 11,900 | | | | 335 | | |
Asahi Kasei Corp. | | | 44,000 | | | | 344 | | |
Astellas Pharma, Inc. | | | 15,600 | | | | 923 | | |
Bank of Yokohama Ltd. (The) | | | 67,000 | | | | 373 | | |
Benesse Holdings, Inc. | | | 2,854 | | | | 115 | | |
Bridgestone Corp. (a) | | | 33,300 | | | | 1,259 | | |
Canon, Inc. (a) | | | 14,604 | | | | 462 | | |
Central Japan Railway Co. | | | 5,392 | | | | 634 | | |
Chiba Bank Ltd. (The) | | | 27,000 | | | | 182 | | |
Chubu Electric Power Co., Inc. | | | 10,300 | | | | 133 | | |
Chugai Pharmaceutical Co., Ltd. (a) | | | 7,600 | | | | 168 | | |
Credit Saison Co., Ltd. | | | 5,000 | | | | 131 | | |
Dai Nippon Printing Co., Ltd. | | | 19,100 | | | | 202 | | |
| | | Shares | | Value
(000) | |
Daido Steel Co., Ltd. | | | 5,000 | | | $ | 25 | | |
Daiichi Sankyo Co., Ltd. | | | 22,500 | | | | 411 | | |
Daikin Industries Ltd. | | | 6,200 | | | | 386 | | |
Daito Trust Construction Co., Ltd. | | | 3,356 | | | | 313 | | |
Daiwa House Industry Co., Ltd. | | | 20,600 | | | | 398 | | |
Daiwa Securities Group, Inc. | | | 91,000 | | | | 907 | | |
Denso Corp. | | | 23,850 | | | | 1,257 | | |
East Japan Railway Co. | | | 13,300 | | | | 1,058 | | |
Eisai Co., Ltd. | | | 7,200 | | | | 279 | | |
FANUC Corp. | | | 6,250 | | | | 1,142 | | |
Fast Retailing Co., Ltd. | | | 3,500 | | | | 1,442 | | |
FUJIFILM Holdings Corp. | | | 20,100 | | | | 569 | | |
Fujitsu Ltd. (b) | | | 78,200 | | | | 404 | | |
Fukuoka Financial Group, Inc. | | | 40,000 | | | | 175 | | |
Hankyu Hanshin Holdings, Inc. | | | 32,000 | | | | 173 | | |
Hirose Electric Co., Ltd. | | | 1,400 | | | | 199 | | |
Hisamitsu Pharmaceutical Co., Inc. | | | 2,100 | | | | 106 | | |
Hitachi Ltd. | | | 140,000 | | | | 1,058 | | |
Hitachi Metals Ltd. | | | 4,000 | | | | 56 | | |
Honda Motor Co., Ltd. | | | 56,613 | | | | 2,328 | | |
Hoya Corp. | | | 17,400 | | | | 483 | | |
IHI Corp. | | | 44,530 | | | | 192 | | |
Inpex Corp. | | | 9,200 | | | | 118 | | |
ITOCHU Corp. | | | 53,351 | | | | 658 | | |
Japan Real Estate Investment Corp. REIT | | | 38 | | | | 204 | | |
Japan Retail Fund Investment Corp. REIT | | | 65 | | | | 132 | | |
Japan Tobacco, Inc. | | | 28,500 | | | | 926 | | |
JFE Holdings, Inc. | | | 22,300 | | | | 530 | | |
JGC Corp. | | | 10,546 | | | | 413 | | |
Joyo Bank Ltd. (The) | | | 47,000 | | | | 240 | | |
JSR Corp. | | | 5,908 | | | | 114 | | |
JX Holdings, Inc. | | | 98,346 | | | | 505 | | |
Kajima Corp. | | | 65,000 | | | | 244 | | |
Kansai Electric Power Co., Inc. (The) (b) | | | 14,800 | | | | 170 | | |
Kao Corp. | | | 16,100 | | | | 506 | | |
Kawasaki Heavy Industries Ltd. | | | 41,500 | | | | 174 | | |
Keikyu Corp. (a) | | | 15,000 | | | | 123 | | |
Keio Corp. | | | 12,000 | | | | 80 | | |
Keyence Corp. | | | 1,557 | | | | 665 | | |
Kintetsu Corp. (a) | | | 61,750 | | | | 216 | | |
Kirin Holdings Co., Ltd. (a) | | | 25,000 | | | | 359 | | |
Kobe Steel Ltd. (a)(b) | | | 47,000 | | | | 80 | | |
Komatsu Ltd. | | | 35,800 | | | | 726 | | |
Konica Minolta, Inc. | | | 20,030 | | | | 200 | | |
Kubota Corp. | | | 50,000 | | | | 826 | | |
Kuraray Co., Ltd. | | | 12,556 | | | | 149 | | |
Kurita Water Industries Ltd. | | | 1,400 | | | | 29 | | |
Kyocera Corp. | | | 13,800 | | | | 688 | | |
Kyushu Electric Power Co., Inc. (b) | | | 6,600 | | | | 84 | | |
Lawson, Inc. (a) | | | 2,700 | | | | 202 | | |
LIXIL Group Corp. | | | 8,262 | | | | 226 | | |
Marubeni Corp. | | | 52,550 | | | | 377 | | |
Maruichi Steel Tube Ltd. | | | 900 | | | | 23 | | |
The accompanying notes are an integral part of the financial statements.
10
Morgan Stanley Institutional Fund, Inc.
Annual Report — December 31, 2013
Portfolio of Investments (cont'd)
Active International Allocation Portfolio
| | | Shares | | Value
(000) | |
Japan (cont'd) | |
Mitsubishi Chemical Holdings Corp. (a) | | | 50,500 | | | $ | 233 | | |
Mitsubishi Corp. | | | 47,900 | | | | 917 | | |
Mitsubishi Electric Corp. | | | 65,352 | | | | 819 | | |
Mitsubishi Estate Co., Ltd. | | | 45,000 | | | | 1,344 | | |
Mitsubishi Heavy Industries Ltd. | | | 118,550 | | | | 733 | | |
Mitsubishi Materials Corp. | | | 78,000 | | | | 287 | | |
Mitsubishi Tanabe Pharma Corp. | | | 7,900 | | | | 110 | | |
Mitsubishi UFJ Financial Group, Inc. (See Note G) | | | 207,606 | | | | 1,368 | | |
Mitsui & Co., Ltd. | | | 58,300 | | | | 811 | | |
Mitsui Fudosan Co., Ltd. | | | 33,900 | | | | 1,218 | | |
Mitsui OSK Lines Ltd. | | | 12,000 | | | | 54 | | |
Mizuho Financial Group, Inc. | | | 859,800 | | | | 1,861 | | |
MS&AD Insurance Group Holdings | | | 17,260 | | | | 463 | | |
Murata Manufacturing Co., Ltd. | | | 8,400 | | | | 745 | | |
NEC Corp. | | | 101,900 | | | | 229 | | |
NGK Insulators Ltd. | | | 14,660 | | | | 278 | | |
NGK Spark Plug Co., Ltd. | | | 9,059 | | | | 214 | | |
Nidec Corp. (a) | | | 3,804 | | | | 372 | | |
Nikon Corp. | | | 12,700 | | | | 242 | | |
Nintendo Co., Ltd. | | | 3,808 | | | | 507 | | |
Nippon Building Fund, Inc. REIT (a) | | | 46 | | | | 267 | | |
Nippon Express Co., Ltd. | | | 35,300 | | | | 171 | | |
Nippon Steel Sumitomo Metal Corp. | | | 386,108 | | | | 1,291 | | |
Nippon Telegraph & Telephone Corp. | | | 12,200 | | | | 656 | | |
Nippon Yusen KK (a) | | | 46,015 | | | | 147 | | |
Nissan Motor Co., Ltd. | | | 84,205 | | | | 707 | | |
Nitto Denko Corp. | | | 7,400 | | | | 312 | | |
NKSJ Holdings, Inc. | | | 10,600 | | | | 294 | | |
Nomura Holdings, Inc. | | | 105,750 | | | | 812 | | |
NSK Ltd. | | | 4,553 | | | | 57 | | |
NTT Data Corp. | | | 6,900 | | | | 254 | | |
NTT DoCoMo, Inc. | | | 17,200 | | | | 282 | | |
Obayashi Corp. | | | 46,571 | | | | 265 | | |
OJI Holdings Corp. | | | 12,000 | | | | 61 | | |
Omron Corp. | | | 10,104 | | | | 446 | | |
Ono Pharmaceutical Co., Ltd. | | | 2,700 | | | | 236 | | |
Oriental Land Co., Ltd. | | | 2,550 | | | | 367 | | |
ORIX Corp. | | | 26,560 | | | | 466 | | |
Osaka Gas Co., Ltd. | | | 37,600 | | | | 147 | | |
Otsuka Holdings Co., Ltd. | | | 8,100 | | | | 234 | | |
Resona Holdings, Inc. | | | 20,100 | | | | 102 | | |
Rohm Co., Ltd. | | | 6,605 | | | | 321 | | |
Santen Pharmaceutical Co., Ltd. | | | 2,700 | | | | 126 | | |
Secom Co., Ltd. | | | 7,485 | | | | 451 | | |
Sekisui Chemical Co., Ltd. | | | 21,072 | | | | 258 | | |
Sekisui House Ltd. | | | 42,646 | | | | 595 | | |
Seven & I Holdings Co., Ltd. | | | 20,400 | | | | 810 | | |
Shimamura Co., Ltd. | | | 300 | | | | 28 | | |
Shimano, Inc. | | | 4,350 | | | | 373 | | |
Shimizu Corp. | | | 51,000 | | | | 257 | | |
Shin-Etsu Chemical Co., Ltd. | | | 13,793 | | | | 804 | | |
Shionogi & Co., Ltd. | | | 10,000 | | | | 217 | | |
| | | Shares | | Value
(000) | |
Shiseido Co., Ltd. (a) | | | 11,600 | | | $ | 186 | | |
Shizuoka Bank Ltd. (The) | | | 25,000 | | | | 266 | | |
Showa Denko KK (a) | | | 11,000 | | | | 16 | | |
SMC Corp. | | | 2,005 | | | | 505 | | |
Softbank Corp. | | | 43,200 | | | | 3,774 | | |
Sony Corp. | | | 28,893 | | | | 501 | | |
Sumitomo Chemical Co., Ltd. | | | 49,600 | | | | 194 | | |
Sumitomo Corp. | | | 35,100 | | | | 440 | | |
Sumitomo Electric Industries Ltd. | | | 22,400 | | | | 373 | | |
Sumitomo Metal Mining Co., Ltd. | | | 42,300 | | | | 553 | | |
Sumitomo Mitsui Financial Group, Inc. | | | 42,400 | | | | 2,182 | | |
Sumitomo Mitsui Trust Holdings, Inc. | | | 233,167 | | | | 1,227 | | |
Sumitomo Realty & Development Co., Ltd. | | | 16,500 | | | | 819 | | |
T&D Holdings, Inc. | | | 19,800 | | | | 276 | | |
Taiheiyo Cement Corp. | | | 7,000 | | | | 27 | | |
Taisei Corp. (a) | | | 59,000 | | | | 268 | | |
Takeda Pharmaceutical Co., Ltd. | | | 25,900 | | | | 1,187 | | |
TDK Corp. | | | 5,252 | | | | 251 | | |
Teijin Ltd. | | | 8,608 | | | | 19 | | |
Terumo Corp. | | | 8,150 | | | | 392 | | |
THK Co., Ltd. | | | 2,800 | | | | 70 | | |
Tobu Railway Co., Ltd. | | | 34,900 | | | | 169 | | |
Tohoku Electric Power Co., Inc. (b) | | | 9,700 | | | | 109 | | |
Tokio Marine Holdings, Inc. | | | 32,320 | | | | 1,079 | | |
Tokyo Electron Ltd. | | | 9,900 | | | | 541 | | |
Tokyo Gas Co., Ltd. | | | 42,600 | | | | 210 | | |
Tokyu Corp. | | | 40,400 | | | | 261 | | |
Tokyu Fudosan Holdings Corp. (b) | | | 23,000 | | | | 216 | | |
Toppan Printing Co., Ltd. | | | 19,600 | | | | 157 | | |
Toray Industries, Inc. | | | 42,100 | | | | 291 | | |
Toshiba Corp. | | | 122,026 | | | | 512 | | |
Toyo Suisan Kaisha Ltd. | | | 3,000 | | | | 90 | | |
Toyota Industries Corp. | | | 3,950 | | | | 178 | | |
Toyota Motor Corp. | | | 101,655 | | | | 6,197 | | |
Trend Micro, Inc. | | | 5,400 | | | | 189 | | |
Unicharm Corp. | | | 8,700 | | | | 496 | | |
West Japan Railway Co. | | | 2,342 | | | | 101 | | |
Yahoo! Japan Corp. | | | 82,600 | | | | 459 | | |
Yakult Honsha Co., Ltd. | | | 2,700 | | | | 136 | | |
Yamada Denki Co., Ltd. (a) | | | 45,900 | | | | 150 | | |
Yamato Holdings Co., Ltd. | | | 10,935 | | | | 221 | | |
Yamato Kogyo Co., Ltd. | | | 800 | | | | 26 | | |
| | | | 79,469 | | |
Macau (0.0%) | |
Galaxy Entertainment Group Ltd. (b)(c) | | | 6,000 | | | | 54 | | |
Malta (0.0%) | |
BGP Holdings PLC (b)(d)(e) | | | 72,261 | | | | — | | |
Netherlands (3.6%) | |
Aegon N.V. | | | 58,068 | | | | 548 | | |
Akzo Nobel N.V. | | | 10,223 | | | | 792 | | |
ArcelorMittal | | | 27,242 | | | | 486 | | |
ASML Holding N.V. | | | 20,657 | | | | 1,933 | | |
The accompanying notes are an integral part of the financial statements.
11
Morgan Stanley Institutional Fund, Inc.
Annual Report — December 31, 2013
Portfolio of Investments (cont'd)
Active International Allocation Portfolio
| | | Shares | | Value
(000) | |
Netherlands (cont'd) | |
CNH Industrial N.V. (b) | | | 109,164 | | | $ | 1,244 | | |
Corio N.V. REIT | | | 1,621 | | | | 73 | | |
Fugro N.V. CVA | | | 1,617 | | | | 96 | | |
Gemalto N.V. (a) | | | 1,538 | | | | 169 | | |
Heineken N.V. | | | 5,018 | | | | 339 | | |
ING Groep N.V. CVA (b) | | | 172,636 | | | | 2,399 | | |
Koninklijke Ahold N.V. | | | 24,897 | | | | 447 | | |
Koninklijke Boskalis Westminster N.V. | | | 164 | | | | 9 | | |
Koninklijke DSM N.V. | | | 4,004 | | | | 315 | | |
Koninklijke KPN N.V. (b) | | | 97,148 | | | | 313 | | |
Koninklijke Philips N.V. | | | 20,965 | | | | 768 | | |
Randstad Holding N.V. | | | 287 | | | | 19 | | |
Reed Elsevier N.V. | | | 25,007 | | | | 530 | | |
TNT Express N.V. | | | 41,426 | | | | 384 | | |
Unilever N.V. CVA | | | 32,772 | | | | 1,320 | | |
Wolters Kluwer N.V. | | | 16,992 | | | | 485 | | |
Ziggo N.V. | | | 6,165 | | | | 282 | | |
| | | | 12,951 | | |
Norway (0.5%) | |
Aker Solutions ASA | | | 2,393 | | | | 43 | | |
DnB ASA | | | 26,267 | | | | 470 | | |
Norsk Hydro ASA | | | 26,092 | | | | 116 | | |
Orkla ASA | | | 11,540 | | | | 90 | | |
Statoil ASA | | | 19,527 | | | | 473 | | |
Subsea 7 SA | | | 4,052 | | | | 78 | | |
Telenor ASA | | | 24,913 | | | | 594 | | |
| | | | 1,864 | | |
Poland (0.6%) | |
Bank Pekao SA | | | 4,041 | | | | 240 | | |
Bank Zachodni WBK SA | | | 909 | | | | 117 | | |
Cyfrowy Polsat SA (b) | | | 4,073 | | | | 27 | | |
Eurocash SA | | | 3,129 | | | | 49 | | |
Jeronimo Martins SGPS SA | | | 19,787 | | | | 387 | | |
KGHM Polska Miedz SA | | | 4,398 | | | | 172 | | |
mBank | | | 600 | | | | 99 | | |
PGE SA | | | 24,965 | | | | 134 | | |
Polski Koncern Naftowy Orlen SA | | | 10,732 | | | | 146 | | |
Polskie Gornictwo Naftowe i Gazownictwo SA | | | 58,722 | | | | 100 | | |
Powszechna Kasa Oszczednosci Bank Polski SA | | | 27,182 | | | | 355 | | |
Powszechny Zaklad Ubezpieczen SA | | | 1,801 | | | | 268 | | |
Tauron Polska Energia SA | | | 45,020 | | | | 65 | | |
Telekomunikacja Polska SA | | | 21,957 | | | | 71 | | |
| | | | 2,230 | | |
Portugal (0.2%) | |
EDP - Energias de Portugal SA | | | 69,140 | | | | 254 | | |
Galp Energia SGPS SA | | | 11,427 | | | | 187 | | |
Portugal Telecom SGPS SA (Registered) | | | 22,697 | | | | 99 | | |
| | | | 540 | | |
Singapore (0.1%) | |
Ascendas Real Estate Investment Trust REIT | | | 3,000 | | | | 5 | | |
CapitaLand Ltd. | | | 5,000 | | | | 12 | | |
| | | Shares | | Value
(000) | |
CapitaMall Trust REIT | | | 4,218 | | | $ | 6 | | |
City Developments Ltd. (a) | | | 1,203 | | | | 9 | | |
ComfortDelGro Corp., Ltd. | | | 3,627 | | | | 6 | | |
DBS Group Holdings Ltd. | | | 4,091 | | | | 55 | | |
Genting Singapore PLC | | | 14,000 | | | | 17 | | |
Jardine Cycle & Carriage Ltd. | | | 65 | | | | 2 | | |
Keppel Corp., Ltd. | | | 3,200 | | | | 28 | | |
Noble Group Ltd. | | | 5,350 | | | | 5 | | |
Oversea-Chinese Banking Corp., Ltd. | | | 7,851 | | | | 63 | | |
SembCorp Industries Ltd. | | | 1,694 | | | | 7 | | |
SembCorp Marine Ltd. (a) | | | 1,400 | | | | 5 | | |
Singapore Airlines Ltd. (a) | | | 1,286 | | | | 11 | | |
Singapore Exchange Ltd. | | | 1,071 | | | | 6 | | |
Singapore Press Holdings Ltd. (a) | | | 4,433 | | | | 15 | | |
Singapore Technologies Engineering Ltd. | | | 3,000 | | | | 9 | | |
Singapore Telecommunications Ltd. | | | 15,745 | | | | 46 | | |
United Overseas Bank Ltd. | | | 3,956 | | | | 67 | | |
Wilmar International Ltd. | | | 2,000 | | | | 5 | | |
| | | | 379 | | |
South Africa (0.3%) | |
SABMiller PLC | | | 17,733 | | | | 911 | | |
Spain (0.9%) | |
Abertis Infraestructuras SA | | | 4,474 | | | | 99 | | |
ACS Actividades de Construccion y Servicios SA | | | 1,737 | | | | 60 | | |
Amadeus IT Holding SA, Class A | | | 4,421 | | | | 189 | | |
Distribuidora Internacional de Alimentacion SA | | | 7,104 | | | | 63 | | |
Enagas SA | | | 2,219 | | | | 58 | | |
Ferrovial SA | | | 4,688 | | | | 91 | | |
Gas Natural SDG SA | | | 4,070 | | | | 105 | | |
Grifols SA | | | 1,733 | | | | 83 | | |
Iberdrola SA | | | 55,207 | | | | 352 | | |
Inditex SA | | | 2,535 | | | | 418 | | |
International Consolidated Airlines Group SA (b) | | | 10,780 | | | | 72 | | |
Mapfre SA | | | 8,946 | | | | 38 | | |
Red Electrica Corp., SA (a) | | | 1,257 | | | | 84 | | |
Repsol SA | | | 9,941 | | | | 250 | | |
Telefonica SA | | | 76,997 | | | | 1,254 | | |
Zardoya Otis SA | | | 1,869 | | | | 34 | | |
| | | | 3,250 | | |
Sweden (3.0%) | |
Assa Abloy AB, Class B | | | 13,417 | | | | 709 | | |
Electrolux AB, Class B | | | 4,342 | | | | 114 | | |
Elekta AB, Class B (a) | | | 13,406 | | | | 205 | | |
Getinge AB, Class B | | | 12,330 | | | | 422 | | |
Hennes & Mauritz AB, Class B | | | 34,147 | | | | 1,573 | | |
Investor AB, Class B | | | 26,083 | | | | 897 | | |
Lundin Petroleum AB (b) | | | 6,116 | | | | 119 | | |
Nordea Bank AB | | | 102,069 | | | | 1,375 | | |
Scania AB, Class B | | | 13,512 | | | | 265 | | |
Securitas AB, Class B | | | 3,395 | | | | 36 | | |
Skanska AB, Class B | | | 18,954 | | | | 387 | | |
Svenska Cellulosa AB SCA, Class B | | | 23,077 | | | | 710 | | |
The accompanying notes are an integral part of the financial statements.
12
Morgan Stanley Institutional Fund, Inc.
Annual Report — December 31, 2013
Portfolio of Investments (cont'd)
Active International Allocation Portfolio
| | | Shares | | Value
(000) | |
Sweden (cont'd) | |
Svenska Handelsbanken AB, Class A | | | 23,819 | | | $ | 1,170 | | |
Swedish Match AB | | | 6,751 | | | | 217 | | |
Tele2 AB, Class B | | | 8,876 | | | | 101 | | |
Telefonaktiebolaget LM Ericsson, Class B | | | 101,527 | | | | 1,239 | | |
TeliaSonera AB | | | 71,678 | | | | 597 | | |
Volvo AB, Class B | | | 50,303 | | | | 660 | | |
| | | | 10,796 | | |
Switzerland (9.0%) | |
ABB Ltd. (Registered) (b) | | | 79,533 | | | | 2,093 | | |
Adecco SA (Registered) (b) | | | 259 | | | | 21 | | |
Baloise Holding AG (Registered) | | | 2,383 | | | | 303 | | |
Cie Financiere Richemont SA (Registered) | | | 9,038 | | | | 900 | | |
Credit Suisse Group AG (Registered) (b) | | | 58,166 | | | | 1,778 | | |
Geberit AG (Registered) | | | 1,692 | | | | 513 | | |
Givaudan SA (Registered) (b) | | | 245 | | | | 350 | | |
Holcim Ltd. (Registered) (b) | | | 7,543 | | | | 564 | | |
Julius Baer Group Ltd. (b) | | | 7,840 | | | | 377 | | |
Logitech International SA (Registered) | | | 5,462 | | | | 75 | | |
Lonza Group AG (Registered) (b) | | | 1,152 | | | | 109 | | |
Nestle SA (Registered) | | | 90,395 | | | | 6,617 | | |
Novartis AG (Registered) | | | 62,611 | | | | 4,997 | | |
Pargesa Holding SA | | | 277 | | | | 22 | | |
Roche Holding AG (Genusschein) | | | 17,807 | | | | 4,975 | | |
Schindler Holding AG | | | 2,089 | | | | 307 | | |
SGS SA (Registered) | | | 25 | | | | 58 | | |
Sonova Holding AG (Registered) (b) | | | 1,317 | | | | 177 | | |
Swatch Group AG (The) | | | 580 | | | | 383 | | |
Swiss Life Holding AG (Registered) (b) | | | 1,050 | | | | 218 | | |
Swiss Prime Site AG (Registered) (b) | | | 1,470 | | | | 114 | | |
Swiss Re AG (b) | | | 16,876 | | | | 1,552 | | |
Swisscom AG (Registered) | | | 774 | | | | 409 | | |
Syngenta AG (Registered) | | | 1,817 | | | | 724 | | |
UBS AG (Registered) (b) | | | 164,265 | | | | 3,116 | | |
Zurich Insurance Group AG (b) | | | 6,287 | | | | 1,822 | | |
| | | | 32,574 | | |
United Kingdom (21.2%) | |
| | 3 | i Group PLC | | | 20,541 | | | | 131 | | |
Aberdeen Asset Management PLC | | | 35,322 | | | | 292 | | |
Admiral Group PLC | | | 5,443 | | | | 118 | | |
Aggreko PLC | | | 74,589 | | | | 2,111 | | |
AMEC PLC | | | 10,297 | | | | 186 | | |
Anglo American PLC | | | 56,308 | | | | 1,231 | | |
ARM Holdings PLC | | | 73,050 | | | | 1,329 | | |
AstraZeneca PLC | | | 28,930 | | | | 1,712 | | |
Aviva PLC | | | 190,775 | | | | 1,421 | | |
BAE Systems PLC | | | 99,087 | | | | 714 | | |
Barclays PLC | | | 579,517 | | | | 2,610 | | |
BG Group PLC | | | 98,965 | | | | 2,126 | | |
BHP Billiton PLC | | | 56,568 | | | | 1,751 | | |
| BP PLC | | | 339,329 | | | | 2,742 | | |
British American Tobacco PLC | | | 29,932 | | | | 1,605 | | |
| | | Shares | | Value
(000) | |
British Land Co., PLC REIT | | | 26,302 | | | $ | 274 | | |
British Sky Broadcasting Group PLC | | | 67,687 | | | | 946 | | |
BT Group PLC | | | 241,889 | | | | 1,520 | | |
Bunzl PLC | | | 14,365 | | | | 345 | | |
Burberry Group PLC | | | 8,526 | | | | 214 | | |
Capita PLC | | | 8,159 | | | | 140 | | |
Carnival PLC | | | 5,995 | | | | 248 | | |
Centrica PLC | | | 88,525 | | | | 510 | | |
Cobham PLC | | | 955 | | | | 4 | | |
Compass Group PLC | | | 70,372 | | | | 1,128 | | |
Croda International PLC | | | 3,627 | | | | 148 | | |
Diageo PLC | | | 47,085 | | | | 1,559 | | |
easyJet PLC | | | 12,991 | | | | 330 | | |
Experian PLC | | | 32,609 | | | | 602 | | |
G4S PLC | | | 18,108 | | | | 79 | | |
GKN PLC | | | 35,734 | | | | 221 | | |
GlaxoSmithKline PLC | | | 109,120 | | | | 2,912 | | |
Glencore Xstrata PLC (b) | | | 50,128 | | | | 260 | | |
Hammerson PLC REIT | | | 21,851 | | | | 182 | | |
HSBC Holdings PLC | | | 491,383 | | | | 5,390 | | |
Imperial Tobacco Group PLC | | | 11,917 | | | | 461 | | |
InterContinental Hotels Group PLC | | | 11,570 | | | | 386 | | |
International Consolidated Airlines Group SA (b) | | | 98,087 | | | | 652 | | |
Intertek Group PLC | | | 5,056 | | | | 264 | | |
Intu Properties PLC REIT | | | 16,011 | | | | 82 | | |
Investec PLC | | | 7,723 | | | | 56 | | |
J Sainsbury PLC | | | 37,416 | | | | 226 | | |
Johnson Matthey PLC | | | 5,078 | | | | 276 | | |
Kingfisher PLC | | | 33,270 | | | | 212 | | |
Land Securities Group PLC REIT | | | 23,454 | | | | 374 | | |
Legal & General Group PLC | | | 190,142 | | | | 701 | | |
Lloyds Banking Group PLC (b) | | | 1,722,351 | | | | 2,250 | | |
Marks & Spencer Group PLC | | | 40,442 | | | | 290 | | |
Meggitt PLC | | | 23,485 | | | | 205 | | |
National Grid PLC | | | 101,141 | | | | 1,320 | | |
Next PLC | | | 6,527 | | | | 589 | | |
Old Mutual PLC | | | 144,706 | | | | 453 | | |
Pearson PLC | | | 31,266 | | | | 694 | | |
Petrofac Ltd. | | | 8,074 | | | | 164 | | |
Prudential PLC | | | 66,575 | | | | 1,477 | | |
Reckitt Benckiser Group PLC | | | 19,146 | | | | 1,520 | | |
Reed Elsevier PLC | | | 42,736 | | | | 636 | | |
Rexam PLC | | | 19,455 | | | | 171 | | |
Rio Tinto PLC | | | 33,529 | | | | 1,893 | | |
Rolls-Royce Holdings PLC (b) | | | 53,237 | | | | 1,124 | | |
Royal Dutch Shell PLC, Class A | | | 105,681 | | | | 3,785 | | |
Royal Dutch Shell PLC, Class B | | | 80,565 | | | | 3,042 | | |
RSA Insurance Group PLC | | | 107,526 | | | | 163 | | |
Sage Group PLC (The) | | | 50,539 | | | | 338 | | |
Schroders PLC | | | 3,576 | | | | 154 | | |
Segro PLC REIT | | | 23,317 | | | | 129 | | |
Serco Group PLC | | | 8,046 | | | | 66 | | |
Severn Trent PLC | | | 14,763 | | | | 417 | | |
The accompanying notes are an integral part of the financial statements.
13
Morgan Stanley Institutional Fund, Inc.
Annual Report — December 31, 2013
Portfolio of Investments (cont'd)
Active International Allocation Portfolio
| | | Shares | | Value
(000) | |
United Kingdom (cont'd) | |
Smith & Nephew PLC | | | 78,054 | | | $ | 1,113 | | |
Smiths Group PLC | | | 9,543 | | | | 234 | | |
SSE PLC | | | 44,427 | | | | 1,008 | | |
Standard Chartered PLC | | | 64,478 | | | | 1,452 | | |
Standard Life PLC | | | 58,611 | | | | 349 | | |
Tesco PLC | | | 206,308 | | | | 1,142 | | |
Tullow Oil PLC | | | 408 | | | | 6 | | |
Unilever PLC | | | 19,085 | | | | 784 | | |
United Utilities Group PLC | | | 6,639 | | | | 74 | | |
Vodafone Group PLC | | | 1,500,603 | | | | 5,889 | | |
Weir Group PLC (The) | | | 5,839 | | | | 206 | | |
Whitbread PLC | | | 7,291 | | | | 453 | | |
Wolseley PLC | | | 7,483 | | | | 424 | | |
WPP PLC | | | 79,309 | | | | 1,812 | | |
| | | | 76,607 | | |
United States (0.0%) | |
Li & Fung Ltd. (a)(c) | | | 16,000 | | | | 21 | | |
Perrigo Co., PLC | | | 392 | | | | 60 | | |
| | | | 81 | | |
Total Common Stocks (Cost $291,559) | | | 326,177 | | |
| | | No. of
Rights | | | |
Rights (0.0%) | |
Spain (0.0%) | |
| Repsol SA (a)(b) (Cost $7) | | | 9,941 | | | | 7 | | |
| | | Shares | | | |
Short-Term Investments (10.6%) | |
Securities held as Collateral on Loaned Securities (2.2%) | |
Investment Company (1.8%) | |
Morgan Stanley Institutional Liquidity
Funds — Money Market Portfolio —
Institutional Class (See Note G) | | | 6,362,044 | | | | 6,362 | | |
| | | Face
Amount
(000) | | | |
Repurchase Agreements (0.4%) | |
Barclays Capital, Inc., (0.01%,
dated 12/31/13, due 1/2/14;
proceeds $1,289; fully collateralized by a
U.S. Government Obligation; 1.00%
due 3/31/17; valued at $1,315) | | $ | 1,289 | | | | 1,289 | | |
BNP Paribas Securities Corp., (0.01%,
dated 12/31/13, due 1/2/14;
proceeds $112; fully collateralized by a
U.S. Government Obligation; 3.63%
due 2/15/21; valued at $114) | | | 112 | | | | 112 | | |
| | | | 1,401 | | |
Total Securities held as Collateral on Loaned
Securities (Cost $7,763) | | | 7,763 | | |
| | | Shares | | Value
(000) | |
Investment Company (8.4%) | |
Morgan Stanley Institutional Liquidity
Funds — Money Market Portfolio —
Institutional Class (See Note G)
(Cost $30,516) | | | 30,515,597 | | | $ | 30,516 | | |
Total Short-Term Investments (Cost $38,279) | | | 38,279 | | |
Total Investments (100.8%) (Cost $329,845)
Including $7,738 of Securities Loaned (f) | | | 364,463 | | |
Liabilities in Excess of Other Assets (-0.8%) | | | (2,905 | ) | |
Net Assets (100.0%) | | $ | 361,558 | | |
(a) All or a portion of this security was on loan at December 31, 2013.
(b) Non-income producing security.
(c) Security trades on the Hong Kong exchange.
(d) Security has been deemed illiquid at December 31, 2013.
(e) At December 31, 2013, the Portfolio held a fair valued securitiy valued at $0, representing 0.0% of net assets. This securitiy has been fair valued as determined in good faith under procedures established by and under the general supervision of the Fund's Directors.
(f) Securities are available for collateral in connection with open foreign currency forward exchange and futures contracts.
@ Value is less than $500.
ADR American Depositary Receipt.
CVA Certificaten Van Aandelen.
REIT Real Estate Investment Trust.
VVPR Verminderde Voorheffing Précompte Réduit.
The accompanying notes are an integral part of the financial statements.
14
Morgan Stanley Institutional Fund, Inc.
Annual Report — December 31, 2013
Portfolio of Investments (cont'd)
Active International Allocation Portfolio
Foreign Currency Forward Exchange Contracts:
The Portfolio had the following foreign currency forward exchange contracts open at December 31, 2013:
Counterparty | | Currency to
Deliver
(000) | | Value
(000) | | Settlement
Date | | In Exchange
For
(000) | | Value
(000) | | Unrealized
Appreciation
(Depreciation)
(000) | |
Bank of New York Mellon | | AUD | 1,879 | | | $ | 1,676 | | | 1/16/14 | | USD | 1,667 | | | $ | 1,667 | | | $ | (9 | ) | |
Commonwealth Bank of Australia | | USD | 6,646 | | | | 6,646 | | | 1/16/14 | | AUD | 7,492 | | | | 6,683 | | | | 37 | | |
Credit Suisse London Branch (GFX) | | USD | 17,749 | | | | 17,749 | | | 1/16/14 | | EUR | 12,928 | | | | 17,785 | | | | 36 | | |
Deutsche Bank AG London | | USD | 3,781 | | | | 3,781 | | | 1/16/14 | | EUR | 2,754 | | | | 3,789 | | | | 8 | | |
Royal Bank of Scotland | | JPY | 527,478 | | | | 5,009 | | | 1/16/14 | | USD | 5,136 | | | | 5,136 | | | | 127 | | |
State Street Bank and Trust Co. | | EUR | 1,191 | | | | 1,638 | | | 1/16/14 | | USD | 1,635 | | | | 1,635 | | | | (3 | ) | |
UBS AG | | EUR | 6,059 | | | | 8,335 | | | 1/16/14 | | USD | 8,318 | | | | 8,318 | | | | (17 | ) | |
UBS AG | | GBP | 1,451 | | | | 2,404 | | | 1/16/14 | | USD | 2,375 | | | | 2,375 | | | | (29 | ) | |
UBS AG | | JPY | 488,314 | | | | 4,638 | | | 1/16/14 | | USD | 4,755 | | | | 4,755 | | | | 117 | | |
UBS AG | | USD | 3,004 | | | | 3,004 | | | 1/16/14 | | GBP | 1,850 | | | | 3,063 | | | | 59 | | |
| | | | | $ | 54,880 | | | | | | | $ | 55,206 | | | $ | 326 | | |
Futures Contracts:
The Portfolio had the following futures contracts open at December 31, 2013:
| | | Number
of
Contracts | | Value
(000) | | Expiration
Date | | Unrealized
Appreciation
(Depreciation)
(000) | |
Long: | |
ASX Spi 200 Index (Australia) | | | 33 | | | $ | 3,917 | | | Mar-14 | | $ | 215 | | |
CAC 40 Index (France) | | | 92 | | | | 5,440 | | | Jan-14 | | | 285 | | |
DAX Index (Germany) | | | 11 | | | | 3,634 | | | Mar-14 | | | 157 | | |
FTSE 100 Index (United Kingdom) | | | 21 | | | | 2,329 | | | Mar-14 | | | 64 | | |
FTSE MIB Index (Italy) | | | 59 | | | | 7,721 | | | Mar-14 | | | 345 | | |
Hang Seng Index (Hong Kong) | | | 28 | | | | 4,213 | | | Jan-14 | | | 22 | | |
Hong Kong Index (Hong Kong) | | | 26 | | | | 1,816 | | | Jan-14 | | | (24 | ) | |
IBEX 35 Index (Spain) | | | 31 | | | | 4,209 | | | Jan-14 | | | 238 | | |
TOPIX Index (Japan) | | | 20 | | | | 2,474 | | | Mar-14 | | | 99 | | |
| | | | | | | | | $ | 1,401 | | |
AUD — Australian Dollar
EUR — Euro
GBP — British Pound
JPY — Japanese Yen
USD — United States Dollar
The accompanying notes are an integral part of the financial statements.
15
Morgan Stanley Institutional Fund, Inc.
Annual Report — December 31, 2013
Active International Allocation Portfolio
Statement of Assets and Liabilities | | December 31, 2013
(000) | |
Assets: | |
Investments in Securities of Unaffiliated Issuers, at Value(1) (Cost $290,672) | | $ | 326,217 | | |
Investment in Security of Affiliated Issuer, at Value (Cost $39,173) | | | 38,246 | | |
Total Investments in Securities, at Value (Cost $329,845) | | | 364,463 | | |
Foreign Currency, at Value (Cost $3,147) | | | 3,106 | | |
Cash | | | 321 | | |
Receivable for Variation Margin on Futures Contracts | | | 2,593 | | |
Unrealized Appreciation on Foreign Currency Forward Exchange Contracts | | | 384 | | |
Dividends Receivable | | | 278 | | |
Tax Reclaim Receivable | | | 161 | | |
Receivable for Investments Sold | | | 132 | | |
Receivable for Portfolio Shares Sold | | | 22 | | |
Receivable from Affiliate | | | 2 | | |
Other Assets | | | 21 | | |
Total Assets | | | 371,483 | | |
Liabilities: | |
Collateral on Securities Loaned, at Value | | | 8,117 | | |
Payable for Portfolio Shares Redeemed | | | 622 | | |
Payable for Advisory Fees | | | 522 | | |
Payable for Sub Transfer Agency Fees | | | 260 | | |
Payable for Sub Transfer Agency Fees — Class I | | | 105 | | |
Payable for Sub Transfer Agency Fees — Class A* | | | 37 | | |
Payable for Sub Transfer Agency Fees — Class L | | | 6 | | |
Payable for Investments Purchased | | | 79 | | |
Unrealized Depreciation on Foreign Currency Forward Exchange Contracts | | | 58 | | |
Payable for Administration Fees | | | 24 | | |
Payable for Directors' Fees and Expenses | | | 12 | | |
Payable for Custodian Fees | | | 10 | | |
Payable for Shareholder Services Fees — Class A* | | | 19 | | |
Payable for Distribution and Shareholder Services Fees — Class L | | | 6 | | |
Payable for Transfer Agent Fees — Class I | | | 1 | | |
Payable for Transfer Agent Fees — Class A* | | | 4 | | |
Payable for Transfer Agent Fees — Class L | | | 1 | | |
Payable for Professional Fees | | | 4 | | |
Other Liabilities | | | 38 | | |
Total Liabilities | | | 9,925 | | |
Net Assets | | $ | 361,558 | | |
Net Assets Consist Of: | |
Paid-in-Capital | | $ | 371,387 | | |
Distributions in Excess of Net Investment Income | | | (399 | ) | |
Accumulated Net Realized Loss | | | (45,746 | ) | |
Unrealized Appreciation (Depreciation) on: | |
Investments | | | 35,545 | | |
Investments in Affiliates | | | (927 | ) | |
Futures Contracts | | | 1,401 | | |
Foreign Currency Forward Exchange Contracts | | | 326 | | |
Foreign Currency Translations | | | (29 | ) | |
Net Assets | | $ | 361,558 | | |
The accompanying notes are an integral part of the financial statements.
16
Morgan Stanley Institutional Fund, Inc.
Annual Report — December 31, 2013
Active International Allocation Portfolio
Statement of Assets and Liabilities (cont'd) | | December 31, 2013
(000) | |
CLASS I: | |
Net Assets | | $ | 260,614 | | |
| Shares Outstanding $0.001 par value shares of beneficial interest (500,000,000 shares authorized) (not in 000's) | | | 18,960,308 | | |
Net Asset Value, Offering and Redemption Price Per Share | | $ | 13.75 | | |
CLASS A*: | |
Net Assets | | $ | 90,599 | | |
| Shares Outstanding $0.001 par value shares of beneficial interest (500,000,000 shares authorized) (not in 000's) | | | 6,458,841 | | |
Net Asset Value, Redemption Price Per Share | | $ | 14.03 | | |
Maximum Sales Load§§ | | | 5.25 | % | |
Maximum Sales Charge | | $ | 0.78 | | |
Maximum Offering Price Per Share | | $ | 14.81 | | |
CLASS L: | |
Net Assets | | $ | 10,345 | | |
| Shares Outstanding $0.001 par value shares of beneficial interest (500,000,000 shares authorized) (not in 000's) | | | 740,444 | | |
Net Asset Value, Offering and Redemption Price Per Share | | $ | 13.97 | | |
(1) Including:
Securities on Loan, at Value: | | $ | 7,738 | | |
* Effective September 9, 2013, Class P and Class H shares were renamed Class A shares.
§§ Effective February 25, 2013, the Directors approved the imposition of a maximum initial sales charge of 5.25% on purchases of Class A shares of the Portfolio.
The accompanying notes are an integral part of the financial statements.
17
Morgan Stanley Institutional Fund, Inc.
Annual Report — December 31, 2013
Active International Allocation Portfolio
Statement of Operations | | Year Ended
December 31, 2013
(000) | |
Investment Income: | |
Dividends from Securities of Unaffiliated Issuers (Net of $746 of Foreign Taxes Withheld) | | $ | 8,695 | | |
Income from Securities Loaned — Net | | | 311 | | |
Dividends from Securities of Affiliated Issuers (Note G) | | | 74 | | |
Interest from Securities of Unaffiliated Issuers | | | 4 | | |
Total Investment Income | | | 9,084 | | |
Expenses: | |
Advisory Fees (Note B) | | | 2,310 | | |
Sub Transfer Agency Fees | | | 250 | | |
Sub Transfer Agency Fees — Class I | | | 106 | | |
Sub Transfer Agency Fees — Class A* | | | 37 | | |
Sub Transfer Agency Fees — Class L | | | 6 | | |
Shareholder Services Fees — Class A* (Note D) | | | 222 | | |
Distribution and Shareholder Services Fees — Class L (Note D) | | | 76 | | |
Administration Fees (Note C) | | | 284 | | |
Custodian Fees (Note F) | | | 160 | | |
Professional Fees | | | 83 | | |
Shareholder Reporting Fees | | | 75 | | |
Registration Fees | | | 55 | | |
Transfer Agency Fees (Note E) | | | 40 | | |
Transfer Agency Fees — Class I (Note E) | | | 2 | | |
Transfer Agency Fees — Class A* (Note E) | | | 6 | | |
Transfer Agency Fees — Class L (Note E) | | | 1 | | |
Pricing Fees | | | 36 | | |
Directors' Fees and Expenses | | | 9 | | |
Other Expenses | | | 59 | | |
Expenses Before Non Operating Expenses | | | 3,817 | | |
Reorganization Expense | | | (174 | )** | |
Total Expenses | | | 3,643 | | |
Waiver of Advisory Fees (Note B) | | | (226 | ) | |
Reimbursement of Class Specific Expenses — Class I (Note B) | | | (62 | ) | |
Reimbursement of Class Specific Expenses — Class A* (Note B) | | | (1 | ) | |
Reimbursement of Class Specific Expenses — Class L (Note B) | | | (2 | ) | |
Rebate from Morgan Stanley Affiliate (Note G) | | | (61 | ) | |
Net Expenses | | | 3,291 | | |
Net Investment Income | | | 5,793 | | |
Realized Gain (Loss): | |
Investments Sold | | | 19,305 | | |
Investments in Affiliates | | | (217 | ) | |
Foreign Currency Forward Exchange Contracts | | | 2,647 | | |
Foreign Currency Transactions | | | (321 | ) | |
Futures Contracts | | | 7,936 | | |
Net Realized Gain | | | 29,350 | | |
Change in Unrealized Appreciation (Depreciation): | |
Investments | | | 31,215 | | |
Investments in Affiliates | | | 501 | | |
Foreign Currency Forward Exchange Contracts | | | (48 | ) | |
Foreign Currency Translations | | | 63 | | |
Futures Contracts | | | 1,255 | | |
Net Change in Unrealized Appreciation (Depreciation) | | | 32,986 | | |
Net Realized Gain and Change in Unrealized Appreciation (Depreciation) | | | 62,336 | | |
Net Increase in Net Assets Resulting from Operations | | $ | 68,129 | | |
* Effective September 9, 2013, Class P and Class H shares were renamed Class A shares.
** Over accrual of reorganization expense.
The accompanying notes are an integral part of the financial statements.
18
Morgan Stanley Institutional Fund, Inc.
Annual Report — December 31, 2013
Active International Allocation Portfolio
Statements of Changes in Net Assets | | Year Ended
December 31,
2013
(000) | | Year Ended
December 31,
2012
(000) | |
Increase (Decrease) in Net Assets: | |
Operations: | |
Net Investment Income | | $ | 5,793 | | | $ | 6,342 | | |
Net Realized Gain | | | 29,350 | | | | 9,586 | | |
Net Change in Unrealized Appreciation (Depreciation) | | | 32,986 | | | | 35,076 | | |
Net Increase in Net Assets Resulting from Operations | | | 68,129 | | | | 51,004 | | |
Distributions from and/or in Excess of: | |
Class I: | |
Net Investment Income | | | (6,934 | ) | | | (3,450 | ) | |
Class A*: | |
Net Investment Income | | | (1,805 | ) | | | (94 | ) | |
Class H@@: | |
Net Investment Income | | | (308 | )** | | | (996 | ) | |
Class L: | |
Net Investment Income | | | (195 | ) | | | (125 | ) | |
Total Distributions | | | (9,242 | ) | | | (4,665 | ) | |
Capital Share Transactions:(1) | |
Class I: | |
Subscribed | | | 11,713 | | | | 12,992 | | |
Issued due to a tax-free reorganization | | | — | | | | 679 | | |
Distributions Reinvested | | | 6,894 | | | | 3,430 | | |
Redeemed | | | (51,945 | ) | | | (108,108 | ) | |
Class A*: | |
Subscribed | | | 7,891 | | | | 777 | | |
Distributions Reinvested | | | 1,767 | | | | 94 | | |
Conversion from Class H | | | 75,886 | | | | — | | |
Redeemed | | | (11,733 | ) | | | (4,011 | ) | |
Class H@@: | |
Subscribed | | | 907 | ** | | | 170 | *** | |
Issued due to a tax-free reorganization | | | — | | | | 75,514 | | |
Distributions Reinvested | | | 299 | ** | | | 964 | *** | |
Conversion to Class A | | | (75,886 | )** | | | — | | |
Redeemed | | | (8,634 | )** | | | (3,890 | )*** | |
Class L: | |
Subscribed | | | 58 | | | | 10 | *** | |
Issued due to a tax-free reorganization | | | — | | | | 10,085 | | |
Distributions Reinvested | | | 191 | | | | 121 | *** | |
Redeemed | | | (1,854 | ) | | | (484 | )*** | |
Net Decrease in Net Assets Resulting from Capital Share Transactions | | | (44,446 | ) | | | (11,657 | ) | |
Redemption Fees | | | — | @ | | | — | @ | |
Total Increase in Net Assets | | | 14,441 | | | | 34,682 | | |
Net Assets: | |
Beginning of Period | | | 347,117 | | | | 312,435 | | |
End of Period (Including Distributions in Excess of Net Investment Income of $(399) and $(460)) | | $ | 361,558 | | | $ | 347,117 | | |
The accompanying notes are an integral part of the financial statements.
19
Morgan Stanley Institutional Fund, Inc.
Annual Report — December 31, 2013
Active International Allocation Portfolio
Statements of Changes in Net Assets (cont'd) | | Year Ended
December 31,
2013
(000) | | Year Ended
December 31,
2012
(000) | |
(1) Capital Share Transactions: | |
Class I: | |
Shares Subscribed | | | 908 | | | | 1,201 | | |
Shares Issued due to tax-free reorganization | | | — | | | | 61 | | |
Shares Issued on Distributions Reinvested | | | 531 | | | | 300 | | |
Shares Redeemed | | | (4,074 | ) | | | (9,967 | ) | |
Net Decrease in Class I Shares Outstanding | | | (2,635 | ) | | | (8,405 | ) | |
Class A*: | |
Shares Subscribed | | | 631 | | | | 72 | | |
Shares Issued on Distributions Reinvested | | | 132 | | | | 8 | | |
Conversion from Class H | | | 5,855 | | | | — | | |
Shares Redeemed | | | (883 | ) | | | (368 | ) | |
Net Increase (Decrease) in Class A* Shares Outstanding | | | 5,735 | | | | (288 | ) | |
Class H@@: | |
Shares Subscribed | | | 73 | ** | | | 15 | *** | |
Shares Issued due to tax-free reorganization | | | — | | | | 6,700 | | |
Shares Issued on Distributions Reinvested | | | 24 | ** | | | 83 | *** | |
Conversion to Class A | | | (5,868 | )** | | | — | | |
Shares Redeemed | | | (688 | )** | | | (339 | )*** | |
Net Increase (Decrease) in Class H Shares Outstanding | | | (6,459 | ) | | | 6,459 | *** | |
Class L: | |
Shares Subscribed | | | 4 | | | | 1 | *** | |
Shares Issued due to tax-free reorganization | | | — | | | | 896 | | |
Shares Issued on Distributions Reinvested | | | 15 | | | | 10 | *** | |
Shares Redeemed | | | (144 | ) | | | (42 | )*** | |
Net Increase (Decrease) in Class L Shares Outstanding | | | (125 | ) | | | 865 | *** | |
@ Amount is less than $500.
@@ Effective September 9, 2013, Class H shares converted into Class A shares.
* Effective September 9, 2013, Class P shares were renamed Class A shares.
** For the period January 1, 2013 through September 6, 2013.
*** For the period June 15, 2012 through December 31, 2012.
The accompanying notes are an integral part of the financial statements.
20
Morgan Stanley Institutional Fund, Inc.
Annual Report — December 31, 2013
Financial Highlights
Active International Allocation Portfolio
| | | Class I | |
| | | Year Ended December 31, | |
Selected Per Share Data and Ratios | | 2013 | | 2012 | | 2011 | | 2010 | | 2009 | |
Net Asset Value, Beginning of Period | | $ | 11.65 | | | $ | 10.07 | | | $ | 12.06 | | | $ | 11.30 | | | $ | 9.11 | | |
Income (Loss) from Investment Operations: | |
Net Investment Income† | | | 0.22 | | | | 0.23 | | | | 0.27 | | | | 0.20 | | | | 0.21 | | |
Net Realized and Unrealized Gain (Loss) | | | 2.25 | | | | 1.51 | | | | (2.03 | ) | | | 0.81 | | | | 2.26 | | |
Total from Investment Operations | | | 2.47 | | | | 1.74 | | | | (1.76 | ) | | | 1.01 | | | | 2.47 | | |
Distributions from and/or in Excess of: | |
Net Investment Income | | | (0.37 | ) | | | (0.16 | ) | | | (0.23 | ) | | | (0.25 | ) | | | (0.28 | ) | |
Redemption Fees | | | 0.00 | ‡ | | | 0.00 | ‡ | | | 0.00 | ‡ | | | 0.00 | ‡ | | | 0.00 | ‡ | |
Net Asset Value, End of Period | | $ | 13.75 | | | $ | 11.65 | | | $ | 10.07 | | | $ | 12.06 | | | $ | 11.30 | | |
Total Return++ | | | 21.38 | % | | | 17.30 | % | | | (14.56 | )% | | | 8.95 | % | | | 27.26 | % | |
Ratios and Supplemental Data: | |
Net Assets, End of Period (Thousands) | | $ | 260,614 | | | $ | 251,657 | | | $ | 302,048 | | | $ | 441,350 | | | $ | 532,584 | | |
Ratio of Expenses to Average Net Assets (1) | | | 0.83 | %+ | | | 0.89 | %+ | | | 0.84 | %+††^ | | | 0.79 | %+†† | | | 0.79 | %+ | |
Ratio of Expenses to Average Net Assets Excluding Non Operating Expenses | | | 0.88 | %+ | | | N/A | | | | 0.84 | %+††^ | | | 0.79 | %+†† | | | 0.79 | %+ | |
Ratio of Net Investment Income to Average Net Assets (1) | | | 1.71 | %+ | | | 2.12 | %+ | | | 2.33 | %+†† | | | 1.82 | %+†† | | | 2.23 | %+ | |
Ratio of Rebate from Morgan Stanley Affiliates to Average Net Assets | | | 0.02 | % | | | 0.01 | % | | | 0.01 | %†† | | | 0.01 | %†† | | | 0.01 | % | |
Portfolio Turnover Rate | | | 36 | % | | | 27 | % | | | 26 | % | | | 19 | % | | | 33 | % | |
(1) Supplemental Information on the Ratios to Average Net Assets: | |
Ratios Before Expense Limitation: | |
Expenses to Average Net Assets | | | 0.99 | % | | | 0.98 | % | | | 0.95 | %†† | | | 0.92 | %+†† | | | 0.85 | %+ | |
Net Investment Income to Average Net Assets | | | 1.55 | % | | | 2.03 | % | | | 2.22 | %†† | | | 1.69 | %+†† | | | 2.17 | %+ | |
† Per share amount is based on average shares outstanding.
‡ Amount is less than $0.005 per share.
++ Calculated based on the net asset value as of the last business day of the period.
+ The Ratios of Expenses and Net Investment Income reflect the rebate of certain Portfolio expenses in connection with the investments in Morgan Stanley affiliates during the period. The effect of the rebate on the ratios is disclosed in the above table as "Ratio of Rebate from Morgan Stanley Affiliates to Average Net Assets."
†† Reflects overall Portfolio ratios for investment income and non-class specific expenses.
^ Effective July 1, 2011, the Adviser has agreed to limit the ratio of expenses to average net assets to the maximum ratio of 0.90% for Class I shares. Prior to July 1, 2011, the maximum ratio was 0.80% for Class I shares.
The accompanying notes are an integral part of the financial statements.
21
Morgan Stanley Institutional Fund, Inc.
Annual Report — December 31, 2013
Financial Highlights
Active International Allocation Portfolio
| | | Class A@ | |
| | | Year Ended December 31, | |
Selected Per Share Data and Ratios | | 2013 | | 2012 | | 2011 | | 2010 | | 2009 | |
Net Asset Value, Beginning of Period | | $ | 11.89 | | | $ | 10.27 | | | $ | 12.28 | | | $ | 11.50 | | | $ | 9.27 | | |
Income (Loss) from Investment Operations: | |
Net Investment Income† | | | 0.11 | | | | 0.20 | | | | 0.25 | | | | 0.18 | | | | 0.18 | | |
Net Realized and Unrealized Gain (Loss) | | | 2.36 | | | | 1.55 | | | | (2.07 | ) | | | 0.81 | | | | 2.31 | | |
Total from Investment Operations | | | 2.47 | | | | 1.75 | | | | (1.82 | ) | | | 0.99 | | | | 2.49 | | |
Distributions from and/or in Excess of: | |
Net Investment Income | | | (0.33 | ) | | | (0.13 | ) | | | (0.19 | ) | | | (0.21 | ) | | | (0.26 | ) | |
Redemption Fees | | | 0.00 | ‡ | | | 0.00 | ‡ | | | 0.00 | ‡ | | | 0.00 | ‡ | | | 0.00 | ‡ | |
Net Asset Value, End of Period | | $ | 14.03 | | | $ | 11.89 | | | $ | 10.27 | | | $ | 12.28 | | | $ | 11.50 | | |
Total Return++ | | | 20.94 | % | | | 17.05 | % | | | (14.75 | )% | | | 8.69 | % | | | 26.99 | % | |
Ratios and Supplemental Data: | |
Net Assets, End of Period (Thousands) | | $ | 90,599 | | | $ | 8,608 | | | $ | 10,387 | | | $ | 14,477 | | | $ | 16,479 | | |
Ratio of Expenses to Average Net Assets (1) | | | 1.09 | %+^^ | | | 1.14 | %+ | | | 1.09 | %+††^ | | | 1.04 | %+†† | | | 1.04 | %+ | |
Ratio of Expenses to Average Net Assets Excluding Non Operating Expenses | | | 1.21 | %+^^ | | | N/A | | | | 1.09 | %+††^ | | | 1.04 | %+†† | | | 1.04 | %+ | |
Ratio of Net Investment Income to Average Net Assets (1) | | | 0.84 | %+ | | | 1.80 | %+ | | | 2.08 | %+†† | | | 1.57 | %+†† | | | 1.80 | %+ | |
Ratio of Rebate from Morgan Stanley Affiliates to Average Net Assets | | | 0.02 | % | | | 0.01 | % | | | 0.01 | %†† | | | 0.01 | %†† | | | 0.01 | % | |
Portfolio Turnover Rate | | | 36 | % | | | 27 | % | | | 26 | % | | | 19 | % | | | 33 | % | |
(1) Supplemental Information on the Ratios to Average Net Assets: | |
Ratios Before Expense Limitation: | |
Expenses to Average Net Assets | | | 1.25 | %+ | | | 1.23 | % | | | 1.20 | %†† | | | 1.17 | %+†† | | | 1.10 | %+ | |
Net Investment Income to Average Net Assets | | | 0.68 | %+ | | | 1.71 | % | | | 1.97 | %†† | | | 1.44 | %+†† | | | 1.74 | %+ | |
@ Effective September 9, 2013, Class P and Class H shares were renamed Class A shares.
† Per share amount is based on average shares outstanding.
‡ Amount is less than $0.005 per share.
++ Calculated based on the net asset value which does not reflect sales charges, if applicable, as of the last business day of the period.
+ The Ratios of Expenses and Net Investment Income reflect the rebate of certain Portfolio expenses in connection with the investments in Morgan Stanley affiliates during the period. The effect of the rebate on the ratios is disclosed in the above table as "Ratio of Rebate from Morgan Stanley Affiliates to Average Net Assets."
^^ Effective September 16, 2013, the Adviser has agreed to limit the ratio of expenses to average net assets to the maximum ratio of 1.25% for Class A shares. Prior to September 16, 2013, the maximum ratio was 1.15% for Class A shares.
†† Reflects overall Portfolio ratios for investment income and non-class specific expenses.
^ Effective July 1, 2011, the Adviser has agreed to limit the ratio of expenses to average net assets to the maximum ratio of 1.15% for Class A shares. Prior to July 1, 2011, the maximum ratio was 1.05% for Class A shares.
The accompanying notes are an integral part of the financial statements.
22
Morgan Stanley Institutional Fund, Inc.
Annual Report — December 31, 2013
Financial Highlights
Active International Allocation Portfolio
| | | Class L | |
Selected Per Share Data and Ratios | | Year Ended
December 31,
2013 | | Period from
June 14, 2012^ to
December 31, 2012 | |
Net Asset Value, Beginning of Period | | $ | 11.84 | | | $ | 10.09 | | |
Income from Investment Operations: | |
Net Investment Income (Loss)† | | | 0.12 | | | | (0.02 | ) | |
Net Realized and Unrealized Gain | | | 2.27 | | | | 1.91 | | |
Total from Investment Operations | | | 2.39 | | | | 1.89 | | |
Distributions from and/or in Excess of: | |
Net Investment Income | | | (0.26 | ) | | | (0.14 | ) | |
Redemption Fees | | | 0.00 | ‡ | | | 0.00 | ‡ | |
Net Asset Value, End of Period | | $ | 13.97 | | | $ | 11.84 | | |
Total Return++ | | | 20.34 | % | | | 18.80 | %# | |
Ratios and Supplemental Data: | |
Net Assets, End of Period (Thousands) | | $ | 10,345 | | | $ | 10,246 | | |
Ratio of Expenses to Average Net Assets (1) | | | 1.61 | %+^^ | | | 1.63 | %+* | |
Ratio of Expenses to Average Net Assets Excluding Non Operating Expenses | | | 1.66 | %+^^ | | | N/A | | |
Ratio of Net Investment Income (Loss) to Average Net Assets (1) | | | 0.94 | %+ | | | (0.33 | )%+* | |
Ratio of Rebate from Morgan Stanley Affiliates to Average Net Assets | | | 0.02 | % | | | 0.02 | %* | |
Portfolio Turnover Rate | | | 36 | % | | | 27 | %# | |
(1) Supplemental Information on the Ratios to Average Net Assets: | |
Ratios Before Expense Limitation: | |
Expenses to Average Net Assets | | | 1.76 | % | | | 1.79 | %* | |
Net Investment Income (Loss) to Average Net Assets | | | 0.79 | % | | | (0.49 | )%* | |
^ Commencement of Operations.
† Per share amount is based on average shares outstanding.
‡ Amount is less than $0.005 per share.
++ Calculated based on the net asset value as of the last business day of the period.
+ The Ratios of Expenses and Net Investment Income (Loss) reflect the rebate of certain Portfolio expenses in connection with the investments in Morgan Stanley affiliates during the period. The effect of the rebate on the ratios is disclosed in the above table as "Ratio of Rebate from Morgan Stanley Affiliates to Average Net Assets."
^^ Effective September 16, 2013, the Adviser has agreed to limit the ratio of expenses to average net assets to the maximum ratio of 1.75% for Class L shares. Prior to September 16, 2013, the maximum ratio was 1.65% for Class L shares.
# Not Annualized.
* Annualized.
The accompanying notes are an integral part of the financial statements.
23
Morgan Stanley Institutional Fund, Inc.
Annual Report — December 31, 2013
Notes to Financial Statements
Morgan Stanley Institutional Fund, Inc. (the "Fund") is registered under the Investment Company Act of 1940, as amended (the "Act"), as an open-end management investment company. The Fund is comprised of twenty-seven separate, active, diversified and non-diversified portfolios (individually referred to as a "Portfolio", collectively as the "Portfolios").
The accompanying financial statements relate to the Active International Allocation Portfolio. The Portfolio seeks long-term capital appreciation by investing primarily, in accordance with country and sector weightings determined by Morgan Stanley Investment Management Inc. (the "Adviser"), in equity securities of non-U.S. issuers which, in the aggregate, replicate broad market indices. The Portfolio offers three classes of shares — Class I, Class A and Class L.
Effective September 9, 2013, Class P and Class H shares were renamed Class A shares.
On October 29, 2012, the Portfolio acquired the net assets of Morgan Stanley International Fund ("International Fund"), an open-end investment company, based on the respective valuations as of the close of business on October 26, 2012, pursuant to a Plan of Reorganization approved by the shareholders of International Fund on September 27, 2012 ("Reorganization"). The purpose of the transaction was to combine two portfolios managed by Morgan Stanley Investment Management Inc. with comparable investment objectives and strategies. The acquisition was accomplished by a tax-free exchange of 61,343 Class I shares of the Portfolio at a net asset value of $11.07 per share for 59,586 Class I shares of International Fund; 896,450 Class L shares of the Portfolio at a net asset value of $11.25 for 912,498 Class C shares of International Fund; 6,700,425 Class H shares of the Portfolio at a net asset value of $11.27 for 6,353,440 Class A shares, 328,778 Class B shares, 7,150 Class R shares and 7,607 Class W shares of International Fund. The net assets of International Fund before the Reorganization were approximately $86,278,000, including unrealized appreciation of approximately $1,091,000 at October 26, 2012. The investment portfolio of International Fund, with a fair value of approximately $85,845,000 and identified cost of approximately $84,464,000 on October 26, 2012, was the principal asset acquired by the Portfolio. For financial reporting purposes, assets received and shares issued by the Portfolio were recorded at fair value; however, the cost basis of the investments received from International Fund was carried forward to align ongoing reporting of the Portfolio's realized and unrealized gains and losses with amounts distributable to shareholders for tax purposes. Immediately prior to the
Reorganization, the net assets of the Portfolio were approximately $289,363,000. Immediately after the merger, the net assets of the Portfolio were approximately $375,641,000.
Upon closing of the Reorganization, shareholders of International Fund received shares of the Portfolio as follows:
International
Fund | | Active
International
Allocation
Portfolio | |
| Class A | | Class H | |
| Class B | | Class H | |
| Class R | | Class H | |
| Class W | | Class H | |
| Class C | | Class L | |
| Class I | | Class I | |
Assuming the acquisition had been completed on January 1, 2012, the beginning of the annual reporting period of the Portfolio, the Portfolio's pro forma results of operations for the year ended December 31, 2012, are as follows:
Net investment income(1) | | $ | 11,123,000 | | |
Net gain realized and unrealized gain(2) | | $ | 44,689,000 | | |
Net increase in net assets resulting from operations | | $ | 55,812,000 | | |
(1) Approximately $6,342,000 as reported, plus approximately $2,780,000 International Fund premerger, plus approximately $2,001,000 of estimated pro-forma eliminated expenses.
(2) Approximately $44,662,000 as reported, plus approximately $27,000 International Fund premerger.
Because the combined investment portfolios have been managed as a single integrated portfolio since the acquisition was completed, it is not practicable to separate the amounts of revenue and earnings of International Fund that have been included in the Portfolio's Statement of Operations since December 31, 2012.
A. Significant Accounting Policies: The following significant accounting policies are in conformity with U.S. generally accepted accounting principles ("GAAP"). Such policies are consistently followed by the Fund in the preparation of its financial statements. GAAP may require management to make estimates and assumptions that affect the reported amounts and disclosures in the financial statements. Actual results may differ from those estimates.
1. Security Valuation: (1) An equity portfolio security listed or traded on an exchange is valued at its latest reported sales price (or at the exchange official closing price if such exchange reports an official closing price), if there were no sales on a given day, the security is valued at the mean between the last reported bid and asked prices; (2) all other equity portfolio securities for which over-the-counter market quotations are readily available are valued
24
Morgan Stanley Institutional Fund, Inc.
Annual Report — December 31, 2013
Notes to Financial Statements (cont'd)
at its latest reported sales price. In cases where a security is traded on more than one exchange, the security is valued on the exchange designated as the primary market; (3) futures are valued at the latest price published by the commodities exchange on which they trade; (4) when market quotations are not readily available, including circumstances under which the Adviser determines that the closing price, last sale price or the mean between the last reported bid and asked prices are not reflective of a security's market value, portfolio securities are valued at their fair value as determined in good faith under procedures established by and under the general supervision of the Fund's Board of Directors (the "Directors"). Occasionally, developments affecting the closing prices of securities and other assets may occur between the times at which valuations of such securities are determined (that is, close of the foreign market on which the securities trade) and the close of business of the New York Stock Exchange ("NYSE"). If developments occur during such periods that are expected to materially affect the value of such securities, such valuations may be adjusted to reflect the estimated fair value of such securities as of the close of the NYSE, as determined in good faith by the Directors or by the Adviser using a pricing service and/or procedures approved by the Directors; (5) investments in mutual funds, including the Morgan Stanley Institutional Liquidity Funds, are valued at the net asset value as of the close of each business day; (6) quotations of foreign portfolio securities, other assets and liabilities and forward contracts stated in foreign currency are translated into U.S. dollar equivalents at the prevailing market rates prior to the close of the NYSE; and (7) short-term debt securities with remaining maturities of 60 days or less at the time of purchase may be valued at amortized cost, unless the Adviser determines such valuation does not reflect the securities' market value, in which case these securities will be valued at their fair market value determined by the Adviser.
Under procedures approved by the Directors, the Fund's Adviser has formed a Valuation Committee. The Valuation Committee provides administration and oversight of the Fund's valuation policies and procedures, which are reviewed at least annually by the Directors. These procedures allow the Fund to utilize independent pricing services, quotations from securities and financial instrument dealers, and other market sources to determine fair value.
The Fund has procedures to determine the fair value of securities and other financial instruments for which market prices are not readily available. Under these procedures, the Valuation Committee convenes on a regular and ad hoc basis to review such securities and considers a number of factors, including valuation methodologies and significant unobservable valuation inputs, when arriving at fair value. The Valuation Committee may employ a market-based approach which may use related or comparable assets or liabilities, recent transactions, market multiples, book values, and other relevant information for the investment to determine the fair value of the investment. An income-based valuation approach may also be used in which the anticipated future cash flows of the investment are discounted to calculate fair value. Discounts may also be applied due to the nature or duration of any restrictions on the disposition of the investments. Due to the inherent uncertainty of valuations of such investments, the fair values may differ significantly from the values that would have been used had an active market existed. The Valuation Committee employs various methods for calibrating these valuation approaches including a regular review of valuation methodologies, key inputs and assumptions, transactional back-testing or disposition analysis, and reviews of any related market activity.
2. Fair Value Measurement: Financial Accounting Standards Board ("FASB") Accounting Standards CodificationTM ("ASC") 820, "Fair Value Measurements and Disclosures" ("ASC 820"), defines fair value as the value that the Fund would receive to sell an investment or pay to transfer a liability in a timely transaction with an independent buyer in the principal market, or in the absence of a principal market the most advantageous market for the investment or liability. ASC 820 establishes a three-tier hierarchy to distinguish between (1) inputs that reflect the assumptions market participants would use in valuing an asset or liability developed based on market data obtained from sources independent of the reporting entity (observable inputs) and (2) inputs that reflect the reporting entity's own assumptions about the assumptions market participants would use in valuing an asset or liability developed based on the best information available in the circumstances (unobservable inputs) and to establish classification of fair value measurements for disclosure purposes. Various inputs are used in determining the value of the Fund's
25
Morgan Stanley Institutional Fund, Inc.
Annual Report — December 31, 2013
Notes to Financial Statements (cont'd)
investments. The inputs are summarized in the three broad levels listed below.
• Level 1 – unadjusted quoted prices in active markets for identical investments
• Level 2 – other significant observable inputs (including quoted prices for similar investments, interest rates, prepayment speeds, credit risk, etc.)
• Level 3 – significant unobservable inputs including the Fund's own assumptions in determining the fair value of investments. Factors considered in making this determination may include, but are not limited to, information obtained by contacting the issuer, analysts, or the appropriate stock exchange (for exchange-traded securities), analysis of the issuer's financial statements or other available documents and, if necessary, available information concerning other securities in similar circumstances
The inputs or methodology used for valuing securities are not necessarily an indication of the risk associated with investing in those securities and the determination of the significance of a particular input to the fair value measurement in its entirety requires judgment and considers factors specific to each security.
The following is a summary of the inputs used to value the Portfolio's investments as of December 31, 2013.
Investment Type | | Level 1
Unadjusted
quoted
prices
(000) | | Level 2
Other
significant
observable
inputs
(000) | | Level 3
Significant
unobservable
inputs
(000) | | Total
(000) | |
Assets: | |
Common Stocks | |
Aerospace & Defense | | $ | 3,881 | | | $ | — | | | $ | — | | | $ | 3,881 | | |
Air Freight & Logistics | | | 1,768 | | | | — | | | | — | | | | 1,768 | | |
Airlines | | | 1,663 | | | | — | | | | — | | | | 1,663 | | |
Auto Components | | | 4,024 | | | | — | | | | — | | | | 4,024 | | |
Automobiles | | | 16,895 | | | | — | | | | — | | | | 16,895 | | |
Beverages | | | 5,368 | | | | — | @ | | | — | | | | 5,368 | | |
Biotechnology | | | 1,118 | | | | — | | | | — | | | | 1,118 | | |
Building Products | | | 3,017 | | | | — | | | | — | | | | 3,017 | | |
Capital Markets | | | 9,718 | | | | — | | | | — | | | | 9,718 | | |
Chemicals | | | 9,848 | | | | — | | | | — | | | | 9,848 | | |
Commercial Banks | | | 39,045 | | | | — | | | | — | | | | 39,045 | | |
Commercial Services &
Supplies | | | 3,575 | | | | — | | | | — | | | | 3,575 | | |
Communications
Equipment | | | 2,209 | | | | — | | | | — | | | | 2,209 | | |
Investment Type | | Level 1
Unadjusted
quoted
prices
(000) | | Level 2
Other
significant
observable
inputs
(000) | | Level 3
Significant
unobservable
inputs
(000) | | Total
(000) | |
Common Stocks (cont'd) | |
Computers & Peripherals | | $ | 473 | | | $ | — | | | $ | — | | | $ | 473 | | |
Construction & Engineering | | | 3,881 | | | | — | | | | — | | | | 3,881 | | |
Construction Materials | | | 1,698 | | | | — | | | | — | | | | 1,698 | | |
Consumer Finance | | | 131 | | | | — | | | | — | | | | 131 | | |
Containers & Packaging | | | 444 | | | | — | | | | — | | | | 444 | | |
Distributors | | | 2 | | | | — | | | | — | | | | 2 | | |
Diversified Consumer
Services | | | 115 | | | | — | | | | — | | | | 115 | | |
Diversified Financial
Services | | | 4,607 | | | | — | | | | — | † | | | 4,607 | | |
Diversified
Telecommunication
Services | | | 9,625 | | | | — | | | | — | | | | 9,625 | | |
Electric Utilities | | | 3,061 | | | | — | | | | — | | | | 3,061 | | |
Electrical Equipment | | | 6,376 | | | | — | | | | — | | | | 6,376 | | |
Electronic Equipment,
Instruments &
Components | | | 5,104 | | | | — | | | | — | | | | 5,104 | | |
Energy Equipment &
Services | | | 925 | | | | — | | | | — | | | | 925 | | |
Food & Staples Retailing | | | 6,770 | | | | — | | | | — | | | | 6,770 | | |
Food Products | | | 10,354 | | | | — | | | | — | | | | 10,354 | | |
Gas Utilities | | | 631 | | | | — | | | | — | | | | 631 | | |
Health Care Equipment &
Supplies | | | 2,812 | | | | — | | | | — | | | | 2,812 | | |
Health Care Providers &
Services | | | 831 | | | | — | | | | — | | | | 831 | | |
Hotels, Restaurants &
Leisure | | | 3,308 | | | | — | | | | — | | | | 3,308 | | |
Household Durables | | | 1,468 | | | | — | | | | — | | | | 1,468 | | |
Household Products | | | 3,041 | | | | — | | | | — | | | | 3,041 | | |
Industrial Conglomerates | | | 5,040 | | | | — | | | | — | | | | 5,040 | | |
Information Technology
Services | | | 1,986 | | | | — | | | | — | | | | 1,986 | | |
Insurance | | | 21,246 | | | | — | | | | — | | | | 21,246 | | |
Internet Software &
Services | | | 588 | | | | — | | | | — | | | | 588 | | |
Leisure Equipment &
Products | | | 615 | | | | — | | | | — | | | | 615 | | |
Life Sciences Tools &
Services | | | 109 | | | | — | | | | — | | | | 109 | | |
Machinery | | | 9,098 | | | | — | | | | — | | | | 9,098 | | |
Marine | | | 972 | | | | — | | | | — | | | | 972 | | |
Media | | | 6,199 | | | | — | | | | — | | | | 6,199 | | |
Metals & Mining | | | 13,070 | | | | — | | | | — | | | | 13,070 | | |
Multi-Utilities | | | 4,049 | | | | — | | | | — | | | | 4,049 | | |
Multi-line Retail | | | 914 | | | | — | | | | — | | | | 914 | | |
Office Electronics | | | 662 | | | | — | | | | — | | | | 662 | | |
Oil, Gas & Consumable
Fuels | | | 17,142 | | | | — | | | | — | | | | 17,142 | | |
Paper & Forest Products | | | 865 | | | | — | | | | — | | | | 865 | | |
Personal Products | | | 1,052 | | | | — | | | | — | | | | 1,052 | | |
Pharmaceuticals | | | 27,054 | | | | — | | | | — | | | | 27,054 | | |
Professional Services | | | 1,150 | | | | — | | | | — | | | | 1,150 | | |
Real Estate Investment
Trusts (REITs) | | | 3,613 | | | | — | | | | — | | | | 3,613 | | |
Real Estate Management &
Development | | | 6,064 | | | | — | | | | — | | | | 6,064 | | |
Road & Rail | | | 3,576 | | | | — | | | | — | | | | 3,576 | | |
26
Morgan Stanley Institutional Fund, Inc.
Annual Report — December 31, 2013
Notes to Financial Statements (cont'd)
Investment Type | | Level 1
Unadjusted
quoted
prices
(000) | | Level 2
Other
significant
observable
inputs
(000) | | Level 3
Significant
unobservable
inputs
(000) | | Total
(000) | |
Common Stocks (cont'd) | |
Semiconductors &
Semiconductor
Equipment | | $ | 4,212 | | | $ | — | | | $ | — | | | $ | 4,212 | | |
Software | | | 3,668 | | | | — | | | | — | | | | 3,668 | | |
Specialty Retail | | | 3,823 | | | | — | | | | — | | | | 3,823 | | |
Textiles, Apparel & Luxury
Goods | | | 3,232 | | | | — | | | | — | | | | 3,232 | | |
Tobacco | | | 3,209 | | | | — | | | | — | | | | 3,209 | | |
Trading Companies &
Distributors | | | 4,315 | | | | — | | | | — | | | | 4,315 | | |
Transportation
Infrastructure | | | 331 | | | | — | | | | — | | | | 331 | | |
Water Utilities | | | 491 | | | | — | | | | — | | | | 491 | | |
Wireless
Telecommunication
Services | | | 10,046 | | | | — | | | | — | | | | 10,046 | | |
Total Common Stocks | | | 326,177 | | | | — | @ | | | — | † | | | 326,177 | | |
Rights | | | 7 | | | | — | | | | — | | | | 7 | | |
Short-Term Investments | |
Investment Company | | | 36,878 | | | | — | | | | — | | | | 36,878 | | |
Repurchase Agreements | | | — | | | | 1,401 | | | | — | | | | 1,401 | | |
Total Short-Term
Investments | | | 36,878 | | | | 1,401 | | | | — | | | | 38,279 | | |
Foreign Currency Forward
Exchange Contracts | | | — | | | | 384 | | | | — | | | | 384 | | |
Futures Contracts | | | 1,425 | | | | — | | | | — | | | | 1,425 | | |
Total Assets | | | 364,487 | | | | 1,785 | | | | — | † | | | 366,272 | | |
Liabilities: | |
Foreign Currency Forward
Exchange Contracts | | | — | | | | (58 | ) | | | — | | | | (58 | ) | |
Futures Contracts | | | (24 | ) | | | — | | | | — | | | | (24 | ) | |
Total Liabilities | | | (24 | ) | | | (58 | ) | | | — | | | | (82 | ) | |
Total | | $ | 364,463 | | | $ | 1,727 | | | $ | — | † | | $ | 366,190 | | |
@ Value is less than $500
† Includes one security which is valued at zero.
Transfers between investment levels may occur as the markets fluctuate and/or the availability of data used in an investment's valuation changes. The Portfolio recognizes transfers between the levels as of the end of the period. As of December 31, 2013, securities with a total value of approximately $303,045,000 transferred from Level 2 to Level 1. At December 31, 2012, the fair value of certain securities were adjusted due to developments which occurred between the time of the close of the foreign markets on which they trade and the close of business on the NYSE which resulted in their Level 2 classification. As of December 31, 2013, a security with a value of less than $500 transferred from Level 1 to Level 2. A security that was valued using an unadjusted quoted price at December 31, 2012 was valued using significant other inputs at December 31, 2013.
Following is a reconciliation of investments in which significant unobservable inputs (Level 3) were used in determining fair value.
| | | Common
Stock
(000) | |
Beginning Balance | | $ | — | †† | |
Purchases | | | — | | |
Sales | | | — | | |
Amortization of discount | | | — | | |
Transfers in | | | — | | |
Transfers out | | | — | | |
Change in unrealized appreciation/depreciation | | | — | | |
Realized gains (losses) | | | — | | |
Ending Balance | | $ | — | †† | |
Net change in unrealized appreciation/depreciation from investments
still held as of December 31, 2013 | | $ | — | | |
†† Includes one security which is valued at zero.
3. Foreign Currency Translation and Foreign Investments: The books and records of the Portfolio are maintained in U.S. dollars. Foreign currency amounts are translated into U.S. dollars as follows:
– investments, other assets and liabilities at the prevailing rate of exchange on the valuation date;
– investment transactions and investment income at the prevailing rates of exchange on the dates of such transactions.
Although the net assets of the Portfolio are presented at the foreign exchange rates and market values at the close of the period, the Portfolio does not isolate that portion of the results of operations arising as a result of changes in the foreign exchange rates from the fluctuations arising from changes in the market prices of securities held at period end. Similarly, the Portfolio does not isolate the effect of changes in foreign exchange rates from the fluctuations arising from changes in the market prices of securities sold during the period. Accordingly, realized and unrealized foreign currency gains (losses) on investments in securities are included in the reported net realized and unrealized gains (losses) on investment transactions and balances. However, pursuant to U.S. Federal income tax regulations, gains and losses from certain foreign currency transactions and the foreign currency portion of gains and losses realized on sales and maturities of foreign denominated debt securities are treated as ordinary income for U.S. Federal income tax purposes.
27
Morgan Stanley Institutional Fund, Inc.
Annual Report — December 31, 2013
Notes to Financial Statements (cont'd)
Net realized gains (losses) on foreign currency transactions represent net foreign exchange gains (losses) from foreign currency forward exchange contracts, disposition of foreign currencies, currency gains (losses) realized between the trade and settlement dates on securities transactions, and the difference between the amount of investment income and foreign withholding taxes recorded on the Portfolio's books and the U.S. dollar equivalent amounts actually received or paid. Net unrealized currency gains (losses) from valuing foreign currency denominated assets and liabilities at period end exchange rates are reflected as a component of unrealized appreciation (depreciation) on the Statement of Assets and Liabilities. The change in unrealized currency gains (losses) on foreign currency translations for the period is reflected in the Statement of Operations.
Foreign security and currency transactions may involve certain considerations and risks not typically associated with those of U.S. dollar denominated transactions as a result of, among other factors, fluctuations of exchange rates in relation to the U.S. dollar, the possibility of lower levels of governmental supervision and regulation of foreign securities markets and the possibility of political or economic instability.
The net assets of the Portfolio include foreign denominated securities and currency. Changes in currency exchange rates will affect the U.S. Dollar value of and investment income from such securities.
Governmental approval for foreign investments may be required in advance of making an investment under certain circumstances in some countries, and the extent of foreign investments in domestic companies may be subject to limitation in other countries. Foreign ownership limitations also may be imposed by the charters of individual companies to prevent, among other concerns, violations of foreign investment limitations. As a result, an additional class of shares (identified as "Foreign" in the Portfolio of Investments) may be created and offered for investment. The "local" and "foreign shares" market values may differ. In the absence of trading of the foreign shares in such markets, the Portfolio values the foreign shares at the closing exchange price of the local shares.
4. Derivatives: The Portfolio may, but is not required to, use derivative instruments for a variety of purposes, including hedging, risk management, portfolio management
or to earn income. Derivatives are financial instruments whose value is based, in part, on the value of an underlying asset, interest rate, index or financial instrument. Prevailing interest rates and volatility levels, among other things, also affect the value of derivative instruments. A derivative instrument often has risks similar to its underlying asset and may have additional risks, including imperfect correlation between the value of the derivative and the underlying asset, risks of default by the counterparty to certain transactions, magnification of losses incurred due to changes in the market value of the securities, instruments, indices or interest rates to which they relate, and risks that the transactions may not be liquid. The use of derivatives involves risks that are different from, and possibly greater than, the risks associated with other portfolio investments. Derivatives may involve the use of highly specialized instruments that require investment techniques and risk analyses different from those associated with other portfolio investments. All of the Portfolio's holdings, including derivative instruments, are marked-to-market each day with the change in value reflected in unrealized appreciation (depreciation). Upon disposition, a realized gain or loss is recognized.
Certain derivative transactions may give rise to a form of leverage. Leverage magnifies the potential for gain and the risk of loss. Leverage associated with derivative transactions may cause the Portfolio to liquidate portfolio positions when it may not be advantageous to do so to satisfy its obligations or to meet earmarking or segregation requirements, pursuant to applicable Securities and Exchange Commission rules and regulations, or may cause the Portfolio to be more volatile than if the Portfolio had not been leveraged. Although the Adviser seeks to use derivatives to further the Portfolio's investment objectives, there is no assurance that the use of derivatives will achieve this result.
Following is a description of the derivative instruments and techniques that the Portfolio used during the period and their associated risks:
Futures: A futures contract is a standardized, exchange-traded agreement to buy or sell a specific quantity of an underlying asset, reference rate or index at a specific price at a specific future time. The value of a futures contract tends to increase and decrease in tandem with the value of the underlying instrument. Depending on the terms of the particular contract, futures contracts are
28
Morgan Stanley Institutional Fund, Inc.
Annual Report — December 31, 2013
Notes to Financial Statements (cont'd)
settled through either physical delivery of the underlying instrument on the settlement date or by payment of a cash settlement amount on the settlement date. During the period the futures contract is open, payments are received from or made to the broker based upon changes in the value of the contract (the variation margin). A decision as to whether, when and how to use futures contracts involves the exercise of skill and judgment and even a well-conceived futures transaction may be unsuccessful because of market behavior or unexpected events. In addition to the derivatives risks discussed above, the prices of futures contracts can be highly volatile, using futures contracts can lower total return, and the potential loss from futures contracts can exceed the Portfolio's initial investment in such contracts. No assurance can be given that a liquid market will exist for any particular futures contract at any particular time. There is also the risk of loss by the Portfolio of margin deposits in the event of bankruptcy of a broker with whom the Portfolio has open positions in the futures contract.
Foreign Currency Forward Exchange Contracts: In connection with its investments in foreign securities, the Portfolio also entered into contracts with banks, brokers or dealers to purchase or sell securities or foreign currencies at a future date. A foreign currency forward exchange contract ("currency contract") is a negotiated agreement between the contracting parties to exchange a specified amount of currency at a specified future time at a specified rate. The rate can be higher or lower than the spot rate between the currencies that are the subject of the contract. Currency contracts may be used to protect against uncertainty in the level of future foreign currency exchange rates or to gain or modify exposure to a particular currency. In addition, the Portfolio may use cross currency hedging or proxy hedging with respect to currencies in which the Portfolio has or expects to have portfolio or currency exposure. Cross currency hedges involve the sale of one currency against the positive exposure to a different currency and may be used for hedging purposes or to establish an active exposure to the exchange rate between any two currencies. There is additional risk that such transactions reduce or preclude the opportunity for gain if the value of the currency should move in the direction opposite to the position taken and
that currency contracts create exposure to currencies in which the Portfolio's securities are not denominated. Unanticipated changes in currency prices may result in poorer overall performance for the Portfolio than if it had not entered into such contracts. The use of currency contracts involves the risk of loss from the insolvency or bankruptcy of the counterparty to the contract or the failure of the counterparty to make payments or otherwise comply with the terms of the contract. A currency contract is marked-to-market daily and the change in market value is recorded by the Portfolio as unrealized gain or loss. The Portfolio records realized gains (losses) when the currency contract is closed equal to the difference between the value of the currency contract at the time it was opened and the value at the time it was closed.
FASB ASC 815, "Derivatives and Hedging: Overall" ("ASC 815"), is intended to improve financial reporting about derivative instruments by requiring enhanced disclosures to enable investors to better understand how and why the Portfolio uses derivative instruments, how these derivative instruments are accounted for and their effects on the Portfolio's financial position and results of operations.
The following table sets forth the fair value of the Portfolio's derivative contracts by primary risk exposure as of December 31, 2013.
| | | Asset Derivatives
Statement of Assets and
Liabilities Location | | Primary Risk
Exposure | | Value
(000) | |
Foreign Currency
Forward Exchange
Contracts | | Unrealized Appreciation on
Foreign Currency Forward
Exchange Contracts | | Currency Risk | | | $384 | | |
Futures Contracts | | Variation Margin | | Equity Risk | | | 1,425 | (a) | |
Total | | | | | | $ | 1,809 | | |
| | | Liability Derivatives
Statement of Assets and
Liabilities Location | | Primary Risk
Exposure | | Value
(000) | |
Foreign Currency
Forward Exchange
Contracts | | Unrealized Depreciation on
Foreign Currency Forward
Exchange Contracts | | Currency Risk | | | $(58) | | |
Futures Contracts | | Variation Margin | | Equity Risk | | | (24 | )(a) | |
Total | | | | | | $ | (82 | ) | |
(a) This amount represents the cumulative appreciation (depreciation) as reported in the Portfolio of Investments. The Statement of Assets and Liabilities only reflects the current day's net variation margin.
29
Morgan Stanley Institutional Fund, Inc.
Annual Report — December 31, 2013
Notes to Financial Statements (cont'd)
The following tables set forth by primary risk exposure the Portfolio's realized gains (losses) and change in unrealized appreciation (depreciation) by type of derivative contract for the year ended December 31, 2013 in accordance with ASC 815.
Realized Gain (Loss) | |
Primary Risk Exposure | | Derivative Type | | Value
(000) | |
Currency Risk | | Foreign Currency Forward
Exchange Contracts | | $ | 2,647 | | |
Equity Risk | | Futures Contracts | | | 7,936 | | |
| | | Total | | $ | 10,583 | | |
Change in Unrealized Appreciation (Depreciation) | |
Primary Risk Exposure | | Derivative Type | | Value
(000) | |
Currency Risk | | Foreign Currency Forward
Exchange Contracts | | $ | (48 | ) | |
Equity Risk | | Futures Contracts | | | 1,255 | | |
| | | Total | | $ | 1,207 | | |
At December 31, 2013, the Portfolio's derivative assets and liabilities are as follows:
Gross Amounts of Assets and Liabilities Presented in the
Statement of Assets and Liabilities | |
Derivatives(a) | | Assets(b)
(000) | | Liabilities(b)
(000) | |
Foreign Currency
Forward Exchange Contracts | | $ | 384 | | | $ | (58 | ) | |
(a) Excludes exchange traded derivatives.
(b) Absent an event of default or early termination, OTC derivative assets and liabilities are presented gross and not offset in the Statement of Assets and Liabilities.
The following tables present derivative financial instruments that are subject to enforceable netting arrangements as of December 31, 2013.
Gross Amounts Not Offset in the Statement of Assets and Liabilities | |
Counterparty | | Gross Asset
Derivatives
Presented in
Statement of
Assets and
Liabilities
(000) | | Financial
Instrument
(000) | | Collateral
Received
(000) | | Net
Amount
(not less
than 0)
(000) | |
Commonwealth Bank of
Australia | | $ | 37 | | | $ | — | | | $ | — | | | $ | 37 | | |
Credit Suisse London
Branch (GFX) | | | 36 | | | | — | | | | — | | | | 36 | | |
Deutsche Bank AG London | | | 8 | | | | — | | | | — | | | | 8 | | |
Royal Bank of Scotland | | | 127 | | | | — | | | | — | | | | 127 | | |
UBS AG | | | 176 | | | | (46 | ) | | | — | | | | 130 | | |
Total | | $ | 384 | | | $ | (46 | ) | | $ | — | | | $ | 338 | | |
Gross Amounts Not Offset in the Statement of Assets and Liabilities | |
Counterparty | | Gross Liability
Derivatives
Presented in
Statement of
Assets and
Liabilities
(000) | | Financial
Instrument
(000) | | Collateral
Pledged
(000) | | Net
Amount
(not less
than 0)
(000) | |
Bank of New York Mellon | | $ | 9 | | | $ | — | | | $ | — | | | $ | 9 | | |
State Street Bank and
Trust Co. | | | 3 | | | | — | | | | — | | | | 3 | | |
UBS AG | | | 46 | | | | (46 | ) | | | — | | | | 0 | | |
Total | | $ | 58 | | | $ | (46 | ) | | $ | — | | | $ | 12 | | |
For the year ended December 31, 2013, the approximate average monthly amount outstanding for each derivative type is as follows:
Foreign Currency Forward Exchange Contracts: | |
Average monthly principal amount | | $ | 106,447,000 | | |
Futures Contracts: | |
Average monthly original value | | $ | 52,884,000 | | |
5. Securities Lending: The Portfolio lends securities to qualified financial institutions, such as broker-dealers, to earn additional income. Any increase or decrease in the fair value of the securities loaned that might occur and any interest earned or dividends declared on those securities during the term of the loan would remain in the Portfolio. The Portfolio would receive cash or securities as collateral in an amount equal to or exceeding 100% of the current fair value of the loaned securities. The collateral is marked-to-market daily, by State Street Bank and Trust Company ("State Street"), the securities lending agent, to ensure that a minimum of 100% collateral coverage is maintained.
Based on pre-established guidelines, the securities lending agent invests any cash collateral that is received in an affiliated money market portfolio and repurchase agreements. Securities lending income is generated from the earnings on the invested collateral and borrowing fees, less any rebates owed to the borrowers and compensation to the lending agent, and is recorded as "Income from Securities Loaned-Net" in the Portfolio's Statement of Operations. Risks in securities lending transactions are that a borrower may not provide additional collateral when required or return the securities when due, and that the value of the short-term investments will be less than the amount of cash collateral plus any rebate that is required to be returned to the borrower.
30
Morgan Stanley Institutional Fund, Inc.
Annual Report — December 31, 2013
Notes to Financial Statements (cont'd)
The Portfolio has the right under the lending agreement to recover the securities from the borrower on demand.
The following table presents financial instruments that are subject to enforceable netting arrangements as of December 31, 2013.
Gross Amounts Not Offset in the Statement of Assets and Liabilities | |
Gross Asset
Amounts
Presented in
Statement of
Assets and
Liabilities
(000) | | Financial
Instrument
(000) | | Collateral
Received
(000) | | Net Amount
(not less than 0)
(000) | |
| $ | 7,738 | (a) | | | — | | | $ | (7,738 | )(b)(c) | | $ | 0 | | |
(a) Represents market value of loaned securities at period end.
(b) The Portfolio received cash collateral of approximately $8,117,000, of which approximately $7,763,000 was subsequently invested in Repurchase Agreements and Morgan Stanley Institutional Liquidity Funds as reported in the Portfolio of Investments. As of December 31, 2013 there was uninvested cash of approximately $354,000, which is not reflected in the Portfolio of Investments. In addition, the Portfolio received non-cash collateral of approximately $40,000 in the form of U.S. government agencies and U.S. government obligations, which the Portfolio cannot sell or repledge, and accordingly are not reflected in the Portfolio of Investments.
(c) The actual collateral received is greater than the amount shown here due to overcollateralization.
6. Redemption Fees: The Portfolio will assess a 2% redemption fee, on Class I shares, Class A shares and Class L shares, which is paid directly to the Portfolio, for shares redeemed or exchanged within thirty days of purchase, subject to certain exceptions. The redemption fee is designed to protect the Portfolio and its remaining shareholders from the effects of short-term trading. These fees, if any, are included in the Statements of Changes in Net Assets.
7. Indemnifications: The Fund enters into contracts that contain a variety of indemnifications. The Fund's maximum exposure under these arrangements is unknown. However, the Fund has not had prior claims or losses pursuant to these contracts and expects the risk of loss to be remote.
8. Dividends and Distributions to Shareholders: Dividend income and distributions to shareholders are recorded on the ex-dividend date. Dividends from net investment income, if any, are declared and paid semiannually. Net realized capital gains, if any, are distributed at least annually.
9. Security Transactions, Income and Expenses: Security transactions are accounted for on the trade date (date the order to buy or sell is executed). Realized gains and losses on the sale of investment securities are determined
on the specific identified cost method. Dividend income and other distributions are recorded on the ex-dividend date (except for certain foreign dividends which may be recorded as soon as the Portfolio is informed of such dividends) net of applicable withholding taxes. Interest income is recognized on the accrual basis except where collection is in doubt. Discounts are accreted and premiums are amortized over the life of the respective securities. Most expenses of the Fund can be directly attributed to a particular Portfolio. Expenses which cannot be directly attributed are apportioned among the Portfolios based upon relative net assets or other appropriate methods. Income, expenses (other than class specific expenses — distribution, transfer agency and sub transfer agency fees) and realized and unrealized gains or losses are allocated to each class of shares based upon their relative net assets.
The Portfolio owns shares of REITs which report information on the source of their distributions annually in the following calendar year. A portion of distributions received from REITs during the year is estimated to be a return of capital and is recorded as a reduction of their cost.
B. Advisory Fees: The Adviser, a wholly-owned subsidiary of Morgan Stanley, provides the Portfolio with advisory services under the terms of an Investment Advisory Agreement, paid quarterly, at the annual rate based on the average daily net assets as follows:
First $1
billion | | Over $1
billion | |
| | 0.65 | % | | | 0.60 | % | |
For the year ended December 31, 2013, the advisory fee rate (net of waivers/rebate) was equivalent to an annual effective rate of 0.57% of the Portfolio's daily net assets.
The Adviser has agreed to reduce its advisory fee and/or reimburse the Portfolio so that total annual portfolio operating expenses, excluding certain investment related expenses, taxes, interest and other extraordinary expenses (including litigation), will not exceed 0.90% for Class I shares, 1.15% for Class A shares and 1.65% for Class L shares. Effective September 16, 2013, the Adviser has agreed to limit the ratio of expenses to average net assets to the maximum ratio of 1.25% and 1.75% for Class A and Class L shares, respectively. The fee waivers and/or expense reimbursements will continue for at least two years from the date of the Reorganization or until such time that the Directors act to discontinue all or a portion of such
31
Morgan Stanley Institutional Fund, Inc.
Annual Report — December 31, 2013
Notes to Financial Statements (cont'd)
waivers and/or reimbursements when it deems such action is appropriate. For the year ended December 31, 2013, approximately $226,000 of advisory fees were waived and approximately $65,000 of other expenses were reimbursed by the Adviser pursuant to this arrangement.
C. Administration Fees: The Adviser also serves as Administrator to the Fund and provides administrative services pursuant to an Administration Agreement for an annual fee, accrued daily and paid monthly, of 0.08% of the Portfolio's average daily net assets. Under a Sub-Administration Agreement between the Administrator and State Street, State Street provides certain administrative services to the Fund. For such services, the Administrator pays State Street a portion of the fee the Administrator receives from the Portfolio.
D. Distribution and Shareholder Services Fees: Morgan Stanley Distribution, Inc. ("MSDI" or the "Distributor"), a wholly-owned subsidiary of the Adviser, and an indirect subsidiary of Morgan Stanley, serves as the Fund's Distributor of Portfolio shares pursuant to a Distribution Agreement. The Fund has adopted a Shareholder Services Plan with respect to Class A shares pursuant to Rule 12b-1 under the Act. Under the Shareholder Services Plan, the Portfolio pays the Distributor a shareholder services fee, accrued daily and paid monthly, at an annual rate of 0.25% of the Portfolio's average daily net assets attributable to Class A shares.
The Fund has adopted a Distribution and Shareholder Services Plan with respect to Class L shares pursuant to Rule 12b-1 under the Act. Under the Distribution and Shareholder Services Plan, the Portfolio pays the Distributor a distribution fee, accrued daily and paid monthly, at an annual rate of 0.50% and a shareholder services fee, accrued daily and paid monthly, at an annual rate of 0.25% of the Portfolio's average daily net assets attributable to Class L shares.
The distribution and shareholder services fees are used to support the expenses associated with servicing and maintaining accounts. The Distributor may compensate other parties for providing shareholder support services to investors who purchase Class A and Class L shares.
E. Dividend Disbursing and Transfer Agent: The Fund's dividend disbursing and transfer agent was Morgan Stanley Services Company Inc. ("Morgan Stanley Services"). Pursuant to a Transfer Agency Agreement, the Fund paid Morgan Stanley Services a fee based on the number of classes,
accounts and transactions relating to the Portfolios of the Fund. Effective July 1, 2013, the Directors approved changing the transfer agent to Boston Financial Data Services, Inc.
F. Custodian Fees: State Street (the "Custodian") serves as Custodian for the Fund in accordance with a Custodian Agreement. The Custodian holds cash, securities, and other assets of the Fund as required by the Act. Custody fees are payable monthly based on assets held in custody, investment purchases and sales activity and account maintenance fees, plus reimbursement for certain out-of-pocket expenses.
G. Security Transactions and Transactions with Affiliates: For the year ended December 31, 2013, purchases and sales of investment securities for the Portfolio, other than long-term U.S. Government securities and short-term investments, were approximately $108,539,000 and $141,890,000, respectively. There were no purchases and sales of long-term U.S. Government securities for the year ended December 31, 2013.
The Portfolio invests in the Institutional Class of the Morgan Stanley Institutional Liquidity Funds — Money Market Portfolio (the "Liquidity Funds"), an open-end management investment company managed by the Adviser, both directly, and as a portion of the securities held as collateral on loaned securities. Advisory fees paid by the Portfolio are reduced by an amount equal to its pro-rata share of the advisory and administration fees paid by the Portfolio due to its investment in the Liquidity Funds. For the year ended December 31, 2013, advisory fees paid were reduced by approximately $61,000 relating to the Portfolio's investment in the Liquidity Funds.
A summary of the Portfolio's transactions in shares of the Liquidity Funds during the year ended December 31, 2013 is as follows:
Value
December 31,
2012
(000) | | Purchases
at Cost
(000) | | Sales
(000) | | Dividend
Income
(000) | | Value
December 31,
2013
(000) | |
| $ | 33,607 | | | $ | 136,113 | | | $ | 132,842 | | | $ | 42 | | | $ | 36,878 | | |
The Portfolio had transactions with Mitsubishi UFJ Financial Group, Inc. and its affiliated broker-dealers, which may be deemed affiliates of the Adviser, Administrator and Distributor under Section 17 the Act.
32
Morgan Stanley Institutional Fund, Inc.
Annual Report — December 31, 2013
Notes to Financial Statements (cont'd)
A summary of the Portfolio's transactions in shares of the Mitsubishi UFJ Financial Group, Inc. during the year ended December 31, 2013 is as follows:
Value
December 31,
2012
(000) | | Purchases
at Cost
(000) | | Sales
(000) | | Realized
Loss
(000) | | Dividend
Income
(000) | | Value
December 31,
2013
(000) | |
| $ | 1,436 | | | | — | | | $ | 352 | | | $ | (217 | ) | | $ | 32 | | | $ | 1,368 | | |
From January 1, 2013 to June 30, 2013, the Portfolio incurred approximately $3,000 in brokerage commissions with Citigroup, Inc., and its affiliated broker-dealers, which may be deemed affiliates of the Adviser, Administrator and Distributor under Section 17 of the Act, for portfolio transactions executed on behalf of the Portfolio. Citigroup, Inc. and its affiliated broker-dealers ceased to be affiliates of the Portfolio pursuant to Section 17 of the Act as of July 1, 2013.
H. Federal Income Taxes: It is the Portfolio's intention to continue to qualify as a regulated investment company and distribute all of its taxable and tax-exempt income. Accordingly, no provision for Federal income taxes is required in the financial statements.
The Portfolio may be subject to taxes imposed by countries in which it invests. Such taxes are generally based on income and/or capital gains earned or repatriated. Taxes are accrued based on net investment income, net realized gains and net unrealized appreciation as such income and/or gains are earned. Taxes may also be based on transactions in foreign currency and are accrued based on the value of investments denominated in such currency.
FASB ASC 740-10 "Income Taxes — Overall" sets forth a minimum threshold for financial statement recognition of the benefit of a tax position taken or expected to be taken in a tax return. Management has concluded there are no significant uncertain tax positions that would require recognition in the financial statements. If applicable, the Portfolio recognizes interest accrued related to unrecognized tax benefits in "Interest Expense" and penalties in "Other Expenses" in the Statement of Operations. The Portfolio files tax returns with the U.S. Internal Revenue Service, New York and various states. Generally, each of the tax years in the four-year period ended December 31, 2013, remains subject to examination by taxing authorities.
The tax character of distributions paid may differ from the character of distributions shown in the Statements of Changes in Net Assets due to short-term capital gains being treated as ordinary income for tax purposes. The tax character of distributions paid during fiscal years 2013 and 2012 was as follows:
2013
Distributions
Paid From: | | 2012
Distributions
Paid From: | |
Ordinary
Income
(000) | | Long-Term
Capital Gain
(000) | | Ordinary
Income
(000) | | Long-Term
Capital Gain
(000) | |
| $ | 9,242 | | | | — | | | $ | 4,665 | | | | — | | |
The amount and character of income and gains to be distributed are determined in accordance with income tax regulations which may differ from GAAP. These book/tax differences are either considered temporary or permanent in nature.
Temporary differences are primarily due to differing book and tax treatments in the timing of the recognition of gains (losses) on certain investment transactions and the timing of the deductibility of certain expenses.
Permanent differences, primarily due to differing treatments of gains (losses) related to foreign currency transactions, basis adjustments on certain equity securities designated as passive foreign investment companies, foreign taxes paid on capital gains and capital loss carryforwards permanently written off, resulted in the following reclassifications among the components of net assets at December 31, 2013:
Distributions in
Excess of
Net Investment
Income
(000) | | Accumulated
Net Realized
Loss
(000) | | Paid-in-Capital
(000) | |
| $ | 2,590 | | | $ | (2,804 | ) | | $ | 214 | | |
At December 31, 2013, the components of distributable earnings for the Portfolio on a tax basis were as follows:
Undistributed
Ordinary
Income
(000) | | Undistributed
Long-Term
Capital Gain
(000) | |
| $ | 520 | | | | — | | |
At December 31, 2013, the aggregate cost for Federal income tax purposes is $334,080,000. The aggregate gross unrealized appreciation is $56,085,000 and the aggregate gross unrealized depreciation is $25,702,000 resulting in net unrealized depreciation of $30,383,000.
33
Morgan Stanley Institutional Fund, Inc.
Annual Report — December 31, 2013
Notes to Financial Statements (cont'd)
At December 31, 2013, the Portfolio had available capital loss carryforwards to offset future net capital gains, to the extent provided by regulations, through the indicated expiration dates:
Amount
(000) | | Expiration* | |
| $ | 7,834 | | | December 31, 2016 | |
| | 33,505 | | | December 31, 2017 | |
* Includes capital losses acquired from Morgan Stanley International Fund that may be subject to limitation under IRC Section 382 in future years.
To the extent that capital loss carryforwards are used to offset any future capital gains realized during the carryover period as provided by U.S. Federal income tax regulations, no capital gains tax liability will be incurred by the Portfolio for gains realized and not distributed. To the extent that capital gains are offset, such gains will not be distributed to the shareholders. During the year ended December 31, 2013, the Portfolio utilized capital loss carryforwards for U. S. Federal income tax purposes of approximately $25,937,000.
Capital losses and specified ordinary losses, including currency losses, incurred after October 31 but within the taxable year are deemed to arise on the first day of the Portfolio's next taxable year. For the year ended December 31, 2013, the Portfolio deferred to January 1, 2014 for U.S. Federal income tax purposes the following losses:
Post-October
Currency and
Specified Ordinary
Losses
(000) | | Post-October
Capital Losses
(000) | |
| | — | | | $ | 531 | | |
I. Results of Special Shareholder Meeting (unaudited): On June 5, 2013 as adjourned to June 24, 2013 and July 17, 2013, a Joint Special Shareholder Meeting was held for Class H shareholders of the Portfolio to approve the Articles of Amendment to the Fund's Articles of Amendment and Restatement and a Plan of Reclassification for the Portfolio pursuant to which Class H shares would be reclassified as Class P shares. The results with respect to this proposal were as follows:
| For | | Against | | Abstain | |
| | 2,796,930 | | | | 114,427 | | | | 328,689 | | |
J. Accounting Pronouncement: In June 2013, FASB issued Accounting Standards Update 2013-08 Financial Services — Investment Companies (Topic 946) — Amendments to the Scope, Measurement, and Disclosure Requirements ("ASU 2013-08") which is effective for interim and annual reporting periods in fiscal years that begin after December 15, 2013. ASU 2013-08 sets forth a methodology for determining whether an entity should be characterized as
an investment company and prescribes fair value accounting for an investment company's non-controlling ownership interest in another investment company. FASB has determined that a fund registered under the Investment Company Act of 1940 automatically meets ASU 2013-08's criteria for an investment company. Although still evaluating the potential impacts of ASU 2013-08 to the Portfolio, management expects that the impact of the Portfolio's adoption will be limited to additional financial statement disclosures.
34
Morgan Stanley Institutional Fund, Inc.
Annual Report — December 31, 2013
Report of Independent Registered Public Accounting Firm
To the Shareholders and Board of Directors of
Morgan Stanley Institutional Fund, Inc. —
Active International Allocation Portfolio
We have audited the accompanying statement of assets and liabilities, including the portfolio of investments, of Active International Allocation Portfolio (one of the portfolios constituting Morgan Stanley Institutional Fund, Inc.) (the "Portfolio") as of December 31, 2013, and the related statement of operations for the year then ended, the statements of changes in net assets for each of the two years in the period then ended, and the financial highlights for each of the periods indicated therein. These financial statements and financial highlights are the responsibility of the Portfolio's management. Our responsibility is to express an opinion on these financial statements and financial highlights based on our audits.
We conducted our audits in accordance with the standards of the Public Company Accounting Oversight Board (United States). Those standards require that we plan and perform the audit to obtain reasonable assurance about whether the financial statements and financial highlights are free of material misstatement. We were not engaged to perform an audit of the Portfolio's internal control over financial reporting. Our audits included consideration of internal control over financial reporting as a basis for designing audit procedures that are appropriate in the circumstances, but not for the purpose of expressing an opinion on the effectiveness of the Portfolio's internal control over financial reporting. Accordingly, we express no such opinion. An audit also includes examining, on a test basis, evidence supporting the amounts and disclosures in the financial statements and financial highlights, assessing the accounting principles used and significant estimates made by management, and evaluating the overall financial statement presentation. Our procedures included confirmation of securities owned as of December 31, 2013, by correspondence with the custodian and others or by other appropriate auditing procedures where replies from others were not received. We believe that our audits provide a reasonable basis for our opinion.
In our opinion, the financial statements and financial highlights referred to above present fairly, in all material respects, the financial position of Active International Allocation Portfolio (one of the portfolios constituting Morgan Stanley Institutional Fund, Inc.) at December 31, 2013, the results of its operations for the year then ended, the changes in its net assets for each of the two years in the period then ended, and the financial highlights for each of the periods indicated therein, in conformity with U.S. generally accepted accounting principles.

Boston, Massachusetts
February 26, 2014
35
Morgan Stanley Institutional Fund, Inc.
Annual Report — December 31, 2013
Federal Tax Notice (unaudited)
For Federal income tax purposes, the following information is furnished with respect to the Portfolio's earnings for its taxable year ended December 31, 2013. When distributed, certain earnings may be subject to a maximum tax rate of 15% as provided for the Jobs and Growth Tax Relief Reconciliation Act of 2003. The Portfolio designated up to a maximum of approximately $5,595,000 as taxable at this lower rate.
The Portfolio intends to pass through foreign tax credits of approximately $277,000 and has derived net income from sources within foreign countries amounting to approximately $9,552,000.
In January, the Portfolio provides tax information to shareholders for the preceding calendar year.
36
Morgan Stanley Institutional Fund, Inc.
Annual Report — December 31, 2013
U.S. Privacy Policy (unaudited)
AN IMPORTANT NOTICE CONCERNING OUR U.S. PRIVACY POLICY
This privacy notice describes the U.S. privacy policy of Morgan Stanley Distribution, Inc., and the Morgan Stanley family of mutual funds ("us", "our", "we").
We are required by federal law to provide you with notice of our U.S. privacy policy ("Policy"). This Policy applies to both our current and former clients unless we state otherwise and is intended for individual clients who purchase products or receive services from us for personal, family or household purposes. This Policy is not applicable to partnerships, corporations, trusts or other non-individual clients or account holders, nor is this Policy applicable to individuals who are either beneficiaries of a trust for which we serve as trustee or participants in an employee benefit plan administered or advised by us. This Policy is, however, applicable to individuals who select us to be a custodian of securities or assets in individual retirement accounts, 401(k) accounts, or accounts subject to the Uniform Gifts to Minors Act.
This notice sets out our business practices to protect your privacy; how we collect and share personal information about you; and how you can limit our sharing or certain uses by others of this information. We may amend this Policy at any time, and will inform you of any changes to our Policy as required by law.
WE RESPECT YOUR PRIVACY
We appreciate that you have provided us with your personal financial information and understand your concerns about your information. We strive to safeguard the information our clients entrust to us. Protecting the confidentiality and security of client information is an important part of how we conduct our business.
This notice describes what personal information we collect about you, how we collect it, when we may share it with others, and how certain others may use it. It discusses the steps you may take to limit our sharing of certain information about you with our affiliated companies, including, but not limited to our affiliated banking businesses, brokerage firms and credit service affiliates. It also discloses how you may limit our affiliates' use of shared information for marketing purposes.
Throughout this Policy, we refer to the nonpublic information that personally identifies you as "personal information." We also use the term "affiliated company" in this notice. An affiliated company is a company in our family of companies and includes companies with the Morgan Stanley name. These affiliated companies are financial institutions such as broker-dealers, banks, investment advisers and credit card issuers. We refer to any company that is not an affiliated company as a nonaffiliated third party. For purposes of Section 5 of this notice, and your ability to limit certain uses of personal information by our affiliates, this notice applies to the use of personal information by our affiliated companies.
1. WHAT PERSONAL INFORMATION DO WE COLLECT FROM YOU?
We may collect the following types of information about you: (i) information provided by you, including information from applications and other forms we receive from you, (ii) information about your transactions with us or our affiliates, (iii) information about your transactions with nonaffiliated third parties, (iv) information from consumer reporting agencies, (v) information obtained from our websites, and (vi) information obtained from other sources. For example:
• We collect information such as your name, address, e-mail address, telephone/fax numbers, assets, income and investment objectives through applications and other forms you submit to us.
• We may obtain information about account balances, your use of account(s) and the types of products and services you prefer to receive from us through your dealings and transactions with us and other sources.
• We may obtain information about your creditworthiness and credit history from consumer reporting agencies.
• We may collect background information from and through third-party vendors to verify representations you have made and to comply with various regulatory requirements.
2. WHEN DO WE DISCLOSE PERSONAL INFORMATION WE COLLECT ABOUT YOU?
We may disclose personal information we collect about you in each of the categories listed above to affiliated and nonaffiliated third parties.
37
Morgan Stanley Institutional Fund, Inc.
Annual Report — December 31, 2013
U.S. Privacy Policy (unaudited) (cont'd)
a. Information we disclose to affiliated companies.
We may disclose personal information that we collect about you to our affiliated companies to manage your account(s) effectively, to service and process your transactions, and to let you know about products and services offered by us and affiliated companies, to manage our business, and as otherwise required or permitted by law. Offers for products and services from affiliated companies are developed under conditions designed to safeguard your personal information.
b. Information we disclose to third parties.
We may disclose personal information that we collect about you to nonaffiliated third parties to provide marketing services on our behalf or to other financial institutions with whom we have joint marketing agreements. We may also disclose all of the information we collect to other nonaffiliated third parties for our everyday business purposes, such as to process transactions, maintain account(s), respond to court orders and legal investigations, report to credit bureaus, offer our own products and services, protect against fraud, for institutional risk control, to perform services on our behalf, and as otherwise required or permitted by law.
When we share personal information about you with a nonaffiliated third party, they are required to limit their use of personal information about you to the particular purpose for which it was shared and they are not allowed to share personal information about you with others except to fulfill that limited purpose or as may be permitted or required by law.
3. HOW DO WE PROTECT THE SECURITY AND CONFIDENTIALITY OF PERSONAL INFORMATION WE COLLECT ABOUT YOU?
We maintain physical, electronic and procedural security measures that comply with applicable law and regulations to help safeguard the personal information we collect about you. We have internal policies governing the proper handling of client information by employees. Third parties that provide support or marketing services on our behalf may also receive personal information about you, and we require them to adhere to appropriate security standards with respect to such information.
4. HOW CAN YOU LIMIT OUR SHARING CERTAIN PERSONAL INFORMATION ABOUT YOU WITH OUR AFFILIATED COMPANIES FOR ELIGIBILITY DETERMINATION?
By following the opt-out procedures in Section 6 below, you may limit the extent to which we share with our affiliated companies, personal information that was collected to determine your eligibility for products and services such as your credit reports and other information that you have provided to us or that we may obtain from third parties ("eligibility information"). Eligibility information does not include your identification information or personal information pertaining to our transactions or experiences with you. Please note that, even if you direct us not to share eligibility information with our affiliated companies, we may still share your personal information, including eligibility information, with our affiliated companies under circumstances that are permitted under applicable law, such as to process transactions or to service your account.
5. HOW CAN YOU LIMIT THE USE OF CERTAIN PERSONAL INFORMATION ABOUT YOU BY OUR AFFILIATED COMPANIES FOR MARKETING?
By following the opt-out instructions in Section 6 below, you may limit our affiliated companies from marketing their products or services to you based on personal information we disclose to them. This information may include, for example, your income and account history with us. Please note that, even if you choose to limit our affiliated companies from using personal information about you that we may share with them for marketing their products and services to you, our affiliated companies may use your personal information that they obtain from us to market to you in circumstances permitted by law, such as if the affiliated party has its own relationship with you.
38
Morgan Stanley Institutional Fund, Inc.
Annual Report — December 31, 2013
U.S. Privacy Policy (unaudited) (cont'd)
6. HOW CAN YOU SEND US AN OPT-OUT INSTRUCTION?
If you wish to limit our sharing of eligibility information about you with our affiliated companies, or our affiliated companies' use of personal information for marketing purposes, as described in this notice, you may do so by:
• Calling us at (800) 548-7786
Monday–Friday between 8a.m. and 5p.m. (EST)
• Writing to us at the following address:
Boston Financial Data Services, Inc.
c/o Privacy Coordinator
P.O. Box 219804
Kansas City, Missouri 64121
If you choose to write to us, your request should include: your name, address, telephone number and account number(s) to which the opt-out applies and whether you are opting out with respect to sharing of eligibility information (Section 4 above), or information used for marketing (Section 5 above), or both. Written opt-out requests should not be sent with any other correspondence. In order to process your request, we require that the request be provided by you directly and not through a third party. Once you have informed us about your privacy preferences, your opt-out preference will remain in effect with respect to this Policy (as it may be amended) until you notify us otherwise. If you are a joint account owner, we will accept instructions from any one of you and apply those instructions to the entire account.
Please understand that if you limit our sharing or our affiliated companies' use of personal information, you and any joint account holder(s) may not receive information about our affiliated companies' products and services, including products or services that could help you manage your financial resources and achieve your investment objectives.
If you have more than one account or relationship with us, please specify the accounts to which you would like us to apply your privacy choices. If you have accounts or relationships with our affiliates, you may receive multiple privacy policies from them, and will need to separately notify those companies of your privacy choices for those accounts or relationships.
7. WHAT IF AN AFFILIATED COMPANY BECOMES A NONAFFILIATED THIRD PARTY?
If, at any time in the future, an affiliated company becomes a nonaffiliated third party, further disclosures of personal information made to the former affiliated company will be limited to those described in Section 2(b) above relating to nonaffiliated third parties. If you elected under Section 6 to limit disclosures we make to affiliated companies, or use of personal information by affiliated companies, your election will not apply to use by any former affiliated company of your personal information in their possession once it becomes a nonaffiliated third party.
SPECIAL NOTICE TO RESIDENTS OF VERMONT
The following section supplements our Policy with respect to our individual clients who have a Vermont address and supersedes anything to the contrary in the above Policy with respect to those clients only.
The State of Vermont requires financial institutions to obtain your consent prior to sharing personal information that they collect about you with nonaffiliated third parties, or eligibility information with affiliated companies, other than in certain limited circumstances. Except as permitted by law, we will not share personal information we collect about you with nonaffiliated third parties or eligibility information with affiliated companies, unless you provide us with your written consent to share such information.
SPECIAL NOTICE TO RESIDENTS OF CALIFORNIA
The following section supplements our Policy with respect to our individual clients who have a California address and supersedes anything to the contrary in the above Policy with respect to those clients only.
In response to a California law, if your account has a California home address, your personal information will not be disclosed to nonaffiliated third parties except as permitted by applicable California law, and we will limit sharing such personal information with our affiliates to comply with California privacy laws that apply to us.
39
Morgan Stanley Institutional Fund, Inc.
Annual Report — December 31, 2013
Director and Officer Information (unaudited)
Independent Director:
Name, Age and Address of
Independent Director | | Position(s)
Held with
Registrant | | Length of Time
Served* | | Principal Occupation(s) During Past 5 Years | | Number of
Portfolios in
Fund Complex
Overseen by
Independent
Director** | | Other Directorships
Held by Independent
Director*** | |
Frank L. Bowman (69)
c/o Kramer Levin Naftalis &
Frankel LLP
Counsel to the Independent
Directors
1177 Avenue of the Americas
New York, NY 10036 | | Director | | Since
August
2006 | | President, Strategic Decisions, LLC (consulting) (since February 2009); Director or Trustee of various Morgan Stanley Funds (since August 2006); Chairperson of the Insurance Sub-Committee of the Compliance and Insurance Committee (since February 2007); served as President and Chief Executive Officer of the Nuclear Energy Institute (policy organization) (February 2005-November 2008); retired as Admiral, U.S. Navy after serving over 38 years on active duty including 8 years as Director of the Naval Nuclear Propulsion Program in the Department of the Navy and the U.S. Department of Energy (1996-2004); served as Chief of Naval Personnel (July 1994-September 1996); and on the Joint Staff as Director of Political Military Affairs (June 1992-July 1994); knighted as Honorary Knight Commander of the Most Excellent Order of the British Empire; awarded the Officier de l'Orde National du Mérite by the French Government; elected to the National Academy of Engineering (2009). | | | 98 | | | Director of BP p.l.c.; Director of Naval and Nuclear Technologies LLP; Director of the Armed Services YMCA of the USA and the U.S. Naval Submarine League; Director of the American Shipbuilding Suppliers Association; Member of the National Security Advisory Council of the Center for U.S. Global Engagement and a member of the CNA Military Advisory Board; Chairman of the Charity J Street Cup Golf; Trustee Fairhaven United Methodist Church. | |
Michael Bozic (73)
c/o Kramer Levin Naftalis & Frankel LLP
Counsel to the Independent Directors
1177 Avenue of the Americas New York, NY 10036 | | Director | | Since
April
1994 | | Private investor and a member of the advisory board of American Road Group LLC (retail) (since June 2000); Chairperson of the Compliance and Insurance Committee (since October 2006); Director or Trustee of various Morgan Stanley Funds (since April 1994); formerly, Chairperson of the Insurance Committee (July 2006-September 2006); Vice Chairman of Kmart Corporation (December 1998-October 2000); Chairman and Chief Executive Officer of Levitz Furniture Corporation (November 1995-November 1998) and President and Chief Executive Officer of Hills Department Stores (May 1991-July 1995); variously Chairman, Chief Executive Officer, President and Chief Operating Officer (1987-1991) of the Sears Merchandise Group of Sears, Roebuck & Co. | | | 100 | | | Trustee and member of the Hillsdale College Board of Trustees. | |
Kathleen A. Dennis (60)
c/o Kramer Levin Naftalis & Frankel LLP
Counsel to the Independent Directors
1177 Avenue of the Americas New York, NY 10036 | | Director | | Since
August
2006 | | President, Cedarwood Associates (mutual fund and investment management consulting) (since July 2006); Chairperson of the Money Market and Alternatives Sub-Committee of the Investment Committee (since October 2006) and Director or Trustee of various Morgan Stanley Funds (since August 2006); formerly, Senior Managing Director of Victory Capital Management (1993-2006). | | | 98 | | | Director of various non-profit organizations. | |
Dr. Manuel H. Johnson (65)
c/o Johnson Smick
International, Inc.
220 I Street, NE Suite 200
Washington, D.C. 20002 | | Director | | Since
July
1991 | | Senior Partner, Johnson Smick International, Inc. (consulting firm); Chairperson of the Investment Committee (since October 2006) and Director or Trustee of various Morgan Stanley Funds (since July 1991); Co-Chairman and a founder of the Group of Seven Council (G7C) (international economic commission); formerly, Chairperson of the Audit Committee (July 1991-September 2006); Vice Chairman of the Board of Governors of the Federal Reserve System and Assistant Secretary of the U.S. Treasury. | | | 101 | | | Director of NVR, Inc. (home construction). | |
40
Morgan Stanley Institutional Fund, Inc.
Annual Report — December 31, 2013
Director and Officer Information (unaudited) (cont'd)
Independent Director: (cont'd)
Name, Age and Address of
Independent Director | | Position(s)
Held with
Registrant | | Length of Time
Served* | | Principal Occupation(s) During Past 5 Years | | Number of
Portfolios in
Fund Complex
Overseen by
Independent
Director** | | Other Directorships
Held by Independent
Director*** | |
Joseph J. Kearns (71)
c/o Kearns & Associates LLC PMB754
22631 Pacific Coast Highway
Malibu, CA 90265 | | Director | | Since
August
1994 | | President, Kearns & Associates LLC (investment consulting); Chairperson of the Audit Committee (since October 2006) and Director or Trustee of various Morgan Stanley Funds (since August 1994); formerly, Deputy Chairperson of the Audit Committee (July 2003-September 2006) and Chairperson of the Audit Committee of various Morgan Stanley Funds (since August 1994); CFO of the J. Paul Getty Trust. | | | 101 | | | Director of Electro Rent Corporation (equipment leasing) and The Ford Family Foundation. | |
Michael F. Klein (55)
c/o Kramer Levin Naftalis & Frankel LLP
Counsel to the Independent Directors
1177 Avenue of the Americas New York, NY 10036 | | Director | | Since
August
2006 | | Managing Director, Aetos Capital, LLC (since March 2000) and Co-President, Aetos Alternatives Management, LLC (since January 2004) and Co-Chief Executive Officer of Aetos Capital LLC (since August 2013); Chairperson of the Fixed Income Sub-Committee of the Investment Committee (since October 2006) and Director or Trustee of various Morgan Stanley Funds (since August 2006); formerly, Managing Director, Morgan Stanley & Co. Inc. and Morgan Stanley Dean Witter Investment Management, President, various Morgan Stanley Funds (June 1998-March 2000) and Principal, Morgan Stanley & Co. Inc. and Morgan Stanley Dean Witter Investment Management (August 1997-December 1999). | | | 98 | | | Director of certain investment funds managed or sponsored by Aetos Capital, LLC. Director of Sanitized AG and Sanitized Marketing AG (specialty chemicals). | |
Michael E. Nugent (77)
522 Fifth Avenue
New York, NY 10036 | | Chairperson
of the
Board and Director | | Chairperson of the Boards since July 2006 and Director since July 1991 | | Chairperson of the Boards of various Morgan Stanley Funds (since July 2006); Chairperson of the Closed-End Fund Committee (since June 2012) and Director or Trustee of various Morgan Stanley Funds (since July 1991); formerly, Chairperson of the Insurance Committee (until July 2006); General Partner, Triumph Capital, L.P. (private investment partnership) (1988-2013). | | | 100 | | | None. | |
W. Allen Reed (66)
c/o Kramer Levin Naftalis & Frankel LLP
Counsel to the Independent Directors
1177 Avenue of the Americas New York, NY 10036 | | Director | | Since
August
2006 | | Chairperson of the Equity Sub-Committee of the Investment Committee (since October 2006) and Director or Trustee of various Morgan Stanley Funds (since August 2006); formerly, President and CEO of General Motors Asset Management; Chairman and Chief Executive Officer of the GM Trust Bank and Corporate Vice President of General Motors Corporation (August 1994-December 2005). | | | 98 | | | Director of Temple-Inland Industries (packaging and forest products); Director of Legg Mason, Inc. and Director of the Auburn University Foundation. | |
Fergus Reid (81)
c/o Joe Pietryka, Inc.
85 Charles Colman Blvd. Pawling, NY 12564 | | Director | | Since
June
1992 | | Chairman, Joe Pietryka, Inc.; Chairperson of the Governance Committee and Director or Trustee of various Morgan Stanley Funds (since June 1992). | | | 101 | | | Through December 31, 2012, Trustee and Director of certain Investment companies in the JPMorgan Fund Complex. | |
41
Morgan Stanley Institutional Fund, Inc.
Annual Report — December 31, 2013
Director and Officer Information (unaudited) (cont'd)
Interested Director:
Name, Age and Address of
Interested Director | | Position(s)
Held with
Registrant | | Length of
Time Served* | | Principal Occupation(s) During Past 5 Years | | Number of
Portfolios in
Fund Complex
Overseen by
Interested
Director** | | Other Directorships
Held by Interested
Director*** | |
James F. Higgins (66)
One New York Plaza
New York, NY 10004 | | Director | | Since
June
2000 | | Director or Trustee of various Morgan Stanley Funds (since June 2000); Senior Advisor of Morgan Stanley (since August 2000). | | | 99 | | | Formerly, Director of AXA Financial, Inc. and AXA Equitable Life Insurance Company (2002-2011) and Director of AXA MONY Life Insurance Company and AXA MONY Life Insurance Company of America (2004-2011). | |
* Each Director serves an indefinite term, until his or her successor is elected.
** The Fund Complex includes (as of December 31, 2013) all open-end and closed-end funds (including all of their portfolios) advised by Morgan Stanley Investment Management Inc. (the "Adviser") and any funds that have an adviser that is an affiliated person of the Adviser (including, but not limited to, Morgan Stanley AIP GP LP).
*** This includes any directorships at public companies and registered investment companies held by the Director at any time during the past five years.
42
Morgan Stanley Institutional Fund, Inc.
Annual Report — December 31, 2013
Director and Officer Information (unaudited) (cont'd)
Executive Officers:
Name, Age and Address of Executive Officer | | Position(s) Held
with
Registrant | | Length of
Time Served* | | Principal Occupation(s) During Past 5 Years | |
John H. Gernon (50)
522 Fifth Avenue
New York, NY 10036 | | President and Principal Executive Officer—Equity, Fixed Income and AIP Funds | | Since
September
2013 | | President and Principal Executive Officer of the Equity and Fixed Income Funds and the Morgan Stanley AIP Funds (since September 2013) in the Fund Complex. Managing Director of the Adviser. | |
Stefanie V. Chang Yu (47)
522 Fifth Avenue
New York, NY 10036 | | Chief Compliance Officer | | Since
January
2014 | | Managing Director of the Adviser and various entities affiliated with the Adviser; Chief Compliance Officer of various Morgan Stanley Funds and the Adviser (since January 2014); formerly, Vice President of various Morgan Stanley Funds (December 1997-January 2014). | |
Joseph C. Benedetti (48)
522 Fifth Avenue
New York, NY 10036 | | Vice President | | Since
January
2014 | | Managing Director of the Adviser and various entities affiliated with the Adviser; Vice President of various Morgan Stanley Funds (since January 2014); formerly, Assistant Secretary of various Morgan Stanley Funds (October 2004-January 2014). | |
Francis J. Smith (48)
522 Fifth Avenue
New York, NY 10036 | | Treasurer and Principal Financial Officer | | Treasurer since July 2003 and Principal Financial Officer since September 2002 | | Executive Director of the Adviser and various entities affiliated with the Adviser; Treasurer and Principal Financial Officer of various Morgan Stanley Funds (since July 2003). | |
Mary E. Mullin (46)
522 Fifth Avenue
New York, NY 10036 | | Secretary | | Since
June
1999 | | Executive Director of the Adviser and various entities affiliated with the Adviser; Secretary of various Morgan Stanley Funds (since June 1999). | |
* Each officer serves an indefinite term, until his or her successor is elected.
43
Morgan Stanley Institutional Fund, Inc.
Annual Report — December 31, 2013
Adviser and Administrator
Morgan Stanley Investment Management Inc.
522 Fifth Avenue
New York, New York 10036
Distributor
Morgan Stanley Distribution, Inc.
522 Fifth Avenue
New York, New York 10036
Dividend Disbursing and Transfer Agent
Boston Financial Data Services, Inc.
2000 Crown Colony Drive
Quincy, Massachusetts 02169
Custodian
State Street Bank and Trust Company
One Lincoln Street
Boston, Massachusetts 02111
Legal Counsel
Dechert LLP
1095 Avenue of the Americas
New York, New York 10036
Counsel to the Independent Directors
Kramer Levin Naftalis & Frankel LLP
1177 Avenue of the Americas
New York, New York 10036
Independent Registered Public Accounting Firm
Ernst & Young LLP
200 Clarendon Street
Boston, Massachusetts 02116
Reporting to Shareholders
Each Morgan Stanley fund provides a complete schedule of portfolio holdings in its semi-annual and annual reports within 60 days of the end of the fund's second and fourth fiscal quarters by filing the schedule electronically with the Securities and Exchange Commission (SEC). The semi-annual reports are filed on Form N-CSRS and the annual reports are filed on Form N-CSR. Morgan Stanley also delivers the semi-annual and annual reports to fund shareholders and makes these reports available on its public website, www.morganstanley.com/im. Each Morgan Stanley fund also files a complete schedule of portfolio holdings with the SEC for the fund's first and third fiscal quarters on Form N-Q. Morgan Stanley does not deliver the reports for the first and third fiscal quarters to shareholders, nor are the reports posted to the Morgan Stanley public website. You may, however, obtain the Form N-Q filings (as well as the Form N-CSR and N-CSRS filings) by accessing the SEC's website, www.sec.gov. You may also review and copy them at the SEC's Public Reference Room in Washington, DC. Information on the operation of the SEC's Public Reference Room may be obtained by calling the SEC toll free at 1 (800) SEC-0330. You can also request copies of these materials, upon payment of a duplicating fee, by electronic request at the SEC's email address (publicinfo@sec.gov) or by writing the Public Reference Room of the SEC, Washington, DC 20549-0102.
Proxy Voting Policies and Procedures and Proxy Voting Record
You may obtain a copy of the Fund's Proxy Voting Policy and Procedures and information regarding how the Fund voted proxies relating to portfolio securities during the most recent twelve-month period ended June 30, without charge, upon request, by calling toll free 1 (800) 548-7786 or by visiting our website at www.morganstanley.com/im. This information is also available on the SEC's website at www.sec.gov.
This report is authorized for distribution only when preceded or accompanied by a prospectus of the Morgan Stanley Institutional Fund, Inc. which describes in detail each Investment Portfolio's investment policies, risks, fees and expenses. Please read the prospectus carefully before you invest or send money. For additional information, including information regarding the investments comprising the Portfolio, please visit our website at www.morganstanley.com/im or call toll free 1 (800) 548-7786.
44
(This Page has been left blank intentionally.)
Printed in U.S.A.
This Report has been prepared for shareholders and may be distributed to others only if preceded or accompanied by a current prospectus.
Morgan Stanley Investment Management Inc.
522 Fifth Avenue
New York, New York 10036
© 2014 Morgan Stanley. Morgan Stanley Distribution, Inc.

IFIAIAANN
812840 EXP 2.28.15

Morgan Stanley Institutional Fund, Inc.
Multi-Asset Portfolio
Annual Report
December 31, 2013

Morgan Stanley Institutional Fund, Inc.
Annual Report — December 31, 2013
Shareholders' Letter | | | 2 | | |
Expense Example | | | 3 | | |
Investment Overview | | | 4 | | |
Portfolio of Investments | | | 8 | | |
Statement of Assets and Liabilities | | | 16 | | |
Statement of Operations | | | 18 | | |
Statements of Changes in Net Assets | | | 19 | | |
Financial Highlights | | | 21 | | |
Notes to Financial Statements | | | 24 | | |
Report of Independent Registered Public Accounting Firm | | | 34 | | |
Federal Tax Notice | | | 35 | | |
U.S. Privacy Policy | | | 36 | | |
Director and Officer Information | | | 39 | | |
This report is authorized for distribution only when preceded or accompanied by prospectuses of the Morgan Stanley Institutional Fund, Inc. To receive a prospectus and/or statement of additional information (SAI), which contains more complete information such as investment objectives, charges, expenses, policies for voting proxies, risk considerations, and describes in detail each of the Portfolio's investment policies to the prospective investor, please call toll free 1 (800) 548-7786. Please read the prospectuses carefully before you invest or send money.
Additionally, you can access portfolio information including performance, characteristics, and investment team commentary through Morgan Stanley Investment Management's website: www.morganstanley.com/im.
Market forecasts provided in this report may not necessarily come to pass. There is no guarantee that any sectors mentioned will continue to perform as discussed herein or that securities in such sectors will be held by the Portfolio in the future. There is no assurance that a Portfolio will achieve its investment objective. Portfolios are subject to market risk, which is the possibility that market values of securities owned by the Portfolio will decline and, therefore, the value of the Portfolio's shares may be less than what you paid for them. Accordingly, you can lose money investing in the Portfolio. Please see the prospectus for more complete information on investment risks.
1
Morgan Stanley Institutional Fund, Inc.
Annual Report — December 31, 2013
Shareholders' Letter (unaudited)
Dear Shareholders,
We are pleased to provide this Annual report, in which you will learn how your investment in Multi-Asset Portfolio (the "Portfolio") performed during the latest twelve-month period.
Morgan Stanley Investment Management is a client-centric, investor-led organization. Our global presence, intellectual capital, and breadth of products and services enable us to partner with investors to meet the evolving challenges of today's financial markets. We aim to deliver superior investment service and to empower our clients to make the informed decisions that help them reach their investment goals.
As always, we thank you for selecting Morgan Stanley Investment Management, and look forward to working with you in the months and years ahead.
Sincerely,

John H. Gernon
President and Principal Executive Officer
January 2014
2
Morgan Stanley Institutional Fund, Inc.
Annual Report — December 31, 2013
Expense Example (unaudited)
Multi-Asset Portfolio
As a shareholder of the Portfolio, you incur two types of costs: (1) transactional costs; and (2) ongoing costs, including advisory fees, administration fees, distribution and shareholder services fees and other Portfolio expenses. This example is intended to help you understand your ongoing costs (in dollars) of investing in the Portfolio and to compare these costs with the ongoing costs of investing in other mutual funds.
This example is based on an investment of $1,000 invested at the beginning of the six-month period ended December 31, 2013 and held for the entire six-month period.
Actual Expenses
The table below provides information about actual account values and actual expenses. You may use the information in this table, together with the amount you invested, to estimate the expenses that you paid over the period. Simply divide your account value by $1,000 (for example, an $8,600 account value divided by $1,000 = 8.6), then multiply the result by the number in the table under the heading entitled "Actual Expenses Paid During Period" to estimate the expenses you paid on your account during this period.
Hypothetical Example for Comparison Purposes
The table below provides information about hypothetical account values and hypothetical expenses based on the Portfolio's actual expense ratio and an assumed rate of return of 5% per year before expenses, which is not the Portfolio's actual return. The hypothetical account values and expenses may not be used to estimate the actual ending account balance or expenses you paid for the period. You may use this information to compare the ongoing costs of investing in the Portfolio and other funds. To do so, compare this 5% hypothetical example with the 5% hypothetical examples that appear in the shareholder reports of the other funds.
Please note that the expenses shown in the table are meant to highlight your ongoing costs only and do not reflect any transactional costs, such as sales charges (loads). Therefore, the information for each class in the table is useful in comparing ongoing costs only, and will not help you determine the relative total costs of owning different funds. In addition, if these transactional costs were included, your costs would have been higher.
| | | Beginning
Account
Value
7/1/13 | | Actual Ending
Account
Value
12/31/13 | | Hypothetical
Ending Account
Value | | Actual
Expenses
Paid
During
Period* | | Hypothetical
Expenses Paid
During Period* | | Net
Expense
Ratio
During
Period** | |
Multi-Asset Portfolio Class I | | $ | 1,000.00 | | | $ | 1,048.90 | | | $ | 1,020.01 | | | $ | 5.32 | | | $ | 5.24 | | | | 1.03 | % | |
Multi-Asset Portfolio Class A@ | | | 1,000.00 | | | | 1,047.30 | | | | 1,018.65 | | | | 6.71 | | | | 6.61 | | | | 1.30 | | |
Multi-Asset Portfolio Class L | | | 1,000.00 | | | | 1,044.10 | | | | 1,016.18 | | | | 9.22 | | | | 9.10 | | | | 1.79 | | |
* Expenses are calculated using each Portfolio Class' annualized net expense ratio (as disclosed), multiplied by the average account value over the period, and multiplied by 184/365 (to reflect the most recent one-half year period).
** Annualized.
@ Effective September 9, 2013, Class P and Class H shares were renamed Class A shares.
3
Morgan Stanley Institutional Fund, Inc.
Annual Report — December 31, 2013
Investment Overview (unaudited)
Multi-Asset Portfolio
The Multi-Asset Portfolio seeks total return. The Portfolio's "Adviser," Morgan Stanley Investment Management Inc., seeks to achieve this objective with an emphasis on positive absolute return and controlling downside portfolio risk.
Performance
For the year ended December 31, 2013, the Portfolio had a total return based on net asset value and reinvestment of distributions per share of 18.24%, net of fees, for Class I shares. The Portfolio's Class I shares outperformed against its primary benchmark, the Bank of America Merrill Lynch U.S. Dollar 1-month LIBID Average Index (the "Index"), which returned 0.10%, and outperformed the secondary benchmark, the Customized MSIM Global Allocation Index (comprised of 60% MSCI All Country World Index, 30% Barclays Capital Global Aggregate Bond Index, 5% S&P GSCI Lite Energy Index, and 5% BofA Merrill Lynch U.S. Dollar 1-Month LIBID Average Index), which returned 11.91%.
Factors Affecting Performance
• Global equities were up 25.5% in local currency terms in 2013, outperforming bonds, which fell 2.6%, and commodities, which fell 1.2%, as the global economic recovery gained momentum, particularly in developed markets, and the Federal Reserve (Fed) began to taper its quantitative easing program.i
• U.S. equities were the regional outperformer (with the S&P 500 Index advancing 32.4%) amid relatively resilient economic data despite fiscal tightening in the first quarter. The U.S. added an average of 185,000 jobs per month during 2013, bringing the unemployment rate below 7%. The Fed spent much of the year deliberating when to withdraw monetary stimulus, given strengthening economic data, and ultimately announced it would taper the pace of asset purchases in December. The yield on the 10-year Treasury rose 127 basis points in 2013, ending the year above 3%.
• Although turmoil surrounding the Italian elections and Cyprus' bailout weighed on investor sentiment in the first quarter, eurozone equities rose 21.5% in 2013 as a whole, as the economic recovery strengthened and broadened out to the periphery.ii Yields on Greek, Spanish, Portuguese, and Italian bonds fell, while German bund yields rose.
• Emerging market equities lagged those of developed markets in 2013, with the MSCI Emerging Markets Index falling 2.6%, amid weaker economic data, concerns about the impact of the Fed's asset purchase tapering on the region, and worries over rapid loan growth and a likely property bubble in China.
• Japanese equities soared, with the MSCI Japan Index up 54.6% in local currency terms, as Prime Minister Shinzo Abe and Bank of Japan Governor Haruhiko Kuroda embarked on a bold economic and monetary experiment to lift Japan out of deflation. A substantial portion of Japan's equity market outperformance was attributable to currency translation, as the Japanese yen fell 17.7% during the year. In U.S. dollar terms, the MSCI Japan Index rose 27.2%.
• The Portfolio's strongest performing positions in 2013 were short positions related to our China and emerging market slowdown theme. In particular, the top contributors included the Portfolio's short positions in the Australian dollar; in emerging market equities relative to developed market equities; in copper relative to U.S. equities; and in mining machinery, iron ore, and China banks stocks, all relative to global equities.
• On balance, positions related to our eurozone recovery theme did not materially impact performance in 2013. Strong gains toward the end of the year from our long positions in the bonds of peripheral eurozone countries, such as Spain, Greece, and Portugal, were offset by losses early in the year from our long positions in eurozone equities, such as France, Germany, Spain, and Italy, all relative to U.S. equities. Our long position in eurozone domestic auto manufacturers relative to global equities also detracted from performance.
• Our yield bubble unwind theme added to performance during 2013. Contributors included a short position in U.S. real estate investment trusts (REITs) relative to U.S. equities and a short position in high dividend yielding U.S. equities relative to low dividend yielding U.S. equities.
Management Strategies
• As of December 31, 2013, the Portfolio's net equity exposure was approximately 19%, net fixed income
4
Morgan Stanley Institutional Fund, Inc.
Annual Report — December 31, 2013
Investment Overview (unaudited) (cont'd)
Multi-Asset Portfolio
exposure was approximately 30%, and the Portfolio had no active commodity positions.iii
• Heading into 2014, we remain cautiously optimistic on risky assets globally. We continue to be more constructive on developed markets than on emerging markets, with a preference for Europe over the U.S. We continue to believe many yield-sensitive assets are overvalued globally, and are likely to re-price as U.S. monetary policy becomes gradually less accommodative. We maintain short positions in yield plays, such as U.S. REITs and high dividend yielding equities.
• We maintain low net equity exposure, as the U.S. stock market appears very overvalued on normalized metrics. We believe that the U.S. stock market could potentially see positive performance in 2014. However we believe this positive performance could be interrupted by a correction, as higher interest rates cause multiples to contract in excess of earnings growth. Such a correction is likely to be deeper than the average Fed tightening/mid-cycle correction, given record-high margins. This increased volatility is common to the late stages of bull markets.
• We are long eurozone risk assets — including financials and peripheral equities and bonds — as we are optimistic that the eurozone will continue to recover from highly-depressed economic conditions for several reasons. First, economic activity indicators have already turned. Second, the bulk of fiscal tightening has been implemented. Third, credit conditions have begun to improve, with peripheral bond yields declining during the fourth quarter and eurozone credit standards approaching pre-crisis levels. Finally, from a structural standpoint, substantial adjustment has been accomplished, and internal devaluations have helped to restore competitiveness in economies such as Spain and Greece. Despite these improvements in the underlying fundamentals, by our measures, eurozone stocks remain 40% below their 2007 highs. On stable measures of equity market value such as price-to-book, eurozone equities are trading at a 43% discount to U.S. equities, well below the historical average discount of 29%. This is in part because earnings remain extremely depressed in the region, but we believe even a modest pace of recovery (1.5% GDP growth) could translate to earnings-per-share growth of roughly 10% in 2014.
• We expect Japanese equities to underperform and therefore maintain a short position in the Portfolio, relative to global equities, without hedging currency exposure. With Japanese equities valued at the same price-to-forward earnings multiple as global equities and investors still optimistically positioned, we believe the coming moderation of Japan's growth as it reverts to its fundamental trend pace will disappoint. First, we expect that by 2015 most of the stimulus-driven upswing in growth will fizzle out. Second, we think there is a substantial risk that the weak yen, far from boosting growth, to the contrary, will (and indeed has already begun to) dampen consumption. Third, Japan's economy faces fiscal contraction in coming years. Lastly, we are deeply skeptical of the potential for a change in Japan's structural growth trend given the economy's natural constraints and the range of policies contemplated by Abenomics.
• We are short assets exposed to China's credit cycle and the commodity supply chain, as well as emerging market currencies and equities (including consumer plays). We expect growth in emerging markets to continue to disappoint. History has shown that the winners of one decade are rarely winners of the next, and it is clear that emerging markets were the big winners of the 2000s. This argues against emerging markets outperforming again in the 2010s. Emerging market economies are transitioning to a lower pace of economic growth, which will likely result in lower corporate profitability. Markets have begun to reflect this new regime partly, but not fully. Thus, we expect further underperformance over the next one to two years.
• All told, our main themes continue to be centered around the unwinding of the yield bubble, the end of China's economic boom, the emerging market growth reset (to a lower level), and the eurozone recovery, as well as a few idiosyncratic ones such as short Japanese equities.
i Global equities, bonds and commodities are represented by the MSCI All Country World Index, Barclays Capital Global Aggregate Total Return Index Unhedged, and S&P GSCI Total Return Index, respectively.
ii Eurozone equities are represented by the Eurostoxx 50 Total Return Index
iii The Portfolio seeks to achieve a consistent level of positive absolute returns while controlling downside portfolio risk. The Portfolio seeks to achieve this objective by taking the majority of risk through hedged or paired (long/short) trades. As the Portfolio's primary benchmark (the Bank of America Merrill Lynch U.S. Dollar 1-month LIBID Average Index) represents cash, the Portfolio will maintain, from time to time, significant exposure to a risk-free asset class.
5
Morgan Stanley Institutional Fund, Inc.
Annual Report — December 31, 2013
Investment Overview (unaudited) (cont'd)
Multi-Asset Portfolio
* Minimum Investment for Class I shares
** Commenced Operations on June 22, 2012.
In accordance with SEC regulations, Portfolio's performance shown assumes that all recurring fees (including management fees) were deducted and all dividends and distributions were reinvested. The performance of Class A+ and L shares will vary from Class I shares and will be negatively impacted by additional fees assessed to those classes.
Performance Compared to the Bank of America Merrill Lynch US Dollar 1-Month LIBID Average Index(1), the Morgan Stanley Capital International (MSCI) All Country World Index(2), the Customized MSIM Global Allocation Index(3) and the Lipper Global Flexible Portfolio Funds Index(4)
| | Period Ended December 31, 2013
Total Returns(5) | |
| | | One
Year | | Five
Years | | Ten
Years | | Since
Inception(7) | |
Portfolio — Class I Shares
w/o sales charges(6) | | | 18.24 | % | | | — | | | | — | | | | 14.89 | % | |
Bank of America Merrill Lynch
US Dollar 1-Month LIBID Average
Index | | | 0.10 | | | | | | | | | | | | 0.10 | | |
MSCI All Country World Index | | | 22.80 | | | | — | | | | — | | | | 23.70 | | |
The Customized MSIM Global
Allocation Index | | | 11.91 | | | | — | | | | — | | | | 14.01 | | |
Lipper Global Flexible Portfolio
Funds Index | | | 13.34 | | | | — | | | | — | | | | 14.92 | | |
Portfolio — Class A+ Shares
w/o sales charges(6) | | | 17.86 | | | | — | | | | — | | | | 14.58 | | |
Portfolio — Class A+ Shares with
maximum 5.25% sales charges(6) | | | 11.68 | | | | — | | | | — | | | | 10.63 | | |
Bank of America Merrill Lynch
US Dollar 1-Month LIBID Average
Index | | | 0.10 | | | | — | | | | — | | | | 0.10 | | |
MSCI All Country World Index | | | 22.80 | | | | — | | | | — | | | | 23.70 | | |
The Customized MSIM Global
Allocation Index | | | 11.91 | | | | — | | | | — | | | | 14.01 | | |
Lipper Global Flexible Portfolio
Funds Index | | | 13.34 | | | | — | | | | — | | | | 14.92 | | |
Portfolio — Class L Shares
w/o sales charges(6) | | | 17.23 | | | | — | | | | — | | | | 13.97 | | |
Bank of America Merrill Lynch
US Dollar 1-Month LIBID Average
Index | | | 0.10 | | | | — | | | | — | | | | 0.10 | | |
MSCI All Country World Index | | | 22.80 | | | | — | | | | — | | | | 23.70 | | |
The Customized MSIM Global
Allocation Index | | | 11.91 | | | | — | | | | — | | | | 14.01 | | |
Lipper Global Flexible Portfolio
Funds Index | | | 13.34 | | | | — | | | | — | | | | 14.92 | | |
Performance data quoted represents past performance, which is no guarantee of future results, and current performance may be lower or higher than the figures shown. Performance assumes that all dividends and distributions, if any, were reinvested. For the most recent month-end performance figures, please visit www.morganstanley.com/im. Investment return and principal value will fluctuate so that Portfolio shares, when redeemed, may be worth more or less than their original cost. Total returns do not reflect the deduction of taxes that a shareholder would pay on Portfolio distributions or the redemption of Portfolio shares. Performance of share classes will vary due to difference in expenses.
+ Effective September 9, 2013, Class P shares were renamed Class A shares.
(1) The Bank of America Merrill Lynch US Dollar 1-Month LIBID Average Index tracks the performance of a basket of synthetic assets paying LIBID to a stated maturity.
6
Morgan Stanley Institutional Fund, Inc.
Annual Report — December 31, 2013
Investment Overview (unaudited) (cont'd)
Multi-Asset Portfolio
The index purchases a new instrument each day, priced at par, having exactly its stated maturity and with a coupon equal to that day's fixing rate. All issues are held to maturity. Therefore, each day the index is comprised of a basket of securities. The index is not marked to market. The returns of the index represent the accrued income generated by the equally weighted average of all the coupons in the basket for a given day. It is not possible to invest directly in an index. The primary benchmark was changed from MSCI All Country World Index to The Bank of America Merrill Lynch US Dollar 1-Month LIBID Average Index in August 2013.
(2) The Morgan Stanley Capital International (MSCI) All Country World Index (ACWI) is a free float-adjusted market capitalization weighted index designed to measure the equity market performance of developed and emerging markets. The term "free float" represents the portion of shares outstanding that are deemed to be available for purchase in the public equity markets by investors. The Index is unmanaged and its returns do not include any sales charges or fees. Such costs would lower performance. It is not possible to invest directly in an index.
(3) The Customized MSIM Global Allocation Index is comprised of 60% MSCI All-Country World Index (benchmark that measures the equity market performance of developed and emerging markets), 30% Barclay Capital Global Aggregate Bond Index (benchmark that provides a broadbased measure of the global investment grade fixed-rate debt markets), 5% S&P GSCI Light Energy Index (benchmark for investment performance in the energy commodity market), and 5% Bank of America/Merrill Lynch US Dollar 1-Month LIBID Average Index (benchmark that tracks the performance of a basket of synthetic assets paying LIBID to a stated maturity). The Index is unmanaged and its returns do not include any sales charges or fees. Such costs would lower performance. It is not possible to invest directly in an index.
(4) The Lipper Global Flexible Portfolio Funds Index is an equally weighted performance index of the largest qualifying funds (based on net assets) in the Lipper Global Flexible Portfolio Funds classification. The Index, which is adjusted for capital gains distributions and income dividends, is unmanaged and should not be considered an investment. There are currently 30 funds represented in this Index. As of the date of this report, the Portfolio is in the Lipper Global Flexible Portfolio Funds classification.
(5) Total returns for the Portfolio reflect fees waived and expenses reimbursed, if applicable, by the Adviser. Without such waivers and reimbursements, total returns would have been lower. The fee waivers and/or expense reimbursements will continue for at least one year or until such time as the Fund's Board of Directors acts to discontinue all or a portion of such waivers and/or expense reimbursements when it deems that such action is appropriate.
(6) Commenced operations on June 22, 2012.
(7) For comparative purposes, average annual since inception returns listed for the Indexes refer to the inception date or initial offering of the respective share class of the Portfolio, not the inception of the Index. Returns for periods less than one year are not annualized.
Portfolio Composition
Classification | | Percentage of
Total Investments | |
Short-Term Investments | | | 66.7 | % | |
Sovereign | | | 15.5 | | |
Other* | | | 11.5 | | |
Commercial Banks | | | 6.3 | | |
Total Investments | | | 100.0 | %** | |
* Industries and/or investment types representing less than 5% of total investments.
** Does not include open long/short futures contracts with an underlying face amount of approximately $167,840,000 and net unrealized appreciation of approximately $1,424,000. Does not include open foreign currency forward exchange contracts with net unrealized appreciation of approximately $38,000. Does not include open swap agreements with net unrealized depreciation of approximately $636,000.
7
Morgan Stanley Institutional Fund, Inc.
Annual Report — December 31, 2013
Portfolio of Investments
Multi-Asset Portfolio
| | | Shares | | Value
(000) | |
Common Stocks (17.1%) | |
Austria (0.1%) | |
Erste Group Bank AG | | | 2,708 | | | $ | 94 | | |
Raiffeisen Bank International AG | | | 514 | | | | 18 | | |
| | | | 112 | | |
Belgium (0.2%) | |
Anheuser-Busch InBev N.V. | | | 1,292 | | | | 137 | | |
Colruyt SA | | | 123 | | | | 7 | | |
Delhaize Group SA | | | 166 | | | | 10 | | |
KBC Groep N.V. | | | 2,409 | | | | 137 | | |
Viohalco SA (a) | | | 586 | | | | 3 | | |
| | | | 294 | | |
Denmark (0.0%) | |
Carlsberg A/S Series B | | | 176 | | | | 19 | | |
Finland (0.0%) | |
Kesko Oyj, Class B | | | 103 | | | | 4 | | |
France (2.4%) | |
BNP Paribas SA | | | 10,440 | | | | 814 | | |
Carrefour SA | | | 954 | | | | 38 | | |
Casino Guichard Perrachon SA | | | 92 | | | | 11 | | |
Credit Agricole SA (a) | | | 10,497 | | | | 134 | | |
Danone | | | 933 | | | | 67 | | |
L'Oreal SA | | | 388 | | | | 68 | | |
Natixis | | | 9,738 | | | | 57 | | |
Pernod-Ricard SA | | | 342 | | | | 39 | | |
Peugeot SA (a) | | | 113,228 | | | | 1,470 | | |
Remy Cointreau SA | | | 39 | | | | 3 | | |
Societe Generale SA | | | 7,377 | | | | 429 | | |
| | | | 3,130 | | |
Germany (0.2%) | |
Beiersdorf AG | | | 162 | | | | 16 | | |
Commerzbank AG (a) | | | 10,165 | | | | 164 | | |
Henkel AG & Co., KGaA | | | 213 | | | | 22 | | |
Metro AG | | | 205 | | | | 10 | | |
Suedzucker AG | | | 132 | | | | 4 | | |
| | | | 216 | | |
Greece (0.3%) | |
Aegean Airlines SA (a) | | | 101 | | | | 1 | | |
Alpha Bank AE (a) | | | 27,401 | | | | 24 | | |
Athens Water Supply & Sewage Co., SA (The) | | | 370 | | | | 4 | | |
Diagnostic & Therapeutic Center of Athens
Hygeia SA (a) | | | 1,174 | | | | 1 | | |
Ellaktor SA (a) | | | 1,280 | | | | 6 | | |
Elval - Hellenic Aluminium Industry SA (a) | | | 200 | | | | 1 | | |
Folli Follie SA (a) | | | 696 | | | | 22 | | |
Fourlis Holdings SA (a) | | | 737 | | | | 4 | | |
Frigoglass SA (a) | | | 360 | | | | 2 | | |
GEK Terna Holding Real Estate Construction SA (a) | | | 1,552 | | | | 7 | | |
Hellenic Exchanges - Athens Stock Exchange
SA Holding | | | 1,641 | | | | 18 | | |
Hellenic Petroleum SA | | | 429 | | | | 4 | | |
Hellenic Telecommunications Organization SA (a) | | | 5,464 | | | | 73 | | |
Intracom Holdings SA (Registered) (a) | | | 2,679 | | | | 2 | | |
| | | Shares | | Value
(000) | |
Intralot SA-Integrated Lottery Systems & Services | | | 4,279 | | | $ | 11 | | |
JUMBO SA (a) | | | 491 | | | | 8 | | |
Marfin Investment Group Holdings SA (a) | | | 7,273 | | | | 4 | | |
Metka SA | | | 355 | | | | 6 | | |
MLS Multimedia SA (a) | | | 223 | | | | 1 | | |
Motor Oil Hellas Corinth Refineries SA | | | 557 | | | | 6 | | |
Mytilineos Holdings SA (a) | | | 939 | | | | 7 | | |
National Bank of Greece SA (a) | | | 7,243 | | | | 38 | | |
OPAP SA | | | 4,678 | | | | 62 | | |
Piraeus Bank SA (a) | | | 20,802 | | | | 44 | | |
Piraeus Port Authority | | | 125 | | | | 3 | | |
Public Power Corp. SA | | | 2,987 | | | | 44 | | |
Sidenor Steel Products Manufacturing Co., SA (a) | | | 879 | | | | 2 | | |
Terna Energy SA (a) | | | 958 | | | | 5 | | |
Thessaloniki Port Authority SA | | | 39 | | | | 1 | | |
Titan Cement Co., SA (a) | | | 1,240 | | | | 34 | | |
| | | | 445 | | |
Ireland (0.1%) | |
Bank of Ireland (a) | | | 221,581 | | | | 77 | | |
Kerry Group PLC, Class A | | | 241 | | | | 17 | | |
| | | | 94 | | |
Italy (2.4%) | |
Banca Monte dei Paschi di Siena SpA (a) | | | 67,201 | | | | 16 | | |
Intesa Sanpaolo SpA | | | 574,380 | | | | 1,418 | | |
UniCredit SpA | | | 214,977 | | | | 1,591 | | |
Unione di Banche Italiane SCPA | | | 8,999 | | | | 61 | | |
| | | | 3,086 | | |
Japan (0.3%) | |
Aeon Co., Ltd. | | | 1,700 | | | | 23 | | |
Ajinomoto Co., Inc. | | | 1,000 | | | | 15 | | |
Asahi Group Holdings Ltd. | | | 1,000 | | | | 28 | | |
Calbee, Inc. | | | 100 | | | | 3 | | |
Coca-Cola West Co., Ltd. | | | 100 | | | | 2 | | |
FamilyMart Co., Ltd. | | | 100 | | | | 5 | | |
Japan Tobacco, Inc. | | | 3,100 | | | | 101 | | |
Kao Corp. | | | 1,600 | | | | 50 | | |
Kirin Holdings Co., Ltd. | | | 1,000 | | | | 14 | | |
Lawson, Inc. | | | 100 | | | | 8 | | |
MEIJI Holdings Co., Ltd. | | | 100 | | | | 7 | | |
Nisshin Seifun Group, Inc. | | | 500 | | | | 5 | | |
Nissin Foods Holdings Co., Ltd. | | | 100 | | | | 4 | | |
Seven & I Holdings Co., Ltd. | | | 2,000 | | | | 79 | | |
Shiseido Co., Ltd. | | | 1,000 | | | | 16 | | |
Suntory Beverage & Food Ltd. | | | 200 | | | | 6 | | |
Unicharm Corp. | | | 200 | | | | 11 | | |
Yakult Honsha Co., Ltd. | | | 100 | | | | 5 | | |
| | | | 382 | | |
Netherlands (0.1%) | |
Heineken Holding N.V. | | | 164 | | | | 10 | | |
Heineken N.V. | | | 373 | | | | 25 | | |
Koninklijke Ahold N.V. | | | 1,637 | | | | 30 | | |
Unilever N.V. CVA | | | 2,633 | | | | 106 | | |
| | | | 171 | | |
The accompanying notes are an integral part of the financial statements.
8
Morgan Stanley Institutional Fund, Inc.
Annual Report — December 31, 2013
Portfolio of Investments (cont'd)
Multi-Asset Portfolio
| | | Shares | | Value
(000) | |
Norway (0.0%) | |
Orkla ASA | | | 1,237 | | | $ | 10 | | |
Poland (0.1%) | |
Jeronimo Martins SGPS SA | | | 5,629 | | | | 110 | | |
Portugal (0.5%) | |
Altri SGPS SA | | | 2,302 | | | | 7 | | |
Banco BPI SA (a) | | | 12,636 | | | | 21 | | |
Banco Comercial Portugues SA (a) | | | 539,108 | | | | 124 | | |
Banco Espirito Santo SA (Registered) (a) | | | 97,686 | | | | 140 | | |
EDP - Energias de Portugal SA | | | 36,551 | | | | 134 | | |
Galp Energia SGPS SA | | | 6,944 | | | | 114 | | |
Mota-Engil SGPS SA | | | 1,396 | | | | 8 | | |
Portucel SA | | | 1,780 | | | | 7 | | |
Portugal Telecom SGPS SA (Registered) | | | 23,710 | | | | 103 | | |
Sonae | | | 7,811 | | | | 11 | | |
Sonaecom - SGPS SA | | | 3,564 | | | | 13 | | |
Zon Optimus SGPS SA | | | 1,746 | | | | 13 | | |
| | | | 695 | | |
South Africa (0.1%) | |
SABMiller PLC | | | 1,552 | | | | 80 | | |
Spain (1.7%) | |
Banco Bilbao Vizcaya Argentaria SA | | | 58,825 | | | | 724 | | |
Banco de Sabadell SA | | | 35,703 | | | | 93 | | |
Banco Popular Espanol SA (a) | | | 13,500 | | | | 81 | | |
Banco Santander SA | | | 119,851 | | | | 1,073 | | |
Bankia SA (a) | | | 43,247 | | | | 73 | | |
CaixaBank SA | | | 12,623 | | | | 66 | | |
Distribuidora Internacional de Alimentacion SA | | | 979 | | | | 9 | | |
EDP Renovaveis SA | | | 7,948 | | | | 42 | | |
| | | | 2,161 | | |
Sweden (0.0%) | |
Svenska Cellulosa AB SCA, Class B | | | 931 | | | | 29 | | |
Swedish Match AB | | | 328 | | | | 10 | | |
| | | | 39 | | |
Switzerland (0.3%) | |
Aryzta AG (a) | | | 140 | | | | 11 | | |
Barry Callebaut AG (Registered) (a) | | | 2 | | | | 2 | | |
Coca-Cola HBC AG (a) | | | 1,359 | | | | 39 | | |
Lindt & Spruengli AG | | | 1 | | | | 5 | | |
Nestle SA (Registered) | | | 5,205 | | | | 381 | | |
| | | | 438 | | |
United Kingdom (0.5%) | |
Associated British Foods PLC | | | 574 | | | | 23 | | |
British American Tobacco PLC | | | 3,086 | | | | 166 | | |
Diageo PLC | | | 4,074 | | | | 135 | | |
Imperial Tobacco Group PLC | | | 1,580 | | | | 61 | | |
J Sainsbury PLC | | | 1,981 | | | | 12 | | |
Reckitt Benckiser Group PLC | | | 1,037 | | | | 82 | | |
Tate & Lyle PLC | | | 743 | | | | 10 | | |
Tesco PLC | | | 13,178 | | | | 73 | | |
Unilever PLC | | | 2,058 | | | | 85 | | |
WM Morrison Supermarkets PLC | | | 3,540 | | | | 15 | | |
| | | | 662 | | |
| | | Shares | | Value
(000) | |
United States (7.8%) | |
AAON, Inc. | | | 894 | | | $ | 29 | | |
Aaron's, Inc. | | | 3,162 | | | | 93 | | |
Actuant Corp., Class A | | | 2,496 | | | | 91 | | |
Acuity Brands, Inc. | | | 852 | | | | 93 | | |
Advance Auto Parts, Inc. | | | 832 | | | | 92 | | |
AGCO Corp. | | | 1,578 | | | | 93 | | |
Allergan, Inc. | | | 870 | | | | 97 | | |
Altria Group, Inc. | | | 2,854 | | | | 110 | | |
AMETEK, Inc. | | | 1,756 | | | | 93 | | |
Analogic Corp. | | | 678 | | | | 60 | | |
Archer-Daniels-Midland Co. | | | 929 | | | | 40 | | |
Arkansas Best Corp. | | | 2,643 | | | | 89 | | |
Avon Products, Inc. | | | 606 | | | | 10 | | |
Balchem Corp. | | | 817 | | | | 48 | | |
Bank of America Corp. | | | 5,727 | | | | 89 | | |
Beam, Inc. | | | 205 | | | | 14 | | |
Belden, Inc. | | | 1,296 | | | | 91 | | |
Brown-Forman Corp., Class B | | | 174 | | | | 13 | | |
Brunswick Corp. | | | 1,988 | | | | 92 | | |
Bunge Ltd. | | | 210 | | | | 17 | | |
Cabot Oil & Gas Corp. | | | 2,355 | | | | 91 | | |
Cal-Maine Foods, Inc. | | | 668 | | | | 40 | | |
Callaway Golf Co. | | | 4,951 | | | | 42 | | |
Campbell Soup Co. | | | 290 | | | | 13 | | |
Cantel Medical Corp. | | �� | 1,881 | | | | 64 | | |
Cash America International, Inc. | | | 1,481 | | | | 57 | | |
Cathay General Bancorp | | | 2,837 | | | | 76 | | |
CF Industries Holdings, Inc. | | | 396 | | | | 92 | | |
Church & Dwight Co., Inc. | | | 193 | | | | 13 | | |
Cigna Corp. | | | 1,057 | | | | 92 | | |
Cimarex Energy Co. | | | 879 | | | | 92 | | |
CIRCOR International, Inc. | | | 649 | | | | 52 | | |
Citigroup, Inc. (See Note G) | | | 1,739 | | | | 91 | | |
Clorox Co. (The) | | | 184 | | | | 17 | | |
Coca-Cola Co. (The) | | | 5,709 | | | | 236 | | |
Coca-Cola Enterprises, Inc. | | | 368 | | | | 16 | | |
Colgate-Palmolive Co. | | | 1,298 | | | | 85 | | |
ConAgra Foods, Inc. | | | 589 | | | | 20 | | |
Constellation Brands, Inc., Class A (a) | | | 232 | | | | 16 | | |
Cooper Cos., Inc. (The) | | | 736 | | | | 91 | | |
Costco Wholesale Corp. | | | 614 | | | | 73 | | |
CR Bard, Inc. | | | 683 | | | | 92 | | |
CST Brands, Inc. | | | 2,552 | | | | 94 | | |
Cubic Corp. | | | 1,095 | | | | 58 | | |
CVS Caremark Corp. | | | 1,722 | | | | 123 | | |
Cytec Industries, Inc. | | | 1,013 | | | | 94 | | |
Danaher Corp. | | | 1,177 | | | | 91 | | |
Deltic Timber Corp. | | | 273 | | | | 19 | | |
DENTSPLY International, Inc. | | | 1,866 | | | | 90 | | |
Dr. Pepper Snapple Group, Inc. | | | 288 | | | | 14 | | |
Eagle Materials, Inc. | | | 1,238 | | | | 96 | | |
EMCOR Group, Inc. | | | 2,238 | | | | 95 | | |
The accompanying notes are an integral part of the financial statements.
9
Morgan Stanley Institutional Fund, Inc.
Annual Report — December 31, 2013
Portfolio of Investments (cont'd)
Multi-Asset Portfolio
| | | Shares | | Value
(000) | |
United States (cont'd) | |
Encore Wire Corp. | | | 602 | | | $ | 33 | | |
Energizer Holdings, Inc. | | | 87 | | | | 9 | | |
Ensign Group, Inc. (The) | | | 901 | | | | 40 | | |
EOG Resources, Inc. | | | 545 | | | | 92 | | |
EQT Corp. | | | 1,034 | | | | 93 | | |
Estee Lauder Cos., Inc. (The), Class A | | | 337 | | | | 25 | | |
Fair Isaac Corp. | | | 1,499 | | | | 94 | | |
FedEx Corp. | | | 646 | | | | 93 | | |
FEI Co. | | | 1,019 | | | | 91 | | |
Financial Engines, Inc. | | | 1,339 | | | | 93 | | |
Franklin Electric Co., Inc. | | | 1,619 | | | | 72 | | |
General Mills, Inc. | | | 911 | | | | 45 | | |
Global Payments, Inc. | | | 1,466 | | | | 95 | | |
Green Mountain Coffee Roasters, Inc. (a) | | | 195 | | | | 15 | | |
Heartland Express, Inc. | | | 2,919 | | | | 57 | | |
Heartland Payment Systems, Inc. | | | 1,937 | | | | 97 | | |
Herbalife Ltd. | | | 123 | | | | 10 | | |
Hershey Co. (The) | | | 220 | | | | 21 | | |
Hormel Foods Corp. | | | 205 | | | | 9 | | |
Interface, Inc. | | | 2,320 | | | | 51 | | |
International Speedway Corp., Class A | | | 704 | | | | 25 | | |
Invacare Corp. | | | 1,483 | | | | 34 | | |
JM Smucker Co. (The) | | | 153 | | | | 16 | | |
Jones Lang LaSalle, Inc. | | | 904 | | | | 93 | | |
KB Home | | | 5,477 | | | | 100 | | |
Kellogg Co. | | | 367 | | | | 22 | | |
Kimberly-Clark Corp. | | | 537 | | | | 56 | | |
Kraft Foods Group, Inc. | | | 858 | | | | 46 | | |
Kroger Co. (The) | | | 696 | | | | 28 | | |
La-Z-Boy, Inc. | | | 3,040 | | | | 94 | | |
Landstar System, Inc. | | | 1,605 | | | | 92 | | |
Lennar Corp., Class A | | | 2,435 | | | | 96 | | |
Lindsay Corp. | | | 1,095 | | | | 91 | | |
Loews Corp. | | | 1,908 | | | | 92 | | |
Lorillard, Inc. | | | 537 | | | | 27 | | |
Mastercard, Inc., Class A | | | 112 | | | | 94 | | |
MAXIMUS, Inc. | | | 2,095 | | | | 92 | | |
McCormick & Co., Inc. | | | 170 | | | | 12 | | |
McKesson Corp. | | | 562 | | | | 91 | | |
Mead Johnson Nutrition Co. | | | 288 | | | | 24 | | |
Minerals Technologies, Inc. | | | 1,173 | | | | 70 | | |
Molson Coors Brewing Co., Class B | | | 213 | | | | 12 | | |
Mondelez International, Inc., Class A | | | 2,403 | | | | 85 | | |
Monster Beverage Corp. (a) | | | 201 | | | | 14 | | |
Olympic Steel, Inc. | | | 362 | | | | 11 | | |
PepsiCo, Inc. | | | 2,171 | | | | 180 | | |
PerkinElmer, Inc. | | | 2,229 | | | | 92 | | |
Perrigo Co., PLC | | | 525 | | | | 81 | | |
Philip Morris International, Inc. | | | 2,352 | | | | 205 | | |
Pioneer Natural Resources Co. | | | 480 | | | | 88 | | |
| | | Shares | | Value
(000) | |
PolyOne Corp. | | | 2,646 | | | $ | 94 | | |
Power Integrations, Inc. | | | 1,549 | | | | 86 | | |
Precision Castparts Corp. | | | 342 | | | | 92 | | |
PrivateBancorp, Inc. | | | 3,194 | | | | 92 | | |
Procter & Gamble Co. (The) | | | 3,852 | | | | 314 | | |
PVH Corp. | | | 689 | | | | 94 | | |
QEP Resources, Inc. | | | 2,961 | | | | 91 | | |
Range Resources Corp. | | | 1,103 | | | | 93 | | |
Reynolds American, Inc. | | | 467 | | | | 23 | | |
Roper Industries, Inc. | | | 674 | | | | 93 | | |
Ryland Group, Inc. (The) | | | 2,267 | | | | 98 | | |
Safeway, Inc. | | | 340 | | | | 11 | | |
SM Energy Co. | | | 1,106 | | | | 92 | | |
Sonic Automotive, Inc., Class A | | | 3,592 | | | | 88 | | |
Standex International Corp. | | | 443 | | | | 28 | | |
Stewart Information Services Corp. | | | 1,607 | | | | 52 | | |
Sysco Corp. | | | 828 | | | | 30 | | |
Textron, Inc. | | | 2,769 | | | | 102 | | |
Thermo Fisher Scientific, Inc. | | | 834 | | | | 93 | | |
Titan International, Inc. | | | 4,225 | | | | 76 | | |
Tractor Supply Co. | | | 1,217 | | | | 94 | | |
Triumph Group, Inc. | | | 1,220 | | | | 93 | | |
Tyson Foods, Inc., Class A | | | 3,063 | | | | 103 | | |
UniFirst Corp. | | | 872 | | | | 93 | | |
Universal Health Services, Inc., Class B | | | 1,142 | | | | 93 | | |
UTi Worldwide, Inc. | | | 5,370 | | | | 94 | | |
Valmont Industries, Inc. | | | 623 | | | | 93 | | |
Visa, Inc., Class A | | | 417 | | | | 93 | | |
Vulcan Materials Co. | | | 1,578 | | | | 94 | | |
Wabtec Corp. | | | 1,222 | | | | 91 | | |
Wal-Mart Stores, Inc. | | | 2,328 | | | | 183 | | |
Walgreen Co. | | | 1,271 | | | | 73 | | |
Whole Foods Market, Inc. | | | 2,046 | | | | 118 | | |
Wintrust Financial Corp. | | | 1,973 | | | | 91 | | |
World Fuel Services Corp. | | | 2,135 | | | | 92 | | |
Zions Bancorporation | | | 3,086 | | | | 92 | | |
| | | | 10,119 | | |
Total Common Stocks (Cost $21,170) | | | 22,267 | | |
Investment Company (0.0%) | |
United States (0.0%) | |
| SPDR S&P 500 ETF Trust (Cost $50) | | | 303 | | | | 56 | | |
| | | Face
Amount
(000) | | | |
Fixed Income Securities (15.0%) | |
Greece (1.4%) | |
Sovereign (1.4%) | |
Hellenic Republic Government Bond,
2.00%, 2/24/23 - 2/24/28 (b) | | EUR | 2,100 | | | | 1,811 | | |
The accompanying notes are an integral part of the financial statements.
10
Morgan Stanley Institutional Fund, Inc.
Annual Report — December 31, 2013
Portfolio of Investments (cont'd)
Multi-Asset Portfolio
| | | Face
Amount
(000) | | Value
(000) | |
Portugal (13.1%) | |
Sovereign (13.1%) | |
Portugal Obrigacoes do Tesouro OT,
3.35%, 10/15/15 (c) | | EUR | 3,150 | | | $ | 4,375 | | |
3.60%, 10/15/14 (c) | | | 3,183 | | | | 4,445 | | |
5.65%, 2/15/24 (c) | | | 1,474 | | | | 1,960 | | |
4.95%, 10/25/23 (c) | | | 4,937 | | | | 6,282 | | |
| | | | 17,062 | | |
Spain (0.5%) | |
Sovereign (0.5%) | |
Spain Government Bond,
3.75%, 10/31/15 | | | 470 | | | | 674 | | |
Total Fixed Income Securities (Cost $18,404) | | | 19,547 | | |
| | | Shares | | | |
Short-Term Investments (64.3%) | |
Investment Company (63.2%) | |
Morgan Stanley Institutional Liquidity
Funds — Money Market Portfolio —
Institutional Class (See Note G)
(Cost $82,396) | | | 82,395,993 | | | | 82,396 | | |
| | | Face
Amount
(000) | | Value
(000) | |
U.S. Treasury Securities (1.1%) | |
U.S. Treasury Bills,
0.03%, 1/30/14 (d) | | $ | 111 | | | $ | 111 | | |
0.04%, 1/30/14 (d) | | | 527 | | | | 527 | | |
0.08%, 4/17/14 (d) | | | 833 | | | | 833 | | |
| Total U.S. Treasury Securities (Cost $1,471) | | | 1,471 | | |
Total Short-Term Investments (Cost $83,867) | | | 83,867 | | |
Total Investments (96.4%) (Cost $123,491) (e) | | | 125,737 | | |
Other Assets in Excess of Liabilities (3.6%) | | | 4,676 | | |
Net Assets (100.0%) | | $ | 130,413 | | |
(a) Non-income producing security.
(b) Multi-step coupon rate changes in predetermined increments to maturity. Rate disclosed is as of December 31, 2013. Maturity date disclosed is the ultimate maturity date.
(c) 144A security — Certain conditions for public sale may exist. Unless otherwise noted, these securities are deemed to be liquid.
(d) Rate shown is the yield to maturity at December 31, 2013.
(e) Securities are available for collateral in connection with open foreign currency forward exchange contracts, futures contracts and swap agreements.
CDI CHESS Depositary Interest.
CVA Certificaten Van Aandelen.
SPDR Standard & Poor's Depository Receipt.
Foreign Currency Forward Exchange Contracts:
The Portfolio had the following foreign currency forward exchange contracts open at December 31, 2013:
Counterparty | | Currency to
Deliver
(000) | | Value
(000) | | Settlement
Date | | In Exchange
For
(000) | | Value
(000) | | Unrealized
Appreciation
(Depreciation)
(000) | |
Bank of America NA | | EUR | 4,380 | | | $ | 6,025 | | | 1/16/14 | | USD | 6,013 | | | $ | 6,013 | | | $ | (12 | ) | |
Bank of America NA | | RUB | 31,511 | | | | 957 | | | 1/16/14 | | USD | 929 | | | | 929 | | | | (28 | ) | |
Bank of America NA | | RUB | 17,082 | | | | 518 | | | 1/16/14 | | USD | 506 | | | | 506 | | | | (12 | ) | |
Bank of America NA | | USD | 1,443 | | | | 1,443 | | | 1/16/14 | | RUB | 48,594 | | | | 1,475 | | | | 32 | | |
Bank of Montreal | | TRY | 821 | | | | 381 | | | 1/16/14 | | USD | 400 | | | | 400 | | | | 19 | | |
Bank of Montreal | | TRY | 344 | | | | 159 | | | 1/16/14 | | USD | 161 | | | | 161 | | | | 2 | | |
Bank of Montreal | | USD | 1,045 | | | | 1,045 | | | 1/16/14 | | EUR | 761 | | | | 1,047 | | | | 2 | | |
Citibank NA | | IDR | 1,961,600 | | | | 161 | | | 1/16/14 | | USD | 160 | | | | 160 | | | | (1 | ) | |
Citibank NA | | IDR | 4,777,339 | | | | 392 | | | 1/16/14 | | USD | 395 | | | | 395 | | | | 3 | | |
Commonwealth Bank of Australia | | AUD | 900 | | | | 803 | | | 1/16/14 | | USD | 801 | | | | 801 | | | | (2 | ) | |
Commonwealth Bank of Australia | | AUD | 4,689 | | | | 4,183 | | | 1/16/14 | | USD | 4,160 | | | | 4,160 | | | | (23 | ) | |
Commonwealth Bank of Australia | | USD | 877 | | | | 877 | | | 1/16/14 | | EUR | 639 | | | | 879 | | | | 2 | | |
Deutsche Bank AG London | | AUD | 654 | | | | 583 | | | 1/16/14 | | USD | 584 | | | | 584 | | | | 1 | | |
Deutsche Bank AG London | | CAD | 107 | | | | 101 | | | 1/16/14 | | USD | 101 | | | | 101 | | | | (— | @) | |
Deutsche Bank AG London | | EUR | 358 | | | | 492 | | | 1/16/14 | | USD | 490 | | | | 490 | | | | (2 | ) | |
Deutsche Bank AG London | | EUR | 2,549 | | | | 3,506 | | | 1/16/14 | | USD | 3,499 | | | | 3,499 | | | | (7 | ) | |
Deutsche Bank AG London | | JPY | 359,226 | | | | 3,411 | | | 1/16/14 | | USD | 3,497 | | | | 3,497 | | | | 86 | | |
Deutsche Bank AG London | | JPY | 169,188 | | | | 1,607 | | | 1/16/14 | | USD | 1,610 | | | | 1,610 | | | | 3 | | |
Deutsche Bank AG London | | USD | 300 | | | | 300 | | | 1/16/14 | | CHF | 266 | | | | 299 | | | | (1 | ) | |
Deutsche Bank AG London | | USD | 2,093 | | | | 2,093 | | | 1/16/14 | | EUR | 1,519 | | | | 2,090 | | | | (3 | ) | |
Deutsche Bank AG London | | USD | 23 | | | | 23 | | | 1/16/14 | | SEK | 152 | | | | 24 | | | | 1 | | |
Goldman Sachs International | | EUR | 569 | | | | 783 | | | 1/16/14 | | USD | 778 | | | | 778 | | | | (5 | ) | |
Goldman Sachs International | | EUR | 11,567 | | | | 15,913 | | | 1/16/14 | | USD | 15,881 | | | | 15,881 | | | | (32 | ) | |
Goldman Sachs International | | USD | 1,053 | | | | 1,053 | | | 1/16/14 | | EUR | 765 | | | | 1,052 | | | | (1 | ) | |
Goldman Sachs International | | USD | 29 | | | | 29 | | | 1/16/14 | | HKD | 223 | | | | 29 | | | | (— | @) | |
JPMorgan Chase Bank | | EUR | 137 | | | | 188 | | | 1/16/14 | | USD | 188 | | | | 188 | | | | (— | @) | |
JPMorgan Chase Bank | | INR | 25,631 | | | | 413 | | | 1/16/14 | | USD | 410 | | | | 410 | | | | (3 | ) | |
JPMorgan Chase Bank | | INR | 9,908 | | | | 160 | | | 1/16/14 | | USD | 160 | | | | 160 | | | | — | @ | |
The accompanying notes are an integral part of the financial statements.
11
Morgan Stanley Institutional Fund, Inc.
Annual Report — December 31, 2013
Portfolio of Investments (cont'd)
Multi-Asset Portfolio
Foreign Currency Forward Exchange Contracts (cont'd):
Counterparty | | Currency to
Deliver
(000) | | Value
(000) | | Settlement
Date | | In Exchange
For
(000) | | Value
(000) | | Unrealized
Appreciation
(Depreciation)
(000) | |
JPMorgan Chase Bank | | USD | 40 | | | $ | 40 | | | 1/16/14 | | DKK | 217 | | | $ | 40 | | | $ | — | @ | |
JPMorgan Chase Bank | | ZAR | 4,123 | | | | 392 | | | 1/16/14 | | USD | 396 | | | | 396 | | | | 4 | | |
JPMorgan Chase Bank | | ZAR | 1,676 | | | | 159 | | | 1/16/14 | | USD | 160 | | | | 160 | | | | 1 | | |
Royal Bank of Scotland | | BRL | 417 | | | | 176 | | | 1/16/14 | | USD | 177 | | | | 177 | | | | 1 | | |
Royal Bank of Scotland | | BRL | 376 | | | | 159 | | | 1/16/14 | | USD | 159 | | | | 159 | | | | (— | @) | |
Royal Bank of Scotland | | EUR | 156 | | | | 214 | | | 1/16/14 | | USD | 214 | | | | 214 | | | | (— | @) | |
Royal Bank of Scotland | | MXN | 792 | | | | 61 | | | 1/16/14 | | USD | 61 | | | | 61 | | | | — | @ | |
Royal Bank of Scotland | | USD | 801 | | | | 801 | | | 1/16/14 | | EUR | 581 | | | | 798 | | | | (3 | ) | |
State Street Bank and Trust Co. | | USD | 880 | | | | 880 | | | 1/16/14 | | CHF | 782 | | | | 876 | | | | (4 | ) | |
State Street Bank and Trust Co. | | USD | 224 | | | | 224 | | | 1/16/14 | | EUR | 162 | | | | 223 | | | | (1 | ) | |
State Street Bank and Trust Co. | | USD | 432 | | | | 432 | | | 1/16/14 | | GBP | 266 | | | | 441 | | | | 9 | | |
State Street Bank and Trust Co. | | USD | 76 | | | | 76 | | | 1/16/14 | | SEK | 500 | | | | 78 | | | | 2 | | |
UBS AG | | EUR | 575 | | | | 792 | | | 1/16/14 | | USD | 790 | | | | 790 | | | | (2 | ) | |
UBS AG | | JPY | 48,509 | | | | 461 | | | 1/16/14 | | USD | 462 | | | | 462 | | | | 1 | | |
UBS AG | | RUB | 67,456 | | | | 2,047 | | | 1/16/14 | | USD | 2,022 | | | | 2,022 | | | | (25 | ) | |
UBS AG | | USD | 101 | | | | 101 | | | 1/16/14 | | CAD | 107 | | | | 101 | | | | (— | @) | |
UBS AG | | USD | 1,017 | | | | 1,017 | | | 1/16/14 | | CHF | 903 | | | | 1,012 | | | | (5 | ) | |
UBS AG | | USD | 269 | | | | 269 | | | 1/16/14 | | CHF | 241 | | | | 270 | | | | 1 | | |
UBS AG | | USD | 187 | | | | 187 | | | 1/16/14 | | EUR | 137 | | | | 188 | | | | 1 | | |
UBS AG | | USD | 194 | | | | 194 | | | 1/16/14 | | GBP | 118 | | | | 196 | | | | 2 | | |
UBS AG | | USD | 2,976 | | | | 2,976 | | | 1/16/14 | | GBP | 1,833 | | | | 3,035 | | | | 59 | | |
UBS AG | | USD | 771 | | | | 771 | | | 1/16/14 | | HKD | 5,976 | | | | 771 | | | | (— | @) | |
UBS AG | | USD | 250 | | | | 250 | | | 1/16/14 | | JPY | 25,692 | | | | 244 | | | | (6 | ) | |
UBS AG | | USD | 161 | | | | 161 | | | 1/16/14 | | KRW | 169,588 | | | | 161 | | | | (— | @) | |
UBS AG | | USD | 2,005 | | | | 2,005 | | | 1/16/14 | | RUB | 67,456 | | | | 2,048 | | | | 43 | | |
UBS AG | | USD | 670 | | | | 670 | | | 1/16/14 | | SEK | 4,409 | | | | 686 | | | | 16 | | |
Bank of America NA | | RUB | 3,233 | | | | 97 | | | 2/20/14 | | USD | 94 | | | | 94 | | | | (3 | ) | |
Bank of America NA | | RUB | 48,594 | | | | 1,466 | | | 2/20/14 | | USD | 1,435 | | | | 1,435 | | | | (31 | ) | |
Bank of America NA | | USD | 3,580 | | | | 3,580 | | | 2/20/14 | | RUB | 119,283 | | | | 3,599 | | | | 19 | | |
UBS AG | | RUB | 67,456 | | | | 2,036 | | | 2/20/14 | | USD | 1,994 | | | | 1,994 | | | | (42 | ) | |
Bank of America NA | | RUB | 67,579 | | | | 2,030 | | | 3/20/14 | | USD | 2,041 | | | | 2,041 | | | | 11 | | |
Bank of America NA | | RUB | 119,283 | | | | 3,583 | | | 3/20/14 | | USD | 3,564 | | | | 3,564 | | | | (19 | ) | |
Bank of America NA | | USD | 2,529 | | | | 2,529 | | | 3/20/14 | | RUB | 84,011 | | | | 2,523 | | | | (6 | ) | |
Bank of America NA | | USD | 944 | | | | 944 | | | 3/20/14 | | RUB | 31,417 | | | | 944 | | | | (— | @) | |
Bank of America NA | | USD | 220 | | | | 220 | | | 3/20/14 | | RUB | 7,317 | | | | 220 | | | | — | @ | |
Bank of America NA | | USD | 1,930 | | | | 1,930 | | | 3/20/14 | | RUB | 64,117 | | | | 1,926 | | | | (4 | ) | |
| | | | | $ | 81,529 | | | | | | | $ | 81,567 | | | $ | 38 | | |
Futures Contracts:
The Portfolio had the following futures contracts open at December 31, 2013:
| | | Number
of
Contracts | | Value
(000) | | Expiration
Date | | Unrealized
Appreciation
(Depreciation)
(000) | |
Long: | |
ASX Spi 200 Index (Australia) | | | 6 | | | $ | 712 | | | Mar-14 | | $ | 32 | | |
Australian 10 yr. Bond (Australia) | | | 12 | | | | 1,229 | | | Mar-14 | | | 8 | | |
CAC 40 Index (France) | | | 2 | | | | 118 | | | Jan-14 | | | 6 | | |
Euro BTP Italian Government Bond (Italy) | | | 7 | | | | 1,106 | | | Mar-14 | | | 1 | | |
Euro OAT (Germany) | | | 8 | | | | 1,446 | | | Mar-14 | | | (12 | ) | |
Euro Stoxx 50 Index (Germany) | | | 443 | | | | 18,941 | | | Mar-14 | | | 652 | | |
FTSE 100 Index (United Kingdom) | | | 14 | | | | 1,553 | | | Mar-14 | | | 40 | | |
FTSE MIB Index (Italy) | | | 10 | | | | 1,309 | | | Mar-14 | | | 55 | | |
IBEX 35 Index (Spain) | | | 13 | | | | 1,765 | | | Jan-14 | | | 72 | | |
MSCI Emerging Market E Mini (United States) | | | 7 | | | | 356 | | | Mar-14 | | | 6 | | |
NIKKEI 225 Index (Japan) | | | 39 | | | | 3,026 | | | Mar-14 | | | 152 | | |
S&P 500 E MINI Index (United States) | | | 373 | | | | 34,336 | | | Mar-14 | | | 695 | | |
U.S. Treasury 10 yr. Note (United States) | | | 420 | | | | 51,680 | | | Mar-14 | | | (635 | ) | |
UK Long Gilt Bond (United Kingdom) | | | 10 | | | | 1,764 | | | Mar-14 | | | (7 | ) | |
The accompanying notes are an integral part of the financial statements.
12
Morgan Stanley Institutional Fund, Inc.
Annual Report — December 31, 2013
Portfolio of Investments (cont'd)
Multi-Asset Portfolio
Futures Contracts (cont'd):
| | | Number
of
Contracts | | Value
(000) | | Expiration
Date | | Unrealized
Appreciation
(Depreciation)
(000) | |
Short: | |
German Euro Bund (Germany) | | | 232 | | | $ | (44,418 | ) | | Mar-14 | | $ | 517 | | |
TOPIX Index (Japan) | | | 33 | | | | (4,081 | ) | | Mar-14 | | | (158 | ) | |
| | | | | | | | | $ | 1,424 | | |
Total Return Swap Agreements:
The Portfolio had the following total return swap agreements open at December 31, 2013:
Swap Counterparty | | Index | | Notional
Amount
(000) | | Floating
Rate | | Pay/Receive
Total Return
of Referenced
Index | | Maturity
Date | | Unrealized
Appreciation
(Depreciation)
(000) | |
Bank of America
| | Merrill Lynch U.S. REIT
Custom Basket | | $ | 1,345 | | | 3-Month USD-LIBOR-minus
0.10% | | Pay | | 7/8/14 | | $ | — | @ | |
Bank of America
| | Merrill Lynch U.S. REIT
Custom Basket | | | 758 | | | 3-Month USD-LIBOR-minus
0.10% | | Pay | | 7/11/14 | | | — | @ | |
Bank of America
| | Merrill Lynch U.S. REIT
Custom Basket | | | 165 | | | 3-Month USD-LIBOR-minus
0.10% | | Pay | | 7/11/14 | | | — | @ | |
Bank of America
| | Merrill Lynch U.S. REIT
Custom Basket | | | 399 | | | 3-Month USD-LIBOR-minus
0.15% | | Pay | | 7/11/14 | | | — | @ | |
Bank of America
| | Merrill Lynch U.S. REIT
Custom Basket | | | 233 | | | 3-Month USD-LIBOR-minus
0.15% | | Pay | | 7/11/14 | | | — | @ | |
Bank of America
| | Merrill Lynch U.S. REIT
Custom Basket | | | 745 | | | 3-Month USD-LIBOR-minus
0.15% | | Pay | | 8/11/14 | | | — | @ | |
Bank of America
| | MSCI Daily Total Return
Europe Net Food
Beverage & Tobacco Index | | | 919 | | | 3-Month USD-LIBOR-minus
0.27% | | Pay | | 12/24/14 | | | (31 | ) | |
Bank of America
| | Merrill Lynch Custom
European Stock Index | | | 6,563 | | | 3-Month EUR-EURIBOR-minus
0.04% | | Receive | | 9/26/14 | | | 251 | | |
Bank of America
| | Merrill Lynch Custom
European Stock Index | | | 6,566 | | | 3-Month EUR-EURIBOR-minus
0.28% | | Pay | | 9/26/14 | | | (248 | ) | |
Barclays Bank
| | Barclays Custom
International Retail Basket | | | 279 | | | 3-Month USD-LIBOR-minus
0.65% | | Pay | | 10/21/14 | | | 3 | | |
Barclays Bank
| | Barclays Custom
International Retail Basket | | | 2,752 | | | 3-Month USD-LIBOR-minus
0.65% | | Pay | | 10/23/14 | | | 29 | | |
Barclays Bank
| | Barclays Custom
International Retail Basket | | | 299 | | | 3-Month USD-LIBOR-minus
0.65% | | Pay | | 10/23/14 | | | 2 | | |
Barclays Bank
| | Barclays Custom
International Retail Basket | | | 426 | | | 3-Month USD-LIBOR-minus
0.65% | | Pay | | 10/23/14 | | | (9 | ) | |
Barclays Bank
| | Barclays Custom
International Retail Basket | | | 209 | | | 3-Month USD-LIBOR-minus
0.65% | | Pay | | 10/23/14 | | | (3 | ) | |
Barclays Bank
| | Barclays Custom
International Retail Basket | | | 592 | | | 3-Month USD-LIBOR-minus
0.65% | | Pay | | 10/23/14 | | | (23 | ) | |
Goldman Sachs
International | | Goldman Sachs Custom
Mortgage REIT Index | | | 825 | | | 3-Month USD-LIBOR-minus
0.28% | | Pay | | 8/20/14 | | | — | @ | |
Goldman Sachs
International | | Goldman Sachs Custom
Mortgage REIT Index | | | 456 | | | 3-Month USD-LIBOR-minus
0.28% | | Pay | | 8/21/14 | | | (1 | ) | |
Goldman Sachs
International | | Goldman Sachs Custom
Mortgage REIT Index | | | 511 | | | 3-Month USD-LIBOR-minus
0.28% | | Pay | | 8/21/14 | | | (1 | ) | |
Goldman Sachs
International | | Goldman Sachs Custom
Mortgage REIT Index | | | 2,955 | | | 3-Month USD-LIBOR-minus
0.28% | | Pay | | 8/21/14 | | | (6 | ) | |
Goldman Sachs
International | | Goldman Sachs Custom
Mortgage REIT Index | | | 504 | | | 3-Month USD-LIBOR-minus
0.28% | | Pay | | 8/21/14 | | | (10 | ) | |
Goldman Sachs
International | | Goldman Sachs Custom
Mortgage REIT Index | | | 260 | | | 3-Month USD-LIBOR-minus
0.28% | | Pay | | 8/21/14 | | | (4 | ) | |
Goldman Sachs
International | | Goldman Sachs Custom
Mortgage REIT Index | | | 2,243 | | | 3-Month USD-LIBOR-minus
0.28% | | Pay | | 8/21/14 | | | (10 | ) | |
The accompanying notes are an integral part of the financial statements.
13
Morgan Stanley Institutional Fund, Inc.
Annual Report — December 31, 2013
Portfolio of Investments (cont'd)
Multi-Asset Portfolio
Total Return Swap Agreements (cont'd):
Swap Counterparty | | Index | | Notional
Amount
(000) | | Floating
Rate | | Pay/Receive
Total Return
of Referenced
Index | | Maturity
Date | | Unrealized
Appreciation
(Depreciation)
(000) | |
Goldman Sachs
International | | Goldman Sachs EU Chemicals
Custom Basket | | $ | 169 | | | 3-Month EUR-EURIBOR-minus
0.10% | | Pay | | 10/13/14 | | $ | (4 | ) | |
Goldman Sachs
International | | Goldman Sachs EU Chemicals
Custom Basket | | | 1,902 | | | 3-Month EUR-EURIBOR-minus
0.10% | | Pay | | 10/13/14 | | | (246 | ) | |
Goldman Sachs
International | | Goldman Sachs EU Chemicals
Custom Basket | | | 404 | | | 3-Month EUR-EURIBOR-minus
0.10% | | Pay | | 10/13/14 | | | (2 | ) | |
Goldman Sachs
International | | Goldman Sachs EU Chemicals
Custom Basket | | | 339 | | | 3-Month EUR-EURIBOR-minus
0.20% | | Pay | | 10/13/14 | | | (21 | ) | |
Goldman Sachs
International | | Goldman Sachs EU Chemicals
Custom Basket | | | 231 | | | 3-Month EUR-EURIBOR-minus
0.10% | | Pay | | 10/13/14 | | | (4 | ) | |
Goldman Sachs
International | | Goldman Sachs EU Chemicals
Custom Basket | | | 203 | | | 3-Month EUR-EURIBOR-minus
0.10% | | Pay | | 10/14/14 | | | (5 | ) | |
Goldman Sachs
International | | Goldman Sachs Custom
Client Basket | | | 5,459 | | | 3-Month USD-LIBOR-minus
0.19% | | Pay | | 11/24/14 | | | (64 | ) | |
Goldman Sachs
International | | Goldman Sachs Custom
Client Basket | | | 2,210 | | | 3-Month USD-LIBOR-minus
0.19% | | Pay | | 11/24/14 | | | (1 | ) | |
Goldman Sachs
International | | Goldman Sachs Custom
Miners Index | | | 1,020 | | | 3-Month USD-LIBOR-minus
0.51% | | Pay | | 11/26/14 | | | (15 | ) | |
Goldman Sachs
International | | Goldman Sachs Custom
Miners Index | | | 140 | | | 3-Month USD-LIBOR-minus
0.51% | | Pay | | 11/26/14 | | | (6 | ) | |
Goldman Sachs
International | | Goldman Sachs Custom
Miners Index | | | 439 | | | 3-Month USD-LIBOR-minus
0.51% | | Pay | | 11/26/14 | | | (2 | ) | |
Goldman Sachs
International | | Goldman Sachs China
Retail Custom Basket | | | 8,255 | | | 3-Month HKD-HIBOR-minus
0.65% | | Pay | | 12/15/14 | | | 38 | | |
Goldman Sachs
International | | Goldman Sachs China
Retail Custom Basket | | | 4,489 | | | 3-Month HKD-HIBOR-minus
0.65% | | Pay | | 12/15/14 | | | — | | |
Goldman Sachs
International | | Goldman Sachs India
Banks Index | | | 1,799 | | | 3-Month USD-LIBOR-minus
0.45% | | Pay | | 12/23/14 | | | (31 | ) | |
Goldman Sachs
International | | Goldman Sachs India
Banks Index | | | 749 | | | 3-Month USD-LIBOR-minus
0.45% | | Pay | | 12/23/14 | | | (1 | ) | |
JPMorgan
Chase Bank | | MSCI U.S. REIT
Index | | | 922 | | | 3-Month USD-LIBOR-minus
0.28% | | Pay | | 7/11/14 | | | 13 | | |
JPMorgan
Chase Bank | | MSCI U.S. REIT
Index | | | 499 | | | 3-Month USD-LIBOR-minus
0.28% | | Pay | | 7/11/14 | | | 22 | | |
JPMorgan
Chase Bank | | MSCI U.S. REIT
Index | | | 600 | | | 3-Month USD-LIBOR-minus
0.28% | | Pay | | 7/11/14 | | | 1 | | |
JPMorgan
Chase Bank | | MSCI U.S. REIT
Index | | | 610 | | | 3-Month USD-LIBOR-minus
0.32% | | Pay | | 7/11/14 | | | (5 | ) | |
JPMorgan
Chase Bank | | MSCI U.S. REIT
Index | | | 410 | | | 3-Month USD-LIBOR-minus
0.28% | | Pay | | 7/11/14 | | | 28 | | |
JPMorgan
Chase Bank | | MSCI U.S. REIT
Index | | | 157 | | | 3-Month USD-LIBOR-minus
0.20% | | Pay | | 7/11/14 | | | 1 | | |
JPMorgan
Chase Bank | | MSCI U.S. REIT
Index | | | 2,879 | | | 3-Month USD-LIBOR-minus
0.32% | | Pay | | 7/11/14 | | | 12 | | |
JPMorgan
Chase Bank
| | MSCI Daily Total Return
Europe Net Food Beverage &
Tobacco Index | | | 3,293 | | | 3-Month USD-LIBOR-minus
0.22% | | Pay | | 8/16/14 | | | (80 | ) | |
JPMorgan
Chase Bank
| | MSCI Daily Total Return
Europe Net Household &
Personal Products Index | | | 352 | | | 3-Month USD-LIBOR-minus
0.39% | | Pay | | 8/16/14 | | | (23 | ) | |
JPMorgan
Chase Bank
| | MSCI Daily Total Return
Europe Net Food Beverage &
Tobacco Index | | | 1,005 | | | 3-Month USD-LIBOR-minus
0.22% | | Pay | | 8/18/14 | | | (24 | ) | |
JPMorgan
Chase Bank
| | MSCI Daily Total Return
Europe Net Food Beverage &
Tobacco Index | | | 1,052 | | | 3-Month USD-LIBOR-minus
0.22% | | Pay | | 8/18/14 | | | (26 | ) | |
The accompanying notes are an integral part of the financial statements.
14
Morgan Stanley Institutional Fund, Inc.
Annual Report — December 31, 2013
Portfolio of Investments (cont'd)
Multi-Asset Portfolio
Total Return Swap Agreements (cont'd):
Swap Counterparty | | Index | | Notional
Amount
(000) | | Floating
Rate | | Pay/Receive
Total Return
of Referenced
Index | | Maturity
Date | | Unrealized
Appreciation
(Depreciation)
(000) | |
JPMorgan
Chase Bank
| | MSCI Daily Total Return
Europe Net Food Beverage &
Tobacco Index | | $ | 700 | | | 3-Month USD-LIBOR-minus
0.22% | | Pay | | 8/18/14 | | $ | (17 | ) | |
JPMorgan
Chase Bank
| | MSCI Daily Total Return
Europe Net Food Beverage &
Tobacco Index | | | 460 | | | 3-Month USD-LIBOR-minus
0.22% | | Pay | | 8/18/14 | | | (4 | ) | |
JPMorgan
Chase Bank
| | MSCI Daily Total Return
Europe Net Food Beverage &
Tobacco Index | | | 305 | | | 3-Month USD-LIBOR-minus
0.22% | | Pay | | 8/18/14 | | | (7 | ) | |
JPMorgan
Chase Bank
| | MSCI Daily Total Return
Europe Net Household &
Personal Products Index | | | 188 | | | 3-Month USD-LIBOR-minus
0.39% | | Pay | | 8/18/14 | | | (12 | ) | |
JPMorgan
Chase Bank
| | MSCI Daily Total Return
Europe Net Household &
Personal Products Index | | | 160 | | | 3-Month USD-LIBOR-minus
0.39% | | Pay | | 8/18/14 | | | (5 | ) | |
JPMorgan
Chase Bank
| | MSCI Daily Total Return
Europe Net Food Beverage &
Tobacco Index | | | 489 | | | 3-Month USD-LIBOR-minus
0.22% | | Pay | | 8/19/14 | | | (12 | ) | |
JPMorgan
Chase Bank
| | MSCI Daily Total Return
Europe Net Household &
Personal Products Index | | | 107 | | | 3-Month USD-LIBOR-minus
0.39% | | Pay | | 8/19/14 | | | (7 | ) | |
JPMorgan
Chase Bank | | JPMorgan Chase Custom
Machinery Index | | | 278 | | | 3-Month USD-LIBOR-minus
0.28% | | Pay | | 11/26/14 | | | (12 | ) | |
JPMorgan
Chase Bank | | JPMorgan Chase Custom
Machinery Index | | | 1,578 | | | 3-Month USD-LIBOR-minus
0.28% | | Pay | | 11/26/14 | | | (60 | ) | |
JPMorgan
Chase Bank | | MSCI China Banks
Index | | | 7,969 | | | 3-Month HKD-HIBOR-minus
0.25% | | Pay | | 11/26/14 | | | 43 | | |
JPMorgan
Chase Bank | | MSCI China Banks
Index | | | 4,800 | | | 3-Month HKD-HIBOR-minus
0.25% | | Pay | | 11/26/14 | | | — | | |
JPMorgan
Chase Bank | | JPMorgan Chase Australian
Banks Index | | | 350 | | | 3-Month AUD-BBSW-minus
0.17% | | Pay | | 11/27/14 | | | (11 | ) | |
JPMorgan
Chase Bank | | JPMorgan Chase Australian
Banks Index | | | 2,253 | | | 3-Month AUD-BBSW-minus
0.17% | | Pay | | 11/27/14 | | | (26 | ) | |
JPMorgan
Chase Bank | | JPMorgan Chase Australian
Banks Index | | | 999 | | | 3-Month AUD-BBSW-minus
0.17% | | Pay | | 11/27/14 | | | — | | |
| | | | | | | | | | | | | | | | | | | | | | | | | $ | (636 | ) | |
@ Value is less than $500.
BBSW Australia's Bank Bill Swap
EURIBOR Euro Interbank Offered Rate.
HIBOR Hong Kong Interbank Offered Rate.
LIBOR London Interbank Offered Rate.
OAT Obligations Assimilables du Trésor (French Treasury Obligation).
AUD — Australian Dollar
BRL — Brazilian Real
CAD — Canadian Dollar
CHF — Swiss Franc
DKK — Danish Krone
EUR — Euro
GBP — British Pound
HKD — Hong Kong Dollar
IDR — Indonesian Rupiah
INR — Indian Rupee
JPY — Japanese Yen
KRW — South Korean Won
MXN — Mexican New Peso
RUB — Russian Ruble
SEK — Swedish Krona
TRY — Turkish Lira
USD — United States Dollar
ZAR — South African Rand
The accompanying notes are an integral part of the financial statements.
15
Morgan Stanley Institutional Fund, Inc.
Annual Report — December 31, 2013
Statement of Assets and Liabilities | | December 31, 2013
(000) | |
Assets: | |
Investments in Securities of Unaffiliated Issuers, at Value (Cost $41,095) | | $ | 43,341 | | |
Investment in Security of Affiliated Issuer, at Value (Cost $82,396) | | | 82,396 | | |
Total Investments in Securities, at Value (Cost $123,491) | | | 125,737 | | |
Foreign Currency, at Value (Cost $63) | | | 63 | | |
Receivable for Variation Margin on Futures Contracts | | | 5,098 | | |
Receivable for Portfolio Shares Sold | | | 3,180 | | |
Unrealized Appreciation on Swap Agreements | | | 443 | | |
Unrealized Appreciation on Foreign Currency Forward Exchange Contracts | | | 321 | | |
Interest Receivable | | | 211 | | |
Tax Reclaim Receivable | | | 44 | | |
Dividends Receivable | | | 11 | | |
Receivable from Affiliate | | | 2 | | |
Other Assets | | | 23 | | |
Total Assets | | | 135,133 | | |
Liabilities: | |
Payable for Investments Purchased | | | 2,925 | | |
Unrealized Depreciation on Swap Agreements | | | 1,079 | | |
Payable for Portfolio Shares Redeemed | | | 347 | | |
Unrealized Depreciation on Foreign Currency Forward Exchange Contracts | | | 283 | | |
Payable for Custodian Fees | | | 45 | | |
Payable for Shareholder Services Fees — Class A* | | | 3 | | |
Payable for Distribution and Shareholder Services Fees — Class L | | | 5 | | |
Payable for Transfer Agent Fees | | | 5 | | |
Payable for Transfer Agent Fees — Class I | | | — | @ | |
Payable for Transfer Agent Fees — Class A* | | | — | @ | |
Payable for Transfer Agent Fees — Class L | | | — | @ | |
Payable for Advisory Fees | | | 6 | | |
Payable for Administration Fees | | | 6 | | |
Payable for Professional Fees | | | 2 | | |
Payable for Sub Transfer Agency Fees | | | — | @ | |
Other Liabilities | | | 14 | | |
Total Liabilities | | | 4,720 | | |
Net Assets | | $ | 130,413 | | |
Net Assets Consist Of: | |
Paid-in-Capital | | $ | 127,826 | | |
Accumulated Undistributed Net Investment Income | | | 604 | | |
Accumulated Net Realized Loss | | | (1,096 | ) | |
Unrealized Appreciation (Depreciation) on: | |
Investments | | | 2,246 | | |
Futures Contracts | | | 1,424 | | |
Swap Agreements | | | (636 | ) | |
Foreign Currency Forward Exchange Contracts | | | 38 | | |
Foreign Currency Translations | | | 7 | | |
Net Assets | | $ | 130,413 | | |
The accompanying notes are an integral part of the financial statements.
16
Morgan Stanley Institutional Fund, Inc.
Annual Report — December 31, 2013
Statement of Assets and Liabilities (cont'd) | | December 31, 2013
(000) | |
CLASS I: | |
Net Assets | | $ | 107,463 | | |
| Shares Outstanding $0.001 par value shares of beneficial interest (500,000,000 shares authorized) (not in 000's) | | | 9,203,243 | | |
Net Asset Value, Offering and Redemption Price Per Share | | $ | 11.68 | | |
CLASS A*: | |
Net Assets | | $ | 13,437 | | |
| Shares Outstanding $0.001 par value shares of beneficial interest (500,000,000 shares authorized) (not in 000's) | | | 1,155,532 | | |
Net Asset Value, Redemption Price Per Share | | $ | 11.63 | | |
Maximum Sales Load§§ | | | 5.25 | % | |
Maximum Sales Charge | | $ | 0.64 | | |
Maximum Offering Price Per Share | | $ | 12.27 | | |
CLASS L: | |
Net Assets | | $ | 9,513 | | |
| Shares Outstanding $0.001 par value shares of beneficial interest (500,000,000 shares authorized) (not in 000's) | | | 825,296 | | |
Net Asset Value, Offering and Redemption Price Per Share | | $ | 11.53 | | |
@ Amount is less than $500.
* Effective September 9, 2013, Class P and Class H shares were renamed Class A shares.
§§ Effective February 25, 2013, the Directors approved the imposition of a maximum initial sales charge of 5.25% on purchases of Class A shares of the Portfolio.
The accompanying notes are an integral part of the financial statements.
17
Morgan Stanley Institutional Fund, Inc.
Annual Report — December 31, 2013
Statement of Operations | | Year Ended
December 31, 2013
(000) | |
Investment Income: | |
Interest from Securities of Unaffiliated Issuers | | $ | 432 | | |
Dividends from Securities of Unaffiliated Issuers (Net of $9 of Foreign Taxes Withheld) | | | 86 | | |
Dividends from Security of Affiliated Issuer (Note G) | | | 18 | | |
Total Investment Income | | | 536 | | |
Expenses: | |
Advisory Fees (Note B) | | | 354 | | |
Custodian Fees (Note F) | | | 182 | | |
Professional Fees | | | 114 | | |
Registration Fees | | | 42 | | |
Administration Fees (Note C) | | | 33 | | |
Shareholder Reporting Fees | | | 32 | | |
Offering Costs | | | 28 | | |
Shareholder Services Fees — Class A* (Note D) | | | 11 | | |
Distribution and Shareholder Services Fees — Class L (Note D) | | | 16 | | |
Pricing Fees | | | 15 | | |
Transfer Agency Fees (Note E) | | | 3 | | |
Transfer Agency Fees — Class I (Note E) | | | — | @ | |
Transfer Agency Fees — Class A* (Note E) | | | — | @ | |
Transfer Agency Fees — Class L (Note E) | | | — | @ | |
Directors' Fees and Expenses | | | 2 | | |
Sub Transfer Agency Fees — Class I | | | — | @ | |
Sub Transfer Agency Fees — Class A* | | | — | @ | |
Sub Transfer Agency Fees | | | — | @ | |
Other Expenses | | | 13 | | |
Total Expenses | | | 845 | | |
Waiver of Advisory Fees (Note B) | | | (354 | ) | |
Rebate from Morgan Stanley Affiliate (Note G) | | | (29 | ) | |
Expenses Reimbursed by Adviser (Note B) | | | (6 | ) | |
Reimbursement of Class Specific Expenses — Class I (Note B) | | | (— | @) | |
Net Expenses | | | 456 | | |
Net Investment Income | | | 80 | | |
Realized Gain (Loss): | |
Investments Sold | | | 934 | | |
Investments in Affiliates | | | 45 | | |
Foreign Currency Forward Exchange Contracts | | | 323 | | |
Foreign Currency Transactions | | | (37 | ) | |
Futures Contracts | | | 2,722 | | |
Swap Agreements | | | (1,058 | ) | |
Net Realized Gain | | | 2,929 | | |
Change in Unrealized Appreciation (Depreciation): | |
Investments | | | 1,875 | | |
Investments in Affiliates | | | (30 | ) | |
Foreign Currency Forward Exchange Contracts | | | 30 | | |
Foreign Currency Translations | | | 7 | | |
Futures Contracts | | | 1,273 | | |
Swap Agreements | | | (489 | ) | |
Net Change in Unrealized Appreciation (Depreciation) | | | 2,666 | | |
Net Realized Gain and Change in Unrealized Appreciation (Depreciation) | | | 5,595 | | |
Net Increase in Net Assets Resulting from Operations | | $ | 5,675 | | |
* Effective September 9, 2013, Class P and Class H shares were renamed Class A shares.
@ Amount is less than $500.
The accompanying notes are an integral part of the financial statements.
18
Morgan Stanley Institutional Fund, Inc.
Annual Report — December 31, 2013
Statements of Changes in Net Assets | | Year Ended
December 31, 2013
(000) | | Period from
June 22, 2012^ to
Year Ended
December 31, 2012
(000) | |
Increase (Decrease) in Net Assets: | |
Operations: | |
Net Investment Income (Loss) | | $ | 80 | | | $ | (34 | ) | |
Net Realized Gain | | | 2,929 | | | | 535 | | |
Net Change in Unrealized Appreciation (Depreciation) | | | 2,666 | | | | 413 | | |
Net Increase in Net Assets Resulting from Operations | | | 5,675 | | | | 914 | | |
Distributions from and/or in Excess of: | |
Class I: | |
Net Realized Gain | | | (2,922 | ) | | | (298 | ) | |
Class A*: | |
Net Realized Gain | | | (486 | ) | | | (2 | ) | |
Class H@: | |
Net Realized Gain | | | — | | | | (5 | ) | |
Class L: | |
Net Realized Gain | | | (284 | ) | | | (5 | ) | |
Total Distributions | | | (3,692 | ) | | | (310 | ) | |
Capital Share Transactions:(1) | |
Class I: | |
Subscribed | | | 87,746 | | | | 19,830 | | |
Distributions Reinvested | | | 2,198 | | | | 77 | | |
Redeemed | | | (5,089 | ) | | | (1 | ) | |
Class A*: | |
Subscribed | | | 10,442 | | | | 100 | | |
Distributions Reinvested | | | 413 | | | | — | | |
Conversion from Class H | | | 3,779 | | | | — | | |
Redeemed | | | (1,164 | ) | | | — | | |
Class H@: | |
Subscribed | | | 3,539 | ** | | | 665 | | |
Distributions Reinvested | | | — | | | | 4 | | |
Conversion to Class A | | | (3,779 | )** | | | — | | |
Redeemed | | | (521 | )** | | | — | | |
Class L: | |
Subscribed | | | 9,771 | | | | 329 | | |
Distributions Reinvested | | | 279 | | | | 3 | | |
Redeemed | | | (795 | ) | | | — | | |
Net Increase in Net Assets Resulting from Capital Share Transactions | | | 106,819 | | | | 21,007 | | |
Total Increase in Net Assets | | | 108,802 | | | | 21,611 | | |
Net Assets: | |
Beginning of Period | | | 21,611 | | | | — | | |
End of Period (Including Accumulated Undistributed Net Investment Income of $604 and $55) | | $ | 130,413 | | | $ | 21,611 | | |
The accompanying notes are an integral part of the financial statements.
19
Morgan Stanley Institutional Fund, Inc.
Annual Report — December 31, 2013
Statements of Changes in Net Assets (cont'd) | | Year Ended
December 31, 2013
(000) | | Period from
June 22, 2012^ to
Year Ended
December 31, 2012
(000) | |
(1) Capital Share Transactions: | |
Class I: | |
Shares Subscribed | | | 7,456 | | | | 1,982 | | |
Shares Issued on Distributions Reinvested | | | 190 | | | | 8 | | |
Shares Redeemed | | | (433 | ) | | | (— | @@) | |
Net Increase in Class I Shares Outstanding | | | 7,213 | | | | 1,990 | | |
Class A*: | |
Shares Subscribed | | | 883 | | | | 10 | | |
Shares Issued on Distributions Reinvested | | | 36 | | | | — | | |
Conversion from Class H | | | 326 | | | | — | | |
Shares Redeemed | | | (99 | ) | | | — | | |
Net Increase in Class A Shares Outstanding | | | 1,146 | | | | 10 | | |
Class H@: | |
Shares Subscribed | | | 306 | ** | | | 66 | | |
Shares Issued on Distributions Reinvested | | | — | | | | — | @@ | |
Conversion to Class A | | | (326 | )** | | | — | | |
Shares Redeemed | | | (46 | )** | | | — | | |
Net Increase (Decrease) in Class H Shares Outstanding | | | (66 | ) | | | 66 | | |
Class L: | |
Shares Subscribed | | | 836 | | | | 33 | | |
Shares Issued on Distributions Reinvested | | | 24 | | | | — | @@ | |
Shares Redeemed | | | (68 | ) | | | — | | |
Net Increase in Class L Shares Outstanding | | | 792 | | | | 33 | | |
^ Commencement of operations.
@ Effective September 9, 2013, Class H shares converted into Class A shares.
@@ Amount is less than 500 shares.
* Effective September 9, 2013, Class P shares were renamed Class A shares.
** For the period January 1, 2013 through September 6, 2013.
The accompanying notes are an integral part of the financial statements.
20
Morgan Stanley Institutional Fund, Inc.
Annual Report — December 31, 2013
Financial Highlights
Multi-Asset Portfolio
| | | Class I | |
Selected Per Share Data and Ratios | | Year Ended
December 31, 2013 | | Period from
June 22,
2012^ to
December 31, 2012 | |
Net Asset Value, Beginning of Period | | $ | 10.30 | | | $ | 10.00 | | |
Income (Loss) from Investment Operations: | |
Net Investment Income (Loss)† | | | 0.03 | | | | (0.02 | ) | |
Net Realized and Unrealized Gain | | | 1.84 | | | | 0.47 | | |
Total from Investment Operations | | | 1.87 | | | | 0.45 | | |
Distributions from and/or in Excess of: | |
Net Realized Gain | | | (0.49 | ) | | | (0.15 | ) | |
Net Asset Value, End of Period | | $ | 11.68 | | | $ | 10.30 | | |
Total Return++ | | | 18.24 | % | | | 4.53 | %# | |
Ratios and Supplemental Data: | |
Net Assets, End of Period (Thousands) | | $ | 107,463 | | | $ | 20,496 | | |
Ratio of Expenses to Average Net Assets (1) | | | 1.03 | %+ | | | 1.01 | %+††* | |
Ratio of Net Investment Income (Loss) to Average Net Assets (1) | | | 0.25 | %+ | | | (0.30 | )%+††* | |
Ratio of Rebate from Morgan Stanley Affiliates to Average Net Assets | | | 0.07 | % | | | 0.09 | %††* | |
Portfolio Turnover Rate | | | 223 | % | | | 167 | %# | |
(1) Supplemental Information on the Ratios to Average Net Assets: | |
Ratios Before Expense Limitation: | |
Expenses to Average Net Assets | | | 1.97 | % | | | 2.41 | %††* | |
Net Investment Loss to Average Net Assets | | | (0.69 | )% | | | (1.70 | )%††* | |
^ Commencement of Operations.
† Per share amount is based on average shares outstanding.
++ Calculated based on the net asset value as of the last business day of the period.
+ The Ratios of Expenses and Net Investment Income (Loss) reflect the rebate of certain Portfolio expenses in connection with the investments in Morgan Stanley affiliates during the period. The effect of the rebate on the ratios is disclosed in the above table as "Ratio of Rebate from Morgan Stanley Affiliates to Average Net Assets."
†† Reflects overall Portfolio ratios for investment income and non-class specific expenses.
# Not Annualized.
* Annualized.
The accompanying notes are an integral part of the financial statements.
21
Morgan Stanley Institutional Fund, Inc.
Annual Report — December 31, 2013
Financial Highlights
Multi-Asset Portfolio
| | | Class A@ | |
Selected Per Share Data and Ratios | | Year Ended
December 31, 2013 | | Period from
June 22,
2012^ to
December 31, 2012 | |
Net Asset Value, Beginning of Period | | $ | 10.29 | | | $ | 10.00 | | |
Income (Loss) from Investment Operations: | |
Net Investment Income (Loss)† | | | 0.01 | | | | (0.03 | ) | |
Net Realized and Unrealized Gain | | | 1.82 | | | | 0.47 | | |
Total from Investment Operations | | | 1.83 | | | | 0.44 | | |
Distributions from and/or in Excess of: | |
Net Realized Gain | | | (0.49 | ) | | | (0.15 | ) | |
Net Asset Value, End of Period | | $ | 11.63 | | | $ | 10.29 | | |
Total Return++ | | | 17.86 | % | | | 4.43 | %# | |
Ratios and Supplemental Data: | |
Net Assets, End of Period (Thousands) | | $ | 13,437 | | | $ | 103 | | |
Ratio of Expenses to Average Net Assets (1) | | | 1.30 | %+^^ | | | 1.26 | %+††* | |
Ratio of Net Investment Income (Loss) to Average Net Assets (1) | | | 0.07 | %+ | | | (0.55 | )%+††* | |
Ratio of Rebate from Morgan Stanley Affiliates to Average Net Assets | | | 0.07 | % | | | 0.09 | %††* | |
Portfolio Turnover Rate | | | 223 | % | | | 167 | %# | |
(1) Supplemental Information on the Ratios to Average Net Assets: | |
Ratios Before Expense Limitation: | |
Expenses to Average Net Assets | | | 2.24 | % | | | 2.66 | %††* | |
Net Investment Loss to Average Net Assets | | | (0.87 | )% | | | (1.95 | )%††* | |
@ Effective September 9, 2013, Class P and Class H shares were renamed Class A shares.
^ Commencement of Operations.
† Per share amount is based on average shares outstanding.
++ Calculated based on the net asset value which does not reflect sales charges, if applicable, as of the last business day of the period.
+ The Ratios of Expenses and Net Investment Income (Loss) reflect the rebate of certain Portfolio expenses in connection with the investments in Morgan Stanley affiliates during the period. The effect of the rebate on the ratios is disclosed in the above table as "Ratio of Rebate from Morgan Stanley Affiliates to Average Net Assets."
^^ Effective September 16, 2013, the Adviser has agreed to limit the ratio of expenses to average net assets to the maximum ratio of 1.45% for Class A shares. Prior to September 16, 2013, the maximum ratio was 1.35% for Class A shares.
†† Reflects overall Portfolio ratios for investment income and non-class specific expenses.
# Not Annualized.
* Annualized.
The accompanying notes are an integral part of the financial statements.
22
Morgan Stanley Institutional Fund, Inc.
Annual Report — December 31, 2013
Financial Highlights
Multi-Asset Portfolio
| | | Class L | |
Selected Per Share Data and Ratios | | Year Ended
December 31, 2013 | | Period from
June 22,
2012^ to
December 31, 2012 | |
Net Asset Value, Beginning of Period | | $ | 10.26 | | | $ | 10.00 | | |
Income (Loss) from Investment Operations: | |
Net Investment Loss† | | | (0.05 | ) | | | (0.06 | ) | |
Net Realized and Unrealized Gain | | | 1.81 | | | | 0.47 | | |
Total from Investment Operations | | | 1.76 | | | | 0.41 | | |
Distributions from and/or in Excess of: | |
Net Realized Gain | | | (0.49 | ) | | | (0.15 | ) | |
Net Asset Value, End of Period | | $ | 11.53 | | | $ | 10.26 | | |
Total Return++ | | | 17.23 | % | | | 4.13 | %# | |
Ratios and Supplemental Data: | |
Net Assets, End of Period (Thousands) | | $ | 9,513 | | | $ | 337 | | |
Ratio of Expenses to Average Net Assets (1) | | | 1.79 | %+^^ | | | 1.76 | %+††* | |
Ratio of Net Investment Loss to Average Net Assets (1) | | | (0.46 | )%+ | | | (1.05 | )%+††* | |
Ratio of Rebate from Morgan Stanley Affiliates to Average Net Assets | | | 0.07 | % | | | 0.09 | %††* | |
Portfolio Turnover Rate | | | 223 | % | | | 167 | %# | |
(1) Supplemental Information on the Ratios to Average Net Assets: | |
Ratios Before Expense Limitation: | |
Expenses to Average Net Assets | | | 2.73 | % | | | 3.16 | %††* | |
Net Investment Loss to Average Net Assets | | | (1.40 | )% | | | (2.45 | )%††* | |
^ Commencement of Operations.
† Per share amount is based on average shares outstanding.
++ Calculated based on the net asset value as of the last business day of the period.
+ The Ratios of Expenses and Net Investment Loss reflect the rebate of certain Portfolio expenses in connection with the investments in Morgan Stanley affiliates during the period. The effect of the rebate on the ratios is disclosed in the above table as "Ratio of Rebate from Morgan Stanley Affiliates to Average Net Assets."
^^ Effective September 16, 2013, the Adviser has agreed to limit the ratio of expenses to average net assets to the maximum ratio of 1.95% for Class L shares. Prior to September 16, 2013, the maximum ratio was 1.85% for Class L shares.
†† Reflects overall Portfolio ratios for investment income and non-class specific expenses.
# Not Annualized.
* Annualized.
The accompanying notes are an integral part of the financial statements.
23
Morgan Stanley Institutional Fund, Inc.
Annual Report — December 31, 2013
Notes to Financial Statements
Morgan Stanley Institutional Fund, Inc. (the "Fund") is registered under the Investment Company Act of 1940, as amended (the "Act"), as an open-end management investment company. The Fund is comprised of twenty-seven separate, active, diversified and non-diversified portfolios (individually referred to as a "Portfolio", collectively as the "Portfolios").
The accompanying financial statements relate to the Multi-Asset Portfolio. The Portfolio seeks total return. The Portfolio's "Adviser," Morgan Stanley Investment Management Inc., seeks to achieve this objective with an emphasis on positive absolute return and controlling downside portfolio risk. To implement this approach, the Adviser will take long and short positions in a range of equity and equity related securities of any market capitalization, bonds, currencies and commodities. The Adviser may implement these positions either directly by purchasing securities or (specifically in the case of short positions) through the use of derivatives. The Portfolio offers three classes of shares — Class I, Class A and Class L.
Effective September 9, 2013, Class P and Class H shares were renamed Class A shares.
A. Significant Accounting Policies: The following significant accounting policies are in conformity with U.S. generally accepted accounting principles ("GAAP"). Such policies are consistently followed by the Fund in the preparation of its financial statements. GAAP may require management to make estimates and assumptions that affect the reported amounts and disclosures in the financial statements. Actual results may differ from those estimates.
1. Security Valuation: (1) Certain portfolio securities may be valued by an outside pricing service approved by the Fund's Board of Directors (the "Directors"). The pricing service may utilize a matrix system or other model incorporating attributes such as security quality, maturity and coupon as the evaluation model parameters, and/or research evaluations by its staff, including review of broker-dealer market price quotations in determining what it believes is the fair valuation of the portfolios securities valued by such pricing service; (2) an equity portfolio security listed or traded on an exchange is valued at its latest reported sales price (or at the exchange official closing price if such exchange reports an official closing price), if there were no sales on a given day, the security is valued at the mean between the last reported bid and asked prices; (3) all other equity portfolio securities for which over-the-counter market quotations are readily available are valued at its latest reported sales price. In cases where a
security is traded on more than one exchange, the security is valued on the exchange designated as the primary market; (4) futures are valued at the latest price published by the commodities exchange on which they trade; (5) swaps are marked-to-market daily based upon quotations from market makers; (6) when market quotations are not readily available, including circumstances under which the Adviser determines that the closing price, last sale price or the mean between the last reported bid and asked prices are not reflective of a security's market value, portfolio securities are valued at their fair value as determined in good faith under procedures established by and under the general supervision of the Directors. Occasionally, developments affecting the closing prices of securities and other assets may occur between the times at which valuations of such securities are determined (that is, close of the foreign market on which the securities trade) and the close of business of the New York Stock Exchange ("NYSE"). If developments occur during such periods that are expected to materially affect the value of such securities, such valuations may be adjusted to reflect the estimated fair value of such securities as of the close of the NYSE, as determined in good faith by the Directors or by the Adviser using a pricing service and/or procedures approved by the Directors; (7) quotations of foreign portfolio securities, other assets and liabilities and forward contracts stated in foreign currency are translated into U.S. dollar equivalents at the prevailing market rates prior to the close of the NYSE; (8) investments in mutual funds, including the Morgan Stanley Institutional Liquidity Funds, are valued at the net asset value as of the close of each business day; and (9) short-term debt securities with remaining maturities of 60 days or less at the time of purchase may be valued at amortized cost, unless the Adviser determines such valuation does not reflect the securities' market value, in which case these securities will be valued at their fair market value determined by the Adviser.
Under procedures approved by the Directors, the Fund's Adviser has formed a Valuation Committee. The Valuation Committee provides administration and oversight of the Fund's valuation policies and procedures, which are reviewed at least annually by the Directors. These procedures allow the Fund to utilize independent pricing services, quotations from securities and financial instrument dealers, and other market sources to determine fair value.
24
Morgan Stanley Institutional Fund, Inc.
Annual Report — December 31, 2013
Notes to Financial Statements (cont'd)
The Fund has procedures to determine the fair value of securities and other financial instruments for which market prices are not readily available. Under these procedures, the Valuation Committee convenes on a regular and ad hoc basis to review such securities and considers a number of factors, including valuation methodologies and significant unobservable valuation inputs, when arriving at fair value. The Valuation Committee may employ a market-based approach which may use related or comparable assets or liabilities, recent transactions, market multiples, book values, and other relevant information for the investment to determine the fair value of the investment. An income-based valuation approach may also be used in which the anticipated future cash flows of the investment are discounted to calculate fair value. Discounts may also be applied due to the nature or duration of any restrictions on the disposition of the investments. Due to the inherent uncertainty of valuations of such investments, the fair values may differ significantly from the values that would have been used had an active market existed. The Valuation Committee employs various methods for calibrating these valuation approaches including a regular review of valuation methodologies, key inputs and assumptions, transactional back-testing or disposition analysis, and reviews of any related market activity.
2. Fair Value Measurement: Financial Accounting Standards Board ("FASB") Accounting Standards CodificationTM ("ASC") 820, "Fair Value Measurements and Disclosures" ("ASC 820"), defines fair value as the value that the Fund would receive to sell an investment or pay to transfer a liability in a timely transaction with an independent buyer in the principal market, or in the absence of a principal market the most advantageous market for the investment or liability. ASC 820 establishes a three-tier hierarchy to distinguish between (1) inputs that reflect the assumptions market participants would use in valuing an asset or liability developed based on market data obtained from sources independent of the reporting entity (observable inputs) and (2) inputs that reflect the reporting entity's own assumptions about the assumptions market participants would use in valuing an asset or liability developed based on the best information available in the circumstances (unobservable inputs) and to establish classification of fair value measurements for disclosure purposes. Various inputs are used in determining the value of
the Fund's investments. The inputs are summarized in the three broad levels listed below.
• Level 1 – unadjusted quoted prices in active markets for identical investments
• Level 2 – other significant observable inputs (including quoted prices for similar investments, interest rates, prepayment speeds, credit risk, etc.)
• Level 3 – significant unobservable inputs including the Fund's own assumptions in determining the fair value of investments. Factors considered in making this determination may include, but are not limited to, information obtained by contacting the issuer, analysts, or the appropriate stock exchange (for exchange-traded securities), analysis of the issuer's financial statements or other available documents and, if necessary, available information concerning other securities in similar circumstances
The inputs or methodology used for valuing securities are not necessarily an indication of the risk associated with investing in those securities and the determination of the significance of a particular input to the fair value measurement in its entirety requires judgment and considers factors specific to each security.
The following is a summary of the inputs used to value the Portfolio's investments as of December 31, 2013.
Investment Type | | Level 1
Unadjusted
quoted
prices
(000) | | Level 2
Other
significant
observable
inputs
(000) | | Level 3
Significant
unobservable
inputs
(000) | | Total
(000) | |
Assets: | |
Common Stocks | |
Aerospace & Defense | | $ | 345 | | | $ | — | | | $ | — | | | $ | 345 | | |
Air Freight & Logistics | | | 187 | | | | — | | | | — | | | | 187 | | |
Airlines | | | 1 | | | | — | | | | — | | | | 1 | | |
Automobiles | | | 1,470 | | | | — | | | | — | | | | 1,470 | | |
Beverages | | | 1,052 | | | | — | | | | — | | | | 1,052 | | |
Building Products | | | 29 | | | | — | | | | — | | | | 29 | | |
Capital Markets | | | 93 | | | | — | | | | — | | | | 93 | | |
Chemicals | | | 398 | | | | — | | | | — | | | | 398 | | |
Commercial Banks | | | 7,862 | | | | — | | | | — | | | | 7,862 | | |
Commercial Services &
Supplies | | | 144 | | | | — | | | | — | | | | 144 | | |
Construction & Engineering | | | 116 | | | | — | | | | — | | | | 116 | | |
Construction Materials | | | 224 | | | | — | | | | — | | | | 224 | | |
Consumer Finance | | | 57 | | | | — | | | | — | | | | 57 | | |
Diversified Financial
Services | | | 202 | | | | — | | | | — | | | | 202 | | |
Diversified
Telecommunication
Services | | | 176 | | | | — | | | | — | | | | 176 | | |
25
Morgan Stanley Institutional Fund, Inc.
Annual Report — December 31, 2013
Notes to Financial Statements (cont'd)
Investment Type | | Level 1
Unadjusted
quoted
prices
(000) | | Level 2
Other
significant
observable
inputs
(000) | | Level 3
Significant
unobservable
inputs
(000) | | Total
(000) | |
Common Stocks (cont'd) | |
Electric Utilities | | $ | 178 | | | $ | — | | | $ | — | | | $ | 178 | | |
Electrical Equipment | | | 384 | | | | — | | | | — | | | | 384 | | |
Electronic Equipment,
Instruments &
Components | | | 182 | | | | — | | | | — | | | | 182 | | |
Food & Staples Retailing | | | 1,083 | | | | — | | | | — | | | | 1,083 | | |
Food Products | | | 1,288 | | | | — | | | | — | | | | 1,288 | | |
Health Care Equipment &
Supplies | | | 431 | | | | — | | | | — | | | | 431 | | |
Health Care Providers &
Services | | | 317 | | | | — | | | | — | | | | 317 | | |
Hotels, Restaurants &
Leisure | | | 98 | | | | — | | | | — | | | | 98 | | |
Household Durables | | | 388 | | | | — | | | | — | | | | 388 | | |
Household Products | | | 638 | | | | — | | | | — | | | | 638 | | |
Independent Power
Producers & Energy
Traders | | | 47 | | | | — | | | | — | | | | 47 | | |
Industrial Conglomerates | | | 104 | | | | — | | | | — | | | | 104 | | |
Information Technology
Services | | | 471 | | | | — | | | | — | | | | 471 | | |
Insurance | | | 144 | | | | — | | | | — | | | | 144 | | |
Leisure Equipment &
Products | | | 134 | | | | — | | | | — | | | | 134 | | |
Life Sciences Tools &
Services | | | 185 | | | | — | | | | — | | | | 185 | | |
Machinery | | | 623 | | | | — | | | | — | | | | 623 | | |
Media | | | 13 | | | | — | | | | — | | | | 13 | | |
Metals & Mining | | | 24 | | | | — | | | | — | | | | 24 | | |
Oil, Gas & Consumable
Fuels | | | 948 | | | | — | | | | — | | | | 948 | | |
Paper & Forest Products | | | 33 | | | | — | | | | — | | | | 33 | | |
Personal Products | | | 195 | | | | — | | | | — | | | | 195 | | |
Pharmaceuticals | | | 178 | | | | — | | | | — | | | | 178 | | |
Real Estate Management &
Development | | | 93 | | | | — | | | | — | | | | 93 | | |
Road & Rail | | | 238 | | | | — | | | | — | | | | 238 | | |
Semiconductors &
Semiconductor
Equipment | | | 86 | | | | — | | | | — | | | | 86 | | |
Software | | | 95 | | | | — | | | | — | | | | 95 | | |
Specialty Retail | | | 495 | | | | — | | | | — | | | | 495 | | |
Textiles, Apparel &
Luxury Goods | | | 94 | | | | — | | | | — | | | | 94 | | |
Tobacco | | | 703 | | | | — | | | | — | | | | 703 | | |
Transportation
Infrastructure | | | 4 | | | | — | | | | — | | | | 4 | | |
Water Utilities | | | 4 | | | | — | | | | — | | | | 4 | | |
Wireless
Telecommunication
Services | | | 13 | | | | — | | | | — | | | | 13 | | |
Total Common Stocks | | | 22,267 | | | | — | | | | — | | | | 22,267 | | |
Investment Company | | | 56 | | | | — | | | | — | | | | 56 | | |
Fixed Income Securities —
Sovereign | | | — | | | | 19,547 | | | | — | | | | 19,547 | | |
Short-Term Investments | |
Investment Company | | | 82,396 | | | | — | | | | — | | | | 82,396 | | |
U.S. Treasury Securities | | | — | | | | 1,471 | | | | — | | | | 1,471 | | |
Total Short-Term
Investments | | | 82,396 | | | | 1,471 | | | | — | | | | 83,867 | | |
Investment Type | | Level 1
Unadjusted
quoted
prices
(000) | | Level 2
Other
significant
observable
inputs
(000) | | Level 3
Significant
unobservable
inputs
(000) | | Total
(000) | |
Foreign Currency
Forward Exchange
Contracts | | $ | — | | | $ | 321 | | | $ | — | | | $ | 321 | | |
Futures Contracts | | | 2,236 | | | | — | | | | — | | | | 2,236 | | |
Total Return Swap
Agreements | | | — | | | | 443 | | | | — | | | | 443 | | |
Total Assets | | | 106,955 | | | | 21,782 | | | | — | | | | 128,737 | | |
Liabilities: | |
Foreign Currency
Forward Exchange
Contracts | | | — | | | | (283 | ) | | | — | | | | (283 | ) | |
Futures Contracts | | | (812 | ) | | | — | | | | — | | | | (812 | ) | |
Total Return Swap
Agreements | | | — | | | | (1,079 | ) | | | — | | | | (1,079 | ) | |
Total Liabilities | | | (812 | ) | | | (1,362 | ) | | | — | | | | (2,174 | ) | |
Total | | $ | 106,143 | | | $ | 20,420 | | | $ | — | | | $ | 126,563 | | |
Transfers between investment levels may occur as the markets fluctuate and/or the availability of data used in an investment's valuation changes. The Portfolio recognizes transfers between the levels as of the end of the period. As of December 31, 2013, the Portfolio did not have any investments transfer between investment levels.
3. Foreign Currency Translation and Foreign Investments: The books and records of the Portfolio are maintained in U.S. dollars. Foreign currency amounts are translated into U.S. dollars as follows:
– investments, other assets and liabilities at the prevailing rate of exchange on the valuation date;
– investment transactions and investment income at the prevailing rates of exchange on the dates of such transactions.
Although the net assets of the Portfolio are presented at the foreign exchange rates and market values at the close of the period, the Portfolio does not isolate that portion of the results of operations arising as a result of changes in the foreign exchange rates from the fluctuations arising from changes in the market prices of securities held at period end. Similarly, the Portfolio does not isolate the effect of changes in foreign exchange rates from the fluctuations arising from changes in the market prices of securities sold during the period. Accordingly, realized and unrealized foreign currency gains (losses) on investments in securities are included in the reported net realized and unrealized gains (losses) on investment transactions and balances. However, pursuant to U.S. Federal income tax regulations, gains and losses from certain foreign
26
Morgan Stanley Institutional Fund, Inc.
Annual Report — December 31, 2013
Notes to Financial Statements (cont'd)
currency transactions and the foreign currency portion of gains and losses realized on sales and maturities of foreign denominated debt securities are treated as ordinary income for U.S. Federal income tax purposes.
Net realized gains (losses) on foreign currency transactions represent net foreign exchange gains (losses) from foreign currency forward exchange contracts, disposition of foreign currencies, currency gains (losses) realized between the trade and settlement dates on securities transactions, and the difference between the amount of investment income and foreign withholding taxes recorded on the Portfolio's books and the U.S. dollar equivalent amounts actually received or paid. Net unrealized currency gains (losses) from valuing foreign currency denominated assets and liabilities at period end exchange rates are reflected as a component of unrealized appreciation (depreciation) on the Statement of Assets and Liabilities. The change in unrealized currency gains (losses) on foreign currency translations for the period is reflected in the Statement of Operations.
Foreign security and currency transactions may involve certain considerations and risks not typically associated with those of U.S. dollar denominated transactions as a result of, among other factors, fluctuations of exchange rates in relation to the U.S. dollar, the possibility of lower levels of governmental supervision and regulation of foreign securities markets and the possibility of political or economic instability.
The net assets of the Portfolio include foreign denominated securities and currency. Changes in currency exchange rates will affect the U.S. Dollar value of and investment income from such securities.
Governmental approval for foreign investments may be required in advance of making an investment under certain circumstances in some countries, and the extent of foreign investments in domestic companies may be subject to limitation in other countries. Foreign ownership limitations also may be imposed by the charters of individual companies to prevent, among other concerns, violations of foreign investment limitations. As a result, an additional class of shares (identified as "Foreign" in the Portfolio of Investments) may be created and offered for investment. The "local" and "foreign shares" market values may differ. In the absence of trading of the foreign shares in such markets, the Portfolio values the foreign shares at the closing exchange price of the local shares.
4. Derivatives: The Portfolio may, but is not required to, use derivative instruments for a variety of purposes, including hedging, risk management, portfolio management or to earn income. Derivatives are financial instruments whose value is based, in part, on the value of an underlying asset, interest rate, index or financial instrument. Prevailing interest rates and volatility levels, among other things, also affect the value of derivative instruments. A derivative instrument often has risks similar to its underlying asset and may have additional risks, including imperfect correlation between the value of the derivative and the underlying asset, risks of default by the counterparty to certain transactions, magnification of losses incurred due to changes in the market value of the securities, instruments, indices or interest rates to which they relate, and risks that the transactions may not be liquid. The use of derivatives involves risks that are different from, and possibly greater than, the risks associated with other portfolio investments. Derivatives may involve the use of highly specialized instruments that require investment techniques and risk analyses different from those associated with other portfolio investments. All of the Portfolio's holdings, including derivative instruments, are marked-to-market each day with the change in value reflected in unrealized appreciation (depreciation). Upon disposition, a realized gain or loss is recognized.
Certain derivative transactions may give rise to a form of leverage. Leverage magnifies the potential for gain and the risk of loss. Leverage associated with derivative transactions may cause the Portfolio to liquidate portfolio positions when it may not be advantageous to do so to satisfy its obligations or to meet earmarking or segregation requirements, pursuant to applicable Securities and Exchange Commission rules and regulations, or may cause the Portfolio to be more volatile than if the Portfolio had not been leveraged. Although the Adviser seeks to use derivatives to further the Portfolio's investment objectives, there is no assurance that the use of derivatives will achieve this result.
Following is a description of the derivative instruments and techniques that the Portfolio used during the period and their associated risks:
Foreign Currency Forward Exchange Contracts: In connection with its investments in foreign securities, the Portfolio also entered into contracts with banks, brokers or dealers to purchase or sell securities or foreign currencies at a future date. A foreign currency forward
27
Morgan Stanley Institutional Fund, Inc.
Annual Report — December 31, 2013
Notes to Financial Statements (cont'd)
ex-change contract ("currency contract") is a negotiated agreement between the contracting parties to exchange a specified amount of currency at a specified future time at a specified rate. The rate can be higher or lower than the spot rate between the currencies that are the subject of the contract. Currency contracts may be used to protect against uncertainty in the level of future foreign currency exchange rates or to gain or modify exposure to a particular currency. There is additional risk that such transactions reduce or preclude the opportunity for gain if the value of the currency should move in the direction opposite to the position taken and that currency contracts create exposure to currencies in which the Portfolio's securities are not denominated. Unanticipated changes in currency prices may result in poorer overall performance for the Portfolio than if it had not entered into such contracts. The use of currency contracts involves the risk of loss from the insolvency or bankruptcy of the counterparty to the contract or the failure of the counterparty to make payments or otherwise comply with the terms of the contract. A currency contract is marked-to-market daily and the change in market value is recorded by the Portfolio as unrealized gain or loss. The Portfolio records realized gains (losses) when the currency contract is closed equal to the difference between the value of the currency contract at the time it was opened and the value at the time it was closed.
Futures: A futures contract is a standardized, exchange-traded agreement to buy or sell a specific quantity of an underlying asset, reference rate or index at a specific price at a specific future time. The value of a futures contract tends to increase and decrease in tandem with the value of the underlying instrument. Depending on the terms of the particular contract, futures contracts are settled through either physical delivery of the underlying instrument on the settlement date or by payment of a cash settlement amount on the settlement date. During the period the futures contract is open, payments are received from or made to the broker based upon changes in the value of the contract (the variation margin). A decision as to whether, when and how to use futures contracts involves the exercise of skill and judgment and even a well-conceived futures transaction may be unsuccessful because of market behavior or unexpected events. In addition to the derivatives risks discussed above, the prices of futures contracts can be highly volatile, using futures contracts can lower total return, and the potential loss from futures contracts can exceed the Portfolio's
initial investment in such contracts. No assurance can be given that a liquid market will exist for any particular futures contract at any particular time. There is also the risk of loss by the Portfolio of margin deposits in the event of bankruptcy of a broker with whom the Portfolio has open positions in the futures contract.
Swaps: The Portfolio may enter into over-the-counter ("OTC") swap contracts or centrally cleared swap transactions. A swap contract is an agreement between two parties pursuant to which the parties exchange payments at specified dates on the basis of a specified notional amount, with the payments calculated by reference to specified securities, indices, reference rates, currencies or other instruments. Typically swap agreements provide that when the period payment dates for both parties are the same, the payments are made on a net basis (i.e., the two payment streams are netted out, with only the net amount paid by one party to the other). The Portfolio's obligations or rights under a swap contract entered into on a net basis will generally be equal only to the net amount to be paid or received under the agreement, based on the relative values of the positions held by each party. Centrally cleared swap transactions help reduce counterparty credit risk. In a centrally cleared swap, the Portfolio's ultimate counterparty is a clearing house rather than a bank, dealer or other financial institution. OTC swap agreements are not entered into or traded on exchanges and often there is no central clearing or guaranty function for OTC swaps. These OTC swaps are often subject to credit risk or the risk of default or non-performance by the counterparty. Both OTC and centrally cleared swaps could result in losses if interest rates or foreign currency exchange rates or credit quality changes are not correctly anticipated by the Portfolio or if the reference index, security or investments do not perform as expected. During the period swap agreements are open, payments are received from or made to the clearinghouse or counterparty based upon changes in the value of the contract (variation margin). The Dodd-Frank Wall Street Reform and Consumer Protection Act and related regulatory developments require the clearing and exchange-trading of certain standardized swap transactions. Mandatory exchange-trading and clearing is occurring on a phased-in basis.
When the Portfolio has an unrealized loss on a swap agreement, the Portfolio has instructed the custodian to pledge cash or liquid securities as collateral with a value approximately equal to the amount of the unrealized
28
Morgan Stanley Institutional Fund, Inc.
Annual Report — December 31, 2013
Notes to Financial Statements (cont'd)
loss. Collateral pledges are monitored and subsequently adjusted if and when the swap valuations fluctuate. Cash collateral is included with "Due from (to) Broker" in the Statement of Assets and Liabilities.
FASB ASC 815, "Derivatives and Hedging: Overall" ("ASC 815"), is intended to improve financial reporting about derivative instruments by requiring enhanced disclosures to enable investors to better understand how and why the Portfolio uses derivative instruments, how these derivative instruments are accounted for and their effects on the Portfolio's financial position and results of operations.
The following tables set forth the fair value of the Portfolio's derivative contracts by primary risk exposure as of December 31, 2013.
| | | Asset Derivatives
Statement of Assets and
Liabilities Location | | Primary Risk
Exposure | | Value
(000) | |
Foreign Currency
Forward
Exchange
Contracts | | Unrealized Appreciation on
Foreign Currency
Forward Exchange
Contracts | |
Currency Risk | | $ | 321 | | |
Futures Contracts | | Variation Margin | | Equity Risk | | | 1,710 | (a) | |
Futures Contracts | | Variation Margin | | Interest Rate Risk | | | 526 | (a) | |
Swap Agreements | | Unrealized Appreciation on
Swap Agreements | | Equity Risk | | | 443 | | |
Total | | | | | | $ | 3,000 | | |
| | | Liability Derivatives
Statement of Assets and
Liabilities Location | | Primary Risk
Exposure | | Value
(000) | |
Foreign Currency
Forward
Exchange
Contracts | | Unrealized Depreciation on
Foreign Currency
Forward Exchange
Contracts | |
Currency Risk | | $ | (283 | ) | |
Futures Contracts | | Variation Margin | | Equity Risk | | | (158 | )(a) | |
Futures Contracts | | Variation Margin | | Interest Rate Risk | | | (654 | )(a) | |
Swap Agreements | | Unrealized Depreciation on
Swap Agreements | | Equity Risk | | | (1,079 | ) | |
Total | | | | | | $ | (2,174 | ) | |
(a) This amount represents the cumulative appreciation (depreciation) as reported in the Portfolio of Investments. The Statement of Assets and Liabilities only reflects the current day's net variation margin.
The following tables set forth by primary risk exposure the Portfolio's realized gains (losses) and change in unrealized appreciation (depreciation) by type of derivative contract for the year ended December 31, 2013 in accordance with ASC 815.
Realized Gain (Loss) | |
Primary Risk Exposure | | Derivative Type | | Value
(000) | |
Currency Risk | | Foreign Currency Forward
Exchange Contracts | | $ | 323 | | |
Equity Risk | | Futures Contracts | | | 2,754 | | |
Interest Rate Risk | | Futures Contracts | | | 33 | | |
Commodity Risk | | Futures Contracts | | | (89 | ) | |
Currency Risk | | Futures Contracts | | | 24 | | |
Equity Risk | | Swap Agreements | | | (1,058 | ) | |
Total | | | | $ | 1,987 | | |
Change in Unrealized Appreciation (Depreciation) | |
Primary Risk Exposure | | Derivative Type | | Value
(000) | |
Currency Risk | | Foreign Currency Forward
Exchange Contracts | | $ | 30 | | |
Equity Risk | | Futures Contracts | | | 1,377 | | |
Interest Rate Risk | | Futures Contracts | | | (104 | ) | |
Equity Risk | | Swap Agreements | | | (489 | ) | |
Total | | | | $ | 814 | | |
At December 31, 2013, the Portfolio's derivative assets and liabilities are as follows:
Gross Amounts of Assets and Liabilities Presented in the Statement of Assets
and Liabilities | |
Derivatives(a) | | Assets(b)
(000) | | Liabilities(b)
(000) | |
Foreign Currency Forward
Exchange Contracts | | $ | 321 | | | $ | (283 | ) | |
Swap Agreements | | | 443 | | | | (1,079 | ) | |
Total | | $ | 764 | | | $ | (1,362 | ) | |
(a) Excludes exchange traded derivatives.
(b) Absent an event of default or early termination, OTC derivative assets and liabilities are presented gross and not offset in the Statement of Assets and Liabilities.
29
Morgan Stanley Institutional Fund, Inc.
Annual Report — December 31, 2013
Notes to Financial Statements (cont'd)
The following tables present derivative financial instruments that are subject to enforceable netting arrangements as of December 31, 2013.
Gross Amounts Not Offset in the Statement of Assets and Liabilities | |
| Counterparty | | Gross Asset
Derivatives
Presented in
Statement of
Assets and
Liabilities
(000) | | Financial
Instrument
(000) | | Collateral
Received
(000) | | Net Amount
(not less
than 0)
(000) | |
Bank of America NA | | $ | 313 | | | $ | (313 | ) | | $ | — | | | $ | 0 | | |
Bank of Montreal | | | 23 | | | | — | | | | — | | | | 23 | | |
Barclays Bank PLC | | | 34 | | | | (34 | ) | | | — | | | | 0 | | |
Citibank NA | | | 3 | | | | (1 | ) | | | — | | | | 2 | | |
Commonwealth Bank of Australia | | | 2 | | | | (2 | ) | | | — | | | | 0 | | |
Deutsche Bank AG London | | | 91 | | | | (13 | ) | | | — | | | | 78 | | |
Goldman Sachs International | | | 38 | | | | (38 | ) | | | — | | | | 0 | | |
JPMorgan Chase Bank NA | | | 125 | | | | (123 | ) | | | — | | | | 2 | | |
Royal Bank of Scotland | | | 1 | | | | (1 | ) | | | — | | | | 0 | | |
State Street Bank and Trust Co. | | | 11 | | | | — | | | | — | | | | 11 | | |
UBS AG | | | 123 | | | | (80 | ) | | | — | | | | 43 | | |
Total | | $ | 764 | | | $ | (605 | ) | | $ | — | | | $ | 159 | | |
Gross Amounts Not Offset in the Statement of Assets and Liabilities | |
| Counterparty | | Gross Liability
Derivatives
Presented in
Statement of
Assets and
Liabilities
(000) | | Financial
Instrument
(000) | | Collateral
Pledged
(000) | | Net Amount
(not less
than 0)
(000) | |
Bank of America NA | | $ | 394 | | | $ | (313 | ) | | $ | — | | | $ | 81 | | |
Barclays Bank PLC | | | 35 | | | | (34 | ) | | | — | | | | 1 | | |
Citibank NA | | | 1 | | | | (1 | ) | | | — | | | | 0 | | |
Commonwealth Bank of Australia | | | 25 | | | | (2 | ) | | | — | | | | 23 | | |
Deutsche Bank AG London | | | 13 | | | | (13 | ) | | | — | | | | 0 | | |
Goldman Sachs International | | | 472 | | | | (38 | ) | | | — | | | | 434 | | |
JPMorgan Chase Bank NA | | | 334 | | | | (123 | ) | | | — | | | | 211 | | |
Royal Bank of Scotland | | | 3 | | | | (1 | ) | | | — | | | | 2 | | |
State Street Bank and Trust Co. | | | 5 | | | | — | | | | — | | | | 5 | | |
UBS AG | | | 80 | | | | (80 | ) | | | — | | | | 0 | | |
Total | | $ | 1,362 | | | $ | (605 | ) | | $ | — | | | $ | 757 | | |
For the year ended December 31, 2013, the approximate average monthly amount outstanding for each derivative type is as follows:
Foreign Currency Forward Exchange Contracts: | |
Average monthly principal amount | | $ | 50,636,000 | | |
Futures Contracts: | |
Average monthly original value | | $ | 52,452,000 | | |
Swap Agreements: | |
Average monthly notional amount | | $ | 35,800,000 | | |
5. Indemnifications: The Fund enters into contracts that contain a variety of indemnifications. The Fund's maximum exposure under these arrangements is unknown. However, the Fund has not had prior claims or losses pursuant to these contracts and expects the risk of loss to be remote.
6. Dividends and Distributions to Shareholders: Dividend income and distributions to shareholders are recorded on the ex-dividend date. Dividends from net investment income, if any, are declared and paid semiannually. Net realized capital gains, if any, are distributed at least annually.
7. Security Transactions, Income and Expenses: Security transactions are accounted for on the trade date (date the order to buy or sell is executed). Realized gains and losses on the sale of investment securities are determined on the specific identified cost method. Dividend income and other distributions are recorded on the ex-dividend date (except for certain foreign dividends which may be recorded as soon as the Portfolio is informed of such dividends) net of applicable withholding taxes. Interest income is recognized on the accrual basis except where collection is in doubt. Discounts are accreted and premiums are amortized over the life of the respective securities. Most expenses of the Fund can be directly attributed to a particular Portfolio. Expenses which cannot be directly attributed are apportioned among the Portfolios based upon relative net assets or other appropriate methods. Income, expenses (other than class specific expenses — distribution, transfer agency and sub transfer agency fees) and realized and unrealized gains or losses are allocated to each class of shares based upon their relative net assets.
B. Advisory Fees: The Adviser, a wholly-owned subsidiary of Morgan Stanley, provides the Portfolio with advisory services under the terms of an Investment Advisory Agreement, paid quarterly, at the annual rate based on the average daily net assets as follows:
First $750
million | | Next $750
million | | Over $1.5
billion | |
| | 0.85 | % | | | 0.80 | % | | | 0.75 | % | |
For the year ended December 31, 2013, the advisory fee rate (net of waivers/rebate/reimbursement) was equivalent to an annual effective rate of 0.00% of the Portfolio's daily net assets.
The Adviser has agreed to reduce its advisory fee and/or reimburse the Portfolio so that total annual portfolio operating expenses, excluding certain investment related expenses, taxes,
30
Morgan Stanley Institutional Fund, Inc.
Annual Report — December 31, 2013
Notes to Financial Statements (cont'd)
interest and other extraordinary expenses (including litigation), will not exceed 1.10% for Class I shares, 1.35% for Class A shares and 1.85% for Class L shares. Effective September 16, 2013, the Adviser has agreed to limit the ratio of expenses to average net assets to the maximum ratio of 1.45% and 1.95% for Class A, and Class L shares, respectively. The fee waivers and/or expense reimbursements will continue for at least one year or until such time that the Directors act to discontinue all or a portion of such waivers and/or reimbursements when it deems such action is appropriate. For the year ended December 31, 2013, approximately $354,000 of advisory fees were waived and approximately $6,000 of other expenses were reimbursed by the Adviser pursuant to this arrangement.
C. Administration Fees: The Adviser also serves as Administrator to the Fund and provides administrative services pursuant to an Administration Agreement for an annual fee, accrued daily and paid monthly, of 0.08% of the Portfolio's average daily net assets. Under a Sub-Administration Agreement between the Administrator and State Street Bank and Trust Company ("State Street"), State Street provides certain administrative services to the Fund. For such services, the Administrator pays State Street a portion of the fee the Administrator receives from the Portfolio.
D. Distribution and Shareholder Services Fees: Morgan Stanley Distribution, Inc. ("MSDI" or the "Distributor"), a wholly-owned subsidiary of the Adviser, and an indirect subsidiary of Morgan Stanley, serves as the Fund's Distributor of Portfolio shares pursuant to a Distribution Agreement. The Fund has adopted a Shareholder Services Plan with respect to Class A shares pursuant to Rule 12b-1 under the Act. Under the Shareholder Services Plan, the Portfolio pays the Distributor a shareholder services fee, accrued daily and paid monthly, at an annual rate of 0.25% of the Portfolio's average daily net assets attributable to Class A shares.
The Fund has adopted a Distribution and Shareholder Services Plan with respect to Class L shares pursuant to Rule 12b-1 under the Act. Under the Distribution and Shareholder Services Plan, the Portfolio pays the Distributor a distribution fee, accrued daily and paid monthly, at an annual rate of 0.50% and a shareholder services fee, accrued daily and paid monthly, at an annual rate of 0.25% of the Portfolio's average daily net assets attributable to Class L shares.
The distribution and shareholder services fees are used to support the expenses associated with servicing and maintaining accounts. The Distributor may compensate other parties for
providing shareholder support services to investors who purchase Class A and Class L shares.
E. Dividend Disbursing and Transfer Agent: The Fund's dividend disbursing and transfer agent was Morgan Stanley Services Company Inc. ("Morgan Stanley Services"). Pursuant to a Transfer Agency Agreement, the Fund paid Morgan Stanley Services a fee based on the number of classes, accounts and transactions relating to the Portfolios of the Fund. Effective July 1, 2013, the Directors approved changing the transfer agent to Boston Financial Data Services, Inc.
F. Custodian Fees: State Street (the "Custodian") serves as Custodian for the Fund in accordance with a Custodian Agreement. The Custodian holds cash, securities, and other assets of the Fund as required by the Act. Custody fees are payable monthly based on assets held in custody, investment purchases and sales activity and account maintenance fees, plus reimbursement for certain out-of-pocket expenses.
G. Security Transactions and Transactions with Affiliates: For the year ended December 31, 2013, purchases and sales of investment securities for the Portfolio, other than long-term U.S. Government securities and short-term investments, were approximately $70,251,000 and $38,259,000, respectively. There were no purchases and sales of long-term U.S. Government securities for the year ended December 31, 2013.
The Portfolio invests in the Institutional Class of the Morgan Stanley Institutional Liquidity Funds — Money Market Portfolio (the "Liquidity Funds"), an open-end management investment company managed by the Adviser. Advisory fees paid by the Portfolio are reduced by an amount equal to its pro-rata share of the advisory and administration fees paid by the Portfolio due to its investment in the Liquidity Funds. For the year ended December 31, 2013, advisory fees paid were reduced by approximately $29,000 relating to the Portfolio's investment in the Liquidity Funds.
A summary of the Portfolio's transactions in shares of the Liquidity Funds during the year ended December 31, 2013 is as follows:
Value
December 31,
2012
(000) | | Purchases
at Cost
(000) | | Sales
(000) | | Dividend
Income
(000) | | Value
December 31,
2013
(000) | |
| $ | 13,182 | | | $ | 124,471 | | | $ | 55,257 | | | $ | 18 | | | $ | 82,396 | | |
For the year ended December 31, 2013, the Portfolio had transactions with Citigroup, Inc., and its affiliated broker-dealers
31
Morgan Stanley Institutional Fund, Inc.
Annual Report — December 31, 2013
Notes to Financial Statements (cont'd)
which may be deemed affiliates of the Adviser, Administrator and Distributor under Section 17 of the Act.
Value
December 31,
2012
(000) | | Purchases
at Cost**
(000) | | Sales**
(000) | | Realized
Gain**
(000) | | Dividend
Income**
(000) | | Value
December 31,
2013
(000) | |
| $ | 395 | | | | — | | | $ | 411 | | | $ | 45 | | | | — | | | $ | 91 | * | |
* Citigroup, Inc., and its affiliated broker-dealers ceased to be affiliates of the Portfolio pursuant to Section 17 of the Act, as of July 1, 2013.
** Data represents transactions through June 30, 2013.
H. Federal Income Taxes: It is the Portfolio's intention to continue to qualify as a regulated investment company and distribute all of its taxable and tax-exempt income. Accordingly, no provision for Federal income taxes is required in the financial statements.
The Portfolio may be subject to taxes imposed by countries in which it invests. Such taxes are generally based on income and/or capital gains earned or repatriated. Taxes are accrued based on net investment income, net realized gains and net unrealized appreciation as such income and/or gains are earned. Taxes may also be based on transactions in foreign currency and are accrued based on the value of investments denominated in such currency.
FASB ASC 740-10, Income Taxes — Overall, sets forth a minimum threshold for financial statement recognition of the benefit of a tax position taken or expected to be taken in a tax return. Management has concluded there are no significant uncertain tax positions that would require recognition in the financial statements. If applicable, the Portfolio recognizes interest accrued related to unrecognized tax benefits in "Interest Expense" and penalties in "Other Expenses" in the Statement of Operations. The Portfolio files tax returns with the U.S. Internal Revenue Service, New York and various states. Generally, each of the tax years in the two-year period ended December 31, 2013, remains subject to examination by taxing authorities.
The tax character of distributions paid may differ from the character of distributions shown in the Statements of Changes in Net Assets due to short-term capital gains being treated as ordinary income for tax purposes. The tax character of distributions paid during fiscal years 2013 and 2012 was as follows:
2013
Distributions
Paid From: | | 2012
Distributions
Paid From: | |
Ordinary
Income
(000) | | Long-Term
Capital Gain
(000) | | Ordinary
Income
(000) | | Long-Term
Capital Gain
(000) | |
| $ | 2,465 | | | $ | 1,227 | | | $ | 310 | | | | — | | |
The amount and character of income and gains to be distributed are determined in accordance with income tax regulations which may differ from GAAP. These book/tax differences are either considered temporary or permanent in nature.
Temporary differences are attributable to differing book and tax treatments for the timing of the recognition of gains (losses) on certain investment transactions and the timing of the deductibility of certain expenses.
Permanent differences, primarily due to differing treatments of gains (losses) related to foreign currency transactions and swap income reclass, resulted in the following reclassifications among the components of net assets at December 31, 2013:
Accumulated
Net Investment
Income
(000) | | Undistributed
Net Realized
Loss
(000) | | Accumulated
Paid-in-
Capital
(000) | |
| $ | 469 | | | ( | $469 | ) | | | — | | |
At December 31, 2013, the components of distributable earnings for the Portfolio on a tax basis were as follows:
Undistributed
Ordinary
Income
(000) | | Undistributed
Long-Term
Capital Gain
(000) | |
| $ | 113 | | | $ | 857 | | |
At December 31, 2013, the aggregate cost for Federal income tax purposes is approximately $124,134,000. The aggregate gross unrealized appreciation is approximately $2,949,000 and the aggregate gross unrealized depreciation is approximately $1,345,000 resulting in net unrealized appreciation of approximately $1,604,000.
I. Other (unaudited): At December 31, 2013, the Portfolio had otherwise unaffiliated record owners of 10% or greater. Investment activities of these shareholders could have a material impact on the Portfolio. The aggregate percentage of such owners was 28% and 27%, for Class I and Class A shares, respectively.
J. Results of Special Shareholder Meeting (unaudited): On June 5, 2013, a Joint Special Shareholder Meeting was held for Class H shareholders of the Portfolio to approve the Articles of Amendment to the Fund's Articles of Amendment and Restatement and a Plan of Reclassification for the Portfolio pursuant to which Class H shares would be reclassified as Class P shares. The results with respect to this proposal were as follows:
| For | | Against | | Abstain | |
| | 55,980 | | | | 0 | | | �� | 0 | | |
32
Morgan Stanley Institutional Fund, Inc.
Annual Report — December 31, 2013
Notes to Financial Statements (cont'd)
K. Accounting Pronouncement: In June 2013, FASB issued Accounting Standards Update 2013-08 Financial Services — Investment Companies (Topic 946) — Amendments to the Scope, Measurement, and Disclosure Requirements ("ASU 2013-08") which is effective for interim and annual reporting periods in fiscal years that begin after December 15, 2013. ASU 2013-08 sets forth a methodology for determining whether an entity should be characterized as an investment company and prescribes fair value accounting for an investment company's non-controlling ownership interest in another investment company. FASB has determined that a fund registered under the Investment Company Act of 1940 automatically meets ASU 2013-08's criteria for an investment company. Although still evaluating the potential impacts of ASU 2013-08 to the Portfolio, management expects that the impact of the Portfolio's adoption will be limited to additional financial statement disclosures.
33
Morgan Stanley Institutional Fund, Inc.
Annual Report — December 31, 2013
Report of Independent Registered Public Accounting Firm
To the Shareholders and Board of Directors of
Morgan Stanley Institutional Fund, Inc. —
Multi-Asset Portfolio
We have audited the accompanying statement of assets and liabilities, including the portfolio of investments, of Multi-Asset Portfolio (one of the portfolios constituting Morgan Stanley Institutional Fund, Inc.) (the "Portfolio") as of December 31, 2013, and the related statement of operations for the year then ended, and statements of changes in net assets and the financial highlights for each of the periods indicated therein. These financial statements and financial highlights are the responsibility of the Portfolio's management. Our responsibility is to express an opinion on these financial statements and financial highlights based on our audits.
We conducted our audits in accordance with the standards of the Public Company Accounting Oversight Board (United States). Those standards require that we plan and perform the audit to obtain reasonable assurance about whether the financial statements and financial highlights are free of material misstatement. We were not engaged to perform an audit of the Portfolio's internal control over financial reporting. Our audits included consideration of internal control over financial reporting as a basis for designing audit procedures that are appropriate in the circumstances, but not for the purpose of expressing an opinion on the effectiveness of the Portfolio's internal control over financial reporting. Accordingly, we express no such opinion. An audit also includes examining, on a test basis, evidence supporting the amounts and disclosures in the financial statements and financial highlights, assessing the accounting principles used and significant estimates made by management, and evaluating the overall financial statement presentation. Our procedures included confirmation of securities owned as of December 31, 2013, by correspondence with the custodian and others or by other appropriate auditing procedures where replies from others were not received. We believe that our audits provide a reasonable basis for our opinion.
In our opinion, the financial statements and financial highlights referred to above present fairly, in all material respects, the financial position of Multi-Asset Portfolio (one of the portfolios constituting Morgan Stanley Institutional Fund, Inc.) at December 31, 2013, the results of its operations for the year then ended, and the changes in its net assets and the financial highlights for each of the periods indicated therein, in conformity with U.S. generally accepted accounting principles.

Boston, Massachusetts
February 26, 2014
34
Morgan Stanley Institutional Fund, Inc.
Annual Report — December 31, 2013
Federal Tax Notice (unaudited)
For Federal income tax purposes, the following information is furnished with respect to the distributions paid by the Portfolio during its taxable year ended December 31, 2013.
The Portfolio designated and paid approximately $1,227,000 as a long-term capital gain distribution.
For Federal income tax purposes, the following information is furnished with respect to the Portfolio's earnings for its taxable year ended December 31, 2013. When distributed, certain earnings may be subject to a maximum tax rate of 15% as provided for the Jobs and Growth Tax Relief Reconciliation Act of 2003. The Portfolio designated up to a maximum of approximately $58,000 as taxable at this lower rate.
In January, the Portfolio provides tax information to shareholders for the preceding calendar year.
35
Morgan Stanley Institutional Fund, Inc.
Annual Report — December 31, 2013
U.S. Privacy Policy (unaudited)
AN IMPORTANT NOTICE CONCERNING OUR U.S. PRIVACY POLICY
This privacy notice describes the U.S. privacy policy of Morgan Stanley Distribution, Inc., and the Morgan Stanley family of mutual funds ("us", "our", "we").
We are required by federal law to provide you with notice of our U.S. privacy policy ("Policy"). This Policy applies to both our current and former clients unless we state otherwise and is intended for individual clients who purchase products or receive services from us for personal, family or household purposes. This Policy is not applicable to partnerships, corporations, trusts or other non-individual clients or account holders, nor is this Policy applicable to individuals who are either beneficiaries of a trust for which we serve as trustee or participants in an employee benefit plan administered or advised by us. This Policy is, however, applicable to individuals who select us to be a custodian of securities or assets in individual retirement accounts, 401(k) accounts, or accounts subject to the Uniform Gifts to Minors Act.
This notice sets out our business practices to protect your privacy; how we collect and share personal information about you; and how you can limit our sharing or certain uses by others of this information. We may amend this Policy at any time, and will inform you of any changes to our Policy as required by law.
WE RESPECT YOUR PRIVACY
We appreciate that you have provided us with your personal financial information and understand your concerns about your information. We strive to safeguard the information our clients entrust to us. Protecting the confidentiality and security of client information is an important part of how we conduct our business.
This notice describes what personal information we collect about you, how we collect it, when we may share it with others, and how certain others may use it. It discusses the steps you may take to limit our sharing of certain information about you with our affiliated companies, including, but not limited to our affiliated banking businesses, brokerage firms and credit service affiliates. It also discloses how you may limit our affiliates' use of shared information for marketing purposes.
Throughout this Policy, we refer to the nonpublic information that personally identifies you as "personal information." We also use the term "affiliated company" in this notice. An affiliated company is a company in our family of companies and includes companies with the Morgan Stanley name. These affiliated companies are financial institutions such as broker-dealers, banks, investment advisers and credit card issuers. We refer to any company that is not an affiliated company as a nonaffiliated third party. For purposes of Section 5 of this notice, and your ability to limit certain uses of personal information by our affiliates, this notice applies to the use of personal information by our affiliated companies.
1. WHAT PERSONAL INFORMATION DO WE COLLECT FROM YOU?
We may collect the following types of information about you: (i) information provided by you, including information from applications and other forms we receive from you, (ii) information about your transactions with us or our affiliates, (iii) information about your transactions with nonaffiliated third parties, (iv) information from consumer reporting agencies, (v) information obtained from our websites, and (vi) information obtained from other sources. For example:
• We collect information such as your name, address, e-mail address, telephone/fax numbers, assets, income and investment objectives through applications and other forms you submit to us.
• We may obtain information about account balances, your use of account(s) and the types of products and services you prefer to receive from us through your dealings and transactions with us and other sources.
• We may obtain information about your creditworthiness and credit history from consumer reporting agencies.
• We may collect background information from and through third-party vendors to verify representations you have made and to comply with various regulatory requirements.
2. WHEN DO WE DISCLOSE PERSONAL INFORMATION WE COLLECT ABOUT YOU?
We may disclose personal information we collect about you in each of the categories listed above to affiliated and nonaffiliated third parties.
36
Morgan Stanley Institutional Fund, Inc.
Annual Report — December 31, 2013
U.S. Privacy Policy (unaudited) (cont'd)
a. Information we disclose to affiliated companies.
We may disclose personal information that we collect about you to our affiliated companies to manage your account(s) effectively, to service and process your transactions, and to let you know about products and services offered by us and affiliated companies, to manage our business, and as otherwise required or permitted by law. Offers for products and services from affiliated companies are developed under conditions designed to safeguard your personal information.
b. Information we disclose to third parties.
We may disclose personal information that we collect about you to nonaffiliated third parties to provide marketing services on our behalf or to other financial institutions with whom we have joint marketing agreements. We may also disclose all of the information we collect to other nonaffiliated third parties for our everyday business purposes, such as to process transactions, maintain account(s), respond to court orders and legal investigations, report to credit bureaus, offer our own products and services, protect against fraud, for institutional risk control, to perform services on our behalf, and as otherwise required or permitted by law.
When we share personal information about you with a nonaffiliated third party, they are required to limit their use of personal information about you to the particular purpose for which it was shared and they are not allowed to share personal information about you with others except to fulfill that limited purpose or as may be permitted or required by law.
3. HOW DO WE PROTECT THE SECURITY AND CONFIDENTIALITY OF PERSONAL INFORMATION WE COLLECT ABOUT YOU?
We maintain physical, electronic and procedural security measures that comply with applicable law and regulations to help safeguard the personal information we collect about you. We have internal policies governing the proper handling of client information by employees. Third parties that provide support or marketing services on our behalf may also receive personal information about you, and we require them to adhere to appropriate security standards with respect to such information.
4. HOW CAN YOU LIMIT OUR SHARING CERTAIN PERSONAL INFORMATION ABOUT YOU WITH OUR AFFILIATED COMPANIES FOR ELIGIBILITY DETERMINATION?
By following the opt-out procedures in Section 6 below, you may limit the extent to which we share with our affiliated companies, personal information that was collected to determine your eligibility for products and services such as your credit reports and other information that you have provided to us or that we may obtain from third parties ("eligibility information"). Eligibility information does not include your identification information or personal information pertaining to our transactions or experiences with you. Please note that, even if you direct us not to share eligibility information with our affiliated companies, we may still share your personal information, including eligibility information, with our affiliated companies under circumstances that are permitted under applicable law, such as to process transactions or to service your account.
5. HOW CAN YOU LIMIT THE USE OF CERTAIN PERSONAL INFORMATION ABOUT YOU BY OUR AFFILIATED COMPANIES FOR MARKETING?
By following the opt-out instructions in Section 6 below, you may limit our affiliated companies from marketing their products or services to you based on personal information we disclose to them. This information may include, for example, your income and account history with us. Please note that, even if you choose to limit our affiliated companies from using personal information about you that we may share with them for marketing their products and services to you, our affiliated companies may use your personal information that they obtain from us to market to you in circumstances permitted by law, such as if the affiliated party has its own relationship with you.
37
Morgan Stanley Institutional Fund, Inc.
Annual Report — December 31, 2013
U.S. Privacy Policy (unaudited) (cont'd)
6. HOW CAN YOU SEND US AN OPT-OUT INSTRUCTION?
If you wish to limit our sharing of eligibility information about you with our affiliated companies, or our affiliated companies' use of personal information for marketing purposes, as described in this notice, you may do so by:
• Calling us at (800) 548-7786
Monday–Friday between 8a.m. and 5p.m. (EST)
• Writing to us at the following address:
Boston Financial Data Services, Inc.
c/o Privacy Coordinator
P.O. Box 219804
Kansas City, Missouri 64121
If you choose to write to us, your request should include: your name, address, telephone number and account number(s) to which the opt-out applies and whether you are opting out with respect to sharing of eligibility information (Section 4 above), or information used for marketing (Section 5 above), or both. Written opt-out requests should not be sent with any other correspondence. In order to process your request, we require that the request be provided by you directly and not through a third party. Once you have informed us about your privacy preferences, your opt-out preference will remain in effect with respect to this Policy (as it may be amended) until you notify us otherwise. If you are a joint account owner, we will accept instructions from any one of you and apply those instructions to the entire account.
Please understand that if you limit our sharing or our affiliated companies' use of personal information, you and any joint account holder(s) may not receive information about our affiliated companies' products and services, including products or services that could help you manage your financial resources and achieve your investment objectives.
If you have more than one account or relationship with us, please specify the accounts to which you would like us to apply your privacy choices. If you have accounts or relationships with our affiliates, you may receive multiple privacy policies from them, and will need to separately notify those companies of your privacy choices for those accounts or relationships.
7. WHAT IF AN AFFILIATED COMPANY BECOMES A NONAFFILIATED THIRD PARTY?
If, at any time in the future, an affiliated company becomes a nonaffiliated third party, further disclosures of personal information made to the former affiliated company will be limited to those described in Section 2(b) above relating to nonaffiliated third parties. If you elected under Section 6 to limit disclosures we make to affiliated companies, or use of personal information by affiliated companies, your election will not apply to use by any former affiliated company of your personal information in their possession once it becomes a nonaffiliated third party.
SPECIAL NOTICE TO RESIDENTS OF VERMONT
The following section supplements our Policy with respect to our individual clients who have a Vermont address and supersedes anything to the contrary in the above Policy with respect to those clients only.
The State of Vermont requires financial institutions to obtain your consent prior to sharing personal information that they collect about you with nonaffiliated third parties, or eligibility information with affiliated companies, other than in certain limited circumstances. Except as permitted by law, we will not share personal information we collect about you with nonaffiliated third parties or eligibility information with affiliated companies, unless you provide us with your written consent to share such information.
SPECIAL NOTICE TO RESIDENTS OF CALIFORNIA
The following section supplements our Policy with respect to our individual clients who have a California address and supersedes anything to the contrary in the above Policy with respect to those clients only.
In response to a California law, if your account has a California home address, your personal information will not be disclosed to nonaffiliated third parties except as permitted by applicable California law, and we will limit sharing such personal information with our affiliates to comply with California privacy laws that apply to us.
38
Morgan Stanley Institutional Fund, Inc.
Annual Report — December 31, 2013
Director and Officer Information (unaudited)
Independent Director:
Name, Age and Address of
Independent Director | | Position(s)
Held with
Registrant | | Length of Time
Served* | | Principal Occupation(s) During Past 5 Years | | Number of
Portfolios in
Fund Complex
Overseen by
Independent
Director** | | Other Directorships
Held by Independent
Director*** | |
Frank L. Bowman (69)
c/o Kramer Levin Naftalis &
Frankel LLP
Counsel to the Independent Directors
1177 Avenue of the Americas
New York, NY 10036 | | Director | | Since
August
2006 | | President, Strategic Decisions, LLC (consulting) (since February 2009); Director or Trustee of various Morgan Stanley Funds (since August 2006); Chairperson of the Insurance Sub-Committee of the Compliance and Insurance Committee (since February 2007); served as President and Chief Executive Officer of the Nuclear Energy Institute (policy organization) (February 2005-November 2008); retired as Admiral, U.S. Navy after serving over 38 years on active duty including 8 years as Director of the Naval Nuclear Propulsion Program in the Department of the Navy and the U.S. Department of Energy (1996-2004); served as Chief of Naval Personnel (July 1994-September 1996); and on the Joint Staff as Director of Political Military Affairs (June 1992-July 1994); knighted as Honorary Knight Commander of the Most Excellent Order of the British Empire; awarded the Officier de l'Orde National du Mérite by the French Government; elected to the National Academy of Engineering (2009). | | | 98 | | | Director of BP p.l.c.; Director of Naval and Nuclear Technologies LLP; Director of the Armed Services YMCA of the USA and the U.S. Naval Submarine League; Director of the American Shipbuilding Suppliers Association; Member of the National Security Advisory Council of the Center for U.S. Global Engagement and a member of the CNA Military Advisory Board; Chairman of the Charity J Street Cup Golf; Trustee of Fairhaven United Methodist Church. | |
Michael Bozic (73)
c/o Kramer Levin Naftalis & Frankel LLP
Counsel to the Independent Directors
1177 Avenue of the Americas
New York, NY 10036 | | Director | | Since
April
1994 | | Private investor and a member of the advisory board of American Road Group LLC (retail) (since June 2000); Chairperson of the Compliance and Insurance Committee (since October 2006); Director or Trustee of various Morgan Stanley Funds (since April 1994); formerly, Chairperson of the Insurance Committee (July 2006-September 2006); Vice Chairman of Kmart Corporation (December 1998-October 2000), Chairman and Chief Executive Officer of Levitz Furniture Corporation (November 1995-November 1998) and President and Chief Executive Officer of Hills Department Stores (May 1991-July 1995); variously Chairman, Chief Executive Officer, President and Chief Operating Officer (1987-1991) of the Sears Merchandise Group of Sears, Roebuck & Co. | | | 100 | | | Trustee and member of the Hillsdale College Board of Trustees. | |
Kathleen A. Dennis (60)
c/o Kramer Levin Naftalis & Frankel LLP
Counsel to the Independent Directors
1177 Avenue of the Americas
New York, NY 10036 | | Director | | Since
August
2006 | | President, Cedarwood Associates (mutual fund and investment management consulting) (since July 2006); Chairperson of the Money Market and Alternatives Sub-Committee of the Investment Committee (since October 2006) and Director or Trustee of various Morgan Stanley Funds (since August 2006); formerly, Senior Managing Director of Victory Capital Management (1993-2006). | | | 98 | | | Director of various non-profit organizations. | |
Dr. Manuel H. Johnson (65)
c/o Johnson Smick International, Inc.
220 I Street, NE
Suite 200
Washington, D.C. 20002 | | Director | | Since
July
1991 | | Senior Partner, Johnson Smick International, Inc. (consulting firm); Chairperson of the Investment Committee (since October 2006) and Director or Trustee of various Morgan Stanley Funds (since July 1991); Co-Chairman and a founder of the Group of Seven Council (G7C) (international economic commission); formerly, Chairperson of the Audit Committee (July 1991-September 2006), Vice Chairman of the Board of Governors of the Federal Reserve System and Assistant Secretary of the U.S. Treasury. | | | 101 | | | Director of NVR, Inc. (home construction). | |
39
Morgan Stanley Institutional Fund, Inc.
Annual Report — December 31, 2013
Director and Officer Information (unaudited) (cont'd)
Independent Director: (cont'd)
Name, Age and Address of
Independent Director | | Position(s)
Held with
Registrant | | Length of Time
Served* | | Principal Occupation(s) During Past 5 Years | | Number of
Portfolios in
Fund Complex
Overseen by
Independent
Director** | | Other Directorships
Held by Independent
Director*** | |
Joseph J. Kearns (71)
c/o Kearns & Associates LLC
PMB754
22631 Pacific Coast Highway
Malibu, CA 90265 | | Director | | Since
August
1994 | | President, Kearns & Associates LLC (investment consulting); Chairperson of the Audit Committee (since October 2006) and Director or Trustee of various Morgan Stanley Funds (since August 1994); formerly, Deputy Chairperson of the Audit Committee (July 2003-September 2006) and Chairperson of the Audit Committee of various Morgan Stanley Funds (since August 1994); CFO of the J. Paul Getty Trust. | | | 101 | | | Director of Electro Rent Corporation (equipment leasing) and The Ford Family Foundation. | |
Michael F. Klein (55)
c/o Kramer Levin Naftalis & Frankel LLP
Counsel to the
Independent Directors
1177 Avenue of the Americas
New York, NY 10036 | | Director | | Since
August
2006 | | Managing Director, Aetos Capital, LLC (since March 2000) and Co-President, Aetos Alternatives Management, LLC (since January 2004) and Co-Chief Executive Officer of Aetos Capital LLC (since August 2013); Chairperson of the Fixed Income Sub-Committee of the Investment Committee (since October 2006) and Director or Trustee of various Morgan Stanley Funds (since August 2006); formerly, Managing Director, Morgan Stanley & Co. Inc. and Morgan Stanley Dean Witter Investment Management, President, various Morgan Stanley Funds (June 1998-March 2000) and Principal, Morgan Stanley & Co. Inc. and Morgan Stanley Dean Witter Investment Management (August 1997-December 1999). | | | 98 | | | Director of certain investment funds managed or sponsored by Aetos Capital, LLC. Director of Sanitized AG and Sanitized Marketing AG (specialty chemicals). | |
Michael E. Nugent (77)
522 Fifth Avenue
New York, NY 10036 | | Chairperson of the Board and Director | | Chairperson of the Boards since July 2006 and Director since July 1991 | | Chairperson of the Boards of various Morgan Stanley Funds (since July 2006); Chairperson of the Closed-End Fund Committee (since June 2012) and Director or Trustee of various Morgan Stanley Funds (since July 1991); formerly, Chairperson of the Insurance Committee (until July 2006); General Partner, Triumph Capital, L.P. (private investment partnership) (1988-2013) | | | 100 | | | None. | |
W. Allen Reed (66)
c/o Kramer Levin Naftalis & Frankel LLP
Counsel to the
Independent Directors
1177 Avenue of the Americas
New York, NY 10036 | | Director | | Since
August
2006 | | Chairperson of the Equity Sub-Committee of the Investment Committee (since October 2006) and Director or Trustee of various Morgan Stanley Funds (since August 2006); formerly, President and CEO of General Motors Asset Management; Chairman and Chief Executive Officer of the GM Trust Bank and Corporate Vice President of General Motors Corporation (August 1994-December 2005). | | | 98 | | | Director of Temple-Inland Industries (packaging and forest products); Director of Legg Mason, Inc. and Director of the Auburn University Foundation. | |
Fergus Reid (81)
c/o Joe Pietryka, Inc.
85 Charles Colman Blvd.
Pawling, NY 12564 | | Director | | Since
June
1992 | | Chairman, Joe Pietryka, Inc.; Chairperson of the Governance Committee and Director or Trustee of various Morgan Stanley Funds (since June 1992). | | | 101 | | | Through December 31, 2012, Trustee and Director of certain Investment companies in the JP Morgan Fund Complex. | |
40
Morgan Stanley Institutional Fund, Inc.
Annual Report — December 31, 2013
Director and Officer Information (unaudited) (cont'd)
Interested Director:
Name, Age and Address of
Interested Director | | Position(s) Held
with Registrant | | Length of
Time Served* | | Principal Occupation(s) During Past 5 Years | | Number of
Portfolios in
Fund Complex
Overseen by
Interested
Director** | | Other Directorships
Held by Interested
Director*** | |
James F. Higgins (66)
One New York Plaza
New York, New York 10004 | | Director | | Since
June
2000 | | Director or Trustee of various Morgan Stanley Funds (since June 2000); Senior Advisor of Morgan Stanley (since August 2000). | | | 99 | | | Formerly, Director of AXA Financial, Inc. and AXA Equitable Life Insurance Company (2002-2011) and Director of AXA MONY Life Insurance Company and AXA MONY Life Insurance Company of America (2004-2011). | |
* Each Director serves an indefinite term, until his or her successor is elected.
** The Fund Complex includes (as of December 31, 2013) all open-end and closed-end funds (including all of their portfolios) advised by Morgan Stanley Investment Management Inc. (the "Adviser") and any funds that have an adviser that is an affiliated person of the Adviser (including, but not limited to, Morgan Stanley AIP GP LP).
*** This includes any directorships at public companies and registered investment companies held by the Director at any time during the past five years.
41
Morgan Stanley Institutional Fund, Inc.
Annual Report — December 31, 2013
Director and Officer Information (unaudited) (cont'd)
Executive Officers:
Name, Age and Address of Executive Officer | | Position(s) Held
with
Registrant | | Length of
Time Served* | | Principal Occupation(s) During Past 5 Years | |
John H. Gernon (50)
522 Fifth Avenue
New York, NY 10036 | | President and Principal Executive Officer—Equity, Fixed Income and AIP Funds | | Since September 2013 | | President and Principal Executive Officer of the Equity and Fixed Income Funds and the Morgan Stanley AIP Funds (since September 2013) in the Fund Complex. Managing Director of the Adviser. | |
Stefanie V. Chang Yu (47)
522 Fifth Avenue
New York, NY 10036 | | Chief Compliance Officer | | Since
January
2014 | | Managing Director of the Adviser and various entities affiliated with the Adviser; Chief Compliance Officer of various Morgan Stanley Funds and the Adviser (since January 2014); formerly, Vice President of various Morgan Stanley Funds (December 1997-January 2014). | |
Joseph C. Benedetti (48)
522 Fifth Avenue
New York, NY 10036 | | Vice President | | Since
January
2014 | | Managing Director of the Adviser and various entities affiliated with the Adviser; Vice President of various Morgan Stanley Funds (since January 2014); formerly, Assistant Secretary of various Morgan Stanley Funds (October 2004-January 2014). | |
Francis J. Smith (48)
522 Fifth Avenue
New York, NY 10036 | | Treasurer and Principal Financial Officer | | Treasurer since July 2003 and Principal Financial Officer since September 2002 | | Executive Director of the Adviser and various entities affiliated with the Adviser; Treasurer and Principal Financial Officer of various Morgan Stanley Funds (since July 2003). | |
Mary E. Mullin (46)
522 Fifth Avenue
New York, NY 10036 | | Secretary | | Since
June
1999 | | Executive Director of the Adviser and various entities affiliated with the Adviser; Secretary of various Morgan Stanley Funds (since June 1999). | |
* Each officer serves an indefinite term, until his or her successor is elected.
42
Morgan Stanley Institutional Fund, Inc.
Annual Report — December 31, 2013
Adviser and Administrator
Morgan Stanley Investment Management Inc.
522 Fifth Avenue
New York, New York 10036
Distributor
Morgan Stanley Distribution, Inc.
522 Fifth Avenue
New York, New York 10036
Dividend Disbursing and Transfer Agent
Boston Financial Data Services, Inc.
2000 Crown Colony Drive
Quincy, Massachusetts 02169
Custodian
State Street Bank and Trust Company
One Lincoln Street
Boston, Massachusetts 02111
Legal Counsel
Dechert LLP
1095 Avenue of the Americas
New York, New York 10036
Counsel to the Independent Directors
Kramer Levin Naftalis & Frankel LLP
1177 Avenue of the Americas
New York, New York 10036
Independent Registered Public Accounting Firm
Ernst & Young LLP
200 Clarendon Street
Boston, Massachusetts 02116
Reporting to Shareholders
Each Morgan Stanley fund provides a complete schedule of portfolio holdings in its semi-annual and annual reports within 60 days of the end of the fund's second and fourth fiscal quarters by filing the schedule electronically with the Securities and Exchange Commission (SEC). The semi-annual reports are filed on Form N-CSRS and the annual reports are filed on Form N-CSR. Morgan Stanley also delivers the semi-annual and annual reports to fund shareholders and makes these reports available on its public website, www.morganstanley.com/im. Each Morgan Stanley fund also files a complete schedule of portfolio holdings with the SEC for the fund's first and third fiscal quarters on Form N-Q. Morgan Stanley does not deliver the reports for the first and third fiscal quarters to shareholders, nor are the reports posted to the Morgan Stanley public website. You may, however, obtain the Form N-Q filings (as well as the Form N-CSR and N-CSRS filings) by accessing the SEC's website, www.sec.gov. You may also review and copy them at the SEC's Public Reference Room in Washington, DC. Information on the operation of the SEC's Public Reference Room may be obtained by calling the SEC toll free at 1 (800) SEC-0330. You can also request copies of these materials, upon payment of a duplicating fee, by electronic request at the SEC's email address (publicinfo@sec.gov) or by writing the Public Reference Room of the SEC, Washington, DC 20549-0102.
Proxy Voting Policies and Procedures and Proxy Voting Record
You may obtain a copy of the Fund's Proxy Voting Policy and Procedures and information regarding how the Fund voted proxies relating to portfolio securities during the most recent twelve-month period ended June 30, without charge, upon request, by calling toll free 1 (800) 548-7786 or by visiting our website at www.morganstanley.com/im. This information is also available on the SEC's website at www.sec.gov.
This report is authorized for distribution only when preceded or accompanied by a prospectus of Morgan Stanley Institutional Fund, Inc. which describes in detail each Investment Portfolio's investment policies, risks, fees and expenses. Please read the prospectus carefully before you invest or send money. For additional information, including information regarding the investments comprising the Portfolio, please visit our website at www.morganstanley.com/im or call toll free 1 (800)-548-7786.
43
(This Page has been left blank intentionally.)
(This Page has been left blank intentionally.)
Printed in U.S.A.
This Report has been prepared for shareholders and may be distributed to others only if preceded or accompanied by a current prospectus.
Morgan Stanley Investment Management Inc.
522 Fifth Avenue
New York, New York 10036
© 2014 Morgan Stanley. Morgan Stanley Distribution, Inc.

IFIMANN
808861 EXP 2.28.15

Morgan Stanley Institutional Fund, Inc.
Global Real Estate Portfolio
Annual Report
December 31, 2013

Morgan Stanley Institutional Fund, Inc.
Annual Report — December 31, 2013
Shareholders' Letter | | | 2 | | |
Expense Example | | | 3 | | |
Investment Overview | | | 4 | | |
Portfolio of Investments | | | 7 | | |
Statement of Assets and Liabilities | | | 10 | | |
Statement of Operations | | | 12 | | |
Statements of Changes in Net Assets | | | 13 | | |
Financial Highlights | | | 15 | | |
Notes to Financial Statements | | | 19 | | |
Report of Independent Registered Public Accounting Firm | | | 26 | | |
Federal Tax Notice | | | 27 | | |
U.S. Privacy Policy | | | 28 | | |
Director and Officer Information | | | 31 | | |
This report is authorized for distribution only when preceded or accompanied by prospectuses of the Morgan Stanley Institutional Fund, Inc. To receive a prospectus and/or statement of additional information (SAI), which contains more complete information such as investment objectives, charges, expenses, policies for voting proxies, risk considerations, and describes in detail each of the Portfolio's investment policies to the prospective investor, please call toll free 1 (800) 548-7786. Please read the prospectuses carefully before you invest or send money.
Additionally, you can access portfolio information including performance, characteristics, and investment team commentary through Morgan Stanley Investment Management's website: www.morganstanley.com/im.
Market forecasts provided in this report may not necessarily come to pass. There is no guarantee that any sectors mentioned will continue to perform as discussed herein or that securities in such sectors will be held by the Portfolio in the future. There is no assurance that a Portfolio will achieve its investment objective. Portfolios are subject to market risk, which is the possibility that market values of securities owned by the Portfolio will decline and, therefore, the value of the Portfolio's shares may be less than what you paid for them. Accordingly, you can lose money investing in the Portfolio. Please see the prospectus for more complete information on investment risks.
1
Morgan Stanley Institutional Fund, Inc.
Annual Report — December 31, 2013
Shareholders' Letter (unaudited)
Dear Shareholders,
We are pleased to provide this Annual report, in which you will learn how your investment in Global Real Estate Portfolio (the "Portfolio") performed during the latest twelve-month period.
Morgan Stanley Investment Management is a client-centric, investor-led organization. Our global presence, intellectual capital, and breadth of products and services enable us to partner with investors to meet the evolving challenges of today's financial markets. We aim to deliver superior investment service and to empower our clients to make the informed decisions that help them reach their investment goals.
As always, we thank you for selecting Morgan Stanley Investment Management, and look forward to working with you in the months and years ahead.
Sincerely,

John H. Gernon
President and Principal Executive Officer
January 2014
2
Morgan Stanley Institutional Fund, Inc.
Annual Report — December 31, 2013
Expense Example (unaudited)
Global Real Estate Portfolio
As a shareholder of the Portfolio, you incur two types of costs: (1) transactional costs; and (2) ongoing costs, including advisory fees, administration fees, distribution and shareholder services fees and other Portfolio expenses. This example is intended to help you understand your ongoing costs (in dollars) of investing in the Portfolio and to compare these costs with the ongoing costs of investing in other mutual funds.
This example is based on an investment of $1,000 invested at the beginning of the six-month period ended December 31, 2013 and held for the entire six-month period.
Actual Expenses
The table below provides information about actual account values and actual expenses. You may use the information in this table, together with the amount you invested, to estimate the expenses that you paid over the period. Simply divide your account value by $1,000 (for example, an $8,600 account value divided by $1,000 = 8.6), then multiply the result by the number in the table under the heading entitled "Actual Expenses Paid During Period" to estimate the expenses you paid on your account during this period.
Hypothetical Example for Comparison Purposes
The table below provides information about hypothetical account values and hypothetical expenses based on the Portfolio's actual expense ratio and an assumed rate of return of 5% per year before expenses, which is not the Portfolio's actual return. The hypothetical account values and expenses may not be used to estimate the actual ending account balance or expenses you paid for the period. You may use this information to compare the ongoing costs of investing in the Portfolio and other funds. To do so, compare this 5% hypothetical example with the 5% hypothetical examples that appear in the shareholder reports of the other funds.
Please note that the expenses shown in the table are meant to highlight your ongoing costs only and do not reflect any transactional costs, such as sales charges (loads). Therefore, the information for each class in the table is useful in comparing ongoing costs only, and will not help you determine the relative total costs of owning different funds. In addition, if these transactional costs were included, your costs would have been higher.
| | | Beginning
Account
Value
7/1/13 | | Actual Ending
Account
Value
12/31/13 | | Hypothetical
Ending Account
Value | | Actual
Expenses
Paid
During
Period | | Hypothetical
Expenses Paid
During Period | | Net
Expense
Ratio
During
Period*** | |
Global Real Estate Portfolio Class I | | $ | 1,000.00 | | | $ | 1,021.90 | | | $ | 1,020.11 | | | $ | 5.15 | * | | $ | 5.14 | * | | | 1.01 | % | |
Global Real Estate Portfolio Class A@ | | | 1,000.00 | | | | 1,020.20 | | | | 1,018.40 | | | | 6.87 | * | | | 6.87 | * | | | 1.35 | | |
Global Real Estate Portfolio Class L | | | 1,000.00 | | | | 1,018.20 | | | | 1,016.38 | | | | 8.90 | * | | | 8.89 | * | | | 1.75 | | |
Global Real Estate Portfolio Class IS | | | 1,000.00 | | | | 1,010.80 | | | | 1,011.84 | | | | 2.83 | ** | | | 2.83 | ** | | | 0.96 | | |
* Expenses are calculated using each Portfolio Class' annualized net expense ratio (as disclosed) multiplied by the average account value over the period, and multiplied by 184/365 (to reflect the most recent one-half year period).
** Expenses are calculated using the Portfolio Class' annualized net expense ratio (as disclosed) multiplied by the average account value over the period, and multiplied by 107/365 (to reflect the actual days in the period).
*** Annualized.
@ Effective September 9, 2013, Class P and Class H shares were renamed Class A shares.
3
Morgan Stanley Institutional Fund, Inc.
Annual Report — December 31, 2013
Investment Overview (unaudited)
Global Real Estate Portfolio
The Global Real Estate Portfolio seeks to provide current income and capital appreciation.
Performance
For the year ended December 31, 2013, the Portfolio had a total return based on net asset value (NAV) and reinvestment of distributions per share of 3.55%, net of fees, for Class I shares. The Portfolio's Class I shares underperformed against its benchmark, the FTSE EPRA/NAREIT Developed Real Estate Index — Net Total Return to U.S. Investors (the "Index"), which returned 4.21%, and underperformed the Morgan Stanley Capital International (MSCI) World Index, which returned 26.68%.
Factors Affecting Performance
• The global real estate securities market gained 4.21% during the 12-month period ending December 31, 2013, as measured by the Index. Europe was the top performing region in the year, Asia performed in-line with the global average, and North America underperformed the global average.
• During the year, real estate share prices appeared to have been influenced by transactional evidence in the private real estate markets of strong investor demand for core assets at valuations that demonstrate the acceptance of low expected returns as well as investors' search for yield. Share prices also fluctuated alongside expectations for central bank quantitative easing (QE) policies, in particular expectations for U.S. Federal Reserve QE tapering, which was announced in December.
• Performance within the U.S., Asian and European regional portfolios contributed to relative performance. Top down global allocation contributed to relative performance. In Asia, the Portfolio benefited from stock selection in Japan and the underweight to Singapore and Australia; this was partially offset by the overweight to and stock selection within Hong Kong, and the underweight to Japan, which detracted. In Europe, the Portfolio benefited from stock selection within and the underweight to Germany, and the overweight to and stock selection in the U.K; this was partially offset by the negative impact of stock selection in Sweden. In the U.S., the Portfolio benefited from the overweight to the hotel sector, the underweight to the health care sector, and stock selection in the mall and diversified sectors; this was
partially offset by relative losses from stock selection within and the overweight to the apartment sector, the underweight to the net lease sector, and stock selection in the suburban office, health care, and shopping center sectors.
Management Strategies
• The global portfolio is comprised of three regional portfolios with a global allocation which weights each of the three major regions (U.S., Europe and Asia) relative to the Index based on our view of the relative attractiveness of each region in terms of underlying real estate fundamentals and public market valuations. Moreover, each of the regional portfolios reflects our core investment philosophy as a real estate value investor, which results in the ownership of stocks that we believe provide the best valuation relative to their underlying real estate values, while striving to maintain portfolio diversification. Our company-specific research leads us to specific preferences for sub-segments within each of the property sectors and countries. For the period ended December 31, 2013, the Portfolio was overweight the Asian listed property sector, and underweight the U.S. and European listed property sectors.
• The overweight to the Asian region was predominated by the real estate operating companies (REOCs) in Hong Kong and Japan. We continue to believe that the Hong Kong REOCs offer highly attractive value, as there is the widest discrepancy both between private and public valuations, and relative to other public listed property markets. The discounted valuations are further accentuated as the Hong Kong REOCs maintain very modest leverage levels. Sentiment continues to be a significant driver of share price movements and investor sentiment remained negative due to macro and interest rate concerns and the continued uncertainty from residential tightening measures. While we believe that there is some risk to asset values, which are above peak levels, there is no evidence to date for commercial assets. Despite trading at premiums, the Japan REOCs continue to offer attractive value versus the Japanese real estate investment trusts (J-REITs). There is continued favorable sentiment toward the J-REOCs due to aggressive QE measures by the Bank of Japan (BOJ), with property values viewed
4
Morgan Stanley Institutional Fund, Inc.
Annual Report — December 31, 2013
Investment Overview (unaudited) (cont'd)
Global Real Estate Portfolio
as a key potential beneficiary of such action. It is notable that current Japan REOC NAVs reflect modest cap rate improvements (awaiting transactional evidence of further cap rate compression) and are based on cash flows and valuations that are near cyclical lows. There are expectations for significant upside to asset values from depressed levels due to BOJ actions to spur asset inflation. As a result, within Japan, we remain overweight the Japan REOCs and underweight the J-REITs. The Portfolio was underweight Singapore on relative valuation.
• In Europe, property stocks in the U.K. and on the Continent ended the year trading at a modest premium to NAVs. In the U.K. there are prospects for NAV improvements going forward, whereas on the Continent there is potential downside risk to asset values due to a weak economy and the lack of a downward adjustment to asset values during the recession. Prime assets in London are attracting significant foreign investment demand and there is continued strength in operating fundamentals. The strength of investment demand is also spreading beyond London. Moreover, the U.K. companies have more defensive balance sheets with less refinancing risk, lower leverage ratios and longer average debt maturities than companies on the Continent. Finally, the U.K. continues to have a better macroeconomic outlook than the eurozone. As a result, we believe the valuations for the U.K. companies are more attractive relative to the prevailing valuations on the Continent, and within Europe we remain overweight the U.K.
• The Portfolio was underweight the U.S., which traded at a modest premium to NAVs, assuming asset values for high-quality assets have fully recovered and are now, on average, modestly in excess of their all-time peak levels achieved in mid-2007. This reflects a bifurcation in the market between the core property sectors (apartments, malls) trading at meaningful discounts to NAVs and finance-company/dividend-oriented stocks (health care, net lease) trading at significant premiums to NAVs. Within the U.S., our company-specific research leads us to an overweighting of a group of companies that are focused in the ownership of high quality malls, apartments, central business district office assets, upscale hotels and a number of out-of-favor companies, and an underweighting to
companies concentrated in the ownership of net lease, health care, suburban office, specialty office, shopping center, storage and industrial assets.
• Western markets (and Japan) continue to recover from significant declines in rents and occupancies. The outlook is for a continued recovery in operating fundamentals as economic growth improves and supply remains largely subdued. The most favorable operating results continue to be posted in the U.S. primarily by shorter lease term sectors: apartment, hotel, storage and high-end malls continue to feature the strongest operating results among the commercial sectors. In Europe, there are easing concerns regarding economic weakness and London continues to show strength. Key Asian markets (Hong Kong and Singapore) feature low vacancy levels and landlords are experiencing increased rents on tenant expirations.
• We continue to maintain a strong conviction to our long-term, value-oriented, bottom-up stock selection driven investment strategy, which is focused on investing in publicly traded real estate securities that offer exposure to the direct property markets at the best value relative to underlying real estate values and NAV growth prospects.
* Minimum Investment for Class I shares
** Commenced Operations on August 30, 2006.
In accordance with SEC regulations, Portfolio's performance shown assumes that all recurring fees (including management fees) were deducted and all dividends and distributions were reinvested. The performance of Class A+, L and IS shares will vary from Class I shares based upon their different inception dates and will be negatively impacted by additional fees assessed to those classes (if applicable).
5
Morgan Stanley Institutional Fund, Inc.
Annual Report — December 31, 2013
Investment Overview (unaudited) (cont'd)
Global Real Estate Portfolio
Performance Compared to the FTSE EPRA/NAREIT Developed Real Estate Index — Net Total Return to US Investors(1), the Morgan Stanley Capital International (MSCI) World Index(2) and the Lipper Global Real Estate Funds Average(3)
| | | Period Ended December 31, 2013
Total Returns(4) | |
| | | | | Average Annual | |
| | | One
Year | | Five
Years | | Ten
Years | | Since
Inception(8) | |
Portfolio — Class I Shares
w/o sales charges(5) | | | 3.55 | % | | | 15.61 | % | | | — | | | | 2.82 | % | |
FTSE EPRA/NAREIT Developed Real
Estate Index — Net Total Return to
US Investors | | | 4.21 | | | | 15.70 | | | | — | | | | 2.20 | | |
MSCI World Index | | | 26.68 | | | | 15.02 | | | | — | | | | 4.97 | | |
Lipper Global Real Estate Funds
Average | | | 3.24 | | | | 14.37 | | | | — | | | | 1.84 | | |
Portfolio — Class A+ Shares
w/o sales charges(5) | | | 3.18 | | | | 15.29 | | | | — | | | | 2.54 | | |
Portfolio — Class A+ Shares with
maximum 5.25% sales charges(5) | | | -2.25 | | | | 14.07 | | | | — | | | | 1.79 | | |
FTSE EPRA/NAREIT Developed Real
Estate Index — Net Total Return to
US Investors | | | 4.21 | | | | 15.70 | | | | — | | | | 2.20 | | |
MSCI World Index | | | 26.68 | | | | 15.02 | | | | — | | | | 4.97 | | |
Lipper Global Real Estate Funds
Average | | | 3.24 | | | | 14.37 | | | | — | | | | 1.84 | | |
Portfolio — Class L Shares
w/o sales charges(6) | | | 2.77 | | | | 14.73 | | | | — | | | | 2.46 | | |
FTSE EPRA/NAREIT Developed Real
Estate Index — Net Total Return to
US Investors | | | 4.21 | | | | 15.70 | | | | — | | | | 2.73 | | |
MSCI World Index | | | 26.68 | | | | 15.02 | | | | — | | | | 4.50 | | |
Lipper Global Real Estate Funds
Average | | | 3.24 | | | | 14.37 | | | | — | | | | 4.33 | | |
Portfolio — Class IS Shares
w/o sales charges(7) | | | — | | | | — | | | | — | | | | 1.08 | | |
FTSE EPRA/NAREIT Developed Real
Estate Index — Net Total Return to
US Investors | | | — | | | | — | | | | — | | | | 1.42 | | |
MSCI World Index | | | — | | | | — | | | | — | | | | 8.81 | | |
Lipper Global Real Estate Funds
Average | | | — | | | | — | | | | — | | | | 1.58 | | |
Performance data quoted represents past performance, which is no guarantee of future results, and current performance may be lower or higher than the figures shown. Performance assumes that all dividends and distributions, if any, were reinvested. For the most recent month-end performance figures, please visit www.morganstanley.com/im. Investment return and principal value will fluctuate so that Portfolio shares, when redeemed, may be worth more or less than their original cost. Total returns do not reflect the deduction of taxes that a shareholder would pay on Portfolio distributions or the redemption of Portfolio shares. Returns for periods less than one year are not annualized. Performance of share classes will vary due to difference in expenses.
+ Effective September 9, 2013, Class P shares were renamed Class A shares.
(1) The FTSE EPRA/NAREIT Developed Real Estate Index — Net Total Return to US Investors is a market capitalization weighted index designed to reflect the stock performance of companies engaged in the North American, European and Asian real estate markets. The performance of the Index is listed in U.S. dollars and assumes reinvestment of dividends. "Net Total Return to US investors" reflects a reduction in total returns after taking into account the withholding tax on dividends by certain foreign countries represented in the Index for periods after 1/31/05 (gross returns used prior to 1/31/05). The Index is unmanaged and its returns do not include any sales charges or fees. Such costs would lower performance. It is not possible to invest directly in an index.
(2) The Morgan Stanley Capital International (MSCI) World Index is a free float-adjusted market capitalization weighted index that is designed to measure the global equity market performance of developed markets. The term "free float" represents the portion of shares outstanding that are deemed to be available for purchase in the public equity markets by investors. The MSCI World Index currently consists of 23 developed market country indices. The performance of the Index is listed in U.S. dollars and assumes reinvestment of net dividends. The Index is unmanaged and its returns do not include any sales charges or fees. Such costs would lower performance. It is not possible to invest directly in an index.
(3) The Lipper Global Real Estate Funds Average tracks the performance of all funds in the Lipper Global Real Estate Funds classification. The Average, which is adjusted for capital gains distributions and income dividends, is unmanaged and should not be considered an investment. As of the date of this report, the Portfolio was in the Lipper Global Real Estate Funds classification.
(4) Total returns for the Portfolio reflect fees waived and expenses reimbursed, if applicable, by the Adviser. Without such waivers and reimbursements, total returns would have been lower. The fee waivers and/or expense reimbursements will continue for at least one year or until such time as the Fund's Board of Directors acts to discontinue all or a portion of such waivers and/or expense reimbursements when it deems that such action is appropriate.
(5) Commenced operations on August 30, 2006.
(6) Commenced offering on June 16, 2008.
(7) Commenced offering September 13, 2013.
(8) For comparative purposes, average annual since inception returns listed for the Indexes refer to the inception date or initial offering of the respective share class of the Portfolio, not the inception of the Index. Returns for periods less than one year are not annualized.
Portfolio Composition
Classification | | Percentage of
Total Investments | |
Diversified | | | 33.7 | % | |
Retail | | | 26.6 | | |
Other* | | | 17.8 | | |
Residential | | | 11.4 | | |
Office | | | 10.5 | | |
Total Investments | | | 100.0 | % | |
* Industries and/or investment types representing less than 5% of total investments.
6
Morgan Stanley Institutional Fund, Inc.
Annual Report — December 31, 2013
Portfolio of Investments
Global Real Estate Portfolio
| | | Shares | | Value
(000) | |
Common Stocks (98.1%) | |
Australia (6.9%) | |
CFS Retail Property Trust Group REIT | | | 2,513,528 | | | $ | 4,365 | | |
Commonwealth Property Office Fund REIT | | | 5,749,555 | | | | 6,391 | | |
Dexus Property Group REIT | | | 8,892,561 | | | | 7,980 | | |
Federation Centres Ltd. REIT | | | 3,945,672 | | | | 8,244 | | |
Goodman Group REIT | | | 4,348,353 | | | | 18,365 | | |
GPT Group REIT | | | 4,421,091 | | | | 13,422 | | |
Investa Office Fund REIT | | | 425,726 | | | | 1,190 | | |
Mirvac Group REIT | | | 7,632,786 | | | | 11,450 | | |
Stockland REIT | | | 3,949,586 | | | | 12,731 | | |
Westfield Group REIT | | | 4,868,737 | | | | 43,864 | | |
Westfield Retail Trust REIT | | | 6,836,626 | | | | 18,130 | | |
| | | | 146,132 | | |
Austria (0.2%) | |
Atrium European Real Estate Ltd. (a) | | | 556,689 | | | | 3,201 | | |
Belgium (0.0%) | |
Cofinimmo REIT | | | 7,406 | | | | 915 | | |
Brazil (0.5%) | |
BR Malls Participacoes SA | | | 605,480 | | | | 4,376 | | |
| BR Properties SA | | | 507,300 | | | | 3,999 | | |
Iguatemi Empresa de Shopping Centers SA | | | 325,400 | | | | 3,076 | | |
| | | | 11,451 | | |
Canada (2.1%) | |
Boardwalk REIT | | | 136,698 | | | | 7,702 | | |
Brookfield Canada Office Properties REIT | | | 186,579 | | | | 4,672 | | |
Calloway REIT | | | 85,891 | | | | 2,034 | | |
Canadian Apartment Properties REIT | | | 44,410 | | | | 888 | | |
Crombie Real Estate Investment Trust REIT | | | 250,530 | | | | 3,193 | | |
Extendicare, Inc. | | | 192,440 | | | | 1,236 | | |
First Capital Realty, Inc. | | | 267,140 | | | | 4,454 | | |
RioCan REIT | | | 828,083 | | | | 19,310 | | |
| | | | 43,489 | | |
China (1.1%) | |
Agile Property Holdings Ltd. (b) | | | 1,462,000 | | | | 1,567 | | |
China Overseas Land & Investment Ltd. (b) | | | 1,092,000 | | | | 3,070 | | |
China Resources Land Ltd. (b) | | | 4,695,000 | | | | 11,637 | | |
Country Garden Holdings Co., Ltd. (b) | | | 5,944,328 | | | | 3,588 | | |
Guangzhou R&F Properties Co., Ltd. H Shares (b) | | | 1,085,200 | | | | 1,587 | | |
Longfor Properties Co., Ltd. (b) | | | 587,500 | | | | 821 | | |
Shimao Property Holdings Ltd. (b) | | | 762,500 | | | | 1,752 | | |
| | | | 24,022 | | |
Finland (0.2%) | |
Sponda Oyj | | | 818,756 | | | | 3,852 | | |
France (3.5%) | |
Altarea REIT | | | 5,104 | | | | 899 | | |
Fonciere Des Regions REIT | | | 62,825 | | | | 5,423 | | |
Gecina SA REIT | | | 27,330 | | | | 3,611 | | |
ICADE REIT | | | 91,065 | | | | 8,478 | | |
Klepierre REIT | | | 106,783 | | | | 4,948 | | |
| | | Shares | | Value
(000) | |
Mercialys SA REIT | | | 218,712 | | | $ | 4,588 | | |
Unibail-Rodamco SE REIT | | | 175,141 | | | | 44,875 | | |
| | | | 72,822 | | |
Germany (1.2%) | |
Alstria Office AG REIT (a) | | | 176,895 | | | | 2,227 | | |
Deutsche Annington Immobilien SE (a) | | | 105,265 | | | | 2,607 | | |
Deutsche Euroshop AG | | | 81,882 | | | | 3,585 | | |
Deutsche Wohnen AG (a) | | | 73,819 | | | | 1,371 | | |
Deutsche Wohnen AG | | | 238,570 | | | | 4,606 | | |
LEG Immobilien AG (a) | | | 170,309 | | | | 10,063 | | |
Prime Office AG REIT (a) | | | 388,458 | | | | 1,651 | | |
| | | | 26,110 | | |
Hong Kong (11.7%) | |
Hang Lung Properties Ltd. | | | 2,048,000 | | | | 6,471 | | |
Henderson Land Development Co., Ltd. | | | 1,370,214 | | | | 7,819 | | |
Hongkong Land Holdings Ltd. | | | 5,774,000 | | | | 34,066 | | |
Hysan Development Co., Ltd. | | | 4,601,014 | | | | 19,818 | | |
Kerry Properties Ltd. | | | 2,420,220 | | | | 8,396 | | |
Link REIT (The) | | | 6,505,775 | | | | 31,546 | | |
New World Development Co., Ltd. | | | 11,537,914 | | | | 14,567 | | |
Sino Land Co., Ltd. | | | 5,210,693 | | | | 7,123 | | |
Sun Hung Kai Properties Ltd. | | | 6,307,180 | | | | 79,996 | | |
Swire Properties Ltd. | | | 3,247,400 | | | | 8,208 | | |
Wharf Holdings Ltd. | | | 3,530,763 | | | | 27,001 | | |
| | | | 245,011 | | |
Italy (0.2%) | |
Beni Stabili SpA REIT | | | 4,948,939 | | | | 3,336 | | |
Japan (14.9%) | |
Activia Properties, Inc. REIT | | | 768 | | | | 6,046 | | |
Hulic Co., Ltd. | | | 478,100 | | | | 7,060 | | |
Japan Real Estate Investment Corp. REIT | | | 2,773 | | | | 14,851 | | |
Japan Retail Fund Investment Corp. REIT | | | 3,790 | | | | 7,709 | | |
Mitsubishi Estate Co., Ltd. | | | 3,026,000 | | | | 90,369 | | |
Mitsui Fudosan Co., Ltd. | | | 2,258,000 | | | | 81,156 | | |
Nippon Building Fund, Inc. REIT | | | 2,808 | | | | 16,318 | | |
Nippon Prologis, Inc. REIT | | | 814 | | | | 7,776 | | |
Nomura Real Estate Holdings, Inc. | | | 70,500 | | | | 1,585 | | |
NTT Urban Development Corp. | | | 31,000 | | | | 356 | | |
Sumitomo Realty & Development Co., Ltd. | | | 1,354,000 | | | | 67,243 | | |
Tokyo Tatemono Co., Ltd. | | | 721,000 | | | | 7,997 | | |
United Urban Investment Corp. REIT | | | 3,233 | | | | 4,645 | | |
| | | | 313,111 | | |
Malta (0.0%) | |
BGP Holdings PLC (a)(c)(d) | | | 12,867,024 | | | | — | | |
Netherlands (0.7%) | |
Corio N.V. REIT | | | 142,137 | | | | 6,370 | | |
Eurocommercial Properties N.V. CVA REIT | | | 103,627 | | | | 4,399 | | |
Vastned Retail N.V. REIT | | | 25,655 | | | | 1,164 | | |
Wereldhave N.V. REIT | | | 44,718 | | | | 3,517 | | |
| | | | 15,450 | | |
The accompanying notes are an integral part of the financial statements.
7
Morgan Stanley Institutional Fund, Inc.
Annual Report — December 31, 2013
Portfolio of Investments (cont'd)
Global Real Estate Portfolio
| | | Shares | | Value
(000) | |
Norway (0.2%) | |
Norwegian Property ASA | | | 3,041,295 | | | $ | 3,645 | | |
Singapore (3.2%) | |
Ascendas Real Estate Investment Trust REIT | | | 2,557,000 | | | | 4,458 | | |
CapitaCommercial Trust REIT | | | 3,057,000 | | | | 3,512 | | |
CapitaLand Ltd. | | | 5,256,000 | | | | 12,620 | | |
CapitaMall Trust REIT | | | 4,212,000 | | | | 6,358 | | |
CapitaMalls Asia Ltd. | | | 1,866,000 | | | | 2,898 | | |
City Developments Ltd. | | | 770,000 | | | | 5,858 | | |
Global Logistic Properties Ltd. | | | 3,880,000 | | | | 8,886 | | |
Keppel REIT | | | 4,267,000 | | | | 4,007 | | |
Mapletree Commercial Trust REIT | | | 1,372,684 | | | | 1,294 | | |
Mapletree Greater China Commercial Trust REIT | | | 232,000 | | | | 154 | | |
SPH REIT (a) | | | 7,006,000 | | | | 5,441 | | |
Suntec REIT | | | 3,275,000 | | | | 3,997 | | |
UOL Group Ltd. | | | 1,393,000 | | | | 6,833 | | |
| | | | 66,316 | | |
Sweden (0.7%) | |
Atrium Ljungberg AB, Class B | | | 205,441 | | | | 2,811 | | |
Castellum AB | | | 186,408 | | | | 2,901 | | |
Fabege AB | | | 87,015 | | | | 1,039 | | |
Hufvudstaden AB, Class A | | | 633,388 | | | | 8,484 | | |
| | | | 15,235 | | |
Switzerland (1.0%) | |
Mobimo Holding AG (Registered) (a) | | | 7,381 | | | | 1,540 | | |
PSP Swiss Property AG (Registered) (a) | | | 161,997 | | | | 13,711 | | |
Swiss Prime Site AG (Registered) (a) | | | 66,806 | | | | 5,171 | | |
| | | | 20,422 | | |
United Kingdom (6.3%) | |
British Land Co., PLC REIT | | | 2,464,106 | | | | 25,666 | | |
Capital & Counties Properties PLC | | | 724,505 | | | | 3,950 | | |
Capital & Regional PLC | | | 4,220,422 | | | | 3,075 | | |
Derwent London PLC REIT | | | 201,779 | | | | 8,337 | | |
Grainger PLC | | | 849,730 | | | | 2,868 | | |
Great Portland Estates PLC REIT | | | 657,877 | | | | 6,526 | | |
Hammerson PLC REIT | | | 2,099,252 | | | | 17,451 | | |
Intu Properties PLC REIT | | | 1,574,280 | | | | 8,079 | | |
Land Securities Group PLC REIT | | | 1,718,602 | | | | 27,420 | | |
LXB Retail Properties PLC (a) | | | 3,749,232 | | | | 7,939 | | |
Quintain Estates & Development PLC (a) | | | 1,835,210 | | | | 2,872 | | |
Safestore Holdings PLC REIT | | | 2,538,318 | | | | 6,767 | | |
Segro PLC REIT | | | 602,605 | | | | 3,333 | | |
Shaftesbury PLC REIT | | | 398,360 | | | | 4,136 | | |
ST Modwen Properties PLC | | | 229,268 | | | | 1,394 | | |
Unite Group PLC | | | 492,033 | | | | 3,280 | | |
| | | | 133,093 | | |
United States (43.5%) | |
Acadia Realty Trust REIT | | | 140,281 | | | | 3,483 | | |
Alexandria Real Estate Equities, Inc. REIT | | | 140,150 | | | | 8,916 | | |
American Campus Communities, Inc. REIT | | | 170,320 | | | | 5,486 | | |
Ashford Hospitality Prime, Inc. REIT | | | 64,118 | | | | 1,167 | | |
Ashford Hospitality Trust, Inc. REIT | | | 320,590 | | | | 2,655 | | |
AvalonBay Communities, Inc. REIT | | | 481,350 | | | | 56,910 | | |
| | | Shares | | Value
(000) | |
Boston Properties, Inc. REIT | | | 350,315 | | | $ | 35,161 | | |
BRE Properties, Inc. REIT | | | 49,615 | | | | 2,714 | | |
Brookfield Office Properties, Inc. | | | 382,046 | | | | 7,354 | | |
Camden Property Trust REIT | | | 385,942 | | | | 21,952 | | |
CBL & Associates Properties, Inc. REIT | | | 94,260 | | | | 1,693 | | |
Cousins Properties, Inc. REIT | | | 470,355 | | | | 4,845 | | |
DCT Industrial Trust, Inc. REIT | | | 1,095,549 | | | | 7,811 | | |
DDR Corp. REIT | | | 463,550 | | | | 7,125 | | |
Duke Realty Corp. REIT | | | 456,180 | | | | 6,861 | | |
Equity Lifestyle Properties, Inc. REIT | | | 307,774 | | | | 11,151 | | |
Equity Residential REIT | | | 1,755,810 | | | | 91,074 | | |
Essex Property Trust, Inc. REIT | | | 14,657 | | | | 2,103 | | |
Exeter Industrial Value Fund, LP REIT (a)(c)(d)(e) | | | 1,860,000 | | | | 1,575 | | |
Federal Realty Investment Trust REIT | | | 79,074 | | | | 8,019 | | |
Forest City Enterprises, Inc., Class A (a) | | | 732,026 | | | | 13,982 | | |
General Growth Properties, Inc. REIT | | | 1,908,697 | | | | 38,308 | | |
HCP, Inc. REIT | | | 986,653 | | | | 35,835 | | |
Health Care, Inc. REIT | | | 110,520 | | | | 5,921 | | |
Healthcare Realty Trust, Inc. REIT | | | 471,180 | | | | 10,041 | | |
Host Hotels & Resorts, Inc. REIT | | | 3,302,922 | | | | 64,209 | | |
Hudson Pacific Properties, Inc. REIT | | | 238,940 | | | | 5,226 | | |
KTR Industrial Fund II, LP REIT (a)(c)(d)(e) | | | 4,597,826 | | | | 4,901 | | |
Lexington Realty Trust REIT | | | 27,830 | | | | 284 | | |
Liberty Property Trust REIT | | | 100,960 | | | | 3,420 | | |
Macerich Co. (The) REIT | | | 559,942 | | | | 32,975 | | |
Mack-Cali Realty Corp. REIT | | | 691,238 | | | | 14,848 | | |
National Retail Properties, Inc. REIT | | | 256,940 | | | | 7,793 | | |
Post Properties, Inc. REIT | | | 11,590 | | | | 524 | | |
ProLogis, Inc. REIT | | | 670,141 | | | | 24,762 | | |
PS Business Parks, Inc. REIT | | | 39,633 | | | | 3,029 | | |
Public Storage REIT | | | 318,225 | | | | 47,899 | | |
Realty Income Corp. REIT | | | 33,170 | | | | 1,238 | | |
Regency Centers Corp. REIT | | | 778,841 | | | | 36,060 | | |
Rexford Industrial Realty, Inc. REIT | | | 98,800 | | | | 1,304 | | |
Senior Housing Properties Trust REIT | | | 763,278 | | | | 16,968 | | |
Simon Property Group, Inc. REIT | | | 852,495 | | | | 129,716 | | |
Sovran Self Storage, Inc. REIT | | | 6,649 | | | | 433 | | |
Starwood Hotels & Resorts Worldwide, Inc. | | | 384,781 | | | | 30,571 | | |
Taubman Centers, Inc. REIT | | | 163,625 | | | | 10,459 | | |
Ventas, Inc. REIT | | | 394,280 | | | | 22,584 | | |
Vornado Realty Trust REIT | | | 706,711 | | | | 62,749 | | |
Winthrop Realty Trust REIT | | | 11,514 | | | | 127 | | |
| | | | 914,221 | | |
Total Common Stocks (Cost $1,936,695) | | | 2,061,834 | | |
Short-Term Investment (1.1%) | |
Investment Company (1.1%) | |
Morgan Stanley Institutional Liquidity
Funds — Treasury Portfolio —
Institutional Class (See Note G)
(Cost $24,177) | | | 24,177,448 | | | | 24,177 | | |
Total Investments (99.2%) (Cost $1,960,872) | | | 2,086,011 | | |
Other Assets in Excess of Liabilities (0.8%) | | | 16,250 | | |
Net Assets (100.0%) | | $ | 2,102,261 | | |
The accompanying notes are an integral part of the financial statements.
8
Morgan Stanley Institutional Fund, Inc.
Annual Report — December 31, 2013
Portfolio of Investments (cont'd)
Global Real Estate Portfolio
(a) Non-income producing security.
(b) Security trades on the Hong Kong exchange.
(c) Security has been deemed illiquid at December 31, 2013.
(d) At December 31, 2013, the Portfolio held fair valued securities valued at approximately $6,476,000, representing 0.3% of net assets. These securities have been fair valued as determined in good faith under procedures established by and under the general supervision of the Fund's Directors.
(e) Restricted security valued at fair value and not registered under the Securities Act of 1933, Exeter Industrial Value Fund, LP was acquired between 11/07 - 4/11 and has a current cost basis of approximately $1,511,000. KTR Industrial Fund II, LP was acquired between 1/09 - 5/12 and has a current cost basis of $2,605,000. At December 31, 2013, these securities had an aggregate market value of approximately $6,476,000 representing 0.3% of net assets.
CVA Certificaten Van Aandelen.
REIT Real Estate Investment Trust.
The accompanying notes are an integral part of the financial statements.
9
Morgan Stanley Institutional Fund, Inc.
Annual Report — December 31, 2013
Global Real Estate Portfolio
Statement of Assets and Liabilities | | December 31, 2013
(000) | |
Assets: | |
Investments in Securities of Unaffiliated Issuers, at Value (Cost $1,936,695) | | $ | 2,061,834 | | |
Investment in Security of Affiliated Issuer, at Value (Cost $24,177) | | | 24,177 | | |
Total Investments in Securities, at Value (Cost $1,960,872) | | | 2,086,011 | | |
Foreign Currency, at Value (Cost $4,872) | | | 4,881 | | |
Receivable for Portfolio Shares Sold | | | 49,937 | | |
Dividends Receivable | | | 6,566 | | |
Receivable for Investments Sold | | | 4,366 | | |
Tax Reclaim Receivable | | | 141 | | |
Receivable from Affiliate | | | 1 | | |
Other Assets | | | 3 | | |
Total Assets | | | 2,151,906 | | |
Liabilities: | |
Payable for Portfolio Shares Redeemed | | | 41,286 | | |
Payable for Advisory Fees | | | 4,519 | | |
Payable for Investments Purchased | | | 2,822 | | |
Payable for Sub Transfer Agency Fees | | | 416 | | |
Payable for Sub Transfer Agency Fees — Class I | | | 209 | | |
Payable for Sub Transfer Agency Fees — Class A* | | | 62 | | |
Payable for Sub Transfer Agency Fees — Class L | | | — | @ | |
Payable for Administration Fees | | | 141 | | |
Payable for Custodian Fees | | | 57 | | |
Payable for Shareholder Services Fees — Class A* | | | 20 | | |
Payable for Distribution and Shareholder Services Fees — Class L | | | 4 | | |
Payable for Professional Fees | | | 9 | | |
Payable for Transfer Agent Fees | | | 4 | | |
Payable for Transfer Agent Fees — Class I | | | 1 | | |
Payable for Transfer Agent Fees — Class A* | | | 1 | | |
Payable for Transfer Agent Fees — Class L | | | — | @ | |
Payable for Transfer Agent Fees — Class IS | | | — | @ | |
Other Liabilities | | | 94 | | |
Total Liabilities | | | 49,645 | | |
Net Assets | | $ | 2,102,261 | | |
Net Assets Consist Of: | |
Paid-in-Capital | | $ | 2,079,242 | | |
Distributions in Excess of Net Investment Income | | | (20,043 | ) | |
Accumulated Net Realized Loss | | | (82,082 | ) | |
Unrealized Appreciation (Depreciation) on: | |
Investments | | | 125,139 | | |
Foreign Currency Translations | | | 5 | | |
Net Assets | | $ | 2,102,261 | | |
The accompanying notes are an integral part of the financial statements.
10
Morgan Stanley Institutional Fund, Inc.
Annual Report — December 31, 2013
Global Real Estate Portfolio
Statement of Assets and Liabilities (cont'd) | | December 31, 2013
(000) | |
CLASS I: | |
Net Assets | | $ | 1,793,614 | | |
| Shares Outstanding $0.001 par value shares of beneficial interest (500,000,000 shares authorized) (not in 000's) | | | 181,020,270 | | |
Net Asset Value, Offering and Redemption Price Per Share | | $ | 9.91 | | |
CLASS A*: | |
Net Assets | | $ | 96,046 | | |
| Shares Outstanding $0.001 par value shares of beneficial interest (500,000,000 shares authorized) (not in 000's) | | | 9,736,277 | | |
Net Asset Value, Redemption Price Per Share | | $ | 9.86 | | |
Maximum Sales Load§§ | | | 5.25 | % | |
Maximum Sales Charge | | $ | 0.55 | | |
Maximum Offering Price Per Share | | $ | 10.41 | | |
CLASS L: | |
Net Assets | | $ | 5,844 | | |
| Shares Outstanding $0.001 par value shares of beneficial interest (500,000,000 shares authorized) (not in 000's) | | | 600,087 | | |
Net Asset Value, Offering and Redemption Price Per Share | | $ | 9.74 | | |
CLASS IS: | |
Net Assets | | $ | 206,757 | | |
| Shares Outstanding $0.001 par value shares of beneficial interest (500,000,000 shares authorized) (not in 000's) | | | 20,855,680 | | |
Net Asset Value, Offering and Redemption Price Per Share | | $ | 9.91 | | |
@ Amount is less than $500.
* Effective September 9, 2013, Class P and Class H shares were renamed Class A shares.
§§ Effective February 25, 2013, the Directors approved the imposition of a maximum initial sales charge of 5.25% on purchases of Class A shares of the Portfolio.
The accompanying notes are an integral part of the financial statements.
11
Morgan Stanley Institutional Fund, Inc.
Annual Report — December 31, 2013
Global Real Estate Portfolio
Statement of Operations | | Year Ended
December 31, 2013
(000) | |
Investment Income: | |
Dividends from Securities of Unaffiliated Issuers (Net of $2,622 of Foreign Taxes Withheld) | | $ | 60,114 | | |
Dividends from Security of Affiliated Issuer (Note G) | | | 10 | | |
Interest from Securities of Unaffiliated Issuers | | | — | @ | |
Total Investment Income | | | 60,124 | | |
Expenses: | |
Advisory Fees (Note B) | | | 18,270 | | |
Administration Fees (Note C) | | | 1,720 | | |
Sub Transfer Agency Fees | | | 784 | | |
Sub Transfer Agency Fees — Class I | | | 257 | | |
Sub Transfer Agency Fees — Class A* | | | 70 | | |
Sub Transfer Agency Fees — Class L | | | — | @ | |
Custodian Fees (Note F) | | | 325 | | |
Shareholder Services Fees — Class A* (Note D) | | | 320 | | |
Distribution and Shareholder Services Fees — Class L (Note D) | | | 54 | | |
Transfer Agency Fees (Note E) | | | 160 | | |
Transfer Agency Fees — Class I (Note E) | | | 2 | | |
Transfer Agency Fees — Class A* (Note E) | | | 1 | | |
Transfer Agency Fees — Class L (Note E) | | | — | @ | |
Transfer Agency Fees — Class IS (Note E) | | | — | @ | |
Shareholder Reporting Fees | | | 147 | | |
Professional Fees | | | 106 | | |
Registration Fees | | | 89 | | |
Directors' Fees and Expenses | | | 48 | | |
Pricing Fees | | | 16 | | |
Other Expenses | | | 69 | | |
Expenses Before Non Operating Expenses | | | 22,438 | | |
Bank Overdraft Expense | | | 8 | | |
Total Expenses | | | 22,446 | | |
Rebate from Morgan Stanley Affiliate (Note G) | | | (46 | ) | |
Waiver of Advisory Fees (Note B) | | | (20 | ) | |
Reimbursement of Class Specific Expenses — Class IS (Note B) | | | (— | @) | |
Net Expenses | | | 22,380 | | |
Net Investment Income | | | 37,744 | | |
Realized Gain (Loss): | |
Investments Sold | | | 96,173 | | |
Foreign Currency Transactions | | | (163 | ) | |
Net Realized Gain | | | 96,010 | | |
Change in Unrealized Appreciation (Depreciation): | |
Investments | | | (66,235 | ) | |
Foreign Currency Translations | | | (21 | ) | |
Net Change in Unrealized Appreciation (Depreciation) | | | (66,256 | ) | |
Net Realized Gain and Change in Unrealized Appreciation (Depreciation) | | | 29,754 | | |
Net Increase in Net Assets Resulting from Operations | | $ | 67,498 | | |
@ Amount is less than $500.
* Effective September 9, 2013, Class P shares were renamed Class A shares.
The accompanying notes are an integral part of the financial statements.
12
Morgan Stanley Institutional Fund, Inc.
Annual Report — December 31, 2013
Global Real Estate Portfolio
Statements of Changes in Net Assets | | Year Ended
December 31,
2013
(000) | | Year Ended
December 31,
2012
(000) | |
Increase (Decrease) in Net Assets: | |
Operations: | |
Net Investment Income | | $ | 37,744 | | | $ | 34,149 | | |
Net Realized Gain | | | 96,010 | | | | 59,686 | | |
Net Change in Unrealized Appreciation (Depreciation) | | | (66,256 | ) | | | 370,607 | | |
Net Increase in Net Assets Resulting from Operations | | | 67,498 | | | | 464,442 | | |
Distributions from and/or in Excess of: | |
Class I: | |
Net Investment Income | | | (37,150 | ) | | | (63,536 | ) | |
Class A*: | |
Net Investment Income | | | (1,584 | ) | | | (5,488 | ) | |
Class H@: | |
Net Investment Income | | | — | | | | (360 | ) | |
Class L: | |
Net Investment Income | | | (69 | ) | | | (191 | ) | |
Class IS: | |
Net Investment Income | | | (3,196 | )*** | | | — | | |
Total Distributions | | | (41,999 | ) | | | (69,575 | ) | |
Capital Share Transactions:(1) | |
Class I: | |
Subscribed | | | 498,648 | | | | 384,506 | | |
Distributions Reinvested | | | 34,732 | | | | 57,311 | | |
Redeemed | | | (648,305 | ) | | | (257,050 | ) | |
Class A*: | |
Subscribed | | | 27,827 | | | | 51,311 | | |
Distributions Reinvested | | | 1,506 | | | | 5,339 | | |
Conversion from Class H | | | 12,381 | | | | — | | |
Redeemed | | | (121,287 | ) | | | (48,055 | ) | |
Class H@: | |
Subscribed | | | 1,889 | ** | | | 511 | | |
Distributions Reinvested | | | — | | | | 360 | | |
Conversion to Class A | | | (12,381 | )** | | | — | | |
Redeemed | | | (761 | )** | | | (1,041 | ) | |
Class L: | |
Subscribed | | | 759 | | | | 284 | | |
Distributions Reinvested | | | 69 | | | | 167 | | |
Redeemed | | | (2,174 | ) | | | (1,388 | ) | |
Class IS: | |
Subscribed | | | 210,927 | *** | | | — | | |
Distributions Reinvested | | | 2,371 | *** | | | — | | |
Redeemed | | | (331 | )*** | | | — | | |
Net Increase in Net Assets Resulting from Capital Share Transactions | | | 5,870 | | | | 192,255 | | |
Total Increase in Net Assets | | | 31,369 | | | | 587,122 | | |
Net Assets: | |
Beginning of Period | | | 2,070,892 | | | | 1,483,770 | | |
End of Period (Including Distributions in Excess of Net Investment Income of $(20,043) and $(28,300)) | | $ | 2,102,261 | | | $ | 2,070,892 | | |
The accompanying notes are an integral part of the financial statements.
13
Morgan Stanley Institutional Fund, Inc.
Annual Report — December 31, 2013
Global Real Estate Portfolio
Statements of Changes in Net Assets (cont'd) | | Year Ended
December 31,
2013
(000) | | Year Ended
December 31,
2012
(000) | |
(1) Capital Share Transactions: | |
Class I: | |
Shares Subscribed | | | 48,739 | | | | 42,933 | | |
Shares Issued on Distributions Reinvested | | | 3,592 | | | | 6,001 | | |
Shares Redeemed | | | (63,843 | ) | | | (28,625 | ) | |
Net Increase (Decrease) in Class I Shares Outstanding | | | (11,512 | ) | | | 20,309 | | |
Class A*: | |
Shares Subscribed | | | 2,787 | | | | 5,717 | | |
Shares Issued on Distributions Reinvested | | | 156 | | | | 561 | | |
Conversion from Class H | | | 1,279 | | | | — | | |
Shares Redeemed | | | (12,120 | ) | | | (5,487 | ) | |
Net Increase (Decrease) in Class A Shares Outstanding | | | (7,898 | ) | | | 791 | | |
Class H@: | |
Shares Subscribed | | | 180 | ** | | | 59 | | |
Shares Issued on Distributions Reinvested | | | — | | | | 38 | | |
Conversion to Class A | | | (1,281 | )** | | | — | | |
Shares Redeemed | | | (77 | )** | | | (118 | ) | |
Net Decrease in Class H Shares Outstanding | | | (1,178 | )** | | | (21 | ) | |
Class L: | |
Shares Subscribed | | | 74 | | | | 30 | | |
Shares Issued on Distributions Reinvested | | | 7 | | | | 18 | | |
Shares Redeemed | | | (216 | ) | | | (154 | ) | |
Net Decrease in Class L Shares Outstanding | | | (135 | ) | | | (106 | ) | |
Class IS: | |
Shares Subscribed | | | 20,644 | *** | | | — | | |
Shares Issued on Distributions Reinvested | | | 245 | *** | | | — | | |
Shares Redeemed | | | (33 | )*** | | | — | | |
Net Increase in Class IS Shares Outstanding | | | 20,856 | | | | — | | |
@ Effective September 9, 2013, Class H shares converted into Class A shares.
* Effective September 9, 2013, Class P shares were renamed Class A shares.
** For the period January 1, 2013 through September 6, 2013.
*** For the period September 13, 2013 through December 31, 2013.
The accompanying notes are an integral part of the financial statements.
14
Morgan Stanley Institutional Fund, Inc.
Annual Report — December 31, 2013
Financial Highlights
Global Real Estate Portfolio
| | | Class I | |
| | | Year Ended December 31, | |
Selected Per Share Data and Ratios | | 2013 | | 2012 | | 2011 | | 2010 | | 2009 | |
Net Asset Value, Beginning of Period | | $ | 9.77 | | | $ | 7.77 | | | $ | 8.78 | | | $ | 7.47 | | | $ | 5.49 | | |
Income (Loss) from Investment Operations: | |
Net Investment Income† | | | 0.18 | | | | 0.17 | | | | 0.14 | | | | 0.19 | | | | 0.14 | | |
Net Realized and Unrealized Gain (Loss) | | | 0.16 | | | | 2.17 | | | | (0.99 | ) | | | 1.31 | | | | 2.11 | | |
Total from Investment Operations | | | 0.34 | | | | 2.34 | | | | (0.85 | ) | | | 1.50 | | | | 2.25 | | |
Distributions from and/or in Excess of: | |
Net Investment Income | | | (0.20 | ) | | | (0.34 | ) | | | (0.16 | ) | | | (0.19 | ) | | | (0.27 | ) | |
Redemption Fees | | | — | | | | — | | | | — | | | | — | | | | 0.00 | ‡ | |
Net Asset Value, End of Period | | $ | 9.91 | | | $ | 9.77 | | | $ | 7.77 | | | $ | 8.78 | | | $ | 7.47 | | |
Total Return++ | | | 3.55 | % | | | 30.19 | % | | | (9.67 | )% | | | 20.22 | % | | | 41.04 | % | |
Ratios and Supplemental Data: | |
Net Assets, End of Period (Thousands) | | $ | 1,793,614 | | | $ | 1,880,999 | | | $ | 1,337,853 | | | $ | 1,215,881 | | | $ | 638,744 | | |
Ratio of Expenses to Average Net Assets | | | 1.02 | %+ | | | 1.02 | %+†† | | | 1.04 | %+†† | | | 1.01 | %+†† | | | 1.01 | %+ | |
Ratio of Expenses to Average Net Assets Excluding Non Operating Expenses | | | 1.02 | %+ | | | N/A | | | | N/A | | | | 1.01 | %+†† | | | 1.01 | %+ | |
Ratio of Net Investment Income to Average Net Assets | | | 1.77 | %+ | | | 2.42 | %+†† | | | 2.12 | %+†† | | | 2.43 | %+†† | | | 2.31 | %+ | |
Ratio of Rebate from Morgan Stanley Affiliates to Average Net Assets | | | 0.00 | %§ | | | 0.00 | %††§ | | | 0.00 | %††§ | | | 0.00 | %††§ | | | 0.00 | %§ | |
Portfolio Turnover Rate | | | 33 | % | | | 29 | % | | | 28 | % | | | 18 | % | | | 59 | % | |
† Per share amount is based on average shares outstanding.
‡ Amount is less than $0.005 per share.
++ Calculated based on the net asset value as of the last business day of the period.
+ The Ratios of Expenses and Net Investment Income reflect the rebate of certain Portfolio expenses in connection with the investments in Morgan Stanley affiliates during the period. The effect of the rebate on the ratios is disclosed in the above table as "Ratio of Rebate from Morgan Stanley Affiliates to Average Net Assets."
†† Reflects overall Portfolio ratios for investment income and non-class specific expenses.
§ Amount is less than 0.005%.
The accompanying notes are an integral part of the financial statements.
15
Morgan Stanley Institutional Fund, Inc.
Annual Report — December 31, 2013
Financial Highlights
Global Real Estate Portfolio
| | | Class A@ | |
| | | Year Ended December 31, | |
Selected Per Share Data and Ratios | | 2013 | | 2012 | | 2011 | | 2010 | | 2009 | |
Net Asset Value, Beginning of Period | | $ | 9.72 | | | $ | 7.73 | | | $ | 8.74 | | | $ | 7.44 | | | $ | 5.47 | | |
Income (Loss) from Investment Operations: | |
Net Investment Income† | | | 0.15 | | | | 0.15 | | | | 0.12 | | | | 0.17 | | | | 0.13 | | |
Net Realized and Unrealized Gain (Loss) | | | 0.15 | | | | 2.16 | | | | (0.98 | ) | | | 1.30 | | | | 2.09 | | |
Total from Investment Operations | | | 0.30 | | | | 2.31 | | | | (0.86 | ) | | | 1.47 | | | | 2.22 | | |
Distributions from and/or in Excess of: | |
Net Investment Income | | | (0.16 | ) | | | (0.32 | ) | | | (0.15 | ) | | | (0.17 | ) | | | (0.25 | ) | |
Redemption Fees | | | — | | | | — | | | | — | | | | — | | | | 0.00 | ‡ | |
Net Asset Value, End of Period | | $ | 9.86 | | | $ | 9.72 | | | $ | 7.73 | | | $ | 8.74 | | | $ | 7.44 | | |
Total Return++ | | | 3.18 | % | | | 29.93 | % | | | (9.91 | )% | | | 19.90 | % | | | 40.66 | % | |
Ratios and Supplemental Data: | |
Net Assets, End of Period (Thousands) | | $ | 96,046 | | | $ | 171,413 | | | $ | 130,244 | | | $ | 67,812 | | | $ | 52,663 | | |
Ratio of Expenses to Average Net Assets (1) | | | 1.30 | %+^ | | | 1.27 | %+†† | | | 1.29 | %+†† | | | 1.26 | %+†† | | | 1.26 | %+ | |
Ratio of Expenses to Average Net Assets Excluding Non Operating Expenses | | | 1.30 | %+^ | | | N/A | | | | N/A | | | | 1.26 | %+†† | | | 1.26 | %+ | |
Ratio of Net Investment Income to Average Net Assets (1) | | | 1.43 | %+ | | | 2.17 | %+†† | | | 1.87 | %+†† | | | 2.18 | %+†† | | | 2.08 | %+ | |
Ratio of Rebate from Morgan Stanley Affiliates to Average Net Assets | | | 0.00 | %§ | | | 0.00 | %††§ | | | 0.00 | %††§ | | | 0.00 | %††§ | | | 0.00 | %§ | |
Portfolio Turnover Rate | | | 33 | % | | | 29 | % | | | 28 | % | | | 18 | % | | | 59 | % | |
(1) Supplemental Information on the Ratios to Average Net Assets: | |
Ratios Before Expense Limitation: | |
Expenses to Average Net Assets | | | 1.32 | % | | | N/A | | | | 1.29 | % | | | N/A | | | | N/A | | |
Net Investment Income to Average Net Assets | | | 1.41 | % | | | N/A | | | | 1.87 | % | | | N/A | | | | N/A | | |
@ Effective September 9, 2013, Class P and Class H shares were renamed Class A shares.
† Per share amount is based on average shares outstanding.
‡ Amount is less than $0.005 per share.
++ Calculated based on the net asset value which does not reflect sales charges, if applicable, as of the last business day of the period.
+ The Ratios of Expenses and Net Investment Income reflect the rebate of certain Portfolio expenses in connection with the investments in Morgan Stanley affiliates during the period. The effect of the rebate on the ratios is disclosed in the above table as "Ratio of Rebate from Morgan Stanley Affiliates to Average Net Assets."
^ Effective September 16, 2013, the Adviser has agreed to limit the ratio of expenses to average net assets to the maximum ratio of 1.40% for Class A shares. Prior to September 16, 2013, the maximum ratio was 1.30% for Class A shares.
†† Reflects overall Portfolio ratios for investment income and non-class specific expenses.
§ Amount is less than 0.005%.
The accompanying notes are an integral part of the financial statements.
16
Morgan Stanley Institutional Fund, Inc.
Annual Report — December 31, 2013
Financial Highlights
Global Real Estate Portfolio
| | | Class L | |
| | | Year Ended December 31, | |
Selected Per Share Data and Ratios | | 2013 | | 2012 | | 2011 | | 2010 | | 2009 | |
Net Asset Value, Beginning of Period | | $ | 9.59 | | | $ | 7.63 | | | $ | 8.62 | | | $ | 7.35 | | | $ | 5.43 | | |
Income (Loss) from Investment Operations: | |
Net Investment Income† | | | 0.10 | | | | 0.10 | | | | 0.07 | | | | 0.13 | | | | 0.08 | | |
Net Realized and Unrealized Gain (Loss) | | | 0.16 | | | | 2.13 | | | | (0.96 | ) | | | 1.28 | | | | 2.08 | | |
Total from Investment Operations | | | 0.26 | | | | 2.23 | | | | (0.89 | ) | | | 1.41 | | | | 2.16 | | |
Distributions from and/or in Excess of: | |
Net Investment Income | | | (0.11 | ) | | | (0.27 | ) | | | (0.10 | ) | | | (0.14 | ) | | | (0.24 | ) | |
Redemption Fees | | | — | | | | — | | | | — | | | | — | | | | 0.00 | ‡ | |
Net Asset Value, End of Period | | $ | 9.74 | | | $ | 9.59 | | | $ | 7.63 | | | $ | 8.62 | | | $ | 7.35 | | |
Total Return++ | | | 2.77 | % | | | 29.26 | % | | | (10.33 | )% | | | 19.26 | % | | | 39.91 | % | |
Ratios and Supplemental Data: | |
Net Assets, End of Period (Thousands) | | $ | 5,844 | | | $ | 7,050 | | | $ | 6,418 | | | $ | 5,043 | | | $ | 1,603 | | |
Ratio of Expenses to Average Net Assets (1) | | | 1.77 | %+^ | | | 1.77 | %+†† | | | 1.79 | %+†† | | | 1.76 | %+†† | | | 1.76 | %+ | |
Ratio of Expenses to Average Net Assets Excluding Non Operating Expenses | | | 1.77 | %+^ | | | N/A | | | | N/A | | | | 1.76 | %+†† | | | 1.76 | %+ | |
Ratio of Net Investment Income to Average Net Assets (1) | | | 0.98 | %+ | | | 1.67 | %+†† | | | 1.37 | %+†† | | | 1.68 | %+†† | | | 1.23 | %+ | |
Ratio of Rebate from Morgan Stanley Affiliates to Average Net Assets | | | 0.00 | %§ | | | 0.00 | %††§ | | | 0.00 | %††§ | | | 0.00 | %††§ | | | 0.00 | %§ | |
Portfolio Turnover Rate | | | 33 | % | | | 29 | % | | | 28 | % | | | 18 | % | | | 59 | % | |
(1) Supplemental Information on the Ratios to Average Net Assets: | |
Ratios Before Expense Limitation: | |
Expenses to Average Net Assets | | | N/A | | | | N/A | | | | 1.79 | % | | | N/A | | | | N/A | | |
Net Investment Income to Average Net Assets | | | N/A | | | | N/A | | | | 1.37 | % | | | N/A | | | | N/A | | |
† Per share amount is based on average shares outstanding.
‡ Amount is less than $0.005 per share.
++ Calculated based on the net asset value as of the last business day of the period.
+ The Ratios of Expenses and Net Investment Income reflect the rebate of certain Portfolio expenses in connection with the investments in Morgan Stanley affiliates during the period. The effect of the rebate on the ratios is disclosed in the above table as "Ratio of Rebate from Morgan Stanley Affiliates to Average Net Assets."
^ Effective September 16, 2013, the Adviser has agreed to limit the ratio of expenses to average net assets to the maximum ratio of 1.90% for Class L shares. Prior to September 16, 2013, the maximum ratio was 1.80% for Class L shares.
†† Reflects overall Portfolio ratios for investment income and non-class specific expenses.
§ Amount is less than 0.005%.
The accompanying notes are an integral part of the financial statements.
17
Morgan Stanley Institutional Fund, Inc.
Annual Report — December 31, 2013
Financial Highlights
Global Real Estate Portfolio
| | | Class IS | |
Selected Per Share Data and Ratios | | Period from
September 13, 2013^ to
December 31, 2013 | |
Net Asset Value, Beginning of Period | | $ | 10.01 | | |
Income (Loss) from Investment Operations: | |
Net Investment Income† | | | 0.08 | | |
Net Realized and Unrealized Loss | | | 0.02 | | |
Total from Investment Operations | | | 0.10 | | |
Distributions from and/or in Excess of: | |
Net Investment Income | | | (0.20 | ) | |
Net Asset Value, End of Period | | $ | 9.91 | | |
Total Return++ | | | 1.08 | %# | |
Ratios and Supplemental Data: | |
Net Assets, End of Period (Thousands) | | $ | 206,757 | | |
Ratio of Expenses to Average Net Assets (1) | | | 0.96 | %+^^* | |
Ratio of Net Investment Income to Average Net Assets (1) | | | 2.88 | %+* | |
Ratio of Rebate from Morgan Stanley Affiliates to Average Net Assets | | | 0.00 | %§* | |
Portfolio Turnover Rate | | | 33 | %# | |
(1) Supplemental Information on the Ratios to Average Net Assets: | |
Ratios Before Expense Limitation: | |
Expenses to Average Net Assets | | | 0.97 | %* | |
Net Investment Loss to Average Net Assets | | | 2.87 | %* | |
^ Commencement of Operations.
† Per share amount is based on average shares outstanding.
++ Calculated based on the net asset value as of the last business day of the period.
+ The Ratios of Expenses and Net Investment Income reflect the rebate of certain Portfolio expenses in connection with the investments in Morgan Stanley affiliates during the period. The effect of the rebate on the ratios is disclosed in the above table as "Ratio of Rebate from Morgan Stanley Affiliates to Average Net Assets."
^^ Effective September 16, 2013, the Adviser has agreed to limit the ratio of expenses to average net assets to the maximum ratio of 0.99% for Class IS shares.
§ Amount is less than 0.005%.
# Not Annualized.
* Annualized.
The accompanying notes are an integral part of the financial statements.
18
Morgan Stanley Institutional Fund, Inc.
Annual Report — December 31, 2013
Notes to Financial Statements
Morgan Stanley Institutional Fund, Inc. (the "Fund") is registered under the Investment Company Act of 1940, as amended (the "Act"), as an open-end management investment company. The Fund is comprised of twenty-seven separate, active, diversified and non-diversified portfolios (individually referred to as a "Portfolio", collectively as the "Portfolios").
The accompanying financial statements relate to the Global Real Estate Portfolio. The Portfolio's adviser, Morgan Stanley Investment Management Inc. (the "Adviser") and sub-advisers, Morgan Stanley Investment Management Limited ("MSIM Limited") and Morgan Stanley Investment Management Company ("MSIM Company") (together, the "Sub-Advisers"), seek to provide current income and capital appreciation by investing primarily in equity securities of companies in the real estate industry located throughout the world, including real estate operating companies ("REOCs"), real estate investment trusts ("REITs") and similar entities established outside of the U.S. (foreign real estate companies). The Portfolio offers four classes of shares — Class I, Class A, Class L and Class IS.
On September 16, 2013, the Portfolio commenced offering Class IS shares. Effective September 9, 2013, Class P and Class H shares were renamed Class A shares.
A. Significant Accounting Policies: The following significant accounting policies are in conformity with U.S. generally accepted accounting principles ("GAAP"). Such policies are consistently followed by the Fund in the preparation of its financial statements. GAAP may require management to make estimates and assumptions that affect the reported amounts and disclosures in the financial statements. Actual results may differ from those estimates.
1. Security Valuation: (1) An equity portfolio security listed or traded on an exchange is valued at its latest reported sales price (or at the exchange official closing price if such exchange reports an official closing price), if there were no sales on a given day, the security is valued at the mean between the last reported bid and asked prices; (2) all other equity portfolio securities for which over-the-counter market quotations are readily available are valued at its latest reported sales price. In cases where a security is traded on more than one exchange, the security is valued on the exchange designated as the primary market; (3) when market quotations are not readily available, including circumstances under which the Adviser determines that the closing price, last sale price or the mean between the last reported bid and asked prices are not reflective of a security's market value, portfolio
securities are valued at their fair value as determined in good faith under procedures established by and under the general supervision of the Fund's Board of Directors (the "Directors"). Occasionally, developments affecting the closing prices of securities and other assets may occur between the times at which valuations of such securities are determined (that is, close of the foreign market on which the securities trade) and the close of business of the New York Stock Exchange ("NYSE"). If developments occur during such periods that are expected to materially affect the value of such securities, such valuations may be adjusted to reflect the estimated fair value of such securities as of the close of the NYSE, as determined in good faith by the Directors or by the Adviser using a pricing service and/or procedures approved by the Directors; (4) quotations of foreign portfolio securities, other assets and liabilities and forward contracts stated in foreign currency are translated into U.S. dollar equivalents at the prevailing market rates prior to the close of the NYSE; (5) investments in mutual funds, including the Morgan Stanley Institutional Liquidity Funds, are valued at the net asset value as of the close of each business day; and (6) short-term debt securities with remaining maturities of 60 days or less at the time of purchase may be valued at amortized cost, unless the Adviser determines such valuation does not reflect the securities' market value, in which case these securities will be valued at their fair market value determined by the Adviser.
Under procedures approved by the Directors, the Fund's Adviser has formed a Valuation Committee. The Valuation Committee provides administration and oversight of the Fund's valuation policies and procedures, which are reviewed at least annually by the Directors. These procedures allow the Fund to utilize independent pricing services, quotations from securities and financial instrument dealers, and other market sources to determine fair value.
The Fund has procedures to determine the fair value of securities and other financial instruments for which market prices are not readily available. Under these procedures, the Valuation Committee convenes on a regular and ad hoc basis to review such securities and considers a number of factors, including valuation methodologies and significant unobservable valuation inputs, when arriving at fair value. The Valuation Committee may employ a market-based approach which
19
Morgan Stanley Institutional Fund, Inc.
Annual Report — December 31, 2013
Notes to Financial Statements (cont'd)
may use related or comparable assets or liabilities, recent transactions, market multiples, book values, and other relevant information for the investment to determine the fair value of the investment. An income-based valuation approach may also be used in which the anticipated future cash flows of the investment are discounted to calculate fair value. Discounts may also be applied due to the nature or duration of any restrictions on the disposition of the investments. Due to the inherent uncertainty of valuations of such investments, the fair values may differ significantly from the values that would have been used had an active market existed. The Valuation Committee employs various methods for calibrating these valuation approaches including a regular review of valuation methodologies, key inputs and assumptions, transactional back-testing or disposition analysis, and reviews of any related market activity.
The Portfolio invests a significant portion of its assets in securities of REITs. The market's perception of prospective declines in private real estate values and other financial assets may result in increased volatility of market prices that can negatively impact the valuation of certain issuers held by the Portfolio.
2. Fair Value Measurement: Financial Accounting Standards Board ("FASB") Accounting Standards CodificationTM ("ASC") 820, "Fair Value Measurements and Disclosures" ("ASC 820"), defines fair value as the value that the Fund would receive to sell an investment or pay to transfer a liability in a timely transaction with an independent buyer in the principal market, or in the absence of a principal market the most advantageous market for the investment or liability. ASC 820 establishes a three-tier hierarchy to distinguish between (1) inputs that reflect the assumptions market participants would use in valuing an asset or liability developed based on market data obtained from sources independent of the reporting entity (observable inputs) and (2) inputs that reflect the reporting entity's own assumptions about the assumptions market participants would use in valuing an asset or liability developed based on the best information available in the circumstances (unobservable inputs) and to establish classification of fair value measurements for disclosure purposes. Various inputs are used in determining the value of the Fund's investments. The inputs are summarized in the three broad levels listed below.
• Level 1 – unadjusted quoted prices in active markets for identical investments
• Level 2 – other significant observable inputs (including quoted prices for similar investments, interest rates, prepayment speeds, credit risk, etc.)
• Level 3 – significant unobservable inputs including the Fund's own assumptions in determining the fair value of investments. Factors considered in making this determination may include, but are not limited to, information obtained by contacting the issuer, analysts, or the appropriate stock exchange (for exchange-traded securities), analysis of the issuer's financial statements or other available documents and, if necessary, available information concerning other securities in similar circumstances
The inputs or methodology used for valuing securities are not necessarily an indication of the risk associated with investing in those securities and the determination of the significance of a particular input to the fair value measurement in its entirety requires judgment and considers factors specific to each security.
The following is a summary of the inputs used to value the Portfolio's investments as of December 31, 2013.
| Investment Type | | Level 1
Unadjusted
quoted
prices
(000) | | Level 2
Other
significant
observable
inputs
(000) | | Level 3
Significant
unobservable
inputs
(000) | | Total
(000) | |
Assets: | |
Common Stocks | |
Diversified | | $ | 703,859 | | | $ | — | | | $ | — | † | | $ | 703,859 | | |
Health Care | | | 92,585 | | | | — | | | | — | | | | 92,585 | | |
Industrial | | | 76,695 | | | | — | | | | 6,476 | | | | 83,171 | | |
Lodging/Resorts | | | 98,601 | | | | — | | | | — | | | | 98,601 | | |
Mixed Industrial/Office | | | 17,308 | | | | — | | | | — | | | | 17,308 | | |
Office | | | 218,995 | | | | — | | | | — | | | | 218,995 | | |
Residential | | | 236,725 | | | | — | | | | — | | | | 236,725 | | |
Retail | | | 555,491 | | | | — | | | | — | | | | 555,491 | | |
Self Storage | | | 55,099 | | | | — | | | | — | | | | 55,099 | | |
Total Common Stocks | | | 2,055,358 | | | | — | | | | 6,476 | † | | | 2,061,834 | | |
Short-Term Investment | |
Investment Company | | | 24,177 | | | | — | | | | — | | | | 24,177 | | |
Total Assets | | $ | 2,079,535 | | | $ | — | | | $ | 6,476 | † | | $ | 2,086,011 | | |
† Includes one security which is valued at zero.
Transfers between investment levels may occur as the markets fluctuate and/or the availability of data used in an investment's valuation changes. The Portfolio recognizes transfers between the levels as of the end of the period. As of December 31, 2013, securities with a total value of approximately $1,041,822,000 transferred from Level 2 to
20
Morgan Stanley Institutional Fund, Inc.
Annual Report — December 31, 2013
Notes to Financial Statements (cont'd)
Level 1. At December 31, 2012, the fair value of certain securities were adjusted due to developments which occurred between the time of the close of the foreign markets on which they trade and the close of business on the NYSE which resulted in their Level 2 classification.
Following is a reconciliation of investments in which significant unobservable inputs (Level 3) were used in determining fair value.
| | | Common
Stocks
(000) | |
Beginning Balance | | $ | 13,745 | † | |
Purchases | | | 663 | | |
Sales | | | — | | |
Amortization of discount | | | — | | |
Transfers in | | | — | | |
Transfers out | | | — | | |
Corporate Actions | | | (10,148 | ) | |
Change in unrealized appreciation/depreciation | | | 313 | | |
Realized gains (losses) | | | 1,903 | | |
Ending Balance | | $ | 6,476 | † | |
Net change in unrealized appreciation/depreciation from investments
still held as of December 31, 2013 | | $ | 313 | | |
† Includes one or more securities which are valued at zero.
The following table presents additional information about valuation techniques and inputs used for investments that are measured at fair value and categorized within Level 3 as of December 31, 2013.
| | | Fair Value at
December 31,
2013
(000) | |
Valuation
Technique | |
Unobservable
Input | |
Industrial | |
Common
Stocks
| | $ | 6,476
| | | Reported Capital Balance,
Adjusted for Subsequent
Capital Calls and Return
of Capital, as applicable | | Adjusted Capital
Balance
| |
3. Foreign Currency Translation and Foreign Investments: The books and records of the Portfolio are maintained in U.S. dollars. Foreign currency amounts are translated into U.S. dollars as follows:
– investments, other assets and liabilities at the prevailing rate of exchange on the valuation date;
– investment transactions and investment income at the prevailing rates of exchange on the dates of such transactions.
Although the net assets of the Portfolio are presented at the foreign exchange rates and market values at the close
of the period, the Portfolio does not isolate that portion of the results of operations arising as a result of changes in the foreign exchange rates from the fluctuations arising from changes in the market prices of securities held at period end. Similarly, the Portfolio does not isolate the effect of changes in foreign exchange rates from the fluctuations arising from changes in the market prices of securities sold during the period. Accordingly, realized and unrealized foreign currency gains (losses) on investments in securities are included in the reported net realized and unrealized gains (losses) on investment transactions and balances. However, pursuant to U.S. Federal income tax regulations, gains and losses from certain foreign currency transactions and the foreign currency portion of gains and losses realized on sales and maturities of foreign denominated debt securities are treated as ordinary income for U.S. Federal income tax purposes.
Net realized gains (losses) on foreign currency transactions represent net foreign exchange gains (losses) from foreign currency forward exchange contracts, disposition of foreign currencies, currency gains (losses) realized between the trade and settlement dates on securities transactions, and the difference between the amount of investment income and foreign withholding taxes recorded on the Portfolio's books and the U.S. dollar equivalent amounts actually received or paid. Net unrealized currency gains (losses) from valuing foreign currency denominated assets and liabilities at period end exchange rates are reflected as a component of unrealized appreciation (depreciation) on the Statement of Assets and Liabilities. The change in unrealized currency gains (losses) on foreign currency translations for the period is reflected in the Statement of Operations.
Foreign security and currency transactions may involve certain considerations and risks not typically associated with those of U.S. dollar denominated transactions as a result of, among other factors, fluctuations of exchange rates in relation to the U.S. dollar, the possibility of lower levels of governmental supervision and regulation of foreign securities markets and the possibility of political or economic instability.
The net assets of the Portfolio include foreign denominated securities and currency. Changes in currency exchange rates will affect the U.S. Dollar value of and investment income from such securities.
21
Morgan Stanley Institutional Fund, Inc.
Annual Report — December 31, 2013
Notes to Financial Statements (cont'd)
Governmental approval for foreign investments may be required in advance of making an investment under certain circumstances in some countries, and the extent of foreign investments in domestic companies may be subject to limitation in other countries. Foreign ownership limitations also may be imposed by the charters of individual companies to prevent, among other concerns, violations of foreign investment limitations. As a result, an additional class of shares (identified as "Foreign" in the Portfolio of Investments) may be created and offered for investment. The "local" and "foreign shares" market values may differ. In the absence of trading of the foreign shares in such markets, the Portfolio values the foreign shares at the closing exchange price of the local shares.
4. Unfunded Commitments: Subject to the terms of a Subscription Agreement between the Portfolio and Exeter Industrial Value Fund LP, the Portfolio has made a subscription commitment of $2,000,000 for which it will receive 2,000,000 shares of common stock. As of December 31, 2013, Exeter Industrial Value Fund LP has drawn down approximately $1,860,000 which represents 93.0% of the commitment.
Subject to the terms of a Subscription Agreement between the Portfolio and KTR Industrial Fund II LP, the Portfolio has made a subscription commitment of $5,000,000 for which it will receive 5,000,000 shares of common stock. As of December 31, 2013, KTR Industrial Fund II LP has drawn down approximately $4,598,000 which represents 92.0% of the commitment.
5. Restricted Securities: The Portfolio invests in unregistered or otherwise restricted securities. The term "restricted securities" refers to securities that are unregistered or are held by control persons of the issuer and securities that are subject to contractual restrictions on their resale. As a result, restricted securities may be more difficult to value and the Portfolio may have difficulty disposing of such assets either in a timely manner or for a reasonable price. In order to dispose of an unregistered security, the Portfolio, where it has contractual rights to do so, may have to cause such security to be registered. A considerable period may elapse between the time the decision is made to sell the security and the time the security is registered so that the Portfolio could sell it. Contractual restrictions on the resale of securities vary in length and
scope and are generally the result of a negotiation between the issuer and acquirer of the securities. The Portfolio would, in either case, bear market risks during that period. Restricted Securities are identified in the Portfolio of Investments.
6. Indemnifications: The Fund enters into contracts that contain a variety of indemnifications. The Fund's maximum exposure under these arrangements is unknown. However, the Fund has not had prior claims or losses pursuant to these contracts and expects the risk of loss to be remote.
7. Dividends and Distributions to Shareholders: Dividend income and distributions to shareholders are recorded on the ex-dividend date. Dividends from net investment income, if any, are declared and paid semiannually. Net realized capital gains, if any, are distributed at least annually.
8. Security Transactions, Income and Expenses: Security transactions are accounted for on the trade date (date the order to buy or sell is executed). Realized gains and losses on the sale of investment securities are determined on the specific identified cost method. Dividend income and other distributions are recorded on the ex-dividend date (except for certain foreign dividends which may be recorded as soon as the Portfolio is informed of such dividends) net of applicable withholding taxes. Interest income is recognized on the accrual basis except where collection is in doubt. Discounts are accreted and premiums are amortized over the life of the respective securities. Most expenses of the Fund can be directly attributed to a particular Portfolio. Expenses which cannot be directly attributed are apportioned among the Portfolios based upon relative net assets or other appropriate methods. Income, expenses (other than class specific expenses — distribution, transfer agency and sub transfer agency fees) and realized and unrealized gains or losses are allocated to each class of shares based upon their relative net assets.
The Portfolio owns shares of REITs which report information on the source of their distributions annually in the following calendar year. A portion of distributions received from REITs during the year is estimated to be a return of capital and is recorded as a reduction of their cost.
22
Morgan Stanley Institutional Fund, Inc.
Annual Report — December 31, 2013
Notes to Financial Statements (cont'd)
B. Advisory/Sub-Advisory Fees: The Adviser, a wholly-owned subsidiary of Morgan Stanley, provides the Portfolio with advisory services under the terms of an Investment Advisory Agreement, paid quarterly, at the annual rate based on the average daily net assets as follows:
First $2.5
billion | | Over $2.5
billion | |
| | 0.85 | % | | | 0.80 | % | |
For the year ended December 31, 2013, the advisory fee rate (net of waivers/rebate) was equivalent to an annual effective rate of 0.85% of the Portfolio's daily net assets.
The Adviser has agreed to reduce its advisory fee and/or reimburse the Portfolio so that total annual portfolio operating expenses, excluding certain investment related expenses, taxes, interest and other extraordinary expenses (including litigation), will not exceed 1.05% for Class I shares, 1.30% for Class A shares and 1.80% for Class L shares. Effective September 16, 2013, the Adviser has agreed to limit the ratio of expenses to average net assets to the maximum ratio of 1.40%, 1.90% and 0.99% for Class A, Class L and Class IS shares, respectively. The fee waivers and/or expense reimbursements will continue for at least one year or until such time that the Directors act to discontinue all or a portion of such waivers and/or reimbursements when it deems such action is appropriate. For the year ended December 31, 2013, approximately $20,000 of advisory fees were waived and less than $500 of other expenses were reimbursed by the Adviser pursuant to this arrangement.
The Adviser has entered into a Sub-Advisory Agreement with the Sub-Advisers, each a wholly-owned subsidiary of Morgan Stanley. The Sub-Advisers provide the Portfolio with advisory services subject to the overall supervision of the Adviser and the Fund's Officers and Directors. The Adviser pays the Sub-Advisers on a monthly basis a portion of the net advisory fees the Adviser receives from the Portfolio.
C. Administration Fees: The Adviser also serves as Administrator to the Fund and provides administrative services pursuant to an Administration Agreement for an annual fee, accrued daily and paid monthly, of 0.08% of the Portfolio's average daily net assets. Under a Sub-Administration Agreement between the Administrator and State Street Bank and Trust Company ("State Street"), State Street provides certain administrative services to the Fund. For such services, the Administrator pays State Street a portion of the fee the Administrator receives from the Portfolio.
D. Distribution and Shareholder Services Fees: Morgan Stanley Distribution, Inc. ("MSDI" or the "Distributor"), a wholly-owned subsidiary of the Adviser, and an indirect subsidiary of Morgan Stanley, serves as the Fund's Distributor of Portfolio shares pursuant to a Distribution Agreement. The Fund has adopted a Shareholder Services Plan with respect to Class A shares pursuant to Rule 12b-1 under the Act. Under the Shareholder Services Plan, the Portfolio pays the Distributor a shareholder services fee, accrued daily and paid monthly, at an annual rate of 0.25% of the Portfolio's average daily net assets attributable to Class A shares.
The Fund has adopted a Distribution and Shareholder Services Plan with respect to Class L shares pursuant to Rule 12b-1 under the Act. Under the Distribution and Shareholder Services Plan, the Portfolio pays the Distributor a distribution fee, accrued daily and paid monthly, at an annual rate of 0.50% and a shareholder services fee, accrued daily and paid monthly, at an annual rate of 0.25% of the Portfolio's average daily net assets attributable to Class L shares.
The distribution and shareholder services fees are used to support the expenses associated with servicing and maintaining accounts. The Distributor may compensate other parties for providing shareholder support services to investors who purchase Class A and Class L shares.
E. Dividend Disbursing and Transfer Agent: The Fund's dividend disbursing and transfer agent was Morgan Stanley Services Company Inc. ("Morgan Stanley Services"). Pursuant to a Transfer Agency Agreement, the Fund paid Morgan Stanley Services a fee based on the number of classes, accounts and transactions relating to the Portfolios of the Fund. Effective July 1, 2013, the Directors approved changing the transfer agent to Boston Financial Data Services, Inc.
F. Custodian Fees: State Street (the "Custodian") serves as Custodian for the Fund in accordance with a Custodian Agreement. The Custodian holds cash, securities, and other assets of the Fund as required by the Act. Custody fees are payable monthly based on assets held in custody, investment purchases and sales activity and account maintenance fees, plus reimbursement for certain out-of-pocket expenses.
G. Security Transactions and Transactions with Affiliates: For the year ended December 31, 2013, purchases and sales of investment securities for the Portfolio, other than long-term U.S. Government securities and short-term investments, were approximately $700,898,000 and
23
Morgan Stanley Institutional Fund, Inc.
Annual Report — December 31, 2013
Notes to Financial Statements (cont'd)
$705,412,000, respectively. There were no purchases and sales of long-term U.S. Government securities for the year ended December 31, 2013.
The Portfolio invests in the Institutional Class of the Morgan Stanley Institutional Liquidity Funds — Treasury Portfolio — Institutional Class (the "Liquidity Funds"), an open-end management investment company managed by the Adviser. Advisory fees paid by the Portfolio are reduced by an amount equal to its pro-rata share of the advisory and administration fees paid by the Portfolio due to its investment in the Liquidity Funds. For the year ended December 31, 2013, advisory fees paid were reduced by approximately $46,000 relating to the Portfolio's investment in the Liquidity Funds.
A summary of the Portfolio's transactions in shares of the Liquidity Funds during the year ended December 31, 2013 is as follows:
Value
December 31,
2012
(000) | | Purchases
at Cost
(000) | | Sales
(000) | | Dividend
Income
(000) | | Value
December 31,
2013
(000) | |
| $ | 18,791 | | | $ | 404,554 | | | $ | 399,168 | | | $ | 10 | | | $ | 24,177 | | |
During the year ended December 31, 2013, the Portfolio incurred less than $500 in brokerage commissions with Morgan Stanley & Co., LLC, an affiliate of the Adviser, Sub-Advisers, Administrator and Distributor, for portfolio transactions executed on behalf of the Portfolio.
From January 1, 2013 to June 30, 2013, the Portfolio incurred approximately $44,000 in brokerage commissions with Citigroup, Inc., and its affiliated broker-dealers, which may be deemed affiliates of the Adviser, Sub-Advisers, Administrator and Distributor under Section 17 of the Act, for portfolio transactions executed on behalf of the Portfolio. Citigroup, Inc. and its affiliated broker-dealers ceased to be affiliates of the Portfolio pursuant to Section 17 of the Act as of July 1, 2013.
H. Federal Income Taxes: It is the Portfolio's intention to continue to qualify as a regulated investment company and distribute all of its taxable and tax-exempt income. Accordingly, no provision for Federal income taxes is required in the financial statements.
The Portfolio may be subject to taxes imposed by countries in which it invests. Such taxes are generally based on income and/or capital gains earned or repatriated. Taxes are accrued based on net investment income, net realized gains and net unrealized appreciation as such income and/or gains are earned. Taxes may also be based on transactions in foreign
currency and are accrued based on the value of investments denominated in such currency.
FASB ASC 740-10 "Income Taxes — Overall" sets forth a minimum threshold for financial statement recognition of the benefit of a tax position taken or expected to be taken in a tax return. Management has concluded there are no significant uncertain tax positions that would require recognition in the financial statements. If applicable, the Portfolio recognizes interest accrued related to unrecognized tax benefits in "Interest Expense" and penalties in "Other Expenses" in the Statement of Operations. The Portfolio files tax returns with the U.S. Internal Revenue Service, New York and various states. Each of the tax years in the four-year period ended December 31, 2013, remains subject to examination by taxing authorities.
The tax character of distributions paid may differ from the character of distributions shown in the Statements of Changes in Net Assets due to short-term capital gains being treated as ordinary income for tax purposes. The tax character of distributions paid during fiscal years 2013 and 2012 was as follows:
2013
Distributions
Paid From: | | 2012
Distributions
Paid From: | |
Ordinary
Income
(000) | | Long-Term
Capital Gain
(000) | | Ordinary
Income
(000) | | Long-Term
Capital Gain
(000) | |
| $ | 41,276 | | | | — | | | $ | 69,575 | | | | — | | |
The amount and character of income and gains to be distributed are determined in accordance with income tax regulations which may differ from GAAP. These book/tax differences are either considered temporary or permanent in nature.
Temporary differences are primarily due to differing book and tax treatments in the timing of the recognition of gains (losses) on certain investment transactions and the timing of the deductibility of certain expenses.
Permanent differences, primarily due to differing treatments of gains (losses) related to foreign currency transactions and REIT adjustments, basis adjustments on certain equity securities designated as passive foreign investment companies and distributions in excess of current earnings and profits, resulted in the following reclassifications among the components of net assets at December 31, 2013:
Distributions
in Excess of
Net Investment
Income
(000) | | Accumulated
Net Realized
Loss
(000) | | Paid-in
Capital
(000) | |
| $ | 12,512 | | | $ | (13,243 | ) | | $ | 731 | | |
24
Morgan Stanley Institutional Fund, Inc.
Annual Report — December 31, 2013
Notes to Financial Statements (cont'd)
At December 31, 2013, the Portfolio had no distributable earnings on a tax basis.
At December 31, 2013, the aggregate cost for federal income tax purposes is approximately $2,000,725,000. The aggregate gross unrealized appreciation is approximately $191,945,000 and the aggregate gross unrealized depreciation is approximately $106,659,000 resulting in net unrealized appreciation of approximately $85,286,000.
At December 31, 2013, the Portfolio had available capital loss carryforwards to offset future net capital gains, to the extent provided by regulations, through the indicated expiration dates:
Amount
(000) | | Expiration | |
| $ | 3,745 | | | December 31, 2017 | |
| | 41,571 | | | December 31, 2018 | |
To the extent that capital loss carryforwards are used to offset any future capital gains realized during the carryover period as provided by U.S. Federal income tax regulations, no capital gains tax liability will be incurred by the Portfolio for gains realized and not distributed. To the extent that capital gains are offset, such gains will not be distributed to the shareholders. During the year ended December 31, 2013, the Portfolio utilized capital loss carryforwards for U.S. Federal income tax purposes of approximately $80,450,000.
Capital losses and specified ordinary losses, including currency losses, incurred after October 31 but within the taxable year are deemed to arise on the first day of the Portfolio's next taxable year. For the year ended December 31, 2013, the Portfolio deferred to January 1, 2014 for U.S. Federal income tax purposes the following losses:
Post-October
Currency
and Specified
Ordinary Losses
(000) | | Post-October
Capital Losses
(000) | |
| $ | 10,345 | | | $ | 6,587 | | |
I. Other (unaudited): At December 31, 2013, the Portfolio had otherwise unaffiliated record owners of 10% or greater. Investment activities of these shareholders could have a material impact on the Portfolio. The aggregate percentage of such owners was 17%, 63% and 56%, for Class I, Class A and Class IS shares, respectively.
J. Results of Special Shareholder Meeting (unaudited): On June 5, 2013 as adjourned to June 24, 2013 and July 17, 2013, a Joint Special Shareholder Meeting was held for
Class H shareholders of the Portfolio to approve the Articles of Amendment to the Fund's Articles of Amendment and Restatement and a Plan of Reclassification for the Portfolio pursuant to which Class H shares would be reclassified as Class P shares. The results with respect to this proposal were as follows:
| For | | Against | | Abstain | |
| | 685,193 | | | | 5,588 | | | | 0 | | |
K. Accounting Pronouncement: In June 2013, FASB issued Accounting Standards Update 2013-08 Financial Services — Investment Companies (Topic 946) — Amendments to the Scope, Measurement, and Disclosure Requirements ("ASU 2013-08") which is effective for interim and annual reporting periods in fiscal years that begin after December 15, 2013. ASU 2013-08 sets forth a methodology for determining whether an entity should be characterized as an investment company and prescribes fair value accounting for an investment company's non-controlling ownership interest in another investment company. FASB has determined that a fund registered under the Investment Company Act of 1940 automatically meets ASU 2013-08's criteria for an investment company. Although still evaluating the potential impacts of ASU 2013-08 to the Portfolio, management expects that the impact of the Portfolio's adoption will be limited to additional financial statement disclosures.
25
Morgan Stanley Institutional Fund, Inc.
Annual Report — December 31, 2013
Report of Independent Registered Public Accounting Firm
To the Shareholders and Board of Directors of
Morgan Stanley Institutional Fund, Inc. —
Global Real Estate Portfolio
We have audited the accompanying statement of assets and liabilities, including the portfolio of investments, of Global Real Estate Portfolio (one of the portfolios constituting Morgan Stanley Institutional Fund, Inc.) (the "Portfolio") as of December 31, 2013, and the related statement of operations for the year then ended, the statements of changes in net assets for each of the two years in the period then ended, and the financial highlights for each of the five years in the period then ended. These financial statements and financial highlights are the responsibility of the Portfolio's management. Our responsibility is to express an opinion on these financial statements and financial highlights based on our audits.
We conducted our audits in accordance with the standards of the Public Company Accounting Oversight Board (United States). Those standards require that we plan and perform the audit to obtain reasonable assurance about whether the financial statements and financial highlights are free of material misstatement. We were not engaged to perform an audit of the Portfolio's internal control over financial reporting. Our audits included consideration of internal control over financial reporting as a basis for designing audit procedures that are appropriate in the circumstances, but not for the purpose of expressing an opinion on the effectiveness of the Portfolio's internal control over financial reporting. Accordingly, we express no such opinion. An audit also includes examining, on a test basis, evidence supporting the amounts and disclosures in the financial statements and financial highlights, assessing the accounting principles used and significant estimates made by management, and evaluating the overall financial statement presentation. Our procedures included confirmation of securities owned as of December 31, 2013, by correspondence with the custodian and others or by other appropriate auditing procedures where replies from others were not received. We believe that our audits provide a reasonable basis for our opinion.
In our opinion, the financial statements and financial highlights referred to above present fairly, in all material respects, the financial position of Global Real Estate Portfolio (one of the portfolios constituting Morgan Stanley Institutional Fund, Inc.) at December 31, 2013, the results of its operations for the year then ended, the changes in its net assets for each of the two years in the period then ended, and the financial highlights for each of the five years in the period then ended, in conformity with U.S. generally accepted accounting principles.

Boston, Massachusetts
February 26, 2014
26
Morgan Stanley Institutional Fund, Inc.
Annual Report — December 31, 2013
Federal Tax Notice (unaudited)
For Federal income tax purposes, the following information is furnished with respect to the distributions paid by the Portfolio during its taxable year ended December 31, 2013. For corporate shareholders, 4.3% of the dividends qualified for the dividends received deduction.
For Federal income tax purposes, the following information is furnished with respect to the Portfolio's earnings for its taxable year ended December 31, 2013. When distributed, certain earnings may be subject to a maximum tax rate of 15% as provided for the Jobs and Growth Tax Relief Reconciliation Act of 2003. The Portfolio designated up to a maximum of $3,686,000 as taxable at this lower rate.
The Portfolio intends to pass through foreign tax credits of approximately $2,220,000 and has derived net income from sources within foreign countries amounting to approximately $36,652,000
In January, the Portfolio provides tax information to shareholders for the preceding calendar year.
27
Morgan Stanley Institutional Fund, Inc.
Annual Report — December 31, 2013
U.S. Privacy Policy (unaudited)
AN IMPORTANT NOTICE CONCERNING OUR U.S. PRIVACY POLICY
This privacy notice describes the U.S. privacy policy of Morgan Stanley Distribution, Inc., and the Morgan Stanley family of mutual funds ("us", "our", "we").
We are required by federal law to provide you with notice of our U.S. privacy policy ("Policy"). This Policy applies to both our current and former clients unless we state otherwise and is intended for individual clients who purchase products or receive services from us for personal, family or household purposes. This Policy is not applicable to partnerships, corporations, trusts or other non-individual clients or account holders, nor is this Policy applicable to individuals who are either beneficiaries of a trust for which we serve as trustee or participants in an employee benefit plan administered or advised by us. This Policy is, however, applicable to individuals who select us to be a custodian of securities or assets in individual retirement accounts, 401(k) accounts, or accounts subject to the Uniform Gifts to Minors Act.
This notice sets out our business practices to protect your privacy; how we collect and share personal information about you; and how you can limit our sharing or certain uses by others of this information. We may amend this Policy at any time, and will inform you of any changes to our Policy as required by law.
WE RESPECT YOUR PRIVACY
We appreciate that you have provided us with your personal financial information and understand your concerns about your information. We strive to safeguard the information our clients entrust to us. Protecting the confidentiality and security of client information is an important part of how we conduct our business.
This notice describes what personal information we collect about you, how we collect it, when we may share it with others, and how certain others may use it. It discusses the steps you may take to limit our sharing of certain information about you with our affiliated companies, including, but not limited to our affiliated banking businesses, brokerage firms and credit service affiliates. It also discloses how you may limit our affiliates' use of shared information for marketing purposes.
Throughout this Policy, we refer to the nonpublic information that personally identifies you as "personal information." We also use the term "affiliated company" in this notice. An affiliated company is a company in our family of companies and includes companies with the Morgan Stanley name. These affiliated companies are financial institutions such as broker-dealers, banks, investment advisers and credit card issuers. We refer to any company that is not an affiliated company as a nonaffiliated third party. For purposes of Section 5 of this notice, and your ability to limit certain uses of personal information by our affiliates, this notice applies to the use of personal information by our affiliated companies.
1. WHAT PERSONAL INFORMATION DO WE COLLECT FROM YOU?
We may collect the following types of information about you: (i) information provided by you, including information from applications and other forms we receive from you, (ii) information about your transactions with us or our affiliates, (iii) information about your transactions with nonaffiliated third parties, (iv) information from consumer reporting agencies, (v) information obtained from our websites, and (vi) information obtained from other sources. For example:
• We collect information such as your name, address, e-mail address, telephone/fax numbers, assets, income and investment objectives through applications and other forms you submit to us.
• We may obtain information about account balances, your use of account(s) and the types of products and services you prefer to receive from us through your dealings and transactions with us and other sources.
• We may obtain information about your creditworthiness and credit history from consumer reporting agencies.
• We may collect background information from and through third-party vendors to verify representations you have made and to comply with various regulatory requirements.
2. WHEN DO WE DISCLOSE PERSONAL INFORMATION WE COLLECT ABOUT YOU?
We may disclose personal information we collect about you in each of the categories listed above to affiliated and nonaffiliated third parties.
28
Morgan Stanley Institutional Fund, Inc.
Annual Report — December 31, 2013
U.S. Privacy Policy (unaudited) (cont'd)
a. Information We Disclose to Affiliated Companies.
We may disclose personal information that we collect about you to our affiliated companies to manage your account(s) effectively, to service and process your transactions, and to let you know about products and services offered by us and affiliated companies, to manage our business, and as otherwise required or permitted by law. Offers for products and services from affiliated companies are developed under conditions designed to safeguard your personal information.
b. Information We Disclose to Third Parties.
We may disclose personal information that we collect about you to nonaffiliated third parties to provide marketing services on our behalf or to other financial institutions with whom we have joint marketing agreements. We may also disclose all of the information we collect to other nonaffiliated third parties for our everyday business purposes, such as to process transactions, maintain account(s), respond to court orders and legal investigations, report to credit bureaus, offer our own products and services, protect against fraud, for institutional risk control, to perform services on our behalf, and as otherwise required or permitted by law.
When we share personal information about you with a nonaffiliated third party, they are required to limit their use of personal information about you to the particular purpose for which it was shared and they are not allowed to share personal information about you with others except to fulfill that limited purpose or as may be permitted or required by law.
3. HOW DO WE PROTECT THE SECURITY AND CONFIDENTIALITY OF PERSONAL INFORMATION WE COLLECT ABOUT YOU?
We maintain physical, electronic and procedural security measures that comply with applicable law and regulations to help safeguard the personal information we collect about you. We have internal policies governing the proper handling of client information by employees. Third parties that provide support or marketing services on our behalf may also receive personal information about you, and we require them to adhere to appropriate security standards with respect to such information.
4. HOW CAN YOU LIMIT OUR SHARING CERTAIN PERSONAL INFORMATION ABOUT YOU WITH OUR AFFILIATED COMPANIES FOR ELIGIBILITY DETERMINATION?
By following the opt-out procedures in Section 6 below, you may limit the extent to which we share with our affiliated companies, personal information that was collected to determine your eligibility for products and services such as your credit reports and other information that you have provided to us or that we may obtain from third parties ("eligibility information"). Eligibility information does not include your identification information or personal information pertaining to our transactions or experiences with you. Please note that, even if you direct us not to share eligibility information with our affiliated companies, we may still share your personal information, including eligibility information, with our affiliated companies under circumstances that are permitted under applicable law, such as to process transactions or to service your account.
5. HOW CAN YOU LIMIT THE USE OF CERTAIN PERSONAL INFORMATION ABOUT YOU BY OUR AFFILIATED COMPANIES FOR MARKETING?
By following the opt-out instructions in Section 6 below, you may limit our affiliated companies from marketing their products or services to you based on personal information we disclose to them. This information may include, for example, your income and account history with us. Please note that, even if you choose to limit our affiliated companies from using personal information about you that we may share with them for marketing their products and services to you, our affiliated companies may use your personal information that they obtain from us to market to you in circumstances permitted by law, such as if the affiliated party has its own relationship with you.
29
Morgan Stanley Institutional Fund, Inc.
Annual Report — December 31, 2013
U.S. Privacy Policy (unaudited) (cont'd)
6. HOW CAN YOU SEND US AN OPT-OUT INSTRUCTION?
If you wish to limit our sharing of eligibility information about you with our affiliated companies, or our affiliated companies' use of personal information for marketing purposes, as described in this notice, you may do so by:
• Calling us at (800) 548-7786
Monday–Friday between 8a.m. and 5p.m. (EST)
• Writing to us at the following address:
Boston Financial Data Services, Inc.
c/o Privacy Coordinator
P.O. Box 219804
Kansas City, Missouri 64121
If you choose to write to us, your request should include: your name, address, telephone number and account number(s) to which the opt-out applies and whether you are opting out with respect to sharing of eligibility information (Section 4 above), or information used for marketing (Section 5 above), or both. Written opt-out requests should not be sent with any other correspondence. In order to process your request, we require that the request be provided by you directly and not through a third party. Once you have informed us about your privacy preferences, your opt-out preference will remain in effect with respect to this Policy (as it may be amended) until you notify us otherwise. If you are a joint account owner, we will accept instructions from any one of you and apply those instructions to the entire account.
Please understand that if you limit our sharing or our affiliated companies' use of personal information, you and any joint account holder(s) may not receive information about our affiliated companies' products and services, including products or services that could help you manage your financial resources and achieve your investment objectives.
If you have more than one account or relationship with us, please specify the accounts to which you would like us to apply your privacy choices. If you have accounts or relationships with our affiliates, you may receive multiple privacy policies from them, and will need to separately notify those companies of your privacy choices for those accounts or relationships.
7. WHAT IF AN AFFILIATED COMPANY BECOMES A NONAFFILIATED THIRD PARTY?
If, at any time in the future, an affiliated company becomes a nonaffiliated third party, further disclosures of personal information made to the former affiliated company will be limited to those described in Section 2(b) above relating to nonaffiliated third parties. If you elected under Section 6 to limit disclosures we make to affiliated companies, or use of personal information by affiliated companies, your election will not apply to use by any former affiliated company of your personal information in their possession once it becomes a nonaffiliated third party.
SPECIAL NOTICE TO RESIDENTS OF VERMONT
The following section supplements our Policy with respect to our individual clients who have a Vermont address and supersedes anything to the contrary in the above Policy with respect to those clients only.
The State of Vermont requires financial institutions to obtain your consent prior to sharing personal information that they collect about you with nonaffiliated third parties, or eligibility information with affiliated companies, other than in certain limited circumstances. Except as permitted by law, we will not share personal information we collect about you with nonaffiliated third parties or eligibility information with affiliated companies, unless you provide us with your written consent to share such information.
SPECIAL NOTICE TO RESIDENTS OF CALIFORNIA
The following section supplements our Policy with respect to our individual clients who have a California address and supersedes anything to the contrary in the above Policy with respect to those clients only.
In response to a California law, if your account has a California home address, your personal information will not be disclosed to nonaffiliated third parties except as permitted by applicable California law, and we will limit sharing such personal information with our affiliates to comply with California privacy laws that apply to us.
30
Morgan Stanley Institutional Fund, Inc.
Annual Report — December 31, 2013
Director and Officer Information (unaudited)
Independent Director:
Name, Age and Address of
Independent Director | | Position(s)
Held with
Registrant | | Length of Time
Served* | | Principal Occupation(s) During Past 5 Years | | Number of
Portfolios in
Fund Complex
Overseen by
Independent
Director** | | Other Directorships
Held by Independent
Director*** | |
Frank L. Bowman (69)
c/o Kramer Levin Naftalis &
Frankel LLP
Counsel to the Independent Directors
1177 Avenue of the Americas
New York, NY 10036 | | Director | | Since
August
2006 | | President, Strategic Decisions, LLC (consulting) (since February 2009); Director or Trustee of various Morgan Stanley Funds (since August 2006); Chairperson of the Insurance Sub-Committee of the Compliance and Insurance Committee (since February 2007); served as President and Chief Executive Officer of the Nuclear Energy Institute (policy organization) (February 2005-November 2008); retired as Admiral, U.S. Navy after serving over 38 years on active duty including 8 years as Director of the Naval Nuclear Propulsion Program in the Department of the Navy and the U.S. Department of Energy (1996-2004); served as Chief of Naval Personnel (July 1994-September 1996); and on the Joint Staff as Director of Political Military Affairs (June 1992-July 1994); knighted as Honorary Knight Commander of the Most Excellent Order of the British Empire; awarded the Officier de l'Orde National du Mérite by the French Government; elected to the National Academy of Engineering (2009). | | | 98 | | | Director of BP p.l.c.; Director of Naval and Nuclear Technologies LLP; Director of the Armed Services YMCA of the USA and the U.S. Naval Submarine League; Director of the American Shipbuilding Suppliers Association; Member of the National Security Advisory Council of the Center for U.S. Global Engagement and a member of the CNA Military Advisory Board; Chairman of the Charity J Street Cup Golf; Trustee of Fairhaven United Methodist Church. | |
Michael Bozic (73)
c/o Kramer Levin Naftalis & Frankel LLP
Counsel to the Independent Directors
1177 Avenue of the Americas
New York, NY 10036 | | Director | | Since
April
1994 | | Private investor and a member of the advisory board of American Road Group LLC (retail) (since June 2000); Chairperson of the Compliance and Insurance Committee (since October 2006); Director or Trustee of various Morgan Stanley Funds (since April 1994); formerly, Chairperson of the Insurance Committee (July 2006-September 2006); Vice Chairman of Kmart Corporation (December 1998-October 2000), Chairman and Chief Executive Officer of Levitz Furniture Corporation (November 1995-November 1998) and President and Chief Executive Officer of Hills Department Stores (May 1991-July 1995); variously Chairman, Chief Executive Officer, President and Chief Operating Officer (1987-1991) of the Sears Merchandise Group of Sears, Roebuck & Co. | | | 100 | | | Trustee and member of the Hillsdale College Board of Trustees. | |
Kathleen A. Dennis (60)
c/o Kramer Levin Naftalis & Frankel LLP
Counsel to the Independent Directors
1177 Avenue of the Americas
New York, NY 10036 | | Director | | Since
August
2006 | | President, Cedarwood Associates (mutual fund and investment management consulting) (since July 2006); Chairperson of the Money Market and Alternatives Sub-Committee of the Investment Committee (since October 2006) and Director or Trustee of various Morgan Stanley Funds (since August 2006); formerly, Senior Managing Director of Victory Capital Management (1993-2006). | | | 98 | | | Director of various non-profit organizations. | |
Dr. Manuel H. Johnson (65)
c/o Johnson Smick Group, Inc.
888 16th Street, N.W.
Suite 740
Washington, D.C. 20006 | | Director | | Since
July
1991 | | Senior Partner, Johnson Smick International, Inc. (consulting firm); Chairperson of the Investment Committee (since October 2006) and Director or Trustee of various Morgan Stanley Funds (since July 1991); Co-Chairman and a founder of the Group of Seven Council (G7C) (international economic commission); formerly, Chairperson of the Audit Committee (July 1991-September 2006), Vice Chairman of the Board of Governors of the Federal Reserve System and Assistant Secretary of the U.S. Treasury. | | | 101 | | | Director of NVR, Inc. (home construction). | |
31
Morgan Stanley Institutional Fund, Inc.
Annual Report — December 31, 2013
Director and Officer Information (unaudited) (cont'd)
Independent Director: (cont'd)
Name, Age and Address of
Independent Director | | Position(s)
Held with
Registrant | | Length of Time
Served* | | Principal Occupation(s) During Past 5 Years | | Number of
Portfolios in
Fund Complex
Overseen by
Independent
Director** | | Other Directorships
Held by Independent
Director*** | |
Joseph J. Kearns (71)
c/o Kearns & Associates LLC
PMB754
22631 Pacific Coast Highway
Malibu, CA 90265 | | Director | | Since
August
1994 | | President, Kearns & Associates LLC (investment consulting); Chairperson of the Audit Committee (since October 2006) and Director or Trustee of various Morgan Stanley Funds (since August 1994); formerly, Deputy Chairperson of the Audit Committee (July 2003-September 2006) and Chairperson of the Audit Committee of various Morgan Stanley Funds (since August 1994); CFO of the J. Paul Getty Trust. | | | 101 | | | Director of Electro Rent Corporation (equipment leasing) and The Ford Family Foundation. | |
Michael F. Klein (55)
c/o Kramer Levin Naftalis & Frankel LLP
Counsel to the
Independent Directors
1177 Avenue of the Americas
New York, NY 10036 | | Director | | Since
August
2006 | | Managing Director, Aetos Capital, LLC (since March 2000); Co-President, Aetos Alternatives Management, LLC (since January 2004) and Co-chief Executive officer of Aetos Capital LLC (since August 2013); Chairperson of the Fixed Income Sub-Committee of the Investment Committee (since October 2006) and Director or Trustee of various Morgan Stanley Funds (since August 2006); formerly, Managing Director, Morgan Stanley & Co. Inc. and Morgan Stanley Dean Witter Investment Management, President, various Morgan Stanley Funds (June 1998-March 2000) and Principal, Morgan Stanley & Co. Inc. and Morgan Stanley Dean Witter Investment Management (August 1997-December 1999). | | | 98 | | | Director of certain investment funds managed or sponsored by Aetos Capital, LLC. Director of Sanitized AG and Sanitized Marketing AG (specialty chemicals). | |
Michael E. Nugent (77)
522 Fifth Avenue
New York, NY 10036 | | Chairperson of the Board and Director | | Chairperson of the Boards since July 2006 and Director since July 1991 | | Chairperson of the Boards of various Morgan Stanley Funds (since July 2006); Chairperson of the Closed-End Fund Committee (since June 2012) and Director or Trustee of various Morgan Stanley Funds (since July 1991); formerly, Chairperson of the Insurance Committee (until July 2006); General Partner, Triumph Capital, L.P. (private investment partnership) (1988-2013) | | | 100 | | | None. | |
W. Allen Reed (66)
c/o Kramer Levin Naftalis & Frankel LLP
Counsel to the
Independent Directors
1177 Avenue of the Americas
New York, NY 10036 | | Director | | Since
August
2006 | | Chairperson of the Equity Sub-Committee of the Investment Committee (since October 2006) and Director or Trustee of various Morgan Stanley Funds (since August 2006); formerly, President and CEO of General Motors Asset Management; Chairman and Chief Executive Officer of the GM Trust Bank and Corporate Vice President of General Motors Corporation (August 1994-December 2005). | | | 98 | | | Director of Temple-Inland Industries (packaging and forest products); Director of Legg Mason, Inc. and Director of the Auburn University Foundation. | |
Fergus Reid (81)
c/o Joe Pietryka, Inc.
85 Charles Colman Blvd.
Pawling, NY 12564 | | Director | | Since
June
1992 | | Chairman, Joe Pietryka, Inc.; Chairperson of the Governance Committee and Director or Trustee of various Morgan Stanley Funds (since June 1992). | | | 101 | | | Through December 31, 2012, Trustee and Director of certain Investment companies in the JP Morgan Fund Complex. | |
32
Morgan Stanley Institutional Fund, Inc.
Annual Report — December 31, 2013
Director and Officer Information (unaudited) (cont'd)
Interested Director:
Name, Age and Address of
Interested Director | | Position(s)
Held with
Registrant | | Length of
Time Served* | | Principal Occupation(s) During Past 5 Years | | Number of
Portfolios in
Fund Complex
Overseen by
Interested
Director** | | Other Directorships
Held by Interested
Director*** | |
James F. Higgins (66)
One New York Plaza
New York, New York 10004 | | Director | | Since
June
2000 | | Director or Trustee of various Morgan Stanley Funds (since June 2000); Senior Advisor of Morgan Stanley (since August 2000). | | | 99 | | | Formerly, Director of AXA Financial, Inc. and AXA Equitable Life Insurance Company (2002-2011) and Director of AXA MONY Life Insurance Company and AXA MONY Life Insurance Company of America (2004-2011). | |
* Each Director serves an indefinite term, until his or her successor is elected.
** The Fund Complex includes (as of December 31, 2013) all open-end and closed-end funds (including all of their portfolios) advised by Morgan Stanley Investment Management Inc. (the "Adviser") and any funds that have an adviser that is an affiliated person of the Adviser (including, but not limited to, Morgan Stanley AIP GP LP).
*** This includes any directorships at public companies and registered investment companies held by the Director at any time during the past five years.
33
Morgan Stanley Institutional Fund, Inc.
Annual Report — December 31, 2013
Director and Officer Information (unaudited) (cont'd)
Executive Officers:
Name, Age and Address of Executive Officer | | Position(s) Held
with
Registrant | | Length of
Time Served* | | Principal Occupation(s) During Past 5 Years | |
John H. Gernon (50)
522 Fifth Avenue
New York, NY 10036 | | President and Principal Executive Officer—Equity, Fixed Income and AIP Funds | | Since September 2013 | | President and Principal Executive Officer of the Equity and Fixed Income Funds and the Morgan Stanley AIP Funds (since September 2013) in the Fund Complex. Managing Director of the Adviser. | |
Stefanie V. Chang Yu (47)
522 Fifth Avenue
New York, NY 10036 | | Chief Compliance Officer | | Since
January
2014 | | Managing Director of the Adviser and various entities affiliated with the Adviser; Chief Compliance Officer of various Morgan Stanley Funds and the Adviser (since January 2014) formerly Vice President of various Morgan Stanley Funds (December 1997-January 2014). | |
Joseph C. Benedetti (48)
522 Fifth Avenue
New York, NY 10036 | | Vice President | | Since
January
2014 | | Managing Director of the Adviser and various entities affiliated with the Adviser; Vice President of various Morgan Stanley Funds (since January 2014). Formerly, Assistant Secretary of various Morgan Stanley Funds (October 2004-January 2014). | |
Francis J. Smith (48)
522 Fifth Avenue
New York, NY 10036 | | Treasurer and Principal Financial Officer | | Treasurer since July 2003 and Principal Financial Officer since September 2002 | | Executive Director of the Adviser and various entities affiliated with the Adviser; Treasurer and Principal Financial Officer of various Morgan Stanley Funds (since July 2003). | |
Mary E. Mullin (46)
522 Fifth Avenue
New York, NY 10036 | | Secretary | | Since
June
1999 | | Executive Director of the Adviser and various entities affiliated with the Adviser; Secretary of various Morgan Stanley Funds (since June 1999). | |
* Each officer serves an indefinite term, until his or her successor is elected.
34
Morgan Stanley Institutional Fund, Inc.
Annual Report — December 31, 2013
Adviser and Administrator
Morgan Stanley Investment Management Inc.
522 Fifth Avenue
New York, New York 10036
Sub-Advisers
Morgan Stanley Investment Management Limited
25 Cabot Square, Canary Wharf
London, E14 4QA, England
Morgan Stanley Investment Management Company
23 Church Street
16-01 Capital Square 049481 Singapore
Distributor
Morgan Stanley Distribution, Inc.
522 Fifth Avenue
New York, New York 10036
Dividend Disbursing and Transfer Agent
Boston Financial Data Services, Inc.
2000 Crown Colony Drive
Quincy, Massachusetts 02169
Custodian
State Street Bank and Trust Company
One Lincoln Street
Boston, Massachusetts 02111
Legal Counsel
Dechert LLP
1095 Avenue of the Americas
New York, New York 10036
Counsel to the Independent Directors
Kramer Levin Naftalis & Frankel LLP
1177 Avenue of the Americas
New York, New York 10036
Independent Registered Public Accounting Firm
Ernst & Young LLP
200 Clarendon Street
Boston, Massachusetts 02116
Reporting to Shareholders
Each Morgan Stanley fund provides a complete schedule of portfolio holdings in its semi-annual and annual reports within 60 days of the end of the fund's second and fourth fiscal quarters by filing the schedule electronically with the Securities and Exchange Commission (SEC). The semi-annual reports are filed on Form N-CSRS and the annual reports are filed on Form N-CSR. Morgan Stanley also delivers the semi-annual and annual reports to fund shareholders and makes these reports available on its public website, www.morganstanley.com/im. Each Morgan Stanley fund also files a complete schedule of portfolio holdings with the SEC for the fund's first and third fiscal quarters on Form N-Q. Morgan Stanley does not deliver the reports for the first and third fiscal quarters to shareholders, nor are the reports posted to the Morgan Stanley public website. You may, however, obtain the Form N-Q filings (as well as the Form N-CSR and N-CSRS filings) by accessing the SEC's website, www.sec.gov. You may also review and copy them at the SEC's Public Reference Room in Washington, DC. Information on the operation of the SEC's Public Reference Room may be obtained by calling the SEC toll free at 1 (800) SEC-0330. You can also request copies of these materials, upon payment of a duplicating fee, by electronic request at the SEC's email address (publicinfo@sec.gov) or by writing the Public Reference Room of the SEC, Washington, DC 20549-0102.
Proxy Voting Policies and Procedures and Proxy Voting Record
You may obtain a copy of the Fund's Proxy Voting Policy and Procedures and information regarding how the Fund voted proxies relating to portfolio securities during the most recent twelve-month period ended June 30, without charge, upon request, by calling toll free 1 (800) 548-7786 or by visiting our website at www.morganstanley.com/im. This information is also available on the SEC's website at www.sec.gov.
This report is authorized for distribution only when preceded or accompanied by a prospectus of the Morgan Stanley Institutional Fund, Inc. which describes in detail each Investment Portfolio's investment policies, risks, fees and expenses. Please read the prospectus carefully before you invest or send money. For additional information, including information regarding the investments comprising the Portfolio, please visit our website at www.morganstanley.com/im or call toll free 1 (800) 548-7786.
35
(This Page has been left blank intentionally.)
Printed in U.S.A.
This Report has been prepared for shareholders and may be distributed to others only if preceded or accompanied by a current prospectus.
Morgan Stanley Investment Management Inc.
522 Fifth Avenue
New York, New York 10036
© 2014 Morgan Stanley. Morgan Stanley Distribution, Inc.

IFIGREANN
808984 EXP 2.28.15

Morgan Stanley Institutional Fund, Inc.
International Equity Portfolio
Annual Report
December 31, 2013

Morgan Stanley Institutional Fund, Inc.
Annual Report — December 31, 2013
Shareholders' Letter | | | 2 | | |
Expense Example | | | 3 | | |
Investment Overview | | | 4 | | |
Portfolio of Investments | | | 7 | | |
Statement of Assets and Liabilities | | | 9 | | |
Statement of Operations | | | 11 | | |
Statements of Changes in Net Assets | | | 12 | | |
Financial Highlights | | | 14 | | |
Notes to Financial Statements | | | 18 | | |
Report of Independent Registered Public Accounting Firm | | | 27 | | |
Federal Tax Notice | | | 28 | | |
U.S. Privacy Policy | | | 29 | | |
Director and Officer Information | | | 32 | | |
This report is authorized for distribution only when preceded or accompanied by prospectuses of the Morgan Stanley Institutional Fund, Inc. To receive a prospectus and/or statement of additional information (SAI), which contains more complete information such as investment objectives, charges, expenses, policies for voting proxies, risk considerations, and describes in detail each of the Portfolio's investment policies to the prospective investor, please call toll free 1 (800) 548-7786. Please read the prospectuses carefully before you invest or send money.
Additionally, you can access portfolio information including performance, characteristics, and investment team commentary through Morgan Stanley Investment Management's website: www.morganstanley.com/im.
Market forecasts provided in this report may not necessarily come to pass. There is no guarantee that any sectors mentioned will continue to perform as discussed herein or that securities in such sectors will be held by the Portfolio in the future. There is no assurance that a Portfolio will achieve its investment objective. Portfolios are subject to market risk, which is the possibility that market values of securities owned by the Portfolio will decline and, therefore, the value of the Portfolio's shares may be less than what you paid for them. Accordingly, you can lose money investing in the Portfolio. Please see the prospectus for more complete information on investment risks.
1
Morgan Stanley Institutional Fund, Inc.
Annual Report — December 31, 2013
Shareholders' Letter (unaudited)
Dear Shareholders,
We are pleased to provide this Annual report, in which you will learn how your investment in International Equity Portfolio (the "Portfolio") performed during the latest twelve-month period.
Morgan Stanley Investment Management is a client-centric, investor-led organization. Our global presence, intellectual capital, and breadth of products and services enable us to partner with investors to meet the evolving challenges of today's financial markets. We aim to deliver superior investment service and to empower our clients to make the informed decisions that help them reach their investment goals.
As always, we thank you for selecting Morgan Stanley Investment Management, and look forward to working with you in the months and years ahead.
Sincerely,

John H. Gernon
President and Principal Executive Officer
January 2014
2
Morgan Stanley Institutional Fund, Inc.
Annual Report — December 31, 2013
Expense Example (unaudited)
International Equity Portfolio
As a shareholder of the Portfolio, you incur two types of costs: (1) transactional costs, including redemptions fees; and (2) ongoing costs, including advisory fees, administration fees, distribution and shareholder services fees and other Portfolio expenses. This example is intended to help you understand your ongoing costs (in dollars) of investing in the Portfolio and to compare these costs with the ongoing costs of investing in other mutual funds.
This example is based on an investment of $1,000 invested at the beginning of the six-month period ended December 31, 2013 and held for the entire six-month period.
Actual Expenses
The table below provides information about actual account values and actual expenses. You may use the information in this table, together with the amount you invested, to estimate the expenses that you paid over the period. Simply divide your account value by $1,000 (for example, an $8,600 account value divided by $1,000 = 8.6), then multiply the result by the number in the table under the heading entitled "Actual Expenses Paid During Period" to estimate the expenses you paid on your account during this period.
Hypothetical Example for Comparison Purposes
The table below provides information about hypothetical account values and hypothetical expenses based on the Portfolio's actual expense ratio and an assumed rate of return of 5% per year before expenses, which is not the Portfolio's actual return. The hypothetical account values and expenses may not be used to estimate the actual ending account balance or expenses you paid for the period. You may use this information to compare the ongoing costs of investing in the Portfolio and other funds. To do so, compare this 5% hypothetical example with the 5% hypothetical examples that appear in the shareholder reports of the other funds.
Please note that the expenses shown in the table are meant to highlight your ongoing costs only and do not reflect any transactional costs, such as sales charges (loads) and redemption fees. Therefore, the information for each class in the table is useful in comparing ongoing costs only, and will not help you determine the relative total costs of owning different funds. In addition, if these transactional costs were included, your costs would have been higher.
| | | Beginning
Account
Value
7/1/13 | | Actual Ending
Account
Value
12/31/13 | | Hypothetical
Ending Account
Value | | Actual
Expenses
Paid
During
Period | | Hypothetical
Expenses Paid
During Period | | Net
Expense
Ratio
During
Period*** | |
International Equity Portfolio Class I | | $ | 1,000.00 | | | $ | 1,144.90 | | | $ | 1,020.42 | | | $ | 5.14 | * | | $ | 4.84 | * | | | 0.95 | % | |
International Equity Portfolio Class A@ | | | 1,000.00 | | | | 1,143.20 | | | | 1,018.95 | | | | 6.70 | * | | | 6.31 | * | | | 1.24 | | |
International Equity Portfolio Class L | | | 1,000.00 | | | | 1,140.70 | | | | 1,016.38 | | | | 9.44 | * | | | 8.89 | * | | | 1.75 | | |
International Equity Portfolio Class IS | | | 1,000.00 | | | | 1,074.20 | | | | 1,011.99 | | | | 2.77 | ** | | | 2.68 | ** | | | 0.91 | | |
* Expenses are calculated using each Portfolio Class' annualized net expense ratio (as disclosed), multiplied by the average account value over the period, and multiplied by 184/365 (to reflect the most recent one-half year period).
** Expenses are calculated using the Portfolio Class' annualized net expense ratio (as disclosed), multiplied by the average account value over the period, and multiplied by 107/365 (to reflect the actual days in the period).
*** Annualized.
@ Effective September 9, 2013, Class P and Class H shares were renamed Class A shares.
3
Morgan Stanley Institutional Fund, Inc.
Annual Report — December 31, 2013
Investment Overview (unaudited)
International Equity Portfolio
The International Equity Portfolio seeks long-term capital appreciation by investing primarily in equity securities of non-U.S. issuers
Performance
For the year ended December 31, 2013, the Portfolio had a total return based on net asset value and reinvestment of distributions per share of 20.39%, net of fees, for Class I shares. The Portfolio's Class I shares underperformed against its benchmark, the Morgan Stanley Capital International (MSCI) EAFE Index (the "Index"), which returned 22.78%. Please keep in mind that high double-digit returns are highly unusual and cannot be sustained.
Factors Affecting Performance
• Global equities rose during the 12-month period, with the MSCI EAFE Index gaining 22.78% for 2013.
• Stock markets ended 2013 on a strong upswing, and the S&P 500 Index returned 32.39%, on expectations of low inflation, low (or gently rising) interest rates, further economic recovery, and an easy transition away from quantitative easing (QE). As this vision increasingly became a consensus view over the course of 2013, it is a small wonder that lower-quality equities have trumped higher quality ones, with telecommunications up 46.2%, consumer discretionary up 35.1%, financials up 24.5%, industrials up 24.9%, versus consumer staples' 17.0% gain for the year.
• Although underperforming the Index, the Portfolio nevertheless performed surprisingly well in 2013, given its historically asymmetric performance characteristics in strongly rising markets. This was generally due to good stock selection, particularly in financials, health care, materials and industrials. This helped partially offset the negative impact of poor stock selection (especially in tobacco) and exposure to consumer staples, the underweight in consumer discretionary and the Portfolio's cash position. Our Japanese stock picking and yen hedge, which was managed with forward contracts, also helped relative performance.
Management Strategies
• We believe that the market is entering 2014 with plenty of scope for disappointment after climbing even higher in 2013. We worry most about valuations in the face of possible weak or
unsustainable growth, deflation, and high real interest rates and their potentially negative implications for developed and emerging markets, together with various difficulties on the policy front. However, we are more positive towards quality consumer staples given their poor relative performance and selective recent de-rating (that is, the market lowering its expectations, causing the stock price to fall) in the second half of 2013.
• With respect to valuation, our main concern is that stock markets have done well principally through re-rating (the market changing its view of a company, causing a stock's price to move, in this case higher) on stagnant earnings estimates, stoked by the liquidity arising from central banks' monetary policies. Two ways of losing money in investing are having either the cash flows or the multiples disappear — or both. The market seems to have well and truly accepted that recovery is around the corner in the principal markets of the U.S., Japan and Europe, hence the re-rating. If this seemingly priced-in recovery does not come through in 2014, we rather doubt the market will continue to re-rate disappointing earnings expectations for a third year running. If the re-rating of lower-quality cyclical stocks does continue in the absence of earnings growth, watch out for fireworks.
• The prospect of this recovery is made all the more difficult by the persistent ratcheting down of inflation expectations, especially in the U.S. and Europe. Earnings growth against a backdrop of a near 1% U.S. Personal Consumption Expenditures (PCE) inflation index could be much more of a headwind than the market anticipates. Indeed, each time U.S. inflation has dropped to 1% (most recently in 1998, 2001-02 and 2008-09) it has been a dangerous time for equities because such low levels of inflation have in the recent past dramatically increased the risk of bankruptcies. We are nudging towards such 1% levels, but the market is exalting more at the prospect of a low inflation, good earnings growth scenario, stoked by continued QE from the incoming chair of the U.S. Federal Reserve Janet Yellen and the prospect of QE by Mario Draghi, Governor of the European Central Bank. If the market finds low inflation less favorable, we may see history repeat, especially if earnings growth disappoints.
• The implication for the Portfolio is that, on a bottom-up stock basis, we find it difficult to find
4
Morgan Stanley Institutional Fund, Inc.
Annual Report — December 31, 2013
Investment Overview (unaudited) (cont'd)
International Equity Portfolio
value in the cyclical recovery sectors — especially consumer discretionary, industrials and banks. To us, the industrials look generally close to peak margins, and financials are less attractive.
• This time last year, we found good value in the two opposite ends of the spectrum — Japan and high quality. We are, however, now struggling to find value in Japan post the market rise, and, in our view, are not seeing much general improvement in the way that Japanese companies are being run. For the Japanese economy to move in the right direction, wages have to rise in real terms, exceeding the increase in consumer price inflation caused by yen depreciation — the opposite to what is now happening, where Japanese consumers' purchasing power is currently getting squeezed. True, bonuses are rising significantly, but only in a few sectors of the economy, and they can be eliminated quickly. If corporate Japan does not obey Prime Minister Shinzo Abe's exhortations to increase real wages in 2014, the Japanese market may stumble on disappointment over the progress of Abenomics, although negative sentiment could be cushioned by an announcement from Bank of Japan Governor Haruhiko Kuroda that he will do "what it takes," as Mario Draghi did at the helm of the European Central Bank. What that means in practical terms is (more) monumental QE being unleashed, designed to diminish the yen. Given we see this as more likely than not, we continue to hedge the yen. We are, on balance, still positive about Japan in the short-to-medium term as we see the most likely scenario as asset price inflation aided by Mr. Kuroda. However, longer term we are skeptical about the prospects for a sustained economic recovery and are increasingly concerned about back peddling by Mr. Abe on necessary structural reforms.
• The weaker yen, down 35% against the U.S. dollar since November 2012, is already helping to export deflation to the U.S. and Europe as Japanese exporters of capital equipment and cars are cutting prices to gain market share in the time-honored way, and this is putting pressure on Asia Pacific, Chinese, and possibly German and U.S. competitors to cut their export prices too. This is the scenario that softened up emerging markets in the Asia Pacific region in 1997 for their big declines in 1998. While we believe that most Asia Pacific emerging markets are in much better shape today than in 1998, we are concerned that the market appears to have forgotten just how destabilising a weak yen can be and may be reminded of this in 2014.
• While the markets are consumed with uncertainties about the Fed's tapering, we are also concerned about how the Western world will shrink its high debt levels, which is a challenging proposition aggravated by the difficulties in exiting QE. It is entirely possible that we could be stuck in current low nominal (though high real) interest rates for years to come. The market is clearly not worrying about this, as indicated by the fall in the price of gold in 2013.
• In general, equity markets do not look particularly cheap to us going into 2014, although that has never stopped them in the past from going up. Happily, we believe that high quality is still reasonably priced, especially after its relative lag in 2013, caused principally by rising real interest rates and emerging markets angst. The consumer staples sector is one of the most sensitive of all market sectors to both of these concerns, and has paid the short-term price in 2013, especially tobacco. We are prepared to look through the short-term noise of falling emerging markets currencies and some temporary fall off in demand, as we believe the long-term growth story around emerging markets consumers looks intact. Furthermore, we believe high quality will be able to continue to compound in most scenarios, and that that ability may well be called upon in 2014.
* Minimum Investment for Class I shares
In accordance with SEC regulations, the Portfolio's performance shown assumes that all recurring fees (including management fees) were deducted and all dividends and distributions were reinvested. The performance of Class A+, L and IS shares will vary from Class I shares based upon their different inception dates and will be negatively impacted by additional fees assessed to those classes (if applicable).
5
Morgan Stanley Institutional Fund, Inc.
Annual Report — December 31, 2013
Investment Overview (unaudited) (cont'd)
International Equity Portfolio
Performance Compared to the Morgan Stanley Capital International (MSCI) EAFE Index(1) and the Lipper International Large-Cap Core Funds Index(2)
| | | Period Ended December 31, 2013
Total Returns(3) | |
| | | | | Average Annual | |
| | | One
Year | | Five
Years | | Ten
Years | | Since
Inception(8) | |
Portfolio — Class I Shares
w/o sales charges(4) | | | 20.39 | % | | | 11.39 | % | | | 7.02 | % | | | 9.43 | % | |
MSCI EAFE Index | | | 22.78 | | | | 12.44 | | | | 6.91 | | | | 4.89 | | |
Lipper International Large-Cap Core
Funds Index | | | 20.67 | | | | 11.74 | | | | 6.37 | | | | 6.85 | | |
Portfolio — Class A+ Shares
w/o sales charges(5) | | | 20.13 | | | | 11.11 | | | | 6.76 | | | | 8.65 | | |
Portfolio — Class A+ Shares with
maximum 5.25% sales charges(5) | | | 13.79 | | | | 9.92 | | | | 6.19 | | | | 8.32 | | |
MSCI EAFE Index | | | 22.78 | | | | 12.44 | | | | 6.91 | | | | 5.27 | | |
Lipper International Large-Cap Core
Funds Index | | | 20.67 | | | | 11.74 | | | | 6.37 | | | | 6.23 | | |
Portfolio — Class L Shares
w/o sales charges(6) | | | 19.49 | | | | — | | | | — | | | | 23.84 | | |
MSCI EAFE Index | | | 22.78 | | | | — | | | | — | | | | 27.97 | | |
Lipper International Large-Cap Core
Funds Index | | | 20.67 | | | | — | | | | — | | | | 26.66 | | |
Portfolio — Class IS Shares
w/o sales charges(7) | | | — | | | | — | | | | — | | | | 7.42 | | |
MSCI EAFE Index | | | — | | | | — | | | | — | | | | 7.78 | | |
Lipper International Large-Cap Core
Funds Index | | | — | | | | — | | | | — | | | | 7.32 | | |
Performance data quoted represents past performance, which is no guarantee of future results, and current performance may be lower or higher than the figures shown. Performance assumes that all dividends and distributions, if any, were reinvested. For the most recent month-end performance figures, please visit www.morganstanley.com/im. Investment return and principal value will fluctuate so that Portfolio shares, when redeemed, may be worth more or less than their original cost. Total returns do not reflect the deduction of taxes that a shareholder would pay on Portfolio distributions or the redemption of Portfolio shares. Returns for periods less than one year are not annualized. Performance of share classes will vary due to difference in expenses.
+ Effective September 9, 2013, Class P shares were renamed Class A shares.
(1) The Morgan Stanley Capital International (MSCI) EAFE Index (Europe, Australasia, Far East) is a free float-adjusted market capitalization index that is designed to measure the international equity market performance of developed markets, excluding the US & Canada. The term "free float" represents the portion of shares outstanding that are deemed to be available for purchase in the public equity markets by investors. The MSCI EAFE Index currently consists of 21 developed market country indices. The performance of the Index is listed in U.S. dollars and assumes reinvestment of net dividends. The Index is unmanaged and its returns do not include any sales charges or fees. Such costs would lower performance. It is not possible to invest directly in an index.
(2) The Lipper International Large-Cap Core Funds Index is an equally weighted performance index of the largest qualifying funds (based on net assets) in the Lipper International Large-Cap Core Funds classification. The Index, which is adjusted for capital gains distributions and income dividends, is unmanaged and
should not be considered an investment. There are currently 30 funds represented in this Index. As of the date of this report, the Portfolio is in the Lipper International Large-Cap Core Funds classification.
(3) Total returns for the Portfolio reflect fees waived and expenses reimbursed, if applicable, by the Adviser. Without such waivers and reimbursements, total returns would have been lower. The fee waivers and/or expense reimbursements will continue for at least one year or until such time as the Fund's Board of Directors acts to discontinue all or a portion of such waivers and/or expense reimbursements when it deems that such action is appropriate.
(4) Commenced operations on August 4, 1989.
(5) Commenced offering on January 2, 1996.
(6) Commenced offering on June 14, 2012.
(7) Commenced offering on September 13, 2013.
(8) For comparative purposes, average annual since inception returns listed for the Indexes refer to the inception date or initial offering of the respective share class of the Portfolio, not the inception of the Index. Returns for periods less than one year are not annualized.
Portfolio Composition
Classification | | Percentage of
Total Investments | |
Other* | | | 46.0 | % | |
Pharmaceuticals | | | 13.2 | | |
Insurance | | | 9.7 | | |
Food Products | | | 9.3 | | |
Oil, Gas & Consumable Fuels | | | 7.8 | | |
Commercial Banks | | | 7.3 | | |
Tobacco | | | 6.7 | | |
Total Investments | | | 100.0 | %** | |
* Industries and/or investment types representing less than 5% of total investments.
** Does not include open foreign currency forward exchange contracts with total unrealized appreciation of approximately $7,891,000.
6
Morgan Stanley Institutional Fund, Inc.
Annual Report — December 31, 2013
Portfolio of Investments
International Equity Portfolio
| | | Shares | | Value
(000) | |
Common Stocks (98.4%) | |
Australia (1.5%) | |
Santos Ltd. | | | 4,985,121 | | | $ | 65,122 | | |
WorleyParsons Ltd. (a) | | | 1,258,540 | | | | 18,654 | | |
| | | | 83,776 | | |
Canada (1.2%) | |
Barrick Gold Corp. | | | 3,302,275 | | | | 58,165 | | |
Turquoise Hill Resources Ltd. (a)(b) | | | 3,155,190 | | | | 10,426 | | |
| | | | 68,591 | | |
China (1.6%) | |
China Petroleum & Chemical Corp.
H Shares (c) | | | 105,988,000 | | | | 86,520 | | |
France (7.8%) | |
BNP Paribas SA | | | 802,804 | | | | 62,565 | | |
LVMH Moet Hennessy Louis Vuitton SA | | | 377,628 | | | | 68,886 | | |
Sanofi | | | 2,146,752 | | | | 227,758 | | |
Vallourec SA | | | 1,240,660 | | | | 67,588 | | |
| | | | 426,797 | | |
Germany (8.6%) | |
BASF SE | | | 577,622 | | | | 61,576 | | |
Bayer AG (Registered) | | | 909,356 | | | | 127,539 | | |
Continental AG | | | 443,236 | | | | 97,196 | | |
HeidelbergCement AG | | | 337,733 | | | | 25,624 | | |
SAP AG | | | 1,876,675 | | | | 160,868 | | |
| | | | 472,803 | | |
Hong Kong (0.5%) | |
AIA Group Ltd. | | | 5,986,500 | | | | 30,032 | | |
Ireland (1.3%) | |
CRH PLC | | | 2,859,208 | | | | 71,981 | | |
Italy (1.4%) | |
Eni SpA | | | 3,213,870 | | | | 77,329 | | |
Japan (18.2%) | |
Asatsu-DK, Inc. (a) | | | 377,785 | | | | 8,843 | | |
Astellas Pharma, Inc. | | | 222,100 | | | | 13,139 | | |
Hitachi Ltd. | | | 6,006,000 | | | | 45,397 | | |
Hoya Corp. | | | 1,064,800 | | | | 29,545 | | |
Inpex Corp. | | | 6,920,900 | | | | 88,590 | | |
Keyence Corp. | | | 98,010 | | | | 41,881 | | |
Kyocera Corp. | | | 1,416,600 | | | | 70,622 | | |
Lawson, Inc. (a) | | | 682,300 | | | | 50,989 | | |
Mitsubishi Electric Corp. | | | 3,656,000 | | | | 45,826 | | |
Mitsubishi Estate Co., Ltd. | | | 2,533,000 | | | | 75,646 | | |
MS&AD Insurance Group Holdings | | | 1,235,500 | | | | 33,108 | | |
NGK Spark Plug Co., Ltd. | | | 1,887,000 | | | | 44,617 | | |
Nitto Denko Corp. | | | 247,000 | | | | 10,402 | | |
NKSJ Holdings, Inc. | | | 2,505,400 | | | | 69,564 | | |
NTT DoCoMo, Inc. | | | 3,431,100 | | | | 56,202 | | |
Sekisui House Ltd. | | | 4,836,200 | | | | 67,507 | | |
Sumco Corp. (a) | | | 2,239,700 | | | | 19,736 | | |
Sumitomo Mitsui Financial Group, Inc. | | | 1,663,251 | | | | 85,603 | | |
Sumitomo Mitsui Trust Holdings, Inc. | | | 9,216,999 | | | | 48,487 | | |
Toyota Motor Corp. | | | 1,528,800 | | | | 93,200 | | |
| | | | 998,904 | | |
| | | Shares | | Value
(000) | |
Netherlands (6.5%) | |
Akzo Nobel N.V. | | | 768,116 | | | $ | 59,534 | | |
ArcelorMittal (a) | | | 2,295,214 | | | | 40,953 | | |
Unilever N.V. CVA | | | 6,313,072 | | | | 254,250 | | |
| | | | 354,737 | | |
Sweden (1.3%) | |
Nordea Bank AB | | | 5,192,453 | | | | 69,953 | | |
Switzerland (15.7%) | |
Credit Suisse Group AG (Registered) (b) | | | 2,384,439 | | | | 72,892 | | |
Holcim Ltd. (Registered) (b) | | | 677,927 | | | | 50,728 | | |
Nestle SA (Registered) | | | 3,494,454 | | | | 255,802 | | |
Novartis AG (Registered) | | | 2,412,652 | | | | 192,569 | | |
Roche Holding AG (Genusschein) | | | 576,727 | | | | 161,112 | | |
Swisscom AG (Registered) | | | 69,197 | | | | 36,528 | | |
Zurich Insurance Group AG (b) | | | 321,296 | | | | 93,106 | | |
| | | | 862,737 | | |
United Kingdom (32.3%) | |
Admiral Group PLC | | | 2,765,750 | | | | 59,997 | | |
Aggreko PLC (a) | | | 3,014,621 | | | | 85,314 | | |
BG Group PLC | | | 5,283,083 | | | | 113,512 | | |
BHP Billiton PLC | | | 1,484,529 | | | | 45,946 | | |
British American Tobacco PLC | | | 4,685,573 | | | | 251,239 | | |
Bunzl PLC | | | 723,401 | | | | 17,370 | | |
Diageo PLC | | | 4,836,376 | | | | 160,176 | | |
Glencore Xstrata PLC (b) | | | 5,237,659 | | | | 27,121 | | |
HSBC Holdings PLC | | | 8,828,754 | | | | 96,843 | | |
Imperial Tobacco Group PLC | | | 3,003,621 | | | | 116,289 | | |
Legal & General Group PLC | | | 6,659,938 | | | | 24,561 | | |
Lloyds Banking Group PLC (b) | | | 27,568,484 | | | | 36,010 | | |
Prudential PLC | | | 6,229,435 | | | | 138,229 | | |
Reckitt Benckiser Group PLC | | | 3,006,999 | | | | 238,665 | | |
Resolution Ltd. | | | 14,031,159 | | | | 82,252 | | |
Rio Tinto PLC | | | 1,153,482 | | | | 65,125 | | |
Smiths Group PLC | | | 2,378,945 | | | | 58,303 | | |
Vodafone Group PLC | | | 19,662,748 | | | | 77,168 | | |
Weir Group PLC (The) | | | 2,398,930 | | | | 84,694 | | |
| | | | 1,778,814 | | |
United States (0.5%) | |
Dr. Pepper Snapple Group, Inc. (a) | | | 577,274 | | | | 28,125 | | |
Total Common Stocks (Cost $4,281,866) | | | 5,411,099 | | |
Rights (0.1%) | |
Canada (0.1%) | |
Turquoise Hill Resources Ltd. (a)(b)
(Cost $5,586) | | | 3,149,811 | | | | 2,965 | | |
Short-Term Investments (1.8%) | |
Securities held as Collateral on Loaned Securities (0.5%) | |
Investment Company (0.4%) | |
Morgan Stanley Institutional Liquidity
Funds — Money Market Portfolio —
Institutional Class (See Note G) | | | 24,984,154 | | | | 24,984 | | |
The accompanying notes are an integral part of the financial statements.
7
Morgan Stanley Institutional Fund, Inc.
Annual Report — December 31, 2013
Portfolio of Investments (cont'd)
International Equity Portfolio
| | | Face
Amount
(000) | | Value
(000) | |
Repurchase Agreements (0.1%) | |
BNP Paribas Securities Corp., (0.01%,
dated 12/31/13, due 1/2/14; proceeds
$2,250; fully collateralized by various
U.S. Government Obligations;
0.63% - 3.63% due 8/15/16 - 2/15/21;
valued at $2,295) | | $ | 2,250 | | | $ | 2,250 | | |
Merrill Lynch & Co., Inc., (0.18%,
dated 12/31/13, due 1/2/14; proceeds
$1,608; fully collateralized by various
Common Stocks and Exchange Traded
Funds; valued at $1,737) | | | 1,608 | | | | 1,608 | | |
| | | | 3,858 | | |
Total Securities held as Collateral on
Loaned Securities (Cost $28,842) | | | 28,842 | | |
Investment Company (1.3%) | |
Morgan Stanley Institutional Liquidity Funds —
Treasury Securities Portfolio —
Institutional Class (See Note G)
(Cost $73,675) | | | 73,675,053 | | | | 73,675 | | |
Total Short-Term Investments (Cost $102,517) | | | 102,517 | | |
Total Investments (100.3%) (Cost $4,389,969)
Including $28,942 of Securities Loaned (d) | | | 5,516,581 | | |
Liabilities in Excess of Other Assets (-0.3%) | | | (16,528 | ) | |
Net Assets (100.0%) | | $ | 5,500,053 | | |
(a) All or a portion of this security was on loan at December 31, 2013.
(b) Non-income producing security.
(c) Security trades on the Hong Kong exchange.
(d) Securities are available for collateral in connection with an open foreign currency forward exchange contract.
CVA Certificaten Van Aandelen.
Foreign Currency Forward Exchange Contract:
The Portfolio had the following foreign currency forward exchange contracts open at December 31, 2013:
Counterparty | | Currency to
Deliver
(000) | | Value
(000) | | Settlement
Date | | In Exchange
For
(000) | | Value
(000) | | Unrealized
Appreciation
(000) | |
Commonwealth Bank of Australia | | JPY | 30,455,000 | | | $ | 289,208 | | | 1/17/14 | | USD | 297,099 | | | $ | 297,099 | | | $ | 7,891 | | |
JPY — Japanese Yen
USD — United States Dollar
The accompanying notes are an integral part of the financial statements.
8
Morgan Stanley Institutional Fund, Inc.
Annual Report — December 31, 2013
International Equity Portfolio
Statement of Assets and Liabilities | | December 31, 2013
(000) | |
Assets: | |
Investments in Securities of Unaffiliated Issuers, at Value(1) (Cost $4,291,310) | | $ | 5,417,922 | | |
Investment in Security of Affiliated Issuer, at Value (Cost $98,659) | | | 98,659 | | |
Total Investments in Securities, at Value (Cost $4,389,969) | | | 5,516,581 | | |
Foreign Currency, at Value (Cost $—@) | | | — | @ | |
Cash | | | 881 | | |
Receivable for Investments Sold | | | 37,585 | | |
Tax Reclaim Receivable | | | 12,363 | | |
Unrealized Appreciation on Foreign Currency Forward Exchange Contracts | | | 7,891 | | |
Receivable for Portfolio Shares Sold | | | 2,060 | | |
Dividends Receivable | | | 1,868 | | |
Receivable from Affiliate | | | 1 | | |
Other Assets | | | 134 | | |
Total Assets | | | 5,579,364 | | |
Liabilities: | |
Payable for Portfolio Shares Redeemed | | | 35,721 | | |
Collateral on Securities Loaned, at Value | | | 29,723 | | |
Payable for Advisory Fees | | | 10,354 | | |
Payable for Sub Transfer Agency Fees | | | 1,348 | | |
Payable for Sub Transfer Agency Fees — Class I | | | 710 | | |
Payable for Sub Transfer Agency Fees — Class A* | | | 293 | | |
Payable for Sub Transfer Agency Fees — Class L | | | 7 | | |
Payable for Administration Fees | | | 365 | | |
Payable for Shareholder Services Fees — Class A* | | | 313 | | |
Payable for Distribution and Shareholder Services Fees — Class L | | | 8 | | |
Payable for Directors' Fees and Expenses | | | 140 | | |
Payable for Custodian Fees | | | 104 | | |
Payable for Investments Purchased | | | 48 | | |
Payable for Transfer Agent Fees | | | 11 | | |
Payable for Transfer Agent Fees — Class I | | | 3 | | |
Payable for Transfer Agent Fees — Class A* | | | 4 | | |
Payable for Transfer Agent Fees — Class L | | | 1 | | |
Payable for Professional Fees | | | 8 | | |
Other Liabilities | | | 150 | | |
Total Liabilities | | | 79,311 | | |
Net Assets | | $ | 5,500,053 | | |
Net Assets Consist Of: | |
Paid-in-Capital | | $ | 4,476,590 | | |
Accumulated Undistributed Net Investment Income | | | 18,659 | | |
Accumulated Net Realized Loss | | | (130,369 | ) | |
Unrealized Appreciation (Depreciation) on: | |
Investments | | | 1,126,612 | | |
Foreign Currency Forward Exchange Contract | | | 7,891 | | |
Foreign Currency Translations | | | 670 | | |
Net Assets | | $ | 5,500,053 | | |
The accompanying notes are an integral part of the financial statements.
9
Morgan Stanley Institutional Fund, Inc.
Annual Report — December 31, 2013
International Equity Portfolio
Statement of Assets and Liabilities (cont'd) | | December 31, 2013
(000) | |
CLASS I: | |
Net Assets | | $ | 3,694,164 | | |
| Shares Outstanding $0.001 par value shares of beneficial interest (500,000,000 shares authorized) (not in 000's) | | | 217,517,531 | | |
Net Asset Value, Offering and Redemption Price Per Share | | $ | 16.98 | | |
CLASS A*: | |
Net Assets | | $ | 1,508,564 | | |
| Shares Outstanding $0.001 par value shares of beneficial interest (500,000,000 shares authorized) (not in 000's) | | | 89,914,807 | | |
Net Asset Value, Redemption Price Per Share | | $ | 16.78 | | |
Maximum Sales Load§§ | | | 5.25 | % | |
Maximum Sales Charge | | $ | 0.93 | | |
Maximum Offering Price Per Share | | $ | 17.71 | | |
CLASS L: | |
Net Assets | | $ | 12,072 | | |
| Shares Outstanding $0.001 par value shares of beneficial interest (500,000,000 shares authorized) (not in 000's) | | | 722,574 | | |
Net Asset Value, Offering and Redemption Price Per Share | | $ | 16.71 | | |
CLASS IS: | |
Net Assets | | $ | 285,253 | | |
| Shares Outstanding $0.001 par value shares of beneficial interest (500,000,000 shares authorized) (not in 000's) | | | 16,795,778 | | |
Net Asset Value, Offering and Redemption Price Per Share | | $ | 16.98 | | |
(1) Including:
Securities on Loan, at Value: | | $ | 28,942 | | |
@ Amount is less than $500.
* Effective September 9, 2013, Class P and Class H shares were renamed Class A shares.
§§ Effective February 25, 2013, the Directors approved the imposition of a maximum initial sales charge of 5.25% on purchases of Class A shares of the Portfolio.
The accompanying notes are an integral part of the financial statements.
10
Morgan Stanley Institutional Fund, Inc.
Annual Report — December 31, 2013
International Equity Portfolio
Statement of Operations | | Year Ended
December 31, 2013
(000) | |
Investment Income: | |
Dividends from Securities of Unaffiliated Issuers (Net of $9,404 of Foreign Taxes Withheld) | | $ | 147,395 | | |
Income from Securities Loaned — Net | | | 2,321 | | |
Interest from Securities of Affiliated Issuers (Note G) | | | 13 | | |
Interest from Securities of Unaffiliated Issuers | | | 1 | | |
Total Investment Income | | | 149,730 | | |
Expenses: | |
Advisory Fees (Note B) | | | 41,018 | | |
Sub Transfer Agency Fees | | | 2,911 | | |
Sub Transfer Agency Fees — Class I | | | 891 | | |
Sub Transfer Agency Fees — Class A* | | | 464 | | |
Sub Transfer Agency Fees — Class L | | | 7 | | |
Administration Fees (Note C) | | | 4,102 | | |
Shareholder Services Fees — Class A* (Note D) | | | 3,248 | | |
Distribution and Shareholder Services Fees — Class L (Note D) | | | 90 | | |
Custodian Fees (Note F) | | | 703 | | |
Shareholder Reporting Fees | | | 216 | | |
Professional Fees | | | 125 | | |
Registration Fees | | | 118 | | |
Transfer Agency Fees (Note E) | | | 101 | | |
Transfer Agency Fees — Class I (Note E) | | | 4 | | |
Transfer Agency Fees — Class A* (Note E) | | | 5 | | |
Transfer Agency Fees — Class L (Note E) | | | 1 | | |
Transfer Agency Fees — Class IS (Note E) | | | — | @ | |
Directors' Fees and Expenses | | | 111 | | |
Pricing Fees | | | 7 | | |
Other Expenses | | | 98 | | |
Expenses Before Non Operating Expenses | | | 54,220 | | |
Reorganization Expense | | | (248 | )** | |
Total Expenses | | | 53,972 | | |
Waiver of Advisory Fees (Note B) | | | (1,432 | ) | |
Reimbursement of Class Specific Expenses — Class I (Note B) | | | (458 | ) | |
Reimbursement of Class Specific Expenses — Class L (Note B) | | | (3 | ) | |
Reimbursement of Class Specific Expenses — Class IS (Note B) | | | (— | @) | |
Rebate from Morgan Stanley Affiliate (Note G) | | | (175 | ) | |
Net Expenses | | | 51,904 | | |
Net Investment Income | | | 97,826 | | |
Realized Gain (Loss): | |
Investments Sold | | | 226,972 | | |
Foreign Currency Forward Exchange Contracts | | | 11,358 | | |
Foreign Currency Transactions | | | (3,054 | ) | |
Net Realized Gain | | | 235,276 | | |
Change in Unrealized Appreciation (Depreciation): | |
Investments | | | 614,737 | | |
Foreign Currency Forward Exchange Contracts | | | 7,891 | | |
Foreign Currency Translations | | | 359 | | |
Net Change in Unrealized Appreciation (Depreciation) | | | 622,987 | | |
Net Realized Gain and Change in Unrealized Appreciation (Depreciation) | | | 858,263 | | |
Net Increase in Net Assets Resulting from Operations | | $ | 956,089 | | |
@ Amount is less than $500.
* Effective September 9, 2013, Class P and Class H shares were renamed Class A shares.
** Over accrued of reorganization expense.
The accompanying notes are an integral part of the financial statements.
11
Morgan Stanley Institutional Fund, Inc.
Annual Report — December 31, 2013
International Equity Portfolio
Statements of Changes in Net Assets | | Year Ended
December 31,
2013
(000) | | Year Ended
December 31,
2012
(000) | |
Increase in Net Assets: | |
Operations: | |
Net Investment Income | | $ | 97,826 | | | $ | 95,327 | | |
Net Realized Gain | | | 235,276 | | | | 131,511 | | |
Net Change in Unrealized Appreciation (Depreciation) | | | 622,987 | | | | 540,703 | | |
Net Increase in Net Assets Resulting from Operations | | | 956,089 | | | | 767,541 | | |
Distributions from and/or in Excess of: | |
Class I: | |
Net Investment Income | | | (61,929 | ) | | | (74,837 | ) | |
Class A**: | |
Net Investment Income | | | (21,534 | ) | | | (18,728 | ) | |
Class H@: | |
Net Investment Income | | | (21 | ) | | | (1,424 | ) | |
Class L: | |
Net Investment Income | | | (113 | ) | | | (237 | ) | |
Class IS: | |
Net Investment Income | | | (4,460 | )**** | | | — | | |
Total Distributions | | | (88,057 | ) | | | (95,226 | ) | |
Capital Share Transactions:(1) | |
Class I: | |
Subscribed | | | 400,704 | | | | 557,092 | | |
Issued due to a tax-free reorganization | | | — | | | | 83,759 | | |
Distributions Reinvested | | | 58,555 | | | | 70,787 | | |
Redeemed | | | (1,035,172 | ) | | | (556,786 | ) | |
Class A**: | |
Subscribed | | | 253,588 | | | | 54,947 | | |
Distributions Reinvested | | | 21,495 | | | | 18,719 | | |
Conversion from Class H | | | 67,123 | | | | — | | |
Redeemed | | | (58,505 | ) | | | (129,416 | ) | |
Class H@: | |
Subscribed | | | 1,172 | *** | | | 317 | * | |
Issued due to a tax-free reorganization | | | — | | | | 69,743 | * | |
Distributions Reinvested | | | 20 | *** | | | 1,383 | * | |
Conversion to Class A | | | (67,123 | )*** | | | — | | |
Redeemed | | | (9,758 | )*** | | | (4,231 | )* | |
Class L: | |
Subscribed | | | 623 | | | | 11 | * | |
Issued due to a tax-free reorganization | | | — | | | | 12,208 | * | |
Distributions Reinvested | | | 111 | | | | 228 | * | |
Redeemed | | | (2,679 | ) | | | (851 | )* | |
Class IS: | |
Subscribed | | | 273,544 | **** | | | — | | |
Distributions Reinvested | | | 4,460 | **** | | | — | | |
Redeemed | | | (1,849 | )**** | | | — | | |
Net Increase (Decrease) in Net Assets Resulting from Capital Share Transactions | | | (93,691 | ) | | | 177,910 | | |
Redemption Fees | | | 41 | | | | 41 | | |
Total Increase in Net Assets | | | 774,382 | | | | 850,266 | | |
Net Assets: | |
Beginning of Period | | | 4,725,671 | | | | 3,875,405 | | |
End of Period (Including Accumulated Undistributed Net Investment Income of $18,659 and $551) | | $ | 5,500,053 | | | $ | 4,725,671 | | |
The accompanying notes are an integral part of the financial statements.
12
Morgan Stanley Institutional Fund, Inc.
Annual Report — December 31, 2013
International Equity Portfolio
Statements of Changes in Net Assets (cont'd) | | Year Ended
December 31,
2013
(000) | | Year Ended
December 31,
2012
(000) | |
(1) Capital Share Transactions: | |
Class I: | |
Shares Subscribed | | | 25,635 | | | | 41,652 | | |
Shares Issued due to a tax-free reorganization | | | — | | | | 6,026 | | |
Shares Issued on Distributions Reinvested | | | 3,606 | | | | 4,964 | | |
Shares Redeemed | | | (64,753 | ) | | | (41,281 | ) | |
Net Increase (Decrease) in Class I Shares Outstanding | | | (35,512 | ) | | | 11,361 | | |
Class A**: | |
Shares Subscribed | | | 16,526 | | | | 4,319 | | |
Shares Issued on Distributions Reinvested | | | 1,340 | | | | 1,328 | | |
Conversion from Class H | | | 4,322 | | | | — | | |
Shares Redeemed | | | (3,685 | ) | | | (9,887 | ) | |
Net Increase (Decrease) in Class A** Shares Outstanding | | | 18,503 | | | | (4,240 | ) | |
Class H@: | |
Shares Subscribed | | | 77 | *** | | | 24 | | |
Shares Issued due to a tax-free reorganization | | | — | | | | 5,091 | | |
Shares Issued on Distributions Reinvested | | | 1 | *** | | | 98 | | |
Conversion to Class A | | | (4,336 | )*** | | | — | | |
Shares Redeemed | | | (652 | )*** | | | (303 | ) | |
Net Increase (Decrease) in Class H Shares Outstanding | | | (4,910 | ) | | | 4,910 | | |
Class L: | |
Shares Subscribed | | | 41 | | | | 1 | | |
Shares Issued due to a tax-free reorganization | | | — | | | | 892 | | |
Shares Issued on Distributions Reinvested | | | 7 | | | | 17 | | |
Shares Redeemed | | | (174 | ) | | | (61 | ) | |
Net Increase (Decrease) in Class L Shares Outstanding | | | (126 | ) | | | 849 | | |
Class IS: | |
Shares Subscribed | | | 16,635 | **** | | | — | | |
Shares Issued on Distributions Reinvested | | | 274 | **** | | | — | | |
Shares Redeemed | | | (113 | )**** | | | — | | |
Net Increase in Class IS Shares Outstanding | | | 16,796 | | | | — | | |
@ Effective September 9, 2013, Class H shares converted into Class A shares.
* For the period June 14, 2012 to December 31, 2012.
** Effective September 9, 2013, Class P shares were renamed Class A shares.
*** For the period January 1, 2013 through September 6, 2013.
**** For the period September 13, 2013 through December 31, 2013.
The accompanying notes are an integral part of the financial statements.
13
Morgan Stanley Institutional Fund, Inc.
Annual Report — December 31, 2013
Financial Highlights
International Equity Portfolio
| | | Class I | |
| | | Year Ended December 31, | |
Selected Per Share Data and Ratios | | 2013 | | 2012 | | 2011 | | 2010 | | 2009 | |
Net Asset Value, Beginning of Period | | $ | 14.35 | | | $ | 12.25 | | | $ | 13.61 | | | $ | 13.02 | | | $ | 11.01 | | |
Income (Loss) from Investment Operations: | |
Net Investment Income† | | | 0.32 | | | | 0.31 | | | | 0.32 | | | | 0.26 | | | | 0.27 | | |
Net Realized and Unrealized Gain (Loss) | | | 2.59 | | | | 2.09 | | | | (1.37 | ) | | | 0.53 | | | | 2.10 | | |
Total from Investment Operations | | | 2.91 | | | | 2.40 | | | | (1.05 | ) | | | 0.79 | | | | 2.37 | | |
Distributions from and/or in Excess of: | |
Net Investment Income | | | (0.28 | ) | | | (0.30 | ) | | | (0.31 | ) | | | (0.20 | ) | | | (0.36 | ) | |
Redemption Fees | | | 0.00 | ‡ | | | 0.00 | ‡ | | | 0.00 | ‡ | | | 0.00 | ‡ | | | 0.00 | ‡ | |
Net Asset Value, End of Period | | $ | 16.98 | | | $ | 14.35 | | | $ | 12.25 | | | $ | 13.61 | | | $ | 13.02 | | |
Total Return++ | | | 20.39 | % | | | 19.60 | % | | | (7.63 | )% | | | 6.08 | % | | | 21.56 | % | |
Ratios and Supplemental Data: | |
Net Assets, End of Period (Thousands) | | $ | 3,694,164 | | | $ | 3,631,307 | | | $ | 2,959,403 | | | $ | 3,372,029 | | | $ | 3,148,980 | | |
Ratio of Expenses to Average Net Assets (1) | | | 0.94 | %+ | | | 0.95 | %+ | | | 0.95 | %+†† | | | 0.95 | %+†† | | | 0.94 | %+ | |
Ratio of Expenses to Average Net Assets Excluding Non Operating Expenses | | | 0.95 | %+ | | | N/A | | | | 0.95 | %+†† | | | 0.95 | %+†† | | | 0.94 | %+ | |
Ratio of Net Investment Income to Average Net Assets (1) | | | 2.04 | %+ | | | 2.31 | %+ | | | 2.36 | %+†† | | | 2.05 | %+†† | | | 2.35 | %+ | |
Ratio of Rebate from Morgan Stanley Affiliates to Average Net Assets | | | 0.00 | %§ | | | 0.00 | %§ | | | 0.00 | %††§ | | | 0.00 | %††§ | | | 0.01 | % | |
Portfolio Turnover Rate | | | 29 | % | | | 23 | % | | | 34 | % | | | 40 | % | | | 38 | % | |
(1) Supplemental Information on the Ratios to Average Net Assets: | |
Ratios Before Expense Limitation: | |
Expenses to Average Net Assets | | | 0.99 | % | | | 0.97 | % | | | 0.98 | %†† | | | 0.98 | %+†† | | | 0.95 | %+ | |
Net Investment Income to Average Net Assets | | | 1.99 | % | | | 2.29 | % | | | 2.33 | %†† | | | 2.02 | %+†† | | | 2.34 | %+ | |
† Per share amount is based on average shares outstanding.
‡ Amount is less than $0.005 per share.
++ Calculated based on the net asset value as of the last business day of the period.
+ The Ratios of Expenses and Net Investment Income reflect the rebate of certain Portfolio expenses in connection with the investments in Morgan Stanley affiliates during the period. The effect of the rebate on the ratios is disclosed in the above table as "Ratio of Rebate from Morgan Stanley Affiliates to Average Net Assets."
†† Reflects overall Portfolio ratios for investment income and non-class specific expenses.
§ Amount is less than 0.005%.
The accompanying notes are an integral part of the financial statements.
14
Morgan Stanley Institutional Fund, Inc.
Annual Report — December 31, 2013
Financial Highlights
International Equity Portfolio
| | | Class A@ | |
| | | Year Ended December 31, | |
Selected Per Share Data and Ratios | | 2013 | | 2012 | | 2011 | | 2010 | | 2009 | |
Net Asset Value, Beginning of Period | | $ | 14.18 | | | $ | 12.11 | | | $ | 13.45 | | | $ | 12.87 | | | $ | 10.90 | | |
Income (Loss) from Investment Operations: | |
Net Investment Income† | | | 0.25 | | | | 0.27 | | | | 0.28 | | | | 0.23 | | | | 0.23 | | |
Net Realized and Unrealized Gain (Loss) | | | 2.59 | | | | 2.07 | | | | (1.34 | ) | | | 0.51 | | | | 2.07 | | |
Total from Investment Operations | | | 2.84 | | | | 2.34 | | | | (1.06 | ) | | | 0.74 | | | | 2.30 | | |
Distributions from and/or in Excess of: | |
Net Investment Income | | | (0.24 | ) | | | (0.27 | ) | | | (0.28 | ) | | | (0.16 | ) | | | (0.33 | ) | |
Redemption Fees | | | 0.00 | ‡ | | | 0.00 | ‡ | | | 0.00 | ‡ | | | 0.00 | ‡ | | | 0.00 | ‡ | |
Net Asset Value, End of Period | | $ | 16.78 | | | $ | 14.18 | | | $ | 12.11 | | | $ | 13.45 | | | $ | 12.87 | | |
Total Return++ | | | 20.13 | % | | | 19.31 | % | | | (7.83 | )% | | | 5.78 | % | | | 21.18 | % | |
Ratios and Supplemental Data: | |
Net Assets, End of Period (Thousands) | | $ | 1,508,564 | | | $ | 1,012,956 | | | $ | 916,002 | | | $ | 928,966 | | | $ | 1,131,919 | | |
Ratio of Expenses to Average Net Assets (1) | | | 1.22 | %+^ | | | 1.20 | %+ | | | 1.20 | %+†† | | | 1.20 | %+†† | | | 1.19 | %+ | |
Ratio of Expenses to Average Net Assets Excluding Non Operating Expenses | | | 1.22 | %+^ | | | N/A | | | | 1.20 | %+†† | | | 1.20 | %+†† | | | 1.19 | %+ | |
Ratio of Net Investment Income to Average Net Assets (1) | | | 1.60 | %+ | | | 2.06 | %+ | | | 2.11 | %+†† | | | 1.80 | %+†† | | | 2.02 | %+ | |
Ratio of Rebate from Morgan Stanley Affiliates to Average Net Assets | | | 0.00 | %§ | | | 0.00 | %§ | | | 0.00 | %††§ | | | 0.00 | %††§ | | | 0.01 | % | |
Portfolio Turnover Rate | | | 29 | % | | | 23 | % | | | 34 | % | | | 40 | % | | | 38 | % | |
(1) Supplemental Information on the Ratios to Average Net Assets: | |
Ratios Before Expense Limitation: | |
Expenses to Average Net Assets | | | 1.25 | % | | | 1.22 | % | | | 1.23 | %†† | | | 1.23 | %+†† | | | 1.20 | %+ | |
Net Investment Income to Average Net Assets | | | 1.57 | % | | | 2.04 | % | | | 2.08 | %†† | | | 1.77 | %+†† | | | 2.01 | %+ | |
@ Effective September 9, 2013, Class P and Class H shares were renamed Class A shares.
† Per share amount is based on average shares outstanding.
‡ Amount is less than $0.005 per share.
++ Calculated based on the net asset value which does not reflect sales charges, if applicable, as of the last business day of the period.
+ The Ratios of Expenses and Net Investment Income reflect the rebate of certain Portfolio expenses in connection with the investments in Morgan Stanley affiliates during the period. The effect of the rebate on the ratios is disclosed in the above table as "Ratio of Rebate from Morgan Stanley Affiliates to Average Net Assets."
^ Effective September 16, 2013, the Adviser has agreed to limit the ratio of expenses to average net assets to the maximum ratio of 1.30% for Class A shares. Prior to September 16, 2013, the maximum ratio was 1.20% for Class A shares.
†† Reflects overall Portfolio ratios for investment income and non-class specific expenses.
§ Amount is less than 0.005%.
The accompanying notes are an integral part of the financial statements.
15
Morgan Stanley Institutional Fund, Inc.
Annual Report — December 31, 2013
Financial Highlights
International Equity Portfolio
| | | Class L | |
Selected Per Share Data and Ratios | | Year Ended
December 31,
2013 | | Period from
June 14, 2012^ to
December 31, 2012 | |
Net Asset Value, Beginning of Period | | $ | 14.12 | | | $ | 12.36 | | |
Income (Loss) from Investment Operations: | |
Net Investment Income (Loss)† | | | 0.19 | | | | (0.07 | ) | |
Net Realized and Unrealized Gain | | | 2.55 | | | | 2.11 | | |
Total from Investment Operations | | | 2.74 | | | | 2.04 | | |
Distributions from and/or in Excess of: | |
Net Investment Income | | | (0.15 | ) | | | (0.28 | ) | |
Redemption Fees | | | 0.00 | ‡ | | | 0.00 | ‡ | |
Net Asset Value, End of Period | | $ | 16.71 | | | $ | 14.12 | | |
Total Return++ | | | 19.49 | % | | | 16.53 | %# | |
Ratios and Supplemental Data: | |
Net Assets, End of Period (Thousands) | | $ | 12,072 | | | $ | 11,982 | | |
Ratio of Expenses to Average Net Assets (1) | | | 1.72 | %+^^ | | | 1.70 | %+* | |
Ratio of Expenses to Average Net Assets Excluding Non Operating Expenses | | | 1.73 | %+^^ | | | N/A | | |
Ratio of Net Investment Income (Loss) to Average Net Assets (1) | | | 1.24 | %+ | | | (0.91 | )%+* | |
Ratio of Rebate from Morgan Stanley Affiliates to Average Net Assets | | | 0.00 | %§ | | | 0.00 | %*§ | |
Portfolio Turnover Rate | | | 29 | % | | | 23 | %# | |
(1) Supplemental Information on the Ratios to Average Net Assets: | |
Ratios Before Expense Limitation: | |
Expenses to Average Net Assets | | | 1.78 | % | | | 1.70 | %* | |
Net Investment Income (Loss) to Average Net Assets | | | 1.18 | % | | | (0.91 | )%* | |
^ Commencement of Operations.
† Per share amount is based on average shares outstanding.
‡ Amount is less than $0.005 per share.
++ Calculated based on the net asset value as of the last business day of the period.
+ The Ratios of Expenses and Net Investment Income (Loss) reflect the rebate of certain Portfolio expenses in connection with the investments in Morgan Stanley affiliates during the period. The effect of the rebate on the ratios is disclosed in the above table as "Ratio of Rebate from Morgan Stanley Affiliates to Average Net Assets."
^^ Effective September 16, 2013, the Adviser has agreed to limit the ratio of expenses to average net assets to the maximum ratio of 1.80% for Class L shares. Prior to September 16, 2013, the maximum ratio was 1.70% for Class L shares.
§ Amount is less than 0.005%.
# Not Annualized.
* Annualized.
The accompanying notes are an integral part of the financial statements.
16
Morgan Stanley Institutional Fund, Inc.
Annual Report — December 31, 2013
Financial Highlights
International Equity Portfolio
| | | Class IS | |
Selected Per Share Data and Ratios | | Period from
September 13, 2013^ to
December 31, 2013 | |
Net Asset Value, Beginning of Period | | $ | 16.08 | | |
Income (Loss) from Investment Operations: | |
Net Investment Loss† | | | (0.01 | ) | |
Net Realized and Unrealized Gain | | | 1.19 | | |
Total from Investment Operations | | | 1.18 | | |
Distributions from and/or in Excess of: | |
Net Investment Income | | | (0.28 | ) | |
Redemption Fees | | | 0.00 | ‡ | |
Net Asset Value, End of Period | | $ | 16.98 | | |
Total Return++ | | | 7.42 | %# | |
Ratios and Supplemental Data: | |
Net Assets, End of Period (Thousands) | | $ | 285,253 | | |
Ratio of Expenses to Average Net Assets (1) | | | 0.91 | %+^^* | |
Ratio of Expenses to Average Net Assets Excluding Non Operating Expenses | | | 0.91 | %+^^* | |
Ratio of Net Investment Loss to Average Net Assets | | | (0.29 | )%+* | |
Ratio of Rebate from Morgan Stanley Affiliates to Average Net Assets | | | 0.00 | %§* | |
Portfolio Turnover Rate | | | 29 | %# | |
(1) Supplemental Information on the Ratios to Average Net Assets: | |
Ratios Before Expense Limitation: | |
Expenses to Average Net Assets | | | 0.91 | %* | |
Net Investment Loss to Average Net Assets | | | (0.29 | )%* | |
^ Commencement of Operations.
† Per share amount is based on average shares outstanding.
‡ Amount is less than $0.005 per share.
++ Calculated based on the net asset value as of the last business day of the period.
+ The Ratios of Expenses and Net Investment Loss reflect the rebate of certain Portfolio expenses in connection with the investments in Morgan Stanley affiliates during the period. The effect of the rebate on the ratios is disclosed in the above table as "Ratio of Rebate from Morgan Stanley Affiliates to Average Net Assets."
^^ Effective September 16, 2013, the Adviser has agreed to limit the ratio of expenses to average net assets to the maximum ratio of 0.91% for Class IS shares.
§ Amount is less than 0.005%.
# Not Annualized.
* Annualized.
The accompanying notes are an integral part of the financial statements.
17
Morgan Stanley Institutional Fund, Inc.
Annual Report — December 31, 2013
Notes to Financial Statements
Morgan Stanley Institutional Fund, Inc. (the "Fund") is registered under the Investment Company Act of 1940, as amended (the "Act"), as an open-end management investment company. The Fund is comprised of twenty-seven separate, active, diversified and non-diversified portfolios (individually referred to as a "Portfolio", collectively as the "Portfolios").
The accompanying financial statements relate to the International Equity Portfolio. The Portfolio's adviser, Morgan Stanley Investment Management Inc. (the "Adviser") and sub-advisers, Morgan Stanley Investment Management Limited ("MSIM") and Morgan Stanley Investment Management Company ("MSIM Company") (together, the "Sub-Advisers"), seek long-term capital appreciation by investing primarily in equity securities of non-U.S. issuers. The Portfolio offers four classes of shares — Class I, Class A, Class L and Class IS.
On September 16, 2013, the Portfolio commenced offering Class IS shares. Effective September 9, 2013, Class P and Class H shares were renamed Class A shares.
On October 29, 2012, the Portfolio acquired the net assets of Morgan Stanley International Value Equity Fund ("International Value Equity Fund"), an open-end investment company, based on the respective valuations as of the close of business on October 26, 2012, pursuant to a Plan of Reorganization approved by the shareholders of International Value Equity Fund on September 27, 2012 ("Reorganization"). The purpose of the transaction was to combine two portfolios managed by Morgan Stanley Investment Management Inc. with comparable investment objectives and strategies. The acquisition was accomplished by a tax-free exchange of 6,025,829 Class I shares of the Portfolio at a net asset value of $13.90 per share for 9,923,493 Class I shares of International Value Equity Fund; 892,369 Class L shares of the Portfolio at a net asset value of $13.68 for 1,447,727 Class C shares of International Value Equity Fund; 5,090,716 Class H shares of the Portfolio at a net asset value of $13.70 for 3,872,198 Class A shares, 4,451,390 Class B shares and 10,479 Class W shares of International Value Equity Fund. The net assets of International Value Equity Fund before the Reorganization were approximately $165,710,000, including unrealized appreciation of approximately $880,000 at October 26, 2012. The investment portfolio of International Value Equity Fund, with a fair value of approximately $165,884,000 and identified cost of approximately $164,992,000 on October 26, 2012, was the principal asset acquired by the Portfolio. For financial reporting purposes, assets received and shares issued by the Portfolio were recorded at fair value; however, the cost basis of the invest-
ments received from International Value Equity Fund was carried forward to align ongoing reporting of the Portfolio's realized and unrealized gains and losses with amounts distributable to shareholders for tax purposes. Immediately prior to the Reorganization, the net assets of the Portfolio were approximately $4,317,571,000. Immediately after the merger, the net assets of the Portfolio were approximately $4,483,281,000.
Upon closing of the Reorganization, shareholders of International Value Equity Fund received shares of the Portfolio as follows:
International
Value Equity
Fund | | International
Equity
Portfolio | |
| Class A | | Class H | |
| Class B | | Class H | |
| Class W | | Class H | |
| Class C | | Class L | |
| Class I | | Class I | |
Assuming the acquisition had been completed on January 1, 2012, the beginning of the annual reporting period of the Portfolio, the Portfolio's pro forma results of operations for the year ended December 31, 2012, are as follows:
Net investment income(1) | | $ | 96,989,000 | | |
Net gain realized and unrealized gain (loss)(2) | | $ | 672,948,000 | | |
Net increase (decrease) in net assets resulting
from operations | | $ | 769,937,000 | | |
(1) Approximately $95,327,000 as reported, plus approximately $872,000 International Value Equity Fund premerger, plus approximately $790,000 of estimated pro-forma eliminated expenses.
(2) Approximately $672,214,000 as reported, plus approximately $734,000 International Value Equity Fund premerger.
Because the combined investment portfolios have been managed as a single integrated portfolio since the acquisition was completed, it is not practicable to separate the amounts of revenue and earnings of International Value Equity Fund that have been included in the Portfolio's Statement of Operations since December 31, 2012.
A. Significant Accounting Policies: The following significant accounting policies are in conformity with U.S. generally accepted accounting principles ("GAAP"). Such policies are consistently followed by the Fund in the preparation of its financial statements. GAAP may require management to make estimates and assumptions that affect the reported amounts and disclosures in the financial statements. Actual results may differ from those estimates.
1. Security Valuation: (1) An equity portfolio security listed or traded on an exchange is valued at its latest reported sales price (or at the exchange official closing price if such exchange reports an official closing price), if there were no sales on a given day, the security is valued at the
18
Morgan Stanley Institutional Fund, Inc.
Annual Report — December 31, 2013
Notes to Financial Statements (cont'd)
mean between the last reported bid and asked prices; (2) all other equity portfolio securities for which over-the-counter market quotations are readily available are valued at its latest reported sales price. In cases where a security is traded on more than one exchange, the security is valued on the exchange designated as the primary market; (3) when market quotations are not readily available, including circumstances under which the Adviser determines that the closing price, last sale price or the mean between the last reported bid and asked prices are not reflective of a security's market value, portfolio securities are valued at their fair value as determined in good faith under procedures established by and under the general supervision of the Fund's Board of Directors (the "Directors"). Occasionally, developments affecting the closing prices of securities and other assets may occur between the times at which valuations of such securities are determined (that is, close of the foreign market on which the securities trade) and the close of business of the New York Stock Exchange ("NYSE"). If developments occur during such periods that are expected to materially affect the value of such securities, such valuations may be adjusted to reflect the estimated fair value of such securities as of the close of the NYSE, as determined in good faith by the Directors or by the Adviser using a pricing service and/or procedures approved by the Directors; (4) quotations of foreign portfolio securities, other assets and liabilities and forward contracts stated in foreign currency are translated into U.S. dollar equivalents at the prevailing market rates prior to the close of the NYSE; (5) investments in mutual funds, including the Morgan Stanley Institutional Liquidity Funds, are valued at the net asset value as of the close of each business day; and (6) short-term debt securities with remaining maturities of 60 days or less at the time of purchase may be valued at amortized cost, unless the Adviser determines such valuation does not reflect the securities' market value, in which case these securities will be valued at their fair market value determined by the Adviser.
Under procedures approved by the Directors, the Fund's Adviser has formed a Valuation Committee. The Valuation Committee provides administration and oversight of the Fund's valuation policies and procedures, which are reviewed at least annually by the Directors. These procedures allow the Fund to utilize independent pricing services, quotations from securities and financial instrument dealers, and other market sources to determine fair value.
The Fund has procedures to determine the fair value of securities and other financial instruments for which market prices are not readily available. Under these procedures, the Valuation Committee convenes on a regular and ad hoc basis to review such securities and considers a number of factors, including valuation methodologies and significant unobservable valuation inputs, when arriving at fair value. The Valuation Committee may employ a market-based approach which may use related or comparable assets or liabilities, recent transactions, market multiples, book values, and other relevant information for the investment to determine the fair value of the investment. An income-based valuation approach may also be used in which the anticipated future cash flows of the investment are discounted to calculate fair value. Discounts may also be applied due to the nature or duration of any restrictions on the disposition of the investments. Due to the inherent uncertainty of valuations of such investments, the fair values may differ significantly from the values that would have been used had an active market existed. The Valuation Committee employs various methods for calibrating these valuation approaches including a regular review of valuation methodologies, key inputs and assumptions, transactional back-testing or disposition analysis, and reviews of any related market activity.
2. Fair Value Measurement: Financial Accounting Standards Board ("FASB") Accounting Standards CodificationTM ("ASC") 820, "Fair Value Measurements and Disclosures" ("ASC 820"), defines fair value as the value that the Fund would receive to sell an investment or pay to transfer a liability in a timely transaction with an independent buyer in the principal market, or in the absence of a principal market the most advantageous market for the investment or liability. ASC 820 establishes a three-tier hierarchy to distinguish between (1) inputs that reflect the assumptions market participants would use in valuing an asset or liability developed based on market data obtained from sources independent of the reporting entity (observable inputs) and (2) inputs that reflect the reporting entity's own assumptions about the assumptions market participants would use in valuing an asset or liability developed based on the best information available in the circumstances (unobservable inputs) and to establish classification of fair value measurements for disclosure purposes. Various inputs are used in determining the value of
19
Morgan Stanley Institutional Fund, Inc.
Annual Report — December 31, 2013
Notes to Financial Statements (cont'd)
the Fund's investments. The inputs are summarized in the three broad levels listed below.
• Level 1 – unadjusted quoted prices in active markets for identical investments
• Level 2 – other significant observable inputs (including quoted prices for similar investments, interest rates, prepayment speeds, credit risk, etc.)
• Level 3 – significant unobservable inputs including the Fund's own assumptions in determining the fair value of investments. Factors considered in making this determination may include, but are not limited to, information obtained by contacting the issuer, analysts, or the appropriate stock exchange (for exchange-traded securities), analysis of the issuer's financial statements or other available documents and, if necessary, available information concerning other securities in similar circumstances
The inputs or methodology used for valuing securities are not necessarily an indication of the risk associated with investing in those securities and the determination of the significance of a particular input to the fair value measurement in its entirety requires judgment and considers factors specific to each security.
The following is a summary of the inputs used to value the Portfolio's investments as of December 31, 2013.
Investment Type | | Level 1
Unadjusted
quoted
prices
(000) | | Level 2
Other
significant
observable
inputs
(000) | | Level 3
Significant
unobservable
inputs
(000) | | Total
(000) | |
Assets: | |
Common Stocks | |
Auto Components | | $ | 141,813 | | | $ | — | | | $ | — | | | $ | 141,813 | | |
Automobiles | | | 93,200 | | | | — | | | | — | | | | 93,200 | | |
Beverages | | | 188,301 | | | | — | | | | — | | | | 188,301 | | |
Capital Markets | | | 72,892 | | | | — | | | | — | | | | 72,892 | | |
Chemicals | | | 131,512 | | | | — | | | | — | | | | 131,512 | | |
Commercial Banks | | | 399,461 | | | | — | | | | — | | | | 399,461 | | |
Commercial Services &
Supplies | | | 85,314 | | | | — | | | | — | | | | 85,314 | | |
Construction Materials | | | 148,333 | | | | — | | | | — | | | | 148,333 | | |
Diversified
Telecommunication
Services | | | 36,528 | | | | — | | | | — | | | | 36,528 | | |
Electrical Equipment | | | 45,826 | | | | — | | | | — | | | | 45,826 | | |
Investment Type | | Level 1
Unadjusted
quoted
prices
(000) | | Level 2
Other
significant
observable
inputs
(000) | | Level 3
Significant
unobservable
inputs
(000) | | Total
(000) | |
Common Stocks (cont'd) | |
Electronic Equipment,
Instruments &
Components | | $ | 187,445 | | | $ | — | | | $ | — | | | $ | 187,445 | | |
Energy Equipment &
Services | | | 18,654 | | | | — | | | | — | | | | 18,654 | | |
Food & Staples Retailing | | | 50,989 | | | | — | | | | — | | | | 50,989 | | |
Food Products | | | 510,052 | | | | — | | | | — | | | | 510,052 | | |
Household Durables | | | 67,507 | | | | — | | | | — | | | | 67,507 | | |
Household Products | | | 238,665 | | | | — | | | | — | | | | 238,665 | | |
Industrial
Conglomerates | | | 58,303 | | | | — | | | | — | | | | 58,303 | | |
Insurance | | | 530,849 | | | | — | | | | — | | | | 530,849 | | |
Machinery | | | 152,282 | | | | — | | | | — | | | | 152,282 | | |
Media | | | 8,843 | | | | — | | | | — | | | | 8,843 | | |
Metals & Mining | | | 247,736 | | | | — | | | | — | | | | 247,736 | | |
Oil, Gas & Consumable
Fuels | | | 431,073 | | | | — | | | | — | | | | 431,073 | | |
Pharmaceuticals | | | 722,117 | | | | — | | | | — | | | | 722,117 | | |
Real Estate
Management &
Development | | | 75,646 | | | | — | | | | — | | | | 75,646 | | |
Semiconductors &
Semiconductor
Equipment | | | 19,736 | | | | — | | | | — | | | | 19,736 | | |
Software | | | 160,868 | | | | — | | | | — | | | | 160,868 | | |
Textiles, Apparel &
Luxury Goods | | | 68,886 | | | | — | | | | — | | | | 68,886 | | |
Tobacco | | | 367,528 | | | | — | | | | — | | | | 367,528 | | |
Trading Companies &
Distributors | | | 17,370 | | | | — | | | | — | | | | 17,370 | | |
Wireless
Telecommunication
Services | | | 133,370 | | | | — | | | | — | | | | 133,370 | | |
Total Common Stocks | | | 5,411,099 | | | | — | | | | — | | | | 5,411,099 | | |
Rights | | | 2,965 | | | | — | | | | — | | | | 2,965 | | |
Short-Term Investments | |
Investment Companies | | | 98,659 | | | | — | | | | — | | | | 98,659 | | |
Repurchase Agreements | | | — | | | | 3,858 | | | | — | | | | 3,858 | | |
Total Short-Term
Investments | | | 98,659 | | | | 3,858 | | | | — | | | | 102,517 | | |
Foreign Currency
Forward Exchange
Contract | | | — | | | | 7,891 | | | | — | | | | 7,891 | | |
Total Assets | | $ | 5,512,723 | | | $ | 11,749 | | | $ | — | | | $ | 5,524,472 | | |
Transfers between investment levels may occur as the markets fluctuate and/or the availability of data used in an investment's valuation changes. The Portfolio recognizes transfers between the levels as of the end of the period. As of December 31, 2013, securities with a total value of approximately $4,874,086,000 transferred from Level 2 to Level 1. At December 31, 2012, the fair value of certain securities were adjusted due to developments which occurred between the time of the close of the foreign markets on which they trade and the close of business on the NYSE which resulted in their Level 2 classification.
20
Morgan Stanley Institutional Fund, Inc.
Annual Report — December 31, 2013
Notes to Financial Statements (cont'd)
3. Foreign Currency Translation and Foreign Investments: The books and records of the Portfolio are maintained in U.S. dollars. Foreign currency amounts are translated into U.S. dollars as follows:
– investments, other assets and liabilities at the prevailing rate of exchange on the valuation date;
– investment transactions and investment income at the prevailing rates of exchange on the dates of such transactions.
Although the net assets of the Portfolio are presented at the foreign exchange rates and market values at the close of the period, the Portfolio does not isolate that portion of the results of operations arising as a result of changes in the foreign exchange rates from the fluctuations arising from changes in the market prices of securities held at period end. Similarly, the Portfolio does not isolate the effect of changes in foreign exchange rates from the fluctuations arising from changes in the market prices of securities sold during the period. Accordingly, realized and unrealized foreign currency gains (losses) on investments in securities are included in the reported net realized and unrealized gains (losses) on investment transactions and balances. However, pursuant to U.S. Federal income tax regulations, gains and losses from certain foreign currency transactions and the foreign currency portion of gains and losses realized on sales and maturities of foreign denominated debt securities are treated as ordinary income for U.S. Federal income tax purposes.
Net realized gains (losses) on foreign currency transactions represent net foreign exchange gains (losses) from foreign currency forward exchange contracts, disposition of foreign currencies, currency gains (losses) realized between the trade and settlement dates on securities transactions, and the difference between the amount of investment income and foreign withholding taxes recorded on the Portfolio's books and the U.S. dollar equivalent amounts actually received or paid. Net unrealized currency gains (losses) from valuing foreign currency denominated assets and liabilities at period end exchange rates are reflected as a component of unrealized appreciation (depreciation) on the Statement of Assets and Liabilities. The change in unrealized currency gains (losses) on foreign currency translations for the period is reflected in the Statement of Operations.
Foreign security and currency transactions may involve certain considerations and risks not typically associated with those of U.S. dollar denominated transactions as a result of, among other factors, fluctuations of exchange rates in relation to the U.S. dollar, the possibility of lower levels of governmental supervision and regulation of foreign securities markets and the possibility of political or economic instability.
Governmental approval for foreign investments may be required in advance of making an investment under certain circumstances in some countries, and the extent of foreign investments in domestic companies may be subject to limitation in other countries. Foreign ownership limitations also may be imposed by the charters of individual companies to prevent, among other concerns, violations of foreign investment limitations. As a result, an additional class of shares (identified as "Foreign" in the Portfolio of Investments) may be created and offered for investment. The "local" and "foreign shares" market values may differ. In the absence of trading of the foreign shares in such markets, the Portfolio values the foreign shares at the closing exchange price of the local shares.
4. Derivatives: The Portfolio may, but is not required to, use derivative instruments for a variety of purposes, including hedging, risk management, portfolio management or to earn income. Derivatives are financial instruments whose value is based, in part, on the value of an underlying asset, interest rate, index or financial instrument. Prevailing interest rates and volatility levels, among other things, also affect the value of derivative instruments. A derivative instrument often has risks similar to its underlying asset and may have additional risks, including imperfect correlation between the value of the derivative and the underlying asset, risks of default by the counterparty to certain transactions, magnification of losses incurred due to changes in the market value of the securities, instruments, indices or interest rates to which they relate, and risks that the transactions may not be liquid. The use of derivatives involves risks that are different from, and possibly greater than, the risks associated with other portfolio investments. Derivatives may involve the use of highly specialized instruments that require investment techniques and risk analyses different from those associated with other portfolio investments. All of the Portfolio's holdings, including derivative instruments, are marked-to-market each day with the change in value reflected in unrealized
21
Morgan Stanley Institutional Fund, Inc.
Annual Report — December 31, 2013
Notes to Financial Statements (cont'd)
appreciation (depreciation). Upon disposition, a realized gain or loss is recognized.
Certain derivative transactions may give rise to a form of leverage. Leverage magnifies the potential for gain and the risk of loss. Leverage associated with derivative transactions may cause the Portfolio to liquidate portfolio positions when it may not be advantageous to do so to satisfy its obligations or to meet earmarking or segregation requirements, pursuant to applicable Securities and Exchange Commission rules and regulations, or may cause the Portfolio to be more volatile than if the Portfolio had not been leveraged. Although the Adviser and/or Sub-Adviser seek to use derivatives to further the Portfolio's investment objectives, there is no assurance that the use of derivatives will achieve this result.
Following is a description of the derivative instruments and techniques that the Portfolio used during the period and their associated risks:
Foreign Currency Forward Exchange Contracts: In connection with its investments in foreign securities, the Portfolio also entered into contracts with banks, brokers or dealers to purchase or sell securities or foreign currencies at a future date. A foreign currency forward exchange contract ("currency contract") is a negotiated agreement between the contracting parties to exchange a specified amount of currency at a specified future time at a specified rate. The rate can be higher or lower than the spot rate between the currencies that are the subject of the contract. Currency contracts may be used to protect against uncertainty in the level of future foreign currency exchange rates or to gain or modify exposure to a particular currency. There is additional risk that such transactions reduce or preclude the opportunity for gain if the value of the currency should move in the direction opposite to the position taken and that currency contracts create exposure to currencies in which the Portfolio's securities are not denominated. Unanticipated changes in currency prices may result in poorer overall performance for the Portfolio than if it had not entered into such contracts. The use of currency contracts involves the risk of loss from the insolvency or bankruptcy of the counterparty to the contract or the failure of the counterparty to make payments or otherwise comply with the terms of the contract. A currency contract is marked-to-market daily and the change in market value
is recorded by the Portfolio as unrealized gain or loss. The Portfolio records realized gains (losses) when the currency contract is closed equal to the difference between the value of the currency contract at the time it was opened and the value at the time it was closed.
FASB ASC 815, "Derivatives and Hedging: Overall" ("ASC 815"), is intended to improve financial reporting about derivative instruments by requiring enhanced disclosures to enable investors to better understand how and why the Portfolio uses derivative instruments, how these derivative instruments are accounted for and their effects on the Portfolio's financial position and results of operations.
The following table sets forth the fair value of the Portfolio's derivative contracts by primary risk exposure as of December 31, 2013.
| | | Asset Derivatives
Statement of Assets and
Liabilities Location | | Primary Risk
Exposure | | Value
(000) | |
Foreign Currency
Forward Exchange
Contract | | Unrealized Appreciation on
Foreign Currency Forward
Exchange Contract | | Currency Risk | | | $7,891 | | |
The following tables set forth by primary risk exposure the Portfolio's realized gains (losses) and change in unrealized appreciation (depreciation) by type of derivative contract for the year ended December 31, 2013 in accordance with ASC 815.
Realized Gain (Loss) | |
Primary Risk Exposure | | Derivative Type | | Value
(000) | |
Currency Risk | | Foreign Currency Forward
Exchange Contracts | | $ | 11,358 | | |
Change in Unrealized Appreciation (Depreciation) | |
Primary Risk Exposure | | Derivative Type | | Value
(000) | |
Currency Risk | | Foreign Currency Forward
Exchange Contracts | | $ | 7,891 | | |
At December 31, 2013, the Portfolio's derivative assets and liabilities are as follows:
Gross Amounts of Assets and Liabilities Presented in the
Statement of Assets and Liabilities | |
Derivatives | | Assets(a)
(000) | | Liabilities(a)
(000) | |
Foreign Currency
Forward Exchange Contract | | $ | 7,891 | | | $ | — | | |
(a) Absent an event of default or early termination, OTC derivative assets and liabilities are presented gross and not offset in the Statement of Assets and Liabilities.
22
Morgan Stanley Institutional Fund, Inc.
Annual Report — December 31, 2013
Notes to Financial Statements (cont'd)
The following table presents derivative financial instruments that are subject to enforceable netting arrangements as of December 31, 2013.
Gross Amounts Not Offset in the Statement of Assets and Liabilities | |
Counterparty | | Gross Asset
Derivatives
Presented in
Statement of
Assets and
Liabilities
(000) | | Financial
Instrument
(000) | | Collateral
Received
(000) | | Net
Amount
(not less
than 0)
(000) | |
Commonwealth Bank of
Australia | | $ | 7,891 | | | | — | | | | — | | | $ | 7,891 | | |
For the year ended December 31, 2013, the approximate average monthly amount outstanding for each derivative type is as follows:
Foreign Currency Forward Exchange Contracts: | |
Average monthly principal amount | | $ | 176,431,000 | | |
5. Securities Lending: The Portfolio lends securities to qualified financial institutions, such as broker-dealers, to earn additional income. Any increase or decrease in the fair value of the securities loaned that might occur and any interest earned or dividends declared on those securities during the term of the loan would remain in the Portfolio. The Portfolio would receive cash or securities as collateral in an amount equal to or exceeding 100% of the current fair value of the loaned securities. The collateral is marked-to-market daily, by State Street Bank and Trust Company ("State Street"), the securities lending agent, to ensure that a minimum of 100% collateral coverage is maintained.
Based on pre-established guidelines, the securities lending agent invests any cash collateral that is received in an affiliated money market portfolio and repurchase agreements. Securities lending income is generated from the earnings on the invested collateral and borrowing fees, less any rebates owed to the borrowers and compensation to the lending agent, and is recorded as "Income from Securities Loaned-Net" in the Portfolio's Statement of Operations. Risks in securities lending transactions are that a borrower may not provide additional collateral when required or return the securities when due, and that the value of the short-term investments will be less than the amount of cash collateral plus any rebate that is required to be returned to the borrower.
The Portfolio has the right under the lending agreement to recover the securities from the borrower on demand.
The following table presents financial instruments that are subject to enforceable netting arrangements as of December 31, 2013.
Gross Amounts Not Offset in the Statement of Assets and Liabilities | |
Gross Asset
Amounts
Presented in
Statement of
Assets and
Liabilities
(000) | | Financial
Instrument
(000) | | Collateral
Received
(000) | | Net Amount
(not less than 0)
(000) | |
| $ | 28,942 | (a) | | | — | | | $ | (28,942 | )(b)(c) | | $ | 0 | | |
(a) Represents market value of loaned securities at period end.
(b) The Portfolio received cash collateral of approximately $29,723,000, of which approximately $28,842,000 was subsequently invested in Repurchase Agreements and Morgan Stanley Institutional Liquidity Funds as reported in the Portfolio of Investments. As of December 31, 2013 there was uninvested cash of approximately $881,000, which is not reflected in the Portfolio of Investments. In addition, the Portfolio received non-cash collateral of approximately $545,000 in the form of U.S. government obligations, which the Portfolio cannot sell or repledge, and accordingly are not reflected in the Portfolio of Investments.
(c) The actual collateral received is greater than the amount shown here due to overcollateralization.
6. Redemption Fees: The Portfolio will assess a 2% redemption fee, on Class I shares, Class A shares, Class L shares and Class IS shares, which is paid directly to the Portfolio, for shares redeemed or exchanged within thirty days of purchase, subject to certain exceptions. The redemption fee is designed to protect the Portfolio and its remaining shareholders from the effects of short-term trading. These fees, if any, are included in the Statements of Changes in Net Assets.
7. Indemnifications: The Fund enters into contracts that contain a variety of indemnifications. The Fund's maximum exposure under these arrangements is unknown. However, the Fund has not had prior claims or losses pursuant to these contracts and expects the risk of loss to be remote.
8. Dividends and Distributions to Shareholders: Dividend income and distributions to shareholders are recorded on the ex-dividend date. Dividends from net investment income, if any, are declared and paid semiannually. Net realized capital gains, if any, are distributed at least annually.
9. Security Transactions, Income and Expenses: Security transactions are accounted for on the trade date (date the order to buy or sell is executed). Realized gains and losses on the sale of investment securities are determined on the specific identified cost method. Dividend
23
Morgan Stanley Institutional Fund, Inc.
Annual Report — December 31, 2013
Notes to Financial Statements (cont'd)
income and other distributions are recorded on the ex-dividend date (except for certain foreign dividends which may be recorded as soon as the Portfolio is informed of such dividends) net of applicable withholding taxes. Interest income is recognized on the accrual basis except where collection is in doubt. Discounts are accreted and premiums are amortized over the life of the respective securities. Most expenses of the Fund can be directly attributed to a particular Portfolio. Expenses which cannot be directly attributed are apportioned among the Portfolios based upon relative net assets or other appropriate methods. Income, expenses (other than class specific expenses — distribution, transfer agency and sub transfer agency fees) and realized and unrealized gains or losses are allocated to each class of shares based upon their relative net assets.
B. Advisory/Sub-Advisory Fees: The Adviser, a wholly-owned subsidiary of Morgan Stanley, provides the Portfolio with advisory services under the terms of an Investment Advisory Agreement, paid quarterly, at the annual rate based on the average daily net assets as follows:
First $10
billion | | Over $10
billion | |
| | 0.80 | % | | | 0.75 | % | |
For the year ended December 31, 2013, the advisory fee rate (net of waivers/rebate) was equivalent to an annual effective rate of 0.77% of the Portfolio's daily net assets.
The Adviser has agreed to reduce its advisory fee and/or reimburse the Portfolio so that total annual portfolio operating expenses, excluding certain investment related expenses, taxes, interest and other extraordinary expenses (including litigation), will not exceed 0.95% for Class I shares, 1.20% for Class A shares, 1.70% for Class L shares. Effective September 16, 2013, the Adviser has agreed to limit the ratio of expenses to average net assets to the maximum ratio of 1.30%, 1.80% and 0.91% for Class A, Class L and Class IS shares, respectively. The fee waivers and/or expense reimbursements will continue for at least two years from the date of Reorganization or until such time that the Directors act to discontinue all or a portion of such waivers and/or reimbursements when it deems such action is appropriate. For the year ended December 31, 2013, approximately $1,432,000 of advisory fees were waived and approximately $461,000 of other expenses were reimbursed by the Adviser pursuant to this arrangement.
The Adviser has entered into a Sub-Advisory Agreement with the Sub-Advisers, each a wholly-owned subsidiary of Morgan Stanley. The Sub-Advisers provide the Portfolio with advisory
services subject to the overall supervision of the Adviser and the Fund's Officers and Directors. The Adviser pays the Sub-Advisers on a monthly basis a portion of the net advisory fees the Adviser receives from the Portfolio.
C. Administration Fees: The Adviser also serves as Administrator to the Fund and provides administrative services pursuant to an Administration Agreement for an annual fee, accrued daily and paid monthly, of 0.08% of the Portfolio's average daily net assets. Under a Sub-Administration Agreement between the Administrator and State Street, State Street provides certain administrative services to the Fund. For such services, the Administrator pays State Street a portion of the fee the Administrator receives from the Portfolio.
D. Distribution and Shareholder Services Fees: Morgan Stanley Distribution, Inc. ("MSDI" or the "Distributor"), a wholly-owned subsidiary of the Adviser, and an indirect subsidiary of Morgan Stanley, serves as the Fund's Distributor of Portfolio shares pursuant to a Distribution Agreement. The Fund has adopted a Shareholder Services Plan with respect to Class A shares pursuant to Rule 12b-1 under the Act. Under the Shareholder Services Plan, the Portfolio pays the Distributor a shareholder services fee, accrued daily and paid monthly, at an annual rate of 0.25% of the Portfolio's average daily net assets attributable to Class A shares.
The Fund has adopted a Distribution and Shareholder Services Plan with respect to Class L shares pursuant to Rule 12b-1 under the Act. Under the Distribution and Shareholder Services Plan, the Portfolio pays the Distributor a distribution fee, accrued daily and paid monthly, at an annual rate of 0.50% and a shareholder services fee, accrued daily and paid monthly, at an annual rate of 0.25% of the Portfolio's average daily net assets attributable to Class L shares.
The distribution and shareholder services fees are used to support the expenses associated with servicing and maintaining accounts. The Distributor may compensate other parties for providing shareholder support services to investors who purchase Class A and Class L shares.
E. Dividend Disbursing and Transfer Agent: The Fund's dividend disbursing and transfer agent was Morgan Stanley Services Company Inc. ("Morgan Stanley Services"). Pursuant to a Transfer Agency Agreement, the Fund paid Morgan Stanley Services a fee based on the number of classes, accounts and transactions relating to the Portfolios of the Fund. Effective July 1, 2013, the Directors approved changing the transfer agent to Boston Financial Data Services, Inc.
24
Morgan Stanley Institutional Fund, Inc.
Annual Report — December 31, 2013
Notes to Financial Statements (cont'd)
F. Custodian Fees: State Street (the "Custodian") serves as Custodian for the Fund in accordance with a Custodian Agreement. The Custodian holds cash, securities, and other assets of the Fund as required by the Act. Custody fees are payable monthly based on assets held in custody, investment purchases and sales activity and account maintenance fees, plus reimbursement for certain out-of-pocket expenses.
G. Security Transactions and Transactions with Affiliates: For the year ended December 31, 2013, purchases and sales of investment securities for the Portfolio, other than long-term U.S. Government securities and short-term investments, were approximately $1,511,833,000 and $1,458,221,000, respectively. There were no purchases and sales of long-term U.S. Government securities for the year ended December 31, 2013.
The Portfolio invests in the Institutional Class of the Morgan Stanley Institutional Liquidity Funds — (the "Liquidity Funds"), an open-end management investment company managed by the Adviser, both directly, and as a portion of the securities held as collateral on loaned securities. Advisory fees paid by the Portfolio are reduced by an amount equal to its pro-rata share of the advisory and administration fees paid by the Portfolio due to its investment in the Liquidity Funds. For the year ended December 31, 2013, advisory fees paid were reduced by approximately $175,000 relating to the Portfolio's investment in the Liquidity Funds.
A summary of the Portfolio's transactions in shares of the Liquidity Funds during the year ended December 31, 2013 is as follows:
Value
December 31,
2012
(000) | | Purchases
at Cost
(000) | | Sales
(000) | | Dividend
Income
(000) | | Value
December 31,
2013
(000) | |
| $ | 206,193 | | | $ | 951,983 | | | $ | 1,059,517 | | | $ | 13 | | | $ | 98,659 | | |
From January 1, 2013 to June 30, 2013, the Portfolio incurred approximately $51,000 in brokerage commissions with Citigroup, Inc., and its affiliated broker-dealers, which may be deemed affiliates of the Adviser, Sub-Advisers, Administrator and Distributor under Section 17 of the Act, for portfolio transactions executed on behalf of the Portfolio. Citigroup, Inc. and its affiliated broker-dealers ceased to be affiliates of the Portfolio pursuant to Section 17 of the Act as of July 1, 2013.
H. Federal Income Taxes: It is the Portfolio's intention to continue to qualify as a regulated investment company and distribute all of its taxable and tax-exempt income. Accordingly, no provision for Federal income taxes is required in the financial statements.
The Portfolio may be subject to taxes imposed by countries in which it invests. Such taxes are generally based on income and/or capital gains earned or repatriated. Taxes are accrued based on net investment income, net realized gains and net unrealized appreciation as such income and/or gains are earned. Taxes may also be based on transactions in foreign currency and are accrued based on the value of investments denominated in such currency.
FASB ASC 740-10 "Income Taxes — Overall" sets forth a minimum threshold for financial statement recognition of the benefit of a tax position taken or expected to be taken in a tax return. Management has concluded there are no significant uncertain tax positions that would require recognition in the financial statements. If applicable, the Portfolio recognizes interest accrued related to unrecognized tax benefits in "Interest Expense" and penalties in "Other Expenses" in the Statement of Operations. The Portfolio files tax returns with the U.S. Internal Revenue Service, New York and various states. Generally, each of the tax years in the four-year period ended December 31, 2013, remains subject to examination by taxing authorities.
The tax character of distributions paid may differ from the character of distributions shown in the Statements of Changes in Net Assets due to short-term capital gains being treated as ordinary income for tax purposes. The tax character of distributions paid during fiscal years 2013 and 2012 was as follows:
2013
Distributions
Paid From: | | 2012
Distributions
Paid From: | |
Ordinary
Income
(000) | | Long-Term
Capital Gain
(000) | | Ordinary
Income
(000) | | Long-Term
Capital Gain
(000) | |
| $ | 88,057 | | | | — | | | $ | 95,226 | | | | — | | |
The amount and character of income and gains to be distributed are determined in accordance with income tax regulations which may differ from GAAP. These book/tax differences are either considered temporary or permanent in nature.
Temporary differences are primarily due to differing book and tax treatments in the timing of the recognition of gains (losses) on certain investment transactions and the timing of the deductibility of certain expenses.
Permanent differences, primarily due to differing treatments of gains (losses) related to foreign currency transactions, basis adjustments on certain equity securities designated as passive foreign investment companies and redemptions in kind, resulted
25
Morgan Stanley Institutional Fund, Inc.
Annual Report — December 31, 2013
Notes to Financial Statements (cont'd)
in the following reclassifications among the components of net assets at December 31, 2013:
Accumulated
Undistributed
Net Investment
Income
(000) | | Accumulated
Net Realized
Loss
(000) | | Paid-in-
Capital
(000) | |
| $ | 8,339 | | | $ | (25,586 | ) | | $ | 17,247 | | |
At December 31, 2013, the components of distributable earnings for the Portfolio on a tax basis were as follows:
Undistributed
Ordinary
Income
(000) | | Undistributed
Long-Term
Capital Gain
(000) | |
| $ | 29,283 | | | | — | | |
At December 31, 2013, the aggregate cost for Federal income tax purposes is $4,415,360,000. The aggregate gross unrealized appreciation is $1,188,607,000 and the aggregate gross unrealized depreciation is $87,386,000 resulting in net unrealized appreciation of $1,101,221,000.
At December 31, 2013, the Portfolio had available capital loss carryforwards to offset future net capital gains, to the extent provided by regulations, through the indicated expiration dates:
Amount
(000) | | Expiration* | |
| $ | 4,909 | | | December 31, 2015 | |
| | 89,469 | | | December 31, 2016 | |
| | 13,223 | | | December 31, 2017 | |
* Includes capital losses acquired from Morgan Stanley International Value Equity Fund that may be subject to limitation under IRC Section 382 in future years.
To the extent that capital loss carryforwards are used to offset any future capital gains realized during the carryover period as provided by U.S. Federal income tax regulations, no capital gains tax liability will be incurred by the Portfolio for gains realized and not distributed. To the extent that capital gains are offset, such gains will not be distributed to the shareholders. During the year ended December 31, 2013, the Portfolio utilized capital loss carryforwards for U. S. Federal income tax purposes of approximately $204,085,000.
For the year ended December 31,2013, the Portfolio realized gains from in-kind redemptions of approximately $17,247,000. The gains are not taxable income to the Portfolio.
I. Other (unaudited): At December 31, 2013, the Portfolio had otherwise unaffiliated record owners of 10% or greater. Investment activities of these shareholders could have a material impact on the Portfolio. The aggregate percentage of such
owners was 44%, 92% and 69%, for Class I, Class A and Class IS shares, respectively.
J. Results of Special Shareholder Meeting (unaudited): On June 5, 2013 as adjourned to June 24, 2013 and July 17, 2013, a Joint Special Shareholder Meeting was held for Class H shareholders of the Portfolio to approve the Articles of Amendment to the Fund's Articles of Amendment and Restatement and a Plan of Reclassification for the Portfolio pursuant to which Class H shares would be reclassified as Class P shares. The results with respect to this proposal were as follows:
| For | | Against | | Abstain | |
| | 1,995,282 | | | | 118,220 | | | | 241,212 | | |
K. Accounting Pronouncement: In June 2013, FASB issued Accounting Standards Update 2013-08 Financial Services — Investment Companies (Topic 946) — Amendments to the Scope, Measurement, and Disclosure Requirements ("ASU 2013-08") which is effective for interim and annual reporting periods in fiscal years that begin after December 15, 2013. ASU 2013-08 sets forth a methodology for determining whether an entity should be characterized as an investment company and prescribes fair value accounting for an investment company's non-controlling ownership interest in another investment company. FASB has determined that a fund registered under the Investment Company Act of 1940 automatically meets ASU 2013-08's criteria for an investment company. Although still evaluating the potential impacts of ASU 2013-08 to the Portfolio, management expects that the impact of the Portfolio's adoption will be limited to additional financial statement disclosures.
26
Morgan Stanley Institutional Fund, Inc.
Annual Report — December 31, 2013
Report of Independent Registered Public Accounting Firm
To the Shareholders and Board of Directors of
Morgan Stanley Institutional Fund, Inc. —
International Equity Portfolio
We have audited the accompanying statement of assets and liabilities, including the portfolio of investments, of International Equity Portfolio (one of the portfolios constituting Morgan Stanley Institutional Fund, Inc.) (the "Portfolio") as of December 31, 2013 and the related statement of operations for the year then ended, the statements of changes in net assets for each of the two years in the period then ended, and the financial highlights for each of the periods indicated therein. These financial statements and financial highlights are the responsibility of the Portfolio's management. Our responsibility is to express an opinion on these financial statements and financial highlights based on our audits.
We conducted our audits in accordance with the standards of the Public Company Accounting Oversight Board (United States). Those standards require that we plan and perform the audit to obtain reasonable assurance about whether the financial statements and financial highlights are free of material misstatement. We were not engaged to perform an audit of the Portfolio's internal control over financial reporting. Our audits included consideration of internal control over financial reporting as a basis for designing audit procedures that are appropriate in the circumstances, but not for the purpose of expressing an opinion on the effectiveness of the Portfolio's internal control over financial reporting. Accordingly, we express no such opinion. An audit also includes examining, on a test basis, evidence supporting the amounts and disclosures in the financial statements and financial highlights, assessing the accounting principles used and significant estimates made by management, and evaluating the overall financial statement presentation. Our procedures included confirmation of securities owned as of December 31, 2013, by correspondence with the custodian and others or by other appropriate auditing procedures where replies from others were not received. We believe that our audits provide a reasonable basis for our opinion.
In our opinion, the financial statements and financial highlights referred to above present fairly, in all material respects, the financial position of International Equity Portfolio (one of the portfolios constituting Morgan Stanley Institutional Fund, Inc.) at December 31, 2013, the results of its operations for the year then ended, the changes in its net assets for each of the two years in the period then ended, and the financial highlights for each of the periods indicated therein, in conformity with U.S. generally accepted accounting principles.

Boston, Massachusetts
February 26, 2014
27
Morgan Stanley Institutional Fund, Inc.
Annual Report — December 31, 2013
Federal Tax Notice (unaudited)
For Federal income tax purposes, the following information is furnished with respect to the Portfolio's earnings for its taxable year ended December 31, 2013. When distributed, certain earnings may be subject to a maximum tax rate of 15% as provided for the Jobs and Growth Tax Relief Reconciliation Act of 2003. The Portfolio designated up to a maximum of $92,769,000 as taxable at this lower rate.
The Portfolio intends to pass through foreign tax credits of approximately $4,713,000 and has derived net income from sources within foreign countries amounting to approximately $156,116,000.
In January, the Portfolio provides tax information to shareholders for the preceding calendar year.
28
Morgan Stanley Institutional Fund, Inc.
Annual Report — December 31, 2013
U.S. Privacy Policy (unaudited)
AN IMPORTANT NOTICE CONCERNING OUR U.S. PRIVACY POLICY
This privacy notice describes the U.S. privacy policy of Morgan Stanley Distribution, Inc., and the Morgan Stanley family of mutual funds ("us", "our", "we").
We are required by federal law to provide you with notice of our U.S. privacy policy ("Policy"). This Policy applies to both our current and former clients unless we state otherwise and is intended for individual clients who purchase products or receive services from us for personal, family or household purposes. This Policy is not applicable to partnerships, corporations, trusts or other non-individual clients or account holders, nor is this Policy applicable to individuals who are either beneficiaries of a trust for which we serve as trustee or participants in an employee benefit plan administered or advised by us. This Policy is, however, applicable to individuals who select us to be a custodian of securities or assets in individual retirement accounts, 401(k) accounts, or accounts subject to the Uniform Gifts to Minors Act.
This notice sets out our business practices to protect your privacy; how we collect and share personal information about you; and how you can limit our sharing or certain uses by others of this information. We may amend this Policy at any time, and will inform you of any changes to our Policy as required by law.
WE RESPECT YOUR PRIVACY
We appreciate that you have provided us with your personal financial information and understand your concerns about your information. We strive to safeguard the information our clients entrust to us. Protecting the confidentiality and security of client information is an important part of how we conduct our business.
This notice describes what personal information we collect about you, how we collect it, when we may share it with others, and how certain others may use it. It discusses the steps you may take to limit our sharing of certain information about you with our affiliated companies, including, but not limited to our affiliated banking businesses, brokerage firms and credit service affiliates. It also discloses how you may limit our affiliates' use of shared information for marketing purposes.
Throughout this Policy, we refer to the nonpublic information that personally identifies you as "personal information." We also use the term "affiliated company" in this notice. An affiliated company is a company in our family of companies and includes companies with the Morgan Stanley name. These affiliated companies are financial institutions such as broker-dealers, banks, investment advisers and credit card issuers. We refer to any company that is not an affiliated company as a nonaffiliated third party. For purposes of Section 5 of this notice, and your ability to limit certain uses of personal information by our affiliates, this notice applies to the use of personal information by our affiliated companies.
1. WHAT PERSONAL INFORMATION DO WE COLLECT FROM YOU?
We may collect the following types of information about you: (i) information provided by you, including information from applications and other forms we receive from you, (ii) information about your transactions with us or our affiliates, (iii) information about your transactions with nonaffiliated third parties, (iv) information from consumer reporting agencies, (v) information obtained from our websites, and (vi) information obtained from other sources. For example:
• We collect information such as your name, address, e-mail address, telephone/fax numbers, assets, income and investment objectives through applications and other forms you submit to us.
• We may obtain information about account balances, your use of account(s) and the types of products and services you prefer to receive from us through your dealings and transactions with us and other sources.
• We may obtain information about your creditworthiness and credit history from consumer reporting agencies.
• We may collect background information from and through third-party vendors to verify representations you have made and to comply with various regulatory requirements.
2. WHEN DO WE DISCLOSE PERSONAL INFORMATION WE COLLECT ABOUT YOU?
We may disclose personal information we collect about you in each of the categories listed above to affiliated and nonaffiliated third parties.
29
Morgan Stanley Institutional Fund, Inc.
Annual Report — December 31, 2013
U.S. Privacy Policy (unaudited) (cont'd)
a. Information we disclose to affiliated companies.
We may disclose personal information that we collect about you to our affiliated companies to manage your account(s) effectively, to service and process your transactions, and to let you know about products and services offered by us and affiliated companies, to manage our business, and as otherwise required or permitted by law. Offers for products and services from affiliated companies are developed under conditions designed to safeguard your personal information.
b. Information we disclose to third parties.
We may disclose personal information that we collect about you to nonaffiliated third parties to provide marketing services on our behalf or to other financial institutions with whom we have joint marketing agreements. We may also disclose all of the information we collect to other nonaffiliated third parties for our everyday business purposes, such as to process transactions, maintain account(s), respond to court orders and legal investigations, report to credit bureaus, offer our own products and services, protect against fraud, for institutional risk control, to perform services on our behalf, and as otherwise required or permitted by law.
When we share personal information about you with a nonaffiliated third party, they are required to limit their use of personal information about you to the particular purpose for which it was shared and they are not allowed to share personal information about you with others except to fulfill that limited purpose or as may be permitted or required by law.
3. HOW DO WE PROTECT THE SECURITY AND CONFIDENTIALITY OF PERSONAL INFORMATION WE COLLECT ABOUT YOU?
We maintain physical, electronic and procedural security measures that comply with applicable law and regulations to help safeguard the personal information we collect about you. We have internal policies governing the proper handling of client information by employees. Third parties that provide support or marketing services on our behalf may also receive personal information about you, and we require them to adhere to appropriate security standards with respect to such information.
4. HOW CAN YOU LIMIT OUR SHARING CERTAIN PERSONAL INFORMATION ABOUT YOU WITH OUR AFFILIATED COMPANIES FOR ELIGIBILITY DETERMINATION?
By following the opt-out procedures in Section 6 below, you may limit the extent to which we share with our affiliated companies, personal information that was collected to determine your eligibility for products and services such as your credit reports and other information that you have provided to us or that we may obtain from third parties ("eligibility information"). Eligibility information does not include your identification information or personal information pertaining to our transactions or experiences with you. Please note that, even if you direct us not to share eligibility information with our affiliated companies, we may still share your personal information, including eligibility information, with our affiliated companies under circumstances that are permitted under applicable law, such as to process transactions or to service your account.
5. HOW CAN YOU LIMIT THE USE OF CERTAIN PERSONAL INFORMATION ABOUT YOU BY OUR AFFILIATED COMPANIES FOR MARKETING?
By following the opt-out instructions in Section 6 below, you may limit our affiliated companies from marketing their products or services to you based on personal information we disclose to them. This information may include, for example, your income and account history with us. Please note that, even if you choose to limit our affiliated companies from using personal information about you that we may share with them for marketing their products and services to you, our affiliated companies may use your personal information that they obtain from us to market to you in circumstances permitted by law, such as if the affiliated party has its own relationship with you.
30
Morgan Stanley Institutional Fund, Inc.
Annual Report — December 31, 2013
U.S. Privacy Policy (unaudited) (cont'd)
6. HOW CAN YOU SEND US AN OPT-OUT INSTRUCTION?
If you wish to limit our sharing of eligibility information about you with our affiliated companies, or our affiliated companies' use of personal information for marketing purposes, as described in this notice, you may do so by:
• Calling us at (800) 548-7786
Monday–Friday between 8a.m. and 5p.m. (EST)
• Writing to us at the following address:
Boston Financial Data Services, Inc.
c/o Privacy Coordinator
P.O. Box 219804
Kansas City, Missouri 64121
If you choose to write to us, your request should include: your name, address, telephone number and account number(s) to which the opt-out applies and whether you are opting out with respect to sharing of eligibility information (Section 4 above), or information used for marketing (Section 5 above), or both. Written opt-out requests should not be sent with any other correspondence. In order to process your request, we require that the request be provided by you directly and not through a third party. Once you have informed us about your privacy preferences, your opt-out preference will remain in effect with respect to this Policy (as it may be amended) until you notify us otherwise. If you are a joint account owner, we will accept instructions from any one of you and apply those instructions to the entire account.
Please understand that if you limit our sharing or our affiliated companies' use of personal information, you and any joint account holder(s) may not receive information about our affiliated companies' products and services, including products or services that could help you manage your financial resources and achieve your investment objectives.
If you have more than one account or relationship with us, please specify the accounts to which you would like us to apply your privacy choices. If you have accounts or relationships with our affiliates, you may receive multiple privacy policies from them, and will need to separately notify those companies of your privacy choices for those accounts or relationships.
7. WHAT IF AN AFFILIATED COMPANY BECOMES A NONAFFILIATED THIRD PARTY?
If, at any time in the future, an affiliated company becomes a nonaffiliated third party, further disclosures of personal information made to the former affiliated company will be limited to those described in Section 2(b) above relating to nonaffiliated third parties. If you elected under Section 6 to limit disclosures we make to affiliated companies, or use of personal information by affiliated companies, your election will not apply to use by any former affiliated company of your personal information in their possession once it becomes a nonaffiliated third party.
SPECIAL NOTICE TO RESIDENTS OF VERMONT
The following section supplements our Policy with respect to our individual clients who have a Vermont address and supersedes anything to the contrary in the above Policy with respect to those clients only.
The State of Vermont requires financial institutions to obtain your consent prior to sharing personal information that they collect about you with nonaffiliated third parties, or eligibility information with affiliated companies, other than in certain limited circumstances. Except as permitted by law, we will not share personal information we collect about you with nonaffiliated third parties or eligibility information with affiliated companies, unless you provide us with your written consent to share such information.
SPECIAL NOTICE TO RESIDENTS OF CALIFORNIA
The following section supplements our Policy with respect to our individual clients who have a California address and supersedes anything to the contrary in the above Policy with respect to those clients only.
In response to a California law, if your account has a California home address, your personal information will not be disclosed to nonaffiliated third parties except as permitted by applicable California law, and we will limit sharing such personal information with our affiliates to comply with California privacy laws that apply to us.
31
Morgan Stanley Institutional Fund, Inc.
Annual Report — December 31, 2013
Director and Officer Information (unaudited)
Independent Director:
Name, Age and Address of
Independent Director | | Position(s)
Held with
Registrant | | Length of Time
Served* | | Principal Occupation(s) During Past 5 Years | | Number of
Portfolios in
Fund Complex
Overseen by
Independent
Director** | | Other Directorships
Held by Independent
Director*** | |
Frank L. Bowman (69)
c/o Kramer Levin Naftalis &
Frankel LLP
Counsel to the Independent Directors
1177 Avenue of the Americas
New York, NY 10036 | | Director | | Since
August
2006 | | President, Strategic Decisions, LLC (consulting) (since February 2009); Director or Trustee of various Morgan Stanley Funds (since August 2006); Chairperson of the Insurance Sub-Committee of the Compliance and Insurance Committee (since February 2007); served as President and Chief Executive Officer of the Nuclear Energy Institute (policy organization) (February 2005-November 2008); retired as Admiral, U.S. Navy after serving over 38 years on active duty including 8 years as Director of the Naval Nuclear Propulsion Program in the Department of the Navy and the U.S. Department of Energy (1996-2004); served as Chief of Naval Personnel (July 1994-September 1996); and on the Joint Staff as Director of Political Military Affairs (June 1992-July 1994); knighted as Honorary Knight Commander of the Most Excellent Order of the British Empire; awarded the Officier de l'Orde National du Mérite by the French Government; elected to the National Academy of Engineering (2009). | | | 98 | | | Director of BP p.l.c.; Director of Naval and Nuclear Technologies LLP; Director of the Armed Services YMCA of the USA and the U.S. Naval Submarine League; Director of the American Shipbuilding Suppliers Association; Member of the National Security Advisory Council of the Center for U.S. Global Engagement and a member of the CNA Military Advisory Board; Chairman of the charity J Street Cup Golf; Trustee of Fairhaven United Methodist Church. | |
Michael Bozic (73)
c/o Kramer Levin Naftalis & Frankel LLP
Counsel to the Independent Directors
1177 Avenue of the Americas
New York, NY 10036 | | Director | | Since
April
1994 | | Private investor and a member of the advisory board of American Road Group LLC (retail) (since June 2000); Chairperson of the Compliance and Insurance Committee (since October 2006); Director or Trustee of various Morgan Stanley Funds (since April 1994); formerly, Chairperson of the Insurance Committee (July 2006-September 2006); Vice Chairman of Kmart Corporation (December 1998-October 2000); Chairman and Chief Executive Officer of Levitz Furniture Corporation (November 1995-November 1998) and President and Chief Executive Officer of Hills Department Stores (May 1991-July 1995); variously Chairman, Chief Executive Officer, President and Chief Operating Officer (1987-1991) of the Sears Merchandise Group of Sears, Roebuck & Co. | | | 100 | | | Trustee and member of the Hillsdale College Board of Trustees. | |
Kathleen A. Dennis (60)
c/o Kramer Levin Naftalis & Frankel LLP
Counsel to the Independent Directors
1177 Avenue of the Americas
New York, NY 10036 | | Director | | Since
August
2006 | | President, Cedarwood Associates (mutual fund and investment management consulting) (since July 2006); Chairperson of the Money Market and Alternatives Sub-Committee of the Investment Committee (since October 2006) and Director or Trustee of various Morgan Stanley Funds (since August 2006); formerly, Senior Managing Director of Victory Capital Management (1993-2006). | | | 98 | | | Director of various non-profit organizations. | |
Dr. Manuel H. Johnson (64)
c/o Johnson Smick International, Inc.
220 I Street,
NE Suite 200
Washington, D.C. 20002 | | Director | | Since
July
1991 | | Senior Partner, Johnson Smick International, Inc. (consulting firm); Chairperson of the Investment Committee (since October 2006) and Director or Trustee of various Morgan Stanley Funds (since July 1991); Co-Chairman and a founder of the Group of Seven Council (G7C) (international economic commission); formerly, Chairperson of the Audit Committee (July 1991-September 2006); Vice Chairman of the Board of Governors of the Federal Reserve System and Assistant Secretary of the U.S. Treasury. | | | 101 | | | Director of NVR, Inc. (home construction). | |
32
Morgan Stanley Institutional Fund, Inc.
Annual Report — December 31, 2013
Director and Officer Information (unaudited) (cont'd)
Independent Director: (cont'd)
Name, Age and Address of
Independent Director | | Position(s)
Held with
Registrant | | Length of Time
Served* | | Principal Occupation(s) During Past 5 Years | | Number of
Portfolios in
Fund Complex
Overseen by
Independent
Director** | | Other Directorships
Held by Independent
Director*** | |
Joseph J. Kearns (71)
c/o Kearns & Associates LLC
PMB754
22631 Pacific Coast Highway
Malibu, CA 90265 | | Director | | Since
August
1994 | | President, Kearns & Associates LLC (investment consulting); Chairperson of the Audit Committee (since October 2006) and Director or Trustee of various Morgan Stanley Funds (since August 1994); formerly, Deputy Chairperson of the Audit Committee (July 2003-September 2006) and Chairperson of the Audit Committee of various Morgan Stanley Funds (since August 1994); CFO of the J. Paul Getty Trust. | | | 101 | | | Director of Electro Rent Corporation (equipment leasing) and The Ford Family Foundation. | |
Michael F. Klein (55)
c/o Kramer Levin Naftalis & Frankel LLP
Counsel to the
Independent Directors
1177 Avenue of the Americas
New York, NY 10036 | | Director | | Since
August
2006 | | Managing Director, Aetos Capital, LLC (since March 2000); Co-President, Aetos Alternatives Management, LLC (since January 2004) and Co-Chief Executive Officer of Aetos Capital LLC (since August 2013); Chairperson of the Fixed Income Sub-Committee of the Investment Committee (since October 2006) and Director or Trustee of various Morgan Stanley Funds (since August 2006); formerly, Managing Director, Morgan Stanley & Co. Inc. and Morgan Stanley Dean Witter Investment Management, President, various Morgan Stanley Funds (June 1998-March 2000) and Principal, Morgan Stanley & Co. Inc. and Morgan Stanley Dean Witter Investment Management (August 1997-December 1999). | | | 98 | | | Director of certain investment funds managed or sponsored by Aetos Capital, LLC. Director of Sanitized AG and Sanitized Marketing AG (specialty chemicals). | |
Michael E. Nugent (77)
522 Fifth Avenue
New York, NY 10036 | | Chairperson of the Board and Director | | Chairperson of the Boards since July 2006 and Director since July 1991 | | Chairperson of the Boards of various Morgan Stanley Funds (since July 2006); Chairperson of the Closed-End Fund Committee (since June 2012) and Director or Trustee of various Morgan Stanley Funds (since July 1991); formerly, Chairperson of the Insurance Committee (until July 2006); General Partner, Triumph Capital, L.P. (private investment partnership) (1988-2013). | | | 100 | | | None. | |
W. Allen Reed (66)
c/o Kramer Levin Naftalis & Frankel LLP
Counsel to the
Independent Directors
1177 Avenue of the Americas
New York, NY 10036 | | Director | | Since
August
2006 | | Chairperson of the Equity Sub-Committee of the Investment Committee (since October 2006) and Director or Trustee of various Morgan Stanley Funds (since August 2006); formerly, President and CEO of General Motors Asset Management; Chairman and Chief Executive Officer of the GM Trust Bank and Corporate Vice President of General Motors Corporation (August 1994-December 2005). | | | 98 | | | Director of Temple-Inland Industries (packaging and forest products); Director of Legg Mason, Inc. and Director of the Auburn University Foundation. | |
Fergus Reid (81)
c/o Joe Pietryka, Inc.
85 Charles Colman Blvd.
Pawling, NY 12564 | | Director | | Since
June
1992 | | Chairman, Joe Pietryka, Inc.; Chairperson of the Governance Committee and Director or Trustee of various Morgan Stanley Funds (since June 1992). | | | 101 | | | Through December 31, 2012, Trustee and Director of certain Investment companies in the JPMorgan Fund Complex. | |
33
Morgan Stanley Institutional Fund, Inc.
Annual Report — December 31, 2013
Director and Officer Information (unaudited) (cont'd)
Interested Director:
Name, Age and Address of
Interested Director | | Position(s)
Held with
Registrant | | Length of
Time Served* | | Principal Occupation(s) During Past 5 Years | | Number of
Portfolios in
Fund Complex
Overseen by
Interested
Director** | | Other Directorships
Held by Interested
Director*** | |
James F. Higgins (66)
One New York Plaza
New York, NY 10004 | | Director | | Since
June
2000 | | Director or Trustee of various Morgan Stanley Funds (since June 2000); Senior Advisor of Morgan Stanley (since August 2000). | | | 99 | | | Formerly, Director of AXA Financial, Inc. and AXA Equitable Life Insurance Company (2002-2011) and Director of AXA MONY Life Insurance Company and AXA MONY Life Insurance Company of America (2004-2011). | |
* Each Director serves an indefinite term, until his or her successor is elected.
** The Fund Complex includes (as of December 31, 2013) all open-end and closed-end funds (including all of their portfolios) advised by Morgan Stanley Investment Management Inc. (the "Adviser") and any funds that have an adviser that is an affiliated person of the Adviser (including, but not limited to, Morgan Stanley AIP GP LP).
*** This includes any directorships at public companies and registered investment companies held by the Director at any time during the past five years.
34
Morgan Stanley Institutional Fund, Inc.
Annual Report — December 31, 2013
Director and Officer Information (unaudited) (cont'd)
Executive Officers:
Name, Age and Address of Executive Officer | | Position(s) Held
with
Registrant | | Length of
Time Served* | | Principal Occupation(s) During Past 5 Years | |
John H. Gernon (50)
522 Fifth Avenue
New York, NY 10036 | | President and Principal Executive Officer—Equity, Fixed Income and AIP Funds | | Since September 2013 | | President and Principal Executive Officer of the Equity and Fixed Income Funds and the Morgan Stanley AIP Funds (since September 2013) in the Fund Complex. Managing Director of the Adviser. | |
Stefanie V. Chang Yu (47)
522 Fifth Avenue
New York, NY 10036 | | Chief Compliance Officer | | Since
January
2014 | | Managing Director of the Adviser and various entities affiliated with the Adviser; Chief Compliance Officer of various Morgan Stanley Funds and the Adviser (since January 2014). Formerly, Vice President of various Morgan Stanley Funds (December 1997-January 2014). | |
Joseph C. Benedetti (48)
522 Fifth Avenue
New York, NY 10036 | | Vice President | | Since
January
2014 | | Managing Director of the Adviser and various entities affiliated with the Adviser; Vice President of various Morgan Stanley Funds (since January 2014). Formerly, Assistant Secretary of various Morgan Stanley Funds (October 2004-January 2014). | |
Francis J. Smith (48)
522 Fifth Avenue
New York, NY 10036 | | Treasurer and Principal Financial Officer | | Treasurer since July 2003 and Principal Financial Officer since September 2002 | | Executive Director of the Adviser and various entities affiliated with the Adviser; Treasurer and Principal Financial Officer of various Morgan Stanley Funds (since July 2003). | |
Mary E. Mullin (46)
522 Fifth Avenue
New York, NY 10036 | | Secretary | | Since
June
1999 | | Executive Director of the Adviser and various entities affiliated with the Adviser; Secretary of various Morgan Stanley Funds (since June 1999). | |
* Each officer serves an indefinite term, until his or her successor is elected.
35
Morgan Stanley Institutional Fund, Inc.
Annual Report — December 31, 2013
Adviser and Administrator
Morgan Stanley Investment Management Inc.
522 Fifth Avenue
New York, New York 10036
Sub-Advisers
Morgan Stanley Investment Management Limited
25 Cabot Square, Canary Wharf
London, E14 4QA, England
Morgan Stanley Investment Management Company
23 Church Street
16-01 Capital Square 049481 Singapore
Distributor
Morgan Stanley Distribution, Inc.
522 Fifth Avenue
New York, New York 10036
Dividend Disbursing and Transfer Agent
Boston Financial Data Services, Inc.
2000 Crown Colony Drive
Quincy, Massachusetts 02169
Custodian
State Street Bank and Trust Company
One Lincoln Street
Boston, Massachusetts 02111
Legal Counsel
Dechert LLP
1095 Avenue of the Americas
New York, New York 10036
Counsel to the Independent Directors
Kramer Levin Naftalis & Frankel LLP
1177 Avenue of the Americas
New York, New York 10036
Independent Registered Public Accounting Firm
Ernst & Young LLP
200 Clarendon Street
Boston, Massachusetts 02116
Reporting to Shareholders
Each Morgan Stanley fund provides a complete schedule of portfolio holdings in its semi-annual and annual reports within 60 days of the end of the fund's second and fourth fiscal quarters by filing the schedule electronically with the Securities and Exchange Commission (SEC). The semi-annual reports are filed on Form N-CSRS and the annual reports are filed on Form N-CSR. Morgan Stanley also delivers the semi-annual and annual reports to fund shareholders and makes these reports available on its public website, www.morganstanley.com/im. Each Morgan Stanley fund also files a complete schedule of portfolio holdings with the SEC for the fund's first and third fiscal quarters on Form N-Q. Morgan Stanley does not deliver the reports for the first and third fiscal quarters to shareholders, nor are the reports posted to the Morgan Stanley public website. You may, however, obtain the Form N-Q filings (as well as the Form N-CSR and N-CSRS filings) by accessing the SEC's website, www.sec.gov. You may also review and copy them at the SEC's Public Reference Room in Washington, DC. Information on the operation of the SEC's Public Reference Room may be obtained by calling the SEC toll free at 1 (800) SEC-0330. You can also request copies of these materials, upon payment of a duplicating fee, by electronic request at the SEC's email address (publicinfo@sec.gov) or by writing the Public Reference Room of the SEC, Washington, DC 20549-0102.
Proxy Voting Policies and Procedures and Proxy Voting Record
You may obtain a copy of the Fund's Proxy Voting Policy and Procedures and information regarding how the Fund voted proxies relating to portfolio securities during the most recent twelve-month period ended June 30, without charge, upon request, by calling toll free 1 (800) 548-7786 or by visiting our website at www.morganstanley.com/im. This information is also available on the SEC's website at www.sec.gov.
This report is authorized for distribution only when preceded or accompanied by a prospectus of the Morgan Stanley Institutional Fund, Inc. which describes in detail each Investment Portfolio's investment policies, risks, fees and expenses. Please read the prospectus carefully before you invest or send money. For additional information, including information regarding the investments comprising the Portfolio, please visit our website at www.morganstanley.com/im or call toll free 1 (800) 548-7786.
36
(This Page has been left blank intentionally.)
Printed in U.S.A.
This Report has been prepared for shareholders and may be distributed to others only if preceded or accompanied by a current prospectus.
Morgan Stanley Investment Management Inc.
522 Fifth Avenue
New York, New York 10036
© 2014 Morgan Stanley. Morgan Stanley Distribution, Inc.

IFIIEANN
809338 EXP 2.28.15

Morgan Stanley Institutional Fund, Inc.
Emerging Markets Portfolio
Annual Report
December 31, 2013

Morgan Stanley Institutional Fund, Inc.
Annual Report — December 31, 2013
Shareholders' Letter | | | 2 | | |
Expense Example | | | 3 | | |
Investment Overview | | | 4 | | |
Portfolio of Investments | | | 6 | | |
Statement of Assets and Liabilities | | | 9 | | |
Statement of Operations | | | 11 | | |
Statements of Changes in Net Assets | | | 12 | | |
Financial Highlights | | | 14 | | |
Notes to Financial Statements | | | 18 | | |
Report of Independent Registered Public Accounting Firm | | | 27 | | |
Federal Tax Notice | | | 28 | | |
U.S. Privacy Policy | | | 29 | | |
Director and Officer Information | | | 32 | | |
This report is authorized for distribution only when preceded or accompanied by prospectuses of the Morgan Stanley Institutional Fund, Inc. To receive a prospectus and/or statement of additional information (SAI), which contains more complete information such as investment objectives, charges, expenses, policies for voting proxies, risk considerations, and describes in detail each of the Portfolio's investment policies to the prospective investor, please call toll free 1 (800) 548-7786. Please read the prospectuses carefully before you invest or send money.
Additionally, you can access portfolio information including performance, characteristics, and investment team commentary through Morgan Stanley Investment Management's website: www.morganstanley.com/im.
Market forecasts provided in this report may not necessarily come to pass. There is no guarantee that any sectors mentioned will continue to perform as discussed herein or that securities in such sectors will be held by the Portfolio in the future. There is no assurance that a Portfolio will achieve its investment objective. Portfolios are subject to market risk, which is the possibility that market values of securities owned by the Portfolio will decline and, therefore, the value of the Portfolio's shares may be less than what you paid for them. Accordingly, you can lose money investing in the Portfolio. Please see the prospectus for more complete information on investment risks.
1
Morgan Stanley Institutional Fund, Inc.
Annual Report — December 31, 2013
Shareholders' Letter (unaudited)
Dear Shareholders,
We are pleased to provide this Annual report, in which you will learn how your investment in Emerging Markets Portfolio (the "Portfolio") performed during the latest twelve-month period.
Morgan Stanley Investment Management is a client-centric, investor-led organization. Our global presence, intellectual capital, and breadth of products and services enable us to partner with investors to meet the evolving challenges of today's financial markets. We aim to deliver superior investment service and to empower our clients to make the informed decisions that help them reach their investment goals.
As always, we thank you for selecting Morgan Stanley Investment Management, and look forward to working with you in the months and years ahead.
Sincerely,

John H. Gernon
President and Principal Executive Officer
January 2014
2
Morgan Stanley Institutional Fund, Inc.
Annual Report — December 31, 2013
Expense Example (unaudited)
Emerging Markets Portfolio
As a shareholder of the Portfolio, you incur two types of costs: (1) transactional costs, including redemptions fees; and (2) ongoing costs, including advisory fees, administration fees, distribution and shareholder services fees and other Portfolio expenses. This example is intended to help you understand your ongoing costs (in dollars) of investing in the Portfolio and to compare these costs with the ongoing costs of investing in other mutual funds.
This example is based on an investment of $1,000 invested at the beginning of the six-month period ended December 31, 2013 and held for the entire six-month period.
Actual Expenses
The table below provides information about actual account values and actual expenses. You may use the information in this table, together with the amount you invested, to estimate the expenses that you paid over the period. Simply divide your account value by $1,000 (for example, an $8,600 account value divided by $1,000 = 8.6), then multiply the result by the number in the table under the heading entitled "Actual Expenses Paid During Period" to estimate the expenses you paid on your account during this period.
Hypothetical Example for Comparison Purposes
The table below provides information about hypothetical account values and hypothetical expenses based on the Portfolio's actual expense ratio and an assumed rate of return of 5% per year before expenses, which is not the Portfolio's actual return. The hypothetical account values and expenses may not be used to estimate the actual ending account balance or expenses you paid for the period. You may use this information to compare the ongoing costs of investing in the Portfolio and other funds. To do so, compare this 5% hypothetical example with the 5% hypothetical examples that appear in the shareholder reports of the other funds.
Please note that the expenses shown in the table are meant to highlight your ongoing costs only and do not reflect any transactional costs, such as sales charges (loads) and redemption fees. Therefore, the information for each class in the table is useful in comparing ongoing costs only, and will not help you determine the relative total costs of owning different funds. In addition, if these transactional costs were included, your costs would have been higher.
| | | Beginning
Account
Value
7/1/13 | | Actual Ending
Account
Value
12/31/13 | | Hypothetical
Ending Account
Value | | Actual
Expenses
Paid
During
Period* | | Hypothetical
Expenses Paid
During Period* | | Net
Expense
Ratio
During
Period*** | |
Emerging Markets Portfolio Class I | | $ | 1,000.00 | | | $ | 1,050.70 | | | $ | 1,018.95 | | | $ | 6.41 | * | | $ | 6.31 | * | | | 1.24 | % | |
Emerging Markets Portfolio Class A@ | | | 1,000.00 | | | | 1,048.90 | | | | 1,017.39 | | | | 8.00 | * | | | 7.88 | * | | | 1.55 | | |
Emerging Markets Portfolio Class L | | | 1,000.00 | | | | 1,046.10 | | | | 1,014.82 | | | | 10.62 | * | | | 10.46 | * | | | 2.06 | | |
Emerging Markets Portfolio Class IS | | | 1,000.00 | | | | 1,018.50 | | | | 1,011.23 | | | | 3.46 | ** | | | 3.45 | ** | | | 1.17 | | |
* Expenses are calculated using each Portfolio Class' annualized net expense ratio (as disclosed), multiplied by the average account value over the period, and multiplied by 184/365 (to reflect the most recent one-half year period).
** Expenses are calculated using the Portfolio Class' annualized net expense ratio (as disclosed), multiplied by the average account value over the period, and multiplied by 107/365 (to reflect the actual days in the period).
*** Annualized.
@ Effective September 9, 2013, Class P and Class H shares were renamed Class A shares.
3
Morgan Stanley Institutional Fund, Inc.
Annual Report — December 31, 2013
Investment Overview (unaudited)
Emerging Markets Portfolio
The Emerging Markets Portfolio seeks long-term capital appreciation by investing primarily in growth-oriented equity securities of issuers in emerging market countries.
Performance
For the year ended December 31, 2013, the Portfolio had a total return based on net asset value and reinvestment of distributions per share of -0.80%, net of fees, for Class I shares. The Portfolio's Class I shares outperformed against its benchmark, the Morgan Stanley Capital International (MSCI) Emerging Markets Net Index (the "Index"), which returned -2.60%.
Factors Affecting Performance
• Since mid-2011, emerging markets equities have underperformed those of developed markets as emerging markets' economic growth has been reset downward, which has disappointed investor expectations. We think two main fault lines will continue to negatively affect emerging market returns: China's excessive credit expansion over the last four years and growing investor concerns about countries with current account deficits that are vulnerable to the tapering of quantitative easing (QE) in the U.S. In countries affected by a Chinese slowdown — particularly Brazil, Russia and South Africa — earnings have been weaker than consensus expected. Countries with large current account deficits, such as Indonesia and Turkey, will continue to remain a concern.
• Our stock selection in China and South Africa were among the primary contributors to performance during the year. An underweight allocation to Brazil, along with stock selection in Eastern Europe, Russia and India, also benefited performance.
• The main detractors from results were our stock selection in Indonesia, and an overweight allocation to and stock selection in Thailand. Our stock selection in and underweight allocation to Taiwan also dampened performance, as did stock selection in Korea.
Management Strategies
• As mentioned above, we believe two major fault lines will continue to negatively affect emerging market equities. First, China's credit growth has been excessive and could contribute to an eventual economic slowdown that is likely to surprise consensus expectations. Second, current account deficits in various countries are likely to remain a concern. However, we note there are nuanced differences in the drivers and direction of each
country's current account situation and we think investors will eventually consider such differentiation.
• In the Portfolio, we remain confident in our underweight to China and China-related plays via commodities and commodities-oriented markets such as Brazil, Russia and South Africa. In regard to the challenges from rising U.S. bond yields, we remain focused on being overweight those countries that we believe are fundamentally sound but had suffered collateral damage in 2013 — including the Philippines, Mexico, Thailand and Poland. These are countries that have not experienced excessive credit growth since the global financial crisis and whose balance of payments is improving. We consider Eastern Europe a well-placed region to potentially benefit from a European growth recovery. German economic growth continues to create positive spillover effects for Poland and the rest of Eastern Europe, where industrial indicators continue to signal expansion. The Philippines remains an underpenetrated market for financial products and we expect gross domestic product (GDP) growth to continue to be buoyant, driven in part by healthy investment and infrastructure spending. In these cases, we have added to our positions and bought on weakness. We have a preference for countries that exhibit constructive reform agendas, sustainable levels of investment-to-GDP and compelling earnings prospects.
* Minimum Investment for Class I shares
In accordance with SEC regulations, Portfolio's performance shown assumes that all recurring fees (including management fees) were deducted and all dividends and distributions were reinvested. The performance of Class A+, L and IS shares will vary from Class I shares based upon their different inception dates and will be negatively impacted by additional fees assessed to those classes (if applicable).
4
Morgan Stanley Institutional Fund, Inc.
Annual Report — December 31, 2013
Investment Overview (unaudited) (cont'd)
Emerging Markets Portfolio
Performance Compared to the Morgan Stanley Capital International (MSCI) Emerging Markets Net Index(1) and the Lipper Emerging Markets Funds Index(2)
| | | Period Ended December 31, 2013
Total Returns(3) | |
| | | | | Average Annual | |
| | | One
Year | | Five
Years | | Ten
Years | | Since
Inception(8) | |
Portfolio — Class I Shares
w/o sales charges(4) | | | -0.80 | % | | | 14.34 | % | | | 10.76 | % | | | 8.75 | % | |
MSCI Emerging Markets Net Index | | | -2.60 | | | | 14.79 | | | | 11.17 | | | | 8.35 | | |
Lipper Emerging Markets Funds Index | | | -1.29 | | | | 15.17 | | | | 10.65 | | | | N/A | | |
Portfolio — Class A+ Shares
w/o sales charges(5) | | | -1.07 | | | | 14.04 | | | | 10.48 | | | | 7.64 | | |
Portfolio — Class A+ Shares with
maximum 5.25% sales charges(5) | | | -6.26 | | | | 12.81 | | | | 9.89 | | | | 7.32 | | |
MSCI Emerging Markets Net Index | | | -2.60 | | | | 14.79 | | | | 11.17 | | | | 6.85 | | |
Lipper Emerging Markets Funds Index | | | -1.29 | | | | 15.17 | | | | 10.65 | | | | 7.06 | | |
Portfolio — Class L Shares
w/o sales charges(6) | | | -1.56 | | | | — | | | | — | | | | 2.68 | | |
MSCI Emerging Markets Net Index | | | -2.60 | | | | — | | | | — | | | | 1.69 | | |
Lipper Emerging Markets Funds Index | | | -1.29 | | | | — | | | | — | | | | 2.88 | | |
Portfolio — Class IS Shares
w/o sales charges(7) | | | — | | | | — | | | | — | | | | 1.85 | | |
MSCI Emerging Markets Net Index | | | — | | | | — | | | | — | | | | 1.99 | | |
Lipper Emerging Markets Funds Index | | | — | | | | — | | | | — | | | | 2.57 | | |
Performance data quoted represents past performance, which is no guarantee of future results, and current performance may be lower or higher than the figures shown. Performance assumes that all dividends and distributions, if any, were reinvested. For the most recent month-end performance figures, please visit www.morganstanley.com/im. Investment return and principal value will fluctuate so that Portfolio shares, when redeemed, may be worth more or less than their original cost. Total returns do not reflect the deduction of taxes that a shareholder would pay on Portfolio distributions or the redemption of Portfolio shares. Returns for periods less than one year are not annualized. Performance of share classes will vary due to difference in expenses.
+ Effective September 9, 2013, Class P shares were renamed Class A shares.
(1) The Morgan Stanley Capital International (MSCI) Emerging Markets Net Index is a free float-adjusted market capitalization weighted index that is designed to measure equity market performance of emerging markets. The term "free float" represents the portion of shares outstanding that are deemed to be available for purchase in the public equity markets by investors. The MSCI Emerging Markets Net Index currently consists of 21 emerging market country indices. The performance of the Index is listed in U.S. dollars and assumes reinvestment of net dividends. The Index is unmanaged and its returns do not include any sales charges or fees. Such costs would lower performance. It is not possible to invest directly in an index.
(2) The Lipper Emerging Markets Funds Index is an equally weighted performance index of the largest qualifying funds (based on net assets) in the Lipper Emerging Markets Funds classification. The Index, which is adjusted for capital gains distributions and income dividends, is unmanaged and should not be considered an investment. There are currently 30 funds represented in this Index. As of the date of this report, the Portfolio is in the Lipper Emerging Markets Funds classification.
(3) Total returns for the Portfolio reflect fees waived and expenses reimbursed, if applicable, by the Adviser. Without such waivers and reimbursements, total returns would have been lower. The fee waivers and/or expense reimbursements
will continue for at least one year or until such time as the Fund's Board of Directors acts to discontinue all or a portion of such waivers and/or expense reimbursements when it deems that such action is appropriate.
(4) Commenced operations on September 25, 1992.
(5) Commenced offering on January 2, 1996.
(6) Commenced offering on April 27, 2012.
(7) Commenced offering on September 13, 2013.
(8) For comparative purposes, average annual since inception returns listed for the Indexes refer to the inception date or initial offering of the respective share class of the Portfolio, not the inception of the Index. Returns for periods less than one year are not annualized.
Portfolio Composition*
Classification | | Percentage of
Total Investments | |
Other** | | | 57.3 | % | |
Commercial Banks | | | 18.1 | | |
Semiconductors & Semiconductor Equipment | | | 8.8 | | |
Wireless Telecommunication Services | | | 5.5 | | |
Internet Software & Services | | | 5.2 | | |
Oil, Gas & Consumable Fuels | | | 5.1 | | |
Total Investments | | | 100.0 | %*** | |
* Percentages indicated are based upon total investments (excluding Securities held as Collateral on Loaned Securities) as of December 31, 2013.
** Industries and/or investment types representing less than 5% of total investments.
*** Does not include open foreign currency forward exchange contracts with total unrealized appreciation of approximately $128,000.
5
Morgan Stanley Institutional Fund, Inc.
Annual Report — December 31, 2013
Portfolio of Investments
Emerging Markets Portfolio
| | | Shares | | Value
(000) | |
Common Stocks (98.2%) | |
Austria (1.8%) | |
Erste Group Bank AG | | | 348,369 | | | $ | 12,140 | | |
Vienna Insurance Group AG Wiener
Versicherung Gruppe | | | 178,554 | | | | 8,898 | | |
| | | | 21,038 | | |
Brazil (6.9%) | |
AMBEV SA ADR | | | 1,641,300 | | | | 12,063 | | |
Banco Bradesco SA (Preference) | | | 1,040,347 | | | | 12,828 | | |
| BRF SA | | | 958,410 | | | | 20,007 | | |
CCR SA | | | 965,128 | | | | 7,269 | | |
Petroleo Brasileiro SA | | | 550,286 | | | | 3,730 | | |
Petroleo Brasileiro SA (Preference) | | | 1,623,552 | | | | 11,754 | | |
Petroleo Brasileiro SA ADR | | | 203,186 | | | | 2,800 | | |
Raia Drogasil SA | | | 434,029 | | | | 2,719 | | |
Ultrapar Participacoes SA | | | 304,750 | | | | 7,227 | | |
| | | | 80,397 | | |
Chile (0.7%) | |
SACI Falabella | | | 862,354 | | | | 7,746 | | |
China (13.2%) | |
Bank of China Ltd. H Shares (a) | | | 49,859,000 | | | | 22,955 | | |
Beijing Enterprises Holdings Ltd. (a)(b) | | | 499,000 | | | | 4,949 | | |
China Conch Venture Holdings Ltd. (a)(c) | | | 509,500 | | | | 1,396 | | |
China Construction Bank Corp. H Shares (a) | | | 18,115,250 | | | | 13,667 | | |
China Mengniu Dairy Co., Ltd. (a) | | | 1,747,000 | | | | 8,291 | | |
China Mobile Ltd. (a) | | | 1,339,500 | | | | 13,889 | | |
China Oilfield Services Ltd. H Shares (a) | | | 2,886,000 | | | | 8,951 | | |
China Overseas Grand Oceans Group Ltd. (a)(b) | | | 1,638,000 | | | | 1,561 | | |
China Overseas Land & Investment Ltd. (a)(b) | | | 1,832,000 | | | | 5,150 | | |
China Pacific Insurance Group Co., Ltd. H Shares (a) | | | 2,981,800 | | | | 11,690 | | |
China Petroleum & Chemical Corp. H Shares (a) | | | 5,828,600 | | | | 4,758 | | |
Chongqing Changan Automobile Co., Ltd. B Shares | | | 868,202 | | | | 1,713 | | |
NetEase, Inc. ADR | | | 21,200 | | | | 1,666 | | |
Qihoo 360 Technology Co., Ltd. ADR (c) | | | 101,911 | | | | 8,362 | | |
Sihuan Pharmaceutical Holdings Group Ltd. (a) | | | 5,250,000 | | | | 4,793 | | |
Sino Biopharmaceutical Ltd. (a) | | | 5,486,000 | | | | 4,351 | | |
Tencent Holdings Ltd. (a) | | | 410,000 | | | | 26,151 | | |
Tsingtao Brewery Co., Ltd. H Shares (a)(b) | | | 678,000 | | | | 5,731 | | |
Uni-President China Holdings Ltd. (a)(b) | | | 3,880,000 | | | | 3,953 | | |
| | | | 153,977 | | |
Colombia (1.2%) | |
Cemex Latam Holdings SA (c) | | | 729,807 | | | | 5,596 | | |
Grupo de Inversiones Suramericana SA | | | 234,745 | | | | 4,099 | | |
Grupo de Inversiones Suramericana SA (Preference) | | | 203,600 | | | | 3,690 | | |
| | | | 13,385 | | |
Czech Republic (0.8%) | |
Komercni Banka AS | | | 42,175 | | | | 9,389 | | |
Hong Kong (1.2%) | |
Samsonite International SA | | | 4,430,400 | | | | 13,484 | | |
Hungary (1.0%) | |
Richter Gedeon Nyrt | | | 598,858 | | | | 12,192 | | |
| | | Shares | | Value
(000) | |
India (6.8%) | |
Asian Paints Ltd. | | | 675,578 | | | $ | 5,352 | | |
Glenmark Pharmaceuticals Ltd. | | | 833,268 | | | | 7,192 | | |
HDFC Bank Ltd. | | | 752,494 | | | | 8,263 | | |
Idea Cellular Ltd. | | | 2,784,021 | | | | 7,512 | | |
IndusInd Bank Ltd. | | | 591,821 | | | | 4,025 | | |
Infosys Ltd. | | | 136,581 | | | | 7,696 | | |
ING Vysya Bank Ltd. | | | 372,491 | | | | 3,710 | | |
ITC Ltd. | | | 1,572,609 | | | | 8,183 | | |
Oil & Natural Gas Corp. Ltd. | | | 555,815 | | | | 2,596 | | |
Sun Pharmaceutical Industries Ltd. | | | 790,243 | | | | 7,249 | | |
Tata Consultancy Services Ltd. | | | 315,099 | | | | 11,065 | | |
Zee Entertainment Enterprises Ltd. | | | 1,508,535 | | | | 6,746 | | |
| | | | 79,589 | | |
Indonesia (1.6%) | |
Bank Tabungan Negara Persero Tbk PT | | | 45,217,454 | | | | 3,232 | | |
Indosat Tbk PT | | | 6,206,500 | | | | 2,116 | | |
Kalbe Farma Tbk PT | | | 47,781,500 | | | | 4,908 | | |
Matahari Department Store Tbk PT (c) | | | 5,419,500 | | | | 4,899 | | |
Semen Indonesia Persero Tbk PT | | | 3,028,000 | | | | 3,521 | | |
| | | | 18,676 | | |
Korea, Republic of (16.8%) | |
Cheil Worldwide, Inc. (c) | | | 136,195 | | | | 3,549 | | |
Cosmax, Inc. (b)(c) | | | 67,187 | | | | 3,170 | | |
Coway Co., Ltd. | | | 138,394 | | | | 8,707 | | |
GS Retail Co., Ltd. (c) | | | 102,990 | | | | 2,733 | | |
Hana Financial Group, Inc. | | | 168,730 | | | | 7,019 | | |
Hotel Shilla Co., Ltd. (c) | | | 65,589 | | | | 4,133 | | |
Hyundai Department Store Co., Ltd. (c) | | | 22,309 | | | | 3,403 | | |
Hyundai Engineering & Construction Co., Ltd. (c) | | | 159,618 | | | | 9,181 | | |
Hyundai Glovis Co., Ltd. (c) | | | 30,857 | | | | 6,754 | | |
Hyundai Heavy Industries Co., Ltd. (c) | | | 25,266 | | | | 6,153 | | |
Hyundai Motor Co. (c) | | | 97,648 | | | | 21,883 | | |
Hyundai Rotem Co., Ltd. (c) | | | 3,450 | | | | 94 | | |
KT Skylife Co., Ltd. (c) | | | 56,940 | | | | 1,594 | | |
LG Household & Health Care Ltd. (c) | | | 9,409 | | | | 4,886 | | |
LG Uplus Corp. (c) | | | 234,940 | | | | 2,393 | | |
NAVER Corp. (c) | | | 10,386 | | | | 7,125 | | |
NCSoft Corp. (c) | | | 33,680 | | | | 7,931 | | |
Nexon Co., Ltd. | | | 649,100 | | | | 5,991 | | |
Orion Corp. (b)(c) | | | 3,355 | | | | 3,017 | | |
Paradise Co., Ltd. (c) | | | 135,145 | | | | 3,387 | | |
Samsung Electronics Co., Ltd. | | | 37,410 | | | | 48,635 | | |
Samsung Electronics Co., Ltd. (Preference) | | | 7,994 | | | | 7,673 | | |
Shinhan Financial Group Co., Ltd. (c) | | | 266,542 | | | | 11,946 | | |
SK Hynix, Inc. (c) | | | 173,480 | | | | 6,049 | | |
SK Telecom Co., Ltd. | | | 31,942 | | | | 6,961 | | |
SK Telecom Co., Ltd. ADR (b) | | | 44,100 | | | | 1,086 | | |
| | | | 195,453 | | |
Laos (0.3%) | |
Kolao Holdings GDR (c) | | | 307,392 | | | | 3,939 | | |
The accompanying notes are an integral part of the financial statements.
6
Morgan Stanley Institutional Fund, Inc.
Annual Report — December 31, 2013
Portfolio of Investments (cont'd)
Emerging Markets Portfolio
| | | Shares | | Value
(000) | |
Malaysia (2.9%) | |
Astro Malaysia Holdings Bhd | | | 6,468,900 | | | $ | 5,925 | | |
CIMB Group Holdings Bhd | | | 4,077,057 | | | | 9,485 | | |
Gamuda Bhd | | | 4,456,400 | | | | 6,530 | | |
IHH Healthcare Bhd (c) | | | 3,429,900 | | | | 4,042 | | |
IJM Corp., Bhd | | | 4,420,300 | | | | 7,935 | | |
| | | | 33,917 | | |
Mexico (7.3%) | |
Alfa SAB de CV | | | 5,161,823 | | | | 14,549 | | |
America Movil SAB de CV, Class L ADR | | | 425,930 | | | | 9,954 | | |
Cemex SAB de CV ADR (c) | | | 1,448,827 | | | | 17,140 | | |
Fomento Economico Mexicano SAB de CV ADR | | | 109,097 | | | | 10,677 | | |
Grupo Financiero Banorte SAB de CV Series O | | | 2,236,870 | | | | 15,648 | | |
Grupo Financiero Santander Mexico SAB de CV ADR | | | 446,608 | | | | 6,092 | | |
Mexichem SAB de CV | | | 1,283,828 | | | | 5,339 | | |
Wal-Mart de Mexico SAB de CV Series V | | | 2,204,801 | | | | 5,789 | | |
| | | | 85,188 | | |
Panama (0.8%) | |
Copa Holdings SA, Class A | | | 57,268 | | | | 9,169 | | |
Peru (1.1%) | |
Credicorp Ltd. | | | 97,533 | | | | 12,945 | | |
Philippines (3.7%) | |
BDO Unibank, Inc. | | | 6,703,590 | | | | 10,361 | | |
Bloomberry Resorts Corp. (c) | | | 11,390,200 | | | | 2,210 | | |
DMCI Holdings, Inc. | | | 6,028,190 | | | | 7,606 | | |
International Container Terminal Services, Inc. | | | 2,640,550 | | | | 6,069 | | |
LT Group, Inc. | | | 7,891,000 | | | | 2,745 | | |
Metro Pacific Investments Corp. | | | 74,984,600 | | | | 7,299 | | |
SM Investments Corp. | | | 430,220 | | | | 6,892 | | |
| | | | 43,182 | | |
Poland (4.4%) | |
Bank Pekao SA | | | 237,587 | | | | 14,117 | | |
Bank Zachodni WBK SA | | | 129,964 | | | | 16,674 | | |
Jeronimo Martins SGPS SA | | | 664,925 | | | | 13,003 | | |
Telekomunikacja Polska SA | | | 2,205,583 | | | | 7,155 | | |
| | | | 50,949 | | |
Qatar (0.5%) | |
Ooredoo QSC | | | 153,941 | | | | 5,800 | | |
Russia (4.2%) | |
Eurasia Drilling Co., Ltd. GDR | | | 110,674 | | | | 4,980 | | |
Lukoil OAO ADR | | | 135,128 | | | | 8,439 | | |
Mail.ru Group Ltd. GDR | | | 159,035 | | | | 7,093 | | |
MegaFon OAO GDR | | | 132,095 | | | | 4,425 | | |
NovaTek OAO (Registered GDR) | | | 87,400 | | | | 11,965 | | |
Sistema JSFC GDR | | | 50,168 | | | | 1,611 | | |
Yandex N.V., Class A (c) | | | 236,189 | | | | 10,192 | | |
| | | | 48,705 | | |
South Africa (4.4%) | |
Life Healthcare Group Holdings Ltd. (b) | | | 1,112,151 | | | | 4,438 | | |
Mondi PLC | | | 594,517 | | | | 10,269 | | |
| | | Shares | | Value
(000) | |
Naspers Ltd., Class N | | | 155,865 | | | $ | 16,285 | | |
Pick n Pay Stores Ltd. (b) | | | 959,085 | | | | 4,754 | | |
SABMiller PLC | | | 165,903 | | | | 8,426 | | |
Sasol Ltd. | | | 113,782 | | | | 5,581 | | |
Vodacom Group Ltd. | | | 131,424 | | | | 1,666 | | |
| | | | 51,419 | | |
Spain (0.8%) | |
Telefonica SA | | | 558,871 | | | | 9,099 | | |
Switzerland (2.0%) | |
Coca-Cola HBC AG (c) | | | 449,775 | | | | 13,123 | | |
Swatch Group AG (The) | | | 16,060 | | | | 10,613 | | |
| | | | 23,736 | | |
Taiwan (7.1%) | |
Chailease Holding Co., Ltd. | | | 2,886,550 | | | | 7,593 | | |
China Life Insurance Co., Ltd. | | | 3,476,245 | | | | 3,522 | | |
Cleanaway Co., Ltd. | | | 346,000 | | | | 2,258 | | |
Delta Electronics, Inc. | | | 714,000 | | | | 4,073 | | |
Eclat Textile Co., Ltd. | | | 393,180 | | | | 4,433 | | |
Fubon Financial Holding Co., Ltd. | | | 4,240,490 | | | | 6,203 | | |
Ginko International Co., Ltd. | | | 166,000 | | | | 3,136 | | |
Hermes Microvision, Inc. GDR (c) | | | 104,112 | | | | 3,382 | | |
Lung Yen Life Service Corp. | | | 132,000 | | | | 372 | | |
MediaTek, Inc. | | | 812,000 | | | | 12,083 | | |
Siliconware Precision Industries Co. | | | 1,537,000 | | | | 1,836 | | |
St. Shine Optical Co., Ltd. | | | 115,000 | | | | 3,284 | | |
Taiwan Cement Corp. | | | 512,000 | | | | 795 | | |
Taiwan Semiconductor Manufacturing Co., Ltd. | | | 6,479,205 | | | | 22,935 | | |
Uni-President Enterprises Corp. | | | 3,428,235 | | | | 6,177 | | |
| | | | 82,082 | | |
Thailand (3.9%) | |
Advanced Info Service PCL (Foreign) | | | 1,141,400 | | | | 6,930 | | |
Bangkok Bank PCL NVDR | | | 1,888,500 | | | | 10,230 | | |
Kasikornbank PCL NVDR | | | 1,250,700 | | | | 5,938 | | |
Land and Houses PCL (Foreign) | | | 16,799,200 | | | | 4,575 | | |
Land and Houses PCL NVDR | | | 6,844,500 | | | | 1,864 | | |
Minor International PCL (Foreign) (b) | | | 5,786,500 | | | | 3,645 | | |
Robinson Department Store PCL (Foreign) | | | 2,880,200 | | | | 4,207 | | |
Supalai PCL (Foreign) | | | 9,410,100 | | | | 4,181 | | |
Total Access Communication PCL (Foreign) | | | 1,441,800 | | | | 4,256 | | |
| | | | 45,826 | | |
Turkey (1.7%) | |
Anadolu Efes Biracilik Ve Malt Sanayii AS | | | 447,846 | | | | 4,845 | | |
Pegasus Hava Tasimaciligi AS (c) | | | 202,363 | | | | 3,418 | | |
Turkcell Iletisim Hizmetleri AS (c) | | | 663,952 | | | | 3,507 | | |
Turkiye Sise ve Cam Fabrikalari AS | | | 3,567,646 | | | | 4,516 | | |
Ulker Biskuvi Sanayi AS | | | 494,389 | | | | 3,497 | | |
| | | | 19,783 | | |
United States (1.1%) | |
Yum! Brands, Inc. | | | 170,176 | | | | 12,867 | | |
Total Common Stocks (Cost $942,990) | | | 1,143,932 | | |
The accompanying notes are an integral part of the financial statements.
7
Morgan Stanley Institutional Fund, Inc.
Annual Report — December 31, 2013
Portfolio of Investments (cont'd)
Emerging Markets Portfolio
| | | Shares | | Value
(000) | |
Investment Companies (0.8%) | |
India (0.4%) | |
Morgan Stanley Growth Fund (See Note G) (c) | | | 4,158,663 | | | $ | 4,668 | | |
Thailand (0.4%) | |
BTS Rail Mass Transit Growth Infrastructure
Fund (Foreign) (Units) (d) | | | 18,050,536 | | | | 4,724 | | |
Total Investment Companies (Cost $7,536) | | | 9,392 | | |
Short-Term Investments (2.7%) | |
Securities held as Collateral on Loaned Securities (1.7%) | |
Investment Company (1.4%) | |
Morgan Stanley Institutional Liquidity
Funds — Money Market Portfolio —
Institutional Class (See Note G) | | | 16,169,996 | | | | 16,170 | | |
| | | Face
Amount
(000) | | | |
Repurchase Agreements (0.3%) | |
Barclays Capital, Inc., (0.01%,
dated 12/31/13, due 1/2/14;
proceeds $3,276; fully collateralized
by a U.S. Government Obligation; 1.00%
due 3/31/17; valued at $3,341) | | $ | 3,276 | | | | 3,276 | | |
BNP Paribas Securities Corp., (0.01%,
dated 12/31/13, due 1/2/14;
proceeds $285; fully collateralized
by a U.S. Government Obligation; 3.63%
due 2/15/21; valued at $291) | | | 285 | | | | 285 | | |
| | | | 3,561 | | |
Total Securities held as Collateral on Loaned
Securities (Cost $19,731) | | | 19,731 | | |
| | | Shares | | Value
(000) | |
Investment Company (1.0%) | |
Morgan Stanley Institutional Liquidity
Funds — Money Market Portfolio —
Institutional Class (See Note G)
(Cost $11,492) | | | 11,492,109 | | | $ | 11,492 | | |
Total Short-Term Investments (Cost $31,223) | | | 31,223 | | |
Total Investments (101.7%) (Cost $981,749)
Including $19,387 of Securities Loaned (e) | | | 1,184,547 | | |
Liabilities in Excess of Other Assets (-1.7%) | | | (19,853 | ) | |
Net Assets (100.0%) | | $ | 1,164,694 | | |
(a) Security trades on the Hong Kong exchange.
(b) All or a portion of this security was on loan at December 31, 2013.
(c) Non-income producing security.
(d) Consists of one or more classes of securities traded together as a unit; stocks with attached warrants.
(e) Securities are available for collateral in connection with an open foreign currency forward exchange contract.
ADR American Depositary Receipt.
GDR Global Depositary Receipt.
NVDR Non-Voting Depositary Receipt.
Foreign Currency Forward Exchange Contracts:
The Portfolio had the following foreign currency forward exchange contracts open at December 31, 2013:
Counterparty | | Currency to
Deliver
(000) | | Value
(000) | | Settlement
Date | | In Exchange
For
(000) | | Value
(000) | | Unrealized
Appreciation
(000) | |
State Street Bank and Trust Co. | | JPY | 610,485 | | | $ | 5,798 | | | 1/16/14 | | USD | 5,926 | | | $ | 5,926 | | | $ | 128 | | |
JPY — Japanese Yen
USD — United States Dollar
The accompanying notes are an integral part of the financial statements.
8
Morgan Stanley Institutional Fund, Inc.
Annual Report — December 31, 2013
Emerging Markets Portfolio
Statement of Assets and Liabilities | | December 31, 2013
(000) | |
Assets: | |
Investments in Securities of Unaffiliated Issuers, at Value(1) (Cost $953,271) | | $ | 1,152,217 | | |
Investment in Security of Affiliated Issuer, at Value (Cost $28,478) | | | 32,330 | | |
Total Investments in Securities, at Value (Cost $981,749) | | | 1,184,547 | | |
Foreign Currency, at Value (Cost $5,073) | | | 5,066 | | |
Cash | | | 898 | | |
Receivable for Investments Sold | | | 3,658 | | |
Dividends Receivable | | | 1,198 | | |
Receivable for Portfolio Shares Sold | | | 551 | | |
Unrealized Appreciation on Foreign Currency Forward Exchange Contracts | | | 128 | | |
Tax Reclaim Receivable | | | 54 | | |
Receivable from Affiliate | | | 1 | | |
Other Assets | | | 62 | | |
Total Assets | | | 1,196,163 | | |
Liabilities: | |
Collateral on Securities Loaned, at Value | | | 20,629 | | |
Payable for Investments Purchased | | | 4,812 | | |
Payable for Advisory Fees | | | 2,815 | | |
Deferred Capital Gain Country Tax | | | 1,184 | | |
Payable for Portfolio Shares Redeemed | | | 658 | | |
Payable for Sub Transfer Agency Fees | | | 561 | | |
Payable for Sub Transfer Agency Fees — Class I | | | 352 | | |
Payable for Sub Transfer Agency Fees — Class A* | | | 14 | | |
Payable for Custodian Fees | | | 180 | | |
Payable for Administration Fees | | | 79 | | |
Payable for Directors' Fees and Expenses | | | 49 | | |
Payable for Professional Fees | | | 15 | | |
Payable for Shareholder Services Fees — Class A* | | | 8 | | |
Payable for Distribution and Shareholder Services Fees — Class L | | | — | @ | |
Payable for Transfer Agent Fees | | | 4 | | |
Payable for Transfer Agent Fees — Class I | | | 2 | | |
Payable for Transfer Agent Fees — Class A* | | | — | @ | |
Payable for Transfer Agent Fees — Class L | | | — | @ | |
Other Liabilities | | | 107 | | |
Total Liabilities | | | 31,469 | | |
Net Assets | | $ | 1,164,694 | | |
Net Assets Consist Of: | |
Paid-in-Capital | | $ | 969,074 | | |
Distributions in Excess of Net Investment Income | | | (6,757 | ) | |
Accumulated Net Realized Gain | | | 701 | | |
Unrealized Appreciation (Depreciation) on: | |
Investments (Net of approximately $1,184 Deferred Capital Gain Country Tax) | | | 197,762 | | |
Investments in Affiliates | | | 3,852 | | |
Foreign Currency Forward Exchange Contracts | | | 128 | | |
Foreign Currency Translations | | | (66 | ) | |
Net Assets | | $ | 1,164,694 | | |
The accompanying notes are an integral part of the financial statements.
9
Morgan Stanley Institutional Fund, Inc.
Annual Report — December 31, 2013
Emerging Markets Portfolio
Statement of Assets and Liabilities (cont'd) | | December 31, 2013
(000) | |
CLASS I: | |
Net Assets | | $ | 1,128,618 | | |
| Shares Outstanding $0.001 par value shares of beneficial interest (500,000,000 shares authorized) (not in 000's) | | | 45,808,307 | | |
Net Asset Value, Offering and Redemption Price Per Share | | $ | 24.64 | | |
CLASS A*: | |
Net Assets | | $ | 35,863 | | |
| Shares Outstanding $0.001 par value shares of beneficial interest (500,000,000 shares authorized) (not in 000's) | | | 1,493,166 | | |
Net Asset Value, Redemption Price Per Share | | $ | 24.02 | | |
Maximum Sales Load§§ | | | 5.25 | % | |
Maximum Sales Charge | | $ | 1.33 | | |
Maximum Offering Price Per Share | | $ | 25.35 | | |
CLASS L: | |
Net Assets | | $ | 203 | | |
| Shares Outstanding $0.001 par value shares of beneficial interest (500,000,000 shares authorized) (not in 000's) | | | 8,475 | | |
Net Asset Value, Offering and Redemption Price Per Share | | $ | 23.91 | | |
CLASS IS: | |
Net Assets | | $ | 10 | | |
| Shares Outstanding $0.001 par value shares of beneficial interest (500,000,000 shares authorized) (not in 000's) | | | 401 | | |
Net Asset Value, Offering and Redemption Price Per Share | | $ | 24.64 | | |
(1) Including:
Securities on Loan, at Value: | | $ | 19,387 | | |
@ Amount is less than $500.
* Effective September 9, 2013, Class P and Class H shares were renamed Class A shares.
§§ Effective February 25, 2013, the Directors approved the imposition of a maximum initial sales charge of 5.25% on purchases of Class A shares of the Portfolio.
The accompanying notes are an integral part of the financial statements.
10
Morgan Stanley Institutional Fund, Inc.
Annual Report — December 31, 2013
Emerging Markets Portfolio
Statement of Operations | | Year Ended
December 31, 2013
(000) | |
Investment Income: | |
Dividends from Securities of Unaffiliated Issuers (Net of $3,118 of Foreign Taxes Withheld) | | $ | 25,485 | | |
Income from Securities Loaned — Net | | | 218 | | |
Dividends from Security of Affiliated Issuer (Note G) | | | 20 | | |
Interest from Securities of Unaffiliated Issuers | | | 4 | | |
Total Investment Income | | | 25,727 | | |
Expenses: | |
Advisory Fees (Note B) | | | 15,339 | | |
Custodian Fees (Note F) | | | 1,227 | | |
Administration Fees (Note C) | | | 1,015 | | |
Sub Transfer Agency Fees | | | 886 | | |
Sub Transfer Agency Fees — Class I | | | 381 | | |
Sub Transfer Agency Fees — Class A* | | | 18 | | |
Professional Fees | | | 114 | | |
Shareholder Services Fees — Class A* (Note D) | | | 93 | | |
Distribution and Shareholder Services Fees — Class L (Note D) | | | 1 | | |
Registration Fees | | | 71 | | |
Directors' Fees and Expenses | | | 30 | | |
Transfer Agency Fees (Note E) | | | 29 | | |
Transfer Agency Fees — Class I (Note E) | | | 2 | | |
Transfer Agency Fees — Class A* (Note E) | | | 1 | | |
Transfer Agency Fees — Class L (Note E) | | | — | @ | |
Transfer Agency Fees — Class IS (Note E) | | | — | @ | |
Shareholder Reporting Fees | | | 18 | | |
Pricing Fees | | | 15 | | |
Other Expenses | | | 42 | | |
Expenses Before Non Operating Expenses | | | 19,282 | | |
Bank Overdraft Expense | | | 1 | | |
Total Expenses | | | 19,283 | | |
Waiver of Advisory Fees (Note B) | | | (3,174 | ) | |
Rebate from Morgan Stanley Affiliate (Note G) | | | (151 | ) | |
Reimbursement of Class Specific Expenses — Class I (Note B) | | | (144 | ) | |
Reimbursement of Class Specific Expenses — Class A* (Note B) | | | (1 | ) | |
Reimbursement of Class Specific Expenses — Class L (Note B) | | | (— | @) | |
Waiver of Transfer Agency Fees — Class IS | | | (— | @) | |
Net Expenses | | | 15,813 | | |
Net Investment Income | | | 9,914 | | |
Realized Gain (Loss): | |
Investments Sold (Net of approximately $1,872 Capital Gain Country Tax) | | | 37,917 | | |
Investments in Affiliates | | | 2,797 | | |
Foreign Currency Forward Exchange Contracts | | | 1,017 | | |
Foreign Currency Transactions | | | (1,532 | ) | |
Net Realized Gain | | | 40,199 | | |
Change in Unrealized Appreciation (Depreciation): | |
Investments (Net of Decrease in Deferred Capital Gain Country Tax of approximately $21) | | | (58,737 | ) | |
Investments in Affiliates | | | (4,080 | ) | |
Foreign Currency Forward Exchange Contracts | | | 27 | | |
Foreign Currency Translations | | | (56 | ) | |
Net Change in Unrealized Appreciation (Depreciation) | | | (62,846 | ) | |
Net Realized Gain and Change in Unrealized Appreciation (Depreciation) | | | (22,647 | ) | |
Net Decrease in Net Assets Resulting from Operations | | $ | (12,733 | ) | |
@ Amount is less than $500.
* Effective September 9, 2013, Class P and Class H shares were renamed Class A shares.
The accompanying notes are an integral part of the financial statements.
11
Morgan Stanley Institutional Fund, Inc.
Annual Report — December 31, 2013
Emerging Markets Portfolio
Statements of Changes in Net Assets | | Year Ended
December 31, 2013
(000) | | Year Ended
December 31, 2012
(000) | |
Increase (Decrease) in Net Assets: | |
Operations: | |
Net Investment Income | | $ | 9,914 | | | $ | 10,304 | | |
Net Realized Gain | | | 40,199 | | | | 16,280 | | |
Net Change in Unrealized Appreciation (Depreciation) | | | (62,846 | ) | | | 210,654 | | |
Net Increase (Decrease) in Net Assets Resulting from Operations | | | (12,733 | ) | | | 237,238 | | |
Distributions from and/or in Excess of: | |
Class I: | |
Net Investment Income | | | (9,348 | ) | | | (8,789 | ) | |
Net Realized Gain | | | (39,401 | ) | | | — | | |
Class A*: | |
Net Investment Income | | | (193 | ) | | | (163 | ) | |
Net Realized Gain | | | (1,255 | ) | | | — | | |
Class H@@@: | |
Net Investment Income | | | (— | @)** | | | (— | @) | |
Net Realized Gain | | | (2 | )** | | | — | | |
Class L: | |
Net Investment Income | | | (— | @) | | | (— | @) | |
Net Realized Gain | | | (6 | ) | | | — | | |
Class IS: | |
Net Investment Income | | | (— | @)*** | | | — | | |
Net Realized Gain | | | (— | @)*** | | | — | | |
Total Distributions | | | (50,205 | ) | | | (8,952 | ) | |
Capital Share Transactions:(1) | |
Class I: | |
Subscribed | | | 109,087 | | | | 112,318 | | |
Distributions Reinvested | | | 48,690 | | | | 8,763 | | |
Redeemed | | | (247,040 | ) | | | (261,321 | ) | |
Class A*: | |
Subscribed | | | 8,625 | | | | 8,578 | | |
Distributions Reinvested | | | 1,428 | | | | 159 | | |
Conversion from Class H | | | 139 | | | | — | | |
Redeemed | | | (13,291 | ) | | | (22,529 | ) | |
Class H@@@: | |
Subscribed | | | 139 | ** | | | 18 | **** | |
Distributions Reinvested | | | 2 | ** | | | — | | |
Conversion to Class A | | | (139 | )** | | | — | | |
Redeemed | | | (9 | )** | | | — | | |
Class L: | |
Subscribed | | | 194 | | | | 10 | **** | |
Distributions Reinvested | | | 6 | | | | — | | |
Class IS: | |
Subscribed | | | 10 | *** | | | — | | |
Net Decrease in Net Assets Resulting from Capital Share Transactions | | | (92,159 | ) | | | (154,004 | ) | |
Redemption Fees | | | 100 | | | | 31 | | |
Total Increase (Decrease) in Net Assets | | | (154,997 | ) | | | 74,313 | | |
Net Assets: | |
Beginning of Period | | | 1,319,691 | | | | 1,245,378 | | |
End of Period (Including Distributions in Excess of Net Investment Income of $(6,757) and $(9,335)) | | $ | 1,164,694 | | | $ | 1,319,691 | | |
The accompanying notes are an integral part of the financial statements.
12
Morgan Stanley Institutional Fund, Inc.
Annual Report — December 31, 2013
Emerging Markets Portfolio
Statements of Changes in Net Assets (cont'd) | | Year Ended
December 31, 2013
(000) | | Year Ended
December 31, 2012
(000) | |
(1) Capital Share Transactions: | |
Class I: | |
Shares Subscribed | | | 4,227 | | | | 4,691 | | |
Shares Issued on Distributions Reinvested | | | 2,005 | | | | 342 | | |
Shares Redeemed | | | (9,732 | ) | | | (10,897 | ) | |
Net Decrease in Class I Shares Outstanding | | | (3,500 | ) | | | (5,864 | ) | |
Class A*: | |
Shares Subscribed | | | 348 | | | | 373 | | |
Shares Issued on Distributions Reinvested | | | 60 | | | | 6 | | |
Conversion from Class H | | | 6 | | | | — | | |
Shares Redeemed | | | (534 | ) | | | (961 | ) | |
Net Decrease in Class A Shares Outstanding | | | (120 | ) | | | (582 | ) | |
Class H@@@: | |
Shares Subscribed | | | 5 | ** | | | 1 | **** | |
Shares Issued on Distributions Reinvested | | | — | @@** | | | — | | |
Conversion to Class A | | | (6 | )** | | | — | | |
Shares Redeemed | | | (— | @@)** | | | — | | |
Net Increase (Decrease) in Class H Shares Outstanding | | | (1 | ) | | | 1 | | |
Class L: | |
Shares Subscribed | | | 8 | | | | — | @@**** | |
Shares Issued on Distributions Reinvested | | | — | @@ | | | — | | |
Net Increase in Class L Shares Outstanding | | | 8 | | | | — | | |
Class IS: | |
Shares Subscribed | | | — | @@*** | | | — | | |
@ Amount is less than $500.
@@ Amount is less than 500 shares.
@@@ Effective September 9, 2013, Class H shares converted into Class A shares.
* Effective September 9, 2013, Class P shares were renamed Class A shares.
** For the period January 1, 2013 through September 6, 2013.
*** For the period September 13, 2013 through December 31, 2013.
**** For the period April 30, 2012 to December 31, 2012.
The accompanying notes are an integral part of the financial statements.
13
Morgan Stanley Institutional Fund, Inc.
Annual Report — December 31, 2013
Financial Highlights
Emerging Markets Portfolio
| | | Class I | |
| | | Year Ended December 31, | |
Selected Per Share Data and Ratios | | 2013 | | 2012 | | 2011 | | 2010 | | 2009 | |
Net Asset Value, Beginning of Period | | $ | 25.94 | | | $ | 21.73 | | | $ | 27.14 | | | $ | 23.10 | | | $ | 13.79 | | |
Income (Loss) from Investment Operations: | |
Net Investment Income† | | | 0.20 | | | | 0.19 | | | | 0.22 | | | | 0.10 | | | | 0.10 | | |
Net Realized and Unrealized Gain (Loss) | | | (0.44 | ) | | | 4.19 | | | | (5.22 | ) | | | 4.15 | | | | 9.49 | | |
Total from Investment Operations | | | (0.24 | ) | | | 4.38 | | | | (5.00 | ) | | | 4.25 | | | | 9.59 | | |
Distributions from and/or in Excess of: | |
Net Investment Income | | | (0.20 | ) | | | (0.17 | ) | | | — | | | | (0.21 | ) | | | (0.28 | ) | |
Net Realized Gain | | | (0.86 | ) | | | — | | | | (0.41 | ) | | | — | | | | — | | |
Total Distributions | | | (1.06 | ) | | | (0.17 | ) | | | (0.41 | ) | | | (0.21 | ) | | | (0.28 | ) | |
Redemption Fees | | | 0.00 | ‡ | | | 0.00 | ‡ | | | 0.00 | ‡ | | | 0.00 | ‡ | | | 0.00 | ‡ | |
Net Asset Value, End of Period | | $ | 24.64 | | | $ | 25.94 | | | $ | 21.73 | | | $ | 27.14 | | | $ | 23.10 | | |
Total Return++ | | | (0.80 | )% | | | 20.19 | % | | | (18.41 | )% | | | 18.49 | % | | | 69.54 | % | |
Ratios and Supplemental Data: | |
Net Assets, End of Period (Thousands) | | $ | 1,128,618 | | | $ | 1,278,837 | | | $ | 1,198,857 | | | $ | 2,031,778 | | | $ | 2,198,793 | | |
Ratio of Expenses to Average Net Assets (1) | | | 1.24 | %+ | | | 1.28 | %+^ | | | 1.48 | %+†† | | | 1.47 | %+†† | | | 1.40 | %+ | |
Ratio of Expenses to Average Net Assets Excluding Non Operating Expenses | | | 1.24 | %+ | | | N/A | | | | N/A | | | | 1.47 | %+†† | | | 1.40 | %+ | |
Ratio of Net Investment Income to Average Net Assets (1) | | | 0.79 | %+ | | | 0.80 | %+^ | | | 0.86 | %+†† | | | 0.40 | %+†† | | | 0.56 | %+ | |
Ratio of Rebate from Morgan Stanley Affiliates to Average Net Assets | | | 0.01 | % | | | 0.01 | % | | | 0.01 | %†† | | | 0.01 | %†† | | | 0.01 | % | |
Portfolio Turnover Rate | | | 49 | % | | | 47 | % | | | 60 | % | | | 59 | % | | | 64 | % | |
(1) Supplemental Information on the Ratios to Average Net Assets: | |
Ratios Before Expense Limitation: | |
Expenses to Average Net Assets | | | 1.51 | % | | | 1.49 | % | | | N/A | | | | N/A | | | | N/A | | |
Net Investment Income to Average Net Assets | | | 0.52 | % | | | 0.59 | % | | | N/A | | | | N/A | | | | N/A | | |
† Per share amount is based on average shares outstanding.
‡ Amount is less than $0.005 per share.
++ Calculated based on the net asset value as of the last business day of the period.
+ The Ratios of Expenses and Net Investment Income reflect the rebate of certain Portfolio expenses in connection with the investments in Morgan Stanley affiliates during the period. The effect of the rebate on the ratios is disclosed in the above table as "Ratio of Rebate from Morgan Stanley Affiliates to Average Net Assets."
†† Reflects overall Portfolio ratios for investment income and non-class specific expenses.
^ Effective March 1, 2012, the Adviser has agreed to limit the ratio of expenses to average net assets to the maximum ratio of 1.25% for Class I shares. Prior to March 1, 2012, the maximum ratio was 1.65% for Class I shares.
The accompanying notes are an integral part of the financial statements.
14
Morgan Stanley Institutional Fund, Inc.
Annual Report — December 31, 2013
Financial Highlights
Emerging Markets Portfolio
| | | Class A@ | |
| | | Year Ended December 31, | |
Selected Per Share Data and Ratios | | 2013 | | 2012 | | 2011 | | 2010 | | 2009 | |
Net Asset Value, Beginning of Period | | $ | 25.31 | | | $ | 21.20 | | | $ | 26.56 | | | $ | 22.61 | | | $ | 13.51 | | |
Income (Loss) from Investment Operations: | |
Net Investment Income† | | | 0.12 | | | | 0.14 | | | | 0.15 | | | | 0.04 | | | | 0.06 | | |
Net Realized and Unrealized Gain (Loss) | | | (0.42 | ) | | | 4.07 | | | | (5.10 | ) | | | 4.06 | | | | 9.28 | | |
Total from Investment Operations | | | (0.30 | ) | | | 4.21 | | | | (4.95 | ) | | | 4.10 | | | | 9.34 | | |
Distributions from and/or in Excess of: | |
Net Investment Income | | | (0.13 | ) | | | (0.10 | ) | | | — | | | | (0.15 | ) | | | (0.24 | ) | |
Net Realized Gain | | | (0.86 | ) | | | — | | | | (0.41 | ) | | | — | | | | — | | |
Total Distributions | | | (0.99 | ) | | | (0.10 | ) | | | (0.41 | ) | | | (0.15 | ) | | | (0.24 | ) | |
Redemption Fees | | | 0.00 | ‡ | | | 0.00 | ‡ | | | 0.00 | ‡ | | | 0.00 | ‡ | | | 0.00 | ‡ | |
Net Asset Value, End of Period | | $ | 24.02 | | | $ | 25.31 | | | $ | 21.20 | | | $ | 26.56 | | | $ | 22.61 | | |
Total Return++ | | | (1.07 | )% | | | 19.87 | % | | | (18.63 | )% | | | 18.20 | % | | | 69.11 | % | |
Ratios and Supplemental Data: | |
Net Assets, End of Period (Thousands) | | $ | 35,863 | | | $ | 40,824 | | | $ | 46,521 | | | $ | 113,434 | | | $ | 126,487 | | |
Ratio of Expenses to Average Net Assets (1) | | | 1.52 | %+^^ | | | 1.53 | %+^ | | | 1.73 | %+†† | | | 1.72 | %+†† | | | 1.65 | %+ | |
Ratio of Expenses to Average Net Assets Excluding Non Operating Expenses | | | 1.52 | %+^^ | | | N/A | | | | N/A | | | | 1.72 | %+†† | | | 1.65 | %+ | |
Ratio of Net Investment Income to Average Net Assets (1) | | | 0.49 | %+ | | | 0.61 | %+^ | | | 0.61 | %+†† | | | 0.15 | %+†† | | | 0.32 | %+ | |
Ratio of Rebate from Morgan Stanley Affiliates to Average Net Assets | | | 0.01 | % | | | 0.01 | % | | | 0.01 | %†† | | | 0.01 | %†† | | | 0.01 | % | |
Portfolio Turnover Rate | | | 49 | % | | | 47 | % | | | 60 | % | | | 59 | % | | | 64 | % | |
(1) Supplemental Information on the Ratios to Average Net Assets: | |
Ratios Before Expense Limitation: | |
Expenses to Average Net Assets | | | 1.78 | % | | | 1.74 | % | | | N/A | | | | N/A | | | | N/A | | |
Net Investment Income to Average Net Assets | | | 0.23 | % | | | 0.40 | % | | | N/A | | | | N/A | | | | N/A | | |
@ Effective September 9, 2013, Class P and Class H shares were renamed Class A shares.
† Per share amount is based on average shares outstanding.
‡ Amount is less than $0.005 per share.
++ Calculated based on the net asset value which does not reflect sales charges, if applicable, as of the last business day of the period.
+ The Ratios of Expenses and Net Investment Income reflect the rebate of certain Portfolio expenses in connection with the investments in Morgan Stanley affiliates during the period. The effect of the rebate on the ratios is disclosed in the above table as "Ratio of Rebate from Morgan Stanley Affiliates to Average Net Assets."
^^ Effective September 16, 2013, the Adviser has agreed to limit the ratio of expenses to average net assets to the maximum ratio of 1.60% for Class A shares. Prior to September 16, 2013, the maximum ratio was 1.50% for Class A shares.
†† Reflects overall Portfolio ratios for investment income and non-class specific expenses.
^ Effective March 1, 2012, the Adviser has agreed to limit the ratio of expenses to average net assets to the maximum ratio of 1.50% for Class A shares. Prior to March 1, 2012, the maximum ratio was 1.90% for Class A shares.
The accompanying notes are an integral part of the financial statements.
15
Morgan Stanley Institutional Fund, Inc.
Annual Report — December 31, 2013
Financial Highlights
Emerging Markets Portfolio
| | | Class L | |
Selected Per Share Data and Ratios | | Year Ended
December 31, 2013 | | Period from
April 27, 2012^ to
December 31, 2012 | |
Net Asset Value, Beginning of Period | | $ | 25.27 | | | $ | 23.85 | | |
Income (Loss) from Investment Operations:^ | |
Net Investment Income (Loss)† | | | (0.05 | ) | | | 0.04 | | |
Net Realized and Unrealized Gain (Loss) | | | (0.37 | ) | | | 1.44 | | |
Total from Investment Operations | | | (0.42 | ) | | | 1.48 | | |
Distributions from and/or in Excess of: | |
Net Investment Income | | | (0.08 | ) | | | (0.06 | ) | |
Net Realized Gain | | | (0.86 | ) | | | — | | |
Total Distributions | | | (0.94 | ) | | | (0.06 | ) | |
Redemption Fees | | | 0.00 | ‡ | | | 0.00 | ‡ | |
Net Asset Value, End of Period | | $ | 23.91 | | | $ | 25.27 | | |
Total Return++ | | | (1.56 | )% | | | 6.20 | %# | |
Ratios and Supplemental Data: | |
Net Assets, End of Period (Thousands) | | $ | 203 | | | $ | 11 | | |
Ratio of Expenses to Average Net Assets (1) | | | 2.03 | %+^^ | | | 1.99 | %+* | |
Ratio of Expenses to Average Net Assets Excluding Non Operating Expenses | | | 2.03 | %+^^ | | | N/A | | |
Ratio of Net Investment Income (Loss) to Average Net Assets (1) | | | (0.18 | )%+ | | | 0.27 | %+* | |
Ratio of Rebate from Morgan Stanley Affiliates to Average Net Assets | | | 0.01 | % | | | 0.01 | %* | |
Portfolio Turnover Rate | | | 49 | % | | | 47 | %# | |
(1) Supplemental Information on the Ratios to Average Net Assets: | |
Ratios Before Expense Limitation: | |
Expenses to Average Net Assets | | | 2.54 | % | | | 2.28 | %* | |
Net Investment Loss to Average Net Assets | | | (0.69 | )% | | | (0.02 | )%* | |
^ Commencement of Operations.
† Per share amount is based on average shares outstanding.
‡ Amount is less than $0.005 per share.
++ Calculated based on the net asset value as of the last business day of the period.
+ The Ratios of Expenses and Net Investment Income (Loss) reflect the rebate of certain Portfolio expenses in connection with the investments in Morgan Stanley affiliates during the period. The effect of the rebate on the ratios is disclosed in the above table as "Ratio of Rebate from Morgan Stanley Affiliates to Average Net Assets."
^^ Effective September 16, 2013, the Adviser has agreed to limit the ratio of expenses to average net assets to the maximum ratio of 2.10% for Class L shares. Prior to September 16, 2013, the maximum ratio was 2.00% for Class L shares.
# Not Annualized.
* Annualized.
The accompanying notes are an integral part of the financial statements.
16
Morgan Stanley Institutional Fund, Inc.
Annual Report — December 31, 2013
Financial Highlights
Emerging Markets Portfolio
| | | Class IS | |
Selected Per Share Data and Ratios | | Period from
September 13, 2013^ to
December 31, 2013 | |
Net Asset Value, Beginning of Period | | $ | 24.92 | | |
Income (Loss) from Investment Operations: | |
Net Investment Loss† | | | (0.01 | ) | |
Net Realized and Unrealized Gain | | | 0.46 | | |
Total from Investment Operations | | | 0.45 | | |
Distributions from and/or in Excess of: | |
Net Investment Income | | | (0.14 | ) | |
Net Realized Gain | | | (0.59 | ) | |
Total Distributions | | | (0.73 | ) | |
| Redemption Fees | | | 0.00 | ‡ | |
Net Asset Value, End of Period | | $ | 24.64 | | |
Total Return++ | | | 1.85 | %# | |
Ratios and Supplemental Data: | |
Net Assets, End of Period (Thousands) | | $ | 10 | | |
Ratio of Expenses to Average Net Assets (1) | | | 1.17 | %+^* | |
Ratio of Expenses to Average Net Assets Excluding Non Operating Expenses | | | 1.17 | %+^* | |
Ratio of Net Investment Loss to Average Net Assets (1) | | | (0.21 | )%+* | |
Ratio of Rebate from Morgan Stanley Affiliates to Average Net Assets | | | 0.01 | %* | |
Portfolio Turnover Rate | | | 49 | %# | |
(1) Supplemental Information on the Ratios to Average Net Assets: | |
Ratios Before Expense Limitation | |
Expenses to Average Net Assets | | | 6.65 | %* | |
Net Investment Loss to Average Net Assets | | | (5.69 | )%* | |
^ Commencement of Operations.
† Per share amount is based on average shares outstanding.
‡ Amount is less than $0.005 per share.
++ Calculated based on the net asset value as of the last business day of the period.
+ The Ratios of Expenses and Net Investment Loss reflect the rebate of certain Portfolio expenses in connection with the investments in Morgan Stanley affiliates during the period. The effect of the rebate on the ratios is disclosed in the above table as "Ratio of Rebate from Morgan Stanley Affiliates to Average Net Assets."
^ Effective September 16, 2013, the Adviser has agreed to limit the ratio of expenses to average net assets to the maximum ratio of 1.18% for Class IS shares.
# Not Annualized.
* Annualized.
The accompanying notes are an integral part of the financial statements.
17
Morgan Stanley Institutional Fund, Inc.
Annual Report — December 31, 2013
Notes to Financial Statements
Morgan Stanley Institutional Fund, Inc. (the "Fund") is registered under the Investment Company Act of 1940, as amended (the "Act"), as an open-end management investment company. The Fund is comprised of twenty-seven separate, active, diversified and non-diversified portfolios (individually referred to as a "Portfolio", collectively as the "Portfolios").
The accompanying financial statements relate to the Emerging Markets Portfolio. The Portfolio's adviser, Morgan Stanley Investment Management Inc. (the "Adviser") and sub-advisers, Morgan Stanley Investment Management Limited ("MSIM Limited") and Morgan Stanley Investment Management Company ("MSIM Company") (together, the "Sub-Advisers"), seek long-term capital appreciation by investing primarily in growth-oriented equity securities of issuers in emerging market countries. The Portfolio offers four classes of shares — Class I, Class A, Class L and Class IS.
On September 16, 2013, the Portfolio commenced offering Class IS shares. Effective September 9, 2013, Class P and Class H shares were renamed Class A shares.
A. Significant Accounting Policies: The following significant accounting policies are in conformity with U.S. generally accepted accounting principles ("GAAP"). Such policies are consistently followed by the Fund in the preparation of its financial statements. GAAP may require management to make estimates and assumptions that affect the reported amounts and disclosures in the financial statements. Actual results may differ from those estimates.
1. Security Valuation: (1) An equity portfolio security listed or traded on an exchange is valued at its latest reported sales price (or at the exchange official closing price if such exchange reports an official closing price), if there were no sales on a given day, the security is valued at the mean between the last reported bid and asked prices; (2) all other equity portfolio securities for which over-the-counter market quotations are readily available are valued at its latest reported sales price. In cases where a security is traded on more than one exchange, the security is valued on the exchange designated as the primary market; (3) when market quotations are not readily available, including circumstances under which the Adviser determines that the closing price, last sale price or the mean between the last reported bid and asked prices are not reflective of a security's market value, portfolio securities are valued at their fair value as determined in good faith under procedures established by and under the general supervision of the
Fund's Board of Directors (the "Directors"). Occasionally, developments affecting the closing prices of securities and other assets may occur between the times at which valuations of such securities are determined (that is, close of the foreign market on which the securities trade) and the close of business of the New York Stock Exchange ("NYSE"). If developments occur during such periods that are expected to materially affect the value of such securities, such valuations may be adjusted to reflect the estimated fair value of such securities as of the close of the NYSE, as determined in good faith by the Directors or by the Adviser using a pricing service and/or procedures approved by the Directors; (4) quotations of foreign portfolio securities, other assets and liabilities and forward contracts stated in foreign currency are translated into U.S. dollar equivalents at the prevailing market rates prior to the close of the NYSE; (5) investments in mutual funds, including the Morgan Stanley Institutional Liquidity Funds, are valued at the net asset value as of the close of each business day; and (6) short-term debt securities with remaining maturities of 60 days or less at the time of purchase may be valued at amortized cost, unless the Adviser determines such valuation does not reflect the securities' market value, in which case these securities will be valued at their fair market value determined by the Adviser.
Under procedures approved by the Directors, the Fund's Adviser has formed a Valuation Committee. The Valuation Committee provides administration and oversight of the Fund's valuation policies and procedures, which are reviewed at least annually by the Directors. These procedures allow the Fund to utilize independent pricing services, quotations from securities and financial instrument dealers, and other market sources to determine fair value.
The Fund has procedures to determine the fair value of securities and other financial instruments for which market prices are not readily available. Under these procedures, the Valuation Committee convenes on a regular and ad hoc basis to review such securities and considers a number of factors, including valuation methodologies and significant unobservable valuation inputs, when arriving at fair value. The Valuation Committee may employ a market-based approach which may use related or comparable assets or liabilities, recent transactions, market multiples, book values, and other relevant information for the investment to determine the fair value of
18
Morgan Stanley Institutional Fund, Inc.
Annual Report — December 31, 2013
Notes to Financial Statements (cont'd)
the investment. An income-based valuation approach may also be used in which the anticipated future cash flows of the investment are discounted to calculate fair value. Discounts may also be applied due to the nature or duration of any restrictions on the disposition of the investments. Due to the inherent uncertainty of valuations of such investments, the fair values may differ significantly from the values that would have been used had an active market existed. The Valuation Committee employs various methods for calibrating these valuation approaches including a regular review of valuation methodologies, key inputs and assumptions, transactional back-testing or disposition analysis, and reviews of any related market activity.
2. Fair Value Measurement: Financial Accounting Standards Board ("FASB") Accounting Standards CodificationTM ("ASC") 820, "Fair Value Measurements and Disclosures" ("ASC 820"), defines fair value as the value that the Fund would receive to sell an investment or pay to transfer a liability in a timely transaction with an independent buyer in the principal market, or in the absence of a principal market the most advantageous market for the investment or liability. ASC 820 establishes a three-tier hierarchy to distinguish between (1) inputs that reflect the assumptions market participants would use in valuing an asset or liability developed based on market data obtained from sources independent of the reporting entity (observable inputs) and (2) inputs that reflect the reporting entity's own assumptions about the assumptions market participants would use in valuing an asset or liability developed based on the best information available in the circumstances (unobservable inputs) and to establish classification of fair value measurements for disclosure purposes. Various inputs are used in determining the value of the Fund's investments. The inputs are summarized in the three broad levels listed below.
• Level 1 – unadjusted quoted prices in active markets for identical investments
• Level 2 – other significant observable inputs (including quoted prices for similar investments, interest rates, prepayment speeds, credit risk, etc.)
• Level 3 – significant unobservable inputs including the Fund's own assumptions in determining the fair value of investments. Factors considered
in making this determination may include, but are not limited to, information obtained by contacting the issuer, analysts, or the appropriate stock exchange (for exchange-traded securities), analysis of the issuer's financial statements or other available documents and, if necessary, available information concerning other securities in similar circumstances
The inputs or methodology used for valuing securities are not necessarily an indication of the risk associated with investing in those securities and the determination of the significance of a particular input to the fair value measurement in its entirety requires judgment and considers factors specific to each security.
The following is a summary of the inputs used to value the Portfolio's investments as of December 31, 2013.
Investment Type | | Level 1
Unadjusted
quoted
prices
(000) | | Level 2
Other
significant
observable
inputs
(000) | | Level 3
Significant
unobservable
inputs
(000) | | Total
(000) | |
Assets: | |
Common Stocks | |
Air Freight & Logistics | | $ | 6,754 | | | $ | — | | | $ | — | | | $ | 6,754 | | |
Airlines | | | 12,587 | | | | — | | | | — | | | | 12,587 | | |
Automobiles | | | 23,596 | | | | — | | | | — | | | | 23,596 | | |
Beverages | | | 57,610 | | | | — | | | | — | | | | 57,610 | | |
Chemicals | | | 10,691 | | | | — | | | | — | | | | 10,691 | | |
Commercial Banks | | | 198,691 | | | | 11,973 | | | | — | | | | 210,664 | | |
Commercial Services &
Supplies | | | 2,258 | | | | — | | | | — | | | | 2,258 | | |
Construction & Engineering | | | 23,646 | | | | — | | | | — | | | | 23,646 | | |
Construction Materials | | | 28,448 | | | | — | | | | — | | | | 28,448 | | |
Diversified Consumer
Services | | | 372 | | | | — | | | | — | | | | 372 | | |
Diversified Financial
Services | | | 28,884 | | | | — | | | | — | | | | 28,884 | | |
Diversified
Telecommunication
Services | | | 24,447 | | | | — | | | | — | | | | 24,447 | | |
Electronic Equipment,
Instruments &
Components | | | 4,073 | | | | — | | | | — | | | | 4,073 | | |
Energy Equipment &
Services | | | 13,931 | | | | — | | | | — | | | | 13,931 | | |
Food & Staples Retailing | | | 28,998 | | | | — | | | | — | | | | 28,998 | | |
Food Products | | | 44,942 | | | | — | | | | — | | | | 44,942 | | |
Health Care Equipment &
Supplies | | | 6,420 | | | | — | | | | — | | | | 6,420 | | |
Health Care Providers &
Services | | | 8,480 | | | | — | | | | — | | | | 8,480 | | |
Hotels, Restaurants &
Leisure | | | 22,597 | | | | 3,645 | | | | — | | | | 26,242 | | |
Household Durables | | | 8,707 | | | | — | | | | — | | | | 8,707 | | |
Household Products | | | 4,886 | | | | — | | | | — | | | | 4,886 | | |
Industrial Conglomerates | | | 38,512 | | | | — | | | | — | | | | 38,512 | | |
19
Morgan Stanley Institutional Fund, Inc.
Annual Report — December 31, 2013
Notes to Financial Statements (cont'd)
Investment Type | | Level 1
Unadjusted
quoted
prices
(000) | | Level 2
Other
significant
observable
inputs
(000) | | Level 3
Significant
unobservable
inputs
(000) | | Total
(000) | |
Common Stocks (cont'd) | |
Information Technology
Services | | $ | 18,761 | | | $ | — | | | $ | — | | | $ | 18,761 | | |
Insurance | | | 24,110 | | | | — | | | | — | | | | 24,110 | | |
Internet Software &
Services | | | 60,589 | | | | — | | | | — | | | | 60,589 | | |
Machinery | | | 6,247 | | | | — | | | | — | | | | 6,247 | | |
Media | | | 34,099 | | | | — | | | | — | | | | 34,099 | | |
Multi-line Retail | | | 16,048 | | | | 4,207 | | | | — | | | | 20,255 | | |
Oil, Gas &
Consumable Fuels | | | 58,850 | | | | — | | | | — | | | | 58,850 | | |
Paper & Forest Products | | | 10,269 | | | | — | | | | — | | | | 10,269 | | |
Personal Products | | | 3,170 | | | | — | | | | — | | | | 3,170 | | |
Pharmaceuticals | | | 40,685 | | | | — | | | | — | | | | 40,685 | | |
Real Estate Management
& Development | | | 13,150 | | | | 4,181 | | | | — | | | | 17,331 | | |
Semiconductors &
Semiconductor
Equipment | | | 102,593 | | | | — | | | | — | | | | 102,593 | | |
Software | | | 13,922 | | | | — | | | | — | | | | 13,922 | | |
Specialty Retail | | | — | | | | 3,939 | | | | — | | | | 3,939 | | |
Textiles, Apparel &
Luxury Goods | | | 28,530 | | | | — | | | | — | | | | 28,530 | | |
Tobacco | | | 8,183 | | | | — | | | | — | | | | 8,183 | | |
Transportation
Infrastructure | | | 13,338 | | | | — | | | | — | | | | 13,338 | | |
Wireless
Telecommunication
Services | | | 52,727 | | | | 11,186 | | | | — | | | | 63,913 | | |
Total Common Stocks | | | 1,104,801 | | | | 39,131 | | | | — | | | | 1,143,932 | | |
Investment Companies | | | 4,668 | | | | 4,724 | | | | — | | | | 9,392 | | |
Short-Term Investments | |
Investment Company | | | 27,662 | | | | — | | | | — | | | | 27,662 | | |
Repurchase Agreements | | | — | | | | 3,561 | | | | — | | | | 3,561 | | |
Total Short-Term
Investments | | | 27,662 | | | | 3,561 | | | | — | | | | 31,223 | | |
Foreign Currency
Forward Exchange
Contract | | | — | | | | 128 | | | | — | | | | 128 | | |
Total Assets | | $ | 1,137,131 | | | $ | 47,544 | | | | — | | | $ | 1,184,675 | | |
Transfers between investment levels may occur as the markets fluctuate and/or the availability of data used in an investment's valuation changes. The Portfolio recognizes transfers between the levels as of the end of the period. As of December 31, 2013, securities with a total value of approximately $654,215,000 transferred from Level 2 to Level 1. At December 31, 2012, the fair value of certain securities were adjusted due to developments which occurred between the time of the close of the foreign markets on which they trade and the close of business on the NYSE which resulted in their Level 2 classification.
3. Foreign Currency Translation and Foreign Investments: The books and records of the Portfolio are maintained in U.S. dollars. Foreign currency amounts are translated into U.S. dollars as follows:
– investments, other assets and liabilities at the prevailing rate of exchange on the valuation date;
– investment transactions and investment income at the prevailing rates of exchange on the dates of such transactions.
Although the net assets of the Portfolio are presented at the foreign exchange rates and market values at the close of the period, the Portfolio does not isolate that portion of the results of operations arising as a result of changes in the foreign exchange rates from the fluctuations arising from changes in the market prices of securities held at period end. Similarly, the Portfolio does not isolate the effect of changes in foreign exchange rates from the fluctuations arising from changes in the market prices of securities sold during the period. Accordingly, realized and unrealized foreign currency gains (losses) on investments in securities are included in the reported net realized and unrealized gains (losses) on investment transactions and balances. However, pursuant to U.S. Federal income tax regulations, gains and losses from certain foreign currency transactions and the foreign currency portion of gains and losses realized on sales and maturities of foreign denominated debt securities are treated as ordinary income for U.S. Federal income tax purposes.
Net realized gains (losses) on foreign currency transactions represent net foreign exchange gains (losses) from foreign currency forward exchange contracts, disposition of foreign currencies, currency gains (losses) realized between the trade and settlement dates on securities transactions, and the difference between the amount of investment income and foreign withholding taxes recorded on the Portfolio's books and the U.S. dollar equivalent amounts actually received or paid. Net unrealized currency gains (losses) from valuing foreign currency denominated assets and liabilities at period end exchange rates are reflected as a component of unrealized appreciation (depreciation) on the Statement of Assets and Liabilities. The change in unrealized currency gains (losses) on foreign currency translations for the period is reflected in the Statement of Operations.
20
Morgan Stanley Institutional Fund, Inc.
Annual Report — December 31, 2013
Notes to Financial Statements (cont'd)
Foreign security and currency transactions may involve certain considerations and risks not typically associated with those of U.S. dollar denominated transactions as a result of, among other factors, fluctuations of exchange rates in relation to the U.S. dollar, the possibility of lower levels of governmental supervision and regulation of foreign securities markets and the possibility of political or economic instability.
The net assets of the Portfolio include foreign denominated securities and currency. Changes in currency exchange rates will affect the U.S. Dollar value of and investment income from such securities.
Governmental approval for foreign investments may be required in advance of making an investment under certain circumstances in some countries, and the extent of foreign investments in domestic companies may be subject to limitation in other countries. Foreign ownership limitations also may be imposed by the charters of individual companies to prevent, among other concerns, violations of foreign investment limitations. As a result, an additional class of shares (identified as "Foreign" in the Portfolio of Investments) may be created and offered for investment. The "local" and "foreign shares" market values may differ. In the absence of trading of the foreign shares in such markets, the Portfolio values the foreign shares at the closing exchange price of the local shares.
4. Derivatives: The Portfolio may, but is not required to, use derivative instruments for a variety of purposes, including hedging, risk management, portfolio management or to earn income. Derivatives are financial instruments whose value is based, in part, on the value of an underlying asset, interest rate, index or financial instrument. Prevailing interest rates and volatility levels, among other things, also affect the value of derivative instruments. A derivative instrument often has risks similar to its underlying asset and may have additional risks, including imperfect correlation between the value of the derivative and the underlying asset, risks of default by the counterparty to certain transactions, magnification of losses incurred due to changes in the market value of the securities, instruments, indices or interest rates to which they relate, and risks that the transactions may not be liquid. The use of derivatives involves risks that are different from, and possibly greater than, the risks associated with other portfolio investments. Derivatives may involve the use of highly specialized instruments that require invest-
ment techniques and risk analyses different from those associated with other portfolio investments. All of the Portfolio's holdings, including derivative instruments, are marked-to-market each day with the change in value reflected in unrealized appreciation (depreciation). Upon disposition, a realized gain or loss is recognized.
Certain derivative transactions may give rise to a form of leverage. Leverage magnifies the potential for gain and the risk of loss. Leverage associated with derivative transactions may cause the Portfolio to liquidate portfolio positions when it may not be advantageous to do so to satisfy its obligations or to meet earmarking or segregation requirements, pursuant to applicable Securities and Exchange Commission rules and regulations, or may cause the Portfolio to be more volatile than if the Portfolio had not been leveraged. Although the Adviser and/or Sub-Advisers seek to use derivatives to further the Portfolio's investment objectives, there is no assurance that the use of derivatives will achieve this result.
Following is a description of the derivative instruments and techniques that the Portfolio used during the period and their associated risks:
Foreign Currency Forward Exchange Contracts: In connection with its investments in foreign securities, the Portfolio also entered into contracts with banks, brokers or dealers to purchase or sell securities or foreign currencies at a future date. A foreign currency forward exchange contract ("currency contract") is a negotiated agreement between the contracting parties to exchange a specified amount of currency at a specified future time at a specified rate. The rate can be higher or lower than the spot rate between the currencies that are the subject of the contract. Currency contracts may be used to protect against uncertainty in the level of future foreign currency exchange rates or to gain or modify exposure to a particular currency. In addition, the Portfolio may use cross currency hedging or proxy hedging with respect to currencies in which the Portfolio has or expects to have portfolio or currency exposure. Cross currency hedges involve the sale of one currency against the positive exposure to a different currency and may be used for hedging purposes or to establish an active exposure to the exchange rate between any two currencies. There is additional risk that such transactions reduce or preclude the opportunity for gain if the value of the currency should move in the direction opposite to the position taken and
21
Morgan Stanley Institutional Fund, Inc.
Annual Report — December 31, 2013
Notes to Financial Statements (cont'd)
that currency contracts create exposure to currencies in which the Portfolio's securities are not denominated. Unanticipated changes in currency prices may result in poorer overall performance for the Portfolio than if it had not entered into such contracts. The use of currency contracts involves the risk of loss from the insolvency or bankruptcy of the counterparty to the contract or the failure of the counterparty to make payments or otherwise comply with the terms of the contract. A currency contract is marked-to-market daily and the change in market value is recorded by the Portfolio as unrealized gain or loss. The Portfolio records realized gains (losses) when the currency contract is closed equal to the difference between the value of the currency contract at the time it was opened and the value at the time it was closed.
FASB ASC 815, "Derivatives and Hedging: Overall" ("ASC 815"), is intended to improve financial reporting about derivative instruments by requiring enhanced disclosures to enable investors to better understand how and why the Portfolio uses derivative instruments, how these derivative instruments are accounted for and their effects on the Portfolio's financial position and results of operations.
The following table sets forth the fair value of the Portfolio's derivative contracts by primary risk exposure as of December 31, 2013.
| | | Asset Derivatives
Statement of Assets and
Liabilities Location | | Primary Risk
Exposure | | Value
(000) | |
Foreign Currency Forward
Exchange Contracts | | Unrealized Appreciation on
Foreign Currency Forward
Exchange Contracts | |
Currency Risk | | $ | 128 | | |
The following tables set forth by primary risk exposure the Portfolio's realized gains (losses) and change in unrealized appreciation (depreciation) by type of derivative contract for the year ended December 31, 2013 in accordance with ASC 815.
Realized Gain (Loss) | |
Primary Risk Exposure | | Derivative Type | | Value
(000) | |
Currency Risk | | Foreign Currency | | | |
| | | Forward Exchange Contracts | | $ | 1,017 | | |
Change in Unrealized Appreciation (Depreciation) | |
Primary Risk Exposure | | Derivative Type | | Value
(000) | |
Currency Risk | | Foreign Currency | | | |
| | | Forward Exchange Contracts | | $ | 27 | | |
At December 31, 2013, the Portfolio's derivative assets and liabilities are as follows:
Gross Amounts of Assets and Liabilities Presented in the
Statement of Assets and Liabilities | |
Derivatives | | Assets(a)
(000) | | Liabilities(a)
(000) | |
Foreign Currency | |
Forward Exchange Contracts | | $ | 128 | | | | — | | |
(a) Absent an event of default or early termination, OTC derivative assets and liabilities are presented gross and not offset in the Statement of Assets and Liabilities.
The following table presents derivative financial instruments that are subject to enforceable netting arrangements as of December 31, 2013.
Gross Amounts Not Offset in the Statement of Assets and Liabilities | |
Counterparty | | Gross Asset
Derivatives
Presented in
Statement of
Assets and
Liabilities
(000) | | Financial
Instrument
(000) | | Collateral
Received
(000) | | Net
Amount
(not less
than 0)
(000) | |
State Street Bank
and Trust Co. | | $ | 128 | | | | — | | | | — | | | $ | 128 | | |
For the year ended December 31, 2013, the approximate average monthly amount outstanding for each derivative type is as follows:
Foreign Currency Forward Exchange Contracts: | |
Average monthly principal amount | | $ | 8,680,000 | | |
5. Securities Lending: The Portfolio lends securities to qualified financial institutions, such as broker-dealers, to earn additional income. Any increase or decrease in the fair value of the securities loaned that might occur and any interest earned or dividends declared on those securities during the term of the loan would remain in the Portfolio. The Portfolio would receive cash or securities as collateral in an amount equal to or exceeding 100% of the current fair value of the loaned securities. The collateral is marked-to-market daily, by State Street Bank and Trust Company ("State Street"), the securities lending agent, to ensure that a minimum of 100% collateral coverage is maintained.
Based on pre-established guidelines, the securities lending agent invests any cash collateral that is received in an affiliated money market portfolio and repurchase agreements. Securities lending income is generated from the earnings on the invested collateral and borrowing fees, less any rebates owed to the borrowers and compensation to the lending agent, and is recorded as "Income from Securities Loaned-Net" in the Portfolio's Statement of Operations. Risks in securities lending transactions are that a borrower may not provide additional collateral
22
Morgan Stanley Institutional Fund, Inc.
Annual Report — December 31, 2013
Notes to Financial Statements (cont'd)
when required or return the securities when due, and that the value of the short-term investments will be less than the amount of cash collateral plus any rebate that is required to be returned to the borrower.
The Portfolio has the right under the lending agreement to recover the securities from the borrower on demand.
The following table presents financial instruments that are subject to enforceable netting arrangements as of December 31, 2013.
Gross Amounts Not Offset in the Statement of Assets and Liabilities | |
Gross Asset
Amounts
Presented in
Statement of
Assets and
Liabilities
(000) | | Financial
Instrument
(000) | | Collateral
Received
(000) | | Net Amount
(not less than 0)
(000) | |
| $ | 19,387 | (a) | | | — | | | $ | (19,387 | )(b)(c) | | $ | 0 | | |
(a) Represents market value of loaned securities at period end.
(b) The Portfolio received cash collateral of approximately $20,629,000, of which approximately $19,731,000 was subsequently invested in Repurchase Agreements and Morgan Stanley Institutional Liquidity Funds as reported in the Portfolio of Investments. As of December 31, 2013 there was uninvested cash of approximately $898,000, which is not reflected in the Portfolio of Investments.
(c) The actual collateral received is greater than the amount shown here due to overcollateralization.
6. Redemption Fees: The Portfolio will assess a 2% redemption fee, on Class I shares, Class A shares, Class L shares and Class IS shares, which is paid directly to the Portfolio, for shares redeemed or exchanged within thirty days of purchase, subject to certain exceptions. The redemption fee is designed to protect the Portfolio and its remaining shareholders from the effects of short-term trading. These fees, if any, are included in the Statements of Changes in Net Assets.
7. Indemnifications: The Fund enters into contracts that contain a variety of indemnifications. The Fund's maximum exposure under these arrangements is unknown. However, the Fund has not had prior claims or losses pursuant to these contracts and expects the risk of loss to be remote.
8. Dividends and Distributions to Shareholders: Dividend income and distributions to shareholders are recorded on the ex-dividend date. Dividends from net investment income, if any, are declared and paid semiannually. Net realized capital gains, if any, are distributed at least annually.
9. Security Transactions, Income and Expenses: Security transactions are accounted for on the trade date
(date the order to buy or sell is executed). Realized gains and losses on the sale of investment securities are determined on the specific identified cost method. Dividend income and other distributions are recorded on the ex-dividend date (except for certain foreign dividends which may be recorded as soon as the Portfolio is informed of such dividends) net of applicable withholding taxes. Interest income is recognized on the accrual basis except where collection is in doubt. Discounts are accreted and premiums are amortized over the life of the respective securities. Most expenses of the Fund can be directly attributed to a particular Portfolio. Expenses which cannot be directly attributed are apportioned among the Portfolios based upon relative net assets or other appropriate methods. Income, expenses (other than class specific expenses — distribution, transfer agency and sub transfer agency fees) and realized and unrealized gains or losses are allocated to each class of shares based upon their relative net assets.
B. Advisory/Sub-Advisory Fees: The Adviser, a wholly-owned subsidiary of Morgan Stanley, provides the Portfolio with advisory services under the terms of an Investment Advisory Agreement, paid quarterly, at the annual rate based on the average daily net assets as follows:
First $500
million Next $500
million | | Next $1.5
billion | | Over $2.5
billion | |
| 1.25% 1.20% | | | 1.15 | % | | | 1.00 | % | |
For the year ended December 31, 2013, the advisory fee rate (net of waivers/rebate) was equivalent to an annual effective rate of 0.95% of the Portfolio's daily net assets.
The Adviser has agreed to reduce its advisory fee and/or reimburse the Portfolio so that total annual portfolio operating expenses, excluding certain investment related expenses, taxes, interest and other extraordinary expenses (including litigation), will not exceed 1.25% for Class I shares, 1.50% for Class A shares, 2.00% for Class L shares. Effective September 16, 2013, the Adviser has agreed to limit the ratio of expenses to average net assets to the maximum ratio of 1.60%, 2.10% and 1.18% for Class A, Class L and Class IS shares, respectively. The fee waivers and/or expense reimbursements will continue for at least one year or until such time that the Directors act to discontinue all or a portion of such waivers and/or reimbursements when it deems such action is appropriate. For the year ended December 31, 2013, approximately $3,174,000 of advisory fees were waived and approximately $145,000 of other expenses were reimbursed by the Adviser pursuant to this arrangement.
23
Morgan Stanley Institutional Fund, Inc.
Annual Report — December 31, 2013
Notes to Financial Statements (cont'd)
The Adviser has entered into a Sub-Advisory Agreement with the Sub-Advisers, each a wholly-owned subsidiary of Morgan Stanley. The Sub-Advisers provide the Portfolio with advisory services subject to the overall supervision of the Adviser and the Fund's Officers and Directors. The Adviser pays the Sub-Advisers on a monthly basis a portion of the net advisory fees the Adviser receives from the Portfolio.
C. Administration Fees: The Adviser also serves as Administrator to the Fund and provides administrative services pursuant to an Administration Agreement for an annual fee, accrued daily and paid monthly, of 0.08% of the Portfolio's average daily net assets. Under a Sub-Administration Agreement between the Administrator and State Street, State Street provides certain administrative services to the Fund. For such services, the Administrator pays State Street a portion of the fee the Administrator receives from the Portfolio.
D. Distribution and Shareholder Services Fees: Morgan Stanley Distribution, Inc. ("MSDI" or the "Distributor"), a wholly-owned subsidiary of the Adviser, and an indirect subsidiary of Morgan Stanley, serves as the Fund's Distributor of Portfolio shares pursuant to a Distribution Agreement. The Fund has adopted a Shareholder Services Plan with respect to Class A shares pursuant to Rule 12b-1 under the Act. Under the Shareholder Services Plan, the Portfolio pays the Distributor a shareholder services fee, accrued daily and paid monthly, at an annual rate of 0.25% of the Portfolio's average daily net assets attributable to Class A shares.
The Fund has adopted a Distribution and Shareholder Services Plan with respect to Class L shares pursuant to Rule 12b-1 under the Act. Under the Distribution and Shareholder Services Plan, the Portfolio pays the Distributor a distribution fee, accrued daily and paid monthly, at an annual rate of 0.50% and a shareholder services fee, accrued daily and paid monthly, at an annual rate of 0.25% of the Portfolio's average daily net assets attributable to Class L shares.
The distribution and shareholder services fees are used to support the expenses associated with servicing and maintaining accounts. The Distributor may compensate other parties for providing shareholder support services to investors who purchase Class A and Class L shares.
E. Dividend Disbursing and Transfer Agent: The Fund's dividend disbursing and transfer agent was Morgan Stanley Services Company Inc. ("Morgan Stanley Services"). Pursuant to a Transfer Agency Agreement, the Fund paid Morgan Stanley Services a fee based on the number of classes,
accounts and transactions relating to the Portfolios of the Fund. Effective July 1, 2013, the Directors approved changing the transfer agent to Boston Financial Data Services, Inc.
F. Custodian Fees: State Street (the "Custodian") serves as Custodian for the Fund in accordance with a Custodian Agreement. The Custodian holds cash, securities, and other assets of the Fund as required by the Act. Custody fees are payable monthly based on assets held in custody, investment purchases and sales activity and account maintenance fees, plus reimbursement for certain out-of-pocket expenses.
G. Security Transactions and Transactions with Affiliates: For the year ended December 31, 2013, purchases and sales of investment securities for the Portfolio, other than long-term U.S. Government securities and short-term investments, were approximately $615,126,000 and $743,283,000, respectively. There were no purchases and sales of long-term U.S. Government securities for the year ended December 31, 2013.
The Portfolio invests in the Institutional Class of the Morgan Stanley Institutional Liquidity Funds — Money Market Portfolio (the "Liquidity Funds"), an open-end management investment company managed by the Adviser, both directly, and as a portion of the securities held as collateral on loaned securities. Advisory fees paid by the Portfolio are reduced by an amount equal to its pro-rata share of the advisory and administration fees paid by the Portfolio due to its investment in the Liquidity Funds. For the year ended December 31, 2013, advisory fees paid were reduced by approximately $27,000 relating to the Portfolio's investment in the Liquidity Funds.
A summary of the Portfolio's transactions in shares of the Liquidity Funds during the year ended December 31, 2013 is as follows:
Value
December 31,
2012
(000) | | Purchases
at Cost
(000) | | Sales
(000) | | Dividend
Income
(000) | | Value
December 31,
2013
(000) | |
| $ | 49,501 | | | $ | 310,678 | | | $ | 332,517 | | | $ | 20 | | | $ | 27,662 | | |
The Portfolio invests in Morgan Stanley Growth Fund, an open-end management investment company advised by an affiliate of the Adviser. The Morgan Stanley Growth Fund has a cost basis of approximately $816,000 at December 31, 2013. Advisory fees paid by the Portfolio are reduced by an amount equal to its pro-rata share of the advisory and administration fees paid by the Morgan Stanley Growth Fund. For the year ended December 31, 2013, advisory fees paid were reduced by approximately $124,000 relating to the Portfolio's investment in the Morgan Stanley Growth Fund.
24
Morgan Stanley Institutional Fund, Inc.
Annual Report — December 31, 2013
Notes to Financial Statements (cont'd)
A summary of the Portfolio's transactions in shares of the Morgan Stanley Growth Fund during the year ended December 31, 2013 is as follows:
Value
December 31,
2012
(000) | | Purchases
at Cost
(000) | | Sales
(000) | | Realized
Gain
(000) | | Dividend
Income
(000) | | Value
December 31,
2013
(000) | |
| $ | 9,467 | | | | — | | | $ | 3,517 | | | $ | 2,797 | | | | — | | | $ | 4,668 | | |
During the year ended December 31, 2013, the Portfolio incurred approximately $66,000 in brokerage commissions with Morgan Stanley & Co., LLC, an affiliate of the Adviser, Sub-Advisers, Administrator and Distributor, for portfolio transactions executed on behalf of the Portfolio.
From January 1, 2013 to June 30, 2013, the Portfolio incurred approximately $82,000 in brokerage commissions with Citigroup, Inc., and its affiliated broker-dealers, which may be deemed affiliates of the Adviser, Sub-Advisers, Administrator and Distributor under Section 17 of the Act, for portfolio transactions executed on behalf of the Portfolio. Citigroup, Inc. and its affiliated broker-dealers ceased to be affiliates of the Portfolio pursuant to Section 17 of the Act as of July 1, 2013.
H. Federal Income Taxes: It is the Portfolio's intention to continue to qualify as a regulated investment company and distribute all of its taxable and tax-exempt income. Accordingly, no provision for Federal income taxes is required in the financial statements.
The Portfolio may be subject to taxes imposed by countries in which it invests. Such taxes are generally based on income and/or capital gains earned or repatriated. Taxes are accrued based on net investment income, net realized gains and net unrealized appreciation as such income and/or gains are earned. Taxes may also be based on transactions in foreign currency and are accrued based on the value of investments denominated in such currency.
FASB ASC 740-10 "Income Taxes — Overall" sets forth a minimum threshold for financial statement recognition of the benefit of a tax position taken or expected to be taken in a tax return. Management has concluded there are no significant uncertain tax positions that would require recognition in the financial statements. If applicable, the Portfolio recognizes interest accrued related to unrecognized tax benefits in "Interest Expense" and penalties in "Other Expenses" in the Statement of Operations. The Portfolio files tax returns with the U.S. Internal Revenue Service, New York and various states. Generally, each of the tax years in the four-year period ended
December 31, 2013, remains subject to examination by taxing authorities.
The tax character of distributions paid may differ from the character of distributions shown in the Statements of Changes in Net Assets due to short-term capital gains being treated as ordinary income for tax purposes. The tax character of distributions paid during fiscal 2013 and 2012 was as follows:
2013
Distributions
Paid From: | | 2012
Distributions
Paid From: | |
Ordinary
Income
(000) | | Long-Term
Capital Gain
(000) | | Ordinary
Income
(000) | | Long-Term
Capital Gain
(000) | |
| $ | 9,541 | | | $ | 40,664 | | | $ | 8,952 | | | $ | — | | |
The amount and character of income and gains to be distributed are determined in accordance with income tax regulations which may differ from GAAP. These book/tax differences are either considered temporary or permanent in nature.
Temporary differences are primarily due to differing book and tax treatments in the timing of the recognition of gains (losses) on certain investment transactions and the timing of the deductibility of certain expenses.
Permanent differences, primarily due to differing treatments of gains (losses) related to foreign currency transactions, basis adjustments on certain equity securities designated as passive foreign investment companies and foreign taxes paid on capital gains, resulted in the following reclassifications among the components of net assets at December 31, 2013:
Distributions in
Excess of Net
Investment
Income
(000) | | Accumulated
Net Realized
Gain
(000) | | Paid-in-Capital
(000) | |
| $ | 2,205 | | | $ | (2,205 | ) | | $ | — | | |
At December 31, 2013, the components of distributable earnings for the Portfolio on a tax basis were as follows:
Undistributed
Ordinary
Income
(000) | | Undistributed
Long-Term
Capital Gain
(000) | |
| $ | 1,194 | | | $ | 6,591 | | |
At December 31, 2013, the aggregate cost for federal income tax purposes is $995,415,000. The aggregate gross unrealized appreciation is $241,738,000 and the aggregate gross unrealized depreciation is $52,606,000 resulting in net unrealized appreciation of $189,132,000.
I. Other (unaudited): At December 31, 2013, the Portfolio had otherwise unaffiliated record owners of 10% or greater. Investment activities of these shareholders could have a mate-
25
Morgan Stanley Institutional Fund, Inc.
Annual Report — December 31, 2013
Notes to Financial Statements (cont'd)
rial impact on the Portfolio. The aggregate percentage of such owners was 75% and 77% for Class I and Class A shares, respectively.
J. Results of Special Shareholder Meeting (unaudited): On June 5, 2013 as adjourned to June 24, 2013 and July 17, 2013, a Joint Special Shareholder Meeting was held for Class H shareholders of the Portfolio to approve the Articles of Amendment to the Fund's Articles of Amendment and Restatement and a Plan of Reclassification for the Portfolio pursuant to which Class H shares would be reclassified as Class P shares. The results with respect to this proposal were as follows:
| For | | Against | | Abstain | |
| | 5,844 | | | | 0 | | | | 0 | | |
K. Accounting Pronouncement: In June 2013, FASB issued Accounting Standards Update 2013-08 Financial Services — Investment Companies (Topic 946) — Amendments to the Scope, Measurement, and Disclosure Requirements ("ASU 2013-08") which is effective for interim and annual reporting periods in fiscal years that begin after December 15, 2013. ASU 2013-08 sets forth a methodology for determining whether an entity should be characterized as an investment company and prescribes fair value accounting for an investment company's non-controlling ownership interest in another investment company. FASB has determined that a fund registered under the Investment Company Act of 1940 automatically meets ASU 2013-08's criteria for an investment company. Although still evaluating the potential impacts of ASU 2013-08 to the Portfolio, management expects that the impact of the Portfolio's adoption will be limited to additional financial statement disclosures.
26
Morgan Stanley Institutional Fund, Inc.
Annual Report — December 31, 2013
Report of Independent Registered Public Accounting Firm
To the Shareholders and Board of Directors of
Morgan Stanley Institutional Fund, Inc. —
Emerging Markets Portfolio
We have audited the accompanying statement of assets and liabilities, including the portfolio of investments, of Emerging Markets Portfolio (one of the portfolios constituting Morgan Stanley Institutional Fund, Inc.) (the "Portfolio") as of December 31, 2013, and the related statement of operations for the year then ended, the statements of changes in net assets for each of the two years in the period then ended, and the financial highlights for each of the periods indicated therein. These financial statements and financial highlights are the responsibility of the Portfolio's management. Our responsibility is to express an opinion on these financial statements and financial highlights based on our audits.
We conducted our audits in accordance with the standards of the Public Company Accounting Oversight Board (United States). Those standards require that we plan and perform the audit to obtain reasonable assurance about whether the financial statements and financial highlights are free of material misstatement. We were not engaged to perform an audit of the Portfolio's internal control over financial reporting. Our audits included consideration of internal control over financial reporting as a basis for designing audit procedures that are appropriate in the circumstances, but not for the purpose of expressing an opinion on the effectiveness of the Portfolio's internal control over financial reporting. Accordingly, we express no such opinion. An audit also includes examining, on a test basis, evidence supporting the amounts and disclosures in the financial statements and financial highlights, assessing the accounting principles used and significant estimates made by management, and evaluating the overall financial statement presentation. Our procedures included confirmation of securities owned as of December 31, 2013, by correspondence with the custodian and others or by other appropriate auditing procedures where replies from others were not received. We believe that our audits provide a reasonable basis for our opinion.
In our opinion, the financial statements and financial highlights referred to above present fairly, in all material respects, the financial position of Emerging Markets Portfolio (one of the portfolios constituting Morgan Stanley Institutional Fund, Inc.) at December 31, 2013, the results of its operations for the year then ended, the changes in its net assets for each of the two years in the period then ended, and the financial highlights for each of the periods indicated therein, in conformity with U.S. generally accepted accounting principles.

Boston, Massachusetts
February 26, 2014
27
Morgan Stanley Institutional Fund, Inc.
Annual Report — December 31, 2013
Federal Tax Notice (unaudited)
For Federal income tax purposes, the following information is furnished with respect to the distributions paid by the Portfolio during its taxable year ended December 31, 2013. The Portfolio designated and paid approximately $40,664,000 as a long-term capital gain distribution.
For Federal income tax purposes, the following information is furnished with respect to the Portfolio's earnings for its taxable year ended December 31, 2013. When distributed, certain earnings may be subject to a maximum tax rate of 15% as provided for the Jobs and Growth Tax Relief Reconciliation Act of 2003. The Portfolio designated up to a maximum of $12,505,000 as taxable at this lower rate.
The Portfolio intends to pass through foreign tax credits of approximately $2,964,000, and has derived net income from sources within foreign countries amounting to approximately $28,374,000.
In January, the Portfolio provides tax information to shareholders for the preceding calendar year.
28
Morgan Stanley Institutional Fund, Inc.
Annual Report — December 31, 2013
U.S. Privacy Policy (unaudited)
AN IMPORTANT NOTICE CONCERNING OUR U.S. PRIVACY POLICY
This privacy notice describes the U.S. privacy policy of Morgan Stanley Distribution, Inc., and the Morgan Stanley family of mutual funds ("us", "our", "we").
We are required by federal law to provide you with notice of our U.S. privacy policy ("Policy"). This Policy applies to both our current and former clients unless we state otherwise and is intended for individual clients who purchase products or receive services from us for personal, family or household purposes. This Policy is not applicable to partnerships, corporations, trusts or other non-individual clients or account holders, nor is this Policy applicable to individuals who are either beneficiaries of a trust for which we serve as trustee or participants in an employee benefit plan administered or advised by us. This Policy is, however, applicable to individuals who select us to be a custodian of securities or assets in individual retirement accounts, 401(k) accounts, or accounts subject to the Uniform Gifts to Minors Act.
This notice sets out our business practices to protect your privacy; how we collect and share personal information about you; and how you can limit our sharing or certain uses by others of this information. We may amend this Policy at any time, and will inform you of any changes to our Policy as required by law.
WE RESPECT YOUR PRIVACY
We appreciate that you have provided us with your personal financial information and understand your concerns about your information. We strive to safeguard the information our clients entrust to us. Protecting the confidentiality and security of client information is an important part of how we conduct our business.
This notice describes what personal information we collect about you, how we collect it, when we may share it with others, and how certain others may use it. It discusses the steps you may take to limit our sharing of certain information about you with our affiliated companies, including, but not limited to our affiliated banking businesses, brokerage firms and credit service affiliates. It also discloses how you may limit our affiliates' use of shared information for marketing purposes.
Throughout this Policy, we refer to the nonpublic information that personally identifies you as "personal information." We also use the term "affiliated company" in this notice. An affiliated company is a company in our family of companies and includes companies with the Morgan Stanley name. These affiliated companies are financial institutions such as broker-dealers, banks, investment advisers and credit card issuers. We refer to any company that is not an affiliated company as a nonaffiliated third party. For purposes of Section 5 of this notice, and your ability to limit certain uses of personal information by our affiliates, this notice applies to the use of personal information by our affiliated companies.
1. WHAT PERSONAL INFORMATION DO WE COLLECT FROM YOU?
We may collect the following types of information about you: (i) information provided by you, including information from applications and other forms we receive from you, (ii) information about your transactions with us or our affiliates, (iii) information about your transactions with nonaffiliated third parties, (iv) information from consumer reporting agencies, (v) information obtained from our websites, and (vi) information obtained from other sources. For example:
• We collect information such as your name, address, e-mail address, telephone/fax numbers, assets, income and investment objectives through applications and other forms you submit to us.
• We may obtain information about account balances, your use of account(s) and the types of products and services you prefer to receive from us through your dealings and transactions with us and other sources.
• We may obtain information about your creditworthiness and credit history from consumer reporting agencies.
• We may collect background information from and through third-party vendors to verify representations you have made and to comply with various regulatory requirements.
2. WHEN DO WE DISCLOSE PERSONAL INFORMATION WE COLLECT ABOUT YOU?
We may disclose personal information we collect about you in each of the categories listed above to affiliated and nonaffiliated third parties.
29
Morgan Stanley Institutional Fund, Inc.
Annual Report — December 31, 2013
U.S. Privacy Policy (unaudited) (cont'd)
a. Information we disclose to affiliated companies.
We may disclose personal information that we collect about you to our affiliated companies to manage your account(s) effectively, to service and process your transactions, and to let you know about products and services offered by us and affiliated companies, to manage our business, and as otherwise required or permitted by law. Offers for products and services from affiliated companies are developed under conditions designed to safeguard your personal information.
b. Information we disclose to third parties.
We may disclose personal information that we collect about you to nonaffiliated third parties to provide marketing services on our behalf or to other financial institutions with whom we have joint marketing agreements. We may also disclose all of the information we collect to other nonaffiliated third parties for our everyday business purposes, such as to process transactions, maintain account(s), respond to court orders and legal investigations, report to credit bureaus, offer our own products and services, protect against fraud, for institutional risk control, to perform services on our behalf, and as otherwise required or permitted by law.
When we share personal information about you with a nonaffiliated third party, they are required to limit their use of personal information about you to the particular purpose for which it was shared and they are not allowed to share personal information about you with others except to fulfill that limited purpose or as may be permitted or required by law.
3. HOW DO WE PROTECT THE SECURITY AND CONFIDENTIALITY OF PERSONAL INFORMATION WE COLLECT ABOUT YOU?
We maintain physical, electronic and procedural security measures that comply with applicable law and regulations to help safeguard the personal information we collect about you. We have internal policies governing the proper handling of client information by employees. Third parties that provide support or marketing services on our behalf may also receive personal information about you, and we require them to adhere to appropriate security standards with respect to such information.
4. HOW CAN YOU LIMIT OUR SHARING CERTAIN PERSONAL INFORMATION ABOUT YOU WITH OUR AFFILIATED COMPANIES FOR ELIGIBILITY DETERMINATION?
By following the opt-out procedures in Section 6 below, you may limit the extent to which we share with our affiliated companies, personal information that was collected to determine your eligibility for products and services such as your credit reports and other information that you have provided to us or that we may obtain from third parties ("eligibility information"). Eligibility information does not include your identification information or personal information pertaining to our transactions or experiences with you. Please note that, even if you direct us not to share eligibility information with our affiliated companies, we may still share your personal information, including eligibility information, with our affiliated companies under circumstances that are permitted under applicable law, such as to process transactions or to service your account.
5. HOW CAN YOU LIMIT THE USE OF CERTAIN PERSONAL INFORMATION ABOUT YOU BY OUR AFFILIATED COMPANIES FOR MARKETING?
By following the opt-out instructions in Section 6 below, you may limit our affiliated companies from marketing their products or services to you based on personal information we disclose to them. This information may include, for example, your income and account history with us. Please note that, even if you choose to limit our affiliated companies from using personal information about you that we may share with them for marketing their products and services to you, our affiliated companies may use your personal information that they obtain from us to market to you in circumstances permitted by law, such as if the affiliated party has its own relationship with you.
30
Morgan Stanley Institutional Fund, Inc.
Annual Report — December 31, 2013
U.S. Privacy Policy (unaudited) (cont'd)
6. HOW CAN YOU SEND US AN OPT-OUT INSTRUCTION?
If you wish to limit our sharing of eligibility information about you with our affiliated companies, or our affiliated companies' use of personal information for marketing purposes, as described in this notice, you may do so by:
• Calling us at (800) 548-7786
Monday–Friday between 8a.m. and 5p.m. (EST)
• Writing to us at the following address:
Boston Financial Data Services, Inc.
c/o Privacy Coordinator
P.O. Box 219804
Kansas City, Missouri 64121
If you choose to write to us, your request should include: your name, address, telephone number and account number(s) to which the opt-out applies and whether you are opting out with respect to sharing of eligibility information (Section 4 above), or information used for marketing (Section 5 above), or both. Written opt-out requests should not be sent with any other correspondence. In order to process your request, we require that the request be provided by you directly and not through a third party. Once you have informed us about your privacy preferences, your opt-out preference will remain in effect with respect to this Policy (as it may be amended) until you notify us otherwise. If you are a joint account owner, we will accept instructions from any one of you and apply those instructions to the entire account.
Please understand that if you limit our sharing or our affiliated companies' use of personal information, you and any joint account holder(s) may not receive information about our affiliated companies' products and services, including products or services that could help you manage your financial resources and achieve your investment objectives.
If you have more than one account or relationship with us, please specify the accounts to which you would like us to apply your privacy choices. If you have accounts or relationships with our affiliates, you may receive multiple privacy policies from them, and will need to separately notify those companies of your privacy choices for those accounts or relationships.
7. WHAT IF AN AFFILIATED COMPANY BECOMES A NONAFFILIATED THIRD PARTY?
If, at any time in the future, an affiliated company becomes a nonaffiliated third party, further disclosures of personal information made to the former affiliated company will be limited to those described in Section 2(b) above relating to nonaffiliated third parties. If you elected under Section 6 to limit disclosures we make to affiliated companies, or use of personal information by affiliated companies, your election will not apply to use by any former affiliated company of your personal information in their possession once it becomes a nonaffiliated third party.
SPECIAL NOTICE TO RESIDENTS OF VERMONT
The following section supplements our Policy with respect to our individual clients who have a Vermont address and supersedes anything to the contrary in the above Policy with respect to those clients only.
The State of Vermont requires financial institutions to obtain your consent prior to sharing personal information that they collect about you with nonaffiliated third parties, or eligibility information with affiliated companies, other than in certain limited circumstances. Except as permitted by law, we will not share personal information we collect about you with nonaffiliated third parties or eligibility information with affiliated companies, unless you provide us with your written consent to share such information.
SPECIAL NOTICE TO RESIDENTS OF CALIFORNIA
The following section supplements our Policy with respect to our individual clients who have a California address and supersedes anything to the contrary in the above Policy with respect to those clients only.
In response to a California law, if your account has a California home address, your personal information will not be disclosed to nonaffiliated third parties except as permitted by applicable California law, and we will limit sharing such personal information with our affiliates to comply with California privacy laws that apply to us.
31
Morgan Stanley Institutional Fund, Inc.
Annual Report — December 31, 2013
Director and Officer Information (unaudited)
Independent Director:
Name, Age and Address of
Independent Director | | Position(s)
Held with
Registrant | | Length of Time
Served* | | Principal Occupation(s) During Past 5 Years | | Number of
Portfolios in
Fund Complex
Overseen by
Independent
Director** | | Other Directorships
Held by Independent
Director*** | |
Frank L. Bowman (69)
c/o Kramer Levin Naftalis &
Frankel LLP
Counsel to the Independent
Directors
1177 Avenue of the Americas
New York, NY 10036 | | Director | | Since
August
2006 | | President, Strategic Decisions, LLC (consulting) (since February 2009); Director or Trustee of various Morgan Stanley Funds (since August 2006); Chairperson of the Insurance Sub-Committee of the Compliance and Insurance Committee (since February 2007); served as President and Chief Executive Officer of the Nuclear Energy Institute (policy organization) (February 2005-November 2008); retired as Admiral, U.S. Navy after serving over 38 years on active duty including 8 years as Director of the Naval Nuclear Propulsion Program in the Department of the Navy and the U.S. Department of Energy (1996-2004); served as Chief of Naval Personnel (July 1994-September 1996); and on the Joint Staff as Director of Political Military Affairs (June 1992-July 1994); knighted as Honorary Knight Commander of the Most Excellent Order of the British Empire; awarded the Officier de l'Orde National du Mérite by the French Government; elected to the National Academy of Engineering (2009). | | 98 | | Director of BP p.l.c.; Director of Naval and Nuclear Technologies LLP; Director of the Armed Services YMCA of the USA and the U.S. Naval Submarine League; Director of the American Shipbuilding Suppliers Association; Member of the National Security Advisory Council of the Center for U.S. Global Engagement and a member of the CNA Military Advisory Board; Chairman of the Charity J Street Cup Golf; Trustee of Fairhaven United Methodist Church. | |
Michael Bozic (73)
c/o Kramer Levin Naftalis & Frankel LLP
Counsel to the Independent Directors
1177 Avenue of the Americas New York, NY 10036 | | Director | | Since
April
1994 | | Private investor and a member of the advisory board of American Road Group LLC (retail) (since June 2000); Chairperson of the Compliance and Insurance Committee (since October 2006); Director or Trustee of various Morgan Stanley Funds (since April 1994); formerly, Chairperson of the Insurance Committee (July 2006-September 2006); Vice Chairman of Kmart Corporation (December 1998-October 2000), Chairman and Chief Executive Officer of Levitz Furniture Corporation (November 1995-November 1998) and President and Chief Executive Officer of Hills Department Stores (May 1991-July 1995); variously Chairman, Chief Executive Officer, President and Chief Operating Officer (1987-1991) of the Sears Merchandise Group of Sears, Roebuck & Co. | | 100 | | Trustee and member of the Hillsdale College Board of Trustees. | |
Kathleen A. Dennis (60)
c/o Kramer Levin Naftalis & Frankel LLP
Counsel to the Independent Directors
1177 Avenue of the Americas New York, NY 10036 | | Director | | Since
August
2006 | | President, Cedarwood Associates (mutual fund and investment management consulting) (since July 2006); Chairperson of the Money Market and Alternatives Sub-Committee of the Investment Committee (since October 2006) and Director or Trustee of various Morgan Stanley Funds (since August 2006); formerly, Senior Managing Director of Victory Capital Management (1993-2006). | | 98 | | Director of various non-profit organizations. | |
Dr. Manuel H. Johnson (65)
c/o Johnson Smick
International, Inc.
220 I Street, NE
Suite 200
Washington, D.C. 20002 | | Director | | Since
July
1991 | | Senior Partner, Johnson Smick International, Inc. (consulting firm); Chairperson of the Investment Committee (since October 2006) and Director or Trustee of various Morgan Stanley Funds (since July 1991); Co-Chairman and a founder of the Group of Seven Council (G7C) (international economic commission); formerly, Chairperson of the Audit Committee (July 1991-September 2006), Vice Chairman of the Board of Governors of the Federal Reserve System and Assistant Secretary of the U.S. Treasury. | | 101 | | Director of NVR, Inc. (home construction). | |
32
Morgan Stanley Institutional Fund, Inc.
Annual Report — December 31, 2013
Director and Officer Information (unaudited) (cont'd)
Independent Director: (cont'd)
Name, Age and Address of
Independent Director | | Position(s)
Held with
Registrant | | Length of Time
Served* | | Principal Occupation(s) During Past 5 Years | | Number of
Portfolios in
Fund Complex
Overseen by
Independent
Director** | | Other Directorships
Held by Independent
Director*** | |
Joseph J. Kearns (71)
c/o Kearns & Associates LLC PMB754
22631 Pacific Coast Highway
Malibu, CA 90265 | | Director | | Since
August
1994 | | President, Kearns & Associates LLC (investment consulting); Chairperson of the Audit Committee (since October 2006) and Director or Trustee of various Morgan Stanley Funds (since August 1994); formerly, Deputy Chairperson of the Audit Committee (July 2003-September 2006) and Chairperson of the Audit Committee of various Morgan Stanley Funds (since August 1994); CFO of the J. Paul Getty Trust. | | 101 | | Director of Electro Rent Corporation (equipment leasing) and The Ford Family Foundation. | |
Michael F. Klein (55)
c/o Kramer Levin Naftalis & Frankel LLP
Counsel to the
Independent Directors
1177 Avenue of the Americas New York, NY 10036 | | Director | | Since
August
2006 | | Managing Director, Aetos Capital, LLC (since March 2000) and Co-President, Aetos Alternatives Management, LLC (since January 2004); and Co-Chief Executive Officer of Aetos Capital LLC (since August 2013); Chairperson of the Fixed Income Sub-Committee of the Investment Committee (since October 2006) and Director or Trustee of various Morgan Stanley Funds (since August 2006); formerly, Managing Director, Morgan Stanley & Co. Inc. and Morgan Stanley Dean Witter Investment Management, President, various Morgan Stanley Funds (June 1998-March 2000) and Principal, Morgan Stanley & Co. Inc. and Morgan Stanley Dean Witter Investment Management (August 1997-December 1999). | | 98 | | Director of certain investment funds managed or sponsored by Aetos Capital, LLC. Director of Sanitized AG and Sanitized Marketing AG (specialty chemicals). | |
Michael E. Nugent (77)
522 Fifth Avenue
New York, NY 10036 | | Chairperson
of the
Board and Director | | Chairperson of the Boards since July 2006 and Director since July 1991 | | Chairperson of the Boards of various Morgan Stanley Funds (since July 2006); Chairperson of the Closed-End Fund Committee (since June 2012) and Director or Trustee of various Morgan Stanley Funds (since July 1991); formerly, Chairperson of the Insurance Committee (until July 2006); General Partner, Triumph Capital, L.P. (private investment partnership) (1988-2013) | | 100 | | None. | |
W. Allen Reed (66)
c/o Kramer Levin Naftalis & Frankel LLP
Counsel to the
Independent Directors
1177 Avenue of the Americas New York, NY 10036 | | Director | | Since
August
2006 | | Chairperson of the Equity Sub-Committee of the Investment Committee (since October 2006) and Director or Trustee of various Morgan Stanley Funds (since August 2006); formerly, President and CEO of General Motors Asset Management; Chairman and Chief Executive Officer of the GM Trust Bank and Corporate Vice President of General Motors Corporation (August 1994-December 2005). | | 98 | | Director of Temple-Inland Industries (packaging and forest products); Director of Legg Mason, Inc. and Director of the Auburn University Foundation. | |
Fergus Reid (81)
c/o Joe Pietryka, Inc.
85 Charles Colman Blvd. Pawling, NY 12564 | | Director | | Since
June
1992 | | Chairman, Joe Pietryka, Inc.; Chairperson of the Governance Committee and Director or Trustee of various Morgan Stanley Funds (since June 1992). | | 101 | | Through December 31, 2012, Trustee and Director of certain Investment companies in the JP Morgan Fund Complex. | |
33
Morgan Stanley Institutional Fund, Inc.
Annual Report — December 31, 2013
Director and Officer Information (unaudited) (cont'd)
Interested Director:
Name, Age and Address of
Interested Director | | Position(s)
Held with
Registrant | | Length of
Time Served* | | Principal Occupation(s) During Past 5 Years | | Number of
Portfolios in
Fund Complex
Overseen by
Interested
Director** | | Other Directorships
Held by Interested
Director*** | |
James F. Higgins (66)
One New York Plaza
New York, New York 10004 | | Director | | Since
June
2000 | | Director or Trustee of various Morgan Stanley Funds (since June 2000); Senior Advisor of Morgan Stanley (since August 2000). | | 99 | | Formerly, Director of AXA Financial, Inc. and AXA Equitable Life Insurance Company (2002-2011) and Director of AXA MONY Life Insurance Company and AXA MONY Life Insurance Company of America (2004-2011). | |
* Each Director serves an indefinite term, until his or her successor is elected.
** The Fund Complex includes (as of December 31, 2013) all open-end and closed-end funds (including all of their portfolios) advised by Morgan Stanley Investment Management Inc. (the "Adviser") and any funds that have an adviser that is an affiliated person of the Adviser (including, but not limited to, Morgan Stanley AIP GP LP).
*** This includes any directorships at public companies and registered investment companies held by the Director at any time during the past five years.
34
Morgan Stanley Institutional Fund, Inc.
Annual Report — December 31, 2013
Director and Officer Information (unaudited) (cont'd)
Executive Officers:
Name, Age and Address of Executive Officer | | Position(s) Held
with
Registrant | | Length of
Time Served* | | Principal Occupation(s) During Past 5 Years | |
John H. Gernon (50)
522 Fifth Avenue
New York, NY 10036 | | President and Principal Executive Officer—Equity, Fixed Income and AIP Funds | | Since
September
2013 | | President and Principal Executive Officer of the Equity and Fixed Income Funds and the Morgan Stanley AIP Funds (since September 2013) in the Fund Complex. Managing Director of the Adviser. | |
Stefanie V. Chang Yu (47)
522 Fifth Avenue
New York, NY 10036 | | Chief Compliance Officer | | Since
January
2014 | | Managing Director of the Adviser and various entities affiliated with the Adviser; Chief Compliance Officer of various Morgan Stanley Funds and the Adviser (since January 2014); formerly, Vice President of various Morgan Stanley Funds (December 1997-January 2014). | |
Joseph C. Benedetti (48)
522 Fifth Avenue
New York, NY 10036 | | Vice President | | Since
January
2014 | | Managing Director of the Adviser and various entities affiliated with the Adviser; Vice President of various Morgan Stanley Funds (since January 2014); formerly, Assistant Secretary of various Morgan Stanley Funds (October 2004-January 2014). | |
Francis J. Smith (48)
522 Fifth Avenue
New York, NY 10036 | | Treasurer and Principal Financial Officer | | Treasurer since July 2003 and Principal Financial Officer since September 2002 | | Executive Director of the Adviser and various entities affiliated with the Adviser; Treasurer and Principal Financial Officer of various Morgan Stanley Funds (since July 2003). | |
Mary E. Mullin (46)
522 Fifth Avenue
New York, NY 10036 | | Secretary | | Since
June
1999 | | Executive Director of the Adviser and various entities affiliated with the Adviser; Secretary of various Morgan Stanley Funds (since June 1999). | |
* Each officer serves an indefinite term, until his or her successor is elected.
35
Morgan Stanley Institutional Fund, Inc.
Annual Report — December 31, 2013
Adviser and Administrator
Morgan Stanley Investment Management Inc.
522 Fifth Avenue
New York, New York 10036
Sub-Advisers
Morgan Stanley Investment Management Limited
25 Cabot Square, Canary Wharf
London, E14 4QA, England
Morgan Stanley Investment Management Company
23 Church Street
16-01 Capital Square 049481 Singapore
Distributor
Morgan Stanley Distribution, Inc.
522 Fifth Avenue
New York, New York 10036
Dividend Disbursing and Transfer Agent
Boston Financial Data Services, Inc.
2000 Crown Colony Drive
Quincy, Massachusetts 02169
Custodian
State Street Bank and Trust Company
One Lincoln Street
Boston, Massachusetts 02111
Legal Counsel
Dechert LLP
1095 Avenue of the Americas
New York, New York 10036
Counsel to the Independent Directors
Kramer Levin Naftalis & Frankel LLP
1177 Avenue of the Americas
New York, New York 10036
Independent Registered Public Accounting Firm
Ernst & Young LLP
200 Clarendon Street
Boston, Massachusetts 02116
Reporting to Shareholders
Each Morgan Stanley fund provides a complete schedule of portfolio holdings in its semi-annual and annual reports within 60 days of the end of the fund's second and fourth fiscal quarters by filing the schedule electronically with the Securities and Exchange Commission (SEC). The semi-annual reports are filed on Form N-CSRS and the annual reports are filed on Form N-CSR. Morgan Stanley also delivers the semi-annual and annual reports to fund shareholders and makes these reports available on its public website, www.morganstanley.com/im. Each Morgan Stanley fund also files a complete schedule of portfolio holdings with the SEC for the fund's first and third fiscal quarters on Form N-Q. Morgan Stanley does not deliver the reports for the first and third fiscal quarters to shareholders, nor are the reports posted to the Morgan Stanley public website. You may, however, obtain the Form N-Q filings (as well as the Form N-CSR and N-CSRS filings) by accessing the SEC's website, www.sec.gov. You may also review and copy them at the SEC's Public Reference Room in Washington, DC. Information on the operation of the SEC's Public Reference Room may be obtained by calling the SEC toll free at 1 (800) SEC-0330. You can also request copies of these materials, upon payment of a duplicating fee, by electronic request at the SEC's email address (publicinfo@sec.gov) or by writing the Public Reference Room of the SEC, Washington, DC 20549-0102.
Proxy Voting Policies and Procedures and Proxy Voting Record
You may obtain a copy of the Fund's Proxy Voting Policy and Procedures and information regarding how the Fund voted proxies relating to portfolio securities during the most recent twelve-month period ended June 30, without charge, upon request, by calling toll free 1 (800) 548-7786 or by visiting our website at www.morganstanley.com/im. This information is also available on the SEC's website at www.sec.gov.
This report is authorized for distribution only when preceded or accompanied by a prospectus of Morgan Stanley Institutional Fund, Inc. which describes in detail each Investment Portfolio's investment policies, risks, fees and expenses. Please read the prospectus carefully before you invest or send money. For additional information, including information regarding the investments comprising the Portfolio, please visit our website at www.morganstanley.com/im or call toll free 1 (800) 548-7786.
36
(This Page has been left blank intentionally.)
Printed in U.S.A.
This Report has been prepared for shareholders and may be distributed to others only if preceded or accompanied by a current prospectus.
Morgan Stanley Investment Management Inc.
522 Fifth Avenue
New York, New York 10036
© 2014 Morgan Stanley. Morgan Stanley Distribution, Inc.

IFIEMANN
808720 EXP 2.28.15

Morgan Stanley Institutional Fund, Inc.
Total Emerging Markets Portfolio
Annual Report
December 31, 2013

Morgan Stanley Institutional Fund, Inc.
Annual Report — December 31, 2013
Shareholders' Letter | | | 2 | | |
Expense Example | | | 3 | | |
Investment Overview | | | 4 | | |
Portfolio of Investments | | | 7 | | |
Statement of Assets and Liabilities | | | 8 | | |
Statement of Operations | | | 9 | | |
Statements of Changes in Net Assets | | | 10 | | |
Financial Highlights | | | 11 | | |
Notes to Financial Statements | | | 14 | | |
Report of Independent Registered Public Accounting Firm | | | 19 | | |
Federal Tax Notice | | | 20 | | |
U.S. Privacy Policy | | | 21 | | |
Director and Officer Information | | | 24 | | |
This report is authorized for distribution only when preceded or accompanied by prospectuses of the Morgan Stanley Institutional Fund, Inc. To receive a prospectus and/or statement of additional information (SAI), which contains more complete information such as investment objectives, charges, expenses, policies for voting proxies, risk considerations, and describes in detail each of the Portfolio's investment policies to the prospective investor, please call toll free 1 (800) 548-7786. Please read the prospectuses carefully before you invest or send money.
Additionally, you can access portfolio information including performance, characteristics, and investment team commentary through Morgan Stanley Investment Management's website: www.morganstanley.com/im.
Market forecasts provided in this report may not necessarily come to pass. There is no guarantee that any sectors mentioned will continue to perform as discussed herein or that securities in such sectors will be held by the Portfolio in the future. There is no assurance that a Portfolio will achieve its investment objective. Portfolios are subject to market risk, which is the possibility that market values of securities owned by the Portfolio will decline and, therefore, the value of the Portfolio's shares may be less than what you paid for them. Accordingly, you can lose money investing in the Portfolio. Please see the prospectus for more complete information on investment risks.
1
Morgan Stanley Institutional Fund, Inc.
Annual Report — December 31, 2013
Shareholders' Letter (unaudited)
Dear Shareholders,
We are pleased to provide this Annual report, in which you will learn how your investment in Total Emerging Markets Portfolio (the "Portfolio") performed during the latest twelve-month period.
Morgan Stanley Investment Management is a client-centric, investor-led organization. Our global presence, intellectual capital, and breadth of products and services enable us to partner with investors to meet the evolving challenges of today's financial markets. We aim to deliver superior investment service and to empower our clients to make the informed decisions that help them reach their investment goals.
As always, we thank you for selecting Morgan Stanley Investment Management, and look forward to working with you in the months and years ahead.
Sincerely,

John H. Gernon
President and Principal Executive Officer
January 2014
2
Morgan Stanley Institutional Fund, Inc.
Annual Report — December 31, 2013
Expense Example (unaudited)
Total Emerging Markets Portfolio
As a shareholder of the Portfolio, you incur two types of costs: (1) transactional costs, including redemptions fees; and (2) ongoing costs, including advisory fees, administration fees, distribution and shareholder services fees and other Portfolio expenses. This example is intended to help you understand your ongoing costs (in dollars) of investing in the Portfolio and to compare these costs with the ongoing costs of investing in other mutual funds.
This example is based on an investment of $1,000 invested at the beginning of the six-month period ended December 31, 2013 and held for the entire six-month period.
Actual Expenses
The table below provides information about actual account values and actual expenses. You may use the information in this table, together with the amount you invested, to estimate the expenses that you paid over the period. Simply divide your account value by $1,000 (for example, an $8,600 account value divided by $1,000 = 8.6), then multiply the result by the number in the table under the heading entitled "Actual Expenses Paid During Period" to estimate the expenses you paid on your account during this period.
Hypothetical Example for Comparison Purposes
The table below provides information about hypothetical account values and hypothetical expenses based on the Portfolio's actual expense ratio and an assumed rate of return of 5% per year before expenses, which is not the Portfolio's actual return. The hypothetical account values and expenses may not be used to estimate the actual ending account balance or expenses you paid for the period. You may use this information to compare the ongoing costs of investing in the Portfolio and other funds. To do so, compare this 5% hypothetical example with the 5% hypothetical examples that appear in the shareholder reports of the other funds.
Please note that the expenses shown in the table are meant to highlight your ongoing costs only and do not reflect any transactional costs, such as sales charges (loads) and redemption fees. Therefore, the information for each class in the table is useful in comparing ongoing costs only, and will not help you determine the relative total costs of owning different funds. In addition, if these transactional costs were included, your costs would have been higher.
| | | Beginning
Account
Value
7/1/13 | | Actual Ending
Account
Value
12/31/13 | | Hypothetical
Ending Account
Value | | Actual
Expenses
Paid
During
Period* | | Hypothetical
Expenses Paid
During Period* | | Net
Expense
Ratio
During
Period** | |
Total Emerging Markets Portfolio Class I | | $ | 1,000.00 | | | $ | 1,017.10 | | | $ | 1,023.59 | | | $ | 1.63 | | | $ | 1.63 | | | | 0.32 | % | |
Total Emerging Markets Portfolio Class A@ | | | 1,000.00 | | | | 1,015.20 | | | | 1,021.93 | | | | 3.30 | | | | 3.31 | | | | 0.65 | | |
Total Emerging Markets Portfolio Class L | | | 1,000.00 | | | | 1,012.80 | | | | 1,019.51 | | | | 5.73 | | | | 5.75 | | | | 1.13 | | |
* Expenses are calculated using each Portfolio Class' annualized net expense ratio (as disclosed), multiplied by the average account value over the period, and multiplied by 184/365 (to reflect the most recent one-half year period).
** Annualized.
@ Effective September 9, 2013, Class P and Class H shares were renamed Class A shares.
3
Morgan Stanley Institutional Fund, Inc.
Annual Report — December 31, 2013
Investment Overview (unaudited)
Total Emerging Markets Portfolio
The Total Emerging Markets Portfolio seeks to maximize total return.
Performance
For the year ended December 31, 2013, the Portfolio had a total return based on net asset value and reinvestment of distributions per share of -6.00%, net of fees, for Class I shares. The Portfolio's Class I shares underperformed against its benchmark, the Morgan Stanley Capital International (MSCI) Emerging Markets Net Index (the "Index"), which returned -2.60%.
Factors Affecting Performance
• Emerging markets (EM) assets came under significant pressure during the year. Equities were volatile, external debt spreads widened, domestic debt yields rose and EM currencies weakened versus the U.S. dollar. During the period, the U.S. Treasury 10-year yield rose by 127 basis points to 3.03% (as per Bloomberg data), due to positive U.S. economic data releases, the Federal Reserve's (Fed) optimistic growth outlook and signs of an improving labor market. This led to a widespread perception among investors that the Fed would begin "tapering" quantitative easing (QE) sooner than previously expected. This expectation was validated by the Federal Open Market Committee (FOMC) in December, as they announced their intention to reduce the size of asset purchases starting in January.
• The generalized weakness in EM debt accrued mainly from positioning rather than a shift in fundamentals. Starting in late May, sustained outflows from the asset class weighed on prices and investor sentiment. For the last few years, investors had been increasing their exposure to EM debt due to the relatively higher economic growth rates of emerging markets versus developed markets, the strong balance sheets in emerging markets and the additional yield offered versus traditional "safe haven" assets. These attributes may have also attracted investors who are tactical in nature and wanted to participate in the "carry trade," a strategy that borrows in a lower yielding currency to invest in potentially higher yielding assets. For investors of this nature, a change in the pace of Fed accommodation was sufficient reason to reduce their exposure to emerging markets.
• In addition to events in the developed world, concerns over China's declining growth rates weighed on countries that export to China, such as Chile, Indonesia and Brazil. Furthermore, idiosyncratic developments in countries such as Turkey, South Africa, Egypt, Ukraine and Brazil exacerbated the more complex global environment for emerging markets. In the case of Turkey, protests that began in late May stabilized during June, but damaged investor perception of the country, its institutions and the outlook for European Union (EU) membership. Also, in December an anti-corruption investigation targeting high-profile figures connected to Prime Minister Recep Tayyip Erdogan's government and a CEO of a state-run bank caused weakness in Turkish debt and currency. In addition, geopolitical tensions across the Middle East remained elevated throughout the year. In Brazil, demonstrations against bus fare hikes spread throughout the country, with protestors complaining about poor-quality services, rising inflation, and the excessive cost of the 2014 World Cup and the 2016 Olympics. In response, the Brazilian government cancelled the fare hikes and proposed a political reform. However, continued fiscal deterioration, persistent inflation and an increasing current account deficit led investors to believe that Brazil may soon be downgraded by the rating agencies. In South Africa, Fitch cut the country's foreign currency long-term rating to BBB from BBB+, citing weaker economic growth prospects with weaker mining production weighing on economic activity. In Ukraine, the government's refusal to sign an association agreement with the EU prompted street protests by opposition parties, which demanded the resignation of President Viktor Yanukovych and his cabinet, and called for early presidential and parliamentary elections. Lastly, demonstrators in Thailand demanded Prime Minister Yingluck Shinawatra's resignation.
• However, there were positive developments in 2013 as well. Moody's upgraded the Philippines from Ba1 to Baa3 with a positive outlook on the back of robust economic performance, ongoing fiscal and debt consolidation, political stability and improved governance. In addition, an incipient growth recovery in the euro area boosted the growth outlook and improved the current account balances of Eastern European countries such as Poland,
4
Morgan Stanley Institutional Fund, Inc.
Annual Report — December 31, 2013
Investment Overview (unaudited) (cont'd)
Total Emerging Markets Portfolio
Hungary and the Czech Republic. Finally, in December, Mexico passed a landmark energy reform, allowing private investment in the energy sector, which could lead to higher growth and increased foreign direct investment. The passage of this legislation combined with improvements in the fiscal framework prompted S&P to raise Mexico's sovereign rating to BBB+.
• Since mid-2011, emerging markets equities have underperformed those of developed markets as emerging markets' economic growth has been reset downward, which has disappointed investor expectations. We think two main fault lines will continue to negatively affect emerging market returns. First, China's credit growth has been excessive and could contribute to an eventual economic slowdown that is likely to surprise consensus expectations. In countries affected by a Chinese slowdown—particularly Brazil, Russia and South Africa—earnings have been weaker than consensus expected. Second, investors have been increasingly concerned about countries with current account deficits that are vulnerable to the tapering of quantitative easing (QE) in the U.S.—such as Indonesia and Turkey, where current account deficits are large. However, we note there are nuanced differences in the drivers and direction of each country's current account situation and we think investors will eventually consider such differentiation.
• All three underlying funds posted losses for the year, diminishing the Portfolio's overall return. The Portfolio's relative performance may lag the all-equity Index because the Portfolio includes exposure to both equity and debt markets.
Management Strategies
• The Portfolio began the period with an overweight stance in equities relative to bonds. Equity markets appeared oversold in late 2012 and in the first few months of 2013, and valuations still looked attractive by our measures. A cyclical upswing in China, fueled by loose monetary policy and credit growth, was also underway early in the year.
Subsequently, conditions turned volatile as anticipation of the Fed's tapering prompted a sell-off in emerging market assets. We trimmed the equity position, bringing the Portfolio to a neutral asset allocation stance—50% equity, 25% domestic debt and 25% external debt—where it remained through the end of the reporting period. We continue to believe EM equity and debt markets face headwinds with disappointing growth, rising interest rates and weakening currencies.
• The Total Emerging Markets Portfolio is a comprehensive portfolio with a sophisticated asset allocation approach in one simplified structure. The Portfolio uses a disciplined asset allocation process based upon fundamental and quantitative analysis which takes into account market research, quantitative models, historical return information and the investment strategies of the underlying funds, the Emerging Markets Equity Portfolio, Emerging Markets Domestic Debt Portfolio and Emerging Markets External Debt Portfolio.
* Minimum Investment for Class I shares
** Commenced Operations on May 31, 2012.
In accordance with SEC regulations, Portfolio's performance shown assumes that all recurring fees (including management fees) were deducted and all dividends and distributions were reinvested. The performance of Class A+ and L shares will vary from Class I shares and will be negatively impacted by additional fees assessed to those classes.
5
Morgan Stanley Institutional Fund, Inc.
Annual Report — December 31, 2013
Investment Overview (unaudited) (cont'd)
Total Emerging Markets Portfolio
Performance Compared to the Morgan Stanley Capital International (MSCI) Emerging Markets Net Index(1) and the Lipper Emerging Markets Funds Index(2)
| | | Period Ended December 31, 2013
Total Returns(3) | |
| | | | | Average Annual | |
| | | One
Year | | Five
Years | | Ten
Years | | Since
Inception(5) | |
Portfolio — Class I Shares
w/o sales charges(4) | | | -6.00 | % | | | — | | | | — | | | | 6.22 | % | |
MSCI Emerging Markets Net Index | | | -2.60 | | | | — | | | | — | | | | 9.25 | | |
Lipper Emerging Markets Funds Index | | | -1.29 | | | | — | | | | — | | | | 10.72 | | |
Portfolio — Class A+ Shares
w/o sales charges(4) | | | -6.19 | | | | — | | | | — | | | | 5.94 | | |
Portfolio — Class A+ Shares with
maximum 5.25% sales charges(4) | | | -11.08 | | | | — | | | | — | | | | 2.42 | | |
MSCI Emerging Markets Net Index | | | -2.60 | | | | — | | | | — | | | | 9.25 | | |
Lipper Emerging Markets Funds Index | | | -1.29 | | | | — | | | | — | | | | 10.72 | | |
Portfolio — Class L Shares
w/o sales charges(4) | | | -6.67 | | | | — | | | | — | | | | 5.41 | | |
MSCI Emerging Markets Net Index | | | -2.60 | | | | — | | | | — | | | | 9.25 | | |
Lipper Emerging Markets Funds Index | | | -1.29 | | | | — | | | | — | | | | 10.72 | | |
Performance data quoted represents past performance, which is no guarantee of future results, and current performance may be lower or higher than the figures shown. Performance assumes that all dividends and distributions, if any, were reinvested. For the most recent month-end performance figures, please visit www.morganstanley.com/im. Investment return and principal value will fluctuate so that Portfolio shares, when redeemed, may be worth more or less than their original cost. Total returns do not reflect the deduction of taxes that a shareholder would pay on Portfolio distributions or the redemption of Portfolio shares. Performance of share classes will vary due to difference in expenses.
+ Effective September 9, 2013, Class P shares were renamed Class A shares.
(1) The Morgan Stanley Capital International (MSCI) Emerging Markets Net Index is a free float-adjusted market capitalization weighted index that is designed to measure equity market performance of emerging markets. The term "free float" represents the portion of shares outstanding that are deemed to be available for purchase in the public equity markets by investors. The MSCI Emerging Markets Net Index currently consists of 21 emerging market country indices. The performance of the Index is listed in U.S. dollars and assumes reinvestment of net dividends. The Index is unmanaged and its returns do not include any sales charges or fees. Such costs would lower performance. It is not possible to invest directly in an index.
(2) The Lipper Emerging Markets Funds Index is an equally weighted performance index of the largest qualifying funds (based on net assets) in the Lipper Emerging Markets Funds classification. The Index, which is adjusted for capital gains distributions and income dividends, is unmanaged and should not be considered an investment. There are currently 30 funds represented in this Index. As of the date of this report, the Portfolio is in the Lipper Emerging Markets Funds classification.
(3) Total returns for the Portfolio reflect fees waived and expenses reimbursed, if applicable, by the Adviser. Without such waivers and reimbursements, total returns would have been lower. The fee waivers and/or expense reimbursements will continue for at least one year or until such time as the Fund's Board of Directors acts to discontinue all or a portion of such waivers and/or expense reimbursements when it deems that such action is appropriate.
(4) Commenced operations on May 31, 2012.
(5) For comparative purposes, average annual since inception returns listed for the Indexes refer to the inception date or initial offering of the respective share class of the Portfolio, not the inception of the Index.
Portfolio Composition
Classification | | Percentage of
Total Investments | |
Investment Companies | | | 100.0 | % | |
6
Morgan Stanley Institutional Fund, Inc.
Annual Report — December 31, 2013
Portfolio of Investments
Total Emerging Markets Portfolio
| | | Shares | | Value
(000) | |
Investment Companies (97.0%) | |
Emerging Markets Debt (48.0%) | |
Morgan Stanley Institutional Fund, Inc. —
Emerging Markets Domestic Debt Portfolio —
Class I (See Note G) | | | 45,555 | | | $ | 490 | | |
Morgan Stanley Institutional Fund, Inc. —
Emerging Markets External Debt Portfolio —
Class I (See Note G) | | | 54,402 | | | | 511 | | |
| | | | 1,001 | | |
Emerging Markets Equity (49.0%) | |
Morgan Stanley Institutional Fund, Inc. —
Emerging Markets Portfolio — Class I
(See Note G) | | | 41,531 | | | | 1,024 | | |
Total Investment Companies (Cost $1,991) | | | 2,025 | | |
Short-Term Investment (1.6%) | |
Investment Company (1.6%) | |
Morgan Stanley Institutional Liquidity
Funds — Money Market Portfolio —
Institutional Class (See Note G)
(Cost $34) | | | 34,185 | | | | 34 | | |
Total Investments (98.6%) (Cost $2,025) | | | 2,059 | | |
Other Assets in Excess of Liabilities (1.4%) | | | 28 | | |
Net Assets (100.0%) | | $ | 2,087 | | |
The accompanying notes are an integral part of the financial statements.
7
Morgan Stanley Institutional Fund, Inc.
Annual Report — December 31, 2013
Total Emerging Markets Portfolio
Statement of Assets and Liabilities | | December 31, 2013
(000) | |
Assets: | |
Investment in Securities of Affiliated Issuer, at Value (Cost $2,025) | | $ | 2,059 | | |
Total Investments in Securities, at Value (Cost $2,025) | | | 2,059 | | |
Due from Adviser | | | 27 | | |
Receivable from Affiliate | | | 6 | | |
Other Assets | | | 11 | | |
Total Assets | | | 2,103 | | |
Liabilities: | |
Payable for Professional Fees | | | 6 | | |
Payable for Transfer Agent Fees | | | 1 | | |
Payable for Transfer Agent Fees — Class I | | | — | @ | |
Payable for Transfer Agent Fees — Class A* | | | — | @ | |
Payable for Transfer Agent Fees — Class L | | | — | @ | |
Payable for Custodian Fees | | | 1 | | |
Payable for Administration Fees | | | — | @ | |
Payable for Shareholder Services Fees — Class A* | | | — | @ | |
Payable for Distribution and Shareholder Services Fees — Class L | | | — | @ | |
Other Liabilities | | | 8 | | |
Total Liabilities | | | 16 | | |
Net Assets | | $ | 2,087 | | |
Net Assets Consist Of: | |
Paid-in-Capital | | $ | 2,019 | | |
Accumulated Undistributed Net Investment Income | | | 1 | | |
Accumulated Net Realized Gain | | | 33 | | |
Unrealized Appreciation (Depreciation) on: | |
Investments in Affiliates | | | 34 | | |
Net Assets | | $ | 2,087 | | |
CLASS I: | |
Net Assets | | $ | 1,758 | | |
| Shares Outstanding $0.001 par value shares of beneficial interest (500,000,000 shares authorized) (not in 000's) | | | 170,000 | | |
Net Asset Value, Offering and Redemption Price Per Share | | $ | 10.34 | | |
CLASS A*: | |
Net Assets | | $ | 207 | | |
| Shares Outstanding $0.001 par value shares of beneficial interest (500,000,000 shares authorized) (not in 000's) | | | 20,017 | | |
Net Asset Value, Redemption Price Per Share | | $ | 10.34 | | |
Maximum Sales Load§§ | | | 5.25 | % | |
Maximum Sales Charge | | $ | 0.57 | | |
Maximum Offering Price Per Share | | $ | 10.91 | | |
CLASS L: | |
Net Assets | | $ | 122 | | |
| Shares Outstanding $0.001 par value shares of beneficial interest (500,000,000 shares authorized) (not in 000's) | | | 11,813 | | |
Net Asset Value, Offering and Redemption Price Per Share | | $ | 10.34 | | |
@ Amount is less than $500.
* Effective September 9, 2013, Class P and Class H shares were renamed Class A shares.
§§ Effective February 25, 2013, the Directors approved the imposition of a maximum initial sales charge of 5.25% on purchases of Class P shares of the Portfolio.
The accompanying notes are an integral part of the financial statements.
8
Morgan Stanley Institutional Fund, Inc.
Annual Report — December 31, 2013
Total Emerging Markets Portfolio
Statement of Operations | | Year Ended
December 31, 2013
(000) | |
Investment Income: | |
Dividends from Securities of Affiliated Issuer (Note G) | | $ | 53 | | |
Expenses: | |
Professional Fees | | | 84 | | |
Registration Fees | | | 40 | | |
Offering Costs | | | 22 | | |
Shareholder Reporting Fees | | | 19 | | |
Transfer Agency Fees (Note E) | | | 9 | | |
Transfer Agency Fees — Class I (Note E) | | | — | @ | |
Transfer Agency Fees — Class A* (Note E) | | | — | @ | |
Transfer Agency Fees — Class L (Note E) | | | — | @ | |
Advisory Fees (Note B) | | | 4 | | |
Custodian Fees (Note F) | | | 4 | | |
Administration Fees (Note C) | | | 2 | | |
Shareholder Services Fees — Class A* (Note D) | | | — | @ | |
Distribution and Shareholder Services Fees — Class L (Note D) | | | 1 | | |
Directors' Fees and Expenses | | | 1 | | |
Other Expenses | | | 9 | | |
Total Expenses | | | 195 | | |
Expenses Reimbursed by Adviser (Note B) | | | (161 | ) | |
Expenses Assumed by Underlying Funds | | | (23 | ) | |
Waiver of Advisory Fees (Note B) | | | (4 | ) | |
Reimbursement of Class Specific Expenses — Class I | | | (— | @) | |
Reimbursement of Class Specific Expenses — Class A* | | | (— | @) | |
Reimbursement of Class Specific Expenses — Class L | | | (— | @) | |
Rebate from Morgan Stanley Affiliate (Note G) | | | (— | @) | |
Net Expenses | | | 7 | | |
Net Investment Income | | | 46 | | |
Realized Gain (Loss): | |
Investments in Affiliates | | | 24 | | |
Capital Gain Distribution Received from Underlying Affiliated Funds | | | 49 | | |
Net Realized Gain | | | 73 | | |
Change in Unrealized Appreciation (Depreciation): | |
Investments in Affiliates | | | (258 | ) | |
Net Change in Unrealized Appreciation (Depreciation) | | | (258 | ) | |
Net Realized Gain and Change in Unrealized Appreciation (Depreciation) | | | (185 | ) | |
Net Decrease in Net Assets Resulting from Operations | | $ | (139 | ) | |
@ Amount is less than $500.
* Effective September 9, 2013, Class P and Class H shares were renamed Class A shares.
The accompanying notes are an integral part of the financial statements.
9
Morgan Stanley Institutional Fund, Inc.
Annual Report — December 31, 2013
Total Emerging Markets Portfolio
Statements of Changes in Net Assets | | Year Ended
December 31,
2013
(000) | | Period from
May 31,
2012^ to
December 31,
2012
(000) | |
Increase (Decrease) in Net Assets: | |
Operations: | |
Net Investment Income | | $ | 46 | | | $ | 28 | | |
Net Realized Gain | | | 73 | | | | 19 | | |
Net Change in Unrealized Appreciation (Depreciation) | | | (258 | ) | | | 292 | | |
Net Increase (Decrease) in Net Assets Resulting from Operations | | | (139 | ) | | | 339 | | |
Distributions from and/or in Excess of: | |
Class I: | |
Net Investment Income | | | (54 | ) | | | (28 | ) | |
Net Realized Gain | | | (21 | ) | | | (12 | ) | |
Class A*: | |
Net Investment Income | | | (6 | ) | | | (1 | ) | |
Net Realized Gain | | | (2 | ) | | | (1 | ) | |
Class H@@@: | |
Net Investment Income | | | — | | | | (1 | ) | |
Net Realized Gain | | | (— | @)** | | | (1 | ) | |
Class L: | |
Net Investment Income | | | (2 | ) | | | (1 | ) | |
Net Realized Gain | | | (1 | ) | | | (1 | ) | |
Total Distributions | | | (86 | ) | | | (46 | ) | |
Capital Share Transactions:(1) | |
Class I: | |
Subscribed | | | — | | | | 1,700 | | |
Class A*: | |
Subscribed | | | — | | | | 100 | | |
Conversion from Class H | | | 104 | | | | — | | |
Class H@@@: | |
Subscribed | | | — | | | | 100 | | |
Conversion to Class A | | | (104 | )** | | | — | | |
Class L: | |
Subscribed | | | 19 | | | | 100 | | |
Net Increase in Net Assets Resulting from Capital Share Transactions | | | 19 | | | | 2,000 | | |
Total Increase (Decrease) in Net Assets | | | (206 | ) | | | 2,293 | | |
Net Assets: | |
Beginning of Period | | | 2,293 | | | | — | | |
End of Period (Including Accumulated Undistributed Net Investment Income of $1 and $—@) | | $ | 2,087 | | | $ | 2,293 | | |
(1) Capital Share Transactions: | |
Class I: | |
Shares Subscribed | | | — | | | | 170 | | |
Class A*: | |
Shares Subscribed | | | — | @@ | | | 10 | | |
Conversion from Class H | | | 10 | | | | — | | |
Net Increase in Class A* Shares Outstanding | | | 10 | | | | 10 | | |
Class H@@@: | |
Shares Subscribed | | | — | | | | 10 | | |
Conversion to Class A | | | (10 | )** | | | — | | |
Net Increase (Decrease) in Class H Shares Outstanding | | | (10 | ) | | | 10 | | |
Class L: | |
Shares Subscribed | | | 2 | | | | 10 | | |
^ Commencement of Operations.
@ Amount is less than $500.
@@ Amount is less than 500 shares.
@@@ Effective September 9, 2013, Class H shares converted into Class A shares.
* Effective September 9, 2013, Class P shares were renamed Class A shares.
** For the period January 1, 2013 through September 6, 2013.
The accompanying notes are an integral part of the financial statements.
10
Morgan Stanley Institutional Fund, Inc.
Annual Report — December 31, 2013
Financial Highlights
Total Emerging Markets Portfolio
| | | Class I | |
Selected Per Share Data and Ratios | | Year Ended
December 31,
2013 | | Period from
May 31, 2012^ to
December 31, 2012 | |
Net Asset Value, Beginning of Period | | $ | 11.47 | | | $ | 10.00 | | |
Income (Loss) from Investment Operations: | |
Net Investment Income† | | | 0.23 | | | | 0.15 | | |
Net Realized and Unrealized Gain (Loss) | | | (0.92 | ) | | | 1.55 | | |
Total from Investment Operations | | | (0.69 | ) | | | 1.70 | | |
Distributions from and/or in Excess of: | |
Net Investment Income | | | (0.32 | ) | | | (0.16 | ) | |
Net Realized Gain | | | (0.12 | ) | | | (0.07 | ) | |
Total Distributions | | | (0.44 | ) | | | (0.23 | ) | |
Net Asset Value, End of Period | | $ | 10.34 | | | $ | 11.47 | | |
Total Return++ | | | (6.00 | )% | | | 17.07 | %# | |
Ratios and Supplemental Data: | |
Net Assets, End of Period (Thousands) | | $ | 1,758 | | | $ | 1,948 | | |
Ratio of Expenses to Average Net Assets (1) | | | 0.31 | %+‡ | | | 0.30 | %+‡††* | |
Ratio of Net Investment Income to Average Net Assets (1) | | | 2.10 | %+‡ | | | 2.32 | %+‡††* | |
Ratio of Rebate from Morgan Stanley Affiliates to Average Net Assets | | | 0.00 | %§ | | | 0.00 | %††§* | |
Portfolio Turnover Rate | | | 22 | % | | | 12 | %# | |
(1) Supplemental Information on the Ratios to Average Net Assets: | |
Ratios Before Expense Limitation: | |
Expenses to Average Net Assets | | | 8.86 | % | | | 10.92 | %††* | |
Net Investment Loss to Average Net Assets | | | (6.45 | )% | | | (8.30 | )%††* | |
^ Commencement of Operations.
† Per share amount is based on average shares outstanding.
++ Calculated based on the net asset value as of the last business day of the period.
+ The Ratios of Expenses and Net Investment Income reflect the rebate of certain Portfolio expenses in connection with the investments in Morgan Stanley affiliates during the period. The effect of the rebate on the ratios is disclosed in the above table as "Ratio of Rebate from Morgan Stanley Affiliates to Average Net Assets."
‡ Expenses do not include the expenses of the Underlying Funds. If expenses of the Underlying Funds were included, the net expense ratio and net investment income ratio, after the waivers and/or reimbursements would be as follows:
| PERIOD ENDED | | EXPENSE
RATIO | | NET INVESTMENT
INCOME (LOSS) RATIO | |
December 31, 2013 | | | 1.35 | % | | | 1.06 | % | |
December 31, 2012 | | | 1.35 | | | | 1.27 | | |
†† Reflects overall Portfolio ratios for investment income and non-class specific expenses.
§ Amount is less than 0.005%.
# Not Annualized.
* Annualized.
The accompanying notes are an integral part of the financial statements.
11
Morgan Stanley Institutional Fund, Inc.
Annual Report — December 31, 2013
Financial Highlights
Total Emerging Markets Portfolio
| | | Class A@ | |
Selected Per Share Data and Ratios | | Year Ended
December 31,
2013 | | Period from
May 31, 2012^ to
December 31, 2012 | |
Net Asset Value, Beginning of Period | | $ | 11.46 | | | $ | 10.00 | | |
Income (Loss) from Investment Operations: | |
Net Investment Income† | | | 0.31 | | | | 0.13 | | |
Net Realized and Unrealized Gain (Loss) | | | (1.02 | ) | | | 1.55 | | |
Total from Investment Operations | | | (0.71 | ) | | | 1.68 | | |
Distributions from and/or in Excess of: | |
Net Investment Income | | | (0.29 | ) | | | (0.15 | ) | |
Net Realized Gain | | | (0.12 | ) | | | (0.07 | ) | |
Total Distributions | | | (0.41 | ) | | | (0.22 | ) | |
Net Asset Value, End of Period | | $ | 10.34 | | | $ | 11.46 | | |
Total Return++ | | | (6.19 | )% | | | 16.81 | %# | |
Ratios and Supplemental Data: | |
Net Assets, End of Period (Thousands) | | $ | 207 | | | $ | 115 | | |
Ratio of Expenses to Average Net Assets (1) | | | 0.60 | %+‡^^ | | | 0.55 | %+‡††* | |
Ratio of Net Investment Income to Average Net Assets (1) | | | 2.80 | %+‡ | | | 2.07 | %+‡††* | |
Ratio of Rebate from Morgan Stanley Affiliates to Average Net Assets | | | 0.00 | %§ | | | 0.00 | %§††* | |
Portfolio Turnover Rate | | | 22 | % | | | 12 | %# | |
(1) Supplemental Information on the Ratios to Average Net Assets: | |
Ratios Before Expense Limitation: | |
Expenses to Average Net Assets | | | 8.96 | % | | | 11.17 | %††* | |
Net Investment Loss to Average Net Assets | | | (5.56 | )% | | | (8.55 | )%††* | |
@ Effective September 9, 2013, Class P and Class H shares were renamed Class A shares.
^ Commencement of Operations.
† Per share amount is based on average shares outstanding.
++ Calculated based on the net asset value which does not reflect sales charges, if applicable, as of the last business day of the period.
+ The Ratios of Expenses and Net Investment Income reflect the rebate of certain Portfolio expenses in connection with the investments in Morgan Stanley affiliates during the period. The effect of the rebate on the ratios is disclosed in the above table as "Ratio of Rebate from Morgan Stanley Affiliates to Average Net Assets."
‡ Expenses do not include the expenses of the Underlying Funds. If expenses of the Underlying Funds were included, the net expense ratio and net investment income ratio, after the waivers and/or reimbursements would be as follows:
| PERIOD ENDED | | EXPENSE
RATIO | | NET INVESTMENT
INCOME (LOSS) RATIO | |
December 31, 2013 | | | 1.64 | % | | | 1.76 | % | |
December 31, 2012 | | | 1.60 | | | | 1.02 | | |
^^ Effective September 16, 2013, the Adviser has agreed to limit the ratio of expenses to average net assets to the maximum ratio of 1.70% for Class A shares. Prior to September 16, 2013, the maximum ratio was 1.60% for Class A shares.
†† Reflects overall Portfolio ratios for investment income and non-class specific expenses.
§ Amount is less than 0.005%.
* Annualized.
# Not Annualized.
The accompanying notes are an integral part of the financial statements.
12
Morgan Stanley Institutional Fund, Inc.
Annual Report �� December 31, 2013
Financial Highlights
Total Emerging Markets Portfolio
| | | Class L | |
Selected Per Share Data and Ratios | | Year Ended
December 31,
2013 | | Period from
May 31, 2012^ to
December 31, 2012 | |
Net Asset Value, Beginning of Period | | $ | 11.46 | | | $ | 10.00 | | |
Income (Loss) from Investment Operations: | |
Net Investment Income† | | | 0.14 | | | | 0.10 | | |
Net Realized and Unrealized Gain (Loss) | | | (0.91 | ) | | | 1.54 | | |
Total from Investment Operations | | | (0.77 | ) | | | 1.64 | | |
Distributions from and/or in Excess of: | |
Net Investment Income | | | (0.23 | ) | | | (0.11 | ) | |
Net Realized Gain | | | (0.12 | ) | | | (0.07 | ) | |
Total Distributions | | | (0.35 | ) | | | (0.18 | ) | |
Net Asset Value, End of Period | | $ | 10.34 | | | $ | 11.46 | | |
Total Return++ | | | (6.67 | )% | | | 16.49 | %# | |
Ratios and Supplemental Data: | |
Net Assets, End of Period (Thousands) | | $ | 122 | | | $ | 115 | | |
Ratio of Expenses to Average Net Assets (1) | | | 1.09 | %+‡^^ | | | 1.05 | %+‡††* | |
Ratio of Net Investment Income to Average Net Assets (1) | | | 1.31 | %+‡ | | | 1.57 | %+‡††* | |
Ratio of Rebate from Morgan Stanley Affiliates to Average Net Assets | | | 0.00 | %§ | | | 0.00 | %††§* | |
Portfolio Turnover Rate | | | 22 | % | | | 12 | %# | |
(1) Supplemental Information on the Ratios to Average Net Assets: | |
Ratios Before Expense Limitation: | |
Expenses to Average Net Assets | | | 9.97 | % | | | 11.67 | %††* | |
Net Investment Loss to Average Net Assets | | | (7.57 | )% | | | (9.05 | )%††* | |
^ Commencement of Operations.
† Per share amount is based on average shares outstanding.
++ Calculated based on the net asset value as of the last business day of the period.
+ The Ratios of Expenses and Net Investment Income reflect the rebate of certain Portfolio expenses in connection with the investments in Morgan Stanley affiliates during the period. The effect of the rebate on the ratios is disclosed in the above table as "Ratio of Rebate from Morgan Stanley Affiliates to Average Net Assets."
‡ Expenses do not include the expenses of the Underlying Funds. If expenses of the Underlying Funds were included, the net expense ratio and net investment income ratio, after the waivers and/or reimbursements would be as follows:
| PERIOD ENDED | | EXPENSE
RATIO | | NET INVESTMENT
INCOME (LOSS) RATIO | |
December 31, 2013 | | | 2.13 | % | | | 0.27 | % | |
December 31, 2012 | | | 2.10 | | | | 0.52 | | |
^^ Effective September 16, 2013, the Adviser has agreed to limit the ratio of expenses to average net assets to the maximum ratio of 2.20% for Class L shares. Prior to September 16, 2013, the maximum ratio was 2.10% for Class L shares.
†† Reflects overall Portfolio ratios for investment income and non-class specific expenses.
§ Amount is less than 0.005%.
# Not Annualized.
* Annualized.
The accompanying notes are an integral part of the financial statements.
13
Morgan Stanley Institutional Fund, Inc.
Annual Report — December 31, 2013
Notes to Financial Statements
Morgan Stanley Institutional Fund, Inc. (the "Fund") is registered under the Investment Company Act of 1940, as amended (the "Act"), as an open-end management investment company. The Fund is comprised of twenty-seven separate, active, diversified and non-diversified portfolios (individually referred to as a "Portfolio", collectively as the "Portfolios").
The accompanying financial statements relate to the Total Emerging Markets Portfolio. The Portfolio is a "fund of funds" in that it seeks to maximize total return by investing primarily in funds advised by Morgan Stanley Investment Management Inc. ("the Adviser") or its affiliates (the "Underlying Funds"). The Portfolio may also invest, to a lesser extent, in individual equity and fixed income securities and exchange-traded funds ("ETFs"). Under normal market conditions, at least 80% of the Portfolio's assets will be allocated among the Underlying Funds and other securities that the Adviser considers to be economically tied to emerging market countries. The Adviser considers the results of a quantitative asset allocation model, which incorporates historical return information, investment objectives and strategies of the Underlying Funds and financial and economic factors designed to capture the risks and returns of the Underlying Funds. The Portfolio offers three classes of shares — Class I, Class A and Class L.
Effective September 9, 2013, Class P and Class H shares were renamed Class A shares.
A. Significant Accounting Policies: The following significant accounting policies are in conformity with U.S. generally accepted accounting principles ("GAAP"). Such policies are consistently followed by the Fund in the preparation of its financial statements. GAAP may require management to make estimates and assumptions that affect the reported amounts and disclosures in the financial statements. Actual results may differ from those estimates.
1. Security Valuation: (1) Investments are valued at the net asset value per share of each Underlying Fund determined as of the close of the New York Stock Exchange ("NYSE") on valuation date; (2) an equity portfolio security listed or traded on an exchange is valued at its latest reported sales price (or at the exchange official closing price if such exchange reports an official closing price), if there were no sales on a given day, the security is valued at the mean between the last reported bid and asked prices; (3) when market quotations are not readily available, including circumstances under which the Adviser determines that the closing price, last sale price or the mean between the last reported bid and asked prices are not reflective of a
security's market value, portfolio securities are valued at their fair value as determined in good faith under procedures established by and under the general supervision of the Fund's Board of Directors (the "Directors"). Occasionally, developments affecting the closing prices of securities and other assets may occur between the times at which valuations of such securities are determined (that is, close of the foreign market on which the securities trade) and the close of business of the NYSE. If developments occur during such periods that are expected to materially affect the value of such securities, such valuations may be adjusted to reflect the estimated fair value of such securities as of the close of the NYSE, as determined in good faith by the Directors or by the Adviser using a pricing service and/or procedures approved by the Directors; (4) investments in mutual funds, including the Morgan Stanley Institutional Liquidity Funds, are valued at the net asset value as of the close of each business day; and (5) short-term debt securities with remaining maturities of 60 days or less at the time of purchase may be valued at amortized cost, unless the Adviser determines such valuation does not reflect the securities' market value, in which case these securities will be valued at their fair market value determined by the Adviser.
Under procedures approved by the Directors, the Fund's Adviser has formed a Valuation Committee. The Valuation Committee provides administration and oversight of the Fund's valuation policies and procedures, which are reviewed at least annually by the Directors. These procedures allow the Fund to utilize independent pricing services, quotations from securities and financial instrument dealers, and other market sources to determine fair value.
The Fund has procedures to determine the fair value of securities and other financial instruments for which market prices are not readily available. Under these procedures, the Valuation Committee convenes on a regular and ad hoc basis to review such securities and considers a number of factors, including valuation methodologies and significant unobservable valuation inputs, when arriving at fair value. The Valuation Committee may employ a market-based approach which may use related or comparable assets or liabilities, recent transactions, market multiples, book values, and other relevant information for the investment to determine the fair value of the investment. An income-based valuation approach may also be used in which the anticipated future cash flows
14
Morgan Stanley Institutional Fund, Inc.
Annual Report — December 31, 2013
Notes to Financial Statements (cont'd)
of the investment are discounted to calculate fair value. Discounts may also be applied due to the nature or duration of any restrictions on the disposition of the investments. Due to the inherent uncertainty of valuations of such investments, the fair values may differ significantly from the values that would have been used had an active market existed. The Valuation Committee employs various methods for calibrating these valuation approaches including a regular review of valuation methodologies, key inputs and assumptions, transactional back-testing or disposition analysis, and reviews of any related market activity.
2. Fair Value Measurement: Financial Accounting Standards Board ("FASB") Accounting Standards CodificationTM ("ASC") 820, "Fair Value Measurements and Disclosures" ("ASC 820"), defines fair value as the value that the Fund would receive to sell an investment or pay to transfer a liability in a timely transaction with an independent buyer in the principal market, or in the absence of a principal market the most advantageous market for the investment or liability. ASC 820 establishes a three-tier hierarchy to distinguish between (1) inputs that reflect the assumptions market participants would use in valuing an asset or liability developed based on market data obtained from sources independent of the reporting entity (observable inputs) and (2) inputs that reflect the reporting entity's own assumptions about the assumptions market participants would use in valuing an asset or liability developed based on the best information available in the circumstances (unobservable inputs) and to establish classification of fair value measurements for disclosure purposes. Various inputs are used in determining the value of the Fund's investments. The inputs are summarized in the three broad levels listed below.
• Level 1 – unadjusted quoted prices in active markets for identical investments
• Level 2 – other significant observable inputs (including quoted prices for similar investments, interest rates, prepayment speeds, credit risk, etc.)
• Level 3 – significant unobservable inputs including the Fund's own assumptions in determining the fair value of investments. Factors considered in making this determination may include, but are not limited to, information obtained by contacting the issuer, analysts,
or the appropriate stock exchange (for exchange-traded securities), analysis of the issuer's financial statements or other available documents and, if necessary, available information concerning other securities in similar circumstances
The inputs or methodology used for valuing securities are not necessarily an indication of the risk associated with investing in those securities and the determination of the significance of a particular input to the fair value measurement in its entirety requires judgment and considers factors specific to each security.
The following is a summary of the inputs used to value the Portfolio's investments as of December 31, 2013.
Investment Type | | Level 1
Unadjusted
quoted
prices
(000) | | Level 2
Other
significant
observable
inputs
(000) | | Level 3
Significant
unobservable
inputs
(000) | | Total
(000) | |
Assets: | |
Investment Companies | | $ | 2,025 | | | $ | — | | | $ | — | | | $ | 2,025 | | |
Short-Term Investment —
Investment Company | | | 34 | | | | — | | | | — | | | | 34 | | |
Total Assets | | $ | 2,059 | | | $ | — | | | $ | — | | | $ | 2,059 | | |
Transfers between investment levels may occur as the markets fluctuate and/or the availability of data used in an investment's valuation changes. The Portfolio recognizes transfers between the levels as of the end of the period. As of December 31, 2013, the Portfolio did not have any investments transfer between investment levels.
3. Redemption Fees: The Portfolio will assess a 2% redemption fee, on Class I shares, Class A shares and Class L shares, which is paid directly to the Portfolio, for shares redeemed or exchanged within thirty days of purchase, subject to certain exceptions. The redemption fee is designed to protect the Portfolio and its remaining shareholders from the effects of short-term trading. These fees, if any, are included in the Statements of Changes in Net Assets.
4. Indemnifications: The Fund enters into contracts that contain a variety of indemnifications. The Fund's maximum exposure under these arrangements is unknown. However, the Fund has not had prior claims or losses pursuant to these contracts and expects the risk of loss to be remote.
5. Dividends and Distributions to Shareholders: Dividend income and distributions to shareholders are recorded on the ex-dividend date. Dividends from net
15
Morgan Stanley Institutional Fund, Inc.
Annual Report — December 31, 2013
Notes to Financial Statements (cont'd)
investment income, if any, are declared and paid semiannually. Net realized capital gains, if any, are distributed at least annually.
6. Security Transactions, Income and Expenses: Security transactions are accounted for on the trade date (date the order to buy or sell is executed). Realized gains and losses on the sale of investment securities are determined on the specific identified cost method. Dividend income and other distributions are recorded on the ex-dividend date (except for certain foreign dividends which may be recorded as soon as the Portfolio is informed of such dividends) net of applicable withholding taxes. Interest income is recognized on the accrual basis except where collection is in doubt. Discounts are accreted and premiums are amortized over the life of the respective securities. Most expenses of the Fund can be directly attributed to a particular Portfolio. Expenses which cannot be directly attributed are apportioned among the Portfolios based upon relative net assets or other appropriate methods. Income, expenses (other than class specific expenses — distribution, transfer agency and sub transfer agency fees) and realized and unrealized gains or losses are allocated to each class of shares based upon their relative net assets.
B. Advisory Fees: The Adviser, a wholly-owned subsidiary of Morgan Stanley, provides the Portfolio with advisory services under the terms of an Investment Advisory Agreement, paid quarterly, at an annual rate of 0.20% of the Portfolio's average daily net assets.
The Adviser has agreed to reduce its advisory fee and/or reimburse the Portfolio so that total annual portfolio operating expenses, excluding certain investment related expenses, taxes, interest and other extraordinary expenses (including litigation), will not exceed 1.35% for Class I shares, 1.60% for Class A shares and 2.10% for Class L shares. Effective September 16, 2013, the Adviser has agreed to limit the ratio of expenses to average net assets to the maximum ratio of 1.70% and 2.20% for Class A and Class L shares, respectively. The fee waivers and/or expense reimbursements will continue for at least one year or until such time that the Directors act to discontinue all or a portion of such waivers and/or reimbursements when it deems such action is appropriate. The expenses of the Underlying Funds are taken into account when calculating the fee waivers and/or expense reimbursements. For the year ended December 31, 2013, approximately $4,000 of advisory fees
were waived and approximately $161,000 of other expenses were reimbursed by the Adviser pursuant to this arrangement.
C. Administration Fees: The Adviser also serves as Administrator to the Fund and provides administrative services pursuant to an Administration Agreement for an annual fee, accrued daily and paid monthly, of 0.08% of the Portfolio's average daily net assets. Under a Sub-Administration Agreement between the Administrator and State Street Bank and Trust Company ("State Street"), State Street provides certain administrative services to the Fund. For such services, the Administrator pays State Street a portion of the fee the Administrator receives from the Portfolio.
D. Distribution and Shareholder Services Fees: Morgan Stanley Distribution, Inc. ("MSDI" or the "Distributor"), a wholly-owned subsidiary of the Adviser, and an indirect subsidiary of Morgan Stanley, serves as the Fund's Distributor of Portfolio shares pursuant to a Distribution Agreement. The Fund has adopted a Shareholder Services Plan with respect to Class A shares pursuant to Rule 12b-1 under the Act. Under the Shareholder Services Plan, the Portfolio pays the Distributor a shareholder services fee, accrued daily and paid monthly, at an annual rate of 0.25% of the Portfolio's average daily net assets attributable to Class A shares.
The Fund has adopted a Distribution and Shareholder Services Plan with respect to Class L shares pursuant to Rule 12b-1 under the Act. Under the Distribution and Shareholder Services Plan, the Portfolio pays the Distributor a distribution fee, accrued daily and paid monthly, at an annual rate of 0.50% and a shareholder services fee, accrued daily and paid monthly, at an annual rate of 0.25% of the Portfolio's average daily net assets attributable to Class L shares.
The distribution and shareholder services fees are used to support the expenses associated with servicing and maintaining accounts. The Distributor may compensate other parties for providing shareholder support services to investors who purchase Class A and Class L shares.
E. Dividend Disbursing and Transfer Agent: The Fund's dividend disbursing and transfer agent was Morgan Stanley Services Company Inc. ("Morgan Stanley Services"). Pursuant to a Transfer Agency Agreement, the Fund paid Morgan Stanley Services a fee based on the number of classes, accounts and transactions relating to the Portfolios of the Fund. Effective July 1, 2013, the Directors approved changing the transfer agent to Boston Financial Data Services, Inc.
16
Morgan Stanley Institutional Fund, Inc.
Annual Report — December 31, 2013
Notes to Financial Statements (cont'd)
F. Custodian Fees: State Street (the "Custodian") serves as Custodian for the Fund in accordance with a Custodian Agreement. The Custodian holds cash, securities, and other assets of the Fund as required by the Act. Custody fees are payable monthly based on assets held in custody, investment purchases and sales activity and account maintenance fees, plus reimbursement for certain out-of-pocket expenses.
G. Security Transactions and Transactions with Affiliates: There were no purchases and sales of long-term U.S. Government securities for the year ended December 31, 2013.
A summary of the purchases and sales of affiliated registered investment companies, other than short-term investments, for the year ended December 31, 2013 is as follows:
Morgan Stanley
Institutional
Fund, Inc. | | Value
December 31,
2012
(000) | | Purchases
at Cost
(000) | | Sales
(000) | | Realized
Gain
(Loss)
(000) | | Dividend
Income
(000) | | Value
December 31,
2013
(000) | |
Emerging Markets | | $ | 1,274 | | | $ | 169 | | | $ | 363 | | | $ | 19 | | | $ | 8 | | | $ | 1,024 | | |
Emerging Markets
Domestic Debt | | | 564 | | | | 63 | | | | 49 | | | | (— | @) | | | 18 | | | | 490 | | |
Emerging Markets
External Debt | | | 447 | | | | 267 | | | | 115 | | | | 5 | | | | 27 | | | | 511 | | |
@ Amount is less than $500.
The Portfolio invests in the Institutional Class of the Morgan Stanley Institutional Liquidity Funds — Money Market Portfolio (the "Liquidity Funds"), an open-end management investment company managed by the Adviser. Advisory fees paid by the Portfolio are reduced by an amount equal to its pro-rata share of the advisory and administration fees paid by the Portfolio due to its investment in the Liquidity Funds. For the year ended December 31, 2013, advisory fees paid were reduced by less than $500 relating to the Portfolio's investment in the Liquidity Funds.
A summary of the Portfolio's transactions in shares of the Liquidity Funds during the year ended December 31, 2013 is as follows:
Value
December 31,
2012
(000) | | Purchases
at Cost
(000) | | Sales
(000) | | Dividend
Income
(000) | | Value
December 31,
2013
(000) | |
| $ | 4 | | | $ | 493 | | | $ | 463 | | | $ | — | @ | | $ | 34 | | |
@ Amount is less than $500.
H. Federal Income Taxes: It is the Portfolio's intention to continue to qualify as a regulated investment company and distribute all of its taxable and tax-exempt income. Accordingly, no provision for Federal income taxes is required in the financial statements.
The Portfolio may be subject to taxes imposed by countries in which it invests. Such taxes are generally based on income and/or capital gains earned or repatriated. Taxes are accrued based on net investment income, net realized gains and net unrealized appreciation as such income and/or gains are earned. Taxes may also be based on transactions in foreign currency and are accrued based on the value of investments denominated in such currency.
FASB ASC 740-10, Income Taxes — Overall, sets forth a minimum threshold for financial statement recognition of the benefit of a tax position taken or expected to be taken in a tax return. Management has concluded there are no significant uncertain tax positions that would require recognition in the financial statements. If applicable, the Portfolio recognizes interest accrued related to unrecognized tax benefits in "Interest Expense" and penalties in "Other Expenses" in the Statement of Operations. The Portfolio files tax returns with the U.S. Internal Revenue Service, New York and various states. Each of the tax years in the two-year period ended December 31, 2013, remains subject to examination by taxing authorities.
The tax character of distributions paid may differ from the character of distributions shown in the Statements of Changes in Net Assets due to short-term capital gains being treated as ordinary income for tax purposes. The tax character of distributions paid during fiscal years 2013 and 2012 was as follows:
2013
Distributions
Paid From: | | 2012
Distributions
Paid From: | |
Ordinary
Income
(000) | | Long-Term
Capital Gain
(000) | | Ordinary
Income
(000) | | Long-Term
Capital Gain
(000) | |
| $ | 74 | | | $ | 12 | | | $ | 46 | | | $ | — | @ | |
The amount and character of income and gains to be distributed are determined in accordance with income tax regulations which may differ from GAAP. These book/tax differences are either considered temporary or permanent in nature.
Temporary differences are attributable to differing book and tax treatments for the timing of the recognition of gains (losses) on certain investment transactions and the timing of the deductibility of certain expenses.
Permanent differences, primarily due to reclassification of distributions received and distribution redesignations, resulted in
17
Morgan Stanley Institutional Fund, Inc.
Annual Report — December 31, 2013
Notes to Financial Statements (cont'd)
the following reclassifications among the components of net assets at December 31, 2013:
Accumulated
Undistributed
Net Investment
Income
(000) | | Accumulated
Net Realized
Gain
(000) | | Paid-in-
Capital
(000) | |
| $ | 17 | | | $ | (17 | ) | | | — | | |
At December 31, 2013, the components of distributable earnings for the Portfolio on a tax basis were as follows:
Undistributed
Ordinary
Income
(000) | | Undistributed
Long-Term
Capital Gain
(000) | |
| | — | | | $ | 37 | | |
At December 31, 2013, the aggregate cost for Federal income tax purposes is approximately $2,027,000. The aggregate gross unrealized appreciation is approximately $102,000 and the aggregate gross unrealized depreciation is approximately $70,000 resulting in net unrealized appreciation of approximately $32,000.
I. Results of Special Shareholder Meeting (unaudited): On June 5, 2013, a Joint Special Shareholder Meeting was held for Class H shareholders of the Portfolio to approve the Articles of Amendment to the Fund's Articles of Amendment and Restatement and a Plan of Reclassification for the Portfolio pursuant to which Class H shares would be reclassified as Class P shares. The results with respect to this proposal were as follows:
| For: | | Against: | | Abstain: | |
| | 10,000 | | | | 0 | | | | 0 | | |
J. Accounting Pronouncement: In June 2013, FASB issued Accounting Standards Update 2013-08 Financial Services — Investment Companies (Topic 946) — Amendments to the Scope, Measurement, and Disclosure Requirements ("ASU 2013-08") which is effective for interim and annual reporting periods in fiscal years that begin after December 15, 2013. ASU 2013-08 sets forth a methodology for determining whether an entity should be characterized as an investment company and prescribes fair value accounting for an investment company's non-controlling ownership interest in another investment company. FASB has determined that a fund registered under the Investment Company Act of 1940 automatically meets ASU 2013-08's criteria for an investment company. Although still evaluating the potential impacts of ASU 2013-08 to the Portfolio, management expects that the impact of the Portfolio's adoption will be limited to additional financial statement disclosures.
18
Morgan Stanley Institutional Fund, Inc.
Annual Report — December 31, 2013
Report of Independent Registered Public Accounting Firm
To the Shareholders and Board of Directors of
Morgan Stanley Institutional Fund, Inc. —
Total Emerging Markets Portfolio
We have audited the accompanying statement of assets and liabilities, including the portfolio of investments, of Total Emerging Markets Portfolio (one of the portfolios constituting Morgan Stanley Institutional Fund, Inc.) (the "Portfolio") as of December 31, 2013, and the related statement of operations for the year then ended, and the statements of changes in net assets and the financial highlights for each of the periods indicated therein. These financial statements and financial highlights are the responsibility of the Portfolio's management. Our responsibility is to express an opinion on these financial statements and financial highlights based on our audits.
We conducted our audits in accordance with the standards of the Public Company Accounting Oversight Board (United States). Those standards require that we plan and perform the audits to obtain reasonable assurance about whether the financial statements and financial highlights are free of material misstatement. We were not engaged to perform an audit of the Portfolio's internal control over financial reporting. Our audits included consideration of internal control over financial reporting as a basis for designing audit procedures that are appropriate in the circumstances, but not for the purpose of expressing an opinion on the effectiveness of the Portfolio's internal control over financial reporting. Accordingly, we express no such opinion. An audit also includes examining, on a test basis, evidence supporting the amounts and disclosures in the financial statements and financial highlights, assessing the accounting principles used and significant estimates made by management, and evaluating the overall financial statement presentation. Our procedures included confirmation of securities owned as of December 31, 2013, by correspondence with the transfer agent and others. We believe that our audits provide a reasonable basis for our opinion.
In our opinion, the financial statements and financial highlights referred to above present fairly, in all material respects, the financial position of the Total Emerging Markets Portfolio (one of the portfolios constituting Morgan Stanley Institutional Fund, Inc.) at December 31, 2013, the results of its operations for the year then ended, and the changes in its net assets and the financial highlights for each of the periods indicated therein, in conformity with U.S. generally accepted accounting principles.

Boston, Massachusetts
February 26, 2014
19
Morgan Stanley Institutional Fund, Inc.
Annual Report — December 31, 2013
Federal Tax Notice (unaudited)
For Federal income tax purposes, the following information is furnished with respect to the distributions paid by the Portfolio during its taxable year ended December 31, 2013.
The Portfolio designated and paid approximately $12,000 as a long-term capital gain distribution.
In January, the Portfolio provides tax information to shareholders for the preceding calendar year.
20
Morgan Stanley Institutional Fund, Inc.
Annual Report — December 31, 2013
U.S. Privacy Policy (unaudited)
AN IMPORTANT NOTICE CONCERNING OUR U.S. PRIVACY POLICY
This privacy notice describes the U.S. privacy policy of Morgan Stanley Distribution, Inc., and the Morgan Stanley family of mutual funds ("us", "our", "we").
We are required by federal law to provide you with notice of our U.S. privacy policy ("Policy"). This Policy applies to both our current and former clients unless we state otherwise and is intended for individual clients who purchase products or receive services from us for personal, family or household purposes. This Policy is not applicable to partnerships, corporations, trusts or other non-individual clients or account holders, nor is this Policy applicable to individuals who are either beneficiaries of a trust for which we serve as trustee or participants in an employee benefit plan administered or advised by us. This Policy is, however, applicable to individuals who select us to be a custodian of securities or assets in individual retirement accounts, 401(k) accounts, or accounts subject to the Uniform Gifts to Minors Act.
This notice sets out our business practices to protect your privacy; how we collect and share personal information about you; and how you can limit our sharing or certain uses by others of this information. We may amend this Policy at any time, and will inform you of any changes to our Policy as required by law.
WE RESPECT YOUR PRIVACY
We appreciate that you have provided us with your personal financial information and understand your concerns about your information. We strive to safeguard the information our clients entrust to us. Protecting the confidentiality and security of client information is an important part of how we conduct our business.
This notice describes what personal information we collect about you, how we collect it, when we may share it with others, and how certain others may use it. It discusses the steps you may take to limit our sharing of certain information about you with our affiliated companies, including, but not limited to our affiliated banking businesses, brokerage firms and credit service affiliates. It also discloses how you may limit our affiliates' use of shared information for marketing purposes.
Throughout this Policy, we refer to the nonpublic information that personally identifies you as "personal information." We also use the term "affiliated company" in this notice. An affiliated company is a company in our family of companies and includes companies with the Morgan Stanley name. These affiliated companies are financial institutions such as broker-dealers, banks, investment advisers and credit card issuers. We refer to any company that is not an affiliated company as a nonaffiliated third party. For purposes of Section 5 of this notice, and your ability to limit certain uses of personal information by our affiliates, this notice applies to the use of personal information by our affiliated companies.
1. WHAT PERSONAL INFORMATION DO WE COLLECT FROM YOU?
We may collect the following types of information about you: (i) information provided by you, including information from applications and other forms we receive from you, (ii) information about your transactions with us or our affiliates, (iii) information about your transactions with nonaffiliated third parties, (iv) information from consumer reporting agencies, (v) information obtained from our websites, and (vi) information obtained from other sources. For example:
• We collect information such as your name, address, e-mail address, telephone/fax numbers, assets, income and investment objectives through applications and other forms you submit to us.
• We may obtain information about account balances, your use of account(s) and the types of products and services you prefer to receive from us through your dealings and transactions with us and other sources.
• We may obtain information about your creditworthiness and credit history from consumer reporting agencies.
• We may collect background information from and through third-party vendors to verify representations you have made and to comply with various regulatory requirements.
2. WHEN DO WE DISCLOSE PERSONAL INFORMATION WE COLLECT ABOUT YOU?
We may disclose personal information we collect about you in each of the categories listed above to affiliated and nonaffiliated third parties.
21
Morgan Stanley Institutional Fund, Inc.
Annual Report — December 31, 2013
U.S. Privacy Policy (unaudited) (cont'd)
a. Information we disclose to affiliated companies.
We may disclose personal information that we collect about you to our affiliated companies to manage your account(s) effectively, to service and process your transactions, and to let you know about products and services offered by us and affiliated companies, to manage our business, and as otherwise required or permitted by law. Offers for products and services from affiliated companies are developed under conditions designed to safeguard your personal information.
b. Information we disclose to third parties.
We may disclose personal information that we collect about you to nonaffiliated third parties to provide marketing services on our behalf or to other financial institutions with whom we have joint marketing agreements. We may also disclose all of the information we collect to other nonaffiliated third parties for our everyday business purposes, such as to process transactions, maintain account(s), respond to court orders and legal investigations, report to credit bureaus, offer our own products and services, protect against fraud, for institutional risk control, to perform services on our behalf, and as otherwise required or permitted by law.
When we share personal information about you with a nonaffiliated third party, they are required to limit their use of personal information about you to the particular purpose for which it was shared and they are not allowed to share personal information about you with others except to fulfill that limited purpose or as may be permitted or required by law.
3. HOW DO WE PROTECT THE SECURITY AND CONFIDENTIALITY OF PERSONAL INFORMATION WE COLLECT ABOUT YOU?
We maintain physical, electronic and procedural security measures that comply with applicable law and regulations to help safeguard the personal information we collect about you. We have internal policies governing the proper handling of client information by employees. Third parties that provide support or marketing services on our behalf may also receive personal information about you, and we require them to adhere to appropriate security standards with respect to such information.
4. HOW CAN YOU LIMIT OUR SHARING CERTAIN PERSONAL INFORMATION ABOUT YOU WITH OUR AFFILIATED COMPANIES FOR ELIGIBILITY DETERMINATION?
By following the opt-out procedures in Section 6 below, you may limit the extent to which we share with our affiliated companies, personal information that was collected to determine your eligibility for products and services such as your credit reports and other information that you have provided to us or that we may obtain from third parties ("eligibility information"). Eligibility information does not include your identification information or personal information pertaining to our transactions or experiences with you. Please note that, even if you direct us not to share eligibility information with our affiliated companies, we may still share your personal information, including eligibility information, with our affiliated companies under circumstances that are permitted under applicable law, such as to process transactions or to service your account.
5. HOW CAN YOU LIMIT THE USE OF CERTAIN PERSONAL INFORMATION ABOUT YOU BY OUR AFFILIATED COMPANIES FOR MARKETING?
By following the opt-out instructions in Section 6 below, you may limit our affiliated companies from marketing their products or services to you based on personal information we disclose to them. This information may include, for example, your income and account history with us. Please note that, even if you choose to limit our affiliated companies from using personal information about you that we may share with them for marketing their products and services to you, our affiliated companies may use your personal information that they obtain from us to market to you in circumstances permitted by law, such as if the affiliated party has its own relationship with you.
22
Morgan Stanley Institutional Fund, Inc.
Annual Report — December 31, 2013
U.S. Privacy Policy (unaudited) (cont'd)
6. HOW CAN YOU SEND US AN OPT-OUT INSTRUCTION?
If you wish to limit our sharing of eligibility information about you with our affiliated companies, or our affiliated companies' use of personal information for marketing purposes, as described in this notice, you may do so by:
• Calling us at (800) 548-7786
Monday–Friday between 8a.m. and 5p.m. (EST)
• Writing to us at the following address:
Boston Financial Data Services, Inc.
c/o Privacy Coordinator
P.O. Box 219804
Kansas City, Missouri 64121
If you choose to write to us, your request should include: your name, address, telephone number and account number(s) to which the opt-out applies and whether you are opting out with respect to sharing of eligibility information (Section 4 above), or information used for marketing (Section 5 above), or both. Written opt-out requests should not be sent with any other correspondence. In order to process your request, we require that the request be provided by you directly and not through a third party. Once you have informed us about your privacy preferences, your opt-out preference will remain in effect with respect to this Policy (as it may be amended) until you notify us otherwise. If you are a joint account owner, we will accept instructions from any one of you and apply those instructions to the entire account.
Please understand that if you limit our sharing or our affiliated companies' use of personal information, you and any joint account holder(s) may not receive information about our affiliated companies' products and services, including products or services that could help you manage your financial resources and achieve your investment objectives.
If you have more than one account or relationship with us, please specify the accounts to which you would like us to apply your privacy choices. If you have accounts or relationships with our affiliates, you may receive multiple privacy policies from them, and will need to separately notify those companies of your privacy choices for those accounts or relationships.
7. WHAT IF AN AFFILIATED COMPANY BECOMES A NONAFFILIATED THIRD PARTY?
If, at any time in the future, an affiliated company becomes a nonaffiliated third party, further disclosures of personal information made to the former affiliated company will be limited to those described in Section 2(b) above relating to nonaffiliated third parties. If you elected under Section 6 to limit disclosures we make to affiliated companies, or use of personal information by affiliated companies, your election will not apply to use by any former affiliated company of your personal information in their possession once it becomes a nonaffiliated third party.
SPECIAL NOTICE TO RESIDENTS OF VERMONT
The following section supplements our Policy with respect to our individual clients who have a Vermont address and supersedes anything to the contrary in the above Policy with respect to those clients only.
The State of Vermont requires financial institutions to obtain your consent prior to sharing personal information that they collect about you with nonaffiliated third parties, or eligibility information with affiliated companies, other than in certain limited circumstances. Except as permitted by law, we will not share personal information we collect about you with nonaffiliated third parties or eligibility information with affiliated companies, unless you provide us with your written consent to share such information.
SPECIAL NOTICE TO RESIDENTS OF CALIFORNIA
The following section supplements our Policy with respect to our individual clients who have a California address and supersedes anything to the contrary in the above Policy with respect to those clients only.
In response to a California law, if your account has a California home address, your personal information will not be disclosed to nonaffiliated third parties except as permitted by applicable California law, and we will limit sharing such personal information with our affiliates to comply with California privacy laws that apply to us.
23
Morgan Stanley Institutional Fund, Inc.
Annual Report — December 31, 2013
Director and Officer Information (unaudited)
Independent Directors:
Name, Age and Address of
Independent Director | | Position(s)
Held with
Registrant | | Length of Time
Served* | | Principal Occupation(s) During Past 5 Years | | Number of
Portfolios in
Fund Complex
Overseen by
Independent
Director** | | Other Directorships
Held by Independent
Director*** | |
Frank L. Bowman (69)
c/o Kramer Levin Naftalis &
Frankel LLP
Counsel to the Independent Directors
1177 Avenue of the Americas
New York, NY 10036 | | Director | | Since
August
2006 | | President, Strategic Decisions, LLC (consulting) (since February 2009); Director or Trustee of various Morgan Stanley Funds (since August 2006); Chairperson of the Insurance Sub-Committee of the Compliance and Insurance Committee (since February 2007); served as President and Chief Executive Officer of the Nuclear Energy Institute (policy organization) (February 2005-November 2008); retired as Admiral, U.S. Navy after serving over 38 years on active duty including 8 years as Director of the Naval Nuclear Propulsion Program in the Department of the Navy and the U.S. Department of Energy (1996-2004); served as Chief of Naval Personnel (July 1994-September 1996); and on the Joint Staff as Director of Political Military Affairs (June 1992-July 1994); knighted as Honorary Knight Commander of the Most Excellent Order of the British Empire; awarded the Officier de l'Orde National du Mérite by the French Government; elected to the National Academy of Engineering (2009). | | | 98 | | | Director of BP p.l.c.; Director of Naval and Nuclear Technologies LLP; Director of the Armed Services YMCA of the USA and the U.S. Naval Submarine League; Director of the American Shipbuilding Suppliers Association; Member of the National Security Advisory Council of the Center for U.S. Global Engagement and a member of the CNA Military Advisory Board; Chairman of the Charity J Street Cup Golf; Trustee of Fairhaven United Methodist Church. | |
Michael Bozic (73)
c/o Kramer Levin Naftalis & Frankel LLP
Counsel to the Independent Directors
1177 Avenue of the Americas
New York, NY 10036 | | Director | | Since
April
1994 | | Private investor and a member of the advisory board of American Road Group LLC (retail) (since June 2000); Chairperson of the Compliance and Insurance Committee (since October 2006); Director or Trustee of various Morgan Stanley Funds (since April 1994); formerly, Chairperson of the Insurance Committee (July 2006-September 2006); Vice Chairman of Kmart Corporation (December 1998-October 2000); Chairman and Chief Executive Officer of Levitz Furniture Corporation (November 1995-November 1998) and President and Chief Executive Officer of Hills Department Stores (May 1991-July 1995); variously Chairman, Chief Executive Officer, President and Chief Operating Officer (1987-1991) of the Sears Merchandise Group of Sears, Roebuck & Co. | | | 100 | | | Trustee and member of the Hillsdale College Board of Trustees. | |
Kathleen A. Dennis (60)
c/o Kramer Levin Naftalis & Frankel LLP
Counsel to the Independent Directors
1177 Avenue of the Americas
New York, NY 10036 | | Director | | Since
August
2006 | | President, Cedarwood Associates (mutual fund and investment management consulting) (since July 2006); Chairperson of the Money Market and Alternatives Sub-Committee of the Investment Committee (since October 2006) and Director or Trustee of various Morgan Stanley Funds (since August 2006); formerly, Senior Managing Director of Victory Capital Management (1993-2006). | | | 98 | | | Director of various non-profit organizations. | |
Dr. Manuel H. Johnson (65)
c/o Johnson Smick
International, Inc.
220 I Street, NE Suite 200
Washington, D.C. 20002 | | Director | | Since
July
1991 | | Senior Partner, Johnson Smick International, Inc. (consulting firm); Chairperson of the Investment Committee (since October 2006) and Director or Trustee of various Morgan Stanley Funds (since July 1991); Co-Chairman and a founder of the Group of Seven Council (G7C) (international economic commission); formerly, Chairperson of the Audit Committee (July 1991-September 2006), Vice Chairman of the Board of Governors of the Federal Reserve System and Assistant Secretary of the U.S. Treasury. | | | 101 | | | Director of NVR, Inc. (home construction). | |
24
Morgan Stanley Institutional Fund, Inc.
Annual Report — December 31, 2013
Director and Officer Information (unaudited) (cont'd)
Independent Directors: (cont'd)
Name, Age and Address of
Independent Director | | Position(s)
Held with
Registrant | | Length of Time
Served* | | Principal Occupation(s) During Past 5 Years | | Number of
Portfolios in
Fund Complex
Overseen by
Independent
Director** | | Other Directorships
Held by Independent
Director*** | |
Joseph J. Kearns (71)
c/o Kearns & Associates LLC
PMB754
22631 Pacific Coast Highway
Malibu, CA 90265 | | Director | | Since
August
1994 | | President, Kearns & Associates LLC (investment consulting); Chairperson of the Audit Committee (since October 2006) and Director or Trustee of various Morgan Stanley Funds (since August 1994); formerly, Deputy Chairperson of the Audit Committee (July 2003-September 2006) and Chairperson of the Audit Committee of various Morgan Stanley Funds (since August 1994); CFO of the J. Paul Getty Trust. | | | 101 | | | Director of Electro Rent Corporation (equipment leasing) and The Ford Family Foundation. | |
Michael F. Klein (55)
c/o Kramer Levin Naftalis & Frankel LLP
Counsel to the Independent
Directors
1177 Avenue of the Americas
New York, NY 10036 | | Director | | Since
August
2006 | | Managing Director, Aetos Capital, LLC (since March 2000); Co-President, Aetos Alternatives Management, LLC (since January 2004) and Co-Chief Executive Officer of Aetos Capital, LLC (since August 2013); Chairperson of the Fixed Income Sub-Committee of the Investment Committee (since October 2006) and Director or Trustee of various Morgan Stanley Funds (since August 2006); formerly, Managing Director, Morgan Stanley & Co. Inc. and Morgan Stanley Dean Witter Investment Management, President, various Morgan Stanley Funds (June 1998-March 2000) and Principal, Morgan Stanley & Co. Inc. and Morgan Stanley Dean Witter Investment Management (August 1997-December 1999). | | | 98 | | | Director of certain investment funds managed or sponsored by Aetos Capital, LLC. Director of Sanitized AG and Sanitized Marketing AG (specialty chemicals). | |
Michael E. Nugent (77)
522 Fifth Avenue
New York, NY 10036 | | Chairperson of the Board and Director | | Chairperson of the Boards since July 2006 and Director since July 1991 | | Chairperson of the Boards of various Morgan Stanley Funds (since July 2006); Chairperson of the Closed-End Fund Committee (since June 2012) and Director or Trustee of various Morgan Stanley Funds (since July 1991); formerly, Chairperson of the Insurance Committee (until July 2006); General Partner, Triumph Capital, L.P. (private investment partnership) (1988-2013). | | | 100 | | | None. | |
W. Allen Reed (66)
c/o Kramer Levin Naftalis & Frankel LLP
Counsel to the Independent
Directors
1177 Avenue of the Americas
New York, NY 10036 | | Director | | Since
August
2006 | | Chairperson of the Equity Sub-Committee of the Investment Committee (since October 2006) and Director or Trustee of various Morgan Stanley Funds (since August 2006); formerly, President and CEO of General Motors Asset Management; Chairman and Chief Executive Officer of the GM Trust Bank and Corporate Vice President of General Motors Corporation (August 1994-December 2005). | | | 98 | | | Director of Temple-Inland Industries (packaging and forest products); Director of Legg Mason, Inc. and Director of the Auburn University Foundation. | |
Fergus Reid (81)
c/o Joe Pietryka, Inc.
85 Charles Colman Blvd.
Pawling, NY 12564 | | Director | | Since
June
1992 | | Chairman, Joe Pietryka, Inc.; Chairperson of the Governance Committee and Director or Trustee of various Morgan Stanley Funds (since June 1992). | | | 101 | | | Through December 31, 2012, Trustee and Director of certain Investment companies in the JPMorgan Fund Complex. | |
25
Morgan Stanley Institutional Fund, Inc.
Annual Report — December 31, 2013
Director and Officer Information (unaudited) (cont'd)
Interested Director:
Name, Age and Address of
Interested Director | | Position(s) Held
with Registrant | | Length of
Time Served* | | Principal Occupation(s) During Past 5 Years | | Number of
Portfolios in
Fund Complex
Overseen by
Interested
Director** | | Other Directorships
Held by Interested
Director*** | |
James F. Higgins (66)
One New York Plaza
New York, New York 10004 | | Director | | Since
June
2000 | | Director or Trustee of various Morgan Stanley Funds (since June 2000); Senior Advisor of Morgan Stanley (since August 2000). | | | 99 | | | Formerly, Director of AXA Financial, Inc. and AXA Equitable Life Insurance Company (2002-2011) and Director of AXA MONY Life Insurance Company and AXA MONY Life Insurance Company of America (2004-2011). | |
* Each Director serves an indefinite term, until his or her successor is elected.
** The Fund Complex includes (as of December 31, 2013) all open-end and closed-end funds (including all of their portfolios) advised by Morgan Stanley Investment Management Inc. (the "Adviser") and any funds that have an adviser that is an affiliated person of the Adviser (including, but not limited to, Morgan Stanley AIP GP LP).
*** This includes any directorships at public companies and registered investment companies held by the Director at any time during the past five years.
26
Morgan Stanley Institutional Fund, Inc.
Annual Report — December 31, 2013
Director and Officer Information (unaudited) (cont'd)
Executive Officers:
Name, Age and Address of Executive Officer | | Position(s) Held
with
Registrant | | Length of
Time Served* | | Principal Occupation(s) During Past 5 Years | |
John H. Gernon (50)
522 Fifth Avenue
New York, NY 10036 | | President and Principal Executive Officer—Equity, Fixed Income and AIP Funds | | Since September 2013 | | President and Principal Executive Officer of the Equity and Fixed Income Funds and the Morgan Stanley AIP Funds (since September 2013) in the Fund Complex. Managing Director of the Adviser. | |
Stefanie V. Chang Yu (47)
522 Fifth Avenue
New York, NY 10036 | | Chief Compliance Officer | | Since
January
2014 | | Managing Director of the Adviser and various entities affiliated with the Adviser; Chief Compliance Officer of various Morgan Stanley Funds and the Adviser (since January 2014). Formerly, Vice President of various Morgan Stanley Funds (December 1997-January 2014). | |
Joseph C. Benedetti (48)
522 Fifth Avenue
New York, NY 10036 | | Vice President | | Since
January
2014 | | Managing Director of the Adviser and various entities affiliated with the Adviser; Vice President of various Morgan Stanley Funds (since January 2014). Formerly, Assistant Secretary of various Morgan Stanley Funds (October 2004-January 2014). | |
Francis J. Smith (48)
522 Fifth Avenue
New York, NY 10036 | | Treasurer and Principal Financial Officer | | Treasurer since July 2003 and Principal Financial Officer since September 2002 | | Executive Director of the Adviser and various entities affiliated with the Adviser; Treasurer and Principal Financial Officer of various Morgan Stanley Funds (since July 2003). | |
Mary E. Mullin (46)
522 Fifth Avenue
New York, NY 10036 | | Secretary | | Since
June
1999 | | Executive Director of the Adviser and various entities affiliated with the Adviser; Secretary of various Morgan Stanley Funds (since June 1999). | |
* Each officer serves an indefinite term, until his or her successor is elected.
27
Morgan Stanley Institutional Fund, Inc.
Annual Report — December 31, 2013
Adviser and Administrator
Morgan Stanley Investment Management Inc.
522 Fifth Avenue
New York, New York 10036
Distributor
Morgan Stanley Distribution, Inc.
522 Fifth Avenue
New York, New York 10036
Dividend Disbursing and Transfer Agent
Boston Financial Data Services, Inc.
2000 Crown Colony Drive
Quincy, Massachusetts 02169
Custodian
State Street Bank and Trust Company
One Lincoln Street
Boston, Massachusetts 02111
Legal Counsel
Dechert LLP
1095 Avenue of the Americas
New York, New York 10036
Counsel to the Independent Directors
Kramer Levin Naftalis & Frankel LLP
1177 Avenue of the Americas
New York, New York 10036
Independent Registered Public Accounting Firm
Ernst & Young LLP
200 Clarendon Street
Boston, Massachusetts 02116
Reporting to Shareholders
Each Morgan Stanley fund provides a complete schedule of portfolio holdings in its semi-annual and annual reports within 60 days of the end of the fund's second and fourth fiscal quarters by filing the schedule electronically with the Securities and Exchange Commission (SEC). The semi-annual reports are filed on Form N-CSRS and the annual reports are filed on Form N-CSR. Morgan Stanley also delivers the semi-annual and annual reports to fund shareholders and makes these reports available on its public website, www.morganstanley.com/im. Each Morgan Stanley fund also files a complete schedule of portfolio holdings with the SEC for the fund's first and third fiscal quarters on Form N-Q. Morgan Stanley does not deliver the reports for the first and third fiscal quarters to shareholders, nor are the reports posted to the Morgan Stanley public website. You may, however, obtain the Form N-Q filings (as well as the Form N-CSR and N-CSRS filings) by accessing the SEC's website, www.sec.gov. You may also review and copy them at the SEC's Public Reference Room in Washington, DC. Information on the operation of the SEC's Public Reference Room may be obtained by calling the SEC toll free at 1 (800) SEC-0330. You can also request copies of these materials, upon payment of a duplicating fee, by electronic request at the SEC's email address (publicinfo@sec.gov) or by writing the Public Reference Room of the SEC, Washington, DC 20549-0102.
Proxy Voting Policies and Procedures and Proxy Voting Record
You may obtain a copy of the Fund's Proxy Voting Policy and Procedures and information regarding how the Fund voted proxies relating to portfolio securities during the most recent twelve-month period ended June 30, without charge, upon request, by calling toll free 1 (800) 548-7786 or by visiting our website at www.morganstanley.com/im. This information is also available on the SEC's website at www.sec.gov.
This report is authorized for distribution only when preceded or accompanied by a prospectus of the Morgan Stanley Institutional Fund, Inc. which describes in detail each Investment Portfolio's investment policies, risks, fees and expenses. Please read the prospectus carefully before you invest or send money. For additional information, including information regarding the investments comprising the Portfolio, please visit our website at www.morganstanley.com/im or call toll free 1 (800) 548-7786.
28
(This Page has been left blank intentionally.)
Printed in U.S.A.
This Report has been prepared for shareholders and may be distributed to others only if preceded or accompanied by a current prospectus.
Morgan Stanley Investment Management Inc.
522 Fifth Avenue
New York, New York 10036
© 2014 Morgan Stanley. Morgan Stanley Distribution, Inc.

IFITEMANN
815308 EXP 2.28.15

Morgan Stanley Institutional Fund, Inc.
Emerging Markets External Debt Portfolio
Annual Report
December 31, 2013

Morgan Stanley Institutional Fund, Inc.
Annual Report — December 31, 2013
Shareholders' Letter | | | 2 | | |
Expense Example | | | 3 | | |
Investment Overview | | | 4 | | |
Portfolio of Investments | | | 7 | | |
Statement of Assets and Liabilities | | | 10 | | |
Statement of Operations | | | 11 | | |
Statements of Changes in Net Assets | | | 12 | | |
Financial Highlights | | | 14 | | |
Notes to Financial Statements | | | 18 | | |
Report of Independent Registered Public Accounting Firm | | | 25 | | |
Federal Tax Notice | | | 26 | | |
U.S. Privacy Policy | | | 27 | | |
Director and Officer Information | | | 30 | | |
This report is authorized for distribution only when preceded or accompanied by prospectuses of the Morgan Stanley Institutional Fund, Inc. To receive a prospectus and/or statement of additional information (SAI), which contains more complete information such as investment objectives, charges, expenses, policies for voting proxies, risk considerations, and describes in detail each of the Portfolio's investment policies to the prospective investor, please call toll free 1 (800) 548-7786. Please read the prospectuses carefully before you invest or send money.
Additionally, you can access portfolio information including performance, characteristics, and investment team commentary through Morgan Stanley Investment Management's website: www.morganstanley.com/im.
Market forecasts provided in this report may not necessarily come to pass. There is no guarantee that any sectors mentioned will continue to perform as discussed herein or that securities in such sectors will be held by the Portfolio in the future. There is no assurance that a Portfolio will achieve its investment objective. Portfolios are subject to market risk, which is the possibility that market values of securities owned by the Portfolio will decline and, therefore, the value of the Portfolio's shares may be less than what you paid for them. Accordingly, you can lose money investing in the Portfolio. Please see the prospectus for more complete information on investment risks.
1
Morgan Stanley Institutional Fund, Inc.
Annual Report — December 31, 2013
Shareholders' Letter (unaudited)
Dear Shareholders,
We are pleased to provide this Annual report, in which you will learn how your investment in Emerging Markets External Debt Portfolio (the "Portfolio") performed during the latest twelve-month period.
Morgan Stanley Investment Management is a client-centric, investor-led organization. Our global presence, intellectual capital, and breadth of products and services enable us to partner with investors to meet the evolving challenges of today's financial markets. We aim to deliver superior investment service and to empower our clients to make the informed decisions that help them reach their investment goals.
As always, we thank you for selecting Morgan Stanley Investment Management, and look forward to working with you in the months and years ahead.
Sincerely,

John H. Gernon
President and Principal Executive Officer
January 2014
2
Morgan Stanley Institutional Fund, Inc.
Annual Report — December 31, 2013
Expense Example (unaudited)
Emerging Markets External Debt Portfolio
As a shareholder of the Portfolio, you incur two types of costs: (1) transactional costs, including redemptions fees; and (2) ongoing costs, including advisory fees, administration fees, distribution and shareholder services fees and other Portfolio expenses. This example is intended to help you understand your ongoing costs (in dollars) of investing in the Portfolio and to compare these costs with the ongoing costs of investing in other mutual funds.
This example is based on an investment of $1,000 invested at the beginning of the six-month period ended December 31, 2013 and held for the entire six-month period.
Actual Expenses
The table below provides information about actual account values and actual expenses. You may use the information in this table, together with the amount you invested, to estimate the expenses that you paid over the period. Simply divide your account value by $1,000 (for example, an $8,600 account value divided by $1,000 = 8.6), then multiply the result by the number in the table under the heading entitled "Actual Expenses Paid During Period" to estimate the expenses you paid on your account during this period.
Hypothetical Example for Comparison Purposes
The table below provides information about hypothetical account values and hypothetical expenses based on the Portfolio's actual expense ratio and an assumed rate of return of 5% per year before expenses, which is not the Portfolio's actual return. The hypothetical account values and expenses may not be used to estimate the actual ending account balance or expenses you paid for the period. You may use this information to compare the ongoing costs of investing in the Portfolio and other funds. To do so, compare this 5% hypothetical example with the 5% hypothetical examples that appear in the shareholder reports of the other funds.
Please note that the expenses shown in the table are meant to highlight your ongoing costs only and do not reflect any transactional costs, such as sales charges (loads) and redemption fees. Therefore, the information for each class in the table is useful in comparing ongoing costs only, and will not help you determine the relative total costs of owning different funds. In addition, if these transactional costs were included, your costs would have been higher.
| | | Beginning
Account
Value
7/1/13 | | Actual Ending
Account
Value
12/31/13 | | Hypothetical
Ending Account
Value | | Actual
Expenses
Paid
During
Period | | Hypothetical
Expenses Paid
During Period | | Net
Expense
Ratio
During
Period*** | |
Emerging Markets External Debt Portfolio Class I | | $ | 1,000.00 | | | $ | 1,005.20 | | | $ | 1,021.02 | | | $ | 4.19 | * | | $ | 4.23 | * | | | 0.83 | % | |
Emerging Markets External Debt Portfolio Class A@ | | | 1,000.00 | | | | 1,003.90 | | | | 1,019.36 | | | | 5.86 | * | | | 5.90 | * | | | 1.16 | | |
Emerging Markets External Debt Portfolio Class L | | | 1,000.00 | | | | 1,001.90 | | | | 1,018.15 | | | | 7.06 | * | | | 7.12 | * | | | 1.40 | | |
Emerging Markets External Debt Portfolio Class IS | | | 1,000.00 | | | | 1,019.20 | | | | 1,012.28 | | | | 2.40 | ** | | | 2.39 | ** | | | 0.81 | | |
* Expenses are calculated using each Portfolio Class' annualized net expense ratio (as disclosed), multiplied by the average account value over the period, and multiplied by 184/365 (to reflect the most recent one-half year period).
** Expenses are calculated using the Portfolio Class' annualized net expense ratio (as disclosed), multiplied by the average account value over the period, and multiplied by 107/365 (to reflect the actual days in the period).
*** Annualized.
@ Effective September 9, 2013, Class P and Class H shares were renamed Class A shares.
3
Morgan Stanley Institutional Fund, Inc.
Annual Report — December 31, 2013
Investment Overview (unaudited)
Emerging Markets External Debt Portfolio
The Emerging Markets External Debt Portfolio seeks high total return.
Performance
For the year ended December 31, 2013, the Portfolio had a total return based on net asset value and reinvestment of distributions per share of -8.79%, net of fees, for Class I shares. The Portfolio's Class I shares underperformed against its benchmark, the J.P. Morgan Emerging Markets Bond Global Index (the "Index"), which returned -6.58%.
Factors Affecting Performance
• Emerging markets (EM) came under significant pressure during the year, as external debt spreads widened, domestic debt yields rose and EM currencies weakened versus the U.S. dollar. During the period, the U.S. Treasury 10-year yield rose by 127 basis points to 3.03% (as per Bloomberg data), due to positive U.S. economic data releases, the Federal Reserve's (Fed) optimistic growth outlook and signs of an improving labor market. This led to a widespread perception among investors that the Fed would begin "tapering" quantitative easing (QE) sooner than previously expected. This expectation was validated by the Federal Open Market Committee (FOMC) in December, as they announced their intention to reduce the size of asset purchases starting in January.
• The generalized weakness in EM debt accrued mainly from positioning rather than a shift in fundamentals. Starting in late May, sustained outflows from the asset class weighed on prices and investor sentiment. For the last few years, investors had been increasing their exposure to EM debt due to the relatively higher economic growth rates of emerging markets versus developed markets, the strong balance sheets in emerging markets and the additional yield offered versus traditional "safe haven" assets. These attributes may have also attracted investors who are tactical in nature and wanted to participate in the "carry trade," a strategy that borrows in a lower yielding currency to invest in potentially higher yielding assets. For investors of this nature, a change in the pace of Fed accommodation was sufficient reason to reduce their exposure to emerging markets.
• In addition to events in the developed world, concerns over China's declining growth rates
weighed on countries that export to China, such as Chile, Indonesia and Brazil.
• Furthermore, idiosyncratic developments in countries such as Turkey, South Africa, Egypt, Ukraine and Brazil exacerbated the more complex global environment for emerging markets. In the case of Turkey, protests that began in late May stabilized during June, but damaged investor perception of the country, its institutions and the outlook for European Union (EU) membership. Also, in December an anti-corruption investigation targeting high-profile figures connected to Prime Minister Recep Tayyip Erdogan's government and a CEO of a state-run bank caused weakness in Turkish debt and currency. In addition, geopolitical tensions across the Middle East remained elevated throughout the year. In Brazil, demonstrations against bus fare hikes spread throughout the country, with protestors complaining about poor-quality services, rising inflation, and the excessive cost of the 2014 World Cup and the 2016 Olympics. In response, the Brazilian government cancelled the fare hikes and proposed a political reform. However, continued fiscal deterioration, persistent inflation and an increasing current account deficit led investors to believe that Brazil may soon be downgraded by the rating agencies. In South Africa, Fitch cut the country's foreign currency long-term rating to BBB from BBB+, citing weaker economic growth prospects with weaker mining production weighing on economic activity. In Ukraine, the government's refusal to sign an association agreement with the EU prompted street protests by opposition parties, which demanded the resignation of President Viktor Yanukovych and his cabinet, and called for early presidential and parliamentary elections. Lastly, demonstrators in Thailand demanded Prime Minister Yingluck Shinawatra's resignation.
• However, there were positive developments in 2013 as well. Moody's upgraded the Philippines from Ba1 to Baa3 with a positive outlook on the back of robust economic performance, ongoing fiscal and debt consolidation, political stability and improved governance. In addition, an incipient growth recovery in the euro area boosted the growth outlook and improved the current account balances of Eastern European countries such as Poland, Hungary and the Czech Republic. Finally, in
4
Morgan Stanley Institutional Fund, Inc.
Annual Report — December 31, 2013
Investment Overview (unaudited) (cont'd)
Emerging Markets External Debt Portfolio
December, Mexico passed a landmark energy reform, allowing private investment in the energy sector, which could lead to higher growth and increased foreign direct investment. The passage of this legislation combined with improvements in the fiscal framework prompted S&P to raise Mexico's sovereign rating to BBB+.
• Overweights to Ukraine and Russia for much of the year detracted from Portfolio returns for the full year. Exposure to local markets in Turkey, Colombia, Peru and Russia in the first half of the year also hurt relative returns for the overall period. In addition, an underweight to Argentina and Lebanon detracted from relative returns. Both countries' bonds performed well despite deteriorating macro-economic and political conditions. In Argentina, an opposition victory in a midterm election last October raised investors' hopes of a more market-friendly approach to economic policy in the future, whereas Lebanon spreads rallied on the back of financial aid from Saudi Arabia.
• Conversely, the Portfolio benefited from maintaining an interest rate duration lower than the Index, which was managed with short positions in U.S. Treasury futures, and overweight exposure to Mexico. In addition, an off-Index position in Slovenia and an underweight to Panama and Uruguay aided returns. Lastly, an overweight to quasi-sovereign bonds in Indonesia and selected corporate bonds in Mexico and Brazil also contributed to relative returns.
Management Strategies
• We continue to see a divergence in monetary policy between the U.S. and the rest of the developed world for the time being. We expect the Fed to gradually continue reducing the pace of monetary stimulus, amid an environment of improved in growth and contained inflation pressures. Nonetheless, the Fed's dovish bias (or preference for low interest rates) will probably remain under the new forward guidance policy (that is, using communications to manage the market's expectations) and the expected leadership of Janet Yellen. On the other hand, in the eurozone and Japan, where the economic recovery remains fragile and inflation pressures are very subdued, we expect highly accommodative monetary conditions to remain for the near term.
• In contrast with past episodes, we do not believe that an expected recovery in developed market economies will necessarily translate into a broad-based positive impact on EM asset prices. On the contrary, we expect differentiation between EM countries to deepen — those countries with current account deficits and low exposure to developed markets, overheating domestic demand and poor institutional frameworks are likely to diverge from those with contained macro imbalances and/or undergoing structural reforms. While EM demand-side stimulus may have been warranted in the wake of the 2008 global financial crisis, several countries have been unwilling or unable to reverse fiscal stimulus. Unfortunately, this situation is likely to persist in 2014. This is because within the group of countries exhibiting the largest imbalances (Brazil, South Africa, Turkey, India and Indonesia) most will hold general or local elections in 2014. Moreover, a further sell-off in developed market interest rates could exert added pressure to EM rates and currencies in 2014. In the presence of such external shocks, EM central banks are likely to allow their currencies to weaken as the main channel of adjustment. Such an environment calls for a selective investment approach coupled with active duration management.
* Minimum Investment for Class I shares
** Commenced Operations on May 24, 2012.
In accordance with SEC regulations, Portfolio's performance shown assumes that all recurring fees (including management fees) were deducted and all dividends and distributions were reinvested. The performance of Class A+, L and IS shares will vary from Class I shares and will be negatively impacted by additional fees assessed to those classes (if applicable).
5
Morgan Stanley Institutional Fund, Inc.
Annual Report — December 31, 2013
Investment Overview (unaudited) (cont'd)
Emerging Markets External Debt Portfolio
Performance Compared to the J.P. Morgan Emerging Markets Bond Global Index(1) and the Lipper Emerging Markets Hard Currency Debt Funds Index(2)
| | | Period Ended December 31, 2013
Total Returns(3) | |
| | | | | Average Annual | |
| | | One
Year | | Five
Years | | Ten
Years | | Since
Inception(6) | |
Portfolio — Class I Shares
w/o sales charges(4) | | | -8.79 | % | | | — | | | | — | | | | 2.92 | % | |
J.P. Morgan Emerging Markets
Bond Global Index | | | -6.58 | | | | — | | | | — | | | | 4.00 | | |
Lipper Emerging Markets
Hard Currency Debt Funds Index | | | -5.26 | | | | — | | | | — | | | | 4.92 | | |
Portfolio — Class A+ Shares
w/o sales charges(4) | | | -9.05 | | | | — | | | | — | | | | 2.64 | | |
Portfolio — Class A+ Shares with
maximum 4.25% sales charges(4) | | | -12.90 | | | | — | | | | — | | | | -0.07 | | |
J.P. Morgan Emerging Markets
Bond Global Index | | | -6.58 | | | | — | | | | — | | | | 4.00 | | |
Lipper Emerging Markets
Hard Currency Debt Funds Index | | | -5.26 | | | | — | | | | — | | | | 4.92 | | |
Portfolio — Class L Shares
w/o sales charges(4) | | | -9.41 | | | | — | | | | — | | | | 2.21 | | |
J.P. Morgan Emerging Markets
Bond Global Index | | | -6.58 | | | | — | | | | — | | | | 4.00 | | |
Lipper Emerging Markets
Hard Currency Debt Funds Index | | | -5.26 | | | | — | | | | — | | | | 4.92 | | |
Portfolio — Class IS Shares
w/o sales charges(5) | | | — | | | | — | | | | — | | | | 1.92 | | |
J.P. Morgan Emerging Markets
Bond Global Index | | | — | | | | — | | | | — | | | | 2.66 | | |
Lipper Emerging Markets
Hard Currency Debt Funds Index | | | — | | | | — | | | | — | | | | 2.82 | | |
Performance data quoted represents past performance, which is no guarantee of future results, and current performance may be lower or higher than the figures shown. Performance assumes that all dividends and distributions, if any, were reinvested. For the most recent month-end performance figures, please visit www.morganstanley.com/im. Investment return and principal value will fluctuate so that Portfolio shares, when redeemed, may be worth more or less than their original cost. Total returns do not reflect the deduction of taxes that a shareholder would pay on Portfolio distributions or the redemption of Portfolio shares. Returns for periods less than one year are not annualized. Performance of share classes will vary due to difference in expenses.
+ Effective September 9, 2013, Class P shares were renamed Class A shares.
(1) The J.P. Morgan Emerging Markets Bond Global ("EMBG") Index tracks total returns for U.S. dollar-denominated debt instruments issued by emerging markets sovereign and quasi-sovereign entities: Brady Bonds, loans, Eurobonds and local market instruments for over 30 emerging market countries. The Index is unmanaged and its returns do not include any sales charges or fees. Such costs would lower performance. It is not possible to invest directly in an index.
(2) The Lipper Emerging Markets Hard Currency Debt Funds Index is an equally weighted performance index of the largest qualifying funds (based on net assets) in the Lipper Emerging Markets Hard Currency Debt Funds classification. The Index, which is adjusted for capital gains distributions and income dividends, is
unmanaged and should not be considered an investment. There are currently 30 funds represented in this Index. As of the date of this report, the Portfolio is in the Lipper Emerging Markets Hard Currency Debt Funds classification.
(3) Total returns for the Portfolio reflect fees waived and expenses reimbursed, if applicable, by the Adviser. Without such waivers and reimbursements, total returns would have been lower. The fee waivers and/or expense reimbursements will continue for at least one year or until such time as the Fund's Board of Directors acts to discontinue all or a portion of such waivers and/or expense reimbursements when it deems that such action is appropriate.
(4) Commenced operations on May 24, 2012.
(5) Commenced offering on September 13, 2013.
(6) For comparative purposes, average annual since inception returns listed for the Indexes refer to the inception date or initial offering of the respective share class of the Portfolio, not the inception of the Index. Returns for periods less than one year are not annualized.
Portfolio Composition
Classification | | Percentage of
Total Investments | |
Sovereign | | | 79.5 | % | |
Corporate Bonds | | | 12.7 | | |
Short-Term Investments | | | 7.8 | | |
Total Investments | | | 100.0 | %** | |
** Does not include open long/short futures contracts with an underlying face amount of approximately $492,000 and total unrealized appreciation of approximately $9,000.
6
Morgan Stanley Institutional Fund, Inc.
Annual Report — December 31, 2013
Portfolio of Investments
Emerging Markets External Debt Portfolio
| | | Face
Amount
(000) | | Value
(000) | |
Fixed Income Securities (90.4%) | |
Brazil (7.3%) | |
Corporate Bonds (5.0%) | |
Banco Safra SA,
6.75%, 1/27/21 | | $ | 200 | | | $ | 211 | | |
ESAL GmbH,
6.25%, 2/5/23 | | | 200 | | | | 181 | | |
Odebrecht Finance Ltd.,
5.13%, 6/26/22 | | | 400 | | | | 392 | | |
Odebrecht Offshore Drilling Finance Ltd.,
6.75%, 10/1/22 (a) | | | 197 | | | | 202 | | |
| | | | 986 | | |
Sovereign (2.3%) | |
Brazil Minas SPE via State of Minas Gerais,
5.33%, 2/15/28 (a) | | | 350 | | | | 327 | | |
Caixa Economica Federal,
3.50%, 11/7/22 (a) | | | 150 | | | | 122 | | |
| | | | 449 | | |
| | | | 1,435 | | |
China (2.8%) | |
Sovereign (2.8%) | |
Sinopec Group Overseas
Development 2013 Ltd.,
4.38%, 10/17/23 | | | 560 | | | | 553 | | |
Colombia (2.8%) | |
Corporate Bonds (1.1%) | |
Ecopetrol SA,
5.88%, 9/18/23 | | | 60 | | | | 63 | | |
Pacific Rubiales Energy Corp.,
5.38%, 1/26/19 (a) | | | 150 | | | | 152 | | |
| | | | 215 | | |
Sovereign (1.7%) | |
Colombia Government International Bond,
11.75%, 2/25/20 | | | 240 | | | | 346 | | |
| | | | 561 | | |
Croatia (1.4%) | |
Sovereign (1.4%) | |
Croatia Government International Bond,
6.00%, 1/26/24 (a) | | | 280 | | | | 279 | | |
Hungary (2.3%) | |
Sovereign (2.3%) | |
Hungary Government International Bond,
5.75%, 11/22/23 | | | 330 | | | | 333 | | |
6.38%, 3/29/21 | | | 108 | | | | 117 | | |
| | | | 450 | | |
Indonesia (7.1%) | |
Sovereign (7.1%) | |
Indonesia Government International Bond,
7.75%, 1/17/38 | | | 148 | | | | 168 | | |
Majapahit Holding BV,
7.75%, 1/20/20 | | | 589 | | | | 649 | | |
| | | Face
Amount
(000) | | Value
(000) | |
Pertamina Persero PT,
5.25%, 5/23/21 | | $ | 200 | | | $ | 194 | | |
Perusahaan Listrik Negara PT,
5.50%, 11/22/21 | | | 400 | | | | 387 | | |
| | | | 1,398 | | |
Ivory Coast (0.7%) | |
Sovereign (0.7%) | |
Ivory Coast Government International Bond,
5.75%, 12/31/32 | | | 145 | | | | 130 | | |
Kazakhstan (5.5%) | |
Sovereign (5.5%) | |
Development Bank of Kazakhstan JSC,
4.13%, 12/10/22 (a) | | | 200 | | | | 180 | | |
KazAgro National Management Holding JSC,
4.63%, 5/24/23 (a) | | | 200 | | | | 184 | | |
KazMunayGas National Co., JSC,
5.75%, 4/30/43 (a) | | | 210 | | | | 182 | | |
6.38%, 4/9/21 | | | 375 | | | | 409 | | |
9.13%, 7/2/18 | | | 100 | | | | 121 | | |
| | | | 1,076 | | |
Lithuania (1.4%) | |
Sovereign (1.4%) | |
Lithuania Government International Bond,
6.63%, 2/1/22 | | | 240 | | | | 281 | | |
Mexico (16.3%) | |
Corporate Bonds (5.3%) | |
Cemex SAB de CV,
6.50%, 12/10/19 (a) | | | 200 | | | | 207 | | |
7.25%, 1/15/21 (a) | | | 200 | | | | 207 | | |
9.50%, 6/15/18 | | | 200 | | | | 228 | | |
Mexichem SAB de CV,
4.88%, 9/19/22 | | | 200 | | | | 197 | | |
Tenedora Nemak SA de CV,
5.50%, 2/28/23 | | | 200 | | | | 197 | | |
| | | | 1,036 | | |
Sovereign (11.0%) | |
Mexican Bonos,
7.50%, 6/3/27 | | MXN | 4,800 | | | | 393 | | |
Mexico Government International Bond,
3.63%, 3/15/22 | | $ | 300 | | | | 301 | | |
6.05%, 1/11/40 | | | 306 | | | | 334 | | |
Pemex Project Funding Master Trust,
6.63%, 6/15/35 | | | 230 | | | | 243 | | |
Petroleos Mexicanos,
3.50%, 1/30/23 | | | 30 | | | | 28 | | |
4.88%, 1/24/22 | | | 843 | | | | 868 | | |
| | | | 2,167 | | |
| | | | 3,203 | | |
Panama (1.1%) | |
Sovereign (1.1%) | |
Panama Government International Bond,
5.20%, 1/30/20 | | | 204 | | | | 223 | | |
The accompanying notes are an integral part of the financial statements.
7
Morgan Stanley Institutional Fund, Inc.
Annual Report — December 31, 2013
Portfolio of Investments (cont'd)
Emerging Markets External Debt Portfolio
| | | Face
Amount
(000) | | Value
(000) | |
Peru (1.8%) | |
Corporate Bonds (1.1%) | |
Banco de Credito del Peru,
6.13%, 4/24/27 (a)(b) | | $ | 120 | | | $ | 120 | | |
Corp. Azucarera del Peru SA,
6.38%, 8/2/22 (a) | | | 100 | | | | 90 | | |
| | | | 210 | | |
Sovereign (0.7%) | |
Peruvian Government International Bond,
7.35%, 7/21/25 | | | 107 | | | | 135 | | |
| | | | 345 | | |
Philippines (4.7%) | |
Sovereign (4.7%) | |
Philippine Government International Bond,
4.00%, 1/15/21 | | | 615 | | | | 640 | | |
9.50%, 2/2/30 | | | 193 | | | | 289 | | |
| | | | 929 | | |
Poland (2.5%) | |
Sovereign (2.5%) | |
Poland Government International Bond,
3.00%, 3/17/23 | | | 530 | | | | 484 | | |
Romania (0.7%) | |
Sovereign (0.7%) | |
Romanian Government International Bond,
4.38%, 8/22/23 (a) | | | 76 | | | | 74 | | |
6.75%, 2/7/22 | | | 50 | | | | 57 | | |
| | | | 131 | | |
Russia (12.6%) | |
Sovereign (12.6%) | |
Russian Agricultural Bank OJSC
Via RSHB Capital SA,
7.75%, 5/29/18 | | | 244 | | | | 275 | | |
Russian Foreign Bond — Eurobond,
7.50%, 3/31/30 | | | 929 | | | | 1,085 | | |
Russian Railways via RZD Capital PLC,
5.70%, 4/5/22 | | | 200 | | | | 204 | | |
Vnesheconombank Via VEB Finance PLC,
5.94%, 11/21/23 (a) | | | 610 | | | | 612 | | |
6.90%, 7/9/20 | | | 273 | | | | 302 | | |
| | | | 2,478 | | |
Serbia (1.2%) | |
Sovereign (1.2%) | |
Republic of Serbia,
4.88%, 2/25/20 | | | 260 | | | | 246 | | |
Slovenia (1.0%) | |
Sovereign (1.0%) | |
Slovenia Government International Bond,
5.85%, 5/10/23 (a) | | | 200 | | | | 204 | | |
| | | Face
Amount
(000) | | Value
(000) | |
Turkey (5.4%) | |
Sovereign (5.4%) | |
Export Credit Bank of Turkey,
5.88%, 4/24/19 (a) | | $ | 200 | | | $ | 203 | | |
Turkey Government International Bond,
3.25%, 3/23/23 | | | 200 | | | | 166 | | |
5.63%, 3/30/21 | | | 700 | | | | 706 | | |
| | | | 1,075 | | |
Ukraine (0.9%) | |
Sovereign (0.9%) | |
Ukraine Government International Bond,
7.80%, 11/28/22 | | | 200 | | | | 182 | | |
Uruguay (0.7%) | |
Sovereign (0.7%) | |
Uruguay Government International Bond,
4.50%, 8/14/24 | | | 138 | | | | 138 | | |
Venezuela (10.2%) | |
Sovereign (10.2%) | |
Petroleos de Venezuela SA,
8.50%, 11/2/17 | | | 1,153 | | | | 963 | | |
12.75%, 2/17/22 | | | 370 | | | | 339 | | |
Venezuela Government International Bond,
9.00%, 5/7/23 | | | 50 | | | | 37 | | |
9.25%, 9/15/27 - 5/7/28 | | | 538 | | | | 417 | | |
11.75%, 10/21/26 | | | 290 | | | | 249 | | |
| | | | 2,005 | | |
Total Fixed Income Securities (Cost $18,573) | | | 17,806 | | |
| | | Shares | | | |
Short-Term Investment (7.6%) | |
Investment Company (7.6%) | |
Morgan Stanley Institutional Liquidity
Funds — Money Market Portfolio —
Institutional Class (See Note G)
(Cost $1,497) | | | 1,496,798 | | | | 1,497 | | |
Total Investments (98.0%) (Cost $20,070) (c) | | | 19,303 | | |
Other Assets in Excess of Liabilities (2.0%) | | | 403 | | |
Net Assets (100.0%) | | $ | 19,706 | | |
(a) 144A security — Certain conditions for public sale may exist. Unless otherwise noted, these securities are deemed to be liquid.
(b) Variable/Floating Rate Security — Interest rate changes on these instruments are based on changes in a designated base rate. The rates shown are those in effect on December 31, 2013.
(c) Securities are available for collateral in connection with an open futures contract.
OJSC Open Joint Stock Company.
MXN — Mexican Peso
The accompanying notes are an integral part of the financial statements.
8
Morgan Stanley Institutional Fund, Inc.
Annual Report — December 31, 2013
Portfolio of Investments (cont'd)
Emerging Markets External Debt Portfolio
Futures Contracts:
The Portfolio had the following futures contracts open at December 31, 2013:
| | | Number
of
Contracts | | Value
(000) | | Expiration
Date | | Unrealized
Appreciation
(000) | |
Short: | |
U.S. Treasury 10 yr. Note | | | 4 | | | $ | (492 | ) | | Mar-14 | | $ | 9 | | |
The accompanying notes are an integral part of the financial statements.
9
Morgan Stanley Institutional Fund, Inc.
Annual Report — December 31, 2013
Emerging Markets External Debt Portfolio
Statement of Assets and Liabilities | | December 31, 2013
(000) | |
Assets: | |
Investments in Securities of Unaffiliated Issuers, at Value (Cost $18,573) | | $ | 17,806 | | |
Investment in Security of Affiliated Issuer, at Value (Cost $1,497) | | | 1,497 | | |
Total Investments in Securities, at Value (Cost $20,070) | | | 19,303 | | |
Cash | | | 4 | | |
Interest Receivable | | | 288 | | |
Receivable for Investments Sold | | | 51 | | |
Due from Adviser | | | 48 | | |
Receivable for Variation Margin on Futures Contracts | | | 27 | | |
Receivable from Affiliate | | | — | @ | |
Other Assets | | | 2 | | |
Total Assets | | | 19,723 | | |
Liabilities: | |
Payable for Professional Fees | | | 7 | | |
Payable for Custodian Fees | | | 2 | | |
Payable for Administration Fees | | | 1 | | |
Payable for Transfer Agent Fees — Class I | | | — | @ | |
Payable for Transfer Agent Fees — Class A* | | | — | @ | |
Payable for Transfer Agent Fees — Class L | | | — | @ | |
Payable for Transfer Agent Fees — Class IS | | | — | @ | |
Payable for Sub Transfer Agency Fees — Class A* | | | — | @ | |
Payable for Shareholder Services Fees — Class A* | | | — | @ | |
Payable for Distribution and Shareholder Services Fees — Class L | | | — | @ | |
Other Liabilities | | | 7 | | |
Total Liabilities | | | 17 | | |
Net Assets | | $ | 19,706 | | |
Net Assets Consist Of: | |
Paid-in-Capital | | $ | 21,072 | | |
Distributions in Excess of Net Investment Income | | | (2 | ) | |
Accumulated Net Realized Loss | | | (606 | ) | |
Unrealized Appreciation (Depreciation) on: | |
Investments | | | (767 | ) | |
Futures Contracts | | | 9 | | |
Foreign Currency Translations | | | (— | @) | |
Net Assets | | $ | 19,706 | | |
CLASS I: | |
Net Assets | | $ | 19,400 | | |
| Shares Outstanding $0.001 par value shares of beneficial interest (500,000,000 shares authorized) (not in 000's) | | | 2,064,850 | | |
Net Asset Value, Offering and Redemption Price Per Share | | $ | 9.40 | | |
CLASS A*: | |
Net Assets | | $ | 196 | | |
| Shares Outstanding $0.001 par value shares of beneficial interest (500,000,000 shares authorized) (not in 000's) | | | 20,890 | | |
Net Asset Value, Redemption Price Per Share | | $ | 9.40 | | |
Maximum Sales Load§§ | | | 4.25 | % | |
Maximum Sales Charge | | $ | 0.42 | | |
Maximum Offering Price Per Share | | $ | 9.82 | | |
CLASS L: | |
Net Assets | | $ | 100 | | |
| Shares Outstanding $0.001 par value shares of beneficial interest (500,000,000 shares authorized) (not in 000's) | | | 10,660 | | |
Net Asset Value, Offering and Redemption Price Per Share | | $ | 9.39 | | |
CLASS IS: | |
Net Assets | | $ | 10 | | |
| Shares Outstanding $0.001 par value shares of beneficial interest (500,000,000 shares authorized) (not in 000's) | | | 1,036 | | |
Net Asset Value, Offering and Redemption Price Per Share | | $ | 9.40 | | |
@ Amount is less than $500.
* Effective September 9, 2013, Class P and Class H shares were renamed Class A shares.
§§ Effective February 25, 2013, the Directors approved the imposition of a maximum initial sales charge of 4.25% on purchases of Class A shares of the Portfolio.
The accompanying notes are an integral part of the financial statements.
10
Morgan Stanley Institutional Fund, Inc.
Annual Report — December 31, 2013
Emerging Markets External Debt Portfolio
Statement of Operations | | Year Ended
December 31, 2013
(000) | |
Investment Income: | |
Interest from Securities of Unaffiliated Issuers (Net of $—@ Foreign Taxes Withheld) | | $ | 1,298 | | |
Dividends from Security of Affiliated Issuer (Note G) | | | 1 | | |
Total Investment Income | | | 1,299 | | |
Expenses: | |
Advisory Fees (Note B) | | | 163 | | |
Professional Fees | | | 115 | | |
Registration Fees | | | 62 | | |
Offering Costs | | | 31 | | |
Shareholder Reporting Fees | | | 26 | | |
Administration Fees (Note C) | | | 17 | | |
Custodian Fees (Note F) | | | 11 | | |
Pricing Fees | | | 11 | | |
Transfer Agency Fees (Note E) | | | 8 | | |
Directors' Fees and Expenses | | | 1 | | |
Transfer Agency Fees — Class I (Note E) | | | — | @ | |
Transfer Agency Fees — Class A* (Note E) | | | — | @ | |
Transfer Agency Fees — Class L (Note E) | | | — | @ | |
Transfer Agency Fees — Class IS (Note E) | | | — | @ | |
Shareholder Services Fees — Class A* (Note D) | | | 1 | | |
Distribution and Shareholder Services Fees — Class L (Note D) | | | 1 | | |
Sub Transfer Agency Fees — Class A* | | | — | @ | |
Other Expenses | | | 20 | | |
Total Expenses | | | 467 | | |
Waiver of Advisory Fees (Note B) | | | (163 | ) | |
Expenses Reimbursed by Adviser (Note B) | | | (119 | ) | |
Rebate from Morgan Stanley Affiliate (Note G) | | | (1 | ) | |
Reimbursement of Class Specific Expenses — Class A* (Note B) | | | (— | @) | |
Reimbursement of Class Specific Expenses — Class L (Note B) | | | (— | @) | |
Reimbursement of Class Specific Expenses — Class IS (Note B) | | | (— | @) | |
Net Expenses | | | 184 | | |
Net Investment Income | | | 1,115 | | |
Realized Gain (Loss): | |
Investments Sold | | | (380 | ) | |
Foreign Currency Forward Exchange Contracts | | | 4 | | |
Foreign Currency Transactions | | | — | @ | |
Futures Contracts | | | 62 | | |
Net Realized Loss | | | (314 | ) | |
Change in Unrealized Appreciation (Depreciation): | |
Investments | | | (2,875 | ) | |
Foreign Currency Forward Exchange Contracts | | | (4 | ) | |
Foreign Currency Translations | | | (1 | ) | |
Futures Contracts | | | 9 | | |
Net Change in Unrealized Appreciation (Depreciation) | | | (2,871 | ) | |
Net Realized Loss and Change in Unrealized Appreciation (Depreciation) | | | (3,185 | ) | |
Net Decrease in Net Assets Resulting from Operations | | $ | (2,070 | ) | |
@ Amount is less than $500.
* Effective September 9, 2013, Class P and Class H shares were renamed Class A shares.
The accompanying notes are an integral part of the financial statements.
11
Morgan Stanley Institutional Fund, Inc.
Annual Report — December 31, 2013
Emerging Markets External Debt Portfolio
Statements of Changes in Net Assets | | Year Ended
December 31,
2013
(000) | | Period from
May 24, 2012^ to
December 31, 2012
(000) | |
Increase (Decrease) in Net Assets: | |
Operations: | |
Net Investment Income | | $ | 1,115 | | | $ | 621 | | |
Net Realized Gain (Loss) | | | (314 | ) | | | 297 | | |
Net Change in Unrealized Appreciation (Depreciation) | | | (2,871 | ) | | | 2,113 | | |
Net Increase (Decrease) in Net Assets Resulting from Operations | | | (2,070 | ) | | | 3,031 | | |
Distributions from and/or in Excess of: | |
Class I: | |
Net Investment Income | | | (1,072 | ) | | | (607 | ) | |
Net Realized Gain | | | (471 | ) | | | (141 | ) | |
Class A*: | |
Net Investment Income | | | (8 | ) | | | (3 | ) | |
Net Realized Gain | | | (4 | ) | | | (1 | ) | |
Class H@@@: | |
Net Investment Income | | | (5 | )** | | | (3 | ) | |
Net Realized Gain | | | (1 | )** | | | (1 | ) | |
Class L: | |
Net Investment Income | | | (5 | ) | | | (2 | ) | |
Net Realized Gain | | | (2 | ) | | | (1 | ) | |
Class IS: | |
Net Investment Income | | | (— | @)*** | | | — | | |
Net Realized Gain | | | (— | @)*** | | | — | | |
Total Distributions | | | (1,568 | ) | | | (759 | ) | |
Capital Share Transactions:(1) | |
Class I: | |
Subscribed | | | 1,038 | | | | 20,528 | | |
Distributions Reinvested | | | 79 | | | | 24 | | |
Redeemed | | | (754 | ) | | | (194 | ) | |
Class A*: | |
Subscribed | | | — | | | | 100 | | |
Distributions Reinvested | | | — | @ | | | — | | |
Conversion from Class H | | | 104 | | | | — | | |
Redeemed | | | (— | @) | | | — | | |
Class H@@@: | |
Subscribed | | | 250 | ** | | | 110 | | |
Distributions Reinvested | | | 3 | ** | | | — | @ | |
Conversion to Class A | | | (104 | )** | | | — | | |
Redeemed | | | (229 | )** | | | (— | @) | |
Class L: | |
Subscribed | | | 7 | | | | 100 | | |
Distributions Reinvested | | | — | @ | | | — | | |
Class IS: | |
Subscribed | | | 10 | *** | | | — | | |
Net Increase in Net Assets Resulting from Capital Share Transactions | | | 404 | | | | 20,668 | | |
Redemption Fees | | | — | @ | | | — | | |
Total Increase (Decrease) in Net Assets | | | (3,234 | ) | | | 22,940 | | |
Net Assets: | |
Beginning of Period | | | 22,940 | | | | — | | |
End of Period (Including Distributions in Excess of Net Investment Income of $(2) and
Undistributed Net Investment Income of $18) | | $ | 19,706 | | | $ | 22,940 | | |
The accompanying notes are an integral part of the financial statements.
12
Morgan Stanley Institutional Fund, Inc.
Annual Report — December 31, 2013
Emerging Markets External Debt Portfolio
Statements of Changes in Net Assets (cont'd) | | Year Ended
December 31,
2013
(000) | | Period from
May 24, 2012^ to
December 31, 2012
(000) | |
(1) Capital Share Transactions: | |
Class I: | |
Shares Subscribed | | | 97 | | | | 2,050 | | |
Shares Issued on Distributions Reinvested | | | 8 | | | | 2 | | |
Shares Redeemed | | | (75 | ) | | | (17 | ) | |
Net Increase in Class I Shares Outstanding | | | 30 | | | | 2,035 | | |
Class A*: | |
Shares Subscribed | | | — | | | | 10 | | |
Shares Issued on Distributions Reinvested | | | — | @@ | | | — | | |
Conversion from Class H | | | 11 | | | | — | | |
Shares Redeemed | | | (— | @@) | | | — | | |
Net Increase in Class A Shares Outstanding | | | 11 | | | | 10 | | |
Class H@@@: | |
Shares Subscribed | | | 23 | ** | | | 11 | | |
Shares Issued on Distributions Reinvested | | | — | @@** | | | — | @@ | |
Conversion to Class A | | | (11 | )** | | | — | | |
Shares Redeemed | | | (23 | )** | | | (— | @@) | |
Net Increase (Decrease) in Class H Shares Outstanding | | | (11 | ) | | | 11 | | |
Class L: | |
Shares Subscribed | | | 1 | | | | 10 | | |
Shares Issued on Distributions Reinvested | | | — | @@ | | | — | | |
Net Increase in Class L Shares Outstanding | | | 1 | | | | 10 | | |
Class IS: | |
Shares Subscribed | | | 1 | *** | | | — | | |
Net Increase in Class IS Shares Outstanding | | | 1 | | | | — | | |
^ Commencement of Operations.
@ Amount is less than $500.
@@ Amount is less than 500 shares.
@@@ Effective September 9, 2013, Class H shares converted into Class A shares.
* Effective September 9, 2013, Class P shares were renamed Class A shares.
** For the period January 1, 2013 through September 6, 2013.
*** For the period September 13, 2013 through December 31, 2013.
The accompanying notes are an integral part of the financial statements.
13
Morgan Stanley Institutional Fund, Inc.
Annual Report — December 31, 2013
Financial Highlights
Emerging Markets External Debt Portfolio
| | | Class I | |
Selected Per Share Data and Ratios | | Year Ended
December 31,
2013 | | Period from
May 24, 2012^ to
December 31, 2012 | |
Net Asset Value, Beginning of Period | | $ | 11.11 | | | $ | 10.00 | | |
Income (Loss) from Investment Operations: | |
Net Investment Income† | | | 0.53 | | | | 0.30 | | |
Net Realized and Unrealized Gain (Loss) | | | (1.50 | ) | | | 1.18 | | |
Total from Investment Operations | | | (0.97 | ) | | | 1.48 | | |
Distributions from and/or in Excess of: | |
Net Investment Income | | | (0.48 | ) | | | (0.30 | ) | |
Net Realized Gain | | | (0.26 | ) | | | (0.07 | ) | |
Total Distributions | | | (0.74 | ) | | | (0.37 | ) | |
Redemption Fees | | | 0.00 | ‡ | | | — | | |
Net Asset Value, End of Period | | $ | 9.40 | | | $ | 11.11 | | |
Total Return++ | | | (8.79 | )% | | | 14.83 | %# | |
Ratios and Supplemental Data: | |
Net Assets, End of Period (Thousands) | | $ | 19,400 | | | $ | 22,597 | | |
Ratio of Expenses to Average Net Assets (1) | | | 0.84 | %+ | | | 0.84 | %+††* | |
Ratio of Net Investment Income to Average Net Assets (1) | | | 5.14 | %+ | | | 4.63 | %+††* | |
Ratio of Rebate from Morgan Stanley Affiliates to Average Net Assets | | | 0.00 | %§ | | | 0.01 | %††* | |
Portfolio Turnover Rate | | | 94 | % | | | 29 | %# | |
(1) Supplemental Information on the Ratios to Average Net Assets: | |
Ratios Before Expense Limitation: | |
Expenses to Average Net Assets | | | 2.15 | % | | | 2.02 | %††* | |
Net Investment Income to Average Net Assets | | | 3.83 | % | | | 3.45 | %††* | |
^ Commencement of Operations.
† Per share amount is based on average shares outstanding.
‡ Amount is less than $0.005 per share.
++ Calculated based on the net asset value as of the last business day of the period.
+ The Ratios of Expenses and Net Investment Income reflect the rebate of certain Portfolio expenses in connection with the investments in Morgan Stanley affiliates during the period. The effect of the rebate on the ratios is disclosed in the above table as "Ratio of Rebate from Morgan Stanley Affiliates to Average Net Assets."
†† Reflects overall Portfolio ratios for investment income and non-class specific expenses.
§ Amount is less than 0.005%.
# Not Annualized.
* Annualized.
The accompanying notes are an integral part of the financial statements.
14
Morgan Stanley Institutional Fund, Inc.
Annual Report — December 31, 2013
Financial Highlights
Emerging Markets External Debt Portfolio
| | | Class A@ | |
Selected Per Share Data and Ratios | | Year Ended
December 31,
2013 | | Period from
May 24, 2012^ to
December 31, 2012 | |
Net Asset Value, Beginning of Period | | $ | 11.11 | | | $ | 10.00 | | |
Income (Loss) from Investment Operations: | |
Net Investment Income† | | | 0.49 | | | | 0.29 | | |
Net Realized and Unrealized Gain (Loss) | | | (1.49 | ) | | | 1.17 | | |
Total from Investment Operations | | | (1.00 | ) | | | 1.46 | | |
Distributions from and/or in Excess of: | |
Net Investment Income | | | (0.45 | ) | | | (0.28 | ) | |
Net Realized Gain | | | (0.26 | ) | | | (0.07 | ) | |
Total Distributions | | | (0.71 | ) | | | (0.35 | ) | |
Redemption Fees | | | 0.00 | ‡ | | | — | | |
Net Asset Value, End of Period | | $ | 9.40 | | | $ | 11.11 | | |
Total Return++ | | | (9.05 | )% | | | 14.66 | %# | |
Ratios and Supplemental Data: | |
Net Assets, End of Period (Thousands) | | $ | 196 | | | $ | 111 | | |
Ratio of Expenses to Average Net Assets (1) | | | 1.14 | %+^^ | | | 1.09 | %+††* | |
Ratio of Net Investment Income to Average Net Assets (1) | | | 4.88 | %+ | | | 4.38 | %+††* | |
Ratio of Rebate from Morgan Stanley Affiliates to Average Net Assets | | | 0.00 | %§ | | | 0.01 | %††* | |
Portfolio Turnover Rate | | | 94 | % | | | 29 | %# | |
(1) Supplemental Information on the Ratios to Average Net Assets: | |
Ratios Before Expense Limitation: | |
Expenses to Average Net Assets | | | 2.76 | % | | | 2.27 | %††* | |
Net Investment Income to Average Net Assets | | | 3.26 | % | | | 3.20 | %††* | |
@ Effective September 9, 2013, Class P and Class H shares were renamed Class A shares.
^ Commencement of Operations.
‡ Amount is less than $0.005 per share.
† Per share amount is based on average shares outstanding.
++ Calculated based on the net asset value which does not reflect sales charges, if applicable, as of the last business day of the period.
+ The Ratios of Expenses and Net Investment Income reflect the rebate of certain Portfolio expenses in connection with the investments in Morgan Stanley affiliates during the period. The effect of the rebate on the ratios is disclosed in the above table as "Ratio of Rebate from Morgan Stanley Affiliates to Average Net Assets."
^^ Effective September 16, 2013, the Adviser has agreed to limit the ratio of expenses to average net assets to the maximum ratio of 1.20% for Class A shares. Prior to September 16, 2013, the maximum ratio was 1.10% for Class A shares.
†† Reflects overall Portfolio ratios for investment income and non-class specific expenses.
§ Amount is less than 0.005%.
# Not Annualized.
* Annualized.
The accompanying notes are an integral part of the financial statements.
15
Morgan Stanley Institutional Fund, Inc.
Annual Report — December 31, 2013
Financial Highlights
Emerging Markets External Debt Portfolio
| | | Class L | |
Selected Per Share Data and Ratios | | Year Ended
December 31,
2013 | | Period from
May 24, 2012^ to
December 31, 2012 | |
Net Asset Value, Beginning of Period | | $ | 11.11 | | | $ | 10.00 | | |
Income (Loss) from Investment Operations: | |
Net Investment Income† | | | 0.47 | | | | 0.25 | | |
Net Realized and Unrealized Gain (Loss) | | | (1.51 | ) | | | 1.18 | | |
Total from Investment Operations | | | (1.04 | ) | | | 1.43 | | |
Distributions from and/or in Excess of: | |
Net Investment Income | | | (0.42 | ) | | | (0.25 | ) | |
Net Realized Gain | | | (0.26 | ) | | | (0.07 | ) | |
Total Distributions | | | (0.68 | ) | | | (0.32 | ) | |
Redemption Fees | | | 0.00 | ‡ | | | — | | |
Net Asset Value, End of Period | | $ | 9.39 | | | $ | 11.11 | | |
Total Return++ | | | (9.41 | )% | | | 14.33 | %# | |
Ratios and Supplemental Data: | |
Net Assets, End of Period (Thousands) | | $ | 100 | | | $ | 111 | | |
Ratio of Expenses to Average Net Assets (1) | | | 1.41 | %+^^ | | | 1.59 | %+††* | |
Ratio of Net Investment Income to Average Net Assets (1) | | | 4.57 | %+ | | | 3.88 | %+††* | |
Ratio of Rebate from Morgan Stanley Affiliates to Average Net Assets | | | 0.00 | %§ | | | 0.01 | %††* | |
Portfolio Turnover Rate | | | 94 | % | | | 29 | %# | |
(1) Supplemental Information on the Ratios to Average Net Assets: | |
Ratios Before Expense Limitation: | |
Expenses to Average Net Assets | | | 3.07 | % | | | 2.77 | %††* | |
Net Investment Income to Average Net Assets | | | 2.91 | % | | | 2.70 | %††* | |
^ Commencement of Operations.
† Per share amount is based on average shares outstanding.
‡ Amount is less than $0.005 per share.
++ Calculated based on the net asset value as of the last business day of the period.
+ The Ratios of Expenses and Net Investment Income reflect the rebate of certain Portfolio expenses in connection with the investments in Morgan Stanley affiliates during the period. The effect of the rebate on the ratios is disclosed in the above table as "Ratio of Rebate from Morgan Stanley Affiliates to Average Net Assets."
^^ Effective September 16, 2013, the Adviser has agreed to limit the ratio of expenses to average net assets to the maximum ratio of 1.45% for Class L shares. Prior to September 16, 2013, the maximum ratio was 1.35% for Class L shares.
†† Reflects overall Portfolio ratios for investment income and non-class specific expenses.
§ Amount is less than 0.005%.
# Not Annualized.
* Annualized.
The accompanying notes are an integral part of the financial statements.
16
Morgan Stanley Institutional Fund, Inc.
Annual Report — December 31, 2013
Financial Highlights
Emerging Markets External Debt Portfolio
| | | Class IS | |
Selected Per Share Data and Ratios | | Period from
September 13, 2013^ to
December 31, 2013 | |
Net Asset Value, Beginning of Period | | $ | 9.65 | | |
Income from Investment Operations: | |
Net Investment Income† | | | 0.15 | | |
Net Realized and Unrealized Gain | | | 0.04 | | |
Total from Investment Operations | | | 0.19 | | |
Distributions from and/or in Excess of: | |
Net Investment Income | | | (0.24 | ) | |
Net Realized Gain | | | (0.20 | ) | |
Total Distributions | | | (0.44 | ) | |
Redemption Fees | | | 0.00 | ‡ | |
Net Asset Value, End of Period | | $ | 9.40 | | |
Total Return++ | | | 1.92 | %# | |
Ratios and Supplemental Data: | |
Net Assets, End of Period (Thousands) | | $ | 10 | | |
Ratio of Expenses to Average Net Assets (1) | | | 0.81 | %+^^* | |
Ratio of Net Investment Income to Average Net Assets (1) | | | 5.36 | %+* | |
Ratio of Rebate from Morgan Stanley Affiliates to Average Net Assets | | | 0.01 | %* | |
Portfolio Turnover Rate | | | 94 | %# | |
(1) Supplemental Information on the Ratios to Average Net Assets: | |
Ratios Before Expense Limitation: | |
Expenses to Average Net Assets | | | 7.70 | %* | |
Net Investment Loss to Average Net Assets | | | (1.53 | )%* | |
^ Commencement of Operations.
† Per share amount is based on average shares outstanding.
‡ Amount is less than $0.005 per share.
++ Calculated based on the net asset value as of the last business day of the period.
+ The Ratios of Expenses and Net Investment Income reflect the rebate of certain Portfolio expenses in connection with the investments in Morgan Stanley affiliates during the period. The effect of the rebate on the ratios is disclosed in the above table as "Ratio of Rebate from Morgan Stanley Affiliates to Average Net Assets."
^^ Effective September 16, 2013, the Adviser has agreed to limit the ratio of expenses to average net assets to the maximum ratio of 0.82% for Class IS shares.
# Not Annualized.
* Annualized.
The accompanying notes are an integral part of the financial statements.
17
Morgan Stanley Institutional Fund, Inc.
Annual Report — December 31, 2013
Notes to Financial Statements
Morgan Stanley Institutional Fund, Inc. (the "Fund") is registered under the Investment Company Act of 1940, as amended (the "Act"), as an open-end management investment company. The Fund is comprised of twenty-seven separate, active, diversified and non-diversified portfolios (individually referred to as a "Portfolio", collectively as the "Portfolios").
The accompanying financial statements relate to the Emerging Markets External Debt Portfolio. The Portfolio seeks high total return by investing primarily in fixed income securities of government and government- related issuers and corporate issuers in emerging market countries. The securities in which the Portfolio may invest will primarily be denominated in U.S. dollars. The Portfolio may invest, to a lesser extent, in securities denominated in currencies other than U.S. dollars. The Portfolio offers four classes of shares — Class I, Class A, Class L and Class IS.
On September 16, 2013, the Portfolio commenced offering Class IS shares. Effective September 9, 2013, Class P and Class H shares were renamed Class A shares.
A. Significant Accounting Policies: The following significant accounting policies are in conformity with U.S. generally accepted accounting principles ("GAAP"). Such policies are consistently followed by the Fund in the preparation of its financial statements. GAAP may require management to make estimates and assumptions that affect the reported amounts and disclosures in the financial statements. Actual results may differ from those estimates.
1. Security Valuation: (1) Certain portfolio securities may be valued by an outside pricing service approved by the Fund's Board of Directors (the "Directors"). The pricing service may utilize a matrix system or other model incorporating attributes such as security quality, maturity and coupon as the evaluation model parameters, and/or research evaluations by its staff, including review of broker-dealer market price quotations in determining what it believes is the fair valuation of the portfolios securities valued by such pricing service; (2) futures are valued at the latest price published by the commodities exchange on which they trade; (3) when market quotations are not readily available, including circumstances under which Morgan Stanley Investment Management Inc. (the "Adviser") determines that the closing price, last sale price or the mean between the last reported bid and asked prices are not reflective of a security's market value, portfolio securities are valued at their fair value as determined in good faith under procedures established by and under the general
supervision of the Directors. Occasionally, developments affecting the closing prices of securities and other assets may occur between the times at which valuations of such securities are determined (that is, close of the foreign market on which the securities trade) and the close of business of the New York Stock Exchange ("NYSE"). If developments occur during such periods that are expected to materially affect the value of such securities, such valuations may be adjusted to reflect the estimated fair value of such securities as of the close of the NYSE, as determined in good faith by the Directors or by the Adviser using a pricing service and/or procedures approved by the Directors; (4) quotations of foreign portfolio securities, other assets and liabilities and forward contracts stated in foreign currency are translated into U.S. dollar equivalents at the prevailing market rates prior to the close of the NYSE; (5) investments in mutual funds, including the Morgan Stanley Institutional Liquidity Funds, are valued at the net asset value as of the close of each business day; and (6) short-term debt securities with remaining maturities of 60 days or less at the time of purchase may be valued at amortized cost, unless the Adviser determines such valuation does not reflect the securities' market value, in which case these securities will be valued at their fair market value determined by the Adviser.
Under procedures approved by the Directors, the Fund's Adviser has formed a Valuation Committee. The Valuation Committee provides administration and oversight of the Fund's valuation policies and procedures, which are reviewed at least annually by the Directors. These procedures allow the Fund to utilize independent pricing services, quotations from securities and financial instrument dealers, and other market sources to determine fair value.
The Fund has procedures to determine the fair value of securities and other financial instruments for which market prices are not readily available. Under these procedures, the Valuation Committee convenes on a regular and ad hoc basis to review such securities and considers a number of factors, including valuation methodologies and significant unobservable valuation inputs, when arriving at fair value. The Valuation Committee may employ a market-based approach which may use related or comparable assets or liabilities, recent transactions, market multiples, book values, and other relevant information for the investment to determine the fair value of the
18
Morgan Stanley Institutional Fund, Inc.
Annual Report — December 31, 2013
Notes to Financial Statements (cont'd)
investment. An income-based valuation approach may also be used in which the anticipated future cash flows of the investment are discounted to calculate fair value. Discounts may also be applied due to the nature or duration of any restrictions on the disposition of the investments. Due to the inherent uncertainty of valuations of such investments, the fair values may differ significantly from the values that would have been used had an active market existed. The Valuation Committee employs various methods for calibrating these valuation approaches including a regular review of valuation methodologies, key inputs and assumptions, transactional back-testing or disposition analysis, and reviews of any related market activity.
2. Fair Value Measurement: Financial Accounting Standards Board ("FASB") Accounting Standards CodificationTM ("ASC") 820, "Fair Value Measurements and Disclosures" ("ASC 820"), defines fair value as the value that the Fund would receive to sell an investment or pay to transfer a liability in a timely transaction with an independent buyer in the principal market, or in the absence of a principal market the most advantageous market for the investment or liability. ASC 820 establishes a three-tier hierarchy to distinguish between (1) inputs that reflect the assumptions market participants would use in valuing an asset or liability developed based on market data obtained from sources independent of the reporting entity (observable inputs) and (2) inputs that reflect the reporting entity's own assumptions about the assumptions market participants would use in valuing an asset or liability developed based on the best information available in the circumstances (unobservable inputs) and to establish classification of fair value measurements for disclosure purposes. Various inputs are used in determining the value of the Fund's investments. The inputs are summarized in the three broad levels listed below.
• Level 1 – unadjusted quoted prices in active markets for identical investments
• Level 2 – other significant observable inputs (including quoted prices for similar investments, interest rates, prepayment speeds, credit risk, etc.)
• Level 3 – significant unobservable inputs including the Fund's own assumptions in determining the fair value of investments. Factors considered
in making this determination may include, but are not limited to, information obtained by contacting the issuer, analysts, or the appropriate stock exchange (for exchange-traded securities), analysis of the issuer's financial statements or other available documents and, if necessary, available information concerning other securities in similar circumstances
The inputs or methodology used for valuing securities are not necessarily an indication of the risk associated with investing in those securities and the determination of the significance of a particular input to the fair value measurement in its entirety requires judgment and considers factors specific to each security.
The following is a summary of the inputs used to value the Portfolio's investments as of December 31, 2013.
Investment Type | | Level 1
Unadjusted
quoted
prices
(000) | | Level 2
Other
significant
observable
inputs
(000) | | Level 3
Significant
unobservable
inputs
(000) | | Total
(000) | |
Assets: | |
Fixed Income Securities | |
Corporate Bonds | | $ | — | | | $ | 2,447 | | | $ | — | | | $ | 2,447 | | |
Sovereign | | | — | | | | 15,359 | | | | — | | | | 15,359 | | |
Total Fixed Income
Securities | | | — | | | | 17,806 | | | | — | | | | 17,806 | | |
Short-Term Investment | |
Investment Company | | | 1,497 | | | | — | | | | — | | | | 1,497 | | |
Futures Contracts | | | 9 | | | | — | | | | — | | | | 9 | | |
Total Assets | | $ | 1,506 | | | $ | 17,806 | | | $ | — | | | $ | 19,312 | | |
Transfers between investment levels may occur as the markets fluctuate and/or the availability of data used in an investment's valuation changes. The Portfolio recognizes transfers between the levels as of the end of the period. As of December 31, 2013, the Portfolio did not have any investments transfer between investment levels.
3. Foreign Currency Translation and Foreign Investments: The books and records of the Portfolio are maintained in U.S. dollars. Foreign currency amounts are translated into U.S. dollars as follows:
– investments, other assets and liabilities at the prevailing rate of exchange on the valuation date;
– investment transactions and investment income at the prevailing rates of exchange on the dates of such transactions.
19
Morgan Stanley Institutional Fund, Inc.
Annual Report — December 31, 2013
Notes to Financial Statements (cont'd)
Although the net assets of the Portfolio are presented at the foreign exchange rates and market values at the close of the period, the Portfolio does not isolate that portion of the results of operations arising as a result of changes in the foreign exchange rates from the fluctuations arising from changes in the market prices of securities held at period end. Similarly, the Portfolio does not isolate the effect of changes in foreign exchange rates from the fluctuations arising from changes in the market prices of securities sold during the period. Accordingly, realized and unrealized foreign currency gains (losses) on investments in securities are included in the reported net realized and unrealized gains (losses) on investment transactions and balances. However, pursuant to U.S. Federal income tax regulations, gains and losses from certain foreign currency transactions and the foreign currency portion of gains and losses realized on sales and maturities of foreign denominated debt securities are treated as ordinary income for U.S. Federal income tax purposes.
Net realized gains (losses) on foreign currency transactions represent net foreign exchange gains (losses) from foreign currency forward exchange contracts, disposition of foreign currencies, currency gains (losses) realized between the trade and settlement dates on securities transactions, and the difference between the amount of investment income and foreign withholding taxes recorded on the Portfolio's books and the U.S. dollar equivalent amounts actually received or paid. Net unrealized currency gains (losses) from valuing foreign currency denominated assets and liabilities at period end exchange rates are reflected as a component of unrealized appreciation (depreciation) on the Statement of Assets and Liabilities. The change in unrealized currency gains (losses) on foreign currency translations for the period is reflected in the Statement of Operations.
Foreign security and currency transactions may involve certain considerations and risks not typically associated with those of U.S. dollar denominated transactions as a result of, among other factors, fluctuations of exchange rates in relation to the U.S. dollar, the possibility of lower levels of governmental supervision and regulation of foreign securities markets and the possibility of political or economic instability. The net assets of the Portfolio include foreign denominated securities and currency. Changes in currency exchange rates will affect the U.S. Dollar value of and investment income from such securities.
Governmental approval for foreign investments may be required in advance of making an investment under certain circumstances in some countries, and the extent of foreign investments in domestic companies may be subject to limitation in other countries. Foreign ownership limitations also may be imposed by the charters of individual companies to prevent, among other concerns, violations of foreign investment limitations. As a result, an additional class of shares (identified as "Foreign" in the Portfolio of Investments) may be created and offered for investment. The "local" and "foreign shares" market values may differ. In the absence of trading of the foreign shares in such markets, the Portfolio values the foreign shares at the closing exchange price of the local shares.
4. Derivatives: The Portfolio may, but is not required to, use derivative instruments for a variety of purposes, including hedging, risk management, portfolio management or to earn income. Derivatives are financial instruments whose value is based, in part, on the value of an underlying asset, interest rate, index or financial instrument. Prevailing interest rates and volatility levels, among other things, also affect the value of derivative instruments. A derivative instrument often has risks similar to its underlying asset and may have additional risks, including imperfect correlation between the value of the derivative and the underlying asset, risks of default by the counterparty to certain transactions, magnification of losses incurred due to changes in the market value of the securities, instruments, indices or interest rates to which they relate, and risks that the transactions may not be liquid. The use of derivatives involves risks that are different from, and possibly greater than, the risks associated with other portfolio investments. Derivatives may involve the use of highly specialized instruments that require investment techniques and risk analyses different from those associated with other portfolio investments. All of the Portfolio's holdings, including derivative instruments, are marked-to-market each day with the change in value reflected in unrealized appreciation (depreciation). Upon disposition, a realized gain or loss is recognized.
Certain derivative transactions may give rise to a form of leverage. Leverage magnifies the potential for gain and the risk of loss. Leverage associated with derivative transactions may cause the Portfolio to liquidate portfolio positions when it may not be advantageous to do so to satisfy its obligations or to meet earmarking or
20
Morgan Stanley Institutional Fund, Inc.
Annual Report — December 31, 2013
Notes to Financial Statements (cont'd)
segregation requirements, pursuant to applicable Securities and Exchange Commission rules and regulations, or may cause the Portfolio to be more volatile than if the Portfolio had not been leveraged. Although the Adviser seeks to use derivatives to further the Portfolio's investment objectives, there is no assurance that the use of derivatives will achieve this result.
Following is a description of the derivative instruments and techniques that the Portfolio used during the period and their associated risks:
Foreign Currency Forward Exchange Contracts: In connection with its investments in foreign securities, the Portfolio also entered into contracts with banks, brokers or dealers to purchase or sell securities or foreign currencies at a future date. A foreign currency forward exchange contract ("currency contract") is a negotiated agreement between the contracting parties to exchange a specified amount of currency at a specified future time at a specified rate. The rate can be higher or lower than the spot rate between the currencies that are the subject of the contract. Currency contracts may be used to protect against uncertainty in the level of future foreign currency exchange rates or to gain or modify exposure to a particular currency. There is additional risk that such transactions reduce or preclude the opportunity for gain if the value of the currency should move in the direction opposite to the position taken and that currency contracts create exposure to currencies in which the Portfolio's securities are not denominated. Unanticipated changes in currency prices may result in poorer overall performance for the Portfolio than if it had not entered into such contracts. The use of currency contracts involves the risk of loss from the insolvency or bankruptcy of the counterparty to the contract or the failure of the counterparty to make payments or otherwise comply with the terms of the contract. A currency contract is marked-to-market daily and the change in market value is recorded by the Portfolio as unrealized gain or loss. The Portfolio records realized gains (losses) when the currency contract is closed equal to the difference between the value of the currency contract at the time it was opened and the value at the time it was closed.
Futures: A futures contract is a standardized, exchange-traded agreement to buy or sell a specific quantity of an underlying asset, reference rate or index at a specific price at a specific future time. The value of a futures contract tends to increase and decrease in tandem with the value of the underlying instrument. Depending on the terms of the particular contract, futures contracts are settled through either physical delivery of the underlying instrument on the settlement date or by payment of a cash settlement amount on the settlement date. During the period the futures contract is open, payments are received from or made to the broker based upon changes in the value of the contract (the variation margin). A decision as to whether, when and how to use futures contracts involves the exercise of skill and judgment and even a well-conceived futures transaction may be unsuccessful because of market behavior or unexpected events. In addition to the derivatives risks discussed above, the prices of futures contracts can be highly volatile, using futures contracts can lower total return, and the potential loss from futures contracts can exceed the Portfolio's initial investment in such contracts. No assurance can be given that a liquid market will exist for any particular futures contract at any particular time. There is also the risk of loss by the Portfolio of margin deposits in the event of bankruptcy of a broker with whom the Portfolio has open positions in the futures contract.
FASB ASC 815, "Derivatives and Hedging: Overall" ("ASC 815"), is intended to improve financial reporting about derivative instruments by requiring enhanced disclosures to enable investors to better understand how and why the Portfolio uses derivative instruments, how these derivative instruments are accounted for and their effects on the Portfolio's financial position and results of operations.
The following table sets forth the fair value of the Portfolio's derivative contracts by primary risk exposure as of December 31, 2013.
| | | Asset Derivatives
Statement of Assets and
Liabilities Location | | Primary Risk
Exposure | | Value
(000) | |
Futures Contracts | | Variation Margin | | Interest Rate Risk | | $ | 9 | (a) | |
(a) This amount represents the cumulative appreciation (depreciation) as reported in the Portfolio of Investments. The Statement of Assets and Liabilities only reflects the current day's net variation margin.
21
Morgan Stanley Institutional Fund, Inc.
Annual Report — December 31, 2013
Notes to Financial Statements (cont'd)
The following tables set forth by primary risk exposure the Portfolio's realized gains (losses) and change in unrealized appreciation (depreciation) by type of derivative contract for the year ended December 31, 2013 in accordance with ASC 815.
Realized Gain (Loss) | |
Primary Risk Exposure | | Derivative Type | | Value
(000) | |
Currency Risk | | Foreign Currency
Forward Exchange Contracts | | $ | 4 | | |
Interest Rate Risk | | Futures Contracts | | | 62 | | |
| | | Total | | $ | 66 | | |
Change in Unrealized Appreciation (Depreciation) | |
Primary Risk Exposure | | Derivative Type | | Value
(000) | |
Currency Risk | | Foreign Currency
Forward Exchange Contracts | | $ | (4 | ) | |
Interest Rate Risk | | Futures Contracts | | | 9 | | |
| | | Total | | $ | 5 | | |
For the year ended December 31, 2013, the approximate average monthly amount outstanding for each derivative type is as follows:
Foreign Currency Forward Exchange Contracts: | |
Average monthly principal amount | | $ | 76,000 | | |
Futures Contracts: | |
Average monthly original value | | $ | 635,000 | | |
5. Redemption Fees: The Portfolio will assess a 2% redemption fee, on Class I shares, Class A shares, Class L shares and Class IS shares, which is paid directly to the Portfolio, for shares redeemed or exchanged within thirty days of purchase, subject to certain exceptions. The redemption fee is designed to protect the Portfolio and its remaining shareholders from the effects of short-term trading. These fees, if any, are included in the Statements of Changes in Net Assets.
6. Indemnifications: The Fund enters into contracts that contain a variety of indemnifications. The Fund's maximum exposure under these arrangements is unknown. However, the Fund has not had prior claims or losses pursuant to these contracts and expects the risk of loss to be remote.
7. Dividends and Distributions to Shareholders: Dividend income and distributions to shareholders are recorded on the ex-dividend date. Dividends from net investment income, if any, are declared and paid quarterly. Net realized capital gains, if any, are distributed at least annually.
8. Security Transactions, Income and Expenses: Security transactions are accounted for on the trade date
(date the order to buy or sell is executed). Realized gains and losses on the sale of investment securities are determined on the specific identified cost method. Dividend income and other distributions are recorded on the ex-dividend date (except for certain foreign dividends which may be recorded as soon as the Portfolio is informed of such dividends) net of applicable withholding taxes. Interest income is recognized on the accrual basis except where collection is in doubt. Discounts are accreted and premiums are amortized over the life of the respective securities. Most expenses of the Fund can be directly attributed to a particular Portfolio. Expenses which cannot be directly attributed are apportioned among the Portfolios based upon relative net assets or other appropriate methods. Income, expenses (other than class specific expenses — distribution, transfer agency and sub transfer agency fees) and realized and unrealized gains or losses are allocated to each class of shares based upon their relative net assets.
B. Advisory Fees: The Adviser, a wholly-owned subsidiary of Morgan Stanley, provides the Portfolio with advisory services under the terms of an Investment Advisory Agreement, paid quarterly, at the annual rate based on the average daily net assets as follows:
First $500
million | | Next $500
million | | Over $1
billion | |
| | 0.75 | % | | | 0.70 | % | | | 0.65 | % | |
For the year ended December 31, 2013, the advisory fee rate (net of waivers/rebate) was equivalent to an annual effective rate of 0.00% of the Portfolio's daily net assets.
The Adviser has agreed to reduce its advisory fee and/or reimburse the Portfolio so that total annual portfolio operating expenses, excluding certain investment related expenses, taxes, interest and other extraordinary expenses (including litigation), will not exceed 0.85% for Class I shares, 1.10% for Class A shares and 1.60% for Class L shares. Effective February 25, 2013, the expense cap for Class L shares was reduced to 1.35%. Effective September 16, 2013, the Adviser has agreed to limit the ratio of expenses to average net assets to the maximum ratio of 1.20%, 1.45% and 0.82% for Class A, Class L and Class IS shares, respectively. The fee waivers and/or expense reimbursements will continue for at least one year or until such time that the Directors act to discontinue all or a portion of such waivers and/or reimbursements when it deems such action is appropriate. For the year ended December 31, 2013, approximately $163,000 of advisory fees were waived and approximately
22
Morgan Stanley Institutional Fund, Inc.
Annual Report — December 31, 2013
Notes to Financial Statements (cont'd)
$119,000 of other expenses were reimbursed by the Adviser pursuant to this arrangement.
C. Administration Fees: The Adviser also serves as Administrator to the Fund and provides administrative services pursuant to an Administration Agreement for an annual fee, accrued daily and paid monthly, of 0.08% of the Portfolio's average daily net assets. Under a Sub-Administration Agreement between the Administrator and State Street Bank and Trust Company ("State Street"), State Street provides certain administrative services to the Fund. For such services, the Administrator pays State Street a portion of the fee the Administrator receives from the Portfolio.
D. Distribution and Shareholder Services Fees: Morgan Stanley Distribution, Inc. ("MSDI" or the "Distributor"), a wholly-owned subsidiary of the Adviser, and an indirect subsidiary of Morgan Stanley, serves as the Fund's Distributor of Portfolio shares pursuant to a Distribution Agreement. The Fund has adopted a Shareholder Services Plan with respect to Class A shares pursuant to Rule 12b-1 under the Act. Under the Shareholder Services Plan, the Portfolio pays the Distributor a shareholder services fee, accrued daily and paid monthly, at an annual rate of 0.25% of the Portfolio's average daily net assets attributable to Class A shares.
The Fund has adopted a Distribution and Shareholder Services Plan with respect to Class L shares pursuant to Rule 12b-1 under the Act. Under the Distribution and Shareholder Services Plan, the Portfolio pays the Distributor a distribution fee, accrued daily and paid monthly, at an annual rate of 0.25% and a shareholder services fee, accrued daily and paid monthly, at an annual rate of 0.25% of the Portfolio's average daily net assets attributable to Class L shares. The Board of Directors approved an amendment to the Distribution and Shareholder Services Plan reducing the distribution fee for the Portfolio's Class L shares from 0.50% to 0.25% of the average daily net assets of such Class, effective February 25, 2013.
The distribution and shareholder services fees are used to support the expenses associated with servicing and maintaining accounts. The Distributor may compensate other parties for providing shareholder support services to investors who purchase Class A and Class L shares.
E. Dividend Disbursing and Transfer Agent: The Fund's dividend disbursing and transfer agent was Morgan Stanley Services Company Inc. ("Morgan Stanley Services"). Pursuant to a Transfer Agency Agreement, the Fund paid Morgan Stanley Services a fee based on the number of
classes, accounts and transactions relating to the Portfolios of the Fund. Effective July 1, 2013, the Directors approved changing the transfer agent to Boston Financial Data Services, Inc.
F. Custodian Fees: State Street (the "Custodian") serves as Custodian for the Fund in accordance with a Custodian Agreement. The Custodian holds cash, securities, and other assets of the Fund as required by the Act. Custody fees are payable monthly based on assets held in custody, investment purchases and sales activity and account maintenance fees, plus reimbursement for certain out-of-pocket expenses.
G. Security Transactions and Transactions with Affiliates: For the year ended December 31, 2013, purchases and sales of investment securities for the Portfolio, other than long-term U.S. Government securities and short-term investments, were approximately $19,406,000 and $20,797,000, respectively. There were no purchases and sales of long-term U.S. Government securities for the year ended December 31, 2013.
The Portfolio invests in the Institutional Class of the Morgan Stanley Institutional Liquidity Funds — Money Market Portfolio (the "Liquidity Funds"), an open-end management investment company managed by the Adviser. Advisory fees paid by the Portfolio are reduced by an amount equal to its pro-rata share of the advisory and administration fees paid by the Portfolio due to its investment in the Liquidity Funds. For the year ended December 31, 2013, advisory fees paid were reduced by approximately $1,000 relating to the Portfolio's investment in the Liquidity Funds.
A summary of the Portfolio's transactions in shares of the Liquidity Funds during the year ended December 31, 2013 is as follows:
Value
December 31,
2012
(000) | | Purchases
at Cost
(000) | | Sales
(000) | | Dividend
Income
(000) | | Value
December 31,
2013
(000) | |
| $ | 130 | | | $ | 13,721 | | | $ | 12,354 | | | $ | 1 | | | $ | 1,497 | | |
H. Federal Income Taxes: It is the Portfolio's intention to continue to qualify as a regulated investment company and distribute all of its taxable and tax-exempt income. Accordingly, no provision for Federal income taxes is required in the financial statements.
The Portfolio may be subject to taxes imposed by countries in which it invests. Such taxes are generally based on income and/or capital gains earned or repatriated. Taxes are accrued based on net investment income, net realized gains and net unrealized appreciation as such income and/or gains are earned. Taxes may also be based on transactions in foreign currency
23
Morgan Stanley Institutional Fund, Inc.
Annual Report — December 31, 2013
Notes to Financial Statements (cont'd)
and are accrued based on the value of investments denominated in such currency.
FASB ASC 740-10 "Income Taxes — Overall" sets forth a minimum threshold for financial statement recognition of the benefit of a tax position taken or expected to be taken in a tax return. Management has concluded there are no significant uncertain tax positions that would require recognition in the financial statements. If applicable, the Portfolio recognizes interest accrued related to unrecognized tax benefits in "Interest Expense" and penalties in "Other Expenses" in the Statement of Operations. The Portfolio files tax returns with the U.S. Internal Revenue Service, New York and various states. Generally, each of the tax years in the two-year period ended December 31, 2013, remains subject to examination by taxing authorities.
The tax character of distributions paid may differ from the character of distributions shown in the Statements of Changes in Net Assets due to short-term capital gains being treated as ordinary income for tax purposes. The tax character of distributions paid during fiscal 2013 and 2012 was as follows:
2013
Distributions
Paid From: | | 2012
Distributions
Paid From: | |
Ordinary
Income
(000) | | Long-Term
Capital Gain
(000) | | Ordinary
Income
(000) | | Long-Term
Capital Gain
(000) | |
| $ | 1,545 | | | $ | 22 | | | $ | 759 | | | | — | | |
The amount and character of income and gains to be distributed are determined in accordance with income tax regulations which may differ from GAAP. These book/tax differences are either considered temporary or permanent in nature.
Temporary differences are primarily due to differing book and tax treatments in the timing of the recognition of gains (losses) on certain investment transactions and the timing of the deductibility of certain expenses.
Permanent differences, primarily due to differing treatments of gains (losses) related to foreign currency transactions, resulted in the following reclassifications among the components of net assets at December 31, 2013:
Distributions in
Excess of
Net Investment
Income
(000) | | Accumulated
Net Realized
Loss
(000) | | Paid-in-
Capital
(000) | |
| $ | (45 | ) | | $ | 45 | | | | — | | |
At December 31, 2013, the Portfolio had no distributable earnings on a tax basis.
At December 31, 2013, the aggregate cost for federal income tax purposes is $20,302,000. The aggregate gross unrealized appreciation is $116,000 and the aggregate gross unrealized depreciation is $1,115,000 resulting in net unrealized depreciation of $999,000.
Capital losses and specified ordinary losses, including currency losses, incurred after October 31 but within the taxable year are deemed to arise on the first day of the Portfolio's next taxable year. For the year ended December 31, 2013, the Portfolio deferred to January 1, 2014 for U.S. Federal income tax purposes the following losses:
Post-October
Currency
and Specified
Ordinary Losses
(000) | | Post-October
Capital Losses
(000) | |
| $ | 1 | | | $ | 361 | | |
I. Results of Special Shareholder Meeting (unaudited): On June 5, 2013, a Joint Special Shareholder Meeting was held for Class H shareholders of the Portfolio to approve the Articles of Amendment to the Fund's Articles of Amendment and Restatement and a Plan of Reclassification for the Portfolio pursuant to which Class H shares would be reclassified as Class P shares. The results with respect to this proposal were as follows:
| For | | Against | | Abstain | |
| | 10,871 | | | | 0 | | | | 0 | | |
J. Accounting Pronouncement: In June 2013, FASB issued Accounting Standards Update 2013-08 Financial Services — Investment Companies (Topic 946) — Amendments to the Scope, Measurement, and Disclosure Requirements ("ASU 2013-08") which is effective for interim and annual reporting periods in fiscal years that begin after December 15, 2013. ASU 2013-08 sets forth a methodology for determining whether an entity should be characterized as an investment company and prescribes fair value accounting for an investment company's non-controlling ownership interest in another investment company. FASB has determined that a fund registered under the Investment Company Act of 1940 automatically meets ASU 2013-08's criteria for an investment company. Although still evaluating the potential impacts of ASU 2013-08 to the Portfolio, management expects that the impact of the Portfolio's adoption will be limited to additional financial statement disclosures.
24
Morgan Stanley Institutional Fund, Inc.
Annual Report — December 31, 2013
Report of Independent Registered Public Accounting Firm
To the Shareholders and Board of Directors of
Morgan Stanley Institutional Fund, Inc. —
Emerging Markets External Debt Portfolio
We have audited the accompanying statement of assets and liabilities, including the portfolio of investments, of Emerging Markets External Debt Portfolio (one of the portfolios constituting Morgan Stanley Institutional Fund, Inc.) (the "Portfolio") as of December 31, 2013, and the related statement of operations for the year then ended, and the statements of changes in net assets and the financial highlights for the periods indicated therein. These financial statements and financial highlights are the responsibility of the Portfolio's management. Our responsibility is to express an opinion on these financial statements and financial highlights based on our audits.
We conducted our audits in accordance with the standards of the Public Company Accounting Oversight Board (United States). Those standards require that we plan and perform the audit to obtain reasonable assurance about whether the financial statements and financial highlights are free of material misstatement. We were not engaged to perform an audit of the Portfolio's internal control over financial reporting. Our audits included consideration of internal control over financial reporting as a basis for designing audit procedures that are appropriate in the circumstances, but not for the purpose of expressing an opinion on the effectiveness of the Portfolio's internal control over financial reporting. Accordingly, we express no such opinion. An audit also includes examining, on a test basis, evidence supporting the amounts and disclosures in the financial statements and financial highlights, assessing the accounting principles used and significant estimates made by management, and evaluating the overall financial statement presentation. Our procedures included confirmation of securities owned as of December 31, 2013, by correspondence with the custodian and others. We believe that our audits provide a reasonable basis for our opinion.
In our opinion, the financial statements and financial highlights referred to above present fairly, in all material respects, the financial position of Emerging Markets External Debt Portfolio (one of the portfolios constituting Morgan Stanley Institutional Fund, Inc.) at December 31, 2013, the results of its operations for the year then ended, and the changes in its net assets and the financial highlights for each of the periods indicated therein, in conformity with U.S. generally accepted accounting principles.

Boston, Massachusetts
February 26, 2014
25
Morgan Stanley Institutional Fund, Inc.
Annual Report — December 31, 2013
Federal Tax Notice (unaudited)
For Federal income tax purposes, the following information is furnished with respect to the distributions paid by the Portfolio during its taxable year ended December 31, 2013.
The Portfolio designated and paid $22,000 as a long-term capital gain distribution.
In January, the Portfolio provides tax information to shareholders for the preceding calendar year.
26
Morgan Stanley Institutional Fund, Inc.
Annual Report — December 31, 2013
U.S. Privacy Policy (unaudited)
AN IMPORTANT NOTICE CONCERNING OUR U.S. PRIVACY POLICY
This privacy notice describes the U.S. privacy policy of Morgan Stanley Distribution, Inc., and the Morgan Stanley family of mutual funds ("us", "our", "we").
We are required by federal law to provide you with notice of our U.S. privacy policy ("Policy"). This Policy applies to both our current and former clients unless we state otherwise and is intended for individual clients who purchase products or receive services from us for personal, family or household purposes. This Policy is not applicable to partnerships, corporations, trusts or other non-individual clients or account holders, nor is this Policy applicable to individuals who are either beneficiaries of a trust for which we serve as trustee or participants in an employee benefit plan administered or advised by us. This Policy is, however, applicable to individuals who select us to be a custodian of securities or assets in individual retirement accounts, 401(k) accounts, or accounts subject to the Uniform Gifts to Minors Act.
This notice sets out our business practices to protect your privacy; how we collect and share personal information about you; and how you can limit our sharing or certain uses by others of this information. We may amend this Policy at any time, and will inform you of any changes to our Policy as required by law.
WE RESPECT YOUR PRIVACY
We appreciate that you have provided us with your personal financial information and understand your concerns about your information. We strive to safeguard the information our clients entrust to us. Protecting the confidentiality and security of client information is an important part of how we conduct our business.
This notice describes what personal information we collect about you, how we collect it, when we may share it with others, and how certain others may use it. It discusses the steps you may take to limit our sharing of certain information about you with our affiliated companies, including, but not limited to our affiliated banking businesses, brokerage firms and credit service affiliates. It also discloses how you may limit our affiliates' use of shared information for marketing purposes.
Throughout this Policy, we refer to the nonpublic information that personally identifies you as "personal information." We also use the term "affiliated company" in this notice. An affiliated company is a company in our family of companies and includes companies with the Morgan Stanley name. These affiliated companies are financial institutions such as broker-dealers, banks, investment advisers and credit card issuers. We refer to any company that is not an affiliated company as a nonaffiliated third party. For purposes of Section 5 of this notice, and your ability to limit certain uses of personal information by our affiliates, this notice applies to the use of personal information by our affiliated companies.
1. WHAT PERSONAL INFORMATION DO WE COLLECT FROM YOU?
We may collect the following types of information about you: (i) information provided by you, including information from applications and other forms we receive from you, (ii) information about your transactions with us or our affiliates, (iii) information about your transactions with nonaffiliated third parties, (iv) information from consumer reporting agencies, (v) information obtained from our websites, and (vi) information obtained from other sources. For example:
• We collect information such as your name, address, e-mail address, telephone/fax numbers, assets, income and investment objectives through applications and other forms you submit to us.
• We may obtain information about account balances, your use of account(s) and the types of products and services you prefer to receive from us through your dealings and transactions with us and other sources.
• We may obtain information about your creditworthiness and credit history from consumer reporting agencies.
• We may collect background information from and through third-party vendors to verify representations you have made and to comply with various regulatory requirements.
2. WHEN DO WE DISCLOSE PERSONAL INFORMATION WE COLLECT ABOUT YOU?
We may disclose personal information we collect about you in each of the categories listed above to affiliated and nonaffiliated third parties.
27
Morgan Stanley Institutional Fund, Inc.
Annual Report — December 31, 2013
U.S. Privacy Policy (unaudited) (cont'd)
a. Information we disclose to affiliated companies.
We may disclose personal information that we collect about you to our affiliated companies to manage your account(s) effectively, to service and process your transactions, and to let you know about products and services offered by us and affiliated companies, to manage our business, and as otherwise required or permitted by law. Offers for products and services from affiliated companies are developed under conditions designed to safeguard your personal information.
b. Information we disclose to third parties.
We may disclose personal information that we collect about you to nonaffiliated third parties to provide marketing services on our behalf or to other financial institutions with whom we have joint marketing agreements. We may also disclose all of the information we collect to other nonaffiliated third parties for our everyday business purposes, such as to process transactions, maintain account(s), respond to court orders and legal investigations, report to credit bureaus, offer our own products and services, protect against fraud, for institutional risk control, to perform services on our behalf, and as otherwise required or permitted by law.
When we share personal information about you with a nonaffiliated third party, they are required to limit their use of personal information about you to the particular purpose for which it was shared and they are not allowed to share personal information about you with others except to fulfill that limited purpose or as may be permitted or required by law.
3. HOW DO WE PROTECT THE SECURITY AND CONFIDENTIALITY OF PERSONAL INFORMATION WE COLLECT ABOUT YOU?
We maintain physical, electronic and procedural security measures that comply with applicable law and regulations to help safeguard the personal information we collect about you. We have internal policies governing the proper handling of client information by employees. Third parties that provide support or marketing services on our behalf may also receive personal information about you, and we require them to adhere to appropriate security standards with respect to such information.
4. HOW CAN YOU LIMIT OUR SHARING CERTAIN PERSONAL INFORMATION ABOUT YOU WITH OUR AFFILIATED COMPANIES FOR ELIGIBILITY DETERMINATION?
By following the opt-out procedures in Section 6 below, you may limit the extent to which we share with our affiliated companies, personal information that was collected to determine your eligibility for products and services such as your credit reports and other information that you have provided to us or that we may obtain from third parties ("eligibility information"). Eligibility information does not include your identification information or personal information pertaining to our transactions or experiences with you. Please note that, even if you direct us not to share eligibility information with our affiliated companies, we may still share your personal information, including eligibility information, with our affiliated companies under circumstances that are permitted under applicable law, such as to process transactions or to service your account.
5. HOW CAN YOU LIMIT THE USE OF CERTAIN PERSONAL INFORMATION ABOUT YOU BY OUR AFFILIATED COMPANIES FOR MARKETING?
By following the opt-out instructions in Section 6 below, you may limit our affiliated companies from marketing their products or services to you based on personal information we disclose to them. This information may include, for example, your income and account history with us. Please note that, even if you choose to limit our affiliated companies from using personal information about you that we may share with them for marketing their products and services to you, our affiliated companies may use your personal information that they obtain from us to market to you in circumstances permitted by law, such as if the affiliated party has its own relationship with you.
28
Morgan Stanley Institutional Fund, Inc.
Annual Report — December 31, 2013
U.S. Privacy Policy (unaudited) (cont'd)
6. HOW CAN YOU SEND US AN OPT-OUT INSTRUCTION?
If you wish to limit our sharing of eligibility information about you with our affiliated companies, or our affiliated companies' use of personal information for marketing purposes, as described in this notice, you may do so by:
• Calling us at (800) 548-7786
Monday–Friday between 8a.m. and 5p.m. (EST)
• Writing to us at the following address:
Boston Financial Data Services, Inc.
c/o Privacy Coordinator
P.O. Box 219804
Kansas City, Missouri 64121
If you choose to write to us, your request should include: your name, address, telephone number and account number(s) to which the opt-out applies and whether you are opting out with respect to sharing of eligibility information (Section 4 above), or information used for marketing (Section 5 above), or both. Written opt-out requests should not be sent with any other correspondence. In order to process your request, we require that the request be provided by you directly and not through a third party. Once you have informed us about your privacy preferences, your opt-out preference will remain in effect with respect to this Policy (as it may be amended) until you notify us otherwise. If you are a joint account owner, we will accept instructions from any one of you and apply those instructions to the entire account.
Please understand that if you limit our sharing or our affiliated companies' use of personal information, you and any joint account holder(s) may not receive information about our affiliated companies' products and services, including products or services that could help you manage your financial resources and achieve your investment objectives.
If you have more than one account or relationship with us, please specify the accounts to which you would like us to apply your privacy choices. If you have accounts or relationships with our affiliates, you may receive multiple privacy policies from them, and will need to separately notify those companies of your privacy choices for those accounts or relationships.
7. WHAT IF AN AFFILIATED COMPANY BECOMES A NONAFFILIATED THIRD PARTY?
If, at any time in the future, an affiliated company becomes a nonaffiliated third party, further disclosures of personal information made to the former affiliated company will be limited to those described in Section 2(b) above relating to nonaffiliated third parties. If you elected under Section 6 to limit disclosures we make to affiliated companies, or use of personal information by affiliated companies, your election will not apply to use by any former affiliated company of your personal information in their possession once it becomes a nonaffiliated third party.
SPECIAL NOTICE TO RESIDENTS OF VERMONT
The following section supplements our Policy with respect to our individual clients who have a Vermont address and supersedes anything to the contrary in the above Policy with respect to those clients only.
The State of Vermont requires financial institutions to obtain your consent prior to sharing personal information that they collect about you with nonaffiliated third parties, or eligibility information with affiliated companies, other than in certain limited circumstances. Except as permitted by law, we will not share personal information we collect about you with nonaffiliated third parties or eligibility information with affiliated companies, unless you provide us with your written consent to share such information.
SPECIAL NOTICE TO RESIDENTS OF CALIFORNIA
The following section supplements our Policy with respect to our individual clients who have a California address and supersedes anything to the contrary in the above Policy with respect to those clients only.
In response to a California law, if your account has a California home address, your personal information will not be disclosed to nonaffiliated third parties except as permitted by applicable California law, and we will limit sharing such personal information with our affiliates to comply with California privacy laws that apply to us.
29
Morgan Stanley Institutional Fund, Inc.
Annual Report — December 31, 2013
Director and Officer Information (unaudited)
Independent Director:
Name, Age and Address of
Independent Director | | Position(s)
Held with
Registrant | | Length of Time
Served* | | Principal Occupation(s) During Past 5 Years | | Number of
Portfolios in
Fund Complex
Overseen by
Independent
Director** | | Other Directorships
Held by Independent
Director*** | |
Frank L. Bowman (69)
c/o Kramer Levin Naftalis &
Frankel LLP
Counsel to the Independent Directors
1177 Avenue of the Americas
New York, NY 10036 | | Director | | Since
August
2006 | | President, Strategic Decisions, LLC (consulting) (since February 2009); Director or Trustee of various Morgan Stanley Funds (since August 2006); Chairperson of the Insurance Sub-Committee of the Compliance and Insurance Committee (since February 2007); served as President and Chief Executive Officer of the Nuclear Energy Institute (policy organization) (February 2005-November 2008); retired as Admiral, U.S. Navy after serving over 38 years on active duty including 8 years as Director of the Naval Nuclear Propulsion Program in the Department of the Navy and the U.S. Department of Energy (1996-2004); served as Chief of Naval Personnel (July 1994-September 1996); and on the Joint Staff as Director of Political Military Affairs (June 1992-July 1994); knighted as Honorary Knight Commander of the Most Excellent Order of the British Empire; awarded the Officier de l'Orde National du Mérite by the French Government; elected to the National Academy of Engineering (2009). | | | 98 | | | Director of BP p.l.c.; Director of Naval and Nuclear Technologies LLP; Director of the Armed Services YMCA of the USA and the U.S. Naval Submarine League; Director of the American Shipbuilding Suppliers Association; Member of the National Security Advisory Council of the Center for U.S. Global Engagement and a member of the CNA Military Advisory Board; Chairman, J Street Cup Golf Charity; Trustee Fairhaven United Methodist Church. | |
Michael Bozic (73)
c/o Kramer Levin Naftalis & Frankel LLP
Counsel to the Independent Directors
1177 Avenue of the Americas
New York, NY 10036 | | Director | | Since
April
1994 | | Private investor and a member of the advisory board of American Road Group LLC (retail) (since June 2000); Chairperson of the Compliance and Insurance Committee (since October 2006); Director or Trustee of various Morgan Stanley Funds (since April 1994); formerly, Chairperson of the Insurance Committee (July 2006-September 2006); Vice Chairman of Kmart Corporation (December 1998-October 2000), Chairman and Chief Executive Officer of Levitz Furniture Corporation (November 1995-November 1998) and President and Chief Executive Officer of Hills Department Stores (May 1991-July 1995); variously Chairman, Chief Executive Officer, President and Chief Operating Officer (1987-1991) of the Sears Merchandise Group of Sears, Roebuck & Co. | | | 100 | | | Trustee and member of the Hillsdale College Board of Trustees. | |
Kathleen A. Dennis (60)
c/o Kramer Levin Naftalis & Frankel LLP
Counsel to the Independent Directors
1177 Avenue of the Americas
New York, NY 10036 | | Director | | Since
August
2006 | | President, Cedarwood Associates (mutual fund and investment management consulting) (since July 2006); Chairperson of the Money Market and Alternatives Sub-Committee of the Investment Committee (since October 2006) and Director or Trustee of various Morgan Stanley Funds (since August 2006); formerly, Senior Managing Director of Victory Capital Management (1993-2006). | | | 98 | | | Director of various non-profit organizations. | |
Dr. Manuel H. Johnson (65)
c/o Johnson Smick Group, Inc.
888 16th Street, N.W.
Suite 740
Washington, D.C. 20006 | | Director | | Since
July
1991 | | Senior Partner, Johnson Smick International, Inc. (consulting firm); Chairperson of the Investment Committee (since October 2006) and Director or Trustee of various Morgan Stanley Funds (since July 1991); Co-Chairman and a founder of the Group of Seven Council (G7C) (international economic commission); formerly, Chairperson of the Audit Committee (July 1991-September 2006), Vice Chairman of the Board of Governors of the Federal Reserve System and Assistant Secretary of the U.S. Treasury. | | | 101 | | | Director of NVR, Inc. (home construction). | |
30
Morgan Stanley Institutional Fund, Inc.
Annual Report — December 31, 2013
Director and Officer Information (unaudited) (cont'd)
Independent Director: (cont'd)
Name, Age and Address of
Independent Director | | Position(s)
Held with
Registrant | | Length of Time
Served* | | Principal Occupation(s) During Past 5 Years | | Number of
Portfolios in
Fund Complex
Overseen by
Independent
Director** | | Other Directorships
Held by Independent
Director*** | |
Joseph J. Kearns (71)
c/o Kearns & Associates LLC
PMB754
22631 Pacific Coast Highway
Malibu, CA 90265 | | Director | | Since
August
1994 | | President, Kearns & Associates LLC (investment consulting); Chairperson of the Audit Committee (since October 2006) and Director or Trustee of various Morgan Stanley Funds (since August 1994); formerly, Deputy Chairperson of the Audit Committee (July 2003-September 2006) and Chairperson of the Audit Committee of various Morgan Stanley Funds (since August 1994); CFO of the J. Paul Getty Trust. | | | 101 | | | Director of Electro Rent Corporation (equipment leasing) and The Ford Family Foundation. | |
Michael F. Klein (55)
c/o Kramer Levin Naftalis & Frankel LLP
Counsel to the
Independent Directors
1177 Avenue of the Americas
New York, NY 10036 | | Director | | Since
August
2006 | | Managing Director, Aetos Capital, LLC (since March 2000) and Co-President, Aetos Alternatives Management, LLC (since January 2004) and Co-Chief Executive Officer of Aetos Capital LLC (since August 2013); Chairperson of the Fixed Income Sub-Committee of the Investment Committee (since October 2006) and Director or Trustee of various Morgan Stanley Funds (since August 2006); formerly, Managing Director, Morgan Stanley & Co. Inc. and Morgan Stanley Dean Witter Investment Management, President, various Morgan Stanley Funds (June 1998-March 2000) and Principal, Morgan Stanley & Co. Inc. and Morgan Stanley Dean Witter Investment Management (August 1997-December 1999). | | | 98 | | | Director of certain investment funds managed or sponsored by Aetos Capital, LLC. Director of Sanitized AG and Sanitized Marketing AG (specialty chemicals). | |
Michael E. Nugent (77)
522 Fifth Avenue
New York, NY 10036 | | Chairperson of the Board and Director | | Chairperson of the Boards since July 2006 and Director since July 1991 | | Chairperson of the Boards of various Morgan Stanley Funds (since July 2006); Chairperson of the Closed-End Fund Committee (since June 2012) and Director or Trustee of various Morgan Stanley Funds (since July 1991); formerly, Chairperson of the Insurance Committee (until July 2006); General Partner, Triumph Capital, L.P. (private investment partnership) (1988-2013) | | | 100 | | | None. | |
W. Allen Reed (66)
c/o Kramer Levin Naftalis & Frankel LLP
Counsel to the
Independent Directors
1177 Avenue of the Americas
New York, NY 10036 | | Director | | Since
August
2006 | | Chairperson of the Equity Sub-Committee of the Investment Committee (since October 2006) and Director or Trustee of various Morgan Stanley Funds (since August 2006); formerly, President and CEO of General Motors Asset Management; Chairman and Chief Executive Officer of the GM Trust Bank and Corporate Vice President of General Motors Corporation (August 1994-December 2005). | | | 98 | | | Director of Temple-Inland Industries (packaging and forest products); Director of Legg Mason, Inc. and Director of the Auburn University Foundation. | |
Fergus Reid (81)
c/o Joe Pietryka, Inc.
85 Charles Colman Blvd.
Pawling, NY 12564 | | Director | | Since
June
1992 | | Chairman, Joe Pietryka, Inc.; Chairperson of the Governance Committee and Director or Trustee of various Morgan Stanley Funds (since June 1992). | | | 101 | | | Through December 31, 2012, Trustee and Director of certain Investment companies in the JP Morgan Fund Complex. | |
31
Morgan Stanley Institutional Fund, Inc.
Annual Report — December 31, 2013
Director and Officer Information (unaudited) (cont'd)
Interested Director:
Name, Age and Address of
Interested Director | | Position(s)
Held with
Registrant | | Length of
Time Served* | | Principal Occupation(s) During Past 5 Years | | Number of
Portfolios in
Fund Complex
Overseen by
Interested
Director** | | Other Directorships
Held by Interested
Director*** | |
James F. Higgins (66)
One New York Plaza
New York, New York 10004 | | Director | | Since
June
2000 | | Director or Trustee of various Morgan Stanley Funds (since June 2000); Senior Advisor of Morgan Stanley (since August 2000). | | | 99 | | | Formerly, Director of AXA Financial, Inc. and AXA Equitable Life Insurance Company (2002-2011) and Director of AXA MONY Life Insurance Company and AXA MONY Life Insurance Company of America (2004-2011). | |
* Each Director serves an indefinite term, until his or her successor is elected.
** The Fund Complex includes (as of December 31, 2013) all open-end and closed-end funds (including all of their portfolios) advised by Morgan Stanley Investment Management Inc. (the "Adviser") and any funds that have an adviser that is an affiliated person of the Adviser (including, but not limited to, Morgan Stanley AIP GP LP).
*** This includes any directorships at public companies and registered investment companies held by the Director at any time during the past five years.
32
Morgan Stanley Institutional Fund, Inc.
Annual Report — December 31, 2013
Director and Officer Information (unaudited) (cont'd)
Executive Officers:
Name, Age and Address of Executive Officer | | Position(s) Held
with
Registrant | | Length of
Time Served* | | Principal Occupation(s) During Past 5 Years | |
John H. Gernon (50)
522 Fifth Avenue
New York, NY 10036 | | President and Principal Executive Officer—Equity, Fixed Income and AIP Funds | | Since September 2013 | | President and Principal Executive Officer of the Equity and Fixed Income Funds and the Morgan Stanley AIP Funds (since September 2013) in the Fund Complex. Managing Director of the Adviser. | |
Stefanie V. Chang Yu (47)
522 Fifth Avenue
New York, NY 10036 | | Chief Compliance Officer | | Since
January
2014 | | Managing Director of the Adviser and various entities affiliated with the Adviser; Chief Compliance Officer of various Morgan Stanley Funds and the Adviser (since January 2014) formerly Vice President of various Morgan Stanley Funds (December 1997-January 2014), | |
Joseph C. Benedetti (48)
522 Fifth Avenue
New York, NY 10036 | | Vice President | | Since
January
2014 | | Managing Director of the Adviser and various entities affiliated with the Adviser; Vice President of various Morgan Stanley Funds (since January 2014). | |
Francis J. Smith (48)
522 Fifth Avenue
New York, NY 10036 | | Treasurer and Principal Financial Officer | | Treasurer since July 2003 and Principal Financial Officer since September 2002 | | Executive Director of the Adviser and various entities affiliated with the Adviser; Treasurer and Principal Financial Officer of various Morgan Stanley Funds (since July 2003). | |
Mary E. Mullin (46)
522 Fifth Avenue
New York, NY 10036 | | Secretary | | Since
June
1999 | | Executive Director of the Adviser and various entities affiliated with the Adviser; Secretary of various Morgan Stanley Funds (since June 1999). | |
* Each officer serves an indefinite term, until his or her successor is elected.
33
Morgan Stanley Institutional Fund, Inc.
Annual Report — December 31, 2013
Adviser and Administrator
Morgan Stanley Investment Management Inc.
522 Fifth Avenue
New York, New York 10036
Distributor
Morgan Stanley Distribution, Inc.
522 Fifth Avenue
New York, New York 10036
Dividend Disbursing and Transfer Agent
Boston Financial Data Services, Inc.
2000 Crown Colony Drive
Quincy, Massachusetts 02169
Custodian
State Street Bank and Trust Company
One Lincoln Street
Boston, Massachusetts 02111
Legal Counsel
Dechert LLP
1095 Avenue of the Americas
New York, New York 10036
Counsel to the Independent Directors
Kramer Levin Naftalis & Frankel LLP
1177 Avenue of the Americas
New York, New York 10036
Independent Registered Public Accounting Firm
Ernst & Young LLP
200 Clarendon Street
Boston, Massachusetts 02116
Reporting to Shareholders
Each Morgan Stanley fund provides a complete schedule of portfolio holdings in its semi-annual and annual reports within 60 days of the end of the fund's second and fourth fiscal quarters by filing the schedule electronically with the Securities and Exchange Commission (SEC). The semi-annual reports are filed on Form N-CSRS and the annual reports are filed on Form N-CSR. Morgan Stanley also delivers the semi-annual and annual reports to fund shareholders and makes these reports available on its public website, www.morganstanley.com/im. Each Morgan Stanley fund also files a complete schedule of portfolio holdings with the SEC for the fund's first and third fiscal quarters on Form N-Q. Morgan Stanley does not deliver the reports for the first and third fiscal quarters to shareholders, nor are the reports posted to the Morgan Stanley public website. You may, however, obtain the Form N-Q filings (as well as the Form N-CSR and N-CSRS filings) by accessing the SEC's website, www.sec.gov. You may also review and copy them at the SEC's Public Reference Room in Washington, DC. Information on the operation of the SEC's Public Reference Room may be obtained by calling the SEC toll free at 1 (800) SEC-0330. You can also request copies of these materials, upon payment of a duplicating fee, by electronic request at the SEC's email address (publicinfo@sec.gov) or by writing the Public Reference Room of the SEC, Washington, DC 20549-0102.
Proxy Voting Policies and Procedures and Proxy Voting Record
You may obtain a copy of the Fund's Proxy Voting Policy and Procedures and information regarding how the Fund voted proxies relating to portfolio securities during the most recent twelve-month period ended June 30, without charge, upon request, by calling toll free 1 (800) 548-7786 or by visiting our website at www.morganstanley.com/im. This information is also available on the SEC's website at www.sec.gov.
This report is authorized for distribution only when preceded or accompanied by a prospectus of the Morgan Stanley Institutional Fund, Inc. which describes in detail each Investment Portfolio's investment policies, risks, fees and expenses. Please read the prospectus carefully before you invest or send money. For additional information, including information regarding the investments comprising the Portfolio, please visit our website at www.morganstanley.com/im or call toll free 1 (800) 548-7786.
34
(This Page has been left blank intentionally.)
(This Page has been left blank intentionally.)
Printed in U.S.A.
This Report has been prepared for shareholders and may be distributed to others only if preceded or accompanied by a current prospectus.
Morgan Stanley Investment Management Inc.
522 Fifth Avenue
New York, New York 10036
© 2014 Morgan Stanley. Morgan Stanley Distribution, Inc.

IFIEMEDANN
810163 EXP 2.28.15

Morgan Stanley Institutional Fund, Inc.
U.S. Real Estate Portfolio
Annual Report
December 31, 2013

Morgan Stanley Institutional Fund, Inc.
Annual Report — December 31, 2013
Shareholders' Letter | | | 2 | | |
Expense Example | | | 3 | | |
Investment Overview | | | 4 | | |
Portfolio of Investments | | | 7 | | |
Statement of Assets and Liabilities | | | 8 | | |
Statement of Operations | | | 10 | | |
Statements of Changes in Net Assets | | | 11 | | |
Financial Highlights | | | 13 | | |
Notes to Financial Statements | | | 17 | | |
Report of Independent Registered Public Accounting Firm | | | 24 | | |
Federal Tax Notice | | | 25 | | |
U.S. Privacy Policy | | | 26 | | |
Director and Officer Information | | | 29 | | |
This report is authorized for distribution only when preceded or accompanied by prospectuses of the Morgan Stanley Institutional Fund, Inc. To receive a prospectus and/or statement of additional information (SAI), which contains more complete information such as investment objectives, charges, expenses, policies for voting proxies, risk considerations, and describes in detail each of the Portfolio's investment policies to the prospective investor, please call toll free 1 (800) 548-7786. Please read the prospectuses carefully before you invest or send money.
Additionally, you can access portfolio information including performance, characteristics, and investment team commentary through Morgan Stanley Investment Management's website: www.morganstanley.com/im.
Market forecasts provided in this report may not necessarily come to pass. There is no guarantee that any sectors mentioned will continue to perform as discussed herein or that securities in such sectors will be held by the Portfolio in the future. There is no assurance that a Portfolio will achieve its investment objective. Portfolios are subject to market risk, which is the possibility that market values of securities owned by the Portfolio will decline and, therefore, the value of the Portfolio's shares may be less than what you paid for them. Accordingly, you can lose money investing in the Portfolio. Please see the prospectus for more complete information on investment risks.
1
Morgan Stanley Institutional Fund, Inc.
Annual Report — December 31, 2013
Shareholders' Letter (unaudited)
Dear Shareholders,
We are pleased to provide this Annual report, in which you will learn how your investment in U.S. Real Estate Portfolio (the "Portfolio") performed during the latest twelve-month period.
Morgan Stanley Investment Management is a client-centric, investor-led organization. Our global presence, intellectual capital, and breadth of products and services enable us to partner with investors to meet the evolving challenges of today's financial markets. We aim to deliver superior investment service and to empower our clients to make the informed decisions that help them reach their investment goals.
As always, we thank you for selecting Morgan Stanley Investment Management, and look forward to working with you in the months and years ahead.
Sincerely,

John H. Gernon
President and Principal Executive Officer
January 2014
2
Morgan Stanley Institutional Fund, Inc.
Annual Report — December 31, 2013
Expense Example (unaudited)
U.S. Real Estate Portfolio
As a shareholder of the Portfolio, you incur two types of costs: (1) transactional costs; and (2) ongoing costs, including advisory fees, administration fees, distribution and shareholder services fees and other Portfolio expenses. This example is intended to help you understand your ongoing costs (in dollars) of investing in the Portfolio and to compare these costs with the ongoing costs of investing in other mutual funds.
This example is based on an investment of $1,000 invested at the beginning of the six-month period ended December 31, 2013 and held for the entire six-month period.
Actual Expenses
The table below provides information about actual account values and actual expenses. You may use the information in this table, together with the amount you invested, to estimate the expenses that you paid over the period. Simply divide your account value by $1,000 (for example, an $8,600 account value divided by $1,000 = 8.6), then multiply the result by the number in the table under the heading entitled "Actual Expenses Paid During Period" to estimate the expenses you paid on your account during this period.
Hypothetical Example for Comparison Purposes
The table below provides information about hypothetical account values and hypothetical expenses based on the Portfolio's actual expense ratio and an assumed rate of return of 5% per year before expenses, which is not the Portfolio's actual return. The hypothetical account values and expenses may not be used to estimate the actual ending account balance or expenses you paid for the period. You may use this information to compare the ongoing costs of investing in the Portfolio and other funds. To do so, compare this 5% hypothetical example with the 5% hypothetical examples that appear in the shareholder reports of the other funds.
Please note that the expenses shown in the table are meant to highlight your ongoing costs only and do not reflect any transactional costs, such as sales charges (loads). Therefore, the information for each class in the table is useful in comparing ongoing costs only, and will not help you determine the relative total costs of owning different funds. In addition, if these transactional costs were included, your costs would have been higher.
| | | Beginning
Account
Value
7/1/13 | | Actual Ending
Account
Value
12/31/13 | | Hypothetical
Ending Account
Value | | Actual
Expenses
Paid
During
Period | | Hypothetical
Expenses Paid
During Period | | Net
Expense
Ratio
During
Period*** | |
U.S. Real Estate Portfolio Class I | | $ | 1,000.00 | | | $ | 976.40 | | | $ | 1,020.10 | | | $ | 5.03 | * | | $ | 5.14 | * | | | 1.01 | % | |
U.S. Real Estate Portfolio Class A@ | | | 1,000.00 | | | | 974.80 | | | | 1,018.60 | | | | 6.52 | * | | | 6.67 | * | | | 1.31 | | |
U.S. Real Estate Portfolio Class L | | | 1,000.00 | | | | 972.70 | | | | 1,016.08 | | | | 9.02 | * | | | 9.20 | * | | | 1.81 | | |
U.S. Real Estate Portfolio Class IS | | | 1,000.00 | | | | 1003.00 | | | | 1,012.02 | | | | 2.64 | ** | | | 2.65 | ** | | | 0.90 | | |
* Expenses are calculated using each Portfolio Class' annualized net expense ratio (as disclosed), multiplied by the average account value over the period, and multiplied by 184/365 (to reflect the most recent one-half year period).
** Expenses are calculated using the Portfolio Class' annualized net expense ratio (as disclosed), multiplied by the average account value over the period, and multiplied by 107/365 (to reflect the actual days in the period).
*** Annualized.
@ Effective September 9, 2013, Class P and Class H shares were renamed Class A shares.
3
Morgan Stanley Institutional Fund, Inc.
Annual Report — December 31, 2013
Investment Overview (unaudited)
U.S. Real Estate Portfolio
The U.S. Real Estate Portfolio seeks to provide above average current income and long-term capital appreciation by investing primarily in equity securities of companies in the U.S. real estate industry, including real estate investment trusts ("REITs").
Performance
For the year ended December 31, 2013, the Portfolio had a total return based on net asset value and reinvestment of distributions per share of 2.45%, net of fees, for Class I shares. The Portfolio's Class I shares underperformed against its benchmark, the FTSE NAREIT Equity REITs Index (the "Index"), which returned 2.47%, and underperformed the S&P 500® Index, which returned 32.39%.
Factors Affecting Performance
• The real estate investment trust (REIT) market gained 2.47% in the 12-month period ending December 31, 2013, as measured by the Index. REITs rallied approximately 20% through late-May as they benefited from yield-oriented buying and then declined by 14.5% for the remainder of the year on concerns over higher interest rates and U.S. Federal Reserve quantitative easing (QE) tapering, which was announced in December. During the year, movements in REIT share prices appeared to have been influenced by transactional evidence in the private markets of strong investor demand for core assets at valuations that demonstrate the acceptance of low expected returns as well as investors' search for yield. REITs trailed the broader equity markets during the year, as investors remained cautious towards the sector due to higher interest rates.
• Among the major sectors, the office sector outperformed, the retail sector modestly underperformed, and the apartment sector underperformed the Index. Apartment companies underperformed as they appeared to continue to be plagued by negative sentiment associated with the decelerating growth in rental rates and increased pipeline of new supply. This was somewhat surprising, as apartments tend to outperform the overall REIT sector in rising rate environments due to shorter-term leases and lower dividend yields. Within the office sector, companies with exposure to central business district (CBD) assets and suburban office assets outperformed, while the specialty office companies underperformed the
Index. The retail sector modestly underperformed as the owners of shopping centers outperformed and the owners of malls underperformed the Index. The health care REITs underperformed the Index, as the sector had been a beneficiary of investors' chase for higher yields in the earlier part of 2013, which appeared to reverse. Among the smaller sectors, the hotel sector significantly outperformed likely due to an improved outlook for the economy. The net lease, storage and industrial sectors outperformed the Index.
• The Portfolio modestly underperformed the Index for the period. Positive contributions from top-down sector allocation and, to a lesser degree, from bottom-up stock selection impacted the Portfolio's performance relative to the Index. From a bottom-up perspective, the Portfolio achieved favorable relative stock selection in the diversified, net lease, mall and hotel sectors. This was partially offset by the negative impact of stock selection in the apartment, health care, shopping center and suburban office sectors. From a top-down perspective, the overweight to the hotel sector, and the underweight to the health care and specialty office sectors contributed to relative performance. This was partially offset by the underweight to the net lease sector and the overweight to the apartment and diversified sectors, which dampened performance.
Management Strategies
• We have maintained our core investment philosophy as a real estate value investor. This results in the ownership of stocks whose share prices provide real estate exposure at the best valuation relative to their underlying asset values. We continue to focus on relative implied valuations as a key metric. Our company-specific research leads us to an overweighting in the Portfolio to a group of companies that are focused in the ownership of high quality malls, apartments, CBD office assets, upscale hotels and a number of out-of-favor companies, and an underweighting to companies concentrated in the ownership of net lease, health care, suburban office, specialty office, shopping center, storage and industrial assets.
• Our outlook for the REIT market is based on two key factors: private market pricing for underlying real estate assets and public market pricing for the
4
Morgan Stanley Institutional Fund, Inc.
Annual Report — December 31, 2013
Investment Overview (unaudited) (cont'd)
U.S. Real Estate Portfolio
securities. With asset values for high-quality assets having fully recovered and now, on average, modestly in excess of their all-time peak levels achieved in mid-2007, the overall REIT market ended the year at a modest premium to Net Asset Values (NAV). This reflects a bifurcation in the market between the core property sectors (apartments, malls) trading at meaningful discounts to NAVs and finance-company/dividend-oriented stocks (health care, net lease) trading at significant premiums to NAV. It is noteworthy that the sector ended the year trading below its historical average premium to NAV, most likely due to investor concerns with regard to rising rates negatively impacting asset values.
* Minimum Investment for Class I shares
In accordance with SEC regulations, Portfolio's performance shown assumes that all recurring fees (including management fees) were deducted and all dividends and distributions were reinvested. The performance of Class A+, L and IS shares will vary from Class I shares based upon their different inception dates and will be negatively impacted by additional fees assessed to those classes (if applicable).
Performance Compared to the FTSE NAREIT Equity REITs Index(1), the S&P 500® Index(2), and the Lipper Real Estate Funds Average(3)
| | | Period Ended December 31, 2013
Total Returns(4) | |
| | | | | Average Annual | |
| | | One
Year | | Five
Years | | Ten
Years | | Since
Inception(9) | |
Portfolio — Class I Shares
w/o sales charges(5) | | | 2.45 | % | | | 16.19 | % | | | 9.38 | % | | | 12.31 | % | |
FTSE NAREIT Equity REITs Index | | | 2.47 | | | | 16.50 | | | | 8.42 | | | | 10.68 | | |
S&P 500® Index | | | 32.39 | | | | 17.94 | | | | 7.40 | | | | 9.36 | | |
Lipper Real Estate Funds Average | | | 1.70 | | | | 16.41 | | | | 7.77 | | | | 10.81 | | |
Portfolio — Class A+ Shares
w/o sales charges(6) | | | 2.14 | | | | 15.87 | | | | 9.10 | | | | 11.39 | | |
Portfolio — Class A+ Shares with
maximum 5.25% sales charges(6) | | | -3.22 | | | | 14.64 | | | | 8.51 | | | | 11.06 | | |
FTSE NAREIT Equity REITs Index | | | 2.47 | | | | 16.50 | | | | 8.42 | | | | 10.36 | | |
S&P 500® Index | | | 32.39 | | | | 17.94 | | | | 7.40 | | | | 8.23 | | |
Lipper Real Estate Funds Average | | | 1.70 | | | | 16.41 | | | | 7.77 | | | | 10.37 | | |
Portfolio — Class L Shares
w/o sales charges(7) | | | 1.62 | | | | — | | | | — | | | | 8.35 | | |
FTSE NAREIT Equity REITs Index | | | 2.47 | | | | — | | | | — | | | | 10.46 | | |
S&P 500® Index | | | 32.39 | | | | — | | | | — | | | | 22.14 | | |
Lipper Real Estate Funds Average | | | 1.70 | | | | — | | | | — | | | | 11.03 | | |
Portfolio — Class IS Shares
w/o sales charges(8) | | | — | | | | — | | | | — | | | | 0.30 | | |
FTSE NAREIT Equity REITs Index | | | — | | | | — | | | | — | | | | -0.26 | | |
S&P 500® Index | | | — | | | | — | | | | — | | | | 10.16 | | |
Lipper Real Estate Funds Average | | | — | | | | — | | | | — | | | | 0.23 | | |
Performance data quoted represents past performance, which is no guarantee of future results, and current performance may be lower or higher than the figures shown. Performance assumes that all dividends and distributions, if any, were reinvested. For the most recent month-end performance figures, please visit www.morganstanley.com/im. Investment return and principal value will fluctuate so that Portfolio shares, when redeemed, may be worth more or less than their original cost. Total returns do not reflect the deduction of taxes that a shareholder would pay on Portfolio distributions or the redemption of Portfolio shares. Returns for periods less than one year are not annualized. Performance of share classes will vary due to difference in expenses.
+ Effective September 9, 2013, Class P shares were renamed Class A shares.
(1) The FTSE NAREIT (National Association of Real Estate Investment Trusts) Equity REITs Index is free float-adjusted market capitalization weighted index of tax-qualified REITs listed on the New York Stock Exchange, NYSE Amex and the NASDAQ National Market Systems. Effective December 20, 2010, the FTSE NAREIT Equity REITs Index will not include "Timber REITs" The Index is unmanaged and its returns do not include any sales charges or fees. Such costs would lower performance. It is not possible to invest directly in an index.
(2) The Standard & Poor's 500® Index (S&P 500®) measures the performance of the large cap segment of the U.S. equities market, covering approximately 75% of the U.S. equities market. The Index includes 500 leading companies in leading industries of the U.S. economy. The Index is unmanaged and its returns do not include any sales charges or fees. Such costs would lower performance. It is not possible to invest directly in an index.
(3) The Lipper Real Estate Funds Average tracks the performance of all funds in the Lipper Real Estate Funds classification. The Average, which is adjusted for capital gains distributions and income dividends, is unmanaged and should not be considered an investment. As of the date of this report, the Portfolio is in the Lipper Real Estate Funds classification.
5
Morgan Stanley Institutional Fund, Inc.
Annual Report — December 31, 2013
Investment Overview (unaudited) (cont'd)
U.S. Real Estate Portfolio
(4) Total returns for the Portfolio reflect fees waived and expenses reimbursed, if applicable, by the Adviser. Without such waivers and reimbursements, total returns would have been lower. The fee waivers and/or expense reimbursements will continue for at least one year or until such time as the Fund's Board of Directors acts to discontinue all or a portion of such waivers and/or expense reimbursements when it deems that such action is appropriate.
(5) Commenced operations on February 24, 1995.
(6) Commenced offering on January 2, 1996.
(7) Commenced offering on November 11, 2011.
(8) Commenced offering on September 13, 2013.
(9) For comparative purposes, average annual since inception returns listed for the Indexes refer to the inception date or initial offering of the respective share class of the Portfolio, not the inception of the Index. Returns for periods less than one year are not annualized.
Portfolio Composition
Classification | | Percentage of
Total Investments | |
Regional Malls | | | 23.3 | % | |
Apartments | | | 18.3 | | |
Lodging/Resorts | | | 10.5 | | |
Health Care | | | 10.1 | | |
Diversified | | | 8.6 | | |
Office | | | 7.6 | | |
Industrial | | | 6.5 | | |
Shopping Centers | | | 5.9 | | |
Self Storage | | | 5.3 | | |
Other* | | | 3.9 | | |
Total Investments | | | 100.0 | % | |
* Industries and/or investment types representing less than 5% of total investments.
6
Morgan Stanley Institutional Fund, Inc.
Annual Report — December 31, 2013
Portfolio of Investments
U.S. Real Estate Portfolio
| | | Shares | | Value
(000) | |
Common Stocks (99.1%) | |
Apartments (18.2%) | |
American Campus Communities, Inc. REIT | | | 164,404 | | | $ | 5,296 | | |
AvalonBay Communities, Inc. REIT | | | 412,249 | | | | 48,740 | | |
BRE Properties, Inc. REIT | | | 40,246 | | | | 2,202 | | |
Camden Property Trust REIT | | | 322,329 | | | | 18,334 | | |
Equity Residential REIT | | | 1,730,253 | | | | 89,748 | | |
Post Properties, Inc. REIT | | | 10,700 | | | | 484 | | |
| | | | 164,804 | | |
Diversified (8.6%) | |
Cousins Properties, Inc. REIT | | | 660,243 | | | | 6,801 | | |
Forest City Enterprises, Inc., Class A (a) | | | 439,398 | | | | 8,392 | | |
Lexington Realty Trust REIT | | | 47,340 | | | | 483 | | |
Vornado Realty Trust REIT | | | 669,996 | | | | 59,489 | | |
Winthrop Realty Trust REIT | | | 230,072 | | | | 2,542 | | |
| | | | 77,707 | | |
Health Care (10.1%) | |
HCP, Inc. REIT | | | 1,078,856 | | | | 39,184 | | |
Health Care, Inc. REIT | | | 102,865 | | | | 5,510 | | |
Healthcare Realty Trust, Inc. REIT | | | 459,442 | | | | 9,791 | | |
Senior Housing Properties Trust REIT | | | 595,765 | | | | 13,244 | | |
Ventas, Inc. REIT | | | 410,069 | | | | 23,489 | | |
| | | | 91,218 | | |
Industrial (6.5%) | |
Cabot Industrial Value Fund II, LP REIT (a)(b)(c)(d) | | | 14,000 | | | | 6,058 | | |
DCT Industrial Trust, Inc. REIT | | | 970,842 | | | | 6,922 | | |
Exeter Industrial Value Fund, LP REIT (a)(b)(c)(d) | | | 7,905,000 | | | | 6,695 | | |
Keystone Industrial Fund, LP REIT (a)(b)(c)(d) | | | 7,574,257 | | | | 7,923 | | |
KTR Industrial Fund II, LP REIT (a)(b)(c)(d) | | | 9,195,652 | | | | 9,803 | | |
ProLogis, Inc. REIT | | | 543,918 | | | | 20,098 | | |
Rexford Industrial Realty, Inc. REIT | | | 102,240 | | | | 1,350 | | |
| | | | 58,849 | | |
Lodging/Resorts (10.5%) | |
Ashford Hospitality Prime, Inc. REIT | | | 87,337 | | | | 1,590 | | |
Ashford Hospitality Trust, Inc. REIT | | | 436,686 | | | | 3,616 | | |
Host Hotels & Resorts, Inc. REIT | | | 3,659,642 | | | | 71,143 | | |
Starwood Hotels & Resorts Worldwide, Inc. | | | 232,062 | | | | 18,437 | | |
| | | | 94,786 | | |
Manufactured Homes (1.2%) | |
Equity Lifestyle Properties, Inc. REIT | | | 304,276 | | | | 11,024 | | |
Mixed Industrial/Office (1.1%) | |
Duke Realty Corp. REIT | | | 321,565 | | | | 4,836 | | |
Liberty Property Trust REIT | | | 61,670 | | | | 2,089 | | |
PS Business Parks, Inc. REIT | | | 34,911 | | | | 2,668 | | |
| | | | 9,593 | | |
Office (7.6%) | |
Alexandria Real Estate Equities, Inc. REIT | | | 133,330 | | | | 8,483 | | |
Boston Properties, Inc. REIT | | | 313,870 | | | | 31,503 | | |
BRCP REIT I, LP (a)(b)(c)(d) | | | 6,101,396 | | | | 1,257 | | |
BRCP REIT II, LP (a)(b)(c)(d) | | | 8,363,574 | | | | 4,424 | | |
Brookfield Office Properties, Inc. | | | 36,238 | | | | 698 | | |
| | | Shares | | Value
(000) | |
Hudson Pacific Properties, Inc. REIT | | | 385,284 | | | $ | 8,426 | | |
Mack-Cali Realty Corp. REIT | | | 657,128 | | | | 14,115 | | |
| | | | 68,906 | | |
Regional Malls (23.3%) | |
CBL & Associates Properties, Inc. REIT | | | 91,630 | | | | 1,646 | | |
General Growth Properties, Inc. REIT | | | 1,883,942 | | | | 37,811 | | |
Macerich Co. (The) REIT | | | 376,015 | | | | 22,143 | | |
Simon Property Group, Inc. REIT | | | 917,085 | | | | 139,544 | | |
Taubman Centers, Inc. REIT | | | 146,465 | | | | 9,362 | | |
| | | | 210,506 | | |
Retail Free Standing (0.9%) | |
National Retail Properties, Inc. REIT | | | 191,440 | | | | 5,806 | | |
Realty Income Corp. REIT | | | 67,610 | | | | 2,524 | | |
| | | | 8,330 | | |
Self Storage (5.2%) | |
Public Storage REIT | | | 296,229 | | | | 44,588 | | |
Sovran Self Storage, Inc. REIT | | | 43,088 | | | | 2,808 | | |
| | | | 47,396 | | |
Shopping Centers (5.9%) | |
Acadia Realty Trust REIT | | | 120,707 | | | | 2,997 | | |
DDR Corp. REIT | | | 409,616 | | | | 6,296 | | |
Federal Realty Investment Trust REIT | | | 88,415 | | | | 8,966 | | |
Regency Centers Corp. REIT | | | 748,556 | | | | 34,658 | | |
| | | | 52,917 | | |
Total Common Stocks (Cost $733,089) | | | 896,036 | | |
Short-Term Investment (0.7%) | |
Investment Company (0.7%) | |
Morgan Stanley Institutional Liquidity
Funds — Treasury Portfolio —
Institutional Class (See Note G)
(Cost $6,203) | | | 6,202,872 | | | | 6,203 | | |
Total Investments (99.8%) (Cost $739,292) | | | 902,239 | | |
Other Assets in Excess of Liabilities (0.2%) | | | 1,491 | | |
Net Assets (100.0%) | | $ | 903,730 | | |
(a) Non-income producing security.
(b) Security has been deemed illiquid at December 31, 2013.
(c) At December 31, 2013, the Portfolio held fair valued securities valued at approximately $36,160,000, representing 4.0% of net assets. These securities have been fair valued as determined in good faith under procedures established by and under the general supervision of the Fund's Directors.
(d) Restricted security valued at fair value and not registered under the Securities Act of 1933. BRCP REIT I, LP was acquired between 5/03 - 5/08 and has a cost basis of approximately $1,009,000. BRCP REIT II, LP was acquired between 10/06 - 4/11 and has a current cost basis of approximately $8,364,000. Cabot Industrial Value Fund II, LP was acquired between 11/05 - 2/10 and has a current cost basis of approximately $7,000,000. Exeter Industrial Value Fund, LP was acquired between 11/07 - 4/11 and has a current cost basis of approximately $6,421,000. Keystone Industrial Fund, LP was acquired between 3/06 - 6/11 and has a current cost basis of approximately $5,437,000. KTR Industrial Fund II, LP was acquired between 1/09 - 5/12 and has a current cost basis of approximately $5,211,000. At December 31, 2013, these securities had an aggregate market value of approximately $36,160,000, representing 4.0% of net assets.
REIT Real Estate Investment Trust.
The accompanying notes are an integral part of the financial statements.
7
Morgan Stanley Institutional Fund, Inc.
Annual Report — December 31, 2013
U.S. Real Estate Portfolio
Statement of Assets and Liabilities | | December 31, 2013
(000) | |
Assets: | |
Investments in Securities of Unaffiliated Issuers, at Value (Cost $733,089) | | $ | 896,036 | | |
Investment in Security of Affiliated Issuer, at Value (Cost $6,203) | | | 6,203 | | |
Total Investments in Securities, at Value (Cost $739,292) | | | 902,239 | | |
Foreign Currency, at Value (Cost $1) | | | 1 | | |
Dividends Receivable | | | 4,116 | | |
Receivable for Investments Sold | | | 2,232 | | |
Receivable for Portfolio Shares Sold | | | 1,461 | | |
Receivable from Affiliate | | | — | @ | |
Other Assets | | | 31 | | |
Total Assets | | | 910,080 | | |
Liabilities: | |
Payable for Portfolio Shares Redeemed | | | 2,097 | | |
Payable for Advisory Fees | | | 1,732 | | |
Payable for Investments Purchased | | | 1,273 | | |
Payable for Sub Transfer Agency Fees | | | 692 | | |
Payable for Sub Transfer Agency Fees — Class I | | | 321 | | |
Payable for Sub Transfer Agency Fees — Class A* | | | 43 | | |
Payable for Sub Transfer Agency Fees — Class L | | | 2 | | |
Payable for Administration Fees | | | 62 | | |
Payable for Shareholder Services Fees — Class A* | | | 21 | | |
Payable for Distribution and Shareholder Services Fees — Class L | | | 3 | | |
Payable for Directors' Fees and Expenses | | | 14 | | |
Payable for Custodian Fees | | | 8 | | |
Payable for Transfer Agent Fees — Class I | | | 4 | | |
Payable for Transfer Agent Fees — Class A* | | | 3 | | |
Payable for Transfer Agent Fees — Class L | | | 1 | | |
Payable for Transfer Agent Fees — Class IS | | | — | @ | |
Payable for Professional Fees | | | 7 | | |
Other Liabilities | | | 67 | | |
Total Liabilities | | | 6,350 | | |
Net Assets | | $ | 903,730 | | |
Net Assets Consist Of: | |
Paid-in-Capital | | $ | 737,622 | | |
Accumulated Undistributed Net Investment Income | | | 478 | | |
Accumulated Net Realized Gain | | | 2,683 | | |
Unrealized Appreciation (Depreciation) on: | |
Investments | | | 162,947 | | |
Foreign Currency Translations | | | (— | @) | |
Net Assets | | $ | 903,730 | | |
The accompanying notes are an integral part of the financial statements.
8
Morgan Stanley Institutional Fund, Inc.
Annual Report — December 31, 2013
U.S. Real Estate Portfolio
Statement of Assets and Liabilities (cont'd) | | December 31, 2013
(000) | |
CLASS I: | |
Net Assets | | $ | 797,933 | | |
| Shares Outstanding $0.001 par value shares of beneficial interest (500,000,000 shares authorized) (not in 000's) | | | 48,225,263 | | |
Net Asset Value, Offering and Redemption Price Per Share | | $ | 16.55 | | |
CLASS A*: | |
Net Assets | | $ | 101,325 | | |
| Shares Outstanding $0.001 par value shares of beneficial interest (500,000,000 shares authorized) (not in 000's) | | | 6,249,364 | | |
Net Asset Value, Redemption Price Per Share | | $ | 16.21 | | |
Maximum Sales Load§§ | | | 5.25 | % | |
Maximum Sales Charge | | $ | 0.90 | | |
Maximum Offering Price Per Share | | $ | 17.11 | | |
CLASS L: | |
Net Assets | | $ | 4,462 | | |
| Shares Outstanding $0.001 par value shares of beneficial interest (500,000,000 shares authorized) (not in 000's) | | | 275,403 | | |
Net Asset Value, Offering and Redemption Price Per Share | | $ | 16.20 | | |
CLASS IS: | |
Net Assets | | $ | 10 | | |
| Shares Outstanding $0.001 par value shares of beneficial interest (500,000,000 shares authorized) (not in 000's) | | | 584 | | |
Net Asset Value, Offering and Redemption Price Per Share | | $ | 16.55 | | |
@ Amount is less than $500.
* Effective September 9, 2013, Class P and Class H shares were renamed Class A shares.
§§ Effective February 25, 2013, the Directors approved the imposition of a maximum initial sales charge of 5.25% on purchases of Class A shares of the Portfolio.
The accompanying notes are an integral part of the financial statements.
9
Morgan Stanley Institutional Fund, Inc.
Annual Report — December 31, 2013
U.S. Real Estate Portfolio
Statement of Operations | | Year Ended
December 31, 2013
(000) | |
Investment Income: | |
Dividends from Securities of Unaffiliated Issuers (Net of $6 of Foreign Taxes Withheld) | | $ | 25,628 | | |
Dividends from Security of Affiliated Issuer (Note G) | | | 3 | | |
Total Investment Income | | | 25,631 | | |
Expenses: | |
Advisory Fees (Note B) | | | 7,853 | | |
Sub Transfer Agency Fees | | | 948 | | |
Sub Transfer Agency Fees — Class I | | | 344 | | |
Sub Transfer Agency Fees — Class A* | | | 50 | | |
Sub Transfer Agency Fees — Class L | | | 2 | | |
Administration Fees (Note C) | | | 813 | | |
Shareholder Services Fees — Class A* (Note D) | | | 284 | | |
Distribution and Shareholder Services Fees — Class L (Note D) | | | 39 | | |
Shareholder Reporting Fees | | | 99 | | |
Registration Fees | | | 90 | | |
Professional Fees | | | 88 | | |
Custodian Fees (Note F) | | | 41 | | |
Transfer Agency Fees (Note E) | | | 28 | | |
Transfer Agency Fees — Class I (Note E) | | | 5 | | |
Transfer Agency Fees — Class A* (Note E) | | | 3 | | |
Transfer Agency Fees — Class L (Note E) | | | 1 | | |
Directors' Fees and Expenses | | | 24 | | |
Pricing Fees | | | 4 | | |
Other Expenses | | | 31 | | |
Expenses Before Non Operating Expenses | | | 10,747 | | |
Bank Overdraft Expense | | | 2 | | |
Investment Related Expenses | | | 101 | | |
Total Expenses | | | 10,850 | | |
Waiver of Advisory Fees (Note B) | | | (129 | ) | |
Reimbursement of Class Specific Expenses — Class I (Note B) | | | (104 | ) | |
Reimbursement of Class Specific Expenses — Class IS (Note B) | | | (— | @) | |
Rebate from Morgan Stanley Affiliate (Note G) | | | (17 | ) | |
Net Expenses | | | 10,600 | | |
Net Investment Income | | | 15,031 | | |
Realized Gain: | |
Investments Sold | | | 27,034 | | |
Foreign Currency Transactions | | | — | @ | |
Net Realized Gain | | | 27,034 | | |
Change in Unrealized Appreciation (Depreciation): | |
Investments | | | (19,185 | ) | |
Foreign Currency Translations | | | (— | @) | |
Net Change in Unrealized Appreciation (Depreciation) | | | (19,185 | ) | |
Net Realized Gain and Change in Unrealized Appreciation (Depreciation) | | | 7,849 | | |
Net Increase in Net Assets Resulting from Operations | | $ | 22,880 | | |
@ Amount is less than $500.
* Effective September 9, 2013, Class P and Class H shares were renamed Class A shares.
The accompanying notes are an integral part of the financial statements.
10
Morgan Stanley Institutional Fund, Inc.
Annual Report — December 31, 2013
U.S. Real Estate Portfolio
Statements of Changes in Net Assets | | Year Ended
December 31,
2013
(000) | | Year Ended
December 31,
2012
(000) | |
Increase (Decrease) in Net Assets: | |
Operations: | |
Net Investment Income | | $ | 15,031 | | | $ | 14,617 | | |
Net Realized Gain | | | 27,034 | | | | 24,903 | | |
Net Change in Unrealized Appreciation (Depreciation) | | | (19,185 | ) | | | 103,917 | | |
Net Increase in Net Assets Resulting from Operations | | | 22,880 | | | | 143,437 | | |
Distributions from and/or in Excess of: | |
Class I: | |
Net Investment Income | | | (18,870 | ) | | | (10,207 | ) | |
Net Realized Gain | | | (19,628 | ) | | | (14,424 | ) | |
Class A*: | |
Net Investment Income | | | (1,988 | ) | | | (924 | ) | |
Net Realized Gain | | | (2,365 | ) | | | (1,660 | ) | |
Class H@@: | |
Net Investment Income | | | (101 | )** | | | (252 | ) | |
Net Realized Gain | | | (123 | )** | | | (457 | ) | |
Class L: | |
Net Investment Income | | | (69 | ) | | | (23 | ) | |
Net Realized Gain | | | (113 | ) | | | (89 | ) | |
Class IS: | |
Net Investment Income | | | (— | @)*** | | | — | | |
Net Realized Gain | | | (— | @)*** | | | — | | |
Total Distributions | | | (43,257 | ) | | | (28,036 | ) | |
Capital Share Transactions:(1) | |
Class I: | |
Subscribed | | | 393,679 | | | | 222,400 | | |
Distributions Reinvested | | | 30,554 | | | | 21,453 | | |
Redeemed | | | (433,966 | ) | | | (289,977 | ) | |
Class A*: | |
Subscribed | | | 24,542 | | | | 25,720 | | |
Distributions Reinvested | | | 4,337 | | | | 2,520 | | |
Conversion from Class H | | | 23,632 | | | | — | | |
Redeemed | | | (42,145 | ) | | | (40,050 | ) | |
Class H@@: | |
Subscribed | | | 2,068 | ** | | | 1,841 | | |
Distributions Reinvested | | | 216 | ** | | | 689 | | |
Conversion to Class A | | | (23,632 | ) | | | — | | |
Redeemed | | | (3,794 | )** | | | (7,058 | ) | |
Class L: | |
Subscribed | | | 533 | | | | 152 | | |
Distributions Reinvested | | | 179 | | | | 108 | | |
Redeemed | | | (1,138 | ) | | | (1,875 | ) | |
Class IS: | |
Subscribed | | | 10 | *** | | | — | | |
Net Decrease in Net Assets Resulting from Capital Share Transactions | | | (24,925 | ) | | | (64,077 | ) | |
Total Increase (Decrease) in Net Assets | | | (45,302 | ) | | | 51,324 | | |
Net Assets: | |
Beginning of Period | | | 949,032 | | | | 897,708 | | |
End of Period (Including Accumulated Undistributed Net Investment Income of $478 and $4,180) | | $ | 903,730 | | | $ | 949,032 | | |
The accompanying notes are an integral part of the financial statements.
11
Morgan Stanley Institutional Fund, Inc.
Annual Report — December 31, 2013
U.S. Real Estate Portfolio
Statements of Changes in Net Assets (cont'd) | | Year Ended
December 31,
2013
(000) | | Year Ended
December 31,
2012
(000) | |
(1) Capital Share Transactions: | |
Class I: | |
Shares Subscribed | | | 22,284 | | | | 13,406 | | |
Shares Issued on Distributions Reinvested | | | 1,827 | | | | 1,280 | | |
Shares Redeemed | | | (24,704 | ) | | | (17,453 | ) | |
Net Decrease in Class I Shares Outstanding | | | (593 | ) | | | (2,767 | ) | |
Class A*: | |
Shares Subscribed | | | 1,437 | | | | 1,586 | | |
Shares Issued on Distributions Reinvested | | | 266 | | | | 153 | | |
Conversion from Class H | | | 1,442 | | | | — | | |
Shares Redeemed | | | (2,453 | ) | | | (2,442 | ) | |
Net Increase (Decrease) in Class A Shares Outstanding | | | 692 | | | | (703 | ) | |
Class H@@: | |
Shares Subscribed | | | 118 | ** | | | 112 | | |
Shares Issued on Distributions Reinvested | | | 12 | ** | | | 42 | | |
Conversion to Class A | | | (1,442 | ) | | | — | | |
Shares Redeemed | | | (218 | )** | | | (436 | ) | |
Net Decrease in Class H Shares Outstanding | | | (1,530 | ) | | | (282 | ) | |
Class L: | |
Shares Subscribed | | | 31 | | | | 9 | | |
Shares Issued on Distributions Reinvested | | | 11 | | | | 7 | | |
Shares Redeemed | | | (67 | ) | | | (116 | ) | |
Net Decrease in Class L Shares Outstanding | | | (25 | ) | | | (100 | ) | |
Class IS: | |
Shares Subscribed | | | 1 | *** | | | — | | |
@ Amount is less than $500.
@@ Effective September 9, 2013, Class H shares converted into Class A shares.
* Effective September 9, 2013, Class P shares were renamed Class A shares.
** For the period January 1, 2013 through September 6, 2013.
*** For the period September 13, 2013 through December 31, 2013.
The accompanying notes are an integral part of the financial statements.
12
Morgan Stanley Institutional Fund, Inc.
Annual Report — December 31, 2013
Financial Highlights
U.S. Real Estate Portfolio
| | | Class I | |
| | | Year Ended December 31, | |
Selected Per Share Data and Ratios | | 2013 | | 2012 | | 2011 | | 2010 | | 2009 | |
Net Asset Value, Beginning of Period | | $ | 16.93 | | | $ | 14.99 | | | $ | 14.33 | | | $ | 11.18 | | | $ | 8.87 | | |
Income (Loss) from Investment Operations: | |
Net Investment Income† | | | 0.27 | | | | 0.24 | | | | 0.11 | | | | 0.30 | | | | 0.23 | | |
Net Realized and Unrealized Gain (Loss) | | | 0.14 | | | | 2.19 | | | | 0.69 | | | | 3.02 | | | | 2.30 | | |
Total from Investment Operations | | | 0.41 | | | | 2.43 | | | | 0.80 | | | | 3.32 | | | | 2.53 | | |
Distributions from and/or in Excess of: | |
Net Investment Income | | | (0.20 | ) | | | (0.20 | ) | | | (0.14 | ) | | | (0.17 | ) | | | (0.22 | ) | |
Net Realized Gain | | | (0.59 | ) | | | (0.29 | ) | | | — | | | | — | | | | — | | |
Total Distributions | | | (0.79 | ) | | | (0.49 | ) | | | (0.14 | ) | | | (0.17 | ) | | | (0.22 | ) | |
Redemption Fees | | | — | | | | — | | | | — | | | | — | | | | 0.00 | ‡ | |
Net Asset Value, End of Period | | $ | 16.55 | | | $ | 16.93 | | | $ | 14.99 | | | $ | 14.33 | | | $ | 11.18 | | |
Total Return++ | | | 2.45 | % | | | 16.26 | % | | | 5.57 | % | | | 29.86 | % | | | 29.65 | % | |
Ratios and Supplemental Data: | |
Net Assets, End of Period (Thousands) | | $ | 797,933 | | | $ | 826,420 | | | $ | 773,138 | | | $ | 855,474 | | | $ | 584,820 | | |
Ratio of Expenses to Average Net Assets (1) | | | 1.01 | %+ | | | 0.98 | %+†† | | | 1.01 | %+ | | | 0.99 | %+†† | | | 0.99 | %+ | |
Ratio of Expenses to Average Net Assets Excluding Non Operating Expenses | | | 1.00 | %+ | | | 0.97 | %+†† | | | 1.00 | %+ | | | 0.98 | %+†† | | | 0.96 | %+ | |
Ratio of Net Investment Income to Average Net Assets (1) | | | 1.51 | %+ | | | 2.45 | %+†† | | | 0.76 | %+ | | | 2.34 | %+†† | | | 2.70 | %+ | |
Ratio of Rebate from Morgan Stanley Affiliates to Average Net Assets | | | 0.00 | %§ | | | 0.00 | %††§ | | | 0.00 | %§ | | | 0.00 | %††§ | | | 0.00 | %§ | |
Portfolio Turnover Rate | | | 24 | % | | | 22 | % | | | 21 | % | | | 41 | % | | | 30 | % | |
(1) Supplemental Information on the Ratios to Average Net Assets: | |
Ratios Before Expense Limitation: | |
Expenses to Average Net Assets | | | 1.03 | % | | | N/A | | | | 1.03 | % | | | N/A | | | | 1.00 | %+ | |
Net Investment Income to Average Net Assets | | | 1.49 | % | | | N/A | | | | 0.74 | % | | | N/A | | | | 2.69 | %+ | |
† Per share amount is based on average shares outstanding.
‡ Amount is less than $0.005 per share.
++ Calculated based on the net asset value as of the last business day of the period.
+ The Ratios of Expenses and Net Investment Income reflect the rebate of certain Portfolio expenses in connection with the investments in Morgan Stanley affiliates during the period. The effect of the rebate on the ratios is disclosed in the above table as "Ratio of Rebate from Morgan Stanley Affiliates to Average Net Assets."
†† Reflects overall Portfolio ratios for investment income and non-class specific expenses.
§ Amount is less than 0.005%.
The accompanying notes are an integral part of the financial statements.
13
Morgan Stanley Institutional Fund, Inc.
Annual Report — December 31, 2013
Financial Highlights
U.S. Real Estate Portfolio
| | | Class A@ | |
| | | Year Ended December 31, | |
Selected Per Share Data and Ratios | | 2013 | | 2012 | | 2011 | | 2010 | | 2009 | |
Net Asset Value, Beginning of Period | | $ | 16.60 | | | $ | 14.70 | | | $ | 14.07 | | | $ | 10.99 | | | $ | 8.73 | | |
Income (Loss) from Investment Operations: | |
Net Investment Income† | | | 0.23 | | | | 0.19 | | | | 0.08 | | | | 0.26 | | | | 0.21 | | |
Net Realized and Unrealized Gain (Loss) | | | 0.12 | | | | 2.16 | | | | 0.66 | | | | 2.96 | | | | 2.25 | | |
Total from Investment Operations | | | 0.35 | | | | 2.35 | | | | 0.74 | | | | 3.22 | | | | 2.46 | | |
Distributions from and/or in Excess of: | |
Net Investment Income | | | (0.15 | ) | | | (0.16 | ) | | | (0.11 | ) | | | (0.14 | ) | | | (0.20 | ) | |
Net Realized Gain | | | (0.59 | ) | | | (0.29 | ) | | | — | | | | — | | | | — | | |
Total Distributions | | | (0.74 | ) | | | (0.45 | ) | | | (0.11 | ) | | | (0.14 | ) | | | (0.20 | ) | |
Redemption Fees | | | — | | | | — | | | | — | | | | — | | | | 0.00 | ‡ | |
Net Asset Value, End of Period | | $ | 16.21 | | | $ | 16.60 | | | $ | 14.70 | | | $ | 14.07 | | | $ | 10.99 | | |
Total Return++ | | | 2.14 | % | | | 16.02 | % | | | 5.26 | % | | | 29.51 | % | | | 29.31 | % | |
Ratios and Supplemental Data: | |
Net Assets, End of Period (Thousands) | | $ | 101,325 | | | $ | 92,240 | | | $ | 92,047 | | | $ | 89,321 | | | $ | 116,164 | | |
Ratio of Expenses to Average Net Assets (1) | | | 1.28 | %+^ | | | 1.23 | %+†† | | | 1.26 | %+ | | | 1.24 | %+†† | | | 1.24 | %+ | |
Ratio of Expenses to Average Net Assets Excluding Non Operating Expenses | | | 1.27 | %+^ | | | 1.22 | %+†† | | | 1.25 | %+ | | | 1.23 | %+†† | | | 1.21 | %+ | |
Ratio of Net Investment Income to Average Net Assets (1) | | | 1.35 | %+ | | | 2.20 | %+†† | | | 0.54 | %+ | | | 2.09 | %+†† | | | 2.45 | %+ | |
Ratio of Rebate from Morgan Stanley Affiliates to Average Net Assets | | | 0.00 | %§ | | | 0.00 | %††§ | | | 0.00 | %§ | | | 0.00 | %††§ | | | 0.00 | %§ | |
Portfolio Turnover Rate | | | 24 | % | | | 22 | % | | | 21 | % | | | 41 | % | | | 30 | % | |
(1) Supplemental Information on the Ratios to Average Net Assets: | |
Ratios Before Expense Limitation: | |
Expenses to Average Net Assets | | | 1.29 | % | | | N/A | | | | 1.28 | % | | | N/A | | | | 1.25 | %+ | |
Net Investment Income to Average Net Assets | | | 1.34 | % | | | N/A | | | | 0.52 | % | | | N/A | | | | 2.44 | %+ | |
@ Effective September 9, 2013, Class P and Class H shares were renamed Class A shares.
† Per share amount is based on average shares outstanding.
‡ Amount is less than $0.005 per share.
++ Calculated based on the net asset value which does not reflect sales charges, if applicable, as of the last business day of the period.
+ The Ratios of Expenses and Net Investment Income reflect the rebate of certain Portfolio expenses in connection with the investments in Morgan Stanley affiliates during the period. The effect of the rebate on the ratios is disclosed in the above table as "Ratio of Rebate from Morgan Stanley Affiliates to Average Net Assets."
^ Effective September 16, 2013, the Adviser has agreed to limit the ratio of expenses to average net assets to the maximum ratio of 1.35% for Class A shares. Prior to September 16, 2013, the maximum ratio was 1.25% for Class A shares.
†† Reflects overall Portfolio ratios for investment income and non-class specific expenses.
§ Amount is less than 0.005%.
The accompanying notes are an integral part of the financial statements.
14
Morgan Stanley Institutional Fund, Inc.
Annual Report — December 31, 2013
Financial Highlights
U.S. Real Estate Portfolio
| | | Class L | |
| | | Year Ended December 31, | | Period from
November 11, 2011^ to | |
Selected Per Share Data and Ratios | | 2013 | | 2012 | | December 31, 2011 | |
Net Asset Value, Beginning of Period | | $ | 16.59 | | | $ | 14.69 | | | $ | 14.52 | | |
Income (Loss) from Investment Operations: | |
Net Investment Income† | | | 0.13 | | | | 0.10 | | | | 0.06 | | |
Net Realized and Unrealized Gain (Loss) | | | 0.13 | | | | 2.16 | | | | 0.11 | | |
Total from Investment Operations | | | 0.26 | | | | 2.26 | | | | 0.17 | | |
Distributions from and/or in Excess of: | |
Net Investment Income | | | (0.06 | ) | | | (0.07 | ) | | | — | | |
Net Realized Gain | | | (0.59 | ) | | | (0.29 | ) | | | — | | |
Total Distributions | | | (0.65 | ) | | | (0.36 | ) | | | — | | |
Net Asset Value, End of Period | | $ | 16.20 | | | $ | 16.59 | | | $ | 14.69 | | |
Total Return++ | | | 1.62 | % | | | 15.44 | % | | | 1.17 | %# | |
Ratios and Supplemental Data: | |
Net Assets, End of Period (Thousands) | | $ | 4,462 | | | $ | 4,975 | | | $ | 5,879 | | |
Ratio of Expenses to Average Net Assets (1) | | | 1.78 | %+^^ | | | 1.73 | %+†† | | | 1.75 | %+* | |
Ratio of Expenses to Average Net Assets Excluding Non Operating Expenses | | | 1.77 | %+^^ | | | 1.72 | %+†† | | | N/A | | |
Ratio of Net Investment Income to Average Net Assets (1) | | | 0.73 | %+ | | | 1.70 | %+ | | | 3.33 | %+* | |
Ratio of Rebate from Morgan Stanley Affiliates to Average Net Assets | | | 0.00 | %§ | | | 0.00 | %§†† | | | 0.00 | %§* | |
Portfolio Turnover Rate | | | 24 | % | | | 22 | % | | | 21 | %* | |
(1) Supplemental Information on the Ratios to Average Net Assets: | |
Ratios Before Expense Limitation: | |
Expenses to Average Net Assets | | | 1.79 | % | | | N/A | | | | 1.91 | %+* | |
Net Investment Income to Average Net Assets | | | 0.72 | % | | | N/A | | | | 3.17 | %+* | |
^ Commencement of Operations.
† Per share amount is based on average shares outstanding.
++ Calculated based on the net asset value as of the last business day of the period.
+ The Ratios of Expenses and Net Investment Income reflect the rebate of certain Portfolio expenses in connection with the investments in Morgan Stanley affiliates during the period. The effect of the rebate on the ratios is disclosed in the above table as "Ratio of Rebate from Morgan Stanley Affiliates to Average Net Assets."
^^ Effective September 16, 2013, the Adviser has agreed to limit the ratio of expenses to average net assets to the maximum ratio of 1.85% for Class L shares. Prior to September 16, 2013, the maximum ratio was 1.75% for Class L shares.
†† Reflects overall Portfolio ratios for investment income and non-class specific expenses.
§ Amount is less than 0.005%.
# Not Annualized.
* Annualized.
The accompanying notes are an integral part of the financial statements.
15
Morgan Stanley Institutional Fund, Inc.
Annual Report — December 31, 2013
Financial Highlights
U.S. Real Estate Portfolio
| | | Class IS | |
Selected Per Share Data and Ratios | | Period from
September 13, 2013^ to
December 31, 2013 | |
Net Asset Value, Beginning of Period | | $ | 17.13 | | |
Income from Investment Operations: | |
Net Investment Income† | | | 0.03 | | |
Net Realized and Unrealized Gain | | | 0.01 | | |
Total from Investment Operations | | | 0.04 | | |
Distributions from and/or in Excess of: | |
Net Investment Income | | | (0.11 | ) | |
Net Realized Gain | | | (0.51 | ) | |
Total Distributions | | | (0.62 | ) | |
Net Asset Value, End of Period | | $ | 16.55 | | |
Total Return++ | | | 0.30 | %# | |
Ratios and Supplemental Data: | |
Net Assets, End of Period (Thousands) | | $ | 10 | | |
Ratio of Expenses to Average Net Assets (1) | | | 0.90 | %*^^ | |
Ratio of Expenses to Average Net Assets Excluding Non Operating Expenses | | | 0.89 | %*^^ | |
Ratio of Net Investment Income to Average Net Assets (1) | | | 0.52 | %* | |
Portfolio Turnover Rate | | | 24 | %# | |
(1) Supplemental Information on the Ratios to Average Net Assets: | |
Ratios Before Expense Limitation: | |
Expenses to Average Net Assets | | | 6.19 | %* | |
Net Investment Loss to Average Net Assets | | | (4.77 | )%* | |
^ Commencement of Operations.
† Per share amount is based on average shares outstanding.
++ Calculated based on the net asset value as of the last business day of the period.
^^ Effective September 16, 2013, the Adviser has agreed to limit the ratio of expenses to average net assets to the maximum ratio of 0.93% for Class IS shares.
# Not Annualized.
* Annualized.
The accompanying notes are an integral part of the financial statements.
16
Morgan Stanley Institutional Fund, Inc.
Annual Report — December 31, 2013
Notes to Financial Statements
Morgan Stanley Institutional Fund, Inc. (the "Fund") is registered under the Investment Company Act of 1940, as amended (the "Act"), as an open-end management investment company. The Fund is comprised of twenty-seven separate, active, diversified and non-diversified portfolios (individually referred to as a "Portfolio", collectively as the "Portfolios").
The accompanying financial statements relate to the U.S. Real Estate Portfolio. The Portfolio seeks to provide above average current income and long-term capital appreciation by investing primarily in equity securities of companies in the U.S. real estate industry, including real estate investment trusts ("REITs"). The Portfolio focuses on REITs as well as real estate operating companies ("REOCs") that invest in a variety of property types and regions. The Portfolio offers four classes of shares — Class I, Class A, Class L and Class IS.
On September 16, 2013, the Portfolio commenced offering Class IS shares. Effective September 9, 2013, Class P and Class H shares were renamed Class A shares.
A. Significant Accounting Policies: The following significant accounting policies are in conformity with U.S. generally accepted accounting principles ("GAAP"). Such policies are consistently followed by the Fund in the preparation of its financial statements. GAAP may require management to make estimates and assumptions that affect the reported amounts and disclosures in the financial statements. Actual results may differ from those estimates.
1. Security Valuation: (1) An equity portfolio security listed or traded on an exchange is valued at its latest reported sales price (or at the exchange official closing price if such exchange reports an official closing price), if there were no sales on a given day, the security is valued at the mean between the last reported bid and asked prices; (2) all other equity portfolio securities for which over-the-counter market quotations are readily available are valued at its latest reported sales price. In cases where a security is traded on more than one exchange, the security is valued on the exchange designated as the primary market; (3) when market quotations are not readily available, including circumstances under which Morgan Stanley Investment Management Inc. (the "Adviser") determines that the closing price, last sale price or the mean between the last reported bid and asked prices are not reflective of a security's market value, portfolio securities are valued at their fair value as determined in good faith under procedures established by and under the general supervision of
the Fund's Board of Directors (the "Directors"). Occasionally, developments affecting the closing prices of securities and other assets may occur between the times at which valuations of such securities are determined (that is, close of the foreign market on which the securities trade) and the close of business of the New York Stock Exchange ("NYSE"). If developments occur during such periods that are expected to materially affect the value of such securities, such valuations may be adjusted to reflect the estimated fair value of such securities as of the close of the NYSE, as determined in good faith by the Directors or by the Adviser using a pricing service and/or procedures approved by the Directors; (4) quotations of foreign portfolio securities, other assets and liabilities and forward contracts stated in foreign currency are translated into U.S. dollar equivalents at the prevailing market rates prior to the close of the NYSE; (5) investments in mutual funds, including the Morgan Stanley Institutional Liquidity Funds, are valued at the net asset value as of the close of each business day; and (6) short-term debt securities with remaining maturities of 60 days or less at the time of purchase may be valued at amortized cost, unless the Adviser determines such valuation does not reflect the securities' market value, in which case these securities will be valued at their fair market value determined by the Adviser.
Under procedures approved by the Directors, the Fund's Adviser has formed a Valuation Committee. The Valuation Committee provides administration and oversight of the Fund's valuation policies and procedures, which are reviewed at least annually by the Directors. These procedures allow the Fund to utilize independent pricing services, quotations from securities and financial instrument dealers, and other market sources to determine fair value.
The Fund has procedures to determine the fair value of securities and other financial instruments for which market prices are not readily available. Under these procedures, the Valuation Committee convenes on a regular and ad hoc basis to review such securities and considers a number of factors, including valuation methodologies and significant unobservable valuation inputs, when arriving at fair value. The Valuation Committee may employ a market-based approach which may use related or comparable assets or liabilities, recent transactions, market multiples, book values, and other relevant information for the investment to determine the fair value of the
17
Morgan Stanley Institutional Fund, Inc.
Annual Report — December 31, 2013
Notes to Financial Statements (cont'd)
investment. An income-based valuation approach may also be used in which the anticipated future cash flows of the investment are discounted to calculate fair value. Discounts may also be applied due to the nature or duration of any restrictions on the disposition of the investments. Due to the inherent uncertainty of valuations of such investments, the fair values may differ significantly from the values that would have been used had an active market existed. The Valuation Committee employs various methods for calibrating these valuation approaches including a regular review of valuation methodologies, key inputs and assumptions, transactional back-testing or disposition analysis, and reviews of any related market activity.
The Portfolio invests a significant portion of its assets in securities of REITs. The market's perception of prospective declines in private real estate values and other financial assets may result in increased volatility of market prices that can negatively impact the valuation of certain issuers held by the Portfolio.
2. Fair Value Measurement: Financial Accounting Standards Board ("FASB") Accounting Standards CodificationTM ("ASC") 820, "Fair Value Measurements and Disclosures" ("ASC 820"), defines fair value as the value that the Fund would receive to sell an investment or pay to transfer a liability in a timely transaction with an independent buyer in the principal market, or in the absence of a principal market the most advantageous market for the investment or liability. ASC 820 establishes a three-tier hierarchy to distinguish between (1) inputs that reflect the assumptions market participants would use in valuing an asset or liability developed based on market data obtained from sources independent of the reporting entity (observable inputs) and (2) inputs that reflect the reporting entity's own assumptions about the assumptions market participants would use in valuing an asset or liability developed based on the best information available in the circumstances (unobservable inputs) and to establish classification of fair value measurements for disclosure purposes. Various inputs are used in determining the value of the Fund's investments. The inputs are summarized in the three broad levels listed below.
• Level 1 – unadjusted quoted prices in active markets for identical investments
• Level 2 – other significant observable inputs (including quoted prices for similar investments, interest rates, prepayment speeds, credit risk, etc.)
• Level 3 – significant unobservable inputs including the Fund's own assumptions in determining the fair value of investments. Factors considered in making this determination may include, but are not limited to, information obtained by contacting the issuer, analysts, or the appropriate stock exchange (for exchange-traded securities), analysis of the issuer's financial statements or other available documents and, if necessary, available information concerning other securities in similar circumstances
The inputs or methodology used for valuing securities are not necessarily an indication of the risk associated with investing in those securities and the determination of the significance of a particular input to the fair value measurement in its entirety requires judgment and considers factors specific to each security.
The following is a summary of the inputs used to value the Portfolio's investments as of December 31, 2013.
Investment Type | | Level 1
Unadjusted
quoted
prices
(000) | | Level 2
Other
significant
observable
inputs
(000) | | Level 3
Significant
unobservable
inputs
(000) | | Total
(000) | |
Assets: | |
Common Stocks | |
Apartments | | $ | 164,804 | | | $ | — | | | $ | — | | | $ | 164,804 | | |
Diversified | | | 77,707 | | | | — | | | | — | | | | 77,707 | | |
Health Care | | | 91,218 | | | | — | | | | — | | | | 91,218 | | |
Industrial | | | 28,370 | | | | — | | | | 30,479 | | | | 58,849 | | |
Lodging/Resorts | | | 94,786 | | | | — | | | | — | | | | 94,786 | | |
Manufactured Homes | | | 11,024 | | | | — | | | | — | | | | 11,024 | | |
Mixed Industrial/Office | | | 9,593 | | | | — | | | | — | | | | 9,593 | | |
Office | | | 63,225 | | | | — | | | | 5,681 | | | | 68,906 | | |
Regional Malls | | | 210,506 | | | | — | | | | — | | | | 210,506 | | |
Retail Free Standing | | | 8,330 | | | | — | | | | — | | | | 8,330 | | |
Self Storage | | | 47,396 | | | | — | | | | — | | | | 47,396 | | |
Shopping Centers | | | 52,917 | | | | — | | | | — | | | | 52,917 | | |
Total Common Stocks | | | 859,876 | | | | — | | | | 36,160 | | | | 896,036 | | |
Short-Term Investment
Investment Company | | | 6,203 | | | | — | | | | — | | | | 6,203 | | |
Total Assets | | $ | 866,079 | | | $ | — | | | $ | 36,160 | | | $ | 902,239 | | |
Transfers between investment levels may occur as the markets fluctuate and/or the availability of data used in an investment's valuation changes. The Portfolio recognizes transfers between the levels as of the end of the
18
Morgan Stanley Institutional Fund, Inc.
Annual Report — December 31, 2013
Notes to Financial Statements (cont'd)
period. As of December 31, 2013, the Portfolio did not have any investments transfer between investment levels.
Following is a reconciliation of investments in which significant unobservable inputs (Level 3) were used in determining fair value.
| | | Common
Stocks
(000) | |
Beginning Balance | | $ | 44,843 | | |
Purchases | | | 662 | | |
Sales | | | (7,714 | ) | |
Amortization of discount | | | — | | |
Transfers in | | | — | | |
Transfers out | | | — | | |
Corporate actions | | | (6,509 | ) | |
Change in unrealized appreciation/depreciation | | | 2,975 | | |
Realized gains (losses) | | | 1,903 | | |
Ending Balance | | $ | 36,160 | | |
Net change in unrealized appreciation/depreciation from
investments still held as of December 31, 2013 | | $ | 3,372 | | |
The following table presents additional information about valuation techniques and inputs used for investments that are measured at fair value and categorized within Level 3 as of December 31, 2013.
| | | Fair Value at
December 31,
2013
(000) | | Valuation
Technique | | Unobservable
Input | |
Industrial | |
Common
Stocks | | $ | 30,479 | | | Reported Capital Balance,
Adjusted for Subsequent
Capital Calls and Return
of Capital, as applicable | | Adjusted Capital
Balance | |
Office | |
Common
Stocks | | $ | 5,681 | | | Reported Capital Balance,
Adjusted for Subsequent
Capital Calls and Return
of Capital, as applicable | | Adjusted Capital
Balance | |
3. Foreign Currency Translation and Foreign Investments: The books and records of the Portfolio are maintained in U.S. dollars. Foreign currency amounts are translated into U.S. dollars as follows:
– investments, other assets and liabilities at the prevailing rate of exchange on the valuation date;
– investment transactions and investment income at the prevailing rates of exchange on the dates of such transactions.
Although the net assets of the Portfolio are presented at the foreign exchange rates and market values at the close of the period, the Portfolio does not isolate that portion of the results of operations arising as a result of changes in the foreign exchange rates from the fluctuations arising from changes in the market prices of securities held at period end. Similarly, the Portfolio does not isolate the effect of changes in foreign exchange rates from the fluctuations arising from changes in the market prices of securities sold during the period. Accordingly, realized and unrealized foreign currency gains (losses) on investments in securities are included in the reported net realized and unrealized gains (losses) on investment transactions and balances. However, pursuant to U.S. Federal income tax regulations, gains and losses from certain foreign currency transactions and the foreign currency portion of gains and losses realized on sales and maturities of foreign denominated debt securities are treated as ordinary income for U.S. Federal income tax purposes.
Net realized gains (losses) on foreign currency transactions represent net foreign exchange gains (losses) from foreign currency forward exchange contracts, disposition of foreign currencies, currency gains (losses) realized between the trade and settlement dates on securities transactions, and the difference between the amount of investment income and foreign withholding taxes recorded on the Portfolio's books and the U.S. dollar equivalent amounts actually received or paid. Net unrealized currency gains (losses) from valuing foreign currency denominated assets and liabilities at period end exchange rates are reflected as a component of unrealized appreciation (depreciation) on the Statement of Assets and Liabilities. The change in unrealized currency gains (losses) on foreign currency translations for the period is reflected in the Statement of Operations.
Foreign security and currency transactions may involve certain considerations and risks not typically associated with those of U.S. dollar denominated transactions as a result of, among other factors, fluctuations of exchange rates in relation to the U.S. dollar, the possibility of lower levels of governmental supervision and regulation of foreign securities markets and the possibility of political or economic instability.
Governmental approval for foreign investments may be required in advance of making an investment under
19
Morgan Stanley Institutional Fund, Inc.
Annual Report — December 31, 2013
Notes to Financial Statements (cont'd)
certain circumstances in some countries, and the extent of foreign investments in domestic companies may be subject to limitation in other countries. Foreign ownership limitations also may be imposed by the charters of individual companies to prevent, among other concerns, violations of foreign investment limitations. As a result, an additional class of shares (identified as "Foreign" in the Portfolio of Investments) may be created and offered for investment. The "local" and "foreign shares" market values may differ. In the absence of trading of the foreign shares in such markets, the Portfolio values the foreign shares at the closing exchange price of the local shares.
4. Unfunded Commitments: Subject to the terms of a Subscription Agreement between the Portfolio and BRCP REIT I, LLC, the Portfolio has made a subscription commitment of $7,000,000 for which it will receive 7,000,000 shares of common stock. As of December 31, 2013, BRCP REIT I, LLC has drawn down approximately $6,101,000 which represents 87.2% of the commitment.
Subject to the terms of a Subscription Agreement between the Portfolio and BRCP REIT II, LLC, the Portfolio has made a subscription commitment of $9,000,000 for which it will receive 9,000,000 shares of common stock. As of December 31, 2013, BRCP REIT II, LLC has drawn down approximately $8,364,000 which represents 92.9% of the commitment.
Subject to the terms of a Subscription Agreement between the Portfolio and Exeter Industrial Value Fund LP, the Portfolio has made a subscription commitment of $8,500,000 for which it will receive 8,500,000 shares of common stock. As of December 31, 2013, Exeter Industrial Value Fund LP has drawn down approximately $7,905,000 which represents 93.0% of the commitment.
Subject to the terms of a Subscription Agreement between the Portfolio and Keystone Industrial Fund, LP, the Portfolio has made a subscription commitment of $7,946,000 for which it will receive 7,946,000 shares of common stock. As of December 31, 2013, Keystone Industrial Fund, LP has drawn down approximately $7,574,000 which represents 95.3% of the commitment.
Subject to the terms of a Subscription Agreement between the Portfolio and KTR Industrial Fund II LP, the Portfolio has made a subscription commitment of $10,000,000 for which it will receive 10,000,000 shares
of common stock. As of December 31, 2013, KTR Industrial Fund II LP has drawn down approximately $9,196,000 which represents 92.0% of the commitment.
Subject to the terms of a Subscription Agreement between the Portfolio and Cabot Industrial Value Fund II, LP, the Portfolio has made a subscription commitment of $7,500,000 for which it will receive 15,000 shares of common stock. As of December 31, 2013, Cabot Industrial Value Fund II, LP has drawn down approximately $7,000,000 which represents 93.3% of the commitment.
5. Restricted Securities: The Portfolio invests in unregistered or otherwise restricted securities. The term "restricted securities" refers to securities that are unregistered or are held by control persons of the issuer and securities that are subject to contractual restrictions on their resale. As a result, restricted securities may be more difficult to value and the Portfolio may have difficulty disposing of such assets either in a timely manner or for a reasonable price. In order to dispose of an unregistered security, the Portfolio, where it has contractual rights to do so, may have to cause such security to be registered. A considerable period may elapse between the time the decision is made to sell the security and the time the security is registered so that the Portfolio could sell it. Contractual restrictions on the resale of securities vary in length and scope and are generally the result of a negotiation between the issuer and acquirer of the securities. The Portfolio would, in either case, bear market risks during that period. Restricted Securities are identified in the Portfolio of Investments.
6. Indemnifications: The Fund enters into contracts that contain a variety of indemnifications. The Fund's maximum exposure under these arrangements is unknown. However, the Fund has not had prior claims or losses pursuant to these contracts and expects the risk of loss to be remote.
7. Dividends and Distributions to Shareholders: Dividend income and distributions to shareholders are recorded on the ex-dividend date. Dividends from net investment income, if any, are declared and paid quarterly. Net realized capital gains, if any, are distributed at least annually.
8. Security Transactions, Income and Expenses: Security transactions are accounted for on the trade date (date the order to buy or sell is executed). Realized gains and losses on the sale of investment securities are determined on the specific identified cost method. Dividend
20
Morgan Stanley Institutional Fund, Inc.
Annual Report — December 31, 2013
Notes to Financial Statements (cont'd)
income and other distributions are recorded on the ex-dividend date (except for certain foreign dividends which may be recorded as soon as the Portfolio is informed of such dividends) net of applicable withholding taxes. Interest income is recognized on the accrual basis except where collection is in doubt. Discounts are accreted and premiums are amortized over the life of the respective securities. Most expenses of the Fund can be directly attributed to a particular Portfolio. Expenses which cannot be directly attributed are apportioned among the Portfolios based upon relative net assets or other appropriate methods. Income, expenses (other than class specific expenses — distribution, transfer agency and sub transfer agency fees) and realized and unrealized gains or losses are allocated to each class of shares based upon their relative net assets.
The Portfolio owns shares of REITs which report information on the source of their distributions annually in the following calendar year. A portion of distributions received from REITs during the year is estimated to be a return of capital and is recorded as a reduction of their cost.
B. Advisory Fees: The Adviser, a wholly-owned subsidiary of Morgan Stanley, provides the Portfolio with advisory services under the terms of an Investment Advisory Agreement, paid quarterly, at the annual rate based on the average daily net assets as follows:
First $500
million | | Next $500
million | | Over $1
billion | |
| | 0.80 | % | | | 0.75 | % | | | 0.70 | % | |
For the year ended December 31, 2013, the advisory fee rate (net of waivers/rebate) was equivalent to an annual effective rate of 0.76% of the Portfolio's daily net assets.
The Adviser has agreed to reduce its advisory fee and/or reimburse the Portfolio so that total annual portfolio operating expenses, excluding certain investment related expenses, taxes, interest and other extraordinary expenses (including litigation), will not exceed 1.00% for Class I shares, 1.25% for Class A shares and 1.75% for Class L shares. Effective September 16, 2013, the Adviser has agreed to limit the ratio of expenses to average net assets to the maximum ratio of 1.35%, 1.85% and 0.93% for Class A, Class L and Class IS shares, respectively. The fee waivers and/or expense reimbursements will continue for at least one year or until such time that the Directors act to discontinue all or a portion of such waivers and/or reimbursements when it deems such action is appropriate. For the year
ended December 31, 2013, approximately $129,000 of advisory fees were waived and approximately $104,000 of other expenses were reimbursed by the Adviser pursuant to this arrangement.
C. Administration Fees: The Adviser also serves as Administrator to the Fund and provides administrative services pursuant to an Administration Agreement for an annual fee, accrued daily and paid monthly, of 0.08% of the Portfolio's average daily net assets. Under a Sub-Administration Agreement between the Administrator and State Street Bank and Trust Company ("State Street"), State Street provides certain administrative services to the Fund. For such services, the Administrator pays State Street a portion of the fee the Administrator receives from the Portfolio.
D. Distribution and Shareholder Services Fees: Morgan Stanley Distribution, Inc. ("MSDI" or the "Distributor"), a wholly-owned subsidiary of the Adviser, and an indirect subsidiary of Morgan Stanley, serves as the Fund's Distributor of Portfolio shares pursuant to a Distribution Agreement. The Fund has adopted a Shareholder Services Plan with respect to Class A shares pursuant to Rule 12b-1 under the Act. Under the Shareholder Services Plan, the Portfolio pays the Distributor a shareholder services fee, accrued daily and paid monthly, at an annual rate of 0.25% of the Portfolio's average daily net assets attributable to Class A shares.
The Fund has adopted a Distribution and Shareholder Services Plan with respect to Class L shares pursuant to Rule 12b-1 under the Act. Under the Distribution and Shareholder Services Plan, the Portfolio pays the Distributor a distribution fee, accrued daily and paid monthly, at an annual rate of 0.50% and a shareholder services fee, accrued daily and paid monthly, at an annual rate of 0.25% of the Portfolio's average daily net assets attributable to Class L shares.
The distribution and shareholder services fees are used to support the expenses associated with servicing and maintaining accounts. The Distributor may compensate other parties for providing shareholder support services to investors who purchase Class A and Class L shares.
E. Dividend Disbursing and Transfer Agent: The Fund's dividend disbursing and transfer agent was Morgan Stanley Services Company Inc. ("Morgan Stanley Services"). Pursuant to a Transfer Agency Agreement, the Fund paid Morgan Stanley Services a fee based on the number of classes, accounts and transactions relating to the Portfolios of the
21
Morgan Stanley Institutional Fund, Inc.
Annual Report — December 31, 2013
Notes to Financial Statements (cont'd)
Fund. Effective July 1, 2013, the Directors approved changing the transfer agent to Boston Financial Data Services, Inc.
F. Custodian Fees: State Street (the "Custodian") serves as Custodian for the Fund in accordance with a Custodian Agreement. The Custodian holds cash, securities, and other assets of the Fund as required by the Act. Custody fees are payable monthly based on assets held in custody, investment purchases and sales activity and account maintenance fees, plus reimbursement for certain out-of-pocket expenses.
G. Security Transactions and Transactions with Affiliates: For the year ended December 31, 2013, purchases and sales of investment securities for the Portfolio, other than long-term U.S. Government securities and short-term investments, were approximately $234,657,000 and $270,462,000, respectively. There were no purchases and sales of long-term U.S. Government securities for the year ended December 31, 2013.
The Portfolio invests in the Institutional Class of the Morgan Stanley Institutional Liquidity Funds — Treasury Portfolio — Institutional Class (the "Liquidity Funds"), an open-end management investment company managed by the Adviser. Advisory fees paid by the Portfolio are reduced by an amount equal to its pro-rata share of the advisory and administration fees paid by the Portfolio due to its investment in the Liquidity Funds. For the year ended December 31, 2013, advisory fees paid were reduced by approximately $17,000 relating to the Portfolio's investment in the Liquidity Funds.
A summary of the Portfolio's transactions in shares of the Liquidity Funds during the year ended December 31, 2013 is as follows:
Value
December 31,
2012
(000) | | Purchases
at Cost
(000) | | Sales
(000) | | Dividend
Income
(000) | | Value
December 31,
2013
(000) | |
| $ | 1,733 | | | $ | 210,069 | | | $ | 205,599 | | | $ | 3 | | | $ | 6,203 | | |
From January 1, 2013 to June 30, 2013, the Portfolio incurred approximately $1,000 in brokerage commissions with Citigroup, Inc., and its affiliated broker-dealers, which may be deemed affiliates of the Adviser, Administrator and Distributor under Section 17 of the Act, for portfolio transactions executed on behalf of the Portfolio. Citigroup, Inc. and its affiliated broker-dealers ceased to be affiliates of the Portfolio pursuant to Section 17 of the Act as of July 1, 2013.
H. Federal Income Taxes: It is the Portfolio's intention to continue to qualify as a regulated investment company and distribute all of its taxable and tax-exempt income. Accordingly,
no provision for Federal income taxes is required in the financial statements.
The Portfolio may be subject to taxes imposed by countries in which it invests. Such taxes are generally based on income and/or capital gains earned or repatriated. Taxes are accrued based on net investment income, net realized gains and net unrealized appreciation as such income and/or gains are earned. Taxes may also be based on transactions in foreign currency and are accrued based on the value of investments denominated in such currency.
FASB ASC 740-10 "Income Taxes — Overall" sets forth a minimum threshold for financial statement recognition of the benefit of a tax position taken or expected to be taken in a tax return. Management has concluded there are no significant uncertain tax positions that would require recognition in the financial statements. If applicable, the Portfolio recognizes interest accrued related to unrecognized tax benefits in "Interest Expense" and penalties in ''Other Expenses" in the Statement of Operations. The Portfolio files tax returns with the U.S. Internal Revenue Service, New York and various states. Generally, each of the tax years in the four-year period ended December 31, 2013, remains subject to examination by taxing authorities.
The tax character of distributions paid may differ from the character of distributions shown in the Statements of Changes in Net Assets due to short-term capital gains being treated as ordinary income for tax purposes. The tax character of distributions paid during fiscal 2013 and 2012 was as follows:
2013
Distributions
Paid From: | | 2012
Distributions
Paid From: | |
Ordinary
Income
(000) | | Long-Term
Capital Gain
(000) | | Ordinary
Income
(000) | | Long-Term
Capital Gain
(000) | |
| $ | 19,641 | | | $ | 23,617 | | | $ | 11,407 | | | $ | 16,630 | | |
The amount and character of income and gains to be distributed are determined in accordance with income tax regulations which may differ from GAAP. These book/tax differences are either considered temporary or permanent in nature.
Temporary differences are primarily due to differing book and tax treatments in the timing of the recognition of gains (losses) on certain investment transactions and the timing of the deductibility of certain expenses.
Permanent differences, primarily due to basis adjustments on partnerships, differing treatments of gains (losses) related to REIT adjustments and a dividend redesignation, resulted in
22
Morgan Stanley Institutional Fund, Inc.
Annual Report — December 31, 2013
Notes to Financial Statements (cont'd)
the following reclassifications among the components of net assets at December 31, 2013:
Accumulated
Undistributed
Net Investment
Income
(000) | | Accumulated
Net Realized
Gain
(000) | | Paid-in-
Capital
(000) | |
| $ | 2,295 | | | $ | (2,883 | ) | | $ | 588 | | |
At December 31, 2013, the components of distributable earnings for the Portfolio on a tax basis were as follows:
Undistributed
Ordinary
Income
(000) | | Undistributed
Long-Term
Capital Gain
(000) | |
| | — | | | $ | 5,672 | | |
At December 31, 2013, the aggregate cost for federal income tax purposes is $742,280,000. The aggregate gross unrealized appreciation is $181,410,000 and the aggregate gross unrealized depreciation is $21,451,000 resulting in net unrealized appreciation of $159,959,000.
I. Other (unaudited): At December 31, 2013, the Portfolio had otherwise unaffiliated record owners of 10% or greater. Investment activities of these shareholders could have a material impact on the Portfolio. The aggregate percentage of such owners was 60% and 42% for Class I and Class A shares, respectively.
J. Results of Special Shareholder Meeting (unaudited): On June 5, 2013 as adjourned to June 24, 2013, a Joint Special Shareholder Meeting was held for Class H shareholders of the Portfolio to approve the Articles of Amendment to the Fund's Articles of Amendment and Restatement and a Plan of Reclassification for the Portfolio pursuant to which Class H shares would be reclassified as Class P shares. The results with respect to this proposal were as follows:
| For | | Against | | Abstain | |
| | 634,414 | | | | 37,870 | | | | 106,585 | | |
K. Accounting Pronouncement: In June 2013, FASB issued Accounting Standards Update 2013-08 Financial Services — Investment Companies (Topic 946) — Amendments to the Scope, Measurement, and Disclosure Requirements ("ASU 2013-08") which is effective for interim and annual reporting periods in fiscal years that begin after December 15, 2013. ASU 2013-08 sets forth a methodology for determining whether an entity should be characterized as an investment company and prescribes fair value accounting for an investment company's non-controlling ownership interest in another investment company. FASB has determined that a fund registered under the Investment Company Act of 1940 automatically meets ASU 2013-08's criteria for an investment
company. Although still evaluating the potential impacts of ASU 2013-08 to the Portfolio, management expects that the impact of the Portfolio's adoption will be limited to additional financial statement disclosures.
23
Morgan Stanley Institutional Fund, Inc.
Annual Report — December 31, 2013
Report of Independent Registered Public Accounting Firm
To the Shareholders and Board of Directors of
Morgan Stanley Institutional Fund, Inc. —
U.S. Real Estate Portfolio
We have audited the accompanying statement of assets and liabilities, including the portfolio of investments, of U.S. Real Estate Portfolio (one of the portfolios constituting Morgan Stanley Institutional Fund, Inc.) (the "Portfolio") as of December 31, 2013, and the related statement of operations for the year then ended, the statements of changes in net assets for each of the two years in the period then ended, and the financial highlights for each of the periods indicated therein. These financial statements and financial highlights are the responsibility of the Portfolio's management. Our responsibility is to express an opinion on these financial statements and financial highlights based on our audits.
We conducted our audits in accordance with the standards of the Public Company Accounting Oversight Board (United States). Those standards require that we plan and perform the audit to obtain reasonable assurance about whether the financial statements and financial highlights are free of material misstatement. We were not engaged to perform an audit of the Portfolio's internal control over financial reporting. Our audits included consideration of internal control over financial reporting as a basis for designing audit procedures that are appropriate in the circumstances, but not for the purpose of expressing an opinion on the effectiveness of the Portfolio's internal control over financial reporting. Accordingly, we express no such opinion. An audit also includes examining, on a test basis, evidence supporting the amounts and disclosures in the financial statements and financial highlights, assessing the accounting principles used and significant estimates made by management, and evaluating the overall financial statement presentation. Our procedures included confirmation of securities owned as of December 31, 2013, by correspondence with the custodian and others or by other appropriate auditing procedures where replies from others were not received. We believe that our audits provide a reasonable basis for our opinion.
In our opinion, the financial statements and financial highlights referred to above present fairly, in all material respects, the financial position of U.S. Real Estate Portfolio (one of the portfolios constituting Morgan Stanley Institutional Fund, Inc.) at December 31, 2013, the results of its operations for the year then ended, the changes in its net assets for each of the two years in the period then ended, and the financial highlights for each of the periods indicated therein, in conformity with U.S. generally accepted accounting principles.

Boston, Massachusetts
February 26, 2014
24
Morgan Stanley Institutional Fund, Inc.
Annual Report — December 31, 2013
Federal Tax Notice (unaudited)
For Federal income tax purposes, the following information is furnished with respect to the distributions paid by the Portfolio during its taxable year ended December 31, 2013. For corporate shareholders, 2.3% of the dividends qualified for the dividends received deduction.
The Portfolio designated and paid $23,617,000 as a long-term capital gain distribution.
For Federal income tax purposes, the following information is furnished with respect to the Portfolio's earnings for the taxable year ended December 31, 2013. When distributed, certain earnings may be subject to a maximum tax rate of 15% as provided for the Jobs and Growth Tax Relief Reconciliation Act of 2003. The Portfolio designated up to a maximum of $392,000 as taxable at this lower rate.
In January, the Portfolio provides tax information to shareholders for the preceding calendar year.
25
Morgan Stanley Institutional Fund, Inc.
Annual Report — December 31, 2013
U.S. Privacy Policy (unaudited)
AN IMPORTANT NOTICE CONCERNING OUR U.S. PRIVACY POLICY
This privacy notice describes the U.S. privacy policy of Morgan Stanley Distribution, Inc., and the Morgan Stanley family of mutual funds ("us", "our", "we").
We are required by federal law to provide you with notice of our U.S. privacy policy ("Policy"). This Policy applies to both our current and former clients unless we state otherwise and is intended for individual clients who purchase products or receive services from us for personal, family or household purposes. This Policy is not applicable to partnerships, corporations, trusts or other non-individual clients or account holders, nor is this Policy applicable to individuals who are either beneficiaries of a trust for which we serve as trustee or participants in an employee benefit plan administered or advised by us. This Policy is, however, applicable to individuals who select us to be a custodian of securities or assets in individual retirement accounts, 401(k) accounts, or accounts subject to the Uniform Gifts to Minors Act.
This notice sets out our business practices to protect your privacy; how we collect and share personal information about you; and how you can limit our sharing or certain uses by others of this information. We may amend this Policy at any time, and will inform you of any changes to our Policy as required by law.
WE RESPECT YOUR PRIVACY
We appreciate that you have provided us with your personal financial information and understand your concerns about your information. We strive to safeguard the information our clients entrust to us. Protecting the confidentiality and security of client information is an important part of how we conduct our business.
This notice describes what personal information we collect about you, how we collect it, when we may share it with others, and how certain others may use it. It discusses the steps you may take to limit our sharing of certain information about you with our affiliated companies, including, but not limited to our affiliated banking businesses, brokerage firms and credit service affiliates. It also discloses how you may limit our affiliates' use of shared information for marketing purposes.
Throughout this Policy, we refer to the nonpublic information that personally identifies you as "personal information." We also use the term "affiliated company" in this notice. An affiliated company is a company in our family of companies and includes companies with the Morgan Stanley name. These affiliated companies are financial institutions such as broker-dealers, banks, investment advisers and credit card issuers. We refer to any company that is not an affiliated company as a nonaffiliated third party. For purposes of Section 5 of this notice, and your ability to limit certain uses of personal information by our affiliates, this notice applies to the use of personal information by our affiliated companies.
1. WHAT PERSONAL INFORMATION DO WE COLLECT FROM YOU?
We may collect the following types of information about you: (i) information provided by you, including information from applications and other forms we receive from you, (ii) information about your transactions with us or our affiliates, (iii) information about your transactions with nonaffiliated third parties, (iv) information from consumer reporting agencies, (v) information obtained from our websites, and (vi) information obtained from other sources. For example:
• We collect information such as your name, address, e-mail address, telephone/fax numbers, assets, income and investment objectives through applications and other forms you submit to us.
• We may obtain information about account balances, your use of account(s) and the types of products and services you prefer to receive from us through your dealings and transactions with us and other sources.
• We may obtain information about your creditworthiness and credit history from consumer reporting agencies.
• We may collect background information from and through third-party vendors to verify representations you have made and to comply with various regulatory requirements.
2. WHEN DO WE DISCLOSE PERSONAL INFORMATION WE COLLECT ABOUT YOU?
We may disclose personal information we collect about you in each of the categories listed above to affiliated and nonaffiliated third parties.
26
Morgan Stanley Institutional Fund, Inc.
Annual Report — December 31, 2013
U.S. Privacy Policy (unaudited) (cont'd)
a. Information we disclose to affiliated companies.
We may disclose personal information that we collect about you to our affiliated companies to manage your account(s) effectively, to service and process your transactions, and to let you know about products and services offered by us and affiliated companies, to manage our business, and as otherwise required or permitted by law. Offers for products and services from affiliated companies are developed under conditions designed to safeguard your personal information.
b. Information we disclose to third parties.
We may disclose personal information that we collect about you to nonaffiliated third parties to provide marketing services on our behalf or to other financial institutions with whom we have joint marketing agreements. We may also disclose all of the information we collect to other nonaffiliated third parties for our everyday business purposes, such as to process transactions, maintain account(s), respond to court orders and legal investigations, report to credit bureaus, offer our own products and services, protect against fraud, for institutional risk control, to perform services on our behalf, and as otherwise required or permitted by law.
When we share personal information about you with a nonaffiliated third party, they are required to limit their use of personal information about you to the particular purpose for which it was shared and they are not allowed to share personal information about you with others except to fulfill that limited purpose or as may be permitted or required by law.
3. HOW DO WE PROTECT THE SECURITY AND CONFIDENTIALITY OF PERSONAL INFORMATION WE COLLECT ABOUT YOU?
We maintain physical, electronic and procedural security measures that comply with applicable law and regulations to help safeguard the personal information we collect about you. We have internal policies governing the proper handling of client information by employees. Third parties that provide support or marketing services on our behalf may also receive personal information about you, and we require them to adhere to appropriate security standards with respect to such information.
4. HOW CAN YOU LIMIT OUR SHARING CERTAIN PERSONAL INFORMATION ABOUT YOU WITH OUR AFFILIATED COMPANIES FOR ELIGIBILITY DETERMINATION?
By following the opt-out procedures in Section 6 below, you may limit the extent to which we share with our affiliated companies, personal information that was collected to determine your eligibility for products and services such as your credit reports and other information that you have provided to us or that we may obtain from third parties ("eligibility information"). Eligibility information does not include your identification information or personal information pertaining to our transactions or experiences with you. Please note that, even if you direct us not to share eligibility information with our affiliated companies, we may still share your personal information, including eligibility information, with our affiliated companies under circumstances that are permitted under applicable law, such as to process transactions or to service your account.
5. HOW CAN YOU LIMIT THE USE OF CERTAIN PERSONAL INFORMATION ABOUT YOU BY OUR AFFILIATED COMPANIES FOR MARKETING?
By following the opt-out instructions in Section 6 below, you may limit our affiliated companies from marketing their products or services to you based on personal information we disclose to them. This information may include, for example, your income and account history with us. Please note that, even if you choose to limit our affiliated companies from using personal information about you that we may share with them for marketing their products and services to you, our affiliated companies may use your personal information that they obtain from us to market to you in circumstances permitted by law, such as if the affiliated party has its own relationship with you.
27
Morgan Stanley Institutional Fund, Inc.
Annual Report — December 31, 2013
U.S. Privacy Policy (unaudited) (cont'd)
6. HOW CAN YOU SEND US AN OPT-OUT INSTRUCTION?
If you wish to limit our sharing of eligibility information about you with our affiliated companies, or our affiliated companies' use of personal information for marketing purposes, as described in this notice, you may do so by:
• Calling us at (800) 548-7786
Monday–Friday between 8a.m. and 5p.m. (EST)
• Writing to us at the following address:
Boston Financial Data Services, Inc.
c/o Privacy Coordinator
P.O. Box 219804
Kansas City, Missouri 64121
If you choose to write to us, your request should include: your name, address, telephone number and account number(s) to which the opt-out applies and whether you are opting out with respect to sharing of eligibility information (Section 4 above), or information used for marketing (Section 5 above), or both. Written opt-out requests should not be sent with any other correspondence. In order to process your request, we require that the request be provided by you directly and not through a third party. Once you have informed us about your privacy preferences, your opt-out preference will remain in effect with respect to this Policy (as it may be amended) until you notify us otherwise. If you are a joint account owner, we will accept instructions from any one of you and apply those instructions to the entire account.
Please understand that if you limit our sharing or our affiliated companies' use of personal information, you and any joint account holder(s) may not receive information about our affiliated companies' products and services, including products or services that could help you manage your financial resources and achieve your investment objectives.
If you have more than one account or relationship with us, please specify the accounts to which you would like us to apply your privacy choices. If you have accounts or relationships with our affiliates, you may receive multiple privacy policies from them, and will need to separately notify those companies of your privacy choices for those accounts or relationships.
7. WHAT IF AN AFFILIATED COMPANY BECOMES A NONAFFILIATED THIRD PARTY?
If, at any time in the future, an affiliated company becomes a nonaffiliated third party, further disclosures of personal information made to the former affiliated company will be limited to those described in Section 2(b) above relating to nonaffiliated third parties. If you elected under Section 6 to limit disclosures we make to affiliated companies, or use of personal information by affiliated companies, your election will not apply to use by any former affiliated company of your personal information in their possession once it becomes a nonaffiliated third party.
SPECIAL NOTICE TO RESIDENTS OF VERMONT
The following section supplements our Policy with respect to our individual clients who have a Vermont address and supersedes anything to the contrary in the above Policy with respect to those clients only.
The State of Vermont requires financial institutions to obtain your consent prior to sharing personal information that they collect about you with nonaffiliated third parties, or eligibility information with affiliated companies, other than in certain limited circumstances. Except as permitted by law, we will not share personal information we collect about you with nonaffiliated third parties or eligibility information with affiliated companies, unless you provide us with your written consent to share such information.
SPECIAL NOTICE TO RESIDENTS OF CALIFORNIA
The following section supplements our Policy with respect to our individual clients who have a California address and supersedes anything to the contrary in the above Policy with respect to those clients only.
In response to a California law, if your account has a California home address, your personal information will not be disclosed to nonaffiliated third parties except as permitted by applicable California law, and we will limit sharing such personal information with our affiliates to comply with California privacy laws that apply to us.
28
Morgan Stanley Institutional Fund, Inc.
Annual Report — December 31, 2013
Director and Officer Information (unaudited)
Independent Director:
Name, Age and Address of
Independent Director | | Position(s)
Held with
Registrant | | Length of Time
Served* | | Principal Occupation(s) During Past 5 Years | | Number of
Portfolios in
Fund Complex
Overseen by
Independent
Director** | | Other Directorships
Held by Independent
Director*** | |
Frank L. Bowman (69)
c/o Kramer Levin Naftalis &
Frankel LLP
Counsel to the Independent Directors
1177 Avenue of the Americas
New York, NY 10036 | | Director | | Since
August
2006 | | President, Strategic Decisions, LLC (consulting) (since February 2009); Director or Trustee of various Morgan Stanley Funds (since August 2006); Chairperson of the Insurance Sub-Committee of the Compliance and Insurance Committee (since February 2007); served as President and Chief Executive Officer of the Nuclear Energy Institute (policy organization) (February 2005-November 2008); retired as Admiral, U.S. Navy after serving over 38 years on active duty including 8 years as Director of the Naval Nuclear Propulsion Program in the Department of the Navy and the U.S. Department of Energy (1996-2004); served as Chief of Naval Personnel (July 1994-September 1996); and on the Joint Staff as Director of Political Military Affairs (June 1992-July 1994); knighted as Honorary Knight Commander of the Most Excellent Order of the British Empire; awarded the Officier de l'Orde National du Mérite by the French Government; elected to the National Academy of Engineering (2009). | | | 98 | | | Director of BP p.l.c.; Director of Naval and Nuclear Technologies LLP; Director of the Armed Services YMCA of the USA and the U.S. Naval Submarine League; Director of the American Shipbuilding Suppliers Association; Member of the National Security Advisory Council of the Center for U.S. Global Engagement and a member of the CNA Military Advisory Board; Chairman of the charity J Street Cup Golf; Trustee of Fairhaven United Methodist Church. | |
Michael Bozic (73)
c/o Kramer Levin Naftalis & Frankel LLP
Counsel to the Independent Directors
1177 Avenue of the Americas
New York, NY 10036 | | Director | | Since
April
1994 | | Private investor and a member of the advisory board of American Road Group LLC (retail) (since June 2000); Chairperson of the Compliance and Insurance Committee (since October 2006); Director or Trustee of various Morgan Stanley Funds (since April 1994); formerly, Chairperson of the Insurance Committee (July 2006-September 2006); Vice Chairman of Kmart Corporation (December 1998-October 2000), Chairman and Chief Executive Officer of Levitz Furniture Corporation (November 1995-November 1998) and President and Chief Executive Officer of Hills Department Stores (May 1991-July 1995); variously Chairman, Chief Executive Officer, President and Chief Operating Officer (1987-1991) of the Sears Merchandise Group of Sears, Roebuck & Co. | | | 100 | | | Trustee and member of the Hillsdale College Board of Trustees. | |
Kathleen A. Dennis (60)
c/o Kramer Levin Naftalis & Frankel LLP
Counsel to the Independent Directors
1177 Avenue of the Americas
New York, NY 10036 | | Director | | Since
August
2006 | | President, Cedarwood Associates (mutual fund and investment management consulting) (since July 2006); Chairperson of the Money Market and Alternatives Sub-Committee of the Investment Committee (since October 2006) and Director or Trustee of various Morgan Stanley Funds (since August 2006); formerly, Senior Managing Director of Victory Capital Management (1993-2006). | | | 98 | | | Director of various non-profit organizations. | |
Dr. Manuel H. Johnson (65)
c/o Johnson Smick Group, Inc.
888 16th Street, N.W.
Suite 740
Washington, D.C. 20006 | | Director | | Since
July
1991 | | Senior Partner, Johnson Smick International, Inc. (consulting firm); Chairperson of the Investment Committee (since October 2006) and Director or Trustee of various Morgan Stanley Funds (since July 1991); Co-Chairman and a founder of the Group of Seven Council (G7C) (international economic commission); formerly, Chairperson of the Audit Committee (July 1991-September 2006), Vice Chairman of the Board of Governors of the Federal Reserve System and Assistant Secretary of the U.S. Treasury. | | | 101 | | | Director of NVR, Inc. (home construction). | |
29
Morgan Stanley Institutional Fund, Inc.
Annual Report — December 31, 2013
Director and Officer Information (unaudited) (cont'd)
Independent Director: (cont'd)
Name, Age and Address of
Independent Director | | Position(s)
Held with
Registrant | | Length of Time
Served* | | Principal Occupation(s) During Past 5 Years | | Number of
Portfolios in
Fund Complex
Overseen by
Independent
Director** | | Other Directorships
Held by Independent
Director*** | |
Joseph J. Kearns (71)
c/o Kearns & Associates LLC
PMB754
22631 Pacific Coast Highway
Malibu, CA 90265 | | Director | | Since
August
1994 | | President, Kearns & Associates LLC (investment consulting); Chairperson of the Audit Committee (since October 2006) and Director or Trustee of various Morgan Stanley Funds (since August 1994); formerly, Deputy Chairperson of the Audit Committee (July 2003-September 2006) and Chairperson of the Audit Committee of various Morgan Stanley Funds (since August 1994); CFO of the J. Paul Getty Trust. | | | 101 | | | Director of Electro Rent Corporation (equipment leasing) and The Ford Family Foundation. | |
Michael F. Klein (55)
c/o Kramer Levin Naftalis & Frankel LLP
Counsel to the Independent
Directors
1177 Avenue of the Americas
New York, NY 10036 | | Director | | Since
August
2006 | | Managing Director, Aetos Capital, LLC (since March 2000) Co-President and Co-Chief Executive Officer of Aetos Capital LLC (since August 2013); Aetos Alternatives Management, LLC (since January 2004); Chairperson of the Fixed Income Sub-Committee of the Investment Committee (since October 2006) and Director or Trustee of various Morgan Stanley Funds (since August 2006); formerly, Managing Director, Morgan Stanley & Co. Inc. and Morgan Stanley Dean Witter Investment Management, President, various Morgan Stanley Funds (June 1998-March 2000) and Principal, Morgan Stanley & Co. Inc. and Morgan Stanley Dean Witter Investment Management (August 1997-December 1999). | | | 98 | | | Director of certain investment funds managed or sponsored by Aetos Capital, LLC. Director of Sanitized AG and Sanitized Marketing AG (specialty chemicals). | |
Michael E. Nugent (77)
522 Fifth Avenue
New York, NY 10036 | | Chairperson of the Board and Director | | Chairperson of the Boards since July 2006 and Director since July 1991 | | Chairperson of the Boards of various Morgan Stanley Funds (since July 2006); Chairperson of the Closed-End Fund Committee (since June 2012) and Director or Trustee of various Morgan Stanley Funds (since July 1991); formerly, Chairperson of the Insurance Committee (until July 2006); General Partner, Triumph Capital, L.P. (private investment partnership) (1988-2013) | | | 100 | | | None. | |
W. Allen Reed (66)
c/o Kramer Levin Naftalis & Frankel LLP
Counsel to the Independent
Directors
1177 Avenue of the Americas
New York, NY 10036 | | Director | | Since
August
2006 | | Chairperson of the Equity Sub-Committee of the Investment Committee (since October 2006) and Director or Trustee of various Morgan Stanley Funds (since August 2006); formerly, President and CEO of General Motors Asset Management; Chairman and Chief Executive Officer of the GM Trust Bank and Corporate Vice President of General Motors Corporation (August 1994-December 2005). | | | 98 | | | Director of Temple-Inland Industries (packaging and forest products); Director of Legg Mason, Inc. and Director of the Auburn University Foundation. | |
Fergus Reid (81)
c/o Joe Pietryka, Inc.
85 Charles Colman Blvd.
Pawling, NY 12564 | | Director | | Since
June
1992 | | Chairman, Joe Pietryka, Inc.; Chairperson of the Governance Committee and Director or Trustee of various Morgan Stanley Funds (since June 1992). | | | 101 | | | Through December 31, 2012, Trustee and Director of certain Investment companies in the JP Morgan Fund Complex. | |
30
Morgan Stanley Institutional Fund, Inc.
Annual Report — December 31, 2013
Director and Officer Information (unaudited) (cont'd)
Interested Director:
Name, Age and Address of
Interested Director | | Position(s) Held
with Registrant | | Length of
Time Served* | | Principal Occupation(s) During Past 5 Years | | Number of
Portfolios in
Fund Complex
Overseen by
Interested
Director** | | Other Directorships
Held by Interested
Director*** | |
James F. Higgins (66)
One New York Plaza
New York, New York 10004 | | Director | | Since
June
2000 | | Director or Trustee of various Morgan Stanley Funds (since June 2000); Senior Advisor of Morgan Stanley (since August 2000). | | | 99 | | | Formerly, Director of AXA Financial, Inc. and AXA Equitable Life Insurance Company (2002-2011) and Director of AXA MONY Life Insurance Company and AXA MONY Life Insurance Company of America (2004-2011). | |
* Each Director serves an indefinite term, until his or her successor is elected.
** The Fund Complex includes (as of December 31, 2013) all open-end and closed-end funds (including all of their portfolios) advised by Morgan Stanley Investment Management Inc. (the "Adviser") and any funds that have an adviser that is an affiliated person of the Adviser (including, but not limited to, Morgan Stanley AIP GP LP).
*** This includes any directorships at public companies and registered investment companies held by the Director at any time during the past five years.
31
Morgan Stanley Institutional Fund, Inc.
Annual Report — December 31, 2013
Director and Officer Information (unaudited) (cont'd)
Executive Officers:
Name, Age and Address of Executive Officer | | Position(s) Held
with
Registrant | | Length of
Time Served* | | Principal Occupation(s) During Past 5 Years | |
John H. Gernon (50)
522 Fifth Avenue
New York, NY 10036 | | President and Principal Executive Officer—Equity, Fixed Income and AIP Funds | | Since September 2013 | | President and Principal Executive Officer of the Equity and Fixed Income Funds and the Morgan Stanley AIP Funds (since September 2013) in the Fund Complex. Managing Director of the Adviser. | |
Stefanie V. Chang Yu (47)
522 Fifth Avenue
New York, NY 10036 | | Chief Compliance Officer | | Since
January
2014 | | Managing Director of the Adviser and various entities affiliated with the Adviser; Chief Compliance Officer of various Morgan Stanley Funds and the Adviser (since January 2014) formerly Vice President of various Morgan Stanley Funds (December 1997-January 2014). | |
Joseph C. Benedetti (48)
522 Fifth Avenue
New York, NY 10036 | | Vice President | | Since
January
2014 | | Managing Director of the Adviser and various entities affiliated with the Adviser; Vice President of various Morgan Stanley Funds (since January 2014). | |
Francis J. Smith (48)
522 Fifth Avenue
New York, NY 10036 | | Treasurer and Principal Financial Officer | | Treasurer since July 2003 and Principal Financial Officer since September 2002 | | Executive Director of the Adviser and various entities affiliated with the Adviser; Treasurer and Principal Financial Officer of various Morgan Stanley Funds (since July 2003). | |
Mary E. Mullin (46)
522 Fifth Avenue
New York, NY 10036 | | Secretary | | Since
June
1999 | | Executive Director of the Adviser and various entities affiliated with the Adviser; Secretary of various Morgan Stanley Funds (since June 1999). | |
* Each officer serves an indefinite term, until his or her successor is elected.
32
Morgan Stanley Institutional Fund, Inc.
Annual Report — December 31, 2013
Adviser and Administrator
Morgan Stanley Investment Management Inc.
522 Fifth Avenue
New York, New York 10036
Distributor
Morgan Stanley Distribution, Inc.
522 Fifth Avenue
New York, New York 10036
Dividend Disbursing and Transfer Agent
Boston Financial Data Services, Inc.
2000 Crown Colony Drive
Quincy, Massachusetts 02169
Custodian
State Street Bank and Trust Company
One Lincoln Street
Boston, Massachusetts 02111
Legal Counsel
Dechert LLP
1095 Avenue of the Americas
New York, New York 10036
Counsel to the Independent Directors
Kramer Levin Naftalis & Frankel LLP
1177 Avenue of the Americas
New York, New York 10036
Independent Registered Public Accounting Firm
Ernst & Young LLP
200 Clarendon Street
Boston, Massachusetts 02116
Reporting to Shareholders
Each Morgan Stanley fund provides a complete schedule of portfolio holdings in its semi-annual and annual reports within 60 days of the end of the fund's second and fourth fiscal quarters by filing the schedule electronically with the Securities and Exchange Commission (SEC). The semi-annual reports are filed on Form N-CSRS and the annual reports are filed on Form N-CSR. Morgan Stanley also delivers the semi-annual and annual reports to fund shareholders and makes these reports available on its public website, www.morganstanley.com/im. Each Morgan Stanley fund also files a complete schedule of portfolio holdings with the SEC for the fund's first and third fiscal quarters on Form N-Q. Morgan Stanley does not deliver the reports for the first and third fiscal quarters to shareholders, nor are the reports posted to the Morgan Stanley public website. You may, however, obtain the Form N-Q filings (as well as the Form N-CSR and N-CSRS filings) by accessing the SEC's website, www.sec.gov. You may also review and copy them at the SEC's Public Reference Room in Washington, DC. Information on the operation of the SEC's Public Reference Room may be obtained by calling the SEC toll free at 1 (800) SEC-0330. You can also request copies of these materials, upon payment of a duplicating fee, by electronic request at the SEC's email address (publicinfo@sec.gov) or by writing the Public Reference Room of the SEC, Washington, DC 20549-0102.
Proxy Voting Policies and Procedures and Proxy Voting Record
You may obtain a copy of the Fund's Proxy Voting Policy and Procedures and information regarding how the Fund voted proxies relating to portfolio securities during the most recent twelve-month period ended June 30, without charge, upon request, by calling toll free 1 (800) 548-7786 or by visiting our website at www.morganstanley.com/im. This information is also available on the SEC's website at www.sec.gov.
This report is authorized for distribution only when preceded or accompanied by a prospectus of the Morgan Stanley Institutional Fund, Inc. which describes in detail each Investment Portfolio's investment policies, risks, fees and expenses. Please read the prospectus carefully before you invest or send money. For additional information, including information regarding the investments comprising the Portfolio, please visit our website at www.morganstanley.com/im or call toll free 1 (800) 548-7786.
33
Printed in U.S.A.
This Report has been prepared for shareholders and may be distributed to others only if preceded or accompanied by a current prospectus.
Morgan Stanley Investment Management Inc.
522 Fifth Avenue
New York, New York 10036
© 2014 Morgan Stanley. Morgan Stanley Distribution, Inc.

IFIUSREAANN
809919 EXP 2.28.15

Morgan Stanley Institutional Fund, Inc.
Emerging Markets Domestic Debt Portfolio
Annual Report
December 31, 2013

Morgan Stanley Institutional Fund, Inc.
Annual Report — December 31, 2013
Shareholders' Letter | | | 2 | | |
Expense Example | | | 3 | | |
Investment Overview | | | 4 | | |
Portfolio of Investments | | | 7 | | |
Statement of Assets and Liabilities | | | 9 | | |
Statement of Operations | | | 11 | | |
Statements of Changes in Net Assets | | | 12 | | |
Financial Highlights | | | 14 | | |
Notes to Financial Statements | | | 18 | | |
Report of Independent Registered Public Accounting Firm | | | 27 | | |
Federal Tax Notice | | | 28 | | |
U.S. Privacy Policy | | | 29 | | |
Director and Officer Information | | | 32 | | |
This report is authorized for distribution only when preceded or accompanied by prospectuses of the Morgan Stanley Institutional Fund, Inc. To receive a prospectus and/or statement of additional information (SAI), which contains more complete information such as investment objectives, charges, expenses, policies for voting proxies, risk considerations, and describes in detail each of the Portfolio's investment policies to the prospective investor, please call toll free 1 (800) 548-7786. Please read the prospectuses carefully before you invest or send money.
Additionally, you can access portfolio information including performance, characteristics, and investment team commentary through Morgan Stanley Investment Management's website: www.morganstanley.com/im.
Market forecasts provided in this report may not necessarily come to pass. There is no guarantee that any sectors mentioned will continue to perform as discussed herein or that securities in such sectors will be held by the Portfolio in the future. There is no assurance that a Portfolio will achieve its investment objective. Portfolios are subject to market risk, which is the possibility that market values of securities owned by the Portfolio will decline and, therefore, the value of the Portfolio's shares may be less than what you paid for them. Accordingly, you can lose money investing in the Portfolio. Please see the prospectus for more complete information on investment risks.
1
Morgan Stanley Institutional Fund, Inc.
Annual Report — December 31, 2013
Shareholders' Letter (unaudited)
Dear Shareholders,
We are pleased to provide this Annual report, in which you will learn how your investment in Emerging Markets Domestic Debt Portfolio (the "Portfolio") performed during the latest twelve-month period.
Morgan Stanley Investment Management is a client-centric, investor-led organization. Our global presence, intellectual capital, and breadth of products and services enable us to partner with investors to meet the evolving challenges of today's financial markets. We aim to deliver superior investment service and to empower our clients to make the informed decisions that help them reach their investment goals.
As always, we thank you for selecting Morgan Stanley Investment Management, and look forward to working with you in the months and years ahead.
Sincerely,

John H. Gernon
President and Principal Executive Officer
January 2014
2
Morgan Stanley Institutional Fund, Inc.
Annual Report — December 31, 2013
Expense Example (unaudited)
Emerging Markets Domestic Debt Portfolio
As a shareholder of the Portfolio, you incur two types of costs: (1) transactional costs, including redemptions fees; and (2) ongoing costs, including advisory fees, administration fees, distribution and shareholder services fees and other Portfolio expenses. This example is intended to help you understand your ongoing costs (in dollars) of investing in the Portfolio and to compare these costs with the ongoing costs of investing in other mutual funds.
This example is based on an investment of $1,000 invested at the beginning of the six-month period ended December 31, 2013 and held for the entire six-month period.
Actual Expenses
The table below provides information about actual account values and actual expenses. You may use the information in this table, together with the amount you invested, to estimate the expenses that you paid over the period. Simply divide your account value by $1,000 (for example, an $8,600 account value divided by $1,000 = 8.6), then multiply the result by the number in the table under the heading entitled "Actual Expenses Paid During Period" to estimate the expenses you paid on your account during this period.
Hypothetical Example for Comparison Purposes
The table below provides information about hypothetical account values and hypothetical expenses based on the Portfolio's actual expense ratio and an assumed rate of return of 5% per year before expenses, which is not the Portfolio's actual return. The hypothetical account values and expenses may not be used to estimate the actual ending account balance or expenses you paid for the period. You may use this information to compare the ongoing costs of investing in the Portfolio and other funds. To do so, compare this 5% hypothetical example with the 5% hypothetical examples that appear in the shareholder reports of the other funds.
Please note that the expenses shown in the table are meant to highlight your ongoing costs only and do not reflect any transactional costs, such as sales charges (loads) and redemption fees. Therefore, the information for each class in the table is useful in comparing ongoing costs only, and will not help you determine the relative total costs of owning different funds. In addition, if these transactional costs were included, your costs would have been higher.
| | | Beginning
Account
Value
7/1/13 | | Actual Ending
Account
Value
12/31/13 | | Hypothetical
Ending Account
Value | | Actual
Expenses
Paid
During
Period | | Hypothetical
Expenses Paid
During Period | | Net
Expense
Ratio
During
Period*** | |
Emerging Markets Domestic Debt Portfolio Class I | | $ | 1,000.00 | | | $ | 969.40 | | | $ | 1,020.97 | | | $ | 4.17 | * | | $ | 4.28 | * | | | 0.84 | % | |
Emerging Markets Domestic Debt Portfolio Class A@ | | | 1,000.00 | | | | 968.00 | | | | 1,019.36 | | | | 5.75 | * | | | 5.90 | * | | | 1.16 | | |
Emerging Markets Domestic Debt Portfolio Class L | | | 1,000.00 | | | | 967.60 | | | | 1,018.30 | | | | 6.79 | * | | | 6.97 | * | | | 1.37 | | |
Emerging Markets Domestic Debt Portfolio Class IS | | | 1,000.00 | | | | 987.00 | | | | 1,012.25 | | | | 2.39 | ** | | | 2.42 | ** | | | 0.82 | | |
* Expenses are calculated using each Portfolio Class' annualized net expense ratio (as disclosed), multiplied by the average account value over the period, and multiplied by 184/365 (to reflect the most recent one-half year period).
** Expenses are calculated using the Portfolio Class' annualized net expense ratio (as disclosed), multiplied by the average account value over the period, and multiplied by 107/365 (to reflect the actual days in the period).
*** Annualized.
@ Effective September 9, 2013, Class P and Class H shares were renamed Class A shares.
3
Morgan Stanley Institutional Fund, Inc.
Annual Report — December 31, 2013
Investment Overview (unaudited)
Emerging Markets Domestic Debt Portfolio
The Emerging Markets Domestic Debt Portfolio seeks high total return by investing primarily in fixed income securities of government and government-related issuers and, to a lesser extent, of corporate issuers in emerging market countries.
Performance
For the year ended December 31, 2013, the Portfolio had a total return based on net asset value and reinvestment of distributions per share of -12.54%, net of fees, for Class I shares. The Portfolio's Class I shares underperformed against its benchmark, the JP Morgan EMBI Global Bond Index/JP Morgan GBI-EM Global Diversified Bond Index (the "Index"), which returned -8.98%.
Factors Affecting Performance
• Emerging markets (EM) came under significant pressure during the year, as external debt spreads widened, domestic debt yields rose and EM currencies weakened versus the U.S. dollar. During the period, the U.S. Treasury 10-year yield rose by 127 basis points to 3.03% (as per Bloomberg data), due to positive U.S. economic data releases, the Federal Reserve's (Fed) optimistic growth outlook and signs of an improving labor market. This led to a widespread perception among investors that the Fed would begin "tapering" quantitative easing (QE) sooner than previously expected. This expectation was validated by the Federal Open Market Committee (FOMC) in December, as they announced their intention to reduce the size of asset purchases starting in January.
• The generalized weakness in EM debt accrued mainly from positioning rather than a shift in fundamentals. Starting in late May, sustained outflows from the asset class weighed on prices and investor sentiment. For the last few years, investors had been increasing their exposure to EM debt due to the relatively higher economic growth rates of emerging markets versus developed markets, the strong balance sheets in emerging markets and the additional yield offered versus traditional "safe haven" assets. These attributes may have also attracted investors who are tactical in nature and wanted to participate in the "carry trade," a strategy that borrows in a lower yielding currency to invest in potentially higher yielding assets. For investors of this nature, a change in the pace of Fed accommodation
was sufficient reason to reduce their exposure to emerging markets.
• In addition to events in the developed world, concerns over China's declining growth rates weighed on countries that export to China, such as Chile, Indonesia and Brazil. Furthermore, idiosyncratic developments in countries such as Turkey, South Africa, Egypt, Ukraine and Brazil exacerbated the more complex global environment for emerging markets. In the case of Turkey, protests that began in late May stabilized during June, but damaged investor perception of the country, its institutions and the outlook for European Union (EU) membership. Also, in December an anti-corruption investigation targeting high-profile figures connected to Prime Minister Recep Tayyip Erdogan's government and a CEO of a state-run bank caused weakness in Turkish debt and currency. In addition, geopolitical tensions across the Middle East remained elevated throughout the year. In Brazil, demonstrations against bus fare hikes spread throughout the country, with protestors complaining about poor-quality services, rising inflation, and the excessive cost of the 2014 World Cup and the 2016 Olympics. In response, the Brazilian government cancelled the fare hikes and proposed a political reform. However, continued fiscal deterioration, persistent inflation and an increasing current account deficit led investors to believe that Brazil may soon be downgraded by the rating agencies. In South Africa, Fitch cut the country's foreign currency long-term rating to BBB from BBB+, citing weaker economic growth prospects with weaker mining production weighing on economic activity. In Ukraine, the government's refusal to sign an association agreement with the EU prompted street protests by opposition parties, which demanded the resignation of President Viktor Yanukovych and his cabinet, and called for early presidential and parliamentary elections. Lastly, demonstrators in Thailand demanded Prime Minister Yingluck Shinawatra's resignation.
• However, there were positive developments in 2013 as well. Moody's upgraded the Philippines from Ba1 to Baa3 with a positive outlook on the back of robust economic performance, ongoing fiscal and debt consolidation, political stability and improved governance. In addition, an incipient growth
4
Morgan Stanley Institutional Fund, Inc.
Annual Report — December 31, 2013
Investment Overview (unaudited) (cont'd)
Emerging Markets Domestic Debt Portfolio
recovery in the euro area boosted the growth outlook and improved the current account balances of Eastern European countries such as Poland, Hungary and the Czech Republic. Finally, in December, Mexico passed a landmark energy reform, allowing private investment in the energy sector, which could lead to higher growth and increased foreign direct investment. The passage of this legislation combined with improvements in the fiscal framework prompted S&P to raise Mexico's sovereign rating to BBB+.
• For the year, longer-than-benchmark duration in Brazil, Mexico, Poland, Russia and Turkey detracted from relative returns. In addition, overweights to the Brazilian real, Turkish lira, South African rand and Russian ruble hurt relative performance.
• Conversely, the Portfolio benefited from maintaining below-benchmark duration and currency exposure in much of Asia, including Indonesia, Malaysia and Thailand. The Portfolio also benefited from a short position in the Japanese yen, managed through currency forwards, which was used as a hedge against broad U.S. dollar appreciation. Also, short positions in U.S. Treasury futures aided relative returns and acted as a hedge against rising global interest rates.
Management Strategies
• We continue to see a divergence in monetary policy between the U.S. and the rest of the developed world for the time being. We expect the Fed to gradually continue reducing the pace of monetary stimulus, amid an environment of improved growth and contained inflation pressures. Nonetheless, the Fed's dovish bias (or preference for low interest rates) will probably remain under the new forward guidance policy (that is, using communications to manage the market's expectations) and the expected leadership of Janet Yellen. On the other hand, in the eurozone and Japan, where the economic recovery remains fragile and inflation pressures are very subdued, we expect highly accommodative monetary conditions to remain for the near term.
• In contrast with past episodes, we do not believe that an expected recovery in developed market economies will necessarily translate into a broad-based positive impact on EM asset prices. On the contrary, we expect differentiation between EM
countries to deepen — those countries with current account deficits and low exposure to developed markets, overheating domestic demand and poor institutional frameworks are likely to diverge from those with contained macro imbalances and/or undergoing structural reforms. While EM demand-side stimulus may have been warranted in the wake of the 2008 global financial crisis, several countries have been unwilling or unable to reverse fiscal stimulus. Unfortunately, this situation is likely to persist in 2014. This is because within the group of countries exhibiting the largest imbalances (Brazil, South Africa, Turkey, India and Indonesia) most will hold general or local elections in 2014. Moreover, a further sell-off in developed market interest rates could exert added pressure to EM rates and currencies in 2014. In the presence of such external shocks, EM central banks are likely to allow their currencies to weaken as the main channel of adjustment. Such an environment calls for a selective investment approach coupled with active duration management.
* Minimum Investment for Class I shares
In accordance with SEC regulations, Portfolio's performance shown assumes that all recurring fees (including management fees) were deducted and all dividends and distributions were reinvested. The performance of Class A+, L and IS shares will vary from Class I shares based upon their different inception dates and will be negatively impacted by additional fees assessed to those classes (if applicable).
5
Morgan Stanley Institutional Fund, Inc.
Annual Report — December 31, 2013
Investment Overview (unaudited) (cont'd)
Emerging Markets Domestic Debt Portfolio
Performance Compared to the JP Morgan EMBI Global Bond Index/JP Morgan GBI-EM Global Diversified Bond Index(1) and the Lipper Emerging Markets Local Currency Debt Funds Average(2)
| | | Period Ended December 31, 2013
Total Returns(3) | |
| | | | | Average Annual | |
| | | One
Year | | Five
Years | | Ten
Years | | Since
Inception(8) | |
Portfolio — Class I Shares
w/o sales charges(4) | | | -12.54 | % | | | 7.00 | % | | | 6.12 | % | | | 8.70 | % | |
JP Morgan EMBI Global Bond
Index/JP Morgan GBI-EM Global
Diversified Bond Index | | | -8.98 | | | | 8.06 | | | | 7.33 | | | | 9.12 | | |
Lipper Emerging Markets Local
Currency Debt Funds Average | | | -9.05 | | | | 8.08 | | | | 5.99 | | | | 9.41 | | |
Portfolio — Class A+ Shares
w/o sales charges(5) | | | -12.76 | | | | 6.74 | | | | 5.86 | | | | 8.75 | | |
Portfolio — Class A+ Shares with
maximum 4.25% sales charges(5) | | | -16.47 | | | | 5.82 | | | | 5.40 | | | | 8.49 | | |
JP Morgan EMBI Global Bond
Index/JP Morgan GBI-EM Global
Diversified Bond Index | | | -8.98 | | | | 8.06 | | | | 7.33 | | | | 9.93 | | |
Lipper Emerging Markets Local
Currency Debt Funds Average | | | -9.05 | | | | 8.08 | | | | 5.99 | | | | 9.43 | | |
Portfolio — Class L Shares
w/o sales charges(6) | | | -13.00 | | | | 6.24 | | | | — | | | | 3.24 | | |
JP Morgan EMBI Global Bond
Index/JP Morgan GBI-EM Global
Diversified Bond Index | | | -8.98 | | | | 8.06 | | | | — | | | | 5.99 | | |
Lipper Emerging Markets Local
Currency Debt Funds Average | | | -9.05 | | | | 8.08 | | | | — | | | | 4.42 | | |
Portfolio — Class IS Shares
w/o sales charges(7) | | | — | | | | — | | | | — | | | | -1.30 | | |
JP Morgan EMBI Global Bond
Index/JP Morgan GBI-EM Global
Diversified Bond Index | | | — | | | | — | | | | — | | | | -0.02 | | |
Lipper Emerging Markets Local
Currency Debt Funds Average | | | — | | | | — | | | | — | | | | 0.29 | | |
Performance data quoted represents past performance, which is no guarantee of future results, and current performance may be lower or higher than the figures shown. Performance assumes that all dividends and distributions, if any, were reinvested. For the most recent month-end performance figures, please visit www.morganstanley.com/im. Investment return and principal value will fluctuate so that Portfolio shares, when redeemed, may be worth more or less than their original cost. Total returns do not reflect the deduction of taxes that a shareholder would pay on Portfolio distributions or the redemption of Portfolio shares. Returns for periods less than one year are not annualized. Performance of share classes will vary due to difference in expenses.
+ Effective September 9, 2013, Class P shares were renamed Class A shares.
(1) JP Morgan EMBI Global Bond Index/JP Morgan GBI-EM Global Diversified Bond Index is a custom index represented by performance of the JP Morgan EMBI Global Bond Index (which tracks the performance U.S. dollar — denominated debt instruments issued by emerging markets) for periods from the Portfolio's inception to September 30, 2007 and the JP Morgan GBI-EM Global Diversified
Bond Index (which tracks local currency government bonds issued by emerging markets) for periods thereafter. The Index is unmanaged and its returns do not include any sales charges or fees. Such costs would lower performance. It is not possible to invest directly in an index.
(2) The Lipper Emerging Markets Local Currency Debt Funds Average tracks the performance of all funds in the Lipper Emerging Markets Local Currency Debt Funds classification. The Average, which is adjusted for capital gains distributions and income dividends, is unmanaged and should not be considered an investment. As of the date of this report, the Portfolio is in the Lipper Emerging Markets Local Currency Debt Funds classification.
(3) Total returns for the Portfolio reflect fees waived and expenses reimbursed, if applicable, by the Adviser. Without such waivers and reimbursements, total returns would have been lower. The fee waivers and/or expense reimbursements will continue for at least one year or until such time as the Fund's Board of Directors acts to discontinue all or a portion of such waivers and/or expense reimbursements when it deems that such action is appropriate.
(4) Commenced operations on February 1, 1994.
(5) Commenced offering on January 2, 1996.
(6) Commenced offering on June 16, 2008.
(7) Commenced offering on September 13, 2013.
(8) For comparative purposes, average annual since inception returns listed for the Indexes refer to the inception date or initial offering of the respective share class of the Portfolio, not the inception of the Index. Returns for periods less than one year are not annualized.
Portfolio Composition
Classification | | Percentage of
Total Investments | |
Sovereign | | | 92.3 | % | |
Other* | | | 7.7 | | |
Total Investments | | | 100.0 | %** | |
* Industries and/or investment types representing less than 5% of total investments.
** Does not include open short futures contracts with an underlying face amount of approximately $6,398,000 and total unrealized appreciation of approximately $122,000. Does not include open foreign currency forward exchange contracts with net unrealized depreciation of approximately $16,000.
6
Morgan Stanley Institutional Fund, Inc.
Annual Report — December 31, 2013
Portfolio of Investments
Emerging Markets Domestic Debt Portfolio
| | | Face
Amount
(000) | | Value
(000) | |
Fixed Income Securities (94.5%) | |
Brazil (9.9%) | |
Sovereign (9.9%) | |
Banco Nacional de Desenvolvimento
Economico e Social,
5.75%, 9/26/23 | | $ | 730 | | | $ | 723 | | |
Brazil Notas do Tesouro Nacional, Series F,
10.00%, 1/1/17 | | BRL | 6,750 | | | | 2,712 | | |
| | | | 3,435 | | |
Chile (0.4%) | |
Sovereign (0.4%) | |
Chile Government International Bond,
5.50%, 8/5/20 | | CLP | 67,000 | | | | 131 | | |
Colombia (3.7%) | |
Sovereign (3.7%) | |
Colombia Government International Bond,
4.38%, 3/21/23 | | COP | 2,031,000 | | | | 937 | | |
9.85%, 6/28/27 | | | 552,000 | | | | 361 | | |
| | | | 1,298 | | |
Hungary (6.2%) | |
Sovereign (6.2%) | |
Hungary Government Bond,
6.00%, 11/24/23 | | HUF | 453,500 | | | | 2,159 | | |
Indonesia (6.7%) | |
Sovereign (6.7%) | |
Barclays Bank PLC, Republic of Indonesia
Government Bond, Credit Linked Notes,
9.00%, 9/19/18 (a) | | IDR | 10,000,000 | | | | 851 | | |
Deutsche Bank AG, Republic of Indonesia
Government Bond, Credit Linked Notes,
11.00%, 12/15/20 (a)(b) | | | 12,000,000 | | | | 1,123 | | |
JPMorgan Chase & Co., Republic of Indonesia
Government Bond, Credit Linked Notes,
9.00%, 9/18/18 (a) | | | 1,000,000 | | | | 85 | | |
11.00%, 11/17/20 | | | 3,000,000 | | | | 281 | | |
| | | | 2,340 | | |
Malaysia (6.0%) | |
Sovereign (6.0%) | |
Malaysia Government Bond,
3.43%, 8/15/14 | | MYR | 1,658 | | | | 508 | | |
3.81%, 2/15/17 | | | 5,150 | | | | 1,584 | | |
| | | | 2,092 | | |
Mexico (12.6%) | |
Sovereign (12.6%) | |
Mexican Bonos,
7.50%, 6/3/27 | | MXN | 31,410 | | | | 2,571 | | |
Petroleos Mexicanos(Units),
7.65%, 11/24/21 (a)(c) | | | 23,000 | | | | 1,816 | | |
| | | | 4,387 | | |
Nigeria (0.8%) | |
Sovereign (0.8%) | |
Nigeria Government Bond,
16.39%, 1/27/22 | | NGN | 39,000 | | | | 282 | | |
| | | Face
Amount
(000) | | Value
(000) | |
Peru (2.1%) | |
Sovereign (2.1%) | |
Peru Government Bond(Units),
8.60%, 8/12/17 | | PEN | 1,390 | | | $ | 572 | | |
Peruvian Government International
Bond(Units),
6.95%, 8/12/31 (a)(c) | | | 457 | | | | 164 | | |
| | | | 736 | | |
Poland (10.4%) | |
Sovereign (10.4%) | |
Poland Government Bond,
3.75%, 4/25/18 | | PLN | 2,721 | | | | 909 | | |
5.25%, 10/25/17 | | | 835 | | | | 294 | | |
5.75%, 10/25/21 | | | 6,610 | | | | 2,410 | | |
| | | | 3,613 | | |
Russia (10.1%) | |
Corporate Bond (1.6%) | |
VimpelCom Holdings BV,
9.00%, 2/13/18 (a) | | RUB | 18,200 | | | | 556 | | |
Sovereign (8.5%) | |
Russian Federal Bond - OFZ,
8.15%, 2/3/27 | | | 93,650 | | | | 2,947 | | |
| | | | 3,503 | | |
South Africa (11.3%) | |
Sovereign (11.3%) | |
Eskom Holdings SOC Ltd.,
5.75%, 1/26/21 | | $ | 1,050 | | | | 1,050 | | |
South Africa Government Bond,
7.25%, 1/15/20 | | ZAR | 30,380 | | | | 2,868 | | |
| | | | 3,918 | | |
Thailand (2.3%) | |
Sovereign (2.3%) | |
Thailand Government Bond,
5.25%, 5/12/14 | | THB | 25,333 | | | | 779 | | |
Turkey (9.3%) | |
Corporate Bond (2.7%) | |
Turkiye Garanti Bankasi AS,
7.38%, 3/7/18 (a) | | TRY | 2,370 | | | | 932 | | |
Sovereign (6.6%) | |
Turkey Government Bond,
8.50%, 9/14/22 | | | 1,000 | | | | 421 | | |
9.00%, 1/27/16 - 3/8/17 | | | 2,080 | | | | 948 | | |
10.00%, 6/17/15 | | | 950 | | | | 443 | | |
10.50%, 1/15/20 | | | 994 | | | | 474 | | |
| | | | 2,286 | | |
| | | | 3,218 | | |
Venezuela (2.7%) | |
Sovereign (2.7%) | |
Petroleos de Venezuela SA,
8.50%, 11/2/17 | | $ | 1,100 | | | | 918 | | |
Total Fixed Income Securities (Cost $35,689) | | | 32,809 | | |
The accompanying notes are an integral part of the financial statements.
7
Morgan Stanley Institutional Fund, Inc.
Annual Report — December 31, 2013
Portfolio of Investments (cont'd)
Emerging Markets Domestic Debt Portfolio
| | | No. of
Warrants | | Value
(000) | |
Warrants (0.0%) | |
Venezuela (0.0%) | |
Venezuela Government International Bond,
Oil-Linked Payment Obligation,
expires 4/15/20 (b)(d) (Cost $—) | | | 495 | | | $ | 12 | | |
| | | Shares | | | |
Short-Term Investment (3.2%) | |
Investment Company (3.2%) | |
Morgan Stanley Institutional Liquidity
Funds — Money Market Portfolio —
Institutional Class (See Note G)
(Cost $1,112) | | | 1,112,029 | | | | 1,112 | | |
Total Short-Term Investments (Cost $1,112) | | | 1,112 | | |
Total Investments (97.7%) (Cost $36,801) (e) | | | 33,933 | | |
Other Assets in Excess of Liabilities (2.3%) | | | 812 | | |
Net Assets (100.0%) | | $ | 34,745 | | |
(a) 144A security — Certain conditions for public sale may exist. Unless otherwise noted, these securities are deemed to be liquid.
(b) Variable/Floating Rate Security — Interest rate changes on these instruments are based on changes in a designated base rate. The rates shown are those in effect on December 31, 2013.
(c) Consists of one or more classes of securities traded together as a unit.
(d) Security has been deemed illiquid at December 31, 2013.
(e) Securities are available for collateral in connection with open foreign currency forward exchange contracts and future contracts.
Foreign Currency Forward Exchange Contracts:
The Portfolio had the following foreign currency forward exchange contracts open at December 31, 2013:
Counterparty | | Currency to
Deliver
(000) | | Value
(000) | | Settlement
Date | | In Exchange
For
(000) | | Value
(000) | | Unrealized
Appreciation
(Depreciation)
(000) | |
JPMorgan Chase Bank | | BRL | 1,720 | | | $ | 728 | | | 1/3/14 | | USD | 734 | | | $ | 734 | | | $ | 6 | | |
JPMorgan Chase Bank | | BRL | 1,720 | | | | 730 | | | 1/3/14 | | USD | 735 | | | | 735 | | | | 5 | | |
JPMorgan Chase Bank | | USD | 738 | | | | 738 | | | 1/3/14 | | BRL | 1,720 | | | | 729 | | | | (9 | ) | |
JPMorgan Chase Bank | | USD | 734 | | | | 734 | | | 1/3/14 | | BRL | 1,720 | | | | 729 | | | | (5 | ) | |
JPMorgan Chase Bank | | EUR | 1,350 | | | | 1,857 | | | 1/17/14 | | USD | 1,857 | | | | 1,857 | | | | (— | @) | |
JPMorgan Chase Bank | | MXN | 13,390 | | | | 1,025 | | | 1/17/14 | | USD | 1,029 | | | | 1,029 | | | | 4 | | |
JPMorgan Chase Bank | | USD | 1,862 | | | | 1,862 | | | 1/17/14 | | EUR | 1,350 | | | | 1,857 | | | | (5 | ) | |
JPMorgan Chase Bank | | USD | 1,036 | | | | 1,037 | | | 1/17/14 | | MXN | 13,390 | | | | 1,025 | | | | (12 | ) | |
| | | | | $ | 8,711 | | | | | | | $ | 8,695 | | | $ | (16 | ) | |
@ Value is less than $500.
BRL — Brazilian Real
CLP — Chilean Peso
COP — Colombian Peso
EUR — Euro
HUF — Hungarian Forint
IDR — Indonesian Rupiah
MXN — Mexican Peso
MYR — Malaysian Ringgit
NGN — Nigerian Naira
PEN — Peruvian Nuevo Sol
PLN — Polish Zloty
RUB — Russian Ruble
THB — Thai Baht
TRY — Turkish Lira
USD — United States Dollar
ZAR — South African Rand
Futures Contracts:
The Portfolio had the following futures contracts open at December 31, 2013:
| | | Number
of
Contracts | | Value
(000) | | Expiration
Date | | Unrealized
Appreciation
(000) | |
Short: | |
U.S. Treasury 10 yr. Note | | | 52 | | | $ | (6,398 | ) | | Mar-14 | | $ | 122 | | |
The accompanying notes are an integral part of the financial statements.
8
Morgan Stanley Institutional Fund, Inc.
Annual Report — December 31, 2013
Emerging Markets Domestic Debt Portfolio
Statement of Assets and Liabilities | | December 31, 2013
(000) | |
Assets: | |
Investments in Securities of Unaffiliated Issuers, at Value (Cost $35,689) | | $ | 32,821 | | |
Investment in Security of Affiliated Issuer, at Value (Cost $1,112) | | | 1,112 | | |
Total Investments in Securities, at Value (Cost $36,801) | | | 33,933 | | |
Foreign Currency, at Value (Cost $66) | | | 65 | | |
Interest Receivable | | | 750 | | |
Receivable for Investments Sold | | | 188 | | |
Receivable for Variation Margin on Futures Contracts | | | 116 | | |
Tax Reclaim Receivable | | | 53 | | |
Unrealized Appreciation on Foreign Currency Forward Exchange Contracts | | | 15 | | |
Due from Adviser | | | 11 | | |
Receivable for Portfolio Shares Sold | | | 6 | | |
Receivable from Affiliate | | | — | @ | |
Other Assets | | | 5 | | |
Total Assets | | | 35,142 | | |
Liabilities: | |
Payable for Portfolio Shares Redeemed | | | 324 | | |
Unrealized Depreciation on Foreign Currency Forward Exchange Contracts | | | 31 | | |
Payable for Professional Fees | | | 9 | | |
Payable for Custodian Fees | | | 8 | | |
Payable for Sub Transfer Agency Fees | | | 4 | | |
Payable for Sub Transfer Agency Fees — Class I | | | 2 | | |
Payable for Sub Transfer Agency Fees — Class A* | | | — | @ | |
Payable for Sub Transfer Agency Fees — Class L | | | — | @ | |
Payable for Directors' Fees and Expenses | | | 5 | | |
Payable for Administration Fees | | | 3 | | |
Payable for Shareholder Services Fees — Class A* | | | 1 | | |
Payable for Distribution and Shareholder Services Fees — Class L | | | 1 | | |
Payable for Transfer Agent Fees — Class I | | | 1 | | |
Payable for Transfer Agent Fees — Class A* | | | — | @ | |
Payable for Transfer Agent Fees — Class L | | | — | @ | |
Payable for Transfer Agent Fees — Class IS | | | — | @ | |
Other Liabilities | | | 8 | | |
Total Liabilities | | | 397 | | |
Net Assets | | $ | 34,745 | | |
Net Assets Consist Of: | |
Paid-in-Capital | | $ | 40,593 | | |
Distributions in Excess of Net Investment Income | | | (953 | ) | |
Accumulated Net Realized Loss | | | (2,120 | ) | |
Unrealized Appreciation (Depreciation) on: | |
Investments | | | (2,868 | ) | |
Futures Contracts | | | 122 | | |
Foreign Currency Forward Exchange Contracts | | | (16 | ) | |
Foreign Currency Translations | | | (13 | ) | |
Net Assets | | $ | 34,745 | | |
The accompanying notes are an integral part of the financial statements.
9
Morgan Stanley Institutional Fund, Inc.
Annual Report — December 31, 2013
Emerging Markets Domestic Debt Portfolio
Statement of Assets and Liabilities (cont'd) | | December 31, 2013
(000) | |
CLASS I: | |
Net Assets | | $ | 25,669 | | |
| Shares Outstanding $0.003 par value shares of beneficial interest (500,000,000 shares authorized) (not in 000's) | | | 2,387,069 | | |
Net Asset Value, Offering and Redemption Price Per Share | | $ | 10.75 | | |
CLASS A*: | |
Net Assets | | $ | 6,065 | | |
| Shares Outstanding $0.003 par value shares of beneficial interest (500,000,000 shares authorized) (not in 000's) | | | 548,873 | | |
Net Asset Value, Redemption Price Per Share | | $ | 11.05 | | |
Maximum Sales Load§§ | | | 4.25 | % | |
Maximum Sales Charge | | $ | 0.49 | | |
Maximum Offering Price Per Share | | $ | 11.54 | | |
CLASS L: | |
Net Assets | | $ | 3,001 | | |
| Shares Outstanding $0.003 par value shares of beneficial interest (500,000,000 shares authorized) (not in 000's) | | | 277,381 | | |
Net Asset Value, Offering and Redemption Price Per Share | | $ | 10.82 | | |
CLASS IS: | |
Net Assets | | $ | 10 | | |
| Shares Outstanding $0.003 par value shares of beneficial interest (500,000,000 shares authorized) (not in 000's) | | | 907 | | |
Net Asset Value, Offering and Redemption Price Per Share | | $ | 10.75 | | |
@ Amount is less than $500.
* Effective September 9, 2013, Class P and Class H shares were renamed Class A shares.
§§ Effective February 25, 2013, the Directors approved the imposition of a maximum initial sales charge of 4.25% on purchases of Class A shares of the Portfolio.
The accompanying notes are an integral part of the financial statements.
10
Morgan Stanley Institutional Fund, Inc.
Annual Report — December 31, 2013
Emerging Markets Domestic Debt Portfolio
Statement of Operations | | Year Ended
December 31, 2013
(000) | |
Investment Income: | |
Interest from Securities of Unaffiliated Issuers | | $ | 3,111 | | |
Dividends from Securities of Unaffiliated Issuers | | | 3 | | |
Dividends from Security of Affiliated Issuer (Note G) | | | 2 | | |
Income from Securities Loaned — Net | | | — | @ | |
Total Investment Income | | | 3,116 | | |
Expenses: | |
Advisory Fees (Note B) | | | 412 | | |
Professional Fees | | | 130 | | |
Custodian Fees (Note F) | | | 53 | | |
Administration Fees (Note C) | | | 44 | | |
Registration Fees | | | 44 | | |
Shareholder Reporting Fees | | | 28 | | |
Shareholder Services Fees — Class A* (Note D) | | | 19 | | |
Distribution and Shareholder Services Fees — Class L (Note D) | | | 22 | | |
Transfer Agency Fees (Note E) | | | 12 | | |
Transfer Agency Fees — Class I (Note E) | | | 1 | | |
Transfer Agency Fees — Class A* (Note E) | | | — | @ | |
Transfer Agency Fees — Class L (Note E) | | | — | @ | |
Transfer Agency Fees — Class IS (Note E) | | | — | @ | |
Pricing Fees | | | 8 | | |
Sub Transfer Agency Fees | | | 6 | | |
Sub Transfer Agency Fees — Class I | | | 3 | | |
Sub Transfer Agency Fees — Class A* | | | 2 | | |
Sub Transfer Agency Fees — Class L | | | — | @ | |
Directors' Fees and Expenses | | | 2 | | |
Other Expenses | | | 19 | | |
Total Expenses | | | 805 | | |
Waiver of Advisory Fees (Note B) | | | (295 | ) | |
Rebate from Morgan Stanley Affiliate (Note G) | | | (3 | ) | |
Reimbursement of Class Specific Expenses — Class I (Note B) | | | (— | @) | |
Reimbursement of Class Specific Expenses — Class IS (Note B) | | | (— | @) | |
Net Expenses | | | 507 | | |
Net Investment Income | | | 2,609 | | |
Realized Gain (Loss): | |
Investments Sold | | | (2,690 | ) | |
Foreign Currency Forward Exchange Contracts | | | 100 | | |
Foreign Currency Transactions | | | (104 | ) | |
Futures Contracts | | | — | @ | |
Net Realized Loss | | | (2,694 | ) | |
Change in Unrealized Appreciation (Depreciation): | |
Investments | | | (7,313 | ) | |
Foreign Currency Forward Exchange Contracts | | | (70 | ) | |
Foreign Currency Translations | | | (30 | ) | |
Futures Contracts | | | 122 | | |
Net Change in Unrealized Appreciation (Depreciation) | | | (7,291 | ) | |
Net Realized Loss and Change in Unrealized Appreciation (Depreciation) | | | (9,985 | ) | |
Net Decrease in Net Assets Resulting from Operations | | $ | (7,376 | ) | |
@ Amount is less than $500.
* Effective September 9, 2013, Class P and Class H shares were renamed Class A shares.
The accompanying notes are an integral part of the financial statements.
11
Morgan Stanley Institutional Fund, Inc.
Annual Report — December 31, 2013
Emerging Markets Domestic Debt Portfolio
Statements of Changes in Net Assets | | Year Ended
December 31,
2013
(000) | | Year Ended
December 31,
2012
(000) | |
Increase (Decrease) in Net Assets: | |
Operations: | |
Net Investment Income | | $ | 2,609 | | | $ | 4,430 | | |
Net Realized Loss | | | (2,694 | ) | | | (2,403 | ) | |
Net Change in Unrealized Appreciation (Depreciation) | | | (7,291 | ) | | | 9,647 | | |
Net Increase (Decrease) in Net Assets Resulting from Operations | | | (7,376 | ) | | | 11,674 | | |
Distributions from and/or in Excess of: | |
Class I: | |
Net Investment Income | | | (789 | ) | | | (2,342 | ) | |
Net Realized Gain | | | (444 | ) | | | (13 | ) | |
Paid-in-Capital | | | (233 | ) | | | | | |
Class A*: | |
Net Investment Income | | | (86 | ) | | | (158 | ) | |
Net Realized Gain | | | (48 | ) | | | (1 | ) | |
Paid-in-Capital | | | (41 | ) | | | | | |
Class H@@: | |
Net Investment Income | | | (29 | )** | | | (91 | ) | |
Net Realized Gain | | | (26 | )** | | | (1 | ) | |
Class L: | |
Net Investment Income | | | (54 | ) | | | (130 | ) | |
Net Realized Gain | | | (39 | ) | | | (1 | ) | |
Paid-in-Capital | | | (21 | ) | | | | | |
Class IS: | |
Net Investment Income | | | (— | @)*** | | | — | | |
Paid-in-Capital | | | (— | @)*** | | | | | |
Total Distributions | | | (1,810 | ) | | | (2,737 | ) | |
Capital Share Transactions:(1) | |
Class I: | |
Subscribed | | | 9,531 | | | | 37,923 | | |
Distributions Reinvested | | | 946 | | | | 859 | | |
Redeemed | | | (26,242 | ) | | | (66,914 | ) | |
Class A*: | |
Subscribed | | | 585 | | | | 433 | | |
Distributions Reinvested | | | 172 | | | | 159 | | |
Conversion from Class H | | | 2,444 | | | | — | | |
Redeemed | | | (2,034 | ) | | | (2,440 | ) | |
Class H@@: | |
Subscribed | | | — | | | | 44 | | |
Distributions Reinvested | | | 55 | ** | | | 91 | | |
Conversion to Class A | | | (2,444 | )** | | | — | | |
Redeemed | | | (223 | )** | | | (418 | ) | |
Class L: | |
Subscribed | | | 254 | | | | 405 | | |
Distributions Reinvested | | | 114 | | | | 131 | | |
Redeemed | | | (1,290 | ) | | | (1,431 | ) | |
Class IS: | |
Subscribed | | | 10 | *** | | | — | | |
Net Decrease in Net Assets Resulting from Capital Share Transactions | | | (18,122 | ) | | | (31,158 | ) | |
Redemption Fees | | | 3 | | | | 10 | | |
Total Decrease in Net Assets | | | (27,305 | ) | | | (22,211 | ) | |
Net Assets: | |
Beginning of Period | | | 62,050 | | | | 84,261 | | |
End of Period (Including Distributions in Excess of Net Investment Income of $(953) and $(559)) | | $ | 34,745 | | | $ | 62,050 | | |
The accompanying notes are an integral part of the financial statements.
12
Morgan Stanley Institutional Fund, Inc.
Annual Report — December 31, 2013
Emerging Markets Domestic Debt Portfolio
Statements of Changes in Net Assets (cont'd) | | Year Ended
December 31,
2013
(000) | | Year Ended
December 31,
2012
(000) | |
(1) Capital Share Transactions: | |
Class I: | |
Shares Subscribed | | | 760 | | | | 3,179 | | |
Shares Issued on Distributions Reinvested | | | 82 | | | | 71 | | |
Shares Redeemed | | | (2,281 | ) | | | (5,616 | ) | |
Net Decrease in Class I Shares Outstanding | | | (1,439 | ) | | | (2,366 | ) | |
Class A*: | |
Shares Subscribed | | | 48 | | | | 35 | | |
Shares Issued on Distributions Reinvested | | | 15 | | | | 13 | | |
Conversion from Class H | | | 220 | | | | — | | |
Shares Redeemed | | | (171 | ) | | | (199 | ) | |
Net Increase (Decrease) in Class A Shares Outstanding | | | 112 | | | | (151 | ) | |
Class H@@: | |
Shares Subscribed | | | — | | | | 3 | | |
Shares Issued on Distributions Reinvested | | | 4 | ** | | | 7 | | |
Conversion to Class A | | | (220 | )** | | | — | | |
Shares Redeemed | | | (17 | )** | | | (33 | ) | |
Net Decrease in Class H Shares Outstanding | | | (233 | ) | | | (23 | ) | |
Class L: | |
Shares Subscribed | | | 19 | | | | 33 | | |
Shares Issued on Distributions Reinvested | | | 10 | | | | 11 | | |
Shares Redeemed | | | (115 | ) | | | (119 | ) | |
Net Decrease in Class L Shares Outstanding | | | (86 | ) | | | (75 | ) | |
Class IS: | |
Shares Subscribed | | | 1 | *** | | | — | | |
@ Amount is less than $500.
@@ Effective September 9, 2013, Class H shares converted into Class A shares.
* Effective September 9, 2013, Class P shares were renamed Class A shares.
** For the period January 1, 2013 through September 6, 2013.
*** For the period September 13, 2013 through December 31, 2013.
The accompanying notes are an integral part of the financial statements.
13
Morgan Stanley Institutional Fund, Inc.
Annual Report — December 31, 2013
Financial Highlights
Emerging Markets Domestic Debt Portfolio
| | | Class I | |
| | | Year Ended December 31, | |
Selected Per Share Data and Ratios | | 2013 | | 2012 | | 2011 | | 2010 | | 2009 | |
Net Asset Value, Beginning of Period | | $ | 12.71 | | | $ | 11.23 | | | $ | 12.44 | | | $ | 12.15 | | | $ | 9.94 | | |
Income (Loss) from Investment Operations: | |
Net Investment Income† | | | 0.61 | | | | 0.65 | | | | 0.64 | | | | 0.87 | | | | 0.71 | | |
Net Realized and Unrealized Gain (Loss) | | | (2.18 | ) | | | 1.22 | | | | (1.07 | ) | | | 0.92 | | | | 1.64 | | |
Total from Investment Operations | | | (1.57 | ) | | | 1.87 | | | | (0.43 | ) | | | 1.79 | | | | 2.35 | | |
Distributions from and/or in Excess of: | |
Net Investment Income | | | (0.20 | ) | | | (0.39 | ) | | | (0.64 | ) | | | (0.93 | ) | | | (0.09 | ) | |
Net Realized Gain | | | (0.12 | ) | | | (0.00 | )‡ | | | (0.14 | ) | | | (0.57 | ) | | | (0.05 | ) | |
Paid-in-Capital | | | (0.07 | ) | | | — | | | | — | | | | — | | | | — | | |
Total Distributions | | | (0.39 | ) | | | (0.39 | ) | | | (0.78 | ) | | | (1.50 | ) | | | (0.14 | ) | |
Redemption Fees | | | 0.00 | ‡ | | | 0.00 | ‡ | | | 0.00 | ‡ | | | 0.00 | ‡ | | | 0.00 | ‡ | |
Net Asset Value, End of Period | | $ | 10.75 | | | $ | 12.71 | | | $ | 11.23 | | | $ | 12.44 | | | $ | 12.15 | | |
Total Return++ | | | (12.54 | )% | | | 16.89 | % | | | (3.66 | )% | | | 15.07 | % | | | 23.75 | % | |
Ratios and Supplemental Data: | |
Net Assets, End of Period (Thousands) | | $ | 25,669 | | | $ | 48,641 | | | $ | 69,557 | | | $ | 28,864 | | | $ | 38,041 | | |
Ratio of Expenses to Average Net Assets (1) | | | 0.84 | %+ | | | 0.84 | %+†† | | | 0.83 | %+†† | | | 0.84 | %+†† | | | 0.84 | %+ | |
Ratio of Expenses to Average Net Assets Excluding Non Operating Expenses | | | N/A | | | | N/A | | | | N/A | | | | 0.84 | %+†† | | | 0.84 | %+ | |
Ratio of Net Investment Income to Average Net Assets (1) | | | 5.08 | %+ | | | 5.40 | %+†† | | | 5.21 | %+†† | | | 7.12 | %+†† | | | 6.44 | %+ | |
Ratio of Rebate from Morgan Stanley Affiliates to Average Net Assets | | | 0.01 | % | | | 0.01 | %†† | | | 0.02 | %†† | | | 0.01 | %†† | | | 0.01 | % | |
Portfolio Turnover Rate | | | 117 | % | | | 84 | % | | | 85 | % | | | 109 | % | | | 138 | % | |
(1) Supplemental Information on the Ratios to Average Net Assets: | |
Ratios Before Expense Limitation: | |
Expenses to Average Net Assets | | | 1.39 | % | | | 1.18 | %†† | | | 1.19 | %†† | | | 1.29 | %+†† | | | 1.35 | %+ | |
Net Investment Income to Average Net Assets | | | 4.53 | % | | | 5.06 | %†† | | | 4.85 | %†† | | | 6.67 | %+†† | | | 5.93 | %+ | |
† Per share amount is based on average shares outstanding.
‡ Amount is less than $0.005 per share.
++ Calculated based on the net asset value as of the last business day of the period.
+ The Ratios of Expenses and Net Investment Income reflect the rebate of certain Portfolio expenses in connection with the investments in Morgan Stanley affiliates during the period. The effect of the rebate on the ratios is disclosed in the above table as "Ratio of Rebate from Morgan Stanley Affiliates to Average Net Assets."
†† Reflects overall Portfolio ratios for investment income and non-class specific expenses.
The accompanying notes are an integral part of the financial statements.
14
Morgan Stanley Institutional Fund, Inc.
Annual Report — December 31, 2013
Financial Highlights
Emerging Markets Domestic Debt Portfolio
| | | Class A@ | |
| | | Year Ended December 31, | |
Selected Per Share Data and Ratios | | 2013 | | 2012 | | 2011 | | 2010 | | 2009 | |
Net Asset Value, Beginning of Period | | $ | 13.06 | | | $ | 11.54 | | | $ | 12.76 | | | $ | 12.42 | | | $ | 10.18 | | |
Income (Loss) from Investment Operations: | |
Net Investment Income† | | | 0.60 | | | | 0.64 | | | | 0.63 | | | | 0.86 | | | | 0.84 | | |
Net Realized and Unrealized Gain (Loss) | | | (2.24 | ) | | | 1.25 | | | | (1.10 | ) | | | 0.94 | | | | 1.53 | | |
Total from Investment Operations | | | (1.64 | ) | | | 1.89 | | | | (0.47 | ) | | | 1.80 | | | | 2.37 | | |
Distributions from and/or in Excess of: | |
Net Investment Income | | | (0.18 | ) | | | (0.37 | ) | | | (0.61 | ) | | | (0.89 | ) | | | (0.08 | ) | |
Net Realized Gain | | | (0.12 | ) | | | (0.00 | )‡ | | | (0.14 | ) | | | (0.57 | ) | | | (0.05 | ) | |
Paid-in-Capital | | | (0.07 | ) | | | — | | | | — | | | | — | | | | — | | |
Total Distributions | | | (0.37 | ) | | | (0.37 | ) | | | (0.75 | ) | | | (1.46 | ) | | | (0.13 | ) | |
Redemption Fees | | | 0.00 | ‡ | | | 0.00 | ‡ | | | 0.00 | ‡ | | | 0.00 | ‡ | | | 0.00 | ‡ | |
Net Asset Value, End of Period | | $ | 11.05 | | | $ | 13.06 | | | $ | 11.54 | | | $ | 12.76 | | | $ | 12.42 | | |
Total Return++ | | | (12.76 | )% | | | 16.56 | % | | | (3.90 | )% | | | 14.88 | % | | | 23.43 | % | |
Ratios and Supplemental Data: | |
Net Assets, End of Period (Thousands) | | $ | 6,065 | | | $ | 5,712 | | | $ | 6,784 | | | $ | 6,792 | | | $ | 4,379 | | |
Ratio of Expenses to Average Net Assets (1) | | | 1.13 | %+^ | | | 1.09 | %+†† | | | 1.08 | %+†† | | | 1.09 | %+†† | | | 1.09 | %+ | |
Ratio of Expenses to Average Net Assets Excluding Non Operating Expenses | | | N/A | | | | N/A | | | | N/A | | | | 1.09 | %+†† | | | 1.09 | %+ | |
Ratio of Net Investment Income to Average Net Assets (1) | | | 4.91 | %+ | | | 5.15 | %+†† | | | 4.96 | %+†† | | | 6.87 | %+†† | | | 7.52 | %+ | |
Ratio of Rebate from Morgan Stanley Affiliates to Average Net Assets | | | 0.01 | % | | | 0.01 | %†† | | | 0.02 | %†† | | | 0.01 | %†† | | | 0.01 | % | |
Portfolio Turnover Rate | | | 117 | % | | | 84 | % | | | 85 | % | | | 109 | % | | | 138 | % | |
(1) Supplemental Information on the Ratios to Average Net Assets: | |
Ratios Before Expense Limitation: | |
Expenses to Average Net Assets | | | 1.72 | % | | | 1.43 | %†† | | | 1.44 | %†† | | | 1.54 | %+†† | | | 1.62 | %+ | |
Net Investment Income to Average Net Assets | | | 4.32 | % | | | 4.81 | %†† | | | 4.60 | %†† | | | 6.42 | %+†† | | | 6.99 | %+ | |
@ Effective September 9, 2013, Class P and Class H shares were renamed Class A shares.
† Per share amount is based on average shares outstanding.
‡ Amount is less than $0.005 per share.
++ Calculated based on the net asset value which does not reflect sales charges, if applicable, as of the last business day of the period.
+ The Ratios of Expenses and Net Investment Income reflect the rebate of certain Portfolio expenses in connection with the investments in Morgan Stanley affiliates during the period. The effect of the rebate on the ratios is disclosed in the above table as "Ratio of Rebate from Morgan Stanley Affiliates to Average Net Assets."
^ Effective September 16, 2013, the Adviser has agreed to limit the ratio of expenses to average net assets to the maximum ratio of 1.20% for Class A shares. Prior to September 16, 2013, the maximum ratio was 1.10% for Class A shares.
†† Reflects overall Portfolio ratios for investment income and non-class specific expenses.
§ Amount is less than 0.005%.
The accompanying notes are an integral part of the financial statements.
15
Morgan Stanley Institutional Fund, Inc.
Annual Report — December 31, 2013
Financial Highlights
Emerging Markets Domestic Debt Portfolio
| | | Class L | |
| | | Year Ended December 31, | |
Selected Per Share Data and Ratios | | 2013 | | 2012 | | 2011 | | 2010 | | 2009 | |
Net Asset Value, Beginning of Period | | $ | 12.80 | | | $ | 11.33 | | | $ | 12.54 | | | $ | 12.24 | | | $ | 10.09 | | |
Income (Loss) from Investment Operations: | |
Net Investment Income† | | | 0.55 | | | | 0.57 | | | | 0.55 | | | | 0.79 | | | | 0.92 | | |
Net Realized and Unrealized Gain (Loss) | | | (2.19 | ) | | | 1.22 | | | | (1.07 | ) | | | 0.92 | | | | 1.36 | | |
Total from Investment Operations | | | (1.64 | ) | | | 1.79 | | | | (0.52 | ) | | | 1.71 | | | | 2.28 | | |
Distributions from and/or in Excess of: | |
Net Investment Income | | | (0.15 | ) | | | (0.32 | ) | | | (0.55 | ) | | | (0.84 | ) | | | (0.08 | ) | |
Net Realized Gain | | | (0.12 | ) | | | (0.00 | )‡ | | | (0.14 | ) | | | (0.57 | ) | | | (0.05 | ) | |
Paid-in-Capital | | | (0.07 | ) | | | — | | | | — | | | | — | | | | — | | |
Total Distributions | | | (0.34 | ) | | | (0.32 | ) | | | (0.69 | ) | | | (1.41 | ) | | | (0.13 | ) | |
Redemption Fees | | | 0.00 | ‡ | | | 0.00 | ‡ | | | 0.00 | ‡ | | | 0.00 | ‡ | | | 0.00 | ‡ | |
Net Asset Value, End of Period | | $ | 10.82 | | | $ | 12.80 | | | $ | 11.33 | | | $ | 12.54 | | | $ | 12.24 | | |
Total Return++ | | | (13.00 | )% | | | 15.99 | % | | | (4.34 | )% | | | 14.18 | % | | | 22.80 | % | |
Ratios and Supplemental Data: | |
Net Assets, End of Period (Thousands) | | $ | 3,001 | | | $ | 4,648 | | | $ | 4,965 | | | $ | 4,668 | | | $ | 1,305 | | |
Ratio of Expenses to Average Net Assets (1) | | | 1.40 | %+^^ | | | 1.59 | %+†† | | | 1.58 | %+†† | | | 1.59 | %+†† | | | 1.59 | %+ | |
Ratio of Expenses to Average Net Assets Excluding Non Operating Expenses | | | N/A | | | | N/A | | | | N/A | | | | 1.59 | %+†† | | | 1.59 | %+ | |
Ratio of Net Investment Income to Average Net Assets (1) | | | 4.55 | %+ | | | 4.65 | %+†† | | | 4.46 | %+†† | | | 6.37 | %+†† | | | 8.21 | %+ | |
Ratio of Rebate from Morgan Stanley Affiliates to Average Net Assets | | | 0.01 | % | | | 0.01 | %†† | | | 0.02 | %†† | | | 0.01 | %†† | | | 0.01 | % | |
Portfolio Turnover Rate | | | 117 | % | | | 84 | % | | | 85 | % | | | 109 | % | | | 138 | % | |
(1) Supplemental Information on the Ratios to Average Net Assets: | |
Ratios Before Expense Limitation: | |
Expenses to Average Net Assets | | | 1.95 | % | | | 1.93 | %†† | | | 1.94 | %†† | | | 2.04 | %+†† | | | 2.02 | %+ | |
Net Investment Income to Average Net Assets | | | 4.00 | % | | | 4.31 | %†† | | | 4.10 | %†† | | | 5.92 | %+†† | | | 7.78 | %+ | |
† Per share amount is based on average shares outstanding.
‡ Amount is less than $0.005 per share.
++ Calculated based on the net asset value as of the last business day of the period.
+ The Ratios of Expenses and Net Investment Income reflect the rebate of certain Portfolio expenses in connection with the investments in Morgan Stanley affiliates during the period. The effect of the rebate on the ratios is disclosed in the above table as "Ratio of Rebate from Morgan Stanley Affiliates to Average Net Assets."
^^ Effective September 16, 2013, the Adviser has agreed to limit the ratio of expenses to average net assets to the maximum ratio of 1.45% for Class L shares. Prior to September 16, 2013, the maximum ratio was 1.35% for Class L shares.
†† Reflects overall Portfolio ratios for investment income and non-class specific expenses.
The accompanying notes are an integral part of the financial statements.
16
Morgan Stanley Institutional Fund, Inc.
Annual Report — December 31, 2013
Financial Highlights
Emerging Markets Domestic Debt Portfolio
| | | Class IS | |
Selected Per Share Data and Ratios | | Period from
September 13, 2013^ to
December 31, 2013 | |
Net Asset Value, Beginning of Period | | $ | 11.02 | | |
Income (Loss) from Investment Operations: | |
Net Investment Income† | | | 0.19 | | |
Net Realized and Unrealized Loss | | | (0.33 | ) | |
Total from Investment Operations | | | (0.14 | ) | |
Distributions from and/or in Excess of: | |
Net Investment Income | | | (0.06 | ) | |
Paid-in-Capital | | | (0.07 | ) | |
Total Distributions | | | (0.13 | ) | |
Redemption Fees | | | 0.00 | ‡ | |
Net Asset Value, End of Period | | $ | 10.75 | | |
Total Return++ | | | (1.30 | )%# | |
Ratios and Supplemental Data: | |
Net Assets, End of Period (Thousands) | | $ | 10 | | |
Ratio of Expenses to Average Net Assets (1) | | | 0.82 | %+^^* | |
Ratio of Net Investment Income to Average Net Assets (1) | | | 5.55 | %+* | |
Ratio of Rebate from Morgan Stanley Affiliates to Average Net Assets | | | 0.00 | %§* | |
Portfolio Turnover Rate | | | 117 | %# | |
(1) Supplemental Information on the Ratios to Average Net Assets: | |
Ratios Before Expense Limitation: | |
Expenses to Average Net Assets | | | 6.94 | %* | |
Net Investment Loss to Average Net Assets | | | (0.57 | )%* | |
^ Commencement of Operations.
† Per share amount is based on average shares outstanding.
‡ Amount is less than $0.005 per share.
++ Calculated based on the net asset value as of the last business day of the period.
+ The Ratios of Expenses and Net Investment Income reflect the rebate of certain Portfolio expenses in connection with the investments in Morgan Stanley affiliates during the period. The effect of the rebate on the ratios is disclosed in the above table as "Ratio of Rebate from Morgan Stanley Affiliates to Average Net Assets."
^^ Effective September 16, 2013, the Adviser has agreed to limit the ratio of expenses to average net assets to the maximum ratio of 0.82% for Class IS shares.
§ Amount is less than 0.005%.
# Not Annualized.
* Annualized.
The accompanying notes are an integral part of the financial statements.
17
Morgan Stanley Institutional Fund, Inc.
Annual Report — December 31, 2013
Notes to Financial Statements
Morgan Stanley Institutional Fund, Inc. (the "Fund") is registered under the Investment Company Act of 1940, as amended (the "Act"), as an open-end management investment company. The Fund is comprised of twenty-seven separate, active, diversified and non-diversified portfolios (individually referred to as a "Portfolio", collectively as the "Portfolios").
The accompanying financial statements relate to the Emerging Markets Domestic Debt Portfolio. The Portfolio seeks high total return by investing primarily in fixed income securities of government and government-related issuers and, to a lesser extent, of corporate issuers in emerging market countries. The Portfolio offers four classes of shares — Class I, Class A, Class L and Class IS.
On September 16, 2013, the Portfolio commenced offering Class IS shares. Effective September 9, 2013, Class P and Class H shares were renamed Class A shares.
A. Significant Accounting Policies: The following significant accounting policies are in conformity with U.S. generally accepted accounting principles ("GAAP"). Such policies are consistently followed by the Fund in the preparation of its financial statements. GAAP may require management to make estimates and assumptions that affect the reported amounts and disclosures in the financial statements. Actual results may differ from those estimates.
1. Security Valuation: (1) Certain portfolio securities may be valued by an outside pricing service approved by the Fund's Board of Directors (the "Directors"). The pricing service may utilize a matrix system or other model incorporating attributes such as security quality, maturity and coupon as the evaluation model parameters, and/or research evaluations by its staff, including review of broker-dealer market price quotations in determining what it believes is the fair valuation of the portfolios securities valued by such pricing service; (2) equity portfolio securities for which over-the-counter market quotations are readily available are valued at its latest reported sales price. In cases where a security is traded on more than one exchange, the security is valued on the exchange designated as the primary market; (3) futures are valued at the latest price published by the commodities exchange on which they trade; (4) when market quotations are not readily available, including circumstances under which Morgan Stanley Investment Management Inc. (the "Adviser") determines that the closing price, last sale price or the mean between the last reported bid and asked prices are not reflective of a security's market value, portfolio securities
are valued at their fair value as determined in good faith under procedures established by and under the general supervision of the Directors. Occasionally, developments affecting the closing prices of securities and other assets may occur between the times at which valuations of such securities are determined (that is, close of the foreign market on which the securities trade) and the close of business of the New York Stock Exchange ("NYSE"). If developments occur during such periods that are expected to materially affect the value of such securities, such valuations may be adjusted to reflect the estimated fair value of such securities as of the close of the NYSE, as determined in good faith by the Directors or by the Adviser using a pricing service and/or procedures approved by the Directors; (5) quotations of foreign portfolio securities, other assets and liabilities and forward contracts stated in foreign currency are translated into U.S. dollar equivalents at the prevailing market rates prior to the close of the NYSE; (6) investments in mutual funds, including the Morgan Stanley Institutional Liquidity Funds, are valued at the net asset value as of the close of each business day; and (7) short-term debt securities with remaining maturities of 60 days or less at the time of purchase may be valued at amortized cost, unless the Adviser determines such valuation does not reflect the securities' market value, in which case these securities will be valued at their fair market value determined by the Adviser.
Under procedures approved by the Directors, the Fund's Adviser has formed a Valuation Committee. The Valuation Committee provides administration and oversight of the Fund's valuation policies and procedures, which are reviewed at least annually by the Directors. These procedures allow the Fund to utilize independent pricing services, quotations from securities and financial instrument dealers, and other market sources to determine fair value.
The Fund has procedures to determine the fair value of securities and other financial instruments for which market prices are not readily available. Under these procedures, the Valuation Committee convenes on a regular and ad hoc basis to review such securities and considers a number of factors, including valuation methodologies and significant unobservable valuation inputs, when arriving at fair value. The Valuation Committee may employ a market-based approach which may use related or comparable assets or liabilities, recent transactions, market multiples, book values, and other relevant
18
Morgan Stanley Institutional Fund, Inc.
Annual Report — December 31, 2013
Notes to Financial Statements (cont'd)
information for the investment to determine the fair value of the investment. An income-based valuation approach may also be used in which the anticipated future cash flows of the investment are discounted to calculate fair value. Discounts may also be applied due to the nature or duration of any restrictions on the disposition of the investments. Due to the inherent uncertainty of valuations of such investments, the fair values may differ significantly from the values that would have been used had an active market existed. The Valuation Committee employs various methods for calibrating these valuation approaches including a regular review of valuation methodologies, key inputs and assumptions, transactional back-testing or disposition analysis, and reviews of any related market activity.
The Portfolio holds a significant portion of its investments in securities which are traded by a small number of market makers who may also be utilized by the Portfolio to provide pricing information used to value such investments. The amounts realized upon disposition of these securities may differ from the value reflected on the Statement of Assets and Liabilities.
2. Fair Value Measurement: Financial Accounting Standards Board ("FASB") Accounting Standards CodificationTM ("ASC") 820, "Fair Value Measurements and Disclosures" ("ASC 820"), defines fair value as the value that the Fund would receive to sell an investment or pay to transfer a liability in a timely transaction with an independent buyer in the principal market, or in the absence of a principal market the most advantageous market for the investment or liability. ASC 820 establishes a three-tier hierarchy to distinguish between (1) inputs that reflect the assumptions market participants would use in valuing an asset or liability developed based on market data obtained from sources independent of the reporting entity (observable inputs) and (2) inputs that reflect the reporting entity's own assumptions about the assumptions market participants would use in valuing an asset or liability developed based on the best information available in the circumstances (unobservable inputs) and to establish classification of fair value measurements for disclosure purposes. Various inputs are used in determining the value of the Fund's investments. The inputs are summarized in the three broad levels listed below.
• Level 1 – unadjusted quoted prices in active markets for identical investments
• Level 2 – other significant observable inputs (including quoted prices for similar investments, interest rates, prepayment speeds, credit risk, etc.)
• Level 3 – significant unobservable inputs including the Fund's own assumptions in determining the fair value of investments. Factors considered in making this determination may include, but are not limited to, information obtained by contacting the issuer, analysts, or the appropriate stock exchange (for exchange-traded securities), analysis of the issuer's financial statements or other available documents and, if necessary, available information concerning other securities in similar circumstances
The inputs or methodology used for valuing securities are not necessarily an indication of the risk associated with investing in those securities and the determination of the significance of a particular input to the fair value measurement in its entirety requires judgment and considers factors specific to each security.
The following is a summary of the inputs used to value the Portfolio's investments as of December 31, 2013.
Investment Type | | Level 1
Unadjusted
quoted
prices
(000) | | Level 2
Other
significant
observable
inputs
(000) | | Level 3
Significant
unobservable
inputs
(000) | | Total
(000) | |
Assets: | |
Fixed Income Securities | |
Corporate Bonds | | $ | — | | | $ | 1,488 | | | $ | — | | | $ | 1,488 | | |
Sovereign | | | — | | | | 31,321 | | | | — | | | | 31,321 | | |
Total Fixed Income
Securities | | | — | | | | 32,809 | | | | — | | | | 32,809 | | |
Warrants | | | — | | | | 12 | | | | — | | | | 12 | | |
Short-Term Investment | |
Investment Company | | | 1,112 | | | | — | | | | — | | | | 1,112 | | |
Foreign Currency Forward
Exchange Contracts | | | — | | | | 15 | | | | — | | | | 15 | | |
Futures Contracts | | | 122 | | | | — | | | | — | | | | 122 | | |
Total Assets | | | 1,234 | | | | 32,836 | | | | — | | | | 34,070 | | |
Liabilities: | |
Foreign Currency Forward
Exchange Contracts | | | — | | | | (31 | ) | | | — | | | | (31 | ) | |
Total | | $ | 1,234 | | | $ | 32,805 | | | $ | — | | | $ | 34,039 | | |
Transfers between investment levels may occur as the markets fluctuate and/or the availability of data used in an investment's valuation changes. The Portfolio recognizes transfers between the levels as of the end of the period. As
19
Morgan Stanley Institutional Fund, Inc.
Annual Report — December 31, 2013
Notes to Financial Statements (cont'd)
of December 31, 2013, the Portfolio did not have any investments transfer between investment levels.
3. Foreign Currency Translation and Foreign Investments: The books and records of the Portfolio are maintained in U.S. dollars. Foreign currency amounts are translated into U.S. dollars as follows:
– investments, other assets and liabilities at the prevailing rate of exchange on the valuation date;
– investment transactions and investment income at the prevailing rates of exchange on the dates of such transactions.
Although the net assets of the Portfolio are presented at the foreign exchange rates and market values at the close of the period, the Portfolio does not isolate that portion of the results of operations arising as a result of changes in the foreign exchange rates from the fluctuations arising from changes in the market prices of securities held at period end. Similarly, the Portfolio does not isolate the effect of changes in foreign exchange rates from the fluctuations arising from changes in the market prices of securities sold during the period. Accordingly, realized and unrealized foreign currency gains (losses) on investments in securities are included in the reported net realized and unrealized gains (losses) on investment transactions and balances. However, pursuant to U.S. Federal income tax regulations, gains and losses from certain foreign currency transactions and the foreign currency portion of gains and losses realized on sales and maturities of foreign denominated debt securities are treated as ordinary income for U.S. Federal income tax purposes.
Net realized gains (losses) on foreign currency transactions represent net foreign exchange gains (losses) from foreign currency forward exchange contracts, disposition of foreign currencies, currency gains (losses) realized between the trade and settlement dates on securities transactions, and the difference between the amount of investment income and foreign withholding taxes recorded on the Portfolio's books and the U.S. dollar equivalent amounts actually received or paid. Net unrealized currency gains (losses) from valuing foreign currency denominated assets and liabilities at period end exchange rates are reflected as a component of unrealized appreciation (depreciation) on the Statement of Assets and Liabilities. The change in unrealized currency gains (losses) on
foreign currency translations for the period is reflected in the Statement of Operations.
Foreign security and currency transactions may involve certain considerations and risks not typically associated with those of U.S. dollar denominated transactions as a result of, among other factors, fluctuations of exchange rates in relation to the U.S. dollar, the possibility of lower levels of governmental supervision and regulation of foreign securities markets and the possibility of political or economic instability.
The net assets of the Portfolio include foreign denominated securities and currency. Changes in currency exchange rates will affect the U.S. Dollar value of and investment income from such securities.
Governmental approval for foreign investments may be required in advance of making an investment under certain circumstances in some countries, and the extent of foreign investments in domestic companies may be subject to limitation in other countries. Foreign ownership limitations also may be imposed by the charters of individual companies to prevent, among other concerns, violations of foreign investment limitations. As a result, an additional class of shares (identified as "Foreign" in the Portfolio of Investments) may be created and offered for investment. The "local" and "foreign shares" market values may differ. In the absence of trading of the foreign shares in such markets, the Portfolio values the foreign shares at the closing exchange price of the local shares.
4. Derivatives: The Portfolio may, but is not required to, use derivative instruments for a variety of purposes, including hedging, risk management, portfolio management or to earn income. Derivatives are financial instruments whose value is based, in part, on the value of an underlying asset, interest rate, index or financial instrument. Prevailing interest rates and volatility levels, among other things, also affect the value of derivative instruments. A derivative instrument often has risks similar to its underlying asset and may have additional risks, including imperfect correlation between the value of the derivative and the underlying asset, risks of default by the counterparty to certain transactions, magnification of losses incurred due to changes in the market value of the securities, instruments, indices or interest rates to which they relate, and risks that the transactions may not be liquid. The use of derivatives involves risks that are different from, and possibly greater than, the
20
Morgan Stanley Institutional Fund, Inc.
Annual Report — December 31, 2013
Notes to Financial Statements (cont'd)
risks associated with other portfolio investments. Derivatives may involve the use of highly specialized instruments that require investment techniques and risk analyses different from those associated with other portfolio investments. All of the Portfolio's holdings, including derivative instruments, are marked-to-market each day with the change in value reflected in unrealized appreciation (depreciation). Upon disposition, a realized gain or loss is recognized.
Certain derivative transactions may give rise to a form of leverage. Leverage magnifies the potential for gain and the risk of loss. Leverage associated with derivative transactions may cause the Portfolio to liquidate portfolio positions when it may not be advantageous to do so to satisfy its obligations or to meet earmarking or segregation requirements, pursuant to applicable Securities and Exchange Commission rules and regulations, or may cause the Portfolio to be more volatile than if the Portfolio had not been leveraged. Although the Adviser seeks to use derivatives to further the Portfolio's investment objectives, there is no assurance that the use of derivatives will achieve this result.
Following is a description of the derivative instruments and techniques that the Portfolio used during the period and their associated risks:
Foreign Currency Forward Exchange Contracts: In connection with its investments in foreign securities, the Portfolio also entered into contracts with banks, brokers or dealers to purchase or sell securities or foreign currencies at a future date. A foreign currency forward exchange contract ("currency contract") is a negotiated agreement between the contracting parties to exchange a specified amount of currency at a specified future time at a specified rate. The rate can be higher or lower than the spot rate between the currencies that are the subject of the contract. Currency contracts may be used to protect against uncertainty in the level of future foreign currency exchange rates or to gain or modify exposure to a particular currency. There is additional risk that such transactions reduce or preclude the opportunity for gain if the value of the currency should move in the direction opposite to the position taken and that currency contracts create exposure to currencies in which the Portfolio's securities are not denominated. Unanticipated changes in currency prices may result in poorer overall performance for the Portfolio than if it had not entered into
such contracts. The use of currency contracts involves the risk of loss from the insolvency or bankruptcy of the counterparty to the contract or the failure of the counterparty to make payments or otherwise comply with the terms of the contract. A currency contract is marked-to-market daily and the change in market value is recorded by the Portfolio as unrealized gain or loss. The Portfolio records realized gains (losses) when the currency contract is closed equal to the difference between the value of the currency contract at the time it was opened and the value at the time it was closed.
Futures: A futures contract is a standardized, exchange-traded agreement to buy or sell a specific quantity of an underlying asset, reference rate or index at a specific price at a specific future time. The value of a futures contract tends to increase and decrease in tandem with the value of the underlying instrument. Depending on the terms of the particular contract, futures contracts are settled through either physical delivery of the underlying instrument on the settlement date or by payment of a cash settlement amount on the settlement date. During the period the futures contract is open, payments are received from or made to the broker based upon changes in the value of the contract (the variation margin). A decision as to whether, when and how to use futures contracts involves the exercise of skill and judgment and even a well-conceived futures transaction may be unsuccessful because of market behavior or unexpected events. In addition to the derivatives risks discussed above, the prices of futures contracts can be highly volatile, using futures contracts can lower total return, and the potential loss from futures contracts can exceed the Portfolio's initial investment in such contracts. No assurance can be given that a liquid market will exist for any particular futures contract at any particular time. There is also the risk of loss by the Portfolio of margin deposits in the event of bankruptcy of a broker with whom the Portfolio has open positions in the futures contract.
FASB ASC 815, "Derivatives and Hedging: Overall" ("ASC 815"), is intended to improve financial reporting about derivative instruments by requiring enhanced disclosures to enable investors to better understand how and why the Portfolio uses derivative instruments, how these derivative instruments are accounted for and their effects on the Portfolio's financial position and results of operations.
21
Morgan Stanley Institutional Fund, Inc.
Annual Report — December 31, 2013
Notes to Financial Statements (cont'd)
The following tables set forth the fair value of the Portfolio's derivative contracts by primary risk exposure as of December 31, 2013.
| | | Asset Derivatives
Statement of Assets and
Liabilities Location | | Primary Risk
Exposure | | Value
(000) | |
Foreign Currency
Forward Exchange
Contracts | | Unrealized Appreciation on
Foreign Currency Forward
Exchange Contracts | | Currency Risk | | $15 | |
Futures Contracts | | Variation Margin | | Interest Rate Risk | | | 122 | (a) | |
Total | | | | | | $ | 137 | | |
| | | Liability Derivatives
Statement of Assets and
Liabilities Location | | Primary Risk
Exposure | | Value
(000) | |
Foreign Currency
Forward Exchange
Contracts | | Unrealized Depreciation on
Foreign Currency Forward
Exchange Contracts | | Currency Risk | | $(31) | |
(a) This amount represents the cumulative appreciation (depreciation) as reported in the Portfolio of Investments. The Statement of Assets and Liabilities only reflects the current day's net variation margin.
The following tables set forth by primary risk exposure the Portfolio's realized gains (losses) and change in unrealized appreciation (depreciation) by type of derivative contract for the year ended December 31, 2013 in accordance with ASC 815.
Realized Gain (Loss) | |
Primary Risk Exposure | | Derivative Type | | Value
(000) | |
Currency Risk | | Foreign Currency Forward
Exchange Contracts | | $ | 100 | | |
Interest Rate Risk | | Futures Contracts | | | — | @ | |
Total | | | | $ | 100 | | |
Change in Unrealized Appreciation (Depreciation) | |
Primary Risk Exposure | | Derivative Type | | Value
(000) | |
Currency Risk | | Foreign Currency Forward
Exchange Contracts | | $ | (70 | ) | |
Interest Rate Risk | | Futures Contracts | | | 122 | | |
Total | | | | $ | 52 | | |
@ Amount is less than $500.
At December 31, 2013, the Portfolio's derivative assets and liabilities are as follows:
Gross Amounts of Assets and Liabilities Presented in the
Statement of Assets and Liabilities | |
Derivatives(a) | | Assets(b)
(000) | | Liabilities(b)
(000) | |
Foreign Currency
Forward Exchange Contracts | | $ | 15 | | | $ | (31 | ) | |
(a) Excludes exchange traded derivatives.
(b) Absent an event of default or early termination, OTC derivative assets and liabilities are presented gross and not offset in the Statement of Assets and Liabilities.
The following tables present derivative financial instruments that are subject to enforceable netting arrangements as of December 31, 2013.
Gross Amounts Not Offset in the Statement of Assets and Liabilities | |
Counterparty | | Gross Asset
Derivatives
Presented in
Statement of
Assets and
Liabilities
(000) | | Financial
Instrument
(000) | | Collateral
Received
(000) | | Net
Amount
(not less
than 0)
(000) | |
JPMorgan Chase Bank NA | | $ | 15 | | | $ | (15 | ) | | | — | | | $ | 0 | | |
Gross Amounts Not Offset in the Statement of Assets and Liabilities | |
Counterparty | | Gross Liability
Derivatives
Presented in
Statement of
Assets and
Liabilities
(000) | | Financial
Instrument
(000) | | Collateral
Pledged
(000) | | Net
Amount
(not less
than 0)
(000) | |
JPMorgan Chase Bank NA | | $ | 31 | | | $ | (15 | ) | | | — | | | $ | 16 | | |
For the year ended December 31, 2013, the approximate average monthly amount outstanding for each derivative type is as follows:
Foreign Currency Forward Exchange Contracts: | |
Average monthly principal amount | | $ | 6,737,000 | | |
Futures Contracts: | |
Average monthly original value | | $ | 1,992,000 | | |
5. Structured Investments: The Portfolio invested a portion of its assets in structured investments. A structured investment is a derivative security designed to offer a return linked to a particular underlying security, currency, commodity or market. Structured investments may come in various forms including notes (such as exchange-traded notes), warrants and options to purchase securities. The Portfolio will typically use structured investments to gain exposure to a permitted underlying security, currency, commodity or market when direct access to a market is limited or inefficient from a tax or cost standpoint. Investments in structured investments involve risks including issuer risk, counterparty risk and market risk. Holders of structured investments bear risks of the underlying investment and are subject to issuer or counterparty risk because the Portfolio is relying on the creditworthiness of such issuer or counterparty and has no rights with respect to the underlying investment. Certain structured investments may be thinly traded or have a limited trading market and may have the effect of increasing the Portfolio's illiquidity to the extent that the Portfolio, at a particular time, may be unable to find qualified buyers for these securities.
22
Morgan Stanley Institutional Fund, Inc.
Annual Report — December 31, 2013
Notes to Financial Statements (cont'd)
6. Securities Lending: The Portfolio lends securities to qualified financial institutions, such as broker-dealers, to earn additional income. Any increase or decrease in the fair value of the securities loaned that might occur and any interest earned or dividends declared on those securities during the term of the loan would remain in the Portfolio. The Portfolio would receive cash or securities as collateral in an amount equal to or exceeding 100% of the current fair value of the loaned securities. The collateral is marked-to-market daily, by State Street Bank and Trust Company ("State Street"), the securities lending agent, to ensure that a minimum of 100% collateral coverage is maintained.
Based on pre-established guidelines, the securities lending agent invests any cash collateral that is received in an affiliated money market portfolio and repurchase agreements. Securities lending income is generated from the earnings on the invested collateral and borrowing fees, less any rebates owed to the borrowers and compensation to the lending agent, and is recorded as "Income from Securities Loaned-Net" in the Portfolio's Statement of Operations. Risks in securities lending transactions are that a borrower may not provide additional collateral when required or return the securities when due, and that the value of the short-term investments will be less than the amount of cash collateral plus any rebate that is required to be returned to the borrower.
At December 31, 2013, the Portfolio did not have any outstanding securities on loan.
7. Redemption Fees: The Portfolio will assess a 2% redemption fee, on Class I shares, Class A shares, Class L shares and Class IS shares, which is paid directly to the Portfolio, for shares redeemed or exchanged within thirty days of purchase, subject to certain exceptions. The redemption fee is designed to protect the Portfolio and its remaining shareholders from the effects of short-term trading. These fees, if any, are included in the Statements of Changes in Net Assets.
8. Indemnifications: The Fund enters into contracts that contain a variety of indemnifications. The Fund's maximum exposure under these arrangements is unknown. However, the Fund has not had prior claims or losses pursuant to these contracts and expects the risk of loss to be remote.
9. Dividends and Distributions to Shareholders: Dividend income and distributions to shareholders are
recorded on the ex-dividend date. Dividends from net investment income, if any, are declared and paid quarterly. Net realized capital gains, if any, are distributed at least annually.
10. Security Transactions, Income and Expenses: Security transactions are accounted for on the trade date (date the order to buy or sell is executed). Realized gains and losses on the sale of investment securities are determined on the specific identified cost method. Dividend income and other distributions are recorded on the ex-dividend date (except for certain foreign dividends which may be recorded as soon as the Portfolio is informed of such dividends) net of applicable withholding taxes. Interest income is recognized on the accrual basis except where collection is in doubt. Discounts are accreted and premiums are amortized over the life of the respective securities. Most expenses of the Fund can be directly attributed to a particular Portfolio. Expenses which cannot be directly attributed are apportioned among the Portfolios based upon relative net assets or other appropriate methods. Income, expenses (other than class specific expenses — distribution, transfer agency and sub transfer agency fees) and realized and unrealized gains or losses are allocated to each class of shares based upon their relative net assets.
B. Advisory Fees: The Adviser, a wholly-owned subsidiary of Morgan Stanley, provides the Portfolio with advisory services under the terms of an Investment Advisory Agreement, paid quarterly, at the annual rate based on the average daily net assets as follows:
First $500
million | | Next $500
million | | Over $1
billion | |
| | 0.75 | % | | | 0.70 | % | | | 0.65 | % | |
For the year ended December 31, 2013, the advisory fee rate (net of waivers/rebate) was equivalent to an annual effective rate of 0.21% of the Portfolio's daily net assets.
The Adviser has agreed to reduce its advisory fee and/or reimburse the Portfolio so that total annual portfolio operating expenses, excluding certain investment related expenses, taxes, interest and other extraordinary expenses (including litigation), will not exceed 0.85% for Class I shares, 1.10% for Class A shares and 1.60% for Class L shares. Effective February 25, 2013, expense cap for Class L shares was reduced to 1.35%. Effective September 16, 2013, the Adviser has agreed to limit the ratio of expenses to average net assets to the maximum ratio of 1.20%, 1.45% and 0.82% for Class A, Class L and Class IS shares, respectively. The fee waivers and/or expense reimbursements will
23
Morgan Stanley Institutional Fund, Inc.
Annual Report — December 31, 2013
Notes to Financial Statements (cont'd)
continue for at least one year or until such time that the Directors act to discontinue all or a portion of such waivers and/or reimbursements when it deems such action is appropriate. For the year ended December 31, 2013, approximately $295,000 of advisory fees were waived and less than $500 of other expenses were reimbursed by the Adviser pursuant to this arrangement.
C. Administration Fees: The Adviser also serves as Administrator to the Fund and provides administrative services pursuant to an Administration Agreement for an annual fee, accrued daily and paid monthly, of 0.08% of the Portfolio's average daily net assets. Under a Sub-Administration Agreement between the Administrator and State Street, State Street provides certain administrative services to the Fund. For such services, the Administrator pays State Street a portion of the fee the Administrator receives from the Portfolio.
D. Distribution and Shareholder Services Fees: Morgan Stanley Distribution, Inc. ("MSDI" or the "Distributor"), a wholly-owned subsidiary of the Adviser, and an indirect subsidiary of Morgan Stanley, serves as the Fund's Distributor of Portfolio shares pursuant to a Distribution Agreement. The Fund has adopted a Shareholder Services Plan with respect to Class A shares pursuant to Rule 12b-1 under the Act. Under the Shareholder Services Plan, the Portfolio pays the Distributor a shareholder services fee, accrued daily and paid monthly, at an annual rate of 0.25% of the Portfolio's average daily net assets attributable to Class A shares.
The Fund has adopted a Distribution and Shareholder Services Plan with respect to Class L shares pursuant to Rule 12b-1 under the Act. Under the Distribution and Shareholder Services Plan, the Portfolio pays the Distributor a distribution fee, accrued daily and paid monthly, at an annual rate of 0.25% and a shareholder services fee, accrued daily and paid monthly, at an annual rate of 0.25% of the Portfolio's average daily net assets attributable to Class L shares. The Directors approved an amendment to the Distribution and Shareholder Services Plan reducing the distribution fee for the Portfolio's Class L shares from 0.50% to 0.25% of the average daily net assets of such Class, effective February 25, 2013.
The distribution and shareholder services fees are used to support the expenses associated with servicing and maintaining accounts. The Distributor may compensate other parties for providing shareholder support services to investors who purchase Class A and Class L shares.
E. Dividend Disbursing and Transfer Agent: The Fund's dividend disbursing and transfer agent was Morgan
Stanley Services Company Inc. ("Morgan Stanley Services"). Pursuant to a Transfer Agency Agreement, the Fund paid Morgan Stanley Services a fee based on the number of classes, accounts and transactions relating to the Portfolios of the Fund. Effective July 1, 2013, the Directors approved changing the transfer agent to Boston Financial Data Services, Inc.
F. Custodian Fees: State Street (the "Custodian") serves as Custodian for the Fund in accordance with a Custodian Agreement. The Custodian holds cash, securities, and other assets of the Fund as required by the Act. Custody fees are payable monthly based on assets held in custody, investment purchases and sales activity and account maintenance fees, plus reimbursement for certain out-of-pocket expenses.
G. Security Transactions and Transactions with Affiliates: For the year ended December 31, 2013, purchases and sales of investment securities for the Portfolio, other than long-term U.S. Government securities and short-term investments, were approximately $59,337,000 and $74,968,000, respectively. There were no purchases and sales of long-term U.S. Government securities for the year ended December 31, 2013.
The Portfolio invests in the Institutional Class of the Morgan Stanley Institutional Liquidity Funds — Money Market Portfolio (the "Liquidity Funds"), an open-end management investment company managed by the Adviser, both directly, and as a portion of the securities held as collateral on loaned securities. Advisory fees paid by the Portfolio are reduced by an amount equal to its pro-rata share of the advisory and administration fees paid by the Portfolio due to its investment in the Liquidity Funds. For the year ended December 31, 2013, advisory fees paid were reduced by approximately $3,000 relating to the Portfolio's investment in the Liquidity Funds.
A summary of the Portfolio's transactions in shares of the Liquidity Funds during the year ended December 31, 2013 is as follows:
Value
December 31,
2012
(000) | | Purchases
at Cost
(000) | | Sales
(000) | | Dividend
Income
(000) | | Value
December 31,
2013
(000) | |
| $ | 919 | | | $ | 35,745 | | | $ | 35,552 | | | $ | 2 | | | $ | 1,112 | | |
H. Federal Income Taxes: It is the Portfolio's intention to continue to qualify as a regulated investment company and distribute all of its taxable and tax-exempt income. Accordingly, no provision for Federal income taxes is required in the financial statements.
24
Morgan Stanley Institutional Fund, Inc.
Annual Report — December 31, 2013
Notes to Financial Statements (cont'd)
The Portfolio may be subject to taxes imposed by countries in which it invests. Such taxes are generally based on income and/or capital gains earned or repatriated. Taxes are accrued based on net investment income, net realized gains and net unrealized appreciation as such income and/or gains are earned. Taxes may also be based on transactions in foreign currency and are accrued based on the value of investments denominated in such currency.
FASB ASC 740-10 "Income Taxes — Overall" sets forth a minimum threshold for financial statement recognition of the benefit of a tax position taken or expected to be taken in a tax return. Management has concluded there are no significant uncertain tax positions that would require recognition in the financial statements. If applicable, the Portfolio recognizes interest accrued related to unrecognized tax benefits in "Interest Expense" and penalties in "Other Expenses" in the Statement of Operations. The Portfolio files tax returns with the U.S. Internal Revenue Service, New York and various states. Generally, each of the tax years in the four-year period ended December 31, 2013, remains subject to examination by taxing authorities.
The tax character of distributions paid may differ from the character of distributions shown in the Statements of Changes in Net Assets due to short-term capital gains being treated as ordinary income for tax purposes. The tax character of distributions paid during fiscal 2013 and 2012 was as follows:
2013
Distributions
Paid From: | | 2012
Distributions
Paid From: | |
Ordinary
Income
(000) | | Long-Term
Capital Gain
(000) | | Paid-in-
Capital
(000) | | Ordinary
Income
(000) | | Long-Term
Capital Gain
(000) | |
| $ | 958 | | | $ | 557 | | | $ | 295 | | | $ | 2,721 | | | $ | 15 | | |
The amount and character of income and gains to be distributed are determined in accordance with income tax regulations which may differ from GAAP. These book/tax differences are either considered temporary or permanent in nature.
Temporary differences are primarily due to differing book and tax treatments in the timing of the recognition of gains (losses) on certain investment transactions and the timing of the deductibility of certain expenses.
Permanent differences, primarily due to differing treatments of gains (losses) related to foreign currency transactions,
resulted in the following reclassifications among the components of net assets at December 31, 2013:
Distributions
in Excess of
Net Investment
Income
(000) | | Accumulated
Net Realized
Loss
(000) | | Paid-in-
Capital
(000) | |
| $ | (2,045 | ) | | $ | 2,045 | | | | — | | |
At December 31, 2013, the Portfolio had no distributable earnings on a tax basis.
At December 31, 2013, the aggregate cost for federal income tax purposes is $37,529,000. The aggregate gross unrealized appreciation is $484,000 and the aggregate gross unrealized depreciation is $4,080,000 resulting in net unrealized depreciation of $3,596,000.
At December 31, 2013, the Portfolio had available unused short-term capital losses of $203,000 and long-term capital losses of $1,066,000 that do not have an expiration date.
To the extent that capital loss carryforwards are used to offset any future capital gains realized during the carryover period as provided by U.S. Federal income tax regulations, no capital gains tax liability will be incurred by the Portfolio for gains realized and not distributed. To the extent that capital gains are offset, such gains will not be distributed to the shareholders.
Capital losses and specified ordinary losses, including currency losses, incurred after October 31 but within the taxable year are deemed to arise on the first day of the Portfolio's next taxable year. For the year ended December 31, 2013, the Portfolio deferred to January 1, 2014 for U.S. Federal income tax purposes the following losses:
Post-October
Currency
and Specified
Ordinary Losses
(000) | | Post-October
Capital Losses
(000) | |
| $ | 951 | | | | — | | |
I. Other (unaudited): Settlement and registration of foreign securities transactions may be subject to significant risks not normally associated with investments in the United States. In certain markets, including Russia, ownership of shares is defined according to entries in the issuer's share register. In Russia, currently no central registration system exists and the share registrars may not be subject to effective state supervision. It is possible that a Portfolio could lose its share registration through fraud, negligence or even mere oversight. In addition, shares being delivered for sales and cash being paid for purchases may be delivered before the exchange is complete. This may
25
Morgan Stanley Institutional Fund, Inc.
Annual Report — December 31, 2013
Notes to Financial Statements (cont'd)
subject the Portfolio to further risk of loss in the event of counterparty's failure to complete the transaction.
At December 31, 2013, the Portfolio had otherwise unaffiliated record owners of 10% or greater. Investment activities of these shareholders could have a material impact on the Portfolio. The aggregate percentage of such owners was 54% and 42%, for Class I and Class A shares, respectively.
J. Results of Special Shareholder Meeting (unaudited): On June 5, 2013, a Joint Special Shareholder Meeting was held for Class H shareholders of the Portfolio to approve the Articles of Amendment to the Fund's Articles of Amendment and Restatement and a Plan of Reclassification for the Portfolio pursuant to which Class H shares would be reclassified as Class P shares. The results with respect to this proposal were as follows:
| For | | Against | | Abstain | |
| | 208,677 | | | | 0 | | | | 0 | | |
K. Accounting Pronouncement: In June 2013, FASB issued Accounting Standards Update 2013-08 Financial Services — Investment Companies (Topic 946) — Amendments to the Scope, Measurement, and Disclosure Requirements ("ASU 2013-08") which is effective for interim and annual reporting periods in fiscal years that begin after December 15, 2013. ASU 2013-08 sets forth a methodology for determining whether an entity should be characterized as an investment company and prescribes fair value accounting for an investment company's non-controlling ownership interest in another investment company. FASB has determined that a fund registered under the Investment Company Act of 1940 automatically meets ASU 2013-08's criteria for an investment company. Although still evaluating the potential impacts of ASU 2013-08 to the Portfolio, management expects that the impact of the Portfolio's adoption will be limited to additional financial statement disclosures.
26
Morgan Stanley Institutional Fund, Inc.
Annual Report — December 31, 2013
Report of Independent Registered Public Accounting Firm
To the Shareholders and Board of Directors of
Morgan Stanley Institutional Fund, Inc. —
Emerging Markets Domestic Debt Portfolio
We have audited the accompanying statement of assets and liabilities, including the portfolio of investments, of Emerging Markets Domestic Debt Portfolio (one of the portfolios constituting Morgan Stanley Institutional Fund, Inc.) (the "Portfolio") as of December 31, 2013, and the related statement of operations for the year then ended, the statement of changes in net assets for each of the two years in the period then ended, and the financial highlights for each of periods indicated therein. These financial statements and financial highlights are the responsibility of the Portfolio's management. Our responsibility is to express an opinion on these financial statements and financial highlights based on our audits.
We conducted our audits in accordance with the standards of the Public Company Accounting Oversight Board (United States). Those standards require that we plan and perform the audit to obtain reasonable assurance about whether the financial statements and financial highlights are free of material misstatement. We were not engaged to perform an audit of the Portfolio's internal control over financial reporting. Our audits included consideration of internal control over financial reporting as a basis for designing audit procedures that are appropriate in the circumstances, but not for the purpose of expressing an opinion on the effectiveness of the Portfolio's internal control over financial reporting. Accordingly, we express no such opinion. An audit also includes examining, on a test basis, evidence supporting the amounts and disclosures in the financial statements and financial highlights, assessing the accounting principles used and significant estimates made by management, and evaluating the overall financial statement presentation. Our procedures included confirmation of securities owned as of December 31, 2013, by correspondence with the custodian and others. We believe that our audits provide a reasonable basis for our opinion.
In our opinion, the financial statements and financial highlights referred to above present fairly, in all material respects, the financial position of Emerging Markets Domestic Debt Portfolio (one of the portfolios constituting Morgan Stanley Institutional Fund, Inc.) at December 31, 2013, the results of its operations for the year then ended, the changes in its net assets for each of the two years in the period then ended, and the financial highlights for each of the periods indicated therein, in conformity with U.S. generally accepted accounting principles.

Boston, Massachusetts
February 26, 2014
27
Morgan Stanley Institutional Fund, Inc.
Annual Report — December 31, 2013
Federal Tax Notice (unaudited)
For Federal income tax purposes, the following information is furnished with respect to the distributions paid by the Portfolio during its taxable year ended December 31, 2013.
The Portfolio designated and paid $557,000 as a long-term capital gain distribution.
In January, the Portfolio provides tax information to shareholders for the preceding calendar year.
28
Morgan Stanley Institutional Fund, Inc.
Annual Report — December 31, 2013
U.S. Privacy Policy (unaudited)
AN IMPORTANT NOTICE CONCERNING OUR U.S. PRIVACY POLICY
This privacy notice describes the U.S. privacy policy of Morgan Stanley Distribution, Inc., and the Morgan Stanley family of mutual funds ("us", "our", "we").
We are required by federal law to provide you with notice of our U.S. privacy policy ("Policy"). This Policy applies to both our current and former clients unless we state otherwise and is intended for individual clients who purchase products or receive services from us for personal, family or household purposes. This Policy is not applicable to partnerships, corporations, trusts or other non-individual clients or account holders, nor is this Policy applicable to individuals who are either beneficiaries of a trust for which we serve as trustee or participants in an employee benefit plan administered or advised by us. This Policy is, however, applicable to individuals who select us to be a custodian of securities or assets in individual retirement accounts, 401(k) accounts, or accounts subject to the Uniform Gifts to Minors Act.
This notice sets out our business practices to protect your privacy; how we collect and share personal information about you; and how you can limit our sharing or certain uses by others of this information. We may amend this Policy at any time, and will inform you of any changes to our Policy as required by law.
WE RESPECT YOUR PRIVACY
We appreciate that you have provided us with your personal financial information and understand your concerns about your information. We strive to safeguard the information our clients entrust to us. Protecting the confidentiality and security of client information is an important part of how we conduct our business.
This notice describes what personal information we collect about you, how we collect it, when we may share it with others, and how certain others may use it. It discusses the steps you may take to limit our sharing of certain information about you with our affiliated companies, including, but not limited to our affiliated banking businesses, brokerage firms and credit service affiliates. It also discloses how you may limit our affiliates' use of shared information for marketing purposes.
Throughout this Policy, we refer to the nonpublic information that personally identifies you as "personal information." We also use the term "affiliated company" in this notice. An affiliated company is a company in our family of companies and includes companies with the Morgan Stanley name. These affiliated companies are financial institutions such as broker-dealers, banks, investment advisers and credit card issuers. We refer to any company that is not an affiliated company as a nonaffiliated third party. For purposes of Section 5 of this notice, and your ability to limit certain uses of personal information by our affiliates, this notice applies to the use of personal information by our affiliated companies.
1. WHAT PERSONAL INFORMATION DO WE COLLECT FROM YOU?
We may collect the following types of information about you: (i) information provided by you, including information from applications and other forms we receive from you, (ii) information about your transactions with us or our affiliates, (iii) information about your transactions with nonaffiliated third parties, (iv) information from consumer reporting agencies, (v) information obtained from our websites, and (vi) information obtained from other sources. For example:
• We collect information such as your name, address, e-mail address, telephone/fax numbers, assets, income and investment objectives through applications and other forms you submit to us.
• We may obtain information about account balances, your use of account(s) and the types of products and services you prefer to receive from us through your dealings and transactions with us and other sources.
• We may obtain information about your creditworthiness and credit history from consumer reporting agencies.
• We may collect background information from and through third-party vendors to verify representations you have made and to comply with various regulatory requirements.
2. WHEN DO WE DISCLOSE PERSONAL INFORMATION WE COLLECT ABOUT YOU?
We may disclose personal information we collect about you in each of the categories listed above to affiliated and nonaffiliated third parties.
29
Morgan Stanley Institutional Fund, Inc.
Annual Report — December 31, 2013
U.S. Privacy Policy (unaudited) (cont'd)
a. Information we disclose to affiliated companies.
We may disclose personal information that we collect about you to our affiliated companies to manage your account(s) effectively, to service and process your transactions, and to let you know about products and services offered by us and affiliated companies, to manage our business, and as otherwise required or permitted by law. Offers for products and services from affiliated companies are developed under conditions designed to safeguard your personal information.
b. Information we disclose to third parties.
We may disclose personal information that we collect about you to nonaffiliated third parties to provide marketing services on our behalf or to other financial institutions with whom we have joint marketing agreements. We may also disclose all of the information we collect to other nonaffiliated third parties for our everyday business purposes, such as to process transactions, maintain account(s), respond to court orders and legal investigations, report to credit bureaus, offer our own products and services, protect against fraud, for institutional risk control, to perform services on our behalf, and as otherwise required or permitted by law.
When we share personal information about you with a nonaffiliated third party, they are required to limit their use of personal information about you to the particular purpose for which it was shared and they are not allowed to share personal information about you with others except to fulfill that limited purpose or as may be permitted or required by law.
3. HOW DO WE PROTECT THE SECURITY AND CONFIDENTIALITY OF PERSONAL INFORMATION WE COLLECT ABOUT YOU?
We maintain physical, electronic and procedural security measures that comply with applicable law and regulations to help safeguard the personal information we collect about you. We have internal policies governing the proper handling of client information by employees. Third parties that provide support or marketing services on our behalf may also receive personal information about you, and we require them to adhere to appropriate security standards with respect to such information.
4. HOW CAN YOU LIMIT OUR SHARING CERTAIN PERSONAL INFORMATION ABOUT YOU WITH OUR AFFILIATED COMPANIES FOR ELIGIBILITY DETERMINATION?
By following the opt-out procedures in Section 6 below, you may limit the extent to which we share with our affiliated companies, personal information that was collected to determine your eligibility for products and services such as your credit reports and other information that you have provided to us or that we may obtain from third parties ("eligibility information"). Eligibility information does not include your identification information or personal information pertaining to our transactions or experiences with you. Please note that, even if you direct us not to share eligibility information with our affiliated companies, we may still share your personal information, including eligibility information, with our affiliated companies under circumstances that are permitted under applicable law, such as to process transactions or to service your account.
5. HOW CAN YOU LIMIT THE USE OF CERTAIN PERSONAL INFORMATION ABOUT YOU BY OUR AFFILIATED COMPANIES FOR MARKETING?
By following the opt-out instructions in Section 6 below, you may limit our affiliated companies from marketing their products or services to you based on personal information we disclose to them. This information may include, for example, your income and account history with us. Please note that, even if you choose to limit our affiliated companies from using personal information about you that we may share with them for marketing their products and services to you, our affiliated companies may use your personal information that they obtain from us to market to you in circumstances permitted by law, such as if the affiliated party has its own relationship with you.
30
Morgan Stanley Institutional Fund, Inc.
Annual Report — December 31, 2013
U.S. Privacy Policy (unaudited) (cont'd)
6. HOW CAN YOU SEND US AN OPT-OUT INSTRUCTION?
If you wish to limit our sharing of eligibility information about you with our affiliated companies, or our affiliated companies' use of personal information for marketing purposes, as described in this notice, you may do so by:
• Calling us at (800) 548-7786
Monday–Friday between 8a.m. and 5p.m. (EST)
• Writing to us at the following address:
Boston Financial Data Services, Inc.
c/o Privacy Coordinator
P.O. Box 219804
Kansas City, Missouri 64121
If you choose to write to us, your request should include: your name, address, telephone number and account number(s) to which the opt-out applies and whether you are opting out with respect to sharing of eligibility information (Section 4 above), or information used for marketing (Section 5 above), or both. Written opt-out requests should not be sent with any other correspondence. In order to process your request, we require that the request be provided by you directly and not through a third party. Once you have informed us about your privacy preferences, your opt-out preference will remain in effect with respect to this Policy (as it may be amended) until you notify us otherwise. If you are a joint account owner, we will accept instructions from any one of you and apply those instructions to the entire account.
Please understand that if you limit our sharing or our affiliated companies' use of personal information, you and any joint account holder(s) may not receive information about our affiliated companies' products and services, including products or services that could help you manage your financial resources and achieve your investment objectives.
If you have more than one account or relationship with us, please specify the accounts to which you would like us to apply your privacy choices. If you have accounts or relationships with our affiliates, you may receive multiple privacy policies from them, and will need to separately notify those companies of your privacy choices for those accounts or relationships.
7. WHAT IF AN AFFILIATED COMPANY BECOMES A NONAFFILIATED THIRD PARTY?
If, at any time in the future, an affiliated company becomes a nonaffiliated third party, further disclosures of personal information made to the former affiliated company will be limited to those described in Section 2(b) above relating to nonaffiliated third parties. If you elected under Section 6 to limit disclosures we make to affiliated companies, or use of personal information by affiliated companies, your election will not apply to use by any former affiliated company of your personal information in their possession once it becomes a nonaffiliated third party.
SPECIAL NOTICE TO RESIDENTS OF VERMONT
The following section supplements our Policy with respect to our individual clients who have a Vermont address and supersedes anything to the contrary in the above Policy with respect to those clients only.
The State of Vermont requires financial institutions to obtain your consent prior to sharing personal information that they collect about you with nonaffiliated third parties, or eligibility information with affiliated companies, other than in certain limited circumstances. Except as permitted by law, we will not share personal information we collect about you with nonaffiliated third parties or eligibility information with affiliated companies, unless you provide us with your written consent to share such information.
SPECIAL NOTICE TO RESIDENTS OF CALIFORNIA
The following section supplements our Policy with respect to our individual clients who have a California address and supersedes anything to the contrary in the above Policy with respect to those clients only.
In response to a California law, if your account has a California home address, your personal information will not be disclosed to nonaffiliated third parties except as permitted by applicable California law, and we will limit sharing such personal information with our affiliates to comply with California privacy laws that apply to us.
31
Morgan Stanley Institutional Fund, Inc.
Annual Report — December 31, 2013
Director and Officer Information (unaudited)
Independent Director:
Name, Age and Address of
Independent Director | | Position(s)
Held with
Registrant | | Length of Time
Served* | | Principal Occupation(s) During Past 5 Years | | Number of
Portfolios in
Fund Complex
Overseen by
Independent
Director** | | Other Directorships
Held by Independent
Director*** | |
Frank L. Bowman (69)
c/o Kramer Levin Naftalis &
Frankel LLP
Counsel to the Independent Directors
1177 Avenue of the Americas
New York, NY 10036 | | Director | | Since
August
2006 | | President, Strategic Decisions, LLC (consulting) (since February 2009); Director or Trustee of various Morgan Stanley Funds (since August 2006); Chairperson of the Insurance Sub-Committee of the Compliance and Insurance Committee (since February 2007); served as President and Chief Executive Officer of the Nuclear Energy Institute (policy organization) (February 2005-November 2008); retired as Admiral, U.S. Navy after serving over 38 years on active duty including 8 years as Director of the Naval Nuclear Propulsion Program in the Department of the Navy and the U.S. Department of Energy (1996-2004); served as Chief of Naval Personnel (July 1994-September 1996); and on the Joint Staff as Director of Political Military Affairs (June 1992-July 1994); knighted as Honorary Knight Commander of the Most Excellent Order of the British Empire; awarded the Officier de l'Orde National du Mérite by the French Government; elected to the National Academy of Engineering (2009). | | | 98 | | | Director of BP p.l.c.; Director of Naval and Nuclear Technologies LLP; Director of the Armed Services YMCA of the USA and the U.S. Naval Submarine League; Director of the American Shipbuilding Suppliers Association; Member of the National Security Advisory Council of the Center for U.S. Global Engagement and a member of the CNA Military Advisory Board; Chairman, J Street Cup Golf Charity, Trustee Fairhaven United Methodist Church. | |
Michael Bozic (73)
c/o Kramer Levin Naftalis & Frankel LLP
Counsel to the Independent Directors
1177 Avenue of the Americas
New York, NY 10036 | | Director | | Since
April
1994 | | Private investor and a member of the advisory board of American Road Group LLC (retail) (since June 2000); Chairperson of the Compliance and Insurance Committee (since October 2006); Director or Trustee of various Morgan Stanley Funds (since April 1994); formerly, Chairperson of the Insurance Committee (July 2006-September 2006); Vice Chairman of Kmart Corporation (December 1998-October 2000), Chairman and Chief Executive Officer of Levitz Furniture Corporation (November 1995-November 1998) and President and Chief Executive Officer of Hills Department Stores (May 1991-July 1995); variously Chairman, Chief Executive Officer, President and Chief Operating Officer (1987-1991) of the Sears Merchandise Group of Sears, Roebuck & Co. | | | 100 | | | Trustee and member of the Hillsdale College Board of Trustees. | |
Kathleen A. Dennis (60)
c/o Kramer Levin Naftalis & Frankel LLP
Counsel to the Independent Directors
1177 Avenue of the Americas
New York, NY 10036 | | Director | | Since
August
2006 | | President, Cedarwood Associates (mutual fund and investment management consulting) (since July 2006); Chairperson of the Money Market and Alternatives Sub-Committee of the Investment Committee (since October 2006) and Director or Trustee of various Morgan Stanley Funds (since August 2006); formerly, Senior Managing Director of Victory Capital Management (1993-2006). | | | 98 | | | Director of various non-profit organizations. | |
Dr. Manuel H. Johnson (65)
c/o Johnson Smick Group, Inc.
888 16th Street, N.W.
Suite 740
Washington, D.C. 20006 | | Director | | Since
July
1991 | | Senior Partner, Johnson Smick International, Inc. (consulting firm); Chairperson of the Investment Committee (since October 2006) and Director or Trustee of various Morgan Stanley Funds (since July 1991); Co-Chairman and a founder of the Group of Seven Council (G7C) (international economic commission); formerly, Chairperson of the Audit Committee (July 1991-September 2006), Vice Chairman of the Board of Governors of the Federal Reserve System and Assistant Secretary of the U.S. Treasury. | | | 101 | | | Director of NVR, Inc. (home construction). | |
32
Morgan Stanley Institutional Fund, Inc.
Annual Report — December 31, 2013
Director and Officer Information (unaudited) (cont'd)
Independent Director: (cont'd)
Name, Age and Address of
Independent Director | | Position(s)
Held with
Registrant | | Length of Time
Served* | | Principal Occupation(s) During Past 5 Years | | Number of
Portfolios in
Fund Complex
Overseen by
Independent
Director** | | Other Directorships
Held by Independent
Director*** | |
Joseph J. Kearns (71)
c/o Kearns & Associates LLC
PMB754
22631 Pacific Coast Highway
Malibu, CA 90265 | | Director | | Since
August
1994 | | President, Kearns & Associates LLC (investment consulting); Chairperson of the Audit Committee (since October 2006) and Director or Trustee of various Morgan Stanley Funds (since August 1994); formerly, Deputy Chairperson of the Audit Committee (July 2003-September 2006) and Chairperson of the Audit Committee of various Morgan Stanley Funds (since August 1994); CFO of the J. Paul Getty Trust. | | | 101 | | | Director of Electro Rent Corporation (equipment leasing) and The Ford Family Foundation. | |
Michael F. Klein (55)
c/o Kramer Levin Naftalis & Frankel LLP
Counsel to the
Independent Directors
1177 Avenue of the Americas
New York, NY 10036 | | Director | | Since
August
2006 | | Managing Director, Aetos Capital, LLC (since March 2000) and Co-President, Aetos Alternatives Management, LLC (since January 2004) and Co-Chief Executive Officer of Aetos Capital LLC (since August 2013); Chairperson of the Fixed Income Sub-Committee of the Investment Committee (since October 2006) and Director or Trustee of various Morgan Stanley Funds (since August 2006); formerly, Managing Director, Morgan Stanley & Co. Inc. and Morgan Stanley Dean Witter Investment Management, President, various Morgan Stanley Funds (June 1998-March 2000) and Principal, Morgan Stanley & Co. Inc. and Morgan Stanley Dean Witter Investment Management (August 1997-December 1999). | | | 98 | | | Director of certain investment funds managed or sponsored by Aetos Capital, LLC. Director of Sanitized AG and Sanitized Marketing AG (specialty chemicals). | |
Michael E. Nugent (77)
522 Fifth Avenue
New York, NY 10036 | | Chairperson of the Board and Director | | Chairperson of the Boards since July 2006 and Director since July 1991 | | Chairperson of the Boards of various Morgan Stanley Funds (since July 2006); Chairperson of the Closed-End Fund Committee (since June 2012) and Director or Trustee of various Morgan Stanley Funds (since July 1991); formerly, Chairperson of the Insurance Committee (until July 2006); General Partner, Triumph Capital, L.P. (private investment partnership) (1988-2013) | | | 100 | | | None. | |
W. Allen Reed (66)
c/o Kramer Levin Naftalis & Frankel LLP
Counsel to the
Independent Directors
1177 Avenue of the Americas
New York, NY 10036 | | Director | | Since
August
2006 | | Chairperson of the Equity Sub-Committee of the Investment Committee (since October 2006) and Director or Trustee of various Morgan Stanley Funds (since August 2006); formerly, President and CEO of General Motors Asset Management; Chairman and Chief Executive Officer of the GM Trust Bank and Corporate Vice President of General Motors Corporation (August 1994-December 2005). | | | 98 | | | Director of Temple-Inland Industries (packaging and forest products); Director of Legg Mason, Inc. and Director of the Auburn University Foundation. | |
Fergus Reid (81)
c/o Joe Pietryka, Inc.
85 Charles Colman Blvd.
Pawling, NY 12564 | | Director | | Since
June
1992 | | Chairman, Joe Pietryka, Inc.; Chairperson of the Governance Committee and Director or Trustee of various Morgan Stanley Funds (since June 1992). | | | 101 | | | Through December 31, 2012, Trustee and Director of certain Investment companies in the JP Morgan Fund Complex. | |
33
Morgan Stanley Institutional Fund, Inc.
Annual Report — December 31, 2013
Director and Officer Information (unaudited) (cont'd)
Interested Director:
Name, Age and Address of
Interested Director | | Position(s) Held
with Registrant | | Length of
Time Served* | | Principal Occupation(s) During Past 5 Years | | Number of
Portfolios in
Fund Complex
Overseen by
Interested
Director** | | Other Directorships
Held by Interested
Director*** | |
James F. Higgins (66)
One New York Plaza
New York, New York 10004 | | Director | | Since
June
2000 | | Director or Trustee of various Morgan Stanley Funds (since June 2000); Senior Advisor of Morgan Stanley (since August 2000). | | | 99 | | | Formerly, Director of AXA Financial, Inc. and AXA Equitable Life Insurance Company (2002-2011) and Director of AXA MONY Life Insurance Company and AXA MONY Life Insurance Company of America (2004-2011). | |
* Each Director serves an indefinite term, until his or her successor is elected.
** The Fund Complex includes (as of December 31, 2013) all open-end and closed-end funds (including all of their portfolios) advised by Morgan Stanley Investment Management Inc. (the "Adviser") and any funds that have an adviser that is an affiliated person of the Adviser (including, but not limited to, Morgan Stanley AIP GP LP).
*** This includes any directorships at public companies and registered investment companies held by the Director at any time during the past five years.
34
Morgan Stanley Institutional Fund, Inc.
Annual Report — December 31, 2013
Director and Officer Information (unaudited) (cont'd)
Executive Officers:
Name, Age and Address of Executive Officer | | Position(s) Held
with
Registrant | | Length of
Time Served* | | Principal Occupation(s) During Past 5 Years | |
John H. Gernon (50)
522 Fifth Avenue
New York, NY 10036 | | President and Principal Executive Officer—Equity, Fixed Income and AIP Funds | | Since September 2013 | | President and Principal Executive Officer of the Equity and Fixed Income Funds and the Morgan Stanley AIP Funds (since September 2013) in the Fund Complex. Managing Director of the Adviser. | |
Stefanie V. Chang Yu (47)
522 Fifth Avenue
New York, NY 10036 | | Chief Compliance Officer | | Since
January
2014 | | Managing Director of the Adviser and various entities affiliated with the Adviser; Chief Compliance Officer of various Morgan Stanley Funds and the Adviser (since January 2014) formerly Vice President of various Morgan Stanley Funds (December 1997-January 2014), | |
Joseph C. Benedetti (48)
522 Fifth Avenue
New York, NY 10036 | | Vice President | | Since
January
2014 | | Managing Director of the Adviser and various entities affiliated with the Adviser; Vice President of various Morgan Stanley Funds (since January 2014). | |
Francis J. Smith (48)
522 Fifth Avenue
New York, NY 10036 | | Treasurer and Principal Financial Officer | | Treasurer since July 2003 and Principal Financial Officer since September 2002 | | Executive Director of the Adviser and various entities affiliated with the Adviser; Treasurer and Principal Financial Officer of various Morgan Stanley Funds (since July 2003). | |
Mary E. Mullin (46)
522 Fifth Avenue
New York, NY 10036 | | Secretary | | Since
June
1999 | | Executive Director of the Adviser and various entities affiliated with the Adviser; Secretary of various Morgan Stanley Funds (since June 1999). | |
* Each officer serves an indefinite term, until his or her successor is elected.
35
Morgan Stanley Institutional Fund, Inc.
Annual Report — December 31, 2013
Adviser and Administrator
Morgan Stanley Investment Management Inc.
522 Fifth Avenue
New York, New York 10036
Distributor
Morgan Stanley Distribution, Inc.
522 Fifth Avenue
New York, New York 10036
Dividend Disbursing and Transfer Agent
Boston Financial Data Services, Inc.
2000 Crown Colony Drive
Quincy, Massachusetts 02169
Custodian
State Street Bank and Trust Company
One Lincoln Street
Boston, Massachusetts 02111
Legal Counsel
Dechert LLP
1095 Avenue of the Americas
New York, New York 10036
Counsel to the Independent Directors
Kramer Levin Naftalis & Frankel LLP
1177 Avenue of the Americas
New York, New York 10036
Independent Registered Public Accounting Firm
Ernst & Young LLP
200 Clarendon Street
Boston, Massachusetts 02116
Reporting to Shareholders
Each Morgan Stanley fund provides a complete schedule of portfolio holdings in its semi-annual and annual reports within 60 days of the end of the fund's second and fourth fiscal quarters by filing the schedule electronically with the Securities and Exchange Commission (SEC). The semi-annual reports are filed on Form N-CSRS and the annual reports are filed on Form N-CSR. Morgan Stanley also delivers the semi-annual and annual reports to fund shareholders and makes these reports available on its public website, www.morganstanley.com/im. Each Morgan Stanley fund also files a complete schedule of portfolio holdings with the SEC for the fund's first and third fiscal quarters on Form N-Q. Morgan Stanley does not deliver the reports for the first and third fiscal quarters to shareholders, nor are the reports posted to the Morgan Stanley public website. You may, however, obtain the Form N-Q filings (as well as the Form N-CSR and N-CSRS filings) by accessing the SEC's website, www.sec.gov. You may also review and copy them at the SEC's Public Reference Room in Washington, DC. Information on the operation of the SEC's Public Reference Room may be obtained by calling the SEC toll free at 1 (800) SEC-0330. You can also request copies of these materials, upon payment of a duplicating fee, by electronic request at the SEC's email address (publicinfo@sec.gov) or by writing the Public Reference Room of the SEC, Washington, DC 20549-0102.
Proxy Voting Policies and Procedures and Proxy Voting Record
You may obtain a copy of the Fund's Proxy Voting Policy and Procedures and information regarding how the Fund voted proxies relating to portfolio securities during the most recent twelve-month period ended June 30, without charge, upon request, by calling toll free 1 (800) 548-7786 or by visiting our website at www.morganstanley.com/im. This information is also available on the SEC's website at www.sec.gov.
This report is authorized for distribution only when preceded or accompanied by a prospectus of the Morgan Stanley Institutional Fund, Inc. which describes in detail each Investment Portfolio's investment policies, risks, fees and expenses. Please read the prospectus carefully before you invest or send money. For additional information, including information regarding the investments comprising the Portfolio, please visit our website at www.morganstanley.com/im or call toll free 1 (800) 548-7786.
36
(This Page has been left blank intentionally.)
Printed in U.S.A.
This Report has been prepared for shareholders and may be distributed to others only if preceded or accompanied by a current prospectus.
Morgan Stanley Investment Management Inc.
522 Fifth Avenue
New York, New York 10036
© 2014 Morgan Stanley. Morgan Stanley Distribution, Inc.

IFIEMDANN
810202 EXP 2.28.15

Morgan Stanley Institutional Fund, Inc.
Global Quality Portfolio
Annual Report
December 31, 2013

Morgan Stanley Institutional Fund, Inc.
Annual Report — December 31, 2013
Shareholders' Letter | | | 2 | | |
Expense Example | | | 3 | | |
Investment Advisory Agreement Approval | | | 4 | | |
Investment Overview | | | 6 | | |
Portfolio of Investments | | | 9 | | |
Statement of Assets and Liabilities | | | 10 | | |
Statement of Operations | | | 12 | | |
Statements of Changes in Net Assets | | | 13 | | |
Financial Highlights | | | 14 | | |
Notes to Financial Statements | | | 18 | | |
Report of Independent Registered Public Accounting Firm | | | 24 | | |
U.S. Privacy Policy | | | 25 | | |
Director and Officer Information | | | 28 | | |
This report is authorized for distribution only when preceded or accompanied by prospectuses of the Morgan Stanley Institutional Fund, Inc. To receive a prospectus and/or statement of additional information (SAI), which contains more complete information such as investment objectives, charges, expenses, policies for voting proxies, risk considerations, and describes in detail each of the Portfolio's investment policies to the prospective investor, please call toll free 1 (800) 548-7786. Please read the prospectuses carefully before you invest or send money.
Additionally, you can access portfolio information including performance, characteristics, and investment team commentary through Morgan Stanley Investment Management's website: www.morganstanley.com/im.
Market forecasts provided in this report may not necessarily come to pass. There is no guarantee that any sectors mentioned will continue to perform as discussed herein or that securities in such sectors will be held by the Portfolio in the future. There is no assurance that a Portfolio will achieve its investment objective. Portfolios are subject to market risk, which is the possibility that market values of securities owned by the Portfolio will decline and, therefore, the value of the Portfolio's shares may be less than what you paid for them. Accordingly, you can lose money investing in the Portfolio. Please see the prospectus for more complete information on investment risks.
1
Morgan Stanley Institutional Fund, Inc.
Annual Report — December 31, 2013
Shareholders' Letter (unaudited)
Dear Shareholders,
We are pleased to provide this Annual report, in which you will learn how your investment in Global Quality Portfolio (the "Portfolio") performed during the period ended December 31, 2013.
Morgan Stanley Investment Management is a client-centric, investor-led organization. Our global presence, intellectual capital, and breadth of products and services enable us to partner with investors to meet the evolving challenges of today's financial markets. We aim to deliver superior investment service and to empower our clients to make the informed decisions that help them reach their investment goals.
As always, we thank you for selecting Morgan Stanley Investment Management, and look forward to working with you in the months and years ahead.
Sincerely,

John H. Gernon
President and Principal Executive Officer
January 2014
2
Morgan Stanley Institutional Fund, Inc.
Annual Report — December 31, 2013
Expense Example (unaudited)
Global Quality Portfolio
As a shareholder of the Portfolio, you incur two types of costs: (1) transactional costs; and (2) ongoing costs, including advisory fees, administration fees, distribution and shareholder services fees and other Portfolio expenses. This example is intended to help you understand your ongoing costs (in dollars) of investing in the Portfolio and to compare these costs with the ongoing costs of investing in other mutual funds.
This example is based on an investment of $1,000 invested at the beginning of the period and held for the entire period 8/30/13-12/31/13 (unless otherwise noted).
Actual Expenses
The table below provides information about actual account values and actual expenses. You may use the information in this table, together with the amount you invested, to estimate the expenses that you paid over the period. Simply divide your account value by $1,000 (for example, an $8,600 account value divided by $1,000 = 8.6), then multiply the result by the number in the table under the heading entitled "Actual Expenses Paid During Period" to estimate the expenses you paid on your account during this period.
Hypothetical Example for Comparison Purposes
The table below provides information about hypothetical account values and hypothetical expenses based on the Portfolio's actual expense ratio and an assumed rate of return of 5% per year before expenses, which is not the Portfolio's actual return. The hypothetical account values and expenses may not be used to estimate the actual ending account balance or expenses you paid for the period. You may use this information to compare the ongoing costs of investing in the Portfolio and other funds. To do so, compare this 5% hypothetical example with the 5% hypothetical examples that appear in the shareholder reports of the other funds.
Please note that the expenses shown in the table are meant to highlight your ongoing costs only and do not reflect any transactional costs, such as sales charges (loads). Therefore, the information for each class in the table is useful in comparing ongoing costs only, and will not help you determine the relative total costs of owning different funds. In addition, if these transactional costs were included, your costs would have been higher.
| | Beginning
Account
Value
8/30/13 | | Actual Ending
Account
Value
12/31/13 | | Hypothetical
Ending Account
Value | | Actual
Expenses
Paid
During
Period | | Hypothetical
Expenses Paid
During Period | | Net
Expense
Ratio
During
Period*** | |
MSIF Global Quality Portfolio Class I^ | | $ | 1,000.00 | | | $ | 1,128.00 | | | $ | 1,012.53 | | | $ | 4.16 | * | | $ | 3.94 | * | | | 1.19 | % | |
MSIF Global Quality Portfolio Class A^ | | | 1,000.00 | | | | 1,127.00 | | | | 1,011.38 | | | | 5.38 | * | | | 5.09 | * | | | 1.54 | | |
MSIF Global Quality Portfolio Class L^ | | | 1,000.00 | | | | 1,125.00 | | | | 1,009.73 | | | | 7.13 | * | | | 6.74 | * | | | 2.04 | | |
MSIF Global Quality Portfolio Class IS | | | 1,000.00 | | | | 1,097.30 | | | | 1,011.29 | | | | 3.54 | ** | | | 3.39 | ** | | | 1.15 | | |
* Expenses are calculated using each Portfolio Class' annualized net expense ratio (as disclosed), multiplied by the average account value over the period, and multiplied by 120/365 (to reflect the most recent one-half year period).
** Expenses are calculated using the Portfolio Class' annualized net expense ratio (as disclosed), multiplied by the average account value over the period, and multiplied by 107/365 (to reflect the actual days in the period).
*** Annualized.
^ Commencement of operations 8/30/13.
3
Morgan Stanley Institutional Fund, Inc.
Annual Report — December 31, 2013
Investment Advisory Agreement Approval (unaudited)
Nature, Extent and Quality of Services
The Board reviewed and considered the nature and extent of the investment advisory services to be provided by the Adviser (as defined herein) under the advisory agreement, including portfolio management, investment research and equity and fixed income securities trading. The Board reviewed similar information and factors regarding the Sub-Advisers (as defined herein), to the extent applicable. The Board also reviewed and considered the nature and extent of the non-advisory, administrative services to be provided by the Portfolio's Adviser under the administration agreement, including accounting, clerical, bookkeeping, compliance, business management and planning, and the provision of supplies, office space and utilities at the Adviser's expense. (The Adviser and Sub-Advisers together are referred to as the "Adviser" and the advisory, sub-advisory and administration agreements together are referred to as the "Management Agreement.") The Board also compared the nature of the services to be provided by the Adviser with similar services provided by non-affiliated advisers as reported to the Board by Lipper, Inc. ("Lipper").
The Board reviewed and considered the qualifications of the portfolio managers, the senior administrative managers and other key personnel of the Adviser who provide the administrative and advisory services to the Portfolio. The Board determined that the Adviser's portfolio managers and key personnel are well qualified by education and/or training and experience to perform the services in an efficient and professional manner. The Board concluded that the nature and extent of the advisory and administrative services to be provided were necessary and appropriate for the conduct of the business and investment activities of the Portfolio and supported its decision to approve the Management Agreement.
Performance, Fees and Expenses of the Portfolio
The Board considered that the Adviser plans to arrange for a public offering of shares of the Portfolio to raise assets for investment and that the offering had not yet begun and concluded that, since the Portfolio currently had no assets to invest and had no track record of performance, this was not a factor it needed to address at the present time.
The Board reviewed the advisory and administrative fee rates (the "management fee rates") proposed to be paid by the Portfolio under the Management Agreement relative to comparable funds advised by the Adviser, when applicable, and compared to their peers as determined by the Adviser, and reviewed the anticipated total expense ratio of the Portfolio. The Board considered that the Portfolio requires the Adviser to develop processes, invest in additional resources and incur additional risks to successfully manage the Portfolio and concluded that the proposed management fee rate and anticipated total expense ratio would be competitive with its peer group average.
Economies of Scale
The Board considered the growth prospects of the Portfolio and the structure of the proposed management fee schedule, which includes breakpoints for the Portfolio. The Board considered that the Portfolio's potential growth was uncertain and concluded that it would be premature to consider economies of scale as a factor in approving the Management Agreement at the present time.
Profitability of the Adviser and Affiliates
Since the Portfolio has not begun operations and has not paid any fees to the Adviser, the Board concluded that this was not a factor that needed to be considered at the present time.
Other Benefits of the Relationship
The Board considered other benefits to the Adviser and its affiliates derived from their relationship with the Portfolio and other funds advised by the Adviser. These benefits may include, among other things, "float" benefits derived from handling of checks for purchases and sales, research received by the Adviser generated from commission dollars spent on funds' portfolio trading and fees for distribution and/or shareholder servicing. Since the Portfolio has not begun operations and has not paid any fees to the Adviser, the Board concluded that these benefits were not a factor that needed to be considered at the present time.
Resources of the Adviser and Historical Relationship Between the Fund and the Adviser
The Board considered whether the Adviser is financially sound and has the resources necessary to perform its obligations under the Management Agreement. The Board also reviewed and considered the organizational structure of the Adviser, the policies and procedures formulated and adopted by the Adviser for managing the Fund's operations and the Board's confidence in the competence and integrity of the senior managers and key personnel of the Adviser. The Board concluded that the Adviser has the financial resources necessary to fulfill its obligations under the Management Agreement and that it is beneficial for the Portfolio to enter into this relationship with the Adviser.
4
Morgan Stanley Institutional Fund, Inc.
Annual Report — December 31, 2013
Investment Advisory Agreement Approval (unaudited) (cont'd)
Other Factors and Current Trends
The Board considered the controls and procedures adopted and implemented by the Adviser and monitored by the Fund's Chief Compliance Officer and concluded that the conduct of business by the Adviser indicates a good faith effort on its part to adhere to high ethical standards in the conduct of the Portfolio's business.
General Conclusion
After considering and weighing all of the above factors, the Board concluded that it would be in the best interest of the Portfolio and its future shareholders to approve the Management Agreement, which will remain in effect for two years and thereafter must be approved annually by the Board of the Portfolio if it is to continue in effect. In reaching this conclusion the Board did not give particular weight to any single factor referenced above. It is possible that individual Board members may have weighed these factors differently in reaching their individual decisions to approve the Management Agreement.
5
Morgan Stanley Institutional Fund, Inc.
Annual Report — December 31, 2013
Investment Overview (unaudited)
Global Quality Portfolio
The Global Quality Portfolio seeks long-term capital appreciation.
Performance
For the period since inception, August 30, 2013, through December 31, 2013, the Portfolio had a total return based on net asset value and reinvestment of distributions per share of 12.80%, net of fees, for Class I shares. The Portfolio's Class I shares underperformed against its benchmark, the Morgan Stanley Capital International (MSCI) World Index (the "Index"), which returned 13.40%.
Factors Affecting Performance
• At the time of the Portfolio's launch in late August, stock prices continued to be driven by "re-rating" — that is, the market changing its view of a company, causing a stock's valuation to increase — an environment that had persisted since 2012. We believe the stock market's re-rating during 2013 was more likely due to a mix of optimism about future earnings growth and the lack of investment alternatives in a world of low interest rates.
• The primary driver of the Portfolio's underperformance during the since-inception period was sector allocation, mainly due to the Portfolio's overweight allocation to consumer staples. Even with the sector delivering a strong positive return, it lagged the even higher return of the benchmark. Although the sector offered better earnings prospects and higher dividend yields than the overall market, consumer staples stocks simply did not re-rate as fast as the market.
• Relative losses in the since-inception period were partially offset by strong returns from financials and industrials. No exposure in the materials, energy and utilities sectors were also positive contributors.
Management Strategies
• While the talk in developed markets has been of an economic acceleration (of sorts), emerging markets have been slowing down. Talk of the U.S. Federal Reserve tapering its bond buying program has caused turmoil in emerging markets, due to the fear of hot money heading back to the U.S. as rates rose. This has caused a slowdown in growth forecasts,
which have dropped to "only" 5% next year for Asia ex-Japan, and has also weakened currencies in countries with current account deficits such as India and Indonesia.
• Although the Portfolio does not have any direct exposure to stocks listed in emerging markets, more than one-third of the revenues of the companies held in the Portfolio are derived in these markets, including BAT, Unilever, Nestle and 3M*,**. These global companies have been affected by the emerging markets slowdown and currency turbulence. Top-line growth in these markets has been tempered, and there have been headwinds where local currencies have weakened. Along with these economic effects, there has also been a worsening of market sentiment directed to companies exposed to emerging markets consumption, as the market has chased the more exciting and higher beta plays (that is, stocks with greater sensitivity to market movements) linked to developed markets.
• Our view is that exposure to emerging markets consumption remains positive. Even post the recent slowdown, emerging market growth continues to run above the rate likely in the near-to-medium term in developed markets. While any resumption in tapering may drive a recurrence of last year's volatility, the emerging markets economies as a whole could continue to see decent overall gross domestic product (GDP) growth, underpinned by growing middle classes and a potential rebalancing towards consumption.
• Our focus remains on high-quality companies that we believe will continue to compound shareholder wealth, by offering steady top-line growth, resilient margins and high unlevered returns on capital at reasonable valuations. In the short-term, returns can be driven by re-rating, as has certainly been the case in 2012 and 2013, but in the long-term, the ability to compound has historically won out. Our belief is that well-managed high quality global companies remain an excellent source of compounders.
* Please see page 8 for Portfolio Composition.
** The information contained in this overview regarding specific securities is for information purposes only and should not be construed as a recommendation to purchase or sell the securities mentioned.
6
Morgan Stanley Institutional Fund, Inc.
Annual Report — December 31, 2013
Investment Overview (unaudited) (cont'd)
Global Quality Portfolio
* Minimum Investment for Class I shares
** Commenced Operations on August 30, 2013.
In accordance with SEC regulations, Portfolio's performance shown assumes that all recurring fees (including management fees) were deducted and all dividends and distributions were reinvested. The performance of Class A, L and IS shares will vary from Class I shares and will be negatively impacted by additional fees assessed to those classes (if applicable).
Performance Compared to the Morgan Stanley Capital International (MSCI) World Index(1) and the Lipper Global Large-Cap Growth Funds Index(2)
| | | Period Ended December 31, 2013
Total Returns(3) | |
| | | One
Year | | Five
Years | | Ten
Years | | Since
Inception(6) | |
Portfolio — Class I Shares
w/o sales charges(4) | | | — | | | | — | | | | — | | | | 12.80 | % | |
MSCI World Index | | | — | | | | — | | | | — | | | | 13.40 | | |
Lipper Global Large-Cap Growth
Funds Index | | | — | | | | — | | | | — | | | | 13.12 | | |
Portfolio — Class A Shares
w/o sales charges(4) | | | — | | | | — | | | | — | | | | 12.70 | | |
Portfolio — Class A Shares with
maximum 5.25% sales charges(4) | | | — | | | | — | | | | — | | | | 6.82 | | |
MSCI World Index | | | — | | | | — | | | | — | | | | 13.40 | | |
Lipper Global Large-Cap Growth
Funds Index | | | — | | | | — | | | | — | | | | 13.12 | | |
Portfolio — Class L Shares
w/o sales charges(4) | | | — | | | | — | | | | — | | | | 12.50 | | |
MSCI World Index | | | — | | | | — | | | | — | | | | 13.40 | | |
Lipper Global Large-Cap Growth
Funds Index | | | — | | | | — | | | | — | | | | 13.12 | | |
Portfolio — Class IS Shares
w/o sales charges(5) | | | — | | | | — | | | | — | | | | 9.73 | | |
MSCI World Index | | | — | | | | — | | | | — | | | | 8.81 | | |
Lipper Global Large-Cap Growth
Funds Index | | | — | | | | — | | | | — | | | | 8.28 | | |
Performance data quoted represents past performance, which is no guarantee of future results, and current performance may be lower or higher than the figures shown. Performance assumes that all dividends and distributions, if any, were reinvested. For the most recent month-end performance figures, please visit www.morganstanley.com/im. Investment return and principal value will fluctuate so that Portfolio shares, when redeemed, may be worth more or less than their original cost. Total returns do not reflect the deduction of taxes that a shareholder would pay on Portfolio distributions or the redemption of Portfolio shares. Returns for periods less than one year are not annualized. Performance of share classes will vary due to difference in expenses.
(1) The Morgan Stanley Capital International (MSCI) World Index is a free float-adjusted market capitalization weighted index designed to measure the equity market performance of developed markets. The term "free float" represents the portion of shares outstanding that are deemed to be available for purchase in the public equity markets by investors. The MSCI World Index currently consists of 23 developed market country indices. The performance of the Index is listed in US dollars and assumes reinvestment of net dividends. The Index is unmanaged and its returns do not include any sales charges or fees. Such costs would lower performance. It is not possible to invest directly in an index.
(2) The Lipper Global Large-Cap Growth Funds Index is an equally weighted performance index of the largest qualifying funds (based on net assets) in the Lipper Global Large-Cap Growth Funds classification. The Index, which is adjusted for capital gains distributions and income dividends, is unmanaged and should not be considered an investment. There are currently 10 funds represented in this Index. As of the date of this report, the Portfolio is in the Lipper Global Large-Cap Growth Funds classification.
7
Morgan Stanley Institutional Fund, Inc.
Annual Report — December 31, 2013
Investment Overview (unaudited) (cont'd)
Global Quality Portfolio
(3) Total returns for the Portfolio reflect fees waived and expenses reimbursed, if applicable, by the Adviser. Without such waivers and reimbursements, total returns would have been lower. The fee waivers and/or expense reimbursements will continue for at least one year or until such time as the Fund's Board of Directors acts to discontinue all or a portion of such waivers and/or expense reimbursements when it deems that such action is appropriate.
(4) Commenced operations on August 30, 2013.
(5) Commenced offering on September 13, 2013.
(6) For comparative purposes, since inception returns listed for the Indexes refer to the inception date or initial offering of the respective share class of the Portfolio, not the inception of the Index. Returns for periods less than one year are not annualized.
Portfolio Composition
Classification | | Percentage of
Total Investments | |
Other* | | | 29.4 | % | |
Pharmaceuticals | | | 18.9 | | |
Food Products | | | 15.7 | | |
Tobacco | | | 10.3 | | |
Industrial Conglomerates | | | 7.4 | | |
Software | | | 6.7 | | |
Household Products | | | 6.3 | | |
Information Technology Services | | | 5.3 | | |
Total Investments | | | 100.0 | % | |
* Industries and/or investment types representing less than 5% of total investments.
8
Morgan Stanley Institutional Fund, Inc.
Annual Report — December 31, 2013
Portfolio of Investments
Global Quality Portfolio
| | | Shares | | Value
(000) | |
Common Stocks (97.0%) | |
France (6.6%) | |
LVMH Moet Hennessy Louis Vuitton SA | | | 610 | | | $ | 111 | | |
Pernod-Ricard SA | | | 529 | | | | 60 | | |
Sanofi | | | 4,613 | | | | 490 | | |
| | | | 661 | | |
Germany (7.2%) | |
BASF SE | | | 905 | | | | 96 | | |
Bayer AG (Registered) | | | 1,604 | | | | 225 | | |
SAP AG | | | 4,721 | | | | 405 | | |
| | | | 726 | | |
Switzerland (14.4%) | |
Nestle SA (Registered) | | | 8,793 | | | | 644 | | |
Novartis AG (Registered) | | | 6,078 | | | | 485 | | |
Roche Holding AG (Genusschein) | | | 1,143 | | | | 319 | | |
| | | | 1,448 | | |
United Kingdom (29.2%) | |
Aggreko PLC | | | 7,690 | | | | 218 | | |
British American Tobacco PLC | | | 10,523 | | | | 564 | | |
Diageo PLC | | | 12,710 | | | | 421 | | |
Experian PLC | | | 3,665 | | | | 68 | | |
Imperial Tobacco Group PLC | | | 4,139 | | | | 160 | | |
Prudential PLC | | | 7,038 | | | | 156 | | |
Reckitt Benckiser Group PLC | | | 6,290 | | | | 499 | | |
Smiths Group PLC | | | 2,168 | | | | 53 | | |
Unilever PLC | | | 14,720 | | | | 605 | | |
Weir Group PLC (The) | | | 5,036 | | | | 178 | | |
| | | | 2,922 | | |
United States (39.6%) | |
3M Co. | | | 2,661 | | | | 373 | | |
Accenture PLC, Class A | | | 3,838 | | | | 316 | | |
Aon PLC | | | 1,843 | | | | 155 | | |
Coach, Inc. | | | 1,850 | | | | 104 | | |
Covidien PLC | | | 1,682 | | | | 115 | | |
Danaher Corp. | | | 4,021 | | | | 310 | | |
Google, Inc., Class A (a) | | | 231 | | | | 259 | | |
Intuit, Inc. | | | 1,059 | | | | 81 | | |
Johnson & Johnson | | | 4,029 | | | | 369 | | |
McDonald's Corp. | | | 1,473 | | | | 143 | | |
Mead Johnson Nutrition Co. | | | 578 | | | | 48 | | |
Microsoft Corp. | | | 4,966 | | | | 186 | | |
Mondelez International, Inc., Class A | | | 7,703 | | | | 272 | | |
Moody's Corp. | | | 1,579 | | | | 124 | | |
Nielsen Holdings N.V. | | | 4,685 | | | | 215 | | |
NIKE, Inc., Class B | | | 1,973 | | | | 155 | | |
Philip Morris International, Inc. | | | 3,491 | | | | 304 | | |
Procter & Gamble Co. (The) | | | 1,576 | | | | 128 | | |
Time Warner, Inc. | | | 1,503 | | | | 105 | | |
Visa, Inc., Class A | | | 935 | | | | 208 | | |
| | | | 3,970 | | |
Total Common Stocks (Cost $9,055) | | | 9,727 | | |
| | | Shares | | Value
(000) | |
Short-Term Investment (2.5%) | |
Investment Company (2.5%) | |
Morgan Stanley Institutional Liquidity Funds —
Treasury Securities Portfolio — Institutional
Class (See Note G)
(Cost $251) | | | 251,276 | | | $ | 251 | | |
Total Investment Company (Cost $251) | | | 251 | | |
Total Investments (99.5%) (Cost $9,306) | | | 9,978 | | |
Other Assets in Excess of Liabilities (0.5%) | | | 47 | | |
Net Assets (100.0%) | | $ | 10,025 | | |
(a) Non-income producing security.
The accompanying notes are an integral part of the financial statements.
9
Morgan Stanley Institutional Fund, Inc.
Annual Report — December 31, 2013
Statement of Assets and Liabilities | | December 31, 2013
(000) | |
Assets: | |
Investments in Securities of Unaffiliated Issuers, at Value (Cost $9,055) | | $ | 9,727 | | |
Investment in Security of Affiliated Issuer, at Value (Cost $251) | | | 251 | | |
Total Investments in Securities, at Value (Cost $9,306) | | | 9,978 | | |
Foreign Currency, at Value (Cost $1) | | | 1 | | |
Prepaid Offering Costs | | | 81 | | |
Due from Adviser | | | 50 | | |
Dividends Receivable | | | 6 | | |
Receivable for Investments Sold | | | — | @ | |
Tax Reclaim Receivable | | | — | @ | |
Receivable from Affiliate | | | — | @ | |
Other Assets | | | — | @ | |
Total Assets | | | 10,116 | | |
Liabilities: | |
Payable for Investments Purchased | | | 50 | | |
Payable for Offering Costs | | | 30 | | |
Payable for Custodian Fees | | | 4 | | |
Payable for Transfer Agent Fees — Class I | | | — | @ | |
Payable for Transfer Agent Fees — Class A | | | — | @ | |
Payable for Transfer Agent Fees — Class L | | | — | @ | |
Payable for Administration Fees | | | 1 | | |
Payable for Professional Fees | | | 1 | | |
Payable for Shareholder Services Fees — Class A | | | — | @ | |
Payable for Distribution and Shareholder Services Fees — Class L | | | — | @ | |
Other Liabilities | | | 5 | | |
Total Liabilities | | | 91 | | |
Net Assets | | $ | 10,025 | | |
Net Assets Consist Of: | |
Paid-in-Capital | | $ | 9,351 | | |
Accumulated Net Investment Income | | | — | @ | |
Accumulated Net Realized Gain | | | 2 | | |
Unrealized Appreciation (Depreciation) on: | |
Investments | | | 672 | | |
Foreign Currency Translations | | | — | @ | |
Net Assets | | $ | 10,025 | | |
The accompanying notes are an integral part of the financial statements.
10
Morgan Stanley Institutional Fund, Inc.
Annual Report — December 31, 2013
Statement of Assets and Liabilities (cont'd) | | December 31, 2013
(000) | |
CLASS I: | |
Net Assets | | $ | 7,440 | | |
| Shares Outstanding $0.001 par value shares of beneficial interest (500,000,000 shares authorized) (not in 000's) | | | 659,341 | | |
Net Asset Value, Offering and Redemption Price Per Share | | $ | 11.28 | | |
CLASS A: | |
Net Assets | | $ | 1,612 | | |
| Shares Outstanding $0.001 par value shares of beneficial interest (500,000,000 shares authorized) (not in 000's) | | | 143,056 | | |
Net Asset Value, Redemption Price Per Share | | $ | 11.27 | | |
Maximum Sales Load | | | 5.25 | % | |
Maximum Sales Charge | | $ | 0.62 | | |
Maximum Offering Price Per Share | | $ | 11.89 | | |
CLASS L: | |
Net Assets | | $ | 962 | | |
| Shares Outstanding $0.001 par value shares of beneficial interest (500,000,000 shares authorized) (not in 000's) | | | 85,520 | | |
Net Asset Value, Offering and Redemption Price Per Share | | $ | 11.25 | | |
CLASS IS: | |
Net Assets | | $ | 11 | | |
| Shares Outstanding $0.001 par value shares of beneficial interest (500,000,000 shares authorized) (not in 000's) | | | 973 | | |
Net Asset Value, Offering and Redemption Price Per Share | | $ | 11.28 | | |
@ Amount is less than $500.
The accompanying notes are an integral part of the financial statements.
11
Morgan Stanley Institutional Fund, Inc.
Annual Report — December 31, 2013
| Statement of Operations Period from | | August 30,
2013^ to
December 31, 2013
(000) | |
Investment Income: | |
Dividends from Securities of Unaffiliated Issuers (Net of $@ of Foreign Taxes Withheld) | | $ | 26 | | |
Dividends from Securities of Affiliated Issuer (Note G) | | | — | @ | |
Total Investment Income | | | 26 | | |
Expenses: | |
Professional Fees | | | 41 | | |
Offering Costs | | | 39 | | |
Advisory Fees (Note B) | | | 19 | | |
Custodian Fees (Note F) | | | 8 | | |
Shareholder Reporting Fees | | | 3 | | |
Administration Fees (Note C) | | | 2 | | |
Transfer Agency Fees — Class I (Note E) | | | — | @ | |
Transfer Agency Fees — Class A (Note E) | | | — | @ | |
Transfer Agency Fees — Class L (Note E) | | | — | @ | |
Transfer Agency Fees — Class IS (Note E) | | | — | @ | |
Shareholder Services Fees — Class A (Note D) | | | 1 | | |
Distribution and Shareholder Services Fees — Class L (Note D) | | | 1 | | |
Directors' Fees and Expenses | | | 1 | | |
Pricing Fees | | | 1 | | |
Registration Fees | | | — | @ | |
Other Expenses | | | 2 | | |
Total Expenses | | | 118 | | |
Expenses Reimbursed by Adviser (Note B) | | | (69 | ) | |
Waiver of Advisory Fees (Note B) | | | (19 | ) | |
Reimbursement of Class Specific Expenses — Class L (Note B) | | | (— | @) | |
Reimbursement of Class Specific Expenses — Class IS (Note B) | | | (— | @) | |
Rebate from Morgan Stanley Affiliate (Note G) | | | (— | @) | |
Net Expenses | | | 30 | | |
Net Investment Loss | | | (4 | ) | |
Realized Gain (Loss): | |
Investments Sold | | | 9 | | |
Foreign Currency Transactions | | | (3 | ) | |
Net Realized Gain | | | 6 | | |
Change in Unrealized Appreciation (Depreciation): | |
Investments | | | 672 | | |
Foreign Currency Translations | | | — | @ | |
Net Change in Unrealized Appreciation (Depreciation) | | | 672 | | |
Net Realized Gain and Change in Unrealized Appreciation (Depreciation) | | | 678 | | |
Net Increase in Net Assets Resulting from Operations | | $ | 674 | | |
^ Commencement of operations.
@ Amount is less than $500.
The accompanying notes are an integral part of the financial statements.
12
Morgan Stanley Institutional Fund, Inc.
Annual Report — December 31, 2013
Statement of Changes in Net Assets | | Period from
August 30, 2013^ to
December 31, 2013
(000) | |
Increase (Decrease) in Net Assets: | |
Operations: | |
Net Investment Loss | | $ | (4 | ) | |
Net Realized Gain | | | 6 | | |
Net Change in Unrealized Appreciation (Depreciation) | | | 672 | | |
Net Increase in Net Assets Resulting from Operations | | | 674 | | |
Capital Share Transactions:(1) | |
Class I: | |
Subscribed | | | 7,025 | | |
Redeemed | | | (137 | ) | |
Class A: | |
Subscribed | | | 1,548 | | |
Redeemed | | | (24 | ) | |
Class L: | |
Subscribed | | | 929 | | |
Class IS: | |
Subscribed | | | 10 | * | |
Net Increase in Net Assets Resulting from Capital Share Transactions | | | 9,351 | | |
Total Increase in Net Assets | | | 10,025 | | |
Net Assets: | |
Beginning of Period | | | — | | |
End of Period (Including Accumulated Net Investment Income of $—@) | | $ | 10,025 | | |
(1) Capital Share Transactions: | |
Class I: | |
Shares Subscribed | | | 671 | | |
Shares Redeemed | | | (12 | ) | |
Net Increase in Class I Shares Outstanding | | | 659 | | |
Class A: | |
Shares Subscribed | | | 145 | | |
Shares Redeemed | | | (2 | ) | |
Net Increase in Class A Shares Outstanding | | | 143 | | |
Class L: | |
Shares Subscribed | | | 86 | | |
Class IS: | |
Shares Subscribed | | | 1 | * | |
^ Commencement of operations
* For the period September 13, 2013 through December 31, 2013.
@ Amount is less than $500.
The accompanying notes are an integral part of the financial statements.
13
Morgan Stanley Institutional Fund, Inc.
Annual Report — December 31, 2013
Financial Highlights
Global Quality Portfolio
| | | Class I | |
Selected Per Share Data and Ratios | | Period from
August 30, 2013^ to
December 31, 2013 | |
Net Asset Value, Beginning of Period | | $ | 10.00 | | |
Income (Loss) from Investment Operations: | |
Net Investment Loss† | | | (0.00 | )‡ | |
Net Realized and Unrealized Gain | | | 1.28 | | |
Total from Investment Operations | | | 1.28 | | |
Net Asset Value, End of Period | | $ | 11.28 | | |
Total Return++ | | | 12.80 | %# | |
Ratios and Supplemental Data: | |
Net Assets, End of Period (Thousands) | | $ | 7,440 | | |
Ratio of Expenses to Average Net Assets (1) | | | 1.19 | %+* | |
Ratio of Net Investment Loss to Average Net Assets (1) | | | (0.12 | )%+* | |
Ratio of Rebate from Morgan Stanley Affiliates to Average Net Assets | | | 0.01 | %* | |
Portfolio Turnover Rate | | | 19 | %# | |
(1) Supplemental Information on the Ratios to Average Net Assets: | |
Ratios Before Expense Limitation | |
Expenses to Average Net Assets | | | 4.86 | %* | |
Net Investment Loss to Average Net Assets | | | (3.79 | )%* | |
^ Commencement of Operations.
† Per share amount is based on average shares outstanding.
‡ Amount is less than $0.005 per share.
++ Calculated based on the net asset value as of the last business day of the period.
+ The Ratios of Expenses and Net Investment Loss reflect the rebate of certain Portfolio expenses in connection with the investments in Morgan Stanley affiliates during the period. The effect of the rebate on the ratios is disclosed in the above table as "Ratio of Rebate from Morgan Stanley Affiliates to Average Net Assets."
# Not Annualized.
* Annualized.
The accompanying notes are an integral part of the financial statements.
14
Morgan Stanley Institutional Fund, Inc.
Annual Report — December 31, 2013
Financial Highlights
Global Quality Portfolio
| | | Class A | |
Selected Per Share Data and Ratios | | Period from
August 30, 2013^ to
December 31, 2013 | |
Net Asset Value, Beginning of Period | | $ | 10.00 | | |
Income (Loss) from Investment Operations: | |
Net Investment Loss† | | | (0.02 | ) | |
Net Realized and Unrealized Gain | | | 1.29 | | |
Total from Investment Operations | | | 1.27 | | |
Net Asset Value, End of Period | | $ | 11.27 | | |
Total Return++ | | | 12.70 | %# | |
Ratios and Supplemental Data: | |
Net Assets, End of Period (Thousands) | | $ | 1,612 | | |
Ratio of Expenses to Average Net Assets (1) | | | 1.54 | %+* | |
Ratio of Net Investment Loss to Average Net Assets (1) | | | (0.45 | )%+* | |
Ratio of Rebate from Morgan Stanley Affiliates to Average Net Assets | | | 0.01 | %* | |
Portfolio Turnover Rate | | | 19 | %# | |
(1) Supplemental Information on the Ratios to Average Net Assets: | |
Ratios Before Expense Limitation | |
Expenses to Average Net Assets | | | 5.00 | %* | |
Net Investment Loss to Average Net Assets | | | (3.91 | )%* | |
^ Commencement of Operations.
† Per share amount is based on average shares outstanding.
++ Calculated based on the net asset value which does not reflect sales charges, if applicable, as of the last business day of the period.
+ The Ratios of Expenses and Net Investment Loss reflect the rebate of certain Portfolio expenses in connection with the investments in Morgan Stanley affiliates during the period. The effect of the rebate on the ratios is disclosed in the above table as "Ratio of Rebate from Morgan Stanley Affiliates to Average Net Assets."
# Not Annualized.
* Annualized.
The accompanying notes are an integral part of the financial statements.
15
Morgan Stanley Institutional Fund, Inc.
Annual Report — December 31, 2013
Financial Highlights
Global Quality Portfolio
| | | Class L | |
Selected Per Share Data and Ratios | | Period from
August 30, 2013^ to
December 31, 2013 | |
Net Asset Value, Beginning of Period | | $ | 10.00 | | |
Income (Loss) from Investment Operations: | |
Net Investment Loss† | | | (0.03 | ) | |
Net Realized and Unrealized Gain | | | 1.28 | | |
Total from Investment Operations | | | 1.25 | | |
Net Asset Value, End of Period | | $ | 11.25 | | |
Total Return++ | | | 12.50 | %# | |
Ratios and Supplemental Data: | |
Net Assets, End of Period (Thousands) | | $ | 962 | | |
Ratio of Expenses to Average Net Assets (1) | | | 2.04 | %+* | |
Ratio of Net Investment Loss to Average Net Assets (1) | | | (0.80 | )%+* | |
Ratio of Rebate from Morgan Stanley Affiliates to Average Net Assets | | | 0.01 | %* | |
Portfolio Turnover Rate | | | 19 | %# | |
(1) Supplemental Information on the Ratios to Average Net Assets: | |
Ratios Before Expense Limitation | |
Expenses to Average Net Assets | | | 6.27 | %* | |
Net Investment Loss to Average Net Assets | | | (5.03 | )%* | |
^ Commencement of Operations.
† Per share amount is based on average shares outstanding.
++ Calculated based on the net asset value as of the last business day of the period.
+ The Ratios of Expenses and Net Investment Loss reflect the rebate of certain Portfolio expenses in connection with the investments in Morgan Stanley affiliates during the period. The effect of the rebate on the ratios is disclosed in the above table as "Ratio of Rebate from Morgan Stanley Affiliates to Average Net Assets."
# Not Annualized.
* Annualized.
The accompanying notes are an integral part of the financial statements.
16
Morgan Stanley Institutional Fund, Inc.
Annual Report — December 31, 2013
Financial Highlights
Global Quality Portfolio
| | | Class IS | |
Selected Per Share Data and Ratios | | Period from
September 13, 2013^ to
December 31, 2013 | |
Net Asset Value, Beginning of Period | | $ | 10.28 | | |
Income (Loss) from Investment Operations: | |
Net Investment Loss† | | | (0.00 | )‡ | |
Net Realized and Unrealized Gain | | | 1.00 | | |
Total from Investment Operations | | | 1.00 | | |
Net Asset Value, End of Period | | $ | 11.28 | | |
Total Return++ | | | 9.73 | %# | |
Ratios and Supplemental Data: | |
Net Assets, End of Period (Thousands) | | $ | 11 | | |
Ratio of Expenses to Average Net Assets (1) | | | 1.15 | %+* | |
Ratio of Net Investment Loss to Average Net Assets (1) | | | (0.10 | )%+* | |
Ratio of Rebate from Morgan Stanley Affiliates to Average Net Assets | | | 0.00 | %§* | |
Portfolio Turnover Rate | | | 19 | %# | |
(1) Supplemental Information on the Ratios to Average Net Assets: | |
Ratios Before Expense Limitation | |
Expenses to Average Net Assets | | | 9.57 | %* | |
Net Investment Loss to Average Net Assets | | | (8.52 | )%* | |
^ Commencement of Operations.
† Per share amount is based on average shares outstanding.
‡ Amount is less than $0.005 per share.
++ Calculated based on the net asset value as of the last business day of the period.
+ The Ratios of Expenses and Net Investment Loss reflect the rebate of certain Portfolio expenses in connection with the investments in Morgan Stanley affiliates during the period. The effect of the rebate on the ratios is disclosed in the above table as "Ratio of Rebate from Morgan Stanley Affiliates to Average Net Assets."
§ Amount is less than 0.005%.
# Not Annualized.
* Annualized.
The accompanying notes are an integral part of the financial statements.
17
Morgan Stanley Institutional Fund, Inc.
Annual Report — December 31, 2013
Notes to Financial Statements
Morgan Stanley Institutional Fund, Inc. (the "Fund") is registered under the Investment Company Act of 1940, as amended (the "Act"), as an open-end management investment company. The Fund is comprised of twenty-seven separate, active, diversified and non-diversified portfolios (individually referred to as a "Portfolio", collectively as the "Portfolios").
The accompanying financial statements relate to the Global Quality Portfolio. The Portfolio's "Sub-Advisers," Morgan Stanley Investment Management Limited ("MSIM Limited") and Morgan Stanley Investment Management Company ("MSIM Company") (together, the "Sub-Advisers"), seek long-term capital appreciation by investing primarily in equity securities of high quality companies located throughout the world, including developed and emerging market countries. In seeking to identify high quality companies, the Sub-Advisers look for companies that they believe have the returns profile that can underpin compounding, that is, they are able to consistently compound shareholder wealth at attractive rates of return over the long-term. In the Sub-Advisers' view, such companies are typically businesses built on dominant market positions, underpinned by powerful, hard to replicate intangible assets and that can generate resilient high cross cycle returns on capital. In addition, the Sub-Advisers consider high quality companies to have some or all of the following characteristics: strong managements, resilient revenue streams, pricing power (high gross margins), typically low capital intensity and the opportunity for organic growth. The Portfolio commenced operations on August 30, 2013 and offers three classes of shares — Class I, Class A and Class L.
On September 16, 2013, the Portfolio commenced offering Class IS shares.
A. Significant Accounting Policies: The following significant accounting policies are in conformity with U.S. generally accepted accounting principles ("GAAP"). Such policies are consistently followed by the Fund in the preparation of its financial statements. GAAP may require management to make estimates and assumptions that affect the reported amounts and disclosures in the financial statements. Actual results may differ from those estimates.
1. Security Valuation: (1) An equity portfolio security listed or traded on an exchange is valued at its latest reported sales price (or at the exchange official closing price if such exchange reports an official closing price), if there were no sales on a given day, the security is valued at the mean between the last reported bid and asked prices;
(2) all other equity portfolio securities for which over-the-counter market quotations are readily available are valued at its latest reported sales price. In cases where a security is traded on more than one exchange, the security is valued on the exchange designated as the primary market; (3) when market quotations are not readily available, including circumstances under which Morgan Stanley Investment Management Inc. (the "Adviser") determines that the closing price, last sale price or the mean between the last reported bid and asked prices are not reflective of a security's market value, portfolio securities are valued at their fair value as determined in good faith under procedures established by and under the general supervision of the Fund's Board of Directors (the "Directors"). Occasionally, developments affecting the closing prices of securities and other assets may occur between the times at which valuations of such securities are determined (that is, close of the foreign market on which the securities trade) and the close of business of the New York Stock Exchange ("NYSE"). If developments occur during such periods that are expected to materially affect the value of such securities, such valuations may be adjusted to reflect the estimated fair value of such securities as of the close of the NYSE, as determined in good faith by the Directors or by the Adviser using a pricing service and/or procedures approved by the Directors; (4) quotations of foreign portfolio securities, other assets and liabilities and forward contracts stated in foreign currency are translated into U.S. dollar equivalents at the prevailing market rates prior to the close of the NYSE; (5) investments in mutual funds, including the Morgan Stanley Institutional Liquidity Funds, are valued at the net asset value as of the close of each business day; and (6) short-term debt securities with remaining maturities of 60 days or less at the time of purchase may be valued at amortized cost, unless the Adviser determines such valuation does not reflect the securities' market value, in which case these securities will be valued at their fair market value determined by the Adviser.
Under procedures approved by the Directors, the Fund's Adviser has formed a Valuation Committee. The Valuation Committee provides administration and oversight of the Fund's valuation policies and procedures, which are reviewed at least annually by the Directors. These procedures allow the Fund to utilize independent pricing services, quotations from securities and financial instrument dealers, and other market sources to determine fair value.
18
Morgan Stanley Institutional Fund, Inc.
Annual Report — December 31, 2013
Notes to Financial Statements (cont'd)
The Fund has procedures to determine the fair value of securities and other financial instruments for which market prices are not readily available. Under these procedures, the Valuation Committee convenes on a regular and ad hoc basis to review such securities and considers a number of factors, including valuation methodologies and significant unobservable valuation inputs, when arriving at fair value. The Valuation Committee may employ a market-based approach which may use related or comparable assets or liabilities, recent transactions, market multiples, book values, and other relevant information for the investment to determine the fair value of the investment. An income-based valuation approach may also be used in which the anticipated future cash flows of the investment are discounted to calculate fair value. Discounts may also be applied due to the nature or duration of any restrictions on the disposition of the investments. Due to the inherent uncertainty of valuations of such investments, the fair values may differ significantly from the values that would have been used had an active market existed. The Valuation Committee employs various methods for calibrating these valuation approaches including a regular review of valuation methodologies, key inputs and assumptions, transactional back-testing or disposition analysis, and reviews of any related market activity.
2. Fair Value Measurement: Financial Accounting Standards Board ("FASB") Accounting Standards CodificationTM ("ASC") 820, "Fair Value Measurements and Disclosures" ("ASC 820"), defines fair value as the value that the Fund would receive to sell an investment or pay to transfer a liability in a timely transaction with an independent buyer in the principal market, or in the absence of a principal market the most advantageous market for the investment or liability. ASC 820 establishes a three-tier hierarchy to distinguish between (1) inputs that reflect the assumptions market participants would use in valuing an asset or liability developed based on market data obtained from sources independent of the reporting entity (observable inputs) and (2) inputs that reflect the reporting entity's own assumptions about the assumptions market participants would use in valuing an asset or liability developed based on the best information available in the circumstances (unobservable inputs) and to establish classification of fair value measurements for disclosure purposes. Various inputs are used in determining the value of
the Fund's investments. The inputs are summarized in the three broad levels listed below.
• Level 1 – unadjusted quoted prices in active markets for identical investments
• Level 2 – other significant observable inputs (including quoted prices for similar investments, interest rates, prepayment speeds, credit risk, etc.)
• Level 3 – significant unobservable inputs including the Fund's own assumptions in determining the fair value of investments. Factors considered in making this determination may include, but are not limited to, information obtained by contacting the issuer, analysts, or the appropriate stock exchange (for exchange-traded securities), analysis of the issuer's financial statements or other available documents and, if necessary, available information concerning other securities in similar circumstances
The inputs or methodology used for valuing securities are not necessarily an indication of the risk associated with investing in those securities and the determination of the significance of a particular input to the fair value measurement in its entirety requires judgment and considers factors specific to each security.
The following is a summary of the inputs used to value the Portfolio's investments as of December 31, 2013.
Investment Type | | Level 1
Unadjusted
quoted
prices
(000) | | Level 2
Other
significant
observable
inputs
(000) | | Level 3
Significant
unobservable
inputs
(000) | | Total
(000) | |
Assets: | |
Common Stocks | |
Beverages | | $ | 481 | | | $ | — | | | $ | — | | | $ | 481 | | |
Chemicals | | | 96 | | | | — | | | | — | | | | 96 | | |
Commercial Services &
Supplies | | | 218 | | | | — | | | | — | | | | 218 | | |
Diversified Financial
Services | | | 124 | | | | — | | | | — | | | | 124 | | |
Food Products | | | 1,569 | | | | — | | | | — | | | | 1,569 | | |
Health Care Equipment &
Supplies | | | 115 | | | | — | | | | — | | | | 115 | | |
Hotels, Restaurants &
Leisure | | | 143 | | | | — | | | | — | | | | 143 | | |
Household Products | | | 627 | | | | — | | | | — | | | | 627 | | |
Industrial Conglomerates | | | 736 | | | | — | | | | — | | | | 736 | | |
Information Technology
Services | | | 524 | | | | — | | | | — | | | | 524 | | |
Insurance | | | 311 | | | | — | | | | — | | | | 311 | | |
19
Morgan Stanley Institutional Fund, Inc.
Annual Report — December 31, 2013
Notes to Financial Statements (cont'd)
Investment Type | | Level 1
Unadjusted
quoted
prices
(000) | | Level 2
Other
significant
observable
inputs
(000) | | Level 3
Significant
unobservable
inputs
(000) | | Total
(000) | |
Common Stocks (cont'd) | |
Internet Software &
Services | | $ | 259 | | | $ | — | | | $ | — | | | $ | 259 | | |
Machinery | | | 178 | | | | — | | | | — | | | | 178 | | |
Media | | | 105 | | | | — | | | | — | | | | 105 | | |
Pharmaceuticals | | | 1,888 | | | | — | | | | — | | | | 1,888 | | |
Professional Services | | | 283 | | | | — | | | | — | | | | 283 | | |
Software | | | 672 | | | | — | | | | — | | | | 672 | | |
Textiles, Apparel &
Luxury Goods | | | 370 | | | | — | | | | — | | | | 370 | | |
Tobacco | | | 1,028 | | | | — | | | | — | | | | 1,028 | | |
Total Common Stocks | | | 9,727 | | | | — | | | | — | | | | 9,727 | | |
Short-Term Investment —
Investment Company | | | 251 | | | | — | | | | — | | | | 251 | | |
Total Assets | | $ | 9,978 | | | $ | — | | | $ | — | | | $ | 9,978 | | |
Transfers between investment levels may occur as the markets fluctuate and/or the availability of data used in an investment's valuation changes. The Portfolio recognizes transfers between the levels as of the end of the period. As of December 31, 2013, the Portfolio did not have any investments transfer between investment levels.
3. Foreign Currency Translation and Foreign Investments: The books and records of the Portfolio are maintained in U.S. dollars. Foreign currency amounts are translated into U.S. dollars as follows:
– investments, other assets and liabilities at the prevailing rate of exchange on the valuation date;
– investment transactions and investment income at the prevailing rates of exchange on the dates of such transactions.
Although the net assets of the Portfolio are presented at the foreign exchange rates and market values at the close of the period, the Portfolio does not isolate that portion of the results of operations arising as a result of changes in the foreign exchange rates from the fluctuations arising from changes in the market prices of securities held at period end. Similarly, the Portfolio does not isolate the effect of changes in foreign exchange rates from the fluctuations arising from changes in the market prices of securities sold during the period. Accordingly, realized and unrealized foreign currency gains (losses) on investments in securities are included in the reported net realized and unrealized gains (losses) on investment transactions and balances. However, pursuant to U.S. Federal income tax regulations, gains and losses from
certain foreign currency transactions and the foreign currency portion of gains and losses realized on sales and maturities of foreign denominated debt securities are treated as ordinary income for U.S. Federal income tax purposes.
Net realized gains (losses) on foreign currency transactions represent net foreign exchange gains (losses) from foreign currency forward exchange contracts, disposition of foreign currencies, currency gains (losses) realized between the trade and settlement dates on securities transactions, and the difference between the amount of investment income and foreign withholding taxes recorded on the Portfolio's books and the U.S. dollar equivalent amounts actually received or paid. Net unrealized currency gains (losses) from valuing foreign currency denominated assets and liabilities at period end exchange rates are reflected as a component of unrealized appreciation (depreciation) on the Statement of Assets and Liabilities. The change in unrealized currency gains (losses) on foreign currency translations for the period is reflected in the Statement of Operations.
Foreign security and currency transactions may involve certain considerations and risks not typically associated with those of U.S. dollar denominated transactions as a result of, among other factors, fluctuations of exchange rates in relation to the U.S. dollar, the possibility of lower levels of governmental supervision and regulation of foreign securities markets and the possibility of political or economic instability.
The net assets of the Portfolio include foreign denominated securities and currency. Changes in currency exchange rates will affect the U.S. Dollar value of and investment income from such securities.
Governmental approval for foreign investments may be required in advance of making an investment under certain circumstances in some countries, and the extent of foreign investments in domestic companies may be subject to limitation in other countries. Foreign ownership limitations also may be imposed by the charters of individual companies to prevent, among other concerns, violations of foreign investment limitations. As a result, an additional class of shares (identified as "Foreign" in the Portfolio of Investments) may be created and offered for investment. The "local" and "foreign shares" market values may differ. In the absence of trading of the foreign
20
Morgan Stanley Institutional Fund, Inc.
Annual Report — December 31, 2013
Notes to Financial Statements (cont'd)
shares in such markets, the Portfolio values the foreign shares at the closing exchange price of the local shares.
4. Indemnifications: The Fund enters into contracts that contain a variety of indemnifications. The Fund's maximum exposure under these arrangements is unknown. However, the Fund has not had prior claims or losses pursuant to these contracts and expects the risk of loss to be remote.
5. Dividends and Distributions to Shareholders: Dividend income and distributions to shareholders are recorded on the ex-dividend date. Dividends from net investment income, if any, are declared and paid semiannually. Net realized capital gains, if any, are distributed at least annually.
6. Security Transactions, Income and Expenses: Security transactions are accounted for on the trade date (date the order to buy or sell is executed). Realized gains and losses on the sale of investment securities are determined on the specific identified cost method. Dividend income and other distributions are recorded on the ex-dividend date (except for certain foreign dividends which may be recorded as soon as the Portfolio is informed of such dividends) net of applicable withholding taxes. Interest income is recognized on the accrual basis except where collection is in doubt. Discounts are accreted and premiums are amortized over the life of the respective securities. Most expenses of the Fund can be directly attributed to a particular Portfolio. Expenses which cannot be directly attributed are apportioned among the Portfolios based upon relative net assets or other appropriate methods. Income, expenses (other than class specific expenses — distribution, transfer agency and sub transfer agency fees) and realized and unrealized gains or losses are allocated to each class of shares based upon their relative net assets.
B. Advisory/Sub-Advisory Fees: The Adviser, a wholly-owned subsidiary of Morgan Stanley, provides the Portfolio with advisory services under the terms of an Investment Advisory Agreement, paid quarterly, at an annual rate of 0.80% of the average daily net assets of the Portfolio.
The Adviser has agreed to reduce its advisory fee and/or reimburse the Portfolio so that total annual portfolio operating expenses, excluding certain investment related expenses, taxes, interest and other extraordinary expenses (including litigation), will not exceed 1.20% for Class I shares, 1.55% for Class A shares, 2.05% for Class L shares and 1.15% for
Class IS shares. The fee waivers and/or expense reimbursements will continue for at least one year or until such time that the Directors act to discontinue all or a portion of such waivers and/or reimbursements when it deems such action is appropriate. For the period ended December 31, 2013, approximately $19,000 of advisory fees were waived and approximately $69,000 of other expenses were reimbursed by the Adviser pursuant to this arrangement.
The Adviser has entered into a Sub-Advisory Agreement with the Sub-Advisers, each a wholly-owned subsidiary of Morgan Stanley. The Sub-Advisers provide the Portfolio with advisory services subject to the overall supervision of the Adviser and the Fund's Officers and Directors. The Adviser pays the Sub-Advisers on a monthly basis a portion of the net advisory fees the Adviser receives from the Portfolio.
C. Administration Fees: The Adviser also serves as Administrator to the Fund and provides administrative services pursuant to an Administration Agreement for an annual fee, accrued daily and paid monthly, of 0.08% of the Portfolio's average daily net assets. Under a Sub-Administration Agreement between the Administrator and State Street Bank and Trust Company ("State Street"), State Street provides certain administrative services to the Fund. For such services, the Administrator pays State Street a portion of the fee the Administrator receives from the Portfolio.
D. Distribution and Shareholder Services Fees: Morgan Stanley Distribution, Inc. ("MSDI" or the "Distributor"), a wholly-owned subsidiary of the Adviser, and an indirect subsidiary of Morgan Stanley, serves as the Fund's Distributor of Portfolio shares pursuant to a Distribution Agreement. The Fund has adopted a Shareholder Services Plan with respect to Class A shares pursuant to Rule 12b-1 under the Act. Under the Shareholder Services Plan, the Portfolio pays the Distributor a shareholder services fee, accrued daily and paid monthly, at an annual rate of 0.25% of the Portfolio's average daily net assets attributable to Class A shares.
The Fund has adopted a Distribution and Shareholder Services Plan with respect to Class L shares pursuant to Rule 12b-1 under the Act. Under the Distribution and Shareholder Services Plan, the Portfolio pays the Distributor a distribution fee, accrued daily and paid monthly, at an annual rate of 0.50% and a shareholder services fee, accrued daily and paid monthly, at an annual rate of 0.25% of the Portfolio's average daily net assets attributable to Class L shares.
21
Morgan Stanley Institutional Fund, Inc.
Annual Report — December 31, 2013
Notes to Financial Statements (cont'd)
The distribution and shareholder services fees are used to support the expenses associated with servicing and maintaining accounts. The Distributor may compensate other parties for providing shareholder support services to investors who purchase Class A and Class L shares.
E. Dividend Disbursing and Transfer Agent: The Fund's dividend disbursing and transfer agent is Boston Financial Data Services, Inc.
F. Custodian Fees: State Street (the "Custodian") serves as Custodian for the Fund in accordance with a Custodian Agreement. The Custodian holds cash, securities, and other assets of the Fund as required by the Act. Custody fees are payable monthly based on assets held in custody, investment purchases and sales activity and account maintenance fees, plus reimbursement for certain out-of-pocket expenses.
G. Security Transactions and Transactions with Affiliates: For the period ended December 31, 2013, purchases and sales of investment securities for the Portfolio, other than long-term U.S. Government securities and short-term investments, were approximately $9,599,000 and $552,000, respectively. There were no purchases and sales of long-term U.S. Government securities for the period ended December 31, 2013.
The Portfolio invests in the Institutional Class of the Morgan Stanley Institutional Liquidity Funds — Treasury Securities Portfolio (the "Liquidity Funds"), an open-end management investment company managed by the Adviser. Advisory fees paid by the Portfolio are reduced by an amount equal to its pro-rata share of the advisory and administration fees paid by the Portfolio due to its investment in the Liquidity Funds. For the period ended December 31, 2013, advisory fees paid were reduced by less than $500 relating to the Portfolio's investment in the Liquidity Funds.
A summary of the Portfolio's transactions in shares of the Liquidity Funds during the period ended December 31, 2013 is as follows:
Value
August 30,
2013
(000) | | Purchases
at Cost
(000) | | Sales
(000) | | Dividend
Income
(000) | | Value
December 31,
2013
(000) | |
| $ | — | | | $ | 8,045 | | | $ | 7,794 | | | $ | — | @ | | $ | 251 | | |
@ Amount is less than $500.
H. Federal Income Taxes: It is the Portfolio's intention to continue to qualify as a regulated investment company and distribute all of its taxable and tax-exempt income. Accordingly,
no provision for Federal income taxes is required in the financial statements.
The Portfolio may be subject to taxes imposed by countries in which it invests. Such taxes are generally based on income and/or capital gains earned or repatriated. Taxes are accrued based on net investment income, net realized gains and net unrealized appreciation as such income and/or gains are earned. Taxes may also be based on transactions in foreign currency and are accrued based on the value of investments denominated in such currency.
FASB ASC 740-10, Income Taxes — Overall, sets forth a minimum threshold for financial statement recognition of the benefit of a tax position taken or expected to be taken in a tax return. Management has concluded there are no significant uncertain tax positions that would require recognition in the financial statements. If applicable, the Portfolio recognizes interest accrued related to unrecognized tax benefits in "Interest Expense" and penalties in ''Other Expenses" in the Statement of Operations. The Portfolio files tax returns with the U.S. Internal Revenue Service, New York and various states.
The tax character of distributions paid may differ from the character of distributions shown in the Statements of Changes in Net Assets due to short-term capital gains being treated as ordinary income for tax purposes. There were no distributions paid during fiscal year 2013.
The amount and character of income and gains to be distributed are determined in accordance with income tax regulations which may differ from GAAP. These book/tax differences are either considered temporary or permanent in nature.
Temporary differences are attributable to differing book and tax treatments for the timing of the recognition of gains (losses) on certain investment transactions and the timing of the deductibility of certain expenses.
Permanent differences, primarily due to differing treatments of gains (losses) related to foreign currency transactions and a net operating loss, resulted in the following reclassifications among the components of net assets at December 31, 2013:
Undistributed
Net Investment
Income
(000) | | Accumulated
Net Realized
Gain
(000) | | Paid-in-
Capital
(000) | |
| $ | 4 | | | $ | (4 | ) | | | — | | |
22
Morgan Stanley Institutional Fund, Inc.
Annual Report — December 31, 2013
Notes to Financial Statements (cont'd)
At December 31, 2013, the components of distributable earnings for the Portfolio on a tax basis were as follows:
Undistributed
Ordinary
Income
(000) | | Undistributed
Long-Term
Capital Gain
(000) | |
| $ | 10 | | | | — | | |
At December 31, 2013, the aggregate cost for Federal income tax purposes is approximately $9,315,000. The aggregate gross unrealized appreciation is approximately $676,000 and the aggregate gross unrealized depreciation is approximately $13,000 resulting in net unrealized appreciation of approximately $663,000.
I. Accounting Pronouncement: In June 2013, FASB issued Accounting Standards Update 2013-08 Financial Services — Investment Companies (Topic 946) — Amendments to the Scope, Measurement, and Disclosure Requirements ("ASU 2013-08") which is effective for interim and annual reporting periods in fiscal years that begin after December 15, 2013. ASU 2013-08 sets forth a methodology for determining whether an entity should be characterized as an investment company and prescribes fair value accounting for an investment company's non-controlling ownership interest in another investment company. FASB has determined that a fund registered under the Investment Company Act of 1940 automatically meets ASU 2013-08's criteria for an investment company. Although still evaluating the potential impacts of ASU 2013-08 to the Portfolio, management expects that the impact of the Portfolio's adoption will be limited to additional financial statement disclosures.
23
Morgan Stanley Institutional Fund, Inc.
Annual Report — December 31, 2013
Report of Independent Registered Public Accounting Firm
To the Shareholders and Board of Directors of
Morgan Stanley Institutional Fund, Inc. —
Global Quality Portfolio
We have audited the accompanying statement of assets and liabilities, including the portfolio of investments, of Global Quality Portfolio (one of the portfolios constituting Morgan Stanley Institutional Fund, Inc.) (the "Portfolio") as of December 31, 2013, and the related statements of operations and changes in net assets and the financial highlights for the period from August 30, 2013 (commencement of operations) to December 31, 2013. These financial statements and financial highlights are the responsibility of the Portfolio's management. Our responsibility is to express an opinion on these financial statements and financial highlights based on our audit.
We conducted our audit in accordance with the standards of the Public Company Accounting Oversight Board (United States). Those standards require that we plan and perform the audit to obtain reasonable assurance about whether the financial statements and financial highlights are free of material misstatement. We were not engaged to perform an audit of the Portfolio's internal control over financial reporting. Our audit included consideration of internal control over financial reporting as a basis for designing audit procedures that are appropriate in the circumstances, but not for the purpose of expressing an opinion on the effectiveness of the Portfolio's internal control over financial reporting. Accordingly, we express no such opinion. An audit also includes examining, on a test basis, evidence supporting the amounts and disclosures in the financial statements and financial highlights, assessing the accounting principles used and significant estimates made by management, and evaluating the overall financial statement presentation. Our procedures included confirmation of securities owned as of December 31, 2013, by correspondence with the custodian and others or by other appropriate auditing procedures where replies from others were not received. We believe that our audit provides a reasonable basis for our opinion.
In our opinion, the financial statements and financial highlights referred to above present fairly, in all material respects, the financial position of Global Quality Portfolio (one of the portfolios constituting Morgan Stanley Institutional Fund, Inc.) at December 31, 2013, the results of its operations, the changes in its net assets, and the financial highlights for the period from August 30, 2013 (commencement of operations) to December 31, 2013, in conformity with U.S. generally accepted accounting principles.

Boston, Massachusetts
February 26, 2014
24
Morgan Stanley Institutional Fund, Inc.
Annual Report — December 31, 2013
U.S. Privacy Policy (unaudited)
AN IMPORTANT NOTICE CONCERNING OUR U.S. PRIVACY POLICY
This privacy notice describes the U.S. privacy policy of Morgan Stanley Distribution, Inc., and the Morgan Stanley family of mutual funds ("us", "our", "we").
We are required by federal law to provide you with notice of our U.S. privacy policy ("Policy"). This Policy applies to both our current and former clients unless we state otherwise and is intended for individual clients who purchase products or receive services from us for personal, family or household purposes. This Policy is not applicable to partnerships, corporations, trusts or other non-individual clients or account holders, nor is this Policy applicable to individuals who are either beneficiaries of a trust for which we serve as trustee or participants in an employee benefit plan administered or advised by us. This Policy is, however, applicable to individuals who select us to be a custodian of securities or assets in individual retirement accounts, 401(k) accounts, or accounts subject to the Uniform Gifts to Minors Act.
This notice sets out our business practices to protect your privacy; how we collect and share personal information about you; and how you can limit our sharing or certain uses by others of this information. We may amend this Policy at any time, and will inform you of any changes to our Policy as required by law.
WE RESPECT YOUR PRIVACY
We appreciate that you have provided us with your personal financial information and understand your concerns about your information. We strive to safeguard the information our clients entrust to us. Protecting the confidentiality and security of client information is an important part of how we conduct our business.
This notice describes what personal information we collect about you, how we collect it, when we may share it with others, and how certain others may use it. It discusses the steps you may take to limit our sharing of certain information about you with our affiliated companies, including, but not limited to our affiliated banking businesses, brokerage firms and credit service affiliates. It also discloses how you may limit our affiliates' use of shared information for marketing purposes.
Throughout this Policy, we refer to the nonpublic information that personally identifies you as "personal information." We also use the term "affiliated company" in this notice. An affiliated company is a company in our family of companies and includes companies with the Morgan Stanley name. These affiliated companies are financial institutions such as broker-dealers, banks, investment advisers and credit card issuers. We refer to any company that is not an affiliated company as a nonaffiliated third party. For purposes of Section 5 of this notice, and your ability to limit certain uses of personal information by our affiliates, this notice applies to the use of personal information by our affiliated companies.
1. WHAT PERSONAL INFORMATION DO WE COLLECT FROM YOU?
We may collect the following types of information about you: (i) information provided by you, including information from applications and other forms we receive from you, (ii) information about your transactions with us or our affiliates, (iii) information about your transactions with nonaffiliated third parties, (iv) information from consumer reporting agencies, (v) information obtained from our websites, and (vi) information obtained from other sources. For example:
• We collect information such as your name, address, e-mail address, telephone/fax numbers, assets, income and investment objectives through applications and other forms you submit to us.
• We may obtain information about account balances, your use of account(s) and the types of products and services you prefer to receive from us through your dealings and transactions with us and other sources.
• We may obtain information about your creditworthiness and credit history from consumer reporting agencies.
• We may collect background information from and through third-party vendors to verify representations you have made and to comply with various regulatory requirements.
2. WHEN DO WE DISCLOSE PERSONAL INFORMATION WE COLLECT ABOUT YOU?
We may disclose personal information we collect about you in each of the categories listed above to affiliated and nonaffiliated third parties.
25
Morgan Stanley Institutional Fund, Inc.
Annual Report — December 31, 2013
U.S. Privacy Policy (unaudited) (cont'd)
a. Information we disclose to affiliated companies.
We may disclose personal information that we collect about you to our affiliated companies to manage your account(s) effectively, to service and process your transactions, and to let you know about products and services offered by us and affiliated companies, to manage our business, and as otherwise required or permitted by law. Offers for products and services from affiliated companies are developed under conditions designed to safeguard your personal information.
b. Information we disclose to third parties.
We may disclose personal information that we collect about you to nonaffiliated third parties to provide marketing services on our behalf or to other financial institutions with whom we have joint marketing agreements. We may also disclose all of the information we collect to other nonaffiliated third parties for our everyday business purposes, such as to process transactions, maintain account(s), respond to court orders and legal investigations, report to credit bureaus, offer our own products and services, protect against fraud, for institutional risk control, to perform services on our behalf, and as otherwise required or permitted by law.
When we share personal information about you with a nonaffiliated third party, they are required to limit their use of personal information about you to the particular purpose for which it was shared and they are not allowed to share personal information about you with others except to fulfill that limited purpose or as may be permitted or required by law.
3. HOW DO WE PROTECT THE SECURITY AND CONFIDENTIALITY OF PERSONAL INFORMATION WE COLLECT ABOUT YOU?
We maintain physical, electronic and procedural security measures that comply with applicable law and regulations to help safeguard the personal information we collect about you. We have internal policies governing the proper handling of client information by employees. Third parties that provide support or marketing services on our behalf may also receive personal information about you, and we require them to adhere to appropriate security standards with respect to such information.
4. HOW CAN YOU LIMIT OUR SHARING CERTAIN PERSONAL INFORMATION ABOUT YOU WITH OUR AFFILIATED COMPANIES FOR ELIGIBILITY DETERMINATION?
By following the opt-out procedures in Section 6 below, you may limit the extent to which we share with our affiliated companies, personal information that was collected to determine your eligibility for products and services such as your credit reports and other information that you have provided to us or that we may obtain from third parties ("eligibility information"). Eligibility information does not include your identification information or personal information pertaining to our transactions or experiences with you. Please note that, even if you direct us not to share eligibility information with our affiliated companies, we may still share your personal information, including eligibility information, with our affiliated companies under circumstances that are permitted under applicable law, such as to process transactions or to service your account.
5. HOW CAN YOU LIMIT THE USE OF CERTAIN PERSONAL INFORMATION ABOUT YOU BY OUR AFFILIATED COMPANIES FOR MARKETING?
By following the opt-out instructions in Section 6 below, you may limit our affiliated companies from marketing their products or services to you based on personal information we disclose to them. This information may include, for example, your income and account history with us. Please note that, even if you choose to limit our affiliated companies from using personal information about you that we may share with them for marketing their products and services to you, our affiliated companies may use your personal information that they obtain from us to market to you in circumstances permitted by law, such as if the affiliated party has its own relationship with you.
26
Morgan Stanley Institutional Fund, Inc.
Annual Report — December 31, 2013
U.S. Privacy Policy (unaudited) (cont'd)
6. HOW CAN YOU SEND US AN OPT-OUT INSTRUCTION?
If you wish to limit our sharing of eligibility information about you with our affiliated companies, or our affiliated companies' use of personal information for marketing purposes, as described in this notice, you may do so by:
• Calling us at (800) 548-7786
Monday–Friday between 8a.m. and 5p.m. (EST)
• Writing to us at the following address:
Boston Financial Data Services, Inc.
c/o Privacy Coordinator
P.O. Box 219804
Kansas City, Missouri 64121
If you choose to write to us, your request should include: your name, address, telephone number and account number(s) to which the opt-out applies and whether you are opting out with respect to sharing of eligibility information (Section 4 above), or information used for marketing (Section 5 above), or both. Written opt-out requests should not be sent with any other correspondence. In order to process your request, we require that the request be provided by you directly and not through a third party. Once you have informed us about your privacy preferences, your opt-out preference will remain in effect with respect to this Policy (as it may be amended) until you notify us otherwise. If you are a joint account owner, we will accept instructions from any one of you and apply those instructions to the entire account.
Please understand that if you limit our sharing or our affiliated companies' use of personal information, you and any joint account holder(s) may not receive information about our affiliated companies' products and services, including products or services that could help you manage your financial resources and achieve your investment objectives.
If you have more than one account or relationship with us, please specify the accounts to which you would like us to apply your privacy choices. If you have accounts or relationships with our affiliates, you may receive multiple privacy policies from them, and will need to separately notify those companies of your privacy choices for those accounts or relationships.
7. WHAT IF AN AFFILIATED COMPANY BECOMES A NONAFFILIATED THIRD PARTY?
If, at any time in the future, an affiliated company becomes a nonaffiliated third party, further disclosures of personal information made to the former affiliated company will be limited to those described in Section 2(b) above relating to nonaffiliated third parties. If you elected under Section 6 to limit disclosures we make to affiliated companies, or use of personal information by affiliated companies, your election will not apply to use by any former affiliated company of your personal information in their possession once it becomes a nonaffiliated third party.
SPECIAL NOTICE TO RESIDENTS OF VERMONT
The following section supplements our Policy with respect to our individual clients who have a Vermont address and supersedes anything to the contrary in the above Policy with respect to those clients only.
The State of Vermont requires financial institutions to obtain your consent prior to sharing personal information that they collect about you with nonaffiliated third parties, or eligibility information with affiliated companies, other than in certain limited circumstances. Except as permitted by law, we will not share personal information we collect about you with nonaffiliated third parties or eligibility information with affiliated companies, unless you provide us with your written consent to share such information.
SPECIAL NOTICE TO RESIDENTS OF CALIFORNIA
The following section supplements our Policy with respect to our individual clients who have a California address and supersedes anything to the contrary in the above Policy with respect to those clients only.
In response to a California law, if your account has a California home address, your personal information will not be disclosed to nonaffiliated third parties except as permitted by applicable California law, and we will limit sharing such personal information with our affiliates to comply with California privacy laws that apply to us.
27
Morgan Stanley Institutional Fund, Inc.
Annual Report — December 31, 2013
Director and Officer Information (unaudited)
Independent Directors:
Name, Age and Address of
Independent Director | | Position(s)
Held with
Registrant | | Length of Time
Served* | | Principal Occupation(s) During Past 5 Years | | Number of
Portfolios in
Fund Complex
Overseen by
Independent
Director** | | Other Directorships
Held by Independent
Director*** | |
Frank L. Bowman (69)
c/o Kramer Levin Naftalis &
Frankel LLP
Counsel to the Independent
Directors
1177 Avenue of the Americas
New York, NY 10036 | | Director | | Since
August
2006 | | President, Strategic Decisions, LLC (consulting) (since February 2009); Director or Trustee of various Morgan Stanley Funds (since August 2006); Chairperson of the Insurance Sub-Committee of the Compliance and Insurance Committee (since February 2007); served as President and Chief Executive Officer of the Nuclear Energy Institute (policy organization) (February 2005-November 2008); retired as Admiral, U.S. Navy after serving over 38 years on active duty including 8 years as Director of the Naval Nuclear Propulsion Program in the Department of the Navy and the U.S. Department of Energy (1996-2004); served as Chief of Naval Personnel (July 1994-September 1996); and on the Joint Staff as Director of Political Military Affairs (June 1992-July 1994); knighted as Honorary Knight Commander of the Most Excellent Order of the British Empire; awarded the Officier de l'Orde National du Mérite by the French Government; elected to the National Academy of Engineering (2009). | | | 98 | | | Director of BP p.l.c.; Director of Naval and Nuclear Technologies LLP; Director of the Armed Services YMCA of the USA and the U.S. Naval Submarine League; Director of the American Shipbuilding Suppliers Association; Member of the National Security Advisory Council of the Center for U.S. Global Engagement and a member of the CNA Military Advisory Board; Chairman of the charity J Street Cup Golf; Trustee of Fairhaven United Methodist Church. | |
Michael Bozic (73)
c/o Kramer Levin Naftalis & Frankel LLP
Counsel to the Independent Directors
1177 Avenue of the Americas New York, NY 10036 | | Director | | Since
April
1994 | | Private investor and a member of the advisory board of American Road Group LLC (retail) (since June 2000); Chairperson of the Compliance and Insurance Committee (since October 2006); Director or Trustee of various Morgan Stanley Funds (since April 1994); formerly, Chairperson of the Insurance Committee (July 2006-September 2006); Vice Chairman of Kmart Corporation (December 1998-October 2000); Chairman and Chief Executive Officer of Levitz Furniture Corporation (November 1995-November 1998) and President and Chief Executive Officer of Hills Department Stores (May 1991-July 1995); variously Chairman, Chief Executive Officer, President and Chief Operating Officer (1987-1991) of the Sears Merchandise Group of Sears, Roebuck & Co. | | | 100 | | | Trustee and member of the Hillsdale College Board of Trustees. | |
Kathleen A. Dennis (60)
c/o Kramer Levin Naftalis & Frankel LLP
Counsel to the Independent Directors
1177 Avenue of the Americas New York, NY 10036 | | Director | | Since
August
2006 | | President, Cedarwood Associates (mutual fund and investment management consulting) (since July 2006); Chairperson of the Money Market and Alternatives Sub-Committee of the Investment Committee (since October 2006) and Director or Trustee of various Morgan Stanley Funds (since August 2006); formerly, Senior Managing Director of Victory Capital Management (1993-2006). | | | 98 | | | Director of various non-profit organizations. | |
Dr. Manuel H. Johnson (65)
c/o Johnson Smick
International, Inc.
220 I Street, NE-Suite 200
Washington, D.C. 20002 | | Director | | Since
July
1991 | | Senior Partner, Johnson Smick International, Inc. (consulting firm); Chairperson of the Investment Committee (since October 2006) and Director or Trustee of various Morgan Stanley Funds (since July 1991); Co-Chairman and a founder of the Group of Seven Council (G7C) (international economic commission); formerly, Chairperson of the Audit Committee (July 1991-September 2006), Vice Chairman of the Board of Governors of the Federal Reserve System and Assistant Secretary of the U.S. Treasury. | | | 101 | | | Director of NVR, Inc. (home construction). | |
28
Morgan Stanley Institutional Fund, Inc.
Annual Report — December 31, 2013
Director and Officer Information (unaudited) (cont'd)
Independent Directors: (cont'd)
Name, Age and Address of
Independent Director | | Position(s)
Held with
Registrant | | Length of Time
Served* | | Principal Occupation(s) During Past 5 Years | | Number of
Portfolios in
Fund Complex
Overseen by
Independent
Director** | | Other Directorships
Held by Independent
Director*** | |
Joseph J. Kearns (71)
c/o Kearns & Associates LLC PMB754
22631 Pacific Coast Highway
Malibu, CA 90265 | | Director | | Since
August
1994 | | President, Kearns & Associates LLC (investment consulting); Chairperson of the Audit Committee (since October 2006) and Director or Trustee of various Morgan Stanley Funds (since August 1994); formerly, Deputy Chairperson of the Audit Committee (July 2003-September 2006) and Chairperson of the Audit Committee of various Morgan Stanley Funds (since August 1994); CFO of the J. Paul Getty Trust. | | | 101 | | | Director of Electro Rent Corporation (equipment leasing) and The Ford Family Foundation. | |
Michael F. Klein (55)
c/o Kramer Levin Naftalis & Frankel LLP
Counsel to the Independent Directors
1177 Avenue of the Americas New York, NY 10036 | | Director | | Since
August
2006 | | Managing Director, Aetos Capital, LLC (since March 2000); Co-President, Aetos Alternatives Management, LLC (since January 2004) and Co-Chief Executive Officer of Aetos Capital LLC (since August 2013); Chairperson of the Fixed Income Sub-Committee of the Investment Committee (since October 2006) and Director or Trustee of various Morgan Stanley Funds (since August 2006); formerly, Managing Director, Morgan Stanley & Co. Inc. and Morgan Stanley Dean Witter Investment Management, President, various Morgan Stanley Funds (June 1998-March 2000) and Principal, Morgan Stanley & Co. Inc. and Morgan Stanley Dean Witter Investment Management (August 1997-December 1999). | | | 98 | | | Director of certain investment funds managed or sponsored by Aetos Capital, LLC. Director of Sanitized AG and Sanitized Marketing AG (specialty chemicals). | |
Michael E. Nugent (77)
522 Fifth Avenue
New York, NY 10036 | | Chairperson
of the
Board and Director | | Chairperson of the Boards since July 2006 and Director since July 1991 | | Chairperson of the Boards of various Morgan Stanley Funds (since July 2006); Chairperson of the Closed-End Fund Committee (since June 2012) and Director or Trustee of various Morgan Stanley Funds (since July 1991); formerly, Chairperson of the Insurance Committee (until July 2006); General Partner, Triumph Capital, L.P. (private investment partnership) (1988-2013). | | | 100 | | | None. | |
W. Allen Reed (66)
c/o Kramer Levin Naftalis & Frankel LLP
Counsel to the Independent Directors
1177 Avenue of the Americas New York, NY 10036 | | Director | | Since
August
2006 | | Chairperson of the Equity Sub-Committee of the Investment Committee (since October 2006) and Director or Trustee of various Morgan Stanley Funds (since August 2006); formerly, President and CEO of General Motors Asset Management; Chairman and Chief Executive Officer of the GM Trust Bank and Corporate Vice President of General Motors Corporation (August 1994-December 2005). | | | 98 | | | Director of Temple-Inland Industries (packaging and forest products); Director of Legg Mason, Inc. and Director of the Auburn University Foundation. | |
Fergus Reid (81)
c/o Joe Pietryka, Inc.
85 Charles Colman Blvd. Pawling, NY 12564 | | Director | | Since
June
1992 | | Chairman, Joe Pietryka, Inc.; Chairperson of the Governance Committee and Director or Trustee of various Morgan Stanley Funds (since June 1992). | | | 101 | | | Through December 31, 2012, Trustee and Director of certain Investment companies in the JPMorgan Fund Complex. | |
29
Morgan Stanley Institutional Fund, Inc.
Annual Report — December 31, 2013
Director and Officer Information (unaudited) (cont'd)
Interested Director:
Name, Age and Address of
Interested Director | | Position(s)
Held with
Registrant | | Length of
Time Served* | | Principal Occupation(s) During Past 5 Years | | Number of
Portfolios in
Fund Complex
Overseen by
Interested
Director** | | Other Directorships
Held by Interested
Director*** | |
James F. Higgins (66)
One New York Plaza
New York, NY 10004 | | Director | | Since
June
2000 | | Director or Trustee of various Morgan Stanley Funds (since June 2000); Senior Advisor of Morgan Stanley (since August 2000). | | | 99 | | | Formerly, Director of AXA Financial, Inc. and AXA Equitable Life Insurance Company (2002-2011) and Director of AXA MONY Life Insurance Company and AXA MONY Life Insurance Company of America (2004-2011). | |
* Each Director serves an indefinite term, until his or her successor is elected.
** The Fund Complex includes (as of December 31, 2013) all open-end and closed-end funds (including all of their portfolios) advised by Morgan Stanley Investment Management Inc. (the "Adviser") and any funds that have an adviser that is an affiliated person of the Adviser (including, but not limited to, Morgan Stanley AIP GP LP).
*** This includes any directorships at public companies and registered investment companies held by the Director at any time during the past five years.
30
Morgan Stanley Institutional Fund, Inc.
Annual Report — December 31, 2013
Director and Officer Information (unaudited) (cont'd)
Executive Officers:
Name, Age and Address of Executive Officer | | Position(s) Held
with
Registrant | | Length of
Time Served* | | Principal Occupation(s) During Past 5 Years | |
John H. Gernon (50)
522 Fifth Avenue
New York, NY 10036 | | President and Principal Executive Officer—Equity, Fixed Income and AIP Funds | | Since
September
2013 | | President and Principal Executive Officer of the Equity and Fixed Income Funds and the Morgan Stanley AIP Funds (since September 2013) in the Fund Complex. Managing Director of the Adviser. | |
Stefanie V. Chang Yu (47)
522 Fifth Avenue
New York, NY 10036 | | Chief Compliance Officer | | Since
January
2014 | | Managing Director of the Adviser and various entities affiliated with the Adviser; Chief Compliance Officer of various Morgan Stanley Funds and the Adviser (since January 2014). Formerly, Vice President of various Morgan Stanley Funds (December 1997-January 2014). | |
Joseph C. Benedetti (48)
522 Fifth Avenue
New York, NY 10036 | | Vice President | | Since
January
2014 | | Managing Director of the Adviser and various entities affiliated with the Adviser; Vice President of various Morgan Stanley Funds (since January 2014). Formerly, Assistant Secretary of various Morgan Stanley Funds (October 2004-January 2014). | |
Francis J. Smith (48)
522 Fifth Avenue
New York, NY 10036 | | Treasurer and Principal Financial Officer | | Treasurer since July 2003 and Principal Financial Officer since September 2002 | | Executive Director of the Adviser and various entities affiliated with the Adviser; Treasurer and Principal Financial Officer of various Morgan Stanley Funds (since July 2003). | |
Mary E. Mullin (46)
522 Fifth Avenue
New York, NY 10036 | | Secretary | | Since
June
1999 | | Executive Director of the Adviser and various entities affiliated with the Adviser; Secretary of various Morgan Stanley Funds (since June 1999). | |
* Each officer serves an indefinite term, until his or her successor is elected.
31
Morgan Stanley Institutional Fund, Inc.
Annual Report — December 31, 2013
Adviser and Administrator
Morgan Stanley Investment Management Inc.
522 Fifth Avenue
New York, New York 10036
Sub-Advisers
Morgan Stanley Investment Management Limited
25 Cabot Square, Canary Wharf
London, E14 4QA, England
Morgan Stanley Investment Management Company
23 Church Street
16-01 Capital Square 049481 Singapore
Distributor
Morgan Stanley Distribution, Inc.
522 Fifth Avenue
New York, New York 10036
Dividend Disbursing and Transfer Agent
Boston Financial Data Services, Inc.
2000 Crown Colony Drive
Quincy, Massachusetts 02169
Custodian
State Street Bank and Trust Company
One Lincoln Street
Boston, Massachusetts 02111
Legal Counsel
Dechert LLP
1095 Avenue of the Americas
New York, New York 10036
Counsel to the Independent Directors
Kramer Levin Naftalis & Frankel LLP
1177 Avenue of the Americas
New York, New York 10036
Independent Registered Public Accounting Firm
Ernst & Young LLP
200 Clarendon Street
Boston, Massachusetts 02116
Reporting to Shareholders
Each Morgan Stanley fund provides a complete schedule of portfolio holdings in its semi-annual and annual reports within 60 days of the end of the fund's second and fourth fiscal quarters by filing the schedule electronically with the Securities and Exchange Commission (SEC). The semi-annual reports are filed on Form N-CSRS and the annual reports are filed on Form N-CSR. Morgan Stanley also delivers the semi-annual and annual reports to fund shareholders and makes these reports available on its public website, www.morganstanley.com/im. Each Morgan Stanley fund also files a complete schedule of portfolio holdings with the SEC for the fund's first and third fiscal quarters on Form N-Q. Morgan Stanley does not deliver the reports for the first and third fiscal quarters to shareholders, nor are the reports posted to the Morgan Stanley public website. You may, however, obtain the Form N-Q filings (as well as the Form N-CSR and N-CSRS filings) by accessing the SEC's website, www.sec.gov. You may also review and copy them at the SEC's Public Reference Room in Washington, DC. Information on the operation of the SEC's Public Reference Room may be obtained by calling the SEC toll free at 1 (800) SEC-0330. You can also request copies of these materials, upon payment of a duplicating fee, by electronic request at the SEC's email address (publicinfo@sec.gov) or by writing the Public Reference Room of the SEC, Washington, DC 20549-0102.
Proxy Voting Policies and Procedures and Proxy Voting Record
You may obtain a copy of the Fund's Proxy Voting Policy and Procedures and information regarding how the Fund voted proxies relating to portfolio securities during the most recent twelve-month period ended June 30, without charge, upon request, by calling toll free 1 (800) 548-7786 or by visiting our website at www.morganstanley.com/im. This information is also available on the SEC's website at www.sec.gov.
This report is authorized for distribution only when preceded or accompanied by a prospectus of the Morgan Stanley Institutional Fund, Inc. which describes in detail each Investment Portfolio's investment policies, risks, fees and expenses. Please read the prospectus carefully before you invest or send money. For additional information, including information regarding the investments comprising the Portfolio, please visit our website at www.morganstanley.com/im or call toll free 1 (800) 548-7786.
32
(This Page has been left blank intentionally.)
Printed in U.S.A.
This Report has been prepared for shareholders and may be distributed to others only if preceded or accompanied by a current prospectus.
Morgan Stanley Investment Management Inc.
522 Fifth Avenue
New York, New York 10036
© 2014 Morgan Stanley. Morgan Stanley Distribution, Inc.

IFIGQANN
809478 EXP 2.28.15
Item 2. Code of Ethics.
(a) The Fund has adopted a code of ethics (the “Code of Ethics”) that applies to its principal executive officer, principal financial officer, principal accounting officer or controller, or persons performing similar functions, regardless of whether these individuals are employed by the Fund or a third party.
(b) No information need be disclosed pursuant to this paragraph.
(c) Not applicable.
(d) Not applicable.
(e) Not applicable.
(f)
(1) The Fund’s Code of Ethics is attached hereto as Exhibit 12 A.
(2) Not applicable.
(3) Not applicable.
Item 3. Audit Committee Financial Expert.
The Fund’s Board of Trustees has determined that Joseph J. Kearns, an “independent” Trustee, is an “audit committee financial expert” serving on its audit committee. Under applicable securities laws, a person who is determined to be an audit committee financial expert will not be deemed an “expert” for any purpose, including without limitation for the purposes of Section 11 of the Securities Act of 1933, as a result of being designated or identified as an audit committee financial expert. The designation or identification of a person as an audit committee financial expert does not impose on such person any duties, obligations, or liabilities that are greater than the duties, obligations, and liabilities imposed on such person as a member of the audit committee and Board of Trustees in the absence of such designation or identification
Item 4. Principal Accountant Fees and Services.
(a)(b)(c)(d) and (g). Based on fees billed for the periods shown:
2013
| | Registrant | | Covered Entities(1) | |
Audit Fees | | $ | 1,012,742 | | N/A | |
| | | | | |
Non-Audit Fees | | | | | |
Audit-Related Fees | | $ | — | (2) | $ | | (2) |
Tax Fees | | $ | 103,801 | (3) | $ | 7,772,493 | (4) |
All Other Fees | | $ | | | $ | 101,000 | (5) |
Total Non-Audit Fees | | $ | 103,801 | | $ | 7,873,493 | |
| | | | | |
Total | | $ | 1,116,543 | | $ | 7,873,493 | |
2012
| | Registrant | | Covered Entities(1) | |
Audit Fees | | $ | 904,490 | | N/A | |
| | | | | |
Non-Audit Fees | | | | | |
Audit-Related Fees | | $ | | (2) | $ | | (2) |
Tax Fees | | $ | 83,850 | (3) | $ | 3,789,467 | (4) |
All Other Fees | | $ | | | $ | 723,998 | (5) |
Total Non-Audit Fees | | $ | 83,850 | | $ | 4,513,465 | |
| | | | | |
Total | | $ | 988,340 | | $ | 4,513,465 | |
N/A- Not applicable, as not required by Item 4.
(1) Covered Entities include the Adviser (excluding sub-advisors) and any entity controlling, controlled by or under common control with the Adviser that provides ongoing services to the Registrant.
(2) Audit-Related Fees represent assurance and related services provided that are reasonably related to the performance of the audit of the financial statements of the Covered Entities’ and funds advised by the Adviser or its affiliates, specifically data verification and agreed-upon procedures related to asset securitizations and agreed-upon procedures engagements.
(3) Tax Fees represent tax compliance, tax planning and tax advice services provided in connection with the preparation and review of the Registrant’s tax returns.
(4) Tax Fees represent tax compliance, tax planning and tax advice services provided in connection with the review of Covered Entities’ tax returns.
(5) All other fees represent project management for future business applications and improving business and operational processes.
(e)(1) The audit committee’s pre-approval policies and procedures are as follows:
APPENDIX A
AUDIT COMMITTEE
AUDIT AND NON-AUDIT SERVICES
PRE-APPROVAL POLICY AND PROCEDURES
OF THE
MORGAN STANLEY RETAIL AND INSTITUTIONAL FUNDS
AS ADOPTED AND AMENDED JULY 23, 2004,(1)
1. Statement of Principles
The Audit Committee of the Board is required to review and, in its sole discretion, pre-approve all Covered Services to be provided by the Independent Auditors to the Fund and Covered Entities in order to assure that services performed by the Independent Auditors do not impair the auditor’s independence from the Fund.
The SEC has issued rules specifying the types of services that an independent auditor may not provide to its audit client, as well as the audit committee’s administration of the engagement of the independent auditor. The SEC’s rules establish two different approaches to pre-approving services, which the SEC considers to be equally valid. Proposed services either: may be pre-approved without consideration of specific case-by-case services by the Audit Committee (“general pre-approval”); or require the specific pre-approval of the Audit Committee or its delegate (“specific pre-approval”). The Audit Committee believes that the combination of these two approaches in this Policy will result in an effective and efficient procedure to pre-approve services performed by the Independent Auditors. As set forth in this Policy, unless a type of service has received general pre-approval, it will require specific pre-approval by the Audit Committee (or by any member of the Audit Committee to which pre-approval authority has been delegated) if it is to be provided by the Independent Auditors. Any proposed services exceeding pre-approved cost levels or budgeted amounts will also require specific pre-approval by the Audit Committee.
The appendices to this Policy describe the Audit, Audit-related, Tax and All Other services that have the general pre-approval of the Audit Committee. The term of any general pre-approval is 12 months from the date of pre-approval, unless the Audit Committee considers and provides a different period and states otherwise. The Audit Committee will annually review and pre-approve the services that may be provided by the Independent Auditors without obtaining specific pre-approval from the Audit Committee. The Audit Committee will add to or subtract from the list of general pre-approved services from time to time, based on subsequent determinations.
(1) This Audit Committee Audit and Non-Audit Services Pre-Approval Policy and Procedures (the “Policy”), adopted as of the date above, supersedes and replaces all prior versions that may have been adopted from time to time.
The purpose of this Policy is to set forth the policy and procedures by which the Audit Committee intends to fulfill its responsibilities. It does not delegate the Audit Committee’s responsibilities to pre-approve services performed by the Independent Auditors to management.
The Fund’s Independent Auditors have reviewed this Policy and believes that implementation of the Policy will not adversely affect the Independent Auditors’ independence.
2. Delegation
As provided in the Act and the SEC’s rules, the Audit Committee may delegate either type of pre-approval authority to one or more of its members. The member to whom such authority is delegated must report, for informational purposes only, any pre-approval decisions to the Audit Committee at its next scheduled meeting.
3. Audit Services
The annual Audit services engagement terms and fees are subject to the specific pre-approval of the Audit Committee. Audit services include the annual financial statement audit and other procedures required to be performed by the Independent Auditors to be able to form an opinion on the Fund’s financial statements. These other procedures include information systems and procedural reviews and testing performed in order to understand and place reliance on the systems of internal control, and consultations relating to the audit. The Audit Committee will approve, if necessary, any changes in terms, conditions and fees resulting from changes in audit scope, Fund structure or other items.
In addition to the annual Audit services engagement approved by the Audit Committee, the Audit Committee may grant general pre-approval to other Audit services, which are those services that only the Independent Auditors reasonably can provide. Other Audit services may include statutory audits and services associated with SEC registration statements (on Forms N-1A, N-2, N-3, N-4, etc.), periodic reports and other documents filed with the SEC or other documents issued in connection with securities offerings.
The Audit Committee has pre-approved the Audit services in Appendix B.1. All other Audit services not listed in Appendix B.1 must be specifically pre-approved by the Audit Committee (or by any member of the Audit Committee to which pre-approval has been delegated).
4. Audit-related Services
Audit-related services are assurance and related services that are reasonably related to the performance of the audit or review of the Fund’s financial statements and, to the extent they are Covered Services, the Covered Entities or that are traditionally performed by the Independent Auditors. Because the Audit Committee believes that the provision of Audit-related services does not impair the independence of the auditor and is consistent with the SEC’s rules on auditor independence, the Audit Committee may grant general pre-approval to Audit-related services. Audit-related services include, among others, accounting consultations related to accounting, financial reporting or disclosure matters
not classified as “Audit services”; assistance with understanding and implementing new accounting and financial reporting guidance from rulemaking authorities; agreed-upon or expanded audit procedures related to accounting and/or billing records required to respond to or comply with financial, accounting or regulatory reporting matters; and assistance with internal control reporting requirements under Forms N-SAR and/or N-CSR.
The Audit Committee has pre-approved the Audit-related services in Appendix B.2. All other Audit-related services not listed in Appendix B.2 must be specifically pre-approved by the Audit Committee (or by any member of the Audit Committee to which pre-approval has been delegated).
5. Tax Services
The Audit Committee believes that the Independent Auditors can provide Tax services to the Fund and, to the extent they are Covered Services, the Covered Entities, such as tax compliance, tax planning and tax advice without impairing the auditor’s independence, and the SEC has stated that the Independent Auditors may provide such services.
Pursuant to the preceding paragraph, the Audit Committee has pre-approved the Tax Services in Appendix B.3. All Tax services in Appendix B.3 must be specifically pre-approved by the Audit Committee (or by any member of the Audit Committee to which pre-approval has been delegated).
6. All Other Services
The Audit Committee believes, based on the SEC’s rules prohibiting the Independent Auditors from providing specific non-audit services, that other types of non-audit services are permitted. Accordingly, the Audit Committee believes it may grant general pre-approval to those permissible non-audit services classified as All Other services that it believes are routine and recurring services, would not impair the independence of the auditor and are consistent with the SEC’s rules on auditor independence.
The Audit Committee has pre-approved the All Other services in Appendix B.4. Permissible All Other services not listed in Appendix B.4 must be specifically pre-approved by the Audit Committee (or by any member of the Audit Committee to which pre-approval has been delegated).
7. Pre-Approval Fee Levels or Budgeted Amounts
Pre-approval fee levels or budgeted amounts for all services to be provided by the Independent Auditors will be established annually by the Audit Committee. Any proposed services exceeding these levels or amounts will require specific pre-approval by the Audit Committee. The Audit Committee is mindful of the overall relationship of fees for audit and non-audit services in determining whether to pre-approve any such services.
8. Procedures
All requests or applications for services to be provided by the Independent Auditors that do not require specific approval by the Audit Committee will be submitted to the Fund’s Chief Financial Officer and must include a detailed description of the services to be
rendered. The Fund’s Chief Financial Officer will determine whether such services are included within the list of services that have received the general pre-approval of the Audit Committee. The Audit Committee will be informed on a timely basis of any such services rendered by the Independent Auditors. Requests or applications to provide services that require specific approval by the Audit Committee will be submitted to the Audit Committee by both the Independent Auditors and the Fund’s Chief Financial Officer, and must include a joint statement as to whether, in their view, the request or application is consistent with the SEC’s rules on auditor independence.
The Audit Committee has designated the Fund’s Chief Financial Officer to monitor the performance of all services provided by the Independent Auditors and to determine whether such services are in compliance with this Policy. The Fund’s Chief Financial Officer will report to the Audit Committee on a periodic basis on the results of its monitoring. Both the Fund’s Chief Financial Officer and management will immediately report to the chairman of the Audit Committee any breach of this Policy that comes to the attention of the Fund’s Chief Financial Officer or any member of management.
9. Additional Requirements
The Audit Committee has determined to take additional measures on an annual basis to meet its responsibility to oversee the work of the Independent Auditors and to assure the auditor’s independence from the Fund, such as reviewing a formal written statement from the Independent Auditors delineating all relationships between the Independent Auditors and the Fund, consistent with Independence Standards Board No. 1, and discussing with the Independent Auditors its methods and procedures for ensuring independence.
10. Covered Entities
Covered Entities include the Fund’s investment adviser(s) and any entity controlling, controlled by or under common control with the Fund’s investment adviser(s) that provides ongoing services to the Fund(s). Beginning with non-audit service contracts entered into on or after May 6, 2003, the Fund’s audit committee must pre-approve non-audit services provided not only to the Fund but also to the Covered Entities if the engagements relate directly to the operations and financial reporting of the Fund. This list of Covered Entities would include:
Morgan Stanley Retail Funds
Morgan Stanley Investment Advisors Inc.
Morgan Stanley & Co. Incorporated
Morgan Stanley DW Inc.
Morgan Stanley Investment Management Inc.
Morgan Stanley Investment Management Limited
Morgan Stanley Investment Management Private Limited
Morgan Stanley Asset & Investment Trust Management Co., Limited
Morgan Stanley Investment Management Company
Morgan Stanley Services Company, Inc.
Morgan Stanley Distributors Inc.
Morgan Stanley Trust FSB
Morgan Stanley Institutional Funds
Morgan Stanley Investment Management Inc.
Morgan Stanley Investment Advisors Inc.
Morgan Stanley Investment Management Limited
Morgan Stanley Investment Management Private Limited
Morgan Stanley Asset & Investment Trust Management Co., Limited
Morgan Stanley Investment Management Company
Morgan Stanley & Co. Incorporated
Morgan Stanley Distribution, Inc.
Morgan Stanley AIP GP LP
Morgan Stanley Alternative Investment Partners LP
(e)(2) Beginning with non-audit service contracts entered into on or after May 6, 2003, the audit committee also is required to pre-approve services to Covered Entities to the extent that the services are determined to have a direct impact on the operations or financial reporting of the Registrant. 100% of such services were pre-approved by the audit committee pursuant to the Audit Committee’s pre-approval policies and procedures (attached hereto).
(f) Not applicable.
(g) See table above.
(h) The audit committee of the Board of Trustees has considered whether the provision of services other than audit services performed by the auditors to the Registrant and Covered Entities is compatible with maintaining the auditors’ independence in performing audit services.
Item 5. Audit Committee of Listed Registrants.
(a) The Fund has a separately-designated standing audit committee established in accordance with Section 3(a)(58)(A) of the Exchange Act whose members are:
Joseph Kearns, Michael Nugent and Allen Reed.
(b) Not applicable.
Item 6. Schedule of Investments
(a) Refer to Item 1.
(b) Not applicable.
Item 7. Disclosure of Proxy Voting Policies and Procedures for Closed-End Management Investment Companies.
Applicable only to reports filed by closed-end funds.
Item 8. Portfolio Managers of Closed-End Management Investment Companies
Applicable only to reports filed by closed-end funds.
Item 9. Closed-End Fund Repurchases
Applicable only to reports filed by closed-end funds.
Item 10. Submission of Matters to a Vote of Security Holders
Not applicable.
Item 11. Controls and Procedures
(a) The Fund’s principal executive officer and principal financial officer have concluded that the Fund’s disclosure controls and procedures are sufficient to ensure that information required to be disclosed by the Fund in this Form N-CSR was recorded, processed, summarized and reported within the time periods specified in the Securities and Exchange Commission’s rules and forms, based upon such officers’ evaluation of these controls and procedures as of a date within 90 days of the filing date of the report.
(b) There were no changes in the registrant’s internal control over financial reporting that occurred during the second fiscal quarter of the period covered by this report that has materially affected, or is reasonably likely to materially affect, the registrant’s internal control over financial reporting.
Item 12. Exhibits
(a) The Code of Ethics for Principal Executive and Senior Financial Officers is attached hereto.
(b) A separate certification for each principal executive officer and principal financial officer of the registrant are attached hereto as part of EX-99.CERT.
SIGNATURES
Pursuant to the requirements of the Securities Exchange Act of 1934 and the Investment Company Act of 1940, the registrant has duly caused this report to be signed on its behalf by the undersigned, thereunto duly authorized.
Morgan Stanley Institutional Fund, Inc | |
| |
/s/ John H. Gernon | |
John H. Gernon | |
Principal Executive Officer | |
February 19, 2014 | |
Pursuant to the requirements of the Securities Exchange Act of 1934 and the Investment Company Act of 1940, this report has been signed by the following persons on behalf of the registrant and in the capacities and on the dates indicated.
/s/ John H, Gernon | |
John H. Gernon | |
Principal Executive Officer | |
February 19, 2014 | |
| |
/s/ Francis Smith | |
Francis Smith | |
Principal Financial Officer | |
February 19, 2014 | |