UNITED STATES
SECURITIES AND EXCHANGE COMMISSION
Washington, D.C. 20549
FORM N-CSR
CERTIFIED SHAREHOLDER REPORT OF REGISTERED
MANAGEMENT INVESTMENT COMPANIES
Investment Company Act file number | 811-05624 | |||||||
| ||||||||
Morgan Stanley Institutional Fund, Inc. | ||||||||
(Exact name of registrant as specified in charter) | ||||||||
| ||||||||
522 Fifth Avenue, New York, New York |
| 10036 | ||||||
(Address of principal executive offices) |
| (Zip code) | ||||||
| ||||||||
John H. Gernon 522 Fifth Avenue, New York, New York 10036 | ||||||||
(Name and address of agent for service) | ||||||||
| ||||||||
Registrant’s telephone number, including area code: | 212-296-0289 |
| ||||||
| ||||||||
Date of fiscal year end: | December 31, |
| ||||||
| ||||||||
Date of reporting period: | December 31, 2015 |
| ||||||
Item 1 - Report to Shareholders
INVESTMENT MANAGEMENT

Morgan Stanley Institutional Fund, Inc.
Active International Allocation Portfolio
Annual Report
December 31, 2015

Morgan Stanley Institutional Fund, Inc.
Annual Report — December 31, 2015
Table of Contents
Shareholders' Letter | 2 | ||||||
Expense Example | 3 | ||||||
Investment Overview | 4 | ||||||
Portfolio of Investments | 7 | ||||||
Statement of Assets and Liabilities | 16 | ||||||
Statement of Operations | 18 | ||||||
Statements of Changes in Net Assets | 19 | ||||||
Financial Highlights | 21 | ||||||
Notes to Financial Statements | 25 | ||||||
Report of Independent Registered Public Accounting Firm | 36 | ||||||
Federal Tax Notice | 37 | ||||||
U.S. Privacy Policy | 38 | ||||||
Director and Officer Information | 41 | ||||||
This report is authorized for distribution only when preceded or accompanied by prospectuses of the Morgan Stanley Institutional Fund, Inc. To receive a prospectus and/or statement of additional information (SAI), which contains more complete information such as investment objectives, charges, expenses, policies for voting proxies, risk considerations, and describes in detail each of the Portfolio's investment policies to the prospective investor, please call toll free 1 (800) 548-7786. Please read the prospectuses carefully before you invest or send money.
Additionally, you can access portfolio information including performance, characteristics, and investment team commentary through Morgan Stanley Investment Management's website: www.morganstanley.com/im.
Market forecasts provided in this report may not necessarily come to pass. There is no guarantee that any sectors mentioned will continue to perform as discussed herein or that securities in such sectors will be held by the Portfolio in the future. There is no assurance that a Portfolio will achieve its investment objective. Portfolios are subject to market risk, which is the possibility that market values of securities owned by the Portfolio will decline and, therefore, the value of the Portfolio's shares may be less than what you paid for them. Accordingly, you can lose money investing in this Portfolio. Please see the prospectus for more complete information on investment risks.
1
Morgan Stanley Institutional Fund, Inc.
Annual Report — December 31, 2015
Shareholders' Letter (unaudited)
Dear Shareholders,
We are pleased to provide this Annual report, in which you will learn how your investment in Active International Allocation Portfolio (the "Portfolio") performed during the latest twelve-month period.
Morgan Stanley Investment Management is a client-centric, investor-led organization. Our global presence, intellectual capital, and breadth of products and services enable us to partner with investors to meet the evolving challenges of today's financial markets. We aim to deliver superior investment service and to empower our clients to make the informed decisions that help them reach their investment goals.
As always, we thank you for selecting Morgan Stanley Investment Management, and look forward to working with you in the months and years ahead.
Sincerely,

John H. Gernon
President and Principal Executive Officer
January 2016
2
Morgan Stanley Institutional Fund, Inc.
Annual Report — December 31, 2015
Expense Example (unaudited)
Active International Allocation Portfolio
As a shareholder of the Portfolio, you incur two types of costs: (1) transactional costs, including redemptions fees; and (2) ongoing costs, including advisory fees, administration fees, distribution and shareholder services fees and other Portfolio expenses. This example is intended to help you understand your ongoing costs (in dollars) of investing in the Portfolio and to compare these costs with the ongoing costs of investing in other mutual funds.
This example is based on an investment of $1,000 invested at the beginning of the six-month period ended December 31, 2015 and held for the entire six-month period.
Actual Expenses
The table below provides information about actual account values and actual expenses. You may use the information in this table, together with the amount you invested, to estimate the expenses that you paid over the period. Simply divide your account value by $1,000 (for example, an $8,600 account value divided by $1,000 = 8.6), then multiply the result by the number in the table under the heading entitled "Actual Expenses Paid During Period" to estimate the expenses you paid on your account during this period.
Hypothetical Example for Comparison Purposes
The table below provides information about hypothetical account values and hypothetical expenses based on the Portfolio's actual expense ratio and an assumed rate of return of 5% per year before expenses, which is not the Portfolio's actual return. The hypothetical account values and expenses may not be used to estimate the actual ending account balance or expenses you paid for the period. You may use this information to compare the ongoing costs of investing in the Portfolio and other funds. To do so, compare this 5% hypothetical example with the 5% hypothetical examples that appear in the shareholder reports of the other funds.
Please note that the expenses shown in the table are meant to highlight your ongoing costs only and do not reflect any transactional costs, such as sales charges (loads) and redemption fees. Therefore, the information for each class in the table is useful in comparing ongoing costs only, and will not help you determine the relative total costs of owning different funds. In addition, if these transactional costs were included, your costs would have been higher.
| Beginning Account Value 7/1/15 | Actual Ending Account Value 12/31/15 | Hypothetical Ending Account Value | Actual Expenses Paid During Period* | Hypothetical Expenses Paid During Period* | Net Expense Ratio During Period** | ||||||||||||||||||||||
Active International Allocation Portfolio Class I | $ | 1,000.00 | $ | 926.00 | $ | 1,020.52 | $ | 4.51 | $ | 4.74 | 0.93 | % | |||||||||||||||
Active International Allocation Portfolio Class A | 1,000.00 | 924.80 | 1,018.95 | 6.02 | 6.31 | 1.24 | |||||||||||||||||||||
Active International Allocation Portfolio Class L | 1,000.00 | 922.10 | 1,016.43 | 8.43 | 8.84 | 1.74 | |||||||||||||||||||||
Active International Allocation Portfolio Class C | 1,000.00 | 920.80 | 1,015.17 | 9.63 | 10.11 | 1.99 | |||||||||||||||||||||
* Expenses are calculated using each Portfolio Class' annualized net expense ratio (as disclosed), multiplied by the average account value over the period, and multiplied by 184/365 (to reflect the most recent one-half year period).
** Annualized.
3
Morgan Stanley Institutional Fund, Inc.
Annual Report — December 31, 2015
Investment Overview (unaudited)
Active International Allocation Portfolio
The Portfolio seeks long-term capital appreciation by investing primarily, in accordance with country and sector weightings determined by the Adviser, Morgan Stanley Investment Management Inc., in equity securities of non-U.S. issuers which, in the aggregate, replicate broad market indices.
Performance
For the year ended December 31, 2015, the Portfolio's Class I shares had a total return based on net asset value and reinvestment of distributions per share of –1.63%, net of fees. The Portfolio's Class I shares underperformed the Portfolio's benchmark, the MSCI EAFE Index (the "Index"), which returned –0.81%.
Factors Affecting Performance
• International equity markets in aggregate managed a flat return for the 12-month period overall, down –0.81% as measured by the Index. On a regional basis, Japan led decisively (+9.57%), followed by the U.S. (+0.69%) and euro area (–1.42%). Emerging markets were the weakest-performing group (–14.92%), and Pacific ex Japan (–8.47%) and the U.K. (–7.56%) also underperformed the Index. (Country and regional returns are represented by their respective MSCI index in U.S. dollar terms.)(1)
• The Portfolio's main contributors to performance for the period were the long position in Japan and underweight to Asia ex-Japan, as well as underweight allocations to the energy and materials sectors. The Portfolio's exposure to the eurozone, however, detracted. That said, the eurozone economy did improve as we expected; we believe equities could finally come through next year.
• The Portfolio utilizes stock index futures as an additional vehicle to implement the portfolio manager's macro investment decisions. For 2015, macro investment decisions made with the use of stock index futures resulted in a realized loss for the Portfolio.
Management Strategies
• In 2015, important global asset prices continued their 2014 trends: emerging market equities were weaker, the U.S. dollar (as represented by the DXY index) strengthened another +10% (versus +12% in
2014), oil fell another –25% (versus –50% in 2014) and the 10-year U.S. Treasury yield ended at 2.25%, not far from 2.12% in December 2014. Other than China-watching, investors spent a lot of time in 2015 waiting for the U.S. Federal Reserve (Fed), who in turn, was waiting for jobs and wage growth.
• Luckily, for most of the fourth quarter, global markets were calm enough and U.S. data was strong enough that the Fed was able to hike its target federal funds rate by 25 basis points in mid-December. This small step toward normalization of monetary policy ended almost a decade of near-zero interest rates and the hike was an important signal of Fed confidence in the U.S. economy. It felt momentous. That said, the key will be IF the Fed can proceed with subsequent hikes in 2016 and IF the European Central Bank (ECB), Bank of Japan (BOJ), and People's Bank of China (PBOC) can successfully de-synchronize their monetary policies from the Fed. It is helpful that the U.S. dollar has been range-bound for the past six months (although it continues to rise versus emerging market currencies) and that China (post its acceptance to International Monetary Fund reserve currency status) has more flexibility to (hopefully) gently devalue the yuan.
• Global equity markets continue to be very nervous about the specter of debt deflation in a low-growth world up to its eyeballs in credit, with significant pockets of excess capacity. The very monetary policy designed to reflate the developed market economies after the global financial crisis sent developed market investors in search of higher yields in U.S. energy and in emerging markets. Cheap money and Chinese stimulus spending (on a scale the world has never before seen) created an illusion of high future demand, which set in motion a credit boom in emerging markets. The piper is now being paid. Chinese growth inevitably slowed, and growth in developed economies remains anemic as deflating global goods prices weigh down corporate profits and wage growth. The emerging markets matter because they make up 35% of the global economy and they are significant (higher margin) customers of many large-cap companies listed on the major exchanges of Europe, Japan and the U.S. Hence, though the U.S. economy may finally be strong
4
Morgan Stanley Institutional Fund, Inc.
Annual Report — December 31, 2015
Investment Overview (unaudited) (cont'd)
Active International Allocation Portfolio
enough to sustain modest rate hikes, it is doing so in a world where pricing power is very weak — and, actually falling — in most globally facing industries.
• As noted, Fed Chair Janet Yellen was able to move forward in December because just enough data improved. First, U.S. jobs data and wages consistently delivered since August. Second, European economic surveys showed modest improvement and the euro strengthened (taking strain off the Fed from too strong of a U.S. dollar.) And third, belief in China's ability to gradually manage its economic slowdown and currency devaluation rose (versus the panic generated by the surprise yuan devaluation in August.)
• On the negative side, U.S. manufacturing growth, earnings and market breadth have been lackluster (U.S. manufacturing purchasing manager index is below 50, a sign of contraction), Europe's industrial production and credit impulse are sluggish, and continued declines in energy prices risk destabilizing global growth, credit and corporate earnings. As for China, pressures on corporates and local governments continue, given slow growth, falling producer prices and high debt levels. However, we know that the leadership is increasing the intensity of its policy measures, and there are some signs of stabilization. If China can stabilize its growth rate for another year (at whatever actual growth rate that happens to be) and if oil prices steady, we could foresee a 2016 with modest economic growth in the U.S., Europe and Japan, continued pressure on emerging markets, and unexciting, plus-or-minus single-digit equity market returns. In such a world, we believe equity market differentiation will be driven by the quality of monetary, fiscal and reform policy choices and by country/sector earnings.
• We ended the year mildly optimistic, but must admit that January's rout in energy prices and in global equity and credit markets make us wary. The key will be whether the U.S. achieves economic growth of at least 2.25% and whether China and falling commodity prices do not add too much more pressure onto global deflation. We do note that the U.S. government has approved modest fiscal spending, household savings are decent, wealth is broadening slightly and corporations have room to invest, if they so choose. One could make
similar observations about Japan, Germany and several other markets in Europe. Our gross domestic product (GDP) tracking models generally remain in line with consensus expectations for about 2.3% U.S. GDP growth in 2016, with 1.7% from the euro zone and 1.2% from Japan — and December's strong U.S. jobs number was encouraging.
(1) Data used in the preparation of this commentary from Morgan Stanley Investment Management, Bloomberg, FactSet and Global Insight, as of December 31, 2015.
* Minimum Investment for Class I shares
In accordance with SEC regulations, the Portfolio's performance shown assumes that all recurring fees (including management fees) were deducted and all dividends and distributions were reinvested. The performance of Class A, L and C shares will vary from the performance of Class I shares based upon their different inception dates and will be negatively impacted by additional fees assessed to those classes.
5
Morgan Stanley Institutional Fund, Inc.
Annual Report — December 31, 2015
Investment Overview (unaudited) (cont'd)
Active International Allocation Portfolio
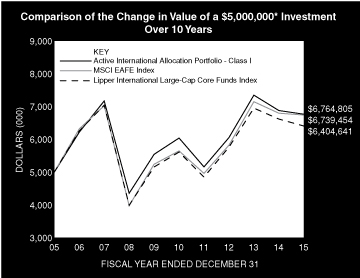
Performance Compared to the MSCI EAFE Index(1) and the Lipper International Large-Cap Core Funds Index(2)
| Period Ended December 31, 2015 Total Returns(3) | |||||||||||||||||||
Average Annual | |||||||||||||||||||
| One Year | Five Years | Ten Years | Since Inception(8) | ||||||||||||||||
| Portfolio — Class I Shares w/o sales charges(4) | –1.63 | % | 2.30 | % | 3.07 | % | 5.64 | % | |||||||||||
| Portfolio — Class A Shares w/o sales charges(5) | –1.95 | 2.00 | 2.78 | 4.81 | |||||||||||||||
| Portfolio — Class A Shares with maximum 5.25% sales charges(5) | –7.10 | 0.91 | 2.23 | 4.53 | |||||||||||||||
| Portfolio — Class L Shares w/o sales charges(6) | –2.44 | — | — | 7.55 | |||||||||||||||
| Portfolio — Class C Shares w/o sales charges(7) | — | — | — | –10.96 | |||||||||||||||
| Portfolio — Class C Shares with maximum 1.00% deferred sales charges(7) | — | — | — | –11.85 | |||||||||||||||
MSCI EAFE Index | –0.81 | 3.60 | 3.03 | 5.34 | |||||||||||||||
| Lipper International Large-Cap Core Funds Index | –3.21 | 2.68 | 2.51 | 6.13 | |||||||||||||||
Performance data quoted represents past performance, which is no guarantee of future results, and current performance may be lower or higher than the figures shown. Performance assumes that all dividends and distributions, if any, were reinvested. For the most recent month-end performance figures, please visit www.morganstanley.com/im. Investment return and principal value will fluctuate so that Portfolio shares, when redeemed, may be worth more or less than their original cost. Total returns do not reflect the deduction of taxes that a shareholder would pay on Portfolio distributions or the redemption of Portfolio shares. Returns for periods less than one year are not annualized. Performance of share classes will vary due to difference in sales charges and expenses.
(1) MSCI EAFE Index (Europe, Australasia, Far East) is a free float-adjusted market capitalization index that is designed to measure the international equity market performance of developed markets, excluding the United States & Canada. The term "free float" represents the portion of shares outstanding that are deemed to be available for purchase in the public equity markets by investors. The MSCI EAFE Index currently consists of 21 developed market country indices. The performance of the Index is listed in U.S. dollars and assumes reinvestment of net dividends. The Index is unmanaged and its returns do not include any sales charges or fees. Such costs would lower performance. It is not possible to invest directly in an index.
(2) The Lipper International Large-Cap Core Funds Index is an equally weighted performance index of the largest qualifying funds (based on net assets) in the Lipper International Large-Cap Core Funds classification. The Index, which is adjusted for capital gains distributions and income dividends, is unmanaged and should not be considered an investment. There are currently 30 funds represented in this Index. As of the date of this report, the Portfolio was in the Lipper International Large-Cap Core Funds classification.
(3) Total returns for the Portfolio reflect fees waived and expenses reimbursed, if applicable, by the Adviser. Without such waivers and reimbursements, total returns would have been lower.
(4) Commenced operations on January 17, 1992.
(5) Commenced offering on January 2, 1996.
(6) Commenced offering on June 14, 2012.
(7) Commenced offering on April 30, 2015.
(8) For comparative purposes, average annual since inception returns listed for the Indexes refer to the inception date of Class I of the Portfolio, not the inception of the Index.
6
Morgan Stanley Institutional Fund, Inc.
Annual Report — December 31, 2015
Portfolio of Investments
Active International Allocation Portfolio
Shares | Value (000) | ||||||||||
Common Stocks (93.9%) | |||||||||||
Australia (4.0%) | |||||||||||
AGL Energy Ltd. | 8,774 | $ | 115 | ||||||||
Amcor Ltd. | 23,075 | 224 | |||||||||
AMP Ltd. | 47,263 | 199 | |||||||||
APA Group | 11,931 | 75 | |||||||||
Asciano Ltd. | 15,083 | 96 | |||||||||
Aurizon Holding Ltd. | 26,241 | 83 | |||||||||
Australia & New Zealand Banking Group Ltd. (a) | 49,773 | 1,004 | |||||||||
BHP Billiton Ltd. | 37,167 | 483 | |||||||||
Brambles Ltd. | 24,794 | 207 | |||||||||
CIMIC Group Ltd. (a) | 2,100 | 37 | |||||||||
Coca-Cola Amatil Ltd. | 12,535 | 84 | |||||||||
Cochlear Ltd. | 878 | 61 | |||||||||
Commonwealth Bank of Australia | 23,468 | 1,450 | |||||||||
Crown Resorts Ltd. | 6,292 | 57 | |||||||||
CSL Ltd. | 7,916 | 604 | |||||||||
Fortescue Metals Group Ltd. (a) | 10,163 | 14 | |||||||||
Goodman Group REIT (a) | 29,504 | 134 | |||||||||
Harvey Norman Holdings Ltd. (a) | 11,416 | 34 | |||||||||
Iluka Resources Ltd. | 8,488 | 38 | |||||||||
Incitec Pivot Ltd. | 30,687 | 88 | |||||||||
Insurance Australia Group Ltd. | 34,176 | 137 | |||||||||
Lend Lease Group REIT | 5,544 | 57 | |||||||||
Macquarie Group Ltd. | 4,461 | 267 | |||||||||
National Australia Bank Ltd. | 38,236 | 834 | |||||||||
Orica Ltd. (a) | 6,737 | 75 | |||||||||
Origin Energy Ltd. | 17,169 | 58 | |||||||||
QBE Insurance Group Ltd. | 17,562 | 160 | |||||||||
Rio Tinto Ltd. | 5,226 | 169 | |||||||||
Santos Ltd. | 14,845 | 39 | |||||||||
Scentre Group REIT | 110,741 | 336 | |||||||||
Sonic Healthcare Ltd. | 7,143 | 93 | |||||||||
South32 Ltd. (b) | 42,717 | 33 | |||||||||
South32 Ltd. (a)(b) | 45,087 | 35 | |||||||||
Stockland REIT (a) | 88,627 | 263 | |||||||||
Suncorp Group Ltd. | 19,013 | 166 | |||||||||
Sydney Airport | 4,662 | 21 | |||||||||
Tabcorp Holdings Ltd. | 10,883 | 37 | |||||||||
Tatts Group Ltd. | 21,251 | 67 | |||||||||
Telstra Corp., Ltd. | 62,881 | 255 | |||||||||
Transurban Group | 20,448 | 155 | |||||||||
Wesfarmers Ltd. | 19,409 | 584 | |||||||||
Westfield Corp. REIT | 39,003 | 268 | |||||||||
Westpac Banking Corp. | 42,681 | 1,035 | |||||||||
Woodside Petroleum Ltd. | 9,855 | 207 | |||||||||
Woolworths Ltd. (a) | 24,176 | 428 | |||||||||
10,866 | |||||||||||
Austria (0.1%) | |||||||||||
Erste Group Bank AG (b) | 9,621 | 301 | |||||||||
Raiffeisen Bank International AG (b) | 958 | 14 | |||||||||
315 | |||||||||||
Shares | Value (000) | ||||||||||
Belgium (1.6%) | |||||||||||
Ageas | 1,655 | $ | 77 | ||||||||
Anheuser-Busch InBev N.V. | 17,046 | 2,105 | |||||||||
Groupe Bruxelles Lambert SA | 6,137 | 525 | |||||||||
KBC Groep N.V. | 11,720 | 733 | |||||||||
Proximus | 428 | 14 | |||||||||
Solvay SA (a) | 669 | 71 | |||||||||
Telenet Group Holding N.V. (b) | 2,238 | 121 | |||||||||
UCB SA | 3,566 | 321 | |||||||||
Umicore SA | 6,321 | 264 | |||||||||
4,231 | |||||||||||
Brazil (0.0%) | |||||||||||
Cia Energetica de Minas Gerais (Preference) | 1 | — | @ | ||||||||
Chile (0.0%) | |||||||||||
Antofagasta PLC (a) | 1,384 | 9 | |||||||||
China (0.1%) | |||||||||||
ASM Pacific Technology Ltd. (a)(c) | 2,600 | 20 | |||||||||
Sihuan Pharmaceutical Holdings Group Ltd. (d)(e) | 21,000 | 8 | |||||||||
Tencent Holdings Ltd. (c) | 15,900 | 310 | |||||||||
WH Group Ltd. (b)(c)(f) | 64,000 | 36 | |||||||||
Wynn Macau Ltd. (a)(c) | 17,200 | 20 | |||||||||
394 | |||||||||||
Denmark (2.1%) | |||||||||||
AP Moeller — Maersk A/S Series A | 129 | 166 | |||||||||
AP Moeller — Maersk A/S Series B | 571 | 741 | |||||||||
Danske Bank A/S | 17,828 | 476 | |||||||||
DSV A/S | 16,408 | 645 | |||||||||
ISS A/S | 4,182 | 151 | |||||||||
Novo Nordisk A/S Series B | 55,388 | 3,184 | |||||||||
Novozymes A/S Series B | 4,224 | 202 | |||||||||
TDC A/S | 9,964 | 49 | |||||||||
5,614 | |||||||||||
Finland (1.3%) | |||||||||||
Elisa Oyj | 4,656 | 175 | |||||||||
Kone Oyj, Class B | 8,651 | 364 | |||||||||
Metso Oyj (a) | 2,666 | 59 | |||||||||
Neste Oyj | 3,991 | 119 | |||||||||
Nokia Oyj | 170,824 | 1,216 | |||||||||
Orion Oyj, Class B | 2,798 | 97 | |||||||||
Sampo Oyj, Class A | 11,110 | 563 | |||||||||
Stora Enso Oyj, Class R | 26,594 | 239 | |||||||||
UPM-Kymmene Oyj | 22,910 | 424 | |||||||||
Wartsila Oyj | 4,960 | 225 | |||||||||
3,481 | |||||||||||
France (10.6%) | |||||||||||
Accor SA | 8,311 | 358 | |||||||||
Aeroports de Paris (ADP) | 1,796 | 208 | |||||||||
Air Liquide SA | 4,638 | 521 | |||||||||
Airbus Group SE | 15,221 | 1,022 | |||||||||
Alcatel-Lucent (b) | 117,672 | 465 | |||||||||
Alstom SA (a)(b) | 5,847 | 179 | |||||||||
The accompanying notes are an integral part of the financial statements.
7
Morgan Stanley Institutional Fund, Inc.
Annual Report — December 31, 2015
Portfolio of Investments (cont'd)
Active International Allocation Portfolio
Shares | Value (000) | ||||||||||
France (cont'd) | |||||||||||
Atos SE | 3,414 | $ | 287 | ||||||||
AXA SA | 36,341 | 994 | |||||||||
BNP Paribas SA | 35,737 | 2,023 | |||||||||
Bouygues SA | 7,702 | 305 | |||||||||
Cap Gemini SA | 5,776 | 534 | |||||||||
Carrefour SA | 15,251 | 439 | |||||||||
Casino Guichard Perrachon SA (a) | 1,801 | 83 | |||||||||
Christian Dior SE | 991 | 168 | |||||||||
Cie de Saint-Gobain | 11,805 | 508 | |||||||||
Cie Generale des Etablissements Michelin | 4,013 | 381 | |||||||||
CNP Assurances | 3,490 | 47 | |||||||||
Credit Agricole SA | 30,971 | 365 | |||||||||
Danone SA | 13,343 | 900 | |||||||||
Dassault Systemes | 6,378 | 510 | |||||||||
Edenred | 10,346 | 195 | |||||||||
Electricite de France SA | 9,260 | 136 | |||||||||
Engie | 51,165 | 906 | |||||||||
Essilor International SA | 3,633 | 453 | |||||||||
Eurazeo SA | 819 | 56 | |||||||||
Eutelsat Communications SA | 3,979 | 119 | |||||||||
Fonciere Des Regions REIT | 2,059 | 184 | |||||||||
Gecina SA REIT | 1,794 | 218 | |||||||||
Groupe Eurotunnel SE | 3,758 | 47 | |||||||||
Hermes International | 248 | 84 | |||||||||
ICADE REIT | 2,054 | 138 | |||||||||
Iliad SA | 1,155 | 276 | |||||||||
Imerys SA | 835 | 58 | |||||||||
Kering | 1,237 | 211 | |||||||||
Klepierre REIT | 10,956 | 486 | |||||||||
L'Oreal SA | 5,821 | 979 | |||||||||
Lagardere SCA | 2,957 | 88 | |||||||||
Legrand SA | 12,559 | 709 | |||||||||
LVMH Moet Hennessy Louis Vuitton SE | 4,037 | 631 | |||||||||
Natixis SA | 26,222 | 148 | |||||||||
Numericable-SFR SAS | 2,323 | 84 | |||||||||
Orange SA | 38,965 | 654 | |||||||||
Pernod Ricard SA | 4,599 | 523 | |||||||||
Publicis Groupe SA | 4,748 | 315 | |||||||||
Remy Cointreau SA | 527 | 38 | |||||||||
Renault SA | 4,146 | 416 | |||||||||
Safran SA | 6,592 | 451 | |||||||||
Sanofi | 26,711 | 2,279 | |||||||||
Schneider Electric SE | 11,047 | 629 | |||||||||
SES SA | 9,939 | 276 | |||||||||
Societe BIC SA | 740 | 122 | |||||||||
Societe Generale SA | 26,928 | 1,242 | |||||||||
Sodexo SA | 1,547 | 150 | |||||||||
STMicroelectronics N.V. | 27,797 | 185 | |||||||||
Suez Environnement Co. | 10,704 | 200 | |||||||||
Technip SA | 584 | 29 | |||||||||
Total SA | 29,582 | 1,317 | |||||||||
Unibail-Rodamco SE REIT | 5,420 | 1,374 | |||||||||
Shares | Value (000) | ||||||||||
Valeo SA | 2,331 | $ | 360 | ||||||||
Veolia Environnement SA | 13,795 | 327 | |||||||||
Vinci SA | 15,491 | 993 | |||||||||
Vivendi SA | 10,659 | 230 | |||||||||
28,613 | |||||||||||
Germany (7.4%) | |||||||||||
Adidas AG | 4,137 | 403 | |||||||||
Allianz SE (Registered) | 7,885 | 1,397 | |||||||||
Axel Springer SE | 830 | 46 | |||||||||
BASF SE | 9,857 | 754 | |||||||||
Bayer AG (Registered) | 19,201 | 2,409 | |||||||||
Bayerische Motoren Werke AG | 4,318 | 455 | |||||||||
Beiersdorf AG | 1,782 | 162 | |||||||||
Brenntag AG | 2,556 | 133 | |||||||||
Commerzbank AG (b) | 35,508 | 368 | |||||||||
Continental AG | 1,795 | 436 | |||||||||
Daimler AG (Registered) | 11,018 | 920 | |||||||||
Deutsche Bank AG (Registered) | 18,430 | 452 | |||||||||
Deutsche Boerse AG | 6,100 | 540 | |||||||||
Deutsche Lufthansa AG (Registered) (b) | 2,804 | 44 | |||||||||
Deutsche Post AG (Registered) | 16,467 | 464 | |||||||||
Deutsche Telekom AG (Registered) | 104,096 | 1,883 | |||||||||
E.ON SE | 34,292 | 332 | |||||||||
Fraport AG Frankfurt Airport Services Worldwide | 766 | 49 | |||||||||
Fresenius Medical Care AG & Co., KGaA | 7,311 | 616 | |||||||||
Fresenius SE & Co., KGaA | 750 | 54 | |||||||||
GEA Group AG | 3,529 | 142 | |||||||||
HeidelbergCement AG | 4,891 | 399 | |||||||||
Henkel AG & Co., KGaA (Preference) | 3,084 | 344 | |||||||||
Hugo Boss AG | 609 | 51 | |||||||||
Infineon Technologies AG | 48,015 | 703 | |||||||||
K&S AG (Registered) | 362 | 9 | |||||||||
Kabel Deutschland Holding AG | 1,257 | 155 | |||||||||
Lanxess AG | 708 | 33 | |||||||||
Linde AG | 2,585 | 375 | |||||||||
Merck KGaA | 3,205 | 311 | |||||||||
Metro AG | 10,164 | 324 | |||||||||
Muenchener Rueckversicherungs AG (Registered) | 349 | 70 | |||||||||
Osram Licht AG | 4,203 | 177 | |||||||||
Porsche Automobil Holding SE (Preference) | 2,978 | 161 | |||||||||
ProSiebenSat.1 Media SE (Registered) | 9,158 | 463 | |||||||||
QIAGEN N.V. (b) | 10,708 | 290 | |||||||||
RTL Group SA (b) | 2,067 | 173 | |||||||||
RWE AG | 14,670 | 187 | |||||||||
SAP SE | 21,065 | 1,678 | |||||||||
Siemens AG (Registered) | 13,446 | 1,304 | |||||||||
Symrise AG | 353 | 23 | |||||||||
Telefonica Deutschland Holding AG | 7,591 | 40 | |||||||||
ThyssenKrupp AG | 7,745 | 154 | |||||||||
TUI AG | 1,625 | 29 | |||||||||
United Internet AG (Registered) | 5,496 | 302 | |||||||||
Vonovia SE | 866 | 27 | |||||||||
19,841 | |||||||||||
The accompanying notes are an integral part of the financial statements.
8
Morgan Stanley Institutional Fund, Inc.
Annual Report — December 31, 2015
Portfolio of Investments (cont'd)
Active International Allocation Portfolio
Shares | Value (000) | ||||||||||
Hong Kong (1.4%) | |||||||||||
AIA Group Ltd. | 132,000 | $ | 786 | ||||||||
Bank of East Asia Ltd. (The) (a) | 13,982 | 52 | |||||||||
BOC Hong Kong Holdings Ltd. | 40,500 | 123 | |||||||||
Cathay Pacific Airways Ltd. | 13,000 | 22 | |||||||||
Cheung Kong Infrastructure Holdings Ltd. | 7,000 | 65 | |||||||||
Cheung Kong Property Holdings Ltd. | 29,500 | 190 | |||||||||
CK Hutchison Holdings Ltd. | 29,500 | 396 | |||||||||
CLP Holdings Ltd. | 21,000 | 178 | |||||||||
First Pacific Co., Ltd. | 26,000 | 17 | |||||||||
Hang Lung Properties Ltd. | 25,000 | 57 | |||||||||
Hang Seng Bank Ltd. | 8,400 | 159 | |||||||||
Henderson Land Development Co., Ltd. | 13,000 | 79 | |||||||||
HKT Trust & HKT Ltd. | 29,000 | 37 | |||||||||
Hong Kong & China Gas Co., Ltd. | 76,000 | 149 | |||||||||
Hong Kong Exchanges and Clearing Ltd. | 12,372 | 314 | |||||||||
Hysan Development Co., Ltd. | 7,000 | 29 | |||||||||
Kerry Properties Ltd. | 7,000 | 19 | |||||||||
Link REIT | 25,000 | 149 | |||||||||
MGM China Holdings Ltd. (a) | 10,400 | 13 | |||||||||
MTR Corp., Ltd. | 16,000 | 79 | |||||||||
New World Development Co., Ltd. (a) | 61,402 | 60 | |||||||||
NWS Holdings Ltd. | 17,545 | 26 | |||||||||
PCCW Ltd. | 45,000 | 26 | |||||||||
Power Assets Holdings Ltd. | 15,000 | 138 | |||||||||
Sands China Ltd. | 26,400 | 89 | |||||||||
Shangri-La Asia Ltd. | 14,000 | 14 | |||||||||
Sino Land Co., Ltd. | 35,062 | 51 | |||||||||
SJM Holdings Ltd. (a) | 22,000 | 16 | |||||||||
Sun Hung Kai Properties Ltd. | 19,000 | 228 | |||||||||
Swire Pacific Ltd., Class A | 6,500 | 73 | |||||||||
Swire Properties Ltd. | 12,800 | 37 | |||||||||
Techtronic Industries Co., Ltd. | 15,000 | 61 | |||||||||
Wharf Holdings Ltd. (The) | 15,000 | 83 | |||||||||
Wheelock & Co., Ltd. | 10,000 | 42 | |||||||||
Yue Yuen Industrial Holdings Ltd. | 8,000 | 27 | |||||||||
3,884 | |||||||||||
Ireland (0.7%) | |||||||||||
Bank of Ireland (b) | 1,481,097 | 543 | |||||||||
CRH PLC | 35,162 | 1,016 | |||||||||
Kerry Group PLC, Class A | 3,556 | 294 | |||||||||
1,853 | |||||||||||
Italy (0.9%) | |||||||||||
Assicurazioni Generali SpA | 35,841 | 655 | |||||||||
Atlantia SpA | 8,588 | 228 | |||||||||
Banca Monte dei Paschi di Siena SpA (b) | 21,371 | 28 | |||||||||
Banco Popolare SC (b) | 1,204 | 17 | |||||||||
Intesa Sanpaolo SpA | 120,273 | 400 | |||||||||
Luxottica Group SpA | 5,931 | 387 | |||||||||
Prysmian SpA | 5,545 | 121 | |||||||||
Telecom Italia SpA | 286,465 | 293 | |||||||||
Shares | Value (000) | ||||||||||
UniCredit SpA | 35,923 | $ | 198 | ||||||||
Unione di Banche Italiane SpA | 8,796 | 58 | |||||||||
2,385 | |||||||||||
Japan (26.5%) | |||||||||||
ABC-Mart, Inc. | 900 | 49 | |||||||||
Acom Co., Ltd. (b) | 10,100 | 48 | |||||||||
Aeon Co., Ltd. | 19,300 | 297 | |||||||||
Aeon Mall Co., Ltd. | 2,000 | 34 | |||||||||
Ajinomoto Co., Inc. | 19,000 | 450 | |||||||||
Amada Holdings Co., Ltd. | 6,400 | 61 | |||||||||
ANA Holdings, Inc. | 64,000 | 185 | |||||||||
Asahi Glass Co., Ltd. (a) | 24,300 | 139 | |||||||||
Asahi Group Holdings Ltd. | 11,200 | 350 | |||||||||
Asahi Kasei Corp. | 16,000 | 108 | |||||||||
Asics Corp. | 2,100 | 43 | |||||||||
Astellas Pharma, Inc. | 70,200 | 997 | |||||||||
Bandai Namco Holdings, Inc. | 5,500 | 116 | |||||||||
Bank of Kyoto Ltd. (The) | 10,000 | 93 | |||||||||
Bank of Yokohama Ltd. (The) | 70,000 | 428 | |||||||||
Benesse Holdings, Inc. (a) | 1,754 | 51 | |||||||||
Bridgestone Corp. | 20,200 | 692 | |||||||||
Brother Industries Ltd. | 6,200 | 71 | |||||||||
Canon, Inc. (a) | 17,204 | 521 | |||||||||
Casio Computer Co., Ltd. (a) | 2,200 | 51 | |||||||||
Central Japan Railway Co. | 4,192 | 743 | |||||||||
Chiba Bank Ltd. (The) | 19,000 | 135 | |||||||||
Chubu Electric Power Co., Inc. | 14,400 | 197 | |||||||||
Chugai Pharmaceutical Co., Ltd. | 6,300 | 220 | |||||||||
Chugoku Bank Ltd. (The) | 3,800 | 51 | |||||||||
Citizen Holdings Co., Ltd. | 10,300 | 74 | |||||||||
Credit Saison Co., Ltd. | 7,300 | 144 | |||||||||
Dai Nippon Printing Co., Ltd. | 10,100 | 100 | |||||||||
Dai-ichi Life Insurance Co., Ltd. (The) | 59,900 | 994 | |||||||||
Daiichi Sankyo Co., Ltd. | 21,400 | 440 | |||||||||
Daikin Industries Ltd. | 6,900 | 502 | |||||||||
Daito Trust Construction Co., Ltd. | 2,556 | 296 | |||||||||
Daiwa House Industry Co., Ltd. | 15,000 | 430 | |||||||||
Daiwa Securities Group, Inc. | 72,000 | 440 | |||||||||
Denso Corp. | 19,250 | 918 | |||||||||
Dentsu, Inc. (a) | 5,000 | 274 | |||||||||
Don Quijote Holdings Co., Ltd. | 4,700 | 165 | |||||||||
East Japan Railway Co. | 10,900 | 1,024 | |||||||||
Eisai Co., Ltd. | 7,400 | 489 | |||||||||
FANUC Corp. | 8,050 | 1,388 | |||||||||
Fast Retailing Co., Ltd. | 2,200 | 770 | |||||||||
Fuji Heavy Industries Ltd. | 5,200 | 214 | |||||||||
FUJIFILM Holdings Corp. | 19,500 | 812 | |||||||||
Fujitsu Ltd. | 60,200 | 300 | |||||||||
Fukuoka Financial Group, Inc. | 27,000 | 134 | |||||||||
Hachijuni Bank Ltd. (The) | 9,000 | 55 | |||||||||
Hakuhodo DY Holdings, Inc. | 8,900 | 96 | |||||||||
The accompanying notes are an integral part of the financial statements.
9
Morgan Stanley Institutional Fund, Inc.
Annual Report — December 31, 2015
Portfolio of Investments (cont'd)
Active International Allocation Portfolio
Shares | Value (000) | ||||||||||
Japan (cont'd) | |||||||||||
Hamamatsu Photonics KK | 3,200 | $ | 88 | ||||||||
Hankyu Hanshin Holdings, Inc. | 18,000 | 117 | |||||||||
Hikari Tsushin, Inc. | 200 | 14 | |||||||||
Hirose Electric Co., Ltd. | 900 | 109 | |||||||||
Hisamitsu Pharmaceutical Co., Inc. (a) | 1,300 | 55 | |||||||||
Hitachi Ltd. | 110,000 | 622 | |||||||||
Hitachi Metals Ltd. | 500 | 6 | |||||||||
Honda Motor Co., Ltd. | 40,713 | 1,305 | |||||||||
Hoshino Resorts, Inc. REIT | 7 | 73 | |||||||||
Hoya Corp. | 17,300 | 705 | |||||||||
IHI Corp. | 40,530 | 111 | |||||||||
Inpex Corp. | 38,000 | 375 | |||||||||
Isetan Mitsukoshi Holdings Ltd. | 15,400 | 200 | |||||||||
Isuzu Motors Ltd. | 9,600 | 103 | |||||||||
Ito En Ltd. (a) | 3,800 | 98 | |||||||||
ITOCHU Corp. | 23,151 | 273 | |||||||||
J Front Retailing Co., Ltd. | 8,100 | 117 | |||||||||
Japan Airlines Co., Ltd. | 5,100 | 183 | |||||||||
Japan Exchange Group, Inc. | 27,800 | 434 | |||||||||
Japan Hotel REIT Investment Corp. REIT | 105 | 78 | |||||||||
Japan Real Estate Investment Corp. REIT | 20 | 97 | |||||||||
Japan Retail Fund Investment Corp. REIT | 35 | 67 | |||||||||
Japan Tobacco, Inc. | 34,700 | 1,274 | |||||||||
JFE Holdings, Inc. (a) | 9,800 | 154 | |||||||||
JGC Corp. | 9,546 | 146 | |||||||||
Joyo Bank Ltd. (The) | 27,000 | 128 | |||||||||
JSR Corp. (a) | 3,108 | 49 | |||||||||
JX Holdings, Inc. | 103,246 | 432 | |||||||||
Kajima Corp. | 20,000 | 119 | |||||||||
Kakaku.com, Inc. | 4,100 | 81 | |||||||||
Kansai Electric Power Co., Inc. (The) (b) | 20,500 | 245 | |||||||||
Kansai Paint Co., Ltd. | 3,000 | 45 | |||||||||
Kao Corp. | 17,800 | 913 | |||||||||
Kawasaki Heavy Industries Ltd. | 43,500 | 161 | |||||||||
KDDI Corp. | 12,600 | 326 | |||||||||
Keikyu Corp. | 9,000 | 74 | |||||||||
Keio Corp. | 8,000 | 69 | |||||||||
Keyence Corp. | 2,057 | 1,129 | |||||||||
Kinden Corp. | 7,000 | 89 | |||||||||
Kintetsu Group Holdings Co., Ltd. | 35,750 | 145 | |||||||||
Kirin Holdings Co., Ltd. | 23,800 | 322 | |||||||||
Kobe Steel Ltd. | 30,000 | 33 | |||||||||
Komatsu Ltd. | 27,500 | 448 | |||||||||
Konica Minolta, Inc. | 16,130 | 162 | |||||||||
Kose Corp. | 2,000 | 184 | |||||||||
Kuraray Co., Ltd. | 7,656 | 93 | |||||||||
Kurita Water Industries Ltd. | 4,400 | 92 | |||||||||
Kyocera Corp. | 11,700 | 542 | |||||||||
Kyowa Exeo Corp. | 4,500 | 46 | |||||||||
Kyowa Hakko Kirin Co., Ltd. | 7,000 | 110 | |||||||||
Kyushu Electric Power Co., Inc. (a)(b) | 9,300 | 102 | |||||||||
Lawson, Inc. | 2,900 | 235 | |||||||||
Shares | Value (000) | ||||||||||
LIXIL Group Corp. (a) | 7,162 | $ | 159 | ||||||||
Mabuchi Motor Co., Ltd. | 1,800 | 97 | |||||||||
Makita Corp. (a) | 1,300 | 75 | |||||||||
Marubeni Corp. | 22,850 | 117 | |||||||||
Marui Group Co., Ltd. | 7,500 | 122 | |||||||||
Maruichi Steel Tube Ltd. | 100 | 3 | |||||||||
Mazda Motor Corp. | 8,100 | 167 | |||||||||
MEIJI Holdings Co., Ltd. | 1,400 | 115 | |||||||||
Minebea Co., Ltd. | 3,000 | 26 | |||||||||
Miraca Holdings, Inc. | 1,800 | 79 | |||||||||
Mitsubishi Chemical Holdings Corp. | 47,100 | 299 | |||||||||
Mitsubishi Corp. | 15,500 | 258 | |||||||||
Mitsubishi Electric Corp. | 49,352 | 517 | |||||||||
Mitsubishi Estate Co., Ltd. | 38,000 | 788 | |||||||||
Mitsubishi Heavy Industries Ltd. | 110,550 | 483 | |||||||||
Mitsubishi Materials Corp. | 17,000 | 53 | |||||||||
Mitsubishi Motors Corp. | 7,900 | 67 | |||||||||
Mitsubishi Tanabe Pharma Corp. | 4,900 | 84 | |||||||||
Mitsubishi UFJ Financial Group, Inc. (See Note G) | 153,106 | 948 | |||||||||
Mitsui & Co., Ltd. | 15,200 | 181 | |||||||||
Mitsui Fudosan Co., Ltd. | 28,900 | 724 | |||||||||
Mitsui OSK Lines Ltd. | 8,000 | 20 | |||||||||
Mizuho Financial Group, Inc. | 710,400 | 1,418 | |||||||||
MS&AD Insurance Group Holdings, Inc. | 13,160 | 385 | |||||||||
Murata Manufacturing Co., Ltd. | 6,800 | 976 | |||||||||
Nabtesco Corp. | 1,500 | 30 | |||||||||
NEC Corp. | 60,900 | 193 | |||||||||
NGK Insulators Ltd. | 8,660 | 195 | |||||||||
NGK Spark Plug Co., Ltd. | 8,059 | 212 | |||||||||
NH Foods Ltd. | 2,000 | 39 | |||||||||
Nidec Corp. | 7,500 | 543 | |||||||||
Nikon Corp. (a) | 14,800 | 198 | |||||||||
Nintendo Co., Ltd. | 2,108 | 290 | |||||||||
Nippon Building Fund, Inc. REIT | 25 | 119 | |||||||||
Nippon Express Co., Ltd. | 20,300 | 95 | |||||||||
Nippon Paint Holdings Co., Ltd. (a) | 2,000 | 48 | |||||||||
Nippon Steel Sumitomo Metal Corp. | 9,400 | 186 | |||||||||
Nippon Telegraph & Telephone Corp. | 24,600 | 977 | |||||||||
Nippon Television Holdings, Inc. | 3,700 | 67 | |||||||||
Nippon Yusen KK | 26,015 | 63 | |||||||||
Nissan Motor Co., Ltd. (a) | 66,805 | 700 | |||||||||
Nitori Holdings Co., Ltd. | 800 | 67 | |||||||||
Nitto Denko Corp. | 5,500 | 401 | |||||||||
Nomura Holdings, Inc. | 123,350 | 686 | |||||||||
NSK Ltd. | 7,053 | 76 | |||||||||
NTT Data Corp. | 3,900 | 188 | |||||||||
NTT DoCoMo, Inc. | 20,200 | 414 | |||||||||
Obayashi Corp. | 9,571 | 88 | |||||||||
Obic Co., Ltd. | 2,200 | 117 | |||||||||
Odakyu Electric Railway Co., Ltd. | 18,000 | 194 | |||||||||
Oji Holdings Corp. | 8,000 | 32 | |||||||||
Omron Corp. | 9,004 | 300 | |||||||||
Ono Pharmaceutical Co., Ltd. | 2,400 | 427 | |||||||||
The accompanying notes are an integral part of the financial statements.
10
Morgan Stanley Institutional Fund, Inc.
Annual Report — December 31, 2015
Portfolio of Investments (cont'd)
Active International Allocation Portfolio
Shares | Value (000) | ||||||||||
Japan (cont'd) | |||||||||||
Oriental Land Co., Ltd. (a) | 8,100 | $ | 488 | ||||||||
ORIX Corp. | 50,460 | 708 | |||||||||
Osaka Gas Co., Ltd. | 83,600 | 301 | |||||||||
Otsuka Holdings Co., Ltd. | 11,200 | 396 | |||||||||
Panasonic Corp. | 20,700 | 210 | |||||||||
Rakuten, Inc. | 31,800 | 366 | |||||||||
Resona Holdings, Inc. | 28,500 | 138 | |||||||||
Rohm Co., Ltd. | 5,005 | 253 | |||||||||
Sanrio Co., Ltd. (a) | 400 | 9 | |||||||||
Santen Pharmaceutical Co., Ltd. | 12,200 | 201 | |||||||||
SBI Holdings, Inc. | 12,700 | 137 | |||||||||
Secom Co., Ltd. | 7,785 | 527 | |||||||||
Sega Sammy Holdings, Inc. | 2,300 | 21 | |||||||||
Seiko Epson Corp. | 2,200 | 34 | |||||||||
Sekisui Chemical Co., Ltd. | 18,072 | 236 | |||||||||
Sekisui House Ltd. | 45,046 | 757 | |||||||||
Seven & I Holdings Co., Ltd. | 21,400 | 976 | |||||||||
Shimamura Co., Ltd. (a) | 400 | 47 | |||||||||
Shimano, Inc. | 3,650 | 559 | |||||||||
Shimizu Corp. | 9,000 | 73 | |||||||||
Shin-Etsu Chemical Co., Ltd. | 11,393 | 619 | |||||||||
Shionogi & Co., Ltd. | 11,700 | 529 | |||||||||
Shiseido Co., Ltd. | 11,500 | 238 | |||||||||
Shizuoka Bank Ltd. (The) | 18,000 | 174 | |||||||||
SMC Corp. | 1,705 | 442 | |||||||||
SoftBank Group Corp. | 29,000 | 1,461 | |||||||||
Sojitz Corp. | 48,400 | 101 | |||||||||
Sompo Japan Nipponkoa Holdings, Inc. | 8,600 | 281 | |||||||||
Sony Corp. | 34,193 | 838 | |||||||||
Sumitomo Chemical Co., Ltd. | 26,600 | 153 | |||||||||
Sumitomo Corp. | 19,400 | 198 | |||||||||
Sumitomo Electric Industries Ltd. | 20,400 | 287 | |||||||||
Sumitomo Metal Mining Co., Ltd. | 6,300 | 76 | |||||||||
Sumitomo Mitsui Financial Group, Inc. | 49,700 | 1,875 | |||||||||
Sumitomo Mitsui Trust Holdings, Inc. | 271,167 | 1,024 | |||||||||
Sumitomo Realty & Development Co., Ltd. | 11,500 | 328 | |||||||||
Suruga Bank Ltd. | 6,000 | 124 | |||||||||
Suzuken Co., Ltd. | 2,600 | 99 | |||||||||
Suzuki Motor Corp. | 2,900 | 88 | |||||||||
Sysmex Corp. | 1,500 | 96 | |||||||||
T&D Holdings, Inc. | 16,500 | 217 | |||||||||
Taiheiyo Cement Corp. (a) | 21,000 | 61 | |||||||||
Taisei Corp. | 28,000 | 184 | |||||||||
Takashimaya Co., Ltd. | 10,000 | 90 | |||||||||
Takeda Pharmaceutical Co., Ltd. | 22,500 | 1,120 | |||||||||
TDK Corp. | 4,052 | 259 | |||||||||
Teijin Ltd. | 1,608 | 5 | |||||||||
Terumo Corp. | 13,200 | 409 | |||||||||
THK Co., Ltd. | 7,500 | 139 | |||||||||
Tobu Railway Co., Ltd. | 47,900 | 236 | |||||||||
Toho Co., Ltd. | 4,500 | 125 | |||||||||
Shares | Value (000) | ||||||||||
Tohoku Electric Power Co., Inc. | 13,400 | $ | 168 | ||||||||
Tokio Marine Holdings, Inc. | 20,720 | 798 | |||||||||
Tokyo Electron Ltd. | 4,600 | 276 | |||||||||
Tokyo Gas Co., Ltd. | 92,600 | 435 | |||||||||
Tokyu Corp. | 32,400 | 256 | |||||||||
Tokyu Fudosan Holdings Corp. | 12,200 | 76 | |||||||||
Toppan Printing Co., Ltd. | 10,600 | 98 | |||||||||
Toray Industries, Inc. (a) | 28,100 | 261 | |||||||||
Toshiba Corp. (a)(b) | 100,026 | 205 | |||||||||
TOTO Ltd. (a) | 2,000 | 70 | |||||||||
Toyo Suisan Kaisha Ltd. | 3,500 | 122 | |||||||||
Toyota Industries Corp. | 2,350 | 126 | |||||||||
Toyota Motor Corp. | 68,355 | 4,196 | |||||||||
Trend Micro, Inc. | 2,900 | 118 | |||||||||
Unicharm Corp. (a) | 15,800 | 322 | |||||||||
USS Co., Ltd. | 4,100 | 62 | |||||||||
West Japan Railway Co. | 1,242 | 86 | |||||||||
Yahoo! Japan Corp. (a) | 60,900 | 248 | |||||||||
Yakult Honsha Co., Ltd. (a) | 3,000 | 147 | |||||||||
Yamada Denki Co., Ltd. (a) | 46,100 | 199 | |||||||||
Yamaha Corp. | 4,100 | 99 | |||||||||
Yamaha Motor Co., Ltd. | 2,800 | 63 | |||||||||
Yamato Holdings Co., Ltd. | 9,835 | 208 | |||||||||
Yaskawa Electric Corp. | 8,800 | 120 | |||||||||
71,545 | |||||||||||
Korea, Republic of (0.0%) | |||||||||||
Nexon Co., Ltd. | 6,300 | 102 | |||||||||
Macau (0.0%) | |||||||||||
Galaxy Entertainment Group Ltd. (c) | 26,000 | 81 | |||||||||
Malta (0.0%) | |||||||||||
BGP Holdings PLC (b)(d)(e) | 72,261 | — | |||||||||
Mexico (0.0%) | |||||||||||
Fresnillo PLC | 757 | 8 | |||||||||
Netherlands (3.8%) | |||||||||||
Aegon N.V. | 45,726 | 258 | |||||||||
Akzo Nobel N.V. | 6,051 | 404 | |||||||||
Altice N.V., Class A (b) | 6,315 | 90 | |||||||||
Altice N.V., Class B (b) | 2,105 | 31 | |||||||||
ArcelorMittal (a) | 26,631 | 111 | |||||||||
ASML Holding N.V. | 15,083 | 1,344 | |||||||||
Boskalis Westminster | 120 | 5 | |||||||||
CNH Industrial N.V. | 80,161 | 547 | |||||||||
Gemalto N.V. | 3,927 | 235 | |||||||||
Heineken N.V. | 5,641 | 482 | |||||||||
ING Groep N.V. CVA | 130,963 | 1,763 | |||||||||
Koninklijke Ahold N.V. | 22,981 | 485 | |||||||||
Koninklijke DSM N.V. | 4,004 | 200 | |||||||||
Koninklijke KPN N.V. | 104,124 | 393 | |||||||||
Koninklijke Philips N.V. | 23,254 | 591 | |||||||||
Randstad Holding N.V. | 4,535 | 282 | |||||||||
RELX N.V. | 40,700 | 684 | |||||||||
The accompanying notes are an integral part of the financial statements.
11
Morgan Stanley Institutional Fund, Inc.
Annual Report — December 31, 2015
Portfolio of Investments (cont'd)
Active International Allocation Portfolio
Shares | Value (000) | ||||||||||
Netherlands (cont'd) | |||||||||||
TNT Express N.V. | 22,240 | $ | 188 | ||||||||
Unilever N.V. CVA | 36,840 | 1,596 | |||||||||
Wolters Kluwer N.V. | 17,981 | 603 | |||||||||
10,292 | |||||||||||
Norway (0.3%) | |||||||||||
Akastor ASA (b) | 169 | — | @ | ||||||||
DNB ASA | 34,267 | 422 | |||||||||
Norsk Hydro ASA | 5,271 | 20 | |||||||||
Orkla ASA | 3,033 | 24 | |||||||||
Statoil ASA | 4,933 | 69 | |||||||||
Telenor ASA | 17,571 | 292 | |||||||||
827 | |||||||||||
Portugal (0.1%) | |||||||||||
Banco Comercial Portugues SA (a)(b) | 318,514 | 17 | |||||||||
Galp Energia SGPS SA | 17,189 | 199 | |||||||||
216 | |||||||||||
South Africa (0.4%) | |||||||||||
Mondi PLC | 1,278 | 25 | |||||||||
SABMiller PLC | 19,151 | 1,147 | |||||||||
1,172 | |||||||||||
Spain (1.8%) | |||||||||||
Abertis Infraestructuras SA | 6,647 | 103 | |||||||||
ACS Actividades de Construccion y Servicios SA | 1,275 | 37 | |||||||||
Aena SA (b)(f) | 551 | 63 | |||||||||
Amadeus IT Holding SA, Class A | 9,514 | 419 | |||||||||
Banco Bilbao Vizcaya Argentaria SA | 96,187 | 701 | |||||||||
Banco de Sabadell SA | 108,973 | 193 | |||||||||
Banco Popular Espanol SA | 38,795 | 128 | |||||||||
Banco Santander SA | 221,338 | 1,087 | |||||||||
Bankia SA (a) | 117,502 | 137 | |||||||||
Bankinter SA | 5,631 | 40 | |||||||||
CaixaBank SA | 52,554 | 183 | |||||||||
Distribuidora Internacional de Alimentacion SA (b) | 7,104 | 42 | |||||||||
Endesa SA | 14,303 | 286 | |||||||||
Ferrovial SA | 3,443 | 78 | |||||||||
Grifols SA | 3,855 | 177 | |||||||||
Industria de Diseno Textil SA | 8,937 | 307 | |||||||||
International Consolidated Airlines Group SA | 1,446 | 13 | |||||||||
International Consolidated Airlines Group SA | 10,386 | 93 | |||||||||
Mapfre SA | 6,036 | 15 | |||||||||
Red Electrica Corp., SA | 4,382 | 365 | |||||||||
Repsol SA | 8,569 | 93 | |||||||||
Telefonica SA | 23,256 | 257 | |||||||||
Zardoya Otis SA (a) | 1,371 | 16 | |||||||||
4,833 | |||||||||||
Sweden (3.3%) | |||||||||||
Assa Abloy AB, Class B | 18,883 | 395 | |||||||||
Electrolux AB, Class B | 57,052 | 1,369 | |||||||||
Elekta AB, Class B (a) | 7,571 | 64 | |||||||||
Getinge AB, Class B | 6,985 | 182 | |||||||||
Hennes & Mauritz AB, Class B | 15,347 | 546 | |||||||||
Shares | Value (000) | ||||||||||
Hexagon AB, Class B | 8,169 | $ | 303 | ||||||||
Husqvarna AB, Class B | 39,598 | 261 | |||||||||
Investor AB, Class B | 23,644 | 870 | |||||||||
Lundin Petroleum AB (b) | 3,730 | 53 | |||||||||
Nordea Bank AB | 99,641 | 1,087 | |||||||||
Securitas AB, Class B | 2,161 | 33 | |||||||||
Skandinaviska Enskilda Banken AB, Class A | 48,253 | 505 | |||||||||
Skanska AB, Class B | 8,914 | 172 | |||||||||
Svenska Cellulosa AB SCA, Class B | 14,723 | 428 | |||||||||
Svenska Handelsbanken AB, Class A | 33,204 | 438 | |||||||||
Swedbank AB, Class A | 20,888 | 459 | |||||||||
Swedish Match AB | 6,810 | 241 | |||||||||
Tele2 AB, Class B | 571 | 6 | |||||||||
Telefonaktiebolaget LM Ericsson, Class B | 96,108 | 931 | |||||||||
TeliaSonera AB | 45,418 | 226 | |||||||||
Volvo AB, Class B | 23,482 | 217 | |||||||||
8,786 | |||||||||||
Switzerland (8.8%) | |||||||||||
ABB Ltd. (Registered) (b) | 47,275 | 839 | |||||||||
Actelion Ltd. (Registered) (b) | 2,464 | 339 | |||||||||
Adecco SA (Registered) (b) | 6,173 | 424 | |||||||||
Baloise Holding AG (Registered) | 1,223 | 155 | |||||||||
Cie Financiere Richemont SA (Registered) | 7,029 | 505 | |||||||||
Coca-Cola HBC AG (b) | 703 | 15 | |||||||||
Credit Suisse Group AG (Registered) (b) | 48,659 | 1,052 | |||||||||
Geberit AG (Registered) | 1,139 | 383 | |||||||||
Givaudan SA (Registered) (b) | 162 | 291 | |||||||||
Julius Baer Group Ltd. (b) | 6,421 | 308 | |||||||||
LafargeHolcim Ltd. (Registered) (b) | 4,384 | 222 | |||||||||
LafargeHolcim Ltd. (Registered) (b) | 9,183 | 460 | |||||||||
Lonza Group AG (Registered) (b) | 1,624 | 264 | |||||||||
Nestle SA (Registered) | 74,851 | 5,548 | |||||||||
Novartis AG (Registered) | 45,848 | 3,919 | |||||||||
Pargesa Holding SA | 219 | 14 | |||||||||
Partners Group Holding AG | 383 | 138 | |||||||||
Roche Holding AG (Genusschein) | 14,001 | 3,859 | |||||||||
Schindler Holding AG | 1,032 | 173 | |||||||||
SGS SA (Registered) | 18 | 34 | |||||||||
Sonova Holding AG (Registered) | 789 | 100 | |||||||||
Swatch Group AG (The) | 418 | 146 | |||||||||
Swatch Group AG (The) (Registered) | 610 | 41 | |||||||||
Swiss Life Holding AG (Registered) (b) | 1,353 | 363 | |||||||||
Swiss Prime Site AG (Registered) (b) | 3,137 | 245 | |||||||||
Swisscom AG (Registered) | 784 | 390 | |||||||||
Syngenta AG (Registered) | 1,228 | 482 | |||||||||
UBS Group AG (Registered) | 111,480 | 2,145 | |||||||||
Zurich Insurance Group AG (b) | 3,238 | 826 | |||||||||
23,680 | |||||||||||
United Kingdom (18.6%) | |||||||||||
| 3i Group PLC | 21,345 | 150 | |||||||||
Aberdeen Asset Management PLC | 29,452 | 125 | |||||||||
Admiral Group PLC | 3,010 | 73 | |||||||||
Aggreko PLC | 8,231 | 111 | |||||||||
The accompanying notes are an integral part of the financial statements.
12
Morgan Stanley Institutional Fund, Inc.
Annual Report — December 31, 2015
Portfolio of Investments (cont'd)
Active International Allocation Portfolio
Shares | Value (000) | ||||||||||
United Kingdom (cont'd) | |||||||||||
Amec Foster Wheeler PLC | 3,418 | $ | 22 | ||||||||
Anglo American PLC | 21,935 | 97 | |||||||||
ARM Holdings PLC | 54,794 | 827 | |||||||||
Ashtead Group PLC | 1,758 | 29 | |||||||||
Associated British Foods PLC | 1,252 | 62 | |||||||||
AstraZeneca PLC | 26,712 | 1,806 | |||||||||
Aviva PLC | 110,254 | 833 | |||||||||
Babcock International Group PLC | 7,896 | 118 | |||||||||
BAE Systems PLC | 68,396 | 503 | |||||||||
Barclays PLC | 274,234 | 888 | |||||||||
Barratt Developments PLC | 36,297 | 333 | |||||||||
BG Group PLC | 87,190 | 1,264 | |||||||||
BHP Billiton PLC | 33,115 | 372 | |||||||||
| BP PLC | 323,506 | 1,686 | |||||||||
British American Tobacco PLC | 44,092 | 2,449 | |||||||||
British Land Co., PLC REIT | 8,518 | 98 | |||||||||
BT Group PLC | 239,164 | 1,653 | |||||||||
Bunzl PLC | 9,483 | 262 | |||||||||
Burberry Group PLC | 7,871 | 138 | |||||||||
Capita PLC | 30,694 | 546 | |||||||||
Carnival PLC | 5,380 | 305 | |||||||||
Centrica PLC | 117,485 | 377 | |||||||||
Cobham PLC | 42,073 | 175 | |||||||||
Compass Group PLC | 58,107 | 1,006 | |||||||||
Croda International PLC | 3,566 | 159 | |||||||||
Diageo PLC | 58,105 | 1,585 | |||||||||
Dixons Carphone PLC | 3,457 | 25 | |||||||||
easyJet PLC | 6,078 | 156 | |||||||||
Experian PLC | 29,942 | 529 | |||||||||
G4S PLC | 19,755 | 66 | |||||||||
GKN PLC | 41,995 | 191 | |||||||||
GlaxoSmithKline PLC | 102,980 | 2,080 | |||||||||
Glencore PLC (b) | 226,738 | 302 | |||||||||
Hammerson PLC REIT | 7,884 | 70 | |||||||||
Hargreaves Lansdown PLC | 3,477 | 77 | |||||||||
HSBC Holdings PLC | 403,187 | 3,182 | |||||||||
Imperial Tobacco Group PLC | 23,988 | 1,262 | |||||||||
Indivior PLC | 15,115 | 42 | |||||||||
Inmarsat PLC | 1,503 | 25 | |||||||||
InterContinental Hotels Group PLC | 9,258 | 359 | |||||||||
Intertek Group PLC | 4,557 | 186 | |||||||||
Intu Properties PLC REIT | 6,132 | 29 | |||||||||
Investec PLC | 8,360 | 59 | |||||||||
ITV PLC | 13,445 | 55 | |||||||||
J Sainsbury PLC (a) | 34,218 | 130 | |||||||||
Johnson Matthey PLC | 5,046 | 196 | |||||||||
Kingfisher PLC | 70,934 | 343 | |||||||||
Land Securities Group PLC REIT | 7,595 | 132 | |||||||||
Legal & General Group PLC | 105,182 | 415 | |||||||||
Lloyds Banking Group PLC | 1,857,604 | 1,999 | |||||||||
Lonmin PLC (a)(b) | 33 | — | @ | ||||||||
Marks & Spencer Group PLC | 57,529 | 382 | |||||||||
Shares | Value (000) | ||||||||||
Meggitt PLC | 16,379 | $ | 90 | ||||||||
Melrose Industries PLC | 3,436 | 15 | |||||||||
Merlin Entertainments PLC (f) | 2,476 | 17 | |||||||||
National Grid PLC | 31,813 | 438 | |||||||||
Next PLC | 4,144 | 444 | |||||||||
Old Mutual PLC | 80,048 | 211 | |||||||||
Pearson PLC | 28,961 | 313 | |||||||||
Persimmon PLC (b) | 10,453 | 312 | |||||||||
Petrofac Ltd. | 2,528 | 30 | |||||||||
Prudential PLC | 36,827 | 824 | |||||||||
Randgold Resources Ltd. | 317 | 20 | |||||||||
Reckitt Benckiser Group PLC | 14,238 | 1,311 | |||||||||
RELX PLC | 39,645 | 695 | |||||||||
Rexam PLC | 17,215 | 153 | |||||||||
Rio Tinto PLC | 17,751 | 517 | |||||||||
Rolls-Royce Holdings PLC (b) | 37,317 | 316 | |||||||||
Royal Dutch Shell PLC, Class A | 94,094 | 2,114 | |||||||||
Royal Dutch Shell PLC, Class B | 31,642 | 722 | |||||||||
Royal Mail PLC | 2,832 | 18 | |||||||||
RSA Insurance Group PLC | 11,896 | 75 | |||||||||
Sage Group PLC (The) | 49,860 | 443 | |||||||||
Schroders PLC | 2,982 | 130 | |||||||||
Segro PLC REIT | 15,809 | 100 | |||||||||
Severn Trent PLC | 2,038 | 65 | |||||||||
Shire PLC | 12,623 | 865 | |||||||||
Sky PLC | 60,175 | 984 | |||||||||
Smith & Nephew PLC | 54,791 | 970 | |||||||||
Smiths Group PLC | 10,654 | 147 | |||||||||
Sports Direct International PLC (b) | 943 | 8 | |||||||||
SSE PLC | 8,324 | 186 | |||||||||
Standard Chartered PLC | 35,018 | 290 | |||||||||
Standard Life PLC | 26,527 | 152 | |||||||||
Tate & Lyle PLC | 1,631 | 14 | |||||||||
Taylor Wimpey PLC | 118,570 | 354 | |||||||||
Tesco PLC (b) | 191,515 | 421 | |||||||||
Travis Perkins PLC | 860 | 25 | |||||||||
Unilever PLC | 29,339 | 1,256 | |||||||||
United Utilities Group PLC | 5,847 | 81 | |||||||||
Vodafone Group PLC | 660,948 | 2,138 | |||||||||
Weir Group PLC (The) | 4,129 | 61 | |||||||||
Whitbread PLC | 6,393 | 413 | |||||||||
William Hill PLC | 3,086 | 18 | |||||||||
WM Morrison Supermarkets PLC (a) | 7,847 | 17 | |||||||||
Wolseley PLC | 6,459 | 351 | |||||||||
WPP PLC | 70,847 | 1,631 | |||||||||
50,099 | |||||||||||
United States (0.1%) | |||||||||||
IMI PLC | 938 | 12 | |||||||||
Li & Fung Ltd. (c) | 64,000 | 43 | |||||||||
Ryanair Holdings PLC ADR | 2,047 | 177 | |||||||||
232 | |||||||||||
Total Common Stocks (Cost $241,881) | 253,359 | ||||||||||
The accompanying notes are an integral part of the financial statements.
13
Morgan Stanley Institutional Fund, Inc.
Annual Report — December 31, 2015
Portfolio of Investments (cont'd)
Active International Allocation Portfolio
| No. of Rights | |||||||||||
Right (0.0%) | |||||||||||
Italy (0.0%) | |||||||||||
| UBI Banca (b) (Cost $—) | 22,716 | — | |||||||||
Shares | Value (000) | ||||||||||
Short-Term Investments (7.5%) | |||||||||||
Securities held as Collateral on Loaned Securities (2.0%) | |||||||||||
Investment Company (1.7%) | |||||||||||
| Morgan Stanley Institutional Liquidity Funds — Money Market Portfolio — Institutional Class (See Note G) | 4,632,450 | $ | 4,632 | ||||||||
| Face Amount (000) | |||||||||||
Repurchase Agreements (0.3%) | |||||||||||
| Barclays Capital, Inc., (0.32%, dated 12/31/15, due 1/4/16; proceeds $271; fully collateralized by a U.S. Government obligation; 1.38% due 2/29/20; valued at $276) | $ | 271 | 271 | ||||||||
| Merrill Lynch & Co., Inc., (0.31%, dated 12/31/15, due 1/4/16; proceeds $542; fully collateralized by a U.S. Government agency security; 3.50% due 3/20/45; valued at $552) | 542 | 542 | |||||||||
813 | |||||||||||
| Total Securities held as Collateral on Loaned Securities (Cost $5,445) | 5,445 | ||||||||||
Shares | |||||||||||
Investment Company (5.5%) | |||||||||||
| Morgan Stanley Institutional Liquidity Funds — Money Market Portfolio — Institutional Class (See Note G) (Cost $14,733) | 14,732,739 | $ | 14,733 | ||||||||
Total Short-Term Investments (Cost $20,178) | 20,178 | ||||||||||
| Total Investments (101.4%) (Cost $262,059) Including $5,775 of Securities Loaned (g)(h)(i) | 273,537 | ||||||||||
Liabilities in Excess of Other Assets (–1.4%) | (3,795 | ) | |||||||||
Net Assets (100.0%) | $ | 269,742 | |||||||||
(a) All or a portion of this security was on loan at December 31, 2015.
(b) Non-income producing security.
(c) Security trades on the Hong Kong exchange.
(d) At December 31, 2015, the Portfolio held fair valued securities valued at approximately $8,000, representing less than 0.05% of net assets. These securities have been fair valued as determined in good faith under procedures established by and under the general supervision of the Fund's Directors.
(e) Security has been deemed illiquid at December 31, 2015.
(f) 144A security — Certain conditions for public sale may exist. Unless otherwise noted, these securities are deemed to be liquid.
(g) Securities are available for collateral in connection with open foreign currency forward exchange contracts and futures contracts.
(h) The approximate fair value and percentage of net assets, $252,709,000 and 93.7%, respectively, represent the securities that have been fair valued under the fair valuation policy for international investments as described in Note A-1 within the Notes to the Financial Statements.
(i) At December 31, 2015, the aggregate cost for Federal income tax purposes is approximately $266,686,000. The aggregate gross unrealized appreciation is approximately $37,845,000 and the aggregate gross unrealized depreciation is approximately $30,994,000 resulting in net unrealized appreciation of approximately $6,851,000.
@ Value is less than $500.
ADR American Depositary Receipt.
CVA Certificaten Van Aandelen.
REIT Real Estate Investment Trust.
The accompanying notes are an integral part of the financial statements.
14
Morgan Stanley Institutional Fund, Inc.
Annual Report — December 31, 2015
Portfolio of Investments (cont'd)
Active International Allocation Portfolio
Foreign Currency Forward Exchange Contracts:
The Portfolio had the following foreign currency forward exchange contracts open at December 31, 2015:
Counterparty | Contracts to Deliver (000) | In Exchange For (000) | Delivery Date | Unrealized Appreciation (Depreciation) (000) | |||||||||||||||
Bank of New York Mellon | JPY | 616,776 | $ | 5,073 | 1/21/16 | $ | (60 | ) | |||||||||||
Citibank NA | $ | 6,784 | EUR | 6,251 | 1/21/16 | 11 | |||||||||||||
Citibank NA | $ | 84 | GBP | 56 | 1/21/16 | (2 | ) | ||||||||||||
Credit Suisse International | EUR | 5,035 | $ | 5,506 | 1/21/16 | 32 | |||||||||||||
Credit Suisse International | $ | 5,960 | AUD | 8,327 | 1/21/16 | 104 | |||||||||||||
Goldman Sachs International | JPY | 23,846 | $ | 196 | 1/21/16 | (2 | ) | ||||||||||||
Northern Trust Company | JPY | 175,426 | $ | 1,443 | 1/21/16 | (17 | ) | ||||||||||||
State Street Bank and Trust Co. | CHF | 896 | $ | 904 | 1/21/16 | 9 | |||||||||||||
State Street Bank and Trust Co. | $ | 863 | AUD | 1,206 | 1/21/16 | 15 | |||||||||||||
State Street Bank and Trust Co. | $ | 1,904 | CHF | 1,882 | 1/21/16 | (24 | ) | ||||||||||||
State Street Bank and Trust Co. | $ | 602 | GBP | 400 | 1/21/16 | (12 | ) | ||||||||||||
$ | 54 | ||||||||||||||||||
Futures Contracts:
The Portfolio had the following futures contracts open at December 31, 2015:
| Number of Contracts | Value (000) | Expiration Date | Unrealized Appreciation (Depreciation) (000) | ||||||||||||||||
Long: | |||||||||||||||||||
Dax Index (Germany) | 26 | $ | 7,609 | Mar-16 | $ | 259 | |||||||||||||
FTSE MIB Index (Italy) | 38 | 4,428 | Mar-16 | 48 | |||||||||||||||
Hang Seng Index (Hong Kong) | 8 | 1,131 | Jan-16 | (2 | ) | ||||||||||||||
IBEX 35 Index (Spain) | 31 | 3,209 | Jan-16 | (44 | ) | ||||||||||||||
$ | 261 | ||||||||||||||||||
AUD — Australian Dollar
CHF — Swiss Franc
EUR — Euro
GBP — British Pound
JPY — Japanese Yen
Portfolio Composition*
Classification | Percentage of Total Investments | ||||||
Other** | 72.8 | % | |||||
Banks | 11.9 | ||||||
Pharmaceuticals | 9.8 | ||||||
Short-Term Investment | 5.5 | ||||||
Total Investments | 100.0 | %*** | |||||
* Percentages indicated are based upon total investments (excluding Securities held as Collateral on Loaned Securities) as of December 31, 2015.
** Industries and/or investment types representing less than 5% of total investments.
*** Does not include open long futures contracts with an underlying face amount of approximately $16,377,000 with net unrealized appreciation of approximately $261,000. Does not include open foreign currency forward exchange contracts with net unrealized appreciation of approximately $54,000.
The accompanying notes are an integral part of the financial statements.
15
Morgan Stanley Institutional Fund, Inc.
Annual Report — December 31, 2015
Active International Allocation Portfolio
Statement of Assets and Liabilities | December 31, 2015 (000) | ||||||
Assets: | |||||||
Investments in Securities of Unaffiliated Issuers, at Value(1) (Cost $241,003) | $ | 253,224 | |||||
Investments in Securities of Affiliated Issuers, at Value (Cost $21,056) | 20,313 | ||||||
Total Investments in Securities, at Value (Cost $262,059) | 273,537 | ||||||
Foreign Currency, at Value (Cost $491) | 496 | ||||||
Cash | 200 | ||||||
Receivable for Variation Margin on Futures Contracts | 1,554 | ||||||
Tax Reclaim Receivable | 380 | ||||||
Dividends Receivable | 215 | ||||||
Unrealized Appreciation on Foreign Currency Forward Exchange Contracts | 171 | ||||||
Receivable for Portfolio Shares Sold | 149 | ||||||
Receivable for Investments Sold | 10 | ||||||
Receivable from Affiliate | 4 | ||||||
Other Assets | 47 | ||||||
Total Assets | 276,763 | ||||||
Liabilities: | |||||||
Collateral on Securities Loaned, at Value | 5,829 | ||||||
Payable for Advisory Fees | 398 | ||||||
Payable for Portfolio Shares Redeemed | 366 | ||||||
Payable for Sub Transfer Agency Fees — Class I | 81 | ||||||
Payable for Sub Transfer Agency Fees — Class A | 44 | ||||||
Payable for Sub Transfer Agency Fees — Class L | 8 | ||||||
Unrealized Depreciation on Foreign Currency Forward Exchange Contracts | 117 | ||||||
Payable for Custodian Fees | 44 | ||||||
Payable for Administration Fees | 19 | ||||||
Payable for Directors' Fees and Expenses | 19 | ||||||
Payable for Shareholder Services Fees — Class A | 14 | ||||||
Payable for Distribution and Shareholder Services Fees — Class L | 5 | ||||||
Payable for Distribution and Shareholder Services Fees — Class C | — | @ | |||||
Payable for Professional Fees | 18 | ||||||
Payable for Transfer Agency Fees — Class I | 2 | ||||||
Payable for Transfer Agency Fees — Class A | 3 | ||||||
Payable for Transfer Agency Fees — Class L | 1 | ||||||
Other Liabilities | 53 | ||||||
Total Liabilities | 7,021 | ||||||
Net Assets | $ | 269,742 | |||||
Net Assets Consist Of: | |||||||
Paid-in-Capital | $ | 314,501 | |||||
Distributions in Excess of Net Investment Income | (883 | ) | |||||
Accumulated Net Realized Loss | (55,639 | ) | |||||
Unrealized Appreciation (Depreciation) on: | |||||||
Investments | 12,221 | ||||||
Investments in Affiliates | (743 | ) | |||||
Futures Contracts | 261 | ||||||
Foreign Currency Forward Exchange Contracts | 54 | ||||||
Foreign Currency Translations | (30 | ) | |||||
Net Assets | $ | 269,742 | |||||
The accompanying notes are an integral part of the financial statements.
16
Morgan Stanley Institutional Fund, Inc.
Annual Report — December 31, 2015
Active International Allocation Portfolio
Statement of Assets and Liabilities (cont'd) | December 31, 2015 (000) | ||||||
CLASS I: | |||||||
Net Assets | $ | 197,733 | |||||
| Shares Outstanding $0.001 par value shares of beneficial interest (unlimited shares authorized) (not in 000's) | 16,212,143 | ||||||
Net Asset Value, Offering and Redemption Price Per Share | $ | 12.20 | |||||
CLASS A: | |||||||
Net Assets | $ | 64,482 | |||||
| Shares Outstanding $0.001 par value shares of beneficial interest (unlimited shares authorized) (not in 000's) | 5,172,860 | ||||||
Net Asset Value, Redemption Price Per Share | $ | 12.47 | |||||
Maximum Sales Load | 5.25 | % | |||||
Maximum Sales Charge | $ | 0.69 | |||||
Maximum Offering Price Per Share | $ | 13.16 | |||||
CLASS L: | |||||||
Net Assets | $ | 7,495 | |||||
| Shares Outstanding $0.001 par value shares of beneficial interest (unlimited shares authorized) (not in 000's) | 603,975 | ||||||
Net Asset Value, Offering and Redemption Price Per Share | $ | 12.41 | |||||
CLASS C: | |||||||
Net Assets | $ | 32 | |||||
| Shares Outstanding $0.001 par value shares of beneficial interest (unlimited shares authorized) (not in 000's) | 2,587 | ||||||
Net Asset Value, Offering and Redemption Price Per Share | $ | 12.38 | |||||
| (1) Including: Securities on Loan, at Value: | $ | 5,775 | |||||
@ Amount is less than $500.
The accompanying notes are an integral part of the financial statements.
17
Morgan Stanley Institutional Fund, Inc.
Annual Report — December 31, 2015
Active International Allocation Portfolio
Statement of Operations | Year Ended December 31, 2015 (000) | ||||||
Investment Income: | |||||||
Dividends from Securities of Unaffiliated Issuers (Net of $634 of Foreign Taxes Withheld) | $ | 7,412 | |||||
Income from Securities Loaned — Net | 169 | ||||||
Dividends from Securities of Affiliated Issuers (Net of $2 of Foreign Taxes Withheld) (Note G) | 62 | ||||||
Interest from Securities of Unaffiliated Issuers | 3 | ||||||
Total Investment Income | 7,646 | ||||||
Expenses: | |||||||
Advisory Fees (Note B) | 1,946 | ||||||
Shareholder Services Fees — Class A (Note D) | 180 | ||||||
Distribution and Shareholder Services Fees — Class L (Note D) | 62 | ||||||
Distribution and Shareholder Services Fees — Class C (Note D) | — | @ | |||||
Administration Fees (Note C) | 239 | ||||||
Sub Transfer Agency Fees — Class I | 75 | ||||||
Sub Transfer Agency Fees — Class A | 90 | ||||||
Sub Transfer Agency Fees — Class L | 16 | ||||||
Custodian Fees (Note F) | 179 | ||||||
Professional Fees | 85 | ||||||
Shareholder Reporting Fees | 64 | ||||||
Pricing Fees | 53 | ||||||
Registration Fees | 47 | ||||||
Transfer Agency Fees — Class I (Note E) | 9 | ||||||
Transfer Agency Fees — Class A (Note E) | 14 | ||||||
Transfer Agency Fees — Class L (Note E) | 4 | ||||||
Transfer Agency Fees — Class C (Note E) | 1 | ||||||
Directors' Fees and Expenses | 8 | ||||||
Other Expenses | 24 | ||||||
Total Expenses | 3,096 | ||||||
Reimbursement of Class Specific Expenses — Class I (Note B) | (47 | ) | |||||
Reimbursement of Class Specific Expenses — Class A (Note B) | (20 | ) | |||||
Reimbursement of Class Specific Expenses — Class L (Note B) | (10 | ) | |||||
Reimbursement of Class Specific Expenses — Class C (Note B) | (— | @) | |||||
Rebate from Morgan Stanley Affiliate (Note G) | (24 | ) | |||||
Net Expenses | 2,995 | ||||||
Net Investment Income | 4,651 | ||||||
Realized Gain (Loss): | |||||||
Investments Sold | (3,922 | ) | |||||
Foreign Currency Forward Exchange Contracts | (2,866 | ) | |||||
Foreign Currency Transactions | (310 | ) | |||||
Futures Contracts | 2,520 | ||||||
Net Realized Loss | (4,578 | ) | |||||
Change in Unrealized Appreciation (Depreciation): | |||||||
Investments | (3,510 | ) | |||||
Investments in Affiliates | 109 | ||||||
Foreign Currency Forward Exchange Contracts | 150 | ||||||
Foreign Currency Translations | 58 | ||||||
Futures Contracts | (547 | ) | |||||
Net Change in Unrealized Appreciation (Depreciation) | (3,740 | ) | |||||
Net Realized Loss and Change in Unrealized Appreciation (Depreciation) | (8,318 | ) | |||||
Net Decrease in Net Assets Resulting from Operations | $ | (3,667 | ) | ||||
@ Amount is less than $500.
The accompanying notes are an integral part of the financial statements.
18
Morgan Stanley Institutional Fund, Inc.
Annual Report — December 31, 2015
Active International Allocation Portfolio
Statements of Changes in Net Assets | Year Ended December 31, 2015 (000) | Year Ended December 31, 2014 (000) | |||||||||
Increase (Decrease) in Net Assets: | |||||||||||
Operations: | |||||||||||
Net Investment Income | $ | 4,651 | $ | 8,206 | |||||||
Net Realized Loss | (4,578 | ) | (8,464 | ) | |||||||
Net Change in Unrealized Appreciation (Depreciation) | (3,740 | ) | (20,813 | ) | |||||||
Net Decrease in Net Assets Resulting from Operations | (3,667 | ) | (21,071 | ) | |||||||
Distributions from and/or in Excess of: | |||||||||||
Class I: | |||||||||||
Net Investment Income | (1,928 | ) | (6,048 | ) | |||||||
Class A: | |||||||||||
Net Investment Income | (382 | ) | (1,668 | ) | |||||||
Class L: | |||||||||||
Net Investment Income | (13 | ) | (153 | ) | |||||||
Class C: | |||||||||||
Net Investment Income | (— | @) | — | ||||||||
Total Distributions | (2,323 | ) | (7,869 | ) | |||||||
Capital Share Transactions:(1) | |||||||||||
Class I: | |||||||||||
Subscribed | 5,523 | 13,277 | |||||||||
Distributions Reinvested | 1,915 | 6,009 | |||||||||
Redeemed | (24,777 | ) | (39,288 | ) | |||||||
Class A: | |||||||||||
Subscribed | 4,676 | 4,264 | |||||||||
Distributions Reinvested | 375 | 1,634 | |||||||||
Redeemed | (11,059 | ) | (17,601 | ) | |||||||
Class L: | |||||||||||
Subscribed | 105 | 30 | |||||||||
Distributions Reinvested | 13 | 150 | |||||||||
Redeemed | (1,086 | ) | (1,082 | ) | |||||||
Class C: | |||||||||||
Subscribed | 36 | * | — | ||||||||
Distributions Reinvested | — | @* | — | ||||||||
Net Decrease in Net Assets Resulting from Capital Share Transactions | (24,279 | ) | (32,607 | ) | |||||||
Redemption Fees | — | @ | — | @ | |||||||
Total Decrease in Net Assets | (30,269 | ) | (61,547 | ) | |||||||
Net Assets: | |||||||||||
Beginning of Period | 300,011 | 361,558 | |||||||||
| End of Period (Including Distributions in Excess of Net Investment Income of $(883) and $(80)) | $ | 269,742 | $ | 300,011 | |||||||
The accompanying notes are an integral part of the financial statements.
19
Morgan Stanley Institutional Fund, Inc.
Annual Report — December 31, 2015
Active International Allocation Portfolio
Statements of Changes in Net Assets (cont'd) | Year Ended December 31, 2015 (000) | Year Ended December 31, 2014 (000) | |||||||||
(1) Capital Share Transactions: | |||||||||||
Class I: | |||||||||||
Shares Subscribed | 428 | 980 | |||||||||
Shares Issued on Distributions Reinvested | 154 | 484 | |||||||||
Shares Redeemed | (1,906 | ) | (2,888 | ) | |||||||
Net Decrease in Class I Shares Outstanding | (1,324 | ) | (1,424 | ) | |||||||
Class A: | |||||||||||
Shares Subscribed | 352 | 309 | |||||||||
Shares Issued on Distributions Reinvested | 29 | 128 | |||||||||
Shares Redeemed | (834 | ) | (1,270 | ) | |||||||
Net Decrease in Class A Shares Outstanding | (453 | ) | (833 | ) | |||||||
Class L: | |||||||||||
Shares Subscribed | 8 | 2 | |||||||||
Shares Issued on Distributions Reinvested | 1 | 12 | |||||||||
Shares Redeemed | (81 | ) | (79 | ) | |||||||
Net Decrease in Class L Shares Outstanding | (72 | ) | (65 | ) | |||||||
Class C: | |||||||||||
Shares Subscribed | 3 | * | — | ||||||||
Shares Issued on Distributions Reinvested | — | @@* | — | ||||||||
Net Increase in Class C Shares Outstanding | 3 | — | |||||||||
* For the period April 30, 2015 through December 31, 2015.
@ Amount is less than $500.
@@ Amount is less than 500 shares.
The accompanying notes are an integral part of the financial statements.
20
Morgan Stanley Institutional Fund, Inc.
Annual Report — December 31, 2015
Financial Highlights
Active International Allocation Portfolio
Class I | |||||||||||||||||||||||
Year Ended December 31, | |||||||||||||||||||||||
Selected Per Share Data and Ratios | 2015 | 2014 | 2013 | 2012 | 2011 | ||||||||||||||||||
Net Asset Value, Beginning of Period | $ | 12.52 | $ | 13.75 | $ | 11.65 | $ | 10.07 | $ | 12.06 | |||||||||||||
Income (Loss) from Investment Operations: | |||||||||||||||||||||||
Net Investment Income† | 0.22 | 0.34 | 0.22 | 0.23 | 0.27 | ||||||||||||||||||
Net Realized and Unrealized Gain (Loss) | (0.42 | ) | (1.22 | ) | 2.25 | 1.51 | (2.03 | ) | |||||||||||||||
Total from Investment Operations | (0.20 | ) | (0.88 | ) | 2.47 | 1.74 | (1.76 | ) | |||||||||||||||
Distributions from and/or in Excess of: | |||||||||||||||||||||||
Net Investment Income | (0.12 | ) | (0.35 | ) | (0.37 | ) | (0.16 | ) | (0.23 | ) | |||||||||||||
Redemption Fees | 0.00 | ‡ | 0.00 | ‡ | 0.00 | ‡ | 0.00 | ‡ | 0.00 | ‡ | |||||||||||||
Net Asset Value, End of Period | $ | 12.20 | $ | 12.52 | $ | 13.75 | $ | 11.65 | $ | 10.07 | |||||||||||||
Total Return++ | (1.63 | )% | (6.37 | )% | 21.38 | % | 17.30 | % | (14.56 | )% | |||||||||||||
Ratios and Supplemental Data: | |||||||||||||||||||||||
Net Assets, End of Period (Thousands) | $ | 197,733 | $ | 219,467 | $ | 260,614 | $ | 251,657 | $ | 302,048 | |||||||||||||
Ratio of Expenses to Average Net Assets (1) | 0.89 | %+ | 0.88 | %+ | 0.83 | %+ | 0.89 | %+ | 0.84 | %+^ | |||||||||||||
Ratio of Expenses to Average Net Assets Excluding Non Operating Expenses | N/A | N/A | 0.88 | %+ | N/A | 0.84 | %+^ | ||||||||||||||||
Ratio of Net Investment Income to Average Net Assets (1) | 1.66 | %+ | 2.53 | %+ | 1.71 | %+ | 2.12 | %+ | 2.33 | %+ | |||||||||||||
Ratio of Rebate from Morgan Stanley Affiliates to Average Net Assets | 0.01 | % | 0.02 | % | 0.02 | % | 0.01 | % | 0.01 | % | |||||||||||||
Portfolio Turnover Rate | 30 | % | 32 | % | 36 | % | 27 | % | 26 | % | |||||||||||||
(1) Supplemental Information on the Ratios to Average Net Assets: | |||||||||||||||||||||||
Ratios Before Expense Limitation: | |||||||||||||||||||||||
Expenses to Average Net Assets | 0.92 | % | 0.99 | % | 0.99 | % | 0.98 | % | 0.95 | % | |||||||||||||
Net Investment Income to Average Net Assets | 1.63 | % | 2.42 | % | 1.55 | % | 2.03 | % | 2.22 | % | |||||||||||||
† Per share amount is based on average shares outstanding.
‡ Amount is less than $0.005 per share.
++ Calculated based on the net asset value as of the last business day of the period.
+ The Ratios of Expenses and Net Investment Income reflect the rebate of certain Portfolio expenses in connection with the investments in Morgan Stanley affiliates during the period. The effect of the rebate on the ratios is disclosed in the above table as "Ratio of Rebate from Morgan Stanley Affiliates to Average Net Assets."
^ Effective July 1, 2011, the Adviser has agreed to limit the ratio of expenses to average net assets to the maximum ratio of 0.90% for Class I shares. Prior to July 1, 2011, the maximum ratio was 0.80% for Class I shares.
The accompanying notes are an integral part of the financial statements.
21
Morgan Stanley Institutional Fund, Inc.
Annual Report — December 31, 2015
Financial Highlights
Active International Allocation Portfolio
Class A | |||||||||||||||||||||||
Year Ended December 31, | |||||||||||||||||||||||
Selected Per Share Data and Ratios | 2015 | 2014 | 2013 | 2012 | 2011 | ||||||||||||||||||
Net Asset Value, Beginning of Period | $ | 12.79 | $ | 14.03 | $ | 11.89 | $ | 10.27 | $ | 12.28 | |||||||||||||
Income (Loss) from Investment Operations: | |||||||||||||||||||||||
Net Investment Income† | 0.17 | 0.30 | 0.11 | 0.20 | 0.25 | ||||||||||||||||||
Net Realized and Unrealized Gain (Loss) | (0.42 | ) | (1.24 | ) | 2.36 | 1.55 | (2.07 | ) | |||||||||||||||
Total from Investment Operations | (0.25 | ) | (0.94 | ) | 2.47 | 1.75 | (1.82 | ) | |||||||||||||||
Distributions from and/or in Excess of: | |||||||||||||||||||||||
Net Investment Income | (0.07 | ) | (0.30 | ) | (0.33 | ) | (0.13 | ) | (0.19 | ) | |||||||||||||
Redemption Fees | 0.00 | ‡ | 0.00 | ‡ | 0.00 | ‡ | 0.00 | ‡ | 0.00 | ‡ | |||||||||||||
Net Asset Value, End of Period | $ | 12.47 | $ | 12.79 | $ | 14.03 | $ | 11.89 | $ | 10.27 | |||||||||||||
Total Return++ | (1.95 | )% | (6.70 | )% | 20.94 | % | 17.05 | % | (14.75 | )% | |||||||||||||
Ratios and Supplemental Data: | |||||||||||||||||||||||
Net Assets, End of Period (Thousands) | $ | 64,482 | $ | 71,938 | $ | 90,599 | $ | 8,608 | $ | 10,387 | |||||||||||||
Ratio of Expenses to Average Net Assets (1) | 1.24 | %+ | 1.23 | %+ | 1.09 | %+^^ | 1.14 | %+ | 1.09 | %+^ | |||||||||||||
Ratio of Expenses to Average Net Assets Excluding Non Operating Expenses | N/A | N/A | 1.21 | %+^^ | N/A | 1.09 | %+^ | ||||||||||||||||
Ratio of Net Investment Income to Average Net Assets (1) | 1.31 | %+ | 2.18 | %+ | 0.84 | %+ | 1.80 | %+ | 2.08 | %+ | |||||||||||||
Ratio of Rebate from Morgan Stanley Affiliates to Average Net Assets | 0.01 | % | 0.02 | % | 0.02 | % | 0.01 | % | 0.01 | % | |||||||||||||
Portfolio Turnover Rate | 30 | % | 32 | % | 36 | % | 27 | % | 26 | % | |||||||||||||
(1) Supplemental Information on the Ratios to Average Net Assets: | |||||||||||||||||||||||
Ratios Before Expense Limitation: | |||||||||||||||||||||||
Expenses to Average Net Assets | 1.28 | % | 1.31 | %+ | 1.25 | %+ | 1.23 | % | 1.20 | % | |||||||||||||
Net Investment Income to Average Net Assets | 1.27 | % | 2.10 | %+ | 0.68 | %+ | 1.71 | % | 1.97 | % | |||||||||||||
† Per share amount is based on average shares outstanding.
‡ Amount is less than $0.005 per share.
++ Calculated based on the net asset value which does not reflect sales charges, if applicable, as of the last business day of the period.
+ The Ratios of Expenses and Net Investment Income reflect the rebate of certain Portfolio expenses in connection with the investments in Morgan Stanley affiliates during the period. The effect of the rebate on the ratios is disclosed in the above table as "Ratio of Rebate from Morgan Stanley Affiliates to Average Net Assets."
^^ Effective September 16, 2013, the Adviser has agreed to limit the ratio of expenses to average net assets to the maximum ratio of 1.25% for Class A shares. Prior to September 16, 2013, the maximum ratio was 1.15% for Class A shares.
^ Effective July 1, 2011, the Adviser has agreed to limit the ratio of expenses to average net assets to the maximum ratio of 1.15% for Class A shares. Prior to July 1, 2011, the maximum ratio was 1.05% for Class A shares.
The accompanying notes are an integral part of the financial statements.
22
Morgan Stanley Institutional Fund, Inc.
Annual Report — December 31, 2015
Financial Highlights
Active International Allocation Portfolio
Class L | |||||||||||||||||||
Year Ended December 31, | Period from June 14, 2012^ to | ||||||||||||||||||
Selected Per Share Data and Ratios | 2015 | 2014 | 2013 | December 31, 2012 | |||||||||||||||
Net Asset Value, Beginning of Period | $ | 12.74 | $ | 13.97 | $ | 11.84 | $ | 10.09 | |||||||||||
Income (Loss) from Investment Operations: | |||||||||||||||||||
Net Investment Income (Loss)† | 0.11 | 0.23 | 0.12 | (0.02 | ) | ||||||||||||||
Net Realized and Unrealized Gain (Loss) | (0.42 | ) | (1.23 | ) | 2.27 | 1.91 | |||||||||||||
Total from Investment Operations | (0.31 | ) | (1.00 | ) | 2.39 | 1.89 | |||||||||||||
Distributions from and/or in Excess of: | |||||||||||||||||||
Net Investment Income | (0.02 | ) | (0.23 | ) | (0.26 | ) | (0.14 | ) | |||||||||||
Redemption Fees | 0.00 | ‡ | 0.00 | ‡ | 0.00 | ‡ | 0.00 | ‡ | |||||||||||
Net Asset Value, End of Period | $ | 12.41 | $ | 12.74 | $ | 13.97 | $ | 11.84 | |||||||||||
Total Return++ | (2.44 | )% | (7.17 | )% | 20.34 | % | 18.80 | %# | |||||||||||
Ratios and Supplemental Data: | |||||||||||||||||||
Net Assets, End of Period (Thousands) | $ | 7,495 | $ | 8,606 | $ | 10,345 | $ | 10,246 | |||||||||||
Ratio of Expenses to Average Net Assets (1) | 1.74 | %+ | 1.73 | %+ | 1.61 | %+^^ | 1.63 | %+* | |||||||||||
Ratio of Expenses to Average Net Assets Excluding Non Operating Expenses | N/A | N/A | 1.66 | %+^^ | N/A | ||||||||||||||
Ratio of Net Investment Income (Loss) to Average Net Assets (1) | 0.82 | %+ | 1.68 | %+ | 0.94 | %+ | (0.33 | )%+* | |||||||||||
Ratio of Rebate from Morgan Stanley Affiliates to Average Net Assets | 0.01 | % | 0.02 | % | 0.02 | % | 0.02 | %* | |||||||||||
Portfolio Turnover Rate | 30 | % | 32 | % | 36 | % | 27 | %# | |||||||||||
(1) Supplemental Information on the Ratios to Average Net Assets: | |||||||||||||||||||
Ratios Before Expense Limitation: | |||||||||||||||||||
Expenses to Average Net Assets | 1.87 | % | 1.87 | % | 1.76 | % | 1.79 | %* | |||||||||||
Net Investment Income (Loss) to Average Net Assets | 0.69 | % | 1.54 | % | 0.79 | % | (0.49 | )%* | |||||||||||
^ Commencement of Offering.
† Per share amount is based on average shares outstanding.
‡ Amount is less than $0.005 per share.
++ Calculated based on the net asset value as of the last business day of the period.
+ The Ratios of Expenses and Net Investment Income (Loss) reflect the rebate of certain Portfolio expenses in connection with the investments in Morgan Stanley affiliates during the period. The effect of the rebate on the ratios is disclosed in the above table as "Ratio of Rebate from Morgan Stanley Affiliates to Average Net Assets."
^^ Effective September 16, 2013, the Adviser has agreed to limit the ratio of expenses to average net assets to the maximum ratio of 1.75% for Class L shares. Prior to September 16, 2013, the maximum ratio was 1.65% for Class L shares.
# Not Annualized.
* Annualized.
The accompanying notes are an integral part of the financial statements.
23
Morgan Stanley Institutional Fund, Inc.
Annual Report — December 31, 2015
Financial Highlights
Active International Allocation Portfolio
Class C | |||||||
Selected Per Share Data and Ratios | Period from April 30, 2015^ to December 31, 2015 | ||||||
Net Asset Value, Beginning of Period | $ | 13.94 | |||||
Loss from Investment Operations: | |||||||
Net Investment Loss† | (0.00 | )‡ | |||||
Net Realized and Unrealized Loss | (1.53 | ) | |||||
Total from Investment Operations | (1.53 | ) | |||||
Distributions from and/or in Excess of: | |||||||
Net Investment Income | (0.03 | ) | |||||
Redemption Fees | 0.00 | ‡ | |||||
Net Asset Value, End of Period | $ | 12.38 | |||||
Total Return++ | (10.96 | )%# | |||||
Ratios and Supplemental Data: | |||||||
Net Assets, End of Period (Thousands) | $ | 32 | |||||
Ratios of Expenses to Average Net Assets (1) | 1.99 | %+* | |||||
Ratio of Net Investment Loss to Average Net Assets (1) | (0.04 | )%+* | |||||
Ratio of Rebate from Morgan Stanley Affiliates to Average Net Assets | 0.01 | %* | |||||
Portfolio Turnover Rate | 30 | % | |||||
(1) Supplemental Information on the Ratios to Average Net Assets: | |||||||
Ratios Before Expense Limitation: | |||||||
Expense to Average Net Assets | 4.26 | %* | |||||
Net Investment Loss to Average Net Assets | (2.31 | )%* | |||||
^ Commencement of Offering.
† Per share amount is based on average shares outstanding.
‡ Amount is less than $0.005 per share.
++ Calculated based on the net asset value which does not reflect sales charges, if applicable, as of the last business day of the period.
+ The Ratios of Expenses and Net Investment Loss reflect the rebate of certain Portfolio expenses in connection with the investments in Morgan Stanley affiliates during the period. The effect of the rebate on the ratios is disclosed in the above table as "Ratio of Rebate from Morgan Stanley Affiliates to Average Net Assets."
# Not Annualized.
* Annualized.
The accompanying notes are an integral part of the financial statements.
24
Morgan Stanley Institutional Fund, Inc.
Annual Report — December 31, 2015
Notes to Financial Statements
Morgan Stanley Institutional Fund, Inc. (the "Fund") is registered under the Investment Company Act of 1940, as amended (the "Act"), as an open-end management investment company. The Fund is comprised of twenty-six separate, active, diversified and non-diversified portfolios (individually referred to as a "Portfolio", collectively as the "Portfolios"). The Fund applies investment company accounting and reporting guidance.
The accompanying financial statements relate to the Active International Allocation Portfolio. The Portfolio seeks long-term capital appreciation by investing primarily, in accordance with country and sector weightings determined by Morgan Stanley Investment Management Inc. (the "Adviser"), in equity securities of non-U.S. issuers which, in the aggregate, replicate broad market indices.
The Portfolio offers four classes of shares — Class I, Class A, Class L and Class C. On April 30, 2015, the Portfolio commenced offering Class C shares and suspended offering of Class L shares. Existing Class L shareholders may invest through reinvestment of dividends and distributions.
A. Significant Accounting Policies: The following significant accounting policies are in conformity with U.S. generally accepted accounting principles ("GAAP"). Such policies are consistently followed by the Fund in the preparation of its financial statements. GAAP may require management to make estimates and assumptions that affect the reported amounts and disclosures in the financial statements. Actual results may differ from those estimates.
1. Security Valuation: (1) An equity portfolio security listed or traded on an exchange is valued at its latest reported sales price (or at the exchange official closing price if such exchange reports an official closing price), if there were no sales on a given day, the security is valued at the mean between the last reported bid and asked prices; (2) all other equity portfolio securities for which over-the-counter ("OTC") market quotations are readily available are valued at its latest reported sales price. In cases where a security is traded on more than one exchange, the security is valued on the exchange designated as the primary market; (3) futures are valued at the latest price published by the commodities exchange on which they trade; (4) when market quotations are not readily available, including circumstances under which the Adviser determines that the closing price, last sale price or the mean between the last reported bid and asked prices are not reflective of a security's market value, portfolio securities
are valued at their fair value as determined in good faith under procedures established by and under the general supervision of the Fund's Board of Directors (the "Directors"). Occasionally, developments affecting the closing prices of securities and other assets may occur between the times at which valuations of such securities are determined (that is, close of the foreign market on which the securities trade) and the close of business of the New York Stock Exchange ("NYSE"). If developments occur during such periods that are expected to materially affect the value of such securities, such valuations may be adjusted to reflect the estimated fair value of such securities as of the close of the NYSE, as determined in good faith by the Directors or by the Adviser using a pricing service and/or procedures approved by the Directors; (5) quotations of foreign portfolio securities, other assets and liabilities and forward contracts stated in foreign currency are translated into U.S. dollar equivalents at the prevailing market rates prior to the close of the NYSE; (6) investments in mutual funds, including the Morgan Stanley Institutional Liquidity Funds, are valued at the net asset value ("NAV") as of the close of each business day; and (7) short-term debt securities with remaining maturities of 60 days or less at the time of purchase may be valued at amortized cost, unless the Adviser determines such valuation does not reflect the securities' market value, in which case these securities will be valued at their fair market value determined by the Adviser.
The Directors have responsibility for determining in good faith the fair value of the investments, and the Directors may appoint others, such as the Fund's Adviser or a valuation committee, to assist the Directors in determining fair value and to make the actual calculations pursuant to the fair valuation methodologies previously approved by the Directors. Under procedures approved by the Directors, the Fund's Adviser has formed a Valuation Committee whose members are approved by the Directors. The Valuation Committee provides administration and oversight of the Fund's valuation policies and procedures, which are reviewed at least annually by the Directors. These procedures allow the Fund to utilize independent pricing services, quotations from securities and financial instrument dealers, and other market sources to determine fair value.
The Fund has procedures to determine the fair value of securities and other financial instruments for which market prices are not readily available. Under these
25
Morgan Stanley Institutional Fund, Inc.
Annual Report — December 31, 2015
Notes to Financial Statements (cont'd)
procedures, the Valuation Committee convenes on a regular and ad hoc basis to review such securities and considers a number of factors, including valuation methodologies and significant unobservable valuation inputs, when arriving at fair value. The Valuation Committee may employ a market-based approach which may use related or comparable assets or liabilities, recent transactions, market multiples, book values, and other relevant information for the investment to determine the fair value of the investment. An income-based valuation approach may also be used in which the anticipated future cash flows of the investment are discounted to calculate fair value. Discounts may also be applied due to the nature or duration of any restrictions on the disposition of the investments. Due to the inherent uncertainty of valuations of such investments, the fair values may differ significantly from the values that would have been used had an active market existed. The Valuation Committee employs various methods for calibrating these valuation approaches including a regular review of valuation methodologies, key inputs and assumptions, transactional back-testing or disposition analysis, and reviews of any related market activity.
2. Fair Value Measurement: Financial Accounting Standards Board ("FASB") Accounting Standards CodificationTM ("ASC") 820, "Fair Value Measurement" ("ASC 820"), defines fair value as the value that the Fund would receive to sell an investment or pay to transfer a liability in a timely transaction with an independent buyer in the principal market, or in the absence of a principal market the most advantageous market for the investment or liability. ASC 820 establishes a three-tier hierarchy to distinguish between (1) inputs that reflect the assumptions market participants would use in valuing an asset or liability developed based on market data obtained from sources independent of the reporting entity (observable inputs) and (2) inputs that reflect the reporting entity's own assumptions about the assumptions market participants would use in valuing an asset or liability developed based on the best information available in the circumstances (unobservable inputs) and to establish classification of fair value measurements for disclosure purposes. Various inputs are used in determining the value of the Fund's investments. The inputs are summarized in the three broad levels listed below.
• Level 1 – unadjusted quoted prices in active markets for identical investments
• Level 2 – other significant observable inputs (including quoted prices for similar investments, interest rates, prepayment speeds, credit risk, etc.)
• Level 3 – significant unobservable inputs including the Fund's own assumptions in determining the fair value of investments. Factors considered in making this determination may include, but are not limited to, information obtained by contacting the issuer, analysts, or the appropriate stock exchange (for exchange-traded securities), analysis of the issuer's financial statements or other available documents and, if necessary, available information concerning other securities in similar circumstances
The inputs or methodology used for valuing securities are not necessarily an indication of the risk associated with investing in those securities and the determination of the significance of a particular input to the fair value measurement in its entirety requires judgment and considers factors specific to each security.
The following is a summary of the inputs used to value the Portfolio's investments as of December 31, 2015.
Investment Type | Level 1 Unadjusted quoted prices (000) | Level 2 Other significant observable inputs (000) | Level 3 Significant unobservable inputs (000) | Total (000) | |||||||||||||||
Assets: | |||||||||||||||||||
Common Stocks | |||||||||||||||||||
Aerospace & Defense | $ | — | $ | 2,557 | $ | — | $ | 2,557 | |||||||||||
Air Freight & Logistics | — | 878 | — | 878 | |||||||||||||||
Airlines | 177 | 696 | — | 873 | |||||||||||||||
Auto Components | — | 3,603 | — | 3,603 | |||||||||||||||
Automobiles | — | 8,855 | — | 8,855 | |||||||||||||||
Banks | — | 31,815 | — | 31,815 | |||||||||||||||
Beverages | — | 6,749 | — | 6,749 | |||||||||||||||
Biotechnology | — | 1,120 | — | 1,120 | |||||||||||||||
Building Products | — | 2,156 | — | 2,156 | |||||||||||||||
Capital Markets | — | 6,166 | — | 6,166 | |||||||||||||||
Chemicals | — | 6,228 | — | 6,228 | |||||||||||||||
| Commercial Services & Supplies | — | 1,728 | — | 1,728 | |||||||||||||||
| Communications Equipment | 465 | 2,147 | — | 2,612 | |||||||||||||||
| Construction & Engineering | — | 2,372 | — | 2,372 | |||||||||||||||
Construction Materials | — | 2,216 | — | 2,216 | |||||||||||||||
Consumer Finance | — | 192 | — | 192 | |||||||||||||||
Containers & Packaging | — | 377 | — | 377 | |||||||||||||||
| Diversified Consumer Services | — | 51 | — | 51 | |||||||||||||||
| Diversified Financial Services | — | 3,478 | — | † | 3,478 | † | |||||||||||||
26
Morgan Stanley Institutional Fund, Inc.
Annual Report — December 31, 2015
Notes to Financial Statements (cont'd)
Investment Type | Level 1 Unadjusted quoted prices (000) | Level 2 Other significant observable inputs (000) | Level 3 Significant unobservable inputs (000) | Total (000) | |||||||||||||||
Common Stocks (cont'd) | |||||||||||||||||||
| Diversified Telecommunication Services | $ | — | $ | 7,915 | $ | — | $ | 7,915 | |||||||||||
Electric Utilities | — | 2,066 | — | 2,066 | |||||||||||||||
Electrical Equipment | — | 3,811 | — | 3,811 | |||||||||||||||
| Electronic Equipment, Instruments & Components | — | 4,522 | — | 4,522 | |||||||||||||||
| Energy Equipment & Services | — | 81 | — | 81 | |||||||||||||||
Food & Staples Retailing | — | 4,461 | — | 4,461 | |||||||||||||||
Food Products | — | 7,751 | — | 7,751 | |||||||||||||||
Gas Utilities | — | 960 | — | 960 | |||||||||||||||
| Health Care Equipment & Supplies | — | 3,040 | — | 3,040 | |||||||||||||||
| Health Care Providers & Services | — | 941 | — | 941 | |||||||||||||||
| Hotels, Restaurants & Leisure | — | 3,537 | — | 3,537 | |||||||||||||||
Household Durables | — | 4,980 | — | 4,980 | |||||||||||||||
Household Products | — | 2,405 | — | 2,405 | |||||||||||||||
Industrial Conglomerates | — | 2,669 | — | 2,669 | |||||||||||||||
| Information Technology Services | — | 1,845 | — | 1,845 | |||||||||||||||
Insurance | — | 12,126 | — | 12,126 | |||||||||||||||
Internet & Catalog Retail | — | 366 | — | 366 | |||||||||||||||
| Internet Software & Services | — | 941 | — | 941 | |||||||||||||||
Leisure Products | — | 795 | — | 795 | |||||||||||||||
| Life Sciences Tools & Services | — | 554 | — | 554 | |||||||||||||||
Machinery | — | 5,558 | — | 5,558 | |||||||||||||||
Marine | — | 990 | — | 990 | |||||||||||||||
Media | — | 7,718 | — | 7,718 | |||||||||||||||
Metals & Mining | — | 2,893 | — | 2,893 | |||||||||||||||
Multi-line Retail | — | 1,554 | — | 1,554 | |||||||||||||||
Multi-Utilities | — | 2,882 | — | 2,882 | |||||||||||||||
| Oil, Gas & Consumable Fuels | — | 8,747 | — | 8,747 | |||||||||||||||
Paper & Forest Products | — | 720 | — | 720 | |||||||||||||||
Personal Products | — | 5,328 | — | 5,328 | |||||||||||||||
Pharmaceuticals | — | 26,240 | 8 | 26,248 | |||||||||||||||
Professional Services | — | 2,001 | — | 2,001 | |||||||||||||||
| Real Estate Investment Trusts (REITs) | — | 4,413 | — | 4,413 | |||||||||||||||
| Real Estate Management & Development | — | 3,953 | — | 3,953 | |||||||||||||||
Road & Rail | — | 3,942 | — | 3,942 | |||||||||||||||
| Semiconductors & Semiconductor Equipment | — | 3,608 | — | 3,608 | |||||||||||||||
Software | — | 3,376 | — | 3,376 | |||||||||||||||
Specialty Retail | — | 2,446 | — | 2,446 | |||||||||||||||
| Tech Hardware, Storage & Peripherals | — | 1,793 | — | 1,793 | |||||||||||||||
| Textiles, Apparel & Luxury Goods | — | 2,878 | — | 2,878 | |||||||||||||||
Tobacco | — | 5,226 | — | 5,226 | |||||||||||||||
| Trading Companies & Distributors | — | 1,928 | — | 1,928 | |||||||||||||||
Investment Type | Level 1 Unadjusted quoted prices (000) | Level 2 Other significant observable inputs (000) | Level 3 Significant unobservable inputs (000) | Total (000) | |||||||||||||||
Common Stocks (cont'd) | |||||||||||||||||||
| Transportation Infrastructure | $ | — | $ | 874 | $ | — | $ | 874 | |||||||||||
Water Utilities | — | 146 | — | 146 | |||||||||||||||
| Wireless Telecommunication Services | — | 4,345 | — | 4,345 | |||||||||||||||
Total Common Stocks | 642 | 252,709 | 8 | † | 253,359 | † | |||||||||||||
Right | — | — | † | — | — | † | |||||||||||||
Short-Term Investments | |||||||||||||||||||
Investment Companies | 19,365 | — | — | 19,365 | |||||||||||||||
Repurchase Agreements | — | 813 | — | 813 | |||||||||||||||
| Total Short-Term Investments | 19,365 | 813 | — | 20,178 | |||||||||||||||
| Foreign Currency Forward Exchange Contracts | — | 171 | — | 171 | |||||||||||||||
Futures Contracts | 307 | — | — | 307 | |||||||||||||||
Total Assets | 20,314 | 253,693 | † | 8 | † | 274,015 | † | ||||||||||||
Liabilities: | |||||||||||||||||||
| Foreign Currency Forward Exchange Contracts | — | (117 | ) | — | (117 | ) | |||||||||||||
Futures Contracts | (46 | ) | — | — | (46 | ) | |||||||||||||
Total Liabilities | (46 | ) | (117 | ) | — | (163 | ) | ||||||||||||
Total | $ | 20,268 | $ | 253,576 | † | $ | 8 | † | $ | 273,852 | † | ||||||||
† Includes one or more securities which are valued at zero.
Transfers between investment levels may occur as the markets fluctuate and/or the availability of data used in an investment's valuation changes. The Portfolio recognizes transfers between the levels as of the end of the period. As of December 31, 2015, securities with a total value of approximately $2,187,000 transferred from Level 1 to Level 2. At December 31, 2015, the fair value of certain securities were adjusted due to developments which occurred between the time of the close of the foreign markets on which they trade and the close of business on the NYSE which resulted in their Level 2 classification. As of December 31, 2015, a security with a total value of approximately $465,000 transferred from Level 2 to Level 1. The security that was valued using other significant observable inputs at December 31, 2014 was valued using unadjusted quoted prices at December 31, 2015. As of December 31, 2015, a security with a total value of approximately $8,000 transferred from Level 2 to Level 3. The security that was valued using other significant observable inputs at December 31, 2014 was valued using significant unobservable inputs at December 31, 2015.
27
Morgan Stanley Institutional Fund, Inc.
Annual Report — December 31, 2015
Notes to Financial Statements (cont'd)
Following is a reconciliation of investments in which significant unobservable inputs (Level 3) were used in determining fair value.
| Common Stocks (000) | |||||||
Beginning Balance | $ | — | † | ||||
Purchases | — | ||||||
Sales | — | ||||||
Amortization of discount | — | ||||||
Transfers in | 8 | ||||||
Transfers out | — | ||||||
Corporate actions | — | ||||||
Change in unrealized appreciation (depreciation) | — | ||||||
Realized gains (losses) | — | ||||||
Ending Balance | $ | 8 | † | ||||
| Net change in unrealized appreciation (depreciation) from investments still held as of December 31, 2015 | $ | — | |||||
† Includes one or more securities which are valued at zero.
The following table presents additional information about valuation techniques and inputs used for investments that are measured at fair value and categorized within Level 3 as of December 31, 2015. Various valuation techniques were used in the valuation of certain investments and weighted based on the level of significance.
| Fair Value at December 31, 2015 (000) | Valuation Technique | Unobservable Input | Range | Selected Value | Impact to Valuation from an Increase in Input | ||||||||||||||||||||||||||
Pharmaceuticals | |||||||||||||||||||||||||||||||
Common Stock | $ | 8 | Market Transaction Method | Precedent Transaction | $ | 0.23 | $ | 0.23 | $ | 0.23 | Increase | ||||||||||||||||||||
Discounted Cash Flow | Weighted Average Cost of Capital | 16.5 | % | 16.5 | % | 16.5 | % | Decrease | |||||||||||||||||||||||
Long-Term Growth Rate | 2.0 | % | 3.0 | % | 2.5 | % | Increase | ||||||||||||||||||||||||
| Market Comparable Companies | Enterprise Value/ EBITDA | 11.5 | x | 15.8 | x | 11.5 | x | Increase | |||||||||||||||||||||||
| Discount for Lack of Marketability/Company Specific Risk | 30.0 | % | 30.0 | % | 30.0 | % | Decrease | ||||||||||||||||||||||||
3. Foreign Currency Translation and Foreign Investments: The books and records of the Portfolio are maintained in U.S. dollars. Foreign currency amounts are translated into U.S. dollars as follows:
– investments, other assets and liabilities at the prevailing rate of exchange on the valuation date;
– investment transactions and investment income at the prevailing rates of exchange on the dates of such transactions.
Although the net assets of the Portfolio are presented at the foreign exchange rates and market values at the close
of the period, the Portfolio does not isolate that portion of the results of operations arising as a result of changes in the foreign exchange rates from the fluctuations arising from changes in the market prices of securities held at period end. Similarly, the Portfolio does not isolate the effect of changes in foreign exchange rates from the fluctuations arising from changes in the market prices of securities sold during the period. Accordingly, realized and unrealized foreign currency gains (losses) on investments in securities are included in the reported net realized and unrealized gains (losses) on investment transactions and balances. However, pursuant to U.S.
28
Morgan Stanley Institutional Fund, Inc.
Annual Report — December 31, 2015
Notes to Financial Statements (cont'd)
Federal income tax regulations, gains and losses from certain foreign currency transactions and the foreign currency portion of gains and losses realized on sales and maturities of foreign denominated debt securities are treated as ordinary income for U.S. Federal income tax purposes.
Net realized gains (losses) on foreign currency transactions represent net foreign exchange gains (losses) from foreign currency forward exchange contracts, disposition of foreign currencies, currency gains (losses) realized between the trade and settlement dates on securities transactions, and the difference between the amount of investment income and foreign withholding taxes recorded on the Portfolio's books and the U.S. dollar equivalent amounts actually received or paid. Net unrealized currency gains (losses) from valuing foreign currency denominated assets and liabilities at period end exchange rates are reflected as a component of unrealized appreciation (depreciation) in the Statement of Assets and Liabilities. The change in unrealized currency gains (losses) on foreign currency translations for the period is reflected in the Statement of Operations.
Foreign security and currency transactions may involve certain considerations and risks not typically associated with those of U.S. dollar denominated transactions as a result of, among other factors, fluctuations of exchange rates in relation to the U.S. dollar, the possibility of lower levels of governmental supervision and regulation of foreign securities markets and the possibility of political or economic instability.
Governmental approval for foreign investments may be required in advance of making an investment under certain circumstances in some countries, and the extent of foreign investments in domestic companies may be subject to limitation in other countries. Foreign ownership limitations also may be imposed by the charters of individual companies to prevent, among other concerns, violations of foreign investment limitations. As a result, an additional class of shares (identified as "Foreign" in the Portfolio of Investments) may be created and offered for investment. The "local" and "foreign shares" market values may differ. In the absence of trading of the foreign shares in such markets, the Portfolio values the foreign shares at the closing exchange price of the local shares.
4. Derivatives: The Portfolio may, but is not required to, use derivative instruments for a variety of purposes, including hedging, risk management, portfolio management or to earn income. Derivatives are financial instruments whose value is based, in part, on the value of an underlying asset, interest rate, index or financial instrument. Prevailing interest rates and volatility levels, among other things, also affect the value of derivative instruments. A derivative instrument often has risks similar to its underlying asset and may have additional risks, including imperfect correlation between the value of the derivative and the underlying asset, risks of default by the counterparty to certain transactions, magnification of losses incurred due to changes in the market value of the securities, instruments, indices or interest rates to which the derivative instrument relates, risks that the transactions may not be liquid and risks arising from margin requirements. The use of derivatives involves risks that are different from, and possibly greater than, the risks associated with other portfolio investments. Derivatives may involve the use of highly specialized instruments that require investment techniques and risk analyses different from those associated with other portfolio investments. All of the Portfolio's holdings, including derivative instruments, are marked-to-market each day with the change in value reflected in unrealized appreciation (depreciation). Upon disposition, a realized gain or loss is recognized.
Certain derivative transactions may give rise to a form of leverage. Leverage magnifies the potential for gain and the risk of loss. Leverage associated with derivative transactions may cause the Portfolio to liquidate portfolio positions when it may not be advantageous to do so to satisfy its obligations or to meet earmarking or segregation requirements, pursuant to applicable Securities and Exchange Commission rules and regulations, or may cause the Portfolio to be more volatile than if the Portfolio had not been leveraged. Although the Adviser seeks to use derivatives to further the Portfolio's investment objectives, there is no assurance that the use of derivatives will achieve this result.
Following is a description of the derivative instruments and techniques that the Portfolio used during the period and their associated risks:
Futures: A futures contract is a standardized, exchange-traded agreement to buy or sell a specific quantity of an underlying asset, reference rate or index at a specific
29
Morgan Stanley Institutional Fund, Inc.
Annual Report — December 31, 2015
Notes to Financial Statements (cont'd)
price at a specific future time. The value of a futures contract tends to increase and decrease in tandem with the value of the underlying instrument. Depending on the terms of the particular contract, futures contracts are settled through either physical delivery of the underlying instrument on the settlement date or by payment of a cash settlement amount on the settlement date. During the period the futures contract is open, payments are received from or made to the broker based upon changes in the value of the contract (the variation margin). A decision as to whether, when and how to use futures contracts involves the exercise of skill and judgment and even a well-conceived futures transaction may be unsuccessful because of market behavior or unexpected events. In addition to the derivatives risks discussed above, the prices of futures contracts can be highly volatile, using futures contracts can lower total return, and the potential loss from futures contracts can exceed the Portfolio's initial investment in such contracts. No assurance can be given that a liquid market will exist for any particular futures contract at any particular time. There is also the risk of loss by the Portfolio of margin deposits in the event of bankruptcy of a broker with which the Portfolio has open positions in the futures contract.
Foreign Currency Forward Exchange Contracts: In connection with its investments in foreign securities, the Portfolio also entered into contracts with banks, brokers or dealers to purchase or sell securities or foreign currencies at a future date. A foreign currency forward exchange contract ("currency contract") is a negotiated agreement between the contracting parties to exchange a specified amount of currency at a specified future time at a specified rate. The rate can be higher or lower than the spot rate between the currencies that are the subject of the contract. Currency contracts may be used to protect against uncertainty in the level of future foreign currency exchange rates or to gain or modify exposure to a particular currency. To the extent hedged by the use of currency contracts, the precise matching of the currency contract amounts and the value of the securities involved will not generally be possible because the future value of such securities in foreign currencies will change as a consequence of market movements in the value of those securities between the date on which the contract is entered into and the date it matures. Furthermore, such transactions may reduce or preclude the opportunity for
gain if the value of the currency should move in the direction opposite to the position taken. There is additional risk to the extent that currency contracts create exposure to currencies in which the Portfolio's securities are not denominated. Unanticipated changes in currency prices may result in poorer overall performance for the Portfolio than if it had not entered into such contracts. The use of currency contracts involves the risk of loss from the insolvency or bankruptcy of the counterparty to the contract or the failure of the counterparty to make payments or otherwise comply with the terms of the contract. A currency contract is marked-to-market daily and the change in market value is recorded by the Portfolio as unrealized gain or loss. The Portfolio records realized gains (losses) when the currency contract is closed equal to the difference between the value of the currency contract at the time it was opened and the value at the time it was closed.
FASB ASC 815, "Derivatives and Hedging" ("ASC 815"), is intended to improve financial reporting about derivative instruments by requiring enhanced disclosures to enable investors to better understand how and why the Portfolio uses derivative instruments, how these derivative instruments are accounted for and their effects on the Portfolio's financial position and results of operations.
The following tables set forth the fair value of the Portfolio's derivative contracts by primary risk exposure as of December 31, 2015.
| Asset Derivatives Statement of Assets and Liabilities Location | Primary Risk Exposure | Value (000) | |||||||||||||
| Foreign Currency Forward Exchange Contracts | Unrealized Appreciation on Foreign Currency Forward Exchange Contracts | Currency Risk | $ | 171 | |||||||||||
| Futures Contracts | Variation Margin on Futures Contracts | Equity Risk | 307 | (a) | |||||||||||
Total | $ | 478 | |||||||||||||
| Liability Derivatives Statement of Assets and Liabilities Location | Primary Risk Exposure | Value (000) | |||||||||||||
| Foreign Currency Forward Exchange Contracts | Unrealized Depreciation on Foreign Currency Forward Exchange Contracts | Currency Risk | $ | (117 | ) | ||||||||||
Futures Contracts | Variation Margin on Futures Contracts | Equity Risk | (46 | )(a) | |||||||||||
Total | $ | (163 | ) | ||||||||||||
(a) This amount represents the cumulative appreciation (depreciation) as reported in the Portfolio of Investments. The Statement of Assets and Liabilities only reflects the current day's net variation margin.
30
Morgan Stanley Institutional Fund, Inc.
Annual Report — December 31, 2015
Notes to Financial Statements (cont'd)
The following tables set forth by primary risk exposure the Portfolio's realized gains (losses) and change in unrealized appreciation (depreciation) by type of derivative contract for the year ended December 31, 2015 in accordance with ASC 815.
Realized Gain (Loss) | |||||||||||
Primary Risk Exposure | Derivative Type | Value (000) | |||||||||
Currency Risk | Foreign Currency Forward Exchange Contracts | $ | (2,866 | ) | |||||||
Equity Risk | Futures Contracts | 2,520 | |||||||||
Total | $ | (346 | ) | ||||||||
Change in Unrealized Appreciation (Depreciation) | |||||||||||
Primary Risk Exposure | Derivative Type | Value (000) | |||||||||
Currency Risk | Foreign Currency Forward Exchange Contracts | $ | 150 | ||||||||
Equity Risk | Futures Contracts | (547 | ) | ||||||||
Total | $ | (397 | ) | ||||||||
At December 31, 2015, the Portfolio's derivative assets and liabilities are as follows:
| Gross Amounts of Assets and Liabilities Presented in the Statement of Assets and Liabilities | |||||||||||
Derivatives(b) | Assets(c) (000) | Liabilities(c) (000) | |||||||||
| Foreign Currency Forward Exchange Contracts | $ | 171 | $ | (117 | ) | ||||||
(b) Excludes exchange traded derivatives.
(c) Absent an event of default or early termination, OTC derivative assets and liabilities are presented gross and not offset in the Statement of Assets and Liabilities.
The Portfolio typically enters into International Swaps and Derivatives Association, Inc. Master Agreements ("ISDA Master Agreements") or similar master agreements (collectively, "Master Agreements") with its contract counterparties for certain OTC derivatives in order to, among other things, reduce its credit risk to counterparties. ISDA Master Agreements include provisions for general obligations, representations, collateral and events of default or termination. Under an ISDA Master Agreement, the Portfolio typically may offset with the counterparty certain OTC derivative financial instruments' payables and/or receivables with collateral held and/or posted and create one single net payment (close-out netting) in the event of default, termination and/or potential deterioration in the credit quality of the counterparty. Various Master Agreements govern the terms of certain transactions with counterparties, including transactions such as swap, forward, repurchase and reverse repurchase agreements. These Master Agreements typically attempt to reduce the counterparty risk associated with such transactions by specifying credit protection mechanisms and providing standardization
that improves legal certainty. Cross-termination provisions under Master Agreements typically provide that a default in connection with one transaction between the Portfolio and a counterparty gives the non-defaulting party the right to terminate any other transactions in place with the defaulting party to create one single net payment due to/due from the defaulting party and may be a feature in certain Master Agreements. In the event the Portfolio exercises its right to terminate a Master Agreement after a counterparty experiences a termination event as defined in the Master Agreement, the return of collateral with market value in excess of the Portfolio's net liability may be delayed or denied.
The following tables present derivative financial instruments that are subject to enforceable netting arrangements as of December 31, 2015.
Gross Amounts Not Offset in the Statement of Assets and Liabilities | |||||||||||||||||||
Counterparty | Gross Asset Derivatives Presented in Statement of Assets and Liabilities (000) | Financial Instrument (000) | Collateral Received (000) | Net Amount (not less than $0) (000) | |||||||||||||||
Citibank NA | $ | 11 | $ | (2 | ) | $ | — | $ | 9 | ||||||||||
Credit Suisse International | 136 | — | — | 136 | |||||||||||||||
| State Street Bank and Trust Co. | 24 | (24 | ) | — | 0 | ||||||||||||||
Total | $ | 171 | $ | (26 | ) | $ | — | $ | 145 | ||||||||||
Gross Amounts Not Offset in the Statement of Assets and Liabilities | |||||||||||||||||||
Counterparty | Gross Liability Derivatives Presented in Statement of Assets and Liabilities (000) | Financial Instrument (000) | Collateral Pledged (000) | Net Amount (not less than $0) (000) | |||||||||||||||
Bank of New York Mellon | $ | 60 | $ | — | $ | — | $ | 60 | |||||||||||
Citibank NA | 2 | (2 | ) | — | 0 | ||||||||||||||
| Goldman Sachs International | 2 | — | — | 2 | |||||||||||||||
Northern Trust Company | 17 | — | — | 17 | |||||||||||||||
| State Street Bank and Trust Co. | 36 | (24 | ) | — | 12 | ||||||||||||||
Total | $ | 117 | $ | (26 | ) | $ | — | $ | 91 | ||||||||||
For the year ended December 31, 2015, the approximate average monthly amount outstanding for each derivative type is as follows:
Foreign Currency Forward Exchange Contracts: | |||||||
Average monthly principal amount | $ | 69,545,000 | |||||
Futures Contracts: | |||||||
Average monthly original value | $ | 52,034,000 | |||||
31
Morgan Stanley Institutional Fund, Inc.
Annual Report — December 31, 2015
Notes to Financial Statements (cont'd)
5. Securities Lending: The Portfolio lends securities to qualified financial institutions, such as broker-dealers, to earn additional income. Any increase or decrease in the fair value of the securities loaned that might occur and any interest earned or dividends declared on those securities during the term of the loan would remain in the Portfolio. The Portfolio would receive cash or securities as collateral in an amount equal to or exceeding 100% of the current fair value of the loaned securities. The collateral is marked-to-market daily by State Street Bank and Trust Company ("State Street"), the securities lending agent, to ensure that a minimum of 100% collateral coverage is maintained.
Based on pre-established guidelines, the securities lending agent invests any cash collateral that is received in an affiliated money market portfolio and repurchase agreements. Securities lending income is generated from the earnings on the invested collateral and borrowing fees, less any rebates owed to the borrowers and compensation to the lending agent, and is recorded as "Income from Securities Loaned — Net" in the Portfolio's Statement of Operations. Risks in securities lending transactions are that a borrower may not provide additional collateral when required or return the securities when due, and that the value of the short-term investments will be less than the amount of cash collateral plus any rebate that is required to be returned to the borrower.
The Portfolio has the right under the lending agreement to recover the securities from the borrower on demand.
The following table presents financial instruments that are subject to enforceable netting arrangements as of December 31, 2015.
Gross Amounts Not Offset in the Statement of Assets and Liabilities | |||||||||||||||
| Gross Asset Amounts Presented in Statement of Assets and Liabilities (000) | Financial Instrument (000) | Collateral Received (000) | Net Amount (not less than $0) (000) | ||||||||||||
| $ | 5,775 | (d) | $ | — | $ | (5,775 | )(e)(f) | $ | 0 | ||||||
(d) Represents market value of loaned securities at period end.
(e) The Portfolio received cash collateral of approximately $5,829,000, of which approximately $5,445,000 was subsequently invested in Repurchase Agreements and Morgan Stanley Institutional Liquidity Funds as reported in the Portfolio of Investments. As of December 31, 2015, there was uninvested cash of approximately $384,000, which is not reflected in the Portfolio of Investments. In addition, the Portfolio received non-cash collateral of approximately $247,000 in the form of U.S. Government obligations, which the Portfolio cannot sell or repledge, and accordingly are not reflected in the Portfolio of Investments.
(f) The actual collateral received is greater than the amount shown here due to overcollateralization.
The Portfolio has adopted the disclosure provisions of FASB Accounting Standards Update No. 2014-11 ("ASU No. 2014-11"), "Transfers & Servicing (Topic 860): Repurchase-to-Maturity Transactions, Repurchase Financings, and Disclosures". ASU No. 2014-11 is intended to provide increased transparency about the types of collateral pledged in securities lending transactions and other similar transactions that are accounted for as secured borrowing.
The following table displays a breakdown of transactions accounted for as secured borrowings, the gross obligations by class of collateral pledged, and the remaining contractual maturity of those transactions as of December 31, 2015.
Remaining Contractual Maturity of the Agreements As of December 31, 2015 | |||||||||||||||||||||||
| Overnight and Continuous (000) | Between <30 days (000) | 30 & 90 days (000) | >90 days (000) | Total (000) | |||||||||||||||||||
Securities Lending Transactions | |||||||||||||||||||||||
Common Stocks | $ | 5,829 | $ | — | $ | — | $ | — | $ | 5,829 | |||||||||||||
Total Borrowings | $ | 5,829 | $ | — | $ | — | $ | — | $ | 5,829 | |||||||||||||
Gross amount of recognized liabilities for securities lending transactions | $ | 5,829 | |||||||||||||||||||||
32
Morgan Stanley Institutional Fund, Inc.
Annual Report — December 31, 2015
Notes to Financial Statements (cont'd)
6. Redemption Fees: The Portfolio will assess a 2% redemption fee on Class I shares, Class A shares, Class L shares and Class C shares, which is paid directly to the Portfolio, for shares redeemed or exchanged within thirty days of purchase, subject to certain exceptions. The redemption fee is designed to protect the Portfolio and its remaining shareholders from the effects of short-term trading. These fees, if any, are included in the Statements of Changes in Net Assets.
7. Indemnifications: The Fund enters into contracts that contain a variety of indemnifications. The Fund's maximum exposure under these arrangements is unknown. However, the Fund has not had prior claims or losses pursuant to these contracts and expects the risk of loss to be remote.
8. Dividends and Distributions to Shareholders: Dividend income and distributions to shareholders are recorded on the ex-dividend date. Dividends from net investment income, if any, are declared and paid annually. Net realized capital gains, if any, are distributed at least annually.
9. Security Transactions, Income and Expenses: Security transactions are accounted for on the trade date (date the order to buy or sell is executed). Realized gains and losses on the sale of investment securities are determined on the specific identified cost method. Dividend income and other distributions are recorded on the ex-dividend date (except for certain foreign dividends which may be recorded as soon as the Portfolio is informed of such dividends) net of applicable withholding taxes. Interest income is recognized on the accrual basis except where collection is in doubt. Discounts are accreted and premiums are amortized over the life of the respective securities. Most expenses of the Fund can be directly attributed to a particular Portfolio. Expenses which cannot be directly attributed are apportioned among the Portfolios based upon relative net assets or other appropriate methods. Income, expenses (other than class specific expenses — distribution and shareholder services, transfer agency and sub transfer agency fees) and realized and unrealized gains or losses are allocated to each class of shares based upon their relative net assets.
The Portfolio owns shares of real estate investment trusts ("REITs") which report information on the source of their distributions annually in the following calendar
year. A portion of distributions received from REITs during the year is estimated to be a return of capital and is recorded as a reduction of their cost.
B. Advisory Fees: The Adviser, a wholly-owned subsidiary of Morgan Stanley, provides the Portfolio with advisory services under the terms of an Investment Advisory Agreement, paid quarterly, at the annual rate based on the daily net assets as follows:
| First $1 billion | Over $1 billion | ||||||
| 0.65 | % | 0.60 | % | ||||
For the year ended December 31, 2015, the advisory fee rate (net of rebate) was equivalent to an annual effective rate of 0.64% of the Portfolio's average daily net assets.
The Adviser has agreed to reduce its advisory fee and/or reimburse the Portfolio so that total annual portfolio operating expenses, excluding certain investment related expenses, taxes, interest and other extraordinary expenses (including litigation), will not exceed 0.90% for Class I shares, 1.25% for Class A shares, 1.75% for Class L shares and 2.00% for Class C shares. The fee waivers and/or expense reimbursements will continue for at least one year from the date of the Portfolio's prospectus or until such time as the Directors act to discontinue all or a portion of such waivers and/or reimbursements when they deem such action is appropriate. For the year ended December 31, 2015, approximately $77,000 of other expenses were reimbursed by the Adviser pursuant to this arrangement.
C. Administration Fees: The Adviser also serves as Administrator to the Fund and provides administrative services pursuant to an Administration Agreement for an annual fee, accrued daily and paid monthly, of 0.08% of the Portfolio's average daily net assets.
Under a Sub-Administration Agreement between the Administrator and State Street, State Street provides certain administrative services to the Fund. For such services, the Administrator pays State Street a portion of the fee the Administrator receives from the Portfolio.
D. Distribution and Shareholder Services Fees: Morgan Stanley Distribution, Inc. ("MSDI" or the "Distributor"), a wholly-owned subsidiary of the Adviser and an indirect subsidiary of Morgan Stanley, serves as the Fund's Distributor of Portfolio shares pursuant to a Distribution Agreement. The Fund has adopted a Shareholder Services Plan with respect to Class A shares pursuant to Rule 12b-1 under the Act. Under the Shareholder Services Plan, the
33
Morgan Stanley Institutional Fund, Inc.
Annual Report — December 31, 2015
Notes to Financial Statements (cont'd)
Portfolio pays the Distributor a shareholder services fee, accrued daily and paid monthly, at an annual rate of 0.25% of the Portfolio's average daily net assets attributable to Class A shares.
The Fund has adopted a Distribution and Shareholder Services Plan with respect to Class L shares pursuant to Rule 12b-1 under the Act. Under the Distribution and Shareholder Services Plan, the Portfolio pays the Distributor a distribution fee, accrued daily and paid monthly, at an annual rate of 0.50% and a shareholder services fee, accrued daily and paid monthly, at an annual rate of 0.25% of the Portfolio's average daily net assets attributable to Class L shares.
The Fund has adopted a Distribution and Shareholder Services Plan with respect to Class C shares pursuant to Rule 12b-1 under the Act. Under the Distribution and Shareholder Services Plan, the Portfolio pays the Distributor a distribution fee, accrued daily and paid monthly, at an annual rate of 0.75% and a shareholder services fee, accrued daily and paid monthly, at an annual rate of 0.25% of the Portfolio's average daily net assets attributable to Class C shares.
The distribution and shareholder services fees are used to support the expenses associated with servicing and maintaining accounts. The Distributor may compensate other parties for providing shareholder support services to investors who purchase Class A, Class L and Class C shares.
E. Dividend Disbursing and Transfer Agent: The Fund's dividend disbursing and transfer agent is Boston Financial Data Services, Inc. ("BFDS"). Pursuant to a Transfer Agency Agreement, the Fund pays BFDS a fee based on the number of classes, accounts and transactions relating to the Portfolios of the Fund.
F. Custodian Fees: State Street (the "Custodian") serves as Custodian for the Fund in accordance with a Custodian Agreement. The Custodian holds cash, securities, and other assets of the Fund as required by the Act. Custody fees are payable monthly based on assets held in custody, investment purchases and sales activity and account maintenance fees, plus reimbursement for certain out-of-pocket expenses.
G. Security Transactions and Transactions with Affiliates: For the year ended December 31, 2015, purchases and sales of investment securities for the Portfolio, other than long-term U.S. Government securities and short-term investments, were approximately $80,884,000 and $89,654,000, respectively. There were no purchases and sales of long-term U.S. Government securities for the year ended December 31, 2015.
The Portfolio invests in the Institutional Class of the Morgan Stanley Institutional Liquidity Funds — Money Market Portfolio (the "Liquidity Funds"), an open-end management investment company managed by the Adviser, both directly and as a portion of the securities held as collateral on loaned securities. Advisory fees paid by the Portfolio are reduced by an amount equal to its pro-rata share of the advisory and administration fees paid by the Portfolio due to its investment in the Liquidity Funds. For the year ended December 31, 2015, advisory fees paid were reduced by approximately $24,000 relating to the Portfolio's investment in the Liquidity Funds.
A summary of the Portfolio's transactions in shares of the Liquidity Funds during the year ended December 31, 2015 is as follows:
| Value December 31, 2014 (000) | Purchases at Cost (000) | Sales (000) | Dividend Income (000) | Value December 31, 2015 (000) | |||||||||||||||
| $ | 34,576 | $ | 85,496 | $ | 100,707 | $ | 41 | $ | 19,365 | ||||||||||
The Portfolio had transactions with Mitsubishi UFJ Financial Group, Inc. and its affiliated broker-dealers, which may be deemed affiliates of the Adviser/Administrator and Distributor under Section 17 the Act.
A summary of the Portfolio's transactions in shares of the Mitsubishi UFJ Financial Group, Inc. during the year ended December 31, 2015 is as follows:
| Value December 31, 2014 (000) | Purchases at Cost (000) | Sales (000) | Realized Gain (000) | Dividend Income (000) | Value December 31, 2015 (000) | ||||||||||||||||||
| $ | 839 | $ | — | $ | — | $ | — | $ | 21 | $ | 948 | ||||||||||||
The Portfolio has an unfunded Deferred Compensation Plan (the "Compensation Plan"), which allows each independent Director to defer payment of all, or a portion, of the fees he or she receives for serving on the Board of Directors. Each eligible Director generally may elect to have the deferred amounts credited with a return equal to the total return on one or more of the Morgan Stanley funds that are offered as investment options under the Compensation Plan. Appreciation/depreciation and distributions received from these investments are recorded with an offsetting increase/decrease in the deferred compensation obligation and do not affect the NAV of the Portfolio.
H. Federal Income Taxes: It is the Portfolio's intention to continue to qualify as a regulated investment company and distribute all of its taxable and tax-exempt income. Accordingly, no provision for Federal income taxes is required in the financial statements.
34
Morgan Stanley Institutional Fund, Inc.
Annual Report — December 31, 2015
Notes to Financial Statements (cont'd)
The Portfolio may be subject to taxes imposed by countries in which it invests. Such taxes are generally based on income and/or capital gains earned or repatriated. Taxes are accrued based on net investment income, net realized gains and net unrealized appreciation as such income and/or gains are earned. Taxes may also be based on transactions in foreign currency and are accrued based on the value of investments denominated in such currency.
FASB ASC 740-10, "Income Taxes — Overall", sets forth a minimum threshold for financial statement recognition of the benefit of a tax position taken or expected to be taken in a tax return. Management has concluded there are no significant uncertain tax positions that would require recognition in the financial statements. If applicable, the Portfolio recognizes interest accrued related to unrecognized tax benefits in "Interest Expense" and penalties in "Other Expenses" in the Statement of Operations. The Portfolio files tax returns with the U.S. Internal Revenue Service, New York and various states. Generally, each of the tax years in the four-year period ended December 31, 2015, remains subject to examination by taxing authorities.
The tax character of distributions paid may differ from the character of distributions shown in the Statements of Changes in Net Assets due to short-term capital gains being treated as ordinary income for tax purposes. The tax character of distributions paid during fiscal 2015 and 2014 was as follows:
| 2015 Distributions Paid From: | 2014 Distributions Paid From: | ||||||||||||||
| Ordinary Income (000) | Long-Term Capital Gain (000) | Ordinary Income (000) | Long-Term Capital Gain (000) | ||||||||||||
| $ | 2,323 | $ | — | $ | 7,870 | $ | — | ||||||||
The amount and character of income and gains to be distributed are determined in accordance with income tax regulations which may differ from GAAP. These book/tax differences are either considered temporary or permanent in nature.
Temporary differences are primarily due to differing book and tax treatments in the timing of the recognition of gains (losses) on certain investment transactions and the timing of the deductibility of certain expenses.
Permanent differences, primarily due to differing treatments of gains (losses) related to foreign currency transactions and basis adjustments on certain equity securities designated as passive foreign investment companies, resulted in the following
reclassifications among the components of net assets at December 31, 2015:
| Distributions in Excess of Net Investment Income (000) | Accumulated Net Realized Loss (000) | Paid-in-Capital (000) | |||||||||
| $ | (3,131 | ) | $ | 3,131 | $ | — | |||||
At December 31, 2015, the Portfolio had no distributable earnings on a tax basis.
At December 31, 2015, the Portfolio had available for Federal income tax purposes unused long-term capital losses of approximately $10,070,000 that do not have an expiration date.
In addition, at December 31, 2015, the Portfolio had available capital loss carryforwards to offset future net capital gains, to the extent provided by regulations, through the indicated expiration dates:
| Amount (000) | Expiration* | ||||||
| $ | 7,834 | December 31, 2016 | |||||
| 33,505 | December 31, 2017 | ||||||
* Includes capital losses acquired from Morgan Stanley International Fund that may be subject to limitation under IRC Section 382 in future years.
To the extent that capital loss carryforwards are used to offset any future capital gains realized during the carryover period as provided by U.S. Federal income tax regulations, no capital gains tax liability will be incurred by the Portfolio for gains realized and not distributed. To the extent that capital gains are offset, such gains will not be distributed to the shareholders.
Capital losses and specified ordinary losses, including currency losses, incurred after October 31 but within the taxable year are deemed to arise on the first day of the Portfolio's next taxable year. For the year ended December 31, 2015, the Portfolio deferred to January 1, 2016 for U.S. Federal income tax purposes the following losses:
| Post-October Currency and Specified Ordinary Losses (000) | Post-October Capital Losses (000) | ||||||
| $ | 157 | $ | — | ||||
I. Other: At December 31, 2015, the Portfolio had record owners of 10% or greater. Investment activities of these shareholders could have a material impact on the Portfolio. The aggregate percentage of such owners was 85.5%.
35
Morgan Stanley Institutional Fund, Inc.
Annual Report — December 31, 2015
Report of Independent Registered Public Accounting Firm
To the Shareholders and Board of Directors of
Morgan Stanley Institutional Fund, Inc. —
Active International Allocation Portfolio
We have audited the accompanying statement of assets and liabilities, including the portfolio of investments, of Active International Allocation Portfolio (one of the portfolios constituting Morgan Stanley Institutional Fund, Inc.) (the "Portfolio") as of December 31, 2015, and the related statement of operations for the year then ended, the statements of changes in net assets for each of the two years in the period then ended and the financial highlights for each of the years or periods indicated therein. These financial statements and financial highlights are the responsibility of the Portfolio's management. Our responsibility is to express an opinion on these financial statements and financial highlights based on our audits.
We conducted our audits in accordance with the standards of the Public Company Accounting Oversight Board (United States). Those standards require that we plan and perform the audit to obtain reasonable assurance about whether the financial statements and financial highlights are free of material misstatement. We were not engaged to perform an audit of the Portfolio's internal control over financial reporting. Our audits included consideration of internal control over financial reporting as a basis for designing audit procedures that are appropriate in the circumstances, but not for the purpose of expressing an opinion on the effectiveness of the Portfolio's internal control over financial reporting. Accordingly, we express no such opinion. An audit also includes examining, on a test basis, evidence supporting the amounts and disclosures in the financial statements and financial highlights, assessing the accounting principles used and significant estimates made by management, and evaluating the overall financial statement presentation. Our procedures included confirmation of securities owned as of December 31, 2015, by correspondence with the custodian and others or by other appropriate auditing procedures where replies from others were not received. We believe that our audits provide a reasonable basis for our opinion.
In our opinion, the financial statements and financial highlights referred to above present fairly, in all material respects, the financial position of Active International Allocation Portfolio (one of the portfolios constituting Morgan Stanley Institutional Fund, Inc.) at December 31, 2015, the results of its operations for the year then ended, the changes in its net assets for each of the two years in the period then ended and the financial highlights for each of the years or periods indicated therein, in conformity with U.S. generally accepted accounting principles.

Boston, Massachusetts
February 26, 2016
36
Morgan Stanley Institutional Fund, Inc.
Annual Report — December 31, 2015
Federal Tax Notice (unaudited)
For Federal income tax purposes, the following information is furnished with respect to the Portfolio's earnings for its taxable year ended December 31, 2015. When distributed, certain earnings may be subject to a maximum tax rate of 15% as provided for the Jobs and Growth Tax Relief Reconciliation Act of 2003. The Portfolio designated up to a maximum of approximately $2,633,000 as taxable at this lower rate.
The Portfolio intends to pass through foreign tax credits of approximately $310,000 and has derived net income from sources within foreign countries amounting to approximately $7,900,000.
In January, the Portfolio provides tax information to shareholders for the preceding calendar year.
37
Morgan Stanley Institutional Fund, Inc.
Annual Report — December 31, 2015
U.S. Privacy Policy (unaudited)
AN IMPORTANT NOTICE CONCERNING OUR U.S. PRIVACY POLICY
This privacy notice describes the U.S. privacy policy of Morgan Stanley Distribution, Inc., and the Morgan Stanley family of mutual funds ("us", "our", "we").
We are required by federal law to provide you with notice of our U.S. privacy policy ("Policy"). This Policy applies to both our current and former clients unless we state otherwise and is intended for individual clients who purchase products or receive services from us for personal, family or household purposes. This Policy is not applicable to partnerships, corporations, trusts or other non-individual clients or account holders, nor is this Policy applicable to individuals who are either beneficiaries of a trust for which we serve as trustee or participants in an employee benefit plan administered or advised by us. This Policy is, however, applicable to individuals who select us to be a custodian of securities or assets in individual retirement accounts, 401(k) accounts, or accounts subject to the Uniform Gifts to Minors Act.
This notice sets out our business practices to protect your privacy; how we collect and share personal information about you; and how you can limit our sharing or certain uses by others of this information. We may amend this Policy at any time, and will inform you of any changes to our Policy as required by law.
WE RESPECT YOUR PRIVACY
We appreciate that you have provided us with your personal financial information and understand your concerns about your information. We strive to safeguard the information our clients entrust to us. Protecting the confidentiality and security of client information is an important part of how we conduct our business.
This notice describes what personal information we collect about you, how we collect it, when we may share it with others, and how certain others may use it. It discusses the steps you may take to limit our sharing of certain information about you with our affiliated companies, including, but not limited to our affiliated banking businesses, brokerage firms and credit service affiliates. It also discloses how you may limit our affiliates' use of shared information for marketing purposes.
Throughout this Policy, we refer to the nonpublic information that personally identifies you as "personal information." We also use the term "affiliated company" in this notice. An affiliated company is a company in our family of companies and includes companies with the Morgan Stanley name. These affiliated companies are financial institutions such as broker-dealers, banks, investment advisers and credit card issuers. We refer to any company that is not an affiliated company as a nonaffiliated third party. For purposes of Section 5 of this notice, and your ability to limit certain uses of personal information by our affiliates, this notice applies to the use of personal information by our affiliated companies.
1. WHAT PERSONAL INFORMATION DO WE COLLECT FROM YOU?
We may collect the following types of information about you: (i) information provided by you, including information from applications and other forms we receive from you, (ii) information about your transactions with us or our affiliates, (iii) information about your transactions with nonaffiliated third parties, (iv) information from consumer reporting agencies, (v) information obtained from our websites, and (vi) information obtained from other sources. For example:
• We collect information such as your name, address, e-mail address, telephone/fax numbers, assets, income and investment objectives through applications and other forms you submit to us.
• We may obtain information about account balances, your use of account(s) and the types of products and services you prefer to receive from us through your dealings and transactions with us and other sources.
• We may obtain information about your creditworthiness and credit history from consumer reporting agencies.
• We may collect background information from and through third-party vendors to verify representations you have made and to comply with various regulatory requirements.
2. WHEN DO WE DISCLOSE PERSONAL INFORMATION WE COLLECT ABOUT YOU?
We may disclose personal information we collect about you in each of the categories listed above to affiliated and nonaffiliated third parties.
38
Morgan Stanley Institutional Fund, Inc.
Annual Report — December 31, 2015
U.S. Privacy Policy (unaudited) (cont'd)
a. Information We Disclose to Affiliated Companies.
We may disclose personal information that we collect about you to our affiliated companies to manage your account(s) effectively, to service and process your transactions, and to let you know about products and services offered by us and affiliated companies, to manage our business, and as otherwise required or permitted by law. Offers for products and services from affiliated companies are developed under conditions designed to safeguard your personal information.
b. Information We Disclose to Third Parties.
We may disclose personal information that we collect about you to nonaffiliated third parties to provide marketing services on our behalf or to other financial institutions with whom we have joint marketing agreements. We may also disclose all of the information we collect to other nonaffiliated third parties for our everyday business purposes, such as to process transactions, maintain account(s), respond to court orders and legal investigations, report to credit bureaus, offer our own products and services, protect against fraud, for institutional risk control, to perform services on our behalf, and as otherwise required or permitted by law.
When we share personal information about you with a nonaffiliated third party, they are required to limit their use of personal information about you to the particular purpose for which it was shared and they are not allowed to share personal information about you with others except to fulfill that limited purpose or as may be permitted or required by law.
3. HOW DO WE PROTECT THE SECURITY AND CONFIDENTIALITY OF PERSONAL INFORMATION WE COLLECT ABOUT YOU?
We maintain physical, electronic and procedural security measures that comply with applicable law and regulations to help safeguard the personal information we collect about you. We have internal policies governing the proper handling of client information by employees. Third parties that provide support or marketing services on our behalf may also receive personal information about you, and we require them to adhere to appropriate security standards with respect to such information.
4. HOW CAN YOU LIMIT OUR SHARING CERTAIN PERSONAL INFORMATION ABOUT YOU WITH OUR AFFILIATED COMPANIES FOR ELIGIBILITY DETERMINATION?
By following the opt-out procedures in Section 6 below, you may limit the extent to which we share with our affiliated companies, personal information that was collected to determine your eligibility for products and services such as your credit reports and other information that you have provided to us or that we may obtain from third parties ("eligibility information"). Eligibility information does not include your identification information or personal information pertaining to our transactions or experiences with you. Please note that, even if you direct us not to share eligibility information with our affiliated companies, we may still share your personal information, including eligibility information, with our affiliated companies under circumstances that are permitted under applicable law, such as to process transactions or to service your account.
5. HOW CAN YOU LIMIT THE USE OF CERTAIN PERSONAL INFORMATION ABOUT YOU BY OUR AFFILIATED COMPANIES FOR MARKETING?
By following the opt-out instructions in Section 6 below, you may limit our affiliated companies from marketing their products or services to you based on personal information we disclose to them. This information may include, for example, your income and account history with us. Please note that, even if you choose to limit our affiliated companies from using personal information about you that we may share with them for marketing their products and services to you, our affiliated companies may use your personal information that they obtain from us to market to you in circumstances permitted by law, such as if the affiliated party has its own relationship with you.
39
Morgan Stanley Institutional Fund, Inc.
Annual Report — December 31, 2015
U.S. Privacy Policy (unaudited) (cont'd)
6. HOW CAN YOU SEND US AN OPT-OUT INSTRUCTION?
If you wish to limit our sharing of eligibility information about you with our affiliated companies, or our affiliated companies' use of personal information for marketing purposes, as described in this notice, you may do so by:
• Calling us at (800) 548-7786
Monday–Friday between 8a.m. and 6p.m. (EST)
• Writing to us at the following address:
Boston Financial Data Services, Inc.
c/o Privacy Coordinator
P.O. Box 219804
Kansas City, Missouri 64121
If you choose to write to us, your request should include: your name, address, telephone number and account number(s) to which the opt-out applies and whether you are opting out with respect to sharing of eligibility information (Section 4 above), or information used for marketing (Section 5 above), or both. Written opt-out requests should not be sent with any other correspondence. In order to process your request, we require that the request be provided by you directly and not through a third party. Once you have informed us about your privacy preferences, your opt-out preference will remain in effect with respect to this Policy (as it may be amended) until you notify us otherwise. If you are a joint account owner, we will accept instructions from any one of you and apply those instructions to the entire account.
Please understand that if you limit our sharing or our affiliated companies' use of personal information, you and any joint account holder(s) may not receive information about our affiliated companies' products and services, including products or services that could help you manage your financial resources and achieve your investment objectives.
If you have more than one account or relationship with us, please specify the accounts to which you would like us to apply your privacy choices. If you have accounts or relationships with our affiliates, you may receive multiple privacy policies from them, and will need to separately notify those companies of your privacy choices for those accounts or relationships.
7. WHAT IF AN AFFILIATED COMPANY BECOMES A NONAFFILIATED THIRD PARTY?
If, at any time in the future, an affiliated company becomes a nonaffiliated third party, further disclosures of personal information made to the former affiliated company will be limited to those described in Section 2(b) above relating to nonaffiliated third parties. If you elected under Section 6 to limit disclosures we make to affiliated companies, or use of personal information by affiliated companies, your election will not apply to use by any former affiliated company of your personal information in their possession once it becomes a nonaffiliated third party.
SPECIAL NOTICE TO RESIDENTS OF VERMONT
The following section supplements our Policy with respect to our individual clients who have a Vermont address and supersedes anything to the contrary in the above Policy with respect to those clients only.
The State of Vermont requires financial institutions to obtain your consent prior to sharing personal information that they collect about you with nonaffiliated third parties, or eligibility information with affiliated companies, other than in certain limited circumstances. Except as permitted by law, we will not share personal information we collect about you with nonaffiliated third parties or eligibility information with affiliated companies, unless you provide us with your written consent to share such information.
SPECIAL NOTICE TO RESIDENTS OF CALIFORNIA
The following section supplements our Policy with respect to our individual clients who have a California address and supersedes anything to the contrary in the above Policy with respect to those clients only.
In response to a California law, if your account has a California home address, your personal information will not be disclosed to nonaffiliated third parties except as permitted by applicable California law, and we will limit sharing such personal information with our affiliates to comply with California privacy laws that apply to us.
40
Morgan Stanley Institutional Fund, Inc.
Annual Report — December 31, 2015
Director and Officer Information (unaudited)
Independent Directors:
| Name, Age and Address of Independent Director | Positions(s) Held with Registrant | Length of Time Served* | Principal Occupation(s) During Past 5 Years and Other Relevant Professional Experience | Number of Portfolios in Fund Complex Overseen by Director** | Other Directorships Held by Independent Director*** | ||||||||||||||||||
| Frank L. Bowman (71) c/o Kramer Levin Naftalis & Frankel LLP Counsel to the Independent Directors 1177 Avenue of the Americas New York, NY 10036 | Director | Since August 2006 | President, Strategic Decisions, LLC (consulting) (since February 2009); Director or Trustee of various Morgan Stanley Funds (since August 2006); Chairperson of the Compliance and Insurance Committee (since October 2015); Formerly, Chairperson of the Insurance Sub-Committee of the Compliance and Insurance Committee (February 2007-December 2015); served as President and Chief Executive Officer of the Nuclear Energy Institute (policy organization) (February 2005-November 2008); retired as Admiral, U.S. Navy after serving over 38 years on active duty including 8 years as Director of the Naval Nuclear Propulsion Program in the Department of the Navy and the U.S. Department of Energy (1996-2004); served as Chief of Naval Personnel (July 1994-September 1996); and on the Joint Staff as Director of Political Military Affairs (June 1992-July1994); knighted as Honorary Knight Commander of the Most Excellent Order of the British Empire; awarded the Officier de l'Orde National du Mérite by the French Government; elected to the National Academy of Engineering (2009). | 98 | Director of BP p.l.c.; Director of Naval and Nuclear Technologies LLP; Director Emeritus of the Armed Services YMCA; Director of the U.S. Naval Submarine League; Member of National Security Advisory Council of the Center for U.S. Global Engagement and a member of the CNA Military Advisory Board; Chairman of the Charity, J Street Cup Golf, Trustee of Fairhaven United Methodist Church; and Director of other various non-profit organizations. | ||||||||||||||||||
| Kathleen A. Dennis (62) c/o Kramer Levin Naftalis & Frankel LLP Counsel to the Independent Directors 1177 Avenue of the Americas New York, NY 10036 | Director | Since August 2006 | President, Cedarwood Associates (mutual fund and investment management consulting) (since July 2006); Chairperson of the Money Market and Alternatives Sub-Committee of the Investment Committee (since October 2006) and Director or Trustee of various Morgan Stanley Funds (since August 2006); formerly, Senior Managing Director of Victory Capital Management (1993-2006). | 98 | Director of various nonprofit organizations. | ||||||||||||||||||
| Nancy C. Everett (61) c/o Kramer Levin Naftalis & Frankel LLP Counsel to the Independent Directors 1177 Avenue of the Americas New York, NY 10036 | Director | Since January 2015 | Chief Executive Officer, Virginia Commonwealth University Investment Company (since November 2015); Owner, OBIR, LLC (investment management consulting) (since June 2014); formerly, Managing Director, BlackRock Inc. (February 2011-December 2013); and Chief Executive Officer, General Motors Asset Management (a/k/a Promark Global Advisors, Inc.) (June 2005-May 2010). | 98 | Member of Virginia Commonwealth University School of Business Foundation; formerly, Member of Virginia Commonwealth University Board of Visitors (2013-2015); Member of Committee on Directors for Emerging Markets Growth Fund, Inc. (2007-2010); Chairperson of Performance Equity Management, LLC (2006-2010); and Chairperson, GMAM Absolute Return Strategies Fund, LLC (2006-2010). | ||||||||||||||||||
41
Morgan Stanley Institutional Fund, Inc.
Annual Report — December 31, 2015
Director and Officer Information (unaudited) (cont'd)
Independent Directors: (cont'd)
| Name, Age and Address of Independent Director | Positions(s) Held with Registrant | Length of Time Served* | Principal Occupation(s) During Past 5 Years and Other Relevant Professional Experience | Number of Portfolios in Fund Complex Overseen by Director** | Other Directorships Held by Independent Director*** | ||||||||||||||||||
| Jakki L. Haussler (58) c/o Kramer Levin Naftalis & Frankel LLP Counsel to the Independent Directors 1177 Avenue of the Americas New York, NY 10036 | Director | Since January 2015 | Chairman and Chief Executive Officer, Opus Capital Group (since January 1996); and formerly, Director, Capvest Venture Fund, LP (May 2000-December 2011); Partner, Adena Ventures, LP (July 1999-December 2010); Director, The Victory Funds (February 2005-July 2008). | 98 | Director of Cincinnati Bell Inc. and Member, Audit Committee and Compensation Committee; Director of Northern Kentucky University Foundation and Member, Investment Committee; Member of Chase College of Law Transactional Law Practice Center Board of Advisors; Director of Best Transport; Chase College of Law Board of Visitors; formerly Member, University of Cincinnati Foundation Investment Committee; Member, Miami University Board of Visitors (2008-2011); Trustee of Victory Funds (2005-2008) and Chairman, Investment Committee (2007-2008) and Member, Service Provider Committee (2005-2008). | ||||||||||||||||||
| Dr. Manuel H. Johnson (67) c/o Johnson Smick International, Inc. 220 I Street, N.E. — Suite 200 Washington, D.C. 20002 | Director | Since July 1991 | Senior Partner, Johnson Smick International, Inc. (consulting firm); Chairperson of the Investment Committee (since October 2006) and Director or Trustee of various Morgan Stanley Funds (since July 1991); Co-Chairman and a founder of the Group of Seven Council (G7C) (international economic commission); formerly Chairperson of the Audit Committee (July 1991-September 2006), Vice Chairman of the Board of Governors of the Federal Reserve System and Assistant Secretary of the U.S. Treasury. | 100 | Director of NVR, Inc. (home construction). | ||||||||||||||||||
| Joseph J. Kearns (73) c/o Kearns & Associates LLC 23823 Malibu Road S-50-440 Malibu, CA 90265 | Director | Since August 1994 | President, Kearns & Associates LLC (investment consulting); Chairperson of the Audit Committee (since October 2006) and Director or Trustee of various Morgan Stanley Funds (since August 1994); formerly, Deputy Chairperson of the Audit Committee (July 2003-September 2006) and Chairperson of the Audit Committee of various Morgan Stanley Funds (since August 1994); CFO of the J. Paul Getty Trust. | 101 | Director of Electro Rent Corporation (equipment leasing). Prior to December 31, 2013, Director of The Ford Family Foundation. | ||||||||||||||||||
42
Morgan Stanley Institutional Fund, Inc.
Annual Report — December 31, 2015
Director and Officer Information (unaudited) (cont'd)
Independent Directors: (cont'd)
| Name, Age and Address of Independent Director | Positions(s) Held with Registrant | Length of Time Served* | Principal Occupation(s) During Past 5 Years and Other Relevant Professional Experience | Number of Portfolios in Fund Complex Overseen by Director** | Other Directorships Held by Independent Director*** | ||||||||||||||||||
| Michael F. Klein (57) c/o Kramer Levin Naftalis & Frankel LLP Counsel to the Independent Directors 1177 Avenue of the Americas New York, NY 10036 | Director | Since August 2006 | Managing Director, Aetos Capital, LLC (since March 2000); Co-President, Aetos Alternatives Management, LLC (since January 2004); and Co-Chief Executive Officer of Aetos Capital LLC (since August 2013); Chairperson of the Fixed Income Sub-Committee of the Investment Committee (since October 2006) and Director or Trustee of various Morgan Stanley Funds (since August 2006); formerly, Managing Director, Morgan Stanley & Co. Inc. and Morgan Stanley Dean Witter Investment Management, President, various Morgan Stanley Funds (June1998-March 2000) and Principal, Morgan Stanley & Co. Inc. and Morgan Stanley Dean Witter Investment Management (August 1997-December 1999). | 97 | Director of certain investment funds managed or sponsored by Aetos Capital, LLC. Director of Sanitized AG and Sanitized Marketing AG (specialty chemicals). | ||||||||||||||||||
| Michael E. Nugent (79) 522 Fifth Avenue New York, NY 10036 | Chair of the Board and Director | Chair of the Boards since July 2006 and Director since July 1991 | Chair of the Boards of various Morgan Stanley Funds (since July 2006); Chairperson of the Closed-End Fund Committee (since June 2012) and Director or Trustee of various Morgan Stanley Funds (since July 1991); formerly, Chairperson of the Insurance Committee (until July 2006), General Partner, TriumphCapital, L.P. (private investment partnership) (1988-2013). | 100 | None. | ||||||||||||||||||
| W. Allen Reed (68) c/o Kramer Levin Naftalis & Frankel LLP Counsel to the Independent Directors 1177 Avenue of the Americas New York, NY 10036 | Director | Since August 2006 | Chairperson of the Equity Sub-Committee of the Investment Committee (since October 2006) and Director or Trustee of various Morgan Stanley Funds (since August 2006); formerly, President and CEO of General Motors Asset Management; Chairman and Chief Executive Officer of the GM Trust Bank and Corporate Vice President of General Motors Corporation (August 1994-December 2005). | 98 | Director of Legg Mason, Inc.; formerly Director of the Auburn University Foundation (2010-2015). | ||||||||||||||||||
| Fergus Reid (83) c/o Joe Pietryka, Inc. 85 Charles Colman Blvd. Pawling, NY 12564 | Director | Since June 1992 | Chairman, Joe Pietryka, Inc.; Chairperson of the Governance Committee and Director or Trustee of various Morgan Stanley Funds (since June 1992). | 100 | Formerly, Trustee and Director of certain investment companies in the JP Morgan Fund Complex managed by JP Morgan Investment Management Inc. (1987-2012). | ||||||||||||||||||
43
Morgan Stanley Institutional Fund, Inc.
Annual Report — December 31, 2015
Director and Officer Information (unaudited) (cont'd)
Interested Director:
| Name, Age and Address of Interested Director | Positions(s) Held with Registrant | Length of Time Served* | Principal Occupation(s) During Past 5 Years | Number of Portfolios in Fund Complex Overseen by Interested Director** | Other Directorships Held by Interested Director*** | ||||||||||||||||||
| James F. Higgins (68) One New York Plaza, New York, NY 10004 | Director | Since June 2000 | Director or Trustee of various Morgan Stanley Funds (since June 2000); Senior Advisor of Morgan Stanley (since August 2000). | 99 | Formerly, Director of AXA Financial, Inc. and AXA Equitable Life Insurance Company (2002-2011) and Director of AXA MONY Life Insurance Company and AXA MONY Life Insurance Company of America (2004-2011). | ||||||||||||||||||
* This is the earliest date the Director began serving the Morgan Stanley Funds. Each Director serves an indefinite term, until his or her successor is elected.
** The Fund Complex includes (as of December 31, 2015) all open-end and closed-end funds (including all of their portfolios) advised by Morgan Stanley Investment Management Inc. (the "Adviser") and any funds that have an adviser that is an affiliated person of the Adviser (including, but not limited to, Morgan Stanley AIP GP LP).
*** This includes any directorships at public companies and registered investment companies held by the Director at any time during the past five years.
Executive Officers:
Name, Age and Address of Executive Officer | Position(s) Held with Registrant | Length of Time Served**** | Principal Occupation(s) During Past 5 Years | ||||||||||||
| John H. Gernon (52) 522 Fifth Avenue New York, NY 10036 | President and Principal Executive Officer | Since September 2013 | President and Principal Executive Officer of the Equity and Fixed Income Funds and the Morgan Stanley AIP Funds (since September 2013) and the Liquidity Funds and various money market funds (since May 2014) in the Fund Complex, Managing Director of the Adviser; Head of Product (since 2006). | ||||||||||||
| Stefanie V. Chang Yu (49) 522 Fifth Avenue New York, NY 10036 | Chief Compliance Officer | Since December 1997 | Managing Director of the Adviser and various entities affiliated with the Adviser; Chief Compliance Officer of various Morgan Stanley Funds and the Adviser (since January 2014); formerly, Vice President of various Morgan Stanley Funds (December 1997-January 2014). | ||||||||||||
| Joseph C. Benedetti (50) 522 Fifth Avenue New York, NY 10036 | Vice President | Since January 2014 | Managing Director of the Adviser and various entities affiliated with the Adviser; Vice President of various Morgan Stanley Funds (since January 2014); formerly, Assistant Secretary of various Morgan Stanley Funds (October 2004-January 2014). | ||||||||||||
| Francis J. Smith (50) 522 Fifth Avenue New York, NY 10036 | Treasurer and Principal Financial Officer | Treasurer since July 2003 and Principal Financial Officer since September 2002 | Executive Director of the Adviser and various entities affiliated with the Adviser; Treasurer (since July 2003) and Principal Financial Officer of various Morgan Stanley Funds (since September 2002). | ||||||||||||
| Mary E. Mullin (48) 522 Fifth Avenue New York, NY 10036 | Secretary | Since June 1999 | Executive Director of the Adviser; Secretary of various Morgan Stanley Funds (since June 1999). | ||||||||||||
**** This is the earliest date the officer began serving the Morgan Stanley Funds. Each officer serves a one-year term, until his or her successor is elected and has qualified.
44
Morgan Stanley Institutional Fund, Inc.
Annual Report — December 31, 2015
Adviser and Administrator
Morgan Stanley Investment Management Inc.
522 Fifth Avenue
New York, New York 10036
Distributor
Morgan Stanley Distribution, Inc.
522 Fifth Avenue
New York, New York 10036
Dividend Disbursing and Transfer Agent
Boston Financial Data Services, Inc.
2000 Crown Colony Drive
Quincy, Massachusetts 02169
Custodian
State Street Bank and Trust Company
One Lincoln Street
Boston, Massachusetts 02111
Legal Counsel
Dechert LLP
1095 Avenue of the Americas
New York, New York 10036
Counsel to the Independent Directors
Kramer Levin Naftalis & Frankel LLP
1177 Avenue of the Americas
New York, New York 10036
Independent Registered Public Accounting Firm
Ernst & Young LLP
200 Clarendon Street
Boston, Massachusetts 02116
Reporting to Shareholders
Each Morgan Stanley fund provides a complete schedule of portfolio holdings in its semi-annual and annual reports within 60 days of the end of the fund's second and fourth fiscal quarters. The semi-annual and annual reports are filed electronically with the Securities and Exchange Commission (SEC) on Form N-CSRS and Form N-CSR, respectively. Morgan Stanley also delivers the semi-annual and annual reports to fund shareholders and makes these reports available on its public website, www.morganstanley.com/im. Each Morgan Stanley fund also files a complete schedule of portfolio holdings with the SEC for the fund's first and third fiscal quarters on Form N-Q. Morgan Stanley does not deliver the reports for the first and third fiscal quarters to shareholders, nor are the reports posted to the Morgan Stanley public website. You may, however, obtain the Form N-Q filings (as well as the Form N-CSR and N-CSRS filings) by accessing the SEC's website, www.sec.gov. You may also review and copy them at the SEC's Public Reference Room in Washington, DC. Information on the operation of the SEC's Public Reference Room may be obtained by calling the SEC toll free at 1 (800) SEC-0330. You can also request copies of these materials, upon payment of a duplicating fee, by electronic request at the SEC's email address (publicinfo@sec.gov) or by writing the Public Reference Room of the SEC, Washington, DC 20549-0102.
Proxy Voting Policies and Procedures and Proxy Voting Record
You may obtain a copy of the Fund's Proxy Voting Policy and Procedures and information regarding how the Fund voted proxies relating to portfolio securities during the most recent twelve-month period ended June 30, without charge, upon request, by calling toll free 1 (800) 548-7786 or by visiting our website at www.morganstanley.com/im. This information is also available on the SEC's website at www.sec.gov.
This report is authorized for distribution only when preceded or accompanied by a prospectus of the Morgan Stanley Institutional Fund, Inc., which describes in detail each Portfolio's investment policies, risks, fees and expenses. Please read the prospectus carefully before you invest or send money. For additional information, including information regarding the investments comprising the Portfolio, please visit our website at www.morganstanley.com/im or call toll free 1 (800) 548-7786.
45
Printed in U.S.A.
This Report has been prepared for shareholders and may be distributed to others only if preceded or accompanied by a current prospectus.
Morgan Stanley Investment Management Inc.
522 Fifth Avenue
New York, New York 10036
© 2016 Morgan Stanley. Morgan Stanley Distribution, Inc.

IFIAIAANN
1409714 EXP. 02.28.17
INVESTMENT MANAGEMENT

Morgan Stanley Institutional Fund, Inc.
U.S. Real Estate Portfolio
Annual Report
December 31, 2015

Morgan Stanley Institutional Fund, Inc.
Annual Report — December 31, 2015
Table of Contents
Shareholders' Letter | 2 | ||||||
Expense Example | 3 | ||||||
Investment Overview | 4 | ||||||
Portfolio of Investments | 7 | ||||||
Statement of Assets and Liabilities | 9 | ||||||
Statement of Operations | 11 | ||||||
Statements of Changes in Net Assets | 12 | ||||||
Financial Highlights | 14 | ||||||
Notes to Financial Statements | 19 | ||||||
Report of Independent Registered Public Accounting Firm | 26 | ||||||
Federal Tax Notice | 27 | ||||||
U.S. Privacy Policy | 28 | ||||||
Director and Officer Information | 31 | ||||||
This report is authorized for distribution only when preceded or accompanied by prospectuses of the Morgan Stanley Institutional Fund, Inc. To receive a prospectus and/or statement of additional information (SAI), which contains more complete information such as investment objectives, charges, expenses, policies for voting proxies, risk considerations, and describes in detail each of the Portfolio's investment policies to the prospective investor, please call toll free 1 (800) 548-7786. Please read the prospectuses carefully before you invest or send money.
Additionally, you can access portfolio information including performance, characteristics, and investment team commentary through Morgan Stanley Investment Management's website: www.morganstanley.com/im.
Market forecasts provided in this report may not necessarily come to pass. There is no guarantee that any sectors mentioned will continue to perform as discussed herein or that securities in such sectors will be held by the Portfolio in the future. There is no assurance that a Portfolio will achieve its investment objective. Portfolios are subject to market risk, which is the possibility that market values of securities owned by the Portfolio will decline and, therefore, the value of the Portfolio's shares may be less than what you paid for them. Accordingly, you can lose money investing in this Portfolio. Please see the prospectus for more complete information on investment risks.
1
Morgan Stanley Institutional Fund, Inc.
Annual Report — December 31, 2015
Shareholders' Letter (unaudited)
Dear Shareholders,
We are pleased to provide this Annual report, in which you will learn how your investment in U.S. Real Estate Portfolio (the "Portfolio") performed during the latest twelve-month period.
Morgan Stanley Investment Management is a client-centric, investor-led organization. Our global presence, intellectual capital, and breadth of products and services enable us to partner with investors to meet the evolving challenges of today's financial markets. We aim to deliver superior investment service and to empower our clients to make the informed decisions that help them reach their investment goals.
As always, we thank you for selecting Morgan Stanley Investment Management, and look forward to working with you in the months and years ahead.
Sincerely,

John H. Gernon
President and Principal Executive Officer
January 2016
2
Morgan Stanley Institutional Fund, Inc.
Annual Report — December 31, 2015
Expense Example (unaudited)
U.S. Real Estate Portfolio
As a shareholder of the Portfolio, you incur two types of costs: (1) transactional costs; and (2) ongoing costs, including advisory fees, administration fees, distribution and shareholder services fees and other Portfolio expenses. This example is intended to help you understand your ongoing costs (in dollars) of investing in the Portfolio and to compare these costs with the ongoing costs of investing in other mutual funds.
This example is based on an investment of $1,000 invested at the beginning of the six-month period ended December 31, 2015 and held for the entire six-month period.
Actual Expenses
The table below provides information about actual account values and actual expenses. You may use the information in this table, together with the amount you invested, to estimate the expenses that you paid over the period. Simply divide your account value by $1,000 (for example, an $8,600 account value divided by $1,000 = 8.6), then multiply the result by the number in the table under the heading entitled "Actual Expenses Paid During Period" to estimate the expenses you paid on your account during this period.
Hypothetical Example for Comparison Purposes
The table below provides information about hypothetical account values and hypothetical expenses based on the Portfolio's actual expense ratio and an assumed rate of return of 5% per year before expenses, which is not the Portfolio's actual return. The hypothetical account values and expenses may not be used to estimate the actual ending account balance or expenses you paid for the period. You may use this information to compare the ongoing costs of investing in the Portfolio and other funds. To do so, compare this 5% hypothetical example with the 5% hypothetical examples that appear in the shareholder reports of the other funds.
Please note that the expenses shown in the table are meant to highlight your ongoing costs only and do not reflect any transactional costs, such as sales charges (loads). Therefore, the information for each class in the table is useful in comparing ongoing costs only, and will not help you determine the relative total costs of owning different funds. In addition, if these transactional costs were included, your costs would have been higher.
| Beginning Account Value 7/1/15 | Actual Ending Account Value 12/31/15 | Hypothetical Ending Account Value | Actual Expenses Paid During Period* | Hypothetical Expenses Paid During Period* | Net Expense Ratio During Period** | ||||||||||||||||||||||
U.S. Real Estate Portfolio Class I | $ | 1,000.00 | $ | 1,083.60 | $ | 1,020.21 | $ | 5.20 | $ | 5.04 | 0.99 | % | |||||||||||||||
U.S. Real Estate Portfolio Class A | 1,000.00 | 1,082.10 | 1,019.00 | 6.46 | 6.26 | 1.23 | |||||||||||||||||||||
U.S. Real Estate Portfolio Class L | 1,000.00 | 1,079.10 | 1,015.93 | 9.64 | 9.35 | 1.84 | |||||||||||||||||||||
U.S. Real Estate Portfolio Class C | 1,000.00 | 1,077.20 | 1,014.62 | 10.99 | 10.66 | 2.10 | |||||||||||||||||||||
U.S. Real Estate Portfolio Class IS | 1,000.00 | 1,083.70 | 1,020.62 | 4.78 | 4.63 | 0.91 | |||||||||||||||||||||
* Expenses are calculated using each Portfolio Class' annualized net expense ratio (as disclosed), multiplied by the average account value over the period, and multiplied by 184/365 (to reflect the most recent one-half year period).
** Annualized.
3
Morgan Stanley Institutional Fund, Inc.
Annual Report — December 31, 2015
Investment Overview (unaudited)
U.S. Real Estate Portfolio
The Portfolio seeks to provide above average current income and long-term capital appreciation by investing primarily in equity securities of companies in the U.S. real estate industry, including real estate investment trusts ("REITs").
Performance
For the year ended December 31, 2015, the Portfolio's Class I shares had a total return based on net asset value and reinvestment of distributions per share of 2.27%, net of fees. The Portfolio's Class I shares underperformed the Portfolio benchmark, the FTSE NAREIT Equity REITs Index (the "Index"), which returned 3.20%, and outperformed the S&P 500® Index, which returned 1.38%.
Factors Affecting Performance
• The real estate investment trust (REIT) market gained 3.20% in the 12-month period ending December 31, 2015, as measured by the Index. Property stocks have been largely influenced by transactional evidence in the private markets of strong investor demand for core assets at valuations that demonstrate the acceptance of low expected returns. Share prices also appeared to fluctuate alongside various macro concerns including expectations for higher interest rates going forward and global economic growth concerns, with a particular focus on China's economic slowdown. REITs outperformed the broader equity market during the year, as property stocks in the U.S. gained on continued improvements in underlying property fundamentals and continued evidence of strong asset valuations in the underlying real estate markets.
• Among the major sectors, the apartment and retail sectors modestly outperformed the Index. Apartment companies outperformed as investors appeared to continue to be impressed with favorable operating fundamentals and a plateauing of the supply pipeline. The retail sector outperformed as the owners of shopping centers outperformed, while the mall owners underperformed the Index. Mall stocks appeared to face negative sentiment due to surprisingly weak sales at a number of the large department store retailers. The office sector underperformed the Index. Within the office sector, companies with exposure to central business district (CBD) markets outperformed, while the secondary CBD/suburban companies underperformed the Index. The health care REITs significantly underperformed the Index. This appeared primarily
to be due to investor concerns that increased supply in the senior housing sector may result in slower cash flow growth for a sector that is already priced at a premium valuation. Concerns with regard to the performance of the health care facility operators also led to concerns with regard to their net lease assets. Among the smaller sectors, the storage stocks posted the best performance due to very strong operating fundamentals, and the data centers posted comparable returns due to investor enthusiasm for the technology-driven demand drivers for this business. The industrial and net lease sectors underperformed the Index. The hotel sector was a significant underperformer. Negative investor sentiment intensified due to weaker earnings and disappointment with regard to the pricing of the sale of Starwood Hotels, despite continued evidence of strong pricing of hotels assets in the private market.
• The Portfolio underperformed the Index for the period. Bottom-up stock selection and top-down sector allocation both detracted from relative performance. From a bottom-up perspective, the Portfolio achieved favorable relative stock selection in the net lease and shopping center sectors. This was offset by the negative impact of stock selection in the hotel and apartment sectors. From a top-down perspective, the underweight to the diversified and health care sectors, and overweight to the apartment sector contributed to relative performance. This was more than offset by the overweight to the hotel sector and underweight to the data centers sector, which detracted from performance.
Management Strategies
• We have maintained our core investment philosophy as a real estate value investor. This results in the ownership of stocks whose share prices we believe provide real estate exposure at the best valuation relative to their underlying asset values. We continue to focus on relative implied valuations as a key metric. Our company-specific research leads us to an overweighting in the Portfolio to a group of companies that are focused in the ownership of CBD office assets, high-quality malls, upscale hotels, apartments, and a number of out-of-favor companies and an underweighting to companies concentrated in the ownership of health care and net lease assets.
4
Morgan Stanley Institutional Fund, Inc.
Annual Report — December 31, 2015
Investment Overview (unaudited) (cont'd)
U.S. Real Estate Portfolio
• Our outlook for the REIT market is based on two key factors: private market pricing for underlying real estate assets and public market pricing for the securities. The REIT sector gained 7.3% in the fourth quarter and 3.2% for the full year, as measured by the Index. With asset values for high-quality assets having fully recovered and now, on average, approximately 20% in excess of their all-time peak levels achieved in 2007, the overall REIT market ended the year at par to net asset values (NAVs), their underlying private real estate value.(i) We see attractive value in many of the property sectors with hotels, CBD office and malls trading at the widest discounts to NAVs. However, there is a disparity in valuations with most property sectors at discounts to NAVs but finance-company/dividend-oriented stocks (health care, net lease) and storage sector trading at significant premiums to NAVs.
(i) Source: Morgan Stanley Investment Management and Green Street Advisors, Inc., as of ending date December 31, 2015
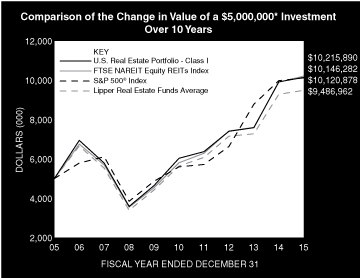
* Minimum Investment for Class I shares
In accordance with SEC regulations, the Portfolio's performance shown assumes that all recurring fees (including management fees) were deducted and all dividends and distributions were reinvested. The performance of Class A, L, C and IS shares will vary from the performance of Class I shares based upon their different inception dates and will be negatively impacted by additional fees assessed to those classes (if applicable).
Performance Compared to the FTSE NAREIT Equity REITs Index(1), the S&P 500® Index(2), and the Lipper Real Estate Funds Average(3)
| Period Ended December 31, 2015 Total Returns(4) | |||||||||||||||||||
Average Annual | |||||||||||||||||||
| One Year | Five Years | Ten Years | Since Inception(10) | ||||||||||||||||
| Portfolio — Class I Shares w/o sales charges(5) | 2.27 | % | 10.95 | % | 7.33 | % | 12.62 | % | |||||||||||
| Portfolio — Class A Shares w/o sales charges(6) | 2.01 | 10.64 | 7.04 | 11.77 | |||||||||||||||
| Portfolio — Class A Shares with maximum 5.25% sales charges(6) | –3.34 | 9.45 | 6.47 | 11.47 | |||||||||||||||
| Portfolio — Class L Shares w/o sales charges(7) | 1.44 | — | — | 11.37 | |||||||||||||||
| Portfolio — Class C Shares w/o sales charges(9) | — | — | — | 2.70 | |||||||||||||||
| Portfolio — Class C Shares with maximum 1.00% deferred sales charges(9) | — | — | — | 1.82 | |||||||||||||||
| Portfolio — Class IS Shares w/o sales charges(8) | 2.36 | — | — | 13.69 | |||||||||||||||
FTSE NAREIT Equity REITs Index | 3.20 | 11.96 | 7.41 | 11.17 | |||||||||||||||
S&P 500® Index | 1.38 | 12.57 | 7.31 | 9.17 | |||||||||||||||
Lipper Real Estate Funds Average | 2.17 | 11.03 | 6.61 | N/A | |||||||||||||||
Performance data quoted represents past performance, which is no guarantee of future results, and current performance may be lower or higher than the figures shown. Performance assumes that all dividends and distributions, if any, were reinvested. For the most recent month-end performance figures, please visit www.morganstanley.com/im. Investment return and principal value will fluctuate so that Portfolio shares, when redeemed, may be worth more or less than their original cost. Total returns do not reflect the deduction of taxes that a shareholder would pay on Portfolio distributions or the redemption of Portfolio shares. Returns for periods less than one year are not annualized. Performance of share classes will vary due to difference in sales charges and expenses.
(1) The FTSE NAREIT (National Association of Real Estate Investment Trusts) Equity REITs Index is free float-adjusted market capitalization weighted index of tax-qualified REITs listed on the New York Stock Exchange, NYSE Amex and the NASDAQ National Market Systems. Effective December 20, 2010, the FTSE NAREIT Equity REITs Index will not include "Timber REITs" The Index is unmanaged and its returns do not include any sales charges or fees. Such costs would lower performance. It is not possible to invest directly in an index.
(2) The Standard & Poor's 500® Index (S&P 500®) measures the performance of the large cap segment of the U.S. equities market, covering approximately 75% of the U.S. equities market. The Index includes 500 leading companies in leading industries of the U.S. economy. The Index is unmanaged and its returns do not include any sales charges or fees. Such costs would lower performance. It is not possible to invest directly in an index.
(3) The Lipper Real Estate Funds Average tracks the performance of all funds in the Lipper Real Estate Funds classification. The Average, which is adjusted for capital gains distributions and income dividends, is unmanaged and should not be considered an investment. As of the date of this report, the Portfolio is in the Lipper Real Estate Funds classification.
5
Morgan Stanley Institutional Fund, Inc.
Annual Report — December 31, 2015
Investment Overview (unaudited) (cont'd)
U.S. Real Estate Portfolio
(4) Total returns for the Portfolio reflect fees waived and expenses reimbursed, if applicable, by the Adviser. Without such waivers and reimbursements, total returns would have been lower.
(5) Commenced operations on February 24, 1995.
(6) Commenced offering on January 2, 1996.
(7) Commenced offering on November 11, 2011.
(8) Commenced offering on September 13, 2013.
(9) Commenced offering on April 30, 2015.
(10) For comparative purposes, average annual since inception returns listed for the Indexes refer to the inception date of Class I of the Portfolio, not the inception of the Index.
6
Morgan Stanley Institutional Fund, Inc.
Annual Report — December 31, 2015
Portfolio of Investments
U.S. Real Estate Portfolio
Shares | Value (000) | ||||||||||
Common Stocks (98.7%) | |||||||||||
Apartments (18.5%) | |||||||||||
| Apartment Investment & Management Co., Class A REIT | 159,226 | $ | 6,374 | ||||||||
AvalonBay Communities, Inc. REIT | 231,558 | 42,636 | |||||||||
Camden Property Trust REIT | 349,544 | 26,831 | |||||||||
Equity Residential REIT | 908,285 | 74,107 | |||||||||
Essex Property Trust, Inc. REIT | 36,548 | 8,750 | |||||||||
158,698 | |||||||||||
Data Centers (0.3%) | |||||||||||
QTS Realty Trust, Inc., Class A REIT | 52,841 | 2,384 | |||||||||
Diversified (7.1%) | |||||||||||
Lexington Realty Trust REIT | 37,260 | 298 | |||||||||
RMR Group, Inc. (The) (a) | 4,363 | 63 | |||||||||
Vornado Realty Trust REIT | 608,976 | 60,873 | |||||||||
61,234 | |||||||||||
Health Care (6.1%) | |||||||||||
Healthcare Realty Trust, Inc. REIT | 172,584 | 4,888 | |||||||||
Senior Housing Properties Trust REIT | 380,811 | 5,651 | |||||||||
Ventas, Inc. REIT | 405,145 | 22,862 | |||||||||
Welltower, Inc. REIT | 286,074 | 19,462 | |||||||||
52,863 | |||||||||||
Industrial (4.8%) | |||||||||||
Cabot Industrial Value Fund II, LP REIT (a)(b)(c)(d) | 14,000 | 7,891 | |||||||||
Duke Realty Corp. REIT | 226,425 | 4,759 | |||||||||
Exeter Industrial Value Fund, LP REIT (a)(b)(c)(d) | 7,905,000 | 2,561 | |||||||||
Liberty Property Trust REIT | 191,930 | 5,959 | |||||||||
ProLogis, Inc. REIT | 391,199 | 16,790 | |||||||||
Rexford Industrial Realty, Inc. REIT | 184,137 | 3,013 | |||||||||
40,973 | |||||||||||
Lodging/Resorts (11.5%) | |||||||||||
Chesapeake Lodging Trust REIT | 396,900 | 9,986 | |||||||||
Hilton Worldwide Holdings, Inc. | 798,240 | 17,082 | |||||||||
Host Hotels & Resorts, Inc. REIT | 3,094,149 | 47,464 | |||||||||
La Quinta Holdings, Inc. (a) | 113,500 | 1,545 | |||||||||
LaSalle Hotel Properties REIT | 435,003 | 10,945 | |||||||||
Starwood Hotels & Resorts Worldwide, Inc. | 115,217 | 7,982 | |||||||||
Xenia Hotels & Resorts, Inc. REIT | 241,479 | 3,702 | |||||||||
98,706 | |||||||||||
Manufactured Homes (0.7%) | |||||||||||
Equity Lifestyle Properties, Inc. REIT | 90,676 | 6,045 | |||||||||
Office (12.2%) | |||||||||||
Boston Properties, Inc. REIT | 371,113 | 47,332 | |||||||||
BRCP REIT I, LP (a)(b)(c)(d) | 6,101,396 | 384 | |||||||||
BRCP REIT II, LP (a)(b)(c)(d) | 8,363,574 | 4,868 | |||||||||
Corporate Office Properties Trust REIT | 210,630 | 4,598 | |||||||||
Cousins Properties, Inc. REIT | 921,105 | 8,686 | |||||||||
Douglas Emmett, Inc. REIT | 482,420 | 15,042 | |||||||||
Shares | Value (000) | ||||||||||
Hudson Pacific Properties, Inc. REIT | 530,376 | $ | 14,925 | ||||||||
Mack-Cali Realty Corp. REIT | 196,634 | 4,591 | |||||||||
Paramount Group, Inc. REIT | 220,713 | 3,995 | |||||||||
104,421 | |||||||||||
Regional Malls (18.2%) | |||||||||||
General Growth Properties, Inc. REIT | 1,134,425 | 30,868 | |||||||||
Macerich Co. (The) REIT | 30,126 | 2,431 | |||||||||
Simon Property Group, Inc. REIT | 585,977 | 113,937 | |||||||||
WP GLIMCHER, Inc. REIT | 850,650 | 9,025 | |||||||||
156,261 | |||||||||||
Retail Free Standing (2.9%) | |||||||||||
National Retail Properties, Inc. REIT | 254,441 | 10,191 | |||||||||
Realty Income Corp. REIT | 67,350 | 3,477 | |||||||||
Spirit Realty Capital, Inc. REIT | 160,060 | 1,604 | |||||||||
STORE Capital Corp. REIT | 429,541 | 9,965 | |||||||||
25,237 | |||||||||||
Self Storage (6.8%) | |||||||||||
CubeSmart REIT | 107,179 | 3,282 | |||||||||
Public Storage REIT | 194,221 | 48,108 | |||||||||
Sovran Self Storage, Inc. REIT | 64,808 | 6,955 | |||||||||
58,345 | |||||||||||
Shopping Centers (9.6%) | |||||||||||
Acadia Realty Trust REIT | 40,547 | 1,344 | |||||||||
Brixmor Property Group, Inc. REIT | 85,090 | 2,197 | |||||||||
DDR Corp. REIT | 261,726 | 4,408 | |||||||||
Federal Realty Investment Trust REIT | 19,475 | 2,845 | |||||||||
Kimco Realty Corp. REIT | 877,754 | 23,225 | |||||||||
Regency Centers Corp. REIT | 447,593 | 30,490 | |||||||||
Tanger Factory Outlet Centers, Inc. REIT | 558,639 | 18,268 | |||||||||
82,777 | |||||||||||
Total Common Stocks (Cost $603,960) | 847,944 | ||||||||||
Short-Term Investment (1.5%) | |||||||||||
Investment Company (1.5%) | |||||||||||
| Morgan Stanley Institutional Liquidity Funds — Treasury Portfolio — Institutional Class (See Note G) (Cost $12,619) | 12,618,888 | 12,619 | |||||||||
| Total Investments (100.2%) (Cost $616,579) (e) | 860,563 | ||||||||||
Liabilities in Excess of Other Assets (–0.2%) | (1,348 | ) | |||||||||
Net Assets (100.0%) | $ | 859,215 | |||||||||
(a) Non-income producing security.
(b) Security has been deemed illiquid at December 31, 2015.
(c) At December 31, 2015, the Portfolio held fair valued securities valued at approximately $15,704,000, representing 1.8% of net assets. These securities have been fair valued as determined in good faith under procedures established by and under the general supervision of the Fund's Directors.
The accompanying notes are an integral part of the financial statements.
7
Morgan Stanley Institutional Fund, Inc.
Annual Report — December 31, 2015
Portfolio of Investments (cont'd)
U.S. Real Estate Portfolio
(d) Restricted security valued at fair value and not registered under the Securities Act of 1933. BRCP REIT I, LP was acquired between 5/03 - 5/08 and has a current cost basis of approximately $45,000. BRCP REIT II, LP was acquired between 10/06 - 4/11 and has a current cost basis of approximately $7,769,000. Cabot Industrial Value Fund II, LP was acquired between 11/05 - 2/10 and has a current cost basis of approximately $7,000,000. Exeter Industrial Value Fund, LP was acquired between 11/07 - 4/11 and has a current cost basis of approximately $372,000. At December 31, 2015, these securities had an aggregate market value of approximately $15,704,000, representing 1.8% of net assets.
(e) At December 31, 2015, the aggregate cost for Federal income tax purposes is approximately $618,871,000. The aggregate gross unrealized appreciation is approximately $263,538,000 and the aggregate gross unrealized depreciation is approximately $21,846,000 resulting in net unrealized appreciation of approximately $241,692,000.
REIT Real Estate Investment Trust.
Portfolio Composition
Classification | Percentage of Total Investments | ||||||
Apartments | 18.4 | % | |||||
Regional Malls | 18.2 | ||||||
Office | 12.1 | ||||||
Lodging/Resorts | 11.5 | ||||||
Other* | 10.1 | ||||||
Shopping Centers | 9.6 | ||||||
Diversified | 7.1 | ||||||
Self Storage | 6.8 | ||||||
Health Care | 6.2 | ||||||
Total Investments | 100.0 | % | |||||
* Industries and/or investment types representing less than 5% of total investments.
The accompanying notes are an integral part of the financial statements.
8
Morgan Stanley Institutional Fund, Inc.
Annual Report — December 31, 2015
U.S. Real Estate Portfolio
Statement of Assets and Liabilities | December 31, 2015 (000) | ||||||
Assets: | |||||||
Investments in Securities of Unaffiliated Issuers, at Value (Cost $603,960) | $ | 847,944 | |||||
Investment in Security of Affiliated Issuer, at Value (Cost $12,619) | 12,619 | ||||||
Total Investments in Securities, at Value (Cost $616,579) | 860,563 | ||||||
Foreign Currency, at Value (Cost $1) | — | @ | |||||
Dividends Receivable | 4,099 | ||||||
Receivable for Investments Sold | 2,744 | ||||||
Receivable for Portfolio Shares Sold | 921 | ||||||
Receivable from Affiliate | 1 | ||||||
Other Assets | 92 | ||||||
Total Assets | 868,420 | ||||||
Liabilities: | |||||||
Payable for Portfolio Shares Redeemed | 4,739 | ||||||
Payable for Investments Purchased | 2,405 | ||||||
Payable for Advisory Fees | 1,719 | ||||||
Payable for Sub Transfer Agency Fees — Class I | 95 | ||||||
Payable for Sub Transfer Agency Fees — Class A | 26 | ||||||
Payable for Sub Transfer Agency Fees — Class L | 2 | ||||||
Payable for Administration Fees | 59 | ||||||
Payable for Directors' Fees and Expenses | 22 | ||||||
Payable for Shareholder Services Fees — Class A | 19 | ||||||
Payable for Distribution and Shareholder Services Fees — Class L | 3 | ||||||
Payable for Distribution and Shareholder Services Fees — Class C | — | @ | |||||
Payable for Professional Fees | 19 | ||||||
Payable for Custodian Fees | 14 | ||||||
Payable for Transfer Agency Fees — Class I | 6 | ||||||
Payable for Transfer Agency Fees — Class A | 3 | ||||||
Payable for Transfer Agency Fees — Class L | — | @ | |||||
Payable for Transfer Agency Fees — Class C | — | @ | |||||
Payable for Transfer Agency Fees — Class IS | — | @ | |||||
Other Liabilities | 74 | ||||||
Total Liabilities | 9,205 | ||||||
Net Assets | $ | 859,215 | |||||
Net Assets Consist Of: | |||||||
Paid-in-Capital | $ | 598,720 | |||||
Accumulated Undistributed Net Investment Income | 4,521 | ||||||
Accumulated Net Realized Gain | 11,990 | ||||||
Unrealized Appreciation (Depreciation) on: | |||||||
Investments | 243,984 | ||||||
Foreign Currency Translations | (— | @) | |||||
Net Assets | $ | 859,215 | |||||
The accompanying notes are an integral part of the financial statements.
9
Morgan Stanley Institutional Fund, Inc.
Annual Report — December 31, 2015
U.S. Real Estate Portfolio
Statement of Assets and Liabilities (cont'd) | December 31, 2015 (000) | ||||||
CLASS I: | |||||||
Net Assets | $ | 625,999 | |||||
| Shares Outstanding $0.001 par value shares of beneficial interest (unlimited shares authorized) (not in 000's) | 35,050,634 | ||||||
Net Asset Value, Offering and Redemption Price Per Share | $ | 17.86 | |||||
CLASS A: | |||||||
Net Assets | $ | 87,462 | |||||
| Shares Outstanding $0.001 par value shares of beneficial interest (unlimited shares authorized) (not in 000's) | 5,021,011 | ||||||
Net Asset Value, Redemption Price Per Share | $ | 17.42 | |||||
Maximum Sales Load | 5.25 | % | |||||
Maximum Sales Charge | $ | 0.97 | |||||
Maximum Offering Price Per Share | $ | 18.39 | |||||
CLASS L: | |||||||
Net Assets | $ | 3,993 | |||||
| Shares Outstanding $0.001 par value shares of beneficial interest (unlimited shares authorized) (not in 000's) | 229,389 | ||||||
Net Asset Value, Offering and Redemption Price Per Share | $ | 17.41 | |||||
CLASS C: | |||||||
Net Assets | $ | 91 | |||||
| Shares Outstanding $0.001 par value shares of beneficial interest (unlimited shares authorized) (not in 000's) | 5,259 | ||||||
Net Asset Value, Offering and Redemption Price Per Share | $ | 17.36 | |||||
CLASS IS: | |||||||
Net Assets | $ | 141,670 | |||||
| Shares Outstanding $0.001 par value shares of beneficial interest (unlimited shares authorized) (not in 000's) | 7,931,209 | ||||||
Net Asset Value, Offering and Redemption Price Per Share | $ | 17.86 | |||||
@ Amount is less than $500.
The accompanying notes are an integral part of the financial statements.
10
Morgan Stanley Institutional Fund, Inc.
Annual Report — December 31, 2015
U.S. Real Estate Portfolio
Statement of Operations | Year Ended December 31, 2015 (000) | ||||||
Investment Income: | |||||||
Dividends from Securities of Unaffiliated Issuers | $ | 25,220 | |||||
Dividends from Security of Affiliated Issuer (Note G) | 2 | ||||||
Total Investment Income | 25,222 | ||||||
Expenses: | |||||||
Advisory Fees (Note B) | 7,439 | ||||||
Administration Fees (Note C) | 768 | ||||||
Sub Transfer Agency Fees — Class I | 541 | ||||||
Sub Transfer Agency Fees — Class A | 119 | ||||||
Sub Transfer Agency Fees — Class L | 5 | ||||||
Shareholder Services Fees — Class A (Note D) | 248 | ||||||
Distribution and Shareholder Services Fees — Class L (Note D) | 34 | ||||||
Distribution and Shareholder Services Fees — Class C (Note D) | — | @ | |||||
Shareholder Reporting Fees | 123 | ||||||
Registration Fees | 88 | ||||||
Professional Fees | 82 | ||||||
Custodian Fees (Note F) | 58 | ||||||
Transfer Agency Fees — Class I (Note E) | 30 | ||||||
Transfer Agency Fees — Class A (Note E) | 13 | ||||||
Transfer Agency Fees — Class L (Note E) | 3 | ||||||
Transfer Agency Fees — Class C (Note E) | 1 | ||||||
Transfer Agency Fees — Class IS (Note E) | 1 | ||||||
Directors' Fees and Expenses | 24 | ||||||
Pricing Fees | 4 | ||||||
Other Expenses | 24 | ||||||
Expenses Before Non Operating Expenses | 9,605 | ||||||
Investment Related Expenses | 28 | ||||||
Total Expenses | 9,633 | ||||||
Rebate from Morgan Stanley Affiliate (Note G) | (2 | ) | |||||
Reimbursement of Class Specific Expenses — Class C (Note B) | (1 | ) | |||||
Reimbursement of Class Specific Expenses — Class IS (Note B) | (— | @) | |||||
Net Expenses | 9,630 | ||||||
Net Investment Income | 15,592 | ||||||
Realized Gain: | |||||||
Investments Sold | 113,715 | ||||||
Change in Unrealized Appreciation (Depreciation): | |||||||
Investments | (109,098 | ) | |||||
Foreign Currency Translations | (— | @) | |||||
Net Change in Unrealized Appreciation (Depreciation) | (109,098 | ) | |||||
Net Realized Gain and Change in Unrealized Appreciation (Depreciation) | 4,617 | ||||||
Net Increase in Net Assets Resulting from Operations | $ | 20,209 | |||||
@ Amount is less than $500.
The accompanying notes are an integral part of the financial statements.
11
Morgan Stanley Institutional Fund, Inc.
Annual Report — December 31, 2015
U.S. Real Estate Portfolio
Statements of Changes in Net Assets | Year Ended December 31, 2015 (000) | Year Ended December 31, 2014 (000) | |||||||||
Increase (Decrease) in Net Assets: | |||||||||||
Operations: | |||||||||||
Net Investment Income | $ | 15,592 | $ | 18,544 | |||||||
Net Realized Gain | 113,715 | 56,530 | |||||||||
Net Change in Unrealized Appreciation (Depreciation) | (109,098 | ) | 190,135 | ||||||||
Net Increase in Net Assets Resulting from Operations | 20,209 | 265,209 | |||||||||
Distributions from and/or in Excess of: | |||||||||||
Class I: | |||||||||||
Net Investment Income | (8,675 | ) | (15,986 | ) | |||||||
Net Realized Gain | (89,446 | ) | (33,514 | ) | |||||||
Class A: | |||||||||||
Net Investment Income | (982 | ) | (1,569 | ) | |||||||
Net Realized Gain | (13,045 | ) | (3,982 | ) | |||||||
Class L: | |||||||||||
Net Investment Income | (20 | ) | (45 | ) | |||||||
Net Realized Gain | (586 | ) | (176 | ) | |||||||
Class C: | |||||||||||
Net Investment Income | (— | @) | — | ||||||||
Net Realized Gain | (11 | ) | — | ||||||||
Class IS: | |||||||||||
Net Investment Income | (2,237 | ) | (— | @) | |||||||
Net Realized Gain | (20,229 | ) | (— | @) | |||||||
Total Distributions | (135,231 | ) | (55,272 | ) | |||||||
Capital Share Transactions:(1) | |||||||||||
Class I: | |||||||||||
Subscribed | 111,705 | 190,489 | |||||||||
Distributions Reinvested | 96,912 | 39,540 | |||||||||
Redeemed | (458,721 | ) | (265,506 | ) | |||||||
Class A: | |||||||||||
Subscribed | 22,527 | 33,259 | |||||||||
Distributions Reinvested | 13,932 | 5,518 | |||||||||
Redeemed | (44,080 | ) | (55,752 | ) | |||||||
Class L: | |||||||||||
Subscribed | 164 | 213 | |||||||||
Distributions Reinvested | 601 | 219 | |||||||||
Redeemed | (1,151 | ) | (964 | ) | |||||||
Class C: | |||||||||||
Subscribed | 92 | * | — | ||||||||
Distributions Reinvested | 10 | * | — | ||||||||
Class IS: | |||||||||||
Subscribed | 232,226 | — | |||||||||
Distributions Reinvested | — | @ | — | ||||||||
Redeemed | (60,663 | ) | — | ||||||||
Net Decrease in Net Assets Resulting from Capital Share Transactions | (86,446 | ) | (52,984 | ) | |||||||
Total Increase (Decrease) in Net Assets | (201,468 | ) | 156,953 | ||||||||
Net Assets: | |||||||||||
Beginning of Period | 1,060,683 | 903,730 | |||||||||
End of Period (Including Accumulated Undistributed Net Investment Income of $4,521 and $1,289) | $ | 859,215 | $ | 1,060,683 | |||||||
The accompanying notes are an integral part of the financial statements.
12
Morgan Stanley Institutional Fund, Inc.
Annual Report — December 31, 2015
U.S. Real Estate Portfolio
Statements of Changes in Net Assets (cont'd) | Year Ended December 31, 2015 (000) | Year Ended December 31, 2014 (000) | |||||||||
(1) Capital Share Transactions: | |||||||||||
Class I: | |||||||||||
Shares Subscribed | 5,439 | 10,099 | |||||||||
Shares Issued on Distributions Reinvested | 5,342 | 2,019 | |||||||||
Shares Redeemed | (22,044 | ) | (14,030 | ) | |||||||
Net Decrease in Class I Shares Outstanding | (11,263 | ) | (1,912 | ) | |||||||
Class A: | |||||||||||
Shares Subscribed | 1,132 | 1,789 | |||||||||
Shares Issued on Distributions Reinvested | 788 | 288 | |||||||||
Shares Redeemed | (2,260 | ) | (2,966 | ) | |||||||
Net Decrease in Class A Shares Outstanding | (340 | ) | (889 | ) | |||||||
Class L: | |||||||||||
Shares Subscribed | 8 | 11 | |||||||||
Shares Issued on Distributions Reinvested | 34 | 11 | |||||||||
Shares Redeemed | (58 | ) | (52 | ) | |||||||
Net Decrease in Class L Shares Outstanding | (16 | ) | (30 | ) | |||||||
Class C: | |||||||||||
Shares Subscribed | 4 | * | — | ||||||||
Shares Issued on Distributions Reinvested | 1 | * | — | ||||||||
Net Increase in Class C Shares Outstanding | 5 | — | |||||||||
Class IS: | |||||||||||
Shares Subscribed | 10,956 | — | |||||||||
Shares Issued on Distributions Reinvested | — | @@ | — | ||||||||
Shares Redeemed | (3,025 | ) | — | ||||||||
Net Increase in Class IS Shares Outstanding | 7,931 | — | |||||||||
* For the period April 30, 2015 through December 31, 2015.
@ Amount is less than $500.
@@ Amount is less than 500 shares.
The accompanying notes are an integral part of the financial statements.
13
Morgan Stanley Institutional Fund, Inc.
Annual Report — December 31, 2015
Financial Highlights
U.S. Real Estate Portfolio
Class I | |||||||||||||||||||||||
Year Ended December 31, | |||||||||||||||||||||||
Selected Per Share Data and Ratios | 2015 | 2014 | 2013 | 2012 | 2011 | ||||||||||||||||||
Net Asset Value, Beginning of Period | $ | 20.48 | $ | 16.55 | $ | 16.93 | $ | 14.99 | $ | 14.33 | |||||||||||||
Income (Loss) from Investment Operations: | |||||||||||||||||||||||
Net Investment Income† | 0.32 | 0.36 | 0.27 | 0.24 | 0.11 | ||||||||||||||||||
Net Realized and Unrealized Gain (Loss) | 0.10 | 4.66 | 0.14 | 2.19 | 0.69 | ||||||||||||||||||
Total from Investment Operations | 0.42 | 5.02 | 0.41 | 2.43 | 0.80 | ||||||||||||||||||
Distributions from and/or in Excess of: | |||||||||||||||||||||||
Net Investment Income | (0.26 | ) | (0.35 | ) | (0.20 | ) | (0.20 | ) | (0.14 | ) | |||||||||||||
Net Realized Gain | (2.78 | ) | (0.74 | ) | (0.59 | ) | (0.29 | ) | — | ||||||||||||||
Total Distributions | (3.04 | ) | (1.09 | ) | (0.79 | ) | (0.49 | ) | (0.14 | ) | |||||||||||||
Net Asset Value, End of Period | $ | 17.86 | $ | 20.48 | $ | 16.55 | $ | 16.93 | $ | 14.99 | |||||||||||||
Total Return++ | 2.27 | % | 30.74 | % | 2.45 | % | 16.26 | % | 5.57 | % | |||||||||||||
Ratios and Supplemental Data: | |||||||||||||||||||||||
Net Assets, End of Period (Thousands) | $ | 625,999 | $ | 948,311 | $ | 797,933 | $ | 826,420 | $ | 773,138 | |||||||||||||
Ratio of Expenses to Average Net Assets (1) | 0.98 | %+ | 0.95 | %+ | 1.01 | %+ | 0.98 | %+ | 1.01 | %+ | |||||||||||||
Ratio of Expenses to Average Net Assets Excluding Non Operating Expenses | 0.98 | %+ | 0.94 | %+ | 1.00 | %+ | 0.97 | %+ | 1.00 | %+ | |||||||||||||
Ratio of Net Investment Income to Average Net Assets (1) | 1.61 | %+ | 1.90 | %+ | 1.51 | %+ | 2.45 | %+ | 0.76 | %+ | |||||||||||||
Ratio of Rebate from Morgan Stanley Affiliates to Average Net Assets | 0.00 | %§ | 0.00 | %§ | 0.00 | %§ | 0.00 | %§ | 0.00 | %§ | |||||||||||||
Portfolio Turnover Rate | 24 | % | 25 | % | 24 | % | 22 | % | 21 | % | |||||||||||||
(1) Supplemental Information on the Ratios to Average Net Assets: | |||||||||||||||||||||||
Ratios Before Expense Limitation: | |||||||||||||||||||||||
Expenses to Average Net Assets | N/A | N/A | 1.03 | % | N/A | 1.03 | % | ||||||||||||||||
Net Investment Income to Average Net Assets | N/A | N/A | 1.49 | % | N/A | 0.74 | % | ||||||||||||||||
† Per share amount is based on average shares outstanding.
++ Calculated based on the net asset value as of the last business day of the period.
+ The Ratios of Expenses and Net Investment Income reflect the rebate of certain Portfolio expenses in connection with the investments in Morgan Stanley affiliates during the period. The effect of the rebate on the ratios is disclosed in the above table as "Ratio of Rebate from Morgan Stanley Affiliates to Average Net Assets."
§ Amount is less than 0.005%.
The accompanying notes are an integral part of the financial statements.
14
Morgan Stanley Institutional Fund, Inc.
Annual Report — December 31, 2015
Financial Highlights
U.S. Real Estate Portfolio
Class A | |||||||||||||||||||||||
Year Ended December 31, | |||||||||||||||||||||||
Selected Per Share Data and Ratios | 2015 | 2014 | 2013 | 2012 | 2011 | ||||||||||||||||||
Net Asset Value, Beginning of Period | $ | 20.04 | $ | 16.21 | $ | 16.60 | $ | 14.70 | $ | 14.07 | |||||||||||||
Income (Loss) from Investment Operations: | |||||||||||||||||||||||
Net Investment Income† | 0.28 | 0.29 | 0.23 | 0.19 | 0.08 | ||||||||||||||||||
Net Realized and Unrealized Gain (Loss) | 0.08 | 4.56 | 0.12 | 2.16 | 0.66 | ||||||||||||||||||
Total from Investment Operations | 0.36 | 4.85 | 0.35 | 2.35 | 0.74 | ||||||||||||||||||
Distributions from and/or in Excess of: | |||||||||||||||||||||||
Net Investment Income | (0.20 | ) | (0.28 | ) | (0.15 | ) | (0.16 | ) | (0.11 | ) | |||||||||||||
Net Realized Gain | (2.78 | ) | (0.74 | ) | (0.59 | ) | (0.29 | ) | — | ||||||||||||||
Total Distributions | (2.98 | ) | (1.02 | ) | (0.74 | ) | (0.45 | ) | (0.11 | ) | |||||||||||||
Net Asset Value, End of Period | $ | 17.42 | $ | 20.04 | $ | 16.21 | $ | 16.60 | $ | 14.70 | |||||||||||||
Total Return++ | 2.01 | % | 30.28 | % | 2.14 | % | 16.02 | % | 5.26 | % | |||||||||||||
Ratios and Supplemental Data: | |||||||||||||||||||||||
Net Assets, End of Period (Thousands) | $ | 87,462 | $ | 107,441 | $ | 101,325 | $ | 92,240 | $ | 92,047 | |||||||||||||
Ratio of Expenses to Average Net Assets (1) | 1.28 | %+ | 1.31 | %+ | 1.28 | %+^ | 1.23 | %+ | 1.26 | %+ | |||||||||||||
Ratio of Expenses to Average Net Assets Excluding Non Operating Expenses | 1.28 | %+ | 1.30 | %+ | 1.27 | %+^ | 1.22 | %+ | 1.25 | %+ | |||||||||||||
Ratio of Net Investment Income to Average Net Assets (1) | 1.43 | %+ | 1.54 | %+ | 1.35 | %+ | 2.20 | %+ | 0.54 | %+ | |||||||||||||
Ratio of Rebate from Morgan Stanley Affiliates to Average Net Assets | 0.00 | %§ | 0.00 | %§ | 0.00 | %§ | 0.00 | %§ | 0.00 | %§ | |||||||||||||
Portfolio Turnover Rate | 24 | % | 25 | % | 24 | % | 22 | % | 21 | % | |||||||||||||
(1) Supplemental Information on the Ratios to Average Net Assets: | |||||||||||||||||||||||
Ratios Before Expense Limitation: | |||||||||||||||||||||||
Expenses to Average Net Assets | N/A | N/A | 1.29 | % | N/A | 1.28 | % | ||||||||||||||||
Net Investment Income to Average Net Assets | N/A | N/A | 1.34 | % | N/A | 0.52 | % | ||||||||||||||||
† Per share amount is based on average shares outstanding.
++ Calculated based on the net asset value which does not reflect sales charges, if applicable, as of the last business day of the period.
+ The Ratios of Expenses and Net Investment Income reflect the rebate of certain Portfolio expenses in connection with the investments in Morgan Stanley affiliates during the period. The effect of the rebate on the ratios is disclosed in the above table as "Ratio of Rebate from Morgan Stanley Affiliates to Average Net Assets."
^ Effective September 16, 2013, the Adviser has agreed to limit the ratio of expenses to average net assets to the maximum ratio of 1.35% for Class A shares. Prior to September 16, 2013, the maximum ratio was 1.25% for Class A shares.
§ Amount is less than 0.005%.
The accompanying notes are an integral part of the financial statements.
15
Morgan Stanley Institutional Fund, Inc.
Annual Report — December 31, 2015
Financial Highlights
U.S. Real Estate Portfolio
Class L | |||||||||||||||||||||||
Year Ended December 31, | Period from November 11, 2011^ to | ||||||||||||||||||||||
Selected Per Share Data and Ratios | 2015 | 2014 | 2013 | 2012 | December 31, 2011 | ||||||||||||||||||
Net Asset Value, Beginning of Period | $ | 20.03 | $ | 16.20 | $ | 16.59 | $ | 14.69 | $ | 14.52 | |||||||||||||
Income (Loss) from Investment Operations: | |||||||||||||||||||||||
Net Investment Income† | 0.21 | 0.20 | 0.13 | 0.10 | 0.06 | ||||||||||||||||||
Net Realized and Unrealized Gain (Loss) | 0.04 | 4.56 | 0.13 | 2.16 | 0.11 | ||||||||||||||||||
Total from Investment Operations | 0.25 | 4.76 | 0.26 | 2.26 | 0.17 | ||||||||||||||||||
Distributions from and/or in Excess of: | |||||||||||||||||||||||
Net Investment Income | (0.09 | ) | (0.19 | ) | (0.06 | ) | (0.07 | ) | — | ||||||||||||||
Net Realized Gain | (2.78 | ) | (0.74 | ) | (0.59 | ) | (0.29 | ) | — | ||||||||||||||
Total Distributions | (2.87 | ) | (0.93 | ) | (0.65 | ) | (0.36 | ) | — | ||||||||||||||
Net Asset Value, End of Period | $ | 17.41 | $ | 20.03 | $ | 16.20 | $ | 16.59 | $ | 14.69 | |||||||||||||
Total Return++ | 1.44 | % | 29.68 | % | 1.62 | % | 15.44 | % | 1.17 | %# | |||||||||||||
Ratios and Supplemental Data: | |||||||||||||||||||||||
Net Assets, End of Period (Thousands) | $ | 3,993 | $ | 4,919 | $ | 4,462 | $ | 4,975 | $ | 5,879 | |||||||||||||
Ratio of Expenses to Average Net Assets (1) | 1.82 | %+ | 1.79 | %+ | 1.78 | %+^^ | 1.73 | %+ | 1.75 | %+* | |||||||||||||
Ratio of Expenses to Average Net Assets Excluding Non Operating Expenses | 1.81 | %+ | 1.78 | %+ | 1.77 | %+^^ | 1.72 | %+ | N/A | ||||||||||||||
Ratio of Net Investment Income to Average Net Assets (1) | 1.08 | %+ | 1.06 | %+ | 0.73 | %+ | 1.70 | %+ | 3.33 | %+* | |||||||||||||
Ratio of Rebate from Morgan Stanley Affiliates to Average Net Assets | 0.00 | %§ | 0.00 | %§ | 0.00 | %§ | 0.00 | %§ | 0.00 | %§* | |||||||||||||
Portfolio Turnover Rate | 24 | % | 25 | % | 24 | % | 22 | % | 21 | %* | |||||||||||||
(1) Supplemental Information on the Ratios to Average Net Assets: | |||||||||||||||||||||||
Ratios Before Expense Limitation: | |||||||||||||||||||||||
Expenses to Average Net Assets | N/A | N/A | 1.79 | % | N/A | 1.91 | %+* | ||||||||||||||||
Net Investment Income to Average Net Assets | N/A | N/A | 0.72 | % | N/A | 3.17 | %+* | ||||||||||||||||
^ Commencement of Offering.
† Per share amount is based on average shares outstanding.
++ Calculated based on the net asset value as of the last business day of the period.
+ The Ratios of Expenses and Net Investment Income reflect the rebate of certain Portfolio expenses in connection with the investments in Morgan Stanley affiliates during the period. The effect of the rebate on the ratios is disclosed in the above table as "Ratio of Rebate from Morgan Stanley Affiliates to Average Net Assets."
^^ Effective September 16, 2013, the Adviser has agreed to limit the ratio of expenses to average net assets to the maximum ratio of 1.85% for Class L shares. Prior to September 16, 2013, the maximum ratio was 1.75% for Class L shares.
§ Amount is less than 0.005%.
# Not Annualized.
* Annualized.
The accompanying notes are an integral part of the financial statements.
16
Morgan Stanley Institutional Fund, Inc.
Annual Report — December 31, 2015
Financial Highlights
U.S. Real Estate Portfolio
Class C | |||||||
Selected Per Share Data and Ratios | Period from April 30, 2015^ to December 31, 2015 | ||||||
Net Asset Value, Beginning of Period | $ | 19.73 | |||||
Income from Investment Operations: | |||||||
Net Investment Income† | 0.18 | ||||||
Net Realized and Unrealized Gain | 0.31 | ||||||
Total from Investment Operations | 0.49 | ||||||
Distributions from and/or in Excess of: | |||||||
Net Investment Income | (0.08 | ) | |||||
Net Realized Gain | (2.78 | ) | |||||
Total Distributions | (2.86 | ) | |||||
Net Asset Value, End of Period | $ | 17.36 | |||||
Total Return++ | 2.70 | %# | |||||
Ratios and Supplemental Data: | |||||||
Net Assets, End of Period (Thousands) | $ | 91 | |||||
Ratios of Expenses to Average Net Assets (1) | 2.10 | %+* | |||||
Ratios of Expenses to Average Net Assets Excluding Non Operating Expenses | 2.10 | %+* | |||||
Ratio of Net Investment Income to Average Net Assets (1) | 1.44 | %+* | |||||
Ratio of Rebate from Morgan Stanley Affiliates to Average Net Assets | 0.00 | %§* | |||||
Portfolio Turnover Rate | 24 | % | |||||
(1) Supplemental Information on the Ratios to Average Net Assets: | |||||||
Ratios Before Expense Limitation: | |||||||
Expense to Average Net Assets | 5.89 | %* | |||||
Net Investment Loss to Average Net Assets | (2.35 | )%* | |||||
^ Commencement of Offering.
† Per share amount is based on average shares outstanding.
++ Calculated based on the net asset value which does not reflect sales charges, if applicable, as of the last business day of the period.
+ The Ratios of Expenses and Net Investment Income reflect the rebate of certain Portfolio expenses in connection with the investments in Morgan Stanley affiliates during the period. The effect of the rebate on the ratios is disclosed in the above table as "Ratio of Rebate from Morgan Stanley Affiliates to Average Net Assets."
§ Amount is less than 0.005%.
# Not Annualized.
* Annualized.
The accompanying notes are an integral part of the financial statements.
17
Morgan Stanley Institutional Fund, Inc.
Annual Report — December 31, 2015
Financial Highlights
U.S. Real Estate Portfolio
Class IS | |||||||||||||||
| Year Ended December 31, | Period from September 13, 2013^ to | ||||||||||||||
Selected Per Share Data and Ratios | 2015 | 2014 | December 31, 2013 | ||||||||||||
Net Asset Value, Beginning of Period | $ | 20.48 | $ | 16.55 | $ | 17.13 | |||||||||
Income (Loss) from Investment Operations: | |||||||||||||||
Net Investment Income† | 0.36 | 0.38 | 0.03 | ||||||||||||
Net Realized and Unrealized Gain (Loss) | 0.08 | 4.65 | 0.01 | ||||||||||||
Total from Investment Operations | 0.44 | 5.03 | 0.04 | ||||||||||||
Distributions from and/or in Excess of: | |||||||||||||||
Net Investment Income | (0.28 | ) | (0.36 | ) | (0.11 | ) | |||||||||
Net Realized Gain | (2.78 | ) | (0.74 | ) | (0.51 | ) | |||||||||
Total Distributions | (3.06 | ) | (1.10 | ) | (0.62 | ) | |||||||||
Net Asset Value, End of Period | $ | 17.86 | $ | 20.48 | $ | 16.55 | |||||||||
Total Return++ | 2.36 | % | 30.82 | % | 0.30 | %# | |||||||||
Ratios and Supplemental Data: | |||||||||||||||
Net Assets, End of Period (Thousands) | $ | 141,670 | $ | 12 | $ | 10 | |||||||||
Ratio of Expenses to Average Net Assets (1) | 0.90 | %+ | 0.89 | %+ | 0.90 | %*^^ | |||||||||
Ratio of Expenses to Average Net Assets Excluding Non Operating Expenses | 0.90 | %+ | 0.88 | %+ | 0.89 | %*^^ | |||||||||
Ratio of Net Investment Income to Average Net Assets (1) | 1.81 | %+ | 1.96 | %+ | 0.52 | %*+ | |||||||||
Ratio of Rebate from Morgan Stanley Affiliates to Average Net Assets | 0.00 | %§ | 0.00 | %§ | N/A | ||||||||||
Portfolio Turnover Rate | 24 | % | 25 | % | 24 | %# | |||||||||
(1) Supplemental Information on the Ratios to Average Net Assets: | |||||||||||||||
Ratios Before Expense Limitation: | |||||||||||||||
Expenses to Average Net Assets | 0.90 | % | 20.21 | % | 6.19 | %* | |||||||||
Net Investment Income (Loss) to Average Net Assets | 1.81 | % | (17.36 | )% | (4.77 | )%* | |||||||||
^ Commencement of Offering.
† Per share amount is based on average shares outstanding.
++ Calculated based on the net asset value as of the last business day of the period.
+ The Ratios of Expenses and Net Investment Income reflect the rebate of certain Portfolio expenses in connection with the investments in Morgan Stanley affiliates during the period. The effect of the rebate on the ratios is disclosed in the above table as "Ratio of Rebate from Morgan Stanley Affiliates to Average Net Assets."
^^ Effective September 16, 2013, the Adviser has agreed to limit the ratio of expenses to average net assets to the maximum ratio of 0.93% for Class IS shares.
§ Amount is less than 0.005%.
# Not Annualized.
* Annualized.
The accompanying notes are an integral part of the financial statements.
18
Morgan Stanley Institutional Fund, Inc.
Annual Report — December 31, 2015
Notes to Financial Statements
Morgan Stanley Institutional Fund, Inc. (the "Fund") is registered under the Investment Company Act of 1940, as amended (the "Act"), as an open-end management investment company. The Fund is comprised of twenty-six separate, active, diversified and non-diversified portfolios (individually referred to as a "Portfolio", collectively as the "Portfolios"). The Fund applies investment company accounting and reporting guidance.
The accompanying financial statements relate to the U.S. Real Estate Portfolio. The Portfolio seeks to provide above average current income and long-term capital appreciation by investing primarily in equity securities of companies in the U.S. real estate industry, including real estate investment trusts ("REITs"). The Portfolio focuses on REITs as well as real estate operating companies ("REOCs") that invest in a variety of property types and regions. The Portfolio has capital subscription commitments to certain investee companies for this same purpose, the details of which are disclosed in the Unfunded Commitments note.
The Portfolio offers five classes of shares — Class I, Class A, Class L, Class C and Class IS. On April 30, 2015, the Portfolio commenced offering Class C shares and suspended offering of Class L shares. Existing Class L shareholders may invest through reinvestment of dividends and distributions.
A. Significant Accounting Policies: The following significant accounting policies are in conformity with U.S. generally accepted accounting principles ("GAAP"). Such policies are consistently followed by the Fund in the preparation of its financial statements. GAAP may require management to make estimates and assumptions that affect the reported amounts and disclosures in the financial statements. Actual results may differ from those estimates.
1. Security Valuation: (1) An equity portfolio security listed or traded on an exchange is valued at its latest reported sales price (or at the exchange official closing price if such exchange reports an official closing price), if there were no sales on a given day, the security is valued at the mean between the last reported bid and asked prices; (2) all other equity portfolio securities for which over-the-counter ("OTC") market quotations are readily available are valued at its latest reported sales price. In cases where a security is traded on more than one exchange, the security is valued on the exchange designated as the primary market; (3) when market quotations are not readily available, including circumstances under which Morgan Stanley Investment Management Inc. (the "Adviser") determines that the closing price, last sale price
or the mean between the last reported bid and asked prices are not reflective of a security's market value, portfolio securities are valued at their fair value as determined in good faith under procedures established by and under the general supervision of the Fund's Board of Directors (the "Directors"). Occasionally, developments affecting the closing prices of securities and other assets may occur between the times at which valuations of such securities are determined (that is, close of the foreign market on which the securities trade) and the close of business of the New York Stock Exchange ("NYSE"). If developments occur during such periods that are expected to materially affect the value of such securities, such valuations may be adjusted to reflect the estimated fair value of such securities as of the close of the NYSE, as determined in good faith by the Directors or by the Adviser using a pricing service and/or procedures approved by the Directors; (4) quotations of foreign portfolio securities, other assets and liabilities and forward contracts stated in foreign currency are translated into U.S. dollar equivalents at the prevailing market rates prior to the close of the NYSE; (5) investments in mutual funds, including the Morgan Stanley Institutional Liquidity Funds, are valued at the net asset value ("NAV") as of the close of each business day; and (6) short-term debt securities with remaining maturities of 60 days or less at the time of purchase may be valued at amortized cost, unless the Adviser determines such valuation does not reflect the securities' market value, in which case these securities will be valued at their fair market value determined by the Adviser.
The Directors have responsibility for determining in good faith the fair value of the investments, and the Directors may appoint others, such as the Fund's Adviser or a valuation committee, to assist the Directors in determining fair value and to make the actual calculations pursuant to the fair valuation methodologies previously approved by the Directors. Under procedures approved by the Directors, the Fund's Adviser has formed a Valuation Committee whose members are approved by the Directors. The Valuation Committee provides administration and oversight of the Fund's valuation policies and procedures, which are reviewed at least annually by the Directors. These procedures allow the Fund to utilize independent pricing services, quotations from securities and financial instrument dealers, and other market sources to determine fair value.
The Fund has procedures to determine the fair value of securities and other financial instruments for which market prices are not readily available. Under these
19
Morgan Stanley Institutional Fund, Inc.
Annual Report — December 31, 2015
Notes to Financial Statements (cont'd)
procedures, the Valuation Committee convenes on a regular and ad hoc basis to review such securities and considers a number of factors, including valuation methodologies and significant unobservable valuation inputs, when arriving at fair value. The Valuation Committee may employ a market-based approach which may use related or comparable assets or liabilities, recent transactions, market multiples, book values, and other relevant information for the investment to determine the fair value of the investment. An income-based valuation approach may also be used in which the anticipated future cash flows of the investment are discounted to calculate fair value. Discounts may also be applied due to the nature or duration of any restrictions on the disposition of the investments. Due to the inherent uncertainty of valuations of such investments, the fair values may differ significantly from the values that would have been used had an active market existed. The Valuation Committee employs various methods for calibrating these valuation approaches including a regular review of valuation methodologies, key inputs and assumptions, transactional back-testing or disposition analysis, and reviews of any related market activity.
The Portfolio invests a significant portion of its assets in securities of REITs. The market's perception of prospective declines in private real estate values and other financial assets may result in increased volatility of market prices that can negatively impact the valuation of certain issuers held by the Portfolio.
2. Fair Value Measurement: Financial Accounting Standards Board ("FASB") Accounting Standards CodificationTM ("ASC") 820, "Fair Value Measurement" ("ASC 820"), defines fair value as the value that the Fund would receive to sell an investment or pay to transfer a liability in a timely transaction with an independent buyer in the principal market, or in the absence of a principal market the most advantageous market for the investment or liability. ASC 820 establishes a three-tier hierarchy to distinguish between (1) inputs that reflect the assumptions market participants would use in valuing an asset or liability developed based on market data obtained from sources independent of the reporting entity (observable inputs) and (2) inputs that reflect the reporting entity's own assumptions about the assumptions market participants would use in valuing an asset or liability developed based on the best information available in the circumstances (unobservable inputs) and to establish classification of fair value measurements for disclosure purposes. Various
inputs are used in determining the value of the Fund's investments. The inputs are summarized in the three broad levels listed below.
• Level 1 – unadjusted quoted prices in active markets for identical investments
• Level 2 – other significant observable inputs (including quoted prices for similar investments, interest rates, prepayment speeds, credit risk, etc.)
• Level 3 – significant unobservable inputs including the Fund's own assumptions in determining the fair value of investments. Factors considered in making this determination may include, but are not limited to, information obtained by contacting the issuer, analysts, or the appropriate stock exchange (for exchange-traded securities), analysis of the issuer's financial statements or other available documents and, if necessary, available information concerning other securities in similar circumstances
The inputs or methodology used for valuing securities are not necessarily an indication of the risk associated with investing in those securities and the determination of the significance of a particular input to the fair value measurement in its entirety requires judgment and considers factors specific to each security.
The following is a summary of the inputs used to value the Portfolio's investments as of December 31, 2015.
Investment Type | Level 1 Unadjusted quoted prices (000) | Level 2 Other significant observable inputs (000) | Level 3 Significant unobservable inputs (000) | Total (000) | |||||||||||||||
Assets: | |||||||||||||||||||
Common Stocks | |||||||||||||||||||
Apartments | $ | 158,698 | $ | — | $ | — | $ | 158,698 | |||||||||||
Data Centers | 2,384 | — | — | 2,384 | |||||||||||||||
Diversified | 61,234 | — | — | 61,234 | |||||||||||||||
Health Care | 52,863 | — | — | 52,863 | |||||||||||||||
Industrial | 30,521 | — | 10,452 | 40,973 | |||||||||||||||
Lodging/Resorts | 98,706 | — | — | 98,706 | |||||||||||||||
Manufactured Homes | 6,045 | — | — | 6,045 | |||||||||||||||
Office | 99,169 | — | 5,252 | 104,421 | |||||||||||||||
Regional Malls | 156,261 | — | — | 156,261 | |||||||||||||||
Retail Free Standing | 25,237 | — | — | 25,237 | |||||||||||||||
Self Storage | 58,345 | — | — | 58,345 | |||||||||||||||
Shopping Centers | 82,777 | — | — | 82,777 | |||||||||||||||
Total Common Stocks | 832,240 | — | 15,704 | 847,944 | |||||||||||||||
Short-Term Investment | |||||||||||||||||||
Investment Company | 12,619 | — | — | 12,619 | |||||||||||||||
Total Assets | $ | 844,859 | $ | — | $ | 15,704 | $ | 860,563 | |||||||||||
20
Morgan Stanley Institutional Fund, Inc.
Annual Report — December 31, 2015
Notes to Financial Statements (cont'd)
Transfers between investment levels may occur as the markets fluctuate and/or the availability of data used in an investment's valuation changes. The Portfolio recognizes transfers between the levels as of the end of the period. As of December 31, 2015, the Portfolio did not have any investments transfer between investment levels.
Following is a reconciliation of investments in which significant unobservable inputs (Level 3) were used in determining fair value.
| Common Stocks (000) | |||||||
Beginning Balance | $ | 37,224 | |||||
Purchases | 938 | ||||||
Sales | (19,800 | ) | |||||
Amortization of discount | — | ||||||
Transfers in | — | ||||||
Transfers out | — | ||||||
Corporate actions | (7,787 | ) | |||||
Change in unrealized appreciation (depreciation) | (6,978 | ) | |||||
Realized gains (losses) | 12,107 | ||||||
Ending Balance | $ | 15,704 | |||||
| Net change in unrealized appreciation (depreciation) from investments still held as of December 31, 2015 | $ | 2,668 | |||||
The following table presents additional information about valuation techniques and inputs used for investments that are measured at fair value and categorized within Level 3 as of December 31, 2015.
| Fair Value at December 31, 2015 (000) | Valuation Technique | Unobservable Input | |||||||||||||
Industrial | |||||||||||||||
| Common Stocks | $ | 10,452 | Reported Capital Balance, Adjusted for Subsequent Capital Calls, Return of Capital and Significant Market Changes between last Capital Statement and Valuation Date, as applicable | Adjusted Capital Balance | |||||||||||
Office | |||||||||||||||
| Common Stocks | $ | 5,252 | Reported Capital Balance, Adjusted for Subsequent Capital Calls, Return of Capital and Significant Market Changes between last Capital Statement and Valuation Date, as applicable | Adjusted Capital Balance | |||||||||||
3. Foreign Currency Translation and Foreign Investments: The books and records of the Portfolio are maintained in U.S. dollars. Foreign currency amounts are translated into U.S. dollars as follows:
– investments, other assets and liabilities at the prevailing rate of exchange on the valuation date;
– investment transactions and investment income at the prevailing rates of exchange on the dates of such transactions.
Although the net assets of the Portfolio are presented at the foreign exchange rates and market values at the close of the period, the Portfolio does not isolate that portion of the results of operations arising as a result of changes in the foreign exchange rates from the fluctuations arising from changes in the market prices of securities held at period end. Similarly, the Portfolio does not isolate the effect of changes in foreign exchange rates from the fluctuations arising from changes in the market prices of securities sold during the period. Accordingly, realized and unrealized foreign currency gains (losses) on investments in securities are included in the reported net realized and unrealized gains (losses) on investment transactions and balances. However, pursuant to U.S. Federal income tax regulations, gains and losses from certain foreign currency transactions and the foreign currency portion of gains and losses realized on sales and maturities of foreign denominated debt securities are treated as ordinary income for U.S. Federal income tax purposes.
Net realized gains (losses) on foreign currency transactions represent net foreign exchange gains (losses) from foreign currency forward exchange contracts, disposition of foreign currencies, currency gains (losses) realized between the trade and settlement dates on securities transactions, and the difference between the amount of investment income and foreign withholding taxes recorded on the Portfolio's books and the U.S. dollar equivalent amounts actually received or paid. Net unrealized currency gains (losses) from valuing foreign currency denominated assets and liabilities at period end exchange rates are reflected as a component of unrealized appreciation (depreciation) in the Statement of Assets and Liabilities. The change in unrealized currency gains (losses) on foreign currency translations for the period is reflected in the Statement of Operations.
21
Morgan Stanley Institutional Fund, Inc.
Annual Report — December 31, 2015
Notes to Financial Statements (cont'd)
Foreign security and currency transactions may involve certain considerations and risks not typically associated with those of U.S. dollar denominated transactions as a result of, among other factors, fluctuations of exchange rates in relation to the U.S. dollar, the possibility of lower levels of governmental supervision and regulation of foreign securities markets and the possibility of political or economic instability.
Governmental approval for foreign investments may be required in advance of making an investment under certain circumstances in some countries, and the extent of foreign investments in domestic companies may be subject to limitation in other countries. Foreign ownership limitations also may be imposed by the charters of individual companies to prevent, among other concerns, violations of foreign investment limitations. As a result, an additional class of shares (identified as "Foreign" in the Portfolio of Investments) may be created and offered for investment. The "local" and "foreign shares" market values may differ. In the absence of trading of the foreign shares in such markets, the Portfolio values the foreign shares at the closing exchange price of the local shares.
4. Unfunded Commitments: Subject to the terms of a Subscription Agreement between the Portfolio and BRCP REIT I, LLC, the Portfolio has made a subscription commitment of $7,000,000 for which it will receive 7,000,000 shares of common stock. As of December 31, 2015, BRCP REIT I, LLC has drawn down approximately $6,101,000 which represents 87.2% of the commitment.
Subject to the terms of a Subscription Agreement between the Portfolio and BRCP REIT II, LLC, the Portfolio has made a subscription commitment of $9,000,000 for which it will receive 9,000,000 shares of common stock. As of December 31, 2015, BRCP REIT II, LLC has drawn down approximately $8,364,000 which represents 92.9% of the commitment.
Subject to the terms of a Subscription Agreement between the Portfolio and Exeter Industrial Value Fund LP, the Portfolio has made a subscription commitment of $8,500,000 for which it will receive 8,500,000 shares of common stock. As of December 31, 2015, Exeter Industrial Value Fund LP has drawn down approximately $7,905,000 which represents 93.0% of the commitment.
Subject to the terms of a Subscription Agreement between the Portfolio and Cabot Industrial Value
Fund II, LP, the Portfolio has made a subscription commitment of $7,500,000 for which it will receive 15,000 shares of common stock. As of December 31, 2015, Cabot Industrial Value Fund II, LP has drawn down approximately $7,000,000 which represents 93.3% of the commitment.
5. Restricted Securities: The Portfolio invests in unregistered or otherwise restricted securities. The term "restricted securities" refers to securities that are unregistered or are held by control persons of the issuer and securities that are subject to contractual restrictions on their resale. As a result, restricted securities may be more difficult to value and the Portfolio may have difficulty disposing of such assets either in a timely manner or for a reasonable price. In order to dispose of an unregistered security, the Portfolio, where it has contractual rights to do so, may have to cause such security to be registered. A considerable period may elapse between the time the decision is made to sell the security and the time the security is registered so that the Portfolio could sell it. Contractual restrictions on the resale of securities vary in length and scope and are generally the result of a negotiation between the issuer and acquirer of the securities. The Portfolio would, in either case, bear market risks during that period. Restricted securities are identified in the Portfolio of Investments.
6. Indemnifications: The Fund enters into contracts that contain a variety of indemnifications. The Fund's maximum exposure under these arrangements is unknown. However, the Fund has not had prior claims or losses pursuant to these contracts and expects the risk of loss to be remote.
7. Dividends and Distributions to Shareholders: Dividend income and distributions to shareholders are recorded on the ex-dividend date. Dividends from net investment income, if any, are declared and paid quarterly. Net realized capital gains, if any, are distributed at least annually.
8. Security Transactions, Income and Expenses: Security transactions are accounted for on the trade date (date the order to buy or sell is executed). Realized gains and losses on the sale of investment securities are determined on the specific identified cost method. Dividend income and other distributions are recorded on the ex-dividend date (except for certain foreign dividends which may be recorded as soon as the Portfolio is
22
Morgan Stanley Institutional Fund, Inc.
Annual Report — December 31, 2015
Notes to Financial Statements (cont'd)
informed of such dividends) net of applicable withholding taxes. Interest income is recognized on the accrual basis ex-ept where collection is in doubt. Discounts are accreted and premiums are amortized over the life of the respective securities. Most expenses of the Fund can be directly attributed to a particular Portfolio. Expenses which cannot be directly attributed are apportioned among the Portfolios based upon relative net assets or other appropriate methods. Income, expenses (other than class specific expenses — distribution and shareholder services, transfer agency and sub transfer agency fees) and realized and unrealized gains or losses are allocated to each class of shares based upon their relative net assets.
The Portfolio owns shares of REITs which report information on the source of their distributions annually in the following calendar year. A portion of distributions received from REITs during the year is estimated to be a return of capital and is recorded as a reduction of their cost.
B. Advisory Fees: The Adviser, a wholly-owned subsidiary of Morgan Stanley, provides the Portfolio with advisory services under the terms of an Investment Advisory Agreement, paid quarterly, at the annual rate based on the daily net assets as follows:
| First $500 million | Next $500 million | Over $1 billion | |||||||||
| 0.80 | % | 0.75 | % | 0.70 | % | ||||||
For the year ended December 31, 2015, the advisory fee rate (net of rebate) was equivalent to an annual effective rate of 0.77% of the Portfolio's average daily net assets.
The Adviser has agreed to reduce its advisory fee and/or reimburse the Portfolio so that total annual portfolio operating expenses, excluding certain investment related expenses, taxes, interest and other extraordinary expenses (including litigation), will not exceed 1.00% for Class I shares, 1.35% for Class A shares, 1.85% for Class L shares, 2.10% for Class C shares and 0.93% for Class IS shares. The fee waivers and/or expense reimbursements will continue for at least one year from the date of the Portfolio's prospectus or until such time as the Directors act to discontinue all or a portion of such waivers and/or reimbursements when they deem such action is appropriate. For the year ended December 31, 2015, approximately $1,000 of other expenses were reimbursed by the Adviser pursuant to this arrangement.
C. Administration Fees: The Adviser also serves as Administrator to the Fund and provides administrative services
pursuant to an Administration Agreement for an annual fee, accrued daily and paid monthly, of 0.08% of the Portfolio's average daily net assets.
Under a Sub-Administration Agreement between the Administrator and State Street Bank and Trust Company ("State Street"), State Street provides certain administrative services to the Fund. For such services, the Administrator pays State Street a portion of the fee the Administrator receives from the Portfolio.
D. Distribution and Shareholder Services Fees: Morgan Stanley Distribution, Inc. ("MSDI" or the "Distributor"), a wholly-owned subsidiary of the Adviser and an indirect subsidiary of Morgan Stanley, serves as the Fund's Distributor of Portfolio shares pursuant to a Distribution Agreement. The Fund has adopted a Shareholder Services Plan with respect to Class A shares pursuant to Rule 12b-1 under the Act. Under the Shareholder Services Plan, the Portfolio pays the Distributor a shareholder services fee, accrued daily and paid monthly, at an annual rate of 0.25% of the Portfolio's average daily net assets attributable to Class A shares.
The Fund has adopted a Distribution and Shareholder Services Plan with respect to Class L shares pursuant to Rule 12b-1 under the Act. Under the Distribution and Shareholder Services Plan, the Portfolio pays the Distributor a distribution fee, accrued daily and paid monthly, at an annual rate of 0.50% and a shareholder services fee, accrued daily and paid monthly, at an annual rate of 0.25% of the Portfolio's average daily net assets attributable to Class L shares.
The Fund has adopted a Distribution and Shareholder Services Plan with respect to Class C shares pursuant to Rule 12b-1 under the Act. Under the Distribution and Shareholder Services Plan, the Portfolio pays the Distributor a distribution fee, accrued daily and paid monthly, at an annual rate of 0.75% and a shareholder services fee, accrued daily and paid monthly, at an annual rate of 0.25% of the Portfolio's average daily net assets attributable to Class C shares.
The distribution and shareholder services fees are used to support the expenses associated with servicing and maintaining accounts. The Distributor may compensate other parties for providing shareholder support services to investors who purchase Class A, Class L and Class C shares.
E. Dividend Disbursing and Transfer Agent: The Fund's dividend disbursing and transfer agent is Boston Financial Data Services, Inc. ("BFDS"). Pursuant to a Transfer Agency Agreement, the Fund pays BFDS a fee based on the
23
Morgan Stanley Institutional Fund, Inc.
Annual Report — December 31, 2015
Notes to Financial Statements (cont'd)
number of classes, accounts and transactions relating to the Portfolios of the Fund.
F. Custodian Fees: State Street (the "Custodian") serves as Custodian for the Fund in accordance with a Custodian Agreement. The Custodian holds cash, securities, and other assets of the Fund as required by the Act. Custody fees are payable monthly based on assets held in custody, investment purchases and sales activity and account maintenance fees, plus reimbursement for certain out-of-pocket expenses.
G. Security Transactions and Transactions with Affiliates: For the year ended December 31, 2015, purchases and sales of investment securities for the Portfolio, other than long-term U.S. Government securities and short-term investments, were approximately $226,785,000 and $400,545,000, respectively. There were no purchases and sales of long-term U.S. Government securities for the year ended December 31, 2015.
The Portfolio invests in the Institutional Class of the Morgan Stanley Institutional Liquidity Funds — Treasury Portfolio (the "Liquidity Funds"), an open-end management investment company managed by the Adviser. Advisory fees paid by the Portfolio are reduced by an amount equal to its pro-rata share of the advisory and administration fees paid by the Portfolio due to its investment in the Liquidity Funds. For the year ended December 31, 2015, advisory fees paid were reduced by approximately $2,000 relating to the Portfolio's investment in the Liquidity Funds.
A summary of the Portfolio's transactions in shares of the Liquidity Funds during the year ended December 31, 2015 is as follows:
| Value December 31, 2014 (000) | Purchases at Cost (000) | Sales (000) | Dividend Income (000) | Value December 31, 2015 (000) | |||||||||||||||
| $ | 9,090 | $ | 160,800 | $ | 157,271 | $ | 2 | $ | 12,619 | ||||||||||
The Portfolio has an unfunded Deferred Compensation Plan (the "Compensation Plan"), which allows each independent Director to defer payment of all, or a portion, of the fees he or she receives for serving on the Board of Directors. Each eligible Director generally may elect to have the deferred amounts credited with a return equal to the total return on one or more of the Morgan Stanley funds that are offered as investment options under the Compensation Plan. Appreciation/depreciation and distributions received from these investments are recorded with an offsetting increase/decrease in the deferred compensation obligation and do not affect the NAV of the Portfolio.
H. Federal Income Taxes: It is the Portfolio's intention to continue to qualify as a regulated investment company and distribute all of its taxable and tax-exempt income. Accordingly, no provision for Federal income taxes is required in the financial statements.
The Portfolio may be subject to taxes imposed by countries in which it invests. Such taxes are generally based on income and/or capital gains earned or repatriated. Taxes are accrued based on net investment income, net realized gains and net unrealized appreciation as such income and/or gains are earned. Taxes may also be based on transactions in foreign currency and are accrued based on the value of investments denominated in such currency.
FASB ASC 740-10, "Income Taxes — Overall", sets forth a minimum threshold for financial statement recognition of the benefit of a tax position taken or expected to be taken in a tax return. Management has concluded there are no significant uncertain tax positions that would require recognition in the financial statements. If applicable, the Portfolio recognizes interest accrued related to unrecognized tax benefits in "Interest Expense" and penalties in "Other Expenses" in the Statement of Operations. The Portfolio files tax returns with the U.S. Internal Revenue Service, New York and various states. Generally, each of the tax years in the four-year period ended December 31, 2015, remains subject to examination by taxing authorities.
The tax character of distributions paid may differ from the character of distributions shown in the Statements of Changes in Net Assets due to short-term capital gains being treated as ordinary income for tax purposes. The tax character of distributions paid during fiscal 2015 and 2014 was as follows:
| 2015 Distributions Paid From: | 2014 Distributions Paid From: | ||||||||||||||
| Ordinary Income (000) | Long-Term Capital Gain (000) | Ordinary Income (000) | Long-Term Capital Gain (000) | ||||||||||||
| $ | 13,888 | $ | 121,343 | $ | 17,600 | $ | 37,672 | ||||||||
The amount and character of income and gains to be distributed are determined in accordance with income tax regulations which may differ from GAAP. These book/tax differences are either considered temporary or permanent in nature.
Temporary differences are primarily due to differing book and tax treatments in the timing of the recognition of gains (losses) on certain investment transactions and the timing of the deductibility of certain expenses.
24
Morgan Stanley Institutional Fund, Inc.
Annual Report — December 31, 2015
Notes to Financial Statements (cont'd)
Permanent differences, primarily due to basis adjustments on partnerships, differing treatments of gains (losses) related to REIT adjustments and a dividend redesignation, resulted in the following reclassifications among the components of net assets at December 31, 2015:
| Accumulated Undistributed Net Investment Income (000) | Accumulated Net Realized Gain (000) | Paid-in- Capital (000) | |||||||||
| $ | (446 | ) | $ | 460 | $ | (14 | ) | ||||
At December 31, 2015, the components of distributable earnings for the Portfolio on a tax basis were as follows:
| Undistributed Ordinary Income (000) | Undistributed Long-Term Capital Gain (000) | ||||||
| $ | 4,933 | $ | 12,565 | ||||
I. Other: At December 31, 2015, the Portfolio had record owners of 10% or greater. Investment activities of these shareholders could have a material impact on the Portfolio. The aggregate percentage of such owners was 46.8%.
25
Morgan Stanley Institutional Fund, Inc.
Annual Report — December 31, 2015
Report of Independent Registered Public Accounting Firm
To the Shareholders and Board of Directors of
Morgan Stanley Institutional Fund, Inc. —
U.S. Real Estate Portfolio
We have audited the accompanying statement of assets and liabilities, including the portfolio of investments, of U.S. Real Estate Portfolio (one of the portfolios constituting Morgan Stanley Institutional Fund, Inc.) (the "Portfolio") as of December 31, 2015, and the related statement of operations for the year then ended, the statements of changes in net assets for each of the two years in the period then ended and the financial highlights for each of the years or periods indicated therein. These financial statements and financial highlights are the responsibility of the Portfolio's management. Our responsibility is to express an opinion on these financial statements and financial highlights based on our audits.
We conducted our audits in accordance with the standards of the Public Company Accounting Oversight Board (United States). Those standards require that we plan and perform the audit to obtain reasonable assurance about whether the financial statements and financial highlights are free of material misstatement. We were not engaged to perform an audit of the Portfolio's internal control over financial reporting. Our audits included consideration of internal control over financial reporting as a basis for designing audit procedures that are appropriate in the circumstances, but not for the purpose of expressing an opinion on the effectiveness of the Portfolio's internal control over financial reporting. Accordingly, we express no such opinion. An audit also includes examining, on a test basis, evidence supporting the amounts and disclosures in the financial statements and financial highlights, assessing the accounting principles used and significant estimates made by management, and evaluating the overall financial statement presentation. Our procedures included confirmation of securities owned as of December 31, 2015, by correspondence with the custodian and others or by other appropriate auditing procedures where replies from others were not received. We believe that our audits provide a reasonable basis for our opinion.
In our opinion, the financial statements and financial highlights referred to above present fairly, in all material respects, the financial position of U.S. Real Estate Portfolio (one of the portfolios constituting Morgan Stanley Institutional Fund, Inc.) at December 31, 2015, the results of its operations for the year then ended, the changes in its net assets for each of the two years in the period then ended and the financial highlights for each of the years or periods indicated therein, in conformity with U.S. generally accepted accounting principles.

Boston, Massachusetts
February 26, 2016
26
Morgan Stanley Institutional Fund, Inc.
Annual Report — December 31, 2015
Federal Tax Notice (unaudited)
For Federal income tax purposes, the following information is furnished with respect to the distributions paid by the Portfolio during its taxable year ended December 31, 2015. For corporate shareholders, 2.1% of the dividends qualified for the dividends received deduction.
The Portfolio designated and paid approximately $121,343,000 as a long-term capital gain distribution.
For Federal income tax purposes, the following information is furnished with respect to the Portfolio's earnings for its taxable year ended December 31, 2015. When distributed, certain earnings may be subject to a maximum tax rate of 15% as provided for the Jobs and Growth Tax Relief Reconciliation Act of 2003. The Portfolio designated up to a maximum of approximately $533,000 as taxable at this lower rate.
In January, the Portfolio provides tax information to shareholders for the preceding calendar year.
27
Morgan Stanley Institutional Fund, Inc.
Annual Report — December 31, 2015
U.S. Privacy Policy (unaudited)
AN IMPORTANT NOTICE CONCERNING OUR U.S. PRIVACY POLICY
This privacy notice describes the U.S. privacy policy of Morgan Stanley Distribution, Inc., and the Morgan Stanley family of mutual funds ("us", "our", "we").
We are required by federal law to provide you with notice of our U.S. privacy policy ("Policy"). This Policy applies to both our current and former clients unless we state otherwise and is intended for individual clients who purchase products or receive services from us for personal, family or household purposes. This Policy is not applicable to partnerships, corporations, trusts or other non-individual clients or account holders, nor is this Policy applicable to individuals who are either beneficiaries of a trust for which we serve as trustee or participants in an employee benefit plan administered or advised by us. This Policy is, however, applicable to individuals who select us to be a custodian of securities or assets in individual retirement accounts, 401(k) accounts, or accounts subject to the Uniform Gifts to Minors Act.
This notice sets out our business practices to protect your privacy; how we collect and share personal information about you; and how you can limit our sharing or certain uses by others of this information. We may amend this Policy at any time, and will inform you of any changes to our Policy as required by law.
WE RESPECT YOUR PRIVACY
We appreciate that you have provided us with your personal financial information and understand your concerns about your information. We strive to safeguard the information our clients entrust to us. Protecting the confidentiality and security of client information is an important part of how we conduct our business.
This notice describes what personal information we collect about you, how we collect it, when we may share it with others, and how certain others may use it. It discusses the steps you may take to limit our sharing of certain information about you with our affiliated companies, including, but not limited to our affiliated banking businesses, brokerage firms and credit service affiliates. It also discloses how you may limit our affiliates' use of shared information for marketing purposes.
Throughout this Policy, we refer to the nonpublic information that personally identifies you as "personal information." We also use the term "affiliated company" in this notice. An affiliated company is a company in our family of companies and includes companies with the Morgan Stanley name. These affiliated companies are financial institutions such as broker-dealers, banks, investment advisers and credit card issuers. We refer to any company that is not an affiliated company as a nonaffiliated third party. For purposes of Section 5 of this notice, and your ability to limit certain uses of personal information by our affiliates, this notice applies to the use of personal information by our affiliated companies.
1. WHAT PERSONAL INFORMATION DO WE COLLECT FROM YOU?
We may collect the following types of information about you: (i) information provided by you, including information from applications and other forms we receive from you, (ii) information about your transactions with us or our affiliates, (iii) information about your transactions with nonaffiliated third parties, (iv) information from consumer reporting agencies, (v) information obtained from our websites, and (vi) information obtained from other sources. For example:
• We collect information such as your name, address, e-mail address, telephone/fax numbers, assets, income and investment objectives through applications and other forms you submit to us.
• We may obtain information about account balances, your use of account(s) and the types of products and services you prefer to receive from us through your dealings and transactions with us and other sources.
• We may obtain information about your creditworthiness and credit history from consumer reporting agencies.
• We may collect background information from and through third-party vendors to verify representations you have made and to comply with various regulatory requirements.
2. WHEN DO WE DISCLOSE PERSONAL INFORMATION WE COLLECT ABOUT YOU?
We may disclose personal information we collect about you in each of the categories listed above to affiliated and nonaffiliated third parties.
28
Morgan Stanley Institutional Fund, Inc.
Annual Report — December 31, 2015
U.S. Privacy Policy (unaudited) (cont'd)
a. Information We Disclose to Affiliated Companies.
We may disclose personal information that we collect about you to our affiliated companies to manage your account(s) effectively, to service and process your transactions, and to let you know about products and services offered by us and affiliated companies, to manage our business, and as otherwise required or permitted by law. Offers for products and services from affiliated companies are developed under conditions designed to safeguard your personal information.
b. Information We Disclose to Third Parties.
We may disclose personal information that we collect about you to nonaffiliated third parties to provide marketing services on our behalf or to other financial institutions with whom we have joint marketing agreements. We may also disclose all of the information we collect to other nonaffiliated third parties for our everyday business purposes, such as to process transactions, maintain account(s), respond to court orders and legal investigations, report to credit bureaus, offer our own products and services, protect against fraud, for institutional risk control, to perform services on our behalf, and as otherwise required or permitted by law.
When we share personal information about you with a nonaffiliated third party, they are required to limit their use of personal information about you to the particular purpose for which it was shared and they are not allowed to share personal information about you with others except to fulfill that limited purpose or as may be permitted or required by law.
3. HOW DO WE PROTECT THE SECURITY AND CONFIDENTIALITY OF PERSONAL INFORMATION WE COLLECT ABOUT YOU?
We maintain physical, electronic and procedural security measures that comply with applicable law and regulations to help safeguard the personal information we collect about you. We have internal policies governing the proper handling of client information by employees. Third parties that provide support or marketing services on our behalf may also receive personal information about you, and we require them to adhere to appropriate security standards with respect to such information.
4. HOW CAN YOU LIMIT OUR SHARING CERTAIN PERSONAL INFORMATION ABOUT YOU WITH OUR AFFILIATED COMPANIES FOR ELIGIBILITY DETERMINATION?
By following the opt-out procedures in Section 6 below, you may limit the extent to which we share with our affiliated companies, personal information that was collected to determine your eligibility for products and services such as your credit reports and other information that you have provided to us or that we may obtain from third parties ("eligibility information"). Eligibility information does not include your identification information or personal information pertaining to our transactions or experiences with you. Please note that, even if you direct us not to share eligibility information with our affiliated companies, we may still share your personal information, including eligibility information, with our affiliated companies under circumstances that are permitted under applicable law, such as to process transactions or to service your account.
5. HOW CAN YOU LIMIT THE USE OF CERTAIN PERSONAL INFORMATION ABOUT YOU BY OUR AFFILIATED COMPANIES FOR MARKETING?
By following the opt-out instructions in Section 6 below, you may limit our affiliated companies from marketing their products or services to you based on personal information we disclose to them. This information may include, for example, your income and account history with us. Please note that, even if you choose to limit our affiliated companies from using personal information about you that we may share with them for marketing their products and services to you, our affiliated companies may use your personal information that they obtain from us to market to you in circumstances permitted by law, such as if the affiliated party has its own relationship with you.
29
Morgan Stanley Institutional Fund, Inc.
Annual Report — December 31, 2015
U.S. Privacy Policy (unaudited) (cont'd)
6. HOW CAN YOU SEND US AN OPT-OUT INSTRUCTION?
If you wish to limit our sharing of eligibility information about you with our affiliated companies, or our affiliated companies' use of personal information for marketing purposes, as described in this notice, you may do so by:
• Calling us at (800) 548-7786
Monday–Friday between 8a.m. and 6p.m. (EST)
• Writing to us at the following address:
Boston Financial Data Services, Inc.
c/o Privacy Coordinator
P.O. Box 219804
Kansas City, Missouri 64121
If you choose to write to us, your request should include: your name, address, telephone number and account number(s) to which the opt-out applies and whether you are opting out with respect to sharing of eligibility information (Section 4 above), or information used for marketing (Section 5 above), or both. Written opt-out requests should not be sent with any other correspondence. In order to process your request, we require that the request be provided by you directly and not through a third party. Once you have informed us about your privacy preferences, your opt-out preference will remain in effect with respect to this Policy (as it may be amended) until you notify us otherwise. If you are a joint account owner, we will accept instructions from any one of you and apply those instructions to the entire account.
Please understand that if you limit our sharing or our affiliated companies' use of personal information, you and any joint account holder(s) may not receive information about our affiliated companies' products and services, including products or services that could help you manage your financial resources and achieve your investment objectives.
If you have more than one account or relationship with us, please specify the accounts to which you would like us to apply your privacy choices. If you have accounts or relationships with our affiliates, you may receive multiple privacy policies from them, and will need to separately notify those companies of your privacy choices for those accounts or relationships.
7. WHAT IF AN AFFILIATED COMPANY BECOMES A NONAFFILIATED THIRD PARTY?
If, at any time in the future, an affiliated company becomes a nonaffiliated third party, further disclosures of personal information made to the former affiliated company will be limited to those described in Section 2(b) above relating to nonaffiliated third parties. If you elected under Section 6 to limit disclosures we make to affiliated companies, or use of personal information by affiliated companies, your election will not apply to use by any former affiliated company of your personal information in their possession once it becomes a nonaffiliated third party.
SPECIAL NOTICE TO RESIDENTS OF VERMONT
The following section supplements our Policy with respect to our individual clients who have a Vermont address and supersedes anything to the contrary in the above Policy with respect to those clients only.
The State of Vermont requires financial institutions to obtain your consent prior to sharing personal information that they collect about you with nonaffiliated third parties, or eligibility information with affiliated companies, other than in certain limited circumstances. Except as permitted by law, we will not share personal information we collect about you with nonaffiliated third parties or eligibility information with affiliated companies, unless you provide us with your written consent to share such information.
SPECIAL NOTICE TO RESIDENTS OF CALIFORNIA
The following section supplements our Policy with respect to our individual clients who have a California address and supersedes anything to the contrary in the above Policy with respect to those clients only.
In response to a California law, if your account has a California home address, your personal information will not be disclosed to nonaffiliated third parties except as permitted by applicable California law, and we will limit sharing such personal information with our affiliates to comply with California privacy laws that apply to us.
30
Morgan Stanley Institutional Fund, Inc.
Annual Report — December 31, 2015
Director and Officer Information (unaudited)
Independent Directors:
| Name, Age and Address of Independent Director | Positions(s) Held with Registrant | Length of Time Served* | Principal Occupation(s) During Past 5 Years and Other Relevant Professional Experience | Number of Portfolios in Fund Complex Overseen by Director** | Other Directorships Held by Independent Director*** | ||||||||||||||||||
| Frank L. Bowman (71) c/o Kramer Levin Naftalis & Frankel LLP Counsel to the Independent Directors 1177 Avenue of the Americas New York, NY 10036 | Director | Since August 2006 | President, Strategic Decisions, LLC (consulting) (since February 2009); Director or Trustee of various Morgan Stanley Funds (since August 2006); Chairperson of the Compliance and Insurance Committee (since October 2015); Formerly, Chairperson of the Insurance Sub-Committee of the Compliance and Insurance Committee (February 2007-December 2015); served as President and Chief Executive Officer of the Nuclear Energy Institute (policy organization) (February 2005-November 2008); retired as Admiral, U.S. Navy after serving over 38 years on active duty including 8 years as Director of the Naval Nuclear Propulsion Program in the Department of the Navy and the U.S. Department of Energy (1996-2004); served as Chief of Naval Personnel (July 1994-September 1996); and on the Joint Staff as Director of Political Military Affairs (June 1992-July1994); knighted as Honorary Knight Commander of the Most Excellent Order of the British Empire; awarded the Officier de l'Orde National du Mérite by the French Government; elected to the National Academy of Engineering (2009). | 98 | Director of BP p.l.c.; Director of Naval and Nuclear Technologies LLP; Director Emeritus of the Armed Services YMCA; Director of the U.S. Naval Submarine League; Member of National Security Advisory Council of the Center for U.S. Global Engagement and a member of the CNA Military Advisory Board; Chairman of the Charity, J Street Cup Golf, Trustee of Fairhaven United Methodist Church; and Director of other various non-profit organizations. | ||||||||||||||||||
| Kathleen A. Dennis (62) c/o Kramer Levin Naftalis & Frankel LLP Counsel to the Independent Directors 1177 Avenue of the Americas New York, NY 10036 | Director | Since August 2006 | President, Cedarwood Associates (mutual fund and investment management consulting) (since July 2006); Chairperson of the Money Market and Alternatives Sub-Committee of the Investment Committee (since October 2006) and Director or Trustee of various Morgan Stanley Funds (since August 2006); formerly, Senior Managing Director of Victory Capital Management (1993-2006). | 98 | Director of various nonprofit organizations. | ||||||||||||||||||
| Nancy C. Everett (61) c/o Kramer Levin Naftalis & Frankel LLP Counsel to the Independent Directors 1177 Avenue of the Americas New York, NY 10036 | Director | Since January 2015 | Chief Executive Officer, Virginia Commonwealth University Investment Company (since November 2015); Owner, OBIR, LLC (investment management consulting) (since June 2014); formerly, Managing Director, BlackRock Inc. (February 2011-December 2013); and Chief Executive Officer, General Motors Asset Management (a/k/a Promark Global Advisors, Inc.) (June 2005-May 2010). | 98 | Member of Virginia Commonwealth University School of Business Foundation; formerly, Member of Virginia Commonwealth University Board of Visitors (2013-2015); Member of Committee on Directors for Emerging Markets Growth Fund, Inc. (2007-2010); Chairperson of Performance Equity Management, LLC (2006-2010); and Chairperson, GMAM Absolute Return Strategies Fund, LLC (2006-2010). | ||||||||||||||||||
31
Morgan Stanley Institutional Fund, Inc.
Annual Report — December 31, 2015
Director and Officer Information (unaudited) (cont'd)
Independent Directors: (cont'd)
| Name, Age and Address of Independent Director | Positions(s) Held with Registrant | Length of Time Served* | Principal Occupation(s) During Past 5 Years and Other Relevant Professional Experience | Number of Portfolios in Fund Complex Overseen by Director** | Other Directorships Held by Independent Director*** | ||||||||||||||||||
| Jakki L. Haussler (58) c/o Kramer Levin Naftalis & Frankel LLP Counsel to the Independent Directors 1177 Avenue of the Americas New York, NY 10036 | Director | Since January 2015 | Chairman and Chief Executive Officer, Opus Capital Group (since January 1996); and formerly, Director, Capvest Venture Fund, LP (May 2000-December 2011); Partner, Adena Ventures, LP (July 1999-December 2010); Director, The Victory Funds (February 2005-July 2008). | 98 | Director of Cincinnati Bell Inc. and Member, Audit Committee and Compensation Committee; Director of Northern Kentucky University Foundation and Member, Investment Committee; Member of Chase College of Law Transactional Law Practice Center Board of Advisors; Director of Best Transport; Chase College of Law Board of Visitors; formerly, Member, University of Cincinnati Foundation Investment Committee; Member, Miami University Board of Visitors (2008-2011); Trustee of Victory Funds (2005-2008) and Chairman, Investment Committee (2007-2008) and Member, Service Provider Committee (2005-2008). | ||||||||||||||||||
| Dr. Manuel H. Johnson (67) c/o Johnson Smick International, Inc. 220 I Street, N.E. — Suite 200 Washington, D.C. 20002 | Director | Since July 1991 | Senior Partner, Johnson Smick International, Inc. (consulting firm); Chairperson of the Investment Committee (since October 2006) and Director or Trustee of various Morgan Stanley Funds (since July 1991); Co-Chairman and a founder of the Group of Seven Council (G7C) (international economic commission); formerly Chairperson of the Audit Committee (July 1991-September 2006), Vice Chairman of the Board of Governors of the Federal Reserve System and Assistant Secretary of the U.S. Treasury. | 100 | Director of NVR, Inc. (home construction). | ||||||||||||||||||
| Joseph J. Kearns (73) c/o Kearns & Associates LLC 23823 Malibu Road S-50-440 Malibu, CA 90265 | Director | Since August 1994 | President, Kearns & Associates LLC (investment consulting); Chairperson of the Audit Committee (since October 2006) and Director or Trustee of various Morgan Stanley Funds (since August 1994); formerly, Deputy Chairperson of the Audit Committee (July 2003-September 2006) and Chairperson of the Audit Committee of various Morgan Stanley Funds (since August 1994); CFO of the J. Paul Getty Trust. | 101 | Director of Electro Rent Corporation (equipment leasing). Prior to December 31, 2013, Director of The Ford Family Foundation. | ||||||||||||||||||
32
Morgan Stanley Institutional Fund, Inc.
Annual Report — December 31, 2015
Director and Officer Information (unaudited) (cont'd)
Independent Directors: (cont'd)
| Name, Age and Address of Independent Director | Positions(s) Held with Registrant | Length of Time Served* | Principal Occupation(s) During Past 5 Years and Other Relevant Professional Experience | Number of Portfolios in Fund Complex Overseen by Director** | Other Directorships Held by Independent Director*** | ||||||||||||||||||
| Michael F. Klein (57) c/o Kramer Levin Naftalis & Frankel LLP Counsel to the Independent Directors 1177 Avenue of the Americas New York, NY 10036 | Director | Since August 2006 | Managing Director, Aetos Capital, LLC (since March 2000); Co-President, Aetos Alternatives Management, LLC (since January 2004); and Co-Chief Executive Officer of Aetos Capital LLC (since August 2013); Chairperson of the Fixed Income Sub-Committee of the Investment Committee (since October 2006) and Director or Trustee of various Morgan Stanley Funds (since August 2006); formerly, Managing Director, Morgan Stanley & Co. Inc. and Morgan Stanley Dean Witter Investment Management, President, various Morgan Stanley Funds (June1998-March 2000) and Principal, Morgan Stanley & Co. Inc. and Morgan Stanley Dean Witter Investment Management (August 1997-December 1999). | 97 | Director of certain investment funds managed or sponsored by Aetos Capital, LLC. Director of Sanitized AG and Sanitized Marketing AG (specialty chemicals). | ||||||||||||||||||
| Michael E. Nugent (79) 522 Fifth Avenue New York, NY 10036 | Chair of the Board and Director | Chair of the Boards since July 2006 and Director since July 1991 | Chair of the Boards of various Morgan Stanley Funds (since July 2006); Chairperson of the Closed-End Fund Committee (since June 2012) and Director or Trustee of various Morgan Stanley Funds (since July 1991); formerly, Chairperson of the Insurance Committee (until July 2006), General Partner, TriumphCapital, L.P. (private investment partnership) (1988-2013). | 100 | None. | ||||||||||||||||||
| W. Allen Reed (68) c/o Kramer Levin Naftalis & Frankel LLP Counsel to the Independent Directors 1177 Avenue of the Americas New York, NY 10036 | Director | Since August 2006 | Chairperson of the Equity Sub-Committee of the Investment Committee (since October 2006) and Director or Trustee of various Morgan Stanley Funds (since August 2006); formerly, President and CEO of General Motors Asset Management; Chairman and Chief Executive Officer of the GM Trust Bank and Corporate Vice President of General Motors Corporation (August 1994-December 2005). | 98 | Director of Legg Mason, Inc.; formerly, Director of the Auburn University Foundation (2010-2015). | ||||||||||||||||||
| Fergus Reid (83) c/o Joe Pietryka, Inc. 85 Charles Colman Blvd. Pawling, NY 12564 | Director | Since June 1992 | Chairman, Joe Pietryka, Inc.; Chairperson of the Governance Committee and Director or Trustee of various Morgan Stanley Funds (since June 1992). | 100 | Formerly, Trustee and Director of certain investment companies in the JP Morgan Fund Complex managed by JP Morgan Investment Management Inc. (1987-2012). | ||||||||||||||||||
33
Morgan Stanley Institutional Fund, Inc.
Annual Report — December 31, 2015
Director and Officer Information (unaudited) (cont'd)
Interested Director:
| Name, Age and Address of Interested Director | Positions(s) Held with Registrant | Length of Time Served* | Principal Occupation(s) During Past 5 Years | Number of Portfolios in Fund Complex Overseen by Interested Director** | Other Directorships Held by Interested Director*** | ||||||||||||||||||
| James F. Higgins (68) One New York Plaza, New York, NY 10004 | Director | Since June 2000 | Director or Trustee of various Morgan Stanley Funds (since June 2000); Senior Advisor of Morgan Stanley (since August 2000). | 99 | Formerly, Director of AXA Financial, Inc. and AXA Equitable Life Insurance Company (2002-2011) and Director of AXA MONY Life Insurance Company and AXA MONY Life Insurance Company of America (2004-2011). | ||||||||||||||||||
* This is the earliest date the Director began serving the Morgan Stanley Funds. Each Director serves an indefinite term, until his or her successor is elected.
** The Fund Complex includes (as of December 31, 2015) all open-end and closed-end funds (including all of their portfolios) advised by Morgan Stanley Investment Management Inc. (the "Adviser") and any funds that have an adviser that is an affiliated person of the Adviser (including, but not limited to, Morgan Stanley AIP GP LP).
*** This includes any directorships at public companies and registered investment companies held by the Director at any time during the past five years.
Executive Officers:
Name, Age and Address of Executive Officer | Position(s) Held with Registrant | Length of Time Served**** | Principal Occupation(s) During Past 5 Years | ||||||||||||
| John H. Gernon (52) 522 Fifth Avenue New York, NY 10036 | President and Principal Executive Officer | Since September 2013 | President and Principal Executive Officer of the Equity and Fixed Income Funds and the Morgan Stanley AIP Funds (since September 2013) and the Liquidity Funds and various money market funds (since May 2014) in the Fund Complex, Managing Director of the Adviser; Head of Product (since 2006). | ||||||||||||
| Stefanie V. Chang Yu (49) 522 Fifth Avenue New York, NY 10036 | Chief Compliance Officer | Since December 1997 | Managing Director of the Adviser and various entities affiliated with the Adviser; Chief Compliance Officer of various Morgan Stanley Funds and the Adviser (since January 2014); formerly, Vice President of various Morgan Stanley Funds (December 1997-January 2014). | ||||||||||||
| Joseph C. Benedetti (50) 522 Fifth Avenue New York, NY 10036 | Vice President | Since January 2014 | Managing Director of the Adviser and various entities affiliated with the Adviser; Vice President of various Morgan Stanley Funds (since January 2014); formerly, Assistant Secretary of various Morgan Stanley Funds (October 2004-January 2014). | ||||||||||||
| Francis J. Smith (50) 522 Fifth Avenue New York, NY 10036 | Treasurer and Principal Financial Officer | Treasurer since July 2003 and Principal Financial Officer since September 2002 | Executive Director of the Adviser and various entities affiliated with the Adviser; Treasurer (since July 2003) and Principal Financial Officer of various Morgan Stanley Funds (since September 2002). | ||||||||||||
| Mary E. Mullin (48) 522 Fifth Avenue New York, NY 10036 | Secretary | Since June 1999 | Executive Director of the Adviser; Secretary of various Morgan Stanley Funds (since June 1999). | ||||||||||||
**** This is the earliest date the officer began serving the Morgan Stanley Funds. Each officer serves a one-year term, until his or her successor is elected and has qualified.
34
Morgan Stanley Institutional Fund, Inc.
Annual Report — December 31, 2015
Adviser and Administrator
Morgan Stanley Investment Management Inc.
522 Fifth Avenue
New York, New York 10036
Distributor
Morgan Stanley Distribution, Inc.
522 Fifth Avenue
New York, New York 10036
Dividend Disbursing and Transfer Agent
Boston Financial Data Services, Inc.
2000 Crown Colony Drive
Quincy, Massachusetts 02169
Custodian
State Street Bank and Trust Company
One Lincoln Street
Boston, Massachusetts 02111
Legal Counsel
Dechert LLP
1095 Avenue of the Americas
New York, New York 10036
Counsel to the Independent Directors
Kramer Levin Naftalis & Frankel LLP
1177 Avenue of the Americas
New York, New York 10036
Independent Registered Public Accounting Firm
Ernst & Young LLP
200 Clarendon Street
Boston, Massachusetts 02116
Reporting to Shareholders
Each Morgan Stanley fund provides a complete schedule of portfolio holdings in its semi-annual and annual reports within 60 days of the end of the fund's second and fourth fiscal quarters. The semi-annual and annual reports are filed electronically with the Securities and Exchange Commission (SEC) on Form N-CSRS and Form N-CSR, respectively. Morgan Stanley also delivers the semi-annual and annual reports to fund shareholders and makes these reports available on its public website, www.morganstanley.com/im. Each Morgan Stanley fund also files a complete schedule of portfolio holdings with the SEC for the fund's first and third fiscal quarters on Form N-Q. Morgan Stanley does not deliver the reports for the first and third fiscal quarters to shareholders, nor are the reports posted to the Morgan Stanley public website. You may, however, obtain the Form N-Q filings (as well as the Form N-CSR and N-CSRS filings) by accessing the SEC's website, www.sec.gov. You may also review and copy them at the SEC's Public Reference Room in Washington, DC. Information on the operation of the SEC's Public Reference Room may be obtained by calling the SEC toll free at 1 (800) SEC-0330. You can also request copies of these materials, upon payment of a duplicating fee, by electronic request at the SEC's email address (publicinfo@sec.gov) or by writing the Public Reference Room of the SEC, Washington, DC 20549-0102.
Proxy Voting Policies and Procedures and Proxy Voting Record
You may obtain a copy of the Fund's Proxy Voting Policy and Procedures and information regarding how the Fund voted proxies relating to portfolio securities during the most recent twelve-month period ended June 30, without charge, upon request, by calling toll free 1 (800) 548-7786 or by visiting our website at www.morganstanley.com/im. This information is also available on the SEC's website at www.sec.gov.
This report is authorized for distribution only when preceded or accompanied by a prospectus of the Morgan Stanley Institutional Fund, Inc., which describes in detail each Portfolio's investment policies, risks, fees and expenses. Please read the prospectus carefully before you invest or send money. For additional information, including information regarding the investments comprising the Portfolio, please visit our website at www.morganstanley.com/im or call toll free 1 (800) 548-7786.
35
(This Page has been left blank intentionally.)
Printed in U.S.A.
This Report has been prepared for shareholders and may be distributed to others only if preceded or accompanied by a current prospectus.
Morgan Stanley Investment Management Inc.
522 Fifth Avenue
New York, New York 10036
© 2016 Morgan Stanley. Morgan Stanley Distribution, Inc.

IFIUSREAANN
1407815 EXP. 02.28.17
INVESTMENT MANAGEMENT

Morgan Stanley Institutional Fund, Inc.
Small Company Growth Portfolio
Annual Report
December 31, 2015

Morgan Stanley Institutional Fund, Inc.
Annual Report — December 31, 2015
Table of Contents
Shareholders' Letter | 2 | ||||||
Expense Example | 3 | ||||||
Investment Overview | 4 | ||||||
Portfolio of Investments | 6 | ||||||
Statement of Assets and Liabilities | 9 | ||||||
Statement of Operations | 11 | ||||||
Statements of Changes in Net Assets | 12 | ||||||
Financial Highlights | 14 | ||||||
Notes to Financial Statements | 18 | ||||||
Report of Independent Registered Public Accounting Firm | 30 | ||||||
Federal Tax Notice | 31 | ||||||
U.S. Privacy Policy | 32 | ||||||
Director and Officer Information | 35 | ||||||
This report is authorized for distribution only when preceded or accompanied by prospectuses of the Morgan Stanley Institutional Fund, Inc. To receive a prospectus and/or statement of additional information (SAI), which contains more complete information such as investment objectives, charges, expenses, policies for voting proxies, risk considerations, and describes in detail each of the Portfolio's investment policies to the prospective investor, please call toll free 1 (800) 548-7786. Please read the prospectuses carefully before you invest or send money.
Additionally, you can access portfolio information including performance, characteristics, and investment team commentary through Morgan Stanley Investment Management's website: www.morganstanley.com/im.
Market forecasts provided in this report may not necessarily come to pass. There is no guarantee that any sectors mentioned will continue to perform as discussed herein or that securities in such sectors will be held by the Portfolio in the future. There is no assurance that a Portfolio will achieve its investment objective. Portfolios are subject to market risk, which is the possibility that market values of securities owned by the Portfolio will decline and, therefore, the value of the Portfolio's shares may be less than what you paid for them. Accordingly, you can lose money investing in this Portfolio. Please see the prospectus for more complete information on investment risks.
1
Morgan Stanley Institutional Fund, Inc.
Annual Report — December 31, 2015
Shareholders' Letter (unaudited)
Dear Shareholders,
We are pleased to provide this Annual report, in which you will learn how your investment in Small Company Growth Portfolio (the "Portfolio") performed during the latest twelve-month period.
Morgan Stanley Investment Management is a client-centric, investor-led organization. Our global presence, intellectual capital, and breadth of products and services enable us to partner with investors to meet the evolving challenges of today's financial markets. We aim to deliver superior investment service and to empower our clients to make the informed decisions that help them reach their investment goals.
As always, we thank you for selecting Morgan Stanley Investment Management, and look forward to working with you in the months and years ahead.
Sincerely,

John H. Gernon
President and Principal Executive Officer
January 2016
2
Morgan Stanley Institutional Fund, Inc.
Annual Report — December 31, 2015
Expense Example (unaudited)
Small Company Growth Portfolio
As a shareholder of the Portfolio, you incur two types of costs: (1) transactional costs, including redemptions fees; and (2) ongoing costs, including advisory fees, administration fees, distribution and shareholder services fees and other Portfolio expenses. This example is intended to help you understand your ongoing costs (in dollars) of investing in the Portfolio and to compare these costs with the ongoing costs of investing in other mutual funds.
This example is based on an investment of $1,000 invested at the beginning of the six-month period ended December 31, 2015 and held for the entire six-month period.
Actual Expenses
The table below provides information about actual account values and actual expenses. You may use the information in this table, together with the amount you invested, to estimate the expenses that you paid over the period. Simply divide your account value by $1,000 (for example, an $8,600 account value divided by $1,000 = 8.6), then multiply the result by the number in the table under the heading entitled "Actual Expenses Paid During Period" to estimate the expenses you paid on your account during this period.
Hypothetical Example for Comparison Purposes
The table below provides information about hypothetical account values and hypothetical expenses based on the Portfolio's actual expense ratio and an assumed rate of return of 5% per year before expenses, which is not the Portfolio's actual return. The hypothetical account values and expenses may not be used to estimate the actual ending account balance or expenses you paid for the period. You may use this information to compare the ongoing costs of investing in the Portfolio and other funds. To do so, compare this 5% hypothetical example with the 5% hypothetical examples that appear in the shareholder reports of the other funds.
Please note that the expenses shown in the table are meant to highlight your ongoing costs only and do not reflect any transactional costs, such as sales charges (loads) and redemption fees. Therefore, the information for each class in the table is useful in comparing ongoing costs only, and will not help you determine the relative total costs of owning different funds. In addition, if these transactional costs were included, your costs would have been higher.
| Beginning Account Value 7/1/15 | Actual Ending Account Value 12/31/15 | Hypothetical Ending Account Value | Actual Expenses Paid During Period* | Hypothetical Expenses Paid During Period* | Net Expense Ratio During Period** | ||||||||||||||||||||||
Small Company Growth Portfolio Class I | $ | 1,000.00 | $ | 841.00 | $ | 1,019.91 | $ | 4.87 | $ | 5.35 | 1.05 | % | |||||||||||||||
Small Company Growth Portfolio Class A | 1,000.00 | 839.70 | 1,018.40 | 6.26 | 6.87 | 1.35 | |||||||||||||||||||||
Small Company Growth Portfolio Class L | 1,000.00 | 837.40 | 1,015.63 | 8.80 | 9.65 | 1.90 | |||||||||||||||||||||
Small Company Growth Portfolio Class IS | 1,000.00 | 841.20 | 1,020.27 | 4.55 | 4.99 | 0.98 | |||||||||||||||||||||
* Expenses are calculated using each Portfolio Class' annualized net expense ratio (as disclosed), multiplied by the average account value over the period, and multiplied by 184/365 (to reflect the most recent one-half year period).
** Annualized.
3
Morgan Stanley Institutional Fund, Inc.
Annual Report — December 31, 2015
Investment Overview (unaudited)
Small Company Growth Portfolio
The Portfolio seeks long-term capital appreciation by investing primarily in growth-oriented equity securities of small capitalization companies.
Performance
For the year ended December 31, 2015, the Portfolio's Class I shares had a total return based on net asset value and reinvestment of distributions per share of -9.58%, net of fees. The Portfolio's Class I shares underperformed the Portfolio's benchmark, the Russell 2000® Growth Index (the "Index"), which returned -1.38%.
Factors Affecting Performance
• The broad stock market ended the 12-month period at nearly the same level where it started, masking the considerable gyrations stock prices endured in between. The anticipation of the U.S. Federal Reserve's (Fed) first rate increase, the persistent slide in commodity prices, and global economic weakness, especially in China, weighed on the market throughout the period. Although U.S. economic data were mixed throughout the period, the economy's slow recovery continued, sufficiently that the Fed decided in December to raise its main policy interest rate, after keeping it near zero since December 2008 to stimulate growth.
• Slowing corporate earnings growth and a record year for merger and acquisition deals dominated the business headlines. Falling oil and raw materials prices caused considerable tumult for share prices in the energy, materials and industrials sectors. Although expectations were that consumer-oriented companies would benefit from consumers spending less at the gas pump, the boost to discretionary spending disappointed as consumers tended to pocket the savings. The U.S. dollar's strength relative to other major currencies, propelled by the Fed's move to a tightening stance while other global central banks were easing, also hurt the profits of U.S. multinational companies. Their foreign sales are worth less when translated back into U.S. dollars, and overseas demand is crimped when U.S. products become more expensive.
• The Portfolio's underperformance during the period was driven by stock selection, with most of the relative losses occurring in the consumer discretionary, health care and information technology (IT) sectors. In the consumer
discretionary sector, a holding in an e-commerce platform detracted as the company reported weaker-than-expected quarterly results, characterized by a revenue miss due to slower volume growth on its platform, and management also indicated profit margins are likely to decline in the near-term in part due to greater marketing spend. We believe this will prove transitory and remain attracted to the company on account of the network effect competitive advantage it has developed in building and operating a global e-commerce marketplace for unique handcrafted and vintage merchandise which has attracted over 50 million members and 20 million active buyers.
• Relative weakness in the health care sector was led by a health care IT company that offers a software tool providing employees a personalized view of their medical benefits and costs associated with medical procedures. Although the company reported solid quarterly results, its shares declined as management's guidance disappointed investors. We believe the company is well positioned because, by aggregating data from multiple sources, it is uniquely suited to provide personalized analytics and cost reduction suggestions to employees.
• The largest detractor in the IT sector was a position in a leading online and mobile platform for restaurant delivery orders in the U.S. While the company reported solid quarterly results, concerns around growing competition have weighed on investor sentiment in recent months. We believe this will prove transitory, as the company has significant brand, scale, and network effect competitive advantages. We remain attracted to the company as its business model — which connects restaurants with consumers — disrupts the traditional phone-in delivery method, which is fraught with inefficiencies. We believe the company has a sizeable opportunity to take share in a large addressable market.
• The Portfolio's underweight position in the energy sector, where we held one stock, was a key contributor to relative performance. The sector was by far the weakest-performing sector in the Index over the period.
4
Morgan Stanley Institutional Fund, Inc.
Annual Report — December 31, 2015
Investment Overview (unaudited) (cont'd)
Small Company Growth Portfolio
Management Strategies
• There were no changes to our bottom-up investment process during the period. We continued to look for high-quality growth companies that we believe have these attributes: sustainable competitive advantages, above-average business visibility, rising return on invested capital, strong free cash flow generation and a favorable risk/reward profile. We find these companies through intense fundamental research. Our emphasis is on secular growth, and as a result short-term market events are not as meaningful in the stock selection process.
• The long-term investment horizon and conviction-weighted investment approach embraced by the team since 1998 can result in periods of performance deviation from the benchmark and peers, as was the case during this reporting period. Our team continues to focus on bottom-up stock selection and the long-term outlook for companies owned in the Portfolio; accordingly, we have had very little turnover in the Portfolio to date, as our ongoing work reaffirms our assessment of quality and competitive advantage in the names we own.
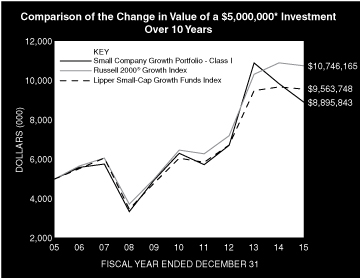
* Minimum Investment for Class I shares
In accordance with SEC regulations, the Portfolio's performance shown assumes that all recurring fees (including management fees) were deducted and all dividends and distributions were reinvested. The performance of Class A, L and IS shares will vary from the performance of Class I shares based upon their different inception dates and will be negatively impacted by additional fees assessed to those classes (if applicable).
Performance Compared to the Russell 2000® Growth Index(1) and the Lipper Small-Cap Growth Funds Index(2)
| Period Ended December 31, 2015 Total Returns(3) | |||||||||||||||||||
Average Annual | |||||||||||||||||||
| One Year | Five Years | Ten Years | Since Inception(8) | ||||||||||||||||
| Portfolio — Class I Shares w/o sales charges(4) | –9.58 | % | 7.12 | % | 5.93 | % | 10.57 | % | |||||||||||
| Portfolio — Class A Shares w/o sales charges(5) | –9.88 | 6.81 | 5.64 | 9.44 | |||||||||||||||
| Portfolio — Class A Shares with maximum 5.25% sales charges(5) | –14.64 | 5.66 | 5.07 | 9.15 | |||||||||||||||
| Portfolio — Class L Shares w/o sales charges(6) | –10.36 | — | — | 9.37 | |||||||||||||||
| Portfolio — Class IS Shares w/o sales charges(7) | –9.52 | — | — | –2.09 | |||||||||||||||
Russell 2000® Growth Index | –1.38 | 10.67 | 7.95 | 7.58 | |||||||||||||||
| Lipper Small-Cap Growth Funds Index | –1.15 | 9.56 | 6.70 | 9.02 | |||||||||||||||
Performance data quoted represents past performance, which is no guarantee of future results, and current performance may be lower or higher than the figures shown. Performance assumes that all dividends and distributions, if any, were reinvested. For the most recent month-end performance figures, please visit www.morganstanley.com/im. Investment return and principal value will fluctuate so that Portfolio shares, when redeemed, may be worth more or less than their original cost. Total returns do not reflect the deduction of taxes that a shareholder would pay on Portfolio distributions or the redemption of Portfolio shares. Performance of share classes will vary due to difference in sales charges and expenses.
(1) The Russell 2000® Growth Index measures the performance of the small-cap growth segment of the U.S. equity universe. It includes those Russell 2000® Index companies with higher price-to-book ratios and higher forecasted growth values. The Russell 2000® Index is a subset of the Russell 3000® Index representing approximately 10% of the total market capitalization of that index. It includes approximately 2,000 of the smallest securities based on a combination of their market capitalization and current index membership. The Index is unmanaged and its returns do not include any sales charges or fees. Such costs would lower performance. It is not possible to invest directly in an index.
(2) The Lipper Small-Cap Growth Funds Index is an equally weighted performance index of the largest qualifying funds (based on net assets) in the Lipper Small-Cap Growth Funds classification. The Index, which is adjusted for capital gains distributions and income dividends, is unmanaged and should not be considered an investment. There are currently 30 funds represented in this Index. As of the date of this report, the Portfolio is in the Lipper Small-Cap Growth Funds classification.
(3) Total returns for the Portfolio reflect fees waived and expenses reimbursed, if applicable, by the Adviser. Without such waivers and reimbursements, total returns would have been lower.
(4) Commenced operations on November 1, 1989.
(5) Commenced offering on January 2, 1996.
(6) Commenced offering on November 11, 2011.
(7) Commenced offering on September 13, 2013.
(8) For comparative purposes, average annual since inception returns listed for the Indexes refer to the inception date of Class I of the Portfolio, not the inception of the Index.
5
Morgan Stanley Institutional Fund, Inc.
Annual Report — December 31, 2015
Portfolio of Investments
Small Company Growth Portfolio
Shares | Value (000) | ||||||||||
Common Stocks (89.6%) | |||||||||||
Aerospace & Defense (3.7%) | |||||||||||
BWX Technologies, Inc. | 1,758,398 | $ | 55,864 | ||||||||
Air Freight & Logistics (2.1%) | |||||||||||
XPO Logistics, Inc. (a)(b) | 1,180,570 | 32,171 | |||||||||
Biotechnology (3.7%) | |||||||||||
ACADIA Pharmaceuticals, Inc. (b) | 115,957 | 4,134 | |||||||||
Agios Pharmaceuticals, Inc. (a)(b) | 95,965 | 6,230 | |||||||||
Alnylam Pharmaceuticals, Inc. (b) | 75,385 | 7,097 | |||||||||
Bellicum Pharmaceuticals, Inc. (b) | 313,260 | 6,350 | |||||||||
Clovis Oncology, Inc. (b) | 74,114 | 2,594 | |||||||||
Insmed, Inc. (b) | 192,504 | 3,494 | |||||||||
Intrexon Corp. (a)(b) | 280,952 | 8,470 | |||||||||
Ironwood Pharmaceuticals, Inc. (b) | 677,827 | 7,856 | |||||||||
Juno Therapeutics, Inc. (a)(b) | 102,769 | 4,519 | |||||||||
Spark Therapeutics, Inc. (a)(b) | 96,458 | 4,370 | |||||||||
ZIOPHARM Oncology, Inc. (a)(b) | 51,495 | 428 | |||||||||
55,542 | |||||||||||
Capital Markets (2.3%) | |||||||||||
Financial Engines, Inc. | 669,635 | 22,547 | |||||||||
WisdomTree Investments, Inc. | 745,632 | 11,691 | |||||||||
34,238 | |||||||||||
Chemicals (1.3%) | |||||||||||
Platform Specialty Products Corp. (b) | 1,501,487 | 19,264 | |||||||||
Consumer Finance (2.0%) | |||||||||||
LendingClub Corp. (b) | 2,815,575 | 31,112 | |||||||||
Electronic Equipment, Instruments & Components (0.9%) | |||||||||||
Cognex Corp. | 224,481 | 7,581 | |||||||||
FARO Technologies, Inc. (b) | 220,439 | 6,507 | |||||||||
14,088 | |||||||||||
Health Care Equipment & Supplies (1.0%) | |||||||||||
Novocure Ltd. (a)(b) | 214,159 | 4,789 | |||||||||
Penumbra, Inc. (b) | 207,603 | 11,171 | |||||||||
15,960 | |||||||||||
Health Care Providers & Services (2.0%) | |||||||||||
HealthEquity, Inc. (b) | 1,198,068 | 30,036 | |||||||||
Health Care Technology (10.8%) | |||||||||||
athenahealth, Inc. (b) | 485,207 | 78,104 | |||||||||
Castlight Health, Inc., Class B (a)(b) | 2,308,627 | 9,858 | |||||||||
Medidata Solutions, Inc. (b) | 910,213 | 44,864 | |||||||||
Press Ganey Holdings, Inc. (b) | 417,595 | 13,175 | |||||||||
Veeva Systems, Inc., Class A (b) | 629,508 | 18,161 | |||||||||
164,162 | |||||||||||
Hotels, Restaurants & Leisure (4.8%) | |||||||||||
Fiesta Restaurant Group, Inc. (b) | 510,166 | 17,142 | |||||||||
Habit Restaurants, Inc. (The) (a)(b) | 662,952 | 15,288 | |||||||||
Krispy Kreme Doughnuts, Inc. (b) | 549,836 | 8,286 | |||||||||
Lindblad Expeditions Holdings, Inc. (b) | 555,915 | 6,176 | |||||||||
Wingstop, Inc. (a)(b) | 321,018 | 7,322 | |||||||||
Zoe's Kitchen, Inc. (a)(b) | 654,186 | 18,304 | |||||||||
72,518 | |||||||||||
Shares | Value (000) | ||||||||||
Internet & Catalog Retail (6.0%) | |||||||||||
Blue Nile, Inc. (b) | 230,036 | $ | 8,541 | ||||||||
Etsy, Inc. (a)(b) | 1,574,874 | 13,008 | |||||||||
MakeMyTrip Ltd. (India) (a)(b) | 540,722 | 9,279 | |||||||||
Ocado Group PLC (United Kingdom) (b) | 3,597,728 | 16,027 | |||||||||
Qunar Cayman Islands Ltd. ADR (China) (a)(b) | 236,975 | 12,498 | |||||||||
Wayfair, Inc., Class A (a)(b) | 678,403 | 32,306 | |||||||||
91,659 | |||||||||||
Internet Software & Services (21.5%) | |||||||||||
Angie's List, Inc. (a)(b) | 1,074,161 | 10,043 | |||||||||
Autohome, Inc. ADR (China) (b) | 513,780 | 17,941 | |||||||||
Benefitfocus, Inc. (a)(b) | 493,786 | 17,969 | |||||||||
Criteo SA ADR (France) (b) | 1,228,183 | 48,636 | |||||||||
GrubHub, Inc. (a)(b) | 2,435,083 | 58,929 | |||||||||
Just Eat PLC (United Kingdom) (b) | 3,580,072 | 26,039 | |||||||||
Marketo, Inc. (b) | 799,691 | 22,959 | |||||||||
New Relic, Inc. (b) | 273,514 | 9,964 | |||||||||
OPOWER, Inc. (a)(b) | 658,142 | 6,950 | |||||||||
Quotient Technology, Inc. (a)(b) | 839,682 | 5,727 | |||||||||
Shutterstock, Inc. (a)(b) | 922,048 | 29,819 | |||||||||
Twitter, Inc. (b) | 1,332,745 | 30,840 | |||||||||
Zillow Group, Inc., Class A (a)(b) | 551,792 | 14,369 | |||||||||
Zillow Group, Inc., Class C (a)(b) | 1,103,584 | 25,912 | |||||||||
326,097 | |||||||||||
Machinery (5.4%) | |||||||||||
Joy Global, Inc. (a) | 1,034,660 | 13,047 | |||||||||
Manitowoc Co., Inc. (The) (a) | 3,513,305 | 53,929 | |||||||||
Terex Corp. | 781,431 | 14,441 | |||||||||
81,417 | |||||||||||
Media (0.5%) | |||||||||||
| Legend Pictures LLC Ltd. (b)(c)(d)(e) (acquisition cost — $5,829; acquired 3/8/12) | 5,452 | 7,611 | |||||||||
Multi-line Retail (0.5%) | |||||||||||
Ollie's Bargain Outlet Holdings, Inc. (a)(b) | 475,821 | 8,094 | |||||||||
Multi-Utilities (0.0%) | |||||||||||
AET&D Holdings No. 1 Ltd. (Australia) (b)(c)(e) | 6,682,555 | — | |||||||||
Pharmaceuticals (1.0%) | |||||||||||
Impax Laboratories, Inc. (b) | 360,720 | 15,424 | |||||||||
Professional Services (5.5%) | |||||||||||
Advisory Board Co. (The) (b) | 696,464 | 34,552 | |||||||||
CEB, Inc. | 409,449 | 25,136 | |||||||||
WageWorks, Inc. (b) | 513,449 | 23,295 | |||||||||
82,983 | |||||||||||
Software (8.1%) | |||||||||||
Ellie Mae, Inc. (b) | 444,979 | 26,801 | |||||||||
FleetMatics Group PLC (b) | 610,499 | 31,007 | |||||||||
Guidewire Software, Inc. (b) | 649,532 | 39,076 | |||||||||
Xero Ltd. (Australia) (b) | 486,602 | 6,566 | |||||||||
Zendesk, Inc. (b) | 752,489 | 19,896 | |||||||||
123,346 | |||||||||||
The accompanying notes are an integral part of the financial statements.
6
Morgan Stanley Institutional Fund, Inc.
Annual Report — December 31, 2015
Portfolio of Investments (cont'd)
Small Company Growth Portfolio
Shares | Value (000) | ||||||||||
Specialty Retail (6.0%) | |||||||||||
Five Below, Inc. (b) | 1,570,417 | $ | 50,411 | ||||||||
Restoration Hardware Holdings, Inc. (a)(b) | 502,383 | 39,914 | |||||||||
90,325 | |||||||||||
Tech Hardware, Storage & Peripherals (0.5%) | |||||||||||
Pure Storage, Inc., Class A (a)(b) | 457,067 | 7,117 | |||||||||
Total Common Stocks (Cost $1,215,248) | 1,359,028 | ||||||||||
Preferred Stocks (6.5%) | |||||||||||
Health Care Technology (0.4%) | |||||||||||
| Grand Rounds, Inc. Series B (b)(c)(d)(e) (acquisition cost — $3,362; acquired 7/3/14) | 3,269,139 | 5,623 | |||||||||
Hotels, Restaurants & Leisure (1.1%) | |||||||||||
| Blue Bottle Coffee, Inc. Series B (b)(c)(d)(e) (acquisition cost — $13,714; acquired 1/24/14) | 947,792 | 17,657 | |||||||||
Internet & Catalog Retail (2.8%) | |||||||||||
| Flipkart Online Services Pvt Ltd. Series D (b)(c)(d)(e) (acquisition cost — $9,579; acquired 10/4/13) | 417,464 | 43,404 | |||||||||
Internet Software & Services (0.6%) | |||||||||||
| Doximity, Inc. Series C (b)(c)(d)(e) (acquisition cost — $8,482; acquired 4/10/14) | 1,759,434 | 8,252 | |||||||||
| Mode Media Corporation Series M-1 (b)(c)(d)(e) (acquisition cost — $5,449; acquired 3/19/08) | 361,920 | 329 | |||||||||
| Mode Media Corporation Escrow Series M-1 (b)(c)(d)(e) (acquisition cost — $506; acquired 3/19/08) | 51,702 | 21 | |||||||||
8,602 | |||||||||||
Software (1.6%) | |||||||||||
| DOMO, Inc. (b)(c)(d)(e) (acquisition cost — $10,559; acquired 1/31/14 — 2/7/14) | 2,554,715 | 16,938 | |||||||||
| Lookout, Inc. Series F (b)(c)(d)(e) (acquisition cost — $13,476; acquired 6/17/14) | 1,179,743 | 7,055 | |||||||||
23,993 | |||||||||||
Tobacco (0.0%) | |||||||||||
| NJOY, Inc. Series D (b)(c)(d)(e) (acquisition cost — $6,363; acquired 2/14/14) | 375,918 | 368 | |||||||||
Total Preferred Stocks (Cost $71,490) | 99,647 | ||||||||||
Convertible Preferred Stock (0.0%) | |||||||||||
Internet Software & Services (0.0%) | |||||||||||
| Youku Tudou, Inc., Class A (China) (b)(c)(d)(e) (acquisition cost — $—@; acquired 9/16/10) (Cost $—@) | 1 | — | @ | ||||||||
Participation Note (0.1%) | |||||||||||
Hotels, Restaurants & Leisure (0.1%) | |||||||||||
| Lindblad Expeditions Holdings, Inc., Equity Linked Notes, expires 7/8/20 (b) (Cost $628) | 314,094 | 958 | |||||||||
| Face Amount (000) | Value (000) | ||||||||||
Promissory Notes (0.0%) | |||||||||||
Internet Software & Services (0.0%) | |||||||||||
| Mode Media Corporation 9.00%, 12/3/19 (b)(c)(d)(e) (acquisition cost — $2,301; acquired 3/19/08) | $ | 793 | $ | 531 | |||||||
| Mode Media Corporation Escrow 9.00%, 12/3/19 (b)(c)(d)(e) (acquisition cost — $40 acquired 3/19/08) | 29 | 9 | |||||||||
Total Promissory Notes (Cost $2,341) | 540 | ||||||||||
| Notional Amount | |||||||||||
Call Option Purchased (0.3%) | |||||||||||
Foreign Currency Option (0.3%) | |||||||||||
| USD/CNY June 2016 @ CNY 6.70, Royal Bank of Scotland (Cost $1,007) | 258,514,365 | 4,460 | |||||||||
Shares | |||||||||||
Short-Term Investments (23.0%) | |||||||||||
Securities held as Collateral on Loaned Securities (17.2%) | |||||||||||
Investment Company (14.7%) | |||||||||||
| Morgan Stanley Institutional Liquidity Funds — Treasury Securities Portfolio — Institutional Class (See Note G) | 223,015,213 | 223,015 | |||||||||
| Face Amount (000) | |||||||||||
Repurchase Agreements (2.5%) | |||||||||||
| Barclays Capital, Inc., (0.32%, dated 12/31/15, due 1/4/16; proceeds $9,616; fully collateralized by a U.S. Government obligation; 2.00% due 11/30/22; valued at $9,808) | $ | 9,616 | 9,616 | ||||||||
| Merrill Lynch & Co., Inc., (0.31%, dated 12/31/15, due 1/4/16; proceeds $27,947; fully collateralized by a U.S. Government agency security; 4.00% due 11/20/45; valued at $28,505) | 27,946 | 27,946 | |||||||||
37,562 | |||||||||||
| Total Securities held as Collateral on Loaned Securities (Cost $260,577) | 260,577 | ||||||||||
Shares | |||||||||||
Investment Company (5.8%) | |||||||||||
| Morgan Stanley Institutional Liquidity Funds — Money Market Portfolio — Institutional Class (See Note G) (Cost $87,547) | 87,547,426 | 87,547 | |||||||||
Total Short-Term Investments (Cost $348,124) | 348,124 | ||||||||||
| Total Investments (119.5%) (Cost $1,638,838) Including $253,320 of Securities Loaned (f)(g) | 1,812,757 | ||||||||||
Liabilities in Excess of Other Assets (–19.5%) | (295,742 | ) | |||||||||
Net Assets (100.0%) | $ | 1,517,015 | |||||||||
(a) All or a portion of this security was on loan at December 31, 2015.
The accompanying notes are an integral part of the financial statements.
7
Morgan Stanley Institutional Fund, Inc.
Annual Report — December 31, 2015
Portfolio of Investments (cont'd)
Small Company Growth Portfolio
(b) Non-income producing security.
(c) Security has been deemed illiquid at December 31, 2015.
(d) Security cannot be offered for public resale without first being registered under the Securities Act of 1933 and related rules ("restricted security"). Acquisition date represents the day on which an enforceable right to acquire such security is obtained and is presented along with related cost in the security description. The Portfolio has registration rights for certain restricted securities. Any costs related to such registration are borne by the issuer. The aggregate value of restricted securities (excluding 144A holdings) at December 31, 2015 amounts to approximately $107,798,000 and represents 7.1% of net assets.
(e) At December 31, 2015, the Portfolio held fair valued securities valued at approximately $107,798,000, representing 7.1% of net assets. These securities have been fair valued as determined in good faith under procedures established by and under the general supervision of the Fund's Directors.
(f) The approximate fair value and percentage of net assets, $48,632,000 and 3.2%, respectively, represent the securities that have been fair valued under the fair valuation policy for international investments as described in Note A-1 within the Notes to the Financial Statements.
(g) At December 31, 2015, the aggregate cost for Federal income tax purposes is approximately $1,660,510,000. The aggregate gross unrealized appreciation is approximately $305,203,000 and the aggregate gross unrealized depreciation is approximately $152,956,000 resulting in net unrealized appreciation of approximately $152,247,000.
@ Value is less than $500.
ADR American Depositary Receipt.
CNY Chinese Yuan Renminbi
USD United States Dollar
Portfolio Composition*
Classification | Percentage of Total Investments | ||||||
Internet Software & Services | 21.6 | % | |||||
Other** | 21.4 | ||||||
Health Care Technology | 10.9 | ||||||
Software | 9.5 | ||||||
Internet & Catalog Retail | 8.7 | ||||||
Hotels, Restaurants & Leisure | 5.9 | ||||||
Specialty Retail | 5.8 | ||||||
Short-Term Investment | 5.6 | ||||||
Professional Services | 5.4 | ||||||
Machinery | 5.2 | ||||||
Total Investments | 100.0 | % | |||||
* Percentages indicated are based upon total investments (excluding Securities held as Collateral on Loaned Securities) as of December 31, 2015.
** Industries and/or investment types representing less than 5% of total investments.
The accompanying notes are an integral part of the financial statements.
8
Morgan Stanley Institutional Fund, Inc.
Annual Report — December 31, 2015
Small Company Growth Portfolio
Statement of Assets and Liabilities | December 31, 2015 (000) | ||||||
Assets: | |||||||
Investments in Securities of Unaffiliated Issuers, at Value(1) (Cost $1,328,276) | $ | 1,502,195 | |||||
Investments in Securities of Affiliated Issuer, at Value (Cost $310,562) | 310,562 | ||||||
Total Investments in Securities, at Value (Cost $1,638,838) | 1,812,757 | ||||||
Foreign Currency, at Value (Cost $—@) | — | @ | |||||
Receivable for Portfolio Shares Sold | 990 | ||||||
Interest Receivable | 148 | ||||||
Dividends Receivable | 59 | ||||||
Receivable from Affiliate | 20 | ||||||
Other Assets | 109 | ||||||
Total Assets | 1,814,083 | ||||||
Liabilities: | |||||||
Collateral on Securities Loaned, at Value | 260,577 | ||||||
Payable for Portfolio Shares Redeemed | 27,912 | ||||||
Due to Broker | 4,530 | ||||||
Payable for Advisory Fees | 3,529 | ||||||
Payable for Sub Transfer Agency Fees — Class I | 160 | ||||||
Payable for Sub Transfer Agency Fees — Class A | 53 | ||||||
Payable for Sub Transfer Agency Fees — Class L | 2 | ||||||
Payable for Administration Fees | 108 | ||||||
Payable for Shareholder Services Fees — Class A | 30 | ||||||
Payable for Distribution and Shareholder Services Fees — Class L | 1 | ||||||
Payable for Custodian Fees | 21 | ||||||
Payable for Professional Fees | 18 | ||||||
Payable for Directors' Fees and Expenses | 13 | ||||||
Payable for Transfer Agency Fees — Class I | 5 | ||||||
Payable for Transfer Agency Fees — Class A | 4 | ||||||
Payable for Transfer Agency Fees — Class L | — | @ | |||||
Payable for Transfer Agency Fees — Class IS | 1 | ||||||
Other Liabilities | 104 | ||||||
Total Liabilities | 297,068 | ||||||
Net Assets | $ | 1,517,015 | |||||
Net Assets Consist Of: | |||||||
Paid-in-Capital | $ | 1,348,516 | |||||
Accumulated Net Investment Loss | (1,142 | ) | |||||
Distributions in Excess of Net Realized Gain | (4,278 | ) | |||||
Unrealized Appreciation (Depreciation) on: | |||||||
Investments | 173,919 | ||||||
Foreign Currency Translations | (— | @) | |||||
Net Assets | $ | 1,517,015 | |||||
The accompanying notes are an integral part of the financial statements.
9
Morgan Stanley Institutional Fund, Inc.
Annual Report — December 31, 2015
Small Company Growth Portfolio
Statement of Assets and Liabilities (cont'd) | December 31, 2015 (000) | ||||||
CLASS I: | |||||||
Net Assets | $ | 718,386 | |||||
| Shares Outstanding $0.001 par value shares of beneficial interest (unlimited shares authorized) (not in 000's) | 52,255,191 | ||||||
Net Asset Value, Offering and Redemption Price Per Share | $ | 13.75 | |||||
CLASS A: | |||||||
Net Assets | $ | 136,621 | |||||
| Shares Outstanding $0.001 par value shares of beneficial interest (unlimited shares authorized) (not in 000's) | 11,153,618 | ||||||
Net Asset Value, Redemption Price Per Share | $ | 12.25 | |||||
Maximum Sales Load | 5.25 | % | |||||
Maximum Sales Charge | $ | 0.68 | |||||
Maximum Offering Price Per Share | $ | 12.93 | |||||
CLASS L: | |||||||
Net Assets | $ | 1,874 | |||||
| Shares Outstanding $0.001 par value shares of beneficial interest (unlimited shares authorized) (not in 000's) | 157,183 | ||||||
Net Asset Value, Offering and Redemption Price Per Share | $ | 11.92 | |||||
CLASS IS: | |||||||
Net Assets | $ | 660,134 | |||||
| Shares Outstanding $0.001 par value shares of beneficial interest (unlimited shares authorized) (not in 000's) | 47,936,864 | ||||||
Net Asset Value, Offering and Redemption Price Per Share | $ | 13.77 | |||||
| (1) Including: Securities on Loan, at Value: | $ | 253,320 | |||||
@ Amount is less than $500.
The accompanying notes are an integral part of the financial statements.
10
Morgan Stanley Institutional Fund, Inc.
Annual Report — December 31, 2015
Small Company Growth Portfolio
Statement of Operations | Year Ended December 31, 2015 (000) | ||||||
Investment Income: | |||||||
Income from Securities Loaned — Net | $ | 9,666 | |||||
Dividends from Securities of Unaffiliated Issuers | 4,510 | ||||||
Dividends from Security of Affiliated Issuer (Note G) | 113 | ||||||
Total Investment Income | 14,289 | ||||||
Expenses: | |||||||
Advisory Fees (Note B) | 16,437 | ||||||
Administration Fees (Note C) | 1,499 | ||||||
Sub Transfer Agency Fees — Class I | 1,166 | ||||||
Sub Transfer Agency Fees — Class A | 225 | ||||||
Sub Transfer Agency Fees — Class L | 6 | ||||||
Shareholder Services Fees — Class A (Note D) | 422 | ||||||
Distribution and Shareholder Services Fees — Class L (Note D) | 17 | ||||||
Shareholder Reporting Fees | 166 | ||||||
Custodian Fees (Note F) | 142 | ||||||
Registration Fees | 115 | ||||||
Professional Fees | 94 | ||||||
Directors' Fees and Expenses | 47 | ||||||
Transfer Agency Fees — Class I (Note E) | 23 | ||||||
Transfer Agency Fees — Class A (Note E) | 17 | ||||||
Transfer Agency Fees — Class L (Note E) | 2 | ||||||
Transfer Agency Fees — Class IS (Note E) | 3 | ||||||
Pricing Fees | 7 | ||||||
Other Expenses | 58 | ||||||
Total Expenses | 20,446 | ||||||
Reimbursement of Class Specific Expenses — Class I (Note B) | (495 | ) | |||||
Reimbursement of Class Specific Expenses — Class L (Note B) | (4 | ) | |||||
Reimbursement of Class Specific Expenses — Class IS (Note B) | (1 | ) | |||||
Waiver of Advisory Fees (Note B) | (189 | ) | |||||
Rebate from Morgan Stanley Affiliate (Note G) | (62 | ) | |||||
Net Expenses | 19,695 | ||||||
Net Investment Loss | (5,406 | ) | |||||
Realized Gain (Loss): | |||||||
Investments Sold | 119,008 | ||||||
Foreign Currency Transactions | (21 | ) | |||||
Net Realized Gain | 118,987 | ||||||
Change in Unrealized Appreciation (Depreciation): | |||||||
Investments | (280,693 | ) | |||||
Foreign Currency Translations | (— | @) | |||||
Net Change in Unrealized Appreciation (Depreciation) | (280,693 | ) | |||||
Net Realized Gain and Change in Unrealized Appreciation (Depreciation) | (161,706 | ) | |||||
Net Decrease in Net Assets Resulting from Operations | $ | (167,112 | ) | ||||
@ Amount is less than $500.
The accompanying notes are an integral part of the financial statements.
11
Morgan Stanley Institutional Fund, Inc.
Annual Report — December 31, 2015
Small Company Growth Portfolio
Statements of Changes in Net Assets | Year Ended December 31, 2015 (000) | Year Ended December 31, 2014 (000) | |||||||||
Increase (Decrease) in Net Assets: | |||||||||||
Operations: | |||||||||||
Net Investment Loss | $ | (5,406 | ) | $ | (7,453 | ) | |||||
Net Realized Gain | 118,987 | 214,347 | |||||||||
Net Change in Unrealized Appreciation (Depreciation) | (280,693 | ) | (471,647 | ) | |||||||
Net Decrease in Net Assets Resulting from Operations | (167,112 | ) | (264,753 | ) | |||||||
Distributions from and/or in Excess of: | |||||||||||
Class I: | |||||||||||
Net Realized Gain | (63,449 | ) | (132,988 | ) | |||||||
Class A: | |||||||||||
Net Realized Gain | (12,300 | ) | (23,704 | ) | |||||||
Class L: | |||||||||||
Net Realized Gain | (174 | ) | (300 | ) | |||||||
Class IS: | |||||||||||
Net Realized Gain | (50,360 | ) | (72,948 | ) | |||||||
Total Distributions | (126,283 | ) | (229,940 | ) | |||||||
Capital Share Transactions:(1) | |||||||||||
Class I: | |||||||||||
Subscribed | 118,065 | 390,498 | |||||||||
Distributions Reinvested | 53,646 | 116,535 | |||||||||
Redeemed | (462,723 | ) | (1,037,599 | ) | |||||||
Class A: | |||||||||||
Subscribed | 16,043 | 28,385 | |||||||||
Distributions Reinvested | 12,255 | 23,620 | |||||||||
Redeemed | (50,786 | ) | (94,284 | ) | |||||||
Class L: | |||||||||||
Subscribed | 9 | 988 | |||||||||
Distributions Reinvested | 173 | 298 | |||||||||
Redeemed | (290 | ) | (910 | ) | |||||||
Class IS: | |||||||||||
Subscribed | 250,791 | 758,371 | |||||||||
Distributions Reinvested | 49,812 | 70,105 | |||||||||
Redeemed | (194,000 | ) | (172,236 | ) | |||||||
Net Increase (Decrease) in Net Assets Resulting from Capital Share Transactions | (207,005 | ) | 83,771 | ||||||||
Redemption Fees | 41 | 123 | |||||||||
Total Decrease in Net Assets | (500,359 | ) | (410,799 | ) | |||||||
Net Assets: | |||||||||||
Beginning of Period | 2,017,374 | 2,428,173 | |||||||||
End of Period (Including Accumulated Net Investment Loss of $(1,142) and $(2,274)) | $ | 1,517,015 | $ | 2,017,374 | |||||||
The accompanying notes are an integral part of the financial statements.
12
Morgan Stanley Institutional Fund, Inc.
Annual Report — December 31, 2015
Small Company Growth Portfolio
Statements of Changes in Net Assets (cont'd) | Year Ended December 31, 2015 (000) | Year Ended December 31, 2014 (000) | |||||||||
(1) Capital Share Transactions: | |||||||||||
Class I: | |||||||||||
Shares Subscribed | 7,216 | 20,776 | |||||||||
Shares Issued on Distributions Reinvested | 3,848 | 7,237 | |||||||||
Shares Redeemed | (28,933 | ) | (56,087 | ) | |||||||
Net Decrease in Class I Shares Outstanding | (17,869 | ) | (28,074 | ) | |||||||
Class A: | |||||||||||
Shares Subscribed | 1,079 | 1,637 | |||||||||
Shares Issued on Distributions Reinvested | 986 | 1,623 | |||||||||
Shares Redeemed | (3,426 | ) | (5,758 | ) | |||||||
Net Decrease in Class A Shares Outstanding | (1,361 | ) | (2,498 | ) | |||||||
Class L: | |||||||||||
Shares Subscribed | 1 | 57 | |||||||||
Shares Issued on Distributions Reinvested | 14 | 21 | |||||||||
Shares Redeemed | (20 | ) | (57 | ) | |||||||
Net Increase (Decrease) in Class L Shares Outstanding | (5 | ) | 21 | ||||||||
Class IS: | |||||||||||
Shares Subscribed | 15,424 | 40,139 | |||||||||
Shares Issued on Distributions Reinvested | 3,570 | 4,388 | |||||||||
Shares Redeemed | (11,750 | ) | (9,935 | ) | |||||||
Net Increase in Class IS Shares Outstanding | 7,244 | 34,592 | |||||||||
The accompanying notes are an integral part of the financial statements.
13
Morgan Stanley Institutional Fund, Inc.
Annual Report — December 31, 2015
Financial Highlights
Small Company Growth Portfolio
Class I | |||||||||||||||||||||||
Year Ended December 31, | |||||||||||||||||||||||
Selected Per Share Data and Ratios | 2015 | 2014 | 2013 | 2012 | 2011 | ||||||||||||||||||
Net Asset Value, Beginning of Period | $ | 16.50 | $ | 20.55 | $ | 14.16 | $ | 12.64 | $ | 14.17 | |||||||||||||
Income (Loss) from Investment Operations: | |||||||||||||||||||||||
Net Investment Loss† | (0.05 | ) | (0.06 | ) | (0.09 | ) | (0.03 | ) | (0.04 | ) | |||||||||||||
Net Realized and Unrealized Gain (Loss) | (1.51 | ) | (2.04 | ) | 8.77 | 2.19 | (1.25 | ) | |||||||||||||||
Total from Investment Operations | (1.56 | ) | (2.10 | ) | 8.68 | 2.16 | (1.29 | ) | |||||||||||||||
Distributions from and/or in Excess of: | |||||||||||||||||||||||
Net Realized Gain | (1.19 | ) | (1.95 | ) | (2.29 | ) | (0.64 | ) | (0.24 | ) | |||||||||||||
Redemption Fees | 0.00 | ‡ | 0.00 | ‡ | 0.00 | ‡ | 0.00 | ‡ | 0.00 | ‡ | |||||||||||||
Net Asset Value, End of Period | $ | 13.75 | $ | 16.50 | $ | 20.55 | $ | 14.16 | $ | 12.64 | |||||||||||||
Total Return++ | (9.58 | )% | (9.68 | )% | 62.26 | % | 17.10 | % | (9.12 | )% | |||||||||||||
Ratios and Supplemental Data: | |||||||||||||||||||||||
Net Assets, End of Period (Thousands) | $ | 718,386 | $ | 1,156,812 | $ | 2,017,558 | $ | 1,143,640 | $ | 1,074,392 | |||||||||||||
Ratio of Expenses to Average Net Assets (1) | 1.05 | %+ | 1.05 | %+ | 1.04 | %+ | 1.05 | %+ | 1.05 | %+ | |||||||||||||
Ratio of Expenses to Average Net Assets Excluding Non Operating Expenses | N/A | N/A | N/A | N/A | 1.05 | %+ | |||||||||||||||||
Ratio of Net Investment Loss to Average Net Assets (1) | (0.29 | )%+ | (0.34 | )%+ | (0.49 | )%+ | (0.20 | )%+ | (0.29 | )%+ | |||||||||||||
Ratio of Rebate from Morgan Stanley Affiliates to Average Net Assets | 0.00 | %§ | 0.00 | %§ | 0.01 | % | 0.00 | %§ | 0.00 | %§ | |||||||||||||
Portfolio Turnover Rate | 42 | % | 53 | % | 43 | % | 22 | % | 26 | % | |||||||||||||
(1) Supplemental Information on the Ratios to Average Net Assets: | |||||||||||||||||||||||
Ratios Before Expense Limitation: | |||||||||||||||||||||||
Expenses to Average Net Assets | 1.11 | % | 1.13 | % | 1.08 | % | 1.12 | % | 1.10 | % | |||||||||||||
Net Investment Loss to Average Net Assets | (0.35 | )% | (0.42 | )% | (0.53 | )% | (0.27 | )% | (0.34 | )% | |||||||||||||
† Per share amount is based on average shares outstanding.
‡ Amount is less than $0.005 per share.
++ Calculated based on the net asset value as of the last business day of the period.
+ The Ratios of Expenses and Net Investment Loss reflect the rebate of certain Portfolio expenses in connection with the investments in Morgan Stanley affiliates during the period. The effect of the rebate on the ratios is disclosed in the above table as "Ratio of Rebate from Morgan Stanley Affiliates to Average Net Assets."
§ Amount is less than 0.005%.
The accompanying notes are an integral part of the financial statements.
14
Morgan Stanley Institutional Fund, Inc.
Annual Report — December 31, 2015
Financial Highlights
Small Company Growth Portfolio
Class A | |||||||||||||||||||||||
Year Ended December 31, | |||||||||||||||||||||||
Selected Per Share Data and Ratios | 2015 | 2014 | 2013 | 2012 | 2011 | ||||||||||||||||||
Net Asset Value, Beginning of Period | $ | 14.89 | $ | 18.83 | $ | 13.13 | $ | 11.80 | $ | 13.27 | |||||||||||||
Income (Loss) from Investment Operations: | |||||||||||||||||||||||
Net Investment Loss† | (0.09 | ) | (0.11 | ) | (0.13 | ) | (0.06 | ) | (0.07 | ) | |||||||||||||
Net Realized and Unrealized Gain (Loss) | (1.36 | ) | (1.88 | ) | 8.12 | 2.03 | (1.16 | ) | |||||||||||||||
Total from Investment Operations | (1.45 | ) | (1.99 | ) | 7.99 | 1.97 | (1.23 | ) | |||||||||||||||
Distributions from and/or in Excess of: | |||||||||||||||||||||||
Net Realized Gain | (1.19 | ) | (1.95 | ) | (2.29 | ) | (0.64 | ) | (0.24 | ) | |||||||||||||
Redemption Fees | 0.00 | ‡ | 0.00 | ‡ | 0.00 | ‡ | 0.00 | ‡ | 0.00 | ‡ | |||||||||||||
Net Asset Value, End of Period | $ | 12.25 | $ | 14.89 | $ | 18.83 | $ | 13.13 | $ | 11.80 | |||||||||||||
Total Return++ | (9.88 | )% | (9.98 | )% | 61.88 | % | 16.70 | % | (9.28 | )% | |||||||||||||
Ratios and Supplemental Data: | |||||||||||||||||||||||
Net Assets, End of Period (Thousands) | $ | 136,621 | $ | 186,307 | $ | 282,632 | $ | 156,824 | $ | 282,988 | |||||||||||||
Ratio of Expenses to Average Net Assets (1) | 1.37 | %+ | 1.38 | %+ | 1.31 | %+^ | 1.30 | %+ | 1.30 | %+ | |||||||||||||
Ratio of Expenses to Average Net Assets Excluding Non Operating Expenses | N/A | N/A | N/A | N/A | 1.30 | %+ | |||||||||||||||||
Ratio of Net Investment Loss to Average Net Assets (1) | (0.61 | )%+ | (0.67 | )%+ | (0.75 | )%+ | (0.45 | )%+ | (0.54 | )%+ | |||||||||||||
Ratio of Rebate from Morgan Stanley Affiliates to Average Net Assets | 0.00 | %§ | 0.00 | %§ | 0.01 | % | 0.00 | %§ | 0.00 | %§ | |||||||||||||
Portfolio Turnover Rate | 42 | % | 53 | % | 43 | % | 22 | % | 26 | % | |||||||||||||
(1) Supplemental Information on the Ratios to Average Net Assets: | |||||||||||||||||||||||
Ratios Before Expense Limitation: | |||||||||||||||||||||||
Expenses to Average Net Assets | 1.38 | % | N/A | 1.35 | % | 1.37 | % | 1.35 | % | ||||||||||||||
Net Investment Loss to Average Net Assets | (0.62 | )% | N/A | (0.79 | )% | (0.52 | )% | (0.59 | )% | ||||||||||||||
† Per share amount is based on average shares outstanding.
‡ Amount is less than $0.005 per share.
++ Calculated based on the net asset value which does not reflect sales charges, if applicable, as of the last business day of the period.
+ The Ratios of Expenses and Net Investment Loss reflect the rebate of certain Portfolio expenses in connection with the investments in Morgan Stanley affiliates during the period. The effect of the rebate on the ratios is disclosed in the above table as "Ratio of Rebate from Morgan Stanley Affiliates to Average Net Assets."
^ Effective September 16, 2013, the Adviser has agreed to limit the ratio of expenses to average net assets to the maximum ratio of 1.40% for Class A shares. Prior to September 16, 2013, the maximum ratio was 1.30% for Class A shares.
§ Amount is less than 0.005%.
The accompanying notes are an integral part of the financial statements.
15
Morgan Stanley Institutional Fund, Inc.
Annual Report — December 31, 2015
Financial Highlights
Small Company Growth Portfolio
Class L | |||||||||||||||||||||||
Year Ended December 31, | Period from November 11, 2011^ to | ||||||||||||||||||||||
Selected Per Share Data and Ratios | 2015 | 2014 | 2013 | 2012 | December 31, 2011 | ||||||||||||||||||
Net Asset Value, Beginning of Period | $ | 14.60 | $ | 18.60 | $ | 13.06 | $ | 11.79 | $ | 12.47 | |||||||||||||
Income (Loss) from Investment Operations: | |||||||||||||||||||||||
Net Investment Loss† | (0.16 | ) | (0.19 | ) | (0.21 | ) | (0.12 | ) | (0.01 | ) | |||||||||||||
Net Realized and Unrealized Gain (Loss) | (1.33 | ) | (1.86 | ) | 8.04 | 2.03 | (0.43 | ) | |||||||||||||||
Total from Investment Operations | (1.49 | ) | (2.05 | ) | 7.83 | 1.91 | (0.44 | ) | |||||||||||||||
Distributions from and/or in Excess of: | |||||||||||||||||||||||
Net Realized Gain | (1.19 | ) | (1.95 | ) | (2.29 | ) | (0.64 | ) | (0.24 | ) | |||||||||||||
Redemption Fees | 0.00 | ‡ | 0.00 | ‡ | 0.00 | ‡ | (0.00 | )‡ | 0.00 | ‡ | |||||||||||||
Net Asset Value, End of Period | $ | 11.92 | $ | 14.60 | $ | 18.60 | $ | 13.06 | $ | 11.79 | |||||||||||||
Total Return++ | (10.36 | )% | (10.43 | )% | 60.97 | % | 16.21 | % | (3.54 | )%# | |||||||||||||
Ratios and Supplemental Data: | |||||||||||||||||||||||
Net Assets, End of Period (Thousands) | $ | 1,874 | $ | 2,370 | $ | 2,632 | $ | 1,696 | $ | 1,657 | |||||||||||||
Ratio of Expenses to Average Net Assets (1) | 1.90 | %+ | 1.90 | %+ | 1.83 | %+^^ | 1.80 | %+ | 1.80 | %+* | |||||||||||||
Ratio of Net Investment Loss to Average Net Assets (1) | (1.13 | )%+ | (1.16 | )%+ | (1.27 | )%+ | (0.95 | )%+ | (0.77 | )%+* | |||||||||||||
Ratio of Rebate from Morgan Stanley Affiliates to Average Net Assets | 0.00 | %§ | 0.00 | %§ | 0.01 | % | 0.00 | %§ | 0.00 | %§* | |||||||||||||
Portfolio Turnover Rate | 42 | % | 53 | % | 43 | % | 22 | % | 26 | %* | |||||||||||||
(1) Supplemental Information on the Ratios to Average Net Assets: | |||||||||||||||||||||||
Ratios Before Expense Limitation: | |||||||||||||||||||||||
Expenses to Average Net Assets | 2.10 | % | 2.02 | % | 1.92 | % | 1.87 | % | 1.85 | %* | |||||||||||||
Net Investment Loss to Average Net Assets | (1.33 | )% | (1.28 | )% | (1.36 | )% | (1.02 | )% | (0.82 | )%* | |||||||||||||
^ Commencement of Offering.
† Per share amount is based on average shares outstanding.
‡ Amount is less than $0.005 per share.
++ Calculated based on the net asset value as of the last business day of the period.
+ The Ratios of Expenses and Net Investment Loss reflect the rebate of certain Portfolio expenses in connection with the investments in Morgan Stanley affiliates during the period. The effect of the rebate on the ratios is disclosed in the above table as "Ratio of Rebate from Morgan Stanley Affiliates to Average Net Assets."
^^ Effective September 16, 2013, the Adviser has agreed to limit the ratio of expenses to average net assets to the maximum ratio of 1.90% for Class L shares. Prior to September 16, 2013, the maximum ratio was 1.80% for Class L shares.
§ Amount is less than 0.005%.
# Not Annualized.
* Annualized.
The accompanying notes are an integral part of the financial statements.
16
Morgan Stanley Institutional Fund, Inc.
Annual Report — December 31, 2015
Financial Highlights
Small Company Growth Portfolio
Class IS | |||||||||||||||
Year Ended December 31, | Period from September 13, 2013^ to | ||||||||||||||
Selected Per Share Data and Ratios | 2015 | 2014 | December 31, 2013 | ||||||||||||
Net Asset Value, Beginning of Period | $ | 16.51 | $ | 20.55 | $ | 19.51 | |||||||||
Income (Loss) from Investment Operations: | |||||||||||||||
Net Investment Loss† | (0.03 | ) | (0.03 | ) | (0.02 | ) | |||||||||
Net Realized and Unrealized Gain (Loss) | (1.52 | ) | (2.06 | ) | 3.15 | ||||||||||
Total from Investment Operations | (1.55 | ) | (2.09 | ) | 3.13 | ||||||||||
Distributions from and/or in Excess of: | |||||||||||||||
Net Realized Gain | (1.19 | ) | (1.95 | ) | (2.09 | ) | |||||||||
Redemption Fees | 0.00 | ‡ | 0.00 | ‡ | 0.00 | ‡ | |||||||||
Net Asset Value, End of Period | $ | 13.77 | $ | 16.51 | $ | 20.55 | |||||||||
Total Return++ | (9.52 | )% | (9.63 | )% | 16.50 | %# | |||||||||
Ratios and Supplemental Data: | |||||||||||||||
Net Assets, End of Period (Thousands) | $ | 660,134 | $ | 671,885 | $ | 125,351 | |||||||||
Ratio of Expenses to Average Net Assets (1) | 0.98 | %+ | 0.97 | %+ | 0.97 | %+^^* | |||||||||
Ratio of Net Investment Loss to Average Net Assets (1) | (0.21 | )%+ | (0.17 | )%+ | (0.30 | )%+* | |||||||||
Ratio of Rebate from Morgan Stanley Affiliates to Average Net Assets | 0.00 | %§ | 0.00 | %§ | 0.01 | %* | |||||||||
Portfolio Turnover Rate | 42 | % | 53 | % | 43 | %# | |||||||||
(1) Supplemental Information on the Ratios to Average Net Assets: | |||||||||||||||
Ratios Before Expense Limitation: | |||||||||||||||
Expenses to Average Net Assets | 0.99 | % | 0.98 | % | 0.99 | %* | |||||||||
Net Investment Loss to Average Net Assets | (0.22 | )% | (0.18 | )% | (0.32 | )%* | |||||||||
^ Commencement of Offering.
† Per share amount is based on average shares outstanding.
‡ Amount is less than $0.005 per share.
++ Calculated based on the net asset value as of the last business day of the period.
+ The Ratios of Expenses and Net Investment Loss reflect the rebate of certain Portfolio expenses in connection with the investments in Morgan Stanley affiliates during the period. The effect of the rebate on the ratios is disclosed in the above table as "Ratio of Rebate from Morgan Stanley Affiliates to Average Net Assets."
^^ Effective September 16, 2013, the Adviser has agreed to limit the ratio of expenses to average net assets to the maximum ratio of 0.98% for Class IS shares.
§ Amount is less than 0.005%.
# Not Annualized.
* Annualized.
The accompanying notes are an integral part of the financial statements.
17
Morgan Stanley Institutional Fund, Inc.
Annual Report — December 31, 2015
Notes to Financial Statements
Morgan Stanley Institutional Fund, Inc. (the "Fund") is registered under the Investment Company Act of 1940, as amended (the "Act"), as an open-end management investment company. The Fund is comprised of twenty-six separate, active, diversified and non-diversified portfolios (individually referred to as a "Portfolio", collectively as the "Portfolios"). The Fund applies investment company accounting and reporting guidance.
The accompanying financial statements relate to the Small Company Growth Portfolio. The Portfolio seeks long-term capital appreciation by investing primarily in growth-oriented equity securities of small capitalization companies. The Portfolio holds promissory notes it has made to certain investee companies for this same purpose, the details of which are disclosed in the Portfolio of Investments.
The Portfolio offers four classes of shares — Class I, Class A, Class L and Class IS. The Portfolio's Class A shares are currently closed to new investors and the Portfolio suspended offering of Class L shares. Existing Class L shareholders may invest through reinvestment of dividends and distributions. The Portfolio's Class I and Class IS shares are closed to new investors with certain exceptions.
A. Significant Accounting Policies: The following significant accounting policies are in conformity with U.S. generally accepted accounting principles ("GAAP"). Such policies are consistently followed by the Fund in the preparation of its financial statements. GAAP may require management to make estimates and assumptions that affect the reported amounts and disclosures in the financial statements. Actual results may differ from those estimates.
1. Security Valuation: (1) An equity portfolio security listed or traded on an exchange is valued at its latest reported sales price (or at the exchange official closing price if such exchange reports an official closing price), if there were no sales on a given day, the security is valued at the mean between the last reported bid and asked prices; (2) all other equity portfolio securities for which over-the-counter ("OTC") market quotations are readily available are valued at its latest reported sales price. In cases where a security is traded on more than one exchange, the security is valued on the exchange designated as the primary market; (3) Certain portfolio securities may be valued by an outside pricing service approved by the Fund's Board of Directors (the "Directors"). The pricing service may utilize a matrix system or other model incorporating attributes
such as security quality, maturity and coupon as the evaluation model parameters, and/or research evaluations by its staff, including review of broker dealer market price quotations in determining what it believes is the fair valuation of the portfolios securities valued by such pricing service; (4) listed options are valued at the last reported sales price on the exchange on which they are listed (or at the exchange official closing price if such exchange reports an official closing price). If an official closing price or last reported sales price is unavailable, the listed option should be fair valued at the mean between their latest bid and asked price. Unlisted options are valued by an outside pricing service approved by the Directors or quotes from a broker or dealer; (5) when market quotations are not readily available, including circumstances under which Morgan Stanley Investment Management Inc. (the "Adviser") determines that the closing price, last sale price or the mean between the last reported bid and asked prices are not reflective of a security's market value, portfolio securities are valued at their fair value as determined in good faith under procedures established by and under the general supervision of the Directors. Occasionally, developments affecting the closing prices of securities and other assets may occur between the times at which valuations of such securities are determined (that is, close of the foreign market on which the securities trade) and the close of business of the New York Stock Exchange ("NYSE"). If developments occur during such periods that are expected to materially affect the value of such securities, such valuations may be adjusted to reflect the estimated fair value of such securities as of the close of the NYSE, as determined in good faith by the Directors or by the Adviser using a pricing service and/or procedures approved by the Directors; (6) quotations of foreign portfolio securities, other assets and liabilities and forward contracts stated in foreign currency are translated into U.S. dollar equivalents at the prevailing market rates prior to the close of the NYSE; (7) investments in mutual funds, including the Morgan Stanley Institutional Liquidity Funds, are valued at the net asset value ("NAV") as of the close of each business day; and (8) short-term debt securities with remaining maturities of 60 days or less at the time of purchase may be valued at amortized cost, unless the Adviser determines such valuation does not reflect the securities' market value, in which case these securities will be valued at their fair market value determined by the Adviser.
18
Morgan Stanley Institutional Fund, Inc.
Annual Report — December 31, 2015
Notes to Financial Statements (cont'd)
The Directors have responsibility for determining in good faith the fair value of the investments, and the Directors may appoint others, such as the Fund's Adviser or a valuation committee, to assist the Directors in determining fair value and to make the actual calculations pursuant to the fair valuation methodologies previously approved by the Directors. Under procedures approved by the Directors, the Fund's Adviser has formed a Valuation Committee whose members are approved by the Directors. The Valuation Committee provides administration and oversight of the Fund's valuation policies and procedures, which are reviewed at least annually by the Directors. These procedures allow the Fund to utilize independent pricing services, quotations from securities and financial instrument dealers, and other market sources to determine fair value.
The Fund has procedures to determine the fair value of securities and other financial instruments for which market prices are not readily available. Under these procedures, the Valuation Committee convenes on a regular and ad hoc basis to review such securities and considers a number of factors, including valuation methodologies and significant unobservable valuation inputs, when arriving at fair value. The Valuation Committee may employ a market-based approach which may use related or comparable assets or liabilities, recent transactions, market multiples, book values, and other relevant information for the investment to determine the fair value of the investment. An income-based valuation approach may also be used in which the anticipated future cash flows of the investment are discounted to calculate fair value. Discounts may also be applied due to the nature or duration of any restrictions on the disposition of the investments. Due to the inherent uncertainty of valuations of such investments, the fair values may differ significantly from the values that would have been used had an active market existed. The Valuation Committee employs various methods for calibrating these valuation approaches including a regular review of valuation methodologies, key inputs and assumptions, transactional back-testing or disposition analysis, and reviews of any related market activity.
2. Fair Value Measurement: Financial Accounting Standards Board ("FASB") Accounting Standards CodificationTM ("ASC") 820, "Fair Value Measurement" ("ASC 820"), defines fair value as the value that the Fund
would receive to sell an investment or pay to transfer a liability in a timely transaction with an independent buyer in the principal market, or in the absence of a principal market the most advantageous market for the investment or liability. ASC 820 establishes a three-tier hierarchy to distinguish between (1) inputs that reflect the assumptions market participants would use in valuing an asset or liability developed based on market data obtained from sources independent of the reporting entity (observable inputs) and (2) inputs that reflect the reporting entity's own assumptions about the assumptions market participants would use in valuing an asset or liability developed based on the best information available in the circumstances (unobservable inputs) and to establish classification of fair value measurements for disclosure purposes. Various inputs are used in determining the value of the Fund's investments. The inputs are summarized in the three broad levels listed below.
• Level 1 – unadjusted quoted prices in active markets for identical investments
• Level 2 – other significant observable inputs (including quoted prices for similar investments, interest rates, prepayment speeds, credit risk, etc.)
• Level 3 – significant unobservable inputs including the Fund's own assumptions in determining the fair value of investments. Factors considered in making this determination may include, but are not limited to, information obtained by contacting the issuer, analysts, or the appropriate stock exchange (for exchange-traded securities), analysis of the issuer's financial statements or other available documents and, if necessary, available information concerning other securities in similar circumstances
The inputs or methodology used for valuing securities are not necessarily an indication of the risk associated with investing in those securities and the determination of the significance of a particular input to the fair value measurement in its entirety requires judgment and considers factors specific to each security.
19
Morgan Stanley Institutional Fund, Inc.
Annual Report — December 31, 2015
Notes to Financial Statements (cont'd)
The following is a summary of the inputs used to value the Portfolio's investments as of December 31, 2015.
Investment Type | Level 1 Unadjusted quoted prices (000) | Level 2 Other significant observable inputs (000) | Level 3 Significant unobservable inputs (000) | Total (000) | |||||||||||||||
Assets: | |||||||||||||||||||
Common Stocks | |||||||||||||||||||
| Aerospace & Defense | $ | 55,864 | $ | — | $ | — | $ | 55,864 | |||||||||||
| Air Freight & Logistics | 32,171 | — | — | 32,171 | |||||||||||||||
Biotechnology | 55,542 | — | — | 55,542 | |||||||||||||||
Capital Markets | 34,238 | — | — | 34,238 | |||||||||||||||
Chemicals | 19,264 | — | — | 19,264 | |||||||||||||||
Consumer Finance | 31,112 | — | — | 31,112 | |||||||||||||||
| Electronic Equipment, Instruments & Components | 14,088 | — | — | 14,088 | |||||||||||||||
| Health Care Equipment & Supplies | 15,960 | — | — | 15,960 | |||||||||||||||
| Health Care Providers & Services | 30,036 | — | — | 30,036 | |||||||||||||||
| Health Care Technology | 164,162 | — | — | 164,162 | |||||||||||||||
| Hotels, Restaurants & Leisure | 72,518 | — | — | 72,518 | |||||||||||||||
| Internet & Catalog Retail | 75,632 | 16,027 | — | 91,659 | |||||||||||||||
| Internet Software & Services | 300,058 | 26,039 | — | 326,097 | |||||||||||||||
Machinery | 81,417 | — | — | 81,417 | |||||||||||||||
Media | — | — | 7,611 | 7,611 | |||||||||||||||
Multi-line Retail | 8,094 | — | — | 8,094 | |||||||||||||||
Multi-Utilities | — | — | — | † | — | † | |||||||||||||
Pharmaceuticals | 15,424 | — | — | 15,424 | |||||||||||||||
Professional Services | 82,983 | — | — | 82,983 | |||||||||||||||
Software | 116,780 | 6,566 | — | 123,346 | |||||||||||||||
Specialty Retail | 90,325 | — | — | 90,325 | |||||||||||||||
| Tech Hardware, Storage & Peripherals | 7,117 | — | — | 7,117 | |||||||||||||||
Total Common Stocks | 1,302,785 | 48,632 | 7,611 | † | 1,359,028 | † | |||||||||||||
Preferred Stocks | — | — | 99,647 | 99,647 | |||||||||||||||
| Convertible Preferred Stock | — | — | @ | — | — | @ | |||||||||||||
Participation Note | 958 | — | — | 958 | |||||||||||||||
Promissory Notes | — | — | 540 | 540 | |||||||||||||||
| Call Option Purchased | — | 4,460 | — | 4,460 | |||||||||||||||
| Short-Term Investments | |||||||||||||||||||
Investment Companies | 310,562 | — | — | 310,562 | |||||||||||||||
| Repurchase Agreements | — | 37,562 | — | 37,562 | |||||||||||||||
| Total Short-Term Investments | 310,562 | 37,562 | — | 348,124 | |||||||||||||||
Total Assets | $ | 1,614,305 | $ | 90,654 | $ | 107,798 | † | $ | 1,812,757 | † | |||||||||
@ Value is less than $500.
† Includes one security which is valued at zero.
Transfers between investment levels may occur as the markets fluctuate and/or the availability of data used in an investment's valuation changes. The Portfolio recognizes transfers between the levels as of the end of the period. At December 31, 2015, the Fund held a security that transferred from Level 3 to Level 2. This security was valued using significant unobservable inputs at December 31, 2014 and was valued using other significant observable inputs at December 31, 2015.
Following is a reconciliation of investments in which significant unobservable inputs (Level 3) were used in determining fair value.
| Common Stocks (000) | Preferred Stocks (000) | Convertible Preferred Stocks (000) | Promissory Notes (000) | ||||||||||||||||
Beginning Balance | $ | 11,405 | † | $ | 100,162 | $ | — | @ | $ | 706 | |||||||||
Purchases | — | — | — | — | |||||||||||||||
Sales | — | — | — | — | |||||||||||||||
Amortization of discount | — | — | — | (15 | ) | ||||||||||||||
Transfers in | — | — | — | — | |||||||||||||||
Transfers out | — | — | (— | @) | — | ||||||||||||||
Corporate actions | — | — | — | — | |||||||||||||||
| Change in unrealized appreciation (depreciation) | (3,794 | ) | (515 | ) | — | @ | (151 | ) | |||||||||||
Realized gains (losses) | — | — | — | — | |||||||||||||||
Ending Balance | $ | 7,611 | † | $ | 99,647 | $ | — | $ | 540 | ||||||||||
| Net change in unrealized appreciation (depreciation) from investments still held as of December 31, 2015 | $ | (3,794 | ) | $ | (515 | ) | $ | — | @ | $ | (151 | ) | |||||||
@ Value is less than $500.
† Includes one security which is valued at zero.
20
Morgan Stanley Institutional Fund, Inc.
Annual Report — December 31, 2015
Notes to Financial Statements (cont'd)
The following table presents additional information about valuation techniques and inputs used for investments that are measured at fair value and categorized within Level 3 as of December 31, 2015. Various valuation techniques were used in the valuation of certain investments and weighted based on the level of significance.
| Fair Value at December 31, 2015 (000) | Valuation Technique | Unobservable Input | Range | Selected Value | Impact to Valuation from an Increase in Input | ||||||||||||||||||||||||||
Health Care Technology | |||||||||||||||||||||||||||||||
Preferred Stock | $ | 5,623 | Discounted Cash Flow | Weighted Average Cost of Capital | 18.0 | % | 20.0 | % | 19.0 | % | Decrease | ||||||||||||||||||||
Perpetual Growth Rate | 3.0 | % | 4.0 | % | 3.5 | % | Increase | ||||||||||||||||||||||||
| Market Comparable Companies | Enterprise Value/ Revenue | 11.5 | x | 14.7 | x | 14.7 | x | Increase | |||||||||||||||||||||||
| Discount for Lack of Marketability | 20.0 | % | 20.0 | % | 20.0 | % | Decrease | ||||||||||||||||||||||||
Hotels, Restaurants & Leisure | |||||||||||||||||||||||||||||||
Preferred Stock | $ | 17,657 | Discounted Cash Flow | Weighted Average Cost of Capital | 19.0 | % | 21.0 | % | 20.0 | % | Decrease | ||||||||||||||||||||
Perpetual Growth Rate | 2.5 | % | 3.5 | % | 3.0 | % | Increase | ||||||||||||||||||||||||
| Market Comparable Companies | Enterprise Value/ Revenue | 4.2 | x | 8.2 | x | 5.4 | x | Increase | |||||||||||||||||||||||
| Discount for Lack of Marketability | 20.0 | % | 20.0 | % | 20.0 | % | Decrease | ||||||||||||||||||||||||
Internet & Catalog Retail | |||||||||||||||||||||||||||||||
Preferred Stock | $ | 43,404 | Discounted Cash Flow | Weighted Average Cost of Capital | 17.0 | % | 19.0 | % | 18.0 | % | Decrease | ||||||||||||||||||||
Perpetual Growth Rate | 3.5 | % | 4.5 | % | 4.0 | % | Increase | ||||||||||||||||||||||||
| Market Comparable Companies | Enterprise Value/ Revenue | 3.1 | x | 5.2 | x | 3.1 | x | Increase | |||||||||||||||||||||||
| Discount for Lack of Marketability | 20.0 | % | 20.0 | % | 20.0 | % | Decrease | ||||||||||||||||||||||||
Internet Software & Services | |||||||||||||||||||||||||||||||
Preferred Stocks | $ | 8,252 | Discounted Cash Flow | Weighted Average Cost of Capital | 22.0 | % | 25.0 | % | 23.5 | % | Decrease | ||||||||||||||||||||
Perpetual Growth Rate | 2.5 | % | 4.5 | % | 3.5 | % | Increase | ||||||||||||||||||||||||
| Market Comparable Companies | Enterprise Value/ Revenue | 11.5 | x | 15.6 | x | 14.2x | Increase | ||||||||||||||||||||||||
| Discount for Lack of Marketability | 20.0 | % | 20.0 | % | 20.0 | % | Decrease | ||||||||||||||||||||||||
$ | 329 | Liquidation Preference Method | Liquidation Value | $ | 1.29 | $ | 1.29 | $ | 1.29 | Increase | |||||||||||||||||||||
Discounted Cash Flow | Weighted Average Cost of Capital | 18.5 | % | 20.5 | % | 19.5 | % | Decrease | |||||||||||||||||||||||
Perpetual Growth Rate | 2.0 | % | 3.0 | % | 2.5 | % | Increase | ||||||||||||||||||||||||
| Market Comparable Companies | Enterprise Value/ Revenue | 1.7 | x | 4.4 | x | 3.1 | x | Increase | |||||||||||||||||||||||
| Discount for Lack of Marketability | 20.0 | % | 20.0 | % | 20.0 | % | Decrease | ||||||||||||||||||||||||
| Preferred Stock — Escrow | $ | 21 | Discount for Escrow | 54.8 | % | 54.8 | % | 54.8 | % | Decrease | |||||||||||||||||||||
21
Morgan Stanley Institutional Fund, Inc.
Annual Report — December 31, 2015
Notes to Financial Statements (cont'd)
| Fair Value at December 31, 2015 (000) | Valuation Technique | Unobservable Input | Range | Selected Value | Impact to Valuation from an Increase in Input | ||||||||||||||||||||||||||
Promissory Note | $ | 531 | Market Transaction Method | Valuation at Issuance as a Percentage of Principal | 100.0 | % | 100.0 | % | 100 | % | Increase | ||||||||||||||||||||
Cost of Debt | 14.3 | % | 14.3 | % | 14.3 | % | Decrease | ||||||||||||||||||||||||
| Valuation as a Percentage of Principal | 66.9 | % | 66.9 | % | 66.9 | % | Increase | ||||||||||||||||||||||||
| Promissory Note — Escrow | $ | 9 | Market Transaction Method | Valuation as a Percentage of Principal | 30.2 | % | 30.2 | % | 30.2 | % | Increase | ||||||||||||||||||||
Media | |||||||||||||||||||||||||||||||
Common Stock | $ | 7,611 | Market Transaction Method | Precedent Transaction | $ | 1,404.57 | $ | 1,404.57 | $ | 1,404.57 | Increase | ||||||||||||||||||||
Discounted Cash Flow | Weighted Average Cost of Capital | 16.0 | % | 17.0 | % | 16.5 | % | Decrease | |||||||||||||||||||||||
Perpetual Growth Rate | 3.0 | % | 5.0 | % | 4.0 | % | Increase | ||||||||||||||||||||||||
| Market Comparable Companies | Enterprise Value/ Revenue | 3.3 | x | 7.9 | x | 5.6 | x | Increase | |||||||||||||||||||||||
| Discount for Lack of Marketability | 20.0 | % | 20.0 | % | 20.0 | % | Decrease | ||||||||||||||||||||||||
Software | |||||||||||||||||||||||||||||||
Preferred Stocks | $ | 16,938 | Discounted Cash Flow | Weighted Average Cost of Capital | 17.5 | % | 19.5 | % | 18.5 | % | Decrease | ||||||||||||||||||||
Perpetual Growth Rate | 3.0 | % | 4.0 | % | 3.5 | % | Increase | ||||||||||||||||||||||||
| Market Comparable Companies | Enterprise Value/ Revenue | 11.1 | x | 12.6 | x | 12.6 | x | Increase | |||||||||||||||||||||||
| Discount for Lack of Marketability | 20.0 | % | 20.0 | % | 20.0 | % | Decrease | ||||||||||||||||||||||||
$ | 7,055 | Discounted Cash Flow | Weighted Average Cost of Capital | 18.5 | % | 20.5 | % | 19.5 | % | Decrease | |||||||||||||||||||||
Perpetual Growth Rate | 3.0 | % | 4.0 | % | 3.5 | % | Increase | ||||||||||||||||||||||||
| Market Comparable Companies | Enterprise Value/ Revenue | 6.3 | x | 43.5 | x | 12.7 | x | Increase | |||||||||||||||||||||||
| Discount for Lack of Marketability | 20.0 | % | 20.0 | % | 20.0 | % | Decrease | ||||||||||||||||||||||||
Tobacco | |||||||||||||||||||||||||||||||
Preferred Stock | $ | 368 | Market Transaction Method | Pending Transaction | $ | 0.98 | $ | 0.98 | $ | 0.98 | Increase | ||||||||||||||||||||
22
Morgan Stanley Institutional Fund, Inc.
Annual Report — December 31, 2015
Notes to Financial Statements (cont'd)
3. Repurchase Agreements: The Portfolio may enter into repurchase agreements under which the Portfolio lends cash and takes possession of securities with an agreement that the counterparty will repurchase such securities. In connection with transactions in repurchase agreements, a bank as custodian for the Portfolio takes possession of the underlying securities which are held as collateral, with a market value at least equal to the amount of the repurchase transaction, including principal and accrued interest. To the extent that any repurchase transaction exceeds one business day, the value of the collateral is marked-to-market on a daily basis to determine that the value of the collateral does not decrease below the repurchase price plus accrued interest as earned. If such a decrease occurs, additional collateral will be requested and, when received, will be added to the account to maintain full collateralization. In the event of default on the obligation to repurchase, the Portfolio has the right to liquidate the collateral and apply the proceeds in satisfaction of the obligation. In the event of default or bankruptcy by the counterparty to the agreement, realization of the collateral proceeds may be subject to cost and delays. The Portfolio, along with other affiliated investment companies, may utilize a joint trading account for the purpose of entering into repurchase agreements.
4. Foreign Currency Translation and Foreign Investments: The books and records of the Portfolio are maintained in U.S. dollars. Foreign currency amounts are translated into U.S. dollars as follows:
– investments, other assets and liabilities at the prevailing rate of exchange on the valuation date;
– investment transactions and investment income at the prevailing rates of exchange on the dates of such transactions.
Although the net assets of the Portfolio are presented at the foreign exchange rates and market values at the close of the period, the Portfolio does not isolate that portion of the results of operations arising as a result of changes in the foreign exchange rates from the fluctuations arising from changes in the market prices of securities held at period end. Similarly, the Portfolio does not isolate the effect of changes in foreign exchange rates from the fluctuations arising from changes in the market prices of securities sold during the period. Accordingly, realized and unrealized foreign currency gains (losses) on
investments in securities are included in the reported net realized and unrealized gains (losses) on investment transactions and balances. However, pursuant to U.S. Federal income tax regulations, gains and losses from certain foreign currency transactions and the foreign currency portion of gains and losses realized on sales and maturities of foreign denominated debt securities are treated as ordinary income for U.S. Federal income tax purposes.
Net realized gains (losses) on foreign currency transactions represent net foreign exchange gains (losses) from foreign currency forward exchange contracts, disposition of foreign currencies, currency gains (losses) realized between the trade and settlement dates on securities transactions, and the difference between the amount of investment income and foreign withholding taxes recorded on the Portfolio's books and the U.S. dollar equivalent amounts actually received or paid. Net unrealized currency gains (losses) from valuing foreign currency denominated assets and liabilities at period end exchange rates are reflected as a component of unrealized appreciation (depreciation) in the Statement of Assets and Liabilities. The change in unrealized currency gains (losses) on foreign currency translations for the period is reflected in the Statement of Operations.
Foreign security and currency transactions may involve certain considerations and risks not typically associated with those of U.S. dollar denominated transactions as a result of, among other factors, fluctuations of exchange rates in relation to the U.S. dollar, the possibility of lower levels of governmental supervision and regulation of foreign securities markets and the possibility of political or economic instability.
Governmental approval for foreign investments may be required in advance of making an investment under certain circumstances in some countries, and the extent of foreign investments in domestic companies may be subject to limitation in other countries. Foreign ownership limitations also may be imposed by the charters of individual companies to prevent, among other concerns, violations of foreign investment limitations. As a result, an additional class of shares (identified as "Foreign" in the Portfolio of Investments) may be created and offered for investment. The "local" and "foreign shares" market values may differ. In the absence of trading of the foreign
23
Morgan Stanley Institutional Fund, Inc.
Annual Report — December 31, 2015
Notes to Financial Statements (cont'd)
shares in such markets, the Portfolio values the foreign shares at the closing exchange price of the local shares.
5. Derivatives: The Portfolio may, but is not required to, use derivative instruments for a variety of purposes, including hedging, risk management, portfolio management or to earn income. Derivatives are financial instruments whose value is based, in part, on the value of an underlying asset, interest rate, index or financial instrument. Prevailing interest rates and volatility levels, among other things, also affect the value of derivative instruments. A derivative instrument often has risks similar to its underlying asset and may have additional risks, including imperfect correlation between the value of the derivative and the underlying asset, risks of default by the counterparty to certain transactions, magnification of losses incurred due to changes in the market value of the securities, instruments, indices or interest rates to which the derivative instrument relates, risks that the transactions may not be liquid and risks arising from margin requirements. The use of derivatives involves risks that are different from, and possibly greater than, the risks associated with other portfolio investments. Derivatives may involve the use of highly specialized instruments that require investment techniques and risk analyses different from those associated with other portfolio investments. All of the Portfolio's holdings, including derivative instruments, are marked-to-market each day with the change in value reflected in unrealized appreciation (depreciation). Upon disposition, a realized gain or loss is recognized.
Certain derivative transactions may give rise to a form of leverage. Leverage magnifies the potential for gain and the risk of loss. Leverage associated with derivative transactions may cause the Portfolio to liquidate portfolio positions when it may not be advantageous to do so to satisfy its obligations or to meet earmarking or segregation requirements, pursuant to applicable Securities and Exchange Commission rules and regulations, or may cause the Portfolio to be more volatile than if the Portfolio had not been leveraged. Although the Adviser seeks to use derivatives to further the Portfolio's investment objectives, there is no assurance that the use of derivatives will achieve this result.
Following is a description of the derivative instruments and techniques that the Portfolio used during the period and their associated risks:
Options: With respect to options, the Portfolio is subject to equity risk, interest rate risk and foreign currency exchange risk in the normal course of pursuing its investment objectives. If the Portfolio buys an option, it buys a legal contract giving it the right to buy or sell a specific amount of the underlying instrument or futures contract on the underlying instrument, at an agreed-upon price typically in exchange for a premium paid by the Portfolio. The Portfolio may purchase and/or sell put and call options. Purchasing call options tends to increase the Portfolio's exposure to the underlying (or similar) instrument. Purchasing put options tends to decrease the Portfolio's exposure to the underlying (or similar) instrument. When entering into purchased option contracts, the Portfolio bears the risk of interest or exchange rates or securities prices moving unexpectedly, in which case, the Portfolio may not achieve the anticipated benefits of the purchased option contracts; however the risk of loss is limited to the premium paid. Purchased options are reported as part of "Total Investments in Securities" in the Statement of Assets and Liabilities. Premium paid for purchasing options which expired are treated as realized losses. If the Portfolio sells an option, it sells to another party the right to buy from or sell to the Portfolio a specific amount of the underlying instrument or futures contract on the underlying instrument at an agreed-upon price typically in exchange for a premium received by the Portfolio. When options are purchased OTC, the Portfolio bears the risk that the counterparty that wrote the option will be unable or unwilling to perform its obligations under the option contract. Options may also be illiquid and the Portfolio may have difficulty closing out its position. A decision as to whether, when and how to use options involves the exercise of skill and judgment and even a well-conceived option transaction may be unsuccessful because of market behavior or unexpected events. The prices of options can be highly volatile and the use of options can lower total returns.
FASB ASC 815, "Derivatives and Hedging" ("ASC 815"), is intended to improve financial reporting about derivative instruments by requiring enhanced disclosures to enable investors to better understand how and why
24
Morgan Stanley Institutional Fund, Inc.
Annual Report — December 31, 2015
Notes to Financial Statements (cont'd)
the Portfolio uses derivative instruments, how these derivative instruments are accounted for and their effects on the Portfolio's financial position and results of operations.
The following table sets forth the fair value of the Portfolio's derivative contracts by primary risk exposure as of December 31, 2015.
| Asset Derivatives Statement of Assets and Liabilities Location | Primary Risk Exposure | Value (000) | |||||||||||||
| Call Option Purchased | Investments, at Value (Call Option Purchased) | Currency Risk | $ | 4,460 | (a) | ||||||||||
(a) Amounts are included in Investments in Securities in the Statement of Assets and Liabilities.
The following tables set forth by primary risk exposure the Portfolio's realized gains (losses) and change in unrealized appreciation (depreciation) by type of derivative contract for the year ended December 31, 2015 in accordance with ASC 815.
Realized Gain (Loss) | |||||||||||
Primary Risk Exposure | Derivative Type | Value (000) | |||||||||
| Currency Risk | Investments (Call Options Purchased) | $ | (2,236 | )(b) | |||||||
(b) Amounts are included in Investments Sold in the Statement of Operations.
Change in Unrealized Appreciation (Depreciation) | |||||||||||
Primary Risk Exposure | Derivative Type | Value (000) | |||||||||
| Currency Risk | Investments (Call Options Purchased) | $3,317(c) | |||||||||
(c) Amounts are included in Investments in the Statement of Operations.
At December 31, 2015, the Portfolio's derivative assets and liabilities are as follows:
| Gross Amounts of Assets and Liabilities Presented in the Statement of Assets and Liabilities | |||||||||||
Derivatives | Assets(d) (000) | Liabilities(d) (000) | |||||||||
Call Options Purchased | $ | 4,460 | (a) | $ | — | ||||||
(a) Amounts are included in Investments in Securities in the Statement of Assets and Liabilities.
(d) Absent an event of default or early termination, OTC derivative assets and liabilities are presented gross and not offset in the Statement of Assets and Liabilities.
The Portfolio typically enters into International Swaps and Derivatives Association, Inc. Master Agreements ("ISDA Master Agreements") or similar master agreements (collectively, "Master Agreements") with its contract counterparties for certain OTC derivatives in order to, among other things, reduce its credit risk to counterparties. ISDA Master Agreements include provisions for general obligations,
representations, collateral and events of default or termination. Under an ISDA Master Agreement, the Portfolio typically may offset with the counterparty certain OTC derivative financial instruments' payables and/or receivables with collateral held and/or posted and create one single net payment (close-out netting) in the event of default, termination and/or potential deterioration in the credit quality of the counterparty. Various Master Agreements govern the terms of certain transactions with counterparties, including transactions such as swap, forward, repurchase and reverse repurchase agreements. These Master Agreements typically attempt to reduce the counterparty risk associated with such transactions by specifying credit protection mechanisms and providing standardization that improves legal certainty. Cross-termination provisions under Master Agreements typically provide that a default in connection with one transaction between the Portfolio and a counterparty gives the non-defaulting party the right to terminate any other transactions in place with the defaulting party to create one single net payment due to/due from the defaulting party and may be a feature in certain Master Agreements. In the event the Portfolio exercises its right to terminate a Master Agreement after a counterparty experiences a termination event as defined in the Master Agreement, the return of collateral with market value in excess of the Portfolio's net liability may be delayed or denied.
The following table presents derivative financial instruments that are subject to enforceable netting arrangements as of December 31, 2015.
Gross Amounts Not Offset in the Statement of Assets and Liabilities | |||||||||||||||||||
Counterparty | Gross Asset Derivatives Presented in Statement of Assets and Liabilities (000) | Financial Instrument (000) | Collateral Received(e) (000) | Net Amount (not less than $0) (000) | |||||||||||||||
Royal Bank of Scotland | $ | 4,460 | $ | — | $ | (4,460 | ) | $ | 0 | ||||||||||
(e) In some instances, the actual collateral received may be more than the amount shown here due to overcollateralization.
For the year ended December 31, 2015, the approximate average monthly amount outstanding for each derivative type is as follows:
Call Options Purchased: | |||||||
Average monthly notional amount | 597,382,000 | ||||||
25
Morgan Stanley Institutional Fund, Inc.
Annual Report — December 31, 2015
Notes to Financial Statements (cont'd)
6. Securities Lending: The Portfolio lends securities to qualified financial institutions, such as broker-dealers, to earn additional income. Any increase or decrease in the fair value of the securities loaned that might occur and any interest earned or dividends declared on those securities during the term of the loan would remain in the Portfolio. The Portfolio would receive cash or securities as collateral in an amount equal to or exceeding 100% of the current fair value of the loaned securities. The collateral is marked-to-market daily by State Street Bank and Trust Company ("State Street"), the securities lending agent, to ensure that a minimum of 100% collateral coverage is maintained.
Based on pre-established guidelines, the securities lending agent invests any cash collateral that is received in an affiliated money market portfolio and repurchase agreements. Securities lending income is generated from the earnings on the invested collateral and borrowing fees, less any rebates owed to the borrowers and compensation to the lending agent, and is recorded as "Income from Securities Loaned-Net" in the Portfolio's Statement of Operations. Risks in securities lending transactions are that a borrower may not provide additional collateral when required or return the securities when due, and that the value of the short-term investments will be less than the amount of cash collateral plus any rebate that is required to be returned to the borrower.
The Portfolio has the right under the lending agreement to recover the securities from the borrower on demand.
The following table presents financial instruments that are subject to enforceable netting arrangements as of December 31, 2015.
Gross Amounts Not Offset in the Statement of Assets and Liabilities | |||||||||||||||
| Gross Asset Amounts Presented in Statement of Assets and Liabilities (000) | Financial Instrument (000) | Collateral Received (000) | Net Amount (not less than $0) (000) | ||||||||||||
| $ | 253,320 | (f) | $ | — | $ | 253,320 | (g)(h) | $ | 0 | ||||||
(f) Represents market value of loaned securities at period end.
(g) The Portfolio received cash collateral of approximately $260,577,000, which was subsequently invested in Repurchase Agreements and Morgan Stanley Institutional Liquidity Funds as reported in the Portfolio of Investments. In addition, the Portfolio received non-cash collateral of approximately $2,002,000 in the form of
U.S. Government obligations, which the Portfolio cannot sell or repledge, and accordingly are not reflected in the Portfolio of Investments.
(h) The actual collateral received is greater than the amount shown here due to overcollateralization.
The Portfolio has adopted the disclosure provisions of FASB Accounting Standards Update No. 2014-11 ("ASU No. 2014-11"), "Transfers & Servicing (Topic 860): Repurchase-to-Maturity Transactions, Repurchase Financings, and Disclosures". ASU No. 2014-11 is intended to provide increased transparency about the types of collateral pledged in securities lending transactions and other similar transactions that are accounted for as secured borrowing.
The following table displays a breakdown of transactions accounted for as secured borrowings, the gross obligations by class of collateral pledged, and the remaining contractual maturity of those transactions as of December 31, 2015.
Remaining Contractual Maturity of the Agreements As of December 31, 2015 | |||||||||||||||||||||||
| Overnight and Continuous (000) | <30 days (000) | Between 30 & 90 days (000) | >90 days (000) | Total (000) | |||||||||||||||||||
Securities Lending Transactions | |||||||||||||||||||||||
Common Stocks | $ | 260,577 | $ | — | $ | — | $ | — | $ | 260,577 | |||||||||||||
Total Borrowings | $ | 260,577 | $ | — | $ | — | $ | — | $ | 260,577 | |||||||||||||
Gross amount of recognized liabilities for securities lending transactions | $ | 260,577 | |||||||||||||||||||||
7. Restricted Securities: The Portfolio invests in unregistered or otherwise restricted securities. The term "restricted securities" refers to securities that are unregistered or are held by control persons of the issuer and securities that are subject to contractual restrictions on their resale. As a result, restricted securities may be more difficult to value and the Portfolio may have difficulty disposing of
such assets either in a timely manner or for a reasonable price. In order to dispose of an unregistered security, the Portfolio, where it has contractual rights to do so, may have to cause such security to be registered. A considerable period may elapse between the time the decision is made to sell the security and the time the security is registered so that the Portfolio could sell it. Contractual restrictions on
26
Morgan Stanley Institutional Fund, Inc.
Annual Report — December 31, 2015
Notes to Financial Statements (cont'd)
the resale of securities vary in length and scope and are generally the result of a negotiation between the issuer and acquirer of the securities. The Portfolio would, in either case, bear market risks during that period. Restricted securities are identified in the Portfolio of Investments.
8. Structured Investments: The Portfolio invested a portion of its assets in structured investments. A structured investment is a derivative security designed to offer a return linked to a particular underlying security, currency, commodity or market. Structured investments may come in various forms including notes (such as exchange-traded notes), warrants and options to purchase securities. The Portfolio will typically use structured investments to gain exposure to a permitted underlying security, currency, commodity or market when direct access to a market is limited or inefficient from a tax or cost standpoint. There can be no assurance that structured investments will trade at the same price or have the same value as the underlying security, currency, commodity or market. Investments in structured investments involve risks including issuer risk, counterparty risk and market risk. Holders of structured investments bear risks of the underlying investment and are subject to issuer or counterparty risk because the Portfolio is relying on the creditworthiness of such issuer or counterparty and has no rights with respect to the underlying investment. Certain structured investments may be thinly traded or have a limited trading market and may have the effect of increasing the Portfolio's illiquidity to the extent that the Portfolio, at a particular time, may be unable to find qualified buyers for these securities.
9. Redemption Fees: The Portfolio will assess a 2% redemption fee on Class I shares, Class A shares, Class L shares and Class IS shares, which is paid directly to the Portfolio, for shares redeemed or exchanged within thirty days of purchase, subject to certain exceptions. The redemption fee is designed to protect the Portfolio and its remaining shareholders from the effects of short-term trading. These fees, if any, are included in the Statements of Changes in Net Assets.
10. Indemnifications: The Fund enters into contracts that contain a variety of indemnifications. The Fund's maximum exposure under these arrangements is unknown. However, the Fund has not had prior claims or losses pursuant to these contracts and expects the risk of loss to be remote.
11. Dividends and Distributions to Shareholders: Dividend income and distributions to shareholders are recorded on the ex-dividend date. Dividends from net investment income, if any, are declared and paid annually. Net realized capital gains, if any, are distributed at least annually.
12. Security Transactions, Income and Expenses: Security transactions are accounted for on the trade date (date the order to buy or sell is executed). Realized gains and losses on the sale of investment securities are determined on the specific identified cost method. Dividend income and other distributions are recorded on the ex-dividend date (except for certain foreign dividends which may be recorded as soon as the Portfolio is informed of such dividends) net of applicable withholding taxes. Interest income is recognized on the accrual basis except where collection is in doubt. Discounts are accreted and premiums are amortized over the life of the respective securities. Most expenses of the Fund can be directly attributed to a particular Portfolio. Expenses which cannot be directly attributed are apportioned among the Portfolios based upon relative net assets or other appropriate methods. Income, expenses (other than class specific expenses — distribution and shareholder services, transfer agency and sub transfer agency fees) and realized and unrealized gains or losses are allocated to each class of shares based upon their relative net assets.
B. Advisory Fees: The Adviser, a wholly-owned subsidiary of Morgan Stanley, provides the Portfolio with advisory services under the terms of an Investment Advisory Agreement, paid quarterly, at the annual rate based on the daily net assets as follows:
| First $1 billion | Next $500 million | Over $1.5 billion | |||||||||
| 0.92 | % | 0.85 | % | 0.80 | % | ||||||
Effective July 1, 2015, the Portfolio's annual rate based on the daily net assets was reduced and is as follows:
| First $1 billion | Next $500 million | Over $1.5 billion | Over $2 billion | ||||||||||||
| 0.92 | % | 0.85 | % | 0.80 | % | 0.75 | % | ||||||||
For the year ended December 31, 2015, the advisory fee rate (net of waivers/rebate) was equivalent to an annual effective rate of 0.86% of the Portfolio's average daily net assets.
The Adviser has agreed to reduce its advisory fee and/or reimburse the Portfolio so that total annual portfolio operating expenses, excluding certain investment related expenses, taxes,
27
Morgan Stanley Institutional Fund, Inc.
Annual Report — December 31, 2015
Notes to Financial Statements (cont'd)
interest and other extraordinary expenses (including litigation), will not exceed 1.05% for Class I shares, 1.40% for Class A shares, 1.90% for Class L shares and 0.98% for Class IS shares. The fee waivers and/or expense reimbursements will continue for at least one year from the date of the Portfolio's prospectus or until such time as the Directors act to discontinue all or a portion of such waivers and/or reimbursements when they deem such action is appropriate. For the year ended December 31, 2015, approximately $189,000 of advisory fees were waived and approximately $500,000 of other expenses were reimbursed by the Adviser pursuant to this arrangement.
C. Administration Fees: The Adviser also serves as Administrator to the Fund and provides administrative services pursuant to an Administration Agreement for an annual fee, accrued daily and paid monthly, of 0.08% of the Portfolio's average daily net assets.
Under a Sub-Administration Agreement between the Administrator and State Street, State Street provides certain administrative services to the Fund. For such services, the Administrator pays State Street a portion of the fee the Administrator receives from the Portfolio.
D. Distribution and Shareholder Services Fees: Morgan Stanley Distribution, Inc. ("MSDI" or the "Distributor"), a wholly-owned subsidiary of the Adviser and an indirect subsidiary of Morgan Stanley, serves as the Fund's Distributor of Portfolio shares pursuant to a Distribution Agreement. The Fund has adopted a Shareholder Services Plan with respect to Class A shares pursuant to Rule 12b-1 under the Act. Under the Shareholder Services Plan, the Portfolio pays the Distributor a shareholder services fee, accrued daily and paid monthly, at an annual rate of 0.25% of the Portfolio's average daily net assets attributable to Class A shares.
The Fund has adopted a Distribution and Shareholder Services Plan with respect to Class L shares pursuant to Rule 12b-1 under the Act. Under the Distribution and Shareholder Services Plan, the Portfolio pays the Distributor a distribution fee, accrued daily and paid monthly, at an annual rate of 0.50% and a shareholder services fee, accrued daily and paid monthly, at an annual rate of 0.25% of the Portfolio's average daily net assets attributable to Class L shares.
The distribution and shareholder services fees are used to support the expenses associated with servicing and maintaining accounts. The Distributor may compensate other parties for providing shareholder support services to investors who purchase Class A and Class L shares.
E. Dividend Disbursing and Transfer Agent: The Fund's dividend disbursing and transfer agent is Boston Financial Data Services, Inc. ("BFDS"). Pursuant to a Transfer Agency Agreement, the Fund pays BFDS a fee based on the number of classes, accounts and transactions relating to the Portfolios of the Fund.
F. Custodian Fees: State Street (the "Custodian") serves as Custodian for the Fund in accordance with a Custodian Agreement. The Custodian holds cash, securities, and other assets of the Fund as required by the Act. Custody fees are payable monthly based on assets held in custody, investment purchases and sales activity and account maintenance fees, plus reimbursement for certain out-of-pocket expenses.
G. Security Transactions and Transactions with Affiliates: For the year ended December 31, 2015, purchases and sales of investment securities for the Portfolio, other than long-term U.S. Government securities and short-term investments, were approximately $761,232,000 and $1,113,915,000, respectively. There were no purchases and sales of long-term U.S. Government securities for the year ended December 31, 2015.
The Portfolio invests in the Institutional Class of the Morgan Stanley Institutional Liquidity Funds (the "Liquidity Funds"), an open-end management investment company managed by the Adviser, both directly and as a portion of the securities held as collateral on loaned securities. Advisory fees paid by the Portfolio are reduced by an amount equal to its pro-rata share of the advisory and administration fees paid by the Portfolio due to its investments in the Liquidity Funds. For the year ended December 31, 2015, advisory fees paid were reduced by approximately $62,000 relating to the Portfolio's investment in the Liquidity Funds.
A summary of the Portfolio's transactions in shares of the Liquidity Funds during the year ended December 31, 2015 is as follows:
| Value December 31, 2014 (000) | Purchases at Cost (000) | Sales (000) | Dividend Income (000) | Value December 31, 2015 (000) | |||||||||||||||
| $ | 204,216 | $ | 1,004,619 | $ | 898,273 | $ | 113 | $ | 310,562 | ||||||||||
During the year ended December 31, 2015, the Portfolio incurred approximately $3,000 in brokerage commissions with Morgan Stanley & Co., LLC, an affiliate of the Adviser/
Administrator and Distributor, for portfolio transactions executed on behalf of the Portfolio.
The Portfolio has an unfunded Deferred Compensation Plan (the "Compensation Plan"), which allows each independent
28
Morgan Stanley Institutional Fund, Inc.
Annual Report — December 31, 2015
Notes to Financial Statements (cont'd)
Director to defer payment of all, or a portion, of the fees he or she receives for serving on the Board of Directors. Each eligible Director generally may elect to have the deferred amounts credited with a return equal to the total return on one or more of the Morgan Stanley funds that are offered as investment options under the Compensation Plan. Appreciation/depreciation and distributions received from these investments are recorded with an offsetting increase/decrease in the deferred compensation obligation and do not affect the NAV of the Portfolio.
H. Federal Income Taxes: It is the Portfolio's intention to continue to qualify as a regulated investment company and distribute all of its taxable and tax-exempt income. Accordingly, no provision for Federal income taxes is required in the financial statements.
The Portfolio may be subject to taxes imposed by countries in which it invests. Such taxes are generally based on income and/or capital gains earned or repatriated. Taxes are accrued based on net investment income, net realized gains and net unrealized appreciation as such income and/or gains are earned. Taxes may also be based on transactions in foreign currency and are accrued based on the value of investments denominated in such currency.
FASB ASC 740-10, "Income Taxes — Overall", sets forth a minimum threshold for financial statement recognition of the benefit of a tax position taken or expected to be taken in a tax return. Management has concluded there are no significant uncertain tax positions that would require recognition in the financial statements. If applicable, the Portfolio recognizes interest accrued related to unrecognized tax benefits in "Interest Expense" and penalties in "Other Expenses" in the Statement of Operations. The Portfolio files tax returns with the U.S. Internal Revenue Service, New York and various states. Generally, each of the tax years in the four-year period ended December 31, 2015, remains subject to examination by taxing authorities.
The tax character of distributions paid may differ from the character of distributions shown in the Statements of Changes in Net Assets due to short-term capital gains being treated as ordinary income for tax purposes. The tax character of distributions paid during fiscal 2015 and 2014 was as follows:
| 2015 Distributions Paid From: | 2014 Distributions Paid From: | ||||||||||||||
| Ordinary Income (000) | Long-Term Capital Gain (000) | Ordinary Income (000) | Long-Term Capital Gain (000) | ||||||||||||
| $ | — | $ | 126,283 | $ | — | $ | 229,940 | ||||||||
The amount and character of income and gains to be distributed are determined in accordance with income tax regulations which may differ from GAAP. These book/tax differences are either considered temporary or permanent in nature.
Temporary differences are primarily due to differing book and tax treatments in the timing of the recognition of gains (losses) on certain investment transactions and the timing of the deductibility of certain expenses.
Permanent differences, primarily due to differing treatments of gains (losses) related to foreign currency transactions, a net operating loss and basis adjustments on partnerships, resulted in the following reclassifications among the components of net assets at December 31, 2015:
| Accumulated Net Investment Loss (000) | Distributions in Excess of Net Realized Gain (000) | Paid-in- Capital (000) | |||||||||
| $ | 6,538 | $ | 4,024 | $ | (10,562 | ) | |||||
At December 31, 2015, the components of distributable earnings for the Portfolio on a tax basis were as follows:
| Undistributed Ordinary Income (000) | Undistributed Long-Term Capital Gain (000) | ||||||
| $ | — | $ | 17,394 | ||||
Capital losses and specified ordinary losses, including currency losses, incurred after October 31 but within the taxable year are deemed to arise on the first day of the Portfolio's next taxable year. For the year ended December 31, 2015, the Portfolio deferred to January 1, 2016 for U.S. Federal income tax purposes the following losses:
| Post-October Currency and Specified Ordinary Losses (000) | Post-October Capital Losses (000) | ||||||
| $ | 1,088 | $ | — | ||||
I. Other: At December 31, 2015, the Portfolio had record owners of 10% or greater. Investment activities of these shareholders could have a material impact on the Portfolio. The aggregate percentage of such owners was 37.9%.
29
Morgan Stanley Institutional Fund, Inc.
Annual Report — December 31, 2015
Report of Independent Registered Public Accounting Firm
To the Shareholders and Board of Directors of
Morgan Stanley Institutional Fund, Inc. —
Small Company Growth Portfolio
We have audited the accompanying statement of assets and liabilities, including the portfolio of investments, of Small Company Growth Portfolio (one of the portfolios constituting Morgan Stanley Institutional Fund, Inc.) (the "Portfolio") as of December 31, 2015, and the related statement of operations for the year then ended, the statements of changes in net assets for each of the two years in the period then ended and the financial highlights for each of the years or periods indicated therein. These financial statements and financial highlights are the responsibility of the Portfolio's management. Our responsibility is to express an opinion on these financial statements and financial highlights based on our audits.
We conducted our audits in accordance with the standards of the Public Company Accounting Oversight Board (United States). Those standards require that we plan and perform the audit to obtain reasonable assurance about whether the financial statements and financial highlights are free of material misstatement. We were not engaged to perform an audit of the Portfolio's internal control over financial reporting. Our audits included consideration of internal control over financial reporting as a basis for designing audit procedures that are appropriate in the circumstances, but not for the purpose of expressing an opinion on the effectiveness of the Portfolio's internal control over financial reporting. Accordingly, we express no such opinion. An audit also includes examining, on a test basis, evidence supporting the amounts and disclosures in the financial statements and financial highlights, assessing the accounting principles used and significant estimates made by management, and evaluating the overall financial statement presentation. Our procedures included confirmation of securities owned as of December 31, 2015, by correspondence with the custodian and others. We believe that our audits provide a reasonable basis for our opinion.
In our opinion, the financial statements and financial highlights referred to above present fairly, in all material respects, the financial position of Small Company Growth Portfolio (one of the portfolios constituting Morgan Stanley Institutional Fund, Inc.) at December 31, 2015, the results of its operations for the year then ended, the changes in its net assets for each of the two years in the period then ended and the financial highlights for each of the years or periods indicated therein, in conformity with U.S. generally accepted accounting principles.

Boston, Massachusetts
February 26, 2016
30
Morgan Stanley Institutional Fund, Inc.
Annual Report — December 31, 2015
Federal Tax Notice (unaudited)
For Federal income tax purposes, the following information is furnished with respect to the distributions paid by the Portfolio during its taxable year ended December 31, 2015.
The Portfolio designated and paid approximately $126,283,000 as a long-term capital gain distribution.
In January, the Portfolio provides tax information to shareholders for the preceding calendar year.
31
Morgan Stanley Institutional Fund, Inc.
Annual Report — December 31, 2015
U.S. Privacy Policy (unaudited)
AN IMPORTANT NOTICE CONCERNING OUR U.S. PRIVACY POLICY
This privacy notice describes the U.S. privacy policy of Morgan Stanley Distribution, Inc., and the Morgan Stanley family of mutual funds ("us", "our", "we").
We are required by federal law to provide you with notice of our U.S. privacy policy ("Policy"). This Policy applies to both our current and former clients unless we state otherwise and is intended for individual clients who purchase products or receive services from us for personal, family or household purposes. This Policy is not applicable to partnerships, corporations, trusts or other
non-individual clients or account holders, nor is this Policy applicable to individuals who are either beneficiaries of a trust for which we serve as trustee or participants in an employee benefit plan administered or advised by us. This Policy is, however, applicable to individuals who select us to be a custodian of securities or assets in individual retirement accounts, 401(k) accounts, or accounts subject to the Uniform Gifts to Minors Act.
This notice sets out our business practices to protect your privacy; how we collect and share personal information about you; and how you can limit our sharing or certain uses by others of this information. We may amend this Policy at any time, and will inform you of any changes to our Policy as required by law.
WE RESPECT YOUR PRIVACY
We appreciate that you have provided us with your personal financial information and understand your concerns about your information. We strive to safeguard the information our clients entrust to us. Protecting the confidentiality and security of client information is an important part of how we conduct our business.
This notice describes what personal information we collect about you, how we collect it, when we may share it with others, and how certain others may use it. It discusses the steps you may take to limit our sharing of certain information about you with our affiliated companies, including, but not limited to our affiliated banking businesses, brokerage firms and credit service affiliates. It also discloses how you may limit our affiliates' use of shared information for marketing purposes.
Throughout this Policy, we refer to the nonpublic information that personally identifies you as "personal information." We also use the term "affiliated company" in this notice. An affiliated company is a company in our family of companies and includes companies with the Morgan Stanley name. These affiliated companies are financial institutions such as broker-dealers, banks, investment advisers and credit card issuers. We refer to any company that is not an affiliated company as a nonaffiliated third party. For purposes of Section 5 of this notice, and your ability to limit certain uses of personal information by our affiliates, this notice applies to the use of personal information by our affiliated companies.
1. WHAT PERSONAL INFORMATION DO WE COLLECT FROM YOU?
We may collect the following types of information about you: (i) information provided by you, including information from applications and other forms we receive from you, (ii) information about your transactions with us or our affiliates, (iii) information about your transactions with nonaffiliated third parties, (iv) information from consumer reporting agencies, (v) information obtained from our websites, and (vi) information obtained from other sources. For example:
• We collect information such as your name, address, e-mail address, telephone/fax numbers, assets, income and investment objectives through applications and other forms you submit to us.
• We may obtain information about account balances, your use of account(s) and the types of products and services you prefer to receive from us through your dealings and transactions with us and other sources.
• We may obtain information about your creditworthiness and credit history from consumer reporting agencies.
• We may collect background information from and through third-party vendors to verify representations you have made and to comply with various regulatory requirements.
2. WHEN DO WE DISCLOSE PERSONAL INFORMATION WE COLLECT ABOUT YOU?
We may disclose personal information we collect about you in each of the categories listed above to affiliated and nonaffiliated third parties.
32
Morgan Stanley Institutional Fund, Inc.
Annual Report — December 31, 2015
U.S. Privacy Policy (unaudited) (cont'd)
a. Information We Disclose to Affiliated Companies.
We may disclose personal information that we collect about you to our affiliated companies to manage your account(s) effectively, to service and process your transactions, and to let you know about products and services offered by us and affiliated companies, to manage our business, and as otherwise required or permitted by law. Offers for products and services from affiliated companies are developed under conditions designed to safeguard your personal information.
b. Information We Disclose to Third Parties.
We may disclose personal information that we collect about you to nonaffiliated third parties to provide marketing services on our behalf or to other financial institutions with whom we have joint marketing agreements. We may also disclose all of the information we collect to other nonaffiliated third parties for our everyday business purposes, such as to process transactions, maintain account(s), respond to court orders and legal investigations, report to credit bureaus, offer our own products and services, protect against fraud, for institutional risk control, to perform services on our behalf, and as otherwise required or permitted by law.
When we share personal information about you with a nonaffiliated third party, they are required to limit their use of personal information about you to the particular purpose for which it was shared and they are not allowed to share personal information about you with others except to fulfill that limited purpose or as may be permitted or required by law.
3. HOW DO WE PROTECT THE SECURITY AND CONFIDENTIALITY OF PERSONAL INFORMATION WE COLLECT ABOUT YOU?
We maintain physical, electronic and procedural security measures that comply with applicable law and regulations to help safeguard the personal information we collect about you. We have internal policies governing the proper handling of client information by employees. Third parties that provide support or marketing services on our behalf may also receive personal information about you, and we require them to adhere to appropriate security standards with respect to such information.
4. HOW CAN YOU LIMIT OUR SHARING CERTAIN PERSONAL INFORMATION ABOUT YOU WITH OUR AFFILIATED COMPANIES FOR ELIGIBILITY DETERMINATION?
By following the opt-out procedures in Section 6 below, you may limit the extent to which we share with our affiliated companies, personal information that was collected to determine your eligibility for products and services such as your credit reports and other information that you have provided to us or that we may obtain from third parties ("eligibility information"). Eligibility information does not include your identification information or personal information pertaining to our transactions or experiences with you. Please note that, even if you direct us not to share eligibility information with our affiliated companies, we may still share your personal information, including eligibility information, with our affiliated companies under circumstances that are permitted under applicable law, such as to process transactions or to service your account.
5. HOW CAN YOU LIMIT THE USE OF CERTAIN PERSONAL INFORMATION ABOUT YOU BY OUR AFFILIATED COMPANIES FOR MARKETING?
By following the opt-out instructions in Section 6 below, you may limit our affiliated companies from marketing their products or services to you based on personal information we disclose to them. This information may include, for example, your income and account history with us. Please note that, even if you choose to limit our affiliated companies from using personal information about you that we may share with them for marketing their products and services to you, our affiliated companies may use your personal information that they obtain from us to market to you in circumstances permitted by law, such as if the affiliated party has its own relationship with you.
33
Morgan Stanley Institutional Fund, Inc.
Annual Report — December 31, 2015
U.S. Privacy Policy (unaudited) (cont'd)
6. HOW CAN YOU SEND US AN OPT-OUT INSTRUCTION?
If you wish to limit our sharing of eligibility information about you with our affiliated companies, or our affiliated companies' use of personal information for marketing purposes, as described in this notice, you may do so by:
• Calling us at (800) 548-7786
Monday–Friday between 8a.m. and 6p.m. (EST)
• Writing to us at the following address:
Boston Financial Data Services, Inc.
c/o Privacy Coordinator
P.O. Box 219804
Kansas City, Missouri 64121
If you choose to write to us, your request should include: your name, address, telephone number and account number(s) to which the opt-out applies and whether you are opting out with respect to sharing of eligibility information (Section 4 above), or information used for marketing (Section 5 above), or both. Written opt-out requests should not be sent with any other correspondence. In order to process your request, we require that the request be provided by you directly and not through a third party. Once you have informed us about your privacy preferences, your opt-out preference will remain in effect with respect to this Policy (as it may be amended) until you notify us otherwise. If you are a joint account owner, we will accept instructions from any one of you and apply those instructions to the entire account.
Please understand that if you limit our sharing or our affiliated companies' use of personal information, you and any joint account holder(s) may not receive information about our affiliated companies' products and services, including products or services that could help you manage your financial resources and achieve your investment objectives.
If you have more than one account or relationship with us, please specify the accounts to which you would like us to apply your privacy choices. If you have accounts or relationships with our affiliates, you may receive multiple privacy policies from them, and will need to separately notify those companies of your privacy choices for those accounts or relationships.
7. WHAT IF AN AFFILIATED COMPANY BECOMES A NONAFFILIATED THIRD PARTY?
If, at any time in the future, an affiliated company becomes a nonaffiliated third party, further disclosures of personal information made to the former affiliated company will be limited to those described in Section 2(b) above relating to nonaffiliated third parties. If you elected under Section 6 to limit disclosures we make to affiliated companies, or use of personal information by affiliated companies, your election will not apply to use by any former affiliated company of your personal information in their possession once it becomes a nonaffiliated third party.
SPECIAL NOTICE TO RESIDENTS OF VERMONT
The following section supplements our Policy with respect to our individual clients who have a Vermont address and supersedes anything to the contrary in the above Policy with respect to those clients only.
The State of Vermont requires financial institutions to obtain your consent prior to sharing personal information that they collect about you with nonaffiliated third parties, or eligibility information with affiliated companies, other than in certain limited circumstances. Except as permitted by law, we will not share personal information we collect about you with nonaffiliated third parties or eligibility information with affiliated companies, unless you provide us with your written consent to share such information.
SPECIAL NOTICE TO RESIDENTS OF CALIFORNIA
The following section supplements our Policy with respect to our individual clients who have a California address and supersedes anything to the contrary in the above Policy with respect to those clients only.
In response to a California law, if your account has a California home address, your personal information will not be disclosed to nonaffiliated third parties except as permitted by applicable California law, and we will limit sharing such personal information with our affiliates to comply with California privacy laws that apply to us.
34
Morgan Stanley Institutional Fund, Inc.
Annual Report — December 31, 2015
Director and Officer Information (unaudited)
Independent Directors:
| Name, Age and Address of Independent Director | Positions(s) Held with Registrant | Length of Time Served | Principal Occupation(s) During Past 5 Years and Other Relevant Professional Experience | Number of Portfolios in Fund Complex Overseen by Director** | Other Directorships Held by Independent Director*** | ||||||||||||||||||
| Frank L. Bowman (71) c/o Kramer Levin Naftalis & Frankel LLP Counsel to the Independent Directors 1177 Avenue of the Americas New York, NY 10036 | Director | Since August 2006 | President, Strategic Decisions, LLC (consulting) (since February 2009); Director or Trustee of various Morgan Stanley Funds (since August 2006); Chairperson of the Compliance and Insurance Committee (since October 2015); Formerly, Chairperson of the Insurance Sub-Committee of the Compliance and Insurance Committee (February 2007-December 2015); served as President and Chief Executive Officer of the Nuclear Energy Institute (policy organization) (February 2005-November 2008); retired as Admiral, U.S. Navy after serving over 38 years on active duty including 8 years as Director of the Naval Nuclear Propulsion Program in the Department of the Navy and the U.S. Department of Energy (1996-2004); served as Chief of Naval Personnel (July 1994-September 1996); and on the Joint Staff as Director of Political Military Affairs (June 1992-July1994); knighted as Honorary Knight Commander of the Most Excellent Order of the British Empire; awarded the Officier de l'Orde National du Mérite by the French Government; elected to the National Academy of Engineering (2009). | 98 | Director of BP p.l.c.; Director of Naval and Nuclear Technologies LLP; Director Emeritus of the Armed Services YMCA; Director of the U.S. Naval Submarine League; Member of the National Security Advisory Council of the Center for U.S. Global Engagement and a member of the CNA Military Advisory Board; Chairman of the Charity, J Street Cup Golf, Trustee of Fairhaven United Methodist Church; and Director of other various non-profit organizations. | ||||||||||||||||||
| Kathleen A. Dennis (62) c/o Kramer Levin Naftalis & Frankel LLP Counsel to the Independent Directors 1177 Avenue of the Americas New York, NY 10036 | Director | Since August 2006 | President, Cedarwood Associates (mutual fund and investment management consulting) (since July 2006); Chairperson of the Money Market and Alternatives Sub-Committee of the Investment Committee (since October 2006) and Director or Trustee of various Morgan Stanley Funds (since August 2006); formerly, Senior Managing Director of Victory Capital Management (1993-2006). | 98 | Director of various nonprofit organizations. | ||||||||||||||||||
| Nancy C. Everett (61) c/o Kramer Levin Naftalis & Frankel LLP Counsel to the Independent Directors 1177 Avenue of the Americas New York, NY 10036 | Director | Since January 2015 | Chief Executive Officer, Virginia Commonwealth University Investment Company (since November 2015); Owner, OBIR, LLC (investment management consulting) (since June 2014); formerly, Managing Director, BlackRock Inc. (February 2011-December 2013); and Chief Executive Officer, General Motors Asset Management (a/k/a Promark Global Advisors, Inc.) (June 2005-May 2010). | 98 | Member of Virginia Commonwealth University School of Business Foundation; formerly, Member of Virginia Commonwealth University Board of Visitors (2013-2015); Member of Committee on Directors for Emerging Markets Growth Fund, Inc. (2007-2010); Chairperson of Performance Equity Management, LLC (2006-2010); and Chairperson, GMAM Absolute Return Strategies Fund, LLC (2006-2010). | ||||||||||||||||||
35
Morgan Stanley Institutional Fund, Inc.
Annual Report — December 31, 2015
Director and Officer Information (unaudited) (cont'd)
Independent Directors: (cont'd)
| Name, Age and Address of Independent Director | Positions(s) Held with Registrant | Length of Time Served | Principal Occupation(s) During Past 5 Years and Other Relevant Professional Experience | Number of Portfolios in Fund Complex Overseen by Director** | Other Directorships Held by Independent Director*** | ||||||||||||||||||
| Jakki L. Haussler (58) c/o Kramer Levin Naftalis & Frankel LLP Counsel to the Independent Directors 1177 Avenue of the Americas New York, NY 10036 | Director | Since January 2015 | Chairman and Chief Executive Officer, Opus Capital Group (since January 1996); and formerly, Director, Capvest Venture Fund, LP (May 2000-December 2011); Partner, Adena Ventures, LP (July 1999-December 2010); Director, The Victory Funds (February 2005-July 2008). | 98 | Director of Cincinnati Bell Inc. and Member, Audit Committee and Compensation Committee; Director of Northern Kentucky University Foundation and Member, Investment Committee; Member of Chase College of Law Transactional Law Practice Center Board of Advisors; Director of Best Transport; Chase College of Law Board of Visitors; formerly, Member, University of Cincinnati Foundation Investment Committee; Member, Miami University Board of Visitors (2008-2011); Trustee of Victory Funds (2005-2008) and Chairman, Investment Committee (2007-2008) and Member, Service Provider Committee (2005-2008). | ||||||||||||||||||
| Dr. Manuel H. Johnson (67) c/o Johnson Smick International, Inc. 220 I Street, N.E. — Suite 200 Washington, D.C. 20002 | Director | Since July 1991 | Senior Partner, Johnson Smick International, Inc. (consulting firm); Chairperson of the Investment Committee (since October 2006) and Director or Trustee of various Morgan Stanley Funds (since July 1991); Co-Chairman and a founder of the Group of Seven Council (G7C) (international economic commission); formerly Chairperson of the Audit Committee (July 1991-September 2006), Vice Chairman of the Board of Governors of the Federal Reserve System and Assistant Secretary of the U.S. Treasury. | 100 | Director of NVR, Inc. (home construction). | ||||||||||||||||||
| Joseph J. Kearns (73) c/o Kearns & Associates LLC 23823 Malibu Road S-50-440 Malibu, CA 90265 | Director | Since August 1994 | President, Kearns & Associates LLC (investment consulting); Chairperson of the Audit Committee (since October 2006) and Director or Trustee of various Morgan Stanley Funds (since August 1994); formerly, Deputy Chairperson of the Audit Committee (July 2003-September 2006) and Chairperson of the Audit Committee of various Morgan Stanley Funds (since August 1994); CFO of the J. Paul Getty Trust. | 101 | Director of Electro Rent Corporation (equipment leasing). Prior to December 31, 2013, Director of The Ford Family Foundation. | ||||||||||||||||||
36
Morgan Stanley Institutional Fund, Inc.
Annual Report — December 31, 2015
Director and Officer Information (unaudited) (cont'd)
Independent Directors: (cont'd)
| Name, Age and Address of Independent Director | Positions(s) Held with Registrant | Length of Time Served | Principal Occupation(s) During Past 5 Years and Other Relevant Professional Experience | Number of Portfolios in Fund Complex Overseen by Director** | Other Directorships Held by Independent Director*** | ||||||||||||||||||
| Michael F. Klein (57) c/o Kramer Levin Naftalis & Frankel LLP Counsel to the Independent Directors 1177 Avenue of the Americas New York, NY 10036 | Director | Since August 2006 | Managing Director, Aetos Capital, LLC (since March 2000); Co-President, Aetos Alternatives Management, LLC (since January 2004); and Co-Chief Executive Officer of Aetos Capital LLC (since August 2013); Chairperson of the Fixed Income Sub-Committee of the Investment Committee (since October 2006) and Director or Trustee of various Morgan Stanley Funds (since August 2006); formerly, Managing Director, Morgan Stanley & Co. Inc. and Morgan Stanley Dean Witter Investment Management, President, various Morgan Stanley Funds (June1998-March 2000) and Principal, Morgan Stanley & Co. Inc. and Morgan Stanley Dean Witter Investment Management (August 1997-December 1999). | 97 | Director of certain investment funds managed or sponsored by Aetos Capital, LLC. Director of Sanitized AG and Sanitized Marketing AG (specialty chemicals). | ||||||||||||||||||
| Michael E. Nugent (79) 522 Fifth Avenue New York, NY 10036 | Chair of the Board and Director | Chair of the Boards since July 2006 and Director since July 1991 | Chair of the Boards of various Morgan Stanley Funds (since July 2006); Chairperson of the Closed-End Fund Committee (since June 2012) and Director or Trustee of various Morgan Stanley Funds (since July 1991); formerly, Chairperson of the Insurance Committee (until July 2006), General Partner, TriumphCapital, L.P. (private investment partnership) (1988-2013). | 100 | None. | ||||||||||||||||||
| W. Allen Reed (68) c/o Kramer Levin Naftalis & Frankel LLP Counsel to the Independent Directors 1177 Avenue of the Americas New York, NY 10036 | Director | Since August 2006 | Chairperson of the Equity Sub-Committee of the Investment Committee (since October 2006) and Director or Trustee of various Morgan Stanley Funds (since August 2006); formerly, President and CEO of General Motors Asset Management; Chairman and Chief Executive Officer of the GM Trust Bank and Corporate Vice President of General Motors Corporation (August 1994-December 2005). | 98 | Director of Legg Mason, Inc. formerly, Director of the Auburn University Foundation (2010-2015). | ||||||||||||||||||
| Fergus Reid (83) c/o Joe Pietryka, Inc. 85 Charles Colman Blvd. Pawling, NY 12564 | Director | Since June 1992 | Chairman, Joe Pietryka, Inc.; Chairperson of the Governance Committee and Director or Trustee of various Morgan Stanley Funds (since June 1992). | 100 | Formerly, Trustee and Director of certain investment companies in the JP Morgan Fund Complex managed by JP Morgan Investment Management Inc. (1987-2012). | ||||||||||||||||||
37
Morgan Stanley Institutional Fund, Inc.
Annual Report — December 31, 2015
Director and Officer Information (unaudited) (cont'd)
Interested Director:
| Name, Age and Address of Interested Director | Positions(s) Held with Registrant | Length of Time Served* | Principal Occupation(s) During Past 5 Years | Number of Portfolios in Fund Complex Overseen by Interested Director** | Other Directorships Held by Interested Director*** | ||||||||||||||||||
| James F. Higgins (68) One New York Plaza, New York, NY 10004 | Director | Since June 2000 | Director or Trustee of various Morgan Stanley Funds (since June 2000); Senior Advisor of Morgan Stanley (since August 2000). | 99 | Formerly, Director of AXA Financial, Inc. and AXA Equitable Life Insurance Company (2002-2011) and Director of AXA MONY Life Insurance Company and AXA MONY Life Insurance Company of America (2004-2011). | ||||||||||||||||||
* This is the earliest date the Director began serving the Morgan Stanley Funds. Each Director serves an indefinite term, until his or her successor is elected.
** The Fund Complex includes (as of December 31, 2015) all open-end and closed-end funds (including all of their portfolios) advised by Morgan Stanley Investment Management Inc. (the "Adviser") and any funds that have an adviser that is an affiliated person of the Adviser (including, but not limited to, Morgan Stanley AIP GP LP).
*** This includes any directorships at public companies and registered investment companies held by the Director at any time during the past five years.
Executive Officers:
Name, Age and Address of Executive Officer | Position(s) Held with Registrant | Length of Time Served**** | Principal Occupation(s) During Past 5 Years | ||||||||||||
| John H. Gernon (52) 522 Fifth Avenue New York, NY 10036 | President and Principal Executive Officer | Since September 2013 | President and Principal Executive Officer of the Equity and Fixed Income Funds and the Morgan Stanley AIP Funds (since September 2013) and the Liquidity Funds and various money market funds (since May 2014) in the Fund Complex, Managing Director of the Adviser; Head of Product (since 2006). | ||||||||||||
| Stefanie V. Chang Yu (49) 522 Fifth Avenue New York, NY 10036 | Chief Compliance Officer | Since December 1997 | Managing Director of the Adviser and various entities affiliated with the Adviser; Chief Compliance Officer of various Morgan Stanley Funds and the Adviser (since January 2014); formerly, Vice President of various Morgan Stanley Funds (December 1997-January 2014). | ||||||||||||
| Joseph C. Benedetti (50) 522 Fifth Avenue New York, NY 10036 | Vice President | Since January 2014 | Managing Director of the Adviser and various entities affiliated with the Adviser; Vice President of various Morgan Stanley Funds (since January 2014); formerly, Assistant Secretary of various Morgan Stanley Funds (October 2004-January 2014). | ||||||||||||
| Francis J. Smith (50) 522 Fifth Avenue New York, NY 10036 | Treasurer and Principal Financial Officer | Treasurer since July 2003 and Principal Financial Officer since September 2002 | Executive Director of the Adviser and various entities affiliated with the Adviser; Treasurer (since July 2003) and Principal Financial Officer of various Morgan Stanley Funds (since September 2002). | ||||||||||||
| Mary E. Mullin (48) 522 Fifth Avenue New York, NY 10036 | Secretary | Since June 1999 | Executive Director of the Adviser; Secretary of various Morgan Stanley Funds (since June 1999). | ||||||||||||
**** This is the earliest date the officer began serving the Morgan Stanley Funds. Each officer serves a one-year term, until his or her successor is elected and has qualified.
38
Morgan Stanley Institutional Fund, Inc.
Annual Report — December 31, 2015
Adviser and Administrator
Morgan Stanley Investment Management Inc.
522 Fifth Avenue
New York, New York 10036
Distributor
Morgan Stanley Distribution, Inc.
522 Fifth Avenue
New York, New York 10036
Dividend Disbursing and Transfer Agent
Boston Financial Data Services, Inc.
2000 Crown Colony Drive
Quincy, Massachusetts 02169
Custodian
State Street Bank and Trust Company
One Lincoln Street
Boston, Massachusetts 02111
Legal Counsel
Dechert LLP
1095 Avenue of the Americas
New York, New York 10036
Counsel to the Independent Directors
Kramer Levin Naftalis & Frankel LLP
1177 Avenue of the Americas
New York, New York 10036
Independent Registered Public Accounting Firm
Ernst & Young LLP
200 Clarendon Street
Boston, Massachusetts 02116
Reporting to Shareholders
Each Morgan Stanley fund provides a complete schedule of portfolio holdings in its semi-annual and annual reports within 60 days of the end of the fund's second and fourth fiscal quarters. The semi-annual and annual reports are filed electronically with the Securities and Exchange Commission (SEC) on Form N-CSRS and Form N-CSR, respectively. Morgan Stanley also delivers the semi-annual and annual reports to fund shareholders and makes these reports available on its public website, www.morganstanley.com/im. Each Morgan Stanley fund also files a complete schedule of portfolio holdings with the SEC for the fund's first and third fiscal quarters on Form N-Q. Morgan Stanley does not deliver the reports for the first and third fiscal quarters to shareholders, nor are the reports posted to the Morgan Stanley public website. You may, however, obtain the Form N-Q filings (as well as the Form N-CSR and N-CSRS filings) by accessing the SEC's website, www.sec.gov. You may also review and copy them at the SEC's Public Reference Room in Washington, DC. Information on the operation of the SEC's Public Reference Room may be obtained by calling the SEC toll free at 1 (800) SEC-0330. You can also request copies of these materials, upon payment of a duplicating fee, by electronic request at the SEC's email address (publicinfo@sec.gov) or by writing the Public Reference Room of the SEC, Washington, DC 20549-0102.
Proxy Voting Policies and Procedures and Proxy Voting Record
You may obtain a copy of the Fund's Proxy Voting Policy and Procedures and information regarding how the Fund voted proxies relating to portfolio securities during the most recent twelve-month period ended June 30, without charge, upon request, by calling toll free 1 (800) 548-7786 or by visiting our website at www.morganstanley.com/im. This information is also available on the SEC's website at www.sec.gov.
This report is authorized for distribution only when preceded or accompanied by a prospectus of the Morgan Stanley Institutional Fund, Inc., which describes in detail each Portfolio's investment policies, risks, fees and expenses. Please read the prospectus carefully before you invest or send money. For additional information, including information regarding the investments comprising the Portfolio, please visit our website at www.morganstanley.com/im or call toll free
1 (800) 548-7786.
39
(This Page has been left blank intentionally.)
Printed in U.S.A.
This Report has been prepared for shareholders and may be distributed to others only if preceded or accompanied by a current prospectus.
Morgan Stanley Investment Management Inc.
522 Fifth Avenue
New York, New York 10036
© 2016 Morgan Stanley. Morgan Stanley Distribution, Inc.

IFISCGANN
1405244 EXP. 02.28.17
INVESTMENT MANAGEMENT

Morgan Stanley Institutional Fund, Inc.
Emerging Markets Portfolio
Annual Report
December 31, 2015

Morgan Stanley Institutional Fund, Inc.
Annual Report — December 31, 2015
Table of Contents
Shareholders' Letter | 2 | ||||||
Expense Example | 3 | ||||||
Investment Overview | 4 | ||||||
Portfolio of Investments | 6 | ||||||
Statement of Assets and Liabilities | 9 | ||||||
Statement of Operations | 11 | ||||||
Statements of Changes in Net Assets | 12 | ||||||
Financial Highlights | 14 | ||||||
Notes to Financial Statements | 19 | ||||||
Report of Independent Registered Public Accounting Firm | 30 | ||||||
Federal Tax Notice | 31 | ||||||
U.S. Privacy Policy | 32 | ||||||
Director and Officer Information | 35 | ||||||
This report is authorized for distribution only when preceded or accompanied by prospectuses of the Morgan Stanley Institutional Fund, Inc. To receive a prospectus and/or statement of additional information (SAI), which contains more complete information such as investment objectives, charges, expenses, policies for voting proxies, risk considerations, and describes in detail each of the Portfolio's investment policies to the prospective investor, please call toll free 1 (800) 548-7786. Please read the prospectuses carefully before you invest or send money.
Additionally, you can access portfolio information including performance, characteristics, and investment team commentary through Morgan Stanley Investment Management's website: www.morganstanley.com/im.
Market forecasts provided in this report may not necessarily come to pass. There is no guarantee that any sectors mentioned will continue to perform as discussed herein or that securities in such sectors will be held by the Portfolio in the future. There is no assurance that a Portfolio will achieve its investment objective. Portfolios are subject to market risk, which is the possibility that market values of securities owned by the Portfolio will decline and, therefore, the value of the Portfolio's shares may be less than what you paid for them. Accordingly, you can lose money investing in this Portfolio. Please see the prospectus for more complete information on investment risks.
1
Morgan Stanley Institutional Fund, Inc.
Annual Report — December 31, 2015
Shareholders' Letter (unaudited)
Dear Shareholders,
We are pleased to provide this Annual report, in which you will learn how your investment in Emerging Markets Portfolio (the "Portfolio") performed during the latest twelve-month period.
Morgan Stanley Investment Management is a client-centric, investor-led organization. Our global presence, intellectual capital, and breadth of products and services enable us to partner with investors to meet the evolving challenges of today's financial markets. We aim to deliver superior investment service and to empower our clients to make the informed decisions that help them reach their investment goals.
As always, we thank you for selecting Morgan Stanley Investment Management, and look forward to working with you in the months and years ahead.
Sincerely,

John H. Gernon
President and Principal Executive Officer
January 2016
2
Morgan Stanley Institutional Fund, Inc.
Annual Report — December 31, 2015
Expense Example (unaudited)
Emerging Markets Portfolio
As a shareholder of the Portfolio, you incur two types of costs: (1) transactional costs, including redemptions fees; and (2) ongoing costs, including advisory fees, administration fees, distribution and shareholder services fees and other Portfolio expenses. This example is intended to help you understand your ongoing costs (in dollars) of investing in the Portfolio and to compare these costs with the ongoing costs of investing in other mutual funds.
This example is based on an investment of $1,000 invested at the beginning of the six-month period ended December 31, 2015 and held for the entire six-month period.
Actual Expenses
The table below provides information about actual account values and actual expenses. You may use the information in this table, together with the amount you invested, to estimate the expenses that you paid over the period. Simply divide your account value by $1,000 (for example, an $8,600 account value divided by $1,000 = 8.6), then multiply the result by the number in the table under the heading entitled "Actual Expenses Paid During Period" to estimate the expenses you paid on your account during this period.
Hypothetical Example for Comparison Purposes
The table below provides information about hypothetical account values and hypothetical expenses based on the Portfolio's actual expense ratio and an assumed rate of return of 5% per year before expenses, which is not the Portfolio's actual return. The hypothetical account values and expenses may not be used to estimate the actual ending account balance or expenses you paid for the period. You may use this information to compare the ongoing costs of investing in the Portfolio and other funds. To do so, compare this 5% hypothetical example with the 5% hypothetical examples that appear in the shareholder reports of the other funds.
Please note that the expenses shown in the table are meant to highlight your ongoing costs only and do not reflect any transactional costs, such as sales charges (loads) and redemption fees. Therefore, the information for each class in the table is useful in comparing ongoing costs only, and will not help you determine the relative total costs of owning different funds. In addition, if these transactional costs were included, your costs would have been higher.
| Beginning Account Value 7/1/15 | Actual Ending Account Value 12/31/15 | Hypothetical Ending Account Value | Actual Expenses Paid During Period* | Hypothetical Expenses Paid During Period* | Net Expense Ratio During Period** | ||||||||||||||||||||||
Emerging Markets Portfolio Class I | $ | 1,000.00 | $ | 855.70 | $ | 1,019.06 | $ | 5.71 | $ | 6.21 | 1.22 | % | |||||||||||||||
Emerging Markets Portfolio Class A | 1,000.00 | 854.50 | 1,017.64 | 7.01 | 7.63 | 1.50 | |||||||||||||||||||||
Emerging Markets Portfolio Class L | 1,000.00 | 852.30 | 1,014.77 | 9.66 | 10.51 | 2.07 | |||||||||||||||||||||
Emerging Markets Portfolio Class C | 1,000.00 | 850.90 | 1,013.46 | 10.87 | 11.82 | 2.33 | |||||||||||||||||||||
Emerging Markets Portfolio Class IS | 1,000.00 | 856.10 | 1,019.51 | 5.29 | 5.75 | 1.13 | |||||||||||||||||||||
* Expenses are calculated using each Portfolio Class' annualized net expense ratio (as disclosed), multiplied by the average account value over the period, and multiplied by 184/365 (to reflect the most recent one-half year period).
** Annualized.
3
Morgan Stanley Institutional Fund, Inc.
Annual Report — December 31, 2015
Investment Overview (unaudited)
Emerging Markets Portfolio
The Portfolio seeks long-term capital appreciation by investing primarily in growth-oriented equity securities of issuers in emerging market countries.
Performance
For the year ended December 31, 2015, the Portfolio's Class I Shares had a total return based on net asset value and reinvestment of distributions per share of –10.33%, net of fees. The Portfolio's Class I shares outperformed the Portfolio's benchmark, the MSCI Emerging Markets Net Index (the "Index"), which returned –14.92%.
Factors Affecting Performance
• Emerging markets equities underperformed in 2015, with the Index returning –14.92% versus the MSCI World Index's flat return of –0.87%. Over the course of the year, markets grew increasingly concerned about China's slowing economy and waning liquidity with the Federal Reserve interest rate hike looming, both of which put downward pressure on global growth. While commodity prices declined, providing a windfall to the consumer, corporate profits hit multi-year lows. Markets that suffered the most in 2015 were commodity exporters such as Colombia, Peru, Brazil and South Africa. Political issues in Greece, Brazil, Turkey and Poland also weighed heavily on markets.
• Positive contributors to the Fund's performance during the period included our stock selection in India, South Africa, China and Taiwan. Both an overweight allocation and stock selection in Eastern Europe added value, as did an underweight allocation and stock selection in Brazil. Additionally, a hedge on the Fund's euro exposure, managed using foreign exchange futures, was beneficial to performance.
• Key detractors from performance included the Fund's position in Korea, where stock selection and an underweight allocation were unfavorable. Stock selection and a neutral allocation in both Colombia and Peru also hampered returns.
Management Strategies
• Several factors are likely to contribute to continued market volatility for some time in 2016: comprehension of China's true economic growth trajectory, reaction to potential additional devaluation of China's currency, and further adjustment to the consequences of the U.S. Federal Reserve's rate
increase path. But we think emerging market equities are heading toward an eventual important turning point, even if precise timing is difficult to determine. Presently, emerging market valuations in aggregate appear attractive, trading at about a 30% discount to developed equities — not as deep as the 50% discount seen in the 1997-98 period, but below their 20-year average discount of over 20%.(i) But as a catalyst, we think what will drive emerging market equities at some point, perhaps later this year, is when the market focuses on economic growth inflections shifting in favor of emerging markets relative to developed markets. Historically, the best time to buy emerging markets, as an asset class, has been when their gross domestic product growth rates were increasing by more than those in developed countries. We believe strongly that there will be big differences among countries for both growth rates and equity performance. Country allocation will be critical to generating excess returns in this environment.
• As we have for many years, we remain underweight China and commodities-related plays such as Brazil and Russia in the portfolio. We still consider Central/Eastern Europe an attractive investment opportunity. After two recessions in five years, Western European growth is recovering and beginning to unleash a great deal of pent-up demand for goods and services which we believe could benefit Poland, the Czech Republic and Romania.
• We also remain positive on the Philippines. In our view, the Philippines continues to deliver some of the most attractive well-rounded growth with the business process outsourcing sector performing well, keeping overall consumption fairly strong. Lower oil prices could provide a tailwind for consumption and help bring inflation down.
• Our overweight position in India is tempered by its status as a market consensus favorite. While views on India's macro prospects are divided, we find select bottom-up stories attractive. In Mexico, economic growth is starting to turn around, as reflected in company earnings. Consumption is finally picking up and credit is at last beginning to grow, and it has among the lowest credit penetration levels of any emerging market country.
(i) Source: FactSet and Morgan Stanley Investment Management. Emerging markets and developed markets are represented by the MSCI Emerging Markets Net Index and MSCI World Index, respectively.
4
Morgan Stanley Institutional Fund, Inc.
Annual Report — December 31, 2015
Investment Overview (unaudited) (cont'd)
Emerging Markets Portfolio

* Minimum Investment for Class I shares
In accordance with SEC regulations, the Portfolio's performance shown assumes that all recurring fees (including management fees) were deducted and all dividends and distributions were reinvested. The performance of Class A, L, C and IS shares will vary from the performance of Class I shares based upon their different inception dates and will be negatively impacted by additional fees assessed to those classes (if applicable).
Performance Compared to the MSCI Emerging Markets Net Index(1) and the Lipper Emerging Markets Funds Index(2)
| Period Ended December 31, 2015 Total Returns(3) | |||||||||||||||||||
Average Annual | |||||||||||||||||||
| One Year | Five Years | Ten Years | Since Inception(9) | ||||||||||||||||
| Portfolio — Class I Shares w/o sales charges(4) | –10.33 | % | –3.58 | % | 3.61 | % | 7.25 | % | |||||||||||
| Portfolio — Class A Shares w/o sales charges(5) | –10.63 | –3.86 | 3.33 | 5.99 | |||||||||||||||
| Portfolio — Class A Shares with maximum 5.25% sales charges(5) | –15.34 | –4.89 | 2.78 | 5.71 | |||||||||||||||
| Portfolio — Class L Shares w/o sales charges(6) | –11.11 | — | — | –3.40 | |||||||||||||||
| Portfolio — Class C Shares w/o sales charges(8) | — | — | — | –18.03 | |||||||||||||||
| Portfolio — Class C Shares with maximum 1.00% deferred sales charges(8) | — | — | — | –18.85 | |||||||||||||||
| Portfolio — Class IS Shares w/o sales charges(7) | –10.29 | — | — | –5.70 | |||||||||||||||
MSCI Emerging Markets Net Index | –14.92 | –4.81 | 3.61 | 6.76 | |||||||||||||||
Lipper Emerging Market Funds Index | –14.50 | –4.23 | 3.22 | N/A | |||||||||||||||
Performance data quoted represents past performance, which is no guarantee of future results, and current performance may be lower or higher than the figures shown. Performance assumes that all dividends and distributions, if any, were reinvested. For the most recent month-end performance figures, please visit www.morganstanley.com/im. Investment return and principal value will fluctuate so that Portfolio shares, when redeemed, may be worth more or less than their original cost. Total returns do not reflect the deduction of taxes that a shareholder would pay on Portfolio distributions or the redemption of Portfolio shares. Returns for periods less than one year are not annualized. Performance of share classes will vary due to difference in sales charges and expenses.
(1) The MSCI Emerging Markets Net Index is a free float-adjusted market capitalization weighted index that is designed to measure equity market performance of emerging markets. The term "free float" represents the portion of shares outstanding that are deemed to be available for purchase in the public equity markets by investors. The MSCI Emerging Markets Net Index currently consists of 23 emerging market country indices. The performance of the Index is listed in U.S. dollars and assumes reinvestment of net dividends. The Index is unmanaged and its returns do not include any sales charges or fees. Such costs would lower performance. It is not possible to invest directly in an index.
(2) The Lipper Emerging Market Funds Index is an equally weighted performance index of the largest qualifying funds (based on net assets) in the Lipper Emerging Market Funds classification. The Index, which is adjusted for capital gains distributions and income dividends, is unmanaged and should not be considered an investment. There are currently 30 funds represented in this Index. As of the date of this report, the Portfolio is in the Lipper Emerging Market Funds classification.
(3) Total returns for the Portfolio reflect fees waived and expenses reimbursed, if applicable, by the Adviser. Without such waivers and reimbursements, total returns would have been lower.
(4) Commenced operations on September 25, 1992.
(5) Commenced offering on January 2, 1996.
(6) Commenced offering on April 27, 2012.
(7) Commenced offering on September 13, 2013.
(8) Commenced offering on April 30, 2015.
(9) For comparative purposes, average annual since inception returns listed for the Indexes refer to the inception date of Class I of the Portfolio, not the inception of the Index.
5
Morgan Stanley Institutional Fund, Inc.
Annual Report — December 31, 2015
Portfolio of Investments
Emerging Markets Portfolio
Shares | Value (000) | ||||||||||
Common Stocks (97.2%) | |||||||||||
Austria (2.3%) | |||||||||||
Erste Group Bank AG (a) | 475,103 | $ | 14,848 | ||||||||
| Vienna Insurance Group AG Wiener Versicherung Gruppe | 178,396 | 4,870 | |||||||||
19,718 | |||||||||||
Brazil (5.1%) | |||||||||||
Banco Bradesco SA (Preference) | 1,061,962 | 5,115 | |||||||||
| BRF SA | 933,359 | 13,037 | |||||||||
Itau Unibanco Holding SA (Preference) | 1,212,430 | 7,923 | |||||||||
MercadoLibre, Inc. (b) | 55,459 | 6,341 | |||||||||
Raia Drogasil SA | 476,110 | 4,255 | |||||||||
Telefonica Brasil SA (Preference) | 323,500 | 2,922 | |||||||||
Ultrapar Participacoes SA | 257,081 | 3,925 | |||||||||
43,518 | |||||||||||
Chile (0.6%) | |||||||||||
SACI Falabella | 737,524 | 4,691 | |||||||||
China (17.8%) | |||||||||||
Alibaba Group Holding Ltd. ADR (a) | 37,000 | 3,007 | |||||||||
Bank of China Ltd. H Shares (c) | 35,533,000 | 15,727 | |||||||||
China Construction Bank Corp. H Shares (c) | 24,267,750 | 16,475 | |||||||||
China Machinery Engineering Corp. H Shares (c) | 2,489,000 | 1,814 | |||||||||
China Mengniu Dairy Co., Ltd. (c) | 1,788,000 | 2,891 | |||||||||
China Mobile Ltd. (c) | 1,790,500 | 20,067 | |||||||||
China Overseas Land & Investment Ltd. (c) | 1,816,000 | 6,305 | |||||||||
| China Pacific Insurance Group Co., Ltd. H Shares (c) | 2,182,600 | 8,953 | |||||||||
China Taiping Insurance Holdings Co., Ltd. (a)(c) | 1,221,800 | 3,745 | |||||||||
China Unicom Hong Kong Ltd. (c) | 1,760,000 | 2,134 | |||||||||
| Chongqing Changan Automobile Co., Ltd. B Shares | 901,502 | 1,979 | |||||||||
| CRCC High-Tech Equipment Corp., Ltd. H Shares (a)(c) | 3,971,000 | 2,434 | |||||||||
CSPC Pharmaceutical Group Ltd. (c) | 2,662,000 | 2,708 | |||||||||
| Huadian Power International Corp., Ltd. H Shares (c) | 3,594,000 | 2,330 | |||||||||
JD.com, Inc. ADR (a) | 172,377 | 5,562 | |||||||||
NetEase, Inc. ADR | 18,288 | 3,315 | |||||||||
| Shanghai Jin Jiang International Hotels Group Co., Ltd. H Shares (c) | 2,906,000 | 1,218 | |||||||||
Shenzhen International Holdings Ltd. (c) | 1,874,500 | 3,443 | |||||||||
Shenzhou International Group Holdings Ltd. (c) | 867,000 | 4,960 | |||||||||
| Sihuan Pharmaceutical Holdings Group Ltd. (d)(e) | 8,310,000 | 3,114 | |||||||||
TAL Education Group ADR (a)(b) | 98,582 | 4,581 | |||||||||
Tencent Holdings Ltd. (c) | 1,670,900 | 32,596 | |||||||||
Tsingtao Brewery Co., Ltd. H Shares (b)(c) | 264,000 | 1,189 | |||||||||
150,547 | |||||||||||
Colombia (0.7%) | |||||||||||
Cemex Latam Holdings SA (a) | 599,961 | 1,947 | |||||||||
Grupo de Inversiones Suramericana SA | 211,073 | 2,365 | |||||||||
| Grupo de Inversiones Suramericana SA (Preference) | 161,171 | 1,758 | |||||||||
6,070 | |||||||||||
Shares | Value (000) | ||||||||||
Czech Republic (1.1%) | |||||||||||
Komercni Banka AS | 48,486 | $ | 9,608 | ||||||||
Egypt (0.5%) | |||||||||||
Commercial International Bank Egypt SAE | 879,085 | 4,266 | |||||||||
Hong Kong (2.7%) | |||||||||||
AIA Group Ltd. | 1,579,000 | 9,407 | |||||||||
Samsonite International SA | 4,442,400 | 13,328 | |||||||||
22,735 | |||||||||||
India (10.4%) | |||||||||||
Ashok Leyland Ltd. | 8,296,373 | 10,958 | |||||||||
Bharat Petroleum Corp., Ltd. | 514,608 | 6,921 | |||||||||
Glenmark Pharmaceuticals Ltd. | 423,813 | 5,871 | |||||||||
HDFC Bank Ltd. | 465,271 | 9,374 | |||||||||
Idea Cellular Ltd. | 1,232,111 | 2,666 | |||||||||
IndusInd Bank Ltd. | 737,310 | 10,750 | |||||||||
Larsen & Toubro Ltd. | 308,550 | 5,918 | |||||||||
Marico Ltd. | 2,135,230 | 7,288 | |||||||||
Maruti Suzuki India Ltd. | 129,463 | 9,018 | |||||||||
Shree Cement Ltd. | 46,791 | 8,124 | |||||||||
Shriram Transport Finance Co., Ltd. | 647,925 | 8,380 | |||||||||
Sun Pharmaceutical Industries Ltd. | 259,711 | 3,201 | |||||||||
88,469 | |||||||||||
Indonesia (3.0%) | |||||||||||
AKR Corporindo Tbk PT | 5,008,100 | 2,593 | |||||||||
Jasa Marga Persero Tbk PT | 1,253,800 | 472 | |||||||||
Kalbe Farma Tbk PT | 35,987,800 | 3,414 | |||||||||
Link Net Tbk PT (a) | 10,900,100 | 3,130 | |||||||||
Matahari Department Store Tbk PT | 6,211,700 | 7,843 | |||||||||
Surya Citra Media Tbk PT | 12,095,200 | 2,710 | |||||||||
United Tractors Tbk PT | 1,143,300 | 1,389 | |||||||||
XL Axiata Tbk PT (a) | 15,829,600 | 4,173 | |||||||||
25,724 | |||||||||||
Korea, Republic of (13.0%) | |||||||||||
Amorepacific Corp. (a) | 23,802 | 8,359 | |||||||||
Cosmax, Inc. (a) | 21,157 | 3,291 | |||||||||
Coway Co., Ltd. (a) | 111,426 | 7,948 | |||||||||
Hotel Shilla Co., Ltd. (a)(b) | 75,863 | 4,964 | |||||||||
| Hyundai Development Co-Engineering & Construction (a) | 48,260 | 1,575 | |||||||||
KB Financial Group, Inc. (a) | 184,348 | 5,180 | |||||||||
Kia Motors Corp. (a) | 149,861 | 6,676 | |||||||||
Korea Aerospace Industries Ltd. (a) | 51,621 | 3,411 | |||||||||
LG Chem Ltd. (a) | 19,390 | 5,355 | |||||||||
LIG Nex1 Co., Ltd. (a) | 24,434 | 2,129 | |||||||||
NAVER Corp. (a) | 11,094 | 6,178 | |||||||||
Nexon Co., Ltd. | 341,000 | 5,535 | |||||||||
Samsung Electronics Co., Ltd. | 27,567 | 29,437 | |||||||||
Samsung Electronics Co., Ltd. (Preference) | 13,514 | 12,507 | |||||||||
SK Holdings Co., Ltd. (a) | 27,872 | 5,665 | |||||||||
SK Telecom Co., Ltd. | 10,478 | 1,921 | |||||||||
110,131 | |||||||||||
The accompanying notes are an integral part of the financial statements.
6
Morgan Stanley Institutional Fund, Inc.
Annual Report — December 31, 2015
Portfolio of Investments (cont'd)
Emerging Markets Portfolio
Shares | Value (000) | ||||||||||
Malaysia (0.1%) | |||||||||||
Astro Malaysia Holdings Bhd | 776,500 | $ | 499 | ||||||||
Mexico (6.9%) | |||||||||||
Alfa SAB de CV | 3,823,937 | 7,573 | |||||||||
Cemex SAB de CV ADR (a) | 1,770,727 | 9,863 | |||||||||
El Puerto de Liverpool SAB de CV | 321,102 | 3,926 | |||||||||
Fomento Economico Mexicano SAB de CV ADR | 199,463 | 18,421 | |||||||||
Grupo Financiero Banorte SAB de CV Series O | 2,066,481 | 11,367 | |||||||||
Grupo Financiero Inbursa SAB de CV Series O | 1,507,704 | 2,730 | |||||||||
Mexichem SAB de CV | 2,102,235 | 4,719 | |||||||||
58,599 | |||||||||||
Pakistan (1.2%) | |||||||||||
Lucky Cement Ltd. | 864,000 | 4,059 | |||||||||
United Bank Ltd. | 4,266,800 | 6,317 | |||||||||
10,376 | |||||||||||
Panama (0.2%) | |||||||||||
Copa Holdings SA, Class A (b) | 39,756 | 1,919 | |||||||||
Peru (0.9%) | |||||||||||
Credicorp Ltd. | 80,222 | 7,807 | |||||||||
Philippines (4.2%) | |||||||||||
BDO Unibank, Inc. | 1,637,000 | 3,641 | |||||||||
DMCI Holdings, Inc. | 12,782,800 | 3,737 | |||||||||
International Container Terminal Services, Inc. | 1,640,270 | 2,446 | |||||||||
LT Group, Inc. | 12,804,800 | 4,012 | |||||||||
Metro Pacific Investments Corp. | 52,206,900 | 5,759 | |||||||||
Metropolitan Bank & Trust Co. | 4,359,987 | 7,458 | |||||||||
SM Investments Corp. | 443,130 | 8,117 | |||||||||
35,170 | |||||||||||
Poland (3.6%) | |||||||||||
Bank Pekao SA | 134,085 | 4,889 | |||||||||
CCC SA | 127,866 | 4,501 | |||||||||
Eurocash SA | 295,162 | 3,637 | |||||||||
Jeronimo Martins SGPS SA | 500,386 | 6,501 | |||||||||
LPP SA | 2,040 | 2,883 | |||||||||
PKP Cargo SA | 219,984 | 3,834 | |||||||||
Polski Koncern Naftowy Orlen SA | 260,454 | 4,475 | |||||||||
30,720 | |||||||||||
Russia (2.0%) | |||||||||||
Mail.ru Group Ltd. GDR (a) | 287,251 | 6,459 | |||||||||
X5 Retail Group N.V. GDR (a) | 237,671 | 4,505 | |||||||||
Yandex N.V., Class A (a) | 365,594 | 5,747 | |||||||||
16,711 | |||||||||||
South Africa (6.4%) | |||||||||||
Life Healthcare Group Holdings Ltd. | 1,868,484 | 4,219 | |||||||||
Mondi PLC | 425,131 | 8,448 | |||||||||
MTN Group Ltd. | 663,225 | 5,686 | |||||||||
Naspers Ltd., Class N | 114,582 | 15,666 | |||||||||
Sasol Ltd. | 207,299 | 5,584 | |||||||||
Steinhoff International Holdings N.V. H Shares (b) | 1,535,937 | 7,797 | |||||||||
Vodacom Group Ltd. | 699,976 | 6,889 | |||||||||
54,289 | |||||||||||
Shares | Value (000) | ||||||||||
Taiwan (10.6%) | |||||||||||
Advanced Semiconductor Engineering, Inc. | 6,092,000 | $ | 6,963 | ||||||||
Advanced Semiconductor Engineering, Inc. ADR | 62,313 | 353 | |||||||||
Catcher Technology Co., Ltd. | 790,000 | 6,615 | |||||||||
Chailease Holding Co., Ltd. | 2,763,261 | 4,746 | |||||||||
Delta Electronics, Inc. | 1,113,557 | 5,226 | |||||||||
Eclat Textile Co., Ltd. | 425,867 | 5,865 | |||||||||
Formosa Plastics Corp. | 976,000 | 2,280 | |||||||||
Fubon Financial Holding Co., Ltd. | 3,888,490 | 5,285 | |||||||||
Hermes Microvision, Inc. | 60,155 | 2,177 | |||||||||
Hon Hai Precision Industry Co., Ltd. | 4,346,000 | 10,630 | |||||||||
PChome Online, Inc. | 231,000 | 2,298 | |||||||||
Pegatron Corp. | 2,341,000 | 5,089 | |||||||||
Taiwan Mobile Co., Ltd. | 1,044,000 | 3,172 | |||||||||
Taiwan Semiconductor Manufacturing Co., Ltd. | 4,958,205 | 21,395 | |||||||||
Uni-President Enterprises Corp. | 4,517,290 | 7,527 | |||||||||
89,621 | |||||||||||
Thailand (2.3%) | |||||||||||
Advanced Info Service PCL (Foreign) (b) | 1,100,100 | 4,611 | |||||||||
DKSH Holding AG (a)(b) | 93,320 | 5,850 | |||||||||
Land and Houses PCL (Foreign) (b) | 11,940,040 | 3,126 | |||||||||
Minor International PCL (Foreign) | 4,486,770 | 4,483 | |||||||||
Total Access Communication PCL (Foreign) (b) | 996,500 | 824 | |||||||||
Total Access Communication PCL NVDR (b) | 464,800 | 385 | |||||||||
19,279 | |||||||||||
Turkey (1.0%) | |||||||||||
Arcelik AS | 864,078 | 4,136 | |||||||||
Ulker Biskuvi Sanayi AS | 664,864 | 4,012 | |||||||||
8,148 | |||||||||||
United States (0.6%) | |||||||||||
Yum! Brands, Inc. (b) | 74,604 | 5,450 | |||||||||
Total Common Stocks (Cost $783,365) | 824,065 | ||||||||||
Investment Company (0.5%) | |||||||||||
Thailand (0.5%) | |||||||||||
| BTS Rail Mass Transit Growth Infrastructure Fund (Foreign) (Units) (f) (Cost $5,698) | 15,447,036 | 4,373 | |||||||||
| No. of Rights | |||||||||||
Right (0.0%) | |||||||||||
Brazil (0.0%) | |||||||||||
| Banco Bradesco SA (a) (Cost $—) | 34,787 | 16 | |||||||||
Short-Term Investments (5.5%) | |||||||||||
Securities held as Collateral on Loaned Securities (3.0%) | |||||||||||
Investment Company (2.6%) | |||||||||||
| Morgan Stanley Institutional Liquidity Funds — Money Market Portfolio — Institutional Class (See Note G) | 21,895,660 | 21,896 | |||||||||
The accompanying notes are an integral part of the financial statements.
7
Morgan Stanley Institutional Fund, Inc.
Annual Report — December 31, 2015
Portfolio of Investments (cont'd)
Emerging Markets Portfolio
| Face Amount (000) | Value (000) | ||||||||||
Repurchase Agreements (0.4%) | |||||||||||
| Barclays Capital, Inc., (0.32%, dated 12/31/15, due 1/4/16; proceeds $1,280; fully collateralized by a U.S. Government obligation; 1.38% due 2/29/20; valued at $1,306) | $ | 1,280 | $ | 1,280 | |||||||
| Merrill Lynch & Co., Inc., (0.31%, dated 12/31/15, due 1/4/16; proceeds $2,560; fully collateralized by a U.S. Government agency security; 3.50% due 3/20/45; valued at $2,611) | 2,560 | 2,560 | |||||||||
3,840 | |||||||||||
| Total Securities held as Collateral on Loaned Securities (Cost $25,736) | 25,736 | ||||||||||
Shares | |||||||||||
Investment Company (2.5%) | |||||||||||
| Morgan Stanley Institutional Liquidity Funds — Money Market Portfolio — Institutional Class (See Note G) (Cost $21,142) | 21,141,956 | 21,142 | |||||||||
Total Short-Term Investments (Cost $46,878) | 46,878 | ||||||||||
| Total Investments (103.2%) (Cost $835,941) Including $26,670 of Securities Loaned (g)(h)(i) | 875,332 | ||||||||||
Liabilities in Excess of Other Assets (–3.2%) | (27,368 | ) | |||||||||
Net Assets (100.0%) | $ | 847,964 | |||||||||
(a) Non-income producing security.
(b) All or a portion of this security was on loan at December 31, 2015.
(c) Security trades on the Hong Kong exchange.
(d) At December 31, 2015, the Portfolio held a fair valued security valued at approximately $3,114,000, representing 0.4% of net assets. This security has been fair valued as determined in good faith under procedures established by and under the general supervision of the Fund's Directors.
(e) Security has been deemed illiquid at December 31, 2015.
(f) Consists of one or more classes of securities traded together as a unit; stocks with attached warrants.
(g) Securities are available for collateral in connection with an open foreign currency forward exchange contract.
(h) The approximate fair value and percentage of net assets, $708,039,000 and 83.5%, respectively, represent the securities that have been fair valued under the fair valuation policy for international investments as described in Note A-1 within the Notes to the Financial Statements.
(i) At December 31, 2015, the aggregate cost for Federal income tax purposes is approximately $845,250,000. The aggregate gross unrealized appreciation is approximately $130,989,000 and the aggregate gross unrealized depreciation is approximately $100,907,000 resulting in net unrealized appreciation of approximately $30,082,000.
ADR American Depositary Receipt.
GDR Global Depositary Receipt.
NVDR Non-Voting Depositary Receipt.
Foreign Currency Forward Exchange Contract:
The Portfolio had the following foreign currency forward exchange contract open at December 31, 2015:
Counterparty | Contracts to Deliver (000) | In Exchange For (000) | Delivery Date | Unrealized Appreciation (000) | |||||||||||||||
UBS AG | EUR | 21,810 | $ | 23,836 | 1/21/16 | $ | 124 | ||||||||||||
EUR — Euro
Portfolio Composition*
Classification | Percentage of Total Investments | ||||||
Other** | 63.6 | % | |||||
Banks | 16.9 | ||||||
Internet Software & Services | 7.8 | ||||||
Tech Hardware, Storage & Peripherals | 6.3 | ||||||
Wireless Telecommunication Services | 5.4 | ||||||
Total Investments | 100.0 | %*** | |||||
* Percentages indicated are based upon total investments (excluding Securities held as Collateral on Loaned Securities) as of December 31, 2015.
** Industries and/or investment types representing less than 5% of total investments.
*** Does not include an open foreign currency forward exchange contract with unrealized appreciation of approximately $124,000.
The accompanying notes are an integral part of the financial statements.
8
Morgan Stanley Institutional Fund, Inc.
Annual Report — December 31, 2015
Emerging Markets Portfolio
Statement of Assets and Liabilities | December 31, 2015 (000) | ||||||
Assets: | |||||||
Investments in Securities of Unaffiliated Issuers, at Value(1) (Cost $792,903) | $ | 832,294 | |||||
Investment in Security of Affiliated Issuer, at Value (Cost $43,038) | 43,038 | ||||||
Total Investments in Securities, at Value (Cost $835,941) | 875,332 | ||||||
Foreign Currency, at Value (Cost $542) | 519 | ||||||
Cash | 1,815 | ||||||
Dividends Receivable | 640 | ||||||
Receivable for Portfolio Shares Sold | 624 | ||||||
Receivable for Investments Sold | 189 | ||||||
Unrealized Appreciation on Foreign Currency Forward Exchange Contracts | 124 | ||||||
Tax Reclaim Receivable | 107 | ||||||
Receivable from Affiliate | 6 | ||||||
Other Assets | 97 | ||||||
Total Assets | 879,453 | ||||||
Liabilities: | |||||||
Collateral on Securities Loaned, at Value | 27,551 | ||||||
Payable for Advisory Fees | 2,020 | ||||||
Payable for Portfolio Shares Redeemed | 679 | ||||||
Payable for Investments Purchased | 653 | ||||||
Payable for Custodian Fees | 206 | ||||||
Payable for Sub Transfer Agency Fees — Class I | 137 | ||||||
Payable for Sub Transfer Agency Fees — Class A | 4 | ||||||
Payable for Sub Transfer Agency Fees — Class L | — | @ | |||||
Payable for Directors' Fees and Expenses | 76 | ||||||
Payable for Administration Fees | 58 | ||||||
Payable for Professional Fees | 24 | ||||||
Payable for Transfer Agency Fees — Class I | 4 | ||||||
Payable for Transfer Agency Fees — Class A | 1 | ||||||
Payable for Transfer Agency Fees — Class L | — | @ | |||||
Payable for Transfer Agency Fees — Class C | — | @ | |||||
Payable for Transfer Agency Fees — Class IS | — | @ | |||||
Payable for Shareholder Services Fees — Class A | 4 | ||||||
Payable for Distribution and Shareholder Services Fees — Class L | — | @ | |||||
Payable for Distribution and Shareholder Services Fees — Class C | — | @ | |||||
Deferred Capital Gain Country Tax | 2 | ||||||
Other Liabilities | 70 | ||||||
Total Liabilities | 31,489 | ||||||
Net Assets | $ | 847,964 | |||||
Net Assets Consist Of: | |||||||
Paid-in-Capital | $ | 864,919 | |||||
Distributions in Excess of Net Investment Income | (3,288 | ) | |||||
Accumulated Net Realized Loss | (53,106 | ) | |||||
Unrealized Appreciation (Depreciation) on: | |||||||
Investments | 39,391 | ||||||
Foreign Currency Forward Exchange Contracts | 124 | ||||||
Foreign Currency Translations | (76 | ) | |||||
Net Assets | $ | 847,964 | |||||
The accompanying notes are an integral part of the financial statements.
9
Morgan Stanley Institutional Fund, Inc.
Annual Report — December 31, 2015
Emerging Markets Portfolio
Statement of Assets and Liabilities (cont'd) | December 31, 2015 (000) | ||||||
CLASS I: | |||||||
Net Assets | $ | 531,194 | |||||
| Shares Outstanding $0.001 par value shares of beneficial interest (unlimited shares authorized) (not in 000's) | 26,991,981 | ||||||
Net Asset Value, Offering and Redemption Price Per Share | $ | 19.68 | |||||
CLASS A: | |||||||
Net Assets | $ | 19,065 | |||||
| Shares Outstanding $0.001 par value shares of beneficial interest (unlimited shares authorized) (not in 000's) | 993,402 | ||||||
Net Asset Value, Redemption Price Per Share | $ | 19.19 | |||||
Maximum Sales Load | 5.25 | % | |||||
Maximum Sales Charge | $ | 1.06 | |||||
Maximum Offering Price Per Share | $ | 20.25 | |||||
CLASS L: | |||||||
Net Assets | $ | 226 | |||||
| Shares Outstanding $0.001 par value shares of beneficial interest (unlimited shares authorized) (not in 000's) | 11,899 | ||||||
Net Asset Value, Offering and Redemption Price Per Share | $ | 18.98 | |||||
CLASS C: | |||||||
Net Assets | $ | 10 | |||||
| Shares Outstanding $0.001 par value shares of beneficial interest (unlimited shares authorized) (not in 000's) | 543 | ||||||
Net Asset Value, Offering and Redemption Price Per Share | $ | 18.95 | |||||
CLASS IS: | |||||||
Net Assets | $ | 297,469 | |||||
| Shares Outstanding $0.001 par value shares of beneficial interest (unlimited shares authorized) (not in 000's) | 15,115,583 | ||||||
Net Asset Value, Offering and Redemption Price Per Share | $ | 19.68 | |||||
| (1) Including: Securities on Loan, at Value: | $ | 26,670 | |||||
@ Amount is less than $500.
The accompanying notes are an integral part of the financial statements.
10
Morgan Stanley Institutional Fund, Inc.
Annual Report — December 31, 2015
Emerging Markets Portfolio
Statement of Operations | Year Ended December 31, 2015 (000) | ||||||
Investment Income: | |||||||
Dividends from Securities of Unaffiliated Issuers (Net of $2,622 of Foreign Taxes Withheld) | $ | 18,514 | |||||
Income from Securities Loaned — Net | 172 | ||||||
Dividends from Security of Affiliated Issuer (Note G) | 48 | ||||||
Interest from Securities of Unaffiliated Issuers (Net of $—@ of Foreign Taxes Withheld) | — | @ | |||||
Total Investment Income | 18,734 | ||||||
Expenses: | |||||||
Advisory Fees (Note B) | 11,275 | ||||||
Custodian Fees (Note F) | 871 | ||||||
Administration Fees (Note C) | 784 | ||||||
Sub Transfer Agency Fees — Class I | 571 | ||||||
Sub Transfer Agency Fees — Class A | 31 | ||||||
Sub Transfer Agency Fees — Class L | — | @ | |||||
Professional Fees | 148 | ||||||
Registration Fees | 73 | ||||||
Shareholder Services Fees — Class A (Note D) | 60 | ||||||
Distribution and Shareholder Services Fees — Class L (Note D) | 2 | ||||||
Distribution and Shareholder Services Fees — Class C (Note D) | — | @ | |||||
Shareholder Reporting Fees | 51 | ||||||
Directors' Fees and Expenses | 25 | ||||||
Transfer Agency Fees — Class I (Note E) | 14 | ||||||
Transfer Agency Fees — Class A (Note E) | 5 | ||||||
Transfer Agency Fees — Class L (Note E) | 2 | ||||||
Transfer Agency Fees — Class C (Note E) | 1 | ||||||
Transfer Agency Fees — Class IS (Note E) | 2 | ||||||
Pricing Fees | 13 | ||||||
Other Expenses | 28 | ||||||
Total Expenses | 13,956 | ||||||
Waiver of Advisory Fees (Note B) | (1,902 | ) | |||||
Reimbursement of Class Specific Expenses — Class I (Note B) | (94 | ) | |||||
Reimbursement of Class Specific Expenses — Class A (Note B) | (1 | ) | |||||
Reimbursement of Class Specific Expenses — Class L (Note B) | (1 | ) | |||||
Reimbursement of Class Specific Expenses — Class C (Note B) | (1 | ) | |||||
Reimbursement of Class Specific Expenses — Class IS (Note B) | (2 | ) | |||||
Rebate from Morgan Stanley Affiliate (Note G) | (27 | ) | |||||
Net Expenses | 11,928 | ||||||
Net Investment Income | 6,806 | ||||||
Realized Gain (Loss): | |||||||
Investments Sold (Net of $151 of Capital Gain Country Tax) | (41,250 | ) | |||||
Foreign Currency Forward Exchange Contracts | 1,704 | ||||||
Foreign Currency Transactions | (1,626 | ) | |||||
Net Realized Loss | (41,172 | ) | |||||
Change in Unrealized Appreciation (Depreciation): | |||||||
Investments (Net of Decrease in Deferred Capital Gain Country Tax of $2,299) | (64,607 | ) | |||||
Foreign Currency Forward Exchange Contracts | (815 | ) | |||||
Foreign Currency Translations | 187 | ||||||
Net Change in Unrealized Appreciation (Depreciation) | (65,235 | ) | |||||
Net Realized Loss and Change in Unrealized Appreciation (Depreciation) | (106,407 | ) | |||||
Net Decrease in Net Assets Resulting from Operations | $ | (99,601 | ) | ||||
@ Amount is less than $500.
The accompanying notes are an integral part of the financial statements.
11
Morgan Stanley Institutional Fund, Inc.
Annual Report — December 31, 2015
Emerging Markets Portfolio
Statements of Changes in Net Assets | Year Ended December 31, 2015 (000) | Year Ended December 31, 2014 (000) | |||||||||
Increase (Decrease) in Net Assets: | |||||||||||
Operations: | |||||||||||
Net Investment Income | $ | 6,806 | $ | 8,096 | |||||||
Net Realized Gain (Loss) | (41,172 | ) | 42,856 | ||||||||
Net Change in Unrealized Appreciation (Depreciation) | (65,235 | ) | (97,002 | ) | |||||||
Net Decrease in Net Assets Resulting from Operations | (99,601 | ) | (46,050 | ) | |||||||
Distributions from and/or in Excess of: | |||||||||||
Class I: | |||||||||||
Net Investment Income | (4,657 | ) | (5,547 | ) | |||||||
Net Realized Gain | — | (32,704 | ) | ||||||||
Class A: | |||||||||||
Net Investment Income | (96 | ) | (129 | ) | |||||||
Net Realized Gain | — | (1,451 | ) | ||||||||
Class L: | |||||||||||
Net Investment Income | (1 | ) | (1 | ) | |||||||
Net Realized Gain | — | (15 | ) | ||||||||
Class C: | |||||||||||
Net Investment Income | (— | @) | — | ||||||||
Class IS: | |||||||||||
Net Investment Income | (2,842 | ) | (3,017 | ) | |||||||
Net Realized Gain | — | (16,464 | ) | ||||||||
Total Distributions | (7,596 | ) | (59,328 | ) | |||||||
Capital Share Transactions:(1) | |||||||||||
Class I: | |||||||||||
Subscribed | 69,057 | 93,404 | |||||||||
Distributions Reinvested | 4,608 | 38,190 | |||||||||
Redeemed | (119,585 | ) | (533,963 | ) | |||||||
Class A: | |||||||||||
Subscribed | 6,118 | 10,567 | |||||||||
Distributions Reinvested | 94 | 1,559 | |||||||||
Redeemed | (11,629 | ) | (18,172 | ) | |||||||
Class L: | |||||||||||
Subscribed | 106 | 127 | |||||||||
Distributions Reinvested | — | @ | 16 | ||||||||
Redeemed | (57 | ) | (101 | ) | |||||||
Class C: | |||||||||||
Subscribed | 12 | * | — | ||||||||
Class IS: | |||||||||||
Subscribed | 38,438 | 354,909 | |||||||||
Distributions Reinvested | 2,841 | 19,481 | |||||||||
Redeemed | (31,338 | ) | (28,889 | ) | |||||||
Net Decrease in Net Assets Resulting from Capital Share Transactions | (41,335 | ) | (62,872 | ) | |||||||
Redemption Fees | 19 | 33 | |||||||||
Total Decrease in Net Assets | (148,513 | ) | (168,217 | ) | |||||||
Net Assets: | |||||||||||
Beginning of Period | 996,477 | 1,164,694 | |||||||||
End of Period (Including Distributions in Excess of Net Investment Income of $(3,288) and $(3,063)) | $ | 847,964 | $ | 996,477 | |||||||
The accompanying notes are an integral part of the financial statements.
12
Morgan Stanley Institutional Fund, Inc.
Annual Report — December 31, 2015
Emerging Markets Portfolio
Statements of Changes in Net Assets (cont'd) | Year Ended December 31, 2015 (000) | Year Ended December 31, 2014 (000) | |||||||||
(1) Capital Share Transactions: | |||||||||||
Class I: | |||||||||||
Shares Subscribed | 3,093 | 3,832 | |||||||||
Shares Issued on Distributions Reinvested | 225 | 1,753 | |||||||||
Shares Redeemed | (5,446 | ) | (22,273 | ) | |||||||
Net Decrease in Class I Shares Outstanding | (2,128 | ) | (16,688 | ) | |||||||
Class A: | |||||||||||
Shares Subscribed | 293 | 438 | |||||||||
Shares Issued on Distributions Reinvested | 5 | 73 | |||||||||
Shares Redeemed | (542 | ) | (766 | ) | |||||||
Net Decrease in Class A Shares Outstanding | (244 | ) | (255 | ) | |||||||
Class L: | |||||||||||
Shares Subscribed | 5 | 5 | |||||||||
Shares Issued on Distributions Reinvested | — | @@ | 1 | ||||||||
Shares Redeemed | (3 | ) | (5 | ) | |||||||
Net Increase in Class L Shares Outstanding | 2 | 1 | |||||||||
Class C: | |||||||||||
Shares Subscribed | 1 | * | — | ||||||||
Class IS: | |||||||||||
Shares Subscribed | 1,728 | 14,962 | |||||||||
Shares Issued on Distributions Reinvested | 139 | 895 | |||||||||
Shares Redeemed | (1,435 | ) | (1,174 | ) | |||||||
Net Increase in Class IS Shares Outstanding | 432 | 14,683 | |||||||||
@ Amount is less than $500.
@@ Amount is less than 500 shares.
* For the period April 30, 2015 through December 31, 2015.
The accompanying notes are an integral part of the financial statements.
13
Morgan Stanley Institutional Fund, Inc.
Annual Report — December 31, 2015
Financial Highlights
Emerging Markets Portfolio
Class I | |||||||||||||||||||||||
Year Ended December 31, | |||||||||||||||||||||||
Selected Per Share Data and Ratios | 2015 | 2014 | 2013 | 2012 | 2011 | ||||||||||||||||||
Net Asset Value, Beginning of Period | $ | 22.13 | $ | 24.64 | $ | 25.94 | $ | 21.73 | $ | 27.14 | |||||||||||||
Income (Loss) from Investment Operations: | |||||||||||||||||||||||
Net Investment Income† | 0.15 | 0.17 | 0.20 | 0.19 | 0.22 | ||||||||||||||||||
Net Realized and Unrealized Gain (Loss) | (2.43 | ) | (1.30 | ) | (0.44 | ) | 4.19 | (5.22 | ) | ||||||||||||||
Total from Investment Operations | (2.28 | ) | (1.13 | ) | (0.24 | ) | 4.38 | (5.00 | ) | ||||||||||||||
Distributions from and/or in Excess of: | |||||||||||||||||||||||
Net Investment Income | (0.17 | ) | (0.20 | ) | (0.20 | ) | (0.17 | ) | — | ||||||||||||||
Net Realized Gain | — | (1.18 | ) | (0.86 | ) | — | (0.41 | ) | |||||||||||||||
Total Distributions | (0.17 | ) | (1.38 | ) | (1.06 | ) | (0.17 | ) | (0.41 | ) | |||||||||||||
Redemption Fees | 0.00 | ‡ | 0.00 | ‡ | 0.00 | ‡ | 0.00 | ‡ | 0.00 | ‡ | |||||||||||||
Net Asset Value, End of Period | $ | 19.68 | $ | 22.13 | $ | 24.64 | $ | 25.94 | $ | 21.73 | |||||||||||||
Total Return++ | (10.33 | )% | (4.47 | )% | (0.80 | )% | 20.19 | % | (18.41 | )% | |||||||||||||
Ratios and Supplemental Data: | |||||||||||||||||||||||
Net Assets, End of Period (Thousands) | $ | 531,194 | $ | 644,537 | $ | 1,128,618 | $ | 1,278,837 | $ | 1,198,857 | |||||||||||||
Ratio of Expenses to Average Net Assets (1) | 1.24 | %+^^ | 1.25 | %+ | 1.24 | %+ | 1.28 | %+^ | 1.48 | %+ | |||||||||||||
Ratio of Expenses to Average Net Assets Excluding Non Operating Expenses | N/A | N/A | 1.24 | %+ | N/A | N/A | |||||||||||||||||
Ratio of Net Investment Income to Average Net Assets (1) | 0.68 | %+ | 0.68 | %+ | 0.79 | %+ | 0.80 | %+^ | 0.86 | %+ | |||||||||||||
Ratio of Rebate from Morgan Stanley Affiliates to Average Net Assets | 0.00 | %§ | 0.00 | %§ | 0.01 | % | 0.01 | % | 0.01 | % | |||||||||||||
Portfolio Turnover Rate | 40 | % | 43 | % | 49 | % | 47 | % | 60 | % | |||||||||||||
(1) Supplemental Information on the Ratios to Average Net Assets: | |||||||||||||||||||||||
Ratios Before Expense Limitation: | |||||||||||||||||||||||
Expenses to Average Net Assets | 1.45 | % | 1.52 | % | 1.51 | % | 1.49 | % | N/A | ||||||||||||||
Net Investment Income to Average Net Assets | 0.47 | % | 0.41 | % | 0.52 | % | 0.59 | % | N/A | ||||||||||||||
† Per share amount is based on average shares outstanding.
‡ Amount is less than $0.005 per share.
++ Calculated based on the net asset value as of the last business day of the period.
+ The Ratios of Expenses and Net Investment Income reflect the rebate of certain Portfolio expenses in connection with the investments in Morgan Stanley affiliates during the period. The effect of the rebate on the ratios is disclosed in the above table as "Ratio of Rebate from Morgan Stanley Affiliates to Average Net Assets."
^^ Effective September 30, 2015, the Adviser has agreed to limit the ratio of expenses to average net assets to the maximum ratio of 1.20% for Class I shares. Prior to September 30, 2015, the maximum ratio was 1.25% for Class I shares.
^ Effective March 1, 2012, the Adviser has agreed to limit the ratio of expenses to average net assets to the maximum ratio of 1.25% for Class I shares. Prior to March 1, 2012, the maximum ratio was 1.65% for Class I shares.
§ Amount is less than 0.005%.
The accompanying notes are an integral part of the financial statements.
14
Morgan Stanley Institutional Fund, Inc.
Annual Report — December 31, 2015
Financial Highlights
Emerging Markets Portfolio
Class A | |||||||||||||||||||||||
Year Ended December 31, | |||||||||||||||||||||||
Selected Per Share Data and Ratios | 2015 | 2014 | 2013 | 2012 | 2011 | ||||||||||||||||||
Net Asset Value, Beginning of Period | $ | 21.57 | $ | 24.02 | $ | 25.31 | $ | 21.20 | $ | 26.56 | |||||||||||||
Income (Loss) from Investment Operations: | |||||||||||||||||||||||
Net Investment Income† | 0.07 | 0.11 | 0.12 | 0.14 | 0.15 | ||||||||||||||||||
Net Realized and Unrealized Gain (Loss) | (2.36 | ) | (1.28 | ) | (0.42 | ) | 4.07 | (5.10 | ) | ||||||||||||||
Total from Investment Operations | (2.29 | ) | (1.17 | ) | (0.30 | ) | 4.21 | (4.95 | ) | ||||||||||||||
Distributions from and/or in Excess of: | |||||||||||||||||||||||
Net Investment Income | (0.09 | ) | (0.10 | ) | (0.13 | ) | (0.10 | ) | — | ||||||||||||||
Net Realized Gain | — | (1.18 | ) | (0.86 | ) | — | (0.41 | ) | |||||||||||||||
Total Distributions | (0.09 | ) | (1.28 | ) | (0.99 | ) | (0.10 | ) | (0.41 | ) | |||||||||||||
Redemption Fees | 0.00 | ‡ | 0.00 | ‡ | 0.00 | ‡ | 0.00 | ‡ | 0.00 | ‡ | |||||||||||||
Net Asset Value, End of Period | $ | 19.19 | $ | 21.57 | $ | 24.02 | $ | 25.31 | $ | 21.20 | |||||||||||||
Total Return++ | (10.63 | )% | (4.77 | )% | (1.07 | )% | 19.87 | % | (18.63 | )% | |||||||||||||
Ratios and Supplemental Data: | |||||||||||||||||||||||
Net Assets, End of Period (Thousands) | $ | 19,065 | $ | 26,701 | $ | 35,863 | $ | 40,824 | $ | 46,521 | |||||||||||||
Ratio of Expenses to Average Net Assets (1) | 1.56 | %+^^^ | 1.57 | %+ | 1.52 | %+^^ | 1.53 | %+^ | 1.73 | %+ | |||||||||||||
Ratio of Expenses to Average Net Assets Excluding Non Operating Expenses | N/A | N/A | 1.52 | %+^^ | N/A | N/A | |||||||||||||||||
Ratio of Net Investment Income to Average Net Assets (1) | 0.34 | %+ | 0.45 | %+ | 0.49 | %+ | 0.61 | %+^ | 0.61 | %+ | |||||||||||||
Ratio of Rebate from Morgan Stanley Affiliates to Average Net Assets | 0.00 | %§ | 0.00 | %§ | 0.01 | % | 0.01 | % | 0.01 | % | |||||||||||||
Portfolio Turnover Rate | 40 | % | 43 | % | 49 | % | 47 | % | 60 | % | |||||||||||||
(1) Supplemental Information on the Ratios to Average Net Assets: | |||||||||||||||||||||||
Ratios Before Expense Limitation: | |||||||||||||||||||||||
Expenses to Average Net Assets | 1.76 | % | 1.82 | % | 1.78 | % | 1.74 | % | N/A | ||||||||||||||
Net Investment Income to Average Net Assets | 0.14 | % | 0.20 | % | 0.23 | % | 0.40 | % | N/A | ||||||||||||||
† Per share amount is based on average shares outstanding.
‡ Amount is less than $0.005 per share.
++ Calculated based on the net asset value which does not reflect sales charges, if applicable, as of the last business day of the period.
+ The Ratios of Expenses and Net Investment Income reflect the rebate of certain Portfolio expenses in connection with the investments in Morgan Stanley affiliates during the period. The effect of the rebate on the ratios is disclosed in the above table as "Ratio of Rebate from Morgan Stanley Affiliates to Average Net Assets."
^^^ Effective September 30, 2015, the Adviser has agreed to limit the ratio of expenses to average net assets to the maximum ratio of 1.55% for Class A shares. Prior to September 30, 2015, the maximum ratio was 1.60% for Class A shares.
^^ Effective September 16, 2013, the Adviser has agreed to limit the ratio of expenses to average net assets to the maximum ratio of 1.60% for Class A shares. Prior to September 16, 2013, the maximum ratio was 1.50% for Class A shares.
^ Effective March 1, 2012, the Adviser has agreed to limit the ratio of expenses to average net assets to the maximum ratio of 1.50% for Class A shares. Prior to March 1, 2012, the maximum ratio was 1.90% for Class A shares.
§ Amount is less than 0.005%.
The accompanying notes are an integral part of the financial statements.
15
Morgan Stanley Institutional Fund, Inc.
Annual Report — December 31, 2015
Financial Highlights
Emerging Markets Portfolio
Class L | |||||||||||||||||||
Year Ended December 31, | Period from April 27, 2012^ to | ||||||||||||||||||
Selected Per Share Data and Ratios | 2015 | 2014 | 2013 | December 31, 2012 | |||||||||||||||
Net Asset Value, Beginning of Period | $ | 21.39 | $ | 23.91 | $ | 25.27 | $ | 23.85 | |||||||||||
Income (Loss) from Investment Operations: | |||||||||||||||||||
Net Investment Income (Loss)† | (0.04 | ) | (0.05 | ) | (0.05 | ) | 0.04 | ||||||||||||
Net Realized and Unrealized Gain (Loss) | (2.33 | ) | (1.23 | ) | (0.37 | ) | 1.44 | ||||||||||||
Total from Investment Operations | (2.37 | ) | (1.28 | ) | (0.42 | ) | 1.48 | ||||||||||||
Distributions from and/or in Excess of: | |||||||||||||||||||
Net Investment Income | (0.04 | ) | (0.06 | ) | (0.08 | ) | (0.06 | ) | |||||||||||
Net Realized Gain | — | (1.18 | ) | (0.86 | ) | — | |||||||||||||
Total Distributions | (0.04 | ) | (1.24 | ) | (0.94 | ) | (0.06 | ) | |||||||||||
Redemption Fees | 0.00 | ‡ | 0.00 | ‡ | 0.00 | ‡ | 0.00 | ‡ | |||||||||||
Net Asset Value, End of Period | $ | 18.98 | $ | 21.39 | $ | 23.91 | $ | 25.27 | |||||||||||
Total Return++ | (11.11 | )% | (5.26 | )% | (1.56 | )% | 6.20 | %# | |||||||||||
Ratios and Supplemental Data: | |||||||||||||||||||
Net Assets, End of Period (Thousands) | $ | 226 | $ | 210 | $ | 203 | $ | 11 | |||||||||||
Ratio of Expenses to Average Net Assets (1) | 2.09 | %+^^^ | 2.10 | %+ | 2.03 | %+^^ | 1.99 | %+* | |||||||||||
Ratio of Expenses to Average Net Assets Excluding Non Operating Expenses | N/A | N/A | 2.03 | %+^^ | N/A | ||||||||||||||
Ratio of Net Investment Income (Loss) to Average Net Assets (1) | (0.19 | )%+ | (0.21 | )%+ | (0.18 | )%+ | 0.27 | %+* | |||||||||||
Ratio of Rebate from Morgan Stanley Affiliates to Average Net Assets | 0.00 | %§ | 0.00 | %§ | 0.01 | % | 0.01 | %* | |||||||||||
Portfolio Turnover Rate | 40 | % | 43 | % | 49 | % | 47 | %# | |||||||||||
(1) Supplemental Information on the Ratios to Average Net Assets: | |||||||||||||||||||
Ratios Before Expense Limitation: | |||||||||||||||||||
Expenses to Average Net Assets | 2.78 | % | 2.97 | % | 2.54 | % | 2.28 | %* | |||||||||||
Net Investment Loss to Average Net Assets | (0.88 | )% | (1.08 | )% | (0.69 | )% | (0.02 | )%* | |||||||||||
^ Commencement of Offering.
† Per share amount is based on average shares outstanding.
‡ Amount is less than $0.005 per share.
++ Calculated based on the net asset value as of the last business day of the period.
+ The Ratios of Expenses and Net Investment Income (Loss) reflect the rebate of certain Portfolio expenses in connection with the investments in Morgan Stanley affiliates during the period. The effect of the rebate on the ratios is disclosed in the above table as "Ratio of Rebate from Morgan Stanley Affiliates to Average Net Assets."
^^^ Effective September 30, 2015, the Adviser has agreed to limit the ratio of expenses to average net assets to the maximum ratio of 2.05% for Class L shares. Prior to September 30, 2015, the maximum ratio was 2.10% for Class L shares.
^^ Effective September 16, 2013, the Adviser has agreed to limit the ratio of expenses to average net assets to the maximum ratio of 2.10% for Class L shares. Prior to September 16, 2013, the maximum ratio was 2.00% for Class L shares.
§ Amount is less than 0.005%.
# Not Annualized.
* Annualized.
The accompanying notes are an integral part of the financial statements.
16
Morgan Stanley Institutional Fund, Inc.
Annual Report — December 31, 2015
Financial Highlights
Emerging Markets Portfolio
Class C | |||||||
Selected Per Share Data and Ratios | Period from April 30, 2015^ to December 31, 2015 | ||||||
Net Asset Value, Beginning of Period | $ | 23.16 | |||||
Loss from Investment Operations: | |||||||
Net Investment Loss† | (0.03 | ) | |||||
Net Realized and Unrealized Gain | (4.14 | ) | |||||
Total from Investment Operations | (4.17 | ) | |||||
Distributions from and/or in Excess of: | |||||||
Net Investment Income | (0.04 | ) | |||||
Redemption Fees | 0.00 | ‡ | |||||
Net Asset Value, End of Period | $ | 18.95 | |||||
Total Return++ | (18.03 | )%# | |||||
Ratios and Supplemental Data: | |||||||
Net Assets, End of Period (Thousands) | $ | 10 | |||||
Ratios of Expenses to Average Net Assets (1) | 2.33 | %+^^* | |||||
Ratio of Net Investment Loss to Average Net Assets (1) | (0.23 | )%+* | |||||
Ratio of Rebate from Morgan Stanley Affiliates to Average Net Assets | 0.00 | %§* | |||||
Portfolio Turnover Rate | 40 | % | |||||
(1) Supplemental Information on the Ratios to Average Net Assets: | |||||||
Ratios Before Expense Limitation: | |||||||
Expense to Average Net Assets | 22.89 | %* | |||||
Net Investment Loss to Average Net Assets | (20.79 | )%* | |||||
^ Commencement of Offering.
† Per share amount is based on average shares outstanding.
‡ Amount is less than $0.005 per share.
++ Calculated based on the net asset value which does not reflect sales charges, if applicable, as of the last business day of the period.
+ The Ratios of Expenses and Net Investment Loss reflect the rebate of certain Portfolio expenses in connection with the investments in Morgan Stanley affiliates during the period. The effect of the rebate on the ratios is disclosed in the above table as "Ratio of Rebate from Morgan Stanley Affiliates to Average Net Assets."
^^ Effective September 30, 2015, the Adviser has agreed to limit the ratio of expenses to average net assets to the maximum ratio of 2.30% for Class C shares. Prior to September 30, 2015, the maximum ratio was 2.35% for Class C shares.
§ Amount is less than 0.005%.
# Not Annualized.
* Annualized.
The accompanying notes are an integral part of the financial statements.
17
Morgan Stanley Institutional Fund, Inc.
Annual Report — December 31, 2015
Financial Highlights
Emerging Markets Portfolio
Class IS | |||||||||||||||
Year Ended December 31, | Period from September 13, 2013^ to | ||||||||||||||
Selected Per Share Data and Ratios | 2015 | 2014 | December 31, 2013 | ||||||||||||
Net Asset Value, Beginning of Period | $ | 22.14 | $ | 24.64 | $ | 24.92 | |||||||||
Income (Loss) from Investment Operations: | |||||||||||||||
Net Investment Income (Loss)† | 0.17 | 0.22 | (0.01 | ) | |||||||||||
Net Realized and Unrealized Gain (Loss) | (2.44 | ) | (1.32 | ) | 0.46 | ||||||||||
Total from Investment Operations | (2.27 | ) | (1.10 | ) | 0.45 | ||||||||||
Distributions from and/or in Excess of: | |||||||||||||||
Net Investment Income | (0.19 | ) | (0.22 | ) | (0.14 | ) | |||||||||
Net Realized Gain | — | (1.18 | ) | (0.59 | ) | ||||||||||
Total Distributions | (0.19 | ) | (1.40 | ) | (0.73 | ) | |||||||||
Redemption Fees | 0.00 | ‡ | 0.00 | ‡ | 0.00 | ‡ | |||||||||
Net Asset Value, End of Period | $ | 19.68 | $ | 22.14 | $ | 24.64 | |||||||||
Total Return++ | (10.29 | )% | (4.36 | )% | 1.85 | %# | |||||||||
Ratios and Supplemental Data: | |||||||||||||||
Net Assets, End of Period (Thousands) | $ | 297,469 | $ | 325,029 | $ | 10 | |||||||||
Ratio of Expenses to Average Net Assets (1) | 1.16 | %+^^^ | 1.18 | %+ | 1.17 | %+^^* | |||||||||
Ratio of Expenses to Average Net Assets Excluding Non Operating Expenses | N/A | N/A | 1.17 | %+^^* | |||||||||||
Ratio of Net Investment Income (Loss) to Average Net Assets (1) | 0.75 | %+ | 0.89 | %+ | (0.21 | )%+* | |||||||||
Ratio of Rebate from Morgan Stanley Affiliates to Average Net Assets | 0.00 | %§ | 0.00 | %§ | 0.01 | %* | |||||||||
Portfolio Turnover Rate | 40 | % | 43 | % | 49 | %# | |||||||||
(1) Supplemental Information on the Ratios to Average Net Assets: | |||||||||||||||
Ratios Before Expense Limitation: | |||||||||||||||
Expenses to Average Net Assets | 1.35 | % | 1.42 | % | 6.65 | %* | |||||||||
Net Investment Income (Loss) to Average Net Assets | 0.56 | % | 0.65 | % | (5.69 | )%* | |||||||||
^ Commencement of Offering.
† Per share amount is based on average shares outstanding.
‡ Amount is less than $0.005 per share.
++ Calculated based on the net asset value as of the last business day of the period.
+ The Ratios of Expenses and Net Investment Income (Loss) reflect the rebate of certain Portfolio expenses in connection with the investments in Morgan Stanley affiliates during the period. The effect of the rebate on the ratios is disclosed in the above table as "Ratio of Rebate from Morgan Stanley Affiliates to Average Net Assets."
^^^ Effective September 30, 2015, the Adviser has agreed to limit the ratio of expenses to average net assets to the maximum ratio of 1.10% for Class IS shares. Prior to September 30, 2015, the maximum ratio was 1.18% for Class IS shares.
^^ Effective September 16, 2013, the Adviser has agreed to limit the ratio of expenses to average net assets to the maximum ratio of 1.18% for Class IS shares.
§ Amount is less than 0.005%.
# Not Annualized.
* Annualized.
The accompanying notes are an integral part of the financial statements.
18
Morgan Stanley Institutional Fund, Inc.
Annual Report — December 31, 2015
Notes to Financial Statements
Morgan Stanley Institutional Fund, Inc. (the "Fund") is registered under the Investment Company Act of 1940, as amended (the "Act"), as an open-end management investment company. The Fund is comprised of twenty-six separate, active, diversified and non-diversified portfolios (individually referred to as a "Portfolio", collectively as the "Portfolios"). The Fund applies investment company accounting and reporting guidance.
The accompanying financial statements relate to the Emerging Markets Portfolio. The Portfolio's adviser, Morgan Stanley Investment Management Inc. (the "Adviser") and sub-advisers, Morgan Stanley Investment Management Limited ("MSIM Limited") and Morgan Stanley Investment Management Company ("MSIM Company") (together, the "Sub-Advisers"), seek long-term capital appreciation by investing primarily in growth-oriented equity securities of issuers in emerging market countries.
The Portfolio offers five classes of shares — Class I, Class A, Class L, Class C and Class IS. On April 30, 2015, the Portfolio commenced offering Class C shares and suspended offering of Class L shares. Existing Class L shareholders may invest through reinvestment of dividends and distributions.
A. Significant Accounting Policies: The following significant accounting policies are in conformity with U.S. generally accepted accounting principles ("GAAP"). Such policies are consistently followed by the Fund in the preparation of its financial statements. GAAP may require management to make estimates and assumptions that affect the reported amounts and disclosures in the financial statements. Actual results may differ from those estimates.
1. Security Valuation: (1) An equity portfolio security listed or traded on an exchange is valued at its latest reported sales price (or at the exchange official closing price if such exchange reports an official closing price), if there were no sales on a given day, the security is valued at the mean between the last reported bid and asked prices; (2) all other equity portfolio securities for which over-the-counter ("OTC") market quotations are readily available are valued at its latest reported sales price. In cases where a security is traded on more than one exchange, the security is valued on the exchange designated as the primary market; (3) when market quotations are not readily available, including circumstances under which the Adviser or Sub-Advisers determine that the closing price, last sale price or the mean between the last reported bid and asked prices
are not reflective of a security's market value, portfolio securities are valued at their fair value as determined in good faith under procedures established by and under the general supervision of the Fund's Board of Directors (the "Directors"). Occasionally, developments affecting the closing prices of securities and other assets may occur between the times at which valuations of such securities are determined (that is, close of the foreign market on which the securities trade) and the close of business of the New York Stock Exchange ("NYSE"). If developments occur during such periods that are expected to materially affect the value of such securities, such valuations may be adjusted to reflect the estimated fair value of such securities as of the close of the NYSE, as determined in good faith by the Directors or by the Adviser using a pricing service and/or procedures approved by the Directors; (4) quotations of foreign portfolio securities, other assets and liabilities and forward contracts stated in foreign currency are translated into U.S. dollar equivalents at the prevailing market rates prior to the close of the NYSE; (5) investments in mutual funds, including the Morgan Stanley Institutional Liquidity Funds, are valued at the net asset value ("NAV") as of the close of each business day; and (6) short-term debt securities with remaining maturities of 60 days or less at the time of purchase may be valued at amortized cost, unless the Adviser determines such valuation does not reflect the securities' market value, in which case these securities will be valued at their fair market value determined by the Adviser.
The Directors have responsibility for determining in good faith the fair value of the investments, and the Directors may appoint others, such as the Fund's Adviser or a valuation committee, to assist the Directors in determining fair value and to make the actual calculations pursuant to the fair valuation methodologies previously approved by the Directors. Under procedures approved by the Directors, the Fund's Adviser has formed a Valuation Committee whose members are approved by the Directors. The Valuation Committee provides administration and oversight of the Fund's valuation policies and procedures, which are reviewed at least annually by the Directors. These procedures allow the Fund to utilize independent pricing services, quotations from securities and financial instrument dealers, and other market sources to determine fair value.
19
Morgan Stanley Institutional Fund, Inc.
Annual Report — December 31, 2015
Notes to Financial Statements (cont'd)
The Fund has procedures to determine the fair value of securities and other financial instruments for which market prices are not readily available. Under these procedures, the Valuation Committee convenes on a regular and ad hoc basis to review such securities and considers a number of factors, including valuation methodologies and significant unobservable valuation inputs, when arriving at fair value. The Valuation Committee may employ a market-based approach which may use related or comparable assets or liabilities, recent transactions, market multiples, book values, and other relevant information for the investment to determine the fair value of the investment. An income-based valuation approach may also be used in which the anticipated future cash flows of the investment are discounted to calculate fair value. Discounts may also be applied due to the nature or duration of any restrictions on the disposition of the investments. Due to the inherent uncertainty of valuations of such investments, the fair values may differ significantly from the values that would have been used had an active market existed. The Valuation Committee employs various methods for calibrating these valuation approaches including a regular review of valuation methodologies, key inputs and assumptions, transactional back-testing or disposition analysis, and reviews of any related market activity.
2. Fair Value Measurement: Financial Accounting Standards Board ("FASB") Accounting Standards CodificationTM ("ASC") 820, "Fair Value Measurement" ("ASC 820"), defines fair value as the value that the Fund would receive to sell an investment or pay to transfer a liability in a timely transaction with an independent buyer in the principal market, or in the absence of a principal market the most advantageous market for the investment or liability. ASC 820 establishes a three-tier hierarchy to distinguish between (1) inputs that reflect the assumptions market participants would use in valuing an asset or liability developed based on market data obtained from sources independent of the reporting entity (observable inputs) and (2) inputs that reflect the reporting entity's own assumptions about the assumptions market participants would use in valuing an asset or liability developed based on the best information available in the circumstances (unobservable inputs) and to establish classification of fair value measurements for disclosure purposes. Various inputs are used in determining the value of the Fund's
investments. The inputs are summarized in the three broad levels listed below.
• Level 1 – unadjusted quoted prices in active markets for identical investments
• Level 2 – other significant observable inputs (including quoted prices for similar investments, interest rates, prepayment speeds, credit risk, etc.)
• Level 3 – significant unobservable inputs including the Fund's own assumptions in determining the fair value of investments. Factors considered in making this determination may include, but are not limited to, information obtained by contacting the issuer, analysts, or the appropriate stock exchange (for exchange-traded securities), analysis of the issuer's financial statements or other available documents and, if necessary, available information concerning other securities in similar circumstances
The inputs or methodology used for valuing securities are not necessarily an indication of the risk associated with investing in those securities and the determination of the significance of a particular input to the fair value measurement in its entirety requires judgment and considers factors specific to each security.
The following is a summary of the inputs used to value the Portfolio's investments as of December 31, 2015.
Investment Type | Level 1 Unadjusted quoted prices (000) | Level 2 Other significant observable inputs (000) | Level 3 Significant unobservable inputs (000) | Total (000) | |||||||||||||||
Assets: | |||||||||||||||||||
Common Stocks | |||||||||||||||||||
| Aerospace & Defense | $ | — | $ | 5,540 | $ | — | $ | 5,540 | |||||||||||
Airlines | 1,919 | — | — | 1,919 | |||||||||||||||
Automobiles | — | 17,673 | — | 17,673 | |||||||||||||||
Banks | 21,904 | 121,571 | — | 143,475 | |||||||||||||||
Beverages | 18,421 | 1,189 | — | 19,610 | |||||||||||||||
Chemicals | 4,719 | 7,635 | — | 12,354 | |||||||||||||||
| Construction & Engineering | — | 9,307 | — | 9,307 | |||||||||||||||
| Construction Materials | 9,863 | 14,130 | — | 23,993 | |||||||||||||||
Consumer Finance | — | 8,380 | — | 8,380 | |||||||||||||||
20
Morgan Stanley Institutional Fund, Inc.
Annual Report — December 31, 2015
Notes to Financial Statements (cont'd)
Investment Type | Level 1 Unadjusted quoted prices (000) | Level 2 Other significant observable inputs (000) | Level 3 Significant unobservable inputs (000) | Total (000) | |||||||||||||||
Common Stocks (cont'd) | |||||||||||||||||||
| Diversified Consumer Services | $ | 4,581 | $ | — | $ | — | $ | 4,581 | |||||||||||
| Diversified Financial Services | — | 19,913 | — | 19,913 | |||||||||||||||
| Diversified Telecommunication Services | — | 12,359 | — | 12,359 | |||||||||||||||
| Electronic Equipment, Instruments & Components | — | 15,856 | — | 15,856 | |||||||||||||||
| Food & Staples Retailing | — | 18,898 | — | 18,898 | |||||||||||||||
Food Products | — | 27,467 | — | 27,467 | |||||||||||||||
| Health Care Providers & Services | — | 4,219 | — | 4,219 | |||||||||||||||
| Hotels, Restaurants & Leisure | 5,450 | 5,701 | — | 11,151 | |||||||||||||||
Household Durables | 7,797 | 12,084 | — | 19,881 | |||||||||||||||
| Independent Power Producers & Energy Traders | — | 2,330 | — | 2,330 | |||||||||||||||
| Industrial Conglomerates | 7,573 | 21,531 | — | 29,104 | |||||||||||||||
Insurance | — | 26,975 | — | 26,975 | |||||||||||||||
| Internet & Catalog Retail | 5,562 | — | — | 5,562 | |||||||||||||||
| Internet Software & Services | 18,410 | 47,531 | — | 65,941 | |||||||||||||||
Machinery | 2,434 | 12,347 | — | 14,781 | |||||||||||||||
Media | — | 18,875 | — | 18,875 | |||||||||||||||
Multi-line Retail | 3,926 | 12,534 | — | 16,460 | |||||||||||||||
| Oil, Gas & Consumable Fuels | — | 20,905 | — | 20,905 | |||||||||||||||
| Paper & Forest Products | — | 8,448 | — | 8,448 | |||||||||||||||
Personal Products | — | 18,938 | — | 18,938 | |||||||||||||||
Pharmaceuticals | — | 15,194 | 3,114 | 18,308 | |||||||||||||||
Professional Services | — | 5,850 | — | 5,850 | |||||||||||||||
| Real Estate Management & Development | — | 9,431 | — | 9,431 | |||||||||||||||
Road & Rail | — | 3,834 | — | 3,834 | |||||||||||||||
| Semiconductors & Semiconductor Equipment | 353 | 30,535 | — | 30,888 | |||||||||||||||
Software | — | 5,535 | — | 5,535 | |||||||||||||||
Specialty Retail | — | 4,964 | — | 4,964 | |||||||||||||||
| Tech Hardware, Storage & Peripherals | — | 53,648 | — | 53,648 | |||||||||||||||
| Textiles, Apparel & Luxury Goods | — | 31,537 | — | 31,537 | |||||||||||||||
| Trading Companies & Distributors | — | 2,593 | — | 2,593 | |||||||||||||||
Investment Type | Level 1 Unadjusted quoted prices (000) | Level 2 Other significant observable inputs (000) | Level 3 Significant unobservable inputs (000) | Total (000) | |||||||||||||||
Common Stocks (cont'd) | |||||||||||||||||||
| Transportation Infrastructure | $ | — | $ | 6,361 | $ | — | $ | 6,361 | |||||||||||
| Wireless Telecommunication Services | — | 46,221 | — | 46,221 | |||||||||||||||
Total Common Stocks | 112,912 | 708,039 | 3,114 | 824,065 | |||||||||||||||
Investment Company | — | 4,373 | — | 4,373 | |||||||||||||||
Right | — | 16 | — | 16 | |||||||||||||||
| Short-Term Investments | |||||||||||||||||||
Investment Company | 43,038 | — | — | 43,038 | |||||||||||||||
| Repurchase Agreements | — | 3,840 | — | 3,840 | |||||||||||||||
| Total Short-Term Investments | 43,038 | 3,840 | — | 46,878 | |||||||||||||||
| Foreign Currency Forward Exchange Contract | — | 124 | — | 124 | |||||||||||||||
Total Assets | $ | 155,950 | $ | 716,392 | $ | 3,114 | $ | 875,456 | |||||||||||
Transfers between investment levels may occur as the markets fluctuate and/or the availability of data used in an investment's valuation changes. The Portfolio recognizes transfers between the levels as of the end of the period. As of December 31, 2015, securities with a total value of approximately $3,114,000 transferred from Level 2 to Level 3. Securities that were valued using other significant observable inputs at December 31, 2014 were valued using significant unobservable inputs at December 31, 2015. At December 31, 2015, the fair value of certain securities were adjusted due to developments which occurred between the time of the close of the foreign markets on which they trade and the close of business on the NYSE which resulted in their level 2 classification.
21
Morgan Stanley Institutional Fund, Inc.
Annual Report — December 31, 2015
Notes to Financial Statements (cont'd)
Following is a reconciliation of investments in which significant unobservable inputs (Level 3) were used in determining fair value.
| Common Stock (000) | |||||||
Beginning Balance | $ | — | |||||
Purchases | — | ||||||
Sales | — | ||||||
Amortization of discount | — | ||||||
Transfers in | 3,114 | ||||||
Transfers out | — | ||||||
Corporate actions | — | ||||||
Change in unrealized appreciation (depreciation) | — | ||||||
Realized gains (losses) | — | ||||||
Ending Balance | $ | 3,114 | |||||
| Net change in unrealized appreciation (depreciation) from investments still held as of December 31, 2015 | $ | — | |||||
The following table presents additional information about valuation techniques and inputs used for investments that are measured at fair value and categorized within Level 3 as of December 31, 2015. Various valuation techniques were used in the valuation of certain investments and weighted based on the level of significance.
| Fair Value at December 31, 2015 (000) | Valuation Technique | Unobservable Input | Range | Selected Value | Impact to Valuation from an Increase in Input | ||||||||||||||||||||||||||
Pharmaceuticals | |||||||||||||||||||||||||||||||
Common Stock | $ | 3,114 | Market Transaction Method | Precedent Transaction | $ | 0.23 | $ | 0.23 | $ | 0.23 | Increase | ||||||||||||||||||||
Discounted Cash Flow | Weighted Average Cost of Capital | 16.5 | % | 16.5 | % | 16.5 | % | Decrease | |||||||||||||||||||||||
| Long-Term Growth Rate | 2.0 | % | 3.0 | % | 2.5 | % | Increase | ||||||||||||||||||||||||
| Market Comparable Companies | Enterprise Value/ EBITDA | 11.5 | x | 15.8 | x | 11.5 | x | Increase | |||||||||||||||||||||||
| Discount for Lack of Marketability/Company Specific Risk | 30.0 | % | 30.0 | % | 30.0 | % | Decrease | ||||||||||||||||||||||||
3. Repurchase Agreements: The Portfolio may enter into repurchase agreements under which the Portfolio lends cash and takes possession of securities with an agreement that the counterparty will repurchase such securities. In connection with transactions in repurchase agreements, a bank as custodian for the Portfolio takes possession of the underlying securities which are held as collateral, with a market value at least equal to the amount of the repurchase transaction, including principal and accrued interest. To the extent that any repurchase transaction exceeds one business day, the value of the collateral is marked-to-market on a daily basis to determine that the
value of the collateral does not decrease below the repurchase price plus accrued interest as earned. If such a decrease occurs, additional collateral will be requested and, when received, will be added to the account to maintain full collateralization. In the event of default on the obligation to repurchase, the Portfolio has the right to liquidate the collateral and apply the proceeds in satisfaction of the obligation. In the event of default or bankruptcy by the counterparty to the agreement, realization of the collateral proceeds may be subject to cost and delays. The Portfolio, along with other affiliated investment companies, may
22
Morgan Stanley Institutional Fund, Inc.
Annual Report — December 31, 2015
Notes to Financial Statements (cont'd)
utilize a joint trading account for the purpose of entering into repurchase agreements.
4. Foreign Currency Translation and Foreign Investments: The books and records of the Portfolio are maintained in U.S. dollars. Foreign currency amounts are translated into U.S. dollars as follows:
– investments, other assets and liabilities at the prevailing rate of exchange on the valuation date;
– investment transactions and investment income at the prevailing rates of exchange on the dates of such transactions.
Although the net assets of the Portfolio are presented at the foreign exchange rates and market values at the close of the period, the Portfolio does not isolate that portion of the results of operations arising as a result of changes in the foreign exchange rates from the fluctuations arising from changes in the market prices of securities held at period end. Similarly, the Portfolio does not isolate the effect of changes in foreign exchange rates from the fluctuations arising from changes in the market prices of securities sold during the period. Accordingly, realized and unrealized foreign currency gains (losses) on investments in securities are included in the reported net realized and unrealized gains (losses) on investment transactions and balances. However, pursuant to U.S. Federal income tax regulations, gains and losses from certain foreign currency transactions and the foreign currency portion of gains and losses realized on sales and maturities of foreign denominated debt securities are treated as ordinary income for U.S. Federal income tax purposes.
Net realized gains (losses) on foreign currency transactions represent net foreign exchange gains (losses) from foreign currency forward exchange contracts, disposition of foreign currencies, currency gains (losses) realized between the trade and settlement dates on securities transactions, and the difference between the amount of investment income and foreign withholding taxes recorded on the Portfolio's books and the U.S. dollar equivalent amounts actually received or paid. Net unrealized currency gains (losses) from valuing foreign currency denominated assets and liabilities at period end exchange rates are reflected as a component of unrealized appreciation (depreciation) in the Statement of Assets and Liabilities. The change in unrealized currency
gains (losses) on foreign currency translations for the period is reflected in the Statement of Operations.
Foreign security and currency transactions may involve certain considerations and risks not typically associated with those of U.S. dollar denominated transactions as a result of, among other factors, fluctuations of exchange rates in relation to the U.S. dollar, the possibility of lower levels of governmental supervision and regulation of foreign securities markets and the possibility of political or economic instability.
Governmental approval for foreign investments may be required in advance of making an investment under certain circumstances in some countries, and the extent of foreign investments in domestic companies may be subject to limitation in other countries. Foreign ownership limitations also may be imposed by the charters of individual companies to prevent, among other concerns, violations of foreign investment limitations. As a result, an additional class of shares (identified as "Foreign" in the Portfolio of Investments) may be created and offered for investment. The "local" and "foreign shares" market values may differ. In the absence of trading of the foreign shares in such markets, the Portfolio values the foreign shares at the closing exchange price of the local shares.
5. Derivatives: The Portfolio may, but is not required to, use derivative instruments for a variety of purposes, including hedging, risk management, portfolio management or to earn income. Derivatives are financial instruments whose value is based, in part, on the value of an underlying asset, interest rate, index or financial instrument. Prevailing interest rates and volatility levels, among other things, also affect the value of derivative instruments. A derivative instrument often has risks similar to its underlying asset and may have additional risks, including imperfect correlation between the value of the derivative and the underlying asset, risks of default by the counterparty to certain transactions, magnification of losses incurred due to changes in the market value of the securities, instruments, indices or interest rates to which the derivative instrument relates, risks that the transactions may not be liquid and risks arising from margin requirements. The use of derivatives involves risks that are different from, and possibly greater than, the risks associated with other portfolio investments. Derivatives may involve the use of highly specialized instruments that require investment techniques and risk analyses different from
23
Morgan Stanley Institutional Fund, Inc.
Annual Report — December 31, 2015
Notes to Financial Statements (cont'd)
those associated with other portfolio investments. All of the Portfolio's holdings, including derivative instruments, are marked-to-market each day with the change in value reflected in unrealized appreciation (depreciation). Upon disposition, a realized gain or loss is recognized.
Certain derivative transactions may give rise to a form of leverage. Leverage magnifies the potential for gain and the risk of loss. Leverage associated with derivative transactions may cause the Portfolio to liquidate portfolio positions when it may not be advantageous to do so to satisfy its obligations or to meet earmarking or segregation requirements, pursuant to applicable Securities and Exchange Commission rules and regulations, or may cause the Portfolio to be more volatile than if the Portfolio had not been leveraged. Although the Adviser and/or Sub-Adviser seek to use derivatives to further the Portfolio's investment objectives, there is no assurance that the use of derivatives will achieve this result.
Following is a description of the derivative instruments and techniques that the Portfolio used during the period and their associated risks:
Foreign Currency Forward Exchange Contracts: In connection with its investments in foreign securities, the Portfolio also entered into contracts with banks, brokers or dealers to purchase or sell securities or foreign currencies at a future date. A foreign currency forward exchange contract ("currency contract") is a negotiated agreement between the contracting parties to exchange a specified amount of currency at a specified future time at a specified rate. The rate can be higher or lower than the spot rate between the currencies that are the subject of the contract. Currency contracts may be used to protect against uncertainty in the level of future foreign currency exchange rates or to gain or modify exposure to a particular currency. To the extent hedged by the use of currency contracts, the precise matching of the currency contract amounts and the value of the securities involved will not generally be possible because the future value of such securities in foreign currencies will change as a consequence of market movements in the value of those securities between the date on which the contract is entered into and the date it matures. Furthermore, such transactions may reduce or preclude the opportunity for gain if the value of the currency should move in the direction opposite to the position taken. There is additional risk to the extent that currency contracts
create exposure to currencies in which the Portfolio's securities are not denominated. Unanticipated changes in currency prices may result in poorer overall performance for the Portfolio than if it had not entered into such contracts. The use of currency contracts involves the risk of loss from the insolvency or bankruptcy of the counterparty to the contract or the failure of the counterparty to make payments or otherwise comply with the terms of the contract. A currency contract is marked-to-market daily and the change in market value is recorded by the Portfolio as unrealized gain or loss. The Portfolio records realized gains (losses) when the currency contract is closed equal to the difference between the value of the currency contract at the time it was opened and the value at the time it was closed.
FASB ASC 815, "Derivatives and Hedging" ("ASC 815"), is intended to improve financial reporting about derivative instruments by requiring enhanced disclosures to enable investors to better understand how and why the Portfolio uses derivative instruments, how these derivative instruments are accounted for and their effects on the Portfolio's financial position and results of operations.
The following table sets forth the fair value of the Portfolio's derivative contracts by primary risk exposure as of December 31, 2015.
| Asset Derivatives Statement of Assets and Liabilities Location | Primary Risk Exposure | Value (000) | |||||||||||||
| Foreign Currency Forward Exchange Contract | Unrealized Appreciation on Foreign Currency Forward Exchange Contract | Currency Risk | $ | 124 | |||||||||||
The following tables set forth by primary risk exposure the Portfolio's realized gains (losses) and change in unrealized appreciation (depreciation) by type of derivative contract for the year ended December 31, 2015 in accordance with ASC 815.
Realized Gain (Loss) | |||||||||||
Primary Risk Exposure | Derivative Type | Value (000) | |||||||||
| Currency Risk | Foreign Currency Forward Exchange Contracts | $ | 1,704 | ||||||||
Change in Unrealized Appreciation (Depreciation) | |||||||||||
Primary Risk Exposure | Derivative Type | Value (000) | |||||||||
| Currency Risk | Foreign Currency Forward Exchange Contracts | $ | (815 | ) | |||||||
24
Morgan Stanley Institutional Fund, Inc.
Annual Report — December 31, 2015
Notes to Financial Statements (cont'd)
At December 31, 2015, the Portfolio's derivative assets and liabilities are as follows:
| Gross Amounts of Assets and Liabilities Presented in the Statement of Assets and Liabilities | |||||||||||
Derivatives | Assets(a) (000) | Liabilities(a) (000) | |||||||||
Foreign Currency Forward Exchange Contract | $ | 124 | $ | — | |||||||
(a) Absent an event of default or early termination, OTC derivative assets and liabilities are presented gross and not offset in the Statement of Assets and Liabilities.
The Portfolio typically enters into International Swaps and Derivatives Association, Inc. Master Agreements ("ISDA Master Agreements") or similar master agreements (collectively, "Master Agreements") with its contract counterparties for certain OTC derivatives in order to, among other things, reduce its credit risk to counterparties. ISDA Master Agreements include provisions for general obligations, representations, collateral and events of default or termination. Under an ISDA Master Agreement, the Portfolio typically may offset with the counterparty certain OTC derivative financial instruments' payables and/or receivables with collateral held and/or posted and create one single net payment (close-out netting) in the event of default, termination and/or potential deterioration in the credit quality of the counterparty. Various Master Agreements govern the terms of certain transactions with counterparties, including transactions such as swap, forward, repurchase and reverse repurchase agreements. These Master Agreements typically attempt to reduce the counterparty risk associated with such transactions by specifying credit protection mechanisms and providing standardization that improves legal certainty. Cross-termination provisions under Master Agreements typically provide that a default in connection with one transaction between the Portfolio and a counterparty gives the non-defaulting party the right to terminate any other transactions in place with the defaulting party to create one single net payment due to/due from the defaulting party and may be a feature in certain Master Agreements. In the event the Portfolio exercises its right to terminate a Master Agreement after a counterparty experiences a termination event as defined in the Master Agreement, the return of collateral with market value in excess of the Portfolio's net liability may be delayed or denied.
The following table presents derivative financial instruments that are subject to enforceable netting arrangements as of December 31, 2015.
Gross Amounts Not Offset in the Statement of Assets and Liabilities | |||||||||||||||||||
Counterparty | Gross Asset Derivatives Presented in Statement of Assets and Liabilities (000) | Financial Instrument (000) | Collateral Received (000) | Net Amount (not less than $0) (000) | |||||||||||||||
UBS AG | $ | 124 | $ | — | $ | — | $ | 124 | |||||||||||
For the year ended December 31, 2015, the approximate average monthly amount outstanding for each derivative type is as follows:
Foreign Currency Forward Exchange Contract: | |||||||
Average monthly principal amount | $ | 43,640,000 | |||||
6. Securities Lending: The Portfolio lends securities to qualified financial institutions, such as broker-dealers, to earn additional income. Any increase or decrease in the fair value of the securities loaned that might occur and any interest earned or dividends declared on those securities during the term of the loan would remain in the Portfolio. The Portfolio would receive cash or securities as collateral in an amount equal to or exceeding 100% of the current fair value of the loaned securities. The collateral is marked-to-market daily by State Street Bank and Trust Company ("State Street"), the securities lending agent, to ensure that a minimum of 100% collateral coverage is maintained.
Based on pre-established guidelines, the securities lending agent invests any cash collateral that is received in an affiliated money market portfolio and repurchase agreements. Securities lending income is generated from the earnings on the invested collateral and borrowing fees, less any rebates owed to the borrowers and compensation to the lending agent, and is recorded as "Income from Securities Loaned — Net" in the Portfolio's Statement of Operations. Risks in securities lending transactions are that a borrower may not provide additional collateral when required or return the securities when due, and that the value of the short-term investments will be less than the amount of cash collateral plus any rebate that is required to be returned to the borrower.
The Portfolio has the right under the lending agreement to recover the securities from the borrower on demand.
25
Morgan Stanley Institutional Fund, Inc.
Annual Report — December 31, 2015
Notes to Financial Statements (cont'd)
The following table presents financial instruments that are subject to enforceable netting arrangements as of December 31, 2015.
Gross Amounts Not Offset in the Statement of Assets and Liabilities | |||||||||||||||
| Gross Asset Amounts Presented in Statement of Assets and Liabilities (000) | Financial Instrument (000) | Collateral Received (000) | Net Amount (not less than $0) (000) | ||||||||||||
| $ | 26,670 | (b) | $ | — | $ | (26,670 | )(c)(d) | $ | 0 | ||||||
(b) Represents market value of loaned securities at period end.
(c) The Portfolio received cash collateral of approximately $27,551,000, of which approximately $25,736,000 was subsequently invested in Repurchase Agreements and Morgan Stanley Institutional Liquidity Funds as reported in the Portfolio of Investments. As of December 31, 2015, there was uninvested cash of approximately $1,815,000, which is not reflected in the Portfolio of Investments. In addition, the Portfolio received non-cash collateral of approximately $209,000 in the form of U.S. Government obligations, which the Portfolio cannot sell or repledge, and accordingly are not reflected in the Portfolio of Investments.
(d) The actual collateral received is greater than the amount shown here due to overcollateralization.
The Portfolio has adopted the disclosure provisions of FASB Accounting Standards Update No. 2014-11 ("ASU No. 2014-11"), "Transfers & Servicing (Topic 860): Repurchase-to-Maturity Transactions, Repurchase Financings, and Disclosures". ASU No. 2014-11 is intended to provide increased transparency about the types of collateral pledged in securities lending transactions and other similar transactions that are accounted for as secured borrowing.
The following table displays a breakdown of transactions accounted for as secured borrowings, the gross obligations by class of collateral pledged, and the remaining contractual maturity of those transactions as of December 31, 2015.
Remaining Contractual Maturity of the Agreements As of December 31, 2015 | |||||||||||||||||||||||
| Overnight and Continuous (000) | <30 days (000) | Between 30 & 90 days (000) | >90 days (000) | Total (000) | |||||||||||||||||||
Securities Lending Transactions | |||||||||||||||||||||||
Common Stocks | $ | 27,551 | $ | — | $ | — | $ | — | $ | 27,551 | |||||||||||||
Total Borrowings | $ | 27,551 | $ | — | $ | — | $ | — | $ | 27,551 | |||||||||||||
Gross amount of recognized liabilities for securities lending transactions | $ | 27,551 | |||||||||||||||||||||
7. Redemption Fees: The Portfolio will assess a 2% redemption fee on Class I shares, Class A shares, Class L shares, Class C shares and Class IS shares, which is paid directly to the Portfolio, for shares redeemed or exchanged within thirty days of purchase, subject to certain exceptions. The redemption fee is designed to protect the Portfolio and its remaining shareholders from the effects of short-term trading. These fees, if any, are included in the Statements of Changes in Net Assets.
8. Indemnifications: The Fund enters into contracts that contain a variety of indemnifications. The Fund's maximum exposure under these arrangements is unknown. However, the Fund has not had prior claims or losses pursuant to these contracts and expects the risk of loss to be remote.
9. Dividends and Distributions to Shareholders: Dividend income and distributions to shareholders are recorded on the ex-dividend date. Dividends from net investment income, if any, are declared and paid annually. Net realized capital gains, if any, are distributed at least annually.
10. Security Transactions, Income and Expenses: Security transactions are accounted for on the trade date (date the order to buy or sell is executed). Realized gains and losses on the sale of investment securities are determined on the specific identified cost method. Dividend income and other distributions are recorded on the ex-dividend date (except for certain foreign dividends which may be recorded as soon as the Portfolio is informed of such dividends) net of applicable withholding taxes. Interest income is recognized on the accrual basis
26
Morgan Stanley Institutional Fund, Inc.
Annual Report — December 31, 2015
Notes to Financial Statements (cont'd)
except where collection is in doubt. Discounts are accreted and premiums are amortized over the life of the respective securities. Most expenses of the Fund can be directly attributed to a particular Portfolio. Expenses which cannot be directly attributed are apportioned among the Portfolios based upon relative net assets or other appropriate methods. Income, expenses (other than class specific expenses — distribution and shareholder services, transfer agency and sub transfer agency fees) and realized and unrealized gains or losses are allocated to each class of shares based upon their relative net assets.
B. Advisory/Sub-Advisory Fees: The Adviser, a wholly-owned subsidiary of Morgan Stanley, provides the Portfolio with advisory services under the terms of an Investment Advisory Agreement, paid quarterly, at the annual rate based on the daily net assets as follows:
| First $500 million | Next $500 million | Next $1.5 billion | Over $2.5 billion | ||||||||||||
| 1.25 | % | 1.20 | % | 1.15 | % | 1.00 | % | ||||||||
Effective September 30, 2015, the Portfolio's annual rate based on the daily net assets was reduced and is as follows:
| First $500 million | Next $500 million | Next $1.5 billion | Over $2.5 billion | ||||||||||||
| 0.95 | % | 0.85 | % | 0.80 | % | 0.75 | % | ||||||||
For the year ended December 31, 2015, the advisory fee rate (net of waivers/rebate) was equivalent to an annual effective rate of 0.95% of the Portfolio's average daily net assets.
The Adviser has agreed to reduce its advisory fee and/or reimburse the Portfolio so that total annual portfolio operating expenses, excluding certain investment related expenses, taxes, interest and other extraordinary expenses (including litigation), will not exceed 1.25% for Class I shares, 1.60% for Class A shares, 2.10% for Class L shares, 2.35% for Class C shares and 1.18% for Class IS shares. Effective September 30, 2015, the Adviser has agreed to reduce its advisory fee and/or reimburse the Portfolio so that total annual portfolio operating expenses will not exceed 1.20% for Class I shares, 1.55% for Class A shares, 2.05% for Class L shares, 2.30% for Class C shares and 1.10% for Class IS shares. The fee waivers and/or expense reimbursements will continue for at least one year from the date of the Portfolio's prospectus or until such time as the Directors act to discontinue all or a portion of such waivers and/or reimbursements when they deem such action is appropriate. For the year ended December 31, 2015, approximately $1,902,000 of advisory fees were waived and approximately $99,000 of other expenses were reimbursed by the Adviser pursuant to this arrangement.
The Adviser has entered into a Sub-Advisory Agreement with the Sub-Advisers, each a wholly-owned subsidiary of Morgan Stanley. The Sub-Advisers provide the Portfolio with advisory services subject to the overall supervision of the Adviser and the Fund's Officers and Directors. The Adviser pays the Sub-Advisers on a monthly basis a portion of the net advisory fees the Adviser receives from the Portfolio.
C. Administration Fees: The Adviser also serves as Administrator to the Fund and provides administrative services pursuant to an Administration Agreement for an annual fee, accrued daily and paid monthly, of 0.08% of the Portfolio's average daily net assets.
Under a Sub-Administration Agreement between the Administrator and State Street, State Street provides certain administrative services to the Fund. For such services, the Administrator pays State Street a portion of the fee the Administrator receives from the Portfolio.
D. Distribution and Shareholder Services Fees: Morgan Stanley Distribution, Inc. ("MSDI" or the "Distributor"), a wholly-owned subsidiary of the Adviser and Sub-Advisers and an indirect subsidiary of Morgan Stanley, serves as the Fund's Distributor of Portfolio shares pursuant to a Distribution Agreement. The Fund has adopted a Shareholder Services Plan with respect to Class A shares pursuant to Rule 12b-1 under the Act. Under the Shareholder Services Plan, the Portfolio pays the Distributor a shareholder services fee, accrued daily and paid monthly, at an annual rate of 0.25% of the Portfolio's average daily net assets attributable to Class A shares.
The Fund has adopted a Distribution and Shareholder Services Plan with respect to Class L shares pursuant to Rule 12b-1 under the Act. Under the Distribution and Shareholder Services Plan, the Portfolio pays the Distributor a distribution fee, accrued daily and paid monthly, at an annual rate of 0.50% and a shareholder services fee, accrued daily and paid monthly, at an annual rate of 0.25% of the Portfolio's average daily net assets attributable to Class L shares.
The Fund has adopted a Distribution and Shareholder Services Plan with respect to Class C shares pursuant to Rule 12b-1 under the Act. Under the Distribution and Shareholder Services Plan, the Portfolio pays the Distributor a distribution fee, accrued daily and paid monthly, at an annual rate of 0.75% and a shareholder services fee, accrued daily and paid monthly, at an annual rate of 0.25% of the Portfolio's average daily net assets attributable to Class C shares.
27
Morgan Stanley Institutional Fund, Inc.
Annual Report — December 31, 2015
Notes to Financial Statements (cont'd)
The distribution and shareholder services fees are used to support the expenses associated with servicing and maintaining accounts. The Distributor may compensate other parties for providing shareholder support services to investors who purchase Class A, Class L and Class C shares.
E. Dividend Disbursing and Transfer Agent: The Fund's dividend disbursing and transfer agent is Boston Financial Data Services, Inc. ("BFDS"). Pursuant to a Transfer Agency Agreement, the Fund pays BFDS a fee based on the number of classes, accounts and transactions relating to the Portfolios of the Fund.
F. Custodian Fees: State Street (the "Custodian") serves as Custodian for the Fund in accordance with a Custodian Agreement. The Custodian holds cash, securities, and other assets of the Fund as required by the Act. Custody fees are payable monthly based on assets held in custody, investment purchases and sales activity and account maintenance fees, plus reimbursement for certain out-of-pocket expenses.
G. Security Transactions and Transactions with Affiliates: For the year ended December 31, 2015, purchases and sales of investment securities for the Portfolio, other than long-term U.S. Government securities and short-term investments, were approximately $376,549,000 and $418,825,000, respectively. There were no purchases and sales of long-term U.S. Government securities for the year ended December 31, 2015.
The Portfolio invests in the Institutional Class of the Morgan Stanley Institutional Liquidity Funds — Money Market Portfolio (the "Liquidity Funds"), an open-end management investment company managed by the Adviser, both directly and as a portion of the securities held as collateral on loaned securities. Advisory fees paid by the Portfolio are reduced by an amount equal to its pro-rata share of the advisory and administration fees paid by the Portfolio due to its investment in the Liquidity Funds. For the year ended December 31, 2015, advisory fees paid were reduced by approximately $27,000 relating to the Portfolio's investment in the Liquidity Funds.
A summary of the Portfolio's transactions in shares of the Liquidity Funds during the year ended December 31, 2015 is as follows:
| Value December 31, 2014 (000) | Purchases at Cost (000) | Sales (000) | Dividend Income (000) | Value December 31, 2015 (000) | |||||||||||||||
| $ | 58,143 | $ | 220,817 | $ | 235,922 | $ | 48 | $ | 43,038 | ||||||||||
During the year ended December 31, 2015, the Portfolio incurred approximately $31,000 in brokerage commissions with
Morgan Stanley & Co., LLC, an affiliate of the Adviser/Administrator, Sub-Advisers and Distributor, for portfolio transactions executed on behalf of the Portfolio.
The Portfolio has an unfunded Deferred Compensation Plan (the "Compensation Plan"), which allows each independent Director to defer payment of all, or a portion, of the fees he or she receives for serving on the Board of Directors. Each eligible Director generally may elect to have the deferred amounts credited with a return equal to the total return on one or more of the Morgan Stanley funds that are offered as investment options under the Compensation Plan. Appreciation/depreciation and distributions received from these investments are recorded with an offsetting increase/decrease in the deferred compensation obligation and do not affect the NAV of the Portfolio.
H. Federal Income Taxes: It is the Portfolio's intention to continue to qualify as a regulated investment company and distribute all of its taxable and tax-exempt income. Accordingly, no provision for Federal income taxes is required in the financial statements.
The Portfolio may be subject to taxes imposed by countries in which it invests. Such taxes are generally based on income and/or capital gains earned or repatriated. Taxes are accrued based on net investment income, net realized gains and net unrealized appreciation as such income and/or gains are earned. Taxes may also be based on transactions in foreign currency and are accrued based on the value of investments denominated in such currency.
FASB ASC 740-10, "Income Taxes — Overall", sets forth a minimum threshold for financial statement recognition of the benefit of a tax position taken or expected to be taken in a tax return. Management has concluded there are no significant uncertain tax positions that would require recognition in the financial statements. If applicable, the Portfolio recognizes interest accrued related to unrecognized tax benefits in "Interest Expense" and penalties in "Other Expenses" in the Statement of Operations. The Portfolio files tax returns with the U.S. Internal Revenue Service, New York and various states. Generally, each of the tax years in the four-year period ended December 31, 2015, remains subject to examination by taxing authorities.
The tax character of distributions paid may differ from the character of distributions shown in the Statements of Changes in Net Assets due to short-term capital gains being treated as
28
Morgan Stanley Institutional Fund, Inc.
Annual Report — December 31, 2015
Notes to Financial Statements (cont'd)
ordinary income for tax purposes. The tax character of distributions paid during fiscal 2015 and 2014 was as follows:
| 2015 Distributions Paid From: | 2014 Distributions Paid From: | ||||||||||||||
| Ordinary Income (000) | Long-Term Capital Gain (000) | Ordinary Income (000) | Long-Term Capital Gain (000) | ||||||||||||
| $ | 7,596 | $ | — | $ | 8,694 | $ | 50,634 | ||||||||
The amount and character of income and gains to be distributed are determined in accordance with income tax regulations which may differ from GAAP. These book/tax differences are either considered temporary or permanent in nature.
Temporary differences are primarily due to differing book and tax treatments in the timing of the recognition of gains (losses) on certain investment transactions and the timing of the deductibility of certain expenses.
Permanent differences, primarily due to differing treatments of gains (losses) related to foreign currency transactions and basis adjustments on certain equity securities designated as passive foreign investment companies, resulted in the following reclassifications among the components of net assets at December 31, 2015:
| Distributions in Excess of Net Investment Income (000) | Accumulated Net Realized Loss (000) | Paid-in- Capital (000) | |||||||||
| $ | 565 | $ | (565 | ) | $ | — | |||||
At December 31, 2015, the components of distributable earnings for the Portfolio on a tax basis were as follows:
| Undistributed Ordinary Income (000) | Undistributed Long-Term Capital Gain (000) | ||||||
| $ | 111 | $ | — | ||||
At December 31, 2015, the Portfolio had available for Federal income tax purposes unused short-term capital losses of approximately $33,080,000 and long-term capital losses of approximately $13,941,000 that do not have an expiration date.
To the extent that capital loss carryforwards are used to offset any future capital gains realized, no capital gains tax liability will be incurred by the Portfolio for gains realized and not distributed. To the extent that capital gains are offset, such gains will not be distributed to the shareholders.
I. Other: At December 31, 2015, the Portfolio had record owners of 10% or greater. Investment activities of these shareholders could have a material impact on the Portfolio. The aggregate percentage of such owners was 72.9%.
29
Morgan Stanley Institutional Fund, Inc.
Annual Report — December 31, 2015
Report of Independent Registered Public Accounting Firm
To the Shareholders and Board of Directors of
Morgan Stanley Institutional Fund, Inc. —
Emerging Markets Portfolio
We have audited the accompanying statement of assets and liabilities, including the portfolio of investments, of Emerging Markets Portfolio (one of the portfolios constituting Morgan Stanley Institutional Fund, Inc.) (the "Portfolio") as of December 31, 2015, and the related statement of operations for the year then ended, the statements of changes in net assets for each of the two years in the period then ended and the financial highlights for each of the years or periods indicated therein. These financial statements and financial highlights are the responsibility of the Portfolio's management. Our responsibility is to express an opinion on these financial statements and financial highlights based on our audits.
We conducted our audits in accordance with the standards of the Public Company Accounting Oversight Board (United States). Those standards require that we plan and perform the audit to obtain reasonable assurance about whether the financial statements and financial highlights are free of material misstatement. We were not engaged to perform an audit of the Portfolio's internal control over financial reporting. Our audits included consideration of internal control over financial reporting as a basis for designing audit procedures that are appropriate in the circumstances, but not for the purpose of expressing an opinion on the effectiveness of the Portfolio's internal control over financial reporting. Accordingly, we express no such opinion. An audit also includes examining, on a test basis, evidence supporting the amounts and disclosures in the financial statements and financial highlights, assessing the accounting principles used and significant estimates made by management, and evaluating the overall financial statement presentation. Our procedures included confirmation of securities owned as of December 31, 2015, by correspondence with the custodian and others or by other appropriate auditing procedures where replies from others were not received. We believe that our audits provide a reasonable basis for our opinion.
In our opinion, the financial statements and financial highlights referred to above present fairly, in all material respects, the financial position of Emerging Markets Portfolio (one of the portfolios constituting Morgan Stanley Institutional Fund, Inc.) at December 31, 2015, the results of its operations for the year then ended, the changes in its net assets for each of the two years in the period then ended and the financial highlights for each of the years or periods indicated therein, in conformity with U.S. generally accepted accounting principles.

Boston, Massachusetts
February 26, 2016
30
Morgan Stanley Institutional Fund, Inc.
Annual Report — December 31, 2015
Federal Tax Notice (unaudited)
For Federal income tax purposes, the following information is furnished with respect to the distributions paid by the Portfolio during its taxable year ended December 31, 2015. For corporate shareholders, 1.7% of the dividends qualified for the dividends received deduction.
For Federal income tax purposes, the following information is furnished with respect to the Portfolio's earnings for its taxable year ended December 31, 2015. When distributed, certain earnings may be subject to a maximum tax rate of 15% as provided for the Jobs and Growth Tax Relief Reconciliation Act of 2003. The Portfolio designated up to a maximum of approximately $10,135,000 as taxable at this lower rate.
The Portfolio intends to pass through foreign tax credits of approximately $2,539,000 and has derived net income from sources within foreign countries amounting to approximately $20,650,000.
In January, the Portfolio provides tax information to shareholders for the preceding calendar year.
31
Morgan Stanley Institutional Fund, Inc.
Annual Report — December 31, 2015
U.S. Privacy Policy (unaudited)
AN IMPORTANT NOTICE CONCERNING OUR U.S. PRIVACY POLICY
This privacy notice describes the U.S. privacy policy of Morgan Stanley Distribution, Inc., and the Morgan Stanley family of mutual funds ("us", "our", "we").
We are required by federal law to provide you with notice of our U.S. privacy policy ("Policy"). This Policy applies to both our current and former clients unless we state otherwise and is intended for individual clients who purchase products or receive services from us for personal, family or household purposes. This Policy is not applicable to partnerships, corporations, trusts or other non-individual clients or account holders, nor is this Policy applicable to individuals who are either beneficiaries of a trust for which we serve as trustee or participants in an employee benefit plan administered or advised by us. This Policy is, however, applicable to individuals who select us to be a custodian of securities or assets in individual retirement accounts, 401(k) accounts, or accounts subject to the Uniform Gifts to Minors Act.
This notice sets out our business practices to protect your privacy; how we collect and share personal information about you; and how you can limit our sharing or certain uses by others of this information. We may amend this Policy at any time, and will inform you of any changes to our Policy as required by law.
WE RESPECT YOUR PRIVACY
We appreciate that you have provided us with your personal financial information and understand your concerns about your information. We strive to safeguard the information our clients entrust to us. Protecting the confidentiality and security of client information is an important part of how we conduct our business.
This notice describes what personal information we collect about you, how we collect it, when we may share it with others, and how certain others may use it. It discusses the steps you may take to limit our sharing of certain information about you with our affiliated companies, including, but not limited to our affiliated banking businesses, brokerage firms and credit service affiliates. It also discloses how you may limit our affiliates' use of shared information for marketing purposes.
Throughout this Policy, we refer to the nonpublic information that personally identifies you as "personal information." We also use the term "affiliated company" in this notice. An affiliated company is a company in our family of companies and includes companies with the Morgan Stanley name. These affiliated companies are financial institutions such as broker-dealers, banks, investment advisers and credit card issuers. We refer to any company that is not an affiliated company as a nonaffiliated third party. For purposes of Section 5 of this notice, and your ability to limit certain uses of personal information by our affiliates, this notice applies to the use of personal information by our affiliated companies.
1. WHAT PERSONAL INFORMATION DO WE COLLECT FROM YOU?
We may collect the following types of information about you: (i) information provided by you, including information from applications and other forms we receive from you, (ii) information about your transactions with us or our affiliates, (iii) information about your transactions with nonaffiliated third parties, (iv) information from consumer reporting agencies, (v) information obtained from our websites, and (vi) information obtained from other sources. For example:
• We collect information such as your name, address, e-mail address, telephone/fax numbers, assets, income and investment objectives through applications and other forms you submit to us.
• We may obtain information about account balances, your use of account(s) and the types of products and services you prefer to receive from us through your dealings and transactions with us and other sources.
• We may obtain information about your creditworthiness and credit history from consumer reporting agencies.
• We may collect background information from and through third-party vendors to verify representations you have made and to comply with various regulatory requirements.
2. WHEN DO WE DISCLOSE PERSONAL INFORMATION WE COLLECT ABOUT YOU?
We may disclose personal information we collect about you in each of the categories listed above to affiliated and nonaffiliated third parties.
32
Morgan Stanley Institutional Fund, Inc.
Annual Report — December 31, 2015
U.S. Privacy Policy (unaudited) (cont'd)
a. Information We Disclose to Affiliated Companies.
We may disclose personal information that we collect about you to our affiliated companies to manage your account(s) effectively, to service and process your transactions, and to let you know about products and services offered by us and affiliated companies, to manage our business, and as otherwise required or permitted by law. Offers for products and services from affiliated companies are developed under conditions designed to safeguard your personal information.
b. Information We Disclose to Third Parties.
We may disclose personal information that we collect about you to nonaffiliated third parties to provide marketing services on our behalf or to other financial institutions with whom we have joint marketing agreements. We may also disclose all of the information we collect to other nonaffiliated third parties for our everyday business purposes, such as to process transactions, maintain account(s), respond to court orders and legal investigations, report to credit bureaus, offer our own products and services, protect against fraud, for institutional risk control, to perform services on our behalf, and as otherwise required or permitted by law.
When we share personal information about you with a nonaffiliated third party, they are required to limit their use of personal information about you to the particular purpose for which it was shared and they are not allowed to share personal information about you with others except to fulfill that limited purpose or as may be permitted or required by law.
3. HOW DO WE PROTECT THE SECURITY AND CONFIDENTIALITY OF PERSONAL INFORMATION WE COLLECT ABOUT YOU?
We maintain physical, electronic and procedural security measures that comply with applicable law and regulations to help safeguard the personal information we collect about you. We have internal policies governing the proper handling of client information by employees. Third parties that provide support or marketing services on our behalf may also receive personal information about you, and we require them to adhere to appropriate security standards with respect to such information.
4. HOW CAN YOU LIMIT OUR SHARING CERTAIN PERSONAL INFORMATION ABOUT YOU WITH OUR AFFILIATED COMPANIES FOR ELIGIBILITY DETERMINATION?
By following the opt-out procedures in Section 6 below, you may limit the extent to which we share with our affiliated companies, personal information that was collected to determine your eligibility for products and services such as your credit reports and other information that you have provided to us or that we may obtain from third parties ("eligibility information"). Eligibility information does not include your identification information or personal information pertaining to our transactions or experiences with you. Please note that, even if you direct us not to share eligibility information with our affiliated companies, we may still share your personal information, including eligibility information, with our affiliated companies under circumstances that are permitted under applicable law, such as to process transactions or to service your account.
5. HOW CAN YOU LIMIT THE USE OF CERTAIN PERSONAL INFORMATION ABOUT YOU BY OUR AFFILIATED COMPANIES FOR MARKETING?
By following the opt-out instructions in Section 6 below, you may limit our affiliated companies from marketing their products or services to you based on personal information we disclose to them. This information may include, for example, your income and account history with us. Please note that, even if you choose to limit our affiliated companies from using personal information about you that we may share with them for marketing their products and services to you, our affiliated companies may use your personal information that they obtain from us to market to you in circumstances permitted by law, such as if the affiliated party has its own relationship with you.
33
Morgan Stanley Institutional Fund, Inc.
Annual Report — December 31, 2015
U.S. Privacy Policy (unaudited) (cont'd)
6. HOW CAN YOU SEND US AN OPT-OUT INSTRUCTION?
If you wish to limit our sharing of eligibility information about you with our affiliated companies, or our affiliated companies' use of personal information for marketing purposes, as described in this notice, you may do so by:
• Calling us at (800) 548-7786
Monday–Friday between 8a.m. and 6p.m. (EST)
• Writing to us at the following address:
Boston Financial Data Services, Inc.
c/o Privacy Coordinator
P.O. Box 219804
Kansas City, Missouri 64121
If you choose to write to us, your request should include: your name, address, telephone number and account number(s) to which the opt-out applies and whether you are opting out with respect to sharing of eligibility information (Section 4 above), or information used for marketing (Section 5 above), or both. Written opt-out requests should not be sent with any other correspondence. In order to process your request, we require that the request be provided by you directly and not through a third party. Once you have informed us about your privacy preferences, your opt-out preference will remain in effect with respect to this Policy (as it may be amended) until you notify us otherwise. If you are a joint account owner, we will accept instructions from any one of you and apply those instructions to the entire account.
Please understand that if you limit our sharing or our affiliated companies' use of personal information, you and any joint account holder(s) may not receive information about our affiliated companies' products and services, including products or services that could help you manage your financial resources and achieve your investment objectives.
If you have more than one account or relationship with us, please specify the accounts to which you would like us to apply your privacy choices. If you have accounts or relationships with our affiliates, you may receive multiple privacy policies from them, and will need to separately notify those companies of your privacy choices for those accounts or relationships.
7. WHAT IF AN AFFILIATED COMPANY BECOMES A NONAFFILIATED THIRD PARTY?
If, at any time in the future, an affiliated company becomes a nonaffiliated third party, further disclosures of personal information made to the former affiliated company will be limited to those described in Section 2(b) above relating to nonaffiliated third parties. If you elected under Section 6 to limit disclosures we make to affiliated companies, or use of personal information by affiliated companies, your election will not apply to use by any former affiliated company of your personal information in their possession once it becomes a nonaffiliated third party.
SPECIAL NOTICE TO RESIDENTS OF VERMONT
The following section supplements our Policy with respect to our individual clients who have a Vermont address and supersedes anything to the contrary in the above Policy with respect to those clients only.
The State of Vermont requires financial institutions to obtain your consent prior to sharing personal information that they collect about you with nonaffiliated third parties, or eligibility information with affiliated companies, other than in certain limited circumstances. Except as permitted by law, we will not share personal information we collect about you with nonaffiliated third parties or eligibility information with affiliated companies, unless you provide us with your written consent to share such information.
SPECIAL NOTICE TO RESIDENTS OF CALIFORNIA
The following section supplements our Policy with respect to our individual clients who have a California address and supersedes anything to the contrary in the above Policy with respect to those clients only.
In response to a California law, if your account has a California home address, your personal information will not be disclosed to nonaffiliated third parties except as permitted by applicable California law, and we will limit sharing such personal information with our affiliates to comply with California privacy laws that apply to us.
34
Morgan Stanley Institutional Fund, Inc.
Annual Report — December 31, 2015
Director and Officer Information (unaudited)
Independent Directors:
| Name, Age and Address of Independent Director | Positions(s) Held with Registrant | Length of Time Served* | Principal Occupation(s) During Past 5 Years and Other Relevant Professional Experience | Number of Portfolios in Fund Complex Overseen by Director** | Other Directorships Held by Independent Director*** | ||||||||||||||||||
| Frank L. Bowman (71) c/o Kramer Levin Naftalis & Frankel LLP Counsel to the Independent Directors 1177 Avenue of the Americas New York, NY 10036 | Director | Since August 2006 | President, Strategic Decisions, LLC (consulting) (since February 2009); Director or Trustee of various Morgan Stanley Funds (since August 2006); Chairperson of the Compliance and Insurance Committee (since October 2015); Formerly, Chairperson of the Insurance Sub-Committee of the Compliance and Insurance Committee (February 2007-December 2015); served as President and Chief Executive Officer of the Nuclear Energy Institute (policy organization) (February 2005-November 2008); retired as Admiral, U.S. Navy after serving over 38 years on active duty including 8 years as Director of the Naval Nuclear Propulsion Program in the Department of the Navy and the U.S. Department of Energy (1996-2004); served as Chief of Naval Personnel (July 1994-September 1996); and on the Joint Staff as Director of Political Military Affairs (June 1992-July1994); knighted as Honorary Knight Commander of the Most Excellent Order of the British Empire; awarded the Officier de l'Orde National du Mérite by the French Government; elected to the National Academy of Engineering (2009). | 98 | Director of BP p.l.c.; Director of Naval and Nuclear Technologies LLP; Director Emeritus of the Armed Services YMCA; Director of the U.S. Naval Submarine League; Member of National Security Advisory Council of the Center for U.S. Global Engagement and a member of the CNA Military Advisory Board; Chairman of the Charity, J Street Cup Golf, Trustee of Fairhaven United Methodist Church; and Director of other various non-profit organizations. | ||||||||||||||||||
| Kathleen A. Dennis (62) c/o Kramer Levin Naftalis & Frankel LLP Counsel to the Independent Directors 1177 Avenue of the Americas New York, NY 10036 | Director | Since August 2006 | President, Cedarwood Associates (mutual fund and investment management consulting) (since July 2006); Chairperson of the Money Market and Alternatives Sub-Committee of the Investment Committee (since October 2006) and Director or Trustee of various Morgan Stanley Funds (since August 2006); formerly, Senior Managing Director of Victory Capital Management (1993-2006). | 98 | Director of various nonprofit organizations. | ||||||||||||||||||
| Nancy C. Everett (61) c/o Kramer Levin Naftalis & Frankel LLP Counsel to the Independent Director 1177 Avenue of the Americas New York, NY 10036 | Director | Since January 2015 | Chief Executive Officer, Virginia Commonwealth University Investment Company (since November 2015); Owner OBIR, LLC (institutional investment management consulting) (since June 2014); formerly, Managing Director, BlackRock, Inc. (February 2011-December 2013); and Chief Executive Officer, General Motors Asset Management (a/k/a Promark Global Advisors, Inc.) (June 2005-May 2010). | 98 | Member of Virginia Commonwealth University School of Business Foundation; formerly, Member of Virginia Commonwealth University Board of Visitors (2013-2015); Member of Committee on Directors for Emerging Markets Growth Fund, Inc. (2007-2010); Chairperson of Performance Equity Management, LLC (2006-2010); and Chairperson, GMAM Absolute Return Strategies Fund, LLC (2006-2010). | ||||||||||||||||||
35
Morgan Stanley Institutional Fund, Inc.
Annual Report — December 31, 2015
Director and Officer Information (unaudited) (cont'd)
Independent Directors: (cont'd)
| Name, Age and Address of Independent Director | Positions(s) Held with Registrant | Length of Time Served* | Principal Occupation(s) During Past 5 Years and Other Relevant Professional Experience | Number of Portfolios in Fund Complex Overseen by Director** | Other Directorships Held by Independent Director*** | ||||||||||||||||||
| Jakki L. Haussler (58) c/o Kramer Levin Naftalis & Frankel LLP Counsel to the Independent Directors 1177 Avenue of the Americas New York, NY 10036 | Director | Since January 2015 | Chairman and Chief Executive Officer, Opus Capital Group (since January 1996); and formerly, Director, Capvest Venture Fund, LP (May 2000-December 2011); Partner, Adena Ventures, LP (July 1999-December 2010); Director, The Victory Funds (February 2005-July 2008). | 98 | Director of Cincinnati Bell Inc. and Member, Audit Committee and Compensation Committee; Director of Northern Kentucky University Foundation and Member, Investment Committee; Member of Chase College of Law Transactional Law Practice Center Board of Advisors; Director of Best Transport; Chase College of Law Board of Visitors; formerly Member, University of Cincinnati Foundation Investment Committee; Member, Miami University Board of Visitors (2008-2011); Trustee of Victory Funds (2005-2008) and Chairman, Investment Committee (2007-2008) and Member, Service Provider Committee (2005-2008). | ||||||||||||||||||
| Dr. Manuel H. Johnson (67) c/o Johnson Smick International, Inc. 220 I Street, N.E. — Suite 200 Washington, D.C. 20002 | Director | Since July 1991 | Senior Partner, Johnson Smick International, Inc. (consulting firm); Chairperson of the Investment Committee (since October 2006) and Director or Trustee of various Morgan Stanley Funds (since July 1991); Co-Chairman and a founder of the Group of Seven Council (G7C) (international economic commission); formerly Chairperson of the Audit Committee (July 1991-September 2006), Vice Chairman of the Board of Governors of the Federal Reserve System and Assistant Secretary of the U.S. Treasury. | 100 | Director of NVR, Inc. (home construction). | ||||||||||||||||||
| Joseph J. Kearns (73) c/o Kearns & Associates LLC 23823 Malibu Road S-50-440 Malibu, CA 90265 | Director | Since August 1994 | President, Kearns & Associates LLC (investment consulting); Chairperson of the Audit Committee (since October 2006) and Director or Trustee of various Morgan Stanley Funds (since August 1994); formerly, Deputy Chairperson of the Audit Committee (July 2003-September 2006) and Chairperson of the Audit Committee of various Morgan Stanley Funds (since August 1994); CFO of the J. Paul Getty Trust. | 101 | Director of Electro Rent Corporation (equipment leasing). Prior to December 31, 2013, Director of The Ford Family Foundation. | ||||||||||||||||||
36
Morgan Stanley Institutional Fund, Inc.
Annual Report — December 31, 2015
Director and Officer Information (unaudited) (cont'd)
Independent Directors: (cont'd)
| Name, Age and Address of Independent Director | Positions(s) Held with Registrant | Length of Time Served* | Principal Occupation(s) During Past 5 Years and Other Relevant Professional Experience | Number of Portfolios in Fund Complex Overseen by Director** | Other Directorships Held by Independent Director*** | ||||||||||||||||||
| Michael F. Klein (57) c/o Kramer Levin Naftalis & Frankel LLP Counsel to the Independent Directors 1177 Avenue of the Americas New York, NY 10036 | Director | Since August 2006 | Managing Director, Aetos Capital, LLC (since March 2000); Co-President, Aetos Alternatives Management, LLC (since January 2004); and Co-Chief Executive Officer of Aetos Capital LLC (since August 2013); Chairperson of the Fixed Income Sub-Committee of the Investment Committee (since October 2006) and Director or Trustee of various Morgan Stanley Funds (since August 2006); formerly, Managing Director, Morgan Stanley & Co. Inc. and Morgan Stanley Dean Witter Investment Management, President, various Morgan Stanley Funds (June1998-March 2000) and Principal, Morgan Stanley & Co. Inc. and Morgan Stanley Dean Witter Investment Management (August 1997-December 1999). | 97 | Director of certain investment funds managed or sponsored by Aetos Capital, LLC. Director of Sanitized AG and Sanitized Marketing AG (specialty chemicals). | ||||||||||||||||||
| Michael E. Nugent (79) 522 Fifth Avenue New York, NY 10036 | Chair of the Board and Director | Chair of the Boards since July 2006 and Director since July 1991 | Chair of the Boards of various Morgan Stanley Funds (since July 2006); Chairperson of the Closed-End Fund Committee (since June 2012) and Director or Trustee of various Morgan Stanley Funds (since July 1991); formerly, Chairperson of the Insurance Committee (until July 2006), General Partner, TriumphCapital, L.P. (private investment partnership) (1988-2013). | 100 | None. | ||||||||||||||||||
| W. Allen Reed (68) c/o Kramer Levin Naftalis & Frankel LLP Counsel to the Independent Directors 1177 Avenue of the Americas New York, NY 10036 | Director | Since August 2006 | Chairperson of the Equity Sub-Committee of the Investment Committee (since October 2006) and Director or Trustee of various Morgan Stanley Funds (since August 2006); formerly, President and CEO of General Motors Asset Management; Chairman and Chief Executive Officer of the GM Trust Bank and Corporate Vice President of General Motors Corporation (August 1994-December 2005). | 98 | Director of Legg Mason, Inc.; formerly Director of the Auburn University Foundation (2010-2015). | ||||||||||||||||||
| Fergus Reid (83) c/o Joe Pietryka, Inc. 85 Charles Colman Blvd. Pawling, NY 12564 | Director | Since June 1992 | Chairman, Joe Pietryka, Inc.; Chairperson of the Governance Committee and Director or Trustee of various Morgan Stanley Funds (since June 1992). | 100 | Formerly, Trustee and Director of certain investment companies in the JP Morgan Fund Complex managed by JP Morgan Investment Management Inc. (1987-2012). | ||||||||||||||||||
37
Morgan Stanley Institutional Fund, Inc.
Annual Report — December 31, 2015
Director and Officer Information (unaudited) (cont'd)
Interested Director:
| Name, Age and Address of Interested Director | Positions(s) Held with Registrant | Length of Time Served* | Principal Occupation(s) During Past 5 Years | Number of Portfolios in Fund Complex Overseen by Interested Director** | Other Directorships Held by Interested Director*** | ||||||||||||||||||
| James F. Higgins (68) One New York Plaza, New York, NY 10004 | Director | Since June 2000 | Director or Trustee of various Morgan Stanley Funds (since June 2000); Senior Advisor of Morgan Stanley (since August 2000). | 99 | Formerly, Director of AXA Financial, Inc. and AXA Equitable Life Insurance Company (2002-2011) and Director of AXA MONY Life Insurance Company and AXA MONY Life Insurance Company of America (2004-2011). | ||||||||||||||||||
* This is the earliest date the Director began serving the Morgan Stanley Funds. Each Director serves an indefinite term, until his or her successor is elected.
** The Fund Complex includes (as of December 31, 2015) all open-end and closed-end funds (including all of their portfolios) advised by Morgan Stanley Investment Management Inc. (the "Adviser") and any funds that have an adviser that is an affiliated person of the Adviser (including, but not limited to, Morgan Stanley AIP GP LP).
*** This includes any directorships at public companies and registered investment companies held by the Director at any time during the past five years.
Executive Officers:
Name, Age and Address of Executive Officer | Position(s) Held with Registrant | Length of Time Served**** | Principal Occupation(s) During Past 5 Years | ||||||||||||
| John H. Gernon (52) 522 Fifth Avenue New York, NY 10036 | President and Principal Executive Officer | Since September 2013 | President and Principal Executive Officer of the Equity and Fixed Income Funds and the Morgan Stanley AIP Funds (since September 2013) and the Liquidity Funds and various money market funds (since May 2014) in the Fund Complex, Managing Director of the Adviser; Head of Product (since 2006). | ||||||||||||
| Stefanie V. Chang Yu (49) 522 Fifth Avenue New York, NY 10036 | Chief Compliance Officer | Since December 1997 | Managing Director of the Adviser and various entities affiliated with the Adviser; Chief Compliance Officer of various Morgan Stanley Funds and the Adviser (since January 2014); formerly, Vice President of various Morgan Stanley Funds (December 1997-January 2014). | ||||||||||||
| Joseph C. Benedetti (50) 522 Fifth Avenue New York, NY 10036 | Vice President | Since January 2014 | Managing Director of the Adviser and various entities affiliated with the Adviser; Vice President of various Morgan Stanley Funds (since January 2014); formerly, Assistant Secretary of various Morgan Stanley Funds (October 2004-January 2014). | ||||||||||||
| Francis J. Smith (50) 522 Fifth Avenue New York, NY 10036 | Treasurer and Principal Financial Officer | Treasurer since July 2003 and Principal Financial Officer since September 2002 | Executive Director of the Adviser and various entities affiliated with the Adviser; Treasurer (since July 2003) and Principal Financial Officer of various Morgan Stanley Funds (since September 2002). | ||||||||||||
| Mary E. Mullin (48) 522 Fifth Avenue New York, NY 10036 | Secretary | Since June 1999 | Executive Director of the Adviser; Secretary of various Morgan Stanley Funds (since June 1999). | ||||||||||||
**** This is the earliest date the officer began serving the Morgan Stanley Funds. Each officer serves a one-year term, until his or her successor is elected and has qualified.
38
Morgan Stanley Institutional Fund, Inc.
Annual Report — December 31, 2015
Adviser and Administrator
Morgan Stanley Investment Management Inc.
522 Fifth Avenue
New York, New York 10036
Sub-Advisers
Morgan Stanley Investment Management Limited
25 Cabot Square, Canary Wharf
London, E14 4QA, England
Morgan Stanley Investment Management Company
23 Church Street
16-01 Capital Square, Singapore 049481
Distributor
Morgan Stanley Distribution, Inc.
522 Fifth Avenue
New York, New York 10036
Dividend Disbursing and Transfer Agent
Boston Financial Data Services, Inc.
2000 Crown Colony Drive
Quincy, Massachusetts 02169
Custodian
State Street Bank and Trust Company
One Lincoln Street
Boston, Massachusetts 02111
Legal Counsel
Dechert LLP
1095 Avenue of the Americas
New York, New York 10036
Counsel to the Independent Directors
Kramer Levin Naftalis & Frankel LLP
1177 Avenue of the Americas
New York, New York 10036
Independent Registered Public Accounting Firm
Ernst & Young LLP
200 Clarendon Street
Boston, Massachusetts 02116
Reporting to Shareholders
Each Morgan Stanley fund provides a complete schedule of portfolio holdings in its semi-annual and annual reports within 60 days of the end of the fund's second and fourth fiscal quarters. The semi-annual and annual reports are filed electronically with the Securities and Exchange Commission (SEC) on Form N-CSRS and Form N-CSR, respectively. Morgan Stanley also delivers the semi-annual and annual reports to fund shareholders and makes these reports available on its public website, www.morganstanley.com/im. Each Morgan Stanley fund also files a complete schedule of portfolio holdings with the SEC for the fund's first and third fiscal quarters on Form N-Q. Morgan Stanley does not deliver the reports for the first and third fiscal quarters to shareholders, nor are the reports posted to the Morgan Stanley public website. You may, however, obtain the Form N-Q filings (as well as the Form N-CSR and N-CSRS filings) by accessing the SEC's website, www.sec.gov. You may also review and copy them at the SEC's Public Reference Room in Washington, DC. Information on the operation of the SEC's Public Reference Room may be obtained by calling the SEC toll free at 1 (800) SEC-0330. You can also request copies of these materials, upon payment of a duplicating fee, by electronic request at the SEC's email address (publicinfo@sec.gov) or by writing the Public Reference Room of the SEC, Washington, DC 20549-0102.
Proxy Voting Policies and Procedures and Proxy Voting Record
You may obtain a copy of the Fund's Proxy Voting Policy and Procedures and information regarding how the Fund voted proxies relating to portfolio securities during the most recent twelve-month period ended June 30, without charge, upon request, by calling toll free 1 (800) 548-7786 or by visiting our website at www.morganstanley.com/im. This information is also available on the SEC's website at www.sec.gov.
This report is authorized for distribution only when preceded or accompanied by a prospectus of the Morgan Stanley Institutional Fund, Inc., which describes in detail each Portfolio's investment policies, risks, fees and expenses. Please read the prospectus carefully before you invest or send money. For additional information, including information regarding the investments comprising the Portfolio, please visit our website at www.morganstanley.com/im or call toll free 1 (800) 548-7786.
39
(This Page has been left blank intentionally.)
Printed in U.S.A.
This Report has been prepared for shareholders and may be distributed to others only if preceded or accompanied by a current prospectus.
Morgan Stanley Investment Management Inc.
522 Fifth Avenue
New York, New York 10036
© 2016 Morgan Stanley. Morgan Stanley Distribution, Inc.

IFIEMANN
1407474 EXP. 02.28.17
INVESTMENT MANAGEMENT

Morgan Stanley Institutional Fund, Inc.
Emerging Markets Leaders Portfolio
Annual Report
December 31, 2015

Morgan Stanley Institutional Fund, Inc.
Annual Report — December 31, 2015
Table of Contents
Shareholders' Letter | 2 | ||||||
Expense Example | 3 | ||||||
Investment Overview | 4 | ||||||
Portfolio of Investments | 6 | ||||||
Statement of Assets and Liabilities | 7 | ||||||
Statement of Operations | 9 | ||||||
Statement of Changes in Net Assets | 10 | ||||||
Financial Highlights | 11 | ||||||
Notes to Financial Statements | 15 | ||||||
Report of Independent Registered Public Accounting Firm | 23 | ||||||
Federal Tax Notice | 24 | ||||||
U.S. Privacy Policy | 25 | ||||||
Director and Officer Information | 28 | ||||||
This report is authorized for distribution only when preceded or accompanied by prospectuses of the Morgan Stanley Institutional Fund, Inc. To receive a prospectus and/or statement of additional information (SAI), which contains more complete information such as investment objectives, charges, expenses, policies for voting proxies, risk considerations, and describes in detail each of the Portfolio's investment policies to the prospective investor, please call toll free 1 (800) 548-7786. Please read the prospectuses carefully before you invest or send money.
Additionally, you can access portfolio information including performance, characteristics, and investment team commentary through Morgan Stanley Investment Management's website: www.morganstanley.com/im.
Market forecasts provided in this report may not necessarily come to pass. There is no guarantee that any sectors mentioned will continue to perform as discussed herein or that securities in such sectors will be held by the Portfolio in the future. There is no assurance that a Portfolio will achieve its investment objective. Portfolios are subject to market risk, which is the possibility that market values of securities owned by the Portfolio will decline and, therefore, the value of the Portfolio's shares may be less than what you paid for them. Accordingly, you can lose money investing in this Portfolio. Please see the prospectus for more complete information on investment risks.
1
Morgan Stanley Institutional Fund, Inc.
Annual Report — December 31, 2015
Shareholders' Letter (unaudited)
Dear Shareholders,
We are pleased to provide this Annual report, in which you will learn how your investment in Emerging Markets Leaders Portfolio (the "Portfolio") performed during the period ended December 31, 2015.
Morgan Stanley Investment Management is a client-centric, investor-led organization. Our global presence, intellectual capital, and breadth of products and services enable us to partner with investors to meet the evolving challenges of today's financial markets. We aim to deliver superior investment service and to empower our clients to make the informed decisions that help them reach their investment goals.
As always, we thank you for selecting Morgan Stanley Investment Management, and look forward to working with you in the months and years ahead.
Sincerely,

John H. Gernon
President and Principal Executive Officer
January 2016
2
Morgan Stanley Institutional Fund, Inc.
Annual Report — December 31, 2015
Expense Example (unaudited)
Emerging Markets Leaders Portfolio
As a shareholder of the Portfolio, you incur two types of costs: (1) transactional costs, including redemptions fees; and (2) ongoing costs, including advisory fees, administration fees, distribution and shareholder services fees and other Portfolio expenses. This example is intended to help you understand your ongoing costs (in dollars) of investing in the Portfolio and to compare these costs with the ongoing costs of investing in other mutual funds.
This example is based on an investment of $1,000 invested at the beginning of the six-month period ended December 31, 2015 and held for the entire six-month period.
Actual Expenses
The table below provides information about actual account values and actual expenses. You may use the information in this table, together with the amount you invested, to estimate the expenses that you paid over the period. Simply divide your account value by $1,000 (for example, an $8,600 account value divided by $1,000 = 8.6), then multiply the result by the number in the table under the heading entitled "Actual Expenses Paid During Period" to estimate the expenses you paid on your account during this period.
Hypothetical Example for Comparison Purposes
The table below provides information about hypothetical account values and hypothetical expenses based on the Portfolio's actual expense ratio and an assumed rate of return of 5% per year before expenses, which is not the Portfolio's actual return. The hypothetical account values and expenses may not be used to estimate the actual ending account balance or expenses you paid for the period. You may use this information to compare the ongoing costs of investing in the Portfolio and other funds. To do so, compare this 5% hypothetical example with the 5% hypothetical examples that appear in the shareholder reports of the other funds.
Please note that the expenses shown in the table are meant to highlight your ongoing costs only and do not reflect any transactional costs, such as sales charges (loads) and redemption fees. Therefore, the information for each class in the table is useful in comparing ongoing costs only, and will not help you determine the relative total costs of owning different funds. In addition, if these transactional costs were included, your costs would have been higher.
| Beginning Account Value 7/1/15 | Actual Ending Account Value 12/31/15 | Hypothetical Ending Account Value | Actual Expenses Paid During Period* | Hypothetical Expenses Paid During Period* | Net Expense Ratio During Period** | ||||||||||||||||||||||
Emerging Markets Leaders Portfolio Class I | $ | 1,000.00 | $ | 931.30 | $ | 1,019.46 | $ | 5.55 | $ | 5.80 | 1.14 | % | |||||||||||||||
Emerging Markets Leaders Portfolio Class A | 1,000.00 | 929.80 | 1,017.39 | 7.54 | 7.88 | 1.55 | |||||||||||||||||||||
Emerging Markets Leaders Portfolio Class C | 1,000.00 | 925.30 | 1,013.61 | 11.16 | 11.67 | 2.30 | |||||||||||||||||||||
Emerging Markets Leaders Portfolio Class IS | 1,000.00 | 930.50 | 1,019.56 | 5.45 | 5.70 | 1.12 | |||||||||||||||||||||
* Expenses are calculated using each Portfolio Class' annualized net expense ratio (as disclosed), multiplied by the average account value over the period, and multiplied by 184/365 (to reflect the most recent one-half year period).
** Annualized.
3
Morgan Stanley Institutional Fund, Inc.
Annual Report — December 31, 2015
Investment Overview (unaudited)
Emerging Markets Leaders Portfolio
The Portfolio seeks long-term capital appreciation.
Performance
For the period since the Portfolio's launch on January 5, 2015 through December 31, 2015, the Portfolio's Class I shares had a total return based on net asset value and reinvestment of distributions per share of –4.26%, net of fees. The Portfolio's Class I shares outperformed the Portfolio's benchmark, the MSCI Emerging Markets Net Index (the "Index"), which returned –13.52%, for the same period.
Factors Affecting Performance
• Emerging markets equities underperformed developed market equities in 2015. Over the course of the year, markets grew increasingly concerned about China's slowing economy and waning liquidity with the Federal Reserve interest rate hike looming, both of which put downward pressure on global growth. While commodity prices declined, providing a windfall to the consumer, corporate profits hit multi-year lows. Markets that suffered the most in 2015 were commodity exporters such as Colombia, Peru, Brazil and South Africa. Political issues in Greece, Brazil, Turkey and Poland also weighed heavily on markets.
• In the Portfolio, the top contributors to performance over the reporting period were holdings in a Portugal-based supermarket retailer, a Hong Kong-based suitcase retailer and a Belgium-based beer maker.
• The largest detractors from performance included holdings in a Peruvian financial company, a Russian retailer and a South African hospital operator.
Management Strategies
• The outlook for emerging markets continues to be challenged. Our Portfolio is steadfastly focusing on what we believe are pockets of sustainable long-term growth even within a slow growth emerging world. Our stock picking discipline, which revolves around companies with what we consider visible steady growth and respect for return on capital employed, remains unchanged.
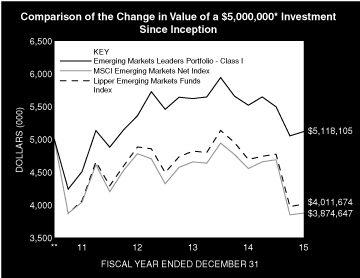
* Minimum Investment for Class I shares
** Commenced Operations on June 30, 2011. Performance shown for the Portfolio's Class I shares reflects the performance of the Morgan Stanley Emerging Markets Leaders Fund (Cayman) LP, a private fund managed by the Adviser for periods prior to close of business on January 5, 2015, when the Portfolio acquired substantially all of the assets and liabilities of the Private Fund in exchange for shares of the Portfolio (the "Emerging Markets Leaders Reorganization").
In accordance with SEC regulations, the Portfolio's performance shown assumes that all recurring fees (including management fees) were deducted and all dividends and distributions were reinvested. The performance of Class A, C and IS shares will vary from the performance of Class I shares based upon their different inception dates and will be negatively impacted by additional fees assessed to those classes (if applicable).
4
Morgan Stanley Institutional Fund, Inc.
Annual Report — December 31, 2015
Investment Overview (unaudited) (cont'd)
Emerging Markets Leaders Portfolio
Performance Compared to the MSCI Emerging Markets Net Index(1) the Lipper Emerging Markets Funds Index(2)
| Period Ended December 31, 2015 Total Returns(3) | |||||||||||||||||||
| One Year | Five Years | Ten Years | Since Inception(6) | ||||||||||||||||
| Portfolio — Class I Shares w/o sales charges(4) | –7.27 | % | — | — | 0.52 | % | |||||||||||||
| Portfolio — Class A Shares w/o sales charges(4) | –7.60 | — | — | 0.44 | |||||||||||||||
| Portfolio — Class A Shares with maximum 5.25% sales charges(4) | –12.48 | — | — | –0.75 | |||||||||||||||
| Portfolio — Class C Shares w/o sales charges(5) | — | — | — | –10.61 | |||||||||||||||
| Portfolio — Class C Shares with maximum 1.00% deferred sales charges(5) | — | — | — | –11.50 | |||||||||||||||
| Portfolio — Class IS Shares w/o sales charges(4) | –7.26 | — | — | 0.52 | |||||||||||||||
MSCI Emerging Markets Net Index | –14.92 | — | — | –5.50 | |||||||||||||||
| Lipper Emerging Market Funds Index | –14.50 | — | — | –4.78 | |||||||||||||||
Performance data quoted represents past performance, which is no guarantee of future results, and current performance may be lower or higher than the figures shown. Performance assumes that all dividends and distributions, if any, were reinvested. For the most recent month-end performance figures, please visit www.morganstanley.com/im. Investment return and principal value will fluctuate so that Portfolio shares, when redeemed, may be worth more or less than their original cost. Total returns do not reflect the deduction of taxes that a shareholder would pay on Portfolio distributions or the redemption of Portfolio shares. Returns for periods less than one year are not annualized. Performance of share classes will vary due to difference in sales charges and expenses.
(1) The MSCI Emerging Markets Net Index is a free float-adjusted market capitalization weighted index that is designed to measure equity market performance of emerging markets. The term "free float" represents the portion of shares outstanding that are deemed to be available for purchase in the public equity markets by investors. The MSCI Emerging Markets Net Index currently consists of 23 emerging market country indices. The performance of the Index is listed in U.S. dollars and assumes reinvestment of net dividends. The Index is unmanaged and its returns do not include any sales charges or fees. Such costs would lower performance. It is not possible to invest directly in an index.
(2) The Lipper Emerging Markets Funds Index is an equally weighted performance index of the largest qualifying funds (based on net assets) in the Lipper Emerging Markets Funds classification. The Index, which is adjusted for capital gains distributions and income dividends, is unmanaged and should not be considered an investment. There are currently 30 funds represented in this Index. As of the date of this report, the Portfolio is in the Lipper Emerging Markets Funds classification.
(3) Total returns for the Portfolio reflect fees waived and expenses reimbursed, if applicable, by the Adviser. Without such waivers and reimbursements, total returns would have been lower.
(4) Pursuant to an agreement and plan of reorganization, between Morgan Stanley Institutional Fund, Inc., on behalf of the Portfolio, and Morgan Stanley Emerging Markets Leaders Fund (Cayman) LP, a private fund managed by the Adviser (the "Private Fund"), following close of business on January 5, 2015, the Portfolio acquired substantially all of the assets and liabilities of the Private Fund in
exchange for shares of the Portfolio (the "Emerging Markets Leaders Reorganization"). The Private Fund commenced operations on June 30, 2011. The Portfolio adopted the performance history of the Private Fund. Performance shown for the Portfolio's Class I, Class A and Class IS shares reflects the performance of the limited partnership interests of the Private Fund, adjusted to reflect any applicable sales charge of the Class, but not adjusted for any other differences in expenses. If adjusted for other expenses, returns would be different.
(5) Commenced offering on April 30, 2015.
(6) For comparative purposes, average annual since inception returns listed for the Indexes refer to the inception date of Class I of the Portfolio, not the inception of the Index.
5
Morgan Stanley Institutional Fund, Inc.
Annual Report — December 31, 2015
Portfolio of Investments
Emerging Markets Leaders Portfolio
Shares | Value (000) | ||||||||||
Common Stocks (82.2%) | |||||||||||
Belgium (5.5%) | |||||||||||
Anheuser-Busch InBev N.V. | 13,165 | $ | 1,626 | ||||||||
Brazil (1.3%) | |||||||||||
| BRF SA | 27,804 | 388 | |||||||||
China (5.0%) | |||||||||||
Tencent Holdings Ltd. (a) | 76,100 | 1,485 | |||||||||
Hong Kong (14.1%) | |||||||||||
AIA Group Ltd. | 305,600 | 1,820 | |||||||||
Samsonite International SA | 783,900 | 2,352 | |||||||||
4,172 | |||||||||||
Indonesia (8.0%) | |||||||||||
Bank Mandiri Persero Tbk PT | 1,118,000 | 742 | |||||||||
Link Net Tbk PT (b) | 1,314,500 | 378 | |||||||||
Matahari Department Store Tbk PT | 382,700 | 483 | |||||||||
Sumber Alfaria Trijaya Tbk PT | 17,871,691 | 753 | |||||||||
2,356 | |||||||||||
Korea, Republic of (2.7%) | |||||||||||
Orion Corp. (b) | 799 | 790 | |||||||||
Mexico (7.9%) | |||||||||||
Fomento Economico Mexicano SAB de CV ADR | 15,593 | 1,440 | |||||||||
Grupo Financiero Banorte SAB de CV Series O | 162,618 | 895 | |||||||||
2,335 | |||||||||||
Peru (3.9%) | |||||||||||
Credicorp Ltd. | 12,010 | 1,169 | |||||||||
Philippines (2.4%) | |||||||||||
BDO Unibank, Inc. | 316,880 | 705 | |||||||||
Poland (4.3%) | |||||||||||
Jeronimo Martins SGPS SA | 97,652 | 1,269 | |||||||||
South Africa (12.5%) | |||||||||||
Famous Brands Ltd. | 121,941 | 1,023 | |||||||||
Life Healthcare Group Holdings Ltd. | 437,536 | 988 | |||||||||
Naspers Ltd., Class N | 5,156 | 705 | |||||||||
SABMiller PLC | 16,169 | 968 | |||||||||
3,684 | |||||||||||
Taiwan (1.8%) | |||||||||||
Poya International Co., Ltd. | 58,000 | 535 | |||||||||
Thailand (4.3%) | |||||||||||
| DKSH Holding AG (b) | 20,360 | 1,276 | |||||||||
Turkey (0.5%) | |||||||||||
Ulker Biskuvi Sanayi AS | 26,277 | 159 | |||||||||
United Kingdom (3.6%) | |||||||||||
British American Tobacco PLC | 18,964 | 1,053 | |||||||||
United States (4.4%) | |||||||||||
Yum! Brands, Inc. | 17,919 | 1,309 | |||||||||
Total Common Stocks (Cost $25,987) | 24,311 | ||||||||||
Participation Notes (14.4%) | |||||||||||
India (14.4%) | |||||||||||
| Bank of Baroda, Equity Linked Notes, expires 12/16/16 (b) | 123,000 | 289 | |||||||||
Shares | Value (000) | ||||||||||
| Bata India Ltd., Equity Linked Notes, expires 10/21/16 (b) | 61,805 | $ | 486 | ||||||||
| Bata India Ltd., Equity Linked Notes, expires 6/4/18 (b) | 45,730 | 360 | |||||||||
| Colgate-Palmolive India Ltd., Equity Linked Notes, expires 7/18/19 (b) | 39,115 | 574 | |||||||||
| Hero Motorcorp Ltd., Equity Linked Notes, expires 11/9/16 (b) | 7,663 | 311 | |||||||||
| Ipca Laboratories Ltd., Equity Linked Notes, expires 2/5/16 (b) | 18,743 | 210 | |||||||||
| Ipca Laboratories Ltd., Equity Linked Notes, expires 8/18/16 (b) | 57,554 | 643 | |||||||||
| Marico Ltd., Equity Linked Notes, expires 1/9/20 (b) | 134,718 | 460 | |||||||||
| Marico Ltd., Equity Linked Notes, expires 6/10/20 (b) | 26,008 | 89 | |||||||||
| Shriram Transport Finance Co., Ltd., Equity Linked Notes, expires 10/31/16 (b) | 66,377 | 858 | |||||||||
Total Participation Notes (Cost $4,578) | 4,280 | ||||||||||
Short-Term Investment (3.6%) | |||||||||||
Investment Company (3.6%) | |||||||||||
| Morgan Stanley Institutional Liquidity Funds — Money Market Portfolio — Institutional Class (See Note G) (Cost $1,066) | 1,065,584 | 1,066 | |||||||||
Total Investments (100.2%) (Cost $31,631) (c)(d) | 29,657 | ||||||||||
Liabilities in Excess of Other Assets (–0.2%) | (71 | ) | |||||||||
Net Assets (100.0%) | $ | 29,586 | |||||||||
(a) Security trades on the Hong Kong exchange.
(b) Non-income producing security.
(c) The approximate fair value and percentage of net assets, $19,498,000 and 65.9%, respectively, represent the securities that have been fair valued under the fair valuation policy for international investments as described in Note A-1 within the Notes to the Financial Statements.
(d) At December 31, 2015, the aggregate cost for Federal income tax purposes is approximately $31,631,000. The aggregate gross unrealized appreciation is approximately $717,000 and the aggregate gross unrealized depreciation is approximately $2,691,000 resulting in net unrealized depreciation of approximately $1,974,000.
ADR American Depositary Receipt.
Portfolio Composition
Classification | Percentage of Total Investments | ||||||
Other* | 38.0 | % | |||||
Beverages | 13.6 | ||||||
Banks | 11.8 | ||||||
Textiles, Apparel & Luxury Goods | 10.8 | ||||||
Hotels, Restaurants & Leisure | 7.9 | ||||||
Food & Staples Retailing | 6.8 | ||||||
Insurance | 6.1 | ||||||
Internet Software & Services | 5.0 | ||||||
Total Investments | 100.0 | % | |||||
* Industries and/or investment types representing less than 5% of total investments.
The accompanying notes are an integral part of the financial statements.
6
Morgan Stanley Institutional Fund, Inc.
Annual Report — December 31, 2015
Emerging Markets Leaders Portfolio
Statement of Assets and Liabilities | December 31, 2015 (000) | ||||||
Assets: | |||||||
Investments in Securities of Unaffiliated Issuers, at Value (Cost $30,565) | $ | 28,591 | |||||
Investment in Security of Affiliated Issuer, at Value (Cost $1,066) | 1,066 | ||||||
Total Investments in Securities, at Value (Cost $31,631) | 29,657 | ||||||
Foreign Currency, at Value (Cost $29) | 29 | ||||||
Due from Adviser | 35 | ||||||
Receivable for Investments Sold | 26 | ||||||
Tax Reclaim Receivable | 12 | ||||||
Prepaid Offering Costs | 3 | ||||||
Dividends Receivable | 2 | ||||||
Receivable from Affiliate | — | @ | |||||
Other Assets | 39 | ||||||
Total Assets | 29,803 | ||||||
Liabilities: | |||||||
Payable for Investments Purchased | 158 | ||||||
Payable for Professional Fees | 21 | ||||||
Deferred Capital Gain Country Tax | 14 | ||||||
Payable for Custodian Fees | 11 | ||||||
Payable for Administration Fees | 2 | ||||||
Payable for Transfer Agency Fees — Class I | — | @ | |||||
Payable for Transfer Agency Fees — Class A | — | @ | |||||
Payable for Transfer Agency Fees — Class C | — | @ | |||||
Payable for Transfer Agency Fees — Class IS | — | @ | |||||
Payable for Reorganization Expense | 1 | ||||||
Payable for Shareholder Services Fees — Class A | — | @ | |||||
Payable for Distribution and Shareholder Services Fees — Class C | — | @ | |||||
Payable for Sub Transfer Agency Fees — Class I | — | @ | |||||
Payable for Sub Transfer Agency Fees — Class A | — | @ | |||||
Payable for Sub Transfer Agency Fees — Class C | — | @ | |||||
Other Liabilities | 10 | ||||||
Total Liabilities | 217 | ||||||
Net Assets | $ | 29,586 | |||||
Net Assets Consist Of: | |||||||
Paid-in-Capital | $ | 32,395 | |||||
Distributions in Excess of Net Investment Income | (223 | ) | |||||
Accumulated Net Realized Loss | (612 | ) | |||||
Unrealized Appreciation (Depreciation) on: | |||||||
Investments | (1,974 | ) | |||||
Foreign Currency Translations | (— | @) | |||||
Net Assets | $ | 29,586 | |||||
The accompanying notes are an integral part of the financial statements.
7
Morgan Stanley Institutional Fund, Inc.
Annual Report — December 31, 2015
Emerging Markets Leaders Portfolio
Statement of Assets and Liabilities (cont'd) | December 31, 2015 (000) | ||||||
CLASS I: | |||||||
Net Assets | $ | 13,379 | |||||
| Shares Outstanding $0.001 par value shares of beneficial interest (unlimited shares authorized) (not in 000's) | 1,415,957 | ||||||
Net Asset Value, Offering and Redemption Price Per Share | $ | 9.45 | |||||
CLASS A: | |||||||
Net Assets | $ | 182 | |||||
| Shares Outstanding $0.001 par value shares of beneficial interest (unlimited shares authorized) (not in 000's) | 19,350 | ||||||
Net Asset Value, Redemption Price Per Share | $ | 9.43 | |||||
Maximum Sales Load | 5.25 | % | |||||
Maximum Sales Charge | $ | 0.52 | |||||
Maximum Offering Price Per Share | $ | 9.95 | |||||
CLASS C: | |||||||
Net Assets | $ | 100 | |||||
| Shares Outstanding $0.001 par value shares of beneficial interest (unlimited shares authorized) (not in 000's) | 10,576 | ||||||
Net Asset Value, Offering and Redemption Price Per Share | $ | 9.42 | |||||
CLASS IS: | |||||||
Net Assets | $ | 15,925 | |||||
| Shares Outstanding $0.001 par value shares of beneficial interest (unlimited shares authorized) (not in 000's) | 1,684,688 | ||||||
Net Asset Value, Offering and Redemption Price Per Share | $ | 9.45 | |||||
@ Amount is less than $500.
The accompanying notes are an integral part of the financial statements.
8
Morgan Stanley Institutional Fund, Inc.
Annual Report — December 31, 2015
Emerging Markets Leaders Portfolio
Statement of Operations | Period from January 5, 2015^ to December 31, 2015 (000) | ||||||
Investment Income: | |||||||
Dividends from Securities of Unaffiliated Issuers (Net of $42 of Foreign Taxes Withheld) | $ | 480 | |||||
Dividends from Security of Affiliated Issuer (Note G) | 3 | ||||||
Total Investment Income | 483 | ||||||
Expenses: | |||||||
Offering Costs | 265 | ||||||
Advisory Fees (Note B) | 238 | ||||||
Professional Fees | 106 | ||||||
Custodian Fees (Note F) | 40 | ||||||
Administration Fees (Note C) | 21 | ||||||
Registration Fees | 16 | ||||||
Shareholder Reporting Fees | 12 | ||||||
Transfer Agency Fees — Class I (Note E) | 2 | ||||||
Transfer Agency Fees — Class A (Note E) | 2 | ||||||
Transfer Agency Fees — Class C (Note E) | 1 | ||||||
Transfer Agency Fees — Class IS (Note E) | 1 | ||||||
Pricing Fees | 3 | ||||||
Directors' Fees and Expenses | 1 | ||||||
Shareholder Services Fees — Class A (Note D) | — | @ | |||||
Distribution and Shareholder Services Fees — Class C (Note D) | 1 | ||||||
Sub Transfer Agency Fees — Class I | — | @ | |||||
Sub Transfer Agency Fees — Class A | — | @ | |||||
Sub Transfer Agency Fees — Class C | — | @ | |||||
Other Expenses | 16 | ||||||
Total Expenses | 725 | ||||||
Waiver of Advisory Fees (Note B) | (238 | ) | |||||
Expenses Reimbursed by Adviser (Note B) | (180 | ) | |||||
Reimbursement of Class Specific Expenses — Class A (Note B) | (2 | ) | |||||
Reimbursement of Class Specific Expenses — Class C (Note B) | (1 | ) | |||||
Reimbursement of Class Specific Expenses — Class IS (Note B) | (1 | ) | |||||
Rebate from Morgan Stanley Affiliate (Note G) | (1 | ) | |||||
Net Expenses | 302 | ||||||
Net Investment Income | 181 | ||||||
Realized Loss: | |||||||
Investments Sold | (601 | ) | |||||
Foreign Currency Transactions | (22 | ) | |||||
Futures Contracts | (10 | ) | |||||
Net Realized Loss | (633 | ) | |||||
Change in Unrealized Appreciation (Depreciation): | |||||||
Investments | (1,974 | ) | |||||
Foreign Currency Translations | (— | @) | |||||
Net Change in Unrealized Appreciation (Depreciation) | (1,974 | ) | |||||
Net Realized Loss and Change in Unrealized Appreciation (Depreciation) | (2,607 | ) | |||||
Net Decrease in Net Assets Resulting from Operations | $ | (2,426 | ) | ||||
^ Date of Reorganization.
@ Amount is less than $500.
The accompanying notes are an integral part of the financial statements.
9
Morgan Stanley Institutional Fund, Inc.
Annual Report — December 31, 2015
Emerging Markets Leaders Portfolio
Statement of Changes in Net Assets | Period from January 5, 2015^ to December 31, 2015 (000) | ||||||
Increase (Decrease) in Net Assets: | |||||||
Operations: | |||||||
Net Investment Income | $ | 181 | |||||
Net Realized (Loss) | (633 | ) | |||||
Net Change in Unrealized Appreciation (Depreciation) | (1,974 | ) | |||||
Net Decrease in Net Assets Resulting from Operations | (2,426 | ) | |||||
Distributions from and/or in Excess of: | |||||||
Class I: | |||||||
Net Investment Income | (174 | ) | |||||
Class A: | |||||||
Net Investment Income | (2 | ) | |||||
Class C: | |||||||
Net Investment Income | (1 | ) | |||||
Class IS: | |||||||
Net Investment Income | (206 | ) | |||||
Total Distributions | (383 | ) | |||||
Capital Share Transactions:(1) | |||||||
Class I: | |||||||
Subscribed | 14,859 | ||||||
Distributions Reinvested | 38 | ||||||
Redeemed | (583 | ) | |||||
Class A: | |||||||
Subscribed | 195 | ||||||
Distributions Reinvested | 1 | ||||||
Redeemed | (7 | ) | |||||
Class C: | |||||||
Subscribed | 110 | * | |||||
Distributions Reinvested | 1 | * | |||||
Class IS: | |||||||
Subscribed | 17,575 | ||||||
Distributions Reinvested | 206 | ||||||
Net Increase in Net Assets Resulting from Capital Share Transactions | 32,395 | ||||||
Total Increase in Net Assets | 29,586 | ||||||
Net Assets: | |||||||
Beginning of Period | — | ||||||
End of Period (Including Distributions in Excess of Net Investment Income of $(223)) | $ | 29,586 | |||||
(1) Capital Share Transactions: | |||||||
Class I: | |||||||
Shares Subscribed | 1,472 | ||||||
Shares Issued on Distributions Reinvested | 4 | ||||||
Shares Redeemed | (60 | ) | |||||
Net Increase in Class I Shares Outstanding | 1,416 | ||||||
Class A: | |||||||
Shares Subscribed | 20 | ||||||
Shares Issued on Distributions Reinvested | — | @@ | |||||
Shares Redeemed | (1 | ) | |||||
Net Increase in Class A Shares Outstanding | 19 | ||||||
Class C: | |||||||
Shares Subscribed | 11 | * | |||||
Shares Issued on Distributions Reinvested | — | @@* | |||||
Net Increase in Class C Shares Outstanding | 11 | ||||||
Class IS: | |||||||
Shares Subscribed | 1,663 | ||||||
Shares Issued on Distributions Reinvested | 22 | ||||||
Net Increase in Class IS Shares Outstanding | 1,685 | ||||||
^ Date of Reorganization.
* For the period April 30, 2015 through December 31, 2015.
@@ Amount is less than 500 shares.
The accompanying notes are an integral part of the financial statements.
10
Morgan Stanley Institutional Fund, Inc.
Annual Report — December 31, 2015
Financial Highlights
Emerging Markets Leaders Portfolio
Class I | |||||||
Selected Per Share Data and Ratios | Period from January 5, 2015^ to December 31, 2015 | ||||||
Net Asset Value, Beginning of Period | $ | 10.00 | |||||
Income (Loss) from Investment Operations: | |||||||
Net Investment Income† | 0.06 | ||||||
Net Realized and Unrealized Loss | (0.49 | ) | |||||
Total from Investment Operations | (0.43 | ) | |||||
Distributions from and/or in Excess of: | |||||||
Net Investment Income | (0.12 | ) | |||||
Net Asset Value, End of Period | $ | 9.45 | |||||
Total Return++ | (4.26 | )%# | |||||
Ratios and Supplemental Data: | |||||||
Net Assets, End of Period (Thousands) | $ | 13,379 | |||||
Ratio of Expenses to Average Net Assets (1) | 1.14 | %+* | |||||
Ratio of Net Investment Income to Average Net Assets (1) | 0.65 | %+* | |||||
Ratio of Rebate from Morgan Stanley Affiliates to Average Net Assets | 0.01 | %* | |||||
Portfolio Turnover Rate | 36 | % | |||||
(1) Supplemental Information on the Ratios to Average Net Assets: | |||||||
Ratios Before Expense Limitation: | |||||||
Expenses to Average Net Assets | 2.80 | %* | |||||
Net Investment Loss to Average Net Assets | (1.01 | )%* | |||||
^ Date of Reorganization (close of business).
† Per share amount is based on average shares outstanding.
++ Calculated based on the net asset value as of the last business day of the period.
+ The Ratios of Expenses and Net Investment Income reflect the rebate of certain Portfolio expenses in connection with the investments in Morgan Stanley affiliates during the period. The effect of the rebate on the ratios is disclosed in the above table as "Ratio of Rebate from Morgan Stanley Affiliates to Average Net Assets."
# Not Annualized.
* Annualized.
The accompanying notes are an integral part of the financial statements.
11
Morgan Stanley Institutional Fund, Inc.
Annual Report — December 31, 2015
Financial Highlights
Emerging Markets Leaders Portfolio
Class A | |||||||
Selected Per Share Data and Ratios | Period from January 5, 2015^ to December 31, 2015 | ||||||
Net Asset Value, Beginning of Period | $ | 10.00 | |||||
Income (Loss) from Investment Operations: | |||||||
Net Investment Income† | 0.02 | ||||||
Net Realized and Unrealized Loss | (0.48 | ) | |||||
Total from Investment Operations | (0.46 | ) | |||||
Distributions from and/or in Excess of: | |||||||
Net Investment Income | (0.11 | ) | |||||
Net Asset Value, End of Period | $ | 9.43 | |||||
Total Return++ | (4.61 | )%# | |||||
Ratios and Supplemental Data: | |||||||
Net Assets, End of Period (Thousands) | $ | 182 | |||||
Ratio of Expenses to Average Net Assets (1) | 1.54 | %+* | |||||
Ratio of Net Investment Income to Average Net Assets (1) | 0.21 | %+* | |||||
Ratio of Rebate from Morgan Stanley Affiliates to Average Net Assets | 0.01 | %* | |||||
Portfolio Turnover Rate | 36 | % | |||||
(1) Supplemental Information on the Ratios to Average Net Assets: | |||||||
Ratios Before Expense Limitation: | |||||||
Expenses to Average Net Assets | 5.89 | %* | |||||
Net Investment Loss to Average Net Assets | (4.14 | )%* | |||||
^ Date of Reorganization (close of business).
† Per share amount is based on average shares outstanding.
++ Calculated based on the net asset value which does not reflect sales charges, if applicable, as of the last business day of the period.
+ The Ratios of Expenses and Net Investment Income reflect the rebate of certain Portfolio expenses in connection with the investments in Morgan Stanley affiliates during the period. The effect of the rebate on the ratios is disclosed in the above table as "Ratio of Rebate from Morgan Stanley Affiliates to Average Net Assets."
# Not Annualized.
* Annualized.
The accompanying notes are an integral part of the financial statements.
12
Morgan Stanley Institutional Fund, Inc.
Annual Report — December 31, 2015
Financial Highlights
Emerging Markets Leaders Portfolio
Class C | |||||||
Selected Per Share Data and Ratios | Period from April 30, 2015^ to December 31, 2015 | ||||||
Net Asset Value, Beginning of Period | $ | 10.61 | |||||
Loss from Investment Operations: | |||||||
Net Investment Loss† | (0.06 | ) | |||||
Net Realized and Unrealized Loss | (1.07 | ) | |||||
Total from Investment Operations | (1.13 | ) | |||||
Distributions from and/or in Excess of: | |||||||
Net Investment Income | (0.06 | ) | |||||
Net Asset Value, End of Period | $ | 9.42 | |||||
Total Return++ | (10.61 | )%# | |||||
Ratios and Supplemental Data: | |||||||
Net Assets, End of Period (Thousands) | $ | 100 | |||||
Ratio of Expenses to Average Net Assets (1) | 2.30 | %+* | |||||
Ratio of Net Investment Loss to Average Net Assets (1) | (0.85 | )%+* | |||||
Ratio of Rebate from Morgan Stanley Affiliates to Average Net Assets | 0.00 | %§* | |||||
Portfolio Turnover Rate | 36 | % | |||||
(1) Supplemental Information on the Ratios to Average Net Assets: | |||||||
Ratios Before Expense Limitation: | |||||||
Expense to Average Net Assets | 5.73 | %* | |||||
Net Investment Loss to Average Net Assets | (4.28 | )%* | |||||
^ Commencement of Offering.
† Per share amount is based on average shares outstanding.
++ Calculated based on the net asset value which does not reflect sales charges, if applicable, as of the last business day of the period.
+ The Ratios of Expenses and Net Investment Loss reflect the rebate of certain Portfolio expenses in connection with the investments in Morgan Stanley affiliates during the period. The effect of the rebate on the ratios is disclosed in the above table as "Ratio of Rebate from Morgan Stanley Affiliates to Average Net Assets."
§ Amount is less than 0.005%.
# Not Annualized.
* Annualized.
The accompanying notes are an integral part of the financial statements.
13
Morgan Stanley Institutional Fund, Inc.
Annual Report — December 31, 2015
Financial Highlights
Emerging Markets Leaders Portfolio
Class IS | |||||||
Selected Per Share Data and Ratios | Period from January 5, 2015^ to December 31, 2015 | ||||||
Net Asset Value, Beginning of Period | $ | 10.00 | |||||
Income (Loss) from Investment Operations: | |||||||
Net Investment Income† | 0.07 | ||||||
Net Realized and Unrealized Loss | (0.50 | ) | |||||
Total from Investment Operations | (0.43 | ) | |||||
Distributions from and/or in Excess of: | |||||||
Net Investment Income | (0.12 | ) | |||||
Net Asset Value, End of Period | $ | 9.45 | |||||
Total Return++ | (4.25 | )%# | |||||
Ratios and Supplemental Data: | |||||||
Net Assets, End of Period (Thousands) | $ | 15,925 | |||||
Ratio of Expenses to Average Net Assets (1) | 1.12 | %+*^^ | |||||
Ratio of Net Investment Income to Average Net Assets (1) | 0.75 | %+* | |||||
Ratio of Rebate from Morgan Stanley Affiliates to Average Net Assets | 0.01 | %* | |||||
Portfolio Turnover Rate | 36 | % | |||||
(1) Supplemental Information on the Ratios to Average Net Assets: | |||||||
Ratios Before Expense Limitation: | |||||||
Expenses to Average Net Assets | 2.65 | %* | |||||
Net Investment Loss to Average Net Assets | (0.78 | )%* | |||||
^ Date of Reorganization (close of business).
† Per share amount is based on average shares outstanding.
++ Calculated based on the net asset value as of the last business day of the period.
+ The Ratios of Expenses and Net Investment Income reflect the rebate of certain Portfolio expenses in connection with the investments in Morgan Stanley affiliates during the period. The effect of the rebate on the ratios is disclosed in the above table as "Ratio of Rebate from Morgan Stanley Affiliates to Average Net Assets."
^^ Effective September 30, 2015, the Adviser has agreed to limit the ratio of expenses to average net assets to the maximum ratio of 1.10% for Class IS shares. Prior to September 30, 2015, the maximum ratio was 1.15% for Class IS shares.
# Not Annualized.
* Annualized.
The accompanying notes are an integral part of the financial statements.
14
Morgan Stanley Institutional Fund, Inc.
Annual Report — December 31, 2015
Notes to Financial Statements
Morgan Stanley Institutional Fund, Inc. (the "Fund") is registered under the Investment Company Act of 1940, as amended (the "Act"), as an open-end management investment company. The Fund is comprised of twenty-six separate, active, diversified and non-diversified portfolios (individually referred to as a "Portfolio", collectively as the "Portfolios"). The Fund applies investment company accounting and reporting guidance.
The accompanying financial statements relate to the Emerging Markets Leaders Portfolio. The Portfolio's adviser, Morgan Stanley Investment Management Inc. (the "Adviser"), and subadvisers, Morgan Stanley Investment Management Limited ("MSIM Limited") and Morgan Stanley Investment Management Company ("MSIM Company") (together, the "Sub-Advisers"), seek to achieve the Portfolio's investment objective by investing primarily in equity securities of companies located in emerging market countries.
The Portfolio offers four classes of shares — Class I, Class A, Class C and Class IS. On April 30, 2015 the Portfolio commenced offering Class C shares.
Pursuant to an agreement and plan of reorganization, between the Fund, on behalf of the Portfolio, and Morgan Stanley Emerging Markets Leaders Fund (Cayman) LP, a private fund managed by the Adviser (the "Private Fund"), at the close of business on January 5, 2015, the Portfolio acquired substantially all of the assets and liabilities of the Private Fund in exchange for shares of the Portfolio (the "Reorganization"). For financial reporting purposes, the net assets received and shares issued by the Portfolio were recorded at fair value. The investment income and realized and unrealized gain/loss presented in the Statement of Operations represent the revenue and earnings of the Portfolio subsequent to the Reorganization. The partners of the Private Fund were issued 1,104,016 shares of beneficial interest in the Portfolio at a net asset value of $10.00, in exchange for their collective interest in the Private Fund, totaling $11,040,160 in net assets. The Private Fund commenced operations on June 30, 2011, and had an investment objective, policies, and strategies that were, in all material respects, the same as those of the Portfolio, and was managed in a manner that, in all material respects, complied with the investment guidelines and restrictions of the Portfolio. However, the Private Fund was not registered as an investment company under the Act, and therefore was not subject to certain investment limitations, diversification requirements, liquidity requirements, and other restrictions imposed by the Act and the Internal Revenue Code of 1986, as amended (the "Code"), which, if applicable, may have adversely affected its performance.
A. Significant Accounting Policies: The following significant accounting policies are in conformity with U.S. generally accepted accounting principles ("GAAP"). Such policies are consistently followed by the Fund in the preparation of its financial statements. GAAP may require management to make estimates and assumptions that affect the reported amounts and disclosures in the financial statements. Actual results may differ from those estimates.
1. Security Valuation: (1) An equity portfolio security listed or traded on an exchange is valued at its latest reported sales price (or at the exchange official closing price if such exchange reports an official closing price), if there were no sales on a given day, the security is valued at the mean between the last reported bid and asked prices; (2) all other equity portfolio securities for which over-the-counter ("OTC") market quotations are readily available are valued at its latest reported sales price. In cases where a security is traded on more than one exchange, the security is valued on the exchange designated as the primary market; (3) Certain portfolio securities may be valued by an outside pricing service approved by the Fund's Board of Directors (the "Directors"). The pricing service may utilize a matrix system or other model incorporating attributes such as security quality, maturity and coupon as the evaluation model parameters, and/or research evaluations by its staff, including review of broker-dealer market price quotations in determining what it believes is the fair valuation of the portfolios securities valued by such pricing service; (4) futures are valued at the latest price published by the commodities exchange on which they trade; (5) when market quotations are not readily available, including circumstances under which the Adviser or Sub-Advisers determine that the closing price, last sale price or the mean between the last reported bid and asked prices are not reflective of a security's market value, portfolio securities are valued at their fair value as determined in good faith under procedures established by and under the general supervision of the Directors. Occasionally, developments affecting the closing prices of securities and other assets may occur between the times at which valuations of such securities are determined (that is, close of the foreign market on which the securities trade) and the close of business of the New York Stock Exchange ("NYSE"). If developments occur during such periods that are expected to materially affect the value of such securities, such valuations may be adjusted to reflect the estimated fair value of such securities as of the close of the NYSE, as
15
Morgan Stanley Institutional Fund, Inc.
Annual Report — December 31, 2015
Notes to Financial Statements (cont'd)
determined in good faith by the Directors or by the Adviser using a pricing service and/or procedures approved by the Directors; (6) quotations of foreign portfolio securities, other assets and liabilities and forward contracts stated in foreign currency are translated into U.S. dollar equivalents at the prevailing market rates prior to the close of the NYSE; (7) investments in mutual funds, including the Morgan Stanley Institutional Liquidity Funds, are valued at the net asset value ("NAV") as of the close of each business day; and (8) short-term debt securities with remaining maturities of 60 days or less at the time of purchase may be valued at amortized cost, unless the Adviser determines such valuation does not reflect the securities' market value, in which case these securities will be valued at their fair market value determined by the Adviser.
The Directors have responsibility for determining in good faith the fair value of the investments, and the Directors may appoint others, such as the Fund's Adviser or a valuation committee, to assist the Directors in determining fair value and to make the actual calculations pursuant to the fair valuation methodologies previously approved by the Directors. Under procedures approved by the Directors, the Fund's Adviser has formed a Valuation Committee whose members are approved by the Directors. The Valuation Committee provides administration and oversight of the Fund's valuation policies and procedures, which are reviewed at least annually by the Directors. These procedures allow the Fund to utilize independent pricing services, quotations from securities and financial instrument dealers, and other market sources to determine fair value.
The Fund has procedures to determine the fair value of securities and other financial instruments for which market prices are not readily available. Under these procedures, the Valuation Committee convenes on a regular and ad hoc basis to review such securities and considers a number of factors, including valuation methodologies and significant unobservable valuation inputs, when arriving at fair value. The Valuation Committee may employ a market-based approach which may use related or comparable assets or liabilities, recent transactions, market multiples, book values, and other relevant information for the investment to determine the fair value of the investment. An income-based valuation approach may also be used in which the anticipated future cash flows of the investment are discounted to calculate fair
value. Discounts may also be applied due to the nature or duration of any restrictions on the disposition of the investments. Due to the inherent uncertainty of valuations of such investments, the fair values may differ significantly from the values that would have been used had an active market existed. The Valuation Committee employs various methods for calibrating these valuation approaches including a regular review of valuation methodologies, key inputs and assumptions, transactional back-testing or disposition analysis, and reviews of any related market activity.
2. Fair Value Measurement: Financial Accounting Standards Board ("FASB") Accounting Standards CodificationTM ("ASC") 820, "Fair Value Measurement" ("ASC 820"), defines fair value as the value that the Fund would receive to sell an investment or pay to transfer a liability in a timely transaction with an independent buyer in the principal market, or in the absence of a principal market the most advantageous market for the investment or liability. ASC 820 establishes a three-tier hierarchy to distinguish between (1) inputs that reflect the assumptions market participants would use in valuing an asset or liability developed based on market data obtained from sources independent of the reporting entity (observable inputs) and (2) inputs that reflect the reporting entity's own assumptions about the assumptions market participants would use in valuing an asset or liability developed based on the best information available in the circumstances (unobservable inputs) and to establish classification of fair value measurements for disclosure purposes. Various inputs are used in determining the value of the Fund's investments. The inputs are summarized in the three broad levels listed below.
• Level 1 – unadjusted quoted prices in active markets for identical investments
• Level 2 – other significant observable inputs (including quoted prices for similar investments, interest rates, prepayment speeds, credit risk, etc.)
• Level 3 – significant unobservable inputs including the Fund's own assumptions in determining the fair value of investments. Factors considered in making this determination may include, but are not limited to, information obtained by contacting the issuer, analysts,
16
Morgan Stanley Institutional Fund, Inc.
Annual Report — December 31, 2015
Notes to Financial Statements (cont'd)
or the appropriate stock exchange (for exchange-traded securities), analysis of the issuer's financial statements or other available documents and, if necessary, available information concerning other securities in similar circumstances
The inputs or methodology used for valuing securities are not necessarily an indication of the risk associated with investing in those securities and the determination of the significance of a particular input to the fair value measurement in its entirety requires judgment and considers factors specific to each security.
The following is a summary of the inputs used to value the Portfolio's investments as of December 31, 2015.
Investment Type | Level 1 Unadjusted quoted prices (000) | Level 2 Other significant observable inputs (000) | Level 3 Significant unobservable inputs (000) | Total (000) | |||||||||||||||
Assets: | |||||||||||||||||||
Common Stocks | |||||||||||||||||||
Banks | $ | 2,064 | $ | 1,447 | $ | — | $ | 3,511 | |||||||||||
Beverages | 1,440 | 2,594 | — | 4,034 | |||||||||||||||
| Diversified Telecommunication Services | — | 378 | — | 378 | |||||||||||||||
Food & Staples Retailing | — | 2,022 | — | 2,022 | |||||||||||||||
Food Products | — | 1,337 | — | 1,337 | |||||||||||||||
| Health Care Providers & Services | — | 988 | — | 988 | |||||||||||||||
| Hotels, Restaurants & Leisure | 1,309 | 1,023 | — | 2,332 | |||||||||||||||
Insurance | — | 1,820 | — | 1,820 | |||||||||||||||
| Internet Software & Services | — | 1,485 | — | 1,485 | |||||||||||||||
Media | — | 705 | — | 705 | |||||||||||||||
Multi-line Retail | — | 1,018 | — | 1,018 | |||||||||||||||
Professional Services | — | 1,276 | — | 1,276 | |||||||||||||||
| Textiles, Apparel & Luxury Goods | — | 2,352 | — | 2,352 | |||||||||||||||
Tobacco | — | 1,053 | — | 1,053 | |||||||||||||||
Total Common Stocks | 4,813 | 19,498 | — | 24,311 | |||||||||||||||
Participation Notes | — | 4,280 | — | 4,280 | |||||||||||||||
Short-Term Investment | |||||||||||||||||||
Investment Company | 1,066 | — | — | 1,066 | |||||||||||||||
Total Assets | $ | 5,879 | $ | 23,778 | $ | — | $ | 29,657 | |||||||||||
Transfers between investment levels may occur as the markets fluctuate and/or the availability of data used in an investment's valuation changes. The Portfolio recognizes transfers between the levels as of the end of the period. As of December 31, 2015, the Portfolio did not have any investments transfer between investment levels. At December 31, 2015, the fair value of certain securities were
adjusted due to developments which occurred between the time of the close of the foreign markets on which they trade and the close of business on the NYSE which resulted in their level 2 classification.
3. Foreign Currency Translation and Foreign Investments: The books and records of the Portfolio are maintained in U.S. dollars. Foreign currency amounts are translated into U.S. dollars as follows:
– investments, other assets and liabilities at the prevailing rate of exchange on the valuation date;
– investment transactions and investment income at the prevailing rates of exchange on the dates of such transactions.
Although the net assets of the Portfolio are presented at the foreign exchange rates and market values at the close of the period, the Portfolio does not isolate that portion of the results of operations arising as a result of changes in the foreign exchange rates from the fluctuations arising from changes in the market prices of securities held at period end. Similarly, the Portfolio does not isolate the effect of changes in foreign exchange rates from the fluctuations arising from changes in the market prices of securities sold during the period. Accordingly, realized and unrealized foreign currency gains (losses) on investments in securities are included in the reported net realized and unrealized gains (losses) on investment transactions and balances. However, pursuant to U.S. Federal income tax regulations, gains and losses from certain foreign currency transactions and the foreign currency portion of gains and losses realized on sales and maturities of foreign denominated debt securities are treated as ordinary income for U.S. Federal income tax purposes.
Net realized gains (losses) on foreign currency transactions represent net foreign exchange gains (losses) from foreign currency forward exchange contracts, disposition of foreign currencies, currency gains (losses) realized between the trade and settlement dates on securities transactions, and the difference between the amount of investment income and foreign withholding taxes recorded on the Portfolio's books and the U.S. dollar equivalent amounts actually received or paid. Net unrealized currency gains (losses) from valuing foreign currency denominated assets and liabilities at period end exchange rates are reflected as a component of unrealized appreciation (depreciation) in the Statement
17
Morgan Stanley Institutional Fund, Inc.
Annual Report — December 31, 2015
Notes to Financial Statements (cont'd)
of Assets and Liabilities. The change in unrealized currency gains (losses) on foreign currency translations for the period is reflected in the Statement of Operations.
Foreign security and currency transactions may involve certain considerations and risks not typically associated with those of U.S. dollar denominated transactions as a result of, among other factors, fluctuations of exchange rates in relation to the U.S. dollar, the possibility of lower levels of governmental supervision and regulation of foreign securities markets and the possibility of political or economic instability.
Governmental approval for foreign investments may be required in advance of making an investment under certain circumstances in some countries, and the extent of foreign investments in domestic companies may be subject to limitation in other countries. Foreign ownership limitations also may be imposed by the charters of individual companies to prevent, among other concerns, violations of foreign investment limitations. As a result, an additional class of shares (identified as "Foreign" in the Portfolio of Investments) may be created and offered for investment. The "local" and "foreign shares" market values may differ. In the absence of trading of the foreign shares in such markets, the Portfolio values the foreign shares at the closing exchange price of the local shares.
4. Structured Investments: The Portfolio invested a portion of its assets in structured investments. A structured investment is a derivative security designed to offer a return linked to a particular underlying security, currency, commodity or market. Structured investments may come in various forms including notes (such as exchange-traded notes), warrants and options to purchase securities. The Portfolio will typically use structured investments to gain exposure to a permitted underlying security, currency, commodity or market when direct access to a market is limited or inefficient from a tax or cost standpoint. There can be no assurance that structured investments will trade at the same price or have the same value as the underlying security, currency, commodity or market. Investments in structured investments involve risks including issuer risk, counterparty risk and market risk. Holders of structured investments bear risks of the underlying investment and are subject to issuer or counterparty risk because the Portfolio is relying on the creditworthiness of such issuer or counterparty and has no rights with respect to the underlying investment. Certain structured investments may be
thinly traded or have a limited trading market and may have the effect of increasing the Portfolio's illiquidity to the extent that the Portfolio, at a particular time, may be unable to find qualified buyers for these securities.
5. Derivatives: The Portfolio may, but is not required to, use derivative instruments for a variety of purposes, including hedging, risk management, portfolio management or to earn income. Derivatives are financial instruments whose value is based, in part, on the value of an underlying asset, interest rate, index or financial instrument. Prevailing interest rates and volatility levels, among other things, also affect the value of derivative instruments. A derivative instrument often has risks similar to its underlying asset and may have additional risks, including imperfect correlation between the value of the derivative and the underlying asset, risks of default by the counterparty to certain transactions, magnification of losses incurred due to changes in the market value of the securities, instruments, indices or interest rates to which the derivative instrument relates, risks that the transactions may not be liquid and risks arising from margin requirements. The use of derivatives involves risks that are different from, and possibly greater than, the risks associated with other portfolio investments. Derivatives may involve the use of highly specialized instruments that require investment techniques and risk analyses different from those associated with other portfolio investments. All of the Portfolio's holdings, including derivative instruments, are marked-to-market each day with the change in value reflected in unrealized appreciation (depreciation). Upon disposition, a realized gain or loss is recognized.
Certain derivative transactions may give rise to a form of leverage. Leverage magnifies the potential for gain and the risk of loss. Leverage associated with derivative transactions may cause the Portfolio to liquidate portfolio positions when it may not be advantageous to do so to satisfy its obligations or to meet earmarking or segregation requirements, pursuant to applicable Securities and Exchange Commission rules and regulations, or may cause the Portfolio to be more volatile than if the Portfolio had not been leveraged. Although the Adviser and/or Sub-Adviser seek to use derivatives to further the Portfolio's investment objectives, there is no assurance that the use of derivatives will achieve this result.
18
Morgan Stanley Institutional Fund, Inc.
Annual Report — December 31, 2015
Notes to Financial Statements (cont'd)
Following is a description of the derivative instruments and techniques that the Portfolio used during the period and their associated risks:
Futures: A futures contract is a standardized, exchange-traded agreement to buy or sell a specific quantity of an underlying asset, reference rate or index at a specific price at a specific future time. The value of a futures contract tends to increase and decrease in tandem with the value of the underlying instrument. Depending on the terms of the particular contract, futures contracts are settled through either physical delivery of the underlying instrument on the settlement date or by payment of a cash settlement amount on the settlement date. During the period the futures contract is open, payments are received from or made to the broker based upon changes in the value of the contract (the variation margin). A decision as to whether, when and how to use futures contracts involves the exercise of skill and judgment and even a well-conceived futures transaction may be unsuccessful because of market behavior or unexpected events. In addition to the derivatives risks discussed above, the prices of futures contracts can be highly volatile, using futures contracts can lower total return, and the potential loss from futures contracts can exceed the Portfolio's initial investment in such contracts. No assurance can be given that a liquid market will exist for any particular futures contract at any particular time. There is also the risk of loss by the Portfolio of margin deposits in the event of bankruptcy of a broker with which the Portfolio has open positions in the futures contract.
As of December 31, 2015, the Portfolio did not have any open futures contracts.
FASB ASC 815, "Derivatives and Hedging" ("ASC 815"), is intended to improve financial reporting about derivative instruments by requiring enhanced disclosures to enable investors to better understand how and why the Portfolio uses derivative instruments, how these derivative instruments are accounted for and their effects on the Portfolio's financial position and results of operations.
The following tables set forth by primary risk exposure the Portfolio's realized gains (losses) and change in unrealized appreciation (depreciation) by type of derivative
contract for the year ended December 31, 2015 in accordance with ASC 815.
Realized Gain (Loss) | |||||||||||
Primary Risk Exposure | Derivative Type | Value (000) | |||||||||
Equity Risk | Futures Contracts | $ | (10 | ) | |||||||
For the year ended December 31, 2015, the approximate average monthly amount outstanding for each derivative type is as follows:
Futures Contracts: | |||||||
Average monthly original value | $ | 247,000 | |||||
6. Redemption Fees: The Portfolio will assess a 2% redemption fee on Class I shares, Class A shares, Class C shares and Class IS shares, which is paid directly to the Portfolio, for shares redeemed or exchanged within thirty days of purchase, subject to certain exceptions. The redemption fee is designed to protect the Portfolio and its remaining shareholders from the effects of short-term trading. These fees, if any, are included in the Statement of Changes in Net Assets.
7. Indemnifications: The Fund enters into contracts that contain a variety of indemnifications. The Fund's maximum exposure under these arrangements is unknown. However, the Fund has not had prior claims or losses pursuant to these contracts and expects the risk of loss to be remote.
8. Dividends and Distributions to Shareholders: Dividend income and distributions to shareholders are recorded on the ex-dividend date. Dividends from net investment income, if any, are declared and paid annually. Net realized capital gains, if any, are distributed at least annually.
9. Security Transactions, Income and Expenses: Security transactions are accounted for on the trade date (date the order to buy or sell is executed). Realized gains and losses on the sale of investment securities are determined on the specific identified cost method. Dividend income and other distributions are recorded on the ex-dividend date (except for certain foreign dividends which may be recorded as soon as the Portfolio is informed of such dividends) net of applicable withholding taxes. Interest income is recognized on the accrual basis except where collection is in doubt. Discounts are accreted and premiums are amortized over the life of the respective securities. Most expenses of the Fund can be directly
19
Morgan Stanley Institutional Fund, Inc.
Annual Report — December 31, 2015
Notes to Financial Statements (cont'd)
attributed to a particular Portfolio. Expenses which cannot be directly attributed are apportioned among the Portfolios based upon relative net assets or other appropriate methods. Income, expenses (other than class specific expenses — distribution and shareholder services, transfer agency and sub transfer agency fees) and realized and unrealized gains or losses are allocated to each class of shares based upon their relative net assets.
B. Advisory/Sub-Advisory Fees: The Adviser, a wholly-owned subsidiary of Morgan Stanley, provides the Portfolio with advisory services under the terms of an Investment Advisory Agreement, paid quarterly, at the annual rate based on the daily net assets as follows:
| First $1 billion | Over $1 billion | ||||||
| 0.90 | % | 0.85 | % | ||||
For the period ended December 31, 2015, the advisory fee rate (net of waivers/rebate) was equivalent to an annual effective rate of 0.00% of the Portfolio's average daily net assets.
The Adviser has agreed to reduce its advisory fee and/or reimburse the Portfolio so that total annual portfolio operating expenses, excluding certain investment related expenses, taxes, interest and other extraordinary expenses (including litigation), will not exceed 1.20% for Class I shares, 1.55% for Class A shares, 2.30% for Class C shares and 1.15% for Class IS shares. Effective September 30, 2015, the Adviser has agreed to reduce its advisory fee and/or reimburse the Portfolio so that total annual portfolio operating expenses will not exceed 1.10% for Class IS shares. The fee waivers and/or expense reimbursements will continue for at least three years from the date of the Reorganization or until such time as the Directors act to discontinue all or a portion of such waivers and/or reimbursements when they deem such action is appropriate. For the period ended December 31, 2015, approximately $238,000 of advisory fees were waived and approximately $184,000 of other expenses were reimbursed by the Adviser pursuant to this arrangement.
The Adviser has entered into a Sub-Advisory Agreement with the Sub-Advisers, each a wholly-owned subsidiary of Morgan Stanley. The Sub-Advisers provide the Portfolio with advisory services subject to the overall supervision of the Adviser and the Fund's Officers and Directors. The Adviser pays the Sub-Advisers on a monthly basis a portion of the net advisory fees the Adviser receives from the Portfolio.
C. Administration Fees: The Adviser also serves as Administrator to the Fund and provides administrative services pursuant to an Administration Agreement for an annual fee,
accrued daily and paid monthly, of 0.08% of the Portfolio's average daily net assets.
Under a Sub-Administration Agreement between the Administrator and State Street Bank and Trust Company ("State Street"), State Street provides certain administrative services to the Fund. For such services, the Administrator pays State Street a portion of the fee the Administrator receives from the Portfolio.
D. Distribution and Shareholder Services Fees: Morgan Stanley Distribution, Inc. ("MSDI" or the "Distributor"), a wholly-owned subsidiary of the Adviser and Sub-Advisers and an indirect subsidiary of Morgan Stanley, serves as the Fund's Distributor of Portfolio shares pursuant to a Distribution Agreement. The Fund has adopted a Shareholder Services Plan with respect to Class A shares pursuant to Rule 12b-1 under the Act. Under the Shareholder Services Plan, the Portfolio pays the Distributor a shareholder services fee, accrued daily and paid monthly, at an annual rate of 0.25% of the Portfolio's average daily net assets attributable to Class A shares.
The Fund has adopted a Distribution and Shareholder Services Plan with respect to Class C shares pursuant to Rule 12b-1 under the Act. Under the Distribution and Shareholder Services Plan, the Portfolio pays the Distributor a distribution fee, accrued daily and paid monthly, at an annual rate of 0.75% and a shareholder services fee, accrued daily and paid monthly, at an annual rate of 0.25% of the Portfolio's average daily net assets attributable to Class C shares.
The distribution and shareholder services fees are used to support the expenses associated with servicing and maintaining accounts. The Distributor may compensate other parties for providing shareholder support services to investors who purchase Class A and Class C shares.
E. Dividend Disbursing and Transfer Agent: The Fund's dividend disbursing and transfer agent is Boston Financial Data Services, Inc. ("BFDS"). Pursuant to a Transfer Agency Agreement, the Fund pays BFDS a fee based on the number of classes, accounts and transactions relating to the Portfolios of the Fund.
F. Custodian Fees: State Street (the "Custodian") serves as Custodian for the Fund in accordance with a Custodian Agreement. The Custodian holds cash, securities, and other assets of the Fund as required by the Act. Custody fees are payable monthly based on assets held in custody, investment purchases and sales activity and account maintenance fees, plus reimbursement for certain out-of-pocket expenses.
20
Morgan Stanley Institutional Fund, Inc.
Annual Report — December 31, 2015
Notes to Financial Statements (cont'd)
G. Security Transactions and Transactions with Affiliates: For the year ended December 31, 2015, purchases and sales of investment securities for the Portfolio, other than long-term U.S. Government securities and short-term investments, were approximately $28,470,000 and $8,671,000, respectively. There were no purchases and sales of long-term U.S. Government securities for the year ended December 31, 2015.
The Portfolio invests in the Institutional Class of the Morgan Stanley Institutional Liquidity Funds — Money Market Portfolio (the "Liquidity Funds"), an open-end management investment company managed by the Adviser. Advisory fees paid by the Portfolio are reduced by an amount equal to its pro-rata share of the advisory and administration fees paid by the Portfolio due to its investment in the Liquidity Funds. For the period ended December 31, 2015, advisory fees paid were reduced by approximately $1,000 relating to the Portfolio's investment in the Liquidity Funds.
A summary of the Portfolio's transactions in shares of the Liquidity Funds during the period ended December 31, 2015 is as follows:
| Value January 5, 2015 (000) | Purchases at Cost (000) | Sales (000) | Dividend Income (000) | Value December 31, 2015 (000) | |||||||||||||||
| $ | — | $ | 30,594 | $ | 29,528 | $ | 3 | $ | 1,066 | ||||||||||
During the period ended December 31, 2015, the Portfolio incurred less than $500 in brokerage commissions with Morgan Stanley & Co., LLC, an affiliate of the Adviser/Administrator, Sub-Advisers and Distributor, for portfolio transactions executed on behalf of the Portfolio.
The Portfolio has an unfunded Deferred Compensation Plan (the "Compensation Plan"), which allows each independent Director to defer payment of all, or a portion, of the fees he or she receives for serving on the Board of Directors. Each eligible Director generally may elect to have the deferred amounts credited with a return equal to the total return on one or more of the Morgan Stanley funds that are offered as investment options under the Compensation Plan. Appreciation/depreciation and distributions received from these investments are recorded with an offsetting increase/decrease in the deferred compensation obligation and do not affect the NAV of the Portfolio.
H. Federal Income Taxes: It is the Portfolio's intention to continue to qualify as a regulated investment company and distribute all of its taxable and tax-exempt income. Accordingly, no provision for Federal income taxes is required in the financial statements.
The Portfolio may be subject to taxes imposed by countries in which it invests. Such taxes are generally based on income and/or capital gains earned or repatriated. Taxes are accrued based on net investment income, net realized gains and net unrealized appreciation as such income and/or gains are earned. Taxes may also be based on transactions in foreign currency and are accrued based on the value of investments denominated in such currency.
FASB ASC 740-10, "Income Taxes — Overall", sets forth a minimum threshold for financial statement recognition of the benefit of a tax position taken or expected to be taken in a tax return. Management has concluded there are no significant uncertain tax positions that would require recognition in the financial statements. If applicable, the Portfolio recognizes interest accrued related to unrecognized tax benefits in "Interest Expense" and penalties in "Other Expenses" in the Statement of Operations. The Portfolio files tax returns with the U.S. Internal Revenue Service, New York and various states.
The tax character of distributions paid may differ from the character of distributions shown in the Statement of Changes in Net Assets due to short-term capital gains being treated as ordinary income for tax purposes. The tax character of distributions paid during fiscal 2015 was as follows:
| 2015 Distributions Paid From: | |||||||||||
| Ordinary Income (000) | Long-Term Capital Gain (000) | ||||||||||
$ | 383 | $ | — | ||||||||
The amount and character of income and gains to be distributed are determined in accordance with income tax regulations which may differ from GAAP. These book/tax differences are either considered temporary or permanent in nature.
Temporary differences are primarily due to differing book and tax treatments in the timing of the recognition of gains (losses) on certain investment transactions and the timing of the deductibility of certain expenses.
Permanent differences, primarily due to differing treatments of gains (losses) related to foreign currency transactions, resulted in the following reclassifications among the components of net assets at December 31, 2015:
| Distributions in Excess of Net Investment Income (000) | Accumulated Net Realized Loss (000) | Paid-in- Capital (000) | |||||||||
| $ | (21 | ) | $ | 21 | $ | — | |||||
21
Morgan Stanley Institutional Fund, Inc.
Annual Report — December 31, 2015
Notes to Financial Statements (cont'd)
At December 31, 2015, the components of distributable earnings for the Portfolio on a tax basis were as follows:
| Undistributed Ordinary Income (000) | Undistributed Long-Term Capital Gain (000) | ||||||
| $ | 32 | $ | — | ||||
At December 31, 2015, the Portfolio had available for Federal income tax purposes unused short-term capital losses of approximately $606,000 and long-term capital losses of approximately $6,000 that do not have an expiration date.
To the extent that capital loss carryforwards are used to offset any future capital gains realized, no capital gains tax liability will be incurred by the Portfolio for gains realized and not distributed. To the extent that capital gains are offset, such gains will not be distributed to the shareholders.
I. Other: At December 31, 2015, the Portfolio had record owners of 10% or greater. Investment activities of these shareholders could have a material impact on the Portfolio. The aggregate percentage of such owners was 53.8%.
22
Morgan Stanley Institutional Fund, Inc.
Annual Report — December 31, 2015
Report of Independent Registered Public Accounting Firm
To the Stockholders and Board of Directors of
Emerging Markets Leaders Portfolio
We have audited the accompanying statement of assets and liabilities, including the portfolio of investments, of Emerging Markets Leaders Portfolio (one of the portfolios constituting Morgan Stanley Institutional Fund, Inc.) (the "Portfolio") as of December 31, 2015, and the related statements of operations and changes in net assets for the period from January 5, 2015 (date of reorganization) to December 31, 2015, and the financial highlights for each of the periods indicated therein. These financial statements and financial highlights are the responsibility of the Portfolio's management. Our responsibility is to express an opinion on these financial statements and financial highlights based on our audit.
We conducted our audit in accordance with the standards of the Public Company Accounting Oversight Board (United States). Those standards require that we plan and perform the audit to obtain reasonable assurance about whether the financial statements and financial highlights are free of material misstatement. We were not engaged to perform an audit of the Portfolio's internal control over financial reporting. Our audit included consideration of internal control over financial reporting as a basis for designing audit procedures that are appropriate in the circumstances, but not for the purpose of expressing an opinion on the effectiveness of the Portfolio's internal control over financial reporting. Accordingly, we express no such opinion. An audit also includes examining, on a test basis, evidence supporting the amounts and disclosures in the financial statements and financial highlights, assessing the accounting principles used and significant estimates made by management, and evaluating the overall financial statement presentation. Our procedures included confirmation of securities owned as of December 31, 2015, by correspondence with the custodian and others or by other appropriate auditing procedures where replies from others were not received. We believe that our audit provides a reasonable basis for our opinion.
In our opinion, the financial statements and financial highlights referred to above present fairly, in all material respects, the financial position of Emerging Markets Leaders Portfolio at December 31, 2015, the results of its operations and changes in its net assets for the period from January 5, 2015 (date of reorganization) to December 31, 2015, and the financial highlights for each of the periods indicated therein, in conformity with U.S. generally accepted accounting principles.

Boston, Massachusetts
February 26, 2016
23
Morgan Stanley Institutional Fund, Inc.
Annual Report — December 31, 2015
Federal Tax Notice (unaudited)
For Federal income tax purposes, the following information is furnished with respect to the distributions paid by the Portfolio during its taxable year ended December 31, 2015. For corporate shareholders, 4.8% of the dividends qualified for the dividends received deduction.
For Federal income tax purposes, the following information is furnished with respect to the Portfolio's earnings for its taxable year ended December 31, 2015. When distributed, certain earnings may be subject to a maximum tax rate of 15% as provided for the Jobs and Growth Tax Relief Reconciliation Act of 2003. The Portfolio designated up to a maximum of approximately $416,000 as taxable at this lower rate.
The Portfolio intends to pass through foreign tax credits of approximately $34,000 and has derived net income from sources within foreign countries amounting to approximately $459,000.
In January, the Portfolio provides tax information to shareholders for the preceding calendar year.
24
Morgan Stanley Institutional Fund, Inc.
Annual Report — December 31, 2015
U.S. Privacy Policy (unaudited)
AN IMPORTANT NOTICE CONCERNING OUR U.S. PRIVACY POLICY
This privacy notice describes the U.S. privacy policy of Morgan Stanley Distribution, Inc., and the Morgan Stanley family of mutual funds ("us", "our", "we").
We are required by federal law to provide you with notice of our U.S. privacy policy ("Policy"). This Policy applies to both our current and former clients unless we state otherwise and is intended for individual clients who purchase products or receive services from us for personal, family or household purposes. This Policy is not applicable to partnerships, corporations, trusts or other non-individual clients or account holders, nor is this Policy applicable to individuals who are either beneficiaries of a trust for which we serve as trustee or participants in an employee benefit plan administered or advised by us. This Policy is, however, applicable to individuals who select us to be a custodian of securities or assets in individual retirement accounts, 401(k) accounts, or accounts subject to the Uniform Gifts to Minors Act.
This notice sets out our business practices to protect your privacy; how we collect and share personal information about you; and how you can limit our sharing or certain uses by others of this information. We may amend this Policy at any time, and will inform you of any changes to our Policy as required by law.
WE RESPECT YOUR PRIVACY
We appreciate that you have provided us with your personal financial information and understand your concerns about your information. We strive to safeguard the information our clients entrust to us. Protecting the confidentiality and security of client information is an important part of how we conduct our business.
This notice describes what personal information we collect about you, how we collect it, when we may share it with others, and how certain others may use it. It discusses the steps you may take to limit our sharing of certain information about you with our affiliated companies, including, but not limited to our affiliated banking businesses, brokerage firms and credit service affiliates. It also discloses how you may limit our affiliates' use of shared information for marketing purposes.
Throughout this Policy, we refer to the nonpublic information that personally identifies you as "personal information." We also use the term "affiliated company" in this notice. An affiliated company is a company in our family of companies and includes companies with the Morgan Stanley name. These affiliated companies are financial institutions such as broker-dealers, banks, investment advisers and credit card issuers. We refer to any company that is not an affiliated company as a nonaffiliated third party. For purposes of Section 5 of this notice, and your ability to limit certain uses of personal information by our affiliates, this notice applies to the use of personal information by our affiliated companies.
1. WHAT PERSONAL INFORMATION DO WE COLLECT FROM YOU?
We may collect the following types of information about you: (i) information provided by you, including information from applications and other forms we receive from you, (ii) information about your transactions with us or our affiliates, (iii) information about your transactions with nonaffiliated third parties, (iv) information from consumer reporting agencies, (v) information obtained from our websites, and (vi) information obtained from other sources. For example:
• We collect information such as your name, address, e-mail address, telephone/fax numbers, assets, income and investment objectives through applications and other forms you submit to us.
• We may obtain information about account balances, your use of account(s) and the types of products and services you prefer to receive from us through your dealings and transactions with us and other sources.
• We may obtain information about your creditworthiness and credit history from consumer reporting agencies.
• We may collect background information from and through third-party vendors to verify representations you have made and to comply with various regulatory requirements.
2. WHEN DO WE DISCLOSE PERSONAL INFORMATION WE COLLECT ABOUT YOU?
We may disclose personal information we collect about you in each of the categories listed above to affiliated and nonaffiliated third parties.
25
Morgan Stanley Institutional Fund, Inc.
Annual Report — December 31, 2015
U.S. Privacy Policy (unaudited) (cont'd)
a. Information We Disclose to Affiliated Companies.
We may disclose personal information that we collect about you to our affiliated companies to manage your account(s) effectively, to service and process your transactions, and to let you know about products and services offered by us and affiliated companies, to manage our business, and as otherwise required or permitted by law. Offers for products and services from affiliated companies are developed under conditions designed to safeguard your personal information.
b. Information We Disclose to Third Parties.
We may disclose personal information that we collect about you to nonaffiliated third parties to provide marketing services on our behalf or to other financial institutions with whom we have joint marketing agreements. We may also disclose all of the information we collect to other nonaffiliated third parties for our everyday business purposes, such as to process transactions, maintain account(s), respond to court orders and legal investigations, report to credit bureaus, offer our own products and services, protect against fraud, for institutional risk control, to perform services on our behalf, and as otherwise required or permitted by law.
When we share personal information about you with a nonaffiliated third party, they are required to limit their use of personal information about you to the particular purpose for which it was shared and they are not allowed to share personal information about you with others except to fulfill that limited purpose or as may be permitted or required by law.
3. HOW DO WE PROTECT THE SECURITY AND CONFIDENTIALITY OF PERSONAL INFORMATION WE COLLECT ABOUT YOU?
We maintain physical, electronic and procedural security measures that comply with applicable law and regulations to help safeguard the personal information we collect about you. We have internal policies governing the proper handling of client information by employees. Third parties that provide support or marketing services on our behalf may also receive personal information about you, and we require them to adhere to appropriate security standards with respect to such information.
4. HOW CAN YOU LIMIT OUR SHARING CERTAIN PERSONAL INFORMATION ABOUT YOU WITH OUR AFFILIATED COMPANIES FOR ELIGIBILITY DETERMINATION?
By following the opt-out procedures in Section 6 below, you may limit the extent to which we share with our affiliated companies, personal information that was collected to determine your eligibility for products and services such as your credit reports and other information that you have provided to us or that we may obtain from third parties ("eligibility information"). Eligibility information does not include your identification information or personal information pertaining to our transactions or experiences with you. Please note that, even if you direct us not to share eligibility information with our affiliated companies, we may still share your personal information, including eligibility information, with our affiliated companies under circumstances that are permitted under applicable law, such as to process transactions or to service your account.
5. HOW CAN YOU LIMIT THE USE OF CERTAIN PERSONAL INFORMATION ABOUT YOU BY OUR AFFILIATED COMPANIES FOR MARKETING?
By following the opt-out instructions in Section 6 below, you may limit our affiliated companies from marketing their products or services to you based on personal information we disclose to them. This information may include, for example, your income and account history with us. Please note that, even if you choose to limit our affiliated companies from using personal information about you that we may share with them for marketing their products and services to you, our affiliated companies may use your personal information that they obtain from us to market to you in circumstances permitted by law, such as if the affiliated party has its own relationship with you.
26
Morgan Stanley Institutional Fund, Inc.
Annual Report — December 31, 2015
U.S. Privacy Policy (unaudited) (cont'd)
6. HOW CAN YOU SEND US AN OPT-OUT INSTRUCTION?
If you wish to limit our sharing of eligibility information about you with our affiliated companies, or our affiliated companies' use of personal information for marketing purposes, as described in this notice, you may do so by:
• Calling us at (800) 548-7786
Monday–Friday between 8a.m. and 6p.m. (EST)
• Writing to us at the following address:
Boston Financial Data Services, Inc.
c/o Privacy Coordinator
P.O. Box 219804
Kansas City, Missouri 64121
If you choose to write to us, your request should include: your name, address, telephone number and account number(s) to which the opt-out applies and whether you are opting out with respect to sharing of eligibility information (Section 4 above), or information used for marketing (Section 5 above), or both. Written opt-out requests should not be sent with any other correspondence. In order to process your request, we require that the request be provided by you directly and not through a third party. Once you have informed us about your privacy preferences, your opt-out preference will remain in effect with respect to this Policy (as it may be amended) until you notify us otherwise. If you are a joint account owner, we will accept instructions from any one of you and apply those instructions to the entire account.
Please understand that if you limit our sharing or our affiliated companies' use of personal information, you and any joint account holder(s) may not receive information about our affiliated companies' products and services, including products or services that could help you manage your financial resources and achieve your investment objectives.
If you have more than one account or relationship with us, please specify the accounts to which you would like us to apply your privacy choices. If you have accounts or relationships with our affiliates, you may receive multiple privacy policies from them, and will need to separately notify those companies of your privacy choices for those accounts or relationships.
7. WHAT IF AN AFFILIATED COMPANY BECOMES A NONAFFILIATED THIRD PARTY?
If, at any time in the future, an affiliated company becomes a nonaffiliated third party, further disclosures of personal information made to the former affiliated company will be limited to those described in Section 2(b) above relating to nonaffiliated third parties. If you elected under Section 6 to limit disclosures we make to affiliated companies, or use of personal information by affiliated companies, your election will not apply to use by any former affiliated company of your personal information in their possession once it becomes a nonaffiliated third party.
SPECIAL NOTICE TO RESIDENTS OF VERMONT
The following section supplements our Policy with respect to our individual clients who have a Vermont address and supersedes anything to the contrary in the above Policy with respect to those clients only.
The State of Vermont requires financial institutions to obtain your consent prior to sharing personal information that they collect about you with nonaffiliated third parties, or eligibility information with affiliated companies, other than in certain limited circumstances. Except as permitted by law, we will not share personal information we collect about you with nonaffiliated third parties or eligibility information with affiliated companies, unless you provide us with your written consent to share such information.
SPECIAL NOTICE TO RESIDENTS OF CALIFORNIA
The following section supplements our Policy with respect to our individual clients who have a California address and supersedes anything to the contrary in the above Policy with respect to those clients only.
In response to a California law, if your account has a California home address, your personal information will not be disclosed to nonaffiliated third parties except as permitted by applicable California law, and we will limit sharing such personal information with our affiliates to comply with California privacy laws that apply to us.
27
Morgan Stanley Institutional Fund, Inc.
Annual Report — December 31, 2015
Director and Officer Information (unaudited)
Independent Directors:
| Name, Age and Address of Independent Director | Positions(s) Held with Registrant | Length of Time Served* | Principal Occupation(s) During Past 5 Years and Other Relevant Professional Experience | Number of Portfolios in Fund Complex Overseen by Director** | Other Directorships Held by Independent Director*** | ||||||||||||||||||
| Frank L. Bowman (71) c/o Kramer Levin Naftalis & Frankel LLP Counsel to the Independent Directors 1177 Avenue of the Americas New York, NY 10036 | Director | Since August 2006 | President, Strategic Decisions, LLC (consulting) (since February 2009); Director or Trustee of various Morgan Stanley Funds (since August 2006); Chairperson of the Compliance and Insurance Committee (since October 2015); Formerly, Chairperson of the Insurance Sub-Committee of the Compliance and Insurance Committee (February 2007-December 2015); served as President and Chief Executive Officer of the Nuclear Energy Institute (policy organization) (February 2005-November 2008); retired as Admiral, U.S. Navy after serving over 38 years on active duty including 8 years as Director of the Naval Nuclear Propulsion Program in the Department of the Navy and the U.S. Department of Energy (1996-2004); served as Chief of Naval Personnel (July 1994-September 1996); and on the Joint Staff as Director of Political Military Affairs (June 1992-July 1994); knighted as Honorary Knight Commander of the Most Excellent Order of the British Empire; awarded the Officier de l'Orde National du Mérite by the French Government; elected to the National Academy of Engineering (2009). | 98 | Director of BP p.l.c.; Director of Naval and Nuclear Technologies LLP; Director Emeritus of the Armed Services YMCA; Director of the U.S. Naval Submarine League; Member of the National Security Advisory Council of the Center for U.S. Global Engagement and a member of the CNA Military Advisory Board; Chairman of the Charity, J Street Cup Golf, Trustee of Fairhaven United Methodist Church; and Director of other various non-profit organizations. | ||||||||||||||||||
| Kathleen A. Dennis (62) c/o Kramer Levin Naftalis & Frankel LLP Counsel to the Independent Directors 1177 Avenue of the Americas New York, NY 10036 | Director | Since August 2006 | President, Cedarwood Associates (mutual fund and investment management consulting) (since July 2006); Chairperson of the Money Market and Alternatives Sub-Committee of the Investment Committee (since October 2006) and Director or Trustee of various Morgan Stanley Funds (since August 2006); formerly, Senior Managing Director of Victory Capital Management (1993-2006). | 98 | Director of various nonprofit organizations. | ||||||||||||||||||
| Nancy C. Everett (61) c/o Kramer Levin Naftalis & Frankel LLP Counsel to the Independent Directors 1177 Avenue of the Americas New York, NY 10036 | Director | Since January 2015 | Chief Executive Officer, Virginia Commonwealth University Investment Company (since November 2015); Owner, OBIR, LLC (investment management consulting) (since June 2014); formerly, Managing Director, BlackRock Inc. (February 2011-December 2013); and Chief Executive Officer, General Motors Asset Management (a/k/a Promark Global Advisors, Inc.) (June 2005-May 2010). | 98 | Member of Virginia Commonwealth University School of Business Foundation; formerly, Member of Virginia Commonwealth University Board of Visitors (2013-2015); Member of Committee on Directors for Emerging Markets Growth Fund, Inc. (2007-2010); Chairperson of Performance Equity Management, LLC (2006-2010); and Chairperson, GMAM Absolute Return Strategies Fund, LLC (2006-2010). | ||||||||||||||||||
28
Morgan Stanley Institutional Fund, Inc.
Annual Report — December 31, 2015
Director and Officer Information (unaudited) (cont'd)
Independent Directors: (cont'd)
| Name, Age and Address of Independent Director | Positions(s) Held with Registrant | Length of Time Served* | Principal Occupation(s) During Past 5 Years and Other Relevant Professional Experience | Number of Portfolios in Fund Complex Overseen by Director** | Other Directorships Held by Independent Director*** | ||||||||||||||||||
| Jakki L. Haussler (58) c/o Kramer Levin Naftalis & Frankel LLP Counsel to the Independent Directors 1177 Avenue of the Americas New York, NY 10036 | Director | Since January 2015 | Chairman and Chief Executive Officer, Opus Capital Group (since January 1996); and formerly, Director, Capvest Venture Fund, LP (May 2000-December 2011); Partner, Adena Ventures, LP (July 1999-December 2010); Director, The Victory Funds (February 2005-July 2008). | 98 | Director of Cincinnati Bell Inc. and Member, Audit Committee and Compensation Committee; Director of Northern Kentucky University Foundation and Member, Investment Committee; Member of Chase College of Law Transactional Law Practice Center Board of Advisors; Director of Best Transport; Chase College of Law Board of Visitors; formerly Member, University of Cincinnati Foundation Investment Committee; Member, Miami University Board of Visitors (2008-2011); Trustee of Victory Funds (2005-2008) and Chairman, Investment Committee (2007-2008) and Member, Service Provider Committee (2005-2008). | ||||||||||||||||||
| Dr. Manuel H. Johnson (67) c/o Johnson Smick International, Inc. 220 I Street, N.E. — Suite 200 Washington, D.C. 20002 | Director | Since July 1991 | Senior Partner, Johnson Smick International, Inc. (consulting firm); Chairperson of the Investment Committee (since October 2006) and Director or Trustee of various Morgan Stanley Funds (since July 1991); Co-Chairman and a founder of the Group of Seven Council (G7C) (international economic commission); formerly Chairperson of the Audit Committee (July 1991-September 2006), Vice Chairman of the Board of Governors of the Federal Reserve System and Assistant Secretary of the U.S. Treasury. | 100 | Director of NVR, Inc. (home construction). | ||||||||||||||||||
| Joseph J. Kearns (73) c/o Kearns & Associates LLC 23823 Malibu Road S-50-440 Malibu, CA 90265 | Director | Since August 1994 | President, Kearns & Associates LLC (investment consulting); Chairperson of the Audit Committee (since October 2006) and Director or Trustee of various Morgan Stanley Funds (since August 1994); formerly, Deputy Chairperson of the Audit Committee (July 2003-September 2006) and Chairperson of the Audit Committee of various Morgan Stanley Funds (since August 1994); CFO of the J. Paul Getty Trust. | 101 | Director of Electro Rent Corporation (equipment leasing). Prior to December 31, 2013, Director of The Ford Family Foundation. | ||||||||||||||||||
29
Morgan Stanley Institutional Fund, Inc.
Annual Report — December 31, 2015
Director and Officer Information (unaudited) (cont'd)
Independent Directors: (cont'd)
| Name, Age and Address of Independent Director | Positions(s) Held with Registrant | Length of Time Served* | Principal Occupation(s) During Past 5 Years and Other Relevant Professional Experience | Number of Portfolios in Fund Complex Overseen by Director** | Other Directorships Held by Independent Director*** | ||||||||||||||||||
| Michael F. Klein (57) c/o Kramer Levin Naftalis & Frankel LLP Counsel to the Independent Directors 1177 Avenue of the Americas New York, NY 10036 | Director | Since August 2006 | Managing Director, Aetos Capital, LLC (since March 2000); Co-President, Aetos Alternatives Management, LLC (since January 2004); and Co-Chief Executive Officer of Aetos Capital LLC (since August 2013); Chairperson of the Fixed Income Sub-Committee of the Investment Committee (since October 2006) and Director or Trustee of various Morgan Stanley Funds (since August 2006); formerly, Managing Director, Morgan Stanley & Co. Inc. and Morgan Stanley Dean Witter Investment Management, President, various Morgan Stanley Funds (June1998-March 2000) and Principal, Morgan Stanley & Co. Inc. and Morgan Stanley Dean Witter Investment Management (August 1997-December 1999). | 97 | Director of certain investment funds managed or sponsored by Aetos Capital, LLC. Director of Sanitized AG and Sanitized Marketing AG (specialty chemicals). | ||||||||||||||||||
| Michael E. Nugent (79) 522 Fifth Avenue New York, NY 10036 | Chair of the Board and Director | Chair of the Boards since July 2006 and Director since July 1991 | Chair of the Boards of various Morgan Stanley Funds (since July 2006); Chairperson of the Closed-End Fund Committee (since June 2012) and Director or Trustee of various Morgan Stanley Funds (since July 1991); formerly, Chairperson of the Insurance Committee (until July 2006), General Partner, TriumphCapital, L.P. (private investment partnership) (1988-2013). | 100 | None. | ||||||||||||||||||
| W. Allen Reed (68) c/o Kramer Levin Naftalis & Frankel LLP Counsel to the Independent Directors 1177 Avenue of the Americas New York, NY 10036 | Director | Since August 2006 | Chairperson of the Equity Sub-Committee of the Investment Committee (since October 2006) and Director or Trustee of various Morgan Stanley Funds (since August 2006); formerly, President and CEO of General Motors Asset Management; Chairman and Chief Executive Officer of the GM Trust Bank and Corporate Vice President of General Motors Corporation (August 1994-December 2005). | 98 | Director of Legg Mason, Inc.; formerly Director of the Auburn University Foundation (2010-2015). | ||||||||||||||||||
| Fergus Reid (83) c/o Joe Pietryka, Inc. 85 Charles Colman Blvd. Pawling, NY 12564 | Director | Since June 1992 | Chairman, Joe Pietryka, Inc.; Chairperson of the Governance Committee and Director or Trustee of various Morgan Stanley Funds (since June 1992). | 100 | Formerly, Trustee and Director of certain investment companies in the JP Morgan Fund Complex managed by JP Morgan Investment Management Inc. (1987-2012). | ||||||||||||||||||
30
Morgan Stanley Institutional Fund, Inc.
Annual Report — December 31, 2015
Director and Officer Information (unaudited) (cont'd)
Interested Director:
| Name, Age and Address of Interested Director | Positions(s) Held with Registrant | Length of Time Served* | Principal Occupation(s) During Past 5 Years | Number of Portfolios in Fund Complex Overseen by Interested Director** | Other Directorships Held by Interested Director*** | ||||||||||||||||||
| James F. Higgins (68) One New York Plaza, New York, NY 10004 | Director | Since June 2000 | Director or Trustee of various Morgan Stanley Funds (since June 2000); Senior Advisor of Morgan Stanley (since August 2000). | 99 | Formerly, Director of AXA Financial, Inc. and AXA Equitable Life Insurance Company (2002-2011) and Director of AXA MONY Life Insurance Company and AXA MONY Life Insurance Company of America (2004-2011). | ||||||||||||||||||
* This is the earliest date the Director began serving the Morgan Stanley Funds. Each Director serves an indefinite term, until his or her successor is elected.
** The Fund Complex includes (as of December 31, 2015) all open-end and closed-end funds (including all of their portfolios) advised by Morgan Stanley Investment Management Inc. (the "Adviser") and any funds that have an adviser that is an affiliated person of the Adviser (including, but not limited to, Morgan Stanley AIP GP LP).
*** This includes any directorships at public companies and registered investment companies held by the Director at any time during the past five years.
Executive Officers:
Name, Age and Address of Executive Officer | Position(s) Held with Registrant | Length of Time Served**** | Principal Occupation(s) During Past 5 Years | ||||||||||||
| John H. Gernon (52) 522 Fifth Avenue New York, NY 10036 | President and Principal Executive Officer | Since September 2013 | President and Principal Executive Officer of the Equity and Fixed Income Funds and the Morgan Stanley AIP Funds (since September 2013) and the Liquidity Funds and various money market funds (since May 2014) in the Fund Complex, Managing Director of the Adviser; Head of Product (since 2006). | ||||||||||||
| Stefanie V. Chang Yu (49) 522 Fifth Avenue New York, NY 10036 | Chief Compliance Officer | Since December 1997 | Managing Director of the Adviser and various entities affiliated with the Adviser; Chief Compliance Officer of various Morgan Stanley Funds and the Adviser (since January 2014); formerly, Vice President of various Morgan Stanley Funds (December 1997-January 2014). | ||||||||||||
| Joseph C. Benedetti (50) 522 Fifth Avenue New York, NY 10036 | Vice President | Since January 2014 | Managing Director of the Adviser and various entities affiliated with the Adviser; Vice President of various Morgan Stanley Funds (since January 2014); formerly, Assistant Secretary of various Morgan Stanley Funds (October 2004-January 2014). | ||||||||||||
| Francis J. Smith (50) 522 Fifth Avenue New York, NY 10036 | Treasurer and Principal Financial Officer | Treasurer since July 2003 and Principal Financial Officer since September 2002 | Executive Director of the Adviser and various entities affiliated with the Adviser; Treasurer (since July 2003) and Principal Financial Officer of various Morgan Stanley Funds (since September 2002). | ||||||||||||
| Mary E. Mullin (48) 522 Fifth Avenue New York, NY 10036 | Secretary | Since June 1999 | Executive Director of the Adviser; Secretary of various Morgan Stanley Funds (since June 1999). | ||||||||||||
**** This is the earliest date the officer began serving the Morgan Stanley Funds. Each officer serves a one-year term, until his or her successor is elected and has qualified.
31
Morgan Stanley Institutional Fund, Inc.
Annual Report — December 31, 2015
Adviser and Administrator
Morgan Stanley Investment Management Inc.
522 Fifth Avenue
New York, New York 10036
Sub-Advisers
Morgan Stanley Investment Management Limited
25 Cabot Square, Canary Wharf
London, E14 4QA, England
Morgan Stanley Investment Management Company
23 Church Street
16-01 Capital Square, Singapore 049481
Distributor
Morgan Stanley Distribution, Inc.
522 Fifth Avenue
New York, New York 10036
Dividend Disbursing and Transfer Agent
Boston Financial Data Services, Inc.
2000 Crown Colony Drive
Quincy, Massachusetts 02169
Custodian
State Street Bank and Trust Company
One Lincoln Street
Boston, Massachusetts 02111
Legal Counsel
Dechert LLP
1095 Avenue of the Americas
New York, New York 10036
Counsel to the Independent Directors
Kramer Levin Naftalis & Frankel LLP
1177 Avenue of the Americas
New York, New York 10036
Independent Registered Public Accounting Firm
Ernst & Young LLP
200 Clarendon Street
Boston, Massachusetts 02116
Reporting to Shareholders
Each Morgan Stanley fund provides a complete schedule of portfolio holdings in its semi-annual and annual reports within 60 days of the end of the fund's second and fourth fiscal quarters. The semi-annual and annual reports are filed electronically with the Securities and Exchange Commission (SEC) on Form N-CSRS and Form N-CSR, respectively. Morgan Stanley also delivers the semi-annual and annual reports to fund shareholders and makes these reports available on its public website, www.morganstanley.com/im. Each Morgan Stanley fund also files a complete schedule of portfolio holdings with the SEC for the fund's first and third fiscal quarters on Form N-Q. Morgan Stanley does not deliver the reports for the first and third fiscal quarters to shareholders, nor are the reports posted to the Morgan Stanley public website. You may, however, obtain the Form N-Q filings (as well as the Form N-CSR and N-CSRS filings) by accessing the SEC's website, www.sec.gov. You may also review and copy them at the SEC's Public Reference Room in Washington, DC. Information on the operation of the SEC's Public Reference Room may be obtained by calling the SEC toll free at 1 (800) SEC-0330. You can also request copies of these materials, upon payment of a duplicating fee, by electronic request at the SEC's email address (publicinfo@sec.gov) or by writing the Public Reference Room of the SEC, Washington, DC 20549-0102.
Proxy Voting Policies and Procedures and Proxy Voting Record
You may obtain a copy of the Fund's Proxy Voting Policy and Procedures and information regarding how the Fund voted proxies relating to portfolio securities during the most recent twelve-month period ended June 30, without charge, upon request, by calling toll free 1 (800) 548-7786 or by visiting our website at www.morganstanley.com/im. This information is also available on the SEC's website at www.sec.gov.
This report is authorized for distribution only when preceded or accompanied by a prospectus of the Morgan Stanley Institutional Fund, Inc., which describes in detail each Portfolio's investment policies, risks, fees and expenses. Please read the prospectus carefully before you invest or send money. For additional information, including information regarding the investments comprising the Portfolio, please visit our website at www.morganstanley.com/im or call toll free 1 (800) 548-7786.
32
Printed in U.S.A.
This Report has been prepared for shareholders and may be distributed to others only if preceded or accompanied by a current prospectus.
Morgan Stanley Investment Management Inc.
522 Fifth Avenue
New York, New York 10036
© 2016 Morgan Stanley. Morgan Stanley Distribution, Inc.

IFIEMLANN
1406902 EXP. 02.28.17
INVESTMENT MANAGEMENT

Morgan Stanley Institutional Fund, Inc.
Growth Portfolio
Annual Report
December 31, 2015

Morgan Stanley Institutional Fund, Inc.
Annual Report — December 31, 2015
Table of Contents
Shareholders' Letter | 2 | ||||||
Expense Example | 3 | ||||||
Investment Overview | 4 | ||||||
Portfolio of Investments | 7 | ||||||
Statement of Assets and Liabilities | 9 | ||||||
Statement of Operations | 11 | ||||||
Statements of Changes in Net Assets | 12 | ||||||
Financial Highlights | 14 | ||||||
Notes to Financial Statements | 19 | ||||||
Report of Independent Registered Public Accounting Firm | 31 | ||||||
Federal Tax Notice | 32 | ||||||
U.S. Privacy Policy | 33 | ||||||
Director and Officer Information | 36 | ||||||
This report is authorized for distribution only when preceded or accompanied by prospectuses of the Morgan Stanley Institutional Fund, Inc. To receive a prospectus and/or statement of additional information (SAI), which contains more complete information such as investment objectives, charges, expenses, policies for voting proxies, risk considerations, and describes in detail each of the Portfolio's investment policies to the prospective investor, please call toll free 1 (800) 548-7786. Please read the prospectuses carefully before you invest or send money.
Additionally, you can access portfolio information including performance, characteristics, and investment team commentary through Morgan Stanley Investment Management's website: www.morganstanley.com/im.
Market forecasts provided in this report may not necessarily come to pass. There is no guarantee that any sectors mentioned will continue to perform as discussed herein or that securities in such sectors will be held by the Portfolio in the future. There is no assurance that a Portfolio will achieve its investment objective. Portfolios are subject to market risk, which is the possibility that market values of securities owned by the Portfolio will decline and, therefore, the value of the Portfolio's shares may be less than what you paid for them. Accordingly, you can lose money investing in this Portfolio. Please see the prospectus for more complete information on investment risks.
1
Morgan Stanley Institutional Fund, Inc.
Annual Report — December 31, 2015
Shareholders' Letter (unaudited)
Dear Shareholders,
We are pleased to provide this Annual report, in which you will learn how your investment in Growth Portfolio (the "Portfolio") performed during the latest twelve-month period.
Morgan Stanley Investment Management is a client-centric, investor-led organization. Our global presence, intellectual capital, and breadth of products and services enable us to partner with investors to meet the evolving challenges of today's financial markets. We aim to deliver superior investment service and to empower our clients to make the informed decisions that help them reach their investment goals.
As always, we thank you for selecting Morgan Stanley Investment Management, and look forward to working with you in the months and years ahead.
Sincerely,

John H. Gernon
President and Principal Executive Officer
January 2016
2
Morgan Stanley Institutional Fund, Inc.
Annual Report — December 31, 2015
Expense Example (unaudited)
Growth Portfolio
As a shareholder of the Portfolio, you incur two types of costs: (1) transactional costs and (2) ongoing costs, including advisory fees, administration fees, distribution and shareholder services fees and other Portfolio expenses. This example is intended to help you understand your ongoing costs (in dollars) of investing in the Portfolio and to compare these costs with the ongoing costs of investing in other mutual funds.
This example is based on an investment of $1,000 invested at the beginning of the six-month period ended December 31, 2015 and held for the entire six-month period.
Actual Expenses
The table below provides information about actual account values and actual expenses. You may use the information in this table, together with the amount you invested, to estimate the expenses that you paid over the period. Simply divide your account value by $1,000 (for example, an $8,600 account value divided by $1,000 = 8.6), then multiply the result by the number in the table under the heading entitled "Actual Expenses Paid During Period" to estimate the expenses you paid on your account during this period.
Hypothetical Example for Comparison Purposes
The table below provides information about hypothetical account values and hypothetical expenses based on the Portfolio's actual expense ratio and an assumed rate of return of 5% per year before expenses, which is not the Portfolio's actual return. The hypothetical account values and expenses may not be used to estimate the actual ending account balance or expenses you paid for the period. You may use this information to compare the ongoing costs of investing in the Portfolio and other funds. To do so, compare this 5% hypothetical example with the 5% hypothetical examples that appear in the shareholder reports of the other funds.
Please note that the expenses shown in the table are meant to highlight your ongoing costs only and do not reflect any transactional costs, such as sales charges (loads). Therefore, the information for each class in the table is useful in comparing ongoing costs only, and will not help you determine the relative total costs of owning different funds. In addition, if these transactional costs were included, your costs would have been higher.
| Beginning Account Value 7/1/15 | Actual Ending Account Value 12/31/15 | Hypothetical Ending Account Value | Actual Expenses Paid During Period* | Hypothetical Expenses Paid During Period* | Net Expense Ratio During Period** | ||||||||||||||||||||||
Growth Portfolio Class I | $ | 1,000.00 | $ | 1,030.50 | $ | 1,022.03 | $ | 3.22 | $ | 3.21 | 0.63 | % | |||||||||||||||
Growth Portfolio Class A | 1,000.00 | 1,028.30 | 1,020.06 | 5.21 | 5.19 | 1.02 | |||||||||||||||||||||
Growth Portfolio Class L | 1,000.00 | 1,024.80 | 1,016.74 | 8.57 | 8.54 | 1.68 | |||||||||||||||||||||
Growth Portfolio Class C | 1,000.00 | 1,025.10 | 1,017.09 | 8.22 | 8.19 | 1.61 | |||||||||||||||||||||
Growth Portfolio Class IS | 1,000.00 | 1,030.70 | 1,022.43 | 2.82 | 2.80 | 0.55 | |||||||||||||||||||||
* Expenses are calculated using each Portfolio Class' annualized net expense ratio (as disclosed), multiplied by the average account value over the period, and multiplied by 184/365 (to reflect the most recent one-half year period).
** Annualized.
3
Morgan Stanley Institutional Fund, Inc.
Annual Report — December 31, 2015
Investment Overview (unaudited)
Growth Portfolio
The Portfolio seeks long-term capital appreciation by investing primarily in growth-oriented equity securities of large capitalization companies.
Performance
For the year ended December 31, 2015, the Portfolio's Class I shares had a total return based on net asset value and reinvestment of distributions per share of 11.91%, net of fees. The Portfolio's Class I shares outperformed the Portfolio's benchmark, the Russell 1000® Growth Index (the "Index"), which returned 5.67%.
Factors Affecting Performance
• The broad stock market ended the 12-month period at nearly the same level where it started, masking the considerable gyrations stock prices endured in between. The anticipation of the U.S. Federal Reserve's (Fed) first rate increase, the persistent slide in commodity prices, and global economic weakness, especially in China, weighed on the market throughout the period. Although U.S. economic data were mixed throughout the period, the economy's slow recovery continued, sufficiently that the Fed decided in December to raise its main policy interest rate, after keeping it near zero since December 2008 to stimulate growth.
• Slowing corporate earnings growth and a record year for merger and acquisition deals dominated the business headlines. Falling oil and raw materials prices caused considerable tumult for share prices in the energy, materials and industrials sectors. Although expectations were that consumer-oriented companies would benefit from consumers spending less at the gas pump, the boost to discretionary spending disappointed as consumers tended to pocket the savings. The U.S. dollar's strength relative to other major currencies, propelled by the Fed's move to a tightening stance while other global central banks were easing, also hurt the profits of U.S. multinational companies. Their foreign sales are worth less when translated back into U.S. dollars, and overseas demand is crimped when U.S. products become more expensive.
• Although our focus remains on our bottom-up stock selection process, both stock selection and sector allocation had a strongly positive impact on relative performance during the period.
• The consumer discretionary sector contributed nearly all of the Portfolio's outperformance relative to the Index during this period. Performance was led by a holding in an online retail and cloud computing leader. The company reported strong quarterly results, with revenue and profit growth in both its core retail business and its web services business ahead of Wall Street expectations. Given its brand and scale competitive advantages, we believe the company is well positioned to continue gaining market share.
• The Portfolio benefited to a much smaller degree from an underweight in the industrials sector, a lack of exposure to the energy sector, stock selection in the financials sector and an overweight position in the information technology sector.
• Only two sectors detracted from relative performance during the period. The consumer staples sector was the larger detractor, driven primarily by unfavorable stock selection and a small relative loss from an underweight to the sector. A position in a leading single-serve coffee provider was the biggest drag on results in the sector. The company's poor execution around the launch of its 2.0 coffee brewer resulted in weaker-than-expected fundamentals, and both the price point and timeline to launch its new cold beverage system had also disappointed investors. Although the shares spiked in early December on news that the company agreed to be acquired by a privately held company at an 80 percent premium, the stock detracted from performance for the period overall.
• Stock selection in the health care sector was also disadvantageous to performance during the period. A specialty drug maker led the group lower, as its shares were plagued by growing drug pricing scrutiny across the industry, which we believe has largely been a function of a more politically sensitive environment ahead of the 2016 U.S. presidential elections. During October, the shares declined further due to allegations regarding its relationships and business practices with specialty pharmacies. We eliminated the position during the month, due to our assessment of the relative risk/reward profile.
4
Morgan Stanley Institutional Fund, Inc.
Annual Report — December 31, 2015
Investment Overview (unaudited) (cont'd)
Growth Portfolio
Management Strategies
• There were no changes to our bottom-up investment process during the period. We continued to look for high-quality growth companies that we believe have these attributes: sustainable competitive advantages, above-average business visibility, rising return on invested capital, strong free cash flow generation and a favorable risk/reward profile. We find these companies through intense fundamental research. Our emphasis is on secular growth, and as a result short-term market events are not as meaningful in the stock selection process.
• The long-term investment horizon and conviction-weighted investment approach embraced by the team since 1998 can result in periods of performance deviation from the benchmark and peers, as was the case during this reporting period. Our team continues to focus on bottom-up stock selection and the long-term outlook for companies owned in the Portfolio; accordingly, we have had very little turnover in the Portfolio to date, as our ongoing work reaffirms our assessment of quality and competitive advantage in the names we own.

* Minimum Investment for Class I shares
In accordance with SEC regulations, the Portfolio's performance shown assumes that all recurring fees (including management fees) were deducted and all dividends and distributions were reinvested. The performance of Class A, L, C and IS shares will vary from the performance of Class I shares based upon their different inception dates and will be negatively impacted by additional fees assessed to those classes (if applicable).
Performance Compared to the Russell 1000® Growth Index(1) and the Lipper Large-Cap Growth Funds Index(2)
| Period Ended December 31, 2015 Total Returns(3) | |||||||||||||||||||
Average Annual | |||||||||||||||||||
| One Year | Five Years | Ten Years | Since Inception(9) | ||||||||||||||||
| Portfolio — Class I Shares w/o sales charges(4) | 11.91 | % | 14.70 | % | 9.64 | % | 10.42 | % | |||||||||||
| Portfolio — Class A Shares w/o sales charges(5) | 11.53 | 14.41 | 9.38 | 9.21 | |||||||||||||||
| Portfolio — Class A Shares with maximum 5.25% sales charges(5) | 5.68 | 13.18 | 8.79 | 8.92 | |||||||||||||||
| Portfolio — Class L Shares w/o sales charges(6) | 10.85 | — | — | 14.71 | |||||||||||||||
| Portfolio — Class C Shares w/o sales charges(8) | — | — | — | 2.71 | |||||||||||||||
| Portfolio — Class C Shares with maximum 1.00% deferred sales charges(8) | — | — | — | 1.76 | |||||||||||||||
| Portfolio — Class IS Shares w/o sales charges(7) | 11.97 | — | — | 15.29 | |||||||||||||||
Russell 1000® Growth Index | 5.67 | 13.53 | 8.53 | 8.64 | |||||||||||||||
Lipper Large-Cap Growth Funds Index | 5.61 | 12.17 | 7.17 | 8.02 | |||||||||||||||
Performance data quoted represents past performance, which is no guarantee of future results, and current performance may be lower or higher than the figures shown. Performance assumes that all dividends and distributions, if any, were reinvested. For the most recent month-end performance figures, please visit www.morganstanley.com/im. Investment return and principal value will fluctuate so that Portfolio shares, when redeemed, may be worth more or less than their original cost. Total returns do not reflect the deduction of taxes that a shareholder would pay on Portfolio distributions or the redemption of Portfolio shares. Returns for periods less than one year are not annualized. Performance of share classes will vary due to difference in sales charges and expenses.
(1) The Russell 1000® Growth Index measures the performance of the large-cap growth segment of the U.S. equity universe. It includes those Russell 1000® Index companies with higher price-to-book ratios and higher forecasted growth values. The Russell 1000® Index is an index of approximately 1,000 of the largest U.S. companies based on a combination of market capitalization and current index membership. The Index is unmanaged and its returns do not include any sales charges or fees. Such costs would lower performance. It is not possible to invest directly in an index.
(2) The Lipper Large-Cap Growth Funds Index is an equally weighted performance index of the largest qualifying funds (based on net assets) in the Lipper Large-Cap Growth Funds classification. The Index, which is adjusted for capital gains distributions and income dividends, is unmanaged and should not be considered an investment. There are currently 30 funds represented in this Index. As of the date of this report, the Portfolio is in the Lipper Large-Cap Growth Funds classification.
(3) Total returns for the Portfolio reflect fees waived and expenses reimbursed, if applicable, by the Adviser. Without such waivers and reimbursements, total returns would have been lower.
(4) Commenced operations on April 2, 1991.
(5) Commenced offering on January 2, 1996.
5
Morgan Stanley Institutional Fund, Inc.
Annual Report — December 31, 2015
Investment Overview (unaudited) (cont'd)
Growth Portfolio
(6) Commenced offering on April 27, 2012.
(7) Commenced offering on September 13, 2013.
(8) Commenced offering on April 30, 2015.
(9) For comparative purposes, average annual since inception returns listed for the Indexes refer to the inception date of Class I of the Portfolio, not the inception of the Index.
6
Morgan Stanley Institutional Fund, Inc.
Annual Report — December 31, 2015
Portfolio of Investments
Growth Portfolio
Shares | Value (000) | ||||||||||
Common Stocks (92.0%) | |||||||||||
Automobiles (4.1%) | |||||||||||
Tesla Motors, Inc. (a)(b) | 619,699 | $ | 148,734 | ||||||||
Beverages (3.0%) | |||||||||||
Monster Beverage Corp. (a) | 738,240 | 109,968 | |||||||||
Biotechnology (0.9%) | |||||||||||
Alnylam Pharmaceuticals, Inc. (a) | 184,894 | 17,406 | |||||||||
Intrexon Corp. (a)(b) | 448,885 | 13,534 | |||||||||
30,940 | |||||||||||
Consumer Finance (0.7%) | |||||||||||
LendingClub Corp. (a) | 2,332,499 | 25,774 | |||||||||
Diversified Financial Services (2.6%) | |||||||||||
McGraw Hill Financial, Inc. | 941,489 | 92,812 | |||||||||
Electrical Equipment (0.5%) | |||||||||||
SolarCity Corp. (a)(b) | 349,991 | �� | 17,857 | ||||||||
Food & Staples Retailing (1.4%) | |||||||||||
Walgreens Boots Alliance, Inc. | 602,400 | 51,297 | |||||||||
Food Products (4.5%) | |||||||||||
Keurig Green Mountain, Inc. | 726,080 | 65,333 | |||||||||
Mead Johnson Nutrition Co. | 1,251,958 | 98,842 | |||||||||
164,175 | |||||||||||
Health Care Equipment & Supplies (3.9%) | |||||||||||
Intuitive Surgical, Inc. (a) | 259,045 | 141,480 | |||||||||
Health Care Technology (1.5%) | |||||||||||
athenahealth, Inc. (a) | 341,232 | 54,928 | |||||||||
Information Technology Services (7.6%) | |||||||||||
Mastercard, Inc., Class A | 1,694,917 | 165,017 | |||||||||
Visa, Inc., Class A | 1,415,554 | 109,776 | |||||||||
274,793 | |||||||||||
Internet & Catalog Retail (16.4%) | |||||||||||
Amazon.com, Inc. (a) | 498,975 | 337,252 | |||||||||
JD.com, Inc. ADR (China) (a) | 1,242,902 | 40,102 | |||||||||
Netflix, Inc. (a) | 867,625 | 99,239 | |||||||||
Priceline Group, Inc. (The) (a) | 92,049 | 117,358 | |||||||||
593,951 | |||||||||||
Internet Software & Services (21.2%) | |||||||||||
Alibaba Group Holding Ltd. ADR (China) (a) | 507,821 | 41,271 | |||||||||
Alphabet, Inc., Class C (a) | 235,253 | 178,529 | |||||||||
Facebook, Inc., Class A (a) | 2,831,659 | 296,361 | |||||||||
LinkedIn Corp., Class A (a) | 650,806 | 146,483 | |||||||||
Twitter, Inc. (a) | 4,643,543 | 107,452 | |||||||||
770,096 | |||||||||||
Life Sciences Tools & Services (4.9%) | |||||||||||
Illumina, Inc. (a) | 928,056 | 178,136 | |||||||||
Media (1.8%) | |||||||||||
| Legend Pictures LLC Ltd. (a)(c)(d)(e) (acquisition cost — $20,782; acquired 10/15/14) | 9,806 | 13,688 | |||||||||
Naspers Ltd., Class N (South Africa) | 388,003 | 53,050 | |||||||||
66,738 | |||||||||||
Shares | Value (000) | ||||||||||
Pharmaceuticals (3.1%) | |||||||||||
Zoetis, Inc. | 2,329,773 | $ | 111,643 | ||||||||
Software (7.2%) | |||||||||||
Mobileye N.V. (a)(b) | 377,869 | 15,976 | |||||||||
Salesforce.com, Inc. (a) | 1,593,554 | 124,935 | |||||||||
Splunk, Inc. (a) | 569,332 | 33,483 | |||||||||
Workday, Inc., Class A (a) | 1,112,630 | 88,654 | |||||||||
263,048 | |||||||||||
Tech Hardware, Storage & Peripherals (5.6%) | |||||||||||
Apple, Inc. | 1,946,885 | 204,929 | |||||||||
Textiles, Apparel & Luxury Goods (1.1%) | |||||||||||
Michael Kors Holdings Ltd. (a) | 953,885 | 38,213 | |||||||||
Total Common Stocks (Cost $2,057,319) | 3,339,512 | ||||||||||
Preferred Stocks (3.9%) | |||||||||||
Electronic Equipment, Instruments & Components (0.5%) | |||||||||||
| Magic Leap Series C (a)(c)(d)(e) (acquisition cost — $18,812; acquired 12/22/15) | 816,725 | 18,812 | |||||||||
Internet & Catalog Retail (3.3%) | |||||||||||
| Airbnb, Inc. Series D (a)(c)(d)(e) (acquisition cost — $20,638; acquired 4/16/14) | 506,928 | 42,404 | |||||||||
| Flipkart Online Services Pvt Ltd. Series F (a)(c)(d)(e) (acquisition cost — $15,000; acquired 8/18/14) | 207,900 | 21,615 | |||||||||
| Uber Techonologies Series G (a)(c)(d)(e) (acquisition cost — $54,173; acquired 12/3/15) | 1,110,729 | 54,173 | |||||||||
118,192 | |||||||||||
Internet Software & Services (0.1%) | |||||||||||
| Dropbox, Inc. Series C (a)(c)(d)(e) (acquisition cost — $7,182; acquired 1/30/14) | 375,979 | 5,384 | |||||||||
Total Preferred Stocks (Cost $115,805) | 142,388 | ||||||||||
| Notional Amount | |||||||||||
Call Option Purchased (0.2%) | |||||||||||
Foreign Currency Option (0.2%) | |||||||||||
| USD/CNY June 2016 @ CNY 6.70, Royal Bank of Scotland (Cost $1,856) | 476,779,214 | 8,225 | |||||||||
Shares | |||||||||||
Short-Term Investments (9.1%) | |||||||||||
Securities held as Collateral on Loaned Securities (4.9%) | |||||||||||
Investment Company (4.2%) | |||||||||||
| Morgan Stanley Institutional Liquidity Funds — Treasury Securities Portfolio — Institutional Class (See Note G) | 151,758,866 | 151,759 | |||||||||
The accompanying notes are an integral part of the financial statements.
7
Morgan Stanley Institutional Fund, Inc.
Annual Report — December 31, 2015
Portfolio of Investments (cont'd)
Growth Portfolio
| Face Amount (000) | Value (000) | ||||||||||
Repurchase Agreements (0.7%) | |||||||||||
| Barclays Capital, Inc., (0.32%, dated 12/31/15, due 1/4/16; proceeds $6,543; fully collateralized by a U.S. Government obligation; 2.00% due 11/30/22; valued at $6,674) | $ | 6,543 | $ | 6,543 | |||||||
| Merrill Lynch & Co., Inc., (0.31%, dated 12/31/15, due 1/4/16; proceeds $19,017; fully collateralized by a U.S. Government agency security; 4.00% due 11/20/45; valued at $19,397) | 19,017 | 19,017 | |||||||||
25,560 | |||||||||||
| Total Securities held as Collateral on Loaned Securities (Cost $177,319) | 177,319 | ||||||||||
Shares | |||||||||||
Investment Company (4.2%) | |||||||||||
| Morgan Stanley Institutional Liquidity Funds — Money Market Portfolio — Institutional Class (See Note G) (Cost $151,070) | 151,070,026 | 151,070 | |||||||||
Total Short-Term Investments (Cost $328,389) | 328,389 | ||||||||||
| Total Investments (105.2%) (Cost $2,503,369) Including $175,431 of Securities Loaned (f)(g) | 3,818,514 | ||||||||||
Liabilities in Excess of Other Assets (–5.2%) | (188,606 | ) | |||||||||
Net Assets (100.0%) | $ | 3,629,908 | |||||||||
(a) Non-income producing security.
(b) All or a portion of this security was on loan at December 31, 2015.
(c) Security has been deemed illiquid at December 31, 2015.
(d) Security cannot be offered for public resale without first being registered under the Securities Act of 1933 and related rules ("restricted security"). Acquisition date represents the day on which an enforceable right to acquire such security is obtained and is presented along with related cost in the security description. The Portfolio has registration rights for certain restricted securities. Any costs related to such registration are borne by the issuer. The aggregate value of restricted securities (excluding 144A holdings) at December 31, 2015 amounts to approximately $156,076,000 and represents 4.3% of net assets.
(e) At December 31, 2015, the Portfolio held fair valued securities valued at approximately $156,076,000, representing 4.3% of net assets. These securities have been fair valued as determined in good faith under procedures established by and under the general supervision of the Fund's Directors.
(f) The approximate fair value and percentage of net assets, $53,050,000 and 1.5%, respectively, represent the securities that have been fair valued under the fair valuation policy for international investments as described in Note A-1 within the Notes to the Financial Statements.
(g) At December 31, 2015, the aggregate cost for Federal income tax purposes is approximately $2,506,215,000. The aggregate gross unrealized appreciation is approximately $1,451,584,000 and the aggregate gross unrealized depreciation is approximately $139,285,000 resulting in net unrealized appreciation of approximately $1,312,299,000.
ADR — American Depositary Receipt.
CNY — Chinese Yuan Renminbi
USD — United States Dollar
Portfolio Composition*
Classification | Percentage of Total Investments | ||||||
Other** | 38.7 | % | |||||
Internet Software & Services | 21.3 | ||||||
Internet & Catalog Retail | 19.6 | ||||||
Information Technology Services | 7.6 | ||||||
Software | 7.2 | ||||||
Tech Hardware, Storage & Peripherals | 5.6 | ||||||
Total Investments | 100.0 | % | |||||
* Percentages indicated are based upon total investments (excluding Securities held as Collateral on Loaned Securities) as of December 31, 2015.
** Industries and/or investment types representing less than 5% of total investments.
The accompanying notes are an integral part of the financial statements.
8
Morgan Stanley Institutional Fund, Inc.
Annual Report — December 31, 2015
Growth Portfolio
Statement of Assets and Liabilities | December 31, 2015 (000) | ||||||
Assets: | |||||||
Investments in Securities of Unaffiliated Issuers, at Value(1) (Cost $2,200,540) | $ | 3,515,685 | |||||
Investments in Securities of Affiliated Issuer, at Value (Cost $302,829) | 302,829 | ||||||
Total Investments in Securities, at Value (Cost $2,503,369) | 3,818,514 | ||||||
Receivable for Portfolio Shares Sold | 3,846 | ||||||
Dividends Receivable | 539 | ||||||
Tax Reclaim Receivable | 493 | ||||||
Receivable from Affiliate | 32 | ||||||
Other Assets | 162 | ||||||
Total Assets | 3,823,586 | ||||||
Liabilities: | |||||||
Collateral on Securities Loaned, at Value | 177,319 | ||||||
Due to Broker | 8,340 | ||||||
Payable for Advisory Fees | 3,899 | ||||||
Payable for Portfolio Shares Redeemed | 2,507 | ||||||
Payable for Sub Transfer Agency Fees — Class I | 158 | ||||||
Payable for Sub Transfer Agency Fees — Class A | 342 | ||||||
Payable for Sub Transfer Agency Fees — Class L | 57 | ||||||
Payable for Sub Transfer Agency Fees — Class C | — | @ | |||||
Payable for Shareholder Services Fees — Class A | 349 | ||||||
Payable for Distribution and Shareholder Services Fees — Class L | 57 | ||||||
Payable for Distribution and Shareholder Services Fees — Class C | 10 | ||||||
Payable for Administration Fees | 248 | ||||||
Payable for Directors' Fees and Expenses | 59 | ||||||
Payable for Custodian Fees | 31 | ||||||
Payable for Transfer Agency Fees — Class I | 7 | ||||||
Payable for Transfer Agency Fees — Class A | 1 | ||||||
Payable for Transfer Agency Fees — Class L | 6 | ||||||
Payable for Transfer Agency Fees — Class C | — | @ | |||||
Payable for Transfer Agency Fees — Class IS | 1 | ||||||
Payable for Professional Fees | 13 | ||||||
Other Liabilities | 274 | ||||||
Total Liabilities | 193,678 | ||||||
Net Assets | $ | 3,629,908 | |||||
Net Assets Consist Of: | |||||||
Paid-in-Capital | $ | 2,121,473 | |||||
Accumulated Net Investment Loss | (671 | ) | |||||
Accumulated Net Realized Gain | 193,961 | ||||||
Unrealized Appreciation (Depreciation) on: | |||||||
Investments | 1,315,145 | ||||||
Net Assets | $ | 3,629,908 | |||||
The accompanying notes are an integral part of the financial statements.
9
Morgan Stanley Institutional Fund, Inc.
Annual Report — December 31, 2015
Growth Portfolio
Statement of Assets and Liabilities (cont'd) | December 31, 2015 (000) | ||||||
CLASS I: | |||||||
Net Assets | $ | 876,660 | |||||
| Shares Outstanding $0.001 par value shares of beneficial interest (unlimited shares authorized) (not in 000's) | 21,679,889 | ||||||
Net Asset Value, Offering and Redemption Price Per Share | $ | 40.44 | |||||
CLASS A: | |||||||
Net Assets | $ | 1,630,538 | |||||
| Shares Outstanding $0.001 par value shares of beneficial interest (unlimited shares authorized) (not in 000's) | 41,482,588 | ||||||
Net Asset Value, Redemption Price Per Share | $ | 39.31 | |||||
Maximum Sales Load | 5.25 | % | |||||
Maximum Sales Charge | $ | 2.18 | |||||
Maximum Offering Price Per Share | $ | 41.49 | |||||
CLASS L: | |||||||
Net Assets | $ | 89,277 | |||||
| Shares Outstanding $0.001 par value shares of beneficial interest (unlimited shares authorized) (not in 000's) | 2,324,245 | ||||||
Net Asset Value, Offering and Redemption Price Per Share | $ | 38.41 | |||||
CLASS C: | |||||||
Net Assets | $ | 13,544 | |||||
| Shares Outstanding $0.001 par value shares of beneficial interest (unlimited shares authorized) (not in 000's) | 352,672 | ||||||
Net Asset Value, Offering and Redemption Price Per Share | $ | 38.40 | |||||
CLASS IS: | |||||||
Net Assets | $ | 1,019,889 | |||||
| Shares Outstanding $0.001 par value shares of beneficial interest (unlimited shares authorized) (not in 000's) | 25,158,267 | ||||||
Net Asset Value, Offering and Redemption Price Per Share | $ | 40.54 | |||||
| (1) Including: Securities on Loan, at Value: | $ | 175,431 | |||||
@ Amount is less than $500.
The accompanying notes are an integral part of the financial statements.
10
Morgan Stanley Institutional Fund, Inc.
Annual Report — December 31, 2015
Growth Portfolio
Statement of Operations | Year Ended December 31, 2015 (000) | ||||||
Investment Income: | |||||||
Dividends from Securities of Unaffiliated Issuers (Net of $21 of Foreign Taxes Withheld) | $ | 14,540 | |||||
Income from Securities Loaned — Net | 871 | ||||||
Dividends from Security of Affiliated Issuer (Note G) | 208 | ||||||
Total Investment Income | 15,619 | ||||||
Expenses: | |||||||
Advisory Fees (Note B) | 15,569 | ||||||
Shareholder Services Fees — Class A (Note D) | 4,053 | ||||||
Distribution and Shareholder Services Fees — Class L (Note D) | 692 | ||||||
Distribution and Shareholder Services Fees — Class C (Note D) | 34 | ||||||
Sub Transfer Agency Fees — Class I | 514 | ||||||
Sub Transfer Agency Fees — Class A | 2,483 | ||||||
Sub Transfer Agency Fees — Class L | 228 | ||||||
Sub Transfer Agency Fees — Class C | 1 | ||||||
Administration Fees (Note C) | 2,873 | ||||||
Shareholder Reporting Fees | 461 | ||||||
Transfer Agency Fees — Class I (Note E) | 38 | ||||||
Transfer Agency Fees — Class A (Note E) | 301 | ||||||
Transfer Agency Fees — Class L (Note E) | 26 | ||||||
Transfer Agency Fees — Class C (Note E) | 1 | ||||||
Transfer Agency Fees — Class IS (Note E) | 3 | ||||||
Custodian Fees (Note F) | 155 | ||||||
Registration Fees | 126 | ||||||
Directors' Fees and Expenses | 114 | ||||||
Professional Fees | 91 | ||||||
Pricing Fees | 4 | ||||||
Other Expenses | 76 | ||||||
Total Expenses | 27,843 | ||||||
Rebate from Morgan Stanley Affiliate (Note G) | (116 | ) | |||||
Reimbursement of Class Specific Expenses — Class A (Note B) | (62 | ) | |||||
Reimbursement of Class Specific Expenses — Class L (Note B) | (16 | ) | |||||
Net Expenses | 27,649 | ||||||
Net Investment Loss | (12,030 | ) | |||||
Realized Gain (Loss): | |||||||
Investments Sold | 440,033 | ||||||
Foreign Currency Transactions | (32 | ) | |||||
Net Realized Gain | 440,001 | ||||||
Change in Unrealized Appreciation (Depreciation): | |||||||
Investments | (38,092 | ) | |||||
Net Realized Gain and Change in Unrealized Appreciation (Depreciation) | 401,909 | ||||||
Net Increase in Net Assets Resulting from Operations | $ | 389,879 | |||||
The accompanying notes are an integral part of the financial statements.
11
Morgan Stanley Institutional Fund, Inc.
Annual Report — December 31, 2015
Growth Portfolio
Statements of Changes in Net Assets | Year Ended December 31, 2015 (000) | Year Ended December 31, 2014 (000) | |||||||||
Increase (Decrease) in Net Assets: | |||||||||||
Operations: | |||||||||||
Net Investment Loss | $ | (12,030 | ) | $ | (6,166 | ) | |||||
Net Realized Gain | 440,001 | 202,492 | |||||||||
Net Change in Unrealized Appreciation (Depreciation) | (38,092 | ) | 77,968 | ||||||||
Net Increase in Net Assets Resulting from Operations | 389,879 | 274,294 | |||||||||
Distributions from and/or in Excess of: | |||||||||||
Class I: | |||||||||||
Net Investment Income | — | (90 | ) | ||||||||
Net Realized Gain | (62,204 | ) | (37,793 | ) | |||||||
Class A: | |||||||||||
Net Realized Gain | (119,469 | ) | (75,475 | ) | |||||||
Class L: | |||||||||||
Net Investment Income | — | (24 | ) | ||||||||
Net Realized Gain | (6,732 | ) | (4,426 | ) | |||||||
Class C: | |||||||||||
Net Realized Gain | (797 | ) | — | ||||||||
Class IS: | |||||||||||
Net Investment Income | — | (171 | ) | ||||||||
Net Realized Gain | (72,693 | ) | (45,091 | ) | |||||||
Total Distributions | (261,895 | ) | (163,070 | ) | |||||||
Capital Share Transactions:(1) | |||||||||||
Class I: | |||||||||||
Subscribed | 191,278 | 456,631 | |||||||||
Issued due to a tax-free reorganization | — | 505,818 | |||||||||
Distributions Reinvested | 60,112 | 37,259 | |||||||||
Redeemed | (200,306 | ) | (1,255,645 | ) | |||||||
Class A: | |||||||||||
Subscribed | 180,513 | 152,431 | |||||||||
Issued due to a tax-free reorganization | — | 1,369,843 | |||||||||
Distributions Reinvested | 115,656 | 73,132 | |||||||||
Redeemed | (269,270 | ) | (316,404 | ) | |||||||
Class L: | |||||||||||
Subscribed | 2,348 | 6,137 | |||||||||
Issued due to a tax-free reorganization | — | 88,416 | |||||||||
Distributions Reinvested | 6,581 | 4,351 | |||||||||
Redeemed | (12,246 | ) | (13,153 | ) | |||||||
Class C: | |||||||||||
Subscribed | 13,781 | * | — | ||||||||
Distributions Reinvested | 677 | * | — | ||||||||
Redeemed | (484 | )* | — | ||||||||
Class IS: | |||||||||||
Subscribed | 127,805 | 1,034,151 | |||||||||
Distributions Reinvested | 68,414 | 41,376 | |||||||||
Redeemed | (181,658 | ) | (92,318 | ) | |||||||
Net Increase in Net Assets Resulting from Capital Share Transactions | 103,201 | 2,092,025 | |||||||||
Total Increase in Net Assets | 231,185 | 2,203,249 | |||||||||
Net Assets: | |||||||||||
Beginning of Period | 3,398,723 | 1,195,474 | |||||||||
End of Period (Including Accumulated Net Investment Loss of $(671) and $(1,417)) | $ | 3,629,908 | $ | 3,398,723 | |||||||
The accompanying notes are an integral part of the financial statements.
12
Morgan Stanley Institutional Fund, Inc.
Annual Report — December 31, 2015
Growth Portfolio
Statements of Changes in Net Assets (cont'd) | Year Ended December 31, 2015 (000) | Year Ended December 31, 2014 (000) | |||||||||
(1) Capital Share Transactions: | |||||||||||
Class I: | |||||||||||
Shares Subscribed | 4,598 | 11,865 | |||||||||
Shares Issued due to a tax-free reorganization | — | 13,594 | |||||||||
Shares Issued on Distributions Reinvested | 1,464 | 999 | |||||||||
Shares Redeemed | (4,832 | ) | (31,791 | ) | |||||||
Net Increase (Decrease) in Class I Shares Outstanding | 1,230 | (5,333 | ) | ||||||||
Class A: | |||||||||||
Shares Subscribed | 4,418 | 3,977 | |||||||||
Shares Issued due to a tax-free reorganization | — | 37,592 | |||||||||
Shares Issued on Distributions Reinvested | 2,896 | 2,008 | |||||||||
Shares Redeemed | (6,635 | ) | (8,231 | ) | |||||||
Net Increase in Class A Shares Outstanding | 679 | 35,346 | |||||||||
Class L: | |||||||||||
Shares Subscribed | 59 | 163 | |||||||||
Shares Issued due to a tax-free reorganization | — | 2,453 | |||||||||
Shares Issued on Distributions Reinvested | 168 | 121 | |||||||||
Shares Redeemed | (306 | ) | (348 | ) | |||||||
Net Increase (Decrease) in Class L Shares Outstanding | (79 | ) | 2,389 | ||||||||
Class C: | |||||||||||
Shares Subscribed | 348 | * | — | ||||||||
Shares Issued on Distributions Reinvested | 17 | * | — | ||||||||
Shares Redeemed | (12 | )* | — | ||||||||
Net Increase in Class C Shares Outstanding | 353 | — | |||||||||
Class IS: | |||||||||||
Shares Subscribed | 3,094 | 26,014 | |||||||||
Shares Issued on Distributions Reinvested | 1,662 | 1,108 | |||||||||
Shares Redeemed | (4,375 | ) | (2,345 | ) | |||||||
Net Increase in Class IS Shares Outstanding | 381 | 24,777 | |||||||||
@ Amount is less than $500.
* For the period April 30, 2015 through December 31, 2015.
The accompanying notes are an integral part of the financial statements.
13
Morgan Stanley Institutional Fund, Inc.
Annual Report — December 31, 2015
Financial Highlights
Growth Portfolio
Class I | |||||||||||||||||||||||
Year Ended December 31, | |||||||||||||||||||||||
Selected Per Share Data and Ratios | 2015 | 2014 | 2013 | 2012 | 2011 | ||||||||||||||||||
Net Asset Value, Beginning of Period | $ | 38.86 | $ | 38.38 | $ | 27.05 | $ | 23.46 | $ | 24.24 | |||||||||||||
Income (Loss) from Investment Operations: | |||||||||||||||||||||||
Net Investment Income (Loss)† | (0.07 | ) | (0.03 | ) | 0.02 | 0.16 | 0.01 | ||||||||||||||||
Net Realized and Unrealized Gain (Loss) | 4.70 | 2.43 | 13.02 | 3.52 | (0.73 | ) | |||||||||||||||||
Total from Investment Operations | 4.63 | 2.40 | 13.04 | 3.68 | (0.72 | ) | |||||||||||||||||
Distributions from and/or in Excess of: | |||||||||||||||||||||||
Net Investment Income | — | (0.00 | )‡ | (0.13 | ) | (0.05 | ) | (0.06 | ) | ||||||||||||||
Net Realized Gain | (3.05 | ) | (1.92 | ) | (1.58 | ) | (0.04 | ) | — | ||||||||||||||
Total Distributions | (3.05 | ) | (1.92 | ) | (1.71 | ) | (0.09 | ) | (0.06 | ) | |||||||||||||
Redemption Fees | 0.00 | ‡ | — | — | — | — | |||||||||||||||||
Net Asset Value, End of Period | $ | 40.44 | $ | 38.86 | $ | 38.38 | $ | 27.05 | $ | 23.46 | |||||||||||||
Total Return++ | 11.91 | % | 6.42 | % | 48.60 | % | 15.66 | % | (3.01 | )% | |||||||||||||
Ratios and Supplemental Data: | |||||||||||||||||||||||
Net Assets, End of Period (Thousands) | $ | 876,660 | $ | 794,648 | $ | 989,649 | $ | 661,073 | $ | 622,193 | |||||||||||||
Ratio of Expenses to Average Net Assets (1) | 0.61 | %+ | 0.69 | %+^ | 0.70 | %+ | 0.72 | %+ | 0.71 | %+ | |||||||||||||
Ratio of Net Investment Income (Loss) to Average Net Assets (1) | (0.18 | )%+ | (0.08 | )%+ | 0.08 | %+ | 0.59 | %+ | 0.05 | %+ | |||||||||||||
Ratio of Rebate from Morgan Stanley Affiliates to Average Net Assets | 0.00 | %§ | 0.01 | % | 0.01 | % | 0.00 | %§ | 0.00 | %§ | |||||||||||||
Portfolio Turnover Rate | 34 | % | 44 | % | 31 | % | 49 | % | 26 | % | |||||||||||||
(1) Supplemental Information on the Ratios to Average Net Assets: | |||||||||||||||||||||||
Ratios Before Expense Limitation: | |||||||||||||||||||||||
Expenses to Average Net Assets | N/A | N/A | 0.71 | % | N/A | N/A | |||||||||||||||||
Net Investment Income to Average Net Assets | N/A | N/A | 0.07 | % | N/A | N/A | |||||||||||||||||
† Per share amount is based on average shares outstanding.
‡ Amount is less than $0.005 per share.
++ Calculated based on the net asset value as of the last business day of the period.
+ The Ratios of Expenses and Net Investment Income (Loss) reflect the rebate of certain Portfolio expenses in connection with the investments in Morgan Stanley affiliates during the period. The effect of the rebate on the ratios is disclosed in the above table as "Ratio of Rebate from Morgan Stanley Affiliates to Average Net Assets."
^ Effective April 7, 2014, the Adviser has agreed to limit the ratio of expenses to average net assets to the maximum ratio of 0.70% for Class I shares. Prior to April 7, 2014, the maximum ratio was 0.80% for Class I shares.
§ Amount is less than 0.005%.
The accompanying notes are an integral part of the financial statements.
14
Morgan Stanley Institutional Fund, Inc.
Annual Report — December 31, 2015
Financial Highlights
Growth Portfolio
Class A | |||||||||||||||||||||||
Year Ended December 31, | |||||||||||||||||||||||
Selected Per Share Data and Ratios | 2015 | 2014 | 2013 | 2012 | 2011 | ||||||||||||||||||
Net Asset Value, Beginning of Period | $ | 37.98 | $ | 37.61 | $ | 26.53 | $ | 23.03 | $ | 23.82 | |||||||||||||
Income (Loss) from Investment Operations: | |||||||||||||||||||||||
Net Investment Income (Loss)† | (0.21 | ) | (0.13 | ) | (0.06 | ) | 0.09 | (0.05 | ) | ||||||||||||||
Net Realized and Unrealized Gain (Loss) | 4.59 | 2.42 | 12.78 | 3.45 | (0.73 | ) | |||||||||||||||||
Total from Investment Operations | 4.38 | 2.29 | 12.72 | 3.54 | (0.78 | ) | |||||||||||||||||
Distributions from and/or in Excess of: | |||||||||||||||||||||||
Net Investment Income | — | — | (0.06 | ) | — | (0.01 | ) | ||||||||||||||||
Net Realized Gain | (3.05 | ) | (1.92 | ) | (1.58 | ) | (0.04 | ) | — | ||||||||||||||
Total Distributions | (3.05 | ) | (1.92 | ) | (1.64 | ) | (0.04 | ) | (0.01 | ) | |||||||||||||
Redemption Fees | 0.00 | ‡ | — | — | — | — | |||||||||||||||||
Net Asset Value, End of Period | $ | 39.31 | $ | 37.98 | $ | 37.61 | $ | 26.53 | $ | 23.03 | |||||||||||||
Total Return++ | 11.53 | % | 6.25 | % | 48.22 | % | 15.36 | % | (3.27 | )% | |||||||||||||
Ratios and Supplemental Data: | |||||||||||||||||||||||
Net Assets, End of Period (Thousands) | $ | 1,630,538 | $ | 1,549,756 | $ | 205,286 | $ | 138,416 | $ | 135,777 | |||||||||||||
Ratio of Expenses to Average Net Assets (1) | 0.96 | %+ | 0.83 | %+^ | 0.95 | %+^ | 0.97 | %+ | 0.96 | %+ | |||||||||||||
Ratio of Net Investment Income (Loss) to Average Net Assets (1) | (0.52 | )%+ | (0.34 | )%+ | (0.18 | )%+ | 0.34 | %+ | (0.20 | )%+ | |||||||||||||
Ratio of Rebate from Morgan Stanley Affiliates to Average Net Assets | 0.00 | %§ | 0.00 | %§ | 0.01 | % | 0.00 | %§ | 0.00 | %§ | |||||||||||||
Portfolio Turnover Rate | 34 | % | 44 | % | 31 | % | 49 | % | 26 | % | |||||||||||||
(1) Supplemental Information on the Ratios to Average Net Assets: | |||||||||||||||||||||||
Ratios Before Expense Limitation: | |||||||||||||||||||||||
Expenses to Average Net Assets | 0.96 | % | N/A | 0.96 | % | N/A | N/A | ||||||||||||||||
Net Investment Loss to Average Net Assets | (0.52 | )% | N/A | (0.19 | )% | N/A | N/A | ||||||||||||||||
† Per share amount is based on average shares outstanding.
‡ Amount is less than $0.005 per share.
++ Calculated based on the net asset value which does not reflect sales charges, if applicable, as of the last business day of the period.
+ The Ratios of Expenses and Net Investment Income (Loss) reflect the rebate of certain Portfolio expenses in connection with the investments in Morgan Stanley affiliates during the period. The effect of the rebate on the ratios is disclosed in the above table as "Ratio of Rebate from Morgan Stanley Affiliates to Average Net Assets."
^ Effective April 7, 2014, the Adviser has agreed to limit the ratio of expenses to average net assets to the maximum ratios of 1.05% for Class A shares. Prior to April 7, 2014, the maximum ratio was 1.15% for Class A shares. Prior to September 16, 2013, the maximum ratio was 1.05% for Class A shares.
§ Amount is less than 0.005%.
The accompanying notes are an integral part of the financial statements.
15
Morgan Stanley Institutional Fund, Inc.
Annual Report — December 31, 2015
Financial Highlights
Growth Portfolio
Class L | |||||||||||||||||||
Year Ended December 31, | Period from April 27, 2012^ to | ||||||||||||||||||
Selected Per Share Data and Ratios | 2015 | 2014 | 2013 | December 31, 2012 | |||||||||||||||
Net Asset Value, Beginning of Period | $ | 37.40 | $ | 37.26 | $ | 26.43 | $ | 27.60 | |||||||||||
Income (Loss) from Investment Operations: | |||||||||||||||||||
Net Investment Income (Loss)† | (0.44 | ) | (0.31 | ) | (0.38 | ) | 0.03 | ||||||||||||
Net Realized and Unrealized Gain (Loss) | 4.50 | 2.38 | 12.84 | (1.16 | ) | ||||||||||||||
Total from Investment Operations | 4.06 | 2.07 | 12.46 | (1.13 | ) | ||||||||||||||
Distributions from and/or in Excess of: | |||||||||||||||||||
Net Investment Income | — | (0.01 | ) | (0.05 | ) | (0.00 | )‡ | ||||||||||||
Net Realized Gain | (3.05 | ) | (1.92 | ) | (1.58 | ) | (0.04 | ) | |||||||||||
Total Distributions | (3.05 | ) | (1.93 | ) | (1.63 | ) | (0.04 | ) | |||||||||||
Redemption Fees | 0.00 | ‡ | — | — | — | ||||||||||||||
Net Asset Value, End of Period | $ | 38.41 | $ | 37.40 | $ | 37.26 | $ | 26.43 | |||||||||||
Total Return++ | 10.85 | % | 5.72 | % | 47.44 | % | (4.10 | )%# | |||||||||||
Ratios and Supplemental Data: | |||||||||||||||||||
Net Assets, End of Period (Thousands) | $ | 89,277 | $ | 89,854 | $ | 528 | $ | 10 | |||||||||||
Ratio of Expenses to Average Net Assets (1) | 1.55 | %+ | 1.29 | %+^^ | 1.60 | %+^^ | 1.51 | %+* | |||||||||||
Ratio of Net Investment Income (Loss) to Average Net Assets (1) | (1.11 | )%+ | (0.82 | )%+ | (1.09 | )%+ | 0.20 | %+* | |||||||||||
Ratio of Rebate from Morgan Stanley Affiliates to Average Net Assets | 0.00 | %§ | 0.00 | %§ | 0.01 | % | 0.00 | %§* | |||||||||||
Portfolio Turnover Rate | 34 | % | 44 | % | 31 | % | 49 | %# | |||||||||||
(1) Supplemental Information on the Ratios to Average Net Assets: | |||||||||||||||||||
Ratios Before Expense Limitation: | |||||||||||||||||||
Expenses to Average Net Assets | 1.57 | % | N/A | 1.72 | % | N/A | |||||||||||||
Net Investment Loss to Average Net Assets | (1.13 | )% | N/A | (1.21 | )% | N/A | |||||||||||||
^ Commencement of Offering.
† Per share amount is based on average shares outstanding.
‡ Amount is less than $0.005 per share.
++ Calculated based on the net asset value as of the last business day of the period.
+ The Ratios of Expenses and Net Investment Income (Loss) reflect the rebate of certain Portfolio expenses in connection with the investments in Morgan Stanley affiliates during the period. The effect of the rebate on the ratios is disclosed in the above table as "Ratio of Rebate from Morgan Stanley Affiliates to Average Net Assets."
^^ Effective April 7, 2014, the Adviser has agreed to limit the ratio of expenses to average net assets to the maximum ratio of 1.55% for Class L shares. Prior to April 7, 2014, the maximum ratio was 1.65% for Class L shares. Prior to September 16, 2013, the maximum ratio was 1.55% for Class L shares.
§ Amount is less than 0.005%.
# Not Annualized.
* Annualized.
The accompanying notes are an integral part of the financial statements.
16
Morgan Stanley Institutional Fund, Inc.
Annual Report — December 31, 2015
Financial Highlights
Growth Portfolio
Class C | |||||||
Selected Per Share Data and Ratios | Period from April 30, 2015^ to December 31, 2015 | ||||||
Net Asset Value, Beginning of Period | $ | 40.33 | |||||
Income (Loss) from Investment Operations: | |||||||
Net Investment Loss† | (0.35 | ) | |||||
Net Realized and Unrealized Gain | 1.47 | ||||||
Total from Investment Operations | 1.12 | ||||||
Distributions from and/or in Excess of: | |||||||
Net Realized Gain | (3.05 | ) | |||||
Redemption Fees | 0.00 | ‡ | |||||
Net Asset Value, End of Period | $ | 38.40 | |||||
Total Return++ | 2.71 | %# | |||||
Ratios and Supplemental Data: | |||||||
Net Assets, End of Period (Thousands) | $ | 13,544 | |||||
Ratios of Expenses to Average Net Assets (1) | 1.62 | %+* | |||||
Ratio of Net Investment Loss to Average Net Assets (1) | (1.29 | )%+* | |||||
Ratio of Rebate from Morgan Stanley Affiliates to Average Net Assets | 0.00 | %§* | |||||
Portfolio Turnover Rate | 34 | % | |||||
^ Commencement of Offering.
† Per share amount is based on average shares outstanding.
‡ Amount is less than $0.005 per share.
++ Calculated based on the net asset value which does not reflect sales charges, if applicable, as of the last business day of the period
+ The Ratios of Expenses and Net Investment Loss reflect the rebate of certain Portfolio expenses in connection with the investments in Morgan Stanley affiliates during the period. The effect of the rebate on the ratios is disclosed in the above table as "Ratio of Rebate from Morgan Stanley Affiliates to Average Net Assets."
§ Amount is less than 0.005%.
# Not Annualized.
* Annualized.
The accompanying notes are an integral part of the financial statements.
17
Morgan Stanley Institutional Fund, Inc.
Annual Report — December 31, 2015
Financial Highlights
Growth Portfolio
Class IS | |||||||||||||||
Year Ended December 31, | Period from September 13, 2013^ to | ||||||||||||||
Selected Per Share Data and Ratios | 2015 | 2014 | December 31, 2013 | ||||||||||||
Net Asset Value, Beginning of Period | $ | 38.92 | $ | 38.40 | $ | 34.45 | |||||||||
Income (Loss) from Investment Operations: | |||||||||||||||
Net Investment Loss† | (0.04 | ) | (0.05 | ) | (0.02 | ) | |||||||||
Net Realized and Unrealized Gain | 4.71 | 2.50 | 5.55 | ||||||||||||
Total from Investment Operations | 4.67 | 2.45 | 5.53 | ||||||||||||
Distributions from and/or in Excess of: | |||||||||||||||
Net Investment Income | — | (0.01 | ) | — | |||||||||||
Net Realized Gain | (3.05 | ) | (1.92 | ) | (1.58 | ) | |||||||||
Total Distributions | (3.05 | ) | (1.93 | ) | (1.58 | ) | |||||||||
Redemption Fees | 0.00 | ‡ | — | — | |||||||||||
Net Asset Value, End of Period | $ | 40.54 | $ | 38.92 | $ | 38.40 | |||||||||
Total Return++ | 11.97 | % | 6.60 | % | 16.20 | %# | |||||||||
Ratios and Supplemental Data: | |||||||||||||||
Net Assets, End of Period (Thousands) | $ | 1,019,889 | $ | 964,465 | $ | 11 | |||||||||
Ratio of Expenses to Average Net Assets (1) | 0.54 | %+ | 0.54 | %+^^ | 0.60 | %+* | |||||||||
Ratio of Net Investment Loss to Average Net Assets (1) | (0.10 | )%+ | (0.12 | )%+ | (0.16 | )%+* | |||||||||
Ratio of Rebate from Morgan Stanley Affiliates to Average Net Assets | 0.00 | %§ | 0.01 | % | 0.01 | %* | |||||||||
Portfolio Turnover Rate | 34 | % | 44 | % | 31 | %# | |||||||||
(1) Supplemental Information on the Ratios to Average Net Assets: | |||||||||||||||
Ratios Before Expense Limitation: | |||||||||||||||
Expenses to Average Net Assets | N/A | 0.55 | % | 5.60 | %* | ||||||||||
Net Investment Loss to Average Net Assets | N/A | (0.13 | )% | (5.16 | )%* | ||||||||||
^ Commencement of Offering.
† Per share amount is based on average shares outstanding.
‡ Amount is less than $0.005 per share.
++ Calculated based on the net asset value as of the last business day of the period.
+ The Ratios of Expenses and Net Investment Loss reflect the rebate of certain Portfolio expenses in connection with the investments in Morgan Stanley affiliates during the period. The effect of the rebate on the ratios is disclosed in the above table as "Ratio of Rebate from Morgan Stanley Affiliates to Average Net Assets."
^^ Effective April 7, 2014, the Adviser has agreed to limit the ratio of expenses to average net assets to the maximum ratio of 0.67% for Class IS shares. Prior to April 7, 2014, the maximum ratio was 0.73% for Class IS shares.
§ Amount is less than 0.005%.
# Not Annualized.
* Annualized.
The accompanying notes are an integral part of the financial statements.
18
Morgan Stanley Institutional Fund, Inc.
Annual Report — December 31, 2015
Notes to Financial Statements
Morgan Stanley Institutional Fund, Inc. (the "Fund") is registered under the Investment Company Act of 1940, as amended (the "Act"), as an open-end management investment company. The Fund is comprised of twenty-six separate, active, diversified and non-diversified portfolios (individually referred to as a "Portfolio", collectively as the "Portfolios"). The Fund applies investment company accounting and reporting guidance.
The accompanying financial statements relate to the Growth Portfolio. The Portfolio seeks long-term capital appreciation by investing primarily in growth oriented equity securities of large capitalization companies. Under normal market conditions, the Portfolio seeks to achieve its investment objective by investing primarily in established and emerging companies, with capitalizations within the range of companies included in the Russell 1000® Growth Index.
The Portfolio offers five classes of shares — Class I, Class A, Class L, Class C and Class IS. On April 30, 2015, the Portfolio commenced offering Class C shares and suspended offering of Class L shares. Existing Class L shareholders may invest through reinvestment of dividends and distributions.
On April 7, 2014, the Portfolio acquired the net assets of Morgan Stanley Focus Growth Fund ("Focus Growth Fund"), an open-end investment company, based on the respective valuations as of the close of business on April 4, 2014, pursuant to a Plan of Reorganization approved by the shareholders of Focus Growth Fund on February 28, 2014 ("Reorganization"). The purpose of the transaction was to combine two portfolios managed by Morgan Stanley Investment Management Inc., (the "Adviser") with comparable investment objectives and strategies. The acquisition was accomplished by a tax-free exchange of 13,593,596 Class I shares of the Portfolio at a net asset value of $37.21 for 9,863,136 Class I shares of Focus Growth Fund; 37,591,749 Class A shares of the Portfolio at a net asset value of $36.44 for 27,362,441 Class A shares and 679,411 Class B shares of Focus Growth Fund; 2,453,264 Class L shares of the Portfolio at a net asset value of $36.04 for 2,096,775 Class L shares of Focus Growth Fund; The net assets of Focus Growth Fund before the Reorganization were approximately $1,964,077,000, including unrealized appreciation of approximately $782,409,000 at April 4, 2014. The investment portfolio of Focus Growth Fund, with a fair value of approximately $1,972,049,000 and identified cost of approximately $1,189,640,000 on April 4, 2014, was the principal asset acquired by the Portfolio. For financial reporting purposes, assets received and shares issued by the Portfolio were recorded at fair value; however, the cost basis of the investments received from
Focus Growth Fund was carried forward to align ongoing reporting of the Portfolio's realized and unrealized gains and losses with amounts distributable to shareholders for tax purposes. Immediately prior to the Reorganization, the net assets of the Portfolio were approximately $1,262,454,000. Immediately after the Reorganization, the net assets of the Portfolio were approximately $3,226,531,000.
Upon closing of the Reorganization, shareholders of Focus Growth Fund received shares of the Portfolio as follows:
| Focus Growth Fund | MSIF Growth Portfolio | ||||||
| Class I | Class I | ||||||
| Class A | Class A | ||||||
| Class B | Class A | ||||||
| Class L | Class L | ||||||
Assuming the acquisition had been completed on January 1, 2014, the beginning of the annual reporting period of the Portfolio, the Portfolio's pro forma results of operations for the period ended December 31, 2014, are as follows:
Net investment income (loss)(1) | $ | 4,381,000 | |||||
Net realized gain and unrealized gain(2) | $ | 300,743,000 | |||||
| Net increase (decrease) in net assets resulting from operations | $ | 305,124,000 | |||||
(1) Approximately $(6,166,000) as reported, plus approximately $5,451,000 Focus Growth Fund prior to the Reorganization, plus approximately $5,096,000 of estimated pro-forma eliminated expenses.
(2) Approximately $280,460,000 as reported, plus approximately $20,283,000 Focus Growth Fund prior to the Reorganization.
Because the combined investment portfolios have been managed as a single integrated portfolio since the acquisition was completed, it is not practicable to separate the amounts of revenue and earnings of Focus Growth Fund that have been included in the Portfolio's Statement of Operations since April 7, 2014.
A. Significant Accounting Policies: The following significant accounting policies are in conformity with U.S. generally accepted accounting principles ("GAAP"). Such policies are consistently followed by the Fund in the preparation of its financial statements. GAAP may require management to make estimates and assumptions that affect the reported amounts and disclosures in the financial statements. Actual results may differ from those estimates.
1. Security Valuation: (1) An equity portfolio security listed or traded on an exchange is valued at its latest reported sales price (or at the exchange official closing price if such exchange reports an official closing price), if there were no sales on a given day, the security is valued at the mean between the last reported bid and asked prices;
19
Morgan Stanley Institutional Fund, Inc.
Annual Report — December 31, 2015
Notes to Financial Statements (cont'd)
(2) all other equity portfolio securities for which over-the-counter ("OTC") market quotations are readily available are valued at its latest reported sales price. In cases where a security is traded on more than one exchange, the security is valued on the exchange designated as the primary market; (3) listed options are valued at the last reported sales price on the exchange on which they are listed (or at the exchange official closing price if such exchange reports an official closing price). If an official closing price or last reported sales price is unavailable, the listed option should be fair valued at the mean between their latest bid and asked price. Unlisted options are valued by an outside pricing service approved by the Fund's Board of Directors (the "Directors") or quotes from a broker or dealer; (4) when market quotations are not readily available, including circumstances under which Morgan Stanley Investment Management Inc. (the "Adviser") determines that the closing price, last sale price or the mean between the last reported bid and asked prices are not reflective of a security's market value, portfolio securities are valued at their fair value as determined in good faith under procedures established by and under the general supervision of the Directors. Occasionally, developments affecting the closing prices of securities and other assets may occur between the times at which valuations of such securities are determined (that is, close of the foreign market on which the securities trade) and the close of business of the New York Stock Exchange ("NYSE"). If developments occur during such periods that are expected to materially affect the value of such securities, such valuations may be adjusted to reflect the estimated fair value of such securities as of the close of the NYSE, as determined in good faith by the Directors or by the Adviser using a pricing service and/or procedures approved by the Directors; (5) quotations of foreign portfolio securities, other assets and liabilities and forward contracts stated in foreign currency are translated into U.S. dollar equivalents at the prevailing market rates prior to the close of the NYSE; (6) investments in mutual funds, including the Morgan Stanley Institutional Liquidity Funds, are valued at the net asset value ("NAV") as of the close of each business day; and (7) short-term debt securities with remaining maturities of 60 days or less at the time of purchase may be valued at amortized cost, unless the Adviser determines such valuation does not reflect the securities' market value, in
which case these securities will be valued at their fair market value determined by the Adviser.
The Directors have responsibility for determining in good faith the fair value of the investments, and the Directors may appoint others, such as the Fund's Adviser or a valuation committee, to assist the Directors in determining fair value and to make the actual calculations pursuant to the fair valuation methodologies previously approved by the Directors. Under procedures approved by the Directors, the Fund's Adviser has formed a Valuation Committee whose members are approved by the Directors. The Valuation Committee provides administration and oversight of the Fund's valuation policies and procedures, which are reviewed at least annually by the Directors. These procedures allow the Fund to utilize independent pricing services, quotations from securities and financial instrument dealers, and other market sources to determine fair value.
The Fund has procedures to determine the fair value of securities and other financial instruments for which market prices are not readily available. Under these procedures, the Valuation Committee convenes on a regular and ad hoc basis to review such securities and considers a number of factors, including valuation methodologies and significant unobservable valuation inputs, when arriving at fair value. The Valuation Committee may employ a market-based approach which may use related or comparable assets or liabilities, recent transactions, market multiples, book values, and other relevant information for the investment to determine the fair value of the investment. An income-based valuation approach may also be used in which the anticipated future cash flows of the investment are discounted to calculate fair value. Discounts may also be applied due to the nature or duration of any restrictions on the disposition of the investments. Due to the inherent uncertainty of valuations of such investments, the fair values may differ significantly from the values that would have been used had an active market existed. The Valuation Committee employs various methods for calibrating these valuation approaches including a regular review of valuation methodologies, key inputs and assumptions, transactional back-testing or disposition analysis, and reviews of any related market activity.
20
Morgan Stanley Institutional Fund, Inc.
Annual Report — December 31, 2015
Notes to Financial Statements (cont'd)
2. Fair Value Measurement: Financial Accounting Standards Board ("FASB") Accounting Standards CodificationTM ("ASC") 820, "Fair Value Measurement" ("ASC 820"), defines fair value as the value that the Fund would receive to sell an investment or pay to transfer a liability in a timely transaction with an independent buyer in the principal market, or in the absence of a principal market the most advantageous market for the investment or liability. ASC 820 establishes a three-tier hierarchy to distinguish between (1) inputs that reflect the assumptions market participants would use in valuing an asset or liability developed based on market data obtained from sources independent of the reporting entity (observable inputs) and (2) inputs that reflect the reporting entity's own assumptions about the assumptions market participants would use in valuing an asset or liability developed based on the best information available in the circumstances (unobservable inputs) and to establish classification of fair value measurements for disclosure purposes. Various inputs are used in determining the value of the Fund's investments. The inputs are summarized in the three broad levels listed below.
• Level 1 – unadjusted quoted prices in active markets for identical investments
• Level 2 – other significant observable inputs (including quoted prices for similar investments, interest rates, prepayment speeds, credit risk, etc.)
• Level 3 – significant unobservable inputs including the Fund's own assumptions in determining the fair value of investments. Factors considered in making this determination may include, but are not limited to, information obtained by contacting the issuer, analysts, or the appropriate stock exchange (for exchange-traded securities), analysis of the issuer's financial statements or other available documents and, if necessary, available information concerning other securities in similar circumstances
The inputs or methodology used for valuing securities are not necessarily an indication of the risk associated with investing in those securities and the determination of the significance of a particular input to the fair value
measurement in its entirety requires judgment and considers factors specific to each security.
The following is a summary of the inputs used to value the Portfolio's investments as of December 31, 2015.
Investment Type | Level 1 Unadjusted quoted prices (000) | Level 2 Other significant observable inputs (000) | Level 3 Significant unobservable inputs (000) | Total (000) | |||||||||||||||
Assets: | |||||||||||||||||||
Common Stocks | |||||||||||||||||||
Automobiles | $ | 148,734 | $ | — | $ | — | $ | 148,734 | |||||||||||
Beverages | 109,968 | — | — | 109,968 | |||||||||||||||
Biotechnology | 30,940 | — | — | 30,940 | |||||||||||||||
Consumer Finance | 25,774 | — | — | 25,774 | |||||||||||||||
| Diversified Financial Services | 92,812 | — | — | 92,812 | |||||||||||||||
Electrical Equipment | 17,857 | — | — | 17,857 | |||||||||||||||
| Food & Staples Retailing | 51,297 | — | — | 51,297 | |||||||||||||||
Food Products | 164,175 | — | — | 164,175 | |||||||||||||||
| Health Care Equipment & Supplies | 141,480 | — | — | 141,480 | |||||||||||||||
| Health Care Technology | 54,928 | — | — | 54,928 | |||||||||||||||
| Information Technology Services | 274,793 | — | — | 274,793 | |||||||||||||||
| Internet & Catalog Retail | 593,951 | — | — | 593,951 | |||||||||||||||
| Internet Software & Services | 770,096 | — | — | 770,096 | |||||||||||||||
| Life Sciences Tools & Services | 178,136 | — | — | 178,136 | |||||||||||||||
Media | — | 53,050 | 13,688 | 66,738 | |||||||||||||||
Pharmaceuticals | 111,643 | — | — | 111,643 | |||||||||||||||
Software | 263,048 | — | — | 263,048 | |||||||||||||||
| Tech Hardware, Storage & Peripherals | 204,929 | — | — | 204,929 | |||||||||||||||
| Textiles, Apparel & Luxury Goods | 38,213 | — | — | 38,213 | |||||||||||||||
Total Common Stocks | 3,272,774 | 53,050 | 13,688 | 3,339,512 | |||||||||||||||
Preferred Stocks | — | — | 142,388 | 142,388 | |||||||||||||||
Call Option Purchased | — | 8,225 | — | 8,225 | |||||||||||||||
| Short-Term Investments | |||||||||||||||||||
Investment Companies | 302,829 | — | — | 302,829 | |||||||||||||||
| Repurchase Agreements | — | 25,560 | — | 25,560 | |||||||||||||||
| Total Short-Term Investments | 302,829 | 25,560 | — | 328,389 | |||||||||||||||
Total Assets | $ | 3,575,603 | $ | 86,835 | $ | 156,076 | $ | 3,818,514 | |||||||||||
21
Morgan Stanley Institutional Fund, Inc.
Annual Report — December 31, 2015
Notes to Financial Statements (cont'd)
Transfers between investment levels may occur as the markets fluctuate and/or the availability of data used in an investment's valuation changes. The Portfolio recognizes transfers between the levels as of the end of the period. As of December 31, 2015, the Portfolio did not have any investments transfer between investment levels. At December 31, 2015, the fair value of certain securities were adjusted due to developments which occurred between the time of the close of the foreign markets on which they trade and the close of business on the NYSE which resulted in their Level 2 classification.
Following is a reconciliation of investments in which significant unobservable inputs (Level 3) were used in determining fair value.
| Common Stock (000) | Preferred Stocks (000) | ||||||||||
Beginning Balance | $ | 20,513 | $ | 57,634 | |||||||
Purchases | — | 72,985 | |||||||||
Sales | — | — | |||||||||
Amortization of discount | — | — | |||||||||
Transfers in | — | — | |||||||||
Transfers out | — | — | |||||||||
Corporate actions | — | — | |||||||||
Change in unrealized appreciation (depreciation) | (6,825 | ) | 11,769 | ||||||||
Realized gains (losses) | — | — | |||||||||
Ending Balance | $ | 13,688 | $ | 142,388 | |||||||
| Net change in unrealized appreciation (depreciation) from investments still held as of December 31, 2015 | $ | (6,285 | ) | $ | 11,769 | ||||||
The following table presents additional information about valuation techniques and inputs used for investments that are measured at fair value and categorized within Level 3 as of December 31, 2015. Various valuation techniques were used in the valuation of certain investments and weighted based on the level of significance.
| Fair Value at December 31, 2015 (000) | Valuation Technique | Unobservable Input | Range | Selected Value | Impact to Valuation from an Increase in Input | ||||||||||||||||||||||||||
Electronic Equipment, Instruments & Components | |||||||||||||||||||||||||||||||
Preferred Stock | $ | 18,812 | Market Transaction Method | Precedent Transaction | $ | 23.03 | $ | 23.03 | $ | 23.03 | Increase | ||||||||||||||||||||
Internet & Catalog Retail | |||||||||||||||||||||||||||||||
Preferred Stocks | $ | 42,404 | Market Transaction Method | Precedent Transaction | $ | 93.09 | $ | 93.09 | $ | 93.09 | Increase | ||||||||||||||||||||
Discounted Cash Flow | Weighted Average Cost of Capital | 16.0 | % | 18.0 | % | 17.0 | % | Decrease | |||||||||||||||||||||||
Perpetual Growth Rate | 3.0 | % | 4.0 | % | 3.5 | % | Increase | ||||||||||||||||||||||||
| Market Comparable Companies | Enterprise Value/ Revenue | 11.1 | x | 17.9 | x | 17.9 | x | Increase | |||||||||||||||||||||||
| Discount for Lack of Marketability | 20.0 | % | 20.0 | % | 20.0 | % | Decrease | ||||||||||||||||||||||||
$ | 21,615 | Discounted Cash Flow | Weighted Average Cost of Capital | 17.0 | % | 19.0 | % | 18.0 | % | Decrease | |||||||||||||||||||||
Perpetual Growth Rate | 3.5 | % | 4.5 | % | 4.0 | % | Increase | ||||||||||||||||||||||||
| Market Comparable Companies | Enterprise Value/ Revenue | 3.1 | x | 5.2 | x | 3.1 | x | Increase | |||||||||||||||||||||||
| Discount for Lack of Marketability | 20.0 | % | 20.0 | % | 20.0 | % | Decrease | ||||||||||||||||||||||||
$ | 54,173 | Market Transaction Method | Precedent Transaction | $ | 48.77 | $ | 48.77 | $ | 48.77 | Increase | |||||||||||||||||||||
22
Morgan Stanley Institutional Fund, Inc.
Annual Report — December 31, 2015
Notes to Financial Statements (cont'd)
| Fair Value at December 31, 2015 (000) | Valuation Technique | Unobservable Input | Range | Selected Value | Impact to Valuation from an Increase in Input | ||||||||||||||||||||||||||
Internet Software & Services | |||||||||||||||||||||||||||||||
Preferred Stock | $ | 5,384 | Discounted Cash Flow | Weighted Average Cost of Capital | 17.0 | % | 19.0 | % | 18.0 | % | Decrease | ||||||||||||||||||||
Perpetual Growth Rate | 2.5 | % | 3.5 | % | 3.0 | % | Increase | ||||||||||||||||||||||||
| Market Comparable Companies | Enterprise Value/ Revenue | 7.8 | x | 20.1 | x | 11.0 | x | Increase | |||||||||||||||||||||||
| Discount for Lack of Marketability | 20.0 | % | 20.0 | % | 20.0 | % | Decrease | ||||||||||||||||||||||||
Media | |||||||||||||||||||||||||||||||
Common Stock | $ | 13,688 | Market Transaction Method | Precedent Transaction | $ | 1,404.57 | $ | 1,404.57 | $ | 1,404.57 | Increase | ||||||||||||||||||||
Discounted Cash Flow | Weighted Average Cost of Capital | 16.0 | % | 17.0 | % | 16.5 | % | Decrease | |||||||||||||||||||||||
Perpetual Growth Rate | 3.0 | % | 5.0 | % | 4.0 | % | Increase | ||||||||||||||||||||||||
| Market Comparable Companies | Enterprise Value/ Revenue | 3.3 | x | 7.9 | x | 5.6 | x | Increase | |||||||||||||||||||||||
| Discount for Lack of Marketability | 20.0 | % | 20.0 | % | 20.0 | % | Decrease | ||||||||||||||||||||||||
3. Repurchase Agreements: The Portfolio may enter into repurchase agreements under which the Portfolio lends cash and takes possession of securities with an agreement that the counterparty will repurchase such securities. In connection with transactions in repurchase agreements, a bank as custodian for the Portfolio takes possession of the underlying securities which are held as collateral, with a market value at least equal to the amount of the repurchase transaction, including principal and accrued interest. To the extent that any repurchase transaction exceeds one business day, the value of the collateral is marked-to-market on a daily basis to determine that the value of the collateral does not decrease below the repurchase price plus accrued interest as earned. If such a decrease occurs, additional collateral will be requested and, when received, will be added to the account to maintain full collateralization. In the event of default on the obligation to repurchase, the Portfolio has the right to liquidate the collateral and apply the proceeds in satisfaction of the obligation. In the event of default or bankruptcy by the counterparty to the agreement, realization of the collateral proceeds may be subject to cost and delays. The Portfolio, along with other affiliated investment companies, may utilize a joint trading account for the purpose of entering into repurchase agreements.
4. Foreign Currency Translation and Foreign Investments: The books and records of the Portfolio are
maintained in U.S. dollars. Foreign currency amounts are translated into U.S. dollars as follows:
– investments, other assets and liabilities at the prevailing rate of exchange on the valuation date;
– investment transactions and investment income at the prevailing rates of exchange on the dates of such transactions.
Although the net assets of the Portfolio are presented at the foreign exchange rates and market values at the close of the period, the Portfolio does not isolate that portion of the results of operations arising as a result of changes in the foreign exchange rates from the fluctuations arising from changes in the market prices of securities held at period end. Similarly, the Portfolio does not isolate the effect of changes in foreign exchange rates from the fluctuations arising from changes in the market prices of securities sold during the period. Accordingly, realized and unrealized foreign currency gains (losses) on investments in securities are included in the reported net realized and unrealized gains (losses) on investment transactions and balances. However, pursuant to U.S. Federal income tax regulations, gains and losses from certain foreign currency transactions and the foreign currency portion of gains and losses realized on sales and maturities of foreign denominated debt securities are
23
Morgan Stanley Institutional Fund, Inc.
Annual Report — December 31, 2015
Notes to Financial Statements (cont'd)
treated as ordinary income for U.S. Federal income tax purposes.
Net realized gains (losses) on foreign currency transactions represent net foreign exchange gains (losses) from foreign currency forward exchange contracts, disposition of foreign currencies, currency gains (losses) realized between the trade and settlement dates on securities transactions, and the difference between the amount of investment income and foreign withholding taxes recorded on the Portfolio's books and the U.S. dollar equivalent amounts actually received or paid. Net unrealized currency gains (losses) from valuing foreign currency denominated assets and liabilities at period end exchange rates are reflected as a component of unrealized appreciation (depreciation) in the Statement of Assets and Liabilities. The change in unrealized currency gains (losses) on foreign currency translations for the period is reflected in the Statement of Operations.
Foreign security and currency transactions may involve certain considerations and risks not typically associated with those of U.S. dollar denominated transactions as a result of, among other factors, fluctuations of exchange rates in relation to the U.S. dollar, the possibility of lower levels of governmental supervision and regulation of foreign securities markets and the possibility of political or economic instability.
Governmental approval for foreign investments may be required in advance of making an investment under certain circumstances in some countries, and the extent of foreign investments in domestic companies may be subject to limitation in other countries. Foreign ownership limitations also may be imposed by the charters of individual companies to prevent, among other concerns, violations of foreign investment limitations. As a result, an additional class of shares (identified as "Foreign" in the Portfolio of Investments) may be created and offered for investment. The "local" and "foreign shares" market values may differ. In the absence of trading of the foreign shares in such markets, the Portfolio values the foreign shares at the closing exchange price of the local shares.
5. Derivatives: The Portfolio may, but is not required to, use derivative instruments for a variety of purposes, including hedging, risk management, portfolio management or to earn income. Derivatives are financial instruments whose value is based, in part, on the value of an underlying asset,
interest rate, index or financial instrument. Prevailing interest rates and volatility levels, among other things, also affect the value of derivative instruments. A derivative instrument often has risks similar to its underlying asset and may have additional risks, including imperfect correlation between the value of the derivative and the underlying asset, risks of default by the counterparty to certain transactions, magnification of losses incurred due to changes in the market value of the securities, instruments, indices or interest rates to which the derivative instrument relates, risks that the transactions may not be liquid and risks arising from margin requirements. The use of derivatives involves risks that are different from, and possibly greater than, the risks associated with other portfolio investments. Derivatives may involve the use of highly specialized instruments that require investment techniques and risk analyses different from those associated with other portfolio investments. All of the Portfolio's holdings, including derivative instruments, are marked-to-market each day with the change in value reflected in unrealized appreciation (depreciation). Upon disposition, a realized gain or loss is recognized.
Certain derivative transactions may give rise to a form of leverage. Leverage magnifies the potential for gain and the risk of loss. Leverage associated with derivative transactions may cause the Portfolio to liquidate portfolio positions when it may not be advantageous to do so to satisfy its obligations or to meet earmarking or segregation requirements, pursuant to applicable Securities and Exchange Commission rules and regulations, or may cause the Portfolio to be more volatile than if the Portfolio had not been leveraged. Although the Adviser seeks to use derivatives to further the Portfolio's investment objectives, there is no assurance that the use of derivatives will achieve this result.
Following is a description of the derivative instruments and techniques that the Portfolio used during the period and their associated risks:
Options: With respect to options, the Portfolio is subject to equity risk, interest rate risk and foreign currency exchange risk in the normal course of pursuing its investment objectives. If the Portfolio buys an option, it buys a legal contract giving it the right to buy or sell a specific amount of the underlying instrument or futures contract on the underlying instrument, at an agreed-upon price typically in exchange for a premium paid by the Portfolio. The Portfolio may purchase and/or sell
24
Morgan Stanley Institutional Fund, Inc.
Annual Report — December 31, 2015
Notes to Financial Statements (cont'd)
put and call options. Purchasing call options tends to increase the Portfolio's exposure to the underlying (or similar) instrument. Purchasing put options tends to decrease the Portfolio's exposure to the underlying (or similar) instrument. When entering into purchased option contracts, the Portfolio bears the risk of interest or exchange rates or securities prices moving unexpectedly, in which case, the Portfolio may not achieve the anticipated benefits of the purchased option contracts; however the risk of loss is limited to the premium paid. Purchased options are reported as part of "Total Investments in Securities" in the Statement of Assets and Liabilities. Premium paid for purchasing options which expired are treated as realized losses. If the Portfolio sells an option, it sells to another party the right to buy from or sell to the Portfolio a specific amount of the underlying instrument or futures contract on the underlying instrument at an agreed-upon price typically in exchange for a premium received by the Portfolio. When options are purchased OTC, the Portfolio bears the risk that the counterparty that wrote the option will be unable or unwilling to perform its obligations under the option contract. Options may also be illiquid and the Portfolio may have difficulty closing out its position. A decision as to whether, when and how to use options involves the exercise of skill and judgment and even a well-conceived option transaction may be unsuccessful because of market behavior or unexpected events. The prices of options can be highly volatile and the use of options can lower total returns.
FASB ASC 815, "Derivatives and Hedging" ("ASC 815"), is intended to improve financial reporting about derivative instruments by requiring enhanced disclosures to enable investors to better understand how and why the Portfolio uses derivative instruments, how these derivative instruments are accounted for and their effects on the Portfolio's financial position and results of operations.
The following table sets forth the fair value of the Portfolio's derivative contracts by primary risk exposure as of December 31, 2015.
| Asset Derivatives Statement of Assets and Liabilities Location | Primary Risk Exposure | Value (000) | |||||||||||||
| Call Option Purchased | Investments, at Value (Call Options Purchased) | Currency Risk | $ | 8,225 | (a) | ||||||||||
(a) Amounts are included in Investments in Securities in the Statement of Assets and Liabilities.
The following tables set forth by primary risk exposure the Portfolio's realized gains (losses) and change in unrealized appreciation (depreciation) by type of derivative contract for the year ended December 31, 2015 in accordance with ASC 815.
Realized Gain (Loss) | |||||||||||
Primary Risk Exposure | Derivative Type | Value (000) | |||||||||
| Currency Risk | Investments (Call Options Purchased) | $ | (3,519 | )(b) | |||||||
(b) Amounts are included in Investments Sold in the Statement of Operations.
Change in Unrealized Appreciation (Depreciation) | |||||||||||
Primary Risk Exposure | Derivative Type | Value (000) | |||||||||
| Currency Risk | Investments (Call Options Purchased) | $ | 6,070 | (c) | |||||||
(c) Amounts are included in Investments in the Statement of Operations.
At December 31, 2015, the Portfolio's derivative assets and liabilities are as follows:
| Gross Amounts of Assets and Liabilities Presented in the Statement of Assets and Liabilities | |||||||||||
Derivatives | Assets(d) (000) | Liabilities(d) (000) | |||||||||
Call Option Purchased | $ | 8,225 | (a) | $ | — | ||||||
(a) Amounts are included in Investments in Securities in the Statement of Assets and Liabilities.
(d) Absent an event of default or early termination, OTC derivative assets and liabilities are presented gross and not offset in the Statement of Assets and Liabilities.
The Portfolio typically enters into International Swaps and Derivatives Association, Inc. Master Agreements ("ISDA Master Agreements") or similar master agreements (collectively, "Master Agreements") with its contract counterparties for certain OTC derivatives in order to, among other things, reduce its credit risk to counterparties. ISDA Master Agreements include provisions for general obligations, representations, collateral and events of default or termination. Under an ISDA Master Agreement, the Portfolio typically may offset with the counterparty certain OTC derivative financial instruments' payables and/or receivables with collateral held and/or posted and create one single net payment (close-out netting) in the event of default, termination and/or potential deterioration in the credit quality of the counterparty. Various Master Agreements govern the terms of certain transactions with counterparties, including transactions such as swap, forward, repurchase and reverse repurchase agreements. These Master Agreements typically attempt to reduce the counterparty risk associated with such transactions by specifying credit protection
25
Morgan Stanley Institutional Fund, Inc.
Annual Report — December 31, 2015
Notes to Financial Statements (cont'd)
mechanisms and providing standardization that improves legal certainty. Cross-termination provisions under Master Agreements typically provide that a default in connection with one transaction between the Portfolio and a counterparty gives the non-defaulting party the right to terminate any other transactions in place with the defaulting party to create one single net payment due to/due from the defaulting party and may be a feature in certain Master Agreements. In the event the Portfolio exercises its right to terminate a Master Agreement after a counterparty experiences a termination event as defined in the Master Agreement, the return of collateral with market value in excess of the Portfolio's net liability may be delayed or denied.
The following table presents derivative financial instruments that are subject to enforceable netting arrangements as of December 31, 2015.
Gross Amounts Not Offset in the Statement of Assets and Liabilities | |||||||||||||||||||
Counterparty | Gross Asset Derivatives Presented in Statement of Assets and Liabilities (000) | Financial Instrument (000) | Collateral Received(e) (000) | Net Amount (not less than $0) (000) | |||||||||||||||
Royal Bank of Scotland | $ | 8,225 | $ | — | $ | (8,225 | ) | $ | 0 | ||||||||||
(e) In some instances, the actual collateral received may be more than the amount shown here due to overcollateralization.
For the year ended December 31, 2015, the approximate average monthly amount outstanding for each derivative type is as follows:
Call Option Purchased: | |||||||
Average monthly notional amount | 990,671,000 | ||||||
6. Securities Lending: The Portfolio lends securities to qualified financial institutions, such as broker-dealers, to earn additional income. Any increase or decrease in the fair value of the securities loaned that might occur and any interest earned or dividends declared on those securities during the term of the loan would remain in the Portfolio. The Portfolio would receive cash or securities as collateral in an amount equal to or exceeding 100% of the current fair value of the loaned securities. The collateral is marked-to-market daily by State Street Bank and Trust Company ("State Street"), the securities lending agent, to ensure that a minimum of 100% collateral coverage is maintained.
Based on pre-established guidelines, the securities lending agent invests any cash collateral that is received in an affiliated money market portfolio and repurchase agreements. Securities lending income is generated from the earnings on the invested collateral and borrowing fees, less any rebates owed to the borrowers and compensation to the lending agent, and is recorded as "Income from Securities Loaned — Net" in the Portfolio's Statement of Operations. Risks in securities lending transactions are that a borrower may not provide additional collateral when required or return the securities when due, and that the value of the short-term investments will be less than the amount of cash collateral plus any rebate that is required to be returned to the borrower.
The Portfolio has the right under the lending agreement to recover the securities from the borrower on demand.
The following table presents financial instruments that are subject to enforceable netting arrangements as of December 31, 2015.
Gross Amounts Not Offset in the Statement of Assets and Liabilities | |||||||||||||||
| Gross Asset Amounts Presented in Statement of Assets and Liabilities (000) | Financial Instrument (000) | Collateral Received (000) | Net Amount (not less than $0) (000) | ||||||||||||
| $ | 175,431 | (f) | $ | — | $ | (175,431 | )(g)(h) | $ | 0 | ||||||
(f) Represents market value of loaned securities at period end.
(g) The Portfolio received cash collateral of approximately $177,319,000, which was subsequently invested in Repurchase Agreements and Morgan Stanley Institutional Liquidity Funds as reported in the Portfolio of Investments. In addition, the Portfolio received non-cash collateral of approximately $1,023,000 in the form of U.S. Government obligations, which the Portfolio cannot sell or repledge, and accordingly are not reflected in the Portfolio of Investments.
(h) The actual collateral received is greater than the amount shown here due to overcollateralization.
The Portfolio has adopted the disclosure provisions of FASB Accounting Standards Update No. 2014-11 ("ASU No. 2014-11"), "Transfers & Servicing (Topic 860): Repurchase-to-Maturity Transactions, Repurchase Financings, and Disclosures". ASU No. 2014-11 is intended to provide increased transparency about the types of collateral pledged in securities lending transactions and other similar transactions that are accounted for as secured borrowing.
26
Morgan Stanley Institutional Fund, Inc.
Annual Report — December 31, 2015
Notes to Financial Statements (cont'd)
The following table displays a breakdown of transactions accounted for as secured borrowings, the gross obligations by class of collateral pledged, and the remaining contractual maturity of those transactions as of December 31, 2015.
Remaining Contractual Maturity of the Agreements As of December 31, 2015 | |||||||||||||||||||||||
| Overnight and Continuous (000) | <30 days (000) | Between 30 & 90 days (000) | >90 days (000) | Total (000) | |||||||||||||||||||
Securities Lending Transactions | |||||||||||||||||||||||
Common Stocks | $ | 177,319 | $ | — | $ | — | $ | — | $ | 177,319 | |||||||||||||
Total Borrowings | $ | 177,319 | $ | — | $ | — | $ | — | $ | 177,319 | |||||||||||||
Gross amount of recognized liabilities for securities lending transactions | $ | 177,319 | |||||||||||||||||||||
7. Restricted Securities: The Portfolio invests in unregistered or otherwise restricted securities. The term "restricted securities" refers to securities that are unregistered or are held by control persons of the issuer and securities that are subject to contractual restrictions on their resale. As a result, restricted securities may be more difficult to value and the Portfolio may have difficulty disposing of such assets either in a timely manner or for a reasonable price. In order to dispose of an unregistered security, the Portfolio, where it has contractual rights to do so, may have to cause such security to be registered. A considerable period may elapse between the time the decision is made to sell the security and the time the security is registered so that the Portfolio could sell it. Contractual restrictions on the resale of securities vary in length and scope and are generally the result of a negotiation between the issuer and acquirer of the securities. The Portfolio would, in either case, bear market risks during that period. Restricted securities are identified in the Portfolio of Investments.
8. Indemnifications: The Fund enters into contracts that contain a variety of indemnifications. The Fund's maximum exposure under these arrangements is unknown. However, the Fund has not had prior claims or losses pursuant to these contracts and expects the risk of loss to be remote.
9. Dividends and Distributions to Shareholders: Dividend income and distributions to shareholders are recorded on the ex-dividend date. Dividends from net investment income, if any, are declared and paid annually. Net realized capital gains, if any, are distributed at least annually.
10. Security Transactions, Income and Expenses: Security transactions are accounted for on the trade date (date the order to buy or sell is executed). Realized gains and losses on the sale of investment securities are
determined on the specific identified cost method. Dividend income and other distributions are recorded on the ex-dividend date (except for certain foreign dividends which may be recorded as soon as the Portfolio is informed of such dividends) net of applicable withholding taxes. Interest income is recognized on the accrual basis except where collection is in doubt. Discounts are accreted and premiums are amortized over the life of the respective securities. Most expenses of the Fund can be directly attributed to a particular Portfolio. Expenses which cannot be directly attributed are apportioned among the Portfolios based upon relative net assets or other appropriate methods. Income, expenses (other than class specific expenses — distribution and shareholder services, transfer agency and sub transfer agency fees) and realized and unrealized gains or losses are allocated to each class of shares based upon their relative net assets.
B. Advisory Fees: The Adviser, a wholly-owned subsidiary of Morgan Stanley, provides the Portfolio with advisory services under the terms of an Investment Advisory Agreement, paid quarterly, at the annual rate based on the daily net assets as follows:
| First $1 billion | Next $1 billion | Next $1 billion | Over $3 billion | ||||||||||||
| 0.50 | % | 0.45 | % | 0.40 | % | 0.35 | % | ||||||||
For the year ended December 31, 2015, the advisory fee rate (net of rebate) was equivalent to an annual effective rate of 0.43% of the Portfolio's average daily net assets.
Pursuant to the Reorganization, the Adviser has agreed to reduce its advisory fee and/or reimburse the Portfolio so that total annual portfolio operating expenses, excluding certain investment related expenses, taxes, interest and other extraordinary expenses (including litigation), will not exceed 0.70% for Class I, 1.05% for Class A, 1.55% for Class L, 1.80% for Class C and 0.67% for Class IS. In addition, the Adviser has
27
Morgan Stanley Institutional Fund, Inc.
Annual Report — December 31, 2015
Notes to Financial Statements (cont'd)
agreed to reimburse 0.01% of expenses of the Class A shares to the extent that total annual operating expenses of the Class A shares exceed 0.96%. The fee waivers and/or expense reimbursements will continue for at least two years from the date of the Reorganization or until such time as the Directors act to discontinue all or a portion of such waivers and/or reimbursements when they deem such action is appropriate. Following the two-year period from the date of the Reorganization, the Adviser has agreed to reduce its advisory fee and/or reimburse the Portfolio so that total annual operating expenses, excluding certain investment related expenses, taxes, interest and other extraordinary expenses (including litigation), will not exceed 0.80% for Class I, 1.15% for Class A, 1.65% for Class L, 1.90% for Class C and 0.73% for Class IS. The fee waivers and/or expense reimbursements will continue for at least one year from the date of the Portfolio's prospectus or until such time as the Directors act to discontinue all or a portion of such waivers and/or reimbursements when they deem such action is appropriate. For the year ended December 31, 2015, approximately $78,000 of other expenses were reimbursed by the Adviser pursuant to this arrangement.
C. Administration Fees: The Adviser also serves as Administrator to the Fund and provides administrative services pursuant to an Administration Agreement for an annual fee, accrued daily and paid monthly, of 0.08% of the Portfolio's average daily net assets.
Under a Sub-Administration Agreement between the Administrator and State Street, State Street provides certain administrative services to the Fund. For such services, the Administrator pays State Street a portion of the fee the Administrator receives from the Portfolio.
D. Distribution and Shareholder Services Fees: Morgan Stanley Distribution, Inc. ("MSDI" or the "Distributor"), a wholly-owned subsidiary of the Adviser and an indirect subsidiary of Morgan Stanley, serves as the Fund's Distributor of Portfolio shares pursuant to a Distribution Agreement. The Fund has adopted a Shareholder Services Plan with respect to Class A shares pursuant to Rule 12b-1 under the Act. Under the Shareholder Services Plan, the Portfolio pays the Distributor a shareholder services fee, accrued daily and paid monthly, at an annual rate of 0.25% of the Portfolio's average daily net assets attributable to Class A shares.
The Fund has adopted a Distribution and Shareholder Services Plan with respect to Class L shares pursuant to Rule 12b-1 under the Act. Under the Distribution and Shareholder Services
Plan, the Portfolio pays the Distributor a distribution fee, accrued daily and paid monthly, at an annual rate of 0.50% and a shareholder services fee, accrued daily and paid monthly, at an annual rate of 0.25% of the Portfolio's average daily net assets attributable to Class L shares.
The Fund has adopted a Distribution and Shareholder Services Plan with respect to Class C shares pursuant to Rule 12b-1 under the Act. Under the Distribution and Shareholder Services Plan, the Portfolio pays the Distributor a distribution fee, accrued daily and paid monthly, at an annual rate of 0.75% and a shareholder services fee, accrued daily and paid monthly, at an annual rate of 0.25% of the Portfolio's average daily net assets attributable to Class C shares.
The distribution and shareholder services fees are used to support the expenses associated with servicing and maintaining accounts. The Distributor may compensate other parties for providing shareholder support services to investors who purchase Class A, Class L and Class C shares.
E. Dividend Disbursing and Transfer Agent: The Fund's dividend disbursing and transfer agent is Boston Financial Data Services, Inc. ("BFDS"). Pursuant to a Transfer Agency Agreement, the Fund pays BFDS a fee based on the number of classes, accounts and transactions relating to the Portfolios of the Fund.
F. Custodian Fees: State Street (the "Custodian") serves as Custodian for the Fund in accordance with a Custodian Agreement. The Custodian holds cash, securities, and other assets of the Fund as required by the Act. Custody fees are payable monthly based on assets held in custody, investment purchases and sales activity and account maintenance fees, plus reimbursement for certain out-of-pocket expenses.
G. Security Transactions and Transactions with Affiliates: For the year ended December 31, 2015, purchases and sales of investment securities for the Portfolio, other than long-term U.S. Government securities and short-term investments, were approximately $1,156,862,000 and $1,327,782,000, respectively. There were no purchases and sales of long-term U.S. Government securities for the year ended December 31, 2015.
The Portfolio invests in the Institutional Class of the Morgan Stanley Institutional Liquidity Funds (the "Liquidity Funds"), an open-end management investment company managed by the Adviser, both directly and as a portion of the securities held as collateral on loaned securities. Advisory fees paid by the
28
Morgan Stanley Institutional Fund, Inc.
Annual Report — December 31, 2015
Notes to Financial Statements (cont'd)
Portfolio are reduced by an amount equal to its pro-rata share of the advisory and administration fees paid by the Portfolio due to its investments in the Liquidity Funds. For the year ended December 31, 2015, advisory fees paid were reduced by approximately $116,000 relating to the Portfolio's investment in the Liquidity Funds.
A summary of the Portfolio's transactions in shares of the Liquidity Funds during the year ended December 31, 2015 is as follows:
| Value December 31, 2014 (000) | Purchases at Cost (000) | Sales (000) | Dividend Income (000) | Value December 31, 2015 (000) | |||||||||||||||
| $ | 167,796 | $ | 1,030,289 | $ | 895,256 | $ | 208 | $ | 302,829 | ||||||||||
The Portfolio has an unfunded Deferred Compensation Plan (the "Compensation Plan"), which allows each independent Director to defer payment of all, or a portion, of the fees he or she receives for serving on the Board of Directors. Each eligible Director generally may elect to have the deferred amounts credited with a return equal to the total return on one or more of the Morgan Stanley funds that are offered as investment options under the Compensation Plan. Appreciation/depreciation and distributions received from these investments are recorded with an offsetting increase/decrease in the deferred compensation obligation and do not affect the NAV of the Portfolio.
H. Federal Income Taxes: It is the Portfolio's intention to continue to qualify as a regulated investment company and distribute all of its taxable and tax-exempt income. Accordingly, no provision for Federal income taxes is required in the financial statements.
The Portfolio may be subject to taxes imposed by countries in which it invests. Such taxes are generally based on income and/or capital gains earned or repatriated. Taxes are accrued based on net investment income, net realized gains and net unrealized appreciation as such income and/or gains are earned. Taxes may also be based on transactions in foreign currency and are accrued based on the value of investments denominated in such currency.
FASB ASC 740-10, "Income Taxes — Overall", sets forth a minimum threshold for financial statement recognition of the benefit of a tax position taken or expected to be taken in a tax return. Management has concluded there are no significant uncertain tax positions that would require recognition in the financial statements. If applicable, the Portfolio recognizes interest accrued related to unrecognized tax benefits in "Interest Expense" and penalties in "Other Expenses" in the State-
ment of Operations. The Portfolio files tax returns with the U.S. Internal Revenue Service, New York and various states. Generally, each of the tax years in the four-year period ended December 31, 2015, remains subject to examination by taxing authorities.
The tax character of distributions paid may differ from the character of distributions shown in the Statements of Changes in Net Assets due to short-term capital gains being treated as ordinary income for tax purposes. The tax character of distributions paid during fiscal 2015 and 2014 was as follows:
| 2015 Distributions Paid From: | 2014 Distributions Paid From: | ||||||||||||||
| Ordinary Income (000) | Long-Term Capital Gain (000) | Ordinary Income (000) | Long-Term Capital Gain (000) | ||||||||||||
| $ | 5,086 | $ | 256,809 | $ | 3,224 | $ | 159,845 | ||||||||
The amount and character of income and gains to be distributed are determined in accordance with income tax regulations which may differ from GAAP. These book/tax differences are either considered temporary or permanent in nature.
Temporary differences are primarily due to differing book and tax treatments in the timing of the recognition of gains (losses) on certain investment transactions and the timing of the deductibility of certain expenses.
Permanent differences, primarily due to differing treatments of gains (losses) related to foreign currency transactions, a net operating loss and basis adjustments on partnerships, resulted in the following reclassifications among the components of net assets at December 31, 2015:
| Accumulated Net Investment Loss (000) | Accumulated Net Realized Gain (000) | Paid-in- Capital (000) | |||||||||
| $ | 12,776 | $ | (12,732 | ) | $ | (44 | ) | ||||
At December 31, 2015, the components of distributable earnings for the Portfolio on a tax basis were as follows:
| Undistributed Ordinary Income (000) | Undistributed Long-Term Capital Gain (000) | ||||||
| $ | — | $ | 196,806 | ||||
Capital losses and specified ordinary losses, including currency losses, incurred after October 31 but within the taxable year are deemed to arise on the first day of the Portfolio's next taxable year. For the year ended December 31, 2015, the Portfolio
29
Morgan Stanley Institutional Fund, Inc.
Annual Report — December 31, 2015
Notes to Financial Statements (cont'd)
deferred to January 1, 2016 for U.S. Federal income tax purposes the following losses:
| Post-October Currency and Specified Ordinary Losses (000) | Post-October Capital Losses (000) | ||||||
| $ | 513 | $ | — | ||||
I. Other: At December 31, 2015, the Portfolio had record owners of 10% or greater. Investment activities of these shareholders could have a material impact on the Portfolio. The aggregate percentage of such owners was 55.7%.
30
Morgan Stanley Institutional Fund, Inc.
Annual Report — December 31, 2015
Report of Independent Registered Public Accounting Firm
To the Shareholders and Board of Directors of
Morgan Stanley Institutional Fund, Inc. —
Growth Portfolio
We have audited the accompanying statement of assets and liabilities, including the portfolio of investments, of Growth Portfolio (one of the portfolios constituting Morgan Stanley Institutional Fund, Inc.) (the "Portfolio") as of December 31, 2015, and the related statement of operations for the year then ended, the statements of changes in net assets for each of the two years in the period then ended and the financial highlights for each of the years or periods indicated therein. These financial statements and financial highlights are the responsibility of the Portfolio's management. Our responsibility is to express an opinion on these financial statements and financial highlights based on our audits.
We conducted our audits in accordance with the standards of the Public Company Accounting Oversight Board (United States). Those standards require that we plan and perform the audit to obtain reasonable assurance about whether the financial statements and financial highlights are free of material misstatement. We were not engaged to perform an audit of the Portfolio's internal control over financial reporting. Our audits included consideration of internal control over financial reporting as a basis for designing audit procedures that are appropriate in the circumstances, but not for the purpose of expressing an opinion on the effectiveness of the Portfolio's internal control over financial reporting. Accordingly, we express no such opinion. An audit also includes examining, on a test basis, evidence supporting the amounts and disclosures in the financial statements and financial highlights, assessing the accounting principles used and significant estimates made by management, and evaluating the overall financial statement presentation. Our procedures included confirmation of securities owned as of December 31, 2015, by correspondence with the custodian and others. We believe that our audits provide a reasonable basis for our opinion.
In our opinion, the financial statements and financial highlights referred to above present fairly, in all material respects, the financial position of Growth Portfolio (one of the portfolios constituting Morgan Stanley Institutional Fund, Inc.) December 31, 2015, the results of its operations for the year then ended, the changes in its net assets for each of the two years in the period then ended and the financial highlights for each of the years or periods indicated therein, in conformity with U.S. generally accepted accounting principles.

Boston, Massachusetts
February 26, 2016
31
Morgan Stanley Institutional Fund, Inc.
Annual Report — December 31, 2015
Federal Tax Notice (unaudited)
For Federal income tax purposes, the following information is furnished with respect to the distributions paid by the Portfolio during its taxable year ended December 31, 2015. For corporate shareholders, 100.0% of the dividends qualified for the dividends received deduction.
The Portfolio designated and paid approximately $256,809,000 as a long-term capital gain distribution.
For Federal income tax purposes, the following information is furnished with respect to the Portfolio's earnings for its taxable year ended December 31, 2015. When distributed, certain earnings may be subject to a maximum tax rate of 15% as provided for the Jobs and Growth Tax Relief Reconciliation Act of 2003. The Portfolio designated up to a maximum of approximately $5,086,000 as taxable at this lower rate.
In January, the Portfolio provides tax information to shareholders for the preceding calendar year.
32
Morgan Stanley Institutional Fund, Inc.
Annual Report — December 31, 2015
U.S. Privacy Policy (unaudited)
AN IMPORTANT NOTICE CONCERNING OUR U.S. PRIVACY POLICY
This privacy notice describes the U.S. privacy policy of Morgan Stanley Distribution, Inc., and the Morgan Stanley family of mutual funds ("us", "our", "we").
We are required by federal law to provide you with notice of our U.S. privacy policy ("Policy"). This Policy applies to both our current and former clients unless we state otherwise and is intended for individual clients who purchase products or receive services from us for personal, family or household purposes. This Policy is not applicable to partnerships, corporations, trusts or other non-individual clients or account holders, nor is this Policy applicable to individuals who are either beneficiaries of a trust for which we serve as trustee or participants in an employee benefit plan administered or advised by us. This Policy is, however, applicable to individuals who select us to be a custodian of securities or assets in individual retirement accounts, 401(k) accounts, or accounts subject to the Uniform Gifts to Minors Act.
This notice sets out our business practices to protect your privacy; how we collect and share personal information about you; and how you can limit our sharing or certain uses by others of this information. We may amend this Policy at any time, and will inform you of any changes to our Policy as required by law.
WE RESPECT YOUR PRIVACY
We appreciate that you have provided us with your personal financial information and understand your concerns about your information. We strive to safeguard the information our clients entrust to us. Protecting the confidentiality and security of client information is an important part of how we conduct our business.
This notice describes what personal information we collect about you, how we collect it, when we may share it with others, and how certain others may use it. It discusses the steps you may take to limit our sharing of certain information about you with our affiliated companies, including, but not limited to our affiliated banking businesses, brokerage firms and credit service affiliates. It also discloses how you may limit our affiliates' use of shared information for marketing purposes.
Throughout this Policy, we refer to the nonpublic information that personally identifies you as "personal information." We also use the term "affiliated company" in this notice. An affiliated company is a company in our family of companies and includes companies with the Morgan Stanley name. These affiliated companies are financial institutions such as broker-dealers, banks, investment advisers and credit card issuers. We refer to any company that is not an affiliated company as a nonaffiliated third party. For purposes of Section 5 of this notice, and your ability to limit certain uses of personal information by our affiliates, this notice applies to the use of personal information by our affiliated companies.
1. WHAT PERSONAL INFORMATION DO WE COLLECT FROM YOU?
We may collect the following types of information about you: (i) information provided by you, including information from applications and other forms we receive from you, (ii) information about your transactions with us or our affiliates, (iii) information about your transactions with nonaffiliated third parties, (iv) information from consumer reporting agencies, (v) information obtained from our websites, and (vi) information obtained from other sources. For example:
• We collect information such as your name, address, e-mail address, telephone/fax numbers, assets, income and investment objectives through applications and other forms you submit to us.
• We may obtain information about account balances, your use of account(s) and the types of products and services you prefer to receive from us through your dealings and transactions with us and other sources.
• We may obtain information about your creditworthiness and credit history from consumer reporting agencies.
• We may collect background information from and through third-party vendors to verify representations you have made and to comply with various regulatory requirements.
2. WHEN DO WE DISCLOSE PERSONAL INFORMATION WE COLLECT ABOUT YOU?
We may disclose personal information we collect about you in each of the categories listed above to affiliated and nonaffiliated third parties.
33
Morgan Stanley Institutional Fund, Inc.
Annual Report — December 31, 2015
U.S. Privacy Policy (unaudited) (cont'd)
a. Information We Disclose to Affiliated Companies.
We may disclose personal information that we collect about you to our affiliated companies to manage your account(s) effectively, to service and process your transactions, and to let you know about products and services offered by us and affiliated companies, to manage our business, and as otherwise required or permitted by law. Offers for products and services from affiliated companies are developed under conditions designed to safeguard your personal information.
b. Information We Disclose to Third Parties.
We may disclose personal information that we collect about you to nonaffiliated third parties to provide marketing services on our behalf or to other financial institutions with whom we have joint marketing agreements. We may also disclose all of the information we collect to other nonaffiliated third parties for our everyday business purposes, such as to process transactions, maintain account(s), respond to court orders and legal investigations, report to credit bureaus, offer our own products and services, protect against fraud, for institutional risk control, to perform services on our behalf, and as otherwise required or permitted by law.
When we share personal information about you with a nonaffiliated third party, they are required to limit their use of personal information about you to the particular purpose for which it was shared and they are not allowed to share personal information about you with others except to fulfill that limited purpose or as may be permitted or required by law.
3. HOW DO WE PROTECT THE SECURITY AND CONFIDENTIALITY OF PERSONAL INFORMATION WE COLLECT ABOUT YOU?
We maintain physical, electronic and procedural security measures that comply with applicable law and regulations to help safeguard the personal information we collect about you. We have internal policies governing the proper handling of client information by employees. Third parties that provide support or marketing services on our behalf may also receive personal information about you, and we require them to adhere to appropriate security standards with respect to such information.
4. HOW CAN YOU LIMIT OUR SHARING CERTAIN PERSONAL INFORMATION ABOUT YOU WITH OUR AFFILIATED COMPANIES FOR ELIGIBILITY DETERMINATION?
By following the opt-out procedures in Section 6 below, you may limit the extent to which we share with our affiliated companies, personal information that was collected to determine your eligibility for products and services such as your credit reports and other information that you have provided to us or that we may obtain from third parties ("eligibility information"). Eligibility information does not include your identification information or personal information pertaining to our transactions or experiences with you. Please note that, even if you direct us not to share eligibility information with our affiliated companies, we may still share your personal information, including eligibility information, with our affiliated companies under circumstances that are permitted under applicable law, such as to process transactions or to service your account.
5. HOW CAN YOU LIMIT THE USE OF CERTAIN PERSONAL INFORMATION ABOUT YOU BY OUR AFFILIATED COMPANIES FOR MARKETING?
By following the opt-out instructions in Section 6 below, you may limit our affiliated companies from marketing their products or services to you based on personal information we disclose to them. This information may include, for example, your income and account history with us. Please note that, even if you choose to limit our affiliated companies from using personal information about you that we may share with them for marketing their products and services to you, our affiliated companies may use your personal information that they obtain from us to market to you in circumstances permitted by law, such as if the affiliated party has its own relationship with you.
34
Morgan Stanley Institutional Fund, Inc.
Annual Report — December 31, 2015
U.S. Privacy Policy (unaudited) (cont'd)
6. HOW CAN YOU SEND US AN OPT-OUT INSTRUCTION?
If you wish to limit our sharing of eligibility information about you with our affiliated companies, or our affiliated companies' use of personal information for marketing purposes, as described in this notice, you may do so by:
• Calling us at (800) 548-7786
Monday–Friday between 8a.m. and 6p.m. (EST)
• Writing to us at the following address:
Boston Financial Data Services, Inc.
c/o Privacy Coordinator
P.O. Box 219804
Kansas City, Missouri 64121
If you choose to write to us, your request should include: your name, address, telephone number and account number(s) to which the opt-out applies and whether you are opting out with respect to sharing of eligibility information (Section 4 above), or information used for marketing (Section 5 above), or both. Written opt-out requests should not be sent with any other correspondence. In order to process your request, we require that the request be provided by you directly and not through a third party. Once you have informed us about your privacy preferences, your opt-out preference will remain in effect with respect to this Policy (as it may be amended) until you notify us otherwise. If you are a joint account owner, we will accept instructions from any one of you and apply those instructions to the entire account.
Please understand that if you limit our sharing or our affiliated companies' use of personal information, you and any joint account holder(s) may not receive information about our affiliated companies' products and services, including products or services that could help you manage your financial resources and achieve your investment objectives.
If you have more than one account or relationship with us, please specify the accounts to which you would like us to apply your privacy choices. If you have accounts or relationships with our affiliates, you may receive multiple privacy policies from them, and will need to separately notify those companies of your privacy choices for those accounts or relationships.
7. WHAT IF AN AFFILIATED COMPANY BECOMES A NONAFFILIATED THIRD PARTY?
If, at any time in the future, an affiliated company becomes a nonaffiliated third party, further disclosures of personal information made to the former affiliated company will be limited to those described in Section 2(b) above relating to nonaffiliated third parties. If you elected under Section 6 to limit disclosures we make to affiliated companies, or use of personal information by affiliated companies, your election will not apply to use by any former affiliated company of your personal information in their possession once it becomes a nonaffiliated third party.
SPECIAL NOTICE TO RESIDENTS OF VERMONT
The following section supplements our Policy with respect to our individual clients who have a Vermont address and supersedes anything to the contrary in the above Policy with respect to those clients only.
The State of Vermont requires financial institutions to obtain your consent prior to sharing personal information that they collect about you with nonaffiliated third parties, or eligibility information with affiliated companies, other than in certain limited circumstances. Except as permitted by law, we will not share personal information we collect about you with nonaffiliated third parties or eligibility information with affiliated companies, unless you provide us with your written consent to share such information.
SPECIAL NOTICE TO RESIDENTS OF CALIFORNIA
The following section supplements our Policy with respect to our individual clients who have a California address and supersedes anything to the contrary in the above Policy with respect to those clients only.
In response to a California law, if your account has a California home address, your personal information will not be disclosed to nonaffiliated third parties except as permitted by applicable California law, and we will limit sharing such personal information with our affiliates to comply with California privacy laws that apply to us.
35
Morgan Stanley Institutional Fund, Inc.
Annual Report — December 31, 2015
Director and Officer Information (unaudited)
Independent Directors:
| Name, Age and Address of Independent Director | Positions(s) Held with Registrant | Length of Time Served | Principal Occupation(s) During Past 5 Years and Other Relevant Professional Experience | Number of Portfolios in Fund Complex Overseen by Director** | Other Directorships Held by Independent Director*** | ||||||||||||||||||
| Frank L. Bowman (71) c/o Kramer Levin Naftalis & Frankel LLP Counsel to the Independent Directors 1177 Avenue of the Americas New York, NY 10036 | Director | Since August 2006 | President, Strategic Decisions, LLC (consulting) (since February 2009); Director or Trustee of various Morgan Stanley Funds (since August 2006); Chairperson of the Compliance and Insurance Committee (since October 2015); Formerly, Chairperson of the Insurance Sub-Committee of the Compliance and Insurance Committee (February 2007-December 2015); served as President and Chief Executive Officer of the Nuclear Energy Institute (policy organization) (February 2005-November 2008); retired as Admiral, U.S. Navy after serving over 38 years on active duty including 8 years as Director of the Naval Nuclear Propulsion Program in the Department of the Navy and the U.S. Department of Energy (1996-2004); served as Chief of Naval Personnel (July 1994-September 1996); and on the Joint Staff as Director of Political Military Affairs (June 1992-July1994); knighted as Honorary Knight Commander of the Most Excellent Order of the British Empire; awarded the Officier de l'Orde National du Mérite by the French Government; elected to the National Academy of Engineering (2009). | 98 | Director of BP p.l.c.; Director of Naval and Nuclear Technologies LLP; Director Emeritus of the Armed Services YMCA; Director of the U.S. Naval Submarine League; Member of the National Security Advisory Council of the Center for U.S. Global Engagement and a member of the CNA Military Advisory Board; Chairman of the Charity, J Street Cup Golf, Trustee of Fairhaven United Methodist Church; and Director of other various non-profit organizations. | ||||||||||||||||||
| Kathleen A. Dennis (62) c/o Kramer Levin Naftalis & Frankel LLP Counsel to the Independent Directors 1177 Avenue of the Americas New York, NY 10036 | Director | Since August 2006 | President, Cedarwood Associates (mutual fund and investment management consulting) (since July 2006); Chairperson of the Money Market and Alternatives Sub-Committee of the Investment Committee (since October 2006) and Director or Trustee of various Morgan Stanley Funds (since August 2006); formerly, Senior Managing Director of Victory Capital Management (1993-2006). | 98 | Director of various nonprofit organizations. | ||||||||||||||||||
| Nancy C. Everett (61) c/o Kramer Levin Naftalis & Frankel LLP Counsel to the Independent Trustees 1177 Avenue of the Americas New York, NY 10036 | Trustee | Since January 2015 | Chief Executive Officer, Virginia Commonwealth University Investment Company (since November 2015); Owner OBIR, LLC (institutional investment management consulting) (since June 2014); formerly, Managing Director, BlackRock, Inc. (February 2011-December 2013); and Chief Executive Officer, General Motors Asset Management (a/k/a Promark Global Advisors, Inc.) (June 2005-May 2010). | 98 | Member of Virginia Commonwealth University School of Business Foundation; formerly, Member of Virginia Commonwealth University Board of Visitors (2013-2015); Member of Committee on Directors for Emerging Markets Growth Fund, Inc. (2007-2010); Chairperson of Performance Equity Management, LLC (2006-2010); and Chairperson, GMAM Absolute Return Strategies Fund, LLC (2006-2010). | ||||||||||||||||||
36
Morgan Stanley Institutional Fund, Inc.
Annual Report — December 31, 2015
Director and Officer Information (unaudited) (cont'd)
Independent Directors: (cont'd)
| Name, Age and Address of Independent Director | Positions(s) Held with Registrant | Length of Time Served | Principal Occupation(s) During Past 5 Years and Other Relevant Professional Experience | Number of Portfolios in Fund Complex Overseen by Director** | Other Directorships Held by Independent Director*** | ||||||||||||||||||
| Jakki L. Haussler (58) c/o Kramer Levin Naftalis & Frankel LLP Counsel to the Independent Directors 1177 Avenue of the Americas New York, NY 10036 | Director | Since January 2015 | Chairman and Chief Executive Officer, Opus Capital Group (since January 1996); and formerly, Director, Capvest Venture Fund, LP (May 2000-December 2011); Partner, Adena Ventures, LP (July 1999-December 2010); Director, The Victory Funds (February 2005-July 2008). | 98 | Director of Cincinnati Bell Inc. and Member, Audit Committee and Compensation Committee; Director of Northern Kentucky University Foundation and Member, Investment Committee; Member of Chase College of Law Transactional Law Practice Center Board of Advisors; Director of Best Transport; Chase College of Law Board of Visitors; formerly Member, University of Cincinnati Foundation Investment Committee; Member, Miami University Board of Visitors (2008-2011); Trustee of Victory Funds (2005-2008) and Chairman, Investment Committee (2007-2008) and Member, Service Provider Committee (2005-2008). | ||||||||||||||||||
| Dr. Manuel H. Johnson (67) c/o Johnson Smick International, Inc. 220 I Street, N.E. — Suite 200 Washington, D.C. 20002 | Director | Since July 1991 | Senior Partner, Johnson Smick International, Inc. (consulting firm); Chairperson of the Investment Committee (since October 2006) and Director or Trustee of various Morgan Stanley Funds (since July 1991); Co-Chairman and a founder of the Group of Seven Council (G7C) (international economic commission); formerly Chairperson of the Audit Committee (July 1991-September 2006), Vice Chairman of the Board of Governors of the Federal Reserve System and Assistant Secretary of the U.S. Treasury. | 100 | Director of NVR, Inc. (home construction). | ||||||||||||||||||
| Joseph J. Kearns (73) c/o Kearns & Associates LLC 23823 Malibu Road S-50-440 Malibu, CA 90265 | Director | Since August 1994 | President, Kearns & Associates LLC (investment consulting); Chairperson of the Audit Committee (since October 2006) and Director or Trustee of various Morgan Stanley Funds (since August 1994); formerly, Deputy Chairperson of the Audit Committee (July 2003-September 2006) and Chairperson of the Audit Committee of various Morgan Stanley Funds (since August 1994); CFO of the J. Paul Getty Trust. | 101 | Director of Electro Rent Corporation (equipment leasing). Prior to December 31, 2013, Director of The Ford Family Foundation. | ||||||||||||||||||
37
Morgan Stanley Institutional Fund, Inc.
Annual Report — December 31, 2015
Director and Officer Information (unaudited) (cont'd)
Independent Directors: (cont'd)
| Name, Age and Address of Independent Director | Positions(s) Held with Registrant | Length of Time Served | Principal Occupation(s) During Past 5 Years and Other Relevant Professional Experience | Number of Portfolios in Fund Complex Overseen by Director** | Other Directorships Held by Independent Director*** | ||||||||||||||||||
| Michael F. Klein (57) c/o Kramer Levin Naftalis & Frankel LLP Counsel to the Independent Directors 1177 Avenue of the Americas New York, NY 10036 | Director | Since August 2006 | Managing Director, Aetos Capital, LLC (since March 2000); Co-President, Aetos Alternatives Management, LLC (since January 2004); and Co-Chief Executive Officer of Aetos Capital LLC (since August 2013); Chairperson of the Fixed Income Sub-Committee of the Investment Committee (since October 2006) and Director or Trustee of various Morgan Stanley Funds (since August 2006); formerly, Managing Director, Morgan Stanley & Co. Inc. and Morgan Stanley Dean Witter Investment Management, President, various Morgan Stanley Funds (June1998-March 2000) and Principal, Morgan Stanley & Co. Inc. and Morgan Stanley Dean Witter Investment Management (August 1997-December 1999). | 97 | Director of certain investment funds managed or sponsored by Aetos Capital, LLC. Director of Sanitized AG and Sanitized Marketing AG (specialty chemicals). | ||||||||||||||||||
| Michael E. Nugent (79) 522 Fifth Avenue New York, NY 10036 | Chair of the Board and Director | Chair of the Boards since July 2006 and Director since July 1991 | Chair of the Boards of various Morgan Stanley Funds (since July 2006); Chairperson of the Closed-End Fund Committee (since June 2012) and Director or Trustee of various Morgan Stanley Funds (since July 1991); formerly, Chairperson of the Insurance Committee (until July 2006), General Partner, TriumphCapital, L.P. (private investment partnership) (1988-2013). | 100 | None. | ||||||||||||||||||
| W. Allen Reed (68) c/o Kramer Levin Naftalis & Frankel LLP Counsel to the Independent Directors 1177 Avenue of the Americas New York, NY 10036 | Director | Since August 2006 | Chairperson of the Equity Sub-Committee of the Investment Committee (since October 2006) and Director or Trustee of various Morgan Stanley Funds (since August 2006); formerly, President and CEO of General Motors Asset Management; Chairman and Chief Executive Officer of the GM Trust Bank and Corporate Vice President of General Motors Corporation (August 1994-December 2005). | 98 | Director of Legg Mason, Inc.; formerly Director of the Auburn University Foundation (2010-2015). | ||||||||||||||||||
| Fergus Reid (83) c/o Joe Pietryka, Inc. 85 Charles Colman Blvd. Pawling, NY 12564 | Director | Since June 1992 | Chairman, Joe Pietryka, Inc.; Chairperson of the Governance Committee and Director or Trustee of various Morgan Stanley Funds (since June 1992). | 100 | Formerly, Trustee and Director of certain investment companies in the JP Morgan Fund Complex managed by JP Morgan Investment Management Inc. (1987-2012). | ||||||||||||||||||
38
Morgan Stanley Institutional Fund, Inc.
Annual Report — December 31, 2015
Director and Officer Information (unaudited) (cont'd)
Interested Director:
| Name, Age and Address of Interested Director | Positions(s) Held with Registrant | Length of Time Served* | Principal Occupation(s) During Past 5 Years | Number of Portfolios in Fund Complex Overseen by Interested Director** | Other Directorships Held by Interested Director*** | ||||||||||||||||||
| James F. Higgins (68) One New York Plaza, New York, NY 10004 | Director | Since June 2000 | Director or Trustee of various Morgan Stanley Funds (since June 2000); Senior Advisor of Morgan Stanley (since August 2000). | 99 | Formerly, Director of AXA Financial, Inc. and AXA Equitable Life Insurance Company (2002-2011) and Director of AXA MONY Life Insurance Company and AXA MONY Life Insurance Company of America (2004-2011). | ||||||||||||||||||
* This is the earliest date the Director began serving the Morgan Stanley Funds. Each Director serves an indefinite term, until his or her successor is elected.
** The Fund Complex includes (as of December 31, 2015) all open-end and closed-end funds (including all of their portfolios) advised by Morgan Stanley Investment Management Inc. (the "Adviser") and any funds that have an adviser that is an affiliated person of the Adviser (including, but not limited to, Morgan Stanley AIP GP LP).
*** This includes any directorships at public companies and registered investment companies held by the Director at any time during the past five years.
Executive Officers:
Name, Age and Address of Executive Officer | Position(s) Held with Registrant | Length of Time Served**** | Principal Occupation(s) During Past 5 Years | ||||||||||||
| John H. Gernon (52) 522 Fifth Avenue New York, NY 10036 | President and Principal Executive Officer | Since September 2013 | President and Principal Executive Officer of the Equity and Fixed Income Funds and the Morgan Stanley AIP Funds (since September 2013) and the Liquidity Funds and various money market funds (since May 2014) in the Fund Complex, Managing Director of the Adviser; Head of Product (since 2006). | ||||||||||||
| Stefanie V. Chang Yu (49) 522 Fifth Avenue New York, NY 10036 | Chief Compliance Officer | Since December 1997 | Managing Director of the Adviser and various entities affiliated with the Adviser; Chief Compliance Officer of various Morgan Stanley Funds and the Adviser (since January 2014); formerly, Vice President of various Morgan Stanley Funds (December 1997-January 2014). | ||||||||||||
| Joseph C. Benedetti (50) 522 Fifth Avenue New York, NY 10036 | Vice President | Since January 2014 | Managing Director of the Adviser and various entities affiliated with the Adviser; Vice President of various Morgan Stanley Funds (since January 2014); formerly, Assistant Secretary of various Morgan Stanley Funds (October 2004-January 2014). | ||||||||||||
| Francis J. Smith (50) 522 Fifth Avenue New York, NY 10036 | Treasurer and Principal Financial Officer | Treasurer since July 2003 and Principal Financial Officer since September 2002 | Executive Director of the Adviser and various entities affiliated with the Adviser; Treasurer (since July 2003) and Principal Financial Officer of various Morgan Stanley Funds (since September 2002). | ||||||||||||
| Mary E. Mullin (48) 522 Fifth Avenue New York, NY 10036 | Secretary | Since June 1999 | Executive Director of the Adviser; Secretary of various Morgan Stanley Funds (since June 1999). | ||||||||||||
**** This is the earliest date the officer began serving the Morgan Stanley Funds. Each officer serves a one-year term, until his or her successor is elected and has qualified.
39
Morgan Stanley Institutional Fund, Inc.
Annual Report — December 31, 2015
Adviser and Administrator
Morgan Stanley Investment Management Inc.
522 Fifth Avenue
New York, New York 10036
Distributor
Morgan Stanley Distribution, Inc.
522 Fifth Avenue
New York, New York 10036
Dividend Disbursing and Transfer Agent
Boston Financial Data Services, Inc.
2000 Crown Colony Drive
Quincy, Massachusetts 02169
Custodian
State Street Bank and Trust Company
One Lincoln Street
Boston, Massachusetts 02111
Legal Counsel
Dechert LLP
1095 Avenue of the Americas
New York, New York 10036
Counsel to the Independent Directors
Kramer Levin Naftalis & Frankel LLP
1177 Avenue of the Americas
New York, New York 10036
Independent Registered Public Accounting Firm
Ernst & Young LLP
200 Clarendon Street
Boston, Massachusetts 02116
Reporting to Shareholders
Each Morgan Stanley fund provides a complete schedule of portfolio holdings in its semi-annual and annual reports within 60 days of the end of the fund's second and fourth fiscal quarters. The semi-annual and annual reports are filed electronically with the Securities and Exchange Commission (SEC) on Form N-CSRS and Form N-CSR, respectively. Morgan Stanley also delivers the semi-annual and annual reports to fund shareholders and makes these reports available on its public website, www.morganstanley.com/im. Each Morgan Stanley fund also files a complete schedule of portfolio holdings with the SEC for the fund's first and third fiscal quarters on Form N-Q. Morgan Stanley does not deliver the reports for the first and third fiscal quarters to shareholders, nor are the reports posted to the Morgan Stanley public website. You may, however, obtain the Form N-Q filings (as well as the Form N-CSR and N-CSRS filings) by accessing the SEC's website, www.sec.gov. You may also review and copy them at the SEC's Public Reference Room in Washington, DC. Information on the operation of the SEC's Public Reference Room may be obtained by calling the SEC toll free at 1 (800) SEC-0330. You can also request copies of these materials, upon payment of a duplicating fee, by electronic request at the SEC's email address (publicinfo@sec.gov) or by writing the Public Reference Room of the SEC, Washington, DC 20549-0102.
Proxy Voting Policies and Procedures and Proxy Voting Record
You may obtain a copy of the Fund's Proxy Voting Policy and Procedures and information regarding how the Fund voted proxies relating to portfolio securities during the most recent twelve-month period ended June 30, without charge, upon request, by calling toll free 1 (800) 548-7786 or by visiting our website at www.morganstanley.com/im. This information is also available on the SEC's website at www.sec.gov.
This report is authorized for distribution only when preceded or accompanied by a prospectus of the Morgan Stanley Institutional Fund, Inc., which describes in detail each Portfolio's investment policies, risks, fees and expenses. Please read the prospectus carefully before you invest or send money. For additional information, including information regarding the investments comprising the Portfolio, please visit our website at www.morganstanley.com/im or call toll free 1 (800) 548-7786.
40
Printed in U.S.A.
This Report has been prepared for shareholders and may be distributed to others only if preceded or accompanied by a current prospectus.
Morgan Stanley Investment Management Inc.
522 Fifth Avenue
New York, New York 10036
© 2016 Morgan Stanley. Morgan Stanley Distribution, Inc.

IFIGRWANN
1406544 EXP. 02.28.17
INVESTMENT MANAGEMENT

Morgan Stanley Institutional Fund, Inc.
Emerging Markets Small Cap Portfolio
Annual Report
December 31, 2015

Morgan Stanley Institutional Fund, Inc.
Annual Report — December 31, 2015
Table of Contents
Shareholders' Letter | 2 | ||||||
Expense Example | 3 | ||||||
Investment Overview | 4 | ||||||
Portfolio of Investments | 5 | ||||||
Statement of Assets and Liabilities | 7 | ||||||
Statement of Operations | 8 | ||||||
Statement of Changes in Net Assets | 9 | ||||||
Financial Highlights | 10 | ||||||
Notes to Financial Statements | 14 | ||||||
Report of Independent Registered Public Accounting Firm | 20 | ||||||
Investment Advisory Agreement Approval | 21 | ||||||
U.S. Privacy Policy | 23 | ||||||
Director and Officer Information | 26 | ||||||
This report is authorized for distribution only when preceded or accompanied by prospectuses of the Morgan Stanley Institutional Fund, Inc. To receive a prospectus and/or statement of additional information (SAI), which contains more complete information such as investment objectives, charges, expenses, policies for voting proxies, risk considerations, and describes in detail each of the Portfolio's investment policies to the prospective investor, please call toll free 1 (800) 548-7786. Please read the prospectuses carefully before you invest or send money.
Additionally, you can access portfolio information including performance, characteristics, and investment team commentary through Morgan Stanley Investment Management's website: www.morganstanley.com/im.
Market forecasts provided in this report may not necessarily come to pass. There is no guarantee that any sectors mentioned will continue to perform as discussed herein or that securities in such sectors will be held by the Portfolio in the future. There is no assurance that a Portfolio will achieve its investment objective. Portfolios are subject to market risk, which is the possibility that market values of securities owned by the Portfolio will decline and, therefore, the value of the Portfolio's shares may be less than what you paid for them. Accordingly, you can lose money investing in this Portfolio. Please see the prospectus for more complete information on investment risks.
1
Morgan Stanley Institutional Fund, Inc.
Annual Report — December 31, 2015
Shareholders' Letter (unaudited)
Dear Shareholders,
We are pleased to provide this Annual report, in which you will learn how your investment in Emerging Markets Small Cap Portfolio (the "Portfolio") performed during the period ended December 31, 2015.
Morgan Stanley Investment Management is a client-centric, investor-led organization. Our global presence, intellectual capital, and breadth of products and services enable us to partner with investors to meet the evolving challenges of today's financial markets. We aim to deliver superior investment service and to empower our clients to make the informed decisions that help them reach their investment goals.
As always, we thank you for selecting Morgan Stanley Investment Management, and look forward to working with you in the months and years ahead.
Sincerely,

John H. Gernon
President and Principal Executive Officer
January 2016
2
Morgan Stanley Institutional Fund, Inc.
Annual Report — December 31, 2015
Expense Example (unaudited)
Emerging Markets Small Cap Portfolio
As a shareholder of the Portfolio, you incur two types of costs: (1) transactional costs; including redemption fees and (2) ongoing costs, including advisory fees, administration fees, distribution and shareholder services fees and other Portfolio expenses. This example is intended to help you understand your ongoing costs (in dollars) of investing in the Portfolio and to compare these costs with the ongoing costs of investing in other mutual funds.
This example is based on an investment of $1,000 invested at the beginning of the period and held for the entire period 12/15/15 – 12/31/15 (unless otherwise noted).
Actual Expenses
The table below provides information about actual account values and actual expenses. You may use the information in this table, together with the amount you invested, to estimate the expenses that you paid over the period. Simply divide your account value by $1,000 (for example, an $8,600 account value divided by $1,000 = 8.6), then multiply the result by the number in the table under the heading entitled "Actual Expenses Paid During Period" to estimate the expenses you paid on your account during this period.
Hypothetical Example for Comparison Purposes
The table below provides information about hypothetical account values and hypothetical expenses based on the Portfolio's actual expense ratio and an assumed rate of return of 5% per year before expenses, which is not the Portfolio's actual return. The hypothetical account values and expenses may not be used to estimate the actual ending account balance or expenses you paid for the period. You may use this information to compare the ongoing costs of investing in the Portfolio and other funds. To do so, compare this 5% hypothetical example with the 5% hypothetical examples that appear in the shareholder reports of the other funds.
Please note that the expenses shown in the table are meant to highlight your ongoing costs only and do not reflect any transactional costs, such as sales charges (loads) and redemption fees. Therefore, the information for each class in the table is useful in comparing ongoing costs only, and will not help you determine the relative total costs of owning different funds. In addition, if these transactional costs were included, your costs would have been higher.
| Beginning Account Value 12/15/15 | Actual Ending Account Value 12/31/15 | Hypothetical Ending Account Value | Actual Expenses Paid During Period* | Hypothetical Expenses Paid During Period* | Net Expense Ratio During Period** | ||||||||||||||||||||||
Emerging Markets Small Cap Portfolio Class I^ | $ | 1,000.00 | $ | 1,028.00 | $ | 1,001.50 | $ | 0.70 | $ | 0.69 | 1.58 | % | |||||||||||||||
Emerging Markets Small Cap Portfolio Class A^ | 1,000.00 | 1,028.00 | 1,001.33 | 0.88 | 0.86 | 1.97 | |||||||||||||||||||||
Emerging Markets Small Cap Portfolio Class C^ | 1,000.00 | 1,028.00 | 1,001.00 | 1.21 | 1.20 | 2.73 | |||||||||||||||||||||
Emerging Markets Small Cap Portfolio Class IS^ | 1,000.00 | 1,028.00 | 1,001.50 | 0.70 | 0.69 | 1.58 | |||||||||||||||||||||
* Expenses are calculated using each Portfolio Class' annualized net expense ratio (as disclosed), multiplied by the average account value over the period, and multiplied by 16/365 (to reflect the actual days in the period).
** Annualized.
^ Class I, A, C and IS commenced operations on 12/15/15.
3
Morgan Stanley Institutional Fund, Inc.
Annual Report — December 31, 2015
Investment Overview (unaudited)
Emerging Markets Small Cap Portfolio
The Portfolio seeks long-term capital appreciation.
Performance
For the period from inception on December 15, 2015 through December 31, 2015, the Portfolio's Class I shares had a total return of 2.80%, net of fees. The Portfolio's benchmark, the MSCI Emerging Markets Small Cap Net Index (the "Index"), returned 4.55% for the same period.
Factors Affecting Performance
• The Portfolio launched a few days prior to the close of the reporting period. Such a short time frame would not provide a meaningful performance analysis as short-term returns may not be indicative of the Portfolio's long-term performance potential.
Management Strategies
• Several factors are likely to contribute to continued market volatility for some time in 2016: comprehension of China's true economic growth trajectory, reaction to potential additional devaluation of China's currency, and further adjustment to the consequences of the U.S. Federal Reserve's rate increase path. But we think emerging market equities are heading toward an eventual important turning point, even if precise timing is difficult to determine. Presently, emerging market valuations in aggregate appear attractive. But as a catalyst, we think what will drive emerging market equities at some point, perhaps later this year, is when the market focuses on economic growth inflections shifting in favor of emerging markets relative to developed markets. Historically, the best time to buy emerging markets, as an asset class, has been when their gross domestic product growth rates were increasing by more than those in developed countries. We believe strongly that there will be big differences among countries for both growth rates and equity performance. Country allocation will be critical to generating excess returns in this environment.
Performance Compared to the MSCI Emerging Markets Small Cap Net Index(1) and the Lipper Emerging Markets Funds Index(2)
| Period Ended December 31, 2015 Total Returns(3) | |||||||||||||||||||
| One Year | Five Years | Ten Years | Since Inception(5) | ||||||||||||||||
| Portfolio — Class I Shares w/o sales charges(4) | — | — | — | 2.80 | % | ||||||||||||||
| Portfolio — Class A Shares w/o sales charges(4) | — | — | — | 2.80 | |||||||||||||||
| Portfolio — Class A Shares with maximum 5.25% sales charges(4) | — | — | — | –2.56 | |||||||||||||||
| Portfolio — Class C Shares w/o sales charges(4) | — | — | — | 2.80 | |||||||||||||||
| Portfolio — Class C Shares with maximum 1.00% deferred sales charges(4) | — | — | — | 1.80 | |||||||||||||||
| Portfolio — Class IS Shares w/o sales charges(4) | — | — | — | 2.80 | |||||||||||||||
| MSCI Emerging Markets Small Cap Net Index | — | — | — | 4.55 | |||||||||||||||
Lipper Emerging Markets Funds Index | — | — | — | 1.16 | |||||||||||||||
Performance data quoted represents past performance, which is no guarantee of future results, and current performance may be lower or higher than the figures shown. Performance assumes that all dividends and distributions, if any, were reinvested. For the most recent month-end performance figures, please visit www.morganstanley.com/im. Investment return and principal value will fluctuate so that Portfolio shares, when redeemed, may be worth more or less than their original cost. Total returns do not reflect the deduction of taxes that a shareholder would pay on Portfolio distributions or the redemption of Portfolio shares. Returns for periods less than one year are not annualized. Performance of share classes will vary due to difference in expenses.
(1) The MSCI Emerging Markets Small Cap Net Index is a free float-adjusted market capitalization weighted index that is designed to measure small cap equity market performance of emerging markets. The term "free float" represents the portion of shares outstanding that are deemed to be available for purchase in the public equity markets by investors. The performance of the Index is listed in U.S. dollars and assumes reinvestment of net dividends. The Index is unmanaged and its returns do not include any sales charges or fees. Such costs would lower performance. It is not possible to invest directly in an index.
(2) The Lipper Emerging Markets Funds Index is an equally weighted performance index of the largest qualifying funds (based on net assets) in the Lipper Emerging Markets Funds classification. The Index, which is adjusted for capital gains distributions and income dividends, is unmanaged and should not be considered an investment. There are currently 30 funds represented in this Index. As of the date of this report, the Portfolio is in the Lipper Emerging Markets Funds classification.
(3) Total returns for the Portfolio reflect fees waived and expenses reimbursed, if applicable, by the Adviser. Without such waivers and reimbursements, total returns would have been lower.
(4) Commenced operations on December 15, 2015.
(5) For comparative purposes, average annual since inception returns listed for the Indexes refer to the inception date of the Portfolio, not the inception of the Index.
4
Morgan Stanley Institutional Fund, Inc.
Annual Report — December 31, 2015
Portfolio of Investments
Emerging Markets Small Cap Portfolio
Shares | Value (000) | ||||||||||
Common Stocks (80.7%) | |||||||||||
Argentina (3.0%) | |||||||||||
Banco Macro SA ADR (a) | 5,490 | $ | 319 | ||||||||
BBVA Banco Frances SA ADR (a) | 15,536 | 297 | |||||||||
616 | |||||||||||
Bangladesh (1.5%) | |||||||||||
Brac Bank Ltd. | 167,528 | 104 | |||||||||
Olympic Industries Ltd. | 63,768 | 210 | |||||||||
314 | |||||||||||
Brazil (2.4%) | |||||||||||
Raia Drogasil SA | 32,741 | 293 | |||||||||
Ser Educacional SA (b) | 102,002 | 197 | |||||||||
490 | |||||||||||
China (18.5%) | |||||||||||
Bitauto Holdings Ltd. ADR (a) | 12,800 | 362 | |||||||||
| Canvest Environmental Protection Group Co., Ltd. H shares (a) | 1,023,000 | 444 | |||||||||
CT Environmental Group Ltd. (c) | 1,282,000 | 419 | |||||||||
| Dawnrays Pharmaceutical Holdings Ltd. H shares | 388,000 | 300 | |||||||||
Fu Shou Yuan International Group Ltd. (c) | 595,000 | 461 | |||||||||
Ourgame International Holdings Ltd. (c) | 457,000 | 339 | |||||||||
TAL Education Group ADR (a) | 8,700 | 404 | |||||||||
Wisdom Sports Group (c) | 842,000 | 563 | |||||||||
Yestar International Holdings Co., Ltd. (c) | 1,195,000 | 524 | |||||||||
3,816 | |||||||||||
Egypt (3.0%) | |||||||||||
Credit Agricole Egypt SAE | 79,501 | 212 | |||||||||
Edita Food Industries SAE GDR (a) | 11,111 | 206 | |||||||||
Integrated Diagnostics Holdings PLC (a)(b) | 40,527 | 200 | |||||||||
618 | |||||||||||
Indonesia (2.2%) | |||||||||||
Jasa Marga Persero Tbk PT | 54,300 | 20 | |||||||||
Matahari Department Store Tbk PT | 341,300 | 431 | |||||||||
451 | |||||||||||
Kenya (1.4%) | |||||||||||
East African Breweries Ltd. | 111,000 | 296 | |||||||||
Korea, Republic of (10.5%) | |||||||||||
Boryung Pharmaceutical Co., Ltd. (a) | 7,487 | 358 | |||||||||
Cosmax, Inc. (a) | 2,066 | 321 | |||||||||
Daewon Pharmaceutical Co., Ltd. (a) | 23,537 | 351 | |||||||||
Fila Korea Ltd. (a) | 2,534 | 203 | |||||||||
Hansae Co., Ltd. (a) | 4,557 | 202 | |||||||||
| Hyundai Development Co-Engineering & Construction (a) | 6,178 | 202 | |||||||||
LIG Nex1 Co., Ltd. (a) | 3,565 | 311 | |||||||||
Nasmedia Co., Ltd. (a) | 5,041 | 214 | |||||||||
2,162 | |||||||||||
Shares | Value (000) | ||||||||||
Mexico (5.2%) | |||||||||||
Banregio Grupo Financiero SAB de CV | 81,882 | $ | 418 | ||||||||
Credito Real SAB de CV SOFOM ER (a) | 93,323 | 237 | |||||||||
| Grupo Aeroportuario del Centro Norte SAB de CV (a) | 44,284 | 216 | |||||||||
Grupo Herdez SAB de CV | 77,423 | 197 | |||||||||
1,068 | |||||||||||
Pakistan (2.9%) | |||||||||||
Lucky Cement Ltd. GDR | 15,737 | 291 | |||||||||
MCB Bank Ltd. GDR (a) | 85,714 | 300 | |||||||||
591 | |||||||||||
Philippines (3.5%) | |||||||||||
Puregold Price Club, Inc. | 425,200 | 313 | |||||||||
Rizal Commercial Banking Corp. | 580,800 | 406 | |||||||||
719 | |||||||||||
Poland (3.0%) | |||||||||||
CCC SA | 5,843 | 206 | |||||||||
KRUK SA | 4,578 | 203 | |||||||||
LPP SA | 148 | 209 | |||||||||
618 | |||||||||||
Romania (3.0%) | |||||||||||
Banca Transilvania (a) | 518,496 | 302 | |||||||||
BRD-Groupe Societe Generale SA (a) | 105,652 | 307 | |||||||||
609 | |||||||||||
South Africa (5.2%) | |||||||||||
AVI Ltd. | 65,014 | 325 | |||||||||
Famous Brands Ltd. | 34,338 | 288 | |||||||||
Life Healthcare Group Holdings Ltd. | 200,815 | 454 | |||||||||
1,067 | |||||||||||
Taiwan (8.3%) | |||||||||||
Chailease Holding Co., Ltd. | 187,000 | 321 | |||||||||
Eclat Textile Co., Ltd. | 32,000 | 441 | |||||||||
Ginko International Co., Ltd. | 24,000 | 317 | |||||||||
Grape King Bio Ltd. | 36,000 | 200 | |||||||||
Hermes Microvision, Inc. | 12,000 | 434 | |||||||||
1,713 | |||||||||||
Thailand (5.0%) | |||||||||||
Carabao Group PCL NVDR | 212,600 | 203 | |||||||||
Mega Lifesciences PCL NVDR | 657,100 | 301 | |||||||||
Minor International PCL (Foreign) | 301,200 | 301 | |||||||||
Robinson Department Store PCL NVDR | 177,400 | 212 | |||||||||
1,017 | |||||||||||
Turkey (2.1%) | |||||||||||
Tat Gida Sanayi AS (a) | 115,822 | 220 | |||||||||
Tofas Turk Otomobil Fabrikasi AS | 32,149 | 209 | |||||||||
429 | |||||||||||
Total Common Stocks (Cost $16,072) | 16,594 | ||||||||||
The accompanying notes are an integral part of the financial statements.
5
Morgan Stanley Institutional Fund, Inc.
Annual Report — December 31, 2015
Portfolio of Investments (cont'd)
Emerging Markets Small Cap Portfolio
Shares | Value (000) | ||||||||||
Participation Notes (11.8%) | |||||||||||
India (9.1%) | |||||||||||
| Credit Analysis & Research Ltd., Equity Linked Notes, expires 4/18/19 (a) | 15,805 | $ | 315 | ||||||||
| LIC Housing Finance Ltd., Equity Linked Notes, expires 12/29/17 (a) | 41,150 | 315 | |||||||||
| Natco Pharma Ltd., Equity Linked Notes, expires 12/29/17 (a) | 36,163 | 316 | |||||||||
| Redington India Ltd., Equity Linked Notes, expires 12/29/17 (a) | 173,188 | 300 | |||||||||
| SKS Microfinance Ltd., Equity Linked Notes, expires 11/5/18 (a) | 55,133 | 416 | |||||||||
| Voltas Ltd., Equity Linked Notes, expires 11/21/19 (a) | 43,746 | 214 | |||||||||
1,876 | |||||||||||
Vietnam (2.7%) | |||||||||||
| Bank for Foreign Trade of Vietnam JSC, Equity Linked Notes, expires 12/17/18 (a) | 162,590 | 317 | |||||||||
| Masan Group Corp., Equity Linked Notes, expires 12/10/18 (a) | 64,880 | 223 | |||||||||
540 | |||||||||||
Total Participation Notes (Cost $2,385) | 2,416 | ||||||||||
Investment Companies (4.9%) | |||||||||||
United States (4.9%) | |||||||||||
iShares MSCI Emerging Markets Small-Cap ETF | 12,313 | 504 | |||||||||
iShares MSCI India Small-Cap ETF | 15,341 | 511 | |||||||||
Total Investment Companies (Cost $993) | 1,015 | ||||||||||
Short-Term Investment (4.1%) | |||||||||||
Investment Company (4.1%) | |||||||||||
| Morgan Stanley Institutional Liquidity Funds — Money Market Portfolio — Institutional Class (See Note G) (Cost $841) | 841,411 | 841 | |||||||||
Total Investments (101.5%) (Cost $20,291) (d)(e) | 20,866 | ||||||||||
Liabilities in Excess of Other Assets (–1.5%) | (300 | ) | |||||||||
Net Assets (100.0%) | $ | 20,566 | |||||||||
(a) Non-income producing security.
(b) 144A security — Certain conditions for public sale may exist. Unless otherwise noted, these securities are deemed to be liquid.
(c) Security trades on the Hong Kong exchange.
(d) The approximate fair value and percentage of net assets, $13,553,000 and 65.9%, respectively, represent the securities that have been fair valued under the fair valuation policy for international investments as described in Note A-1 within the Notes to the Financial Statements.
(e) At December 31, 2015, the aggregate cost for Federal income tax purposes is approximately $20,291,000. The aggregate gross unrealized appreciation is approximately $729,000 and the aggregate gross unrealized depreciation is approximately $154,000 resulting in net unrealized appreciation of approximately $575,000.
ADR American Depositary Receipt.
ETF Exchange Traded Fund.
GDR Global Depositary Receipt.
NVDR Non-Voting Depositary Receipt.
Portfolio Composition
Classification | Percentage of Total Investments | ||||||
Other* | 61.7 | % | |||||
Banks | 14.3 | ||||||
Food Products | 6.6 | ||||||
Pharmaceuticals | 6.3 | ||||||
Textiles, Apparel & Luxury Goods | 6.0 | ||||||
Diversified Consumer Services | 5.1 | ||||||
Total Investments | 100.0 | % | |||||
* Industries and/or investment types representing less than 5% of total investments.
The accompanying notes are an integral part of the financial statements.
6
Morgan Stanley Institutional Fund, Inc.
Annual Report — December 31, 2015
Emerging Markets Small Cap Portfolio
Statement of Assets and Liabilities | December 31, 2015 (000) | ||||||
Assets: | |||||||
Investments in Securities of Unaffiliated Issuers, at Value (Cost $19,450) | $ | 20,025 | |||||
Investment in Security of Affiliated Issuer, at Value (Cost $841) | 841 | ||||||
Total Investments in Securities, at Value (Cost $20,291) | 20,866 | ||||||
Receivable for Investments Sold | 940 | ||||||
Prepaid Offering Costs | 144 | ||||||
Due from Adviser | 43 | ||||||
Receivable from Affiliate | 1 | ||||||
Other Assets | — | @ | |||||
Total Assets | 21,994 | ||||||
Liabilities: | |||||||
Payable for Investments Purchased | 1,227 | ||||||
Payable for Offering Costs | 151 | ||||||
Payable for Professional Fees | 37 | ||||||
Payable for Custodian Fees | 7 | ||||||
Payable for Administration Fees | 1 | ||||||
Payable for Transfer Agency Fees — Class I | — | @ | |||||
Payable for Transfer Agency Fees — Class A | — | @ | |||||
Payable for Transfer Agency Fees — Class C | — | @ | |||||
Payable for Shareholder Services Fees — Class A | — | @ | |||||
Payable for Distribution and Shareholder Services Fees — Class C | — | @ | |||||
Other Liabilities | 5 | ||||||
Total Liabilities | 1,428 | ||||||
Net Assets | $ | 20,566 | |||||
Net Assets Consist Of: | |||||||
Paid-in-Capital | $ | 19,998 | |||||
Accumulated Net Investment Loss | (7 | ) | |||||
Unrealized Appreciation (Depreciation) on: | |||||||
Investments | 575 | ||||||
Foreign Currency Translations | — | @ | |||||
Net Assets | $ | 20,566 | |||||
CLASS I: | |||||||
Net Assets | $ | 20,536 | |||||
| Shares Outstanding $0.001 par value shares of beneficial interest (unlimited shares authorized) (not in 000's) | 1,997,000 | ||||||
Net Asset Value, Offering and Redemption Price Per Share | $ | 10.28 | |||||
CLASS A: | |||||||
Net Assets | $ | 10 | |||||
| Shares Outstanding $0.001 par value shares of beneficial interest (unlimited shares authorized) (not in 000's) | 1,000 | ||||||
Net Asset Value, Redemption Price Per Share | $ | 10.28 | |||||
Maximum Sales Load | 5.25 | % | |||||
Maximum Sales Charge | $ | 0.57 | |||||
Maximum Offering Price Per Share | $ | 10.85 | |||||
CLASS C: | |||||||
Net Assets | $ | 10 | |||||
| Shares Outstanding $0.001 par value shares of beneficial interest (unlimited shares authorized) (not in 000's) | 1,000 | ||||||
Net Asset Value, Offering and Redemption Price Per Share | $ | 10.28 | |||||
CLASS IS: | |||||||
Net Assets | $ | 10 | |||||
| Shares Outstanding $0.001 par value shares of beneficial interest (unlimited shares authorized) (not in 000's) | 1,000 | ||||||
Net Asset Value, Offering and Redemption Price Per Share˛ | $ | 10.28 | |||||
@ Amount is less than $500.
The accompanying notes are an integral part of the financial statements.
7
Morgan Stanley Institutional Fund, Inc.
Annual Report — December 31, 2015
Emerging Markets Small Cap Portfolio
Statement of Operations | Period from December 15, 2015^ to December 31, 2015 (000) | ||||||
Investment Income: | |||||||
Dividends from Securities of Unaffiliated Issuers | $ | 22 | |||||
Dividends from Security of Affiliated Issuer (Note G) | 1 | ||||||
Total Investment Income | 23 | ||||||
Expenses: | |||||||
Professional Fees | 37 | ||||||
Advisory Fees (Note B) | 11 | ||||||
Custodian Fees (Note F) | 7 | ||||||
Offering Costs | 7 | ||||||
Shareholder Reporting Fees | 4 | ||||||
Administration Fees (Note C) | 1 | ||||||
Transfer Agency Fees — Class I (Note E) | — | @ | |||||
Transfer Agency Fees — Class A (Note E) | — | @ | |||||
Transfer Agency Fees — Class C (Note E) | — | @ | |||||
Transfer Agency Fees — Class IS (Note E) | — | @ | |||||
Shareholder Services Fees — Class A (Note D) | — | @ | |||||
Distribution and Shareholder Services Fees — Class C (Note D) | — | @ | |||||
Pricing Fees | — | @ | |||||
Registration Fees | — | @ | |||||
Other Expenses | 1 | ||||||
Total Expenses | 68 | ||||||
Expenses Reimbursed by Adviser (Note B) | (43 | ) | |||||
Waiver of Advisory Fees (Note B) | (11 | ) | |||||
Reimbursement of Class Specific Expenses — Class A (Note B) | (— | @) | |||||
Reimbursement of Class Specific Expenses — Class C (Note B) | (— | @) | |||||
Reimbursement of Class Specific Expenses — Class IS (Note B) | (— | @) | |||||
Rebate from Morgan Stanley Affiliate (Note G) | (— | @) | |||||
Net Expenses | 14 | ||||||
Net Investment Income | 9 | ||||||
Realized Gain (Loss): | |||||||
Investments Sold | 15 | ||||||
Foreign Currency Transactions | (33 | ) | |||||
Net Realized Loss | (18 | ) | |||||
Change in Unrealized Appreciation (Depreciation): | |||||||
Investments | 575 | ||||||
Foreign Currency Translations | — | @ | |||||
Net Change in Unrealized Appreciation (Depreciation) | 575 | ||||||
Net Realized Loss and Change in Unrealized Appreciation (Depreciation) | 557 | ||||||
Net Increase in Net Assets Resulting from Operations | $ | 566 | |||||
^ Commencement of Operations.
@ Amount is less than $500.
The accompanying notes are an integral part of the financial statements.
8
Morgan Stanley Institutional Fund, Inc.
Annual Report — December 31, 2015
Emerging Markets Small Cap Portfolio
Statement of Changes in Net Assets | Period from December 15, 2015^ to December 31, 2015 (000) | ||||||
Increase (Decrease) in Net Assets: | |||||||
Operations: | |||||||
Net Investment Income | $ | 9 | |||||
Net Realized Loss | (18 | ) | |||||
Net Change in Unrealized Appreciation (Depreciation) | 575 | ||||||
Net Increase in Net Assets Resulting from Operations | 566 | ||||||
Capital Share Transactions:(1) | |||||||
Class I: | |||||||
Subscribed | 19,970 | ||||||
Class A: | |||||||
Subscribed | 10 | ||||||
Class C: | |||||||
Subscribed | 10 | ||||||
Class IS: | |||||||
Subscribed | 10 | ||||||
Net Increase in Net Assets Resulting from Capital Share Transactions | 20,000 | ||||||
Total Increase in Net Assets | 20,566 | ||||||
Net Assets: | |||||||
Beginning of Period | — | ||||||
End of Period (Including Accumulated Net Investment Loss of $(7)) | $ | 20,566 | |||||
(1) Capital Share Transactions: | |||||||
Class I: | |||||||
Shares Subscribed | 1,997 | ||||||
Class A: | |||||||
Shares Subscribed | 1 | ||||||
Class C: | |||||||
Shares Subscribed | 1 | ||||||
Class IS: | |||||||
Shares Subscribed | 1 | ||||||
^ Commencement of Operations.
The accompanying notes are an integral part of the financial statements.
9
Morgan Stanley Institutional Fund, Inc.
Annual Report — December 31, 2015
Financial Highlights
Emerging Markets Small Cap Portfolio
Class I | |||||||
Selected Per Share Data and Ratios | Period from December 15, 2015^ to December 31, 2015 | ||||||
Net Asset Value, Beginning of Period | $ | 10.00 | |||||
Income from Investment Operations: | |||||||
Net Investment Income† | 0.01 | ||||||
Net Realized and Unrealized Gain | 0.27 | ||||||
Total from Investment Operations | 0.28 | ||||||
Net Asset Value, End of Period | $ | 10.28 | |||||
Total Return++ | 2.80 | %# | |||||
Ratios and Supplemental Data: | |||||||
Net Assets, End of Period (Thousands) | $ | 20,536 | |||||
Ratio of Expenses to Average Net Assets (1) | 1.58 | %+* | |||||
Ratio of Net Investment Income to Average Net Assets (1) | 1.01 | %+* | |||||
Ratio of Rebate from Morgan Stanley Affiliates to Average Net Assets | 0.03 | %* | |||||
Portfolio Turnover Rate | 5 | % | |||||
(1) Supplemental Information on the Ratios to Average Net Assets: | |||||||
Ratios Before Expense Limitation: | |||||||
Expenses to Average Net Assets | 7.62 | %* | |||||
Net Investment Loss to Average Net Assets | (5.03 | )%* | |||||
^ Commencement of Operations.
† Per share amount is based on average shares outstanding.
++ Calculated based on the net asset value as of the last business day of the period.
+ The Ratios of Expenses and Net Investment Income reflect the rebate of certain Portfolio expenses in connection with the investments in Morgan Stanley affiliates during the period. The effect of the rebate on the ratios is disclosed in the above table as "Ratio of Rebate from Morgan Stanley Affiliates to Average Net Assets."
# Not Annualized.
* Annualized.
The accompanying notes are an integral part of the financial statements.
10
Morgan Stanley Institutional Fund, Inc.
Annual Report — December 31, 2015
Financial Highlights
Emerging Markets Small Cap Portfolio
Class A | |||||||
Selected Per Share Data and Ratios | Period from December 15, 2015^ to December 31, 2015 | ||||||
Net Asset Value, Beginning of Period | $ | 10.00 | |||||
Income from Investment Operations: | |||||||
Net Investment Income† | 0.00 | ‡ | |||||
Net Realized and Unrealized Gain | 0.28 | ||||||
Total from Investment Operations | 0.28 | ||||||
Net Asset Value, End of Period | $ | 10.28 | |||||
Total Return++ | 2.80 | %# | |||||
Ratios and Supplemental Data: | |||||||
Net Assets, End of Period (Thousands) | $ | 10 | |||||
Ratio of Expenses to Average Net Assets (1) | 1.97 | %+* | |||||
Ratio of Net Investment Income to Average Net Assets (1) | 0.62 | %+* | |||||
Ratio of Rebate from Morgan Stanley Affiliates to Average Net Assets | 0.03 | %* | |||||
Portfolio Turnover Rate | 5 | % | |||||
(1) Supplemental Information on the Ratios to Average Net Assets: | |||||||
Ratios Before Expense Limitation: | |||||||
Expenses to Average Net Assets | 21.45 | %* | |||||
Net Investment Loss to Average Net Assets | (18.86 | )%* | |||||
^ Commencement of Operations.
† Per share amount is based on average shares outstanding.
‡ Amount is less than $0.005 per share.
++ Calculated based on the net asset value which does not reflect sales charges, if applicable, as of the last business day of the period.
+ The Ratios of Expenses and Net Investment Income reflect the rebate of certain Portfolio expenses in connection with the investments in Morgan Stanley affiliates during the period. The effect of the rebate on the ratios is disclosed in the above table as "Ratio of Rebate from Morgan Stanley Affiliates to Average Net Assets."
# Not Annualized.
* Annualized.
The accompanying notes are an integral part of the financial statements.
11
Morgan Stanley Institutional Fund, Inc.
Annual Report — December 31, 2015
Financial Highlights
Emerging Markets Small Cap Portfolio
Class C | |||||||
Selected Per Share Data and Ratios | Period from December 15, 2015^ to December 31, 2015 | ||||||
Net Asset Value, Beginning of Period | $ | 10.00 | |||||
Income from Investment Operations: | |||||||
Net Investment Loss† | (0.00 | )‡ | |||||
Net Realized and Unrealized Gain | 0.28 | ||||||
Total from Investment Operations | 0.28 | ||||||
Net Asset Value, End of Period | $ | 10.28 | |||||
Total Return++ | 2.80 | %# | |||||
Ratios and Supplemental Data: | |||||||
Net Assets, End of Period (Thousands) | $ | 10 | |||||
Ratio of Expenses to Average Net Assets (1) | 2.73 | %+* | |||||
Ratio of Net Investment Loss to Average Net Assets (1) | (0.14 | )%+* | |||||
Ratio of Rebate from Morgan Stanley Affiliates to Average Net Assets | 0.02 | %* | |||||
Portfolio Turnover Rate | 5 | % | |||||
(1) Supplemental Information on the Ratios to Average Net Assets: | |||||||
Ratios Before Expense Limitation: | |||||||
Expenses to Average Net Assets | 22.20 | %* | |||||
Net Investment Loss to Average Net Assets | (19.61 | )%* | |||||
^ Commencement of Operations.
† Per share amount is based on average shares outstanding.
‡ Amount is less than $0.005 per share.
++ Calculated based on the net asset value which does not reflect sales charges, if applicable, as of the last business day of the period.
+ The Ratios of Expenses and Net Investment Loss reflect the rebate of certain Portfolio expenses in connection with the investments in Morgan Stanley affiliates during the period. The effect of the rebate on the ratios is disclosed in the above table as "Ratio of Rebate from Morgan Stanley Affiliates to Average Net Assets."
# Not Annualized.
* Annualized.
The accompanying notes are an integral part of the financial statements.
12
Morgan Stanley Institutional Fund, Inc.
Annual Report — December 31, 2015
Financial Highlights
Emerging Markets Small Cap Portfolio
Class IS | |||||||
Selected Per Share Data and Ratios | Period from December 15, 2015^ to December 31, 2015 | ||||||
Net Asset Value, Beginning of Period | $ | 10.00 | |||||
Income from Investment Operations: | |||||||
Net Investment Income† | 0.01 | ||||||
Net Realized and Unrealized Gain | 0.27 | ||||||
Total from Investment Operations | 0.28 | ||||||
Net Asset Value, End of Period | $ | 10.28 | |||||
Total Return++ | 2.80 | %# | |||||
Ratios and Supplemental Data: | |||||||
Net Assets, End of Period (Thousands) | $ | 10 | |||||
Ratio of Expenses to Average Net Assets (1) | 1.58 | %+* | |||||
Ratio of Net Investment Income to Average Net Assets (1) | 1.01 | %+* | |||||
Ratio of Rebate from Morgan Stanley Affiliates to Average Net Assets | 0.02 | %* | |||||
Portfolio Turnover Rate | 5 | % | |||||
(1) Supplemental Information on the Ratios to Average Net Assets: | |||||||
Ratios Before Expense Limitation: | |||||||
Expenses to Average Net Assets | 21.20 | %* | |||||
Net Investment Loss to Average Net Assets | (18.61 | )%* | |||||
^ Commencement of Operations.
† Per share amount is based on average shares outstanding.
++ Calculated based on the net asset value as of the last business day of the period.
+ The Ratios of Expenses and Net Investment Income reflect the rebate of certain Portfolio expenses in connection with the investments in Morgan Stanley affiliates during the period. The effect of the rebate on the ratios is disclosed in the above table as "Ratio of Rebate from Morgan Stanley Affiliates to Average Net Assets."
# Not Annualized.
* Annualized.
The accompanying notes are an integral part of the financial statements.
13
Morgan Stanley Institutional Fund, Inc.
Annual Report — December 31, 2015
Notes to Financial Statements
Morgan Stanley Institutional Fund, Inc. (the "Fund") is registered under the Investment Company Act of 1940, as amended (the "Act"), as an open-end management investment company. The Fund is comprised of twenty-six separate, active, diversified and non-diversified portfolios (individually referred to as a "Portfolio", collectively as the "Portfolios"). The Fund applies investment company accounting and reporting guidance.
The accompanying financial statements relate to the Emerging Markets Small Cap Portfolio. The Portfolio seeks long-term capital appreciation.
The Portfolio commenced operations on December 15, 2015 and offers four classes of shares — Class I, Class A, Class C and Class IS.
A. Significant Accounting Policies: The following significant accounting policies are in conformity with U.S. generally accepted accounting principles ("GAAP"). Such policies are consistently followed by the Fund in the preparation of its financial statements. GAAP may require management to make estimates and assumptions that affect the reported amounts and disclosures in the financial statements. Actual results may differ from those estimates.
1. Security Valuation: (1) An equity portfolio security listed or traded on an exchange is valued at its latest reported sales price (or at the exchange official closing price if such exchange reports an official closing price), if there were no sales on a given day, the security is valued at the mean between the last reported bid and asked prices; (2) all other equity portfolio securities for which over-the-counter ("OTC") market quotations are readily available are valued at its latest reported sales price. In cases where a security is traded on more than one exchange, the security is valued on the exchange designated as the primary market; (3) certain portfolio securities may be valued by an outside pricing service approved by the Fund's Board of Directors (the "Directors"). The pricing service may utilize a matrix system or other model incorporating attributes such as security quality, maturity and coupon as the evaluation model parameters, and/or research evaluations by its staff, including review of broker-dealer market price quotations in determining what it believes is the fair valuation of the portfolios securities valued by such pricing service; (4) when market quotations are not readily available, including circumstances under which Morgan Stanley Investment Management Inc. (the "Adviser") determines that the closing price, last sale price or the mean between
the last reported bid and asked prices are not reflective of a security's market value, portfolio securities are valued at their fair value as determined in good faith under procedures established by and under the general supervision of the Directors. Occasionally, developments affecting the closing prices of securities and other assets may occur between the times at which valuations of such securities are determined (that is, close of the foreign market on which the securities trade) and the close of business of the New York Stock Exchange ("NYSE"). If developments occur during such periods that are expected to materially affect the value of such securities, such valuations may be adjusted to reflect the estimated fair value of such securities as of the close of the NYSE, as determined in good faith by the Directors or by the Adviser using a pricing service and/or procedures approved by the Directors; (5) quotations of foreign portfolio securities, other assets and liabilities and forward contracts stated in foreign currency are translated into U.S. dollar equivalents at the prevailing market rates prior to the close of the NYSE; (6) investments in mutual funds, including the Morgan Stanley Institutional Liquidity Funds, are valued at the net asset value ("NAV") as of the close of each business day; and (7) short-term debt securities with remaining maturities of 60 days or less at the time of purchase may be valued at amortized cost, unless the Adviser determines such valuation does not reflect the securities' market value, in which case these securities will be valued at their fair market value determined by the Adviser.
The Directors have responsibility for determining in good faith the fair value of the investments, and the Directors may appoint others, such as the Fund's Adviser or a valuation committee, to assist the Directors in determining fair value and to make the actual calculations pursuant to the fair valuation methodologies previously approved by the Directors. Under procedures approved by the Directors, the Fund's Adviser has formed a Valuation Committee whose members are approved by the Directors. The Valuation Committee provides administration and oversight of the Fund's valuation policies and procedures, which are reviewed at least annually by the Directors. These procedures allow the Fund to utilize independent pricing services, quotations from securities and financial instrument dealers, and other market sources to determine fair value.
14
Morgan Stanley Institutional Fund, Inc.
Annual Report — December 31, 2015
Notes to Financial Statements (cont'd)
The Fund has procedures to determine the fair value of securities and other financial instruments for which market prices are not readily available. Under these procedures, the Valuation Committee convenes on a regular and ad hoc basis to review such securities and considers a number of factors, including valuation methodologies and significant unobservable valuation inputs, when arriving at fair value. The Valuation Committee may employ a market-based approach which may use related or comparable assets or liabilities, recent transactions, market multiples, book values, and other relevant information for the investment to determine the fair value of the investment. An income-based valuation approach may also be used in which the anticipated future cash flows of the investment are discounted to calculate fair value. Discounts may also be applied due to the nature or duration of any restrictions on the disposition of the investments. Due to the inherent uncertainty of valuations of such investments, the fair values may differ significantly from the values that would have been used had an active market existed. The Valuation Committee employs various methods for calibrating these valuation approaches including a regular review of valuation methodologies, key inputs and assumptions, transactional back-testing or disposition analysis, and reviews of any related market activity.
2. Fair Value Measurement: Financial Accounting Standards Board ("FASB") Accounting Standards CodificationTM ("ASC") 820, "Fair Value Measurement" ("ASC 820"), defines fair value as the value that the Fund would receive to sell an investment or pay to transfer a liability in a timely transaction with an independent buyer in the principal market, or in the absence of a principal market the most advantageous market for the investment or liability. ASC 820 establishes a three-tier hierarchy to distinguish between (1) inputs that reflect the assumptions market participants would use in valuing an asset or liability developed based on market data obtained from sources independent of the reporting entity (observable inputs) and (2) inputs that reflect the reporting entity's own assumptions about the assumptions market participants would use in valuing an asset or liability developed based on the best information available in the circumstances (unobservable inputs) and to establish classification of fair value measurements for disclosure purposes. Various inputs are used in determining the value of the Fund's
investments. The inputs are summarized in the three broad levels listed below.
• Level 1 – unadjusted quoted prices in active markets for identical investments
• Level 2 – other significant observable inputs (including quoted prices for similar investments, interest rates, prepayment speeds, credit risk, etc.)
• Level 3 – significant unobservable inputs including the Fund's own assumptions in determining the fair value of investments. Factors considered in making this determination may include, but are not limited to, information obtained by contacting the issuer, analysts, or the appropriate stock exchange (for exchange-traded securities), analysis of the issuer's financial statements or other available documents and, if necessary, available information concerning other securities in similar circumstances
The inputs or methodology used for valuing securities are not necessarily an indication of the risk associated with investing in those securities and the determination of the significance of a particular input to the fair value measurement in its entirety requires judgment and considers factors specific to each security.
The following is a summary of the inputs used to value the Portfolio's investments as of December 31, 2015.
Investment Type | Level 1 Unadjusted quoted prices (000) | Level 2 Other significant observable inputs (000) | Level 3 Significant unobservable inputs (000) | Total (000) | |||||||||||||||
Assets: | |||||||||||||||||||
Common Stocks | |||||||||||||||||||
Aerospace & Defense | $ | — | $ | 311 | $ | — | $ | 311 | |||||||||||
Automobiles | — | 209 | — | 209 | |||||||||||||||
Banks | 1,334 | 1,331 | — | 2,665 | |||||||||||||||
Beverages | — | 499 | — | 499 | |||||||||||||||
| Commercial Services & Supplies | — | 524 | — | 524 | |||||||||||||||
| Construction & Engineering | — | 202 | — | 202 | |||||||||||||||
Construction Materials | 291 | — | — | 291 | |||||||||||||||
Consumer Finance | 237 | 203 | — | 440 | |||||||||||||||
| Diversified Consumer Services | 404 | 658 | — | 1,062 | |||||||||||||||
| Diversified Financial Services | — | 321 | — | 321 | |||||||||||||||
Food & Staples Retailing | — | 606 | — | 606 | |||||||||||||||
Food Products | 197 | 961 | — | 1,158 | |||||||||||||||
15
Morgan Stanley Institutional Fund, Inc.
Annual Report — December 31, 2015
Notes to Financial Statements (cont'd)
Investment Type | Level 1 Unadjusted quoted prices (000) | Level 2 Other significant observable inputs (000) | Level 3 Significant unobservable inputs (000) | Total (000) | |||||||||||||||
Common Stocks (cont'd) | |||||||||||||||||||
| Health Care Equipment & Supplies | $ | — | $ | 317 | $ | — | $ | 317 | |||||||||||
| Health Care Providers & Services | — | 654 | — | 654 | |||||||||||||||
| Hotels, Restaurants & Leisure | — | 589 | — | 589 | |||||||||||||||
| Independent Power Producers & Energy Traders | — | 444 | — | 444 | |||||||||||||||
| Internet Software & Services | 362 | — | — | 362 | |||||||||||||||
Media | — | 777 | — | 777 | |||||||||||||||
Multi-line Retail | — | 643 | — | 643 | |||||||||||||||
Personal Products | — | 521 | — | 521 | |||||||||||||||
Pharmaceuticals | — | 1,310 | — | 1,310 | |||||||||||||||
| Semiconductors & Semiconductor Equipment | — | 434 | — | 434 | |||||||||||||||
Software | — | 339 | — | 339 | |||||||||||||||
| Textiles, Apparel & Luxury Goods | — | 1,261 | — | 1,261 | |||||||||||||||
| Transportation Infrastructure | 216 | 20 | — | 236 | |||||||||||||||
Water Utilities | — | 419 | — | 419 | |||||||||||||||
Total Common Stocks | 3,041 | 13,553 | — | 16,594 | |||||||||||||||
Participation Notes | — | 2,416 | — | 2,416 | |||||||||||||||
Investment Companies | 1,015 | — | — | 1,015 | |||||||||||||||
Short-Term Investment | |||||||||||||||||||
Investment Company | 841 | — | — | 841 | |||||||||||||||
Total Assets | $ | 4,897 | $ | 15,969 | $ | — | $ | 20,866 | |||||||||||
Transfers between investment levels may occur as the markets fluctuate and/or the availability of data used in an investment's valuation changes. The Portfolio recognizes transfers between the levels as of the end of the period. As of December 31, 2015, the Portfolio did not have any investments transfer between investment levels. At December 31, 2015, the fair value of certain securities were adjusted due to developments which occurred between the time of the close of the foreign markets on which they trade and the close of business on the NYSE which resulted in their level 2 classification.
3. Foreign Currency Translation and Foreign Investments: The books and records of the Portfolio are maintained in U.S. dollars. Foreign currency amounts are translated into U.S. dollars as follows:
– investments, other assets and liabilities at the prevailing rate of exchange on the valuation date;
– investment transactions and investment income at the prevailing rates of exchange on the dates of such transactions.
Although the net assets of the Portfolio are presented at the foreign exchange rates and market values at the close of the period, the Portfolio does not isolate that portion of the results of operations arising as a result of changes in the foreign exchange rates from the fluctuations arising from changes in the market prices of securities held at period end. Similarly, the Portfolio does not isolate the effect of changes in foreign exchange rates from the fluctuations arising from changes in the market prices of securities sold during the period. Accordingly, realized and unrealized foreign currency gains (losses) on investments in securities are included in the reported net realized and unrealized gains (losses) on investment transactions and balances. However, pursuant to U.S. Federal income tax regulations, gains and losses from certain foreign currency transactions and the foreign currency portion of gains and losses realized on sales and maturities of foreign denominated debt securities are treated as ordinary income for U.S. Federal income tax purposes.
Net realized gains (losses) on foreign currency transactions represent net foreign exchange gains (losses) from foreign currency forward exchange contracts, disposition of foreign currencies, currency gains (losses) realized between the trade and settlement dates on securities transactions, and the difference between the amount of investment income and foreign withholding taxes recorded on the Portfolio's books and the U.S. dollar equivalent amounts actually received or paid. Net unrealized currency gains (losses) from valuing foreign currency denominated assets and liabilities at period end exchange rates are reflected as a component of unrealized appreciation (depreciation) in the Statement of Assets and Liabilities. The change in unrealized currency gains (losses) on foreign currency translations for the period is reflected in the Statement of Operations.
A significant portion of the Portfolio's net assets consist of securities of issuers located in emerging markets, which are denominated in foreign currencies. Such securities may be concentrated in a limited number of countries and regions and may vary throughout the period. Changes in currency exchange rates will affect the value
16
Morgan Stanley Institutional Fund, Inc.
Annual Report — December 31, 2015
Notes to Financial Statements (cont'd)
of and investment income from foreign currency denominated securities. Emerging market securities are often subject to greater price volatility, limited capitalization and liquidity, and higher rates of inflation than securities of companies based in the U.S. In addition, emerging market issuers may be subject to substantial governmental involvement in the economy and greater social, economic and political uncertainty.
Governmental approval for foreign investments may be required in advance of making an investment under certain circumstances in some countries, and the extent of foreign investments in domestic companies may be subject to limitation in other countries. Foreign ownership limitations also may be imposed by the charters of individual companies to prevent, among other concerns, violations of foreign investment limitations. As a result, an additional class of shares (identified as "Foreign" in the Portfolio of Investments) may be created and offered for investment. The "local" and "foreign shares" market values may differ. In the absence of trading of the foreign shares in such markets, the Portfolio values the foreign shares at the closing exchange price of the local shares.
4. Structured Investments: The Portfolio invested a portion of its assets in structured investments. A structured investment is a derivative security designed to offer a return linked to a particular underlying security, currency, commodity or market. Structured investments may come in various forms including notes (such as exchange-traded notes), warrants and options to purchase securities. The Portfolio will typically use structured investments to gain exposure to a permitted underlying security, currency, commodity or market when direct access to a market is limited or inefficient from a tax or cost standpoint. There can be no assurance that structured investments will trade at the same price or have the same value as the underlying security, currency, commodity or market. Investments in structured investments involve risks including issuer risk, counterparty risk and market risk. Holders of structured investments bear risks of the underlying investment and are subject to issuer or counterparty risk because the Portfolio is relying on the creditworthiness of such issuer or counterparty and has no rights with respect to the underlying investment. Certain structured investments may be thinly traded or have a limited trading market and may have the effect of
increasing the Portfolio's illiquidity to the extent that the Portfolio, at a particular time, may be unable to find qualified buyers for these securities.
5. Redemption Fees: The Portfolio will assess a 2% redemption fee on Class I shares, Class A shares, Class C shares and Class IS shares, which is paid directly to the Portfolio, for shares redeemed or exchanged within thirty days of purchase, subject to certain exceptions. The redemption fee is designed to protect the Portfolio and its remaining shareholders from the effects of short-term trading. These fees, if any, are included in the Statement of Changes in Net Assets.
6. Indemnifications: The Fund enters into contracts that contain a variety of indemnifications. The Fund's maximum exposure under these arrangements is unknown. However, the Fund has not had prior claims or losses pursuant to these contracts and expects the risk of loss to be remote.
7. Dividends and Distributions to Shareholders: Dividend income and distributions to shareholders are recorded on the ex-dividend date. Dividends from net investment income, if any, are declared and paid annually. Net realized capital gains, if any, are distributed at least annually.
8. Security Transactions, Income and Expenses: Security transactions are accounted for on the trade date (date the order to buy or sell is executed). Realized gains and losses on the sale of investment securities are determined on the specific identified cost method. Dividend income and other distributions are recorded on the ex-dividend date (except for certain foreign dividends which may be recorded as soon as the Portfolio is informed of such dividends) net of applicable withholding taxes. Interest income is recognized on the accrual basis except where collection is in doubt. Discounts are accreted and premiums are amortized over the life of the respective securities. Most expenses of the Fund can be directly attributed to a particular Portfolio. Expenses which cannot be directly attributed are apportioned among the Portfolios based upon relative net assets or other appropriate methods. Income, expenses (other than class specific expenses — distribution and shareholder services, transfer agency and sub transfer agency fees) and realized and unrealized gains or losses are allocated to each class of shares based upon their relative net assets.
17
Morgan Stanley Institutional Fund, Inc.
Annual Report — December 31, 2015
Notes to Financial Statements (cont'd)
B. Advisory Fees: The Adviser, a wholly-owned subsidiary of Morgan Stanley, provides the Portfolio with advisory services under the terms of an Investment Advisory Agreement, paid quarterly, at an annual rate of 1.25% of the average daily net assets of the Portfolio.
The Adviser has agreed to reduce its advisory fee and/or reimburse the Portfolio so that total annual portfolio operating expenses, excluding certain investment related expenses, taxes, interest and other extraordinary expenses (including litigation), will not exceed 1.65% for Class I shares, 2.00% for Class A shares, 2.75% for Class C shares and 1.60% for Class IS shares. The fee waivers and/or expense reimbursements will continue for at least one year from the date of the Portfolio's prospectus or until such time as the Directors act to discontinue all or a portion of such waivers and/or reimbursements when they deem such action is appropriate. For the period ended December 31, 2015, approximately $11,000 of advisory fees were waived and less than $43,000 of other expenses were reimbursed by the Adviser pursuant to this arrangement.
C. Administration Fees: The Adviser also serves as Administrator to the Fund and provides administrative services pursuant to an Administration Agreement for an annual fee, accrued daily and paid monthly, of 0.08% of the Portfolio's average daily net assets.
Under a Sub-Administration Agreement between the Administrator and State Street Bank and Trust Company ("State Street"), State Street provides certain administrative services to the Fund. For such services, the Administrator pays State Street a portion of the fee the Administrator receives from the Portfolio.
D. Distribution and Shareholder Services Fees: Morgan Stanley Distribution, Inc. ("MSDI" or the "Distributor"), a wholly-owned subsidiary of the Adviser and an indirect subsidiary of Morgan Stanley, serves as the Fund's Distributor of Portfolio shares pursuant to a Distribution Agreement. The Fund has adopted a Shareholder Services Plan with respect to Class A shares pursuant to Rule 12b-1 under the Act. Under the Shareholder Services Plan, the Portfolio pays the Distributor a shareholder services fee, accrued daily and paid monthly, at an annual rate of 0.25% of the Portfolio's average daily net assets attributable to Class A shares.
The Fund has adopted a Distribution and Shareholder Services Plan with respect to Class C shares pursuant to Rule 12b-1 under the Act. Under the Distribution and Shareholder Services Plan, the Portfolio pays the Distributor a distribution fee, accrued daily and paid monthly, at an annual rate of 0.75%
and a shareholder services fee, accrued daily and paid monthly, at an annual rate of 0.25% of the Portfolio's average daily net assets attributable to Class C shares.
The distribution and shareholder services fees are used to support the expenses associated with servicing and maintaining accounts. The Distributor may compensate other parties for providing shareholder support services to investors who purchase Class A and Class C shares.
E. Dividend Disbursing and Transfer Agent: The Fund's dividend disbursing and transfer agent is Boston Financial Data Services, Inc. ("BFDS"). Pursuant to a Transfer Agency Agreement, the Fund pays BFDS a fee based on the number of classes, accounts and transactions relating to the Portfolios of the Fund.
F. Custodian Fees: State Street (the "Custodian") serves as Custodian for the Fund in accordance with a Custodian Agreement. The Custodian holds cash, securities, and other assets of the Fund as required by the Act. Custody fees are payable monthly based on assets held in custody, investment purchases and sales activity and account maintenance fees, plus reimbursement for certain out-of-pocket expenses.
G. Security Transactions and Transactions with Affiliates: For the period ended December 31, 2015, purchases and sales of investment securities for the Portfolio, other than long-term U.S. Government securities and short-term investments, were approximately $20,378,000 and $943,000, respectively. There were no purchases and sales of long-term U.S. Government securities for the period ended December 31, 2015.
The Portfolio invests in the Institutional Class of the Morgan Stanley Institutional Liquidity Funds — Money Market Portfolio (the "Liquidity Funds"), an open-end management investment company managed by the Adviser. Advisory fees paid by the Portfolio are reduced by an amount equal to its pro-rata share of the advisory and administration fees paid by the Portfolio due to its investment in the Liquidity Funds. For the period ended December 31, 2015, advisory fees paid were reduced by less than $500 relating to the Portfolio's investment in the Liquidity Funds.
A summary of the Portfolio's transactions in shares of the Liquidity Funds during the period ended December 31, 2015 is as follows:
| Value December 15, 2015 (000) | Purchases at Cost (000) | Sales (000) | Dividend Income (000) | Value December 31, 2015 (000) | |||||||||||||||
| $ | — | $ | 18,367 | $ | 17,526 | $ | 1 | $ | 841 | ||||||||||
18
Morgan Stanley Institutional Fund, Inc.
Annual Report — December 31, 2015
Notes to Financial Statements (cont'd)
The Portfolio has an unfunded Deferred Compensation Plan (the "Compensation Plan"), which allows each independent Director to defer payment of all, or a portion, of the fees he or she receives for serving on the Board of Directors. Each eligible Director generally may elect to have the deferred amounts credited with a return equal to the total return on one or more of the Morgan Stanley funds that are offered as investment options under the Compensation Plan. Appreciation/depreciation and distributions received from these investments are recorded with an offsetting increase/decrease in the deferred compensation obligation and do not affect the NAV of the Portfolio.
H. Federal Income Taxes: It is the Portfolio's intention to continue to qualify as a regulated investment company and distribute all of its taxable and tax-exempt income. Accordingly, no provision for Federal income taxes is required in the financial statements.
The Portfolio may be subject to taxes imposed by countries in which it invests. Such taxes are generally based on income and/or capital gains earned or repatriated. Taxes are accrued based on net investment income, net realized gains and net unrealized appreciation as such income and/or gains are earned. Taxes may also be based on transactions in foreign currency and are accrued based on the value of investments denominated in such currency.
FASB ASC 740-10, "Income Taxes — Overall", sets forth a minimum threshold for financial statement recognition of the benefit of a tax position taken or expected to be taken in a tax return. Management has concluded there are no significant uncertain tax positions that would require recognition in the financial statements. If applicable, the Portfolio recognizes interest accrued related to unrecognized tax benefits in "Interest Expense" and penalties in "Other Expenses" in the Statement of Operations. The Portfolio files tax returns with the U.S. Internal Revenue Service, New York and various states.
The tax character of distributions paid may differ from the character of distributions shown in the Statement of Changes in Net Assets due to short-term capital gains being treated as ordinary income for tax purposes. There were no distributions paid during fiscal 2015.
The amount and character of income and gains to be distributed are determined in accordance with income tax regulations which may differ from GAAP. These book/tax differences are either considered temporary or permanent in nature.
Temporary differences are primarily due to differing book and tax treatments in the timing of the recognition of gains (losses) on certain investment transactions and the timing of the deductibility of certain expenses.
Permanent differences, primarily due to differing treatments of gains (losses) related to foreign currency transactions and a net operating loss, resulted in the following reclassifications among the components of net assets at December 31, 2015:
| Accumulated Net Investment Loss (000) | Net Realized Gain (000) | Paid-in- Capital (000) | |||||||||
| $ | (16 | ) | $ | 18 | $ | (2 | ) | ||||
At December 31, 2015, the Portfolio had no distributable earnings on a tax basis.
19
Morgan Stanley Institutional Fund, Inc.
Annual Report — December 31, 2015
Report of Independent Registered Public Accounting Firm
To the Shareholders and Board of Directors of
Morgan Stanley Institutional Fund, Inc. —
Emerging Markets Small Cap Portfolio
We have audited the accompanying statement of assets and liabilities, including the portfolio of investments, of Emerging Markets Small Cap Portfolio (one of the portfolios constituting Morgan Stanley Institutional Fund, Inc.) (the "Portfolio") as of December 31, 2015, and the related statements of operations and changes in net assets for the period from December 15, 2015 (commencement of operations) to December 31, 2015 and the financial highlights. These financial statements and financial highlights are the responsibility of the Portfolio's management. Our responsibility is to express an opinion on these financial statements and financial highlights based on our audit.
We conducted our audit in accordance with the standards of the Public Company Accounting Oversight Board (United States). Those standards require that we plan and perform the audit to obtain reasonable assurance about whether the financial statements and financial highlights are free of material misstatement. We were not engaged to perform an audit of the Portfolio's internal control over financial reporting. Our audit included consideration of internal control over financial reporting as a basis for designing audit procedures that are appropriate in the circumstances, but not for the purpose of expressing an opinion on the effectiveness of the Portfolio's internal control over financial reporting. Accordingly, we express no such opinion. An audit also includes examining, on a test basis, evidence supporting the amounts and disclosures in the financial statements and financial highlights, assessing the accounting principles used and significant estimates made by management, and evaluating the overall financial statement presentation. Our procedures included confirmation of securities owned as of December 31, 2015, by correspondence with the custodian and others or by other appropriate auditing procedures where replies from others were not received. We believe that our audit provides a reasonable basis for our opinion.
In our opinion, the financial statements and financial highlights referred to above present fairly, in all material respects, the financial position of Emerging Markets Small Cap Portfolio (one of the portfolios constituting Morgan Stanley Institutional Fund, Inc.) at December 31, 2015, the results of its operations, changes in its net assets and the financial highlights for the period from December 15, 2015 (commencement of operations) to December 31, 2015, in conformity with U.S. generally accepted accounting principles.

Boston, Massachusetts
February 26, 2016
20
Morgan Stanley Institutional Fund, Inc.
Annual Report — December 31, 2015
Investment Advisory Agreement Approval (unaudited)
The Board considered the following factors at the time of approval of the contracts which occurred prior to commencement of operations.
Nature, Extent and Quality of Services
The Board reviewed and considered the nature and extent of the investment advisory services to be provided by the Adviser (as defined herein) under the advisory agreement, including portfolio management, investment research and equity and fixed income securities trading. The Board also reviewed and considered the nature and extent of the non-advisory, administrative services to be provided by the Adviser under the administration agreement, including accounting, operations, clerical, bookkeeping, compliance, business management and planning, legal services and the provision of supplies, office space and utilities at the Adviser's expense. The Board also considered the Adviser's investment in personnel and infrastructure that benefits the Portfolio. (The advisory and administration agreements together are referred to as the "Management Agreement.") The Board also considered that the Adviser serves a variety of other investment advisory clients and has experience overseeing service providers. The Board also compared the nature of the services to be provided by the Adviser with similar services provided by non-affiliated advisers as reported to the Board by Lipper, Inc.
The Board reviewed and considered the qualifications of the portfolio managers, the senior administrative managers and other key personnel of the Adviser who will provide the administrative and advisory services to the Portfolio. The Board determined that the Adviser's portfolio managers and key personnel are well qualified by education and/or training and experience to perform the services in an efficient and professional manner. The Board concluded that the nature and extent of the advisory and administrative services to be provided were necessary and appropriate for the conduct of the business and investment activities of the Portfolio and supported its decision to approve the Management Agreement.
Performance, Fees and Expenses of the Portfolio
The Board considered that the Adviser plans to arrange for a public offering of shares of the Portfolio to raise assets for investment and that the offering had not yet begun and concluded that, since the Portfolio currently had no assets to invest (other than seed capital required under the Investment Company Act) and had no track record of performance, this was not a factor it needed to address at the present time.
The Board reviewed the advisory and administrative fee rates (the "management fee rates") proposed to be paid by the Portfolio under the Management Agreement relative to comparable funds advised by the Adviser, when applicable, and compared to their peers as determined by the Adviser, and reviewed the anticipated total expense ratio of the Portfolio. The Board considered that the Portfolio requires the Adviser to develop processes, invest in additional resources and incur additional risks to successfully manage the Portfolio and concluded that the proposed management fee rate and anticipated total expense ratio would be acceptable.
Economies of Scale
The Board considered the growth prospects of the Portfolio and the structure of the proposed management fee schedule, which does not include breakpoints for the Portfolio. The Board considered that the Portfolio's potential growth was uncertain and concluded that it would be premature to consider economies of scale as a factor in approving the Management Agreement at the present time.
Profitability of the Adviser and Affiliates
Since the Portfolio had not begun operations and had not paid any fees to the Adviser, the Board concluded that this was not a factor that needed to be considered at the present time.
Other Benefits of the Relationship
The Board considered other direct and indirect benefits to the Adviser and/or its affiliates to be derived from their relationship with the Portfolio and other funds advised by the Adviser. These benefits may include, among other things, fees for trading, distribution and/or shareholder servicing and for transaction processing and reporting platforms used by securities lending agents, and research received by the Adviser generated from commission dollars spent on funds' portfolio trading. Since the Portfolio had not begun operations and had not paid any fees to the Adviser, the Board concluded that these benefits were not a factor that needed to be considered at the present time.
21
Morgan Stanley Institutional Fund, Inc.
Annual Report — December 31, 2015
Investment Advisory Agreement Approval (unaudited) (cont'd)
Resources of the Adviser and Historical Relationship Between the Portfolio and the Adviser
The Board considered whether the Adviser is financially sound and has the resources necessary to perform its obligations under the Management Agreement. The Board also reviewed and considered the organizational structure of the Adviser, the policies and procedures formulated and adopted by the Adviser for managing the Portfolio's operations and the Board's confidence in the competence and integrity of the senior managers and key personnel of the Adviser. The Board concluded that the Adviser has the financial resources necessary to fulfill its obligations under the Management Agreement and that it is beneficial for the Portfolio to enter into this relationship with the Adviser.
Other Factors and Current Trends
The Board considered the controls and procedures adopted and implemented by the Adviser and monitored by the Fund's Chief Compliance Officer and concluded that the conduct of business by the Adviser indicates a good faith effort on its part to adhere to high ethical standards in the conduct of the Portfolio's business.
General Conclusion
After considering and weighing all of the above factors, with various written materials and verbal information presented by the Adviser, the Board concluded that it would be in the best interest of the Portfolio and its future shareholders to approve the Management Agreement, which will remain in effect for two years and thereafter must be approved annually by the Board of the Portfolio if it is to continue in effect. In reaching this conclusion the Board did not give particular weight to any single piece of information or factor referenced above. It is possible that individual Board members may have weighed these factors, and the information presented, differently in reaching their individual decisions to approve the Management Agreement.
22
Morgan Stanley Institutional Fund, Inc.
Annual Report — December 31, 2015
U.S. Privacy Policy (unaudited)
AN IMPORTANT NOTICE CONCERNING OUR U.S. PRIVACY POLICY
This privacy notice describes the U.S. privacy policy of Morgan Stanley Distribution, Inc., and the Morgan Stanley family of mutual funds ("us", "our", "we").
We are required by federal law to provide you with notice of our U.S. privacy policy ("Policy"). This Policy applies to both our current and former clients unless we state otherwise and is intended for individual clients who purchase products or receive services from us for personal, family or household purposes. This Policy is not applicable to partnerships, corporations, trusts or other non-individual clients or account holders, nor is this Policy applicable to individuals who are either beneficiaries of a trust for which we serve as trustee or participants in an employee benefit plan administered or advised by us. This Policy is, however, applicable to individuals who select us to be a custodian of securities or assets in individual retirement accounts, 401(k) accounts, or accounts subject to the Uniform Gifts to Minors Act.
This notice sets out our business practices to protect your privacy; how we collect and share personal information about you; and how you can limit our sharing or certain uses by others of this information. We may amend this Policy at any time, and will inform you of any changes to our Policy as required by law.
WE RESPECT YOUR PRIVACY
We appreciate that you have provided us with your personal financial information and understand your concerns about your information. We strive to safeguard the information our clients entrust to us. Protecting the confidentiality and security of client information is an important part of how we conduct our business.
This notice describes what personal information we collect about you, how we collect it, when we may share it with others, and how certain others may use it. It discusses the steps you may take to limit our sharing of certain information about you with our affiliated companies, including, but not limited to our affiliated banking businesses, brokerage firms and credit service affiliates. It also discloses how you may limit our affiliates' use of shared information for marketing purposes.
Throughout this Policy, we refer to the nonpublic information that personally identifies you as "personal information." We also use the term "affiliated company" in this notice. An affiliated company is a company in our family of companies and includes companies with the Morgan Stanley name. These affiliated companies are financial institutions such as broker-dealers, banks, investment advisers and credit card issuers. We refer to any company that is not an affiliated company as a nonaffiliated third party. For purposes of Section 5 of this notice, and your ability to limit certain uses of personal information by our affiliates, this notice applies to the use of personal information by our affiliated companies.
1. WHAT PERSONAL INFORMATION DO WE COLLECT FROM YOU?
We may collect the following types of information about you: (i) information provided by you, including information from applications and other forms we receive from you, (ii) information about your transactions with us or our affiliates, (iii) information about your transactions with nonaffiliated third parties, (iv) information from consumer reporting agencies, (v) information obtained from our websites, and (vi) information obtained from other sources. For example:
• We collect information such as your name, address, e-mail address, telephone/fax numbers, assets, income and investment objectives through applications and other forms you submit to us.
• We may obtain information about account balances, your use of account(s) and the types of products and services you prefer to receive from us through your dealings and transactions with us and other sources.
• We may obtain information about your creditworthiness and credit history from consumer reporting agencies.
• We may collect background information from and through third-party vendors to verify representations you have made and to comply with various regulatory requirements.
2. WHEN DO WE DISCLOSE PERSONAL INFORMATION WE COLLECT ABOUT YOU?
We may disclose personal information we collect about you in each of the categories listed above to affiliated and nonaffiliated third parties.
23
Morgan Stanley Institutional Fund, Inc.
Annual Report — December 31, 2015
U.S. Privacy Policy (unaudited) (cont'd)
a. Information We Disclose to Affiliated Companies.
We may disclose personal information that we collect about you to our affiliated companies to manage your account(s) effectively, to service and process your transactions, and to let you know about products and services offered by us and affiliated companies, to manage our business, and as otherwise required or permitted by law. Offers for products and services from affiliated companies are developed under conditions designed to safeguard your personal information.
b. Information We Disclose to Third Parties.
We may disclose personal information that we collect about you to nonaffiliated third parties to provide marketing services on our behalf or to other financial institutions with whom we have joint marketing agreements. We may also disclose all of the information we collect to other nonaffiliated third parties for our everyday business purposes, such as to process transactions, maintain account(s), respond to court orders and legal investigations, report to credit bureaus, offer our own products and services, protect against fraud, for institutional risk control, to perform services on our behalf, and as otherwise required or permitted by law.
When we share personal information about you with a nonaffiliated third party, they are required to limit their use of personal information about you to the particular purpose for which it was shared and they are not allowed to share personal information about you with others except to fulfill that limited purpose or as may be permitted or required by law.
3. HOW DO WE PROTECT THE SECURITY AND CONFIDENTIALITY OF PERSONAL INFORMATION WE COLLECT ABOUT YOU?
We maintain physical, electronic and procedural security measures that comply with applicable law and regulations to help safeguard the personal information we collect about you. We have internal policies governing the proper handling of client information by employees. Third parties that provide support or marketing services on our behalf may also receive personal information about you, and we require them to adhere to appropriate security standards with respect to such information.
4. HOW CAN YOU LIMIT OUR SHARING CERTAIN PERSONAL INFORMATION ABOUT YOU WITH OUR AFFILIATED COMPANIES FOR ELIGIBILITY DETERMINATION?
By following the opt-out procedures in Section 6 below, you may limit the extent to which we share with our affiliated companies, personal information that was collected to determine your eligibility for products and services such as your credit reports and other information that you have provided to us or that we may obtain from third parties ("eligibility information"). Eligibility information does not include your identification information or personal information pertaining to our transactions or experiences with you. Please note that, even if you direct us not to share eligibility information with our affiliated companies, we may still share your personal information, including eligibility information, with our affiliated companies under circumstances that are permitted under applicable law, such as to process transactions or to service your account.
5. HOW CAN YOU LIMIT THE USE OF CERTAIN PERSONAL INFORMATION ABOUT YOU BY OUR AFFILIATED COMPANIES FOR MARKETING?
By following the opt-out instructions in Section 6 below, you may limit our affiliated companies from marketing their products or services to you based on personal information we disclose to them. This information may include, for example, your income and account history with us. Please note that, even if you choose to limit our affiliated companies from using personal information about you that we may share with them for marketing their products and services to you, our affiliated companies may use your personal information that they obtain from us to market to you in circumstances permitted by law, such as if the affiliated party has its own relationship with you.
24
Morgan Stanley Institutional Fund, Inc.
Annual Report — December 31, 2015
U.S. Privacy Policy (unaudited) (cont'd)
6. HOW CAN YOU SEND US AN OPT-OUT INSTRUCTION?
If you wish to limit our sharing of eligibility information about you with our affiliated companies, or our affiliated companies' use of personal information for marketing purposes, as described in this notice, you may do so by:
• Calling us at (800) 548-7786
Monday–Friday between 8a.m. and 6p.m. (EST)
• Writing to us at the following address:
Boston Financial Data Services, Inc.
c/o Privacy Coordinator
P.O. Box 219804
Kansas City, Missouri 64121
If you choose to write to us, your request should include: your name, address, telephone number and account number(s) to which the opt-out applies and whether you are opting out with respect to sharing of eligibility information (Section 4 above), or information used for marketing (Section 5 above), or both. Written opt-out requests should not be sent with any other correspondence. In order to process your request, we require that the request be provided by you directly and not through a third party. Once you have informed us about your privacy preferences, your opt-out preference will remain in effect with respect to this Policy (as it may be amended) until you notify us otherwise. If you are a joint account owner, we will accept instructions from any one of you and apply those instructions to the entire account.
Please understand that if you limit our sharing or our affiliated companies' use of personal information, you and any joint account holder(s) may not receive information about our affiliated companies' products and services, including products or services that could help you manage your financial resources and achieve your investment objectives.
If you have more than one account or relationship with us, please specify the accounts to which you would like us to apply your privacy choices. If you have accounts or relationships with our affiliates, you may receive multiple privacy policies from them, and will need to separately notify those companies of your privacy choices for those accounts or relationships.
7. WHAT IF AN AFFILIATED COMPANY BECOMES A NONAFFILIATED THIRD PARTY?
If, at any time in the future, an affiliated company becomes a nonaffiliated third party, further disclosures of personal information made to the former affiliated company will be limited to those described in Section 2(b) above relating to nonaffiliated third parties. If you elected under Section 6 to limit disclosures we make to affiliated companies, or use of personal information by affiliated companies, your election will not apply to use by any former affiliated company of your personal information in their possession once it becomes a nonaffiliated third party.
SPECIAL NOTICE TO RESIDENTS OF VERMONT
The following section supplements our Policy with respect to our individual clients who have a Vermont address and supersedes anything to the contrary in the above Policy with respect to those clients only.
The State of Vermont requires financial institutions to obtain your consent prior to sharing personal information that they collect about you with nonaffiliated third parties, or eligibility information with affiliated companies, other than in certain limited circumstances. Except as permitted by law, we will not share personal information we collect about you with nonaffiliated third parties or eligibility information with affiliated companies, unless you provide us with your written consent to share such information.
SPECIAL NOTICE TO RESIDENTS OF CALIFORNIA
The following section supplements our Policy with respect to our individual clients who have a California address and supersedes anything to the contrary in the above Policy with respect to those clients only.
In response to a California law, if your account has a California home address, your personal information will not be disclosed to nonaffiliated third parties except as permitted by applicable California law, and we will limit sharing such personal information with our affiliates to comply with California privacy laws that apply to us.
25
Morgan Stanley Institutional Fund, Inc.
Annual Report — December 31, 2015
Director and Officer Information (unaudited)
Independent Directors:
| Name, Age and Address of Independent Director | Positions(s) Held with Registrant | Length of Time Served* | Principal Occupation(s) During Past 5 Years and Other Relevant Professional Experience | Number of Portfolios in Fund Complex Overseen by Director** | Other Directorships Held by Independent Director*** | ||||||||||||||||||
| Frank L. Bowman (71) c/o Kramer Levin Naftalis & Frankel LLP Counsel to the Independent Directors 1177 Avenue of the Americas New York, NY 10036 | Director | Since August 2006 | President, Strategic Decisions, LLC (consulting) (since February 2009); Director or Trustee of various Morgan Stanley Funds (since August 2006); Chairperson of the Compliance and Insurance Committee (since October 2015); Formerly, Chairperson of the Insurance Sub-Committee of the Compliance and Insurance Committee (February 2007-December 2015); served as President and Chief Executive Officer of the Nuclear Energy Institute (policy organization) (February 2005-November 2008); retired as Admiral, U.S. Navy after serving over 38 years on active duty including 8 years as Director of the Naval Nuclear Propulsion Program in the Department of the Navy and the U.S. Department of Energy (1996-2004); served as Chief of Naval Personnel (July 1994-September 1996); and on the Joint Staff as Director of Political Military Affairs (June 1992-July1994); knighted as Honorary Knight Commander of the Most Excellent Order of the British Empire; awarded the Officier de l'Orde National du Mérite by the French Government; elected to the National Academy of Engineering (2009). | 98 | Director of BP p.l.c.; Director of Naval and Nuclear Technologies LLP; Director Emeritus of the Armed Services YMCA; Director of the U.S. Naval Submarine League; Member of National Security Advisory Council of the Center for U.S. Global Engagement and a member of the CNA Military Advisory Board; Chairman of the Charity, J Street Cup Golf, Trustee of Fairhaven United Methodist Church; and Director of other various non-profit organizations. | ||||||||||||||||||
| Kathleen A. Dennis (62) c/o Kramer Levin Naftalis & Frankel LLP Counsel to the Independent Directors 1177 Avenue of the Americas New York, NY 10036 | Director | Since August 2006 | President, Cedarwood Associates (mutual fund and investment management consulting) (since July 2006); Chairperson of the Money Market and Alternatives Sub-Committee of the Investment Committee (since October 2006) and Director or Trustee of various Morgan Stanley Funds (since August 2006); formerly, Senior Managing Director of Victory Capital Management (1993-2006). | 98 | Director of various nonprofit organizations. | ||||||||||||||||||
| Nancy C. Everett (61) c/o Kramer Levin Naftalis & Frankel LLP Counsel to the Independent Directors 1177 Avenue of the Americas New York, NY 10036 | Director | Since January 2015 | Chief Executive Officer, Virginia Commonwealth University Investment Company (since November 2015); Owner, OBIR, LLC (investment management consulting) (since June 2014); formerly, Managing Director, BlackRock Inc. (February 2011-December 2013); and Chief Executive Officer, General Motors Asset Management (a/k/a Promark Global Advisors, Inc.) (June 2005-May 2010). | 98 | Member of Virginia Commonwealth University School of Business Foundation; formerly, Member of Virginia Commonwealth University Board of Visitors (2013-2015); Member of Committee on Directors for Emerging Markets Growth Fund, Inc. (2007-2010); Chairperson of Performance Equity Management, LLC (2006-2010); and Chairperson, GMAM Absolute Return Strategies Fund, LLC (2006-2010). | ||||||||||||||||||
26
Morgan Stanley Institutional Fund, Inc.
Annual Report — December 31, 2015
Director and Officer Information (unaudited) (cont'd)
Independent Directors: (cont'd)
| Name, Age and Address of Independent Director | Positions(s) Held with Registrant | Length of Time Served* | Principal Occupation(s) During Past 5 Years and Other Relevant Professional Experience | Number of Portfolios in Fund Complex Overseen by Director** | Other Directorships Held by Independent Director*** | ||||||||||||||||||
| Jakki L. Haussler (58) c/o Kramer Levin Naftalis & Frankel LLP Counsel to the Independent Directors 1177 Avenue of the Americas New York, NY 10036 | Director | Since January 2015 | Chairman and Chief Executive Officer, Opus Capital Group (since January 1996); and formerly, Director, Capvest Venture Fund, LP (May 2000-December 2011); Partner, Adena Ventures, LP (July 1999-December 2010); Director, The Victory Funds (February 2005-July 2008). | 98 | Director of Cincinnati Bell Inc. and Member, Audit Committee and Compensation Committee; Director of Northern Kentucky University Foundation and Member, Investment Committee; Member of Chase College of Law Transactional Law Practice Center Board of Advisors; Director of Best Transport; Chase College of Law Board of Visitors; formerly Member, University of Cincinnati Foundation Investment Committee; Member, Miami University Board of Visitors (2008-2011); Trustee of Victory Funds (2005-2008) and Chairman, Investment Committee (2007-2008) and Member, Service Provider Committee (2005-2008). | ||||||||||||||||||
| Dr. Manuel H. Johnson (67) c/o Johnson Smick International, Inc. 220 I Street, N.E. — Suite 200 Washington, D.C. 20002 | Director | Since July 1991 | Senior Partner, Johnson Smick International, Inc. (consulting firm); Chairperson of the Investment Committee (since October 2006) and Director or Trustee of various Morgan Stanley Funds (since July 1991); Co-Chairman and a founder of the Group of Seven Council (G7C) (international economic commission); formerly Chairperson of the Audit Committee (July 1991-September 2006), Vice Chairman of the Board of Governors of the Federal Reserve System and Assistant Secretary of the U.S. Treasury. | 100 | Director of NVR, Inc. (home construction). | ||||||||||||||||||
| Joseph J. Kearns (73) c/o Kearns & Associates LLC 23823 Malibu Road S-50-440 Malibu, CA 90265 | Director | Since August 1994 | President, Kearns & Associates LLC (investment consulting); Chairperson of the Audit Committee (since October 2006) and Director or Trustee of various Morgan Stanley Funds (since August 1994); formerly, Deputy Chairperson of the Audit Committee (July 2003-September 2006) and Chairperson of the Audit Committee of various Morgan Stanley Funds (since August 1994); CFO of the J. Paul Getty Trust. | 101 | Director of Electro Rent Corporation (equipment leasing). Prior to December 31, 2013, Director of The Ford Family Foundation. | ||||||||||||||||||
27
Morgan Stanley Institutional Fund, Inc.
Annual Report — December 31, 2015
Director and Officer Information (unaudited) (cont'd)
Independent Directors: (cont'd)
| Name, Age and Address of Independent Director | Positions(s) Held with Registrant | Length of Time Served* | Principal Occupation(s) During Past 5 Years and Other Relevant Professional Experience | Number of Portfolios in Fund Complex Overseen by Director** | Other Directorships Held by Independent Director*** | ||||||||||||||||||
| Michael F. Klein (57) c/o Kramer Levin Naftalis & Frankel LLP Counsel to the Independent Directors 1177 Avenue of the Americas New York, NY 10036 | Director | Since August 2006 | Managing Director, Aetos Capital, LLC (since March 2000); Co-President, Aetos Alternatives Management, LLC (since January 2004); and Co-Chief Executive Officer of Aetos Capital LLC (since August 2013); Chairperson of the Fixed Income Sub-Committee of the Investment Committee (since October 2006) and Director or Trustee of various Morgan Stanley Funds (since August 2006); formerly, Managing Director, Morgan Stanley & Co. Inc. and Morgan Stanley Dean Witter Investment Management, President, various Morgan Stanley Funds (June1998-March 2000) and Principal, Morgan Stanley & Co. Inc. and Morgan Stanley Dean Witter Investment Management (August 1997-December 1999). | 97 | Director of certain investment funds managed or sponsored by Aetos Capital, LLC. Director of Sanitized AG and Sanitized Marketing AG (specialty chemicals). | ||||||||||||||||||
| Michael E. Nugent (79) 522 Fifth Avenue New York, NY 10036 | Chair of the Board and Director | Chair of the Boards since July 2006 and Director since July 1991 | Chair of the Boards of various Morgan Stanley Funds (since July 2006); Chairperson of the Closed-End Fund Committee (since June 2012) and Director or Trustee of various Morgan Stanley Funds (since July 1991); formerly, Chairperson of the Insurance Committee (until July 2006), General Partner, TriumphCapital, L.P. (private investment partnership) (1988-2013). | 100 | None. | ||||||||||||||||||
| W. Allen Reed (68) c/o Kramer Levin Naftalis & Frankel LLP Counsel to the Independent Directors 1177 Avenue of the Americas New York, NY 10036 | Director | Since August 2006 | Chairperson of the Equity Sub-Committee of the Investment Committee (since October 2006) and Director or Trustee of various Morgan Stanley Funds (since August 2006); formerly, President and CEO of General Motors Asset Management; Chairman and Chief Executive Officer of the GM Trust Bank and Corporate Vice President of General Motors Corporation (August 1994-December 2005). | 98 | Director of Legg Mason, Inc.; formerly Director of the Auburn University Foundation (2010-2015). | ||||||||||||||||||
| Fergus Reid (83) c/o Joe Pietryka, Inc. 85 Charles Colman Blvd. Pawling, NY 12564 | Director | Since June 1992 | Chairman, Joe Pietryka, Inc.; Chairperson of the Governance Committee and Director or Trustee of various Morgan Stanley Funds (since June 1992). | 100 | Formerly, Trustee and Director of certain investment companies in the JP Morgan Fund Complex managed by JP Morgan Investment Management Inc. (1987-2012). | ||||||||||||||||||
28
Morgan Stanley Institutional Fund, Inc.
Annual Report — December 31, 2015
Director and Officer Information (unaudited) (cont'd)
Interested Director:
| Name, Age and Address of Interested Director | Positions(s) Held with Registrant | Length of Time Served* | Principal Occupation(s) During Past 5 Years | Number of Portfolios in Fund Complex Overseen by Interested Director** | Other Directorships Held by Interested Director*** | ||||||||||||||||||
| James F. Higgins (68) One New York Plaza, New York, NY 10004 | Director | Since June 2000 | Director or Trustee of various Morgan Stanley Funds (since June 2000); Senior Advisor of Morgan Stanley (since August 2000). | 99 | Formerly, Director of AXA Financial, Inc. and AXA Equitable Life Insurance Company (2002-2011) and Director of AXA MONY Life Insurance Company and AXA MONY Life Insurance Company of America (2004-2011). | ||||||||||||||||||
* This is the earliest date the Director began serving the Morgan Stanley Funds. Each Director serves an indefinite term, until his or her successor is elected.
** The Fund Complex includes (as of December 31, 2015) all open-end and closed-end funds (including all of their portfolios) advised by Morgan Stanley Investment Management Inc. (the "Adviser") and any funds that have an adviser that is an affiliated person of the Adviser (including, but not limited to, Morgan Stanley AIP GP LP).
*** This includes any directorships at public companies and registered investment companies held by the Director at any time during the past five years.
Executive Officers:
Name, Age and Address of Executive Officer | Position(s) Held with Registrant | Length of Time Served**** | Principal Occupation(s) During Past 5 Years | ||||||||||||
| John H. Gernon (52) 522 Fifth Avenue New York, NY 10036 | President and Principal Executive Officer | Since September 2013 | President and Principal Executive Officer of the Equity and Fixed Income Funds and the Morgan Stanley AIP Funds (since September 2013) and the Liquidity Funds and various money market funds (since May 2014) in the Fund Complex, Managing Director of the Adviser; Head of Product (since 2006). | ||||||||||||
| Stefanie V. Chang Yu (49) 522 Fifth Avenue New York, NY 10036 | Chief Compliance Officer | Since December 1997 | Managing Director of the Adviser and various entities affiliated with the Adviser; Chief Compliance Officer of various Morgan Stanley Funds and the Adviser (since January 2014); formerly, Vice President of various Morgan Stanley Funds (December 1997-January 2014). | ||||||||||||
| Joseph C. Benedetti (50) 522 Fifth Avenue New York, NY 10036 | Vice President | Since January 2014 | Managing Director of the Adviser and various entities affiliated with the Adviser; Vice President of various Morgan Stanley Funds (since January 2014); formerly, Assistant Secretary of various Morgan Stanley Funds (October 2004-January 2014). | ||||||||||||
| Francis J. Smith (50) 522 Fifth Avenue New York, NY 10036 | Treasurer and Principal Financial Officer | Treasurer since July 2003 and Principal Financial Officer since September 2002 | Executive Director of the Adviser and various entities affiliated with the Adviser; Treasurer (since July 2003) and Principal Financial Officer of various Morgan Stanley Funds (since September 2002). | ||||||||||||
| Mary E. Mullin (48) 522 Fifth Avenue New York, NY 10036 | Secretary | Since June 1999 | Executive Director of the Adviser; Secretary of various Morgan Stanley Funds (since June 1999). | ||||||||||||
**** This is the earliest date the officer began serving the Morgan Stanley Funds. Each officer serves a one-year term, until his or her successor is elected and has qualified.
29
Morgan Stanley Institutional Fund, Inc.
Annual Report — December 31, 2015
Adviser and Administrator
Morgan Stanley Investment Management Inc.
522 Fifth Avenue
New York, New York 10036
Distributor
Morgan Stanley Distribution, Inc.
522 Fifth Avenue
New York, New York 10036
Dividend Disbursing and Transfer Agent
Boston Financial Data Services, Inc.
2000 Crown Colony Drive
Quincy, Massachusetts 02169
Custodian
State Street Bank and Trust Company
One Lincoln Street
Boston, Massachusetts 02111
Legal Counsel
Dechert LLP
1095 Avenue of the Americas
New York, New York 10036
Counsel to the Independent Directors
Kramer Levin Naftalis & Frankel LLP
1177 Avenue of the Americas
New York, New York 10036
Independent Registered Public Accounting Firm
Ernst & Young LLP
200 Clarendon Street
Boston, Massachusetts 02116
Reporting to Shareholders
Each Morgan Stanley fund provides a complete schedule of portfolio holdings in its semi-annual and annual reports within 60 days of the end of the fund's second and fourth fiscal quarters. The semi-annual and annual reports are filed electronically with the Securities and Exchange Commission (SEC) on Form N-CSRS and Form N-CSR, respectively. Morgan Stanley also delivers the semi-annual and annual reports to fund shareholders and makes these reports available on its public website, www.morganstanley.com/im. Each Morgan Stanley fund also files a complete schedule of portfolio holdings with the SEC for the fund's first and third fiscal quarters on Form N-Q. Morgan Stanley does not deliver the reports for the first and third fiscal quarters to shareholders, nor are the reports posted to the Morgan Stanley public website. You may, however, obtain the Form N-Q filings (as well as the Form N-CSR and N-CSRS filings) by accessing the SEC's website, www.sec.gov. You may also review and copy them at the SEC's Public Reference Room in Washington, DC. Information on the operation of the SEC's Public Reference Room may be obtained by calling the SEC toll free at 1 (800) SEC-0330. You can also request copies of these materials, upon payment of a duplicating fee, by electronic request at the SEC's email address (publicinfo@sec.gov) or by writing the Public Reference Room of the SEC, Washington, DC 20549-0102.
Proxy Voting Policies and Procedures and Proxy Voting Record
You may obtain a copy of the Fund's Proxy Voting Policy and Procedures and information regarding how the Fund voted proxies relating to portfolio securities during the most recent twelve-month period ended June 30, without charge, upon request, by calling toll free 1 (800) 548-7786 or by visiting our website at www.morganstanley.com/im. This information is also available on the SEC's website at www.sec.gov.
This report is authorized for distribution only when preceded or accompanied by a prospectus of the Morgan Stanley Institutional Fund, Inc., which describes in detail each Portfolio's investment policies, risks, fees and expenses. Please read the prospectus carefully before you invest or send money. For additional information, including information regarding the investments comprising the Portfolio, please visit our website at www.morganstanley.com/im or call toll free 1 (800) 548-7786.
30
Printed in U.S.A.
This Report has been prepared for shareholders and may be distributed to others only if preceded or accompanied by a current prospectus.
Morgan Stanley Investment Management Inc.
522 Fifth Avenue
New York, New York 10036
© 2016 Morgan Stanley. Morgan Stanley Distribution, Inc.

IFIEMSCANN
1407446 EXP. 02.28.17
INVESTMENT MANAGEMENT

Morgan Stanley Institutional Fund, Inc.
International Equity Portfolio
Annual Report
December 31, 2015

Morgan Stanley Institutional Fund, Inc.
Annual Report — December 31, 2015
Table of Contents
Shareholders' Letter | 2 | ||||||
Expense Example | 3 | ||||||
Investment Overview | 4 | ||||||
Portfolio of Investments | 7 | ||||||
Statement of Assets and Liabilities | 9 | ||||||
Statement of Operations | 11 | ||||||
Statements of Changes in Net Assets | 12 | ||||||
Financial Highlights | 14 | ||||||
Notes to Financial Statements | 19 | ||||||
Report of Independent Registered Public Accounting Firm | 28 | ||||||
Federal Tax Notice | 29 | ||||||
U.S. Privacy Policy | 30 | ||||||
Director and Officer Information | 33 | ||||||
This report is authorized for distribution only when preceded or accompanied by prospectuses of the Morgan Stanley Institutional Fund, Inc. To receive a prospectus and/or statement of additional information (SAI), which contains more complete information such as investment objectives, charges, expenses, policies for voting proxies, risk considerations, and describes in detail each of the Portfolio's investment policies to the prospective investor, please call toll free 1 (800) 548-7786. Please read the prospectuses carefully before you invest or send money.
Additionally, you can access portfolio information including performance, characteristics, and investment team commentary through Morgan Stanley Investment Management's website: www.morganstanley.com/im.
Market forecasts provided in this report may not necessarily come to pass. There is no guarantee that any sectors mentioned will continue to perform as discussed herein or that securities in such sectors will be held by the Portfolio in the future. There is no assurance that a Portfolio will achieve its investment objective. Portfolios are subject to market risk, which is the possibility that market values of securities owned by the Portfolio will decline and, therefore, the value of the Portfolio's shares may be less than what you paid for them. Accordingly, you can lose money investing in this Portfolio. Please see the prospectus for more complete information on investment risks.
1
Morgan Stanley Institutional Fund, Inc.
Annual Report — December 31, 2015
Shareholders' Letter (unaudited)
Dear Shareholders,
We are pleased to provide this Annual report, in which you will learn how your investment in International Equity Portfolio (the "Portfolio") performed during the latest twelve-month period.
Morgan Stanley Investment Management is a client-centric, investor-led organization. Our global presence, intellectual capital, and breadth of products and services enable us to partner with investors to meet the evolving challenges of today's financial markets. We aim to deliver superior investment service and to empower our clients to make the informed decisions that help them reach their investment goals.
As always, we thank you for selecting Morgan Stanley Investment Management, and look forward to working with you in the months and years ahead.
Sincerely,

John H. Gernon
President and Principal Executive Officer
January 2016
2
Morgan Stanley Institutional Fund, Inc.
Annual Report — December 31, 2015
Expense Example (unaudited)
International Equity Portfolio
As a shareholder of the Portfolio, you incur two types of costs: (1) transactional costs, including redemptions fees; and (2) ongoing costs, including advisory fees, administration fees, distribution and shareholder services fees and other Portfolio expenses. This example is intended to help you understand your ongoing costs (in dollars) of investing in the Portfolio and to compare these costs with the ongoing costs of investing in other mutual funds.
This example is based on an investment of $1,000 invested at the beginning of the six-month period ended December 31, 2015 and held for the entire six-month period.
Actual Expenses
The table below provides information about actual account values and actual expenses. You may use the information in this table, together with the amount you invested, to estimate the expenses that you paid over the period. Simply divide your account value by $1,000 (for example, an $8,600 account value divided by $1,000 = 8.6), then multiply the result by the number in the table under the heading entitled "Actual Expenses Paid During Period" to estimate the expenses you paid on your account during this period.
Hypothetical Example for Comparison Purposes
The table below provides information about hypothetical account values and hypothetical expenses based on the Portfolio's actual expense ratio and an assumed rate of return of 5% per year before expenses, which is not the Portfolio's actual return. The hypothetical account values and expenses may not be used to estimate the actual ending account balance or expenses you paid for the period. You may use this information to compare the ongoing costs of investing in the Portfolio and other funds. To do so, compare this 5% hypothetical example with the 5% hypothetical examples that appear in the shareholder reports of the other funds.
Please note that the expenses shown in the table are meant to highlight your ongoing costs only and do not reflect any transactional costs, such as sales charges (loads) and redemption fees. Therefore, the information for each class in the table is useful in comparing ongoing costs only, and will not help you determine the relative total costs of owning different funds. In addition, if these transactional costs were included, your costs would have been higher.
| Beginning Account Value 7/1/15 | Actual Ending Account Value 12/31/15 | Hypothetical Ending Account Value | Actual Expenses Paid During Period* | Hypothetical Expenses Paid During Period* | Net Expense Ratio During Period** | ||||||||||||||||||||||
International Equity Portfolio Class I | $ | 1,000.00 | $ | 935.80 | $ | 1,020.42 | $ | 4.64 | $ | 4.84 | 0.95 | % | |||||||||||||||
International Equity Portfolio Class A | 1,000.00 | 934.40 | 1,018.65 | 6.34 | 6.61 | 1.30 | |||||||||||||||||||||
International Equity Portfolio Class L | 1,000.00 | 932.20 | 1,016.13 | 8.77 | 9.15 | 1.80 | |||||||||||||||||||||
International Equity Portfolio Class C | 1,000.00 | 930.40 | 1,014.87 | 9.97 | 10.41 | 2.05 | |||||||||||||||||||||
International Equity Portfolio Class IS | 1,000.00 | 935.70 | 1,020.62 | 4.44 | 4.63 | 0.91 | |||||||||||||||||||||
* Expenses are calculated using each Portfolio Class' annualized net expense ratio (as disclosed), multiplied by the average account value over the period, and multiplied by 184/365 (to reflect the most recent one-half year period).
** Annualized.
3
Morgan Stanley Institutional Fund, Inc.
Annual Report — December 31, 2015
Investment Overview (unaudited)
International Equity Portfolio
The Portfolio seeks long-term capital appreciation by investing primarily in equity securities of non-U.S. issuers.
Performance
For the year ended December 31, 2015, the Portfolio's Class I shares had a total return based on net asset value and reinvestment of distributions per share of 0.36%, net of fees. The Portfolio's Class I shares outperformed the Portfolio's benchmark, the MSCI EAFE Index (the "Index"), which returned –0.81%.
Factors Affecting Performance
• After stocks looked into the void in September, the fourth quarter of 2015 started with a strong October rally, followed by a relatively uneventful November and then fell again in December. After all was said and done, the Index ended the year down 0.8% in U.S. dollar (USD) terms (+5.3% in local currency) as a strong U.S. dollar continued to affect local market returns and fears of a China slowdown added to volatility.
• In 2015, notable developed market laggards were the countries most exposed to the commodity complex: Canada (–24.2% in USD), Norway (–15.0%) and Australia (–10.0%). Within the EAFE countries, the best performers were Denmark (+23.4%), Ireland (+16.5%) and Belgium (+12.1%). Benefiting from additional quantitative easing, Japan delivered decent performance, up 9.6% for the year, while the eurozone (–2.8%) and the U.K. (–7.6%) underperformed. Turning to developing markets, the MSCI Emerging Markets Index was down 15% for the year, with Greece (–61%) and Latin America (–31%) inflicting much of the damage. China ended the year down 7.8%, and Russia eased back into positive territory, up 4.2%.(i) (All country and regional performance is represented by the respective MSCI index in U.S. dollar terms.)
• On a sector basis, for the year, the Index was led by consumer staples (+8.8%), health care (+7.8%) and information technology (+4.5%), while the weakest-performing sectors were energy (–18.5%), materials (–16.8%) and utilities (–5.3%).
• The Portfolio outperformed for the year thanks to overweight allocations to consumer staples and health care, and the underweight to financials (primarily banks). Strong stock selection in financials, materials and consumer staples was largely offset by stock selection in industrials, health care and information technology.
• Top absolute contributors to the Portfolio's performance for the year were Reckitt Benckiser Group, Unilever and Japan Tobacco. Top absolute detractors for the period were Weir Group PLC, Vallourec SA and Meggitt PLC.(ii) A hedge on the yen to USD, managed using currency forward contracts, also detracted from performance.
Management Strategies
• This time last year we identified a litany of problems facing equity markets — ranging from high valuations and earnings risk, to emerging markets malaise, to an underlying, likely destructive, tide of disinflation or outright deflation that showed few signs of abating. Suffice it to say that none of these have gone away. Rather, existing problems have intensified, new ones have emerged, and there are few hiding places across increasingly correlated asset classes.
• This difficult macro outlook and the gathering deflationary clouds are hardly a propitious backdrop for us as bottom up stock pickers as they present an increasingly difficult outlook for the companies we invest in — or hope to invest in. We are, of course, used to uncertainty, and this uncertainty is not in itself problematic, provided one is given a good margin of relative safety on valuation to hold an existing stock or invest in a new stock idea. However, the problems continue to be: 1) the outlook is tending to deteriorate in our existing holdings — principally in the non-highest-quality stocks, where we are not potentially compensated by valuation and 2) finding new high-quality stocks at a decent price is difficult, and 3) even finding new non-high-quality stocks is very difficult as we do not have the large margin of relative safety we require. This means in practice that we continue to be squeezed and, as a result, the Portfolio is getting more concentrated.
(i) Country and sector performance data from FactSet.
(ii) The information contained in this overview regarding specific securities is for informational purposes only and should not be construed as a recommendation to purchase or sell the securities mentioned.
4
Morgan Stanley Institutional Fund, Inc.
Annual Report — December 31, 2015
Investment Overview (unaudited) (cont'd)
International Equity Portfolio
• For the Portfolio's existing holdings, we are not generally overly concerned about what we consider our highest-quality stocks, such as the consumer staples or pharmaceuticals, where the investment proposition amounts to seeking to own quality companies at fair prices, albeit with some concerns such as emerging markets exposure and U.S. drug pricing. We are more concerned about good quality companies that have been pressured by deflationary top lines (such as our oil-related industrials), where we are no longer potentially compensated by price for the worsening outlook. We all worry about lower-quality cyclical, and often somewhat inert, Japanese companies where the proposition is basically fair-to-"fairish" companies at fair prices, which is not good enough for us, given the risks. This means that although we think the overall Portfolio has decent relative value against the market, we would like to find some new homes for some of our existing holdings, but cannot do so as much as we would like, as the potential new candidates do not seem to have what we consider the right price/quality trade-off.
• As for new opportunities generally, the pickings are slim. We do not think there is much in the way of investment potential in the oil and commodities complex, and we worry that industrials may be in the firing line for the toxic combination of falling volumes and falling prices. In other sectors which we view as lower-quality sectors — financials, information technology and telecommunication services — we struggle to find a sufficient margin of relative safety, given the risks. We continue to concentrate on what we believe are the higher-quality sectors. Overall, for now, our approach continues to be not to attempt to blow the lights out, but just to do our best keeping the lights burning.
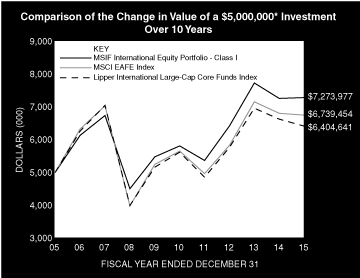
* Minimum Investment for Class I shares
In accordance with SEC regulations, the Portfolio's performance shown assumes that all recurring fees (including management fees) were deducted and all dividends and distributions were reinvested. The performance of Class A, L, C and IS shares will vary from the performance of Class I shares based upon their different inception dates and will be negatively impacted by additional fees assessed to those classes (if applicable).
5
Morgan Stanley Institutional Fund, Inc.
Annual Report — December 31, 2015
Investment Overview (unaudited) (cont'd)
International Equity Portfolio
Performance Compared to the MSCI EAFE Index(1) and the Lipper International Large-Cap Core Funds Index(2)
| Period Ended December 31, 2015 Total Returns(3) | |||||||||||||||||||
Average Annual | |||||||||||||||||||
| One Year | Five Years | Ten Years | Since Inception(9) | ||||||||||||||||
| Portfolio — Class I Shares w/o sales charges(4) | 0.36 | % | 4.62 | % | 3.82 | % | 8.44 | % | |||||||||||
| Portfolio — Class A Shares w/o sales charges(5) | –0.02 | 4.32 | 3.54 | 7.39 | |||||||||||||||
| Portfolio — Class A Shares with maximum 5.25% sales charges(5) | –5.29 | 3.20 | 2.98 | 7.10 | |||||||||||||||
| Portfolio — Class L Shares w/o sales charges(6) | –0.47 | — | — | 7.44 | |||||||||||||||
| Portfolio — Class C Shares w/o sales charges(8) | — | — | — | –9.41 | |||||||||||||||
| Portfolio — Class C Shares with maximum 1.00% deferred sales charges(8) | — | — | — | –10.30 | |||||||||||||||
| Portfolio — Class IS Shares w/o sales charges(7) | 0.40 | — | — | 0.56 | |||||||||||||||
MSCI EAFE Index | –0.81 | 3.60 | 3.03 | 4.28 | |||||||||||||||
| Lipper International Large-Cap Core Funds Index | –3.21 | 2.68 | 2.51 | 5.98 | |||||||||||||||
Performance data quoted represents past performance, which is no guarantee of future results, and current performance may be lower or higher than the figures shown. Performance assumes that all dividends and distributions, if any, were reinvested. For the most recent month-end performance figures, please visit www.morganstanley.com/im. Investment return and principal value will fluctuate so that Portfolio shares, when redeemed, may be worth more or less than their original cost. Total returns do not reflect the deduction of taxes that a shareholder would pay on Portfolio distributions or the redemption of Portfolio shares. Returns for periods less than one year are not annualized. Performance of share classes will vary due to difference in sales charges and expenses.
(1) The MSCI EAFE Index (Europe, Australasia, Far East) is a free float-adjusted market capitalization index that is designed to measure the international equity market performance of developed markets, excluding the US & Canada. The term "free float" represents the portion of shares outstanding that are deemed to be available for purchase in the public equity markets by investors. The MSCI EAFE Index currently consists of 21 developed market country indices. The performance of the Index is listed in U.S. dollars and assumes reinvestment of net dividends. The Index is unmanaged and its returns do not include any sales charges or fees. Such costs would lower performance. It is not possible to invest directly in an index.
(2) The Lipper International Large-Cap Core Funds Index is an equally weighted performance index of the largest qualifying funds (based on net assets) in the Lipper International Large-Cap Core Funds classification. The Index, which is adjusted for capital gains distributions and income dividends, is unmanaged and should not be considered an investment. There are currently 30 funds represented in this Index. As of the date of this report, the Portfolio is in the Lipper International Large-Cap Core Funds classification.
(3) Total returns for the Portfolio reflect fees waived and expenses reimbursed, if applicable, by the Adviser. Without such waivers and reimbursements, total returns would have been lower.
(4) Commenced operations on August 4, 1989.
(5) Commenced offering on January 2, 1996.
(6) Commenced offering on June 14, 2012.
(7) Commenced offering on September 13, 2013.
(8) Commenced offering on April 30, 2015.
(9) For comparative purposes, average annual since inception returns listed for the Indexes refer to the inception date of Class I of the Portfolio, not the inception of the Index.
6
Morgan Stanley Institutional Fund, Inc.
Annual Report — December 31, 2015
Portfolio of Investments
International Equity Portfolio
Shares | Value (000) | ||||||||||
Common Stocks (97.9%) | |||||||||||
Australia (0.1%) | |||||||||||
WorleyParsons Ltd. (a) | 1,396,402 | $ | 4,646 | ||||||||
Belgium (1.5%) | |||||||||||
KBC Groep N.V. | 1,022,467 | 63,931 | |||||||||
Canada (1.5%) | |||||||||||
Barrick Gold Corp. | 5,758,833 | 42,618 | |||||||||
Turquoise Hill Resources Ltd. (b) | 8,244,142 | 20,913 | |||||||||
63,531 | |||||||||||
China (0.7%) | |||||||||||
China Petroleum & Chemical Corp. H Shares (c) | 51,808,000 | 31,094 | |||||||||
France (9.1%) | |||||||||||
AXA SA | 1,501,464 | 41,048 | |||||||||
L'Oreal SA | 412,341 | 69,373 | |||||||||
Pernod Ricard SA | 872,514 | 99,197 | |||||||||
Publicis Groupe SA | 910,182 | 60,367 | |||||||||
Sanofi | 1,382,560 | 117,968 | |||||||||
Vallourec SA (a) | 582,764 | 5,410 | |||||||||
393,363 | |||||||||||
Germany (7.3%) | |||||||||||
BASF SE | 553,262 | 42,297 | |||||||||
Bayer AG (Registered) | 805,598 | 101,071 | |||||||||
Continental AG | 216,541 | 52,558 | |||||||||
HeidelbergCement AG | 581,117 | 47,409 | |||||||||
SAP SE | 892,082 | 71,055 | |||||||||
314,390 | |||||||||||
Ireland (1.0%) | |||||||||||
CRH PLC | 1,575,134 | 45,529 | |||||||||
Italy (0.4%) | |||||||||||
Eni SpA | 1,129,757 | 16,736 | |||||||||
Japan (18.2%) | |||||||||||
Hitachi Ltd. | 11,753,000 | 66,495 | |||||||||
Hoya Corp. | 324,800 | 13,242 | |||||||||
Inpex Corp. | 5,004,000 | 49,383 | |||||||||
Japan Tobacco, Inc. | 3,492,200 | 128,224 | |||||||||
Keyence Corp. | 53,110 | 29,149 | |||||||||
Kyocera Corp. | 490,000 | 22,711 | |||||||||
Lawson, Inc. | 579,700 | 47,012 | |||||||||
Mitsubishi Estate Co., Ltd. | 2,541,000 | 52,667 | |||||||||
MS&AD Insurance Group Holdings, Inc. | 653,100 | 19,099 | |||||||||
NGK Spark Plug Co., Ltd. | 2,797,500 | 73,693 | |||||||||
Nitto Denko Corp. | 211,100 | 15,399 | |||||||||
NTT DoCoMo, Inc. | 612,800 | 12,560 | |||||||||
Sekisui House Ltd. | 1,568,700 | 26,361 | |||||||||
Sompo Japan Nipponkoa Holdings, Inc. | 2,518,200 | 82,369 | |||||||||
Sumco Corp. (a) | 1,456,100 | 10,939 | |||||||||
Sumitomo Mitsui Financial Group, Inc. | 525,751 | 19,832 | |||||||||
Sumitomo Mitsui Trust Holdings, Inc. | 1,467,999 | 5,542 | |||||||||
Toyota Motor Corp. | 1,824,100 | 111,963 | |||||||||
786,640 | |||||||||||
Shares | Value (000) | ||||||||||
Netherlands (7.4%) | |||||||||||
Akzo Nobel N.V. | 812,706 | $ | 54,284 | ||||||||
RELX N.V. | 4,076,812 | 68,555 | |||||||||
Unilever N.V. CVA | 4,549,280 | 197,100 | |||||||||
319,939 | |||||||||||
Sweden (1.1%) | |||||||||||
Nordea Bank AB | 4,414,791 | 48,173 | |||||||||
Switzerland (15.6%) | |||||||||||
Credit Suisse Group AG (Registered) (b) | 4,110,455 | 88,841 | |||||||||
Nestle SA (Registered) | 2,715,053 | 201,250 | |||||||||
Novartis AG (Registered) | 1,725,939 | 147,527 | |||||||||
Roche Holding AG (Genusschein) | 527,380 | 145,340 | |||||||||
Swisscom AG (Registered) | 87,911 | 43,719 | |||||||||
Zurich Insurance Group AG (b) | 199,008 | 50,779 | |||||||||
677,456 | |||||||||||
United Kingdom (34.0%) | |||||||||||
Admiral Group PLC | 1,626,471 | 39,561 | |||||||||
Aggreko PLC (a) | 357,177 | 4,804 | |||||||||
Aviva PLC | 8,567,119 | 64,734 | |||||||||
BG Group PLC | 2,805,763 | 40,687 | |||||||||
British American Tobacco PLC | 3,610,730 | 200,537 | |||||||||
BT Group PLC | 12,090,838 | 83,562 | |||||||||
Bunzl PLC | 2,622,246 | 72,437 | |||||||||
Experian PLC | 3,246,429 | 57,366 | |||||||||
GlaxoSmithKline PLC | 7,260,170 | 146,641 | |||||||||
Imperial Tobacco Group PLC | 2,277,616 | 119,793 | |||||||||
Lloyds Banking Group PLC | 73,404,709 | 79,007 | |||||||||
Meggitt PLC | 8,436,052 | 46,531 | |||||||||
Prudential PLC | 5,268,786 | 117,957 | |||||||||
Reckitt Benckiser Group PLC | 2,215,628 | 203,946 | |||||||||
RELX PLC | 2,631,533 | 46,137 | |||||||||
Smiths Group PLC | 2,665,815 | 36,879 | |||||||||
Travis Perkins PLC | 1,306,186 | 37,740 | |||||||||
Weir Group PLC (The) | 569,987 | 8,384 | |||||||||
Wolseley PLC | 1,167,650 | 63,472 | |||||||||
1,470,175 | |||||||||||
Total Common Stocks (Cost $3,616,959) | 4,235,603 | ||||||||||
Short-Term Investments (2.7%) | |||||||||||
Securities held as Collateral on Loaned Securities (0.4%) | |||||||||||
Investment Company (0.3%) | |||||||||||
| Morgan Stanley Institutional Liquidity Funds — Treasury Securities Portfolio — Institutional Class (See Note G) | 15,725,945 | 15,726 | |||||||||
| Face Amount (000) | |||||||||||
Repurchase Agreements (0.1%) | |||||||||||
| Barclays Capital, Inc., (0.32%, dated 12/31/15, due 1/4/16; proceeds $678; fully collateralized by a U.S. Government obligation; 2.00% due 11/30/22; valued at $692) | $ | 678 | 678 | ||||||||
The accompanying notes are an integral part of the financial statements.
7
Morgan Stanley Institutional Fund, Inc.
Annual Report — December 31, 2015
Portfolio of Investments (cont'd)
International Equity Portfolio
| Face Amount (000) | Value (000) | ||||||||||
Repurchase Agreements (cont'd) | |||||||||||
| Merrill Lynch & Co., Inc., (0.31%, dated 12/31/15, due 1/4/16; proceeds $1,971; fully collateralized by a U.S. Government agency security; 4.00% due 11/20/45; valued at $2,010) | $ | 1,971 | $ | 1,971 | |||||||
2,649 | |||||||||||
| Total Securities held as Collateral on Loaned Securities (Cost $18,375) | 18,375 | ||||||||||
Shares | |||||||||||
Investment Company (2.3%) | |||||||||||
| Morgan Stanley Institutional Liquidity Funds — Treasury Securities Portfolio — Institutional Class (See Note G) (Cost $98,466) | 98,466,221 | 98,466 | |||||||||
Total Short-Term Investments (Cost $116,841) | 116,841 | ||||||||||
| Total Investments (100.6%) (Cost $3,733,800) Including $17,215 of Securities Loaned (d)(e)(f) | 4,352,444 | ||||||||||
Liabilities in Excess of Other Assets (–0.6%) | (27,504 | ) | |||||||||
Net Assets (100.0%) | $ | 4,324,940 | |||||||||
(a) All or a portion of this security was on loan at December 31, 2015.
(b) Non-income producing security.
(c) Security trades on the Hong Kong exchange.
(d) Securities are available for collateral in connection with an open foreign currency forward exchange contract.
(e) The approximate fair value and percentage of net assets, $4,172,072,000 and 96.5%, respectively, represent the securities that have been fair valued under the fair valuation policy for international investments as described in Note A-1 within the Notes to the Financial Statements.
(f) At December 31, 2015, the aggregate cost for Federal income tax purposes is approximately $3,771,315,000. The aggregate gross unrealized appreciation is approximately $845,079,000 and the aggregate gross unrealized depreciation is approximately $263,950,000 resulting in net unrealized appreciation of approximately $581,129,000.
CVA Certificaten Van Aandelen.
Foreign Currency Forward Exchange Contract:
The Portfolio had the following foreign currency forward exchange contract open at December 31, 2015:
Counterparty | Contracts to Deliver (000) | In Exchange For (000) | Delivery Date | Unrealized Depreciation (000) | |||||||||||||||
Commonwealth Bank of Australia | JPY | 40,700,000 | $ | 332,329 | 1/20/16 | $ | (6,403 | ) | |||||||||||
JPY — Japanese Yen
Portfolio Composition*
Classification | Percentage of Total Investments | ||||||
Other** | 53.7 | % | |||||
Pharmaceuticals | 15.2 | ||||||
Tobacco | 10.4 | ||||||
Insurance | 9.6 | ||||||
Personal Products | 6.1 | ||||||
Banks | 5.0 | ||||||
Total Investments | 100.0 | %*** | |||||
* Percentages indicated are based upon total investments (excluding Securities held as Collateral on Loaned Securities) as of December 31, 2015.
** Industries and/or investment types representing less than 5% of total investments.
*** Does not include an open foreign currency forward exchange contract with unrealized depreciation of approximately $6,403,000.
The accompanying notes are an integral part of the financial statements.
8
Morgan Stanley Institutional Fund, Inc.
Annual Report — December 31, 2015
International Equity Portfolio
Statement of Assets and Liabilities | December 31, 2015 (000) | ||||||
Assets: | |||||||
Investments in Securities of Unaffiliated Issuers, at Value(1) (Cost $3,619,608) | $ | 4,238,252 | |||||
Investment in Security of Affiliated Issuer, at Value (Cost $114,192) | 114,192 | ||||||
Total Investments in Securities, at Value (Cost $3,733,800) | 4,352,444 | ||||||
Foreign Currency, at Value (Cost $1,528) | 1,520 | ||||||
Tax Reclaim Receivable | 7,511 | ||||||
Dividends Receivable | 5,504 | ||||||
Receivable for Portfolio Shares Sold | 2,614 | ||||||
Receivable from Affiliate | 2 | ||||||
Other Assets | 263 | ||||||
Total Assets | 4,369,858 | ||||||
Liabilities: | |||||||
Collateral on Securities Loaned, at Value | 18,375 | ||||||
Payable for Portfolio Shares Redeemed | 9,482 | ||||||
Payable for Advisory Fees | 8,486 | ||||||
Unrealized Depreciation on Foreign Currency Forward Exchange Contracts | 6,403 | ||||||
Payable for Sub Transfer Agency Fees — Class I | 500 | ||||||
Payable for Sub Transfer Agency Fees — Class A | 420 | ||||||
Payable for Sub Transfer Agency Fees — Class L | 9 | ||||||
Payable for Sub Transfer Agency Fees — Class C | — | @ | |||||
Payable for Shareholder Services Fees — Class A | 295 | ||||||
Payable for Distribution and Shareholder Services Fees — Class L | 6 | ||||||
Payable for Distribution and Shareholder Services Fees — Class C | — | @ | |||||
Payable for Administration Fees | 299 | ||||||
Payable for Directors' Fees and Expenses | 218 | ||||||
Payable for Custodian Fees | 181 | ||||||
Payable for Professional Fees | 17 | ||||||
Payable for Transfer Agency Fees — Class I | 6 | ||||||
Payable for Transfer Agency Fees — Class A | 4 | ||||||
Payable for Transfer Agency Fees — Class L | 1 | ||||||
Payable for Transfer Agency Fees — Class C | — | @ | |||||
Payable for Transfer Agency Fees — Class IS | 1 | ||||||
Other Liabilities | 215 | ||||||
Total Liabilities | 44,918 | ||||||
Net Assets | $ | 4,324,940 | |||||
Net Assets Consist Of: | |||||||
Paid-in-Capital | $ | 3,839,487 | |||||
Accumulated Undistributed Net Investment Income | 9,314 | ||||||
Accumulated Net Realized Loss | (135,338 | ) | |||||
Unrealized Appreciation (Depreciation) on: | |||||||
Investments | 618,644 | ||||||
Foreign Currency Forward Exchange Contracts | (6,403 | ) | |||||
Foreign Currency Translations | (764 | ) | |||||
Net Assets | $ | 4,324,940 | |||||
The accompanying notes are an integral part of the financial statements.
9
Morgan Stanley Institutional Fund, Inc.
Annual Report — December 31, 2015
International Equity Portfolio
Statement of Assets and Liabilities (cont'd) | December 31, 2015 (000) | ||||||
CLASS I: | |||||||
Net Assets | $ | 2,073,782 | |||||
| Shares Outstanding $0.001 par value shares of beneficial interest (unlimited shares authorized) (not in 000's) | 137,353,276 | ||||||
Net Asset Value, Offering and Redemption Price Per Share | $ | 15.10 | |||||
CLASS A: | |||||||
Net Assets | $ | 1,369,566 | |||||
| Shares Outstanding $0.001 par value shares of beneficial interest (unlimited shares authorized) (not in 000's) | 91,851,570 | ||||||
Net Asset Value, Redemption Price Per Share | $ | 14.91 | |||||
Maximum Sales Load | 5.25 | % | |||||
Maximum Sales Charge | $ | 0.83 | |||||
Maximum Offering Price Per Share | $ | 15.74 | |||||
CLASS L: | |||||||
Net Assets | $ | 9,053 | |||||
| Shares Outstanding $0.001 par value shares of beneficial interest (unlimited shares authorized) (not in 000's) | 608,992 | ||||||
Net Asset Value, Offering and Redemption Price Per Share | $ | 14.87 | |||||
CLASS C: | |||||||
Net Assets | $ | 372 | |||||
| Shares Outstanding $0.001 par value shares of beneficial interest (unlimited shares authorized) (not in 000's) | 25,151 | ||||||
Net Asset Value, Offering and Redemption Price Per Share | $ | 14.77 | |||||
CLASS IS: | |||||||
Net Assets | $ | 872,167 | |||||
| Shares Outstanding $0.001 par value shares of beneficial interest (unlimited shares authorized) (not in 000's) | 57,755,253 | ||||||
Net Asset Value, Offering and Redemption Price Per Share | $ | 15.10 | |||||
| (1) Including: Securities on Loan, at Value: | $ | 17,215 | |||||
@ Amount is less than $500.
The accompanying notes are an integral part of the financial statements.
10
Morgan Stanley Institutional Fund, Inc.
Annual Report — December 31, 2015
International Equity Portfolio
Statement of Operations | Year Ended December 31, 2015 (000) | ||||||
Investment Income: | |||||||
Dividends from Securities of Unaffiliated Issuers (Net of $10,159 of Foreign Taxes Withheld) | $ | 132,962 | |||||
Income from Securities Loaned — Net | 2,012 | ||||||
Dividends from Security of Affiliated Issuer (Note G) | 10 | ||||||
Total Investment Income | 134,984 | ||||||
Expenses: | |||||||
Advisory Fees (Note B) | 38,818 | ||||||
Sub Transfer Agency Fees — Class I | 2,525 | ||||||
Sub Transfer Agency Fees — Class A | 2,437 | ||||||
Sub Transfer Agency Fees — Class L | 19 | ||||||
Sub Transfer Agency Fees — Class C | — | @ | |||||
Administration Fees (Note C) | 3,882 | ||||||
Shareholder Services Fees — Class A (Note D) | 3,754 | ||||||
Distribution and Shareholder Services Fees — Class L (Note D) | 75 | ||||||
Distribution and Shareholder Services Fees — Class C (Note D) | 2 | ||||||
Custodian Fees (Note F) | 727 | ||||||
Shareholder Reporting Fees | 249 | ||||||
Registration Fees | 180 | ||||||
Directors' Fees and Expenses | 121 | ||||||
Professional Fees | 103 | ||||||
Transfer Agency Fees — Class I (Note E) | 28 | ||||||
Transfer Agency Fees — Class A (Note E) | 18 | ||||||
Transfer Agency Fees — Class L (Note E) | 4 | ||||||
Transfer Agency Fees — Class C (Note E) | 1 | ||||||
Transfer Agency Fees — Class IS (Note E) | 3 | ||||||
Pricing Fees | 8 | ||||||
Other Expenses | 79 | ||||||
Expenses Before Non Operating Expenses | 53,033 | ||||||
Bank Overdraft Expense | 5 | ||||||
Total Expenses | 53,038 | ||||||
Reimbursement of Class Specific Expenses — Class I (Note B) | (1,548 | ) | |||||
Reimbursement of Class Specific Expenses — Class A (Note B) | (341 | ) | |||||
Reimbursement of Class Specific Expenses — Class L (Note B) | (9 | ) | |||||
Reimbursement of Class Specific Expenses — Class C (Note B) | (1 | ) | |||||
Waiver of Advisory Fees (Note B) | (49 | ) | |||||
Rebate from Morgan Stanley Affiliate (Note G) | (10 | ) | |||||
Net Expenses | 51,080 | ||||||
Net Investment Income | 83,904 | ||||||
Realized Gain (Loss): | |||||||
Investments Sold | (87,600 | ) | |||||
Foreign Currency Forward Exchange Contracts | 8,538 | ||||||
Foreign Currency Transactions | (1,947 | ) | |||||
Net Realized Loss | (81,009 | ) | |||||
Change in Unrealized Appreciation (Depreciation): | |||||||
Investments | 46,563 | ||||||
Foreign Currency Forward Exchange Contracts | (5,928 | ) | |||||
Foreign Currency Translations | 246 | ||||||
Net Change in Unrealized Appreciation (Depreciation) | 40,881 | ||||||
Net Realized Loss and Change in Unrealized Appreciation (Depreciation) | (40,128 | ) | |||||
Net Increase in Net Assets Resulting from Operations | $ | 43,776 | |||||
@ Amount is less than $500.
The accompanying notes are an integral part of the financial statements.
11
Morgan Stanley Institutional Fund, Inc.
Annual Report — December 31, 2015
International Equity Portfolio
Statements of Changes in Net Assets | Year Ended December 31, 2015 (000) | Year Ended December 31, 2014 (000) | |||||||||
Increase (Decrease) in Net Assets: | |||||||||||
Operations: | |||||||||||
Net Investment Income | $ | 83,904 | $ | 118,533 | |||||||
Net Realized Gain (Loss) | (81,009 | ) | 136,668 | ||||||||
Net Change in Unrealized Appreciation (Depreciation) | 40,881 | (564,577 | ) | ||||||||
Net Increase (Decrease) in Net Assets Resulting from Operations | 43,776 | (309,376 | ) | ||||||||
Distributions from and/or in Excess of: | |||||||||||
Class I: | |||||||||||
Net Investment Income | (63,421 | ) | (81,485 | ) | |||||||
Class A: | |||||||||||
Net Investment Income | (34,301 | ) | (41,518 | ) | |||||||
Class L: | |||||||||||
Net Investment Income | (186 | ) | (213 | ) | |||||||
Class C: | |||||||||||
Net Investment Income | (7 | ) | — | ||||||||
Class IS: | |||||||||||
Net Investment Income | (23,788 | ) | (21,067 | ) | |||||||
Total Distributions | (121,703 | ) | (144,283 | ) | |||||||
Capital Share Transactions:(1) | |||||||||||
Class I: | |||||||||||
Subscribed | 249,465 | 349,891 | |||||||||
Distributions Reinvested | 60,713 | 78,325 | |||||||||
Redeemed | (821,490 | ) | (1,249,623 | ) | |||||||
Class A: | |||||||||||
Subscribed | 221,012 | 279,033 | |||||||||
Distributions Reinvested | 34,196 | 41,456 | |||||||||
Redeemed | (441,011 | ) | (112,593 | ) | |||||||
Class L: | |||||||||||
Subscribed | 1,036 | 598 | |||||||||
Distributions Reinvested | 183 | 210 | |||||||||
Redeemed | (1,712 | ) | (2,194 | ) | |||||||
Class C: | |||||||||||
Subscribed | 524 | * | — | ||||||||
Distributions Reinvested | 7 | * | — | ||||||||
Redeemed | (128 | )* | — | ||||||||
Class IS: | |||||||||||
Subscribed | 246,796 | 542,518 | |||||||||
Distributions Reinvested | 22,149 | 19,267 | |||||||||
Redeemed | (90,463 | ) | (71,791 | ) | |||||||
Net Decrease in Net Assets Resulting from Capital Share Transactions | (518,723 | ) | (124,903 | ) | |||||||
Redemption Fees | 50 | 49 | |||||||||
Total Decrease in Net Assets | (596,600 | ) | (578,513 | ) | |||||||
Net Assets: | |||||||||||
Beginning of Period | 4,921,540 | 5,500,053 | |||||||||
End of Period (Including Accumulated Undistributed Net Investment Income of $9,314 and $40,390) | $ | 4,324,940 | $ | 4,921,540 | |||||||
The accompanying notes are an integral part of the financial statements.
12
Morgan Stanley Institutional Fund, Inc.
Annual Report — December 31, 2015
International Equity Portfolio
| Statements of Changes in Net Assets (cont'd) | Year Ended December 31, 2015 (000) | Year Ended December 31, 2014 (000) | |||||||||
(1) Capital Share Transactions: | |||||||||||
Class I: | |||||||||||
Shares Subscribed | 15,470 | 20,963 | |||||||||
Shares Issued on Distributions Reinvested | 3,885 | 4,997 | |||||||||
Shares Redeemed | (51,356 | ) | (74,124 | ) | |||||||
Net Decrease in Class I Shares Outstanding | (32,001 | ) | (48,164 | ) | |||||||
Class A: | |||||||||||
Shares Subscribed | 14,515 | 17,653 | |||||||||
Shares Issued on Distributions Reinvested | 2,210 | 2,679 | |||||||||
Shares Redeemed | (28,049 | ) | (7,071 | ) | |||||||
Net Increase (Decrease) in Class A Shares Outstanding | (11,324 | ) | 13,261 | ||||||||
Class L: | |||||||||||
Shares Subscribed | 65 | 37 | |||||||||
Shares Issued on Distributions Reinvested | 12 | 13 | |||||||||
Shares Redeemed | (109 | ) | (132 | ) | |||||||
Net Decrease in Class L Shares Outstanding | (32 | ) | (82 | ) | |||||||
Class C: | |||||||||||
Shares Subscribed | 33 | * | — | ||||||||
Shares Issued on Distributions Reinvested | — | @@* | — | ||||||||
Shares Redeemed | (8 | )* | — | ||||||||
Net Increase in Class C Shares Outstanding | 25 | — | |||||||||
Class IS: | |||||||||||
Shares Subscribed | 15,745 | 32,435 | |||||||||
Shares Issued on Distributions Reinvested | 1,418 | 1,231 | |||||||||
Shares Redeemed | (5,630 | ) | (4,240 | ) | |||||||
Net Increase in Class IS Shares Outstanding | 11,533 | 29,426 | |||||||||
* For the period April 30, 2015 through December 31, 2015.
@@ Amount is less than 500 shares.
The accompanying notes are an integral part of the financial statements.
13
Morgan Stanley Institutional Fund, Inc.
Annual Report — December 31, 2015
Financial Highlights
International Equity Portfolio
Class I | |||||||||||||||||||||||
Year Ended December 31, | |||||||||||||||||||||||
Selected Per Share Data and Ratios | 2015 | 2014 | 2013 | 2012 | 2011 | ||||||||||||||||||
Net Asset Value, Beginning of Period | $ | 15.47 | $ | 16.98 | $ | 14.35 | $ | 12.25 | $ | 13.61 | |||||||||||||
Income (Loss) from Investment Operations: | |||||||||||||||||||||||
Net Investment Income† | 0.30 | 0.39 | 0.32 | 0.31 | 0.32 | ||||||||||||||||||
Net Realized and Unrealized Gain (Loss) | (0.23 | ) | (1.42 | ) | 2.59 | 2.09 | (1.37 | ) | |||||||||||||||
Total from Investment Operations | 0.07 | (1.03 | ) | 2.91 | 2.40 | (1.05 | ) | ||||||||||||||||
Distributions from and/or in Excess of: | |||||||||||||||||||||||
Net Investment Income | (0.44 | ) | (0.48 | ) | (0.28 | ) | (0.30 | ) | (0.31 | ) | |||||||||||||
Redemption Fees | 0.00 | ‡ | 0.00 | ‡ | 0.00 | ‡ | 0.00 | ‡ | 0.00 | ‡ | |||||||||||||
Net Asset Value, End of Period | $ | 15.10 | $ | 15.47 | $ | 16.98 | $ | 14.35 | $ | 12.25 | |||||||||||||
Total Return++ | 0.36 | % | (6.08 | )% | 20.39 | % | 19.60 | % | (7.63 | )% | |||||||||||||
Ratios and Supplemental Data: | |||||||||||||||||||||||
Net Assets, End of Period (Thousands) | $ | 2,073,782 | $ | 2,620,040 | $ | 3,694,164 | $ | 3,631,307 | $ | 2,959,403 | |||||||||||||
Ratio of Expenses to Average Net Assets (1) | 0.95 | %+ | 0.95 | %+ | 0.94 | %+ | 0.95 | %+ | 0.95 | %+ | |||||||||||||
Ratio of Expenses to Average Net Assets Excluding Non Operating Expenses | 0.95 | %+ | 0.95 | %+ | 0.95 | %+ | N/A | 0.95 | %+ | ||||||||||||||
Ratio of Net Investment Income to Average Net Assets (1) | 1.85 | %+ | 2.33 | %+ | 2.04 | %+ | 2.31 | %+ | 2.36 | %+ | |||||||||||||
Ratio of Rebate from Morgan Stanley Affiliates to Average Net Assets | 0.00 | %§ | 0.00 | %§ | 0.00 | %§ | 0.00 | %§ | 0.00 | %§ | |||||||||||||
Portfolio Turnover Rate | 29 | % | 29 | % | 29 | % | 23 | % | 34 | % | |||||||||||||
(1) Supplemental Information on the Ratios to Average Net Assets: | |||||||||||||||||||||||
Ratios Before Expense Limitation: | |||||||||||||||||||||||
Expenses to Average Net Assets | 1.01 | % | 1.04 | % | 0.99 | % | 0.97 | % | 0.98 | % | |||||||||||||
Net Investment Income to Average Net Assets | 1.79 | % | 2.24 | % | 1.99 | % | 2.29 | % | 2.33 | % | |||||||||||||
† Per share amount is based on average shares outstanding.
‡ Amount is less than $0.005 per share.
++ Calculated based on the net asset value as of the last business day of the period.
+ The Ratios of Expenses and Net Investment Income reflect the rebate of certain Portfolio expenses in connection with the investments in Morgan Stanley affiliates during the period. The effect of the rebate on the ratios is disclosed in the above table as "Ratio of Rebate from Morgan Stanley Affiliates to Average Net Assets."
§ Amount is less than 0.005%.
The accompanying notes are an integral part of the financial statements.
14
Morgan Stanley Institutional Fund, Inc.
Annual Report — December 31, 2015
Financial Highlights
International Equity Portfolio
Class A | |||||||||||||||||||||||
Year Ended December 31, | |||||||||||||||||||||||
Selected Per Share Data and Ratios | 2015 | 2014 | 2013 | 2012 | 2011 | ||||||||||||||||||
Net Asset Value, Beginning of Period | $ | 15.28 | $ | 16.78 | $ | 14.18 | $ | 12.11 | $ | 13.45 | |||||||||||||
Income (Loss) from Investment Operations: | |||||||||||||||||||||||
Net Investment Income† | 0.24 | 0.31 | 0.25 | 0.27 | 0.28 | ||||||||||||||||||
Net Realized and Unrealized Gain (Loss) | (0.23 | ) | (1.38 | ) | 2.59 | 2.07 | (1.34 | ) | |||||||||||||||
Total from Investment Operations | 0.01 | (1.07 | ) | 2.84 | 2.34 | (1.06 | ) | ||||||||||||||||
Distributions from and/or in Excess of: | |||||||||||||||||||||||
Net Investment Income | (0.38 | ) | (0.43 | ) | (0.24 | ) | (0.27 | ) | (0.28 | ) | |||||||||||||
Redemption Fees | 0.00 | ‡ | 0.00 | ‡ | 0.00 | ‡ | 0.00 | ‡ | 0.00 | ‡ | |||||||||||||
Net Asset Value, End of Period | $ | 14.91 | $ | 15.28 | $ | 16.78 | $ | 14.18 | $ | 12.11 | |||||||||||||
Total Return++ | (0.02 | )% | (6.43 | )% | 20.13 | % | 19.31 | % | (7.83 | )% | |||||||||||||
Ratios and Supplemental Data: | |||||||||||||||||||||||
Net Assets, End of Period (Thousands) | $ | 1,369,566 | $ | 1,576,475 | $ | 1,508,564 | $ | 1,012,956 | $ | 916,002 | |||||||||||||
Ratio of Expenses to Average Net Assets (1) | 1.30 | %+ | 1.30 | %+ | 1.22 | %+^ | 1.20 | %+ | 1.20 | %+ | |||||||||||||
Ratio of Expenses to Average Net Assets Excluding Non Operating Expenses | 1.30 | %+ | 1.30 | %+ | 1.22 | %+^ | N/A | 1.20 | %+ | ||||||||||||||
Ratio of Net Investment Income to Average Net Assets (1) | 1.48 | %+ | 1.89 | %+ | 1.60 | %+ | 2.06 | %+ | 2.11 | %+ | |||||||||||||
Ratio of Rebate from Morgan Stanley Affiliates to Average Net Assets | 0.00 | %§ | 0.00 | %§ | 0.00 | %§ | 0.00 | %§ | 0.00 | %§ | |||||||||||||
Portfolio Turnover Rate | 29 | % | 29 | % | 29 | % | 23 | % | 34 | % | |||||||||||||
(1) Supplemental Information on the Ratios to Average Net Assets: | |||||||||||||||||||||||
Ratios Before Expense Limitation: | |||||||||||||||||||||||
Expenses to Average Net Assets | 1.32 | % | 1.34 | % | 1.25 | % | 1.22 | % | 1.23 | % | |||||||||||||
Net Investment Income to Average Net Assets | 1.46 | % | 1.85 | % | 1.57 | % | 2.04 | % | 2.08 | % | |||||||||||||
† Per share amount is based on average shares outstanding.
‡ Amount is less than $0.005 per share.
++ Calculated based on the net asset value which does not reflect sales charges, if applicable, as of the last business day of the period.
+ The Ratios of Expenses and Net Investment Income reflect the rebate of certain Portfolio expenses in connection with the investments in Morgan Stanley affiliates during the period. The effect of the rebate on the ratios is disclosed in the above table as "Ratio of Rebate from Morgan Stanley Affiliates to Average Net Assets."
^ Effective September 16, 2013, the Adviser has agreed to limit the ratio of expenses to average net assets to the maximum ratio of 1.30% for Class A shares. Prior to September 16, 2013, the maximum ratio was 1.20% for Class A shares.
§ Amount is less than 0.005%.
The accompanying notes are an integral part of the financial statements.
15
Morgan Stanley Institutional Fund, Inc.
Annual Report — December 31, 2015
Financial Highlights
International Equity Portfolio
Class L | |||||||||||||||||||
Year Ended December 31, | Period from June 14, 2012^ to | ||||||||||||||||||
Selected Per Share Data and Ratios | 2015 | 2014 | 2013 | December 31, 2012 | |||||||||||||||
Net Asset Value, Beginning of Period | $ | 15.23 | $ | 16.71 | $ | 14.12 | $ | 12.36 | |||||||||||
Income (Loss) from Investment Operations: | |||||||||||||||||||
Net Investment Income (Loss)† | 0.15 | 0.24 | 0.19 | (0.07 | ) | ||||||||||||||
Net Realized and Unrealized Gain (Loss) | (0.21 | ) | (1.39 | ) | 2.55 | 2.11 | |||||||||||||
Total from Investment Operations | (0.06 | ) | (1.15 | ) | 2.74 | 2.04 | |||||||||||||
Distributions from and/or in Excess of: | |||||||||||||||||||
Net Investment Income | (0.30 | ) | (0.33 | ) | (0.15 | ) | (0.28 | ) | |||||||||||
Redemption Fees | 0.00 | ‡ | 0.00 | ‡ | 0.00 | ‡ | 0.00 | ‡ | |||||||||||
Net Asset Value, End of Period | $ | 14.87 | $ | 15.23 | $ | 16.71 | $ | 14.12 | |||||||||||
Total Return++ | (0.47 | )% | (6.91 | )% | 19.49 | % | 16.53 | %# | |||||||||||
Ratios and Supplemental Data: | |||||||||||||||||||
Net Assets, End of Period (Thousands) | $ | 9,053 | $ | 9,763 | $ | 12,072 | $ | 11,982 | |||||||||||
Ratio of Expenses to Average Net Assets (1) | 1.80 | %+ | 1.80 | %+ | 1.72 | %+^^ | 1.70 | %+* | |||||||||||
Ratio of Expenses to Average Net Assets Excluding Non Operating Expenses | 1.80 | %+ | 1.80 | %+ | 1.73 | %+^^ | N/A | ||||||||||||
Ratio of Net Investment Income (Loss) to Average Net Assets (1) | 0.97 | %+ | 1.48 | %+ | 1.24 | %+ | (0.91 | )%+* | |||||||||||
Ratio of Rebate from Morgan Stanley Affiliates to Average Net Assets | 0.00 | %§ | 0.00 | %§ | 0.00 | %§ | 0.00 | %§* | |||||||||||
Portfolio Turnover Rate | 29 | % | 29 | % | 29 | % | 23 | %# | |||||||||||
(1) Supplemental Information on the Ratios to Average Net Assets: | |||||||||||||||||||
Ratios Before Expense Limitation: | |||||||||||||||||||
Expenses to Average Net Assets | 1.89 | % | 1.89 | % | 1.78 | % | 1.70 | %* | |||||||||||
Net Investment Income (Loss) to Average Net Assets | 0.88 | % | 1.38 | % | 1.18 | % | (0.91 | )%* | |||||||||||
^ Commencement of Offering.
† Per share amount is based on average shares outstanding.
‡ Amount is less than $0.005 per share.
++ Calculated based on the net asset value as of the last business day of the period.
+ The Ratios of Expenses and Net Investment Income (Loss) reflect the rebate of certain Portfolio expenses in connection with the investments in Morgan Stanley affiliates during the period. The effect of the rebate on the ratios is disclosed in the above table as "Ratio of Rebate from Morgan Stanley Affiliates to Average Net Assets."
^^ Effective September 16, 2013, the Adviser has agreed to limit the ratio of expenses to average net assets to the maximum ratio of 1.80% for Class L shares. Prior to September 16, 2013, the maximum ratio was 1.70% for Class L shares.
§ Amount is less than 0.005%.
The accompanying notes are an integral part of the financial statements.
16
Morgan Stanley Institutional Fund, Inc.
Annual Report — December 31, 2015
Financial Highlights
International Equity Portfolio
Class C | |||||||
| Selected Per Share Data and Ratios | Period from April 30, 2015^ to December 31, 2015 | ||||||
Net Asset Value, Beginning of Period | $ | 16.70 | |||||
Loss from Investment Operations: | |||||||
Net Investment Loss† | (0.03 | ) | |||||
Net Realized and Unrealized Loss | (1.53 | ) | |||||
Total from Investment Operations | (1.56 | ) | |||||
Distributions from and/or in Excess of: | |||||||
Net Investment Income | (0.37 | ) | |||||
Redemption Fees | 0.00 | ‡ | |||||
Net Asset Value, End of Period | $ | 14.77 | |||||
Total Return++ | (9.41 | )%# | |||||
Ratios and Supplemental Data: | |||||||
Net Assets, End of Period (Thousands) | $ | 372 | |||||
Ratios of Expenses to Average Net Assets (1) | 2.05 | %+* | |||||
Ratios of Expenses to Average Net Assets Excluding Non Operating Expenses | 2.05 | %+* | |||||
Ratio of Net Investment Loss to Average Net Assets (1) | (0.27 | )%+* | |||||
Ratio of Rebate from Morgan Stanley Affiliates to Average Net Assets | 0.00 | %§* | |||||
Portfolio Turnover Rate | 29 | % | |||||
(1) Supplemental Information on the Ratios to Average Net Assets: | |||||||
Ratios Before Expense Limitation: | |||||||
Expense to Average Net Assets | 2.75 | %* | |||||
Net Investment Loss to Average Net Assets | (0.97 | )%* | |||||
^ Commencement of Offering.
† Per share amount is based on average shares outstanding.
‡ Amount is less than $0.005 per share.
++ Calculated based on the net asset value which does not reflect sales charges, if applicable, as of the last business day of the period.
+ The Ratios of Expenses and Net Investment Loss reflect the rebate of certain Portfolio expenses in connection with the investments in Morgan Stanley affiliates during the period. The effect of the rebate on the ratios is disclosed in the above table as "Ratio of Rebate from Morgan Stanley Affiliates to Average Net Assets."
§ Amount is less than 0.005%.
# Not Annualized.
* Annualized.
The accompanying notes are an integral part of the financial statements.
17
Morgan Stanley Institutional Fund, Inc.
Annual Report — December 31, 2015
Financial Highlights
International Equity Portfolio
Class IS | |||||||||||||||
Year Ended December 31, | Period from September 13, 2013^ to | ||||||||||||||
Selected Per Share Data and Ratios | 2015 | 2014 | December 31, 2013 | ||||||||||||
Net Asset Value, Beginning of Period | $ | 15.47 | $ | 16.98 | $ | 16.08 | |||||||||
Income (Loss) from Investment Operations: | |||||||||||||||
Net Investment Income (Loss)† | 0.30 | 0.40 | (0.01 | ) | |||||||||||
Net Realized and Unrealized Gain (Loss) | (0.23 | ) | (1.43 | ) | 1.19 | ||||||||||
Total from Investment Operations | 0.07 | (1.03 | ) | 1.18 | |||||||||||
Distributions from and/or in Excess of: | |||||||||||||||
Net Investment Income | (0.44 | ) | (0.48 | ) | (0.28 | ) | |||||||||
Redemption Fees | 0.00 | ‡ | 0.00 | ‡ | 0.00 | ‡ | |||||||||
Net Asset Value, End of Period | $ | 15.10 | $ | 15.47 | $ | 16.98 | |||||||||
Total Return++ | 0.40 | % | (6.07 | )% | 7.42 | %# | |||||||||
Ratios and Supplemental Data: | |||||||||||||||
Net Assets, End of Period (Thousands) | $ | 872,167 | $ | 715,262 | $ | 285,253 | |||||||||
Ratio of Expenses to Average Net Assets (1) | 0.91 | %+ | 0.91 | %+ | 0.91 | %+^^* | |||||||||
Ratio of Expenses to Average Net Assets Excluding Non Operating Expenses | 0.91 | %+ | 0.91 | %+ | 0.91 | %+^^* | |||||||||
Ratio of Net Investment Income (Loss) to Average Net Assets (1) | 1.84 | %+ | 2.36 | %+ | (0.29 | )%+* | |||||||||
Ratio of Rebate from Morgan Stanley Affiliates to Average Net Assets | 0.00 | %§ | 0.00 | %§ | 0.00 | %§* | |||||||||
Portfolio Turnover Rate | 29 | % | 29 | % | 29 | %# | |||||||||
(1) Supplemental Information on the Ratios to Average Net Assets: | |||||||||||||||
Ratios Before Expense Limitation | |||||||||||||||
Expenses to Average Net Assets | 0.91 | % | 0.91 | % | 0.91 | %* | |||||||||
Net Investment Income (Loss) to Average Net Assets | 1.84 | % | 2.36 | % | (0.29 | )%* | |||||||||
^ Commencement of Offering.
† Per share amount is based on average shares outstanding.
‡ Amount is less than $0.005 per share.
++ Calculated based on the net asset value as of the last business day of the period.
+ The Ratios of Expenses and Net Investment Income (Loss) reflect the rebate of certain Portfolio expenses in connection with the investments in Morgan Stanley affiliates during the period. The effect of the rebate on the ratios is disclosed in the above table as "Ratio of Rebate from Morgan Stanley Affiliates to Average Net Assets."
^^ Effective September 16, 2013, the Adviser has agreed to limit the ratio of expenses to average net assets to the maximum ratio of 0.91% for Class IS shares.
§ Amount is less than 0.005%.
# Not Annualized.
* Annualized.
The accompanying notes are an integral part of the financial statements.
18
Morgan Stanley Institutional Fund, Inc.
Annual Report — December 31, 2015
Notes to Financial Statements
Morgan Stanley Institutional Fund, Inc. (the "Fund") is registered under the Investment Company Act of 1940, as amended (the "Act"), as an open-end management investment company. The Fund is comprised of twenty-six separate, active, diversified and non-diversified portfolios (individually referred to as a "Portfolio", collectively as the "Portfolios"). The Fund applies investment company accounting and reporting guidance.
The accompanying financial statements relate to the International Equity Portfolio. The Portfolio's adviser, Morgan Stanley Investment Management Inc. (the "Adviser") and sub-advisers, Morgan Stanley Investment Management Limited ("MSIM") and Morgan Stanley Investment Management Company ("MSIM Company") (together, the "Sub-Advisers"), seek long-term capital appreciation by investing primarily in equity securities of non-U.S. issuers.
The Portfolio offers five classes of shares — Class I, Class A, Class L, Class C and Class IS. On April 30, 2015, the Portfolio commenced offering Class C shares and suspended offering of Class L shares. Existing Class L shareholders may invest through reinvestment of dividends and distributions.
A. Significant Accounting Policies: The following significant accounting policies are in conformity with U.S. generally accepted accounting principles ("GAAP"). Such policies are consistently followed by the Fund in the preparation of its financial statements. GAAP may require management to make estimates and assumptions that affect the reported amounts and disclosures in the financial statements. Actual results may differ from those estimates.
1. Security Valuation: (1) An equity portfolio security listed or traded on an exchange is valued at its latest reported sales price (or at the exchange official closing price if such exchange reports an official closing price), if there were no sales on a given day, the security is valued at the mean between the last reported bid and asked prices; (2) all other equity portfolio securities for which over-the-counter ("OTC") market quotations are readily available are valued at its latest reported sales price. In cases where a security is traded on more than one exchange, the security is valued on the exchange designated as the primary market; (3) when market quotations are not readily available, including circumstances under which the Adviser or Sub-Advisers determine that the closing price, last sale price or the mean between the last reported bid and asked prices are not reflective of a security's market value, portfolio securities are valued at their fair value as determined in
good faith under procedures established by and under the general supervision of the Fund's Board of Directors (the "Directors"). Occasionally, developments affecting the closing prices of securities and other assets may occur between the times at which valuations of such securities are determined (that is, close of the foreign market on which the securities trade) and the close of business of the New York Stock Exchange ("NYSE"). If developments occur during such periods that are expected to materially affect the value of such securities, such valuations may be adjusted to reflect the estimated fair value of such securities as of the close of the NYSE, as determined in good faith by the Directors or by the Adviser using a pricing service and/or procedures approved by the Directors; (4) quotations of foreign portfolio securities, other assets and liabilities and forward contracts stated in foreign currency are translated into U.S. dollar equivalents at the prevailing market rates prior to the close of the NYSE; (5) investments in mutual funds, including the Morgan Stanley Institutional Liquidity Funds, are valued at the net asset value ("NAV") as of the close of each business day; and (6) short-term debt securities with remaining maturities of 60 days or less at the time of purchase may be valued at amortized cost, unless the Adviser determines such valuation does not reflect the securities' market value, in which case these securities will be valued at their fair market value determined by the Adviser.
The Directors have responsibility for determining in good faith the fair value of the investments, and the Directors may appoint others, such as the Fund's Adviser or a valuation committee, to assist the Directors in determining fair value and to make the actual calculations pursuant to the fair valuation methodologies previously approved by the Directors. Under procedures approved by the Directors, the Fund's Adviser has formed a Valuation Committee whose members are approved by the Directors. The Valuation Committee provides administration and oversight of the Fund's valuation policies and procedures, which are reviewed at least annually by the Directors. These procedures allow the Fund to utilize independent pricing services, quotations from securities and financial instrument dealers, and other market sources to determine fair value.
The Fund has procedures to determine the fair value of securities and other financial instruments for which market prices are not readily available. Under these
19
Morgan Stanley Institutional Fund, Inc.
Annual Report — December 31, 2015
Notes to Financial Statements (cont'd)
procedures, the Valuation Committee convenes on a regular and ad hoc basis to review such securities and considers a number of factors, including valuation methodologies and significant unobservable valuation inputs, when arriving at fair value. The Valuation Committee may employ a market-based approach which may use related or comparable assets or liabilities, recent transactions, market multiples, book values, and other relevant information for the investment to determine the fair value of the investment. An income-based valuation approach may also be used in which the anticipated future cash flows of the investment are discounted to calculate fair value. Discounts may also be applied due to the nature or duration of any restrictions on the disposition of the investments. Due to the inherent uncertainty of valuations of such investments, the fair values may differ significantly from the values that would have been used had an active market existed. The Valuation Committee employs various methods for calibrating these valuation approaches including a regular review of valuation methodologies, key inputs and assumptions, transactional back-testing or disposition analysis, and reviews of any related market activity.
2. Fair Value Measurement: Financial Accounting Standards Board ("FASB") Accounting Standards CodificationTM ("ASC") 820, "Fair Value Measurement" ("ASC 820"), defines fair value as the value that the Fund would receive to sell an investment or pay to transfer a liability in a timely transaction with an independent buyer in the principal market, or in the absence of a principal market the most advantageous market for the investment or liability. ASC 820 establishes a three-tier hierarchy to distinguish between (1) inputs that reflect the assumptions market participants would use in valuing an asset or liability developed based on market data obtained from sources independent of the reporting entity (observable inputs) and (2) inputs that reflect the reporting entity's own assumptions about the assumptions market participants would use in valuing an asset or liability developed based on the best information available in the circumstances (unobservable inputs) and to establish classification of fair value measurements for disclosure purposes. Various inputs are used in determining the value of the Fund's investments. The inputs are summarized in the three broad levels listed below.
• Level 1 – unadjusted quoted prices in active markets for identical investments
• Level 2 – other significant observable inputs (including quoted prices for similar investments, interest rates, prepayment speeds, credit risk, etc.)
• Level 3 – significant unobservable inputs including the Fund's own assumptions in determining the fair value of investments. Factors considered in making this determination may include, but are not limited to, information obtained by contacting the issuer, analysts, or the appropriate stock exchange (for exchange-traded securities), analysis of the issuer's financial statements or other available documents and, if necessary, available information concerning other securities in similar circumstances
The inputs or methodology used for valuing securities are not necessarily an indication of the risk associated with investing in those securities and the determination of the significance of a particular input to the fair value measurement in its entirety requires judgment and considers factors specific to each security.
The following is a summary of the inputs used to value the Portfolio's investments as of December 31, 2015.
Investment Type | Level 1 Unadjusted quoted prices (000) | Level 2 Other significant observable inputs (000) | Level 3 Significant unobservable inputs (000) | Total (000) | |||||||||||||||
Assets: | |||||||||||||||||||
Common Stocks | |||||||||||||||||||
Aerospace & Defense | $ | — | $ | 46,531 | $ | — | $ | 46,531 | |||||||||||
Auto Components | — | 126,251 | — | 126,251 | |||||||||||||||
Automobiles | — | 111,963 | — | 111,963 | |||||||||||||||
Banks | — | 216,485 | — | 216,485 | |||||||||||||||
Beverages | — | 99,197 | — | 99,197 | |||||||||||||||
Capital Markets | — | 88,841 | — | 88,841 | |||||||||||||||
Chemicals | — | 111,980 | — | 111,980 | |||||||||||||||
| Commercial Services & Supplies | — | 4,804 | — | 4,804 | |||||||||||||||
Construction Materials | — | 92,938 | — | 92,938 | |||||||||||||||
| Diversified Telecommunication Services | — | 127,281 | — | 127,281 | |||||||||||||||
| Electronic Equipment, Instruments & Components | — | 118,355 | — | 118,355 | |||||||||||||||
| Energy Equipment & Services | — | 4,646 | — | 4,646 | |||||||||||||||
| Food & Staples Retailing | — | 47,012 | — | 47,012 | |||||||||||||||
Food Products | — | 201,250 | — | 201,250 | |||||||||||||||
| Health Care Equipment & Supplies | — | 13,242 | — | 13,242 | |||||||||||||||
Household Durables | — | 26,361 | — | 26,361 | |||||||||||||||
20
Morgan Stanley Institutional Fund, Inc.
Annual Report — December 31, 2015
Notes to Financial Statements (cont'd)
Investment Type | Level 1 Unadjusted quoted prices (000) | Level 2 Other significant observable inputs (000) | Level 3 Significant unobservable inputs (000) | Total (000) | |||||||||||||||
Common Stocks (cont'd) | |||||||||||||||||||
Household Products | $ | — | $ | 203,946 | $ | — | $ | 203,946 | |||||||||||
| Industrial Conglomerates | — | 36,879 | — | 36,879 | |||||||||||||||
Insurance | — | 415,547 | — | 415,547 | |||||||||||||||
Machinery | — | 13,794 | — | 13,794 | |||||||||||||||
Media | — | 175,059 | — | 175,059 | |||||||||||||||
Metals & Mining | 63,531 | — | — | 63,531 | |||||||||||||||
| Oil, Gas & Consumable Fuels | — | 137,900 | — | 137,900 | |||||||||||||||
Personal Products | — | 266,473 | — | 266,473 | |||||||||||||||
Pharmaceuticals | — | 658,547 | — | 658,547 | |||||||||||||||
Professional Services | — | 57,366 | — | 57,366 | |||||||||||||||
| Real Estate Management & Development | — | 52,667 | — | 52,667 | |||||||||||||||
| Semiconductors & Semiconductor Equipment | — | 10,939 | — | 10,939 | |||||||||||||||
Software | — | 71,055 | — | 71,055 | |||||||||||||||
Tobacco | — | 448,554 | — | 448,554 | |||||||||||||||
| Trading Companies & Distributors | — | 173,649 | — | 173,649 | |||||||||||||||
| Wireless Telecommunication Services | — | 12,560 | — | 12,560 | |||||||||||||||
| Total Common Stocks | 63,531 | 4,172,072 | — | 4,235,603 | |||||||||||||||
Short-Term Investments | |||||||||||||||||||
Investment Company | 114,192 | — | — | 114,192 | |||||||||||||||
| Repurchase Agreements | — | 2,649 | — | 2,649 | |||||||||||||||
| Total Short-Term Investments | 114,192 | 2,649 | — | 116,841 | |||||||||||||||
Total Assets | 177,723 | 4,174,721 | — | 4,352,444 | |||||||||||||||
Liabilities: | |||||||||||||||||||
| Foreign Currency Forward Exchange Contract | — | (6,403 | ) | — | (6,403 | ) | |||||||||||||
Total | $ | 177,723 | $ | 4,168,318 | $ | — | $ | 4,346,041 | |||||||||||
Transfers between investment levels may occur as the markets fluctuate and/or the availability of data used in an investment's valuation changes. The Portfolio recognizes transfers between the levels as of the end of the period. As of December 31, 2015, the Portfolio did not have any investments transfer between investment levels.
3. Repurchase Agreements: The Portfolio may enter into repurchase agreements under which the Portfolio lends cash and takes possession of securities with an agreement that the counterparty will repurchase such securities. In connection with transactions in repurchase agreements, a bank as custodian for the Portfolio takes possession of the underlying securities which are held as collateral, with a
market value at least equal to the amount of the repurchase transaction, including principal and accrued interest. To the extent that any repurchase transaction exceeds one business day, the value of the collateral is marked-to-market on a daily basis to determine that the value of the collateral does not decrease below the repurchase price plus accrued interest as earned. If such a decrease occurs, additional collateral will be requested and, when received, will be added to the account to maintain full collateralization. In the event of default on the obligation to repurchase, the Portfolio has the right to liquidate the collateral and apply the proceeds in satisfaction of the obligation. In the event of default or bankruptcy by the counterparty to the agreement, realization of the collateral proceeds may be subject to cost and delays. The Portfolio, along with other affiliated investment companies, may utilize a joint trading account for the purpose of entering into repurchase agreements.
4. Foreign Currency Translation and Foreign Investments: The books and records of the Portfolio are maintained in U.S. dollars. Foreign currency amounts are translated into U.S. dollars as follows:
– investments, other assets and liabilities at the prevailing rate of exchange on the valuation date;
– investment transactions and investment income at the prevailing rates of exchange on the dates of such transactions.
Although the net assets of the Portfolio are presented at the foreign exchange rates and market values at the close of the period, the Portfolio does not isolate that portion of the results of operations arising as a result of changes in the foreign exchange rates from the fluctuations arising from changes in the market prices of securities held at period end. Similarly, the Portfolio does not isolate the effect of changes in foreign exchange rates from the fluctuations arising from changes in the market prices of securities sold during the period. Accordingly, realized and unrealized foreign currency gains (losses) on investments in securities are included in the reported net realized and unrealized gains (losses) on investment transactions and balances. However, pursuant to U.S. Federal income tax regulations, gains and losses from certain foreign currency transactions and the foreign currency portion of gains and losses realized on sales and maturities of foreign denominated debt securities are treated as ordinary income for U.S. Federal income tax purposes.
21
Morgan Stanley Institutional Fund, Inc.
Annual Report — December 31, 2015
Notes to Financial Statements (cont'd)
Net realized gains (losses) on foreign currency transactions represent net foreign exchange gains (losses) from foreign currency forward exchange contracts, disposition of foreign currencies, currency gains (losses) realized between the trade and settlement dates on securities transactions, and the difference between the amount of investment income and foreign withholding taxes recorded on the Portfolio's books and the U.S. dollar equivalent amounts actually received or paid. Net unrealized currency gains (losses) from valuing foreign currency denominated assets and liabilities at period end exchange rates are reflected as a component of unrealized appreciation (depreciation) in the Statement of Assets and Liabilities. The change in unrealized currency gains (losses) on foreign currency translations for the period is reflected in the Statement of Operations.
Foreign security and currency transactions may involve certain considerations and risks not typically associated with those of U.S. dollar denominated transactions as a result of, among other factors, fluctuations of exchange rates in relation to the U.S. dollar, the possibility of lower levels of governmental supervision and regulation of foreign securities markets and the possibility of political or economic instability.
Governmental approval for foreign investments may be required in advance of making an investment under certain circumstances in some countries, and the extent of foreign investments in domestic companies may be subject to limitation in other countries. Foreign ownership limitations also may be imposed by the charters of individual companies to prevent, among other concerns, violations of foreign investment limitations. As a result, an additional class of shares (identified as "Foreign" in the Portfolio of Investments) may be created and offered for investment. The "local" and "foreign shares" market values may differ. In the absence of trading of the foreign shares in such markets, the Portfolio values the foreign shares at the closing exchange price of the local shares.
5. Derivatives: The Portfolio may, but is not required to, use derivative instruments for a variety of purposes, including hedging, risk management, portfolio management or to earn income. Derivatives are financial instruments whose value is based, in part, on the value of an underlying asset, interest rate, index or financial instrument. Prevailing interest rates and volatility levels, among other things, also affect the value of derivative instruments.
A derivative instrument often has risks similar to its underlying asset and may have additional risks, including imperfect correlation between the value of the derivative and the underlying asset, risks of default by the counterparty to certain transactions, magnification of losses incurred due to changes in the market value of the securities, instruments, indices or interest rates to which the derivative instrument relates, risks that the transactions may not be liquid and risks arising from margin requirements. The use of derivatives involves risks that are different from, and possibly greater than, the risks associated with other portfolio investments. Derivatives may involve the use of highly specialized instruments that require investment techniques and risk analyses different from those associated with other portfolio investments. All of the Portfolio's holdings, including derivative instruments, are marked-to-market each day with the change in value reflected in unrealized appreciation (depreciation). Upon disposition, a realized gain or loss is recognized.
Certain derivative transactions may give rise to a form of leverage. Leverage magnifies the potential for gain and the risk of loss. Leverage associated with derivative transactions may cause the Portfolio to liquidate portfolio positions when it may not be advantageous to do so to satisfy its obligations or to meet earmarking or segregation requirements, pursuant to applicable Securities and Exchange Commission rules and regulations, or may cause the Portfolio to be more volatile than if the Portfolio had not been leveraged. Although the Adviser and/or Sub-Adviser seek to use derivatives to further the Portfolio's investment objectives, there is no assurance that the use of derivatives will achieve this result.
Following is a description of the derivative instruments and techniques that the Portfolio used during the period and their associated risks:
Foreign Currency Forward Exchange Contracts: In connection with its investments in foreign securities, the Portfolio also entered into contracts with banks, brokers or dealers to purchase or sell securities or foreign currencies at a future date. A foreign currency forward exchange contract ("currency contract") is a negotiated agreement between the contracting parties to exchange a specified amount of currency at a specified future time at a specified rate. The rate can be higher or lower than the spot rate between the currencies that are the subject of the contract. Currency contracts may be used to protect against
22
Morgan Stanley Institutional Fund, Inc.
Annual Report — December 31, 2015
Notes to Financial Statements (cont'd)
uncertainty in the level of future foreign currency exchange rates or to gain or modify exposure to a particular currency. To the extent hedged by the use of currency contracts, the precise matching of the currency contract amounts and the value of the securities involved will not generally be possible because the future value of such securities in foreign currencies will change as a consequence of market movements in the value of those securities between the date on which the contract is entered into and the date it matures. Furthermore, such transactions may reduce or preclude the opportunity for gain if the value of the currency should move in the direction opposite to the position taken. There is additional risk to the extent that currency contracts create exposure to currencies in which the Portfolio's securities are not denominated. Unanticipated changes in currency prices may result in poorer overall performance for the Portfolio than if it had not entered into such contracts. The use of currency contracts involves the risk of loss from the insolvency or bankruptcy of the counterparty to the contract or the failure of the counterparty to make payments or otherwise comply with the terms of the contract. A currency contract is marked-to-market daily and the change in market value is recorded by the Portfolio as unrealized gain or loss. The Portfolio records realized gains (losses) when the currency contract is closed equal to the difference between the value of the currency contract at the time it was opened and the value at the time it was closed.
FASB ASC 815, "Derivatives and Hedging" ("ASC 815"), is intended to improve financial reporting about derivative instruments by requiring enhanced disclosures to enable investors to better understand how and why the Portfolio uses derivative instruments, how these derivative instruments are accounted for and their effects on the Portfolio's financial position and results of operations.
The following table sets forth the fair value of the Portfolio's derivative contracts by primary risk exposure as of December 31, 2015.
| Liability Derivatives Statement of Assets and Liabilities Location | Primary Risk Exposure | Value (000) | |||||||||||||
| Foreign Currency Forward Exchange Contract | Unrealized Depreciation on Foreign Currency Forward Exchange Contracts | Currency Risk | $ | (6,403 | ) | ||||||||||
The following tables set forth by primary risk exposure the Portfolio's realized gains (losses) and change in unrealized appreciation (depreciation) by type of derivative contract for the year ended December 31, 2015 in accordance with ASC 815.
Realized Gain (Loss) | |||||||||||
Primary Risk Exposure | Derivative Type | Value (000) | |||||||||
Currency Risk | Foreign Currency Forward Exchange Contracts | $ | 8,538 | ||||||||
Change in Unrealized Appreciation (Depreciation) | |||||||||||
Primary Risk Exposure | Derivative Type | Value (000) | |||||||||
Currency Risk | Foreign Currency Forward Exchange Contracts | $ | (5,928 | ) | |||||||
At December 31, 2015, the Portfolio's derivative assets and liabilities are as follows:
| Gross Amounts of Assets and Liabilities Presented in the Statement of Assets and Liabilities | |||||||||||
Derivatives | Assets(a) (000) | Liabilities(a) (000) | |||||||||
Foreign Currency Forward Exchange Contract | $ | — | $ | (6,403 | ) | ||||||
(a) Absent an event of default or early termination, OTC derivative assets and liabilities are presented gross and not offset in the Statement of Assets and Liabilities.
The Portfolio typically enters into International Swaps and Derivatives Association, Inc. Master Agreements ("ISDA Master Agreements") or similar master agreements (collectively, "Master Agreements") with its contract counterparties for certain OTC derivatives in order to, among other things, reduce its credit risk to counterparties. ISDA Master Agreements include provisions for general obligations, representations, collateral and events of default or termination. Under an ISDA Master Agreement, the Portfolio typically may offset with the counterparty certain OTC derivative financial instruments' payables and/or receivables with collateral held and/or posted and create one single net payment (close-out netting) in the event of default, termination and/or potential deterioration in the credit quality of the counterparty. Various Master Agreements govern the terms of certain transactions with counterparties, including transactions such as swap, forward, repurchase and reverse repurchase agreements. These Master Agreements typically attempt to reduce the counterparty risk associated with such transactions by specifying credit protection mechanisms and providing standardization that improves legal certainty. Cross-termination provisions under Master Agreements typically provide that a default in connection with one transaction between the Portfolio and a
23
Morgan Stanley Institutional Fund, Inc.
Annual Report — December 31, 2015
Notes to Financial Statements (cont'd)
counterparty gives the non-defaulting party the right to terminate any other transactions in place with the defaulting party to create one single net payment due to/due from the defaulting party and may be a feature in certain Master Agreements. In the event the Portfolio exercises its right to terminate a Master Agreement after a counterparty experiences a termination event as defined in the Master Agreement, the return of collateral with market value in excess of the Portfolio's net liability may be delayed or denied.
The following table presents derivative financial instruments that are subject to enforceable netting arrangements as of December 31, 2015.
Gross Amounts Not Offset in the Statement of Assets and Liabilities | |||||||||||||||||||
Counterparty | Gross Liability Derivatives Presented in Statement of Assets and Liabilities (000) | Financial Instrument (000) | Collateral Pledged (000) | Net Amount (not less than $0) (000) | |||||||||||||||
Commonwealth Bank of Australia | $ | 6,403 | $ | — | $ | — | $ | 6,403 | |||||||||||
For the year ended December 31, 2015, the approximate average monthly amount outstanding for each derivative type is as follows:
Foreign Currency Forward Exchange Contracts: | |||||||
Average monthly principal amount | $ | 377,206,000 | |||||
6. Securities Lending: The Portfolio lends securities to qualified financial institutions, such as broker-dealers, to earn additional income. Any increase or decrease in the fair value of the securities loaned that might occur and any interest earned or dividends declared on those securities during the term of the loan would remain in the Portfolio. The Portfolio would receive cash or securities as collateral in an amount equal to or exceeding 100% of the current fair value of the loaned securities. The collateral is marked-to-market daily by State Street Bank and Trust Company ("State Street"), the securities lending agent, to ensure that a minimum of 100% collateral coverage is maintained.
Based on pre-established guidelines, the securities lending agent invests any cash collateral that is received in an
affiliated money market portfolio and repurchase agreements. Securities lending income is generated from the earnings on the invested collateral and borrowing fees, less any rebates owed to the borrowers and compensation to the lending agent, and is recorded as "Income from Securities Loaned — Net" in the Portfolio's Statement of Operations. Risks in securities lending transactions are that a borrower may not provide additional collateral when required or return the securities when due, and that the value of the short-term investments will be less than the amount of cash collateral plus any rebate that is required to be returned to the borrower.
The Portfolio has the right under the lending agreement to recover the securities from the borrower on demand.
The following table presents financial instruments that are subject to enforceable netting arrangements as of December 31, 2015.
Gross Amounts Not Offset in the Statement of Assets and Liabilities | |||||||||||||||
| Gross Asset Amounts Presented in Statement of Assets and Liabilities (000) | Financial Instrument (000) | Collateral Received (000) | Net Amount (not less than $0) (000) | ||||||||||||
| $ | 17,215 | (b) | $ | — | $ | 17,215 | (c)(d) | $ | 0 | ||||||
(b) Represents market value of loaned securities at period end.
(c) The Portfolio received cash collateral of approximately $18,375,000, of which was subsequently invested in Repurchase Agreements and Morgan Stanley Institutional Liquidity Funds as reported in the Portfolio of Investments.
(d) The actual collateral received is greater than the amount shown here due to overcollateralization.
The Portfolio has adopted the disclosure provisions of FASB Accounting Standards Update No. 2014-11 ("ASU No. 2014-11"), "Transfers & Servicing (Topic 860): Repurchase-to-Maturity Transactions, Repurchase Financings, and Disclosures". ASU No. 2014-11 is intended to provide increased transparency about the types of collateral pledged in securities lending transactions and other similar transactions that are accounted for as secured borrowing.
24
Morgan Stanley Institutional Fund, Inc.
Annual Report — December 31, 2015
Notes to Financial Statements (cont'd)
The following table displays a breakdown of transactions accounted for as secured borrowings, the gross obligations by class of collateral pledged, and the remaining contractual maturity of those transactions as of December 31, 2015.
Remaining Contractual Maturity of the Agreements As of December 31, 2015 | |||||||||||||||||||||||
| Overnight and Continuous (000) | <30 days (000) | Between 30 & 90 days (000) | >90 days (000) | Total (000) | |||||||||||||||||||
Securities Lending Transactions | |||||||||||||||||||||||
Common Stocks | $ | 18,375 | $ | — | $ | — | $ | — | $ | 18,375 | |||||||||||||
Total Borrowings | $ | 18,375 | $ | — | $ | — | $ | — | $ | 18,375 | |||||||||||||
Gross amount of recognized liabilities for securities lending transactions | $ | 18,375 | |||||||||||||||||||||
7. Redemption Fees: The Portfolio will assess a 2% redemption fee on Class I shares, Class A shares, Class L shares, Class C shares and Class IS shares, which is paid directly to the Portfolio, for shares redeemed or exchanged within thirty days of purchase, subject to certain exceptions. The redemption fee is designed to protect the Portfolio and its remaining shareholders from the effects of short-term trading. These fees, if any, are included in the Statements of Changes in Net Assets.
8. Indemnifications: The Fund enters into contracts that contain a variety of indemnifications. The Fund's maximum exposure under these arrangements is unknown. However, the Fund has not had prior claims or losses pursuant to these contracts and expects the risk of loss to be remote.
9. Dividends and Distributions to Shareholders: Dividend income and distributions to shareholders are recorded on the ex-dividend date. Dividends from net investment income, if any, are declared and paid annually. Net realized capital gains, if any, are distributed at least annually.
10. Security Transactions, Income and Expenses: Security transactions are accounted for on the trade date (date the order to buy or sell is executed). Realized gains and losses on the sale of investment securities are determined on the specific identified cost method. Dividend income and other distributions are recorded on the ex-dividend date (except for certain foreign dividends which may be recorded as soon as the Portfolio is informed of such dividends) net of applicable withholding taxes. Interest income is recognized on the accrual basis except where collection is in doubt. Discounts are accreted and premiums are amortized over the life of the respective securities. Most expenses of the Fund can be directly attributed to a particular Portfolio. Expenses which cannot be directly attributed are apportioned among the Portfolios based upon relative net assets or other appropriate methods. Income,
expenses (other than class specific expenses -distribution and shareholder services, transfer agency and sub transfer agency fees) and realized and unrealized gains or losses are allocated to each class of shares based upon their relative net assets.
B. Advisory/Sub-Advisory Fees: The Adviser, a wholly-owned subsidiary of Morgan Stanley, provides the Portfolio with advisory services under the terms of an Investment Advisory Agreement, paid quarterly, at the annual rate based on the daily net assets as follows:
| First $10 billion | Over $10 billion | ||||||
| 0.80 | % | 0.75 | % | ||||
For the year ended December 31, 2015, the advisory fee rate (net of waivers/rebate) was equivalent to an annual effective rate of 0.80% of the Portfolio's average daily net assets.
The Adviser has agreed to reduce its advisory fee and/or reimburse the Portfolio so that total annual portfolio operating expenses, excluding certain investment related expenses, taxes, interest and other extraordinary expenses (including litigation), will not exceed 0.95% for Class I shares, 1.30% for Class A shares, 1.80% for Class L shares, 2.05% for Class C shares and 0.91% for Class IS shares. The fee waivers and/or expense reimbursements will continue for at least one year from the date of the Portfolio's prospectus or until such time as the Directors act to discontinue all or a portion of such waivers and/or reimbursements when they deem such action is appropriate. For the year ended December 31, 2015, approximately $49,000 of advisory fees were waived and approximately $1,899,000 of other expenses were reimbursed by the Adviser pursuant to this arrangement.
The Adviser has entered into a Sub-Advisory Agreement with the Sub-Advisers, each a wholly-owned subsidiary of Morgan Stanley. The Sub-Advisers provide the Portfolio with advisory services subject to the overall supervision of the Adviser and the Fund's Officers and Directors. The Adviser pays the Sub-Advisers on a monthly basis a portion of the net advisory fees the Adviser receives from the Portfolio.
25
Morgan Stanley Institutional Fund, Inc.
Annual Report — December 31, 2015
Notes to Financial Statements (cont'd)
C. Administration Fees: The Adviser also serves as Administrator to the Fund and provides administrative services pursuant to an Administration Agreement for an annual fee, accrued daily and paid monthly, of 0.08% of the Portfolio's average daily net assets.
Under a Sub-Administration Agreement between the Administrator and State Street, State Street provides certain administrative services to the Fund. For such services, the Administrator pays State Street a portion of the fee the Administrator receives from the Portfolio.
D. Distribution and Shareholder Services Fees: Morgan Stanley Distribution, Inc. ("MSDI" or the "Distributor"), a wholly-owned subsidiary of the Adviser and Sub-Advisers and an indirect subsidiary of Morgan Stanley, serves as the Fund's Distributor of Portfolio shares pursuant to a Distribution Agreement. The Fund has adopted a Shareholder Services Plan with respect to Class A shares pursuant to Rule 12b-1 under the Act. Under the Shareholder Services Plan, the Portfolio pays the Distributor a shareholder services fee, accrued daily and paid monthly, at an annual rate of 0.25% of the Portfolio's average daily net assets attributable to Class A shares.
The Fund has adopted a Distribution and Shareholder Services Plan with respect to Class L shares pursuant to Rule 12b-1 under the Act. Under the Distribution and Shareholder Services Plan, the Portfolio pays the Distributor a distribution fee, accrued daily and paid monthly, at an annual rate of 0.50% and a shareholder services fee, accrued daily and paid monthly, at an annual rate of 0.25% of the Portfolio's average daily net assets attributable to Class L shares.
The Fund has adopted a Distribution and Shareholder Services Plan with respect to Class C shares pursuant to Rule 12b-1 under the Act. Under the Distribution and Shareholder Services Plan, the Portfolio pays the Distributor a distribution fee, accrued daily and paid monthly, at an annual rate of 0.75% and a shareholder services fee, accrued daily and paid monthly, at an annual rate of 0.25% of the Portfolio's average daily net assets attributable to Class C shares.
The distribution and shareholder services fees are used to support the expenses associated with servicing and maintaining accounts. The Distributor may compensate other parties for providing shareholder support services to investors who purchase Class A, Class L and Class C shares.
E. Dividend Disbursing and Transfer Agent: The Fund's dividend disbursing and transfer agent is Boston Financial
Data Services, Inc. ("BFDS"). Pursuant to a Transfer Agency Agreement, the Fund pays BFDS a fee based on the number of classes, accounts and transactions relating to the Portfolios of the Fund.
F. Custodian Fees: State Street (the "Custodian") serves as Custodian for the Fund in accordance with a Custodian Agreement. The Custodian holds cash, securities, and other assets of the Fund as required by the Act. Custody fees are payable monthly based on assets held in custody, investment purchases and sales activity and account maintenance fees, plus reimbursement for certain out-of-pocket expenses.
G. Security Transactions and Transactions with Affiliates: For the year ended December 31, 2015, purchases and sales of investment securities for the Portfolio, other than long-term U.S. Government securities and short-term investments, were approximately $1,368,250,000 and $1,853,410,000, respectively. There were no purchases and sales of long-term U.S. Government securities for the year ended December 31, 2015.
The Portfolio invests in the Institutional Class of the Morgan Stanley Institutional Liquidity Funds — Treasury Securities Portfolio (the "Liquidity Funds"), an open-end management investment company managed by the Adviser, both directly and as a portion of the securities held as collateral on loaned securities. Advisory fees paid by the Portfolio are reduced by an amount equal to its pro-rata share of the advisory and administration fees paid by the Portfolio due to its investment in the Liquidity Funds. For the year ended December 31, 2015, advisory fees paid were reduced by approximately $10,000 relating to the Portfolio's investment in the Liquidity Funds.
A summary of the Portfolio's transactions in shares of the Liquidity Funds during the year ended December 31, 2015 is as follows:
| Value December 31, 2014 (000) | Purchases at Cost (000) | Sales (000) | Dividend Income (000) | Value December 31, 2015 (000) | |||||||||||||||
| $ | 175,317 | $ | 1,173,992 | $ | 1,235,117 | $ | 10 | $ | 114,192 | ||||||||||
The Portfolio has an unfunded Deferred Compensation Plan (the "Compensation Plan"), which allows each independent Director to defer payment of all, or a portion, of the fees he or she receives for serving on the Board of Directors. Each eligible Director generally may elect to have the deferred amounts credited with a return equal to the total return on one or more of the Morgan Stanley funds that are offered as investment options under the Compensation Plan. Appreciation/depreciation and distributions received from these investments are recorded
26
Morgan Stanley Institutional Fund, Inc.
Annual Report — December 31, 2015
Notes to Financial Statements (cont'd)
with an offsetting increase/decrease in the deferred compensation obligation and do not affect the NAV of the Portfolio.
H. Federal Income Taxes: It is the Portfolio's intention to continue to qualify as a regulated investment company and distribute all of its taxable and tax-exempt income. Accordingly, no provision for Federal income taxes is required in the financial statements.
The Portfolio may be subject to taxes imposed by countries in which it invests. Such taxes are generally based on income and/or capital gains earned or repatriated. Taxes are accrued based on net investment income, net realized gains and net unrealized appreciation as such income and/or gains are earned. Taxes may also be based on transactions in foreign currency and are accrued based on the value of investments denominated in such currency.
FASB ASC 740-10, "Income Taxes — Overall", sets forth a minimum threshold for financial statement recognition of the benefit of a tax position taken or expected to be taken in a tax return. Management has concluded there are no significant uncertain tax positions that would require recognition in the financial statements. If applicable, the Portfolio recognizes interest accrued related to unrecognized tax benefits in "Interest Expense" and penalties in "Other Expenses" in the Statement of Operations. The Portfolio files tax returns with the U.S. Internal Revenue Service, New York and various states. Generally, each of the tax years in the four-year period ended December 31, 2015, remains subject to examination by taxing authorities.
The tax character of distributions paid may differ from the character of distributions shown in the Statements of Changes in Net Assets due to short-term capital gains being treated as ordinary income for tax purposes. The tax character of distributions paid during fiscal 2015 and 2014 was as follows:
| 2015 Distributions Paid From: | 2014 Distributions Paid From: | ||||||||||||||
| Ordinary Income (000) | Long-Term Capital Gain (000) | Ordinary Income (000) | Long-Term Capital Gain (000) | ||||||||||||
| $ | 121,703 | $ | — | $ | 144,283 | $ | — | ||||||||
The amount and character of income and gains to be distributed are determined in accordance with income tax regulations which may differ from GAAP. These book/tax differences are either considered temporary or permanent in nature.
Temporary differences are primarily due to differing book and tax treatments in the timing of the recognition of gains (losses)
on certain investment transactions and the timing of the deductibility of certain expenses.
Permanent differences, primarily due to differing treatments of gains (losses) related to foreign currency transactions and basis adjustments on certain equity securities designated as passive foreign investment companies, resulted in the following reclassifications among the components of net assets at December 31, 2015:
| Accumulated Undistributed Net Investment Income (000) | Accumulated Net Realized Loss (000) | Paid-in-Capital (000) | |||||||||
| $ | 6,723 | $ | (6,723 | ) | $ | — | |||||
At December 31, 2015, the components of distributable earnings for the Portfolio on a tax basis were as follows:
| Undistributed Ordinary Income (000) | Undistributed Long-Term Capital Gain (000) | ||||||
| $ | 4,435 | $ | — | ||||
At December 31, 2015, the Portfolio had available for Federal income tax purposes unused short term and long term capital losses of approximately $20,709,000 and $60,377,000, respectively, that do not have an expiration date.
In addition, at December 31, 2015, the Portfolio had available for Federal income tax purposes unused capital losses which will expire on the indicated dates:
| Amount (000) | Expiration* | ||||||
| $ | 10,001 | December 31, 2016 | |||||
| 8,116 | December 31, 2017 | ||||||
* Includes capital losses acquired from Morgan Stanley International Value Equity Fund that may be subject to limitation under IRC Section 382 in future years, reducing the total carryforwad available.
To the extent that capital loss carryforwards are used to offset any future capital gains realized during the carryover period as provided by U.S. Federal income tax regulations, no capital gains tax liability will be incurred by the Portfolio for gains realized and not distributed. To the extent that capital gains are offset, such gains will not be distributed to the shareholders.
I. Other: At December 31, 2015, the Portfolio had record owners of 10% or greater. Investment activities of these shareholders could have a material impact on the Portfolio. The aggregate percentage of such owners was 43.4%.
27
Morgan Stanley Institutional Fund, Inc.
Annual Report — December 31, 2015
Report of Independent Registered Public Accounting Firm
To the Shareholders and Board of Directors of
Morgan Stanley Institutional Fund, Inc. —
International Equity Portfolio
We have audited the accompanying statement of assets and liabilities, including the portfolio of investments, of International Equity Portfolio (one of the portfolios constituting Morgan Stanley Institutional Fund, Inc.) (the "Portfolio") as of December 31, 2015 and the related statement of operations for the year then ended, the statements of changes in net assets for each of the two years in the period then ended and the financial highlights for each of the years or periods indicated therein. These financial statements and financial highlights are the responsibility of the Portfolio's management. Our responsibility is to express an opinion on these financial statements and financial highlights based on our audits.
We conducted our audits in accordance with the standards of the Public Company Accounting Oversight Board (United States). Those standards require that we plan and perform the audit to obtain reasonable assurance about whether the financial statements and financial highlights are free of material misstatement. We were not engaged to perform an audit of the Portfolio's internal control over financial reporting. Our audits included consideration of internal control over financial reporting as a basis for designing audit procedures that are appropriate in the circumstances, but not for the purpose of expressing an opinion on the effectiveness of the Portfolio's internal control over financial reporting. Accordingly, we express no such opinion. An audit also includes examining, on a test basis, evidence supporting the amounts and disclosures in the financial statements and financial highlights, assessing the accounting principles used and significant estimates made by management, and evaluating the overall financial statement presentation. Our procedures included confirmation of securities owned as of December 31, 2015, by correspondence with the custodian and others. We believe that our audits provide a reasonable basis for our opinion.
In our opinion, the financial statements and financial highlights referred to above present fairly, in all material respects, the financial position of International Equity Portfolio (one of the portfolios constituting Morgan Stanley Institutional Fund, Inc.) at December 31, 2015, the results of its operations for the year then ended, the changes in its net assets for each of the two years in the period then ended and the financial highlights for each of the years or periods indicated therein, in conformity with U.S. generally accepted accounting principles.

Boston, Massachusetts
February 26, 2016
28
Morgan Stanley Institutional Fund, Inc.
Annual Report — December 31, 2015
Federal Tax Notice (unaudited)
For Federal income tax purposes, the following information is furnished with respect to the Portfolio's earnings for its taxable year ended December 31, 2015. When distributed, certain earnings may be subject to a maximum tax rate of 15% as provided for by the Jobs and Growth Tax Relief Reconciliation Act of 2003. The Portfolio designated up to a maximum of approximately $99,278,000 as taxable at this lower rate.
The Portfolio intends to pass through foreign tax credits of approximately $5,613,000 and has derived net income from sources within foreign countries amounting to approximately $139,943,000.
In January, the Portfolio provides tax information to shareholders for the preceding calendar year.
29
Morgan Stanley Institutional Fund, Inc.
Annual Report — December 31, 2015
U.S. Privacy Policy (unaudited)
AN IMPORTANT NOTICE CONCERNING OUR U.S. PRIVACY POLICY
This privacy notice describes the U.S. privacy policy of Morgan Stanley Distribution, Inc., and the Morgan Stanley family of mutual funds ("us", "our", "we").
We are required by federal law to provide you with notice of our U.S. privacy policy ("Policy"). This Policy applies to both our current and former clients unless we state otherwise and is intended for individual clients who purchase products or receive services from us for personal, family or household purposes. This Policy is not applicable to partnerships, corporations, trusts or other non-individual clients or account holders, nor is this Policy applicable to individuals who are either beneficiaries of a trust for which we serve as trustee or participants in an employee benefit plan administered or advised by us. This Policy is, however, applicable to individuals who select us to be a custodian of securities or assets in individual retirement accounts, 401(k) accounts, or accounts subject to the Uniform Gifts to Minors Act.
This notice sets out our business practices to protect your privacy; how we collect and share personal information about you; and how you can limit our sharing or certain uses by others of this information. We may amend this Policy at any time, and will inform you of any changes to our Policy as required by law.
WE RESPECT YOUR PRIVACY
We appreciate that you have provided us with your personal financial information and understand your concerns about your information. We strive to safeguard the information our clients entrust to us. Protecting the confidentiality and security of client information is an important part of how we conduct our business.
This notice describes what personal information we collect about you, how we collect it, when we may share it with others, and how certain others may use it. It discusses the steps you may take to limit our sharing of certain information about you with our affiliated companies, including, but not limited to our affiliated banking businesses, brokerage firms and credit service affiliates. It also discloses how you may limit our affiliates' use of shared information for marketing purposes.
Throughout this Policy, we refer to the nonpublic information that personally identifies you as "personal information." We also use the term "affiliated company" in this notice. An affiliated company is a company in our family of companies and includes companies with the Morgan Stanley name. These affiliated companies are financial institutions such as broker-dealers, banks, investment advisers and credit card issuers. We refer to any company that is not an affiliated company as a nonaffiliated third party. For purposes of Section 5 of this notice, and your ability to limit certain uses of personal information by our affiliates, this notice applies to the use of personal information by our affiliated companies.
1. WHAT PERSONAL INFORMATION DO WE COLLECT FROM YOU?
We may collect the following types of information about you: (i) information provided by you, including information from applications and other forms we receive from you, (ii) information about your transactions with us or our affiliates, (iii) information about your transactions with nonaffiliated third parties, (iv) information from consumer reporting agencies, (v) information obtained from our websites, and (vi) information obtained from other sources. For example:
• We collect information such as your name, address, e-mail address, telephone/fax numbers, assets, income and investment objectives through applications and other forms you submit to us.
• We may obtain information about account balances, your use of account(s) and the types of products and services you prefer to receive from us through your dealings and transactions with us and other sources.
• We may obtain information about your creditworthiness and credit history from consumer reporting agencies.
• We may collect background information from and through third-party vendors to verify representations you have made and to comply with various regulatory requirements.
2. WHEN DO WE DISCLOSE PERSONAL INFORMATION WE COLLECT ABOUT YOU?
We may disclose personal information we collect about you in each of the categories listed above to affiliated and nonaffiliated third parties.
30
Morgan Stanley Institutional Fund, Inc.
Annual Report — December 31, 2015
U.S. Privacy Policy (unaudited) (cont'd)
a. Information We Disclose to Affiliated Companies.
We may disclose personal information that we collect about you to our affiliated companies to manage your account(s) effectively, to service and process your transactions, and to let you know about products and services offered by us and affiliated companies, to manage our business, and as otherwise required or permitted by law. Offers for products and services from affiliated companies are developed under conditions designed to safeguard your personal information.
b. Information We Disclose to Third Parties.
We may disclose personal information that we collect about you to nonaffiliated third parties to provide marketing services on our behalf or to other financial institutions with whom we have joint marketing agreements. We may also disclose all of the information we collect to other nonaffiliated third parties for our everyday business purposes, such as to process transactions, maintain account(s), respond to court orders and legal investigations, report to credit bureaus, offer our own products and services, protect against fraud, for institutional risk control, to perform services on our behalf, and as otherwise required or permitted by law.
When we share personal information about you with a nonaffiliated third party, they are required to limit their use of personal information about you to the particular purpose for which it was shared and they are not allowed to share personal information about you with others except to fulfill that limited purpose or as may be permitted or required by law.
3. HOW DO WE PROTECT THE SECURITY AND CONFIDENTIALITY OF PERSONAL INFORMATION WE COLLECT ABOUT YOU?
We maintain physical, electronic and procedural security measures that comply with applicable law and regulations to help safeguard the personal information we collect about you. We have internal policies governing the proper handling of client information by employees. Third parties that provide support or marketing services on our behalf may also receive personal information about you, and we require them to adhere to appropriate security standards with respect to such information.
4. HOW CAN YOU LIMIT OUR SHARING CERTAIN PERSONAL INFORMATION ABOUT YOU WITH OUR AFFILIATED COMPANIES FOR ELIGIBILITY DETERMINATION?
By following the opt-out procedures in Section 6 below, you may limit the extent to which we share with our affiliated companies, personal information that was collected to determine your eligibility for products and services such as your credit reports and other information that you have provided to us or that we may obtain from third parties ("eligibility information"). Eligibility information does not include your identification information or personal information pertaining to our transactions or experiences with you. Please note that, even if you direct us not to share eligibility information with our affiliated companies, we may still share your personal information, including eligibility information, with our affiliated companies under circumstances that are permitted under applicable law, such as to process transactions or to service your account.
5. HOW CAN YOU LIMIT THE USE OF CERTAIN PERSONAL INFORMATION ABOUT YOU BY OUR AFFILIATED COMPANIES FOR MARKETING?
By following the opt-out instructions in Section 6 below, you may limit our affiliated companies from marketing their products or services to you based on personal information we disclose to them. This information may include, for example, your income and account history with us. Please note that, even if you choose to limit our affiliated companies from using personal information about you that we may share with them for marketing their products and services to you, our affiliated companies may use your personal information that they obtain from us to market to you in circumstances permitted by law, such as if the affiliated party has its own relationship with you.
31
Morgan Stanley Institutional Fund, Inc.
Annual Report — December 31, 2015
U.S. Privacy Policy (unaudited) (cont'd)
6. HOW CAN YOU SEND US AN OPT-OUT INSTRUCTION?
If you wish to limit our sharing of eligibility information about you with our affiliated companies, or our affiliated companies' use of personal information for marketing purposes, as described in this notice, you may do so by:
• Calling us at (800) 548-7786
Monday–Friday between 8a.m. and 6p.m. (EST)
• Writing to us at the following address:
Boston Financial Data Services, Inc.
c/o Privacy Coordinator
P.O. Box 219804
Kansas City, Missouri 64121
If you choose to write to us, your request should include: your name, address, telephone number and account number(s) to which the opt-out applies and whether you are opting out with respect to sharing of eligibility information (Section 4 above), or information used for marketing (Section 5 above), or both. Written opt-out requests should not be sent with any other correspondence. In order to process your request, we require that the request be provided by you directly and not through a third party. Once you have informed us about your privacy preferences, your opt-out preference will remain in effect with respect to this Policy (as it may be amended) until you notify us otherwise. If you are a joint account owner, we will accept instructions from any one of you and apply those instructions to the entire account.
Please understand that if you limit our sharing or our affiliated companies' use of personal information, you and any joint account holder(s) may not receive information about our affiliated companies' products and services, including products or services that could help you manage your financial resources and achieve your investment objectives.
If you have more than one account or relationship with us, please specify the accounts to which you would like us to apply your privacy choices. If you have accounts or relationships with our affiliates, you may receive multiple privacy policies from them, and will need to separately notify those companies of your privacy choices for those accounts or relationships.
7. WHAT IF AN AFFILIATED COMPANY BECOMES A NONAFFILIATED THIRD PARTY?
If, at any time in the future, an affiliated company becomes a nonaffiliated third party, further disclosures of personal information made to the former affiliated company will be limited to those described in Section 2(b) above relating to nonaffiliated third parties. If you elected under Section 6 to limit disclosures we make to affiliated companies, or use of personal information by affiliated companies, your election will not apply to use by any former affiliated company of your personal information in their possession once it becomes a nonaffiliated third party.
SPECIAL NOTICE TO RESIDENTS OF VERMONT
The following section supplements our Policy with respect to our individual clients who have a Vermont address and supersedes anything to the contrary in the above Policy with respect to those clients only.
The State of Vermont requires financial institutions to obtain your consent prior to sharing personal information that they collect about you with nonaffiliated third parties, or eligibility information with affiliated companies, other than in certain limited circumstances. Except as permitted by law, we will not share personal information we collect about you with nonaffiliated third parties or eligibility information with affiliated companies, unless you provide us with your written consent to share such information.
SPECIAL NOTICE TO RESIDENTS OF CALIFORNIA
The following section supplements our Policy with respect to our individual clients who have a California address and supersedes anything to the contrary in the above Policy with respect to those clients only.
In response to a California law, if your account has a California home address, your personal information will not be disclosed to nonaffiliated third parties except as permitted by applicable California law, and we will limit sharing such personal information with our affiliates to comply with California privacy laws that apply to us.
32
Morgan Stanley Institutional Fund, Inc.
Annual Report — December 31, 2015
Director and Officer Information (unaudited)
Independent Directors:
| Name, Age and Address of Independent Director | Positions(s) Held with Registrant | Length of Time Served | Principal Occupation(s) During Past 5 Years and Other Relevant Professional Experience | Number of Portfolios in Fund Complex Overseen by Director** | Other Directorships Held by Independent Director*** | ||||||||||||||||||
| Frank L. Bowman (71) c/o Kramer Levin Naftalis & Frankel LLP Counsel to the Independent Directors 1177 Avenue of the Americas New York, NY 10036 | Director | Since August 2006 | President, Strategic Decisions, LLC (consulting) (since February 2009); Director or Trustee of various Morgan Stanley Funds (since August 2006); Chairperson of the Compliance and Insurance Committee (since October 2015); Formerly, Chairperson of the Insurance Sub-Committee of the Compliance and Insurance Committee (February 2007-December 2015); served as President and Chief Executive Officer of the Nuclear Energy Institute (policy organization) (February 2005-November 2008); retired as Admiral, U.S. Navy after serving over 38 years on active duty including 8 years as Director of the Naval Nuclear Propulsion Program in the Department of the Navy and the U.S. Department of Energy (1996-2004); served as Chief of Naval Personnel (July 1994-September 1996); and on the Joint Staff as Director of Political Military Affairs (June 1992-July1994); knighted as Honorary Knight Commander of the Most Excellent Order of the British Empire; awarded the Officier de l'Orde National du Mérite by the French Government; elected to the National Academy of Engineering (2009). | 98 | Director of BP p.l.c.; Director of Naval and Nuclear Technologies LLP; Director Emeritus of the Armed Services YMCA; Director of the U.S. Naval Submarine League; Member of the National Security Advisory Council of the Center for U.S. Global Engagement and a member of the CNA Military Advisory Board; Chairman of the Charity, J Street Cup Golf, Trustee of Fairhaven United Methodist Church; and Director of other various non-profit organizations. | ||||||||||||||||||
| Kathleen A. Dennis (62) c/o Kramer Levin Naftalis & Frankel LLP Counsel to the Independent Directors 1177 Avenue of the Americas New York, NY 10036 | Director | Since August 2006 | President, Cedarwood Associates (mutual fund and investment management consulting) (since July 2006); Chairperson of the Money Market and Alternatives Sub-Committee of the Investment Committee (since October 2006) and Director or Trustee of various Morgan Stanley Funds (since August 2006); formerly, Senior Managing Director of Victory Capital Management (1993-2006). | 98 | Director of various nonprofit organizations. | ||||||||||||||||||
| Nancy C. Everett (61) c/o Kramer Levin Naftalis & Frankel LLP Counsel to the Independent Directors 1177 Avenue of the Americas New York, NY 10036 | Director | Since January 2015 | Chief Executive Officer, Virginia Commonwealth University Investment Company (since November 2015); Owner, OBIR, LLC (investment management consulting) (since June 2014); formerly, Managing Director, BlackRock Inc. (February 2011-December 2013); and Chief Executive Officer, General Motors Asset Management (a/k/a Promark Global Advisors, Inc.) (June 2005-May 2010). | 98 | Member of Virginia Commonwealth University School of Business Foundation; formerly, Member of Virginia Commonwealth University Board of Visitors (2013-2015); Member of Committee on Directors for Emerging Markets Growth Fund, Inc. (2007-2010); Chairperson of Performance Equity Management, LLC (2006-2010); and Chairperson, GMAM Absolute Return Strategies Fund, LLC (2006-2010). | ||||||||||||||||||
33
Morgan Stanley Institutional Fund, Inc.
Annual Report — December 31, 2015
Director and Officer Information (unaudited) (cont'd)
Independent Directors: (cont'd)
| Name, Age and Address of Independent Director | Positions(s) Held with Registrant | Length of Time Served | Principal Occupation(s) During Past 5 Years and Other Relevant Professional Experience | Number of Portfolios in Fund Complex Overseen by Director** | Other Directorships Held by Independent Director*** | ||||||||||||||||||
| Jakki L. Haussler (58) c/o Kramer Levin Naftalis & Frankel LLP Counsel to the Independent Directors 1177 Avenue of the Americas New York, NY 10036 | Director | Since January 2015 | Chairman and Chief Executive Officer, Opus Capital Group (since January 1996); and formerly, Director, Capvest Venture Fund, LP (May 2000-December 2011); Partner, Adena Ventures, LP (July 1999-December 2010); Director, The Victory Funds (February 2005-July 2008). | 98 | Director of Cincinnati Bell Inc. and Member, Audit Committee and Compensation Committee; Director of Northern Kentucky University Foundation and Member, Investment Committee; Member of Chase College of Law Transactional Law Practice Center Board of Advisors; Director of Best Transport; Chase College of Law Board of Visitors; formerly Member, University of Cincinnati Foundation Investment Committee; Member, Miami University Board of Visitors (2008-2011); Trustee of Victory Funds (2005-2008) and Chairman, Investment Committee (2007-2008) and Member, Service Provider Committee (2005-2008). | ||||||||||||||||||
| Dr. Manuel H. Johnson (67) c/o Johnson Smick International, Inc. 220 I Street, N.E. — Suite 200 Washington, D.C. 20002 | Director | Since July 1991 | Senior Partner, Johnson Smick International, Inc. (consulting firm); Chairperson of the Investment Committee (since October 2006) and Director or Trustee of various Morgan Stanley Funds (since July 1991); Co-Chairman and a founder of the Group of Seven Council (G7C) (international economic commission); formerly Chairperson of the Audit Committee (July 1991-September 2006), Vice Chairman of the Board of Governors of the Federal Reserve System and Assistant Secretary of the U.S. Treasury. | 100 | Director of NVR, Inc. (home construction). | ||||||||||||||||||
| Joseph J. Kearns (73) c/o Kearns & Associates LLC 23823 Malibu Road S-50-440 Malibu, CA 90265 | Director | Since August 1994 | President, Kearns & Associates LLC (investment consulting); Chairperson of the Audit Committee (since October 2006) and Director or Trustee of various Morgan Stanley Funds (since August 1994); formerly, Deputy Chairperson of the Audit Committee (July 2003-September 2006) and Chairperson of the Audit Committee of various Morgan Stanley Funds (since August 1994); CFO of the J. Paul Getty Trust. | 101 | Director of Electro Rent Corporation (equipment leasing). Prior to December 31, 2013, Director of The Ford Family Foundation. | ||||||||||||||||||
34
Morgan Stanley Institutional Fund, Inc.
Annual Report — December 31, 2015
Director and Officer Information (unaudited) (cont'd)
Independent Directors: (cont'd)
| Name, Age and Address of Independent Director | Positions(s) Held with Registrant | Length of Time Served | Principal Occupation(s) During Past 5 Years and Other Relevant Professional Experience | Number of Portfolios in Fund Complex Overseen by Director** | Other Directorships Held by Independent Director*** | ||||||||||||||||||
| Michael F. Klein (57) c/o Kramer Levin Naftalis & Frankel LLP Counsel to the Independent Directors 1177 Avenue of the Americas New York, NY 10036 | Director | Since August 2006 | Managing Director, Aetos Capital, LLC (since March 2000); Co-President, Aetos Alternatives Management, LLC (since January 2004); and Co-Chief Executive Officer of Aetos Capital LLC (since August 2013); Chairperson of the Fixed Income Sub-Committee of the Investment Committee (since October 2006) and Director or Trustee of various Morgan Stanley Funds (since August 2006); formerly, Managing Director, Morgan Stanley & Co. Inc. and Morgan Stanley Dean Witter Investment Management, President, various Morgan Stanley Funds (June1998-March 2000) and Principal, Morgan Stanley & Co. Inc. and Morgan Stanley Dean Witter Investment Management (August 1997-December 1999). | 97 | Director of certain investment funds managed or sponsored by Aetos Capital, LLC. Director of Sanitized AG and Sanitized Marketing AG (specialty chemicals). | ||||||||||||||||||
| Michael E. Nugent (79) 522 Fifth Avenue New York, NY 10036 | Chair of the Board and Director | Chair of the Boards since July 2006 and Director since July 1991 | Chair of the Boards of various Morgan Stanley Funds (since July 2006); Chairperson of the Closed-End Fund Committee (since June 2012) and Director or Trustee of various Morgan Stanley Funds (since July 1991); formerly, Chairperson of the Insurance Committee (until July 2006), General Partner, TriumphCapital, L.P. (private investment partnership) (1988-2013). | 100 | None. | ||||||||||||||||||
| W. Allen Reed (68) c/o Kramer Levin Naftalis & Frankel LLP Counsel to the Independent Directors 1177 Avenue of the Americas New York, NY 10036 | Director | Since August 2006 | Chairperson of the Equity Sub-Committee of the Investment Committee (since October 2006) and Director or Trustee of various Morgan Stanley Funds (since August 2006); formerly, President and CEO of General Motors Asset Management; Chairman and Chief Executive Officer of the GM Trust Bank and Corporate Vice President of General Motors Corporation (August 1994-December 2005). | 98 | Director of Legg Mason, Inc.; formerly Director of the Auburn University Foundation (2010-2015). | ||||||||||||||||||
| Fergus Reid (83) c/o Joe Pietryka, Inc. 85 Charles Colman Blvd. Pawling, NY 12564 | Director | Since June 1992 | Chairman, Joe Pietryka, Inc.; Chairperson of the Governance Committee and Director or Trustee of various Morgan Stanley Funds (since June 1992). | 100 | Formerly, Trustee and Director of certain investment companies in the JP Morgan Fund Complex managed by JP Morgan Investment Management Inc. (1987-2012). | ||||||||||||||||||
35
Morgan Stanley Institutional Fund, Inc.
Annual Report — December 31, 2015
Director and Officer Information (unaudited) (cont'd)
Interested Director:
| Name, Age and Address of Interested Director | Positions(s) Held with Registrant | Length of Time Served* | Principal Occupation(s) During Past 5 Years | Number of Portfolios in Fund Complex Overseen by Interested Director** | Other Directorships Held by Interested Director*** | ||||||||||||||||||
| James F. Higgins (68) One New York Plaza, New York, NY 10004 | Director | Since June 2000 | Director or Trustee of various Morgan Stanley Funds (since June 2000); Senior Advisor of Morgan Stanley (since August 2000). | 99 | Formerly, Director of AXA Financial, Inc. and AXA Equitable Life Insurance Company (2002-2011) and Director of AXA MONY Life Insurance Company and AXA MONY Life Insurance Company of America (2004-2011). | ||||||||||||||||||
* This is the earliest date the Director began serving the Morgan Stanley Funds. Each Director serves an indefinite term, until his or her successor is elected.
** The Fund Complex includes (as of December 31, 2015) all open-end and closed-end funds (including all of their portfolios) advised by Morgan Stanley Investment Management Inc. (the "Adviser") and any funds that have an adviser that is an affiliated person of the Adviser (including, but not limited to, Morgan Stanley AIP GP LP).
*** This includes any directorships at public companies and registered investment companies held by the Director at any time during the past five years.
Executive Officers:
Name, Age and Address of Executive Officer | Position(s) Held Registrant | Length of with Served**** | Time Principal Occupation(s) During Past 5 Years | ||||||||||||
| John H. Gernon (52) 522 Fifth Avenue New York, NY 10036 | President and Principal Executive Officer | Since September 2013 | President and Principal Executive Officer of the Equity and Fixed Income Funds and the Morgan Stanley AIP Funds (since September 2013) and the Liquidity Funds and various money market funds (since May 2014) in the Fund Complex, Managing Director of the Adviser; Head of Product (since 2006). | ||||||||||||
| Stefanie V. Chang Yu (49) 522 Fifth Avenue New York, NY 10036 | Chief Compliance Officer | Since December 1997 | Managing Director of the Adviser and various entities affiliated with the Adviser; Chief Compliance Officer of various Morgan Stanley Funds and the Adviser (since January 2014); formerly, Vice President of various Morgan Stanley Funds (December 1997-January 2014). | ||||||||||||
| Joseph C. Benedetti (50) 522 Fifth Avenue New York, NY 10036 | Vice President | Since January 2014 | Managing Director of the Adviser and various entities affiliated with the Adviser; Vice President of various Morgan Stanley Funds (since January 2014); formerly, Assistant Secretary of various Morgan Stanley Funds (October 2004-January 2014). | ||||||||||||
| Francis J. Smith (50) 522 Fifth Avenue New York, NY 10036 | Treasurer and Principal Financial Officer | Treasurer since July 2003 and Principal Financial Officer since September 2002 | Executive Director of the Adviser and various entities affiliated with the Adviser; Treasurer (since July 2003) and Principal Financial Officer of various Morgan Stanley Funds (since September 2002). | ||||||||||||
| Mary E. Mullin (48) 522 Fifth Avenue New York, NY 10036 | Secretary | Since June 1999 | Executive Director of the Adviser; Secretary of various Morgan Stanley Funds (since June 1999). | ||||||||||||
**** This is the earliest date the officer began serving the Morgan Stanley Funds. Each officer serves a one-year term, until his or her successor is elected and has qualified.
36
Morgan Stanley Institutional Fund, Inc.
Annual Report — December 31, 2015
Adviser and Administrator
Morgan Stanley Investment Management Inc.
522 Fifth Avenue
New York, New York 10036
Sub-Advisers
Morgan Stanley Investment Management Limited
25 Cabot Square, Canary Wharf
London, E14 4QA, England
Morgan Stanley Investment Management Company
23 Church Street
16-01 Capital Square, Singapore 049481
Distributor
Morgan Stanley Distribution, Inc.
522 Fifth Avenue
New York, New York 10036
Dividend Disbursing and Transfer Agent
Boston Financial Data Services, Inc.
2000 Crown Colony Drive
Quincy, Massachusetts 02169
Custodian
State Street Bank and Trust Company
One Lincoln Street
Boston, Massachusetts 02111
Legal Counsel
Dechert LLP
1095 Avenue of the Americas
New York, New York 10036
Counsel to the Independent Directors
Kramer Levin Naftalis & Frankel LLP
1177 Avenue of the Americas
New York, New York 10036
Independent Registered Public Accounting Firm
Ernst & Young LLP
200 Clarendon Street
Boston, Massachusetts 02116
Reporting to Shareholders
Each Morgan Stanley fund provides a complete schedule of portfolio holdings in its semi-annual and annual reports within 60 days of the end of the fund's second and fourth fiscal quarters. The semi-annual and annual reports are filed electronically with the Securities and Exchange Commission (SEC) on Form N-CSRS and Form N-CSR, respectively. Morgan Stanley also delivers the semi-annual and annual reports to fund shareholders and makes these reports available on its public website, www.morganstanley.com/im. Each Morgan Stanley fund also files a complete schedule of portfolio holdings with the SEC for the fund's first and third fiscal quarters on Form N-Q. Morgan Stanley does not deliver the reports for the first and third fiscal quarters to shareholders, nor are the reports posted to the Morgan Stanley public website. You may, however, obtain the Form N-Q filings (as well as the Form N-CSR and N-CSRS filings) by accessing the SEC's website, www.sec.gov. You may also review and copy them at the SEC's Public Reference Room in Washington, DC. Information on the operation of the SEC's Public Reference Room may be obtained by calling the SEC toll free at 1 (800) SEC-0330. You can also request copies of these materials, upon payment of a duplicating fee, by electronic request at the SEC's email address (publicinfo@sec.gov) or by writing the Public Reference Room of the SEC, Washington, DC 20549-0102.
Proxy Voting Policies and Procedures and Proxy Voting Record
You may obtain a copy of the Fund's Proxy Voting Policy and Procedures and information regarding how the Fund voted proxies relating to portfolio securities during the most recent twelve-month period ended June 30, without charge, upon request, by calling toll free 1 (800) 548-7786 or by visiting our website at www.morganstanley.com/im. This information is also available on the SEC's website at www.sec.gov.
This report is authorized for distribution only when preceded or accompanied by a prospectus of the Morgan Stanley Institutional Fund, Inc., which describes in detail each Portfolio's investment policies, risks, fees and expenses. Please read the prospectus carefully before you invest or send money. For additional information, including information regarding the investments comprising the Portfolio, please visit our website at www.morganstanley.com/im or call toll free 1 (800) 548-7786.
37
Printed in U.S.A.
This Report has been prepared for shareholders and may be distributed to others only if preceded or accompanied by a current prospectus.
Morgan Stanley Investment Management Inc.
522 Fifth Avenue
New York, New York 10036
© 2016 Morgan Stanley. Morgan Stanley Distribution, Inc.

IFIIEANN
1405194 EXP. 02.28.17
INVESTMENT MANAGEMENT

Morgan Stanley Institutional Fund, Inc.
International Real Estate Portfolio
Annual Report
December 31, 2015

Morgan Stanley Institutional Fund, Inc.
Annual Report — December 31, 2015
Table of Contents
Shareholders' Letter | 2 | ||||||
Expense Example | 3 | ||||||
Investment Overview | 4 | ||||||
Portfolio of Investments | 7 | ||||||
Statement of Assets and Liabilities | 9 | ||||||
Statement of Operations | 11 | ||||||
Statements of Changes in Net Assets | 12 | ||||||
Financial Highlights | 14 | ||||||
Notes to Financial Statements | 20 | ||||||
Report of Independent Registered Public Accounting Firm | 27 | ||||||
Federal Tax Notice | 28 | ||||||
U.S. Privacy Policy | 29 | ||||||
Director and Officer Information | 32 | ||||||
This report is authorized for distribution only when preceded or accompanied by prospectuses of the Morgan Stanley Institutional Fund, Inc. To receive a prospectus and/or statement of additional information (SAI), which contains more complete information such as investment objectives, charges, expenses, policies for voting proxies, risk considerations, and describes in detail each of the Portfolio's investment policies to the prospective investor, please call toll free 1 (800) 548-7786. Please read the prospectuses carefully before you invest or send money.
Additionally, you can access portfolio information including performance, characteristics, and investment team commentary through Morgan Stanley Investment Management's website: www.morganstanley.com/im.
Market forecasts provided in this report may not necessarily come to pass. There is no guarantee that any sectors mentioned will continue to perform as discussed herein or that securities in such sectors will be held by the Portfolio in the future. There is no assurance that a Portfolio will achieve its investment objective. Portfolios are subject to market risk, which is the possibility that market values of securities owned by the Portfolio will decline and, therefore, the value of the Portfolio's shares may be less than what you paid for them. Accordingly, you can lose money investing in this Portfolio. Please see the prospectus for more complete information on investment risks.
1
Morgan Stanley Institutional Fund, Inc.
Annual Report — December 31, 2015
Shareholders' Letter (unaudited)
Dear Shareholders,
We are pleased to provide this Annual report, in which you will learn how your investment in International Real Estate Portfolio (the "Portfolio") performed during the latest twelve-month period.
Morgan Stanley Investment Management is a client-centric, investor-led organization. Our global presence, intellectual capital, and breadth of products and services enable us to partner with investors to meet the evolving challenges of today's financial markets. We aim to deliver superior investment service and to empower our clients to make the informed decisions that help them reach their investment goals.
As always, we thank you for selecting Morgan Stanley Investment Management, and look forward to working with you in the months and years ahead.
Sincerely,

John H. Gernon
President and Principal Executive Officer
January 2016
2
Morgan Stanley Institutional Fund, Inc.
Annual Report — December 31, 2015
Expense Example (unaudited)
International Real Estate Portfolio
As a shareholder of the Portfolio, you incur two types of costs: (1) transactional costs, including redemptions fees; and (2) ongoing costs, including advisory fees, administration fees, distribution and shareholder services fees and other Portfolio expenses. This example is intended to help you understand your ongoing costs (in dollars) of investing in the Portfolio and to compare these costs with the ongoing costs of investing in other mutual funds.
This example is based on an investment of $1,000 invested at the beginning of the six-month period ended December 31, 2015 and held for the entire six-month period.
Actual Expenses
The table below provides information about actual account values and actual expenses. You may use the information in this table, together with the amount you invested, to estimate the expenses that you paid over the period. Simply divide your account value by $1,000 (for example, an $8,600 account value divided by $1,000 = 8.6), then multiply the result by the number in the table under the heading entitled "Actual Expenses Paid During Period" to estimate the expenses you paid on your account during this period.
Hypothetical Example for Comparison Purposes
The table below provides information about hypothetical account values and hypothetical expenses based on the Portfolio's actual expense ratio and an assumed rate of return of 5% per year before expenses, which is not the Portfolio's actual return. The hypothetical account values and expenses may not be used to estimate the actual ending account balance or expenses you paid for the period. You may use this information to compare the ongoing costs of investing in the Portfolio and other funds. To do so, compare this 5% hypothetical example with the 5% hypothetical examples that appear in the shareholder reports of the other funds.
Please note that the expenses shown in the table are meant to highlight your ongoing costs only and do not reflect any transactional costs, such as sales charges (loads) and redemption fees. Therefore, the information for each class in the table is useful in comparing ongoing costs only, and will not help you determine the relative total costs of owning different funds. In addition, if these transactional costs were included, your costs would have been higher.
| Beginning Account Value 7/1/15 | Actual Ending Account Value 12/31/15 | Hypothetical Ending Account Value | Actual Expenses Paid During Period* | Hypothetical Expenses Paid During Period* | Net Expense Ratio During Period** | ||||||||||||||||||||||
International Real Estate Portfolio Class I | $ | 1,000.00 | $ | 938.70 | $ | 1,020.16 | $ | 4.89 | $ | 5.09 | 1.00 | % | |||||||||||||||
International Real Estate Portfolio Class A | 1,000.00 | 937.00 | 1,018.40 | 6.59 | 6.87 | 1.35 | |||||||||||||||||||||
International Real Estate Portfolio Class H | 1,000.00 | 937.00 | 1,018.40 | 6.59 | 6.87 | 1.35 | |||||||||||||||||||||
International Real Estate Portfolio Class L | 1,000.00 | 934.70 | 1,015.88 | 9.02 | 9.40 | 1.85 | |||||||||||||||||||||
International Real Estate Portfolio Class C | 1,000.00 | 933.10 | 1,014.62 | 10.23 | 10.66 | 2.10 | |||||||||||||||||||||
International Real Estate Portfolio Class IS | 1,000.00 | 938.60 | 1,020.32 | 4.74 | 4.94 | 0.97 | |||||||||||||||||||||
* Expenses are calculated using each Portfolio Class' annualized net expense ratio (as disclosed), multiplied by the average account value over the period, and multiplied by 184/365 (to reflect the most recent one-half year period).
** Annualized.
3
Morgan Stanley Institutional Fund, Inc.
Annual Report — December 31, 2015
Investment Overview (unaudited)
International Real Estate Portfolio
The Portfolio seeks to provide current income and long-term capital appreciation.
Performance
For the year ended December 31, 2015, the Portfolio's Class I shares had a total return based on net asset value and reinvestment of distributions per share of –3.29%, net of fees. The Portfolio's Class I shares underperformed the Portfolio's benchmark, the FTSE EPRA/NAREIT Developed ex-North America Real Estate — Net Total Return Index (the "Index"), which returned –2.58%, and the MSCI EAFE Index, which returned –0.81%.
Factors Affecting Performance
• The international real estate securities market declined 2.58% during the 12-month period ending December 31, 2015, as measured by the Index. Europe outperformed the international average and Asia underperformed the international average.
• During the year, property stocks have been largely influenced by transactional evidence in the private markets of strong investor demand for core assets at valuations that demonstrate the acceptance of low expected returns. Share prices also appeared to fluctuate alongside various macro concerns including expectations for higher interest rates going forward and global economic growth concerns, with a particular focus on China's economic slowdown.
• Performance within the Asian regional portfolio outperformed the Index and the European portfolio was relatively neutral. Top-down global allocation detracted from relative performance due to the underweight to the European portfolio and overweight to the Asian regional portfolio. In Asia, the Portfolio benefited from stock selection in Hong Kong and Hong Kong-listed China real estate operating companies (REOCs), and the underweight to and stock selection within Singapore; this was partially offset by the negative influence of its overweight to Hong Kong and underweight to Australia. In Europe, the Portfolio benefited from stock selection in Germany and the U.K.; this was partially offset by the overweight to Norway and stock selection in Sweden and Austria, which detracted.
Management Strategies
• The Portfolio is comprised of two regional portfolios with a global allocation which weights the European and Asian regions relative to the Index based on our view of the relative attractiveness of each region in terms of underlying real estate fundamentals and public market valuations. Moreover, both of the regional portfolios reflect our core investment philosophy as a real estate value investor, which results in the ownership of stocks that we believe provide the best valuation relative to their underlying real estate values, while maintaining portfolio diversification. Our company-specific research leads us to specific preferences for sub-segments within each of the property sectors and countries. For the period ended December 31, 2015, the Portfolio was overweight the Asian listed property sector and underweight the European listed property sector.
• In Asia, the Hong Kong REOCs continue to represent the most significant overweight in the global portfolio, as we believe the stocks offer highly attractive value given the wide discrepancy between public and private valuations, and relative to other public listed property markets. The companies traded at an average 46% discount to net asset values (NAVs) — their underlying private real estate value — at the end of the period, which represented the widest discount on a global basis, and we believe share prices substantially discount the various risks that could potentially impact operating fundamentals and asset values in the private market and ignored strong transactional evidence in the office market.(i) The discounted valuations are further accentuated as the Hong Kong REOCs maintain very modest leverage levels. Sentiment continues to be a significant driver of share price movements and investor sentiment remained cautious due to macro concerns regarding China. The Japan REOCs traded at an average 20% discount to NAVs. Share prices do not fully reflect strong transactional evidence in the private market. In wide contrast, the Japan real estate investment trusts (J-REITs) continued to trade at a significant premium of 22% — the widest premium on a global basis — driven by purchases by the Bank of Japan and domestic investor attraction to the positive spread between J-REIT dividend yields
(i) Source for all valuations data: Morgan Stanley Investment Management, as of ending date December 31, 2015.
4
Morgan Stanley Institutional Fund, Inc.
Annual Report — December 31, 2015
Investment Overview (unaudited) (cont'd)
International Real Estate Portfolio
relative to the 10-year Japanese government bond yield. It is notable that the asset portfolios of the major Japan REOCs, which are largely comprised of prime office assets in Central Tokyo, may benefit from stronger operating fundamentals as compared to the generally lower-quality and diverse asset portfolios of the J-REITs. As a result, we believe the valuations for the Japan REOCs are far more attractive relative to the prevailing valuations for the J-REITs and we remain overweight to the REOCs and underweight the REITs within Japan. Finally, it is notable current NAVs are based on cash flows that are near cyclical lows and continued improvements in occupancy levels have led to greater enthusiasm for rental growth. The Portfolio was underweight Australia and the Singapore REITs on relative valuation.
• In Europe, property stocks in the U.K. ended the period trading at a 6% discount to reported NAVs (with the large-cap U.K. Majors trading at a 15% discount to NAVs) and property stocks on the Continent ended the period trading at an average 16% premium to reported NAVs. As rental growth remains modest in most markets on the Continent, current premiums reflect continued yield compression following the start of quantitative easing. In the U.K., the pace of NAV growth is expected to decelerate going forward as the contribution from yield compression diminishes and rental growth takes over as the main driver of capital value growth. Moreover, we believe the U.K. companies are poised to benefit from better economic prospects and have stronger balance sheets, lower leverage ratios and longer average debt maturities than companies on the Continent. As a result, given share price premiums and weaker growth prospects the Continent remains less attractive relative to the U.K., in particular the U.K. Majors, and within Europe we remain overweight the U.K. Majors and underweight the Continent.
• Investment values for prime real estate assets have continued to improve due to investors' widespread acceptance of low expected returns from real estate in today's low return environment, coupled with continued credit availability and low borrowing rates. Very strong capital flows to the property sector have driven asset pricing to all-time highs in most prime markets. In Western markets, valuations
for prime assets have largely recovered back to or in excess of peak levels achieved in 2007. In Asian markets, Hong Kong has witnessed improvements in asset values primarily due to improved cash flows (as cap rate compression has not been as pervasive), whereas in Tokyo improvements have largely been due to cap rate compression with a modest recovery in fundamentals. In Australia, despite weak operating fundamentals, there has been continued strong investor demand for commercial assets.
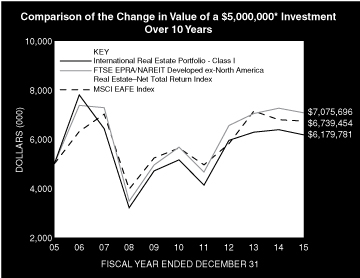
* Minimum Investment for Class I shares
In accordance with SEC regulations, the Portfolio's performance shown assumes that all recurring fees (including management fees) were deducted and all dividends and distributions were reinvested. The performance of Class A, H, L, C and IS shares will vary from the performance of Class I shares based upon their different inception dates and will be negatively impacted by additional fees assessed to those classes (if applicable).
5
Morgan Stanley Institutional Fund, Inc.
Annual Report — December 31, 2015
Investment Overview (unaudited) (cont'd)
International Real Estate Portfolio
Performance Compared to the FTSE EPRA/NAREIT Developed ex-North America Real Estate — Net Total Return Index(1) and the MSCI EAFE Index(2)
| Period Ended December 31, 2015 Total Returns(3) | |||||||||||||||||||
Average Annual | |||||||||||||||||||
| One Year | Five Years | Ten Years | Since Inception(8) | ||||||||||||||||
| Portfolio — Class I Shares w/o sales charges(4) | –3.29 | % | 3.66 | % | 2.14 | % | 7.67 | % | |||||||||||
| Portfolio — Class A Shares w/o sales charges(4) | –3.61 | 3.35 | 1.87 | 7.39 | |||||||||||||||
| Portfolio — Class A Shares with maximum 5.25% sales charges(4) | –8.67 | 2.24 | 1.32 | 7.08 | |||||||||||||||
| Portfolio — Class H Shares w/o sales charges(5) | –3.65 | — | — | 6.24 | |||||||||||||||
| Portfolio — Class H Shares with maximum 4.75% sales charges(5) | –8.24 | — | — | 4.85 | |||||||||||||||
| Portfolio — Class L Shares w/o sales charges(5) | –4.11 | — | — | 5.72 | |||||||||||||||
| Portfolio — Class C Shares w/o sales charges(7) | — | — | — | –11.47 | |||||||||||||||
| Portfolio — Class C Shares with maximum 1.00% deferred sales charges(7) | — | — | — | –12.34 | |||||||||||||||
| Portfolio — Class IS Shares w/o sales charges(6) | –3.26 | — | — | –0.02 | |||||||||||||||
| FTSE EPRA/NAREIT Developed ex-North America Real Estate — Net Total Return Index | –2.58 | 4.49 | 3.53 | 5.85 | |||||||||||||||
MSCI EAFE Index | –0.81 | 3.60 | 3.03 | 8.03 | |||||||||||||||
Performance data quoted represents past performance, which is no guarantee of future results, and current performance may be lower or higher than the figures shown. Performance assumes that all dividends and distributions, if any, were reinvested. For the most recent month-end performance figures, please visit www.morganstanley.com/im. Investment return and principal value will fluctuate so that Portfolio shares, when redeemed, may be worth more or less than their original cost. Total returns do not reflect the deduction of taxes that a shareholder would pay on Portfolio distributions or the redemption of Portfolio shares. Returns for periods less than one year are not annualized. Performance of share classes will vary due to difference in sales charges and expenses.
(1) The FTSE EPRA/NAREIT Developed ex-North America Real Estate — Net Total Return Index is a free float-adjusted market capitalization weighted index designed to reflect the stock performance of companies engaged in the European and Asian real estate markets. The performance of the Index is listed in U.S. dollars and assumes reinvestment of dividends. "Net Total Return " reflects a reduction in total returns after taking into account the withholding tax on dividends by certain foreign countries represented in the Index for periods after 2/18/05 (gross returns used prior to 2/18/05). The Index is unmanaged and its returns do not include any sales charges or fees. Such costs would lower performance. It is not possible to invest directly in an index.
(2) The MSCI EAFE Index (Europe, Australasia, Far East) is a free float-adjusted market capitalization index that is designed to measure the international equity market performance of developed markets, excluding the U.S. & Canada. The term "free float" represents the portion of shares outstanding that are deemed to be available for purchase in the public equity markets by investors. The MSCI EAFE Index currently consists of 21 developed market country indices. The performance of the Index is listed in U.S. dollars and assumes reinvestment of net dividends. The Index is unmanaged and its returns do not include any sales charges or fees. Such costs would lower performance. It is not possible to invest directly in an index.
(3) Total returns for the Portfolio reflect fees waived and expenses reimbursed, if applicable, by the Adviser. Without such waivers and reimbursements, total returns would have been lower.
(4) Commenced operations on October 1, 1997.
(5) Commenced offering on April 27, 2012.
(6) Commenced offering on September 13, 2013.
(7) Commenced offering on April 30, 2015.
(8) For comparative purposes, average annual since inception returns listed for the Indexes refer to the inception date of Class I of the Portfolio, not the inception of the Index.
6
Morgan Stanley Institutional Fund, Inc.
Annual Report — December 31, 2015
Portfolio of Investments
International Real Estate Portfolio
Shares | Value (000) | ||||||||||
Common Stocks (99.2%) | |||||||||||
Australia (11.1%) | |||||||||||
Dexus Property Group REIT | 103,430 | $ | 561 | ||||||||
Goodman Group REIT | 313,758 | 1,420 | |||||||||
GPT Group REIT | 302,032 | 1,044 | |||||||||
Investa Office Fund REIT | 67,885 | 196 | |||||||||
Mirvac Group REIT | 460,326 | 659 | |||||||||
Scentre Group REIT | 851,875 | 2,582 | |||||||||
Shopping Centres Australasia Property Group REIT | 41,504 | 64 | |||||||||
Stockland REIT | 309,264 | 918 | |||||||||
Vicinity Centres REIT | 214,493 | 435 | |||||||||
Westfield Corp. REIT | 321,986 | 2,215 | |||||||||
10,094 | |||||||||||
Austria (0.3%) | |||||||||||
Atrium European Real Estate Ltd. (a) | 65,614 | 254 | |||||||||
Belgium (0.0%) | |||||||||||
Befimmo SA REIT | 588 | 35 | |||||||||
China (0.9%) | |||||||||||
China Overseas Land & Investment Ltd. (b) | 42,000 | 146 | |||||||||
China Resources Land Ltd. (b) | 20,000 | 58 | |||||||||
| Dalian Wanda Commercial Properties Co., Ltd. H Shares (b)(c) | 29,300 | 170 | |||||||||
Global Logistic Properties Ltd. | 283,200 | 426 | |||||||||
800 | |||||||||||
Finland (1.7%) | |||||||||||
Citycon Oyj (a) | 390,019 | 1,010 | |||||||||
Sponda Oyj | 118,231 | 500 | |||||||||
1,510 | |||||||||||
France (6.9%) | |||||||||||
Fonciere Des Regions REIT | 3,326 | 298 | |||||||||
Gecina SA REIT | 6,103 | 740 | |||||||||
ICADE REIT | 10,587 | 711 | |||||||||
Klepierre REIT | 20,935 | 928 | |||||||||
Mercialys SA REIT | 6,568 | 133 | |||||||||
Unibail-Rodamco SE REIT | 13,609 | 3,451 | |||||||||
6,261 | |||||||||||
Germany (3.6%) | |||||||||||
ADO Properties SA (a)(c) | 11,415 | 330 | |||||||||
Alstria Office AG REIT (a) | 1,145 | 15 | |||||||||
Deutsche Euroshop AG | 5,232 | 230 | |||||||||
Deutsche Wohnen AG | 35,895 | 999 | |||||||||
LEG Immobilien AG (a) | 2,413 | 198 | |||||||||
Vonovia SE | 49,100 | 1,521 | |||||||||
3,293 | |||||||||||
Hong Kong (25.8%) | |||||||||||
Champion REIT | 206,000 | 103 | |||||||||
Cheung Kong Property Holdings Ltd. | 474,000 | 3,058 | |||||||||
Hang Lung Properties Ltd. | 156,000 | 354 | |||||||||
Henderson Land Development Co., Ltd. | 163,630 | 996 | |||||||||
Hongkong Land Holdings Ltd. | 576,400 | 4,019 | |||||||||
Shares | Value (000) | ||||||||||
Hysan Development Co., Ltd. | 493,836 | $ | 2,015 | ||||||||
Kerry Properties Ltd. | 97,771 | 266 | |||||||||
Link REIT | 371,895 | 2,219 | |||||||||
New World Development Co., Ltd. | 901,748 | 885 | |||||||||
Sino Land Co., Ltd. | 164,945 | 240 | |||||||||
Sun Hung Kai Properties Ltd. | 484,456 | 5,814 | |||||||||
Swire Properties Ltd. | 638,700 | 1,836 | |||||||||
Wharf Holdings Ltd. (The) | 295,117 | 1,629 | |||||||||
23,434 | |||||||||||
Ireland (0.9%) | |||||||||||
Green REIT PLC | 275,025 | 476 | |||||||||
Hibernia REIT PLC | 240,181 | 367 | |||||||||
843 | |||||||||||
Italy (0.0%) | |||||||||||
Beni Stabili SpA REIT | 47,776 | 36 | |||||||||
Japan (22.7%) | |||||||||||
Activia Properties, Inc. REIT | 95 | 403 | |||||||||
Advance Residence Investment Corp. REIT | 121 | 266 | |||||||||
Daiwa Office Investment Corp. REIT | 47 | 255 | |||||||||
Frontier Real Estate Investment Corp. REIT | 22 | 88 | |||||||||
GLP J-REIT | 293 | 283 | |||||||||
Hulic Co., Ltd. | 19,600 | 172 | |||||||||
Japan Real Estate Investment Corp. REIT | 216 | 1,051 | |||||||||
Japan Retail Fund Investment Corp. REIT | 234 | 449 | |||||||||
Kenedix Office Investment Corp. REIT | 27 | 126 | |||||||||
Mitsubishi Estate Co., Ltd. | 266,000 | 5,513 | |||||||||
Mitsui Fudosan Co., Ltd. | 206,000 | 5,162 | |||||||||
Mori Hills Investment Corp. REIT | 279 | 358 | |||||||||
Nippon Building Fund, Inc. REIT | 266 | 1,271 | |||||||||
Nippon Prologis, Inc. REIT | 262 | 473 | |||||||||
Nomura Real Estate Master Fund, Inc. REIT (a) | 266 | 329 | |||||||||
NTT Urban Development Corp. | 8,700 | 84 | |||||||||
Orix, Inc. J-REIT | 319 | 413 | |||||||||
Premier Investment Corp. REIT | 61 | 62 | |||||||||
Sumitomo Realty & Development Co., Ltd. | 93,000 | 2,650 | |||||||||
Tokyo Tatemono Co., Ltd. | 40,000 | 435 | |||||||||
Tokyu, Inc. REIT | 53 | 67 | |||||||||
United Urban Investment Corp. REIT | 515 | 699 | |||||||||
20,609 | |||||||||||
Malta (0.0%) | |||||||||||
BGP Holdings PLC (a)(d)(e) | 4,769,371 | — | |||||||||
Netherlands (1.3%) | |||||||||||
Eurocommercial Properties N.V. CVA REIT | 15,675 | 676 | |||||||||
Wereldhave N.V. REIT | 9,217 | 517 | |||||||||
1,193 | |||||||||||
Norway (1.0%) | |||||||||||
Entra ASA (c) | 96,633 | 775 | |||||||||
Norwegian Property ASA (a) | 91,290 | 94 | |||||||||
869 | |||||||||||
The accompanying notes are an integral part of the financial statements.
7
Morgan Stanley Institutional Fund, Inc.
Annual Report — December 31, 2015
Portfolio of Investments (cont'd)
International Real Estate Portfolio
Shares | Value (000) | ||||||||||
Singapore (2.4%) | |||||||||||
Ascendas Real Estate Investment Trust REIT | 213,700 | $ | 342 | ||||||||
CapitaLand Commercial Trust Ltd. REIT | 162,900 | 155 | |||||||||
CapitaLand Ltd. | 370,600 | 870 | |||||||||
CapitaLand Mall Trust REIT | 278,100 | 377 | |||||||||
UOL Group Ltd. | 96,922 | 425 | |||||||||
2,169 | |||||||||||
Sweden (2.1%) | |||||||||||
Atrium Ljungberg AB, Class B | 21,356 | 336 | |||||||||
Castellum AB | 37,079 | 526 | |||||||||
Fabege AB | 7,927 | 130 | |||||||||
Hufvudstaden AB, Class A | 62,869 | 890 | |||||||||
1,882 | |||||||||||
Switzerland (1.9%) | |||||||||||
Mobimo Holding AG (Registered) (a) | 348 | 77 | |||||||||
PSP Swiss Property AG (Registered) (a) | 17,095 | 1,497 | |||||||||
Swiss Prime Site AG (Registered) (a) | 2,114 | 165 | |||||||||
1,739 | |||||||||||
United Kingdom (16.6%) | |||||||||||
British Land Co., PLC REIT | 259,912 | 2,992 | |||||||||
Capital & Counties Properties PLC | 50,956 | 331 | |||||||||
Capital & Regional PLC REIT | 395,387 | 378 | |||||||||
Derwent London PLC REIT | 20,100 | 1,086 | |||||||||
Great Portland Estates PLC REIT | 83,503 | 1,018 | |||||||||
Hammerson PLC REIT | 158,953 | 1,405 | |||||||||
Intu Properties PLC REIT | 236,957 | 1,107 | |||||||||
Land Securities Group PLC REIT | 192,661 | 3,340 | |||||||||
Londonmetric Property PLC REIT | 735 | 2 | |||||||||
LXB Retail Properties PLC (a) | 377,895 | 534 | |||||||||
Segro PLC REIT | 143,469 | 906 | |||||||||
Shaftesbury PLC REIT | 37,479 | 502 | |||||||||
ST Modwen Properties PLC | 53,772 | 328 | |||||||||
Unite Group PLC | 34,394 | 332 | |||||||||
Urban & Civic PLC | 118,549 | 492 | |||||||||
Workspace Group PLC REIT | 21,763 | 307 | |||||||||
15,060 | |||||||||||
Total Common Stocks (Cost $91,631) | 90,081 | ||||||||||
| No. of Rights | |||||||||||
Right (0.0%) | |||||||||||
Singapore (0.0%) | |||||||||||
| Ascendas Real Estate Investment Trust REIT (a) (Cost $—) | 8,013 | — | @ | ||||||||
Shares | Value (000) | ||||||||||
Short-Term Investment (0.7%) | |||||||||||
Investment Company (0.7%) | |||||||||||
| Morgan Stanley Institutional Liquidity Funds — Treasury Portfolio — Institutional Class (See Note G) (Cost $602) | 602,069 | $ | 602 | ||||||||
Total Investments (99.9%) (Cost $92,233) (f)(g) | 90,683 | ||||||||||
Other Assets in Excess of Liabilities (0.1%) | 116 | ||||||||||
Net Assets (100.0%) | $ | 90,799 | |||||||||
(a) Non-income producing security.
(b) Security trades on the Hong Kong exchange.
(c) 144A security — Certain conditions for public sale may exist. Unless otherwise noted, these securities are deemed to be liquid.
(d) Security has been deemed illiquid at December 31, 2015.
(e) At December 31, 2015, the Portfolio held a fair valued security valued at $0, representing 0.0% of net assets. This security has been fair valued as determined in good faith under procedures established by and under the general supervision of the Fund's Directors.
(f) The approximate fair value and percentage of net assets, $90,081,000 and 99.2%, respectively, represent the securities that have been fair valued under the fair valuation policy for international investments as described in Note A-1 within the Notes to the Financial Statements.
(g) At December 31, 2015, the aggregate cost for Federal income tax purposes is approximately $105,843,000. The aggregate gross unrealized appreciation is approximately $3,450,000 and the aggregate gross unrealized depreciation is approximately $18,610,000 resulting in net unrealized depreciation of approximately $15,160,000.
@ Value is less than $500.
CVA Certificaten Van Aandelen.
REIT Real Estate Investment Trust.
Portfolio Composition
Classification | Percentage of Total Investments | ||||||
Diversified | 53.6 | % | |||||
Retail | 21.4 | ||||||
Office | 15.2 | ||||||
Other* | 9.8 | ||||||
Total Investments | 100.0 | % | |||||
* Industries and/or investment types representing less than 5% of total investments.
The accompanying notes are an integral part of the financial statements.
8
Morgan Stanley Institutional Fund, Inc.
Annual Report — December 31, 2015
International Real Estate Portfolio
Statement of Assets and Liabilities | December 31, 2015 (000) | ||||||
Assets: | |||||||
Investments in Securities of Unaffiliated Issuers, at Value (Cost $91,631) | $ | 90,081 | |||||
Investment in Security of Affiliated Issuer, at Value (Cost $602) | 602 | ||||||
Total Investments in Securities, at Value (Cost $92,233) | 90,683 | ||||||
Foreign Currency, at Value (Cost $92) | 86 | ||||||
Dividends Receivable | 150 | ||||||
Tax Reclaim Receivable | 36 | ||||||
Receivable for Investments Sold | 22 | ||||||
Receivable for Portfolio Shares Sold | 19 | ||||||
Receivable from Affiliate | — | @ | |||||
Other Assets | 47 | ||||||
Total Assets | 91,043 | ||||||
Liabilities: | |||||||
Payable for Advisory Fees | 77 | ||||||
Payable for Portfolio Shares Redeemed | 66 | ||||||
Payable for Custodian Fees | 44 | ||||||
Payable for Professional Fees | 25 | ||||||
Payable for Administration Fees | 6 | ||||||
Payable for Sub Transfer Agency Fees — Class I | 3 | ||||||
Payable for Sub Transfer Agency Fees — Class A | 1 | ||||||
Payable for Sub Transfer Agency Fees — Class H | — | @ | |||||
Payable for Sub Transfer Agency Fees — Class L | — | @ | |||||
Payable for Sub Transfer Agency Fees — Class C | — | @ | |||||
Payable for Transfer Agency Fees — Class I | 1 | ||||||
Payable for Transfer Agency Fees — Class A | — | @ | |||||
Payable for Transfer Agency Fees — Class H | — | @ | |||||
Payable for Transfer Agency Fees — Class L | — | @ | |||||
Payable for Transfer Agency Fees — Class C | — | @ | |||||
Payable for Transfer Agency Fees — Class IS | — | @ | |||||
Payable for Directors' Fees and Expenses | 1 | ||||||
Payable for Shareholder Services Fees — Class A | 1 | ||||||
Payable for Shareholder Services Fees — Class H | — | @ | |||||
Payable for Distribution and Shareholder Services Fees — Class L | — | @ | |||||
Payable for Distribution and Shareholder Services Fees — Class C | — | @ | |||||
Payable for Investments Purchased | — | @ | |||||
Other Liabilities | 19 | ||||||
Total Liabilities | 244 | ||||||
Net Assets | $ | 90,799 | |||||
Net Assets Consist Of: | |||||||
Paid-in-Capital | $ | 699,072 | |||||
Distributions in Excess of Net Investment Income | (357 | ) | |||||
Accumulated Net Realized Loss | (606,356 | ) | |||||
Unrealized Appreciation (Depreciation) on: | |||||||
Investments | (1,550 | ) | |||||
Foreign Currency Translations | (10 | ) | |||||
Net Assets | $ | 90,799 | |||||
The accompanying notes are an integral part of the financial statements.
9
Morgan Stanley Institutional Fund, Inc.
Annual Report — December 31, 2015
International Real Estate Portfolio
Statement of Assets and Liabilities (cont'd) | December 31, 2015 (000) | ||||||
CLASS I: | |||||||
Net Assets | $ | 67,459 | |||||
| Shares Outstanding $0.001 par value shares of beneficial interest (unlimited shares authorized) (not in 000's) | 3,603,565 | ||||||
Net Asset Value, Offering and Redemption Price Per Share | $ | 18.72 | |||||
CLASS A: | |||||||
Net Assets | $ | 2,308 | |||||
| Shares Outstanding $0.001 par value shares of beneficial interest (unlimited shares authorized) (not in 000's) | 123,254 | ||||||
Net Asset Value, Redemption Price Per Share | $ | 18.73 | |||||
Maximum Sales Load | 5.25 | % | |||||
Maximum Sales Charge | $ | 1.04 | |||||
Maximum Offering Price Per Share | $ | 19.77 | |||||
CLASS H: | |||||||
Net Assets | $ | 11 | |||||
| Shares Outstanding $0.001 par value shares of beneficial interest (unlimited shares authorized) (not in 000's) | 578 | ||||||
Net Asset Value, Redemption Price Per Share | $ | 18.84 | |||||
Maximum Sales Load | 4.75 | % | |||||
Maximum Sales Charge | $ | 0.94 | |||||
Maximum Offering Price Per Share | $ | 19.78 | |||||
CLASS L: | |||||||
Net Assets | $ | 55 | |||||
| Shares Outstanding $0.001 par value shares of beneficial interest (unlimited shares authorized) (not in 000's) | 2,934 | ||||||
Net Asset Value, Offering and Redemption Price Per Share | $ | 18.61 | |||||
CLASS C: | |||||||
Net Assets | $ | 22 | |||||
| Shares Outstanding $0.001 par value shares of beneficial interest (unlimited shares authorized) (not in 000's) | 1,206 | ||||||
Net Asset Value, Offering and Redemption Price Per Share | $ | 18.50 | |||||
CLASS IS: | |||||||
Net Assets | $ | 20,944 | |||||
| Shares Outstanding $0.001 par value shares of beneficial interest (unlimited shares authorized) (not in 000's) | 1,119,155 | ||||||
Net Asset Value, Offering and Redemption Price Per Share | $ | 18.71 | |||||
@ Amount is less than $500.
The accompanying notes are an integral part of the financial statements.
10
Morgan Stanley Institutional Fund, Inc.
Annual Report — December 31, 2015
International Real Estate Portfolio
Statement of Operations | Year Ended December 31, 2015 (000) | ||||||
Investment Income: | |||||||
Dividends from Securities of Unaffiliated Issuers (Net of $196 of Foreign Taxes Withheld) | $ | 2,755 | |||||
Dividends from Security of Affiliated Issuer (Note G) | — | @ | |||||
Total Investment Income | 2,755 | ||||||
Expenses: | |||||||
Advisory Fees (Note B) | 778 | ||||||
Custodian Fees (Note F) | 159 | ||||||
Professional Fees | 99 | ||||||
Administration Fees (Note C) | 78 | ||||||
Registration Fees | 67 | ||||||
Sub Transfer Agency Fees — Class I | 25 | ||||||
Sub Transfer Agency Fees — Class A | 3 | ||||||
Sub Transfer Agency Fees — Class H | — | @ | |||||
Sub Transfer Agency Fees — Class L | — | @ | |||||
Sub Transfer Agency Fees — Class C | — | @ | |||||
Shareholder Reporting Fees | 16 | ||||||
Transfer Agency Fees — Class I (Note E) | 5 | ||||||
Transfer Agency Fees — Class A (Note E) | 2 | ||||||
Transfer Agency Fees — Class H (Note E) | 2 | ||||||
Transfer Agency Fees — Class L (Note E) | 2 | ||||||
Transfer Agency Fees — Class C (Note E) | 1 | ||||||
Transfer Agency Fees — Class IS (Note E) | 2 | ||||||
Pricing Fees | 11 | ||||||
Shareholder Services Fees — Class A (Note D) | 7 | ||||||
Shareholder Services Fees — Class H (Note D) | — | @ | |||||
Distribution and Shareholder Services Fees — Class L (Note D) | 1 | ||||||
Distribution and Shareholder Services Fees — Class C (Note D) | — | @ | |||||
Directors' Fees and Expenses | 3 | ||||||
Other Expenses | 15 | ||||||
Total Expenses | 1,276 | ||||||
Waiver of Advisory Fees (Note B) | (282 | ) | |||||
Reimbursement of Class Specific Expenses — Class I (Note B) | (4 | ) | |||||
Reimbursement of Class Specific Expenses — Class A (Note B) | (2 | ) | |||||
Reimbursement of Class Specific Expenses — Class H (Note B) | (2 | ) | |||||
Reimbursement of Class Specific Expenses — Class L (Note B) | (2 | ) | |||||
Reimbursement of Class Specific Expenses — Class C (Note B) | (1 | ) | |||||
Reimbursement of Class Specific Expenses — Class IS (Note B) | (2 | ) | |||||
Rebate from Morgan Stanley Affiliate (Note G) | (— | @) | |||||
Net Expenses | 981 | ||||||
Net Investment Income | 1,774 | ||||||
Realized Loss: | |||||||
Investments Sold | (4,922 | ) | |||||
Foreign Currency Transactions | (26 | ) | |||||
Net Realized Loss | (4,948 | ) | |||||
Change in Unrealized Appreciation (Depreciation): | |||||||
Investments | 205 | ||||||
Foreign Currency Translations | (6 | ) | |||||
Net Change in Unrealized Appreciation (Depreciation) | 199 | ||||||
Net Realized Loss and Change in Unrealized Appreciation (Depreciation) | (4,749 | ) | |||||
Net Decrease in Net Assets Resulting from Operations | $ | (2,975 | ) | ||||
@ Amount is less than $500.
The accompanying notes are an integral part of the financial statements.
11
Morgan Stanley Institutional Fund, Inc.
Annual Report — December 31, 2015
International Real Estate Portfolio
Statements of Changes in Net Assets | Year Ended December 31, 2015 (000) | Year Ended December 31, 2014 (000) | |||||||||
Increase (Decrease) in Net Assets: | |||||||||||
Operations: | |||||||||||
Net Investment Income | $ | 1,774 | $ | 2,491 | |||||||
Net Realized Loss | (4,948 | ) | (36,351 | ) | |||||||
Net Change in Unrealized Appreciation (Depreciation) | 199 | 34,120 | |||||||||
Net Increase (Decrease) in Net Assets Resulting from Operations | (2,975 | ) | 260 | ||||||||
Distributions from and/or in Excess of: | |||||||||||
Class I: | |||||||||||
Net Investment Income | (1,912 | ) | (2,415 | ) | |||||||
Class A: | |||||||||||
Net Investment Income | (53 | ) | (58 | ) | |||||||
Class H: | |||||||||||
Net Investment Income | (1 | ) | (2 | ) | |||||||
Class L: | |||||||||||
Net Investment Income | (1 | ) | (1 | ) | |||||||
Class C: | |||||||||||
Net Investment Income | (— | @) | — | ||||||||
Class IS: | |||||||||||
Net Investment Income | (294 | ) | (701 | ) | |||||||
Total Distributions | (2,261 | ) | (3,177 | ) | |||||||
Capital Share Transactions:(1) | |||||||||||
Class I: | |||||||||||
Subscribed | 5,627 | 16,918 | |||||||||
Distributions Reinvested | 1,015 | 1,200 | |||||||||
Redeemed | (29,676 | ) | (53,548 | ) | |||||||
Class A: | |||||||||||
Subscribed | 128 | 306 | |||||||||
Distributions Reinvested | 47 | 52 | |||||||||
Redeemed | (525 | ) | (887 | ) | |||||||
Class H: | |||||||||||
Distributions Reinvested | 1 | 2 | |||||||||
Redeemed | (103 | ) | — | ||||||||
Class L: | |||||||||||
Subscribed | — | 21 | |||||||||
Distributions Reinvested | 1 | 1 | |||||||||
Redeemed | (40 | ) | — | ||||||||
Class C: | |||||||||||
Subscribed | 25 | * | — | ||||||||
Distributions Reinvested | — | @* | — | ||||||||
Redeemed | (— | @)* | — | ||||||||
Class IS: | |||||||||||
Subscribed | 19,970 | 40,510 | |||||||||
Distributions Reinvested | 294 | 701 | |||||||||
Redeemed | (555 | ) | (36,082 | ) | |||||||
Net Decrease in Net Assets Resulting from Capital Share Transactions | (3,791 | ) | (30,806 | ) | |||||||
Redemption Fees | — | @ | 1 | ||||||||
Total Decrease in Net Assets | (9,027 | ) | (33,722 | ) | |||||||
Net Assets: | |||||||||||
Beginning of Period | 99,826 | 133,548 | |||||||||
End of Period (Including Distributions in Excess of Net Investment Income of $(357) and $(193)) | $ | 90,799 | $ | 99,826 | |||||||
The accompanying notes are an integral part of the financial statements.
12
Morgan Stanley Institutional Fund, Inc.
Annual Report — December 31, 2015
International Real Estate Portfolio
Statements of Changes in Net Assets (cont'd) | Year Ended December 31, 2015 (000) | Year Ended December 31, 2014 (000) | |||||||||
(1) Capital Share Transactions: | |||||||||||
Class I: | |||||||||||
Shares Subscribed | 272 | 828 | |||||||||
Shares Issued on Distributions Reinvested | 52 | 60 | |||||||||
Shares Redeemed | (1,473 | ) | (2,641 | ) | |||||||
Net Decrease in Class I Shares Outstanding | (1,149 | ) | (1,753 | ) | |||||||
Class A: | |||||||||||
Shares Subscribed | 6 | 16 | |||||||||
Shares Issued on Distributions Reinvested | 2 | 3 | |||||||||
Shares Redeemed | (26 | ) | (45 | ) | |||||||
Net Decrease in Class A Shares Outstanding | (18 | ) | (26 | ) | |||||||
Class H: | |||||||||||
Shares Issued on Distributions Reinvested | — | @@ | — | @@ | |||||||
Shares Redeemed | (5 | ) | — | ||||||||
Net Increase (Decrease) in Class H Shares Outstanding | (5 | ) | — | @@ | |||||||
Class L: | |||||||||||
Shares Subscribed | — | 1 | |||||||||
Shares Issued on Distributions Reinvested | — | @@ | — | @@ | |||||||
Shares Redeemed | (2 | ) | — | ||||||||
Net Increase (Decrease) in Class L Shares Outstanding | (2 | ) | 1 | ||||||||
Class C: | |||||||||||
Shares Subscribed | 1 | * | — | ||||||||
Shares Issued on Distributions Reinvested | — | @@* | — | ||||||||
Shares Redeemed | (— | @@)* | — | ||||||||
Net Increase in Class C Shares Outstanding | 1 | — | |||||||||
Class IS: | |||||||||||
Shares Subscribed | 1,002 | 1,915 | |||||||||
Shares Issued on Distributions Reinvested | 15 | 36 | |||||||||
Shares Redeemed | (27 | ) | (1,823 | ) | |||||||
Net Increase in Class IS Shares Outstanding | 990 | 128 | |||||||||
* For the period April 30, 2015 through December 31, 2015.
@ Amount is less than $500.
@@ Amount is less than 500 shares.
The accompanying notes are an integral part of the financial statements.
13
Morgan Stanley Institutional Fund, Inc.
Annual Report — December 31, 2015
Financial Highlights
International Real Estate Portfolio
Class I | |||||||||||||||||||||||
Year Ended December 31, | |||||||||||||||||||||||
Selected Per Share Data and Ratios | 2015 | 2014 | 2013 | 2012 | 2011 | ||||||||||||||||||
Net Asset Value, Beginning of Period | $ | 19.84 | $ | 19.99 | $ | 20.16 | $ | 14.66 | $ | 18.85 | |||||||||||||
Income (Loss) from Investment Operations: | |||||||||||||||||||||||
Net Investment Income† | 0.37 | 0.39 | 0.41 | 0.44 | 0.39 | ||||||||||||||||||
Net Realized and Unrealized Gain (Loss) | (1.00 | ) | (0.07 | ) | 0.65 | 5.89 | (4.04 | ) | |||||||||||||||
Total from Investment Operations | (0.63 | ) | 0.32 | 1.06 | 6.33 | (3.65 | ) | ||||||||||||||||
Distributions from and/or in Excess of: | |||||||||||||||||||||||
Net Investment Income | (0.49 | ) | (0.47 | ) | (1.23 | ) | (0.83 | ) | (0.54 | ) | |||||||||||||
Redemption Fees | 0.00 | ‡ | 0.00 | ‡ | 0.00 | ‡ | 0.00 | ‡ | 0.00 | ‡ | |||||||||||||
Net Asset Value, End of Period | $ | 18.72 | $ | 19.84 | $ | 19.99 | $ | 20.16 | $ | 14.66 | |||||||||||||
Total Return++ | (3.29 | )% | 1.61 | % | 5.56 | % | 44.05 | % | (19.92 | )% | |||||||||||||
Ratios and Supplemental Data: | |||||||||||||||||||||||
Net Assets, End of Period (Thousands) | $ | 67,459 | $ | 94,269 | $ | 130,023 | $ | 138,390 | $ | 207,695 | |||||||||||||
Ratio of Expenses to Average Net Assets (1) | 1.00 | %+ | 1.00 | %+ | 1.00 | %+ | 1.00 | %+ | 1.00 | %+ | |||||||||||||
Ratio of Net Investment Income to Average Net Assets (1) | 1.84 | %+ | 1.91 | %+ | 2.00 | %+ | 2.54 | %+ | 2.17 | %+ | |||||||||||||
Ratio of Rebate from Morgan Stanley Affiliates to Average Net Assets | 0.00 | %§ | 0.00 | %§ | 0.00 | %§ | 0.00 | %§ | 0.00 | %§ | |||||||||||||
Portfolio Turnover Rate | 37 | % | 59 | % | 40 | % | 31 | % | 18 | % | |||||||||||||
(1) Supplemental Information on the Ratios to Average Net Assets: | |||||||||||||||||||||||
Ratios Before Expense Limitation: | |||||||||||||||||||||||
Expenses to Average Net Assets | 1.29 | % | 1.16 | % | 1.23 | %+ | 1.12 | % | N/A | ||||||||||||||
Net Investment Income to Average Net Assets | 1.55 | % | 1.75 | % | 1.76 | %+ | 2.42 | % | N/A | ||||||||||||||
† Per share amount is based on average shares outstanding.
‡ Amount is less than $0.005 per share.
++ Calculated based on the net asset value as of the last business day of the period.
+ The Ratios of Expenses and Net Investment Income reflect the rebate of certain Portfolio expenses in connection with the investments in Morgan Stanley affiliates during the period. The effect of the rebate on the ratios is disclosed in the above table as "Ratio of Rebate from Morgan Stanley Affiliates to Average Net Assets."
§ Amount is less than 0.005%.
The accompanying notes are an integral part of the financial statements.
14
Morgan Stanley Institutional Fund, Inc.
Annual Report — December 31, 2015
Financial Highlights
International Real Estate Portfolio
Class A | |||||||||||||||||||||||
Year Ended December 31, | |||||||||||||||||||||||
Selected Per Share Data and Ratios | 2015 | 2014 | 2013 | 2012 | 2011 | ||||||||||||||||||
Net Asset Value, Beginning of Period | $ | 19.84 | $ | 19.98 | $ | 20.14 | $ | 14.65 | $ | 18.83 | |||||||||||||
Income (Loss) from Investment Operations: | |||||||||||||||||||||||
Net Investment Income† | 0.30 | 0.31 | 0.35 | 0.39 | 0.34 | ||||||||||||||||||
Net Realized and Unrealized Gain (Loss) | (1.00 | ) | (0.06 | ) | 0.66 | 5.89 | (4.04 | ) | |||||||||||||||
Total from Investment Operations | (0.70 | ) | 0.25 | 1.01 | 6.28 | (3.70 | ) | ||||||||||||||||
Distributions from and/or in Excess of: | |||||||||||||||||||||||
Net Investment Income | (0.41 | ) | (0.39 | ) | (1.17 | ) | (0.79 | ) | (0.48 | ) | |||||||||||||
Redemption Fees | — | 0.00 | ‡ | 0.00 | ‡ | 0.00 | ‡ | 0.00 | ‡ | ||||||||||||||
Net Asset Value, End of Period | $ | 18.73 | $ | 19.84 | $ | 19.98 | $ | 20.14 | $ | 14.65 | |||||||||||||
Total Return++ | (3.61 | )% | 1.27 | % | 5.28 | % | 43.71 | % | (20.16 | )% | |||||||||||||
Ratios and Supplemental Data: | |||||||||||||||||||||||
Net Assets, End of Period (Thousands) | $ | 2,308 | $ | 2,792 | $ | 3,331 | $ | 4,431 | $ | 3,400 | |||||||||||||
Ratio of Expenses to Average Net Assets (1) | 1.35 | %+ | 1.35 | %+ | 1.27 | %+^ | 1.25 | %+ | 1.25 | %+ | |||||||||||||
Ratio of Net Investment Income to Average Net Assets (1) | 1.48 | %+ | 1.55 | %+ | 1.72 | %+ | 2.23 | %+ | 1.92 | %+ | |||||||||||||
Ratio of Rebate from Morgan Stanley Affiliates to Average Net Assets | 0.00 | %§ | 0.00 | %§ | 0.00 | %§ | 0.00 | %§ | 0.00 | %§ | |||||||||||||
Portfolio Turnover Rate | 37 | % | 59 | % | 40 | % | 31 | % | 18 | % | |||||||||||||
(1) Supplemental Information on the Ratios to Average Net Assets: | |||||||||||||||||||||||
Ratios Before Expense Limitation: | |||||||||||||||||||||||
Expenses to Average Net Assets | 1.70 | % | 1.58 | % | 1.53 | %+ | 1.38 | % | N/A | ||||||||||||||
Net Investment Income to Average Net Assets | 1.13 | % | 1.32 | % | 1.47 | %+ | 2.10 | % | N/A | ||||||||||||||
† Per share amount is based on average shares outstanding.
‡ Amount is less than $0.005 per share.
++ Calculated based on the net asset value which does not reflect sales charges, if applicable, as of the last business day of the period.
+ The Ratios of Expenses and Net Investment Income reflect the rebate of certain Portfolio expenses in connection with the investments in Morgan Stanley affiliates during the period. The effect of the rebate on the ratios is disclosed in the above table as "Ratio of Rebate from Morgan Stanley Affiliates to Average Net Assets."
^ Effective September 16, 2013, the Adviser has agreed to limit the ratio of expenses to average net assets to the maximum ratio of 1.35% for Class A shares. Prior to September 16, 2013, the maximum ratio was 1.25% for Class A shares.
§ Amount is less than 0.005%.
The accompanying notes are an integral part of the financial statements.
15
Morgan Stanley Institutional Fund, Inc.
Annual Report — December 31, 2015
Financial Highlights
International Real Estate Portfolio
Class H | |||||||||||||||||||
Year Ended December 31, | Period from April 27, 2012^ to | ||||||||||||||||||
Selected Per Share Data and Ratios | 2015 | 2014 | 2013 | December 31, 2012 | |||||||||||||||
Net Asset Value, Beginning of Period | $ | 19.79 | $ | 19.95 | $ | 20.13 | $ | 17.31 | |||||||||||
Income (Loss) from Investment Operations: | |||||||||||||||||||
Net Investment Income† | 0.35 | 0.31 | 0.37 | 0.22 | |||||||||||||||
Net Realized and Unrealized Gain (Loss) | (1.06 | ) | (0.07 | ) | 0.63 | 3.40 | |||||||||||||
Total from Investment Operations | (0.71 | ) | 0.24 | 1.00 | 3.62 | ||||||||||||||
Distributions from and/or in Excess of: | |||||||||||||||||||
Net Investment Income | (0.25 | ) | (0.40 | ) | (1.18 | ) | (0.80 | ) | |||||||||||
Redemption Fees | 0.01 | 0.00 | ‡ | — | — | ||||||||||||||
Net Asset Value, End of Period | $ | 18.84 | $ | 19.79 | $ | 19.95 | $ | 20.13 | |||||||||||
Total Return++ | (3.65 | )% | 1.27 | % | 5.27 | % | 21.66 | %# | |||||||||||
Ratios and Supplemental Data: | |||||||||||||||||||
Net Assets, End of Period (Thousands) | $ | 11 | $ | 113 | $ | 111 | $ | 13 | |||||||||||
Ratio of Expenses to Average Net Assets (1) | 1.35 | %+ | 1.35 | %+ | 1.28 | %+^^ | 1.25 | %+* | |||||||||||
Ratio of Net Investment Income to Average Net Assets (1) | 1.68 | %+ | 1.54 | %+ | 1.83 | %+ | 1.85 | %+* | |||||||||||
Ratio of Rebate from Morgan Stanley Affiliates to Average Net Assets | 0.00 | %§ | 0.00 | %§ | 0.00 | %§ | 0.00 | %§* | |||||||||||
Portfolio Turnover Rate | 37 | % | 59 | % | 40 | % | 31 | %# | |||||||||||
(1) Supplemental Information on the Ratios to Average Net Assets: | |||||||||||||||||||
Ratios Before Expense Limitation: | |||||||||||||||||||
Expenses to Average Net Assets | 3.59 | % | 2.92 | % | 1.92 | %+ | 1.43 | %* | |||||||||||
Net Investment Income (Loss) to Average Net Assets | (0.56 | )% | (0.03 | )% | 1.20 | %+ | 1.67 | %* | |||||||||||
^ Commencement of Offering.
† Per share amount is based on average shares outstanding.
‡ Amount is less than $0.005 per share.
++ Calculated based on the net asset value which does not reflect sales charges, if applicable, as of the last business day of the period.
+ The Ratios of Expenses and Net Investment Income reflect the rebate of certain Portfolio expenses in connection with the investments in Morgan Stanley affiliates during the period. The effect of the rebate on the ratios is disclosed in the above table as "Ratio of Rebate from Morgan Stanley Affiliates to Average Net Assets."
^^ Effective September 16, 2013, the Adviser has agreed to limit the ratio of expenses to average net assets to the maximum ratio of 1.35% for Class H shares. Prior to September 16, 2013, the maximum ratio was 1.25% for Class H shares.
§ Amount is less than 0.005%.
# Not Annualized.
* Annualized.
The accompanying notes are an integral part of the financial statements.
16
Morgan Stanley Institutional Fund, Inc.
Annual Report — December 31, 2015
Financial Highlights
International Real Estate Portfolio
Class L | |||||||||||||||||||
Year Ended December 31, | Period from April 27, 2012^ to | ||||||||||||||||||
Selected Per Share Data and Ratios | 2015 | 2014 | 2013 | December 31, 2012 | |||||||||||||||
Net Asset Value, Beginning of Period | $ | 19.69 | $ | 19.86 | $ | 20.13 | $ | 17.31 | |||||||||||
Income (Loss) from Investment Operations: | |||||||||||||||||||
Net Investment Income† | 0.18 | 0.21 | 0.22 | 0.16 | |||||||||||||||
Net Realized and Unrealized Gain (Loss) | (0.97 | ) | (0.06 | ) | 0.68 | 3.40 | |||||||||||||
Total from Investment Operations | (0.79 | ) | 0.15 | 0.90 | 3.56 | ||||||||||||||
Distributions from and/or in Excess of: | |||||||||||||||||||
Net Investment Income | (0.29 | ) | (0.32 | ) | (1.17 | ) | (0.74 | ) | |||||||||||
Redemption Fees | 0.00 | ‡ | 0.00 | ‡ | — | — | |||||||||||||
Net Asset Value, End of Period | $ | 18.61 | $ | 19.69 | $ | 19.86 | $ | 20.13 | |||||||||||
Total Return++ | (4.11 | )% | 0.75 | % | 4.73 | % | 21.28 | %# | |||||||||||
Ratios and Supplemental Data: | |||||||||||||||||||
Net Assets, End of Period (Thousands) | $ | 55 | $ | 95 | $ | 73 | $ | 12 | |||||||||||
Ratio of Expenses to Average Net Assets (1) | 1.85 | %+ | 1.85 | %+ | 1.81 | %+^^ | 1.75 | %+* | |||||||||||
Ratio of Net Investment Income to Average Net Assets (1) | 0.90 | %+ | 1.05 | %+ | 1.08 | %+ | 1.37 | %+* | |||||||||||
Ratio of Rebate from Morgan Stanley Affiliates to Average Net Assets | 0.00 | %§ | 0.00 | %§ | 0.00 | %§ | 0.00 | %§* | |||||||||||
Portfolio Turnover Rate | 37 | % | 59 | % | 40 | % | 31 | %# | |||||||||||
(1) Supplemental Information on the Ratios to Average Net Assets: | |||||||||||||||||||
Ratios Before Expense Limitation: | |||||||||||||||||||
Expenses to Average Net Assets | 4.58 | % | 3.90 | % | 3.44 | %+ | 1.93 | %* | |||||||||||
Net Investment Income (Loss) to Average Net Assets | (1.83 | )% | (1.00 | )% | (0.55 | )%+ | 1.19 | %* | |||||||||||
^ Commencement of Offering.
† Per share amount is based on average shares outstanding.
‡ Amount is less than $0.005 per share.
++ Calculated based on the net asset value as of the last business day of the period.
+ The Ratios of Expenses and Net Investment Income reflect the rebate of certain Portfolio expenses in connection with the investments in Morgan Stanley affiliates during the period. The effect of the rebate on the ratios is disclosed in the above table as "Ratio of Rebate from Morgan Stanley Affiliates to Average Net Assets."
^^ Effective September 16, 2013, the Adviser has agreed to limit the ratio of expenses to average net assets to the maximum ratio of 1.85% for Class L shares. Prior to September 16, 2013, the maximum ratio was 1.75% for Class L shares.
§ Amount is less than 0.005%.
# Not Annualized.
* Annualized.
The accompanying notes are an integral part of the financial statements.
17
Morgan Stanley Institutional Fund, Inc.
Annual Report — December 31, 2015
Financial Highlights
International Real Estate Portfolio
Class C | |||||||
Selected Per Share Data and Ratios | Period from April 30, 2015^ to December 31, 2015 | ||||||
Net Asset Value, Beginning of Period | $ | 21.28 | |||||
Income (Loss) from Investment Operations: | |||||||
Net Investment Income† | 0.06 | ||||||
Net Realized and Unrealized Loss | (2.48 | ) | |||||
Total from Investment Operations | (2.42 | ) | |||||
Distributions from and/or in Excess of: | |||||||
Net Investment Income | (0.36 | ) | |||||
Redemption Fees | 0.00 | ‡ | |||||
Net Asset Value, End of Period | $ | 18.50 | |||||
Total Return++ | (11.47 | )%# | |||||
Ratios and Supplemental Data: | |||||||
Net Assets, End of Period (Thousands) | $ | 22 | |||||
Ratios of Expenses to Average Net Assets (1) | 2.10 | %+* | |||||
Ratio of Net Investment Income to Average Net Assets (1) | 0.45 | %+* | |||||
Ratio of Rebate from Morgan Stanley Affiliates to Average Net Assets | 0.00 | %§* | |||||
Portfolio Turnover Rate | 37 | % | |||||
(1) Supplemental Information on the Ratios to Average Net Assets: | |||||||
Ratios Before Expense Limitation: | |||||||
Expense to Average Net Assets | 10.98 | %* | |||||
Net Investment Loss to Average Net Assets | (8.43 | )%* | |||||
^ Commencement of Offering.
† Per share amount is based on average shares outstanding.
‡ Amount is less than $0.005 per share.
++ Calculated based on the net asset value which does not reflect sales charges, if applicable, as of the last business day of the period.
+ The Ratios of Expenses and Net Investment Income reflect the rebate of certain Portfolio expenses in connection with the investments in Morgan Stanley affiliates during the period. The effect of the rebate on the ratios is disclosed in the above table as "Ratio of Rebate from Morgan Stanley Affiliates to Average Net Assets."
§ Amount is less than 0.005%.
# Not Annualized.
* Annualized.
The accompanying notes are an integral part of the financial statements.
18
Morgan Stanley Institutional Fund, Inc.
Annual Report — December 31, 2015
Financial Highlights
International Real Estate Portfolio
Class IS | |||||||||||||||
Year Ended December 31, | Period from September 13, 2013^ to | ||||||||||||||
Selected Per Share Data and Ratios | 2015 | 2014 | December 31, 2013 | ||||||||||||
Net Asset Value, Beginning of Period | $ | 19.83 | $ | 19.99 | $ | 19.97 | |||||||||
Income (Loss) from Investment Operations: | |||||||||||||||
Net Investment Income† | 0.37 | 0.23 | 0.11 | ||||||||||||
Net Realized and Unrealized Gain (Loss) | (1.00 | ) | 0.09 | 0.22 | |||||||||||
Total from Investment Operations | (0.63 | ) | 0.32 | 0.33 | |||||||||||
Distributions from and/or in Excess of: | |||||||||||||||
Net Investment Income | (0.49 | ) | (0.48 | ) | (0.31 | ) | |||||||||
Redemption Fees | 0.00 | ‡ | 0.00 | ‡ | — | ||||||||||
Net Asset Value, End of Period | $ | 18.71 | $ | 19.83 | $ | 19.99 | |||||||||
Total Return++ | (3.26 | )% | 1.60 | % | 1.68 | %# | |||||||||
Ratios and Supplemental Data: | |||||||||||||||
Net Assets, End of Period (Thousands) | $ | 20,944 | $ | 2,557 | $ | 10 | |||||||||
Ratio of Expenses to Average Net Assets (1) | 0.97 | %+ | 0.97 | %+ | 0.97 | %+^^* | |||||||||
Ratio of Net Investment Income to Average Net Assets (1) | 1.86 | %+ | 1.14 | %+ | 1.76 | %+* | |||||||||
Ratio of Rebate from Morgan Stanley Affiliates to Average Net Assets | 0.00 | %§ | 0.00 | %§ | 0.00 | %§* | |||||||||
Portfolio Turnover Rate | 37 | % | 59 | % | 40 | %# | |||||||||
(1) Supplemental Information on the Ratios to Average Net Assets: | |||||||||||||||
Ratios Before Expense Limitation | |||||||||||||||
Expenses to Average Net Assets | 1.30 | % | 1.13 | % | 6.46 | %* | |||||||||
Net Investment Income (Loss) to Average Net Assets | 1.53 | % | 0.98 | % | (3.73 | )%* | |||||||||
^ Commencement of Offering.
† Per share amount is based on average shares outstanding.
‡ Amount is less than $0.005 per share.
++ Calculated based on the net asset value as of the last business day of the period.
+ The Ratios of Expenses and Net Investment Income reflect the rebate of certain Portfolio expenses in connection with the investments in Morgan Stanley affiliates during the period. The effect of the rebate on the ratios is disclosed in the above table as "Ratio of Rebate from Morgan Stanley Affiliates to Average Net Assets."
^^ Effective September 16, 2013, the Adviser has agreed to limit the ratio of expenses to average net assets to the maximum ratio of 0.97% for Class IS shares.
§ Amount is less than 0.005%.
# Not Annualized.
* Annualized.
The accompanying notes are an integral part of the financial statements.
19
Morgan Stanley Institutional Fund, Inc.
Annual Report — December 31, 2015
Notes to Financial Statements
Morgan Stanley Institutional Fund, Inc. (the "Fund") is registered under the Investment Company Act of 1940, as amended (the "Act"), as an open-end management investment company. The Fund is comprised of twenty-six separate, active, diversified and non-diversified portfolios (individually referred to as a "Portfolio", collectively as the "Portfolios"). The Fund applies investment company accounting and reporting guidance.
The accompanying financial statements relate to the International Real Estate Portfolio. The Portfolio's adviser, Morgan Stanley Investment Management Inc. (the "Adviser") and sub-advisers, Morgan Stanley Investment Management Limited ("MSIM Limited") and Morgan Stanley Investment Management Company ("MSIM Company") (together, the "Sub-Advisers"), seek a combination of current income and long-term capital appreciation by investing primarily in equity securities of companies in the real estate industry located throughout the world (excluding the United States and Canada).
The Portfolio offers six classes of shares — Class I, Class A, Class H, Class L, Class C and Class IS. The Portfolio's Class H shares are currently closed to all investors. On April 30, 2015, the Portfolio commenced offering Class C shares and suspended offering of Class L shares. Existing Class L shareholders may invest through reinvestment of dividends and distributions.
A. Significant Accounting Policies: The following significant accounting policies are in conformity with U.S. generally accepted accounting principles ("GAAP"). Such policies are consistently followed by the Fund in the preparation of its financial statements. GAAP may require management to make estimates and assumptions that affect the reported amounts and disclosures in the financial statements. Actual results may differ from those estimates.
1. Security Valuation: (1) An equity portfolio security listed or traded on an exchange is valued at its latest reported sales price (or at the exchange official closing price if such exchange reports an official closing price), if there were no sales on a given day, the security is valued at the mean between the last reported bid and asked prices; (2) all other equity portfolio securities for which over-the-counter ("OTC") market quotations are readily available are valued at its latest reported sales price. In cases where a security is traded on more than one exchange, the security is valued on the exchange designated as the primary market; (3) when market quotations are not readily available, including circumstances under which the Adviser or Sub-Advisers determine that the closing price,
last sale price or the mean between the last reported bid and asked prices are not reflective of a security's market value, portfolio securities are valued at their fair value as determined in good faith under procedures established by and under the general supervision of the Fund's Board of Directors (the "Directors"). Occasionally, developments affecting the closing prices of securities and other assets may occur between the times at which valuations of such securities are determined (that is, close of the foreign market on which the securities trade) and the close of business of the New York Stock Exchange ("NYSE"). If developments occur during such periods that are expected to materially affect the value of such securities, such valuations may be adjusted to reflect the estimated fair value of such securities as of the close of the NYSE, as determined in good faith by the Directors or by the Adviser using a pricing service and/or procedures approved by the Directors; (4) quotations of foreign portfolio securities, other assets and liabilities and forward contracts stated in foreign currency are translated into U.S. dollar equivalents at the prevailing market rates prior to the close of the NYSE; (5) investments in mutual funds, including the Morgan Stanley Institutional Liquidity Funds, are valued at the net asset value ("NAV") as of the close of each business day; and (6) short-term debt securities with remaining maturities of 60 days or less at the time of purchase may be valued at amortized cost, unless the Adviser determines such valuation does not reflect the securities' market value, in which case these securities will be valued at their fair market value determined by the Adviser.
The Directors have responsibility for determining in good faith the fair value of the investments, and the Directors may appoint others, such as the Fund's Adviser or a valuation committee, to assist the Directors in determining fair value and to make the actual calculations pursuant to the fair valuation methodologies previously approved by the Directors. Under procedures approved by the Directors, the Fund's Adviser has formed a Valuation Committee whose members are approved by the Directors. The Valuation Committee provides administration and oversight of the Fund's valuation policies and procedures, which are reviewed at least annually by the Directors. These procedures allow the Fund to utilize independent pricing services, quotations from securities and financial instrument dealers, and other market sources to determine fair value.
20
Morgan Stanley Institutional Fund, Inc.
Annual Report — December 31, 2015
Notes to Financial Statements (cont'd)
The Fund has procedures to determine the fair value of securities and other financial instruments for which market prices are not readily available. Under these procedures, the Valuation Committee convenes on a regular and ad hoc basis to review such securities and considers a number of factors, including valuation methodologies and significant unobservable valuation inputs, when arriving at fair value. The Valuation Committee may employ a market-based approach which may use related or comparable assets or liabilities, recent transactions, market multiples, book values, and other relevant information for the investment to determine the fair value of the investment. An income-based valuation approach may also be used in which the anticipated future cash flows of the investment are discounted to calculate fair value. Discounts may also be applied due to the nature or duration of any restrictions on the disposition of the investments. Due to the inherent uncertainty of valuations of such investments, the fair values may differ significantly from the values that would have been used had an active market existed. The Valuation Committee employs various methods for calibrating these valuation approaches including a regular review of valuation methodologies, key inputs and assumptions, transactional back-testing or disposition analysis, and reviews of any related market activity.
The Portfolio invests a significant portion of its assets in securities of real estate investment trusts ("REITs"). The market's perception of prospective declines in private real estate values and other financial assets may result in increased volatility of market prices that can negatively impact the valuation of certain issuers held by the Portfolio.
2. Fair Value Measurement: Financial Accounting Standards Board ("FASB") Accounting Standards CodificationTM ("ASC") 820, "Fair Value Measurement" ("ASC 820"), defines fair value as the value that the Fund would receive to sell an investment or pay to transfer a liability in a timely transaction with an independent buyer in the principal market, or in the absence of a principal market the most advantageous market for the investment or liability. ASC 820 establishes a three-tier hierarchy to distinguish between (1) inputs that reflect the assumptions market participants would use in valuing an asset or liability developed based on market data obtained from sources independent of the reporting entity (observable inputs) and (2) inputs that reflect the reporting entity's own
assumptions about the assumptions market participants would use in valuing an asset or liability developed based on the best information available in the circumstances (unobservable inputs) and to establish classification of fair value measurements for disclosure purposes. Various inputs are used in determining the value of the Fund's investments. The inputs are summarized in the three broad levels listed below.
• Level 1 – unadjusted quoted prices in active markets for identical investments
• Level 2 – other significant observable inputs (including quoted prices for similar investments, interest rates, prepayment speeds, credit risk, etc.)
• Level 3 – significant unobservable inputs including the Fund's own assumptions in determining the fair value of investments. Factors considered in making this determination may include, but are not limited to, information obtained by contacting the issuer, analysts, or the appropriate stock exchange (for exchange-traded securities), analysis of the issuer's financial statements or other available documents and, if necessary, available information concerning other securities in similar circumstances
The inputs or methodology used for valuing securities are not necessarily an indication of the risk associated with investing in those securities and the determination of the significance of a particular input to the fair value measurement in its entirety requires judgment and considers factors specific to each security.
The following is a summary of the inputs used to value the Portfolio's investments as of December 31, 2015.
Investment Type | Level 1 Unadjusted quoted prices (000) | Level 2 Other significant observable inputs (000) | Level 3 Significant unobservable inputs (000) | Total (000) | |||||||||||||||
Assets: | |||||||||||||||||||
Common Stocks | |||||||||||||||||||
Diversified | $ | — | $ | 48,629 | $ | — | † | $ | 48,629 | † | |||||||||
Industrial | — | 3,850 | — | 3,850 | |||||||||||||||
Mixed Industrial/Office | — | 561 | — | 561 | |||||||||||||||
Office | — | 13,808 | — | 13,808 | |||||||||||||||
Residential | — | 3,850 | — | 3,850 | |||||||||||||||
Retail | — | 19,383 | — | 19,383 | |||||||||||||||
Total Common Stocks | — | 90,081 | — | † | 90,081 | † | |||||||||||||
21
Morgan Stanley Institutional Fund, Inc.
Annual Report — December 31, 2015
Notes to Financial Statements (cont'd)
Investment Type | Level 1 Unadjusted quoted prices (000) | Level 2 Other significant observable inputs (000) | Level 3 Significant unobservable inputs (000) | Total (000) | |||||||||||||||
Right | $ | — | $ | — | @ | $ | — | $ | — | @ | |||||||||
Short-Term Investment | |||||||||||||||||||
Investment Company | 602 | — | — | 602 | |||||||||||||||
Total Assets | $ | 602 | $ | 90,081 | $ | — | † | $ | 90,683 | † | |||||||||
@ Value is less than $500.
† Includes one security which is valued at zero.
Transfers between investment levels may occur as the markets fluctuate and/or the availability of data used in an investment's valuation changes. The Portfolio recognizes transfers between the levels as of the end of the period. As of December 31, 2015, securities with a total value of approximately $170,000 transferred from Level 1 to Level 2. Securities that were valued using unadjusted quoted prices at December 31, 2014 were valued using other significant observable inputs at December 31, 2015. At December 31, 2015, the fair value of certain securities were adjusted due to developments which occurred between the time of the close of the foreign markets on which they trade and the close of business on the NYSE which resulted in their Level 2 classification.
Following is a reconciliation of investments in which significant unobservable inputs (Level 3) were used in determining fair value.
| Common Stock (000) | |||||||
Beginning Balance | $ | — | † | �� | |||
Purchases | — | ||||||
Sales | — | ||||||
Amortization of discount | — | ||||||
Transfers in | — | ||||||
Transfers out | — | ||||||
Corporate actions | — | ||||||
Change in unrealized appreciation (depreciation) | — | ||||||
Realized gains (losses) | — | ||||||
Ending Balance | $ | — | † | ||||
| Net change in unrealized appreciation (depreciation) from investments still held as of December 31, 2015 | $ | — | |||||
† Includes one security which is valued at zero.
3. Foreign Currency Translation and Foreign Investments: The books and records of the Portfolio are maintained in U.S. dollars. Foreign currency amounts are translated into U.S. dollars as follows:
– investments, other assets and liabilities at the prevailing rate of exchange on the valuation date;
– investment transactions and investment income at the prevailing rates of exchange on the dates of such transactions.
Although the net assets of the Portfolio are presented at the foreign exchange rates and market values at the close of the period, the Portfolio does not isolate that portion of the results of operations arising as a result of changes in the foreign exchange rates from the fluctuations arising from changes in the market prices of securities held at period end. Similarly, the Portfolio does not isolate the effect of changes in foreign exchange rates from the fluctuations arising from changes in the market prices of securities sold during the period. Accordingly, realized and unrealized foreign currency gains (losses) on investments in securities are included in the reported net realized and unrealized gains (losses) on investment transactions and balances. However, pursuant to U.S. Federal income tax regulations, gains and losses from certain foreign currency transactions and the foreign currency portion of gains and losses realized on sales and maturities of foreign denominated debt securities are treated as ordinary income for U.S. Federal income tax purposes.
Net realized gains (losses) on foreign currency transactions represent net foreign exchange gains (losses) from foreign currency forward exchange contracts, disposition of foreign currencies, currency gains (losses) realized between the trade and settlement dates on securities transactions, and the difference between the amount of investment income and foreign withholding taxes recorded on the Portfolio's books and the U.S. dollar equivalent amounts actually received or paid. Net unrealized currency gains (losses) from valuing foreign currency denominated assets and liabilities at period end exchange rates are reflected as a component of unrealized appreciation (depreciation) in the Statement of Assets and Liabilities. The change in unrealized currency gains (losses) on foreign currency translations for the period is reflected in the Statement of Operations.
22
Morgan Stanley Institutional Fund, Inc.
Annual Report — December 31, 2015
Notes to Financial Statements (cont'd)
Foreign security and currency transactions may involve certain considerations and risks not typically associated with those of U.S. dollar denominated transactions as a result of, among other factors, fluctuations of exchange rates in relation to the U.S. dollar, the possibility of lower levels of governmental supervision and regulation of foreign securities markets and the possibility of political or economic instability.
Governmental approval for foreign investments may be required in advance of making an investment under certain circumstances in some countries, and the extent of foreign investments in domestic companies may be subject to limitation in other countries. Foreign ownership limitations also may be imposed by the charters of individual companies to prevent, among other concerns, violations of foreign investment limitations. As a result, an additional class of shares (identified as "Foreign" in the Portfolio of Investments) may be created and offered for investment. The "local" and "foreign shares" market values may differ. In the absence of trading of the foreign shares in such markets, the Portfolio values the foreign shares at the closing exchange price of the local shares.
4. Redemption Fees: The Portfolio will assess a 2% redemption fee on Class I shares, Class A shares, Class H, Class L shares, Class C shares and Class IS shares, which is paid directly to the Portfolio, for shares redeemed or exchanged within thirty days of purchase, subject to certain exceptions. The redemption fee is designed to protect the Portfolio and its remaining shareholders from the effects of short-term trading. These fees, if any, are included in the Statements of Changes in Net Assets.
5. Indemnifications: The Fund enters into contracts that contain a variety of indemnifications. The Fund's maximum exposure under these arrangements is unknown. However, the Fund has not had prior claims or losses pursuant to these contracts and expects the risk of loss to be remote.
6. Dividends and Distributions to Shareholders: Dividend income and distributions to shareholders are recorded on the ex-dividend date. Dividends from net investment income, if any, are declared and paid annually. Net realized capital gains, if any, are distributed at least annually.
7. Security Transactions, Income and Expenses: Security transactions are accounted for on the trade date
(date the order to buy or sell is executed). Realized gains and losses on the sale of investment securities are determined on the specific identified cost method. Dividend income and other distributions are recorded on the ex-dividend date (except for certain foreign dividends which may be recorded as soon as the Portfolio is informed of such dividends) net of applicable withholding taxes. Interest income is recognized on the accrual basis except where collection is in doubt. Discounts are accreted and premiums are amortized over the life of the respective securities. Most expenses of the Fund can be directly attributed to a particular Portfolio. Expenses which cannot be directly attributed are apportioned among the Portfolios based upon relative net assets or other appropriate methods. Income, expenses (other than class specific expenses — distribution and shareholder services, transfer agency and sub transfer agency fees) and realized and unrealized gains or losses are allocated to each class of shares based upon their relative net assets.
The Portfolio owns shares of REITs which report information on the source of their distributions annually in the following calendar year. A portion of distributions received from REITs during the year is estimated to be a return of capital and is recorded as a reduction of their cost.
B. Advisory/Sub-Advisory Fees: The Adviser, a wholly-owned subsidiary of Morgan Stanley, provides the Portfolio with advisory services under the terms of an Investment Advisory Agreement, paid quarterly, at an annual rate of 0.80% of the daily net assets of the Portfolio.
The Adviser has agreed to reduce its advisory fee and/or reimburse the Portfolio so that total annual portfolio operating expenses, excluding certain investment related expenses, taxes, interest and other extraordinary expenses (including litigation), will not exceed 1.00% for Class I shares, 1.35% for Class A shares, 1.35% for Class H, 1.85% for Class L shares, 2.10% for Class C shares and 0.97% for Class IS shares. The fee waivers and/or expense reimbursements will continue for at least one year from the date of the Portfolio's prospectus or until such time as the Directors act to discontinue all or a portion of such waivers and/or reimbursements when they deem such action is appropriate. For the year ended December 31, 2015, approximately $282,000 of advisory fees were waived and approximately $13,000 of other expenses were reimbursed by the Adviser pursuant to this arrangement.
23
Morgan Stanley Institutional Fund, Inc.
Annual Report — December 31, 2015
Notes to Financial Statements (cont'd)
The Adviser has entered into a Sub-Advisory Agreement with the Sub-Advisers, each a wholly-owned subsidiary of Morgan Stanley. The Sub-Advisers provide the Portfolio with advisory services subject to the overall supervision of the Adviser and the Fund's Officers and Directors. The Adviser pays the Sub-Advisers on a monthly basis a portion of the net advisory fees the Adviser receives from the Portfolio.
C. Administration Fees: The Adviser also serves as Administrator to the Fund and provides administrative services pursuant to an Administration Agreement for an annual fee, accrued daily and paid monthly, of 0.08% of the Portfolio's average daily net assets.
Under a Sub-Administration Agreement between the Administrator and State Street Bank and Trust Company ("State Street"), State Street provides certain administrative services to the Fund. For such services, the Administrator pays State Street a portion of the fee the Administrator receives from the Portfolio.
D. Distribution and Shareholder Services Fees: Morgan Stanley Distribution, Inc. ("MSDI" or the "Distributor"), a wholly-owned subsidiary of the Adviser and Sub-Advisers and an indirect subsidiary of Morgan Stanley, serves as the Fund's Distributor of Portfolio shares pursuant to a Distribution Agreement. The Fund has adopted Shareholder Services Plan with respect to Class A and Class H shares pursuant to Rule 12b-1 under the Act. Under the Shareholder Services Plan, the Portfolio pays the Distributor a shareholder services fee, accrued daily and paid monthly, at an annual rate of 0.25% of the Portfolio's average daily net assets attributable to Class A and Class H shares.
The Fund has adopted a Distribution and Shareholder Services Plan with respect to Class L shares pursuant to Rule 12b-1 under the Act. Under the Distribution and Shareholder Services Plan, the Portfolio pays the Distributor a distribution fee, accrued daily and paid monthly, at an annual rate of 0.50% and a shareholder services fee, accrued daily and paid monthly, at an annual rate of 0.25% of the Portfolio's average daily net assets attributable to Class L shares.
The Fund has adopted a Distribution and Shareholder Services Plan with respect to Class C shares pursuant to Rule 12b-1 under the Act. Under the Distribution and Shareholder Services Plan, the Portfolio pays the Distributor a distribution fee, accrued daily and paid monthly, at an annual rate of 0.75% and a shareholder services fee, accrued daily and paid monthly, at an annual rate of 0.25% of the Portfolio's average daily net assets attributable to Class C shares.
The distribution and shareholder services fees are used to support the expenses associated with servicing and maintaining accounts. The Distributor may compensate other parties for providing shareholder support services to investors who purchase Class A, Class H, Class L and Class C shares.
E. Dividend Disbursing and Transfer Agent: The Fund's dividend disbursing and transfer agent is Boston Financial Data Services, Inc. ("BFDS"). Pursuant to a Transfer Agency Agreement, the Fund pays BFDS a fee based on the number of classes, accounts and transactions relating to the Portfolios of the Fund.
F. Custodian Fees: State Street (the "Custodian") serves as Custodian for the Fund in accordance with a Custodian Agreement. The Custodian holds cash, securities, and other assets of the Fund as required by the Act. Custody fees are payable monthly based on assets held in custody, investment purchases and sales activity and account maintenance fees, plus reimbursement for certain out-of-pocket expenses.
G. Security Transactions and Transactions with Affiliates: For the year ended December 31, 2015, purchases and sales of investment securities for the Portfolio, other than long-term U.S. Government securities and short-term investments, were approximately $35,807,000 and $50,183,000, respectively. There were no purchases and sales of long-term U.S. Government securities for the year ended December 31, 2015.
The Portfolio invests in the Institutional Class of the Morgan Stanley Institutional Liquidity Funds — Treasury Portfolio (the "Liquidity Funds"), an open-end management investment company managed by the Adviser. Advisory fees paid by the Portfolio are reduced by an amount equal to its pro-rata share of the advisory and administration fees paid by the Portfolio due to its investment in the Liquidity Funds. For the year ended December 31, 2015, advisory fees paid were reduced by less than $500 relating to the Portfolio's investment in the Liquidity Funds.
A summary of the Portfolio's transactions in shares of the Liquidity Funds during the year ended December 31, 2015 is as follows:
| Value December 31, 2014 (000) | Purchases at Cost (000) | Sales (000) | Dividend Income (000) | Value December 31, 2015 (000) | |||||||||||||||
| $ | 174 | $ | 29,492 | $ | 29,064 | $ | — | @ | $ | 602 | |||||||||
@ Amount is less than $500.
24
Morgan Stanley Institutional Fund, Inc.
Annual Report — December 31, 2015
Notes to Financial Statements (cont'd)
During the year ended December 31, 2015, the Portfolio incurred approximately $1,000 in brokerage commissions with Morgan Stanley & Co., LLC, an affiliate of the Adviser/Administrator, Sub-Advisers and Distributor, for portfolio transactions executed on behalf of the Portfolio.
The Portfolio has an unfunded Deferred Compensation Plan (the "Compensation Plan"), which allows each independent Director to defer payment of all, or a portion, of the fees he or she receives for serving on the Board of Directors. Each eligible Director generally may elect to have the deferred amounts credited with a return equal to the total return on one or more of the Morgan Stanley funds that are offered as investment options under the Compensation Plan. Appreciation/depreciation and distributions received from these investments are recorded with an offsetting increase/decrease in the deferred compensation obligation and do not affect the NAV of the Portfolio.
H. Federal Income Taxes: It is the Portfolio's intention to continue to qualify as a regulated investment company and distribute all of its taxable and tax-exempt income. Accordingly, no provision for Federal income taxes is required in the financial statements.
The Portfolio may be subject to taxes imposed by countries in which it invests. Such taxes are generally based on income and/or capital gains earned or repatriated. Taxes are accrued based on net investment income, net realized gains and net unrealized appreciation as such income and/or gains are earned. Taxes may also be based on transactions in foreign currency and are accrued based on the value of investments denominated in such currency.
FASB ASC 740-10, "Income Taxes — Overall", sets forth a minimum threshold for financial statement recognition of the benefit of a tax position taken or expected to be taken in a tax return. Management has concluded there are no significant uncertain tax positions that would require recognition in the financial statements. If applicable, the Portfolio recognizes interest accrued related to unrecognized tax benefits in "Interest Expense" and penalties in "Other Expenses" in the Statement of Operations. The Portfolio files tax returns with the U.S. Internal Revenue Service, New York and various states. Generally, each of the tax years in the four-year period ended December 31, 2015, remains subject to examination by taxing authorities.
The tax character of distributions paid may differ from the character of distributions shown in the Statements of Changes in Net Assets due to short-term capital gains being treated as
ordinary income for tax purposes. The tax character of distributions paid during fiscal 2015 and 2014 was as follows:
| 2015 Distributions Paid From: | 2014 Distributions Paid From: | ||||||||||||||
| Ordinary Income (000) | Long-Term Capital Gain (000) | Ordinary Income (000) | Long-Term Capital Gain (000) | ||||||||||||
| $ | 2,263 | $ | — | $ | 3,177 | $ | — | ||||||||
The amount and character of income and gains to be distributed are determined in accordance with income tax regulations which may differ from GAAP. These book/tax differences are either considered temporary or permanent in nature.
Temporary differences are primarily due to differing book and tax treatments in the timing of the recognition of gains (losses) on certain investment transactions and the timing of the deductibility of certain expenses.
Permanent differences, primarily due to differing treatments of gains (losses) related to foreign currency transactions and basis adjustments on certain equity securities designated as passive foreign investment companies, resulted in the following reclassifications among the components of net assets at December 31, 2015:
| Distributions in Excess of Net Investment Income (000) | Accumulated Net Realized Loss (000) | Paid-in- Capital (000) | |||||||||
| $ | 323 | $ | (329 | ) | $ | 6 | |||||
At December 31, 2015, the components of distributable earnings for the Portfolio on a tax basis were as follows:
| Undistributed Ordinary Income (000) | Undistributed Long-Term Capital Gain (000) | ||||||
| $ | 454 | $ | — | ||||
At December 31, 2015, the Portfolio had available for Federal income tax purposes unused short-term capital losses of approximately $2,733,000 and long-term capital losses of approximately $207,449,000 that do not have an expiration date.
In addition, at December 31, 2015, the Portfolio had available capital loss carryforwards to offset future net capital gains, to the extent provided by regulations, through the indicated expiration dates:
| Amount (000) | Expiration | ||||||
| $ | 98,798 | December 31, 2016 | |||||
| 217,627 | December 31, 2017 | ||||||
| 66,872 | December 31, 2018 | ||||||
25
Morgan Stanley Institutional Fund, Inc.
Annual Report — December 31, 2015
Notes to Financial Statements (cont'd)
To the extent that capital loss carryforwards are used to offset any future capital gains realized during the carryover period as provided by U.S. Federal income tax regulations, no capital gains tax liability will be incurred by the Portfolio for gains realized and not distributed. To the extent that capital gains are offset, such gains will not be distributed to the shareholders.
I. Other: At December 31, 2015, the Portfolio had record owners of 10% or greater. Investment activities of these shareholders could have a material impact on the Portfolio. The aggregate percentage of such owners was 61.6%.
26
Morgan Stanley Institutional Fund, Inc.
Annual Report — December 31, 2015
Report of Independent Registered Public Accounting Firm
To the Shareholders and Board of Directors of
Morgan Stanley Institutional Fund, Inc. —
International Real Estate Portfolio
We have audited the accompanying statement of assets and liabilities, including the portfolio of investments, of International Real Estate Portfolio (one of the portfolios constituting Morgan Stanley Institutional Fund, Inc.) (the "Portfolio") as of December 31, 2015, and the related statement of operations for the year then ended, the statements of changes in net assets for each of the two years in the period then ended and the financial highlights for each of the years or periods indicated therein. These financial statements and financial highlights are the responsibility of the Portfolio's management. Our responsibility is to express an opinion on these financial statements and financial highlights based on our audits.
We conducted our audits in accordance with the standards of the Public Company Accounting Oversight Board (United States). Those standards require that we plan and perform the audit to obtain reasonable assurance about whether the financial statements and financial highlights are free of material misstatement. We were not engaged to perform an audit of the Portfolio's internal control over financial reporting. Our audits included consideration of internal control over financial reporting as a basis for designing audit procedures that are appropriate in the circumstances, but not for the purpose of expressing an opinion on the effectiveness of the Portfolio's internal control over financial reporting. Accordingly, we express no such opinion. An audit also includes examining, on a test basis, evidence supporting the amounts and disclosures in the financial statements and financial highlights, assessing the accounting principles used and significant estimates made by management, and evaluating the overall financial statement presentation. Our procedures included confirmation of securities owned as of December 31, 2015, by correspondence with the custodian and others or by other appropriate auditing procedures where replies from others were not received. We believe that our audits provide a reasonable basis for our opinion.
In our opinion, the financial statements and financial highlights referred to above present fairly, in all material respects, the financial position of International Real Estate Portfolio (one of the portfolios constituting Morgan Stanley Institutional Fund, Inc.) at December 31, 2015 the results of its operations for the year then ended, the changes in its net assets for each of the two years in the period then ended and the financial highlights for each of the years or periods indicated therein, in conformity with U.S. generally accepted accounting principles.

Boston, Massachusetts
February 26, 2016
27
Morgan Stanley Institutional Fund, Inc.
Annual Report — December 31, 2015
Federal Tax Notice (unaudited)
For Federal income tax purposes, the following information is furnished with respect to the Portfolio's earnings for the taxable year ended December 31, 2015.
When distributed, certain earnings may be subject to a maximum tax rate of 15% as provided for the Jobs and Growth Tax Relief Reconciliation Act of 2003. The Portfolio designated up to a maximum of approximately $1,009,000 as taxable at this lower rate.
The Portfolio intends to pass through foreign tax credits of approximately $123,000, and has derived net income from sources within foreign countries amounting to approximately $2,784,000.
In January, the Portfolio provides tax information to shareholders for the preceding calendar year.
28
Morgan Stanley Institutional Fund, Inc.
Annual Report — December 31, 2015
U.S. Privacy Policy (unaudited)
AN IMPORTANT NOTICE CONCERNING OUR U.S. PRIVACY POLICY
This privacy notice describes the U.S. privacy policy of Morgan Stanley Distribution, Inc., and the Morgan Stanley family of mutual funds ("us", "our", "we").
We are required by federal law to provide you with notice of our U.S. privacy policy ("Policy"). This Policy applies to both our current and former clients unless we state otherwise and is intended for individual clients who purchase products or receive services from us for personal, family or household purposes. This Policy is not applicable to partnerships, corporations, trusts or other non-individual clients or account holders, nor is this Policy applicable to individuals who are either beneficiaries of a trust for which we serve as trustee or participants in an employee benefit plan administered or advised by us. This Policy is, however, applicable to individuals who select us to be a custodian of securities or assets in individual retirement accounts, 401(k) accounts, or accounts subject to the Uniform Gifts to Minors Act.
This notice sets out our business practices to protect your privacy; how we collect and share personal information about you; and how you can limit our sharing or certain uses by others of this information. We may amend this Policy at any time, and will inform you of any changes to our Policy as required by law.
WE RESPECT YOUR PRIVACY
We appreciate that you have provided us with your personal financial information and understand your concerns about your information. We strive to safeguard the information our clients entrust to us. Protecting the confidentiality and security of client information is an important part of how we conduct our business.
This notice describes what personal information we collect about you, how we collect it, when we may share it with others, and how certain others may use it. It discusses the steps you may take to limit our sharing of certain information about you with our affiliated companies, including, but not limited to our affiliated banking businesses, brokerage firms and credit service affiliates. It also discloses how you may limit our affiliates' use of shared information for marketing purposes.
Throughout this Policy, we refer to the nonpublic information that personally identifies you as "personal information." We also use the term "affiliated company" in this notice. An affiliated company is a company in our family of companies and includes companies with the Morgan Stanley name. These affiliated companies are financial institutions such as broker-dealers, banks, investment advisers and credit card issuers. We refer to any company that is not an affiliated company as a nonaffiliated third party. For purposes of Section 5 of this notice, and your ability to limit certain uses of personal information by our affiliates, this notice applies to the use of personal information by our affiliated companies.
1. WHAT PERSONAL INFORMATION DO WE COLLECT FROM YOU?
We may collect the following types of information about you: (i) information provided by you, including information from applications and other forms we receive from you, (ii) information about your transactions with us or our affiliates, (iii) information about your transactions with nonaffiliated third parties, (iv) information from consumer reporting agencies, (v) information obtained from our websites, and (vi) information obtained from other sources. For example:
• We collect information such as your name, address, e-mail address, telephone/fax numbers, assets, income and investment objectives through applications and other forms you submit to us.
• We may obtain information about account balances, your use of account(s) and the types of products and services you prefer to receive from us through your dealings and transactions with us and other sources.
• We may obtain information about your creditworthiness and credit history from consumer reporting agencies.
• We may collect background information from and through third-party vendors to verify representations you have made and to comply with various regulatory requirements.
2. WHEN DO WE DISCLOSE PERSONAL INFORMATION WE COLLECT ABOUT YOU?
We may disclose personal information we collect about you in each of the categories listed above to affiliated and nonaffiliated third parties.
29
Morgan Stanley Institutional Fund, Inc.
Annual Report — December 31, 2015
U.S. Privacy Policy (unaudited) (cont'd)
a. Information We Disclose to Affiliated Companies.
We may disclose personal information that we collect about you to our affiliated companies to manage your account(s) effectively, to service and process your transactions, and to let you know about products and services offered by us and affiliated companies, to manage our business, and as otherwise required or permitted by law. Offers for products and services from affiliated companies are developed under conditions designed to safeguard your personal information.
b. Information We Disclose to Third Parties.
We may disclose personal information that we collect about you to nonaffiliated third parties to provide marketing services on our behalf or to other financial institutions with whom we have joint marketing agreements. We may also disclose all of the information we collect to other nonaffiliated third parties for our everyday business purposes, such as to process transactions, maintain account(s), respond to court orders and legal investigations, report to credit bureaus, offer our own products and services, protect against fraud, for institutional risk control, to perform services on our behalf, and as otherwise required or permitted by law.
When we share personal information about you with a nonaffiliated third party, they are required to limit their use of personal information about you to the particular purpose for which it was shared and they are not allowed to share personal information about you with others except to fulfill that limited purpose or as may be permitted or required by law.
3. HOW DO WE PROTECT THE SECURITY AND CONFIDENTIALITY OF PERSONAL INFORMATION WE COLLECT ABOUT YOU?
We maintain physical, electronic and procedural security measures that comply with applicable law and regulations to help safeguard the personal information we collect about you. We have internal policies governing the proper handling of client information by employees. Third parties that provide support or marketing services on our behalf may also receive personal information about you, and we require them to adhere to appropriate security standards with respect to such information.
4. HOW CAN YOU LIMIT OUR SHARING CERTAIN PERSONAL INFORMATION ABOUT YOU WITH OUR AFFILIATED COMPANIES FOR ELIGIBILITY DETERMINATION?
By following the opt-out procedures in Section 6 below, you may limit the extent to which we share with our affiliated companies, personal information that was collected to determine your eligibility for products and services such as your credit reports and other information that you have provided to us or that we may obtain from third parties ("eligibility information"). Eligibility information does not include your identification information or personal information pertaining to our transactions or experiences with you. Please note that, even if you direct us not to share eligibility information with our affiliated companies, we may still share your personal information, including eligibility information, with our affiliated companies under circumstances that are permitted under applicable law, such as to process transactions or to service your account.
5. HOW CAN YOU LIMIT THE USE OF CERTAIN PERSONAL INFORMATION ABOUT YOU BY OUR AFFILIATED COMPANIES FOR MARKETING?
By following the opt-out instructions in Section 6 below, you may limit our affiliated companies from marketing their products or services to you based on personal information we disclose to them. This information may include, for example, your income and account history with us. Please note that, even if you choose to limit our affiliated companies from using personal information about you that we may share with them for marketing their products and services to you, our affiliated companies may use your personal information that they obtain from us to market to you in circumstances permitted by law, such as if the affiliated party has its own relationship with you.
30
Morgan Stanley Institutional Fund, Inc.
Annual Report — December 31, 2015
U.S. Privacy Policy (unaudited) (cont'd)
6. HOW CAN YOU SEND US AN OPT-OUT INSTRUCTION?
If you wish to limit our sharing of eligibility information about you with our affiliated companies, or our affiliated companies' use of personal information for marketing purposes, as described in this notice, you may do so by:
• Calling us at (800) 548-7786
Monday–Friday between 8a.m. and 6p.m. (EST)
• Writing to us at the following address:
Boston Financial Data Services, Inc.
c/o Privacy Coordinator
P.O. Box 219804
Kansas City, Missouri 64121
If you choose to write to us, your request should include: your name, address, telephone number and account number(s) to which the opt-out applies and whether you are opting out with respect to sharing of eligibility information (Section 4 above), or information used for marketing (Section 5 above), or both. Written opt-out requests should not be sent with any other correspondence. In order to process your request, we require that the request be provided by you directly and not through a third party. Once you have informed us about your privacy preferences, your opt-out preference will remain in effect with respect to this Policy (as it may be amended) until you notify us otherwise. If you are a joint account owner, we will accept instructions from any one of you and apply those instructions to the entire account.
Please understand that if you limit our sharing or our affiliated companies' use of personal information, you and any joint account holder(s) may not receive information about our affiliated companies' products and services, including products or services that could help you manage your financial resources and achieve your investment objectives.
If you have more than one account or relationship with us, please specify the accounts to which you would like us to apply your privacy choices. If you have accounts or relationships with our affiliates, you may receive multiple privacy policies from them, and will need to separately notify those companies of your privacy choices for those accounts or relationships.
7. WHAT IF AN AFFILIATED COMPANY BECOMES A NONAFFILIATED THIRD PARTY?
If, at any time in the future, an affiliated company becomes a nonaffiliated third party, further disclosures of personal information made to the former affiliated company will be limited to those described in Section 2(b) above relating to nonaffiliated third parties. If you elected under Section 6 to limit disclosures we make to affiliated companies, or use of personal information by affiliated companies, your election will not apply to use by any former affiliated company of your personal information in their possession once it becomes a nonaffiliated third party.
SPECIAL NOTICE TO RESIDENTS OF VERMONT
The following section supplements our Policy with respect to our individual clients who have a Vermont address and supersedes anything to the contrary in the above Policy with respect to those clients only.
The State of Vermont requires financial institutions to obtain your consent prior to sharing personal information that they collect about you with nonaffiliated third parties, or eligibility information with affiliated companies, other than in certain limited circumstances. Except as permitted by law, we will not share personal information we collect about you with nonaffiliated third parties or eligibility information with affiliated companies, unless you provide us with your written consent to share such information.
SPECIAL NOTICE TO RESIDENTS OF CALIFORNIA
The following section supplements our Policy with respect to our individual clients who have a California address and supersedes anything to the contrary in the above Policy with respect to those clients only.
In response to a California law, if your account has a California home address, your personal information will not be disclosed to nonaffiliated third parties except as permitted by applicable California law, and we will limit sharing such personal information with our affiliates to comply with California privacy laws that apply to us.
31
Morgan Stanley Institutional Fund, Inc.
Annual Report — December 31, 2015
Director and Officer Information (unaudited)
Independent Directors:
| Name, Age and Address of Independent Director | Positions(s) Held with Registrant | Length of Time Served* | Principal Occupation(s) During Past 5 Years and Other Relevant Professional Experience | Number of Portfolios in Fund Complex Overseen by Director** | Other Directorships Held by Independent Director*** | ||||||||||||||||||
| Frank L. Bowman (71) c/o Kramer Levin Naftalis & Frankel LLP Counsel to the Independent Directors 1177 Avenue of the Americas New York, NY 10036 | Director | Since August 2006 | President, Strategic Decisions, LLC (consulting) (since February 2009); Director or Trustee of various Morgan Stanley Funds (since August 2006); Chairperson of the Compliance and Insurance Committee (since October 2015); Formerly, Chairperson of the Insurance Sub-Committee of the Compliance and Insurance Committee (February 2007-December 2015); served as President and Chief Executive Officer of the Nuclear Energy Institute (policy organization) (February 2005-November 2008); retired as Admiral, U.S. Navy after serving over 38 years on active duty including 8 years as Director of the Naval Nuclear Propulsion Program in the Department of the Navy and the U.S. Department of Energy (1996-2004); served as Chief of Naval Personnel (July 1994-September 1996); and on the Joint Staff as Director of Political Military Affairs (June 1992-July1994); knighted as Honorary Knight Commander of the Most Excellent Order of the British Empire; awarded the Officier de l'Orde National du Mérite by the French Government; elected to the National Academy of Engineering (2009). | 98 | Director of BP p.l.c.; Director of Naval and Nuclear Technologies LLP; Director Emeritus of the Armed Services YMCA; Director of the U.S. Naval Submarine League; Member of the National Security Advisory Council of the Center for U.S. Global Engagement and a member of the CNA Military Advisory Board; Chairman of the Charity, J Street Cup Golf, Trustee of Fairhaven United Methodist Church; and Director of other various non-profit organizations. | ||||||||||||||||||
| Kathleen A. Dennis (62) c/o Kramer Levin Naftalis & Frankel LLP Counsel to the Independent Directors 1177 Avenue of the Americas New York, NY 10036 | Director | Since August 2006 | President, Cedarwood Associates (mutual fund and investment management consulting) (since July 2006); Chairperson of the Money Market and Alternatives Sub-Committee of the Investment Committee (since October 2006) and Director or Trustee of various Morgan Stanley Funds (since August 2006); formerly, Senior Managing Director of Victory Capital Management (1993-2006). | 98 | Director of various nonprofit organizations. | ||||||||||||||||||
| Nancy C. Everett (61) c/o Kramer Levin Naftalis & Frankel LLP Counsel to the Independent Directors 1177 Avenue of the Americas New York, NY 10036 | Director | Since January 2015 | Chief Executive Officer, Virginia Commonwealth University Investment Company (since November 2015); Owner, OBIR, LLC (investment management consulting) (since June 2014); formerly, Managing Director, BlackRock Inc. (February 2011-December 2013); and Chief Executive Officer, General Motors Asset Management (a/k/a Promark Global Advisors, Inc.) (June 2005-May 2010). | 98 | Member of Virginia Commonwealth University School of Business Foundation; formerly, Member of Virginia Commonwealth University Board of Visitors (2013-2015); Member of Committee on Directors for Emerging Markets Growth Fund, Inc. (2007-2010); Chairperson of Performance Equity Management, LLC (2006-2010); and Chairperson, GMAM Absolute Return Strategies Fund, LLC (2006-2010). | ||||||||||||||||||
32
Morgan Stanley Institutional Fund, Inc.
Annual Report — December 31, 2015
Director and Officer Information (unaudited) (cont'd)
Independent Directors: (cont'd)
| Name, Age and Address of Independent Director | Positions(s) Held with Registrant | Length of Time Served* | Principal Occupation(s) During Past 5 Years and Other Relevant Professional Experience | Number of Portfolios in Fund Complex Overseen by Director** | Other Directorships Held by Independent Director*** | ||||||||||||||||||
| Jakki L. Haussler (58) c/o Kramer Levin Naftalis & Frankel LLP Counsel to the Independent Directors 1177 Avenue of the Americas New York, NY 10036 | Director | Since January 2015 | Chairman and Chief Executive Officer, Opus Capital Group (since January 1996); and formerly, Director, Capvest Venture Fund, LP (May 2000-December 2011); Partner, Adena Ventures, LP (July 1999-December 2010); Director, The Victory Funds (February 2005-July 2008). | 98 | Director of Cincinnati Bell Inc. and Member, Audit Committee and Compensation Committee; Director of Northern Kentucky University Foundation and Member, Investment Committee; Member of Chase College of Law Transactional Law Practice Center Board of Advisors; Director of Best Transport; Chase College of Law Board of Visitors; formerly Member, University of Cincinnati Foundation Investment Committee; Member, Miami University Board of Visitors (2008-2011); Trustee of Victory Funds (2005-2008) and Chairman, Investment Committee (2007-2008) and Member, Service Provider Committee (2005-2008). | ||||||||||||||||||
| Dr. Manuel H. Johnson (67) c/o Johnson Smick International, Inc. 220 I Street, N.E. — Suite 200 Washington, D.C. 20002 | Director | Since July 1991 | Senior Partner, Johnson Smick International, Inc. (consulting firm); Chairperson of the Investment Committee (since October 2006) and Director or Trustee of various Morgan Stanley Funds (since July 1991); Co-Chairman and a founder of the Group of Seven Council (G7C) (international economic commission); formerly Chairperson of the Audit Committee (July 1991-September 2006), Vice Chairman of the Board of Governors of the Federal Reserve System and Assistant Secretary of the U.S. Treasury. | 100 | Director of NVR, Inc. (home construction). | ||||||||||||||||||
| Joseph J. Kearns (73) c/o Kearns & Associates LLC 23823 Malibu Road S-50-440 Malibu, CA 90265 | Director | Since August 1994 | President, Kearns & Associates LLC (investment consulting); Chairperson of the Audit Committee (since October 2006) and Director or Trustee of various Morgan Stanley Funds (since August 1994); formerly, Deputy Chairperson of the Audit Committee (July 2003-September 2006) and Chairperson of the Audit Committee of various Morgan Stanley Funds (since August 1994); CFO of the J. Paul Getty Trust. | 101 | Director of Electro Rent Corporation (equipment leasing). Prior to December 31, 2013, Director of The Ford Family Foundation. | ||||||||||||||||||
33
Morgan Stanley Institutional Fund, Inc.
Annual Report — December 31, 2015
Director and Officer Information (unaudited) (cont'd)
Independent Directors: (cont'd)
| Name, Age and Address of Independent Director | Positions(s) Held with Registrant | Length of Time Served* | Principal Occupation(s) During Past 5 Years and Other Relevant Professional Experience | Number of Portfolios in Fund Complex Overseen by Director** | Other Directorships Held by Independent Director*** | ||||||||||||||||||
| Michael F. Klein (57) c/o Kramer Levin Naftalis & Frankel LLP Counsel to the Independent Directors 1177 Avenue of the Americas New York, NY 10036 | Director | Since August 2006 | Managing Director, Aetos Capital, LLC (since March 2000); Co-President, Aetos Alternatives Management, LLC (since January 2004); and Co-Chief Executive Officer of Aetos Capital LLC (since August 2013); Chairperson of the Fixed Income Sub-Committee of the Investment Committee (since October 2006) and Director or Trustee of various Morgan Stanley Funds (since August 2006); formerly, Managing Director, Morgan Stanley & Co. Inc. and Morgan Stanley Dean Witter Investment Management, President, various Morgan Stanley Funds (June1998-March 2000) and Principal, Morgan Stanley & Co. Inc. and Morgan Stanley Dean Witter Investment Management (August 1997-December 1999). | 97 | Director of certain investment funds managed or sponsored by Aetos Capital, LLC. Director of Sanitized AG and Sanitized Marketing AG (specialty chemicals). | ||||||||||||||||||
| Michael E. Nugent (79) 522 Fifth Avenue New York, NY 10036 | Chair of the Board and Director | Chair of the Boards since July 2006 and Director since July 1991 | Chair of the Boards of various Morgan Stanley Funds (since July 2006); Chairperson of the Closed-End Fund Committee (since June 2012) and Director or Trustee of various Morgan Stanley Funds (since July 1991); formerly, Chairperson of the Insurance Committee (until July 2006), General Partner, TriumphCapital, L.P. (private investment partnership) (1988-2013). | 100 | None. | ||||||||||||||||||
| W. Allen Reed (68) c/o Kramer Levin Naftalis & Frankel LLP Counsel to the Independent Directors 1177 Avenue of the Americas New York, NY 10036 | Director | Since August 2006 | Chairperson of the Equity Sub-Committee of the Investment Committee (since October 2006) and Director or Trustee of various Morgan Stanley Funds (since August 2006); formerly, President and CEO of General Motors Asset Management; Chairman and Chief Executive Officer of the GM Trust Bank and Corporate Vice President of General Motors Corporation (August 1994-December 2005). | 98 | Director of Legg Mason, Inc.; formerly Director of the Auburn University Foundation (2010-2015). | ||||||||||||||||||
| Fergus Reid (83) c/o Joe Pietryka, Inc. 85 Charles Colman Blvd. Pawling, NY 12564 | Director | Since June 1992 | Chairman, Joe Pietryka, Inc.; Chairperson of the Governance Committee and Director or Trustee of various Morgan Stanley Funds (since June 1992). | 100 | Formerly, Trustee and Director of certain investment companies in the JP Morgan Fund Complex managed by JP Morgan Investment Management Inc. (1987-2012). | ||||||||||||||||||
34
Morgan Stanley Institutional Fund, Inc.
Annual Report — December 31, 2015
Director and Officer Information (unaudited) (cont'd)
Interested Director:
| Name, Age and Address of Interested Director | Positions(s) Held with Registrant | Length of Time Served* | Principal Occupation(s) During Past 5 Years | Number of Portfolios in Fund Complex Overseen by Interested Director** | Other Directorships Held by Interested Director*** | ||||||||||||||||||
| James F. Higgins (68) One New York Plaza, New York, NY 10004 | Director | Since June 2000 | Director or Trustee of various Morgan Stanley Funds (since June 2000); Senior Advisor of Morgan Stanley (since August 2000). | 99 | Formerly, Director of AXA Financial, Inc. and AXA Equitable Life Insurance Company (2002-2011) and Director of AXA MONY Life Insurance Company and AXA MONY Life Insurance Company of America (2004-2011). | ||||||||||||||||||
* This is the earliest date the Director began serving the Morgan Stanley Funds. Each Director serves an indefinite term, until his or her successor is elected.
** The Fund Complex includes (as of December 31, 2015) all open-end and closed-end funds (including all of their portfolios) advised by Morgan Stanley Investment Management Inc. (the "Adviser") and any funds that have an adviser that is an affiliated person of the Adviser (including, but not limited to, Morgan Stanley AIP GP LP).
*** This includes any directorships at public companies and registered investment companies held by the Director at any time during the past five years.
Executive Officers:
Name, Age and Address of Executive Officer | Position(s) Held with Registrant | Length of Time Served**** | Principal Occupation(s) During Past 5 Years | ||||||||||||
| John H. Gernon (52) 522 Fifth Avenue New York, NY 10036 | President and Principal Executive Officer | Since September 2013 | President and Principal Executive Officer of the Equity and Fixed Income Funds and the Morgan Stanley AIP Funds (since September 2013) and the Liquidity Funds and various money market funds (since May 2014) in the Fund Complex, Managing Director of the Adviser; Head of Product (since 2006). | ||||||||||||
| Stefanie V. Chang Yu (49) 522 Fifth Avenue New York, NY 10036 | Chief Compliance Officer | Since December 1997 | Managing Director of the Adviser and various entities affiliated with the Adviser; Chief Compliance Officer of various Morgan Stanley Funds and the Adviser (since January 2014); formerly, Vice President of various Morgan Stanley Funds (December 1997-January 2014). | ||||||||||||
| Joseph C. Benedetti (50) 522 Fifth Avenue New York, NY 10036 | Vice President | Since January 2014 | Managing Director of the Adviser and various entities affiliated with the Adviser; Vice President of various Morgan Stanley Funds (since January 2014); formerly, Assistant Secretary of various Morgan Stanley Funds (October 2004-January 2014). | ||||||||||||
| Francis J. Smith (50) 522 Fifth Avenue New York, NY 10036 | Treasurer and Principal Financial Officer | Treasurer since July 2003 and Principal Financial Officer since September 2002 | Executive Director of the Adviser and various entities affiliated with the Adviser; Treasurer (since July 2003) and Principal Financial Officer of various Morgan Stanley Funds (since September 2002). | ||||||||||||
| Mary E. Mullin (48) 522 Fifth Avenue New York, NY 10036 | Secretary | Since June 1999 | Executive Director of the Adviser; Secretary of various Morgan Stanley Funds (since June 1999). | ||||||||||||
**** This is the earliest date the officer began serving the Morgan Stanley Funds. Each officer serves a one-year term, until his or her successor is elected and has qualified.
35
Morgan Stanley Institutional Fund, Inc.
Annual Report — December 31, 2015
Adviser and Administrator
Morgan Stanley Investment Management Inc.
522 Fifth Avenue
New York, New York 10036
Sub-Advisers
Morgan Stanley Investment Management Limited
25 Cabot Square, Canary Wharf
London, E14 4QA, England
Morgan Stanley Investment Management Company
23 Church Street
16-01 Capital Square, Singapore 049481
Distributor
Morgan Stanley Distribution, Inc.
522 Fifth Avenue
New York, New York 10036
Dividend Disbursing and Transfer Agent
Boston Financial Data Services, Inc.
2000 Crown Colony Drive
Quincy, Massachusetts 02169
Custodian
State Street Bank and Trust Company
One Lincoln Street
Boston, Massachusetts 02111
Legal Counsel
Dechert LLP
1095 Avenue of the Americas
New York, New York 10036
Counsel to the Independent Directors
Kramer Levin Naftalis & Frankel LLP
1177 Avenue of the Americas
New York, New York 10036
Independent Registered Public Accounting Firm
Ernst & Young LLP
200 Clarendon Street
Boston, Massachusetts 02116
Reporting to Shareholders
Each Morgan Stanley fund provides a complete schedule of portfolio holdings in its semi-annual and annual reports within 60 days of the end of the fund's second and fourth fiscal quarters. The semi-annual and annual reports are filed electronically with the Securities and Exchange Commission (SEC) on Form N-CSRS and Form N-CSR, respectively. Morgan Stanley also delivers the semi-annual and annual reports to fund shareholders and makes these reports available on its public website, www.morganstanley.com/im. Each Morgan Stanley fund also files a complete schedule of portfolio holdings with the SEC for the fund's first and third fiscal quarters on Form N-Q. Morgan Stanley does not deliver the reports for the first and third fiscal quarters to shareholders, nor are the reports posted to the Morgan Stanley public website. You may, however, obtain the Form N-Q filings (as well as the Form N-CSR and N-CSRS filings) by accessing the SEC's website, www.sec.gov. You may also review and copy them at the SEC's Public Reference Room in Washington, DC. Information on the operation of the SEC's Public Reference Room may be obtained by calling the SEC toll free at 1 (800) SEC-0330. You can also request copies of these materials, upon payment of a duplicating fee, by electronic request at the SEC's email address (publicinfo@sec.gov) or by writing the Public Reference Room of the SEC, Washington, DC 20549-0102.
Proxy Voting Policies and Procedures and Proxy Voting Record
You may obtain a copy of the Fund's Proxy Voting Policy and Procedures and information regarding how the Fund voted proxies relating to portfolio securities during the most recent twelve-month period ended June 30, without charge, upon request, by calling toll free 1 (800) 548-7786 or by visiting our website at www.morganstanley.com/im. This information is also available on the SEC's website at www.sec.gov.
This report is authorized for distribution only when preceded or accompanied by a prospectus of the Morgan Stanley Institutional Fund, Inc., which describes in detail each Portfolio's investment policies, risks, fees and expenses. Please read the prospectus carefully before you invest or send money. For additional information, including information regarding the investments comprising the Portfolio, please visit our website at www.morganstanley.com/im or call toll free 1 (800) 548-7786.
36
Printed in U.S.A.
This Report has been prepared for shareholders and may be distributed to others only if preceded or accompanied by a current prospectus.
Morgan Stanley Investment Management Inc.
522 Fifth Avenue
New York, New York 10036
© 2016 Morgan Stanley. Morgan Stanley Distribution, Inc.

IFIIREANN
1406566 EXP. 02.28.17
INVESTMENT MANAGEMENT

Morgan Stanley Institutional Fund, Inc.
Global Real Estate Portfolio
Annual Report
December 31, 2015

Morgan Stanley Institutional Fund, Inc.
Annual Report — December 31, 2015
Table of Contents
Shareholders' Letter | 2 | ||||||
Expense Example | 3 | ||||||
Investment Overview | 4 | ||||||
Portfolio of Investments | 8 | ||||||
Statement of Assets and Liabilities | 11 | ||||||
Statement of Operations | 13 | ||||||
Statements of Changes in Net Assets | 14 | ||||||
Financial Highlights | 16 | ||||||
Notes to Financial Statements | 21 | ||||||
Report of Independent Registered Public Accounting Firm | 28 | ||||||
Federal Tax Notice | 29 | ||||||
U.S. Privacy Policy | 30 | ||||||
Director and Officer Information | 33 | ||||||
This report is authorized for distribution only when preceded or accompanied by prospectuses of the Morgan Stanley Institutional Fund, Inc. To receive a prospectus and/or statement of additional information (SAI), which contains more complete information such as investment objectives, charges, expenses, policies for voting proxies, risk considerations, and describes in detail each of the Portfolio's investment policies to the prospective investor, please call toll free 1 (800) 548-7786. Please read the prospectuses carefully before you invest or send money.
Additionally, you can access portfolio information including performance, characteristics, and investment team commentary through Morgan Stanley Investment Management's website: www.morganstanley.com/im.
Market forecasts provided in this report may not necessarily come to pass. There is no guarantee that any sectors mentioned will continue to perform as discussed herein or that securities in such sectors will be held by the Portfolio in the future. There is no assurance that a Portfolio will achieve its investment objective. Portfolios are subject to market risk, which is the possibility that market values of securities owned by the Portfolio will decline and, therefore, the value of the Portfolio's shares may be less than what you paid for them. Accordingly, you can lose money investing in this Portfolio. Please see the prospectus for more complete information on investment risks.
1
Morgan Stanley Institutional Fund, Inc.
Annual Report — December 31, 2015
Shareholders' Letter (unaudited)
Dear Shareholders,
We are pleased to provide this Annual report, in which you will learn how your investment in Global Real Estate Portfolio (the "Portfolio") performed during the latest twelve-month period.
Morgan Stanley Investment Management is a client-centric, investor-led organization. Our global presence, intellectual capital, and breadth of products and services enable us to partner with investors to meet the evolving challenges of today's financial markets. We aim to deliver superior investment service and to empower our clients to make the informed decisions that help them reach their investment goals.
As always, we thank you for selecting Morgan Stanley Investment Management, and look forward to working with you in the months and years ahead.
Sincerely,

John H. Gernon
President and Principal Executive Officer
January 2016
2
Morgan Stanley Institutional Fund, Inc.
Annual Report — December 31, 2015
Expense Example (unaudited)
Global Real Estate Portfolio
As a shareholder of the Portfolio, you incur two types of costs: (1) transactional costs; and (2) ongoing costs, including advisory fees, administration fees, distribution and shareholder services fees and other Portfolio expenses. This example is intended to help you understand your ongoing costs (in dollars) of investing in the Portfolio and to compare these costs with the ongoing costs of investing in other mutual funds.
This example is based on an investment of $1,000 invested at the beginning of the six-month period ended December 31, 2015 and held for the entire six-month period.
Actual Expenses
The table below provides information about actual account values and actual expenses. You may use the information in this table, together with the amount you invested, to estimate the expenses that you paid over the period. Simply divide your account value by $1,000 (for example, an $8,600 account value divided by $1,000 = 8.6), then multiply the result by the number in the table under the heading entitled "Actual Expenses Paid During Period" to estimate the expenses you paid on your account during this period.
Hypothetical Example for Comparison Purposes
The table below provides information about hypothetical account values and hypothetical expenses based on the Portfolio's actual expense ratio and an assumed rate of return of 5% per year before expenses, which is not the Portfolio's actual return. The hypothetical account values and expenses may not be used to estimate the actual ending account balance or expenses you paid for the period. You may use this information to compare the ongoing costs of investing in the Portfolio and other funds. To do so, compare this 5% hypothetical example with the 5% hypothetical examples that appear in the shareholder reports of the other funds.
Please note that the expenses shown in the table are meant to highlight your ongoing costs only and do not reflect any transactional costs, such as sales charges (loads). Therefore, the information for each class in the table is useful in comparing ongoing costs only, and will not help you determine the relative total costs of owning different funds. In addition, if these transactional costs were included, your costs would have been higher.
| Beginning Account Value 7/1/15 | Actual Ending Account Value 12/31/15 | Hypothetical Ending Account Value | Actual Expenses Paid During Period* | Hypothetical Expenses Paid During Period* | Net Expense Ratio During Period** | ||||||||||||||||||||||
Global Real Estate Portfolio Class I | $ | 1,000.00 | $ | 1,009.70 | $ | 1,019.81 | $ | 5.42 | $ | 5.45 | 1.07 | % | |||||||||||||||
Global Real Estate Portfolio Class A | 1,000.00 | 1,008.50 | 1,018.40 | 6.83 | 6.87 | 1.35 | |||||||||||||||||||||
Global Real Estate Portfolio Class L | 1,000.00 | 1,006.00 | 1,016.23 | 9.00 | 9.05 | 1.78 | |||||||||||||||||||||
Global Real Estate Portfolio Class C | 1,000.00 | 1,003.90 | 1,014.37 | 10.86 | 10.92 | 2.15 | |||||||||||||||||||||
Global Real Estate Portfolio Class IS | 1,000.00 | 1,010.70 | 1,020.27 | 4.97 | 4.99 | 0.98 | |||||||||||||||||||||
* Expenses are calculated using each Portfolio Class' annualized net expense ratio (as disclosed), multiplied by the average account value over the period, and multiplied by 184/365 (to reflect the most recent one-half year period).
** Annualized.
3
Morgan Stanley Institutional Fund, Inc.
Annual Report — December 31, 2015
Investment Overview (unaudited)
Global Real Estate Portfolio
The Portfolio seeks to provide current income and capital appreciation.
Performance
For the year ended December 31, 2015, the Portfolio's Class I shares had a total return based on net asset value and reinvestment of distributions per share of –0.94%, net of fees. The Portfolio's Class I shares underperformed the Portfolio's benchmark, the FTSE EPRA/NAREIT Developed Real Estate Index — Net Total Return to U.S. Investors (the "Index"), which returned –0.11%, and underperformed the MSCI World Index, which returned –0.87%.
Factors Affecting Performance
• The global real estate securities market was basically flat, returning –0.11% during the 12-month period ending December 31, 2015, as measured by the Index. Europe was the best-performing region in the year, North America also significantly outperformed the global average, and Asia meaningfully underperformed the global average.
• During the year, property stocks have been largely influenced by transactional evidence in the private markets of strong investor demand for core assets at valuations that demonstrate the acceptance of low expected returns. Share prices also appeared to fluctuate alongside various macro concerns including expectations for higher interest rates going forward and global economic growth concerns, with a particular focus on China's economic slowdown.
• Performance within the Asian regional portfolio outperformed the Index, the European portfolio was relatively neutral, and the North American portfolio detracted. Top-down global allocation detracted from relative performance due to the overweight to the Asian regional portfolio and underweight to the European portfolio. In Asia, the Portfolio benefited from stock selection in Hong Kong and Hong Kong-listed China real estate operating companies (REOCs), and the underweight to and stock selection within Singapore; this was partially offset by the negative influence of its overweight to Hong Kong and underweight to Australia. In Europe, the Portfolio benefited from stock selection in Germany and the
U.K.; this was partially offset by the overweight to Norway and stock selection in Sweden and Austria, which detracted. In the U.S., the Portfolio benefited from the overweight to the apartment sector, underweight to health care sector and stock selection within and the underweight to the net lease sector. The underweight to Canada also contributed to relative performance. This was offset by relative weakness from the overweight to and stock selection within the hotel sector, and stock selection in the apartment sector.
Management Strategies
• The global portfolio is comprised of three regional portfolios with a global allocation which weights each of the three major regions (North America, Europe and Asia) relative to the Index based on our view of the relative attractiveness of each region in terms of underlying real estate fundamentals and public market valuations. Moreover, each of the regional portfolios reflects our core investment philosophy as a real estate value investor, which results in the ownership of stocks that we believe provide the best valuation relative to their underlying real estate values, while maintaining portfolio diversification. Our company-specific research leads us to specific preferences for sub-segments within each of the property sectors and countries. For the period ended December 31, 2015, the Portfolio was overweight the Asian and North American listed property sectors, and underweight the European listed property sector.
• In Asia, the Hong Kong REOCs continue to represent the most significant overweight in the global portfolio, as we believe the stocks offer highly attractive value given the wide discrepancy between public and private valuations, and relative to other public listed property markets. The companies traded at an average 46% discount to net asset values (NAVs) — their underlying private real estate value — at the end of the period, which represented the widest discount on a global basis, and we believe share prices substantially discount the various risks that could potentially impact operating fundamentals and asset values in the private market and ignored strong transactional evidence in the office market.(i) The discounted valuations are further accentuated as the Hong Kong REOCs
(i) Source for all valuations data, unless otherwise noted: Morgan Stanley Investment Management, as of ending date December 31, 2015.
4
Morgan Stanley Institutional Fund, Inc.
Annual Report — December 31, 2015
Investment Overview (unaudited) (cont'd)
Global Real Estate Portfolio
maintain very modest leverage levels. Sentiment continues to be a significant driver of share price movements and investor sentiment remained cautious due to macro concerns regarding China. The Japan REOCs traded at an average 20% discount to NAVs. Share prices do not fully reflect strong transactional evidence in the private market. In wide contrast, the Japan real estate investment trusts (J-REITs) continued to trade at a significant premium of 22% — the widest premium on a global basis — driven by purchases by the Bank of Japan and domestic investor attraction to the positive spread between J-REIT dividend yields relative to the 10-year Japanese government bond yield. It is notable that the asset portfolios of the major Japan REOCs, which are largely comprised of prime office assets in Central Tokyo, may benefit from stronger operating fundamentals as compared to the generally lower-quality and diverse asset portfolios of the J-REITs. As a result, we believe the valuations for the Japan REOCs are far more attractive relative to the prevailing valuations for the J-REITs and we remain overweight to the REOCs and underweight the REITs within Japan. Finally, it is notable current NAVs are based on cash flows that are near cyclical lows and continued improvements in occupancy levels have led to greater enthusiasm for rental growth. The Portfolio was underweight Australia and the Singapore REITs on relative valuation.
• In Europe, property stocks in the U.K. ended the period trading at a 6% discount to reported NAVs (with the large-cap U.K. Majors trading at a 15% discount to NAVs) and property stocks on the Continent ended the period trading at an average 16% premium to reported NAVs. As rental growth remains modest in most markets on the Continent, current premiums reflect continued yield compression following the start of quantitative easing. In the U.K., the pace of NAV growth is expected to decelerate going forward as the contribution from yield compression diminishes and rental growth takes over as the main driver of capital value growth. Moreover, we believe the U.K. companies are poised to benefit from better economic prospects and have stronger balance sheets, lower leverage ratios and longer average debt maturities than companies on the Continent. As a result, given share price premiums and weaker
growth prospects the Continent remains less attractive relative to the U.K., in particular the U.K. Majors, and within Europe we remain overweight the U.K. Majors and underweight the Continent.
• Values for high-quality assets in the U.S. have fully recovered and are now, on average, approximately 20% in excess of their all-time peak levels achieved in 2007.(ii) Based on these asset values, share price valuations ended the period on average at par to NAVs. We see attractive value in many of the property sectors with hotels, primary central business district (CBD) office and malls trading at the widest discounts to NAVs. However, there is a disparity in valuations with most property sectors at discounts to NAVs but finance-company/dividend-oriented stocks (health care, net lease) and the storage sector trading at significant premiums to NAVs. Within the U.S., our company-specific research leads us to an overweighting in the Portfolio to a group of companies that are focused in the ownership of primary CBD office assets, high-quality malls, upscale hotels, apartments, and a number of out-of-favor companies and an underweighting to companies concentrated in the ownership of health care, net lease, and secondary CBD/suburban office assets.
• Investment values for prime real estate assets have continued to improve due to investors' widespread acceptance of low expected returns from real estate in today's low return environment, coupled with continued credit availability and low borrowing rates. Very strong capital flows to the property sector have driven asset pricing to all-time highs in most prime markets. In Western markets, valuations for prime assets have largely recovered back to or in excess of peak levels achieved in 2007. In Asian markets, Hong Kong has witnessed improvements in asset values primarily due to improved cash flows (as cap rate compression has not been as pervasive), whereas in Tokyo improvements have largely been due to cap rate compression with a modest recovery in fundamentals. In Australia, despite weak operating fundamentals, there has been continued strong investor demand for commercial assets.
(ii) Source: Morgan Stanley Investment Management and Green Street Advisors, Inc., as of ending date 12/31/2015.
5
Morgan Stanley Institutional Fund, Inc.
Annual Report — December 31, 2015
Investment Overview (unaudited) (cont'd)
Global Real Estate Portfolio
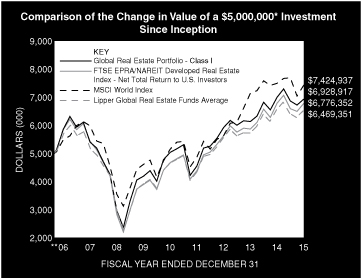
* Minimum Investment for Class I shares
** Commenced Operations on August 30, 2006.
In accordance with SEC regulations, the Portfolio's performance shown assumes that all recurring fees (including management fees) were deducted and all dividends and distributions were reinvested. The performance of Class A, L, C and IS shares will vary from the performance of Class I shares based upon their different inception dates and will be impacted by additional fees assessed to those classes (if applicable).
Performance Compared to the FTSE EPRA/NAREIT Developed Real Estate Index — Net Total Return to U.S. Investors(1), the MSCI World Index(2) and the Lipper Global Real Estate Funds Average(3)
| Period Ended December 31, 2015 Total Returns(4) | |||||||||||||||||||
Average Annual | |||||||||||||||||||
| One Year | Five Years | Ten Years | Since Inception(9) | ||||||||||||||||
| Portfolio — Class I Shares w/o sales charges(5) | –0.94 | % | 6.59 | % | — | 3.56 | % | ||||||||||||
| Portfolio — Class A Shares w/o sales charges(5) | –1.25 | 6.32 | — | 3.28 | |||||||||||||||
| Portfolio — Class A Shares with maximum 5.25% sales charges(5) | –6.42 | 5.19 | — | 2.69 | |||||||||||||||
| Portfolio — Class L Shares w/o sales charges(6) | –1.71 | 5.81 | — | 3.26 | |||||||||||||||
| Portfolio — Class C Shares w/o sales charges(8) | — | — | — | –4.71 | |||||||||||||||
| Portfolio — Class C Shares with maximum 1.00% deferred sales charges(8) | — | — | — | –5.65 | |||||||||||||||
| Portfolio — Class IS Shares w/o sales charges(7) | –0.84 | — | — | 6.08 | |||||||||||||||
| FTSE EPRA/NAREIT Developed Real Estate Index — Net Total Return to U.S. Investors | –0.11 | 7.73 | — | 3.31 | |||||||||||||||
MSCI World Index | –0.87 | 7.59 | — | 4.33 | |||||||||||||||
| Lipper Global Real Estate Funds Average | –0.46 | 6.87 | — | 2.80 | |||||||||||||||
Performance data quoted represents past performance, which is no guarantee of future results, and current performance may be lower or higher than the figures shown. Performance assumes that all dividends and distributions, if any, were reinvested. For the most recent month-end performance figures, please visit www.morganstanley.com/im. Investment return and principal value will fluctuate so that Portfolio shares, when redeemed, may be worth more or less than their original cost. Total returns do not reflect the deduction of taxes that a shareholder would pay on Portfolio distributions or the redemption of Portfolio shares. Returns for periods less than one year are not annualized. Performance of share classes will vary due to difference in expenses.
(1) The FTSE EPRA/NAREIT Developed Real Estate Index — Net Total Return to U.S. Investors is a market capitalization weighted index designed to reflect the stock performance of companies engaged in the North American, European and Asian real estate markets. The performance of the Index is listed in U.S. dollars and assumes reinvestment of net dividends. "Net Total Return to U.S. investors" reflects a reduction in total returns after taking into account the withholding tax on dividends by certain foreign countries represented in the Index for periods after 1/31/05 (gross returns used prior to 1/31/05). The Index is unmanaged and its returns do not include any sales charges or fees. Such costs would lower performance. It is not possible to invest directly in an index.
(2) The MSCI World Index is a free float-adjusted market capitalization weighted index that is designed to measure the global equity market performance of developed markets. The term "free float" represents the portion of shares outstanding that are deemed to be available for purchase in the public equity markets by investors. The MSCI World Index currently consists of 23 developed
6
Morgan Stanley Institutional Fund, Inc.
Annual Report — December 31, 2015
Investment Overview (unaudited) (cont'd)
Global Real Estate Portfolio
market country indices. The performance of the Index is listed in U.S. dollars and assumes reinvestment of net dividends. The Index is unmanaged and its returns do not include any sales charges or fees. Such costs would lower performance. It is not possible to invest directly in an index.
(3) The Lipper Global Real Estate Funds Average tracks the performance of all funds in the Lipper Global Real Estate Funds classification. The Average, which is adjusted for capital gains distributions and income dividends, is unmanaged and should not be considered an investment. As of the date of this report, the Portfolio was in the Lipper Global Real Estate Funds classification.
(4) Total returns for the Portfolio reflect fees waived and expenses reimbursed, if applicable, by the Adviser. Without such waivers and reimbursements, total returns would have been lower.
(5) Commenced operations on August 30, 2006.
(6) Commenced offering on June 16, 2008.
(7) Commenced offering September 13, 2013.
(8) Commenced offering on April 30, 2015.
(9) For comparative purposes, average annual since inception returns listed for the Indexes refer to the inception date of Class I of the Portfolio, not the inception of the Index.
7
Morgan Stanley Institutional Fund, Inc.
Annual Report — December 31, 2015
Portfolio of Investments
Global Real Estate Portfolio
Shares | Value (000) | ||||||||||
Common Stocks (97.2%) | |||||||||||
Australia (4.8%) | |||||||||||
Dexus Property Group REIT | 1,140,532 | $ | 6,185 | ||||||||
Goodman Group REIT | 3,516,327 | 15,920 | |||||||||
GPT Group REIT | 3,387,098 | 11,707 | |||||||||
Investa Office Fund REIT | 760,820 | 2,204 | |||||||||
Mirvac Group REIT | 5,147,804 | 7,366 | |||||||||
Scentre Group REIT | 9,537,172 | 28,903 | |||||||||
Shopping Centres Australasia Property Group REIT | 453,253 | 699 | |||||||||
Stockland REIT | 3,467,471 | 10,294 | |||||||||
Vicinity Centres REIT | 2,409,986 | 4,884 | |||||||||
Westfield Corp. REIT | 3,605,827 | 24,806 | |||||||||
112,968 | |||||||||||
Austria (0.1%) | |||||||||||
Atrium European Real Estate Ltd. (a) | 700,314 | 2,711 | |||||||||
Belgium (0.0%) | |||||||||||
Befimmo SA REIT | 6,046 | 361 | |||||||||
Brazil (0.3%) | |||||||||||
BR Malls Participacoes SA | 924,761 | 2,579 | |||||||||
| BR Properties SA | 803,400 | 1,709 | |||||||||
Iguatemi Empresa de Shopping Centers SA | 599,301 | 2,855 | |||||||||
7,143 | |||||||||||
Canada (1.8%) | |||||||||||
Boardwalk REIT | 175,814 | 6,029 | |||||||||
Brookfield Canada Office Properties REIT | 232,971 | 4,388 | |||||||||
Crombie Real Estate Investment Trust REIT | 315,240 | 2,916 | |||||||||
Dream Office Real Estate Investment Trust REIT | 216,270 | 2,715 | |||||||||
Extendicare, Inc. | 184,957 | 1,290 | |||||||||
First Capital Realty, Inc. | 445,352 | 5,906 | |||||||||
RioCan REIT | 993,126 | 17,003 | |||||||||
Smart Real Estate Investment Trust REIT | 93,274 | 2,035 | |||||||||
42,282 | |||||||||||
China (0.4%) | |||||||||||
China Overseas Land & Investment Ltd. (b) | 476,000 | 1,653 | |||||||||
China Resources Land Ltd. (b) | 226,000 | 652 | |||||||||
| Dalian Wanda Commercial Properties Co., Ltd. H Shares (b)(c) | 323,000 | 1,870 | |||||||||
Global Logistic Properties Ltd. | 3,111,200 | 4,684 | |||||||||
8,859 | |||||||||||
Finland (0.7%) | |||||||||||
Citycon Oyj (a) | 3,977,245 | 10,307 | |||||||||
Sponda Oyj | 1,199,321 | 5,070 | |||||||||
15,377 | |||||||||||
France (2.8%) | |||||||||||
Fonciere Des Regions REIT | 32,494 | 2,909 | |||||||||
Gecina SA REIT | 64,697 | 7,849 | |||||||||
ICADE REIT | 108,395 | 7,277 | |||||||||
Klepierre REIT | 214,976 | 9,534 | |||||||||
Mercialys SA REIT | 83,193 | 1,684 | |||||||||
Unibail-Rodamco SE REIT | 141,284 | 35,823 | |||||||||
65,076 | |||||||||||
Shares | Value (000) | ||||||||||
Germany (1.4%) | |||||||||||
ADO Properties SA (a)(c) | 118,620 | $ | 3,425 | ||||||||
Alstria Office AG REIT (a) | 12,538 | 167 | |||||||||
Deutsche Euroshop AG | 51,621 | 2,269 | |||||||||
Deutsche Wohnen AG | 368,596 | 10,260 | |||||||||
LEG Immobilien AG (a) | 25,121 | 2,062 | |||||||||
Vonovia SE | 511,232 | 15,835 | |||||||||
34,018 | |||||||||||
Hong Kong (11.2%) | |||||||||||
Champion REIT | 2,198,000 | 1,096 | |||||||||
Cheung Kong Property Holdings Ltd. | 5,277,000 | 34,043 | |||||||||
Hang Lung Properties Ltd. | 1,713,000 | 3,885 | |||||||||
Henderson Land Development Co., Ltd. | 1,827,639 | 11,126 | |||||||||
Hongkong Land Holdings Ltd. | 6,519,800 | 45,466 | |||||||||
Hysan Development Co., Ltd. | 5,527,014 | 22,552 | |||||||||
Kerry Properties Ltd. | 1,087,720 | 2,961 | |||||||||
Link REIT | 4,149,275 | 24,754 | |||||||||
New World Development Co., Ltd. | 10,078,109 | 9,889 | |||||||||
Sino Land Co., Ltd. | 1,835,637 | 2,675 | |||||||||
Sun Hung Kai Properties Ltd. | 5,466,367 | 65,606 | |||||||||
Swire Properties Ltd. | 7,228,600 | 20,777 | |||||||||
Wharf Holdings Ltd. (The) | 3,293,763 | 18,180 | |||||||||
263,010 | |||||||||||
Ireland (0.4%) | |||||||||||
Green REIT PLC | 2,863,551 | 4,953 | |||||||||
Hibernia REIT PLC | 2,367,179 | 3,624 | |||||||||
8,577 | |||||||||||
Italy (0.0%) | |||||||||||
Beni Stabili SpA REIT | 520,678 | 393 | |||||||||
Japan (9.8%) | |||||||||||
Activia Properties, Inc. REIT | 1,059 | 4,496 | |||||||||
Advance Residence Investment Corp. REIT | 1,358 | 2,989 | |||||||||
Daiwa Office Investment Corp. REIT | 536 | 2,902 | |||||||||
Frontier Real Estate Investment Corp. REIT | 249 | 999 | |||||||||
GLP J-REIT | 3,278 | 3,171 | |||||||||
Hulic Co., Ltd. | 211,800 | 1,858 | |||||||||
Japan Real Estate Investment Corp. REIT | 2,414 | 11,740 | |||||||||
Japan Retail Fund Investment Corp. REIT | 2,638 | 5,066 | |||||||||
Kenedix Office Investment Corp. REIT | 297 | 1,390 | |||||||||
Mitsubishi Estate Co., Ltd. | 2,971,000 | 61,580 | |||||||||
Mitsui Fudosan Co., Ltd. | 2,313,000 | 57,958 | |||||||||
Mori Hills Investment Corp. REIT | 3,030 | 3,883 | |||||||||
Nippon Building Fund, Inc. REIT | 3,021 | 14,430 | |||||||||
Nippon Prologis, Inc. REIT | 2,936 | 5,306 | |||||||||
Nomura Real Estate Master Fund, Inc. REIT (a) | 3,116 | 3,857 | |||||||||
NTT Urban Development Corp. | 93,300 | 897 | |||||||||
Orix, Inc. J-REIT | 3,576 | 4,627 | |||||||||
Premier Investment Corp. REIT | 635 | 649 | |||||||||
Sumitomo Realty & Development Co., Ltd. | 1,044,000 | 29,747 | |||||||||
Tokyo Tatemono Co., Ltd. | 444,200 | 4,830 | |||||||||
Tokyu, Inc. REIT | 552 | 695 | |||||||||
United Urban Investment Corp. REIT | 5,840 | 7,921 | |||||||||
230,991 | |||||||||||
The accompanying notes are an integral part of the financial statements.
8
Morgan Stanley Institutional Fund, Inc.
Annual Report — December 31, 2015
Portfolio of Investments (cont'd)
Global Real Estate Portfolio
Shares | Value (000) | ||||||||||
Malta (0.0%) | |||||||||||
BGP Holdings PLC (a)(d)(e) | 12,867,024 | $ | — | ||||||||
Netherlands (0.5%) | |||||||||||
Eurocommercial Properties N.V. CVA REIT | 170,367 | 7,344 | |||||||||
Wereldhave N.V. REIT | 98,316 | 5,513 | |||||||||
12,857 | |||||||||||
Norway (0.4%) | |||||||||||
Entra ASA (c) | 1,003,829 | 8,055 | |||||||||
Norwegian Property ASA (a) | 865,679 | 886 | |||||||||
8,941 | |||||||||||
Singapore (1.0%) | |||||||||||
Ascendas Real Estate Investment Trust REIT | 2,269,900 | 3,635 | |||||||||
CapitaLand Commercial Trust Ltd. REIT | 1,789,100 | 1,698 | |||||||||
CapitaLand Ltd. | 4,134,700 | 9,704 | |||||||||
CapitaLand Mall Trust REIT | 2,971,400 | 4,027 | |||||||||
UOL Group Ltd. | 1,071,893 | 4,701 | |||||||||
23,765 | |||||||||||
Sweden (0.9%) | |||||||||||
Atrium Ljungberg AB, Class B | 231,117 | 3,637 | |||||||||
Castellum AB | 385,171 | 5,459 | |||||||||
Fabege AB | 90,364 | 1,486 | |||||||||
Hufvudstaden AB, Class A | 672,568 | 9,523 | |||||||||
20,105 | |||||||||||
Switzerland (0.8%) | |||||||||||
Mobimo Holding AG (Registered) (a) | 4,172 | 924 | |||||||||
PSP Swiss Property AG (Registered) (a) | 182,273 | 15,964 | |||||||||
Swiss Prime Site AG (Registered) (a) | 27,103 | 2,117 | |||||||||
19,005 | |||||||||||
United Kingdom (6.7%) | |||||||||||
British Land Co., PLC REIT | 2,677,692 | 30,821 | |||||||||
Capital & Counties Properties PLC | 595,298 | 3,864 | |||||||||
Capital & Regional PLC REIT | 3,993,426 | 3,815 | |||||||||
Derwent London PLC REIT | 214,593 | 11,593 | |||||||||
Great Portland Estates PLC REIT | 913,454 | 11,135 | |||||||||
Hammerson PLC REIT | 1,625,260 | 14,364 | |||||||||
Intu Properties PLC REIT | 2,438,826 | 11,397 | |||||||||
Land Securities Group PLC REIT | 1,982,908 | 34,378 | |||||||||
LXB Retail Properties PLC (a) | 3,651,832 | 5,160 | |||||||||
Segro PLC REIT | 1,469,534 | 9,276 | |||||||||
Shaftesbury PLC REIT | 388,099 | 5,201 | |||||||||
ST Modwen Properties PLC | 549,410 | 3,351 | |||||||||
Unite Group PLC | 352,493 | 3,403 | |||||||||
Urban & Civic PLC | 1,233,942 | 5,126 | |||||||||
Workspace Group PLC REIT | 221,094 | 3,121 | |||||||||
156,005 | |||||||||||
United States (53.2%) | |||||||||||
Acadia Realty Trust REIT | 57,030 | 1,891 | |||||||||
| Apartment Investment & Management Co., Class A REIT | 227,239 | 9,096 | |||||||||
AvalonBay Communities, Inc. REIT | 405,266 | 74,622 | |||||||||
Boston Properties, Inc. REIT | 555,242 | 70,816 | |||||||||
Shares | Value (000) | ||||||||||
Brixmor Property Group, Inc. REIT | 129,260 | $ | 3,337 | ||||||||
Camden Property Trust REIT | 536,313 | 41,167 | |||||||||
Chesapeake Lodging Trust REIT | 557,471 | 14,026 | |||||||||
Corporate Office Properties Trust REIT | 357,303 | 7,800 | |||||||||
Cousins Properties, Inc. REIT | 1,160,318 | 10,942 | |||||||||
CubeSmart REIT | 160,268 | 4,907 | |||||||||
DDR Corp. REIT | 491,676 | 8,280 | |||||||||
Douglas Emmett, Inc. REIT | 662,584 | 20,659 | |||||||||
Duke Realty Corp. REIT | 484,400 | 10,182 | |||||||||
Equity Lifestyle Properties, Inc. REIT | 139,586 | 9,306 | |||||||||
Equity Residential REIT | 1,364,921 | 111,364 | |||||||||
Essex Property Trust, Inc. REIT | 73,825 | 17,674 | |||||||||
Exeter Industrial Value Fund, LP REIT (a)(d)(e)(f) | 1,860,000 | 603 | |||||||||
Federal Realty Investment Trust REIT | 10,329 | 1,509 | |||||||||
General Growth Properties, Inc. REIT | 1,663,574 | 45,266 | |||||||||
Healthcare Realty Trust, Inc. REIT | 248,803 | 7,046 | |||||||||
Hilton Worldwide Holdings, Inc. | 1,226,223 | 26,241 | |||||||||
Host Hotels & Resorts, Inc. REIT | 4,188,962 | 64,259 | |||||||||
Hudson Pacific Properties, Inc. REIT | 596,442 | 16,784 | |||||||||
Kimco Realty Corp. REIT | 1,320,791 | 34,948 | |||||||||
La Quinta Holdings, Inc. (a) | 173,930 | 2,367 | |||||||||
LaSalle Hotel Properties REIT | 710,719 | 17,882 | |||||||||
Lexington Realty Trust REIT | 27,623 | 221 | |||||||||
Liberty Property Trust REIT | 429,095 | 13,323 | |||||||||
Macerich Co. (The) REIT | 75,509 | 6,093 | |||||||||
Mack-Cali Realty Corp. REIT | 293,918 | 6,863 | |||||||||
Mid-America Apartment Communities, Inc. REIT | 16,496 | 1,498 | |||||||||
National Retail Properties, Inc. REIT | 399,598 | 16,004 | |||||||||
Paramount Group, Inc. REIT | 342,350 | 6,197 | |||||||||
ProLogis, Inc. REIT | 680,842 | 29,222 | |||||||||
Public Storage REIT | 306,544 | 75,931 | |||||||||
QTS Realty Trust, Inc., Class A REIT | 54,070 | 2,439 | |||||||||
Realty Income Corp. REIT | 56,075 | 2,895 | |||||||||
Regency Centers Corp. REIT | 594,911 | 40,525 | |||||||||
Rexford Industrial Realty, Inc. REIT | 252,751 | 4,135 | |||||||||
RMR Group, Inc. (The) (a) | 8,054 | 116 | |||||||||
Senior Housing Properties Trust REIT | 725,604 | 10,768 | |||||||||
Simon Property Group, Inc. REIT | 854,926 | 166,232 | |||||||||
Sovran Self Storage, Inc. REIT | 53,712 | 5,764 | |||||||||
Spirit Realty Capital, Inc. REIT | 237,700 | 2,382 | |||||||||
Starwood Hotels & Resorts Worldwide, Inc. | 258,072 | 17,879 | |||||||||
STORE Capital Corp. REIT | 622,941 | 14,452 | |||||||||
Tanger Factory Outlet Centers, Inc. REIT | 804,151 | 26,296 | |||||||||
Ventas, Inc. REIT | 555,142 | 31,327 | |||||||||
Vornado Realty Trust REIT | 930,971 | 93,060 | |||||||||
Welltower, Inc. REIT | 338,449 | 23,025 | |||||||||
WP GLIMCHER, Inc. REIT | 1,137,910 | 12,073 | |||||||||
Xenia Hotels & Resorts, Inc. REIT | 367,671 | 5,636 | |||||||||
1,247,330 | |||||||||||
Total Common Stocks (Cost $1,993,763) | 2,279,774 | ||||||||||
The accompanying notes are an integral part of the financial statements.
9
Morgan Stanley Institutional Fund, Inc.
Annual Report — December 31, 2015
Portfolio of Investments (cont'd)
Global Real Estate Portfolio
| No. of Rights | Value (000) | ||||||||||
Right (0.0%) | |||||||||||
Singapore (0.0%) | |||||||||||
| Ascendas Real Estate Investment Trust REIT (a) (Cost $—) | 85,121 | $ | 3 | ||||||||
Shares | |||||||||||
Short-Term Investment (1.0%) | |||||||||||
Investment Company (1.0%) | |||||||||||
| Morgan Stanley Institutional Liquidity Funds — Treasury Portfolio — Institutional Class (See Note G) (Cost $24,444) | 24,444,124 | 24,444 | |||||||||
Total Investments (98.2%) (Cost $2,018,207) (g)(h) | 2,304,221 | ||||||||||
Other Assets in Excess of Liabilities (1.8%) | 41,503 | ||||||||||
Net Assets (100.0%) | $ | 2,345,724 | |||||||||
(a) Non-income producing security.
(b) Security trades on the Hong Kong exchange.
(c) 144A security — Certain conditions for public sale may exist. Unless otherwise noted, these securities are deemed to be liquid.
(d) At December 31, 2015, the Portfolio held fair valued securities valued at approximately $603,000, representing less than 0.05% of net assets. These securities have been fair valued as determined in good faith under procedures established by and under the general supervision of the Fund's Directors.
(e) Security has been deemed illiquid at December 31, 2015.
(f) Restricted security valued at fair value and not registered under the Securities Act of 1933, Exeter Industrial Value Fund, LP was acquired between 11/07 - 4/11 and has a current cost basis of $88,000. At December 31, 2015, this security had an aggregate market value of approximately $603,000, representing less than 0.05% of net assets.
(g) The approximate fair value and percentage of net assets, $990,162,000 and 42.2%, respectively, represent the securities that have been fair valued under the fair valuation policy for international investments as described in Note A-1 within the Notes to the Financial Statements.
(h) At December 31, 2015, the aggregate cost for Federal income tax purposes is approximately $2,074,593,000. The aggregate gross unrealized appreciation is approximately $336,619,000 and the aggregate gross unrealized depreciation is approximately $106,991,000 resulting in net unrealized appreciation of approximately $229,628,000.
CVA Certificaten Van Aandelen.
REIT Real Estate Investment Trust.
Portfolio Composition
Classification | Percentage of Total Investments | ||||||
Diversified | 27.4 | % | |||||
Retail | 27.1 | ||||||
Residential | 13.5 | ||||||
Office | 12.9 | ||||||
Other* | 12.7 | ||||||
Lodging/Resorts | 6.4 | ||||||
Total Investments | 100.0 | % | |||||
* Industries and/or investment types representing less than 5% of total investments.
The accompanying notes are an integral part of the financial statements.
10
Morgan Stanley Institutional Fund, Inc.
Annual Report — December 31, 2015
Global Real Estate Portfolio
Statement of Assets and Liabilities | December 31, 2015 (000) | ||||||
Assets: | |||||||
Investments in Securities of Unaffiliated Issuers, at Value (Cost $1,993,763) | $ | 2,279,777 | |||||
Investment in Security of Affiliated Issuer, at Value (Cost $24,444) | 24,444 | ||||||
Total Investments in Securities, at Value (Cost $2,018,207) | 2,304,221 | ||||||
Foreign Currency, at Value (Cost $7,356) | 7,329 | ||||||
Receivable for Portfolio Shares Sold | 39,891 | ||||||
Dividends Receivable | 8,250 | ||||||
Receivable for Investments Sold | 4,347 | ||||||
Tax Reclaim Receivable | 284 | ||||||
Receivable from Affiliate | 1 | ||||||
Other Assets | 109 | ||||||
Total Assets | 2,364,432 | ||||||
Liabilities: | |||||||
Payable for Portfolio Shares Redeemed | 8,680 | ||||||
Payable for Advisory Fees | 5,056 | ||||||
Payable for Investments Purchased | 4,192 | ||||||
Payable for Sub Transfer Agency Fees — Class I | 366 | ||||||
Payable for Sub Transfer Agency Fees — Class A | 11 | ||||||
Payable for Sub Transfer Agency Fees — Class L | — | @ | |||||
Payable for Sub Transfer Agency Fees — Class C | — | @ | |||||
Payable for Administration Fees | 157 | ||||||
Payable for Custodian Fees | 83 | ||||||
Payable for Shareholder Services Fees — Class A | 29 | ||||||
Payable for Distribution and Shareholder Services Fees — Class L | 3 | ||||||
Payable for Distribution and Shareholder Services Fees — Class C | — | @ | |||||
Payable for Professional Fees | 18 | ||||||
Payable for Transfer Agency Fees — Class I | 4 | ||||||
Payable for Transfer Agency Fees — Class A | 1 | ||||||
Payable for Transfer Agency Fees — Class L | — | @ | |||||
Payable for Transfer Agency Fees — Class C | — | @ | |||||
Payable for Transfer Agency Fees — Class IS | — | @ | |||||
Other Liabilities | 108 | ||||||
Total Liabilities | 18,708 | ||||||
| Net Assets | $ | 2,345,724 | |||||
Net Assets Consist Of: | |||||||
Paid-in-Capital | $ | 2,128,026 | |||||
Distributions in Excess of Net Investment Income | (17,148 | ) | |||||
Accumulated Net Realized Loss | (51,110 | ) | |||||
Unrealized Appreciation (Depreciation) on: | |||||||
Investments | 286,014 | ||||||
Foreign Currency Translations | (58 | ) | |||||
Net Assets | $ | 2,345,724 | |||||
The accompanying notes are an integral part of the financial statements.
11
Morgan Stanley Institutional Fund, Inc.
Annual Report — December 31, 2015
Global Real Estate Portfolio
Statement of Assets and Liabilities (cont'd) | December 31, 2015 (000) | ||||||
CLASS I: | |||||||
Net Assets | $ | 1,192,624 | |||||
| Shares Outstanding $0.001 par value shares of beneficial interest (unlimited shares authorized) (not in 000's) | 110,407,415 | ||||||
Net Asset Value, Offering and Redemption Price Per Share | $ | 10.80 | |||||
CLASS A: | |||||||
Net Assets | $ | 135,517 | |||||
| Shares Outstanding $0.001 par value shares of beneficial interest (unlimited shares authorized) (not in 000's) | 12,617,084 | ||||||
Net Asset Value, Redemption Price Per Share | $ | 10.74 | |||||
Maximum Sales Load | 5.25 | % | |||||
Maximum Sales Charge | $ | 0.60 | |||||
Maximum Offering Price Per Share | $ | 11.34 | |||||
CLASS L: | |||||||
Net Assets | $ | 4,509 | |||||
| Shares Outstanding $0.001 par value shares of beneficial interest (unlimited shares authorized) (not in 000's) | 424,840 | ||||||
Net Asset Value, Offering and Redemption Price Per Share | $ | 10.61 | |||||
CLASS C: | |||||||
Net Assets | $ | 191 | |||||
| Shares Outstanding $0.001 par value shares of beneficial interest (unlimited shares authorized) (not in 000's) | 18,038 | ||||||
Net Asset Value, Offering and Redemption Price Per Share | $ | 10.56 | |||||
CLASS IS: | |||||||
Net Assets | $ | 1,012,883 | |||||
| Shares Outstanding $0.001 par value shares of beneficial interest (unlimited shares authorized) (not in 000's) | 93,734,750 | ||||||
Net Asset Value, Offering and Redemption Price Per Share | $ | 10.81 | |||||
@ Amount is less than $500.
The accompanying notes are an integral part of the financial statements.
12
Morgan Stanley Institutional Fund, Inc.
Annual Report — December 31, 2015
Global Real Estate Portfolio
Statement of Operations | Year Ended December 31, 2015 (000) | ||||||
Investment Income: | |||||||
Dividends from Securities of Unaffiliated Issuers (Net of $2,494 of Foreign Taxes Withheld) | $ | 66,090 | |||||
Dividends from Security of Affiliated Issuer (Note G) | 7 | ||||||
Total Investment Income | 66,097 | ||||||
Expenses: | |||||||
Advisory Fees (Note B) | 20,660 | ||||||
Administration Fees (Note C) | 1,945 | ||||||
Sub Transfer Agency Fees — Class I | 1,307 | ||||||
Sub Transfer Agency Fees — Class A | 136 | ||||||
Sub Transfer Agency Fees — Class L | 1 | ||||||
Sub Transfer Agency Fees — Class C | — | @ | |||||
Shareholder Services Fees — Class A (Note D) | 292 | ||||||
Distribution and Shareholder Services Fees — Class L (Note D) | 36 | ||||||
Distribution and Shareholder Services Fees — Class C (Note D) | 1 | ||||||
Custodian Fees (Note F) | 327 | ||||||
Shareholder Reporting Fees | 222 | ||||||
Registration Fees | 135 | ||||||
Professional Fees | 107 | ||||||
Directors' Fees and Expenses | 59 | ||||||
Transfer Agency Fees — Class I (Note E) | 17 | ||||||
Transfer Agency Fees — Class A (Note E) | 7 | ||||||
Transfer Agency Fees — Class L (Note E) | 2 | ||||||
Transfer Agency Fees — Class C (Note E) | 1 | ||||||
Transfer Agency Fees — Class IS (Note E) | 4 | ||||||
Pricing Fees | 15 | ||||||
Other Expenses | 79 | ||||||
Expenses Before Non Operating Expenses | 25,353 | ||||||
Bank Overdraft Expense | 14 | ||||||
Total Expenses | 25,367 | ||||||
Reimbursement of Class Specific Expenses — Class I (Note B) | (12 | ) | |||||
Reimbursement of Class Specific Expenses — Class C (Note B) | (1 | ) | |||||
Rebate from Morgan Stanley Affiliate (Note G) | (6 | ) | |||||
Net Expenses | 25,348 | ||||||
Net Investment Income | 40,749 | ||||||
Realized Gain (Loss): | |||||||
Investments Sold | 42,236 | ||||||
Foreign Currency Transactions | (609 | ) | |||||
Net Realized Gain | 41,627 | ||||||
Change in Unrealized Appreciation (Depreciation): | |||||||
Investments | (106,290 | ) | |||||
Foreign Currency Translations | 14 | ||||||
Net Change in Unrealized Appreciation (Depreciation) | (106,276 | ) | |||||
Net Realized Gain and Change in Unrealized Appreciation (Depreciation) | (64,649 | ) | |||||
Net Decrease in Net Assets Resulting from Operations | $ | (23,900 | ) | ||||
@ Amount is less than $500.
The accompanying notes are an integral part of the financial statements.
13
Morgan Stanley Institutional Fund, Inc.
Annual Report — December 31, 2015
Global Real Estate Portfolio
Statements of Changes in Net Assets | Year Ended December 31, 2015 (000) | Year Ended December 31, 2014 (000) | |||||||||
Increase (Decrease) in Net Assets: | |||||||||||
Operations: | |||||||||||
Net Investment Income | $ | 40,749 | $ | 43,522 | |||||||
Net Realized Gain (Loss) | 41,627 | (13,640 | ) | ||||||||
Net Change in Unrealized Appreciation (Depreciation) | (106,276 | ) | 267,088 | ||||||||
Net Increase (Decrease) in Net Assets Resulting from Operations | (23,900 | ) | 296,970 | ||||||||
Distributions from and/or in Excess of: | |||||||||||
Class I: | |||||||||||
Net Investment Income | (21,346 | ) | (32,422 | ) | |||||||
Class A: | |||||||||||
Net Investment Income | (2,184 | ) | (1,673 | ) | |||||||
Class L: | |||||||||||
Net Investment Income | (48 | ) | (51 | ) | |||||||
Class C: | |||||||||||
Net Investment Income | (3 | ) | — | ||||||||
Class IS: | |||||||||||
Net Investment Income | (18,420 | ) | (10,854 | ) | |||||||
Total Distributions | (42,001 | ) | (45,000 | ) | |||||||
Capital Share Transactions:(1) | |||||||||||
Class I: | |||||||||||
Subscribed | 271,674 | 400,262 | |||||||||
Distributions Reinvested | 20,026 | 30,916 | |||||||||
Redeemed | (900,616 | ) | (594,468 | ) | |||||||
Class A: | |||||||||||
Subscribed | 75,282 | 25,611 | |||||||||
Distributions Reinvested | 2,164 | 1,655 | |||||||||
Redeemed | (44,823 | ) | (28,866 | ) | |||||||
Class L: | |||||||||||
Subscribed | 392 | 308 | |||||||||
Distributions Reinvested | 48 | 51 | |||||||||
Redeemed | (554 | ) | (1,972 | ) | |||||||
Class C: | |||||||||||
Subscribed | 195 | * | — | ||||||||
Distributions Reinvested | 2 | * | — | ||||||||
Class IS: | |||||||||||
Subscribed | 611,395 | 439,963 | |||||||||
Distributions Reinvested | 16,673 | 9,217 | |||||||||
Redeemed | (165,921 | ) | (111,220 | ) | |||||||
Net Increase (Decrease) in Net Assets Resulting from Capital Share Transactions | (114,063 | ) | 171,457 | ||||||||
Total Increase (Decrease) in Net Assets | (179,964 | ) | 423,427 | ||||||||
Net Assets: | |||||||||||
Beginning of Period | 2,525,688 | 2,102,261 | |||||||||
End of Period (Including Distributions in Excess of Net Investment Income of $(17,148) and $(18,176)) | $ | 2,345,724 | $ | 2,525,688 | |||||||
The accompanying notes are an integral part of the financial statements.
14
Morgan Stanley Institutional Fund, Inc.
Annual Report — December 31, 2015
Global Real Estate Portfolio
Statements of Changes in Net Assets (cont'd) | Year Ended December 31, 2015 (000) | Year Ended December 31, 2014 (000) | |||||||||
(1) Capital Share Transactions: | |||||||||||
Class I: | |||||||||||
Shares Subscribed | 24,005 | 37,469 | |||||||||
Shares Issued on Distributions Reinvested | 1,847 | 2,857 | |||||||||
Shares Redeemed | (80,137 | ) | (56,654 | ) | |||||||
Net Decrease in Class I Shares Outstanding | (54,285 | ) | (16,328 | ) | |||||||
Class A: | |||||||||||
Shares Subscribed | 6,969 | 2,432 | |||||||||
Shares Issued on Distributions Reinvested | 201 | 154 | |||||||||
Shares Redeemed | (4,125 | ) | (2,750 | ) | |||||||
Net Increase (Decrease) in Class A Shares Outstanding | 3,045 | (164 | ) | ||||||||
Class L: | |||||||||||
Shares Subscribed | 34 | 29 | |||||||||
Shares Issued on Distributions Reinvested | 5 | 5 | |||||||||
Shares Redeemed | (50 | ) | (198 | ) | |||||||
Net Decrease in Class L Shares Outstanding | (11 | ) | (164 | ) | |||||||
Class C: | |||||||||||
Shares Subscribed | 18 | * | — | ||||||||
Shares Issued on Distributions Reinvested | — | @@* | — | ||||||||
Net Increase in Class C Shares Outstanding | 18 | — | |||||||||
Class IS: | |||||||||||
Shares Subscribed | 54,250 | 41,496 | |||||||||
Shares Issued on Distributions Reinvested | 1,537 | 852 | |||||||||
Shares Redeemed | (14,851 | ) | (10,405 | ) | |||||||
Net Increase in Class IS Shares Outstanding | 40,936 | 31,943 | |||||||||
* For the period April 30, 2015 through December 31, 2015.
@@ Amount is less than 500 shares.
The accompanying notes are an integral part of the financial statements.
15
Morgan Stanley Institutional Fund, Inc.
Annual Report — December 31, 2015
Financial Highlights
Global Real Estate Portfolio
Class I | |||||||||||||||||||||||
Year Ended December 31, | |||||||||||||||||||||||
Selected Per Share Data and Ratios | 2015 | 2014 | 2013 | 2012 | 2011 | ||||||||||||||||||
Net Asset Value, Beginning of Period | $ | 11.10 | $ | 9.91 | $ | 9.77 | $ | 7.77 | $ | 8.78 | |||||||||||||
Income (Loss) from Investment Operations: | |||||||||||||||||||||||
Net Investment Income† | 0.18 | 0.20 | 0.18 | 0.17 | 0.14 | ||||||||||||||||||
Net Realized and Unrealized Gain (Loss) | (0.28 | ) | 1.19 | 0.16 | 2.17 | (0.99 | ) | ||||||||||||||||
Total from Investment Operations | (0.10 | ) | 1.39 | 0.34 | 2.34 | (0.85 | ) | ||||||||||||||||
Distributions from and/or in Excess of: | |||||||||||||||||||||||
Net Investment Income | (0.20 | ) | (0.20 | ) | (0.20 | ) | (0.34 | ) | (0.16 | ) | |||||||||||||
Net Asset Value, End of Period | $ | 10.80 | $ | 11.10 | $ | 9.91 | $ | 9.77 | $ | 7.77 | |||||||||||||
Total Return++ | (0.94 | )% | 14.08 | % | 3.55 | % | 30.19 | % | (9.67 | )% | |||||||||||||
Ratios and Supplemental Data: | |||||||||||||||||||||||
Net Assets, End of Period (Thousands) | $ | 1,192,624 | $ | 1,828,656 | $ | 1,793,614 | $ | 1,880,999 | $ | 1,337,853 | |||||||||||||
Ratio of Expenses to Average Net Assets (1) | 1.05 | %+ | 1.05 | %+ | 1.02 | %+ | 1.02 | %+ | 1.04 | %+ | |||||||||||||
Ratio of Expenses to Average Net Assets Excluding Non Operating Expenses | 1.05 | %+ | N/A | 1.02 | %+ | N/A | N/A | ||||||||||||||||
Ratio of Net Investment Income to Average Net Assets (1) | 1.65 | %+ | 1.85 | %+ | 1.77 | %+ | 2.42 | %+ | 2.12 | %+ | |||||||||||||
Ratio of Rebate from Morgan Stanley Affiliates to Average Net Assets | 0.00 | %§ | 0.00 | %§ | 0.00 | %§ | 0.00 | %§ | 0.00 | %§ | |||||||||||||
Portfolio Turnover Rate | 29 | % | 32 | % | 33 | % | 29 | % | 28 | % | |||||||||||||
(1) Supplemental Information on the Ratios to Average Net Assets: | |||||||||||||||||||||||
Ratios Before Expense Limitation: | |||||||||||||||||||||||
Expenses to Average Net Assets | 1.05 | % | 1.05 | % | N/A | N/A | N/A | ||||||||||||||||
Net Investment Income to Average Net Assets | 1.65 | % | 1.85 | % | N/A | N/A | N/A | ||||||||||||||||
† Per share amount is based on average shares outstanding.
++ Calculated based on the net asset value as of the last business day of the period.
+ The Ratios of Expenses and Net Investment Income reflect the rebate of certain Portfolio expenses in connection with the investments in Morgan Stanley affiliates during the period. The effect of the rebate on the ratios is disclosed in the above table as "Ratio of Rebate from Morgan Stanley Affiliates to Average Net Assets."
§ Amount is less than 0.005%.
The accompanying notes are an integral part of the financial statements.
16
Morgan Stanley Institutional Fund, Inc.
Annual Report — December 31, 2015
Financial Highlights
Global Real Estate Portfolio
Class A | |||||||||||||||||||||||
Year Ended December 31, | |||||||||||||||||||||||
Selected Per Share Data and Ratios | 2015 | 2014 | 2013 | 2012 | 2011 | ||||||||||||||||||
Net Asset Value, Beginning of Period | $ | 11.05 | $ | 9.86 | $ | 9.72 | $ | 7.73 | $ | 8.74 | |||||||||||||
Income (Loss) from Investment Operations: | |||||||||||||||||||||||
Net Investment Income† | 0.16 | 0.17 | 0.15 | 0.15 | 0.12 | ||||||||||||||||||
Net Realized and Unrealized Gain (Loss) | (0.30 | ) | 1.19 | 0.15 | 2.16 | (0.98 | ) | ||||||||||||||||
Total from Investment Operations | (0.14 | ) | 1.36 | 0.30 | 2.31 | (0.86 | ) | ||||||||||||||||
Distributions from and/or in Excess of: | |||||||||||||||||||||||
Net Investment Income | (0.17 | ) | (0.17 | ) | (0.16 | ) | (0.32 | ) | (0.15 | ) | |||||||||||||
Net Asset Value, End of Period | $ | 10.74 | $ | 11.05 | $ | 9.86 | $ | 9.72 | $ | 7.73 | |||||||||||||
Total Return++ | (1.25 | )% | 13.88 | % | 3.18 | % | 29.93 | % | (9.91 | )% | |||||||||||||
Ratios and Supplemental Data: | |||||||||||||||||||||||
Net Assets, End of Period (Thousands) | $ | 135,517 | $ | 105,766 | $ | 96,046 | $ | 171,413 | $ | 130,244 | |||||||||||||
Ratio of Expenses to Average Net Assets (1) | 1.34 | %+ | 1.31 | %+ | 1.30 | %+^ | 1.27 | %+ | 1.29 | %+ | |||||||||||||
Ratio of Expenses to Average Net Assets Excluding Non Operating Expenses | 1.34 | %+ | N/A | 1.30 | %+^ | N/A | N/A | ||||||||||||||||
Ratio of Net Investment Income to Average Net Assets (1) | 1.47 | %+ | 1.60 | %+ | 1.43 | %+ | 2.17 | %+ | 1.87 | %+ | |||||||||||||
Ratio of Rebate from Morgan Stanley Affiliates to Average Net Assets | 0.00 | %§ | 0.00 | %§ | 0.00 | %§ | 0.00 | %§ | 0.00 | %§ | |||||||||||||
Portfolio Turnover Rate | 29 | % | 32 | % | 33 | % | 29 | % | 28 | % | |||||||||||||
(1) Supplemental Information on the Ratios to Average Net Assets: | |||||||||||||||||||||||
Ratios Before Expense Limitation: | |||||||||||||||||||||||
Expenses to Average Net Assets | N/A | N/A | 1.32 | % | N/A | 1.29 | % | ||||||||||||||||
Net Investment Income to Average Net Assets | N/A | N/A | 1.41 | % | N/A | 1.87 | % | ||||||||||||||||
† Per share amount is based on average shares outstanding.
++ Calculated based on the net asset value which does not reflect sales charges, if applicable, as of the last business day of the period.
+ The Ratios of Expenses and Net Investment Income reflect the rebate of certain Portfolio expenses in connection with the investments in Morgan Stanley affiliates during the period. The effect of the rebate on the ratios is disclosed in the above table as "Ratio of Rebate from Morgan Stanley Affiliates to Average Net Assets."
^ Effective September 16, 2013, the Adviser has agreed to limit the ratio of expenses to average net assets to the maximum ratio of 1.40% for Class A shares. Prior to September 16, 2013, the maximum ratio was 1.30% for Class A shares.
§ Amount is less than 0.005%.
The accompanying notes are an integral part of the financial statements.
17
Morgan Stanley Institutional Fund, Inc.
Annual Report — December 31, 2015
Financial Highlights
Global Real Estate Portfolio
Class L | |||||||||||||||||||||||
Year Ended December 31, | |||||||||||||||||||||||
Selected Per Share Data and Ratios | 2015 | 2014 | 2013 | 2012 | 2011 | ||||||||||||||||||
Net Asset Value, Beginning of Period | $ | 10.91 | $ | 9.74 | $ | 9.59 | $ | 7.63 | $ | 8.62 | |||||||||||||
Income (Loss) from Investment Operations: | |||||||||||||||||||||||
Net Investment Income† | 0.12 | 0.12 | 0.10 | 0.10 | 0.07 | ||||||||||||||||||
Net Realized and Unrealized Gain (Loss) | (0.31 | ) | 1.17 | 0.16 | 2.13 | (0.96 | ) | ||||||||||||||||
Total from Investment Operations | (0.19 | ) | 1.29 | 0.26 | 2.23 | (0.89 | ) | ||||||||||||||||
Distributions from and/or in Excess of: | |||||||||||||||||||||||
Net Investment Income | (0.11 | ) | (0.12 | ) | (0.11 | ) | (0.27 | ) | (0.10 | ) | |||||||||||||
Net Asset Value, End of Period | $ | 10.61 | $ | 10.91 | $ | 9.74 | $ | 9.59 | $ | 7.63 | |||||||||||||
Total Return++ | (1.71 | )% | 13.27 | % | 2.77 | % | 29.26 | % | (10.33 | )% | |||||||||||||
Ratios and Supplemental Data: | |||||||||||||||||||||||
Net Assets, End of Period (Thousands) | $ | 4,509 | $ | 4,755 | $ | 5,844 | $ | 7,050 | $ | 6,418 | |||||||||||||
Ratio of Expenses to Average Net Assets (1) | 1.78 | %+ | 1.79 | %+ | 1.77 | %+^ | 1.77 | %+ | 1.79 | %+ | |||||||||||||
Ratio of Expenses to Average Net Assets Excluding Non Operating Expenses | 1.77 | %+ | N/A | 1.77 | %+^ | N/A | N/A | ||||||||||||||||
Ratio of Net Investment Income to Average Net Assets (1) | 1.12 | %+ | 1.08 | %+ | 0.98 | %+ | 1.67 | %+ | 1.37 | %+ | |||||||||||||
Ratio of Rebate from Morgan Stanley Affiliates to Average Net Assets | 0.00 | %§ | 0.00 | %§ | 0.00 | %§ | 0.00 | %§ | 0.00 | %§ | |||||||||||||
Portfolio Turnover Rate | 29 | % | 32 | % | 33 | % | 29 | % | 28 | % | |||||||||||||
(1) Supplemental Information on the Ratios to Average Net Assets: | |||||||||||||||||||||||
Ratios Before Expense Limitation: | |||||||||||||||||||||||
Expenses to Average Net Assets | N/A | N/A | N/A | N/A | 1.79 | % | |||||||||||||||||
Net Investment Income to Average Net Assets | N/A | N/A | N/A | N/A | 1.37 | % | |||||||||||||||||
† Per share amount is based on average shares outstanding.
++ Calculated based on the net asset value as of the last business day of the period.
+ The Ratios of Expenses and Net Investment Income reflect the rebate of certain Portfolio expenses in connection with the investments in Morgan Stanley affiliates during the period. The effect of the rebate on the ratios is disclosed in the above table as "Ratio of Rebate from Morgan Stanley Affiliates to Average Net Assets."
^ Effective September 16, 2013, the Adviser has agreed to limit the ratio of expenses to average net assets to the maximum ratios of 1.90% for Class L shares. Prior to September 16, 2013, the maximum ratio was 1.80% for Class L shares.
§ Amount is less than 0.005%.
The accompanying notes are an integral part of the financial statements.
18
Morgan Stanley Institutional Fund, Inc.
Annual Report — December 31, 2015
Financial Highlights
Global Real Estate Portfolio
Class C | |||||||
Selected Per Share Data and Ratios | Period from April 30, 2015^ to December 31,2015 | ||||||
Net Asset Value, Beginning of Period | $ | 11.23 | |||||
Income (Loss) from Investment Operations: | |||||||
Net Investment Income† | 0.07 | ||||||
Net Realized and Unrealized Loss | (0.60 | ) | |||||
Total from Investment Operations | (0.53 | ) | |||||
Distributions from and/or in Excess of: | |||||||
Net Investment Income | (0.14 | ) | |||||
Net Asset Value, End of Period | $ | 10.56 | |||||
Total Return++ | (4.71 | )%# | |||||
Ratios and Supplemental Data: | |||||||
Net Assets, End of Period (Thousands) | $ | 191 | |||||
Ratios of Expenses to Average Net Assets (1) | 2.15 | %+* | |||||
Ratios of Expenses to Average Net Assets Excluding Non Operating Expenses | 2.15 | %+* | |||||
Ratio of Net Investment Income to Average Net Assets (1) | 1.01 | %+* | |||||
Ratio of Rebate from Morgan Stanley Affiliates to Average Net Assets | 0.00 | %§* | |||||
Portfolio Turnover Rate | 29 | % | |||||
(1) Supplemental Information on the Ratios to Average Net Assets: | |||||||
Ratios Before Expense Limitation: | |||||||
Expense to Average Net Assets | 3.25 | %* | |||||
Net Investment Income to Average Net Assets | (0.09 | )%* | |||||
^ Commencement of Offering.
† Per share amount is based on average shares outstanding.
++ Calculated based on the net asset value which does not reflect sales charges, if applicable, as of the last business day of the period.
+ The Ratios of Expenses and Net Investment Income reflect the rebate of certain Portfolio expenses in connection with the investments in Morgan Stanley affiliates during the period. The effect of the rebate on the ratios is disclosed in the above table as "Ratio of Rebate from Morgan Stanley Affiliates to Average Net Assets."
§ Amount is less than 0.005%.
# Not Annualized.
* Annualized.
The accompanying notes are an integral part of the financial statements.
19
Morgan Stanley Institutional Fund, Inc.
Annual Report — December 31, 2015
Financial Highlights
Global Real Estate Portfolio
Class IS | |||||||||||||||
Year Ended December 31, | Period from September 13, 2013^ to | ||||||||||||||
Selected Per Share Data and Ratios | 2015 | 2014 | December 31, 2013 | ||||||||||||
Net Asset Value, Beginning of Period | $ | 11.11 | $ | 9.91 | $ | 10.01 | |||||||||
Income (Loss) from Investment Operations: | |||||||||||||||
Net Investment Income† | 0.20 | 0.22 | 0.08 | ||||||||||||
Net Realized and Unrealized Gain (Loss) | (0.29 | ) | 1.19 | 0.02 | |||||||||||
Total from Investment Operations | (0.09 | ) | 1.41 | 0.10 | |||||||||||
Distributions from and/or in Excess of: | |||||||||||||||
Net Investment Income | (0.21 | ) | (0.21 | ) | (0.20 | ) | |||||||||
Net Asset Value, End of Period | $ | 10.81 | $ | 11.11 | $ | 9.91 | |||||||||
Total Return++ | (0.84 | )% | 14.27 | % | 1.08 | %# | |||||||||
Ratios and Supplemental Data: | |||||||||||||||
Net Assets, End of Period (Thousands) | $ | 1,012,883 | $ | 586,511 | $ | 206,757 | |||||||||
Ratio of Expenses to Average Net Assets (1) | 0.97 | %+ | 0.96 | %+ | 0.96 | %+^^* | |||||||||
Ratio of Expenses to Average Net Assets Excluding Non Operating Expenses | 0.97 | %+ | N/A | N/A | |||||||||||
Ratio of Net Investment Income to Average Net Assets (1) | 1.78 | %+ | 2.01 | %+ | 2.88 | %+* | |||||||||
Ratio of Rebate from Morgan Stanley Affiliates to Average Net Assets | 0.00 | %§ | 0.00 | %§ | 0.00 | %§* | |||||||||
Portfolio Turnover Rate | 29 | % | 32 | % | 33 | %# | |||||||||
(1) Supplemental Information on the Ratios to Average Net Assets: | |||||||||||||||
Ratios Before Expense Limitation: | |||||||||||||||
Expenses to Average Net Assets | N/A | 0.96 | % | 0.97 | %* | ||||||||||
Net Investment Income to Average Net Assets | N/A | 2.01 | % | 2.87 | %* | ||||||||||
^ Commencement of Offering.
† Per share amount is based on average shares outstanding.
++ Calculated based on the net asset value as of the last business day of the period.
+ The Ratios of Expenses and Net Investment Income reflect the rebate of certain Portfolio expenses in connection with the investments in Morgan Stanley affiliates during the period. The effect of the rebate on the ratios is disclosed in the above table as "Ratio of Rebate from Morgan Stanley Affiliates to Average Net Assets."
^^ Effective September 16, 2013, the Adviser has agreed to limit the ratio of expenses to average net assets to the maximum ratio of 0.99% for Class IS shares.
§ Amount is less than 0.005%.
# Not Annualized.
* Annualized.
The accompanying notes are an integral part of the financial statements.
20
Morgan Stanley Institutional Fund, Inc.
Annual Report — December 31, 2015
Notes to Financial Statements
Morgan Stanley Institutional Fund, Inc. (the "Fund") is registered under the Investment Company Act of 1940, as amended (the "Act"), as an open-end management investment company. The Fund is comprised of twenty-six separate, active, diversified and non-diversified portfolios (individually referred to as a "Portfolio", collectively as the "Portfolios"). The Fund applies investment company accounting and reporting guidance.
The accompanying financial statements relate to the Global Real Estate Portfolio. The Portfolio's adviser, Morgan Stanley Investment Management Inc. (the "Adviser") and sub-advisers, Morgan Stanley Investment Management Limited ("MSIM Limited") and Morgan Stanley Investment Management Company ("MSIM Company") (together, the "Sub-Advisers"), seek to provide current income and capital appreciation by investing at least 80% of the Portfolio's assets in equity securities of companies in the real estate industry, including real estate operating companies ("REOCs"), real estate investment trusts ("REITs") and similar entities established outside the U.S. (foreign real estate companies). The Portfolio has capital subscription commitments to an investee company for this same purpose, the details of which are disclosed in the Unfunded Commitments note.
The Portfolio offers five classes of shares — Class I, Class A, Class L, Class C and Class IS. On April 30, 2015, the Portfolio commenced offering Class C shares and suspended offering of Class L shares. Existing Class L shareholders may invest through reinvestment of dividends and distributions.
A. Significant Accounting Policies: The following significant accounting policies are in conformity with U.S. generally accepted accounting principles ("GAAP"). Such policies are consistently followed by the Fund in the preparation of its financial statements. GAAP may require management to make estimates and assumptions that affect the reported amounts and disclosures in the financial statements. Actual results may differ from those estimates.
1. Security Valuation: (1) An equity portfolio security listed or traded on an exchange is valued at its latest reported sales price (or at the exchange official closing price if such exchange reports an official closing price), if there were no sales on a given day, the security is valued at the mean between the last reported bid and asked prices; (2) all other equity portfolio securities for which
over-the-counter ("OTC") market quotations are readily available are valued at its latest reported sales price. In cases where a security is traded on more than one exchange, the security is valued on the exchange designated as the primary market; (3) when market quotations are not readily available, including circumstances under which the Adviser or Sub-Advisers determine that the closing price, last sale price or the mean between the last reported bid and asked prices are not reflective of a security's market value, portfolio securities are valued at their fair value as determined in good faith under procedures established by and under the general supervision of the Fund's Board of Directors (the "Directors"). Occasionally, developments affecting the closing prices of securities and other assets may occur between the times at which valuations of such securities are determined (that is, close of the foreign market on which the securities trade) and the close of business of the New York Stock Exchange ("NYSE"). If developments occur during such periods that are expected to materially affect the value of such securities, such valuations may be adjusted to reflect the estimated fair value of such securities as of the close of the NYSE, as determined in good faith by the Directors or by the Adviser using a pricing service and/or procedures approved by the Directors; (4) quotations of foreign portfolio securities, other assets and liabilities and forward contracts stated in foreign currency are translated into U.S. dollar equivalents at the prevailing market rates prior to the close of the NYSE; (5) investments in mutual funds, including the Morgan Stanley Institutional Liquidity Funds, are valued at the net asset value ("NAV") as of the close of each business day; and (6) short-term debt securities with remaining maturities of 60 days or less at the time of purchase may be valued at amortized cost, unless the Adviser determines such valuation does not reflect the securities' market value, in which case these securities will be valued at their fair market value determined by the Adviser.
The Directors have responsibility for determining in good faith the fair value of the investments, and the Directors may appoint others, such as the Fund's Adviser or a valuation committee, to assist the Directors in determining fair value and to make the actual calculations pursuant to the fair valuation methodologies previously approved by the Directors. Under procedures approved by the Directors, the Fund's Adviser has
21
Morgan Stanley Institutional Fund, Inc.
Annual Report — December 31, 2015
Notes to Financial Statements (cont'd)
formed a Valuation Committee whose members are approved by the Directors. The Valuation Committee provides administration and oversight of the Fund's valuation policies and procedures, which are reviewed at least annually by the Directors. These procedures allow the Fund to utilize independent pricing services, quotations from securities and financial instrument dealers, and other market sources to determine fair value.
The Fund has procedures to determine the fair value of securities and other financial instruments for which market prices are not readily available. Under these procedures, the Valuation Committee convenes on a regular and ad hoc basis to review such securities and considers a number of factors, including valuation methodologies and significant unobservable valuation inputs, when arriving at fair value. The Valuation Committee may employ a market-based approach which may use related or comparable assets or liabilities, recent transactions, market multiples, book values, and other relevant information for the investment to determine the fair value of the investment. An income-based valuation approach may also be used in which the anticipated future cash flows of the investment are discounted to calculate fair value. Discounts may also be applied due to the nature or duration of any restrictions on the disposition of the investments. Due to the inherent uncertainty of valuations of such investments, the fair values may differ significantly from the values that would have been used had an active market existed. The Valuation Committee employs various methods for calibrating these valuation approaches including a regular review of valuation methodologies, key inputs and assumptions, transactional back-testing or disposition analysis, and reviews of any related market activity.
The Portfolio invests a significant portion of its assets in securities of REITs. The market's perception of prospective declines in private real estate values and other financial assets may result in increased volatility of market prices that can negatively impact the valuation of certain issuers held by the Portfolio.
2. Fair Value Measurement: Financial Accounting Standards Board ("FASB") Accounting Standards
CodificationTM ("ASC") 820, "Fair Value Measurement" ("ASC 820"), defines fair value as the value that the Fund would receive to sell an investment or pay to transfer a liability in a timely transaction with an independent buyer in the principal market, or in the absence of a principal market the most advantageous market for the investment or liability. ASC 820 establishes a three-tier hierarchy to distinguish between (1) inputs that reflect the assumptions market participants would use in valuing an asset or liability developed based on market data obtained from sources independent of the reporting entity (observable inputs) and (2) inputs that reflect the reporting entity's own assumptions about the assumptions market participants would use in valuing an asset or liability developed based on the best information available in the circumstances (unobservable inputs) and to establish classification of fair value measurements for disclosure purposes. Various inputs are used in determining the value of the Fund's investments. The inputs are summarized in the three broad levels listed below.
• Level 1 – unadjusted quoted prices in active markets for identical investments
• Level 2 – other significant observable inputs (including quoted prices for similar investments, interest rates, prepayment speeds, credit risk, etc.)
• Level 3 – significant unobservable inputs including the Fund's own assumptions in determining the fair value of investments. Factors considered in making this determination may include, but are not limited to, information obtained by contacting the issuer, analysts, or the appropriate stock exchange (for exchange-traded securities), analysis of the issuer's financial statements or other available documents and, if necessary, available information concerning other securities in similar circumstances
The inputs or methodology used for valuing securities are not necessarily an indication of the risk associated with investing in those securities and the determination of the significance of a particular input to the fair value measurement in its entirety requires judgment and considers factors specific to each security.
22
Morgan Stanley Institutional Fund, Inc.
Annual Report — December 31, 2015
Notes to Financial Statements (cont'd)
The following is a summary of the inputs used to value the Portfolio's investments as of December 31, 2015.
Investment Type | Level 1 Unadjusted quoted prices (000) | Level 2 Other significant observable inputs (000) | Level 3 Significant unobservable inputs (000) | Total (000) | |||||||||||||||
Assets: | |||||||||||||||||||
Common Stocks | |||||||||||||||||||
Diversified | $ | 95,836 | $ | 535,463 | $ | — | † | $ | 631,299 | † | |||||||||
Health Care | 73,456 | — | — | 73,456 | |||||||||||||||
Industrial | 33,357 | 41,992 | 603 | 75,952 | |||||||||||||||
Lodging/Resorts | 148,290 | — | — | 148,290 | |||||||||||||||
Mixed Industrial/Office | 23,505 | 7,894 | — | 31,399 | |||||||||||||||
Office | 147,164 | 151,177 | — | 298,341 | |||||||||||||||
Residential | 270,756 | 40,279 | — | 311,035 | |||||||||||||||
Retail | 410,043 | 213,357 | — | 623,400 | |||||||||||||||
Self Storage | 86,602 | — | — | 86,602 | |||||||||||||||
Total Common Stocks | 1,289,009 | 990,162 | 603 | † | 2,279,774 | † | |||||||||||||
Right | — | 3 | — | 3 | |||||||||||||||
| Short-Term Investment | |||||||||||||||||||
| Investment Company | 24,444 | — | — | 24,444 | |||||||||||||||
Total Assets | $ | 1,313,453 | $ | 990,165 | $ | 603 | † | $ | 2,304,221 | † | |||||||||
† Includes one security which is valued at zero.
Transfers between investment levels may occur as the markets fluctuate and/or the availability of data used in an investment's valuation changes. The Portfolio recognizes transfers between the levels as of the end of the period. As of December 31, 2015, securities with a total value of approximately $1,870,000 transferred from Level 1 to Level 2. Securities that were valued using unadjusted quoted prices at December 31, 2014 were valued using other significant observable inputs at December 31, 2015. At December 31, 2015, the fair value of certain securities were adjusted due to developments which occurred between the time of the close of the foreign markets on which they trade and the close of business on the NYSE which resulted in their level 2 classification.
Following is a reconciliation of investments in which significant unobservable inputs (Level 3) were used in determining fair value.
| Common Stocks (000) | |||||||
Beginning Balance | $ | 6,673 | † | ||||
Purchases | — | ||||||
Sales | (6,266 | ) | |||||
Amortization of discount | — | ||||||
Transfers in | — | ||||||
Transfers out | — | ||||||
Corporate actions | (1,363 | ) | |||||
Change in unrealized appreciation (depreciation) | (3,091 | ) | |||||
Realized gains (losses) | 4,650 | ||||||
Ending Balance | $ | 603 | † | ||||
| Net change in unrealized appreciation (depreciation) from investments still held as of December 31, 2015 | $ | 305 | |||||
† Includes one security which is valued at zero.
The following table presents additional information about valuation techniques and inputs used for investments that are measured at fair value and categorized within Level 3 as of December 31, 2015.
| Fair Value at December 31, 2015 (000) | Valuation Technique | Unobservable Input | |||||||||||||
Industrial | |||||||||||||||
| Common Stock | $ | 603 | Reported Capital Balance, Adjusted for Subsequent Capital Calls, Return of Capital and Significant Market Changes between last Capital Statement and Valuation Date, as applicable | Adjusted Capital Balance | |||||||||||
3. Foreign Currency Translation and Foreign Investments: The books and records of the Portfolio are maintained in U.S. dollars. Foreign currency amounts are translated into U.S. dollars as follows:
– investments, other assets and liabilities at the prevailing rate of exchange on the valuation date;
– investment transactions and investment income at the prevailing rates of exchange on the dates of such transactions.
Although the net assets of the Portfolio are presented at the foreign exchange rates and market values at the close of the period, the Portfolio does not isolate that portion of the results of operations arising as a result of changes in the foreign exchange rates from the fluctuations arising
23
Morgan Stanley Institutional Fund, Inc.
Annual Report — December 31, 2015
Notes to Financial Statements (cont'd)
from changes in the market prices of securities held at period end. Similarly, the Portfolio does not isolate the effect of changes in foreign exchange rates from the fluctuations arising from changes in the market prices of securities sold during the period. Accordingly, realized and unrealized foreign currency gains (losses) on investments in securities are included in the reported net realized and unrealized gains (losses) on investment transactions and balances. However, pursuant to U.S. Federal income tax regulations, gains and losses from certain foreign currency transactions and the foreign currency portion of gains and losses realized on sales and maturities of foreign denominated debt securities are treated as ordinary income for U.S. Federal income tax purposes.
Net realized gains (losses) on foreign currency transactions represent net foreign exchange gains (losses) from foreign currency forward exchange contracts, disposition of foreign currencies, currency gains (losses) realized between the trade and settlement dates on securities transactions, and the difference between the amount of investment income and foreign withholding taxes recorded on the Portfolio's books and the U.S. dollar equivalent amounts actually received or paid. Net unrealized currency gains (losses) from valuing foreign currency denominated assets and liabilities at period end exchange rates are reflected as a component of unrealized appreciation (depreciation) in the Statement of Assets and Liabilities. The change in unrealized currency gains (losses) on foreign currency translations for the period is reflected in the Statement of Operations.
Foreign security and currency transactions may involve certain considerations and risks not typically associated with those of U.S. dollar denominated transactions as a result of, among other factors, fluctuations of exchange rates in relation to the U.S. dollar, the possibility of lower levels of governmental supervision and regulation of foreign securities markets and the possibility of political or economic instability.
Governmental approval for foreign investments may be required in advance of making an investment under certain circumstances in some countries, and the extent of foreign investments in domestic companies may be subject to limitation in other countries. Foreign ownership limitations also may be imposed by the charters of individual companies to prevent, among other concerns, violations of foreign investment limitations. As a result,
an additional class of shares (identified as "Foreign" in the Portfolio of Investments) may be created and offered for investment. The "local" and "foreign shares" market values may differ. In the absence of trading of the foreign shares in such markets, the Portfolio values the foreign shares at the closing exchange price of the local shares.
4. Unfunded Commitments: Subject to the terms of a Subscription Agreement between the Portfolio and Exeter Industrial Value Fund LP, the Portfolio has made a subscription commitment of $2,000,000 for which it will receive 2,000,000 shares of common stock. As of December 31, 2015, Exeter Industrial Value Fund LP has drawn down approximately $1,860,000 which represents 93.0% of the commitment.
5. Restricted Securities: The Portfolio invests in unregistered or otherwise restricted securities. The term "restricted securities" refers to securities that are unregistered or are held by control persons of the issuer and securities that are subject to contractual restrictions on their resale. As a result, restricted securities may be more difficult to value and the Portfolio may have difficulty disposing of such assets either in a timely manner or for a reasonable price. In order to dispose of an unregistered security, the Portfolio, where it has contractual rights to do so, may have to cause such security to be registered. A considerable period may elapse between the time the decision is made to sell the security and the time the security is registered so that the Portfolio could sell it. Contractual restrictions on the resale of securities vary in length and scope and are generally the result of a negotiation between the issuer and acquirer of the securities. The Portfolio would, in either case, bear market risks during that period. Restricted securities are identified in the Portfolio of Investments.
6. Indemnifications: The Fund enters into contracts that contain a variety of indemnifications. The Fund's maximum exposure under these arrangements is unknown. However, the Fund has not had prior claims or losses pursuant to these contracts and expects the risk of loss to be remote.
7. Dividends and Distributions to Shareholders: Dividend income and distributions to shareholders are recorded on the ex-dividend date. Dividends from net investment income, if any, are declared and paid annually.
24
Morgan Stanley Institutional Fund, Inc.
Annual Report — December 31, 2015
Notes to Financial Statements (cont'd)
Net realized capital gains, if any, are distributed at least annually.
8. Security Transactions, Income and Expenses: Security transactions are accounted for on the trade date (date the order to buy or sell is executed). Realized gains and losses on the sale of investment securities are determined on the specific identified cost method. Dividend income and other distributions are recorded on the ex-dividend date (except for certain foreign dividends which may be recorded as soon as the Portfolio is informed of such dividends) net of applicable withholding taxes. Interest income is recognized on the accrual basis except where collection is in doubt. Discounts are accreted and premiums are amortized over the life of the respective securities. Most expenses of the Fund can be directly attributed to a particular Portfolio. Expenses which cannot be directly attributed are apportioned among the Portfolios based upon relative net assets or other appropriate methods. Income, expenses (other than class specific expenses — distribution and shareholder services, transfer agency and sub transfer agency fees) and realized and unrealized gains or losses are allocated to each class of shares based upon their relative net assets.
The Portfolio owns shares of REITs which report information on the source of their distributions annually in the following calendar year. A portion of distributions received from REITs during the year is estimated to be a return of capital and is recorded as a reduction of their cost.
B. Advisory/Sub-Advisory Fees: The Adviser, a wholly-owned subsidiary of Morgan Stanley, provides the Portfolio with advisory services under the terms of an Investment Advisory Agreement, paid quarterly, at the annual rate based on the daily net assets as follows:
| First $2.5 billion | Over $2.5 billion | ||||||
| 0.85 | % | 0.80 | % | ||||
For the year ended December 31, 2015, the advisory fee rate (net of rebate) was equivalent to an annual effective rate of 0.85% of the Portfolio's average daily net assets.
The Adviser has agreed to reduce its advisory fee and/or reimburse the Portfolio so that total annual portfolio operating expenses, excluding certain investment related expenses, taxes, interest and other extraordinary expenses (including litigation), will not exceed 1.05% for Class I shares, 1.40% for Class A shares, 1.90% for Class L shares, 2.15% for Class C shares and
0.99% for Class IS shares. The fee waivers and/or expense reimbursements will continue for at least one year from the date of the Portfolio's prospectus or until such time that the Directors act to discontinue all or a portion of such waivers or reimbursements when they deem such action is appropriate. For the year ended December 31, 2015, approximately $13,000 of other expenses were reimbursed by the Adviser pursuant to this arrangement.
The Adviser has entered into a Sub-Advisory Agreement with the Sub-Advisers, each a wholly-owned subsidiary of Morgan Stanley. The Sub-Advisers provide the Portfolio with advisory services subject to the overall supervision of the Adviser and the Fund's Officers and Directors. The Adviser pays the Sub-Advisers on a monthly basis a portion of the net advisory fees the Adviser receives from the Portfolio.
C. Administration Fees: The Adviser also serves as Administrator to the Fund and provides administrative services pursuant to an Administration Agreement for an annual fee, accrued daily and paid monthly, of 0.08% of the Portfolio's average daily net assets.
Under a Sub-Administration Agreement between the Administrator and State Street Bank and Trust Company ("State Street"), State Street provides certain administrative services to the Fund. For such services, the Administrator pays State Street a portion of the fee the Administrator receives from the Portfolio.
D. Distribution and Shareholder Services Fees: Morgan Stanley Distribution, Inc. ("MSDI" or the "Distributor"), a wholly-owned subsidiary of the Adviser and Sub-Advisers and an indirect subsidiary of Morgan Stanley, serves as the Fund's Distributor of Portfolio shares pursuant to a Distribution Agreement. The Fund has adopted a Shareholder Services Plan with respect to Class A shares pursuant to Rule 12b-1 under the Act. Under the Shareholder Services Plan, the Portfolio pays the Distributor a shareholder services fee, accrued daily and paid monthly, at an annual rate of 0.25% of the Portfolio's average daily net assets attributable to Class A shares.
The Fund has adopted a Distribution and Shareholder Services Plan with respect to Class L shares pursuant to Rule 12b-1 under the Act. Under the Distribution and Shareholder Services Plan, the Portfolio pays the Distributor a distribution fee, accrued daily and paid monthly, at an annual rate of 0.50% and a shareholder services fee, accrued daily and paid monthly, at an annual rate of 0.25% of the Portfolio's average daily net assets attributable to Class L shares.
25
Morgan Stanley Institutional Fund, Inc.
Annual Report — December 31, 2015
Notes to Financial Statements (cont'd)
The Fund has adopted a Distribution and Shareholder Services Plan with respect to Class C shares pursuant to Rule 12b-1 under the Act. Under the Distribution and Shareholder Services Plan, the Portfolio pays the Distributor a distribution fee, accrued daily and paid monthly, at an annual rate of 0.75% and a shareholder services fee, accrued daily and paid monthly, at an annual rate of 0.25% of the Portfolio's average daily net assets attributable to Class C shares.
The distribution and shareholder services fees are used to support the expenses associated with servicing and maintaining accounts. The Distributor may compensate other parties for providing shareholder support services to investors who purchase Class A, Class L and Class C shares.
E. Dividend Disbursing and Transfer Agent: The Fund's dividend disbursing and transfer agent is Boston Financial Data Services, Inc. ("BFDS"). Pursuant to a Transfer Agency Agreement, the Fund pays BFDS a fee based on the number of classes, accounts and transactions relating to the Portfolios of the Fund.
F. Custodian Fees: State Street (the "Custodian") serves as Custodian for the Fund in accordance with a Custodian Agreement. The Custodian holds cash, securities, and other assets of the Fund as required by the Act. Custody fees are payable monthly based on assets held in custody, investment purchases and sales activity and account maintenance fees, plus reimbursement for certain out-of-pocket expenses.
G. Security Transactions and Transactions with Affiliates: For the year ended December 31, 2015, purchases and sales of investment securities for the Portfolio, other than long-term U.S. Government securities and short-term investments, were approximately $685,574,000 and $744,496,000, respectively. There were no purchases and sales of long-term U.S. Government securities for the year ended December 31, 2015.
The Portfolio invests in the Institutional Class of the Morgan Stanley Institutional Liquidity Funds — Treasury Portfolio (the "Liquidity Funds"), an open-end management investment company managed by the Adviser. Advisory fees paid by the Portfolio are reduced by an amount equal to its pro-rata share of the advisory and administration fees paid by the Portfolio due to its investment in the Liquidity Funds. For the year ended December 31, 2015, advisory fees paid were reduced by approximately $6,000 relating to the Portfolio's investment in the Liquidity Funds.
A summary of the Portfolio's transactions in shares of the Liquidity Funds during the year ended December 31, 2015 is as follows:
| Value December 31, 2014 (000) | Purchases at Cost (000) | Sales (000) | Dividend Income (000) | Value December 31, 2015 (000) | |||||||||||||||
| $ | 51,296 | $ | 321,888 | $ | 348,740 | $ | 7 | $ | 24,444 | ||||||||||
The Portfolio has an unfunded Deferred Compensation Plan (the "Compensation Plan"), which allows each independent Director to defer payment of all, or a portion, of the fees he or she receives for serving on the Board of Directors. Each eligible Director generally may elect to have the deferred amounts credited with a return equal to the total return on one or more of the Morgan Stanley funds that are offered as investment options under the Compensation Plan. Appreciation/depreciation and distributions received from these investments are recorded with an offsetting increase/decrease in the deferred compensation obligation and do not affect the NAV of the Portfolio.
H. Federal Income Taxes: It is the Portfolio's intention to continue to qualify as a regulated investment company and distribute all of its taxable and tax-exempt income. Accordingly, no provision for Federal income taxes is required in the financial statements.
The Portfolio may be subject to taxes imposed by countries in which it invests. Such taxes are generally based on income and/or capital gains earned or repatriated. Taxes are accrued based on net investment income, net realized gains and net unrealized appreciation as such income and/or gains are earned. Taxes may also be based on transactions in foreign currency and are accrued based on the value of investments denominated in such currency.
FASB ASC 740-10, "Income Taxes — Overall", sets forth a minimum threshold for financial statement recognition of the benefit of a tax position taken or expected to be taken in a tax return. Management has concluded there are no significant uncertain tax positions that would require recognition in the financial statements. If applicable, the Portfolio recognizes interest accrued related to unrecognized tax benefits in "Interest Expense" and penalties in "Other Expenses" in the Statement of Operations. The Portfolio files tax returns with the U.S. Internal Revenue Service, New York and various states. Generally, each of the tax years in the four-year period ended December 31, 2015, remains subject to examination by taxing authorities.
26
Morgan Stanley Institutional Fund, Inc.
Annual Report — December 31, 2015
Notes to Financial Statements (cont'd)
The tax character of distributions paid may differ from the character of distributions shown in the Statements of Changes in Net Assets due to short-term capital gains being treated as ordinary income for tax purposes. The tax character of distributions paid during fiscal 2015 and 2014 was as follows:
| 2015 Distributions Paid From: | 2014 Distributions Paid From: | ||||||||||||||
| Ordinary Income (000) | Long-Term Capital Gain (000) | Ordinary Income (000) | Long-Term Capital Gain (000) | ||||||||||||
| $ | 42,001 | $ | — | $ | 45,000 | $ | — | ||||||||
The amount and character of income and gains to be distributed are determined in accordance with income tax regulations which may differ from GAAP. These book/tax differences are either considered temporary or permanent in nature.
Temporary differences are primarily due to differing book and tax treatments in the timing of the recognition of gains (losses) on certain investment transactions and the timing of the deductibility of certain expenses.
Permanent differences, primarily due to differing treatments of gains (losses) related to foreign currency transactions, redemptions-in-kind and basis adjustments on certain equity securities designated as passive foreign investment companies, resulted in the following reclassifications among the components of net assets at December 31, 2015:
| Distributions in Excess of Net Investment Income (000) | Accumulated Net Realized Loss (000) | Paid-in- Capital (000) | |||||||||
| $ | 2,280 | $ | 5,488 | $ | (7,768 | ) | |||||
At December 31, 2015, the Portfolio had no distributable earnings on a tax basis.
At December 31, 2015, the Portfolio had available capital loss carryforwards to offset future net capital gains, to the extent provided by regulations, through the indicated expiration dates:
| Amount (000) | Expiration | ||||||
| $ | 6,431 | December 31, 2018 | |||||
To the extent that capital loss carryforwards are used to offset any future capital gains realized during the carryover period as provided by U.S. Federal income tax regulations, no capital gains tax liability will be incurred by the Portfolio for gains realized and not distributed. To the extent that capital gains are offset, such gains will not be distributed to the shareholders. During the year ended December 31, 2015, the Portfolio utilized capital loss carryforwards for U. S. Federal income tax purposes of approximately $45,146,000.
Capital losses and specified ordinary losses, including currency losses, incurred after October 31 but within the taxable year are deemed to arise on the first day of the Portfolio's next taxable year. For the year ended December 31, 2015, the Portfolio deferred to January 1, 2016 for U.S. Federal income tax purposes the following losses:
| Post-October Currency and Specified Ordinary Losses (000) | Post-October Capital Losses (000) | ||||||
| $ | 6,975 | $ | — | ||||
For the year ended December 31,2015, the Portfolio realized gains from in-kind redemptions of approximately $6,767,000. The gains are not taxable income to the Portfolio.
I. Other: At December 31, 2015, the Portfolio had record owners of 10% or greater. Investment activities of these shareholders could have a material impact on the Portfolio. The aggregate percentage of such owners was 20.6%.
27
Morgan Stanley Institutional Fund, Inc.
Annual Report — December 31, 2015
Report of Independent Registered Public Accounting Firm
To the Shareholders and Board of Directors of
Morgan Stanley Institutional Fund, Inc. —
Global Real Estate Portfolio
We have audited the accompanying statement of assets and liabilities, including the portfolio of investments, of Global Real Estate Portfolio (one of the portfolios constituting Morgan Stanley Institutional Fund, Inc.) (the "Portfolio") as of December 31, 2015, and the related statement of operations for the year then ended, the statements of changes in net assets for each of the two years in the period then ended and the financial highlights for each of the years or periods indicated therein. These financial statements and financial highlights are the responsibility of the Portfolio's management. Our responsibility is to express an opinion on these financial statements and financial highlights based on our audits.
We conducted our audits in accordance with the standards of the Public Company Accounting Oversight Board (United States). Those standards require that we plan and perform the audit to obtain reasonable assurance about whether the financial statements and financial highlights are free of material misstatement. We were not engaged to perform an audit of the Portfolio's internal control over financial reporting. Our audits included consideration of internal control over financial reporting as a basis for designing audit procedures that are appropriate in the circumstances, but not for the purpose of expressing an opinion on the effectiveness of the Portfolio's internal control over financial reporting. Accordingly, we express no such opinion. An audit also includes examining, on a test basis, evidence supporting the amounts and disclosures in the financial statements and financial highlights, assessing the accounting principles used and significant estimates made by management, and evaluating the overall financial statement presentation. Our procedures included confirmation of securities owned as of December 31, 2015, by correspondence with the custodian and others or by other appropriate auditing procedures where replies from others were not received. We believe that our audits provide a reasonable basis for our opinion.
In our opinion, the financial statements and financial highlights referred to above present fairly, in all material respects, the financial position of Global Real Estate Portfolio (one of the portfolios constituting Morgan Stanley Institutional Fund, Inc.) at December 31, 2015, the results of its operations for the year then ended, the changes in its net assets for each of the two years in the period then ended and the financial highlights for each of the years or periods indicated therein, in conformity with U.S. generally accepted accounting principles.

Boston, Massachusetts
February 26, 2016
28
Morgan Stanley Institutional Fund, Inc.
Annual Report — December 31, 2015
Federal Tax Notice (unaudited)
For Federal income tax purposes, the following information is furnished with respect to the distributions paid by the Portfolio during its taxable year ended December 31, 2015. For corporate shareholders, 1.9% of the dividends qualified for the dividends received deduction.
For Federal income tax purposes, the following information is furnished with respect to the Portfolio's earnings for its taxable year ended December 31, 2015. When distributed, certain earnings may be subject to a maximum tax rate of 15% as provided for the Jobs and Growth Tax Relief Reconciliation Act of 2003. The Portfolio designated up to a maximum of approximately $13,902,000 as taxable at this lower rate.
In January, the Portfolio provides tax information to shareholders for the preceding calendar year.
29
Morgan Stanley Institutional Fund, Inc.
Annual Report — December 31, 2015
U.S. Privacy Policy (unaudited)
AN IMPORTANT NOTICE CONCERNING OUR U.S. PRIVACY POLICY
This privacy notice describes the U.S. privacy policy of Morgan Stanley Distribution, Inc., and the Morgan Stanley family of mutual funds ("us", "our", "we").
We are required by federal law to provide you with notice of our U.S. privacy policy ("Policy"). This Policy applies to both our current and former clients unless we state otherwise and is intended for individual clients who purchase products or receive services from us for personal, family or household purposes. This Policy is not applicable to partnerships, corporations, trusts or other non-individual clients or account holders, nor is this Policy applicable to individuals who are either beneficiaries of a trust for which we serve as trustee or participants in an employee benefit plan administered or advised by us. This Policy is, however, applicable to individuals who select us to be a custodian of securities or assets in individual retirement accounts, 401(k) accounts, or accounts subject to the Uniform Gifts to Minors Act.
This notice sets out our business practices to protect your privacy; how we collect and share personal information about you; and how you can limit our sharing or certain uses by others of this information. We may amend this Policy at any time, and will inform you of any changes to our Policy as required by law.
WE RESPECT YOUR PRIVACY
We appreciate that you have provided us with your personal financial information and understand your concerns about your information. We strive to safeguard the information our clients entrust to us. Protecting the confidentiality and security of client information is an important part of how we conduct our business.
This notice describes what personal information we collect about you, how we collect it, when we may share it with others, and how certain others may use it. It discusses the steps you may take to limit our sharing of certain information about you with our affiliated companies, including, but not limited to our affiliated banking businesses, brokerage firms and credit service affiliates. It also discloses how you may limit our affiliates' use of shared information for marketing purposes.
Throughout this Policy, we refer to the nonpublic information that personally identifies you as "personal information." We also use the term "affiliated company" in this notice. An affiliated company is a company in our family of companies and includes companies with the Morgan Stanley name. These affiliated companies are financial institutions such as broker-dealers, banks, investment advisers and credit card issuers. We refer to any company that is not an affiliated company as a nonaffiliated third party. For purposes of Section 5 of this notice, and your ability to limit certain uses of personal information by our affiliates, this notice applies to the use of personal information by our affiliated companies.
1. WHAT PERSONAL INFORMATION DO WE COLLECT FROM YOU?
We may collect the following types of information about you: (i) information provided by you, including information from applications and other forms we receive from you, (ii) information about your transactions with us or our affiliates, (iii) information about your transactions with nonaffiliated third parties, (iv) information from consumer reporting agencies, (v) information obtained from our websites, and (vi) information obtained from other sources. For example:
• We collect information such as your name, address, e-mail address, telephone/fax numbers, assets, income and investment objectives through applications and other forms you submit to us.
• We may obtain information about account balances, your use of account(s) and the types of products and services you prefer to receive from us through your dealings and transactions with us and other sources.
• We may obtain information about your creditworthiness and credit history from consumer reporting agencies.
• We may collect background information from and through third-party vendors to verify representations you have made and to comply with various regulatory requirements.
2. WHEN DO WE DISCLOSE PERSONAL INFORMATION WE COLLECT ABOUT YOU?
We may disclose personal information we collect about you in each of the categories listed above to affiliated and nonaffiliated third parties.
30
Morgan Stanley Institutional Fund, Inc.
Annual Report — December 31, 2015
U.S. Privacy Policy (unaudited) (cont'd)
a. Information We Disclose to Affiliated Companies.
We may disclose personal information that we collect about you to our affiliated companies to manage your account(s) effectively, to service and process your transactions, and to let you know about products and services offered by us and affiliated companies, to manage our business, and as otherwise required or permitted by law. Offers for products and services from affiliated companies are developed under conditions designed to safeguard your personal information.
b. Information We Disclose to Third Parties.
We may disclose personal information that we collect about you to nonaffiliated third parties to provide marketing services on our behalf or to other financial institutions with whom we have joint marketing agreements. We may also disclose all of the information we collect to other nonaffiliated third parties for our everyday business purposes, such as to process transactions, maintain account(s), respond to court orders and legal investigations, report to credit bureaus, offer our own products and services, protect against fraud, for institutional risk control, to perform services on our behalf, and as otherwise required or permitted by law.
When we share personal information about you with a nonaffiliated third party, they are required to limit their use of personal information about you to the particular purpose for which it was shared and they are not allowed to share personal information about you with others except to fulfill that limited purpose or as may be permitted or required by law.
3. HOW DO WE PROTECT THE SECURITY AND CONFIDENTIALITY OF PERSONAL INFORMATION WE COLLECT ABOUT YOU?
We maintain physical, electronic and procedural security measures that comply with applicable law and regulations to help safeguard the personal information we collect about you. We have internal policies governing the proper handling of client information by employees. Third parties that provide support or marketing services on our behalf may also receive personal information about you, and we require them to adhere to appropriate security standards with respect to such information.
4. HOW CAN YOU LIMIT OUR SHARING CERTAIN PERSONAL INFORMATION ABOUT YOU WITH OUR AFFILIATED COMPANIES FOR ELIGIBILITY DETERMINATION?
By following the opt-out procedures in Section 6 below, you may limit the extent to which we share with our affiliated companies, personal information that was collected to determine your eligibility for products and services such as your credit reports and other information that you have provided to us or that we may obtain from third parties ("eligibility information"). Eligibility information does not include your identification information or personal information pertaining to our transactions or experiences with you. Please note that, even if you direct us not to share eligibility information with our affiliated companies, we may still share your personal information, including eligibility information, with our affiliated companies under circumstances that are permitted under applicable law, such as to process transactions or to service your account.
5. HOW CAN YOU LIMIT THE USE OF CERTAIN PERSONAL INFORMATION ABOUT YOU BY OUR AFFILIATED COMPANIES FOR MARKETING?
By following the opt-out instructions in Section 6 below, you may limit our affiliated companies from marketing their products or services to you based on personal information we disclose to them. This information may include, for example, your income and account history with us. Please note that, even if you choose to limit our affiliated companies from using personal information about you that we may share with them for marketing their products and services to you, our affiliated companies may use your personal information that they obtain from us to market to you in circumstances permitted by law, such as if the affiliated party has its own relationship with you.
31
Morgan Stanley Institutional Fund, Inc.
Annual Report — December 31, 2015
U.S. Privacy Policy (unaudited) (cont'd)
6. HOW CAN YOU SEND US AN OPT-OUT INSTRUCTION?
If you wish to limit our sharing of eligibility information about you with our affiliated companies, or our affiliated companies' use of personal information for marketing purposes, as described in this notice, you may do so by:
• Calling us at (800) 548-7786
Monday–Friday between 8a.m. and 6p.m. (EST)
• Writing to us at the following address:
Boston Financial Data Services, Inc.
c/o Privacy Coordinator
P.O. Box 219804
Kansas City, Missouri 64121
If you choose to write to us, your request should include: your name, address, telephone number and account number(s) to which the opt-out applies and whether you are opting out with respect to sharing of eligibility information (Section 4 above), or information used for marketing (Section 5 above), or both. Written opt-out requests should not be sent with any other correspondence. In order to process your request, we require that the request be provided by you directly and not through a third party. Once you have informed us about your privacy preferences, your opt-out preference will remain in effect with respect to this Policy (as it may be amended) until you notify us otherwise. If you are a joint account owner, we will accept instructions from any one of you and apply those instructions to the entire account.
Please understand that if you limit our sharing or our affiliated companies' use of personal information, you and any joint account holder(s) may not receive information about our affiliated companies' products and services, including products or services that could help you manage your financial resources and achieve your investment objectives.
If you have more than one account or relationship with us, please specify the accounts to which you would like us to apply your privacy choices. If you have accounts or relationships with our affiliates, you may receive multiple privacy policies from them, and will need to separately notify those companies of your privacy choices for those accounts or relationships.
7. WHAT IF AN AFFILIATED COMPANY BECOMES A NONAFFILIATED THIRD PARTY?
If, at any time in the future, an affiliated company becomes a nonaffiliated third party, further disclosures of personal information made to the former affiliated company will be limited to those described in Section 2(b) above relating to nonaffiliated third parties. If you elected under Section 6 to limit disclosures we make to affiliated companies, or use of personal information by affiliated companies, your election will not apply to use by any former affiliated company of your personal information in their possession once it becomes a nonaffiliated third party.
SPECIAL NOTICE TO RESIDENTS OF VERMONT
The following section supplements our Policy with respect to our individual clients who have a Vermont address and supersedes anything to the contrary in the above Policy with respect to those clients only.
The State of Vermont requires financial institutions to obtain your consent prior to sharing personal information that they collect about you with nonaffiliated third parties, or eligibility information with affiliated companies, other than in certain limited circumstances. Except as permitted by law, we will not share personal information we collect about you with nonaffiliated third parties or eligibility information with affiliated companies, unless you provide us with your written consent to share such information.
SPECIAL NOTICE TO RESIDENTS OF CALIFORNIA
The following section supplements our Policy with respect to our individual clients who have a California address and supersedes anything to the contrary in the above Policy with respect to those clients only.
In response to a California law, if your account has a California home address, your personal information will not be disclosed to nonaffiliated third parties except as permitted by applicable California law, and we will limit sharing such personal information with our affiliates to comply with California privacy laws that apply to us.
32
Morgan Stanley Institutional Fund, Inc.
Annual Report — December 31, 2015
Director and Officer Information (unaudited)
Independent Directors:
| Name, Age and Address of Independent Director | Positions(s) Held with Registrant | Length of Time Served* | Principal Occupation(s) During Past 5 Years and Other Relevant Professional Experience | Number of Portfolios in Fund Complex Overseen by Director** | Other Directorships Held by Independent Director*** | ||||||||||||||||||
| Frank L. Bowman (71) c/o Kramer Levin Naftalis & Frankel LLP Counsel to the Independent Directors 1177 Avenue of the Americas New York, NY 10036 | Director | Since August 2006 | President, Strategic Decisions, LLC (consulting) (since February 2009); Director or Trustee of various Morgan Stanley Funds (since August 2006); Chairperson of the Compliance and Insurance Committee (since October 2015); Formerly, Chairperson of the Insurance Sub-Committee of the Compliance and Insurance Committee (February 2007-December 2015); served as President and Chief Executive Officer of the Nuclear Energy Institute (policy organization) (February 2005-November 2008); retired as Admiral, U.S. Navy after serving over 38 years on active duty including 8 years as Director of the Naval Nuclear Propulsion Program in the Department of the Navy and the U.S. Department of Energy (1996-2004); served as Chief of Naval Personnel (July 1994-September 1996); and on the Joint Staff as Director of Political Military Affairs (June 1992-July1994); knighted as Honorary Knight Commander of the Most Excellent Order of the British Empire; awarded the Officier de l'Orde National du Mérite by the French Government; elected to the National Academy of Engineering (2009). | 98 | Director of BP p.l.c.; Director of Naval and Nuclear Technologies LLP; Director Emeritus of the Armed Services YMCA; Director of the U.S. Naval Submarine League; Member of National Security Advisory Council of the Center for U.S. Global Engagement and a member of the CNA Military Advisory Board; Chairman of the Charity, J Street Cup Golf, Trustee of Fairhaven United Methodist Church; and Director of other various non-profit organizations. | ||||||||||||||||||
| Kathleen A. Dennis (62) c/o Kramer Levin Naftalis & Frankel LLP Counsel to the Independent Directors 1177 Avenue of the Americas New York, NY 10036 | Director | Since August 2006 | President, Cedarwood Associates (mutual fund and investment management consulting) (since July 2006); Chairperson of the Money Market and Alternatives Sub-Committee of the Investment Committee (since October 2006) and Director or Trustee of various Morgan Stanley Funds (since August 2006); formerly, Senior Managing Director of Victory Capital Management (1993-2006). | 98 | Director of various nonprofit organizations. | ||||||||||||||||||
| Nancy C. Everett (61) c/o Kramer Levin Naftalis & Frankel LLP Counsel to the Independent Directors 1177 Avenue of the Americas New York, NY 10036 | Director | Since January 2015 | Chief Executive Officer, Virginia Commonwealth University Investment Company (since November 2015); Owner, OBIR, LLC (investment management consulting) (since June 2014); formerly, Managing Director, BlackRock Inc. (February 2011-December 2013); and Chief Executive Officer, General Motors Asset Management (a/k/a Promark Global Advisors, Inc.) (June 2005-May 2010). | 98 | Member of Virginia Commonwealth University School of Business Foundation; formerly, Member of Virginia Commonwealth University Board of Visitors (2013-2015); Member of Committee on Directors for Emerging Markets Growth Fund, Inc. (2007-2010); Chairperson of Performance Equity Management, LLC (2006-2010); and Chairperson, GMAM Absolute Return Strategies Fund, LLC (2006-2010). | ||||||||||||||||||
33
Morgan Stanley Institutional Fund, Inc.
Annual Report — December 31, 2015
Director and Officer Information (unaudited) (cont'd)
Independent Directors: (cont'd)
| Name, Age and Address of Independent Director | Positions(s) Held with Registrant | Length of Time Served* | Principal Occupation(s) During Past 5 Years and Other Relevant Professional Experience | Number of Portfolios in Fund Complex Overseen by Director** | Other Directorships Held by Independent Director*** | ||||||||||||||||||
| Jakki L. Haussler (58) c/o Kramer Levin Naftalis & Frankel LLP Counsel to the Independent Directors 1177 Avenue of the Americas New York, NY 10036 | Director | Since January 2015 | Chairman and Chief Executive Officer, Opus Capital Group (since January 1996); and formerly, Director, Capvest Venture Fund, LP (May 2000-December 2011); Partner, Adena Ventures, LP (July 1999-December 2010); Director, The Victory Funds (February 2005-July 2008). | 98 | Director of Cincinnati Bell Inc. and Member, Audit Committee and Compensation Committee; Director of Northern Kentucky University Foundation and Member, Investment Committee; Member of Chase College of Law Transactional Law Practice Center Board of Advisors; Director of Best Transport; Chase College of Law Board of Visitors; formerly Member, University of Cincinnati Foundation Investment Committee; Member, Miami University Board of Visitors (2008-2011); Trustee of Victory Funds (2005-2008) and Chairman, Investment Committee (2007-2008) and Member, Service Provider Committee (2005-2008). | ||||||||||||||||||
| Dr. Manuel H. Johnson (67) c/o Johnson Smick International, Inc. 220 I Street, N.E. — Suite 200 Washington, D.C. 20002 | Director | Since July 1991 | Senior Partner, Johnson Smick International, Inc. (consulting firm); Chairperson of the Investment Committee (since October 2006) and Director or Trustee of various Morgan Stanley Funds (since July 1991); Co-Chairman and a founder of the Group of Seven Council (G7C) (international economic commission); formerly Chairperson of the Audit Committee (July 1991-September 2006), Vice Chairman of the Board of Governors of the Federal Reserve System and Assistant Secretary of the U.S. Treasury. | 100 | Director of NVR, Inc. (home construction). | ||||||||||||||||||
| Joseph J. Kearns (73) c/o Kearns & Associates LLC 23823 Malibu Road S-50-440 Malibu, CA 90265 | Director | Since August 1994 | President, Kearns & Associates LLC (investment consulting); Chairperson of the Audit Committee (since October 2006) and Director or Trustee of various Morgan Stanley Funds (since August 1994); formerly, Deputy Chairperson of the Audit Committee (July 2003-September 2006) and Chairperson of the Audit Committee of various Morgan Stanley Funds (since August 1994); CFO of the J. Paul Getty Trust. | 101 | Director of Electro Rent Corporation (equipment leasing). Prior to December 31, 2013, Director of The Ford Family Foundation. | ||||||||||||||||||
34
Morgan Stanley Institutional Fund, Inc.
Annual Report — December 31, 2015
Director and Officer Information (unaudited) (cont'd)
Independent Directors: (cont'd)
| Name, Age and Address of Independent Director | Positions(s) Held with Registrant | Length of Time Served* | Principal Occupation(s) During Past 5 Years and Other Relevant Professional Experience | Number of Portfolios in Fund Complex Overseen by Director** | Other Directorships Held by Independent Director*** | ||||||||||||||||||
| Michael F. Klein (57) c/o Kramer Levin Naftalis & Frankel LLP Counsel to the Independent Directors 1177 Avenue of the Americas New York, NY 10036 | Director | Since August 2006 | Managing Director, Aetos Capital, LLC (since March 2000); Co-President, Aetos Alternatives Management, LLC (since January 2004); and Co-Chief Executive Officer of Aetos Capital LLC (since August 2013); Chairperson of the Fixed Income Sub-Committee of the Investment Committee (since October 2006) and Director or Trustee of various Morgan Stanley Funds (since August 2006); formerly, Managing Director, Morgan Stanley & Co. Inc. and Morgan Stanley Dean Witter Investment Management, President, various Morgan Stanley Funds (June1998-March 2000) and Principal, Morgan Stanley & Co. Inc. and Morgan Stanley Dean Witter Investment Management (August 1997-December 1999). | 97 | Director of certain investment funds managed or sponsored by Aetos Capital, LLC. Director of Sanitized AG and Sanitized Marketing AG (specialty chemicals). | ||||||||||||||||||
| Michael E. Nugent (79) 522 Fifth Avenue New York, NY 10036 | Chair of the Board and Director | Chair of the Boards since July 2006 and Director since July 1991 | Chair of the Boards of various Morgan Stanley Funds (since July 2006); Chairperson of the Closed-End Fund Committee (since June 2012) and Director or Trustee of various Morgan Stanley Funds (since July 1991); formerly, Chairperson of the Insurance Committee (until July 2006), General Partner, TriumphCapital, L.P. (private investment partnership) (1988-2013). | 100 | None. | ||||||||||||||||||
| W. Allen Reed (68) c/o Kramer Levin Naftalis & Frankel LLP Counsel to the Independent Directors 1177 Avenue of the Americas New York, NY 10036 | Director | Since August 2006 | Chairperson of the Equity Sub-Committee of the Investment Committee (since October 2006) and Director or Trustee of various Morgan Stanley Funds (since August 2006); formerly, President and CEO of General Motors Asset Management; Chairman and Chief Executive Officer of the GM Trust Bank and Corporate Vice President of General Motors Corporation (August 1994-December 2005). | 98 | Director of Legg Mason, Inc.; formerly Director of the Auburn University Foundation (2010-2015). | ||||||||||||||||||
| Fergus Reid (83) c/o Joe Pietryka, Inc. 85 Charles Colman Blvd. Pawling, NY 12564 | Director | Since June 1992 | Chairman, Joe Pietryka, Inc.; Chairperson of the Governance Committee and Director or Trustee of various Morgan Stanley Funds (since June 1992). | 100 | Formerly, Trustee and Director of certain investment companies in the JP Morgan Fund Complex managed by JP Morgan Investment Management Inc. (1987-2012). | ||||||||||||||||||
35
Morgan Stanley Institutional Fund, Inc.
Annual Report — December 31, 2015
Director and Officer Information (unaudited) (cont'd)
Interested Director:
| Name, Age and Address of Interested Director | Positions(s) Held with Registrant | Length of Time Served* | Principal Occupation(s) During Past 5 Years | Number of Portfolios in Fund Complex Overseen by Interested Director** | Other Directorships Held by Interested Director*** | ||||||||||||||||||
| James F. Higgins (68) One New York Plaza, New York, NY 10004 | Director | Since June 2000 | Director or Trustee of various Morgan Stanley Funds (since June 2000); Senior Advisor of Morgan Stanley (since August 2000). | 99 | Formerly, Director of AXA Financial, Inc. and AXA Equitable Life Insurance Company (2002-2011) and Director of AXA MONY Life Insurance Company and AXA MONY Life Insurance Company of America (2004-2011). | ||||||||||||||||||
* This is the earliest date the Director began serving the Morgan Stanley Funds. Each Director serves an indefinite term, until his or her successor is elected.
** The Fund Complex includes (as of December 31, 2015) all open-end and closed-end funds (including all of their portfolios) advised by Morgan Stanley Investment Management Inc. (the "Adviser") and any funds that have an adviser that is an affiliated person of the Adviser (including, but not limited to, Morgan Stanley AIP GP LP).
*** This includes any directorships at public companies and registered investment companies held by the Director at any time during the past five years.
Executive Officers:
Name, Age and Address of Executive Officer | Position(s) Held with Registrant | Length of Time Served**** | Principal Occupation(s) During Past 5 Years | ||||||||||||
| John H. Gernon (52) 522 Fifth Avenue New York, NY 10036 | President and Principal Executive Officer | Since September 2013 | President and Principal Executive Officer of the Equity and Fixed Income Funds and the Morgan Stanley AIP Funds (since September 2013) and the Liquidity Funds and various money market funds (since May 2014) in the Fund Complex, Managing Director of the Adviser; Head of Product (since 2006). | ||||||||||||
| Stefanie V. Chang Yu (49) 522 Fifth Avenue New York, NY 10036 | Chief Compliance Officer | Since December 1997 | Managing Director of the Adviser and various entities affiliated with the Adviser; Chief Compliance Officer of various Morgan Stanley Funds and the Adviser (since January 2014); formerly, Vice President of various Morgan Stanley Funds (December 1997-January 2014). | ||||||||||||
| Joseph C. Benedetti (50) 522 Fifth Avenue New York, NY 10036 | Vice President | Since January 2014 | Managing Director of the Adviser and various entities affiliated with the Adviser; Vice President of various Morgan Stanley Funds (since January 2014); formerly, Assistant Secretary of various Morgan Stanley Funds (October 2004-January 2014). | ||||||||||||
| Francis J. Smith (50) 522 Fifth Avenue New York, NY 10036 | Treasurer and Principal Financial Officer | Treasurer since July 2003 and Principal Financial Officer since September 2002 | Executive Director of the Adviser and various entities affiliated with the Adviser; Treasurer (since July 2003) and Principal Financial Officer of various Morgan Stanley Funds (since September 2002). | ||||||||||||
| Mary E. Mullin (48) 522 Fifth Avenue New York, NY 10036 | Secretary | Since June 1999 | Executive Director of the Adviser; Secretary of various Morgan Stanley Funds (since June 1999). | ||||||||||||
**** This is the earliest date the officer began serving the Morgan Stanley Funds. Each officer serves a one-year term, until his or her successor is elected and has qualified.
36
Morgan Stanley Institutional Fund, Inc.
Annual Report — December 31, 2015
Adviser and Administrator
Morgan Stanley Investment Management Inc.
522 Fifth Avenue
New York, New York 10036
Sub-Advisers
Morgan Stanley Investment Management Limited
25 Cabot Square, Canary Wharf
London, E14 4QA, England
Morgan Stanley Investment Management Company
23 Church Street
16-01 Capital Square, Singapore 049481
Distributor
Morgan Stanley Distribution, Inc.
522 Fifth Avenue
New York, New York 10036
Dividend Disbursing and Transfer Agent
Boston Financial Data Services, Inc.
2000 Crown Colony Drive
Quincy, Massachusetts 02169
Custodian
State Street Bank and Trust Company
One Lincoln Street
Boston, Massachusetts 02111
Legal Counsel
Dechert LLP
1095 Avenue of the Americas
New York, New York 10036
Counsel to the Independent Directors
Kramer Levin Naftalis & Frankel LLP
1177 Avenue of the Americas
New York, New York 10036
Independent Registered Public Accounting Firm
Ernst & Young LLP
200 Clarendon Street
Boston, Massachusetts 02116
Reporting to Shareholders
Each Morgan Stanley fund provides a complete schedule of portfolio holdings in its semi-annual and annual reports within 60 days of the end of the fund's second and fourth fiscal quarters. The semi-annual and annual reports are filed electronically with the Securities and Exchange Commission (SEC) on Form N-CSRS and Form N-CSR, respectively. Morgan Stanley also delivers the semi-annual and annual reports to fund shareholders and makes these reports available on its public website, www.morganstanley.com/im. Each Morgan Stanley fund also files a complete schedule of portfolio holdings with the SEC for the fund's first and third fiscal quarters on Form N-Q. Morgan Stanley does not deliver the reports for the first and third fiscal quarters to shareholders, nor are the reports posted to the Morgan Stanley public website. You may, however, obtain the Form N-Q filings (as well as the Form N-CSR and N-CSRS filings) by accessing the SEC's website, www.sec.gov. You may also review and copy them at the SEC's Public Reference Room in Washington, DC. Information on the operation of the SEC's Public Reference Room may be obtained by calling the SEC toll free at 1 (800) SEC-0330. You can also request copies of these materials, upon payment of a duplicating fee, by electronic request at the SEC's email address (publicinfo@sec.gov) or by writing the Public Reference Room of the SEC, Washington, DC 20549-0102.
Proxy Voting Policies and Procedures and Proxy Voting Record
You may obtain a copy of the Fund's Proxy Voting Policy and Procedures and information regarding how the Fund voted proxies relating to portfolio securities during the most recent twelve-month period ended June 30, without charge, upon request, by calling toll free 1 (800) 548-7786 or by visiting our website at www.morganstanley.com/im. This information is also available on the SEC's website at www.sec.gov.
This report is authorized for distribution only when preceded or accompanied by a prospectus of the Morgan Stanley Institutional Fund, Inc., which describes in detail each Portfolio's investment policies, risks, fees and expenses. Please read the prospectus carefully before you invest or send money. For additional information, including information regarding the investments comprising the Portfolio, please visit our website at www.morganstanley.com/im or call toll free 1 (800) 548-7786.
37
Printed in U.S.A.
This Report has been prepared for shareholders and may be distributed to others only if preceded or accompanied by a current prospectus.
Morgan Stanley Investment Management Inc.
522 Fifth Avenue
New York, New York 10036
© 2016 Morgan Stanley. Morgan Stanley Distribution, Inc.

IFIGREANN
1407632 EXP. 02.28.17
INVESTMENT MANAGEMENT

Morgan Stanley Institutional Fund, Inc.
International Opportunity Portfolio
Annual Report
December 31, 2015

Morgan Stanley Institutional Fund, Inc.
Annual Report — December 31, 2015
Table of Contents
Shareholders' Letter | 2 | ||||||
Expense Example | 3 | ||||||
Investment Overview | 4 | ||||||
Portfolio of Investments | 6 | ||||||
Statement of Assets and Liabilities | 8 | ||||||
Statement of Operations | 10 | ||||||
Statements of Changes in Net Assets | 11 | ||||||
Financial Highlights | 13 | ||||||
Notes to Financial Statements | 18 | ||||||
Report of Independent Registered Public Accounting Firm | 28 | ||||||
Federal Tax Notice | 29 | ||||||
U.S. Privacy Policy | 30 | ||||||
Director and Officer Information | 33 | ||||||
This report is authorized for distribution only when preceded or accompanied by prospectuses of the Morgan Stanley Institutional Fund, Inc. To receive a prospectus and/or statement of additional information (SAI), which contains more complete information such as investment objectives, charges, expenses, policies for voting proxies, risk considerations, and describes in detail each of the Portfolio's investment policies to the prospective investor, please call toll free 1 (800) 548-7786. Please read the prospectuses carefully before you invest or send money.
Additionally, you can access portfolio information including performance, characteristics, and investment team commentary through Morgan Stanley Investment Management's website: www.morganstanley.com/im.
Market forecasts provided in this report may not necessarily come to pass. There is no guarantee that any sectors mentioned will continue to perform as discussed herein or that securities in such sectors will be held by the Portfolio in the future. There is no assurance that a Portfolio will achieve its investment objective. Portfolios are subject to market risk, which is the possibility that market values of securities owned by the Portfolio will decline and, therefore, the value of the Portfolio's shares may be less than what you paid for them. Accordingly, you can lose money investing in this Portfolio. Please see the prospectus for more complete information on investment risks.
1
Morgan Stanley Institutional Fund, Inc.
Annual Report — December 31, 2015
Shareholders' Letter (unaudited)
Dear Shareholders,
We are pleased to provide this Annual report, in which you will learn how your investment in International Opportunity Portfolio (the "Portfolio") performed during the latest twelve-month period.
Morgan Stanley Investment Management is a client-centric, investor-led organization. Our global presence, intellectual capital, and breadth of products and services enable us to partner with investors to meet the evolving challenges of today's financial markets. We aim to deliver superior investment service and to empower our clients to make the informed decisions that help them reach their investment goals.
As always, we thank you for selecting Morgan Stanley Investment Management, and look forward to working with you in the months and years ahead.
Sincerely,

John H. Gernon
President and Principal Executive Officer
January 2016
2
Morgan Stanley Institutional Fund, Inc.
Annual Report — December 31, 2015
Expense Example (unaudited)
International Opportunity Portfolio
As a shareholder of the Portfolio, you incur two types of costs: (1) transactional costs, including redemptions fees; and (2) ongoing costs, including advisory fees, administration fees, distribution and shareholder services fees and other Portfolio expenses. This example is intended to help you understand your ongoing costs (in dollars) of investing in the Portfolio and to compare these costs with the ongoing costs of investing in other mutual funds.
This example is based on an investment of $1,000 invested at the beginning of the six-month period ended December 31, 2015 and held for the entire six-month period.
Actual Expenses
The table below provides information about actual account values and actual expenses. You may use the information in this table, together with the amount you invested, to estimate the expenses that you paid over the period. Simply divide your account value by $1,000 (for example, an $8,600 account value divided by $1,000 = 8.6), then multiply the result by the number in the table under the heading entitled "Actual Expenses Paid During Period" to estimate the expenses you paid on your account during this period.
Hypothetical Example for Comparison Purposes
The table below provides information about hypothetical account values and hypothetical expenses based on the Portfolio's actual expense ratio and an assumed rate of return of 5% per year before expenses, which is not the Portfolio's actual return. The hypothetical account values and expenses may not be used to estimate the actual ending account balance or expenses you paid for the period. You may use this information to compare the ongoing costs of investing in the Portfolio and other funds. To do so, compare this 5% hypothetical example with the 5% hypothetical examples that appear in the shareholder reports of the other funds.
Please note that the expenses shown in the table are meant to highlight your ongoing costs only and do not reflect any transactional costs, such as sales charges (loads) and redemption fees. Therefore, the information for each class in the table is useful in comparing ongoing costs only, and will not help you determine the relative total costs of owning different funds. In addition, if these transactional costs were included, your costs would have been higher.
| Beginning Account Value 7/1/15 | Actual Ending Account Value 12/31/15 | Hypothetical Ending Account Value | Actual Expenses Paid During Period* | Hypothetical Expenses Paid During Period* | Net Expense Ratio During Period** | ||||||||||||||||||||||
International Opportunity Portfolio Class I | $ | 1,000.00 | $ | 983.80 | $ | 1,020.32 | $ | 4.85 | $ | 4.94 | 0.97 | % | |||||||||||||||
International Opportunity Portfolio Class A | 1,000.00 | 982.30 | 1,018.65 | 6.50 | 6.61 | 1.30 | |||||||||||||||||||||
International Opportunity Portfolio Class L | 1,000.00 | 979.40 | 1,015.93 | 9.18 | 9.35 | 1.84 | |||||||||||||||||||||
International Opportunity Portfolio Class C | 1,000.00 | 978.30 | 1,014.67 | 10.42 | 10.61 | 2.09 | |||||||||||||||||||||
International Opportunity Portfolio Class IS | 1,000.00 | 984.60 | 1,020.47 | 4.70 | 4.79 | 0.94 | |||||||||||||||||||||
* Expenses are calculated using each Portfolio Class' annualized net expense ratio (as disclosed), multiplied by the average account value over the period, and multiplied by 184/365 (to reflect the most recent one-half year period).
** Annualized.
3
Morgan Stanley Institutional Fund, Inc.
Annual Report — December 31, 2015
Investment Overview (unaudited)
International Opportunity Portfolio
The Portfolio seeks long-term capital appreciation.
Performance
For the year ended December 31, 2015, the Portfolio's Class I shares had a total return based on net asset value and reinvestment of distributions per share of 11.40%, net of fees. The Portfolio's Class I shares outperformed the Portfolio's benchmark, the MSCI All Country World Index ex USA Index (the "Index"), which returned –5.66%.
Factors Affecting Performance
• International equity markets declined 5.66% for the period, as measured by the Index. A backdrop of weak global economic growth, intensifying concerns about China's slowdown, shifting sentiment about central bank policies and a sustained decline in commodity prices weighed on the markets throughout the year. On a regional basis, Japan's 9.6% gain outperformed Europe's modest decline of 2.8%, while emerging market equities suffered a 14.9% loss (as measured by the MSCI Japan Index, MSCI Europe Index and MSCI Emerging Markets Index, respectively).
• The Portfolio's relative outperformance versus the Index was driven primarily by stock selection. Sector allocation, a result of where we're finding the most attractive individual stock opportunities, also contributed positively to relative performance.
• Information technology (IT) was the top contributor in the Portfolio during the period, due to strong stock selection and a sector overweight position. The Portfolio's holdings in two IT services providers with cost advantages in software development outsourcing were the first- and second-largest contributors to the performance of the Portfolio during the period.
• Stock selection in the consumer discretionary sector was the second-largest contributor to the Portfolio during the period. Relative gains in the sector were led by a position in a provider of after-school private tutoring services to primary and secondary students in China, the third-largest contributor to Portfolio performance during the period. Within the sector, performance was negatively impacted by positions in a U.K. luxury goods retailer that was the worst-performing stock in the Portfolio as well
as positions in a Chinese apparel retailer and a hospitality operator in Macau and China.
• Stock selection in the industrials sector was the third-largest contributor to the Portfolio during the period, led by a position in a Danish port consolidator.
• The Portfolio's lack of exposure to the telecommunication services sector was the main detractor from relative performance versus the Index during the period.
Management Strategies
• There were no changes to our bottom-up investment process during the period. The Growth Team seeks high quality companies, which we define primarily as those with sustainable competitive advantages. Our team continues to focus on bottom-up stock selection and the long-term outlook for companies owned in the portfolio; accordingly, we have had very limited turnover in the portfolio to date, as our ongoing work reaffirms our assessment of quality and competitive advantage in the names we own.

* Minimum Investment for Class I shares
** Commenced Operations on March 31, 2010.
In accordance with SEC regulations, the Portfolio's performance shown assumes that all recurring fees (including management fees) were deducted and all dividends and distributions were reinvested. The performance of Class A, L, C and IS shares will vary from the performance of Class I shares based upon their different inception dates and will be impacted by additional fees assessed to those classes (if applicable).
4
Morgan Stanley Institutional Fund, Inc.
Annual Report — December 31, 2015
Investment Overview (unaudited) (cont'd)
International Opportunity Portfolio
Performance Compared to the MSCI All Country World ex USA Index(1) and the Lipper International Multi-Cap Growth Funds Index(2)
| Period Ended December 31, 2015 Total Returns(3) | |||||||||||||||||||
Average Annual | |||||||||||||||||||
| One Year | Five Years | Ten Years | Since Inception(7) | ||||||||||||||||
| Portfolio — Class I Shares w/o sales charges(4) | 11.40 | % | 7.46 | % | — | 9.99 | % | ||||||||||||
| Portfolio — Class A Shares w/o sales charges(4) | 10.99 | 7.14 | — | 9.66 | |||||||||||||||
| Portfolio — Class A Shares with maximum 5.25% sales charges(4) | 5.15 | 5.98 | — | 8.64 | |||||||||||||||
| Portfolio — Class L Shares w/o sales charges(4) | 10.38 | 6.59 | — | 9.10 | |||||||||||||||
| Portfolio — Class C Shares w/o sales charges(6) | — | — | — | –1.85 | |||||||||||||||
| Portfolio — Class C Shares with maximum 1.00% deferred sales charges(6) | — | — | — | –2.80 | |||||||||||||||
| Portfolio — Class IS Shares w/o sales charges(5) | 11.40 | — | — | 11.18 | |||||||||||||||
| MSCI All Country World ex USA Index | –5.66 | 1.06 | — | 2.51 | |||||||||||||||
| Lipper International Multi-Cap Growth Funds Index | –1.31 | 2.70 | — | 4.36 | |||||||||||||||
Performance data quoted represents past performance, which is no guarantee of future results, and current performance may be lower or higher than the figures shown. Performance assumes that all dividends and distributions, if any, were reinvested. For the most recent month-end performance figures, please visit www.morganstanley.com/im. Investment return and principal value will fluctuate so that Portfolio shares, when redeemed, may be worth more or less than their original cost. Total returns do not reflect the deduction of taxes that a shareholder would pay on Portfolio distributions or the redemption of Portfolio shares. Returns for periods less than one year are not annualized. Performance of share classes will vary due to difference in sales charges and expenses.
(1) The MSCI All Country World ex USA Index is a free float-adjusted market capitalization weighted index designed to measure the equity market performance of developed and emerging markets, excluding the United States. The term "free float" represents the portion of shares outstanding that are deemed to be available for purchase in the public equity markets by investors. The Index is unmanaged and its returns do not include any sales charges or fees. Such costs would lower performance. It is not possible to invest directly in an index.
(2) The Lipper International Multi-Cap Growth Funds Index is an equally weighted performance index of the largest qualifying funds (based on net assets) in the Lipper International Multi-Cap Growth Funds classification. The Index, which is adjusted for capital gains distributions and income dividends, is unmanaged and should not be considered an investment. There are currently 30 funds represented in this Index. As of the date of this report, the Portfolio was in the Lipper International Multi-Cap Growth Funds classification.
(3) Total returns for the Portfolio reflect fees waived and expenses reimbursed, if applicable, by the Adviser. Without such waivers and reimbursements, total returns would have been lower.
(4) Commenced operations on March 31, 2010.
(5) Commenced offering on September 13, 2013.
(6) Commenced offering on April 30, 2015.
(7) For comparative purposes, average annual since inception returns listed for the Indexes refer to the inception date of Class I of the Portfolio, not the inception of the Index.
5
Morgan Stanley Institutional Fund, Inc.
Annual Report — December 31, 2015
Portfolio of Investments
International Opportunity Portfolio
Shares | Value (000) | ||||||||||
Common Stocks (91.2%) | |||||||||||
Australia (0.0%) | |||||||||||
AET&D Holdings No. 1 Ltd. (a)(b)(c) | 16,699 | $ | — | ||||||||
Belgium (2.7%) | |||||||||||
Anheuser-Busch InBev N.V. | 13,841 | 1,710 | |||||||||
Brazil (1.5%) | |||||||||||
CETIP SA — Mercados Organizados | 100,591 | 950 | |||||||||
Canada (2.9%) | |||||||||||
Brookfield Asset Management, Inc., Class A | 29,457 | 929 | |||||||||
Brookfield Infrastructure Partners LP | 24,756 | 938 | |||||||||
1,867 | |||||||||||
China (13.5%) | |||||||||||
Autohome, Inc. ADR (a) | 34,746 | 1,213 | |||||||||
China Resources Enterprise Ltd. (d) | 6,000 | 13 | |||||||||
JD.com, Inc. ADR (a) | 28,979 | 935 | |||||||||
Jiangsu Hengrui Medicine Co., Ltd., Class A | 165,500 | 1,248 | |||||||||
TAL Education Group ADR (a) | 73,124 | 3,398 | |||||||||
Tencent Holdings Ltd. (d) | 89,500 | 1,746 | |||||||||
Vipshop Holdings Ltd. ADR (a) | 3,722 | 57 | |||||||||
8,610 | |||||||||||
Denmark (6.5%) | |||||||||||
DSV A/S | 105,192 | 4,132 | |||||||||
France (3.9%) | |||||||||||
Christian Dior SE | 7,674 | 1,304 | |||||||||
Hermes International | 3,451 | 1,163 | |||||||||
2,467 | |||||||||||
Germany (1.9%) | |||||||||||
Adidas AG | 12,468 | 1,215 | |||||||||
Hong Kong (2.0%) | |||||||||||
AIA Group Ltd. | 210,800 | 1,256 | |||||||||
India (2.7%) | |||||||||||
HDFC Bank Ltd. ADR | 20,671 | 1,273 | |||||||||
MakeMyTrip Ltd. (a)(e) | 26,679 | 458 | |||||||||
1,731 | |||||||||||
Japan (7.8%) | |||||||||||
Calbee, Inc. | 64,700 | 2,716 | |||||||||
Japan Airport Terminal Co., Ltd. | 50,400 | 2,235 | |||||||||
4,951 | |||||||||||
Korea, Republic of (8.4%) | |||||||||||
Loen Entertainment, Inc. (a) | 25,087 | 1,786 | |||||||||
NAVER Corp. (a) | 2,455 | 1,367 | |||||||||
ViroMed Co., Ltd. (a) | 14,094 | 2,182 | |||||||||
5,335 | |||||||||||
Norway (1.0%) | |||||||||||
TGS Nopec Geophysical Co., ASA | 39,760 | 629 | |||||||||
South Africa (2.5%) | |||||||||||
Naspers Ltd., Class N | 11,634 | 1,591 | |||||||||
Switzerland (4.3%) | |||||||||||
Kuehne & Nagel International AG (Registered) | 11,173 | 1,532 | |||||||||
Nestle SA (Registered) | 16,853 | 1,249 | |||||||||
2,781 | |||||||||||
Shares | Value (000) | ||||||||||
United Kingdom (9.8%) | |||||||||||
Burberry Group PLC | 122,774 | $ | 2,160 | ||||||||
Hargreaves Lansdown PLC | 69,989 | 1,550 | |||||||||
Just Eat PLC (a) | 183,710 | 1,336 | |||||||||
Reckitt Benckiser Group PLC | 12,833 | 1,181 | |||||||||
6,227 | |||||||||||
United States (19.8%) | |||||||||||
Cognizant Technology Solutions Corp., Class A (a) | 43,748 | 2,626 | |||||||||
EPAM Systems, Inc. (a) | 47,602 | 3,742 | |||||||||
Globant SA (a) | 19,254 | 722 | |||||||||
Luxoft Holding, Inc. (a) | 44,638 | 3,443 | |||||||||
Priceline Group, Inc. (The) (a) | 1,651 | 2,105 | |||||||||
12,638 | |||||||||||
Total Common Stocks (Cost $55,578) | 58,090 | ||||||||||
Preferred Stock (0.3%) | |||||||||||
India (0.3%) | |||||||||||
| Flipkart Online Services Pvt Ltd. Series D (a)(b)(c)(f) (acquisition cost — $36; acquired 10/4/13) (Cost $36) | 1,590 | 165 | |||||||||
Convertible Preferred Stock (0.0%) | |||||||||||
China (0.0%) | |||||||||||
| Youku Tudou, Inc., Class A (a)(b)(f) (acquisition cost — $—@; acquired 9/16/10) (Cost $—@) | 6 | — | @ | ||||||||
Participation Notes (2.4%) | |||||||||||
China (2.4%) | |||||||||||
| Foshan Haitian Flavouring & Food Company Ltd., Class A, Equity Linked Notes, expires 10/11/24 (a) | 84,860 | 461 | |||||||||
| Jiangsu Yanghe Brewery, Class A, Equity Linked Notes, expires 1/23/17 (a) | 26,907 | 283 | |||||||||
| Kweichow Moutai Co., Ltd., Class A, Equity Linked Notes, expires 5/5/16 (a) | 2,224 | 75 | |||||||||
| Kweichow Moutai Co., Ltd., Class A, Equity Linked Notes, expires 3/4/21 (a) | 22,079 | 740 | |||||||||
Total Participation Notes (Cost $1,433) | 1,559 | ||||||||||
| Notional Amount | |||||||||||
Call Option Purchased (0.1%) | |||||||||||
Foreign Currency Option (0.1%) | |||||||||||
| USD/CNY June 2016 @ CNY 6.70, Royal Bank of Scotland (Cost $10) | 2,495,691 | 43 | |||||||||
Shares | |||||||||||
Short-Term Investments (6.7%) | |||||||||||
Securities held as Collateral on Loaned Securities (0.2%) | |||||||||||
Investment Company (0.2%) | |||||||||||
| Morgan Stanley Institutional Liquidity Funds — Treasury Securities Portfolio — Institutional Class (See Note G) | 120,547 | 121 | |||||||||
The accompanying notes are an integral part of the financial statements.
6
Morgan Stanley Institutional Fund, Inc.
Annual Report — December 31, 2015
Portfolio of Investments (cont'd)
International Opportunity Portfolio
| Face Amount (000) | Value (000) | ||||||||||
Repurchase Agreements (0.0%) | |||||||||||
| Barclays Capital, Inc., (0.32%, dated 12/31/15, due 1/4/16; proceeds $5; fully collateralized by a U.S. Government obligation; 2.00% due 11/30/22; valued at $5) | $ | 5 | $ | 5 | |||||||
| Merrill Lynch & Co., Inc., (0.31%, dated 12/31/15, due 1/4/16; proceeds $15; fully collateralized by a U.S. Government agency security; 4.00% due 11/20/45; valued at $15) | 15 | 15 | |||||||||
20 | |||||||||||
| Total Securities held as Collateral on Loaned Securities (Cost $141) | 141 | ||||||||||
Shares | |||||||||||
Investment Company (6.5%) | |||||||||||
| Morgan Stanley Institutional Liquidity Funds — Money Market Portfolio — Institutional Class (See Note G) (Cost $4,154) | 4,154,067 | 4,154 | |||||||||
Total Short-Term Investments (Cost $4,295) | 4,295 | ||||||||||
| Total Investments (100.7%) (Cost $61,352) Including $134 of Securities Loaned (g)(h) | 64,152 | ||||||||||
Liabilities in Excess of Other Assets (–0.7%) | (450 | ) | |||||||||
Net Assets (100.0%) | $ | 63,702 | |||||||||
(a) Non-income producing security.
(b) Security has been deemed illiquid at December 31, 2015.
(c) At December 31, 2015, the Portfolio held fair valued securities valued at approximately $165,000, representing 0.3% of net assets. These securities have been fair valued as determined in good faith under procedures established by and under the general supervision of the Fund's Directors.
(d) Security trades on the Hong Kong exchange.
(e) All or a portion of this security was on loan at December 31, 2015.
(f) Security cannot be offered for public resale without first being registered under the Securities Act of 1933 and related rules ("restricted security"). Acquisition date represents the day on which an enforceable right to acquire such security is obtained and is presented along with related cost in the security description. The Portfolio has registration rights for certain restricted securities. Any costs related to such registration are borne by the issuer. The aggregate value of restricted securities (excluding 144A holdings) at December 31, 2015 amounts to approximately $165,000 and represents 0.3% of net assets.
(g) The approximate fair value and percentage of net assets, $36,251,000 and 56.9%, respectively, represent the securities that have been fair valued under the fair valuation policy for international investments as described in Note A-1 within the Notes to the Financial Statements.
(h) At December 31, 2015, the aggregate cost for Federal income tax purposes is approximately $61,659,000. The aggregate gross unrealized appreciation is approximately $4,081,000 and the aggregate gross unrealized depreciation is approximately $1,588,000 resulting in net unrealized appreciation of approximately $2,493,000.
@ Value is less than $500.
ADR American Depositary Receipt.
CNY Chinese Yuan Renminbi
USD United States Dollar
Portfolio Composition*
Classification | Percentage of Total Investments | ||||||
Other** | 30.5 | % | |||||
Information Technology Services | 15.3 | ||||||
Textiles, Apparel & Luxury Goods | 9.1 | ||||||
Internet Software & Services | 8.8 | ||||||
Food Products | 6.9 | ||||||
Short-Term Investment | 6.5 | ||||||
Road & Rail | 6.5 | ||||||
Internet & Catalog Retail | 5.8 | ||||||
Diversified Consumer Services | 5.3 | ||||||
Media | 5.3 | ||||||
Total Investments | 100.0 | % | |||||
* Percentages indicated are based upon total investments (excluding Securities held as Collateral on Loaned Securities) as of December 31, 2015.
** Industries and/or investment types representing less than 5% of total investments.
The accompanying notes are an integral part of the financial statements.
7
Morgan Stanley Institutional Fund, Inc.
Annual Report — December 31, 2015
International Opportunity Portfolio
Statement of Assets and Liabilities | December 31, 2015 (000) | ||||||
Assets: | |||||||
Investments in Securities of Unaffiliated Issuers, at Value(1) (Cost $57,077) | $ | 59,877 | |||||
Investments in Securities of Affiliated Issuer, at Value (Cost $4,275) | 4,275 | ||||||
Total Investments in Securities, at Value (Cost $61,352) | 64,152 | ||||||
Foreign Currency, at Value (Cost $—@) | — | @ | |||||
Cash | 22 | ||||||
Receivable for Investments Sold | 4,181 | ||||||
Receivable for Portfolio Shares Sold | 1,458 | ||||||
Dividends Receivable | 27 | ||||||
Tax Reclaim Receivable | 12 | ||||||
Receivable from Affiliate | 1 | ||||||
Other Assets | 40 | ||||||
Total Assets | 69,893 | ||||||
Liabilities: | |||||||
Payable for Investments Purchased | 5,962 | ||||||
Collateral on Securities Loaned, at Value | 141 | ||||||
Payable for Portfolio Shares Redeemed | 31 | ||||||
Payable for Professional Fees | 19 | ||||||
Payable for Custodian Fees | 17 | ||||||
Payable for Administration Fees | 4 | ||||||
Payable for Shareholder Services Fees — Class A | 2 | ||||||
Payable for Distribution and Shareholder Services Fees — Class L | — | @ | |||||
Payable for Distribution and Shareholder Services Fees — Class C | 1 | ||||||
Payable for Advisory Fees | 3 | ||||||
Payable for Transfer Agency Fees — Class I | — | @ | |||||
Payable for Transfer Agency Fees — Class A | — | @ | |||||
Payable for Transfer Agency Fees — Class L | — | @ | |||||
Payable for Transfer Agency Fees — Class C | — | @ | |||||
Payable for Sub Transfer Agency Fees — Class I | — | @ | |||||
Payable for Sub Transfer Agency Fees — Class A | — | @ | |||||
Payable for Sub Transfer Agency Fees — Class L | — | @ | |||||
Payable for Sub Transfer Agency Fees — Class C | — | @ | |||||
Other Liabilities | 11 | ||||||
Total Liabilities | 6,191 | ||||||
Net Assets | $ | 63,702 | |||||
Net Assets Consist Of: | |||||||
Paid-in-Capital | $ | 61,658 | |||||
Accumulated Undistributed Net Investment Income | 21 | ||||||
Accumulated Net Realized Loss | (775 | ) | |||||
Unrealized Appreciation (Depreciation) on: | |||||||
Investments | 2,800 | ||||||
Foreign Currency Translations | (2 | ) | |||||
Net Assets | $ | 63,702 | |||||
The accompanying notes are an integral part of the financial statements.
8
Morgan Stanley Institutional Fund, Inc.
Annual Report — December 31, 2015
International Opportunity Portfolio
Statement of Assets and Liabilities (cont'd) | December 31, 2015 (000) | ||||||
CLASS I: | |||||||
Net Assets | $ | 52,128 | |||||
| Shares Outstanding $0.001 par value shares of beneficial interest (unlimited shares authorized) (not in 000's) | 3,468,835 | ||||||
Net Asset Value, Offering and Redemption Price Per Share | $ | 15.03 | |||||
CLASS A: | |||||||
Net Assets | $ | 9,520 | |||||
| Shares Outstanding $0.001 par value shares of beneficial interest (unlimited shares authorized) (not in 000's) | 637,437 | ||||||
Net Asset Value, Redemption Price Per Share | $ | 14.93 | |||||
Maximum Sales Load | 5.25 | % | |||||
Maximum Sales Charge | $ | 0.83 | |||||
Maximum Offering Price Per Share | $ | 15.76 | |||||
CLASS L: | |||||||
Net Assets | $ | 266 | |||||
| Shares Outstanding $0.001 par value shares of beneficial interest (unlimited shares authorized) (not in 000's) | 18,128 | ||||||
Net Asset Value, Offering and Redemption Price Per Share | $ | 14.69 | |||||
CLASS C: | |||||||
Net Assets | $ | 1,776 | |||||
| Shares Outstanding $0.001 par value shares of beneficial interest (unlimited shares authorized) (not in 000's) | 121,386 | ||||||
Net Asset Value, Offering and Redemption Price Per Share | $ | 14.63 | |||||
CLASS IS: | |||||||
Net Assets | $ | 12 | |||||
| Shares Outstanding $0.001 par value shares of beneficial interest (unlimited shares authorized) (not in 000's) | 784 | ||||||
Net Asset Value, Offering and Redemption Price Per Share | $ | 15.03 | |||||
| (1) Including: Securities on Loan, at Value: | $ | 134 | |||||
@ Amount is less than $500.
The accompanying notes are an integral part of the financial statements.
9
Morgan Stanley Institutional Fund, Inc.
Annual Report — December 31, 2015
International Opportunity Portfolio
Statement of Operations | Year Ended December 31, 2015 (000) | ||||||
Investment Income: | |||||||
Dividends from Securities of Unaffiliated Issuers (Net of $19 of Foreign Taxes Withheld) | $ | 250 | |||||
Income from Securities Loaned — Net | 4 | ||||||
Dividends from Security of Affiliated Issuer (Note G) | 3 | ||||||
Total Investment Income | 257 | ||||||
Expenses: | |||||||
Advisory Fees (Note B) | 214 | ||||||
Professional Fees | 108 | ||||||
Custodian Fees (Note F) | 57 | ||||||
Registration Fees | 52 | ||||||
Administration Fees (Note C) | 21 | ||||||
Shareholder Services Fees — Class A (Note D) | 8 | ||||||
Distribution and Shareholder Services Fees — Class L (Note D) | 2 | ||||||
Distribution and Shareholder Services Fees — Class C (Note D) | 6 | ||||||
Shareholder Reporting Fees | 13 | ||||||
Transfer Agency Fees — Class I (Note E) | 2 | ||||||
Transfer Agency Fees — Class A (Note E) | 3 | ||||||
Transfer Agency Fees — Class L (Note E) | 2 | ||||||
Transfer Agency Fees — Class C (Note E) | 1 | ||||||
Transfer Agency Fees — Class IS (Note E) | 2 | ||||||
Sub Transfer Agency Fees — Class I | 5 | ||||||
Sub Transfer Agency Fees — Class A | 2 | ||||||
Sub Transfer Agency Fees — Class L | — | @ | |||||
Sub Transfer Agency Fees — Class C | — | @ | |||||
Pricing Fees | 6 | ||||||
Other Expenses | 23 | ||||||
Total Expenses | 527 | ||||||
Waiver of Advisory Fees (Note B) | (214 | ) | |||||
Expenses Reimbursed by Adviser (Note B) | (25 | ) | |||||
Reimbursement of Class Specific Expenses — Class A (Note B) | (1 | ) | |||||
Reimbursement of Class Specific Expenses — Class L (Note B) | (2 | ) | |||||
Reimbursement of Class Specific Expenses — Class C (Note B) | (1 | ) | |||||
Reimbursement of Class Specific Expenses — Class IS (Note B) | (2 | ) | |||||
Rebate from Morgan Stanley Affiliate (Note G) | (2 | ) | |||||
Net Expenses | 280 | ||||||
Net Investment Loss | (23 | ) | |||||
Realized Gain (Loss): | |||||||
Investments Sold | (148 | ) | |||||
Foreign Currency Transactions | 52 | ||||||
Net Realized Loss | (96 | ) | |||||
Change in Unrealized Appreciation (Depreciation): | |||||||
Investments | 1,133 | ||||||
Foreign Currency Translations | (1 | ) | |||||
Net Change in Unrealized Appreciation (Depreciation) | 1,132 | ||||||
Net Realized Loss and Change in Unrealized Appreciation (Depreciation) | 1,036 | ||||||
Net Increase in Net Assets Resulting from Operations | $ | 1,013 | |||||
@ Amount is less than $500.
The accompanying notes are an integral part of the financial statements.
10
Morgan Stanley Institutional Fund, Inc.
Annual Report — December 31, 2015
International Opportunity Portfolio
Statements of Changes in Net Assets | Year Ended December 31, 2015 (000) | Year Ended December 31, 2014 (000) | |||||||||
Increase (Decrease) in Net Assets: | |||||||||||
Operations: | |||||||||||
Net Investment Income (Loss) | $ | (23 | ) | $ | 46 | ||||||
Net Realized Gain (Loss) | (96 | ) | 584 | ||||||||
Net Change in Unrealized Appreciation (Depreciation) | 1,132 | (475 | ) | ||||||||
Net Increase in Net Assets Resulting from Operations | 1,013 | 155 | |||||||||
Distributions from and/or in Excess of: | |||||||||||
Class I: | |||||||||||
Net Investment Income | (39 | ) | (4 | ) | |||||||
Net Realized Gain | (847 | ) | (210 | ) | |||||||
Class A: | |||||||||||
Net Investment Income | (1 | ) | (— | @) | |||||||
Net Realized Gain | (135 | ) | (23 | ) | |||||||
Class L: | |||||||||||
Net Realized Gain | (7 | ) | (4 | ) | |||||||
Class C: | |||||||||||
Net Investment Income | (1 | ) | — | ||||||||
Net Realized Gain | (25 | ) | — | ||||||||
Class IS: | |||||||||||
Net Investment Income | (— | @) | (— | @) | |||||||
Net Realized Gain | (— | @) | (— | @) | |||||||
Total Distributions | (1,055 | ) | (241 | ) | |||||||
Capital Share Transactions:(1) | |||||||||||
Class I: | |||||||||||
Subscribed | 46,792 | 3,295 | |||||||||
Distributions Reinvested | 695 | 78 | |||||||||
Redeemed | (6,474 | ) | (26 | ) | |||||||
Class A: | |||||||||||
Subscribed | 9,679 | 1,260 | |||||||||
Distributions Reinvested | 127 | 18 | |||||||||
Redeemed | (1,112 | ) | (529 | ) | |||||||
Class L: | |||||||||||
Subscribed | 63 | 59 | |||||||||
Distributions Reinvested | 2 | 1 | |||||||||
Redeemed | (4 | ) | (1 | ) | |||||||
Class C: | |||||||||||
Subscribed | 1,921 | * | — | ||||||||
Distributions Reinvested | 26 | * | — | ||||||||
Redeemed | (111 | )* | — | ||||||||
Net Increase in Net Assets Resulting from Capital Share Transactions | 51,604 | 4,155 | |||||||||
Redemption Fees | 1 | — | @ | ||||||||
Total Increase in Net Assets | 51,563 | 4,069 | |||||||||
Net Assets: | |||||||||||
Beginning of Period | 12,139 | 8,070 | |||||||||
End of Period (Including Accumulated Undistributed Net Investment Income of $21 and $41) | $ | 63,702 | $ | 12,139 | |||||||
The accompanying notes are an integral part of the financial statements.
11
Morgan Stanley Institutional Fund, Inc.
Annual Report — December 31, 2015
International Opportunity Portfolio
Statements of Changes in Net Assets (cont'd) | Year Ended December 31, 2015 (000) | Year Ended December 31, 2014 (000) | |||||||||
| (1) Capital Share Transactions: | |||||||||||
Class I: | |||||||||||
Shares Subscribed | 3,070 | 227 | |||||||||
Shares Issued on Distributions Reinvested | 45 | 6 | |||||||||
Shares Redeemed | (432 | ) | (2 | ) | |||||||
Net Increase in Class I Shares Outstanding | 2,683 | 231 | |||||||||
Class A: | |||||||||||
Shares Subscribed | 632 | 88 | |||||||||
Shares Issued on Distributions Reinvested | 8 | 1 | |||||||||
Shares Redeemed | (74 | ) | (37 | ) | |||||||
Net Increase in Class A Shares Outstanding | 566 | 52 | |||||||||
Class L: | |||||||||||
Shares Subscribed | 4 | 4 | |||||||||
Shares Issued on Distributions Reinvested | — | @@ | — | @@ | |||||||
Shares Redeemed | (— | @@) | (— | @@) | |||||||
Net Increase in Class L Shares Outstanding | 4 | 4 | |||||||||
Class C: | |||||||||||
Shares Subscribed | 125 | * | — | ||||||||
Shares Issued on Distributions Reinvested | 2 | * | — | ||||||||
Shares Redeemed | (6 | )* | — | ||||||||
Net Increase in Class C Shares Outstanding | 121 | — | |||||||||
@ Amount is less than $500.
@@ Amount is less than 500 shares.
* For the period April 30, 2015 through December 31, 2015.
The accompanying notes are an integral part of the financial statements.
12
Morgan Stanley Institutional Fund, Inc.
Annual Report — December 31, 2015
Financial Highlights
International Opportunity Portfolio
Class I | |||||||||||||||||||||||
Year Ended December 31, | |||||||||||||||||||||||
Selected Per Share Data and Ratios | 2015 | 2014 | 2013 | 2012 | 2011 | ||||||||||||||||||
Net Asset Value, Beginning of Period | $ | 13.92 | $ | 13.77 | $ | 11.19 | $ | 10.26 | $ | 12.07 | |||||||||||||
Income (Loss) from Investment Operations: | |||||||||||||||||||||||
Net Investment Income (Loss)† | (0.00 | )‡ | 0.08 | 0.10 | 0.08 | 0.08 | |||||||||||||||||
Net Realized and Unrealized Gain (Loss) | 1.58 | 0.36 | 2.85 | 0.92 | (1.31 | ) | |||||||||||||||||
Total from Investment Operations | 1.58 | 0.44 | 2.95 | 1.00 | (1.23 | ) | |||||||||||||||||
Distributions from and/or in Excess of: | |||||||||||||||||||||||
Net Investment Income | (0.03 | ) | (0.01 | ) | (0.09 | ) | (0.07 | ) | (0.10 | ) | |||||||||||||
Net Realized Gain | (0.44 | ) | (0.28 | ) | (0.28 | ) | — | (0.48 | ) | ||||||||||||||
Total Distributions | (0.47 | ) | (0.29 | ) | (0.37 | ) | (0.07 | ) | (0.58 | ) | |||||||||||||
Redemption Fees | 0.00 | ‡ | 0.00 | ‡ | — | — | — | ||||||||||||||||
Net Asset Value, End of Period | $ | 15.03 | $ | 13.92 | $ | 13.77 | $ | 11.19 | $ | 10.26 | |||||||||||||
Total Return++ | 11.40 | % | 3.14 | % | 26.47 | % | 9.76 | % | (10.16 | )% | |||||||||||||
Ratios and Supplemental Data: | |||||||||||||||||||||||
Net Assets, End of Period (Thousands) | $ | 52,128 | $ | 10,943 | $ | 7,647 | $ | 5,259 | $ | 4,822 | |||||||||||||
Ratio of Expenses to Average Net Assets (1) | 1.01 | %+^ | 1.09 | %+ | 1.13 | %+ | 1.14 | %+ | 1.15 | %+ | |||||||||||||
Ratio of Net Investment Income (Loss) to Average Net Assets (1) | (0.01 | )%+ | 0.57 | %+ | 0.82 | %+ | 0.70 | %+ | 0.67 | %+ | |||||||||||||
Ratio of Rebate from Morgan Stanley Affiliates to Average Net Assets | 0.01 | % | 0.01 | % | 0.01 | % | 0.01 | % | 0.00 | %§ | |||||||||||||
Portfolio Turnover Rate | 51 | % | 33 | % | 40 | % | 33 | % | 37 | % | |||||||||||||
(1) Supplemental Information on the Ratios to Average Net Assets: | |||||||||||||||||||||||
Ratios Before Expense Limitation: | |||||||||||||||||||||||
Expenses to Average Net Assets | 1.95 | % | 3.25 | % | 3.84 | % | 3.87 | % | 3.82 | % | |||||||||||||
Net Investment Loss to Average Net Assets | (0.95 | )% | (1.59 | )% | (1.89 | )% | (2.03 | )% | (2.00 | )% | |||||||||||||
† Per share amount is based on average shares outstanding.
‡ Amount is less than $0.005 per share.
++ Calculated based on the net asset value as of the last business day of the period.
+ The Ratios of Expenses and Net Investment Income (Loss) reflect the rebate of certain Portfolio expenses in connection with the investments in Morgan Stanley affiliates during the period. The effect of the rebate on the ratios is disclosed in the above table as "Ratio of Rebate from Morgan Stanley Affiliates to Average Net Assets."
^ Effective July 1, 2015, the Adviser has agreed to limit the ratio of expenses to average net assets to the maximum ratio of 1.00% for Class I shares. Prior to July 1, 2015, the maximum ratio was 1.15% for Class I shares.
§ Amount is less than 0.005%.
The accompanying notes are an integral part of the financial statements.
13
Morgan Stanley Institutional Fund, Inc.
Annual Report — December 31, 2015
Financial Highlights
International Opportunity Portfolio
Class A | |||||||||||||||||||||||
Year Ended December 31, | |||||||||||||||||||||||
Selected Per Share Data and Ratios | 2015 | 2014 | 2013 | 2012 | 2011 | ||||||||||||||||||
Net Asset Value, Beginning of Period | $ | 13.87 | $ | 13.78 | $ | 11.19 | $ | 10.26 | $ | 12.04 | |||||||||||||
Income (Loss) from Investment Operations: | |||||||||||||||||||||||
Net Investment Income (Loss)† | (0.06 | ) | 0.01 | 0.02 | 0.05 | 0.05 | |||||||||||||||||
Net Realized and Unrealized Gain (Loss) | 1.57 | 0.37 | 2.89 | 0.92 | (1.30 | ) | |||||||||||||||||
Total from Investment Operations | 1.51 | 0.38 | 2.91 | 0.97 | (1.25 | ) | |||||||||||||||||
Distributions from and/or in Excess of: | |||||||||||||||||||||||
Net Investment Income | (0.01 | ) | (0.01 | ) | (0.04 | ) | (0.04 | ) | (0.05 | ) | |||||||||||||
Net Realized Gain | (0.44 | ) | (0.28 | ) | (0.28 | ) | — | (0.48 | ) | ||||||||||||||
Total Distributions | (0.45 | ) | (0.29 | ) | (0.32 | ) | (0.04 | ) | (0.53 | ) | |||||||||||||
Redemption Fees | 0.00 | ‡ | 0.00 | ‡ | — | — | — | ||||||||||||||||
Net Asset Value, End of Period | $ | 14.93 | $ | 13.87 | $ | 13.78 | $ | 11.19 | $ | 10.26 | |||||||||||||
Total Return++ | 10.99 | % | 2.71 | % | 26.12 | % | 9.49 | % | (10.33 | )% | |||||||||||||
Ratios and Supplemental Data: | |||||||||||||||||||||||
Net Assets, End of Period (Thousands) | $ | 9,520 | $ | 992 | $ | 275 | $ | 112 | $ | 103 | |||||||||||||
Ratio of Expenses to Average Net Assets (1) | 1.34 | %+^^ | 1.49 | %+ | 1.44 | %+^ | 1.39 | %+ | 1.40 | %+ | |||||||||||||
Ratio of Net Investment Income (Loss) to Average Net Assets (1) | (0.39 | )%+ | 0.04 | %+ | 0.13 | %+ | 0.45 | %+ | 0.42 | %+ | |||||||||||||
Ratio of Rebate from Morgan Stanley Affiliates to Average Net Assets | 0.01 | % | 0.01 | % | 0.01 | % | 0.01 | % | 0.00 | %§ | |||||||||||||
Portfolio Turnover Rate | 51 | % | 33 | % | 40 | % | 33 | % | 37 | % | |||||||||||||
(1) Supplemental Information on the Ratios to Average Net Assets: | |||||||||||||||||||||||
Ratios Before Expense Limitation: | |||||||||||||||||||||||
Expenses to Average Net Assets | 2.28 | % | 3.81 | % | 4.49 | % | 4.12 | % | 4.07 | % | |||||||||||||
Net Investment Loss to Average Net Assets | (1.33 | )% | (2.28 | )% | (2.92 | )% | (2.28 | )% | (2.25 | )% | |||||||||||||
† Per share amount is based on average shares outstanding.
‡ Amount is less than $0.005 per share.
++ Calculated based on the net asset value which does not reflect sales charges, if applicable, as of the last business day of the period.
+ The Ratios of Expenses and Net Investment Income (Loss) reflect the rebate of certain Portfolio expenses in connection with the investments in Morgan Stanley affiliates during the period. The effect of the rebate on the ratios is disclosed in the above table as "Ratio of Rebate from Morgan Stanley Affiliates to Average Net Assets."
^ Effective September 16, 2013, the Adviser has agreed to limit the ratio of expenses to average net assets to the maximum ratio of 1.50% for Class A shares. Prior to September 16, 2013, the maximum ratio was 1.40% for Class A shares.
^^ Effective July 1, 2015, the Adviser has agreed to limit the ratio of expenses to average net assets to the maximum ratio of 1.35% for Class A shares. Prior to July 1, 2015, the maximum ratio was 1.50% for Class A shares.
§ Amount is less than 0.005%.
The accompanying notes are an integral part of the financial statements.
14
Morgan Stanley Institutional Fund, Inc.
Annual Report — December 31, 2015
Financial Highlights
International Opportunity Portfolio
Class L | |||||||||||||||||||||||
Year Ended December 31, | |||||||||||||||||||||||
Selected Per Share Data and Ratios | 2015 | 2014 | 2013 | 2012 | 2011 | ||||||||||||||||||
Net Asset Value, Beginning of Period | $ | 13.71 | $ | 13.68 | $ | 11.13 | $ | 10.22 | $ | 12.00 | |||||||||||||
Income (Loss) from Investment Operations: | |||||||||||||||||||||||
Net Investment Loss† | (0.12 | ) | (0.05 | ) | (0.00 | )‡ | (0.01 | ) | (0.01 | ) | |||||||||||||
Net Realized and Unrealized Gain (Loss) | 1.54 | 0.36 | 2.83 | 0.92 | (1.29 | ) | |||||||||||||||||
Total from Investment Operations | 1.42 | 0.31 | 2.83 | 0.91 | (1.30 | ) | |||||||||||||||||
Distributions from and/or in Excess of: | |||||||||||||||||||||||
Net Realized Gain | (0.44 | ) | (0.28 | ) | (0.28 | ) | — | (0.48 | ) | ||||||||||||||
Redemption Fees | 0.00 | ‡ | 0.00 | ‡ | — | — | — | ||||||||||||||||
Net Asset Value, End of Period | $ | 14.69 | $ | 13.71 | $ | 13.68 | $ | 11.13 | $ | 10.22 | |||||||||||||
Total Return++ | 10.38 | % | 2.24 | % | 25.49 | % | 8.90 | % | (10.81 | )% | |||||||||||||
Ratios and Supplemental Data: | |||||||||||||||||||||||
Net Assets, End of Period (Thousands) | $ | 266 | $ | 193 | $ | 137 | $ | 112 | $ | 102 | |||||||||||||
Ratio of Expenses to Average Net Assets (1) | 1.91 | %+^^ | 1.99 | %+ | 1.92 | %+^ | 1.89 | %+ | 1.90 | %+ | |||||||||||||
Ratio of Net Investment Loss to Average Net Assets (1) | (0.80 | )%+ | (0.38 | )%+ | (0.00 | )%+§ | (0.05 | )%+ | (0.08 | )%+ | |||||||||||||
Ratio of Rebate from Morgan Stanley Affiliates to Average Net Assets | 0.01 | % | 0.01 | % | 0.01 | % | 0.01 | % | 0.00 | %§ | |||||||||||||
Portfolio Turnover Rate | 51 | % | 33 | % | 40 | % | 33 | % | 37 | % | |||||||||||||
(1) Supplemental Information on the Ratios to Average Net Assets: | |||||||||||||||||||||||
Ratios Before Expense Limitation: | |||||||||||||||||||||||
Expenses to Average Net Assets | 3.54 | % | 5.06 | % | 4.91 | % | 4.62 | % | 4.57 | % | |||||||||||||
Net Investment Loss to Average Net Assets | (2.43 | )% | (3.45 | )% | (2.99 | )% | (2.78 | )% | (2.75 | )% | |||||||||||||
† Per share amount is based on average shares outstanding.
‡ Amount is less than $0.005 per share.
++ Calculated based on the net asset value as of the last business day of the period.
+ The Ratios of Expenses and Net Investment Loss reflect the rebate of certain Portfolio expenses in connection with the investments in Morgan Stanley affiliates during the period. The effect of the rebate on the ratios is disclosed in the above table as "Ratio of Rebate from Morgan Stanley Affiliates to Average Net Assets."
^ Effective September 16, 2013, the Adviser has agreed to limit the ratio of expenses to average net assets to the maximum ratio of 2.00% for Class L shares. Prior to September 16, 2013, the maximum ratio was 1.90% for Class L shares.
^^ Effective July 1, 2015, the Adviser has agreed to limit the ratio of expenses to average net assets to the maximum ratio of 1.85% for Class L shares. Prior to July 1, 2015, the maximum ratio was 2.00% for Class L shares.
§ Amount is less than 0.005%.
The accompanying notes are an integral part of the financial statements.
15
Morgan Stanley Institutional Fund, Inc.
Annual Report — December 31, 2015
Financial Highlights
International Opportunity Portfolio
Class C | |||||||
| Selected Per Share Data and Ratios | Period from April 30, 2015^ to December 31, 2015 | ||||||
Net Asset Value, Beginning of Period | $ | 15.39 | |||||
Loss from Investment Operations: | |||||||
Net Investment Loss† | (0.13 | ) | |||||
Net Realized and Unrealized Loss | (0.16 | ) | |||||
Total from Investment Operations | (0.29 | ) | |||||
Distributions from and/or in Excess of: | |||||||
Net Investment Income | (0.03 | ) | |||||
Net Realized Gain | (0.44 | ) | |||||
Total Distributions | (0.47 | ) | |||||
Redemption Fees | 0.00 | ‡ | |||||
Net Asset Value, End of Period | $ | 14.63 | |||||
Total Return++ | (1.85 | )%# | |||||
Ratios and Supplemental Data: | |||||||
Net Assets, End of Period (Thousands) | $ | 1,776 | |||||
Ratios of Expenses to Average Net Assets (1) | 2.10 | %+*^^ | |||||
Ratio of Net Investment Loss to Average Net Assets (1) | (1.28 | )%+* | |||||
Ratio of Rebate from Morgan Stanley Affiliates to Average Net Assets | 0.01 | %* | |||||
Portfolio Turnover Rate | 51 | % | |||||
(1) Supplemental Information on the Ratios to Average Net Assets: | |||||||
Ratios Before Expense Limitation: | |||||||
Expense to Average Net Assets | 3.03 | %* | |||||
Net Investment Loss to Average Net Assets | (2.21 | )%* | |||||
^ Commencement of Offering.
† Per share amount is based on average shares outstanding.
‡ Amount is less than $0.005 per share.
++ Calculated based on the net asset value which does not reflect sales charges, if applicable, as of the last business day of the period.
+ The Ratios of Expenses and Net Investment Loss reflect the rebate of certain Portfolio expenses in connection with the investments in Morgan Stanley affiliates during the period. The effect of the rebate on the ratios is disclosed in the above table as "Ratio of Rebate from Morgan Stanley Affiliates to Average Net Assets."
^^ Effective July 1, 2015, the Adviser has agreed to limit the ratio of expenses to average net assets to the maximum ratio of 2.10% for Class C shares. Prior to July 1, 2015, the maximum ratio was 2.25% for Class C shares.
# Not Annualized
* Annualized.
The accompanying notes are an integral part of the financial statements.
16
Morgan Stanley Institutional Fund, Inc.
Annual Report — December 31, 2015
Financial Highlights
International Opportunity Portfolio
Class IS | |||||||||||||||
Year Ended December 31, | Period from September 13, 2013^ to | ||||||||||||||
Selected Per Share Data and Ratios | 2015 | 2014 | December 31, 2013 | ||||||||||||
Net Asset Value, Beginning of Period | $ | 13.92 | $ | 13.77 | $ | 12.75 | |||||||||
Income (Loss) from Investment Operations: | |||||||||||||||
Net Investment Income (Loss)† | 0.02 | 0.07 | (0.02 | ) | |||||||||||
Net Realized and Unrealized Gain | 1.56 | 0.37 | 1.41 | ||||||||||||
Total from Investment Operations | 1.58 | 0.44 | 1.39 | ||||||||||||
Distributions from and/or in Excess of: | |||||||||||||||
Net Investment Income | (0.03 | ) | (0.01 | ) | (0.09 | ) | |||||||||
Net Realized Gain | (0.44 | ) | (0.28 | ) | (0.28 | ) | |||||||||
Total Distributions | (0.47 | ) | (0.29 | ) | (0.37 | ) | |||||||||
Redemption Fees | 0.00 | ‡ | 0.00 | ‡ | — | ||||||||||
Net Asset Value, End of Period | $ | 15.03 | $ | 13.92 | $ | 13.77 | |||||||||
Total Return++ | 11.40 | % | 3.22 | % | 10.96 | %# | |||||||||
Ratios and Supplemental Data: | |||||||||||||||
Net Assets, End of Period (Thousands) | $ | 12 | $ | 11 | $ | 11 | |||||||||
Ratio of Expenses to Average Net Assets (1) | 1.01 | %+^^^ | 1.08 | %+ | 1.08 | %+^^* | |||||||||
Ratio of Net Investment Income (Loss) to Average Net Assets (1) | 0.12 | %+ | 0.51 | %+ | (0.47 | )%+* | |||||||||
Ratio of Rebate from Morgan Stanley Affiliates to Average Net Assets | 0.00 | %§ | 0.01 | % | 0.01 | %* | |||||||||
Portfolio Turnover Rate | 51 | % | 33 | % | 40 | %# | |||||||||
(1) Supplemental Information on the Ratios to Average Net Assets: | |||||||||||||||
Ratios Before Expense Limitation | |||||||||||||||
Expenses to Average Net Assets | 15.79 | % | 20.64 | % | 9.61 | %* | |||||||||
Net Investment Loss to Average Net Assets | (14.66 | )% | (19.05 | )% | (9.00 | )%* | |||||||||
^ Commencement of Offering.
† Per share amount is based on average shares outstanding.
‡ Amount is less than $0.005 per share.
++ Calculated based on the net asset value as of the last business day of the period.
+ The Ratios of Expenses and Net Investment Income (Loss) reflect the rebate of certain Portfolio expenses in connection with the investments in Morgan Stanley affiliates during the period. The effect of the rebate on the ratios is disclosed in the above table as "Ratio of Rebate from Morgan Stanley Affiliates to Average Net Assets."
^^ Effective September 16, 2013, the Adviser has agreed to limit the ratio of expenses to average net assets to the maximum ratio of 1.09% for Class IS shares.
^^^ Effective July 1, 2015, the Adviser has agreed to limit the ratio of expenses to average net assets to the maximum ratio of 0.94% for Class IS shares. Prior to July 1, 2015, the maximum ratio was 1.09% for Class IS shares.
§ Amount is less than 0.005%.
# Not Annualized.
* Annualized.
The accompanying notes are an integral part of the financial statements.
17
Morgan Stanley Institutional Fund, Inc.
Annual Report — December 31, 2015
Notes to Financial Statements
Morgan Stanley Institutional Fund, Inc. (the "Fund") is registered under the Investment Company Act of 1940, as amended (the "Act"), as an open-end management investment company. The Fund is comprised of twenty-six separate, active, diversified and non-diversified portfolios (individually referred to as a "Portfolio", collectively as the "Portfolios"). The Fund applies investment company accounting and reporting guidance.
The accompanying financial statements relate to the International Opportunity Portfolio. The Portfolio seeks long-term capital appreciation by investing primarily in established and emerging companies on an international basis, with capitalizations within the range of companies included in the MSCI All Country World Index ex USA Index.
The Portfolio offers five classes of shares — Class I, Class A, Class L, Class C and Class IS. On April, 30, 2015 the Portfolio commenced offering Class C shares and suspended offering of Class L shares. Existing Class L shareholders may invest through reinvestment of dividends and distributions.
A. Significant Accounting Policies: The following significant accounting policies are in conformity with U.S. generally accepted accounting principles ("GAAP"). Such policies are consistently followed by the Fund in the preparation of its financial statements. GAAP may require management to make estimates and assumptions that affect the reported amounts and disclosures in the financial statements. Actual results may differ from those estimates.
1. Security Valuation: (1) An equity portfolio security listed or traded on an exchange is valued at its latest reported sales price (or at the exchange official closing price if such exchange reports an official closing price), if there were no sales on a given day, the security is valued at the mean between the last reported bid and asked prices; (2) all other equity portfolio securities for which over-the-counter ("OTC") market quotations are readily available are valued at its latest reported sales price. In cases where a security is traded on more than one exchange, the security is valued on the exchange designated as the primary market; (3) Certain portfolio securities may be valued by an outside pricing service approved by the Fund's Board of Directors (the "Directors"). The pricing service may utilize a matrix system or other model incorporating attributes such as security quality, maturity and coupon as the evaluation model parameters, and/or research evaluations by its staff, including review of broker-dealer market price
quotations in determining what it believes is the fair valuation of the portfolios securities valued by such pricing service; (4) listed options are valued at the last reported sales price on the exchange on which they are listed (or at the exchange official closing price if such exchange reports an official closing price). If an official closing price or last reported sales price is unavailable, the listed option should be fair valued at the mean between their latest bid and asked price. Unlisted options are valued by an outside pricing service approved by the Directors or quotes from a broker or dealer; (5) when market quotations are not readily available, including circumstances under which Morgan Stanley Investment Management Inc. (the "Adviser") determines that the closing price, last sale price or the mean between the last reported bid and asked prices are not reflective of a security's market value, portfolio securities are valued at their fair value as determined in good faith under procedures established by and under the general supervision of the Directors. Occasionally, developments affecting the closing prices of securities and other assets may occur between the times at which valuations of such securities are determined (that is, close of the foreign market on which the securities trade) and the close of business of the New York Stock Exchange ("NYSE"). If developments occur during such periods that are expected to materially affect the value of such securities, such valuations may be adjusted to reflect the estimated fair value of such securities as of the close of the NYSE, as determined in good faith by the Directors or by the Adviser using a pricing service and/or procedures approved by the Directors; (6) quotations of foreign portfolio securities, other assets and liabilities and forward contracts stated in foreign currency are translated into U.S. dollar equivalents at the prevailing market rates prior to the close of the NYSE; (7) investments in mutual funds, including the Morgan Stanley Institutional Liquidity Funds, are valued at the net asset value ("NAV") as of the close of each business day; and (8) short-term debt securities with remaining maturities of 60 days or less at the time of purchase may be valued at amortized cost, unless the Adviser determines such valuation does not reflect the securities' market value, in which case these securities will be valued at their fair market value determined by the Adviser.
The Directors have responsibility for determining in good faith the fair value of the investments, and the Directors may appoint others, such as the Fund's
18
Morgan Stanley Institutional Fund, Inc.
Annual Report — December 31, 2015
Notes to Financial Statements (cont'd)
Adviser or a valuation committee, to assist the Directors in determining fair value and to make the actual calculations pursuant to the fair valuation methodologies previously approved by the Directors. Under procedures approved by the Directors, the Fund's Adviser has formed a Valuation Committee whose members are approved by the Directors. The Valuation Committee provides administration and oversight of the Fund's valuation policies and procedures, which are reviewed at least annually by the Directors. These procedures allow the Fund to utilize independent pricing services, quotations from securities and financial instrument dealers, and other market sources to determine fair value.
The Fund has procedures to determine the fair value of securities and other financial instruments for which market prices are not readily available. Under these procedures, the Valuation Committee convenes on a regular and ad hoc basis to review such securities and considers a number of factors, including valuation methodologies and significant unobservable valuation inputs, when arriving at fair value. The Valuation Committee may employ a market-based approach which may use related or comparable assets or liabilities, recent transactions, market multiples, book values, and other relevant information for the investment to determine the fair value of the investment. An income-based valuation approach may also be used in which the anticipated future cash flows of the investment are discounted to calculate fair value. Discounts may also be applied due to the nature or duration of any restrictions on the disposition of the investments. Due to the inherent uncertainty of valuations of such investments, the fair values may differ significantly from the values that would have been used had an active market existed. The Valuation Committee employs various methods for calibrating these valuation approaches including a regular review of valuation methodologies, key inputs and assumptions, transactional back-testing or disposition analysis, and reviews of any related market activity.
2. Fair Value Measurement: Financial Accounting Standards Board ("FASB") Accounting Standards CodificationTM ("ASC") 820, "Fair Value Measurement" ("ASC 820"), defines fair value as the value that the Fund would receive to sell an investment or pay to transfer a liability in a timely transaction with an independent buyer in the principal market, or in the absence of a principal
market the most advantageous market for the investment or liability. ASC 820 establishes a three-tier hierarchy to distinguish between (1) inputs that reflect the assumptions market participants would use in valuing an asset or liability developed based on market data obtained from sources independent of the reporting entity (observable inputs) and (2) inputs that reflect the reporting entity's own assumptions about the assumptions market participants would use in valuing an asset or liability developed based on the best information available in the circumstances (unobservable inputs) and to establish classification of fair value measurements for disclosure purposes. Various inputs are used in determining the value of the Fund's investments. The inputs are summarized in the three broad levels listed below.
• Level 1 – unadjusted quoted prices in active markets for identical investments
• Level 2 – other significant observable inputs (including quoted prices for similar investments, interest rates, prepayment speeds, credit risk, etc.)
• Level 3 – significant unobservable inputs including the Fund's own assumptions in determining the fair value of investments. Factors considered in making this determination may include, but are not limited to, information obtained by contacting the issuer, analysts, or the appropriate stock exchange (for exchange-traded securities), analysis of the issuer's financial statements or other available documents and, if necessary, available information concerning other securities in similar circumstances
The inputs or methodology used for valuing securities are not necessarily an indication of the risk associated with investing in those securities and the determination of the significance of a particular input to the fair value measurement in its entirety requires judgment and considers factors specific to each security.
19
Morgan Stanley Institutional Fund, Inc.
Annual Report — December 31, 2015
Notes to Financial Statements (cont'd)
The following is a summary of the inputs used to value the Portfolio's investments as of December 31, 2015.
Investment Type | Level 1 Unadjusted quoted prices (000) | Level 2 Other significant observable inputs (000) | Level 3 Significant unobservable inputs (000) | Total (000) | |||||||||||||||
Assets: | |||||||||||||||||||
Common Stocks | |||||||||||||||||||
Banks | $ | 1,273 | $ | — | $ | — | $ | 1,273 | |||||||||||
Beverages | — | 1,710 | — | 1,710 | |||||||||||||||
Biotechnology | — | 2,182 | — | 2,182 | |||||||||||||||
Capital Markets | — | 2,500 | — | 2,500 | |||||||||||||||
| Diversified Consumer Services | 3,398 | — | — | 3,398 | |||||||||||||||
Electric Utilities | 938 | — | — | 938 | |||||||||||||||
| Energy Equipment & Services | — | 629 | — | 629 | |||||||||||||||
Food & Staples Retailing | — | 13 | — | 13 | |||||||||||||||
Food Products | — | 3,965 | — | 3,965 | |||||||||||||||
Household Products | — | 1,181 | — | 1,181 | |||||||||||||||
| Information Technology Services | 9,811 | — | — | 9,811 | |||||||||||||||
Insurance | — | 1,256 | — | 1,256 | |||||||||||||||
Internet & Catalog Retail | 3,555 | — | — | 3,555 | |||||||||||||||
| Internet Software & Services | 1,213 | 4,449 | — | 5,662 | |||||||||||||||
Marine | — | 1,532 | — | 1,532 | |||||||||||||||
Media | — | 3,377 | — | 3,377 | |||||||||||||||
Multi-Utilities | — | — | — | † | — | † | |||||||||||||
Pharmaceuticals | — | 1,248 | — | 1,248 | |||||||||||||||
| Real Estate Management & Development | 929 | — | — | 929 | |||||||||||||||
Road & Rail | — | 4,132 | — | 4,132 | |||||||||||||||
Software | 722 | — | — | 722 | |||||||||||||||
| Textiles, Apparel & Luxury Goods | — | 5,842 | — | 5,842 | |||||||||||||||
| Transportation Infrastructure | — | 2,235 | — | 2,235 | |||||||||||||||
Total Common Stocks | 21,839 | 36,251 | — | † | 58,090 | † | |||||||||||||
Preferred Stock | — | — | 165 | 165 | |||||||||||||||
| Convertible Preferred Stock | — | — | @ | — | — | @ | |||||||||||||
Participation Notes | — | 1,559 | — | 1,559 | |||||||||||||||
Call Option Purchased | — | 43 | — | 43 | |||||||||||||||
Short-Term Investments | |||||||||||||||||||
Investment Companies | 4,275 | — | — | 4,275 | |||||||||||||||
Repurchase Agreements | — | 20 | — | 20 | |||||||||||||||
| Total Short-Term Investments | 4,275 | 20 | — | 4,295 | |||||||||||||||
Total Assets | $ | 26,114 | $ | 37,873 | $ | 165 | † | $ | 64,152 | † | |||||||||
@ Value is less than $500.
† Includes one security which is valued at zero.
Transfers between investment levels may occur as the markets fluctuate and/or the availability of data used in an investment's valuation changes. The Portfolio recognizes transfers between the levels as of the end of the period. At December 31, 2015, the Portfolio held a security with a value of less than $500 that transferred from Level 3 to Level 2. This security was valued using significant unobservable inputs at December 31, 2014 and was valued using other significant observable inputs at December 31, 2015. At December 31, 2015, the fair value of certain securities were adjusted due to developments which occurred between the time of the close of the foreign markets on which they trade and the close of business on the NYSE which resulted in their Level 2 classification.
Following is a reconciliation of investments in which significant unobservable inputs (Level 3) were used in determining fair value.
| Common Stock (000) | Preferred Stock (000) | Convertible Preferred Stock (000) | |||||||||||||
Beginning Balance | $ | — | † | $ | 190 | $ | — | @ | |||||||
Purchases | — | — | — | ||||||||||||
Sales | — | — | — | ||||||||||||
Amortization of discount | — | — | — | ||||||||||||
Transfers in | — | — | — | ||||||||||||
Transfers out | — | — | (— | @) | |||||||||||
Corporate actions | — | — | — | ||||||||||||
| Change in unrealized appreciation (depreciation) | — | (25 | ) | — | @ | ||||||||||
Realized gains (losses) | — | — | — | ||||||||||||
Ending Balance | $ | — | † | $ | 165 | $ | — | ||||||||
| Net change in unrealized appreciation (depreciation) from investments still held as of December 31, 2015 | $ | — | $ | (25 | ) | $ | — | @ | |||||||
@ Value is less than $500.
† Includes one security which is valued at zero.
20
Morgan Stanley Institutional Fund, Inc.
Annual Report — December 31, 2015
Notes to Financial Statements (cont'd)
The following table presents additional information about valuation techniques and inputs used for investments that are measured at fair value and categorized within Level 3 as of December 31, 2015.
| Fair Value at December 31, 2015 (000) | Valuation Technique | Unobservable Input | Range | Selected Value | Impact to Valuation from an Increase in Input | ||||||||||||||||||||||||||
Internet & Catalog Retail | |||||||||||||||||||||||||||||||
Preferred Stock | $ | 165 | Discounted Cash Flow | Weighted Average Cost of Capital | 17.0 | % | 19.0 | % | 18.0 | % | Decrease | ||||||||||||||||||||
Perpetual Growth Rate | 3.5 | % | 4.5 | % | 4.0 | % | Increase | ||||||||||||||||||||||||
| Market Comparable Companies | Enterprise Value/ Revenue | 3.1 | x | 5.2 | x | 3.1 | x | Increase | |||||||||||||||||||||||
| Discount for Lack of Marketability | 20.0 | % | 20.0 | % | 20.0 | % | Decrease | ||||||||||||||||||||||||
3. Repurchase Agreements: The Portfolio may enter into repurchase agreements under which a Portfolio lends excess cash and takes possession of securities with an agreement that the counterparty will repurchase such securities. In connection with transactions in repurchase agreements, a bank as custodian for the Portfolio takes possession of the underlying securities which are held as collateral, with a market value at least equal to the amount of the repurchase transaction, including principal and accrued interest. To the extent that any repurchase transaction exceeds one business day, the value of the collateral is marked-to-market on a daily basis to determine the adequacy of the collateral. In the event of default on the obligation to repurchase, the Portfolio has the right to liquidate the collateral and apply the proceeds in satisfaction of the obligation. In the event of default or bankruptcy by the counterparty to the agreement, realization and/or retention of the collateral or proceeds may be subject to legal proceedings. The Portfolio, along with other affiliated investment companies, may utilize a joint trading account for the purpose of entering into repurchase agreements.
4. Foreign Currency Translation and Foreign Investments: The books and records of the Portfolio are maintained in U.S. dollars. Foreign currency amounts are translated into U.S. dollars as follows:
– investments, other assets and liabilities at the prevailing rate of exchange on the valuation date;
– investment transactions and investment income at the prevailing rates of exchange on the dates of such transactions.
Although the net assets of the Portfolio are presented at the foreign exchange rates and market values at the close of the period, the Portfolio does not isolate that portion of the results of operations arising as a result of changes in the foreign exchange rates from the fluctuations arising from changes in the market prices of securities held at period end. Similarly, the Portfolio does not isolate the effect of changes in foreign exchange rates from the fluctuations arising from changes in the market prices of securities sold during the period. Accordingly, realized and unrealized foreign currency gains (losses) on investments in securities are included in the reported net realized and unrealized gains (losses) on investment transactions and balances. However, pursuant to U.S. Federal income tax regulations, gains and losses from certain foreign currency transactions and the foreign currency portion of gains and losses realized on sales and maturities of foreign denominated debt securities are treated as ordinary income for U.S. Federal income tax purposes.
Net realized gains (losses) on foreign currency transactions represent net foreign exchange gains (losses) from foreign currency forward exchange contracts, disposition of foreign currencies, currency gains (losses) realized between the trade and settlement dates on securities transactions, and the difference between the amount of investment income and foreign withholding taxes recorded on the Portfolio's books and the U.S. dollar equivalent amounts actually received or paid. Net unrealized currency gains (losses) from valuing foreign currency denominated assets and liabilities at period end exchange rates are reflected as a component of
21
Morgan Stanley Institutional Fund, Inc.
Annual Report — December 31, 2015
Notes to Financial Statements (cont'd)
unrealized appreciation (depreciation) in the Statement of Assets and Liabilities. The change in unrealized currency gains (losses) on foreign currency translations for the period is reflected in the Statement of Operations.
Foreign security and currency transactions may involve certain considerations and risks not typically associated with those of U.S. dollar denominated transactions as a result of, among other factors, fluctuations of exchange rates in relation to the U.S. dollar, the possibility of lower levels of governmental supervision and regulation of foreign securities markets and the possibility of political or economic instability.
Governmental approval for foreign investments may be required in advance of making an investment under certain circumstances in some countries, and the extent of foreign investments in domestic companies may be subject to limitation in other countries. Foreign ownership limitations also may be imposed by the charters of individual companies to prevent, among other concerns, violations of foreign investment limitations. As a result, an additional class of shares (identified as "Foreign" in the Portfolio of Investments) may be created and offered for investment. The "local" and "foreign shares" market values may differ. In the absence of trading of the foreign shares in such markets, the Portfolio values the foreign shares at the closing exchange price of the local shares.
5. Derivatives: The Portfolio may, but is not required to, use derivative instruments for a variety of purposes, including hedging, risk management, portfolio management or to earn income. Derivatives are financial instruments whose value is based, in part, on the value of an underlying asset, interest rate, index or financial instrument. Prevailing interest rates and volatility levels, among other things, also affect the value of derivative instruments. A derivative instrument often has risks similar to its underlying asset and may have additional risks, including imperfect correlation between the value of the derivative and the underlying asset, risks of default by the counterparty to certain transactions, magnification of losses incurred due to changes in the market value of the securities, instruments, indices or interest rates to which the derivative instrument relates, risks that the transactions may not be liquid and risks arising from margin requirements. The use of derivatives involves risks that are different from, and possibly greater than, the risks associated with other portfolio investments. Derivatives may involve the use of
highly specialized instruments that require investment techniques and risk analyses different from those associated with other portfolio investments. All of the Portfolio's holdings, including derivative instruments, are marked-to-market each day with the change in value reflected in unrealized appreciation (depreciation). Upon disposition, a realized gain or loss is recognized.
Certain derivative transactions may give rise to a form of leverage. Leverage magnifies the potential for gain and the risk of loss. Leverage associated with derivative transactions may cause the Portfolio to liquidate portfolio positions when it may not be advantageous to do so to satisfy its obligations or to meet earmarking or segregation requirements, pursuant to applicable Securities and Exchange Commission rules and regulations, or may cause the Portfolio to be more volatile than if the Portfolio had not been leveraged. Although the Adviser seeks to use derivatives to further the Portfolio's investment objectives, there is no assurance that the use of derivatives will achieve this result.
Following is a description of the derivative instruments and techniques that the Portfolio used during the period and their associated risks:
Options: With respect to options, the Portfolio is subject to equity risk, interest rate risk and foreign currency exchange risk in the normal course of pursuing its investment objectives. If the Portfolio buys an option, it buys a legal contract giving it the right to buy or sell a specific amount of the underlying instrument or futures contract on the underlying instrument, at an agreed-upon price typically in exchange for a premium paid by the Portfolio. The Portfolio may purchase and/or sell put and call options. Purchasing call options tends to increase the Portfolio's exposure to the underlying (or similar) instrument. Purchasing put options tends to decrease the Portfolio's exposure to the underlying (or similar) instrument. When entering into purchased option contracts, the Portfolio bears the risk of interest or exchange rates or securities prices moving unexpectedly, in which case, the Portfolio may not achieve the anticipated benefits of the purchased option contracts; however the risk of loss is limited to the premium paid. Purchased options are reported as part of "Total Investments in Securities" in the Statement of Assets and Liabilities. Premium paid for purchasing options which expired are treated as realized losses. If the Portfolio sells
22
Morgan Stanley Institutional Fund, Inc.
Annual Report — December 31, 2015
Notes to Financial Statements (cont'd)
an option, it sells to another party the right to buy from or sell to the Portfolio a specific amount of the underlying instrument or futures contract on the underlying instrument at an agreed-upon price typically in exchange for a premium received by the Portfolio. When options are purchased OTC, the Portfolio bears the risk that the counterparty that wrote the option will be unable or unwilling to perform its obligations under the option contract. Options may also be illiquid and the Portfolio may have difficulty closing out its position. A decision as to whether, when and how to use options involves the exercise of skill and judgment and even a well-conceived option transaction may be unsuccessful because of market behavior or unexpected events. The prices of options can be highly volatile and the use of options can lower total returns.
FASB ASC 815, "Derivatives and Hedging" ("ASC 815"), is intended to improve financial reporting about derivative instruments by requiring enhanced disclosures to enable investors to better understand how and why the Portfolio uses derivative instruments, how these derivative instruments are accounted for and their effects on the Portfolio's financial position and results of operations.
The following table sets forth the fair value of the Portfolio's derivative contracts by primary risk exposure as of December 31, 2015.
| Asset Derivatives Statement of Assets and Liabilities Location | Primary Risk Exposure | Value (000) | |||||||||||||
| Call Options Purchased | Investments, at Value (Call Options Purchased) | Currency Risk | $ | 43 | (a) | ||||||||||
(a) Amounts are included in Investments in Securities in the Statement of Assets and Liabilities.
The following tables set forth by primary risk exposure the Portfolio's realized gains (losses) and change in unrealized appreciation (depreciation) by type of derivative contract for the year ended December 31, 2015 in accordance with ASC 815.
Realized Gain (Loss) | |||||||||||
Primary Risk Exposure | Derivative Type | Value (000) | |||||||||
| Currency Risk | Investments (Call Options Purchased) | $(9)(b) | |||||||||
(b) Amounts are included in Investments Sold in the Statement of Operations.
Change in Unrealized Appreciation (Depreciation) | |||||||||||
Primary Risk Exposure | Derivative Type | Value (000) | |||||||||
| Currency Risk | Investments (Call Options Purchased) | $33(c) | |||||||||
(c) Amounts are included in Investments in the Statement of Operations.
At December 31, 2015, the Portfolio's derivative assets and liabilities are as follows:
| Gross Amounts of Assets and Liabilities Presented in the Statement of Assets and Liabilities | |||||||||||
Derivatives | Assets(d) (000) | Liabilities(d) (000) | |||||||||
Call Options Purchased | $ | 43 | (a) | $ | — | ||||||
(a) Amounts are included in Investments in Securities in the Statement of Assets and Liabilities.
(d) Absent an event of default or early termination, OTC derivative assets and liabilities are presented gross and not offset in the Statement of Assets and Liabilities.
The Portfolio typically enters into International Swaps and Derivatives Association, Inc. Master Agreements ("ISDA Master Agreements") or similar master agreements (collectively, "Master Agreements") with its contract counterparties for certain OTC derivatives in order to, among other things, reduce its credit risk to counterparties. ISDA Master Agreements include provisions for general obligations, representations, collateral and events of default or termination. Under an ISDA Master Agreement, the Portfolio typically may offset with the counterparty certain OTC derivative financial instruments' payables and/or receivables with collateral held and/or posted and create one single net payment (close-out netting) in the event of default, termination and/or potential deterioration in the credit quality of the counterparty. Various Master Agreements govern the terms of certain transactions with counterparties, including transactions such as swap, forward, repurchase and reverse repurchase agreements. These Master Agreements typically attempt to reduce the counterparty risk associated with such transactions by specifying credit protection mechanisms and providing standardization that improves legal certainty. Cross-termination provisions under Master Agreements typically provide that a default in connection with one transaction between the Portfolio and a counterparty gives the non-defaulting party the right to terminate any other transactions in place with the defaulting party to create one single net payment due to/due from the defaulting party and may be a feature in certain Master Agreements. In the event the Portfolio exercises its right to terminate a Master Agreement after a counterparty experiences a termination event as defined in the Master Agreement, the return of collateral with market value in
23
Morgan Stanley Institutional Fund, Inc.
Annual Report — December 31, 2015
Notes to Financial Statements (cont'd)
excess of the Portfolio's net liability may be delayed or denied.
The following table presents derivative financial instruments that are subject to enforceable netting arrangements as of December 31, 2015.
Gross Amounts Not Offset in the Statement of Assets and Liabilities | |||||||||||||||||||
Counterparty | Gross Asset Derivatives Presented in Statement of Assets and Liabilities (000) | Financial Instrument (000) | Collateral Received (000) | Net Amount (not less than $0) (000) | |||||||||||||||
Royal Bank of Scotland | $ | 43 | $ | — | $ | — | $ | 43 | |||||||||||
For the year ended December 31, 2015, the approximate average monthly amount outstanding for each derivative type is as follows:
Call Options Purchased: | |||||||
Average monthly notional amount | 3,386,000 | ||||||
6. Securities Lending: The Portfolio lends securities to qualified financial institutions, such as broker-dealers, to earn additional income. Any increase or decrease in the fair value of the securities loaned that might occur and any interest earned or dividends declared on those securities during the term of the loan would remain in the Portfolio. The Portfolio would receive cash or securities as collateral in an amount equal to or exceeding 100% of the current fair value of the loaned securities. The collateral is marked-to-market daily by State Street Bank and Trust Company ("State Street"), the securities lending agent, to ensure that a minimum of 100% collateral coverage is maintained.
Based on pre-established guidelines, the securities lending agent invests any cash collateral that is received in anaffiliated money market portfolio and repurchase agreements. Securities lending income is generated from the earnings on the invested collateral and borrowing fees, less any rebates owed to the borrowers and compensation to the
lending agent, and is recorded as "Income from Securities Loaned-Net" in the Portfolio's Statement of Operations. Risks in securities lending transactions are that a borrower may not provide additional collateral when required or return the securities when due, and that the value of the short-term investments will be less than the amount of cash collateral plus any rebate that is required to be returned to the borrower.
The Portfolio has the right under the lending agreement to recover the securities from the borrower on demand.
The following table presents financial instruments that are subject to enforceable netting arrangements as of December 31, 2015.
Gross Amounts Not Offset in the Statement of Assets and Liabilities | |||||||||||||||
| Gross Asset Amounts Presented in Statement of Assets and Liabilities (000) | Financial Instrument (000) | Collateral Received (000) | Net Amount (not less than $0) (000) | ||||||||||||
| $ | 134 | (e) | $ | — | $ | (134 | )(f)(g) | $ | 0 | ||||||
(e) Represents market value of loaned securities at period end.
(f) The Portfolio received cash collateral of approximately $141,000, of which was subsequently invested in Repurchase Agreements and Morgan Stanley Institutional Liquidity Funds as reported in the Portfolio of Investments.
(g) The actual collateral received is greater than the amount shown here due to overcollateralization.
The Portfolio has adopted the disclosure provisions of FASB Accounting Standards Update No. 2014-11 ("ASU No. 2014-11"), "Transfers & Servicing (Topic 860): Repurchase-to-Maturity Transactions, Repurchase Financings, and Disclosures". ASU No. 2014-11 is intended to provide increased transparency about the types of collateral pledged in securities lending transactions and other similar transactions that are accounted for as secured borrowing.
The following table displays a breakdown of transactions accounted for as secured borrowings, the gross obligations by class of collateral pledged, and the remaining contractual maturity of those transactions as of December 31, 2015.
Remaining Contractual Maturity of the Agreements As of December 31, 2015 | |||||||||||||||||||||||
| Overnight and Continuous (000) | <30 days (000) | Between 30 & 90 days (000) | >90 days (000) | Total (000) | |||||||||||||||||||
Securities Lending Transactions | |||||||||||||||||||||||
Common Stocks | $ | 141 | $ | — | $ | — | $ | — | $ | 141 | |||||||||||||
Total Borrowings | $ | 141 | $ | — | $ | — | $ | — | $ | 141 | |||||||||||||
Gross amount of recognized liabilities for securities lending transactions | $ | 141 | |||||||||||||||||||||
24
Morgan Stanley Institutional Fund, Inc.
Annual Report — December 31, 2015
Notes to Financial Statements (cont'd)
7. Structured Investments: The Portfolio invested a portion of its assets in structured investments. A structured investment is a derivative security designed to offer a return linked to a particular underlying security, currency, commodity or market. Structured investments may come in various forms including notes (such as exchange-traded notes), warrants and options to purchase securities. The Portfolio will typically use structured investments to gain exposure to a permitted underlying security, currency, commodity or market when direct access to a market is limited or inefficient from a tax or cost standpoint. There can be no assurance that structured investments will trade at the same price or have the same value as the underlying security, currency, commodity or market. Investments in structured investments involve risks including issuer risk, counterparty risk and market risk. Holders of structured investments bear risks of the underlying investment and are subject to issuer or counterparty risk because the Portfolio is relying on the creditworthiness of such issuer or counterparty and has no rights with respect to the underlying investment. Certain structured investments may be thinly traded or have a limited trading market and may have the effect of increasing the Portfolio's illiquidity to the extent that the Portfolio, at a particular time, may be unable to find qualified buyers for these securities.
8. Restricted Securities: The Portfolio invests in unregistered or otherwise restricted securities. The term "restricted securities" refers to securities that are unregistered or are held by control persons of the issuer and securities that are subject to contractual restrictions on their resale. As a result, restricted securities may be more difficult to value and the Portfolio may have difficulty disposing of such assets either in a timely manner or for a reasonable price. In order to dispose of an unregistered security, the Portfolio, where it has contractual rights to do so, may have to cause such security to be registered. A considerable period may elapse between the time the decision is made to sell the security and the time the security is registered so that the Portfolio could sell it. Contractual restrictions on the resale of securities vary in length and scope and are generally the result of a negotiation between the issuer and acquirer of the securities. The Portfolio would, in either case, bear market risks during that period. Restricted securities are identified in the Portfolio of Investments.
9. Redemption Fees: The Portfolio will assess a 2% redemption fee on Class I shares, Class A shares, Class L shares, Class C shares and Class IS shares, which is paid directly to the Portfolio, for shares redeemed or exchanged within thirty days of purchase, subject to certain exceptions. The redemption fee is designed to protect the Portfolio and
its remaining shareholders from the effects of short-term trading. These fees, if any, are included in the Statements of Changes in Net Assets.
10. Indemnifications: The Fund enters into contracts that contain a variety of indemnifications. The Fund's maximum exposure under these arrangements is unknown. However, the Fund has not had prior claims or losses pursuant to these contracts and expects the risk of loss to be remote.
11. Dividends and Distributions to Shareholders: Dividend income and distributions to shareholders are recorded on the ex-dividend date. Dividends from net investment income, if any, are declared and paid annually. Net realized capital gains, if any, are distributed at least annually.
12. Security Transactions, Income and Expenses: Security transactions are accounted for on the trade date (date the order to buy or sell is executed). Realized gains and losses on the sale of investment securities are determined on the specific identified cost method. Dividend income and other distributions are recorded on the ex-dividend date (except for certain foreign dividends which may be recorded as soon as the Portfolio is informed of such dividends) net of applicable withholding taxes. Interest income is recognized on the accrual basis except where collection is in doubt. Discounts are accreted and premiums are amortized over the life of the respective securities. Most expenses of the Fund can be directly attributed to a particular Portfolio. Expenses which cannot be directly attributed are apportioned among the Portfolios based upon relative net assets or other appropriate methods. Income, expenses (other than class specific expenses — distribution and shareholder services, transfer agency and sub transfer agency fees) and realized and unrealized gains or losses are allocated to each class of shares based upon their relative net assets.
B. Advisory Fees: The Adviser, a wholly-owned subsidiary of Morgan Stanley, provides the Portfolio with advisory services under the terms of an Investment Advisory Agreement, paid quarterly, at the annual rate based on the daily net assets as follows:
| First $1 billion | Over $1 billion | ||||||
| 0.90 | % | 0.85 | % | ||||
Effective July 1, 2015, the Portfolio's annual rate based on the daily net assets was reduced and is as follows:
| First $1 billion | Over $1 billion | ||||||
| 0.80 | % | 0.75 | % | ||||
For the year ended December 31, 2015, the advisory fee rate (net of waivers/rebate) was equivalent to an annual effective rate of 0.00% of the Portfolio's average daily net assets.
25
Morgan Stanley Institutional Fund, Inc.
Annual Report — December 31, 2015
Notes to Financial Statements (cont'd)
The Adviser has agreed to reduce its advisory fee and/or reimburse the Portfolio so that total annual portfolio operating expenses, excluding certain investment related expenses, taxes, interest and other extraordinary expenses (including litigation), will not exceed 1.15% for Class I shares, 1.50% for Class A shares, 2.00% for Class L shares, 2.25% for Class C shares and 1.09% for Class IS shares. Effective July 1, 2015, the Adviser has agreed to reduce its advisory fee and/or reimburse the Portfolio so that total annual portfolio operating expenses will not exceed 1.00% for Class I shares, 1.35% for Class A shares, 1.85% for Class L shares, 2.10% for Class C shares and 0.94% for Class IS shares. The fee waivers and/or expense reimbursements will continue for at least one year from the date of the Portfolio's prospectus or until such time as the Directors act to discontinue all or a portion of such waivers and/or reimbursements when they deem such action is appropriate. For the year ended December 31, 2015, approximately $214,000 of advisory fees were waived and approximately $31,000 of other expenses were reimbursed by the Adviser pursuant to this arrangement.
C. Administration Fees: The Adviser also serves as Administrator to the Fund and provides administrative services pursuant to an Administration Agreement for an annual fee, accrued daily and paid monthly, of 0.08% of the Portfolio's average daily net assets.
Under a Sub-Administration Agreement between the Administrator and State Street, State Street provides certain administrative services to the Fund. For such services, the Administrator pays State Street a portion of the fee the Administrator receives from the Portfolio.
D. Distribution and Shareholder Services Fees: Morgan Stanley Distribution, Inc. ("MSDI" or the "Distributor"), a wholly-owned subsidiary of the Adviser and an indirect subsidiary of Morgan Stanley, serves as the Fund's Distributor of Portfolio shares pursuant to a Distribution Agreement. The Fund has adopted a Shareholder Services Plan with respect to Class A shares pursuant to Rule 12b-1 under the Act. Under the Shareholder Services Plan, the Portfolio pays the Distributor a shareholder services fee, accrued daily and paid monthly, at an annual rate of 0.25% of the Portfolio's average daily net assets attributable to Class A shares.
The Fund has adopted a Distribution and Shareholder Services Plan with respect to Class L shares pursuant to Rule 12b-1 under the Act. Under the Distribution and Shareholder Services Plan, the Portfolio pays the Distributor a distribution fee, accrued daily and paid monthly, at an annual rate of 0.50% and a shareholder services fee, accrued daily and paid monthly, at
an annual rate of 0.25% of the Portfolio's average daily net assets attributable to Class L shares.
The Fund has adopted a Distribution and Shareholder Services Plan with respect to Class C shares pursuant to Rule 12b-1 under the Act. Under the Distribution and Shareholder Services Plan, the Portfolio pays the Distributor a distribution fee, accrued daily and paid monthly, at an annual rate of 0.75% and a shareholder services fee, accrued daily and paid monthly, at an annual rate of 0.25% of the Portfolio's average daily net assets attributable to Class C shares.
The distribution and shareholder services fees are used to support the expenses associated with servicing and maintaining accounts. The Distributor may compensate other parties for providing shareholder support services to investors who purchase Class A, Class L and Class C shares.
E. Dividend Disbursing and Transfer Agent: The Fund's dividend disbursing and transfer agent is Boston Financial Data Services, Inc. ("BFDS"). Pursuant to a Transfer Agency Agreement, the Fund pays BFDS a fee based on the number of classes, accounts and transactions relating to the Portfolios of the Fund.
F. Custodian Fees: State Street (the "Custodian") serves as Custodian for the Fund in accordance with a Custodian Agreement. The Custodian holds cash, securities, and other assets of the Fund as required by the Act. Custody fees are payable monthly based on assets held in custody, investment purchases and sales activity and account maintenance fees, plus reimbursement for certain out-of-pocket expenses.
G. Security Transactions and Transactions with Affiliates: For the year ended December 31, 2015, purchases and sales of investment securities for the Portfolio, other than long-term U.S. Government securities and short-term investments, were approximately $59,826,000 and $12,673,000, respectively. There were no purchases and sales of long-term U.S. Government securities for the year ended December 31, 2015.
The Portfolio invests in the Institutional Class of the Morgan Stanley Institutional Liquidity Funds (the "Liquidity Funds"), an open-end management investment company managed by the Adviser, both directly and as a portion of the securities held as collateral on loaned securities. Advisory fees paid by the Portfolio are reduced by an amount equal to its pro-rata share of the advisory and administration fees paid by the Portfolio due to its investment in the Liquidity Funds. For the year ended December 31, 2015, advisory fees paid were reduced by approximately $2,000 relating to the Portfolio's investment in the Liquidity Funds.
26
Morgan Stanley Institutional Fund, Inc.
Annual Report — December 31, 2015
Notes to Financial Statements (cont'd)
A summary of the Portfolio's transactions in shares of the Liquidity Funds during the year ended December 31, 2015 is as follows:
| Value December 31, 2014 (000) | Purchases at Cost (000) | Sales (000) | Dividend Income (000) | Value December 31, 2015 (000) | |||||||||||||||
| $ | 253 | $ | 47,667 | $ | 43,645 | $ | 3 | $ | 4,275 | ||||||||||
The Portfolio has an unfunded Deferred Compensation Plan (the "Compensation Plan"), which allows each independent Director to defer payment of all, or a portion, of the fees he or she receives for serving on the Board of Directors. Each eligible Director generally may elect to have the deferred amounts credited with a return equal to the total return on one or more of the Morgan Stanley funds that are offered as investment options under the Compensation Plan. Appreciation/depreciation and distributions received from these investments are recorded with an offsetting increase/decrease in the deferred compensation obligation and do not affect the NAV of the Portfolio.
H. Federal Income Taxes: It is the Portfolio's intention to continue to qualify as a regulated investment company and distribute all of its taxable and tax-exempt income. Accordingly, no provision for Federal income taxes is required in the financial statements.
The Portfolio may be subject to taxes imposed by countries in which it invests. Such taxes are generally based on income and/or capital gains earned or repatriated. Taxes are accrued based on net investment income, net realized gains and net unrealized appreciation as such income and/or gains are earned. Taxes may also be based on transactions in foreign currency and are accrued based on the value of investments denominated in such currency.
FASB ASC 740-10, "Income Taxes — Overall", sets forth a minimum threshold for financial statement recognition of the benefit of a tax position taken or expected to be taken in a tax return. Management has concluded there are no significant uncertain tax positions that would require recognition in the financial statements. If applicable, the Portfolio recognizes interest accrued related to unrecognized tax benefits in "Interest Expense" and penalties in "Other Expenses" in the Statement of Operations. The Portfolio files tax returns with the U.S. Internal Revenue Service, New York and various states. Generally, each of the tax years in the four-year period ended December 31, 2015, remains subject to examination by taxing authorities.
The tax character of distributions paid may differ from the character of distributions shown in the Statements of Changes in Net Assets due to short-term capital gains being treated as
ordinary income for tax purposes. The tax character of distributions paid during fiscal 2015 and 2014 was as follows:
| 2015 Distributions Paid From: | 2014 Distributions Paid From: | ||||||||||||||
| Ordinary Income (000) | Long-Term Capital Gain (000) | Ordinary Income (000) | Long-Term Capital Gain (000) | ||||||||||||
| $ | 96 | $ | 960 | $ | 102 | $ | 139 | ||||||||
The amount and character of income and gains to be distributed are determined in accordance with income tax regulations which may differ from GAAP. These book/tax differences are either considered temporary or permanent in nature.
Temporary differences are primarily due to differing book and tax treatments in the timing of the recognition of gains (losses) on certain investment transactions and the timing of the deductibility of certain expenses.
Permanent differences, primarily due to differing treatments of gains (losses) related to foreign currency transactions and a nondeductible expense, resulted in the following reclassifications among the components of net assets at December 31, 2015:
| Undistributed Net Investment Income (000) | Distributions in Excess of Net Realized Gain (000) | Paid-in- Capital (000) | |||||||||
| $ | 44 | $ | (43 | ) | $ | (1 | ) | ||||
At December 31, 2015, the components of distributable earnings for the Portfolio on a tax basis were as follows:
| Undistributed Ordinary Income (000) | Undistributed Long-Term Capital Gain (000) | ||||||
| $ | 20 | $ | — | ||||
Capital losses and specified ordinary losses, including currency losses, incurred after October 31 but within the taxable year are deemed to arise on the first day of the Portfolio's next taxable year. For the year ended December 31, 2015, the Portfolio deferred to January 1, 2016 for U.S. Federal income tax purposes the following losses:
| Post-October Currency and Specified Ordinary Losses (000) | Post-October Capital Losses (000) | ||||||
| $ | — | $ | 469 | ||||
I. Other: At December 31, 2015, the Portfolio had record owners of 10% or greater. Investment activities of these shareholders could have a material impact on the Portfolio. The aggregate percentage of such owners was 54.3%.
27
Morgan Stanley Institutional Fund, Inc.
Annual Report — December 31, 2015
Report of Independent Registered Public Accounting Firm
To the Shareholders and Board of Directors of
Morgan Stanley Institutional Fund, Inc. —
International Opportunity Portfolio
We have audited the accompanying statement of assets and liabilities, including the portfolio of investments, of International Opportunity Portfolio (one of the portfolios constituting Morgan Stanley Institutional Fund, Inc.) (the "Portfolio) as of December 31, 2015, and the related statement of operations for the year then ended, the statements of changes in net assets for each of the two years in the period then ended and the financial highlights for each of the years or periods indicated therein. These financial statements and financial highlights are the responsibility of the Portfolio's management. Our responsibility is to express an opinion on these financial statements and financial highlights based on our audits.
We conducted our audits in accordance with the standards of the Public Company Accounting Oversight Board (United States). Those standards require that we plan and perform the audit to obtain reasonable assurance about whether the financial statements and financial highlights are free of material misstatement. We were not engaged to perform an audit of the Portfolio's internal control over financial reporting. Our audits included consideration of internal control over financial reporting as a basis for designing audit procedures that are appropriate in the circumstances, but not for the purpose of expressing an opinion on the effectiveness of the Portfolio's internal control over financial reporting. Accordingly, we express no such opinion. An audit also includes examining, on a test basis, evidence supporting the amounts and disclosures in the financial statements and financial highlights, assessing the accounting principles used and significant estimates made by management, and evaluating the overall financial statement presentation. Our procedures included confirmation of securities owned as of December 31, 2015, by correspondence with the custodian and others or by other appropriate auditing procedures where replies from others were not received. We believe that our audits provide a reasonable basis for our opinion.
In our opinion, the financial statements and financial highlights referred to above present fairly, in all material respects, the financial position of International Opportunity Portfolio (one of the portfolios constituting Morgan Stanley Institutional Fund, Inc.) at December 31, 2015, the results of its operations for the year then ended, the changes in its net assets for each of the two years in the period then ended and the financial highlights for each of the years or periods indicated therein, in conformity with U.S. generally accepted accounting principles.

Boston, Massachusetts
February 26, 2016
28
Morgan Stanley Institutional Fund, Inc.
Annual Report — December 31, 2015
Federal Tax Notice (unaudited)
For Federal income tax purposes, the following information is furnished with respect to the distributions paid by the Portfolio during its taxable year ended December 31, 2015.
The Portfolio designated and paid approximately $960,000 as a long-term capital gain distribution.
For Federal income tax purposes, the following information is furnished with respect to the Portfolio's earnings for its taxable year ended December 31, 2015. When distributed, certain earnings may be subject to a maximum tax rate of 15% as provided for the Jobs and Growth Tax Relief Reconciliation Act of 2003. The Portfolio designated up to a maximum of approximately $117,000 as taxable at this lower rate.
The Portfolio intends to pass through foreign tax credits of approximately $21,000, and has derived income from sources within foreign countries amounting to approximately $248,000.
In January, the Portfolio provides tax information to shareholders for the preceding calendar year.
29
Morgan Stanley Institutional Fund, Inc.
Annual Report — December 31, 2015
U.S. Privacy Policy (unaudited)
AN IMPORTANT NOTICE CONCERNING OUR U.S. PRIVACY POLICY
This privacy notice describes the U.S. privacy policy of Morgan Stanley Distribution, Inc., and the Morgan Stanley family of mutual funds ("us", "our", "we").
We are required by federal law to provide you with notice of our U.S. privacy policy ("Policy"). This Policy applies to both our current and former clients unless we state otherwise and is intended for individual clients who purchase products or receive services from us for personal, family or household purposes. This Policy is not applicable to partnerships, corporations, trusts or other non-individual clients or account holders, nor is this Policy applicable to individuals who are either beneficiaries of a trust for which we serve as trustee or participants in an employee benefit plan administered or advised by us. This Policy is, however, applicable to individuals who select us to be a custodian of securities or assets in individual retirement accounts, 401(k) accounts, or accounts subject to the Uniform Gifts to Minors Act.
This notice sets out our business practices to protect your privacy; how we collect and share personal information about you; and how you can limit our sharing or certain uses by others of this information. We may amend this Policy at any time, and will inform you of any changes to our Policy as required by law.
WE RESPECT YOUR PRIVACY
We appreciate that you have provided us with your personal financial information and understand your concerns about your information. We strive to safeguard the information our clients entrust to us. Protecting the confidentiality and security of client information is an important part of how we conduct our business.
This notice describes what personal information we collect about you, how we collect it, when we may share it with others, and how certain others may use it. It discusses the steps you may take to limit our sharing of certain information about you with our affiliated companies, including, but not limited to our affiliated banking businesses, brokerage firms and credit service affiliates. It also discloses how you may limit our affiliates' use of shared information for marketing purposes.
Throughout this Policy, we refer to the nonpublic information that personally identifies you as "personal information." We also use the term "affiliated company" in this notice. An affiliated company is a company in our family of companies and includes companies with the Morgan Stanley name. These affiliated companies are financial institutions such as broker-dealers, banks, investment advisers and credit card issuers. We refer to any company that is not an affiliated company as a nonaffiliated third party. For purposes of Section 5 of this notice, and your ability to limit certain uses of personal information by our affiliates, this notice applies to the use of personal information by our affiliated companies.
1. WHAT PERSONAL INFORMATION DO WE COLLECT FROM YOU?
We may collect the following types of information about you: (i) information provided by you, including information from applications and other forms we receive from you, (ii) information about your transactions with us or our affiliates, (iii) information about your transactions with nonaffiliated third parties, (iv) information from consumer reporting agencies, (v) information obtained from our websites, and (vi) information obtained from other sources. For example:
• We collect information such as your name, address, e-mail address, telephone/fax numbers, assets, income and investment objectives through applications and other forms you submit to us.
• We may obtain information about account balances, your use of account(s) and the types of products and services you prefer to receive from us through your dealings and transactions with us and other sources.
• We may obtain information about your creditworthiness and credit history from consumer reporting agencies.
• We may collect background information from and through third-party vendors to verify representations you have made and to comply with various regulatory requirements.
2. WHEN DO WE DISCLOSE PERSONAL INFORMATION WE COLLECT ABOUT YOU?
We may disclose personal information we collect about you in each of the categories listed above to affiliated and nonaffiliated third parties.
30
Morgan Stanley Institutional Fund, Inc.
Annual Report — December 31, 2015
U.S. Privacy Policy (unaudited) (cont'd)
a. Information We Disclose to Affiliated Companies.
We may disclose personal information that we collect about you to our affiliated companies to manage your account(s) effectively, to service and process your transactions, and to let you know about products and services offered by us and affiliated companies, to manage our business, and as otherwise required or permitted by law. Offers for products and services from affiliated companies are developed under conditions designed to safeguard your personal information.
b. Information We Disclose to Third Parties.
We may disclose personal information that we collect about you to nonaffiliated third parties to provide marketing services on our behalf or to other financial institutions with whom we have joint marketing agreements. We may also disclose all of the information we collect to other nonaffiliated third parties for our everyday business purposes, such as to process transactions, maintain account(s), respond to court orders and legal investigations, report to credit bureaus, offer our own products and services, protect against fraud, for institutional risk control, to perform services on our behalf, and as otherwise required or permitted by law.
When we share personal information about you with a nonaffiliated third party, they are required to limit their use of personal information about you to the particular purpose for which it was shared and they are not allowed to share personal information about you with others except to fulfill that limited purpose or as may be permitted or required by law.
3. HOW DO WE PROTECT THE SECURITY AND CONFIDENTIALITY OF PERSONAL INFORMATION WE COLLECT ABOUT YOU?
We maintain physical, electronic and procedural security measures that comply with applicable law and regulations to help safeguard the personal information we collect about you. We have internal policies governing the proper handling of client information by employees. Third parties that provide support or marketing services on our behalf may also receive personal information about you, and we require them to adhere to appropriate security standards with respect to such information.
4. HOW CAN YOU LIMIT OUR SHARING CERTAIN PERSONAL INFORMATION ABOUT YOU WITH OUR AFFILIATED COMPANIES FOR ELIGIBILITY DETERMINATION?
By following the opt-out procedures in Section 6 below, you may limit the extent to which we share with our affiliated companies, personal information that was collected to determine your eligibility for products and services such as your credit reports and other information that you have provided to us or that we may obtain from third parties ("eligibility information"). Eligibility information does not include your identification information or personal information pertaining to our transactions or experiences with you. Please note that, even if you direct us not to share eligibility information with our affiliated companies, we may still share your personal information, including eligibility information, with our affiliated companies under circumstances that are permitted under applicable law, such as to process transactions or to service your account.
5. HOW CAN YOU LIMIT THE USE OF CERTAIN PERSONAL INFORMATION ABOUT YOU BY OUR AFFILIATED COMPANIES FOR MARKETING?
By following the opt-out instructions in Section 6 below, you may limit our affiliated companies from marketing their products or services to you based on personal information we disclose to them. This information may include, for example, your income and account history with us. Please note that, even if you choose to limit our affiliated companies from using personal information about you that we may share with them for marketing their products and services to you, our affiliated companies may use your personal information that they obtain from us to market to you in circumstances permitted by law, such as if the affiliated party has its own relationship with you.
31
Morgan Stanley Institutional Fund, Inc.
Annual Report — December 31, 2015
U.S. Privacy Policy (unaudited) (cont'd)
6. HOW CAN YOU SEND US AN OPT-OUT INSTRUCTION?
If you wish to limit our sharing of eligibility information about you with our affiliated companies, or our affiliated companies' use of personal information for marketing purposes, as described in this notice, you may do so by:
• Calling us at (800) 548-7786
Monday–Friday between 8a.m. and 6p.m. (EST)
• Writing to us at the following address:
Boston Financial Data Services, Inc.
c/o Privacy Coordinator
P.O. Box 219804
Kansas City, Missouri 64121
If you choose to write to us, your request should include: your name, address, telephone number and account number(s) to which the opt-out applies and whether you are opting out with respect to sharing of eligibility information (Section 4 above), or information used for marketing (Section 5 above), or both. Written opt-out requests should not be sent with any other correspondence. In order to process your request, we require that the request be provided by you directly and not through a third party. Once you have informed us about your privacy preferences, your opt-out preference will remain in effect with respect to this Policy (as it may be amended) until you notify us otherwise. If you are a joint account owner, we will accept instructions from any one of you and apply those instructions to the entire account.
Please understand that if you limit our sharing or our affiliated companies' use of personal information, you and any joint account holder(s) may not receive information about our affiliated companies' products and services, including products or services that could help you manage your financial resources and achieve your investment objectives.
If you have more than one account or relationship with us, please specify the accounts to which you would like us to apply your privacy choices. If you have accounts or relationships with our affiliates, you may receive multiple privacy policies from them, and will need to separately notify those companies of your privacy choices for those accounts or relationships.
7. WHAT IF AN AFFILIATED COMPANY BECOMES A NONAFFILIATED THIRD PARTY?
If, at any time in the future, an affiliated company becomes a nonaffiliated third party, further disclosures of personal information made to the former affiliated company will be limited to those described in Section 2(b) above relating to nonaffiliated third parties. If you elected under Section 6 to limit disclosures we make to affiliated companies, or use of personal information by affiliated companies, your election will not apply to use by any former affiliated company of your personal information in their possession once it becomes a nonaffiliated third party.
SPECIAL NOTICE TO RESIDENTS OF VERMONT
The following section supplements our Policy with respect to our individual clients who have a Vermont address and supersedes anything to the contrary in the above Policy with respect to those clients only.
The State of Vermont requires financial institutions to obtain your consent prior to sharing personal information that they collect about you with nonaffiliated third parties, or eligibility information with affiliated companies, other than in certain limited circumstances. Except as permitted by law, we will not share personal information we collect about you with nonaffiliated third parties or eligibility information with affiliated companies, unless you provide us with your written consent to share such information.
SPECIAL NOTICE TO RESIDENTS OF CALIFORNIA
The following section supplements our Policy with respect to our individual clients who have a California address and supersedes anything to the contrary in the above Policy with respect to those clients only.
In response to a California law, if your account has a California home address, your personal information will not be disclosed to nonaffiliated third parties except as permitted by applicable California law, and we will limit sharing such personal information with our affiliates to comply with California privacy laws that apply to us.
32
Morgan Stanley Institutional Fund, Inc.
Annual Report — December 31, 2015
Director and Officer Information (unaudited)
Independent Directors:
| Name, Age and Address of Independent Director | Positions(s) Held with Registrant | Length of Time Served* | Principal Occupation(s) During Past 5 Years and Other Relevant Professional Experience | Number of Portfolios in Fund Complex Overseen by Director** | Other Directorships Held by Independent Director*** | ||||||||||||||||||
| Frank L. Bowman (71) c/o Kramer Levin Naftalis & Frankel LLP Counsel to the Independent Directors 1177 Avenue of the Americas New York, NY 10036 | Director | Since August 2006 | President, Strategic Decisions, LLC (consulting) (since February 2009); Director or Trustee of various Morgan Stanley Funds (since August 2006); Chairperson of the Compliance and Insurance Committee (since October 2015); Formerly, Chairperson of the Insurance Sub-Committee of the Compliance and Insurance Committee (February 2007-December 2015); served as President and Chief Executive Officer of the Nuclear Energy Institute (policy organization) (February 2005-November 2008); retired as Admiral, U.S. Navy after serving over 38 years on active duty including 8 years as Director of the Naval Nuclear Propulsion Program in the Department of the Navy and the U.S. Department of Energy (1996-2004); served as Chief of Naval Personnel (July 1994-September 1996); and on the Joint Staff as Director of Political Military Affairs (June 1992-July1994); knighted as Honorary Knight Commander of the Most Excellent Order of the British Empire; awarded the Officier de l'Orde National du Mérite by the French Government; elected to the National Academy of Engineering (2009). | 98 | Director of BP p.l.c.; Director of Naval and Nuclear Technologies LLP; Director Emeritus of the Armed Services YMCA; Director of the U.S. Naval Submarine League; Member of the National Security Advisory Council of the Center for U.S. Global Engagement and a member of the CNA Military Advisory Board; Chairman of the Charity, J Street Cup Golf, Trustee of Fairhaven United Methodist Church; and Director of other various non-profit organizations. | ||||||||||||||||||
| Kathleen A. Dennis (62) c/o Kramer Levin Naftalis & Frankel LLP Counsel to the Independent Directors 1177 Avenue of the Americas New York, NY 10036 | Director | Since August 2006 | President, Cedarwood Associates (mutual fund and investment management consulting) (since July 2006); Chairperson of the Money Market and Alternatives Sub-Committee of the Investment Committee (since October 2006) and Director or Trustee of various Morgan Stanley Funds (since August 2006); formerly, Senior Managing Director of Victory Capital Management (1993-2006). | 98 | Director of various nonprofit organizations. | ||||||||||||||||||
| Nancy C. Everett (61) c/o Kramer Levin Naftalis & Frankel LLP Counsel to the Independent Directors 1177 Avenue of the Americas New York, NY 10036 | Director | Since January 2015 | Chief Executive Officer, Virginia Commonwealth University Investment Company (since November 2015); Owner, OBIR, LLC (investment management consulting) (since June 2014); formerly, Managing Director, BlackRock Inc. (February 2011-December 2013); and Chief Executive Officer, General Motors Asset Management (a/k/a Promark Global Advisors, Inc.) (June 2005-May 2010). | 98 | Member of Virginia Commonwealth University School of Business Foundation; formerly, Member of Virginia Commonwealth University Board of Visitors (2013-2015); Member of Committee on Directors for Emerging Markets Growth Fund, Inc. (2007-2010); Chairperson of Performance Equity Management, LLC (2006-2010); and Chairperson, GMAM Absolute Return Strategies Fund, LLC (2006-2010). | ||||||||||||||||||
33
Morgan Stanley Institutional Fund, Inc.
Annual Report — December 31, 2015
Director and Officer Information (unaudited) (cont'd)
Independent Directors: (cont'd)
| Name, Age and Address of Independent Director | Positions(s) Held with Registrant | Length of Time Served* | Principal Occupation(s) During Past 5 Years and Other Relevant Professional Experience | Number of Portfolios in Fund Complex Overseen by Director** | Other Directorships Held by Independent Director*** | ||||||||||||||||||
| Jakki L. Haussler (58) c/o Kramer Levin Naftalis & Frankel LLP Counsel to the Independent Directors 1177 Avenue of the Americas New York, NY 10036 | Director | Since January 2015 | Chairman and Chief Executive Officer, Opus Capital Group (since January 1996); and formerly, Director, Capvest Venture Fund, LP (May 2000-December 2011); Partner, Adena Ventures, LP (July 1999-December 2010); Director, The Victory Funds (February 2005-July 2008). | 98 | Director of Cincinnati Bell Inc. and Member, Audit Committee and Compensation Committee; Director of Northern Kentucky University Foundation and Member, Investment Committee; Member of Chase College of Law Transactional Law Practice Center Board of Advisors; Director of Best Transport; Chase College of Law Board of Visitors; formerly Member, University of Cincinnati Foundation Investment Committee; Member, Miami University Board of Visitors (2008-2011); Trustee of Victory Funds (2005-2008) and Chairman, Investment Committee (2007-2008) and Member, Service Provider Committee (2005-2008). | ||||||||||||||||||
| Dr. Manuel H. Johnson (67) c/o Johnson Smick International, Inc. 220 I Street, N.E. — Suite 200 Washington, D.C. 20002 | Director | Since July 1991 | Senior Partner, Johnson Smick International, Inc. (consulting firm); Chairperson of the Investment Committee (since October 2006) and Director or Trustee of various Morgan Stanley Funds (since July 1991); Co-Chairman and a founder of the Group of Seven Council (G7C) (international economic commission); formerly Chairperson of the Audit Committee (July 1991-September 2006), Vice Chairman of the Board of Governors of the Federal Reserve System and Assistant Secretary of the U.S. Treasury. | 100 | Director of NVR, Inc. (home construction). | ||||||||||||||||||
| Joseph J. Kearns (73) c/o Kearns & Associates LLC 23823 Malibu Road S-50-440 Malibu, CA 90265 | Director | Since August 1994 | President, Kearns & Associates LLC (investment consulting); Chairperson of the Audit Committee (since October 2006) and Director or Trustee of various Morgan Stanley Funds (since August 1994); formerly, Deputy Chairperson of the Audit Committee (July 2003-September 2006) and Chairperson of the Audit Committee of various Morgan Stanley Funds (since August 1994); CFO of the J. Paul Getty Trust. | 101 | Director of Electro Rent Corporation (equipment leasing). Prior to December 31, 2013, Director of The Ford Family Foundation. | ||||||||||||||||||
34
Morgan Stanley Institutional Fund, Inc.
Annual Report — December 31, 2015
Director and Officer Information (unaudited) (cont'd)
Independent Directors: (cont'd)
| Name, Age and Address of Independent Director | Positions(s) Held with Registrant | Length of Time Served* | Principal Occupation(s) During Past 5 Years and Other Relevant Professional Experience | Number of Portfolios in Fund Complex Overseen by Director** | Other Directorships Held by Independent Director*** | ||||||||||||||||||
| Michael F. Klein (57) c/o Kramer Levin Naftalis & Frankel LLP Counsel to the Independent Directors 1177 Avenue of the Americas New York, NY 10036 | Director | Since August 2006 | Managing Director, Aetos Capital, LLC (since March 2000); Co-President, Aetos Alternatives Management, LLC (since January 2004); and Co-Chief Executive Officer of Aetos Capital LLC (since August 2013); Chairperson of the Fixed Income Sub-Committee of the Investment Committee (since October 2006) and Director or Trustee of various Morgan Stanley Funds (since August 2006); formerly, Managing Director, Morgan Stanley & Co. Inc. and Morgan Stanley Dean Witter Investment Management, President, various Morgan Stanley Funds (June 1998-March 2000) and Principal, Morgan Stanley & Co. Inc. and Morgan Stanley Dean Witter Investment Management (August 1997-December 1999). | 97 | Director of certain investment funds managed or sponsored by Aetos Capital, LLC. Director of Sanitized AG and Sanitized Marketing AG (specialty chemicals). | ||||||||||||||||||
| Michael E. Nugent (79) 522 Fifth Avenue New York, NY 10036 | Chair of the Board and Director | Chair of the Boards since July 2006 and Director since July 1991 | Chair of the Boards of various Morgan Stanley Funds (since July 2006); Chairperson of the Closed-End Fund Committee (since June 2012) and Director or Trustee of various Morgan Stanley Funds (since July 1991); formerly, Chairperson of the Insurance Committee (until July 2006), General Partner, TriumphCapital, L.P. (private investment partnership) (1988-2013). | 100 | None. | ||||||||||||||||||
| W. Allen Reed (68) c/o Kramer Levin Naftalis & Frankel LLP Counsel to the Independent Directors 1177 Avenue of the Americas New York, NY 10036 | Director | Since August 2006 | Chairperson of the Equity Sub-Committee of the Investment Committee (since October 2006) and Director or Trustee of various Morgan Stanley Funds (since August 2006); formerly, President and CEO of General Motors Asset Management; Chairman and Chief Executive Officer of the GM Trust Bank and Corporate Vice President of General Motors Corporation (August 1994-December 2005). | 98 | Director of Legg Mason, Inc.; formerly Director of the Auburn University Foundation (2010-2015). | ||||||||||||||||||
| Fergus Reid (83) c/o Joe Pietryka, Inc. 85 Charles Colman Blvd. Pawling, NY 12564 | Director | Since June 1992 | Chairman, Joe Pietryka, Inc.; Chairperson of the Governance Committee and Director or Trustee of various Morgan Stanley Funds (since June 1992). | 100 | Formerly, Trustee and Director of certain investment companies in the JP Morgan Fund Complex managed by JP Morgan Investment Management Inc. (1987-2012). | ||||||||||||||||||
35
Morgan Stanley Institutional Fund, Inc.
Annual Report — December 31, 2015
Director and Officer Information (unaudited) (cont'd)
Interested Director:
| Name, Age and Address of Interested Director | Positions(s) Held with Registrant | Length of Time Served* | Principal Occupation(s) During Past 5 Years | Number of Portfolios in Fund Complex Overseen by Interested Director** | Other Directorships Held by Interested Director*** | ||||||||||||||||||
| James F. Higgins (68) One New York Plaza, New York, NY 10004 | Director | Since June 2000 | Director or Trustee of various Morgan Stanley Funds (since June 2000); Senior Advisor of Morgan Stanley (since August 2000). | 99 | Formerly, Director of AXA Financial, Inc. and AXA Equitable Life Insurance Company (2002-2011) and Director of AXA MONY Life Insurance Company and AXA MONY Life Insurance Company of America (2004-2011). | ||||||||||||||||||
* This is the earliest date the Director began serving the Morgan Stanley Funds. Each Director serves an indefinite term, until his or her successor is elected.
** The Fund Complex includes (as of December 31, 2015) all open-end and closed-end funds (including all of their portfolios) advised by Morgan Stanley Investment Management Inc. (the "Adviser") and any funds that have an adviser that is an affiliated person of the Adviser (including, but not limited to, Morgan Stanley AIP GP LP).
*** This includes any directorships at public companies and registered investment companies held by the Director at any time during the past five years.
Executive Officers:
Name, Age and Address of Executive Officer | Position(s) Held with Registrant | Length of Time Served**** | Principal Occupation(s) During Past 5 Years | ||||||||||||
| John H. Gernon (52) 522 Fifth Avenue New York, NY 10036 | President and Principal Executive Officer | Since September 2013 | President and Principal Executive Officer of the Equity and Fixed Income Funds and the Morgan Stanley AIP Funds (since September 2013) and the Liquidity Funds and various money market funds (since May 2014) in the Fund Complex, Managing Director of the Adviser; Head of Product (since 2006). | ||||||||||||
| Stefanie V. Chang Yu (49) 522 Fifth Avenue New York, NY 10036 | Chief Compliance Officer | Since December 1997 | Managing Director of the Adviser and various entities affiliated with the Adviser; Chief Compliance Officer of various Morgan Stanley Funds and the Adviser (since January 2014); formerly, Vice President of various Morgan Stanley Funds (December 1997-January 2014). | ||||||||||||
| Joseph C. Benedetti (50) 522 Fifth Avenue New York, NY 10036 | Vice President | Since January 2014 | Managing Director of the Adviser and various entities affiliated with the Adviser; Vice President of various Morgan Stanley Funds (since January 2014); formerly, Assistant Secretary of various Morgan Stanley Funds (October 2004-January 2014). | ||||||||||||
| Francis J. Smith (50) 522 Fifth Avenue New York, NY 10036 | Treasurer and Principal Financial Officer | Treasurer since July 2003 and Principal Financial Officer since September 2002 | Executive Director of the Adviser and various entities affiliated with the Adviser; Treasurer (since July 2003) and Principal Financial Officer of various Morgan Stanley Funds (since September 2002). | ||||||||||||
| Mary E. Mullin (48) 522 Fifth Avenue New York, NY 10036 | Secretary | Since June 1999 | Executive Director of the Adviser; Secretary of various Morgan Stanley Funds (since June 1999). | ||||||||||||
**** This is the earliest date the officer began serving the Morgan Stanley Funds. Each officer serves a one-year term, until his or her successor is elected and has qualified.
36
Morgan Stanley Institutional Fund, Inc.
Annual Report — December 31, 2015
Adviser and Administrator
Morgan Stanley Investment Management Inc.
522 Fifth Avenue
New York, New York 10036
Distributor
Morgan Stanley Distribution, Inc.
522 Fifth Avenue
New York, New York 10036
Dividend Disbursing and Transfer Agent
Boston Financial Data Services, Inc.
2000 Crown Colony Drive
Quincy, Massachusetts 02169
Custodian
State Street Bank and Trust Company
One Lincoln Street
Boston, Massachusetts 02111
Legal Counsel
Dechert LLP
1095 Avenue of the Americas
New York, New York 10036
Counsel to the Independent Directors
Kramer Levin Naftalis & Frankel LLP
1177 Avenue of the Americas
New York, New York 10036
Independent Registered Public Accounting Firm
Ernst & Young LLP
200 Clarendon Street
Boston, Massachusetts 02116
Reporting to Shareholders
Each Morgan Stanley fund provides a complete schedule of portfolio holdings in its semi-annual and annual reports within 60 days of the end of the fund's second and fourth fiscal quarters. The semi-annual and annual reports are filed electronically with the Securities and Exchange Commission (SEC) on Form N-CSRS and Form N-CSR, respectively. Morgan Stanley also delivers the semi-annual and annual reports to fund shareholders and makes these reports available on its public website, www.morganstanley.com/im. Each Morgan Stanley fund also files a complete schedule of portfolio holdings with the SEC for the fund's first and third fiscal quarters on Form N-Q. Morgan Stanley does not deliver the reports for the first and third fiscal quarters to shareholders, nor are the reports posted to the Morgan Stanley public website. You may, however, obtain the Form N-Q filings (as well as the Form N-CSR and N-CSRS filings) by accessing the SEC's website, www.sec.gov. You may also review and copy them at the SEC's Public Reference Room in Washington, DC. Information on the operation of the SEC's Public Reference Room may be obtained by calling the SEC toll free at 1 (800) SEC-0330. You can also request copies of these materials, upon payment of a duplicating fee, by electronic request at the SEC's email address (publicinfo@sec.gov) or by writing the Public Reference Room of the SEC, Washington, DC 20549-0102.
Proxy Voting Policies and Procedures and Proxy Voting Record
You may obtain a copy of the Fund's Proxy Voting Policy and Procedures and information regarding how the Fund voted proxies relating to portfolio securities during the most recent twelve-month period ended June 30, without charge, upon request, by calling toll free 1 (800) 548-7786 or by visiting our website at www.morganstanley.com/im. This information is also available on the SEC's website at www.sec.gov.
This report is authorized for distribution only when preceded or accompanied by a prospectus of the Morgan Stanley Institutional Fund, Inc., which describes in detail each Portfolio's investment policies, risks, fees and expenses. Please read the prospectus carefully before you invest or send money. For additional information, including information regarding the investments comprising the Portfolio, please visit our website at www.morganstanley.com/im or call toll free 1 (800) 548-7786.
37
Printed in U.S.A.
This Report has been prepared for shareholders and may be distributed to others only if preceded or accompanied by a current prospectus.
Morgan Stanley Investment Management Inc.
522 Fifth Avenue
New York, New York 10036
© 2016 Morgan Stanley. Morgan Stanley Distribution, Inc.

IFIIIOANN
1406437 EXP. 02.28.17
INVESTMENT MANAGEMENT

Morgan Stanley Institutional Fund, Inc.
Advantage Portfolio
Annual Report
December 31, 2015

Morgan Stanley Institutional Fund, Inc.
Annual Report — December 31, 2015
Table of Contents
Shareholders' Letter | 2 | ||||||
Expense Example | 3 | ||||||
Investment Overview | 4 | ||||||
Portfolio of Investments | 7 | ||||||
Statement of Assets and Liabilities | 9 | ||||||
Statement of Operations | 11 | ||||||
Statements of Changes in Net Assets | 12 | ||||||
Financial Highlights | 14 | ||||||
Notes to Financial Statements | 19 | ||||||
Report of Independent Registered Public Accounting Firm | 27 | ||||||
Federal Tax Notice | 28 | ||||||
U.S. Privacy Policy | 29 | ||||||
Director and Officer Information | 32 | ||||||
This report is authorized for distribution only when preceded or accompanied by prospectuses of the Morgan Stanley Institutional Fund, Inc. To receive a prospectus and/or statement of additional information (SAI), which contains more complete information such as investment objectives, charges, expenses, policies for voting proxies, risk considerations, and describes in detail each of the Portfolio's investment policies to the prospective investor, please call toll free 1 (800) 548-7786. Please read the prospectuses carefully before you invest or send money.
Additionally, you can access portfolio information including performance, characteristics, and investment team commentary through Morgan Stanley Investment Management's website: www.morganstanley.com/im.
Market forecasts provided in this report may not necessarily come to pass. There is no guarantee that any sectors mentioned will continue to perform as discussed herein or that securities in such sectors will be held by the Portfolio in the future. There is no assurance that a Portfolio will achieve its investment objective. Portfolios are subject to market risk, which is the possibility that market values of securities owned by the Portfolio will decline and, therefore, the value of the Portfolio's shares may be less than what you paid for them. Accordingly, you can lose money investing in this Portfolio. Please see the prospectus for more complete information on investment risks.
1
Morgan Stanley Institutional Fund, Inc.
Annual Report — December 31, 2015
Shareholders' Letter (unaudited)
Dear Shareholders,
We are pleased to provide this Annual report, in which you will learn how your investment in Advantage Portfolio (the "Portfolio") performed during the latest twelve-month period.
Morgan Stanley Investment Management is a client-centric, investor-led organization. Our global presence, intellectual capital, and breadth of products and services enable us to partner with investors to meet the evolving challenges of today's financial markets. We aim to deliver superior investment service and to empower our clients to make the informed decisions that help them reach their investment goals.
As always, we thank you for selecting Morgan Stanley Investment Management, and look forward to working with you in the months and years ahead.
Sincerely,

John H. Gernon
President and Principal Executive Officer
January 2016
2
Morgan Stanley Institutional Fund, Inc.
Annual Report — December 31, 2015
Expense Example (unaudited)
Advantage Portfolio
As a shareholder of the Portfolio, you incur two types of costs: (1) transactional costs; and (2) ongoing costs, including advisory fees, administration fees, distribution and shareholder services fees and other Portfolio expenses. This example is intended to help you understand your ongoing costs (in dollars) of investing in the Portfolio and to compare these costs with the ongoing costs of investing in other mutual funds.
This example is based on an investment of $1,000 invested at the beginning of the six-month period ended December 31, 2015 and held for the entire six-month period.
Actual Expenses
The table below provides information about actual account values and actual expenses. You may use the information in this table, together with the amount you invested, to estimate the expenses that you paid over the period. Simply divide your account value by $1,000 (for example, an $8,600 account value divided by $1,000 = 8.6), then multiply the result by the number in the table under the heading entitled "Actual Expenses Paid During Period" to estimate the expenses you paid on your account during this period.
Hypothetical Example for Comparison Purposes
The table below provides information about hypothetical account values and hypothetical expenses based on the Portfolio's actual expense ratio and an assumed rate of return of 5% per year before expenses, which is not the Portfolio's actual return. The hypothetical account values and expenses may not be used to estimate the actual ending account balance or expenses you paid for the period. You may use this information to compare the ongoing costs of investing in the Portfolio and other funds. To do so, compare this 5% hypothetical example with the 5% hypothetical examples that appear in the shareholder reports of the other funds.
Please note that the expenses shown in the table are meant to highlight your ongoing costs only and do not reflect any transactional costs, such as sales charges (loads). Therefore, the information for each class in the table is useful in comparing ongoing costs only, and will not help you determine the relative total costs of owning different funds. In addition, if these transactional costs were included, your costs would have been higher.
| Beginning Account Value 7/1/15 | Actual Ending Account Value 12/31/15 | Hypothetical Ending Account Value | Actual Expenses Paid During Period* | Hypothetical Expenses Paid During Period* | Net Expense Ratio During Period** | ||||||||||||||||||||||
Advantage Portfolio Class I | $ | 1,000.00 | $ | 1,058.90 | $ | 1,020.92 | $ | 4.41 | $ | 4.33 | 0.85 | % | |||||||||||||||
Advantage Portfolio Class A | 1,000.00 | 1,056.80 | 1,019.21 | 6.17 | 6.06 | 1.19 | |||||||||||||||||||||
Advantage Portfolio Class L | 1,000.00 | 1,058.00 | 1,020.21 | 5.14 | 5.04 | 0.99 | |||||||||||||||||||||
Advantage Portfolio Class C | 1,000.00 | 1,052.50 | 1,015.43 | 10.04 | 9.86 | 1.94 | |||||||||||||||||||||
Advantage Portfolio Class IS | 1,000.00 | 1,059.80 | 1,021.12 | 4.21 | 4.13 | 0.81 | |||||||||||||||||||||
* Expenses are calculated using each Portfolio Class' annualized net expense ratio (as disclosed), multiplied by the average account value over the period, and multiplied by 184/365 (to reflect the most recent one-half year period).
** Annualized.
3
Morgan Stanley Institutional Fund, Inc.
Annual Report — December 31, 2015
Investment Overview (unaudited)
Advantage Portfolio
The Portfolio seeks long-term capital appreciation.
Performance
For the year ended December 31, 2015 the Portfolio's Class I shares had a total return based on net asset value and reinvestment of distributions per share of 12.56%, net of fees. The Portfolio's Class I shares outperformed the Portfolio's benchmark, the Russell 1000® Growth Index (the "Index"), which returned 5.67%.
Factors Affecting Performance
• The broad stock market ended the 12-month period at nearly the same level where it started, masking the considerable gyrations stock prices endured in between. The anticipation of the U.S. Federal Reserve's (Fed) first rate increase, the persistent slide in commodity prices, and global economic weakness, especially in China, weighed on the market throughout the period. Although U.S. economic data were mixed throughout the period, the economy's slow recovery continued, sufficiently that the Fed decided in December to raise its main policy interest rate, after keeping it near zero since December 2008 to stimulate growth.
• Slowing corporate earnings growth and a record year for merger and acquisition deals dominated the business headlines. Falling oil and raw materials prices caused considerable tumult for share prices in the energy, materials and industrials sectors. Although expectations were that consumer-oriented companies would benefit from consumers spending less at the gas pump, the boost to discretionary spending disappointed as consumers tended to pocket the savings. The U.S. dollar's strength relative to other major currencies, propelled by the Fed's move to a tightening stance while other global central banks were easing, also hurt the profits of U.S. multinational companies. Their foreign sales are worth less when translated back into U.S. dollars, and overseas demand is crimped when U.S. products become more expensive.
• Although our focus remains on our bottom-up stock selection process, both stock selection and sector allocation had a strongly positive impact on relative performance during the period.
• The consumer discretionary sector contributed nearly all of the Portfolio's outperformance relative to the Index during this period. Performance was
led by a holding in an online retail and cloud computing leader. The company reported strong quarterly results, with revenue and profit growth in both its core retail business and its web services business ahead of Wall Street expectations. Given its brand and scale competitive advantages, we believe the company is well positioned to continue gaining market share.
• The Portfolio benefited to a much smaller degree from an underweight in the industrials sector, a lack of exposure to the energy and materials sectors, and stock selection in the financials and information technology sectors.
• Only two sectors detracted from relative performance during the period. The consumer staples sector was the larger detractor, driven primarily by unfavorable stock selection and a small relative loss from an underweight to the sector. A position in a leading single-serve coffee provider was the biggest drag on results in the sector. The company's poor execution around the launch of its 2.0 coffee brewer resulted in weaker-than-expected fundamentals, and both the price point and timeline to launch its new cold beverage system had also disappointed investors. Although the shares spiked in early December on news that the company agreed to be acquired by a privately held company at an 80 percent premium, the stock detracted from performance for the period overall.
• Stock selection in the health care sector was also disadvantageous to performance during the period. A specialty drug maker led the group lower, as its shares were plagued by growing drug pricing scrutiny across the industry, which we believe has largely been a function of a more politically sensitive environment ahead of the 2016 U.S. presidential elections. During October, the shares declined further due to allegations regarding its relationships and business practices with specialty pharmacies. We eliminated the position during the month, due to our assessment of the relative risk/reward profile.
Management Strategies
• There were no changes to our bottom-up investment process during the period. We continued to look for franchises with strong name recognition and sustainable competitive advantages.
4
Morgan Stanley Institutional Fund, Inc.
Annual Report — December 31, 2015
Investment Overview (unaudited) (cont'd)
Advantage Portfolio
We typically favor companies with rising returns on invested capital, above average business visibility, strong free cash flow generation and an attractive risk/reward profile. Our emphasis is on secular growth, and as a result short-term market events are not as meaningful in the stock selection process.
• The long-term investment horizon and conviction-weighted investment approach embraced by the team since 1998 can result in periods of performance deviation from the benchmark and peers, as was the case during this reporting period. Our team continues to focus on bottom-up stock selection and the long-term outlook for companies owned in the Portfolio; accordingly, we have had very little turnover in the Portfolio to date, as our ongoing work reaffirms our assessment of quality and competitive advantage in the names we own.

* Minimum Investment for Class I shares
** Commenced Operations on June 30, 2008.
In accordance with SEC regulations, the Portfolio's performance shown assumes that all recurring fees (including management fees) were deducted and all dividends and distributions were reinvested. The performance of Class A, L, C and IS shares will vary from the performance of Class I shares based upon their different inception dates and will be impacted by additional fees assessed to those classes (if applicable).
Performance Compared to the Russell 1000® Growth Index(1) and the Lipper Large-Cap Growth Funds Index(2)
| Period Ended December 31, 2015 Total Returns(3) | |||||||||||||||||||
Average Annual | |||||||||||||||||||
| One Year | Five Years | Ten Years | Since Inception(7) | ||||||||||||||||
| Portfolio — Class I Shares w/o sales charges(4) | 12.56 | % | 15.24 | % | — | 11.54 | % | ||||||||||||
| Portfolio — Class A Shares w/o sales charges(4) | 12.20 | 14.90 | — | 17.08 | |||||||||||||||
| Portfolio — Class A Shares with maximum 5.25% sales charges(4) | 6.28 | 13.67 | — | 15.96 | |||||||||||||||
| Portfolio — Class L Shares w/o sales charges(4) | 12.47 | 15.14 | — | 11.39 | |||||||||||||||
| Portfolio — Class C Shares w/o sales charges(6) | — | — | — | 3.91 | |||||||||||||||
| Portfolio — Class C Shares with maximum 1.00% deferred sales charges(6) | — | — | — | 2.96 | |||||||||||||||
| Portfolio — Class IS Shares w/o sales charges(5) | 12.65 | — | — | 15.56 | |||||||||||||||
Russell 1000® Growth Index | 5.67 | 13.53 | — | 10.00 | |||||||||||||||
Lipper Large-Cap Growth Funds Index | 5.61 | 12.17 | — | 8.55 | |||||||||||||||
Performance data quoted represents past performance, which is no guarantee of future results, and current performance may be lower or higher than the figures shown. Performance assumes that all dividends and distributions, if any, were reinvested. For the most recent month-end performance figures, please visit www.morganstanley.com/im. Investment return and principal value will fluctuate so that Portfolio shares, when redeemed, may be worth more or less than their original cost. Total returns do not reflect the deduction of taxes that a shareholder would pay on Portfolio distributions or the redemption of Portfolio shares. Returns for periods less than one year are not annualized. Performance of share classes will vary due to difference in sales charges and expenses.
(1) The Russell 1000® Growth Index measures the performance of the large-cap growth segment of the U.S. equity universe. It includes those Russell 1000® Index companies with higher price-to-book ratios and higher forecasted growth values. The Russell 1000® Index is an index of approximately 1,000 of the largest U.S. companies based on a combination of market capitalization and current index membership. The Index is unmanaged and its returns do not include any sales charges or fees. Such costs would lower performance. It is not possible to invest directly in an index.
(2) The Lipper Large-Cap Growth Funds Index is an equally weighted performance index of the largest qualifying funds (based on net assets) in the Lipper Large-Cap Growth Funds classification. The Index, which is adjusted for capital gains distributions and income dividends, is unmanaged and should not be considered an investment. There are currently 30 funds represented in this Index. As of the date of this report, the Portfolio was in the Lipper Large-Cap Growth Funds classification.
(3) Total returns for the Portfolio reflect fees waived and expenses reimbursed, if applicable, by the Adviser. Without such waivers and reimbursements, total returns would have been lower.
5
Morgan Stanley Institutional Fund, Inc.
Annual Report — December 31, 2015
Investment Overview (unaudited) (cont'd)
Advantage Portfolio
(4) On May 21, 2010, Class C and Class I shares of Van Kampen Core Growth Fund ("the Predecessor Fund") were reorganized into Class L and Class I shares of Morgan Stanley Advantage Portfolio ("the Portfolio"), respectively. Class L and Class I shares' returns of the Portfolio will differ from the Predecessor Fund as they have different expenses. Performance shown for the Portfolio's Class I and Class L shares reflects the performance of the shares of the Predecessor Fund for periods prior to May 21, 2010. The Class C and I shares of the Predecessor Fund commenced operations on June 30, 2008. Class P shares, which were renamed Class A shares effective September 9, 2013, commenced operations on May 21, 2010.
(5) Commenced offering on September 13, 2013.
(6) Commenced offering on April 30, 2015.
(7) For comparative purposes, average annual since inception returns listed for the Indexes refer to the inception date of Class I of the Portfolio, not the inception of the Index.
6
Morgan Stanley Institutional Fund, Inc.
Annual Report — December 31, 2015
Portfolio of Investments
Advantage Portfolio
Shares | Value (000) | ||||||||||
Common Stocks (87.9%) | |||||||||||
Aerospace & Defense (2.4%) | |||||||||||
United Technologies Corp. | 10,792 | $ | 1,037 | ||||||||
Beverages (4.1%) | |||||||||||
Brown-Forman Corp., Class B | 5,984 | 594 | |||||||||
Monster Beverage Corp. (a) | 8,157 | 1,215 | |||||||||
1,809 | |||||||||||
Diversified Financial Services (4.5%) | |||||||||||
Berkshire Hathaway, Inc., Class B (a) | 6,848 | 904 | |||||||||
McGraw Hill Financial, Inc. | 10,656 | 1,051 | |||||||||
1,955 | |||||||||||
Food & Staples Retailing (4.6%) | |||||||||||
Costco Wholesale Corp. | 3,612 | 584 | |||||||||
Walgreens Boots Alliance, Inc. | 16,631 | 1,416 | |||||||||
2,000 | |||||||||||
Food Products (11.0%) | |||||||||||
Hershey Co. (The) | 6,797 | 607 | |||||||||
Keurig Green Mountain, Inc. | 8,217 | 739 | |||||||||
Kraft Heinz Co. (The) | 8,590 | 625 | |||||||||
Mead Johnson Nutrition Co. | 14,763 | 1,166 | |||||||||
Mondelez International, Inc., Class A | 15,196 | 681 | |||||||||
Nestle SA ADR (Switzerland) | 13,582 | 1,011 | |||||||||
4,829 | |||||||||||
Hotels, Restaurants & Leisure (2.0%) | |||||||||||
Marriott International, Inc., Class A | 7,724 | 518 | |||||||||
Restaurant Brands International, Inc. | 9,563 | 357 | |||||||||
875 | |||||||||||
Household Products (1.4%) | |||||||||||
Colgate-Palmolive Co. | 9,085 | 605 | |||||||||
Information Technology Services (8.4%) | |||||||||||
Cognizant Technology Solutions Corp., Class A (a) | 5,656 | 340 | |||||||||
Mastercard, Inc., Class A | 18,210 | 1,773 | |||||||||
PayPal Holdings, Inc. (a) | 11,160 | 404 | |||||||||
Visa, Inc., Class A | 15,209 | 1,179 | |||||||||
3,696 | |||||||||||
Insurance (0.9%) | |||||||||||
Progressive Corp. (The) | 12,196 | 388 | |||||||||
Internet & Catalog Retail (8.6%) | |||||||||||
Amazon.com, Inc. (a) | 5,580 | 3,771 | |||||||||
Internet Software & Services (19.7%) | |||||||||||
Alibaba Group Holding Ltd. ADR (China) (a) | 5,447 | 443 | |||||||||
Alphabet, Inc., Class C (a) | 2,611 | 1,981 | |||||||||
eBay, Inc. (a) | 6,180 | 170 | |||||||||
Facebook, Inc., Class A (a) | 31,126 | 3,258 | |||||||||
LinkedIn Corp., Class A (a) | 7,480 | 1,683 | |||||||||
Twitter, Inc. (a) | 47,923 | 1,109 | |||||||||
8,644 | |||||||||||
Life Sciences Tools & Services (2.1%) | |||||||||||
Thermo Fisher Scientific, Inc. | 6,415 | 910 | |||||||||
Shares | Value (000) | ||||||||||
Media (4.3%) | |||||||||||
Charter Communications, Inc., Class A (a) | 2,046 | $ | 375 | ||||||||
Naspers Ltd., Class N (South Africa) | 4,288 | 586 | |||||||||
Walt Disney Co. (The) | 8,923 | 938 | |||||||||
1,899 | |||||||||||
Personal Products (1.4%) | |||||||||||
Estee Lauder Cos., Inc. (The), Class A | 7,000 | 616 | |||||||||
Pharmaceuticals (2.8%) | |||||||||||
Zoetis, Inc. | 25,738 | 1,233 | |||||||||
Specialty Retail (2.3%) | |||||||||||
TJX Cos., Inc. (The) | 14,018 | 994 | |||||||||
Tech Hardware, Storage & Peripherals (5.0%) | |||||||||||
Apple, Inc. | 20,917 | 2,202 | |||||||||
Textiles, Apparel & Luxury Goods (2.4%) | |||||||||||
Christian Dior SE (France) | 4,609 | 783 | |||||||||
Michael Kors Holdings Ltd. (a) | 7,057 | 283 | |||||||||
1,066 | |||||||||||
Total Common Stocks (Cost $32,155) | 38,529 | ||||||||||
| Notional Amount | |||||||||||
Call Option Purchased (0.2%) | |||||||||||
Foreign Currency Option (0.2%) | |||||||||||
| USD/CNY June 2016 @ CNY 6.70, Royal Bank of Scotland (Cost $19) | 4,812,538 | 83 | |||||||||
Shares | |||||||||||
Short-Term Investment (7.7%) | |||||||||||
Investment Company (7.7%) | |||||||||||
| Morgan Stanley Institutional Liquidity Funds — Money Market Portfolio — Institutional Class (See Note G) (Cost $3,368) | 3,368,326 | 3,368 | |||||||||
Total Investments (95.8%) (Cost $35,542) (b)(c) | 41,980 | ||||||||||
Other Assets in Excess of Liabilities (4.2%) | 1,834 | ||||||||||
Net Assets (100.0%) | $ | 43,814 | |||||||||
(a) Non-income producing security.
(b) The approximate fair value and percentage of net assets, $1,369,000 and 3.1%, respectively, represent the securities that have been fair valued under the fair valuation policy for international investments as described in Note A-1 within the Notes to the Financial Statements.
(c) At December 31, 2015, the aggregate cost for Federal income tax purposes is approximately $35,702,000. The aggregate gross unrealized appreciation is approximately $7,522,000 and the aggregate gross unrealized depreciation is approximately $1,244,000 resulting in net unrealized appreciation of approximately $6,278,000.
ADR American Depositary Receipt.
CNY — Chinese Yuan Renminbi
USD — United States Dollar
The accompanying notes are an integral part of the financial statements.
7
Morgan Stanley Institutional Fund, Inc.
Annual Report — December 31, 2015
Portfolio of Investments (cont'd)
Advantage Portfolio
Portfolio Composition
Classification | Percentage of Total Investments | ||||||
Other* | 36.9 | % | |||||
Internet Software & Services | 20.6 | ||||||
Food Products | 11.5 | ||||||
Internet & Catalog Retail | 9.0 | ||||||
Information Technology Services | 8.8 | ||||||
Short-Term Investment | 8.0 | ||||||
Tech Hardware, Storage & Peripherals | 5.2 | ||||||
Total Investments | 100.0 | % | |||||
* Industries and/or investment types representing less than 5% of total investments.
The accompanying notes are an integral part of the financial statements.
8
Morgan Stanley Institutional Fund, Inc.
Annual Report — December 31, 2015
Advantage Portfolio
Statement of Assets and Liabilities | December 31, 2015 (000) | ||||||
Assets: | |||||||
Investments in Securities of Unaffiliated Issuers, at Value (Cost $32,174) | $ | 38,612 | |||||
Investment in Security of Affiliated Issuer, at Value (Cost $3,368) | 3,368 | ||||||
Total Investments in Securities, at Value (Cost $35,542) | 41,980 | ||||||
Foreign Currency, at Value (Cost —@) | — | @ | |||||
Receivable for Portfolio Shares Sold | 1,840 | ||||||
Dividends Receivable | 22 | ||||||
Due from Adviser | 9 | ||||||
Receivable from Affiliate | — | @ | |||||
Other Assets | 33 | ||||||
Total Assets | 43,884 | ||||||
Liabilities: | |||||||
Payable for Professional Fees | 23 | ||||||
Payable for Portfolio Shares Redeemed | 17 | ||||||
Payable for Sub Transfer Agency Fees — Class I | 2 | ||||||
Payable for Sub Transfer Agency Fees — Class A | 1 | ||||||
Payable for Sub Transfer Agency Fees — Class L | 3 | ||||||
Payable for Sub Transfer Agency Fees — Class C | — | @ | |||||
Payable for Custodian Fees | 6 | ||||||
Payable for Shareholder Services Fees — Class A | 2 | ||||||
Payable for Distribution and Shareholder Services Fees — Class L | — | @ | |||||
Payable for Distribution and Shareholder Services Fees — Class C | 1 | ||||||
Payable for Administration Fees | 3 | ||||||
Payable for Transfer Agency Fees — Class I | — | @ | |||||
Payable for Transfer Agency Fees — Class A | 1 | ||||||
Payable for Transfer Agency Fees — Class L | — | @ | |||||
Payable for Transfer Agency Fees — Class C | — | @ | |||||
Other Liabilities | 11 | ||||||
Total Liabilities | 70 | ||||||
Net Assets | $ | 43,814 | |||||
Net Assets Consist Of: | |||||||
Paid-in-Capital | $ | 36,349 | |||||
Accumulated Net Investment Loss | (10 | ) | |||||
Accumulated Net Realized Gain | 1,037 | ||||||
Unrealized Appreciation (Depreciation) on: | |||||||
Investments | 6,438 | ||||||
Foreign Currency Translations | (— | @) | |||||
Net Assets | $ | 43,814 | |||||
The accompanying notes are an integral part of the financial statements.
9
Morgan Stanley Institutional Fund, Inc.
Annual Report — December 31, 2015
Advantage Portfolio
Statement of Assets and Liabilities (cont'd) | December 31, 2015 (000) | ||||||
CLASS I: | |||||||
Net Assets | $ | 24,718 | |||||
| Shares Outstanding $0.001 par value shares of beneficial interest (unlimited shares authorized) (not in 000's) | 1,420,260 | ||||||
Net Asset Value, Offering and Redemption Price Per Share | $ | 17.40 | |||||
CLASS A: | |||||||
Net Assets | $ | 11,939 | |||||
| Shares Outstanding $0.001 par value shares of beneficial interest (unlimited shares authorized) (not in 000's) | 693,413 | ||||||
Net Asset Value, Redemption Price Per Share | $ | 17.22 | |||||
Maximum Sales Load | 5.25 | % | |||||
Maximum Sales Charge | $ | 0.95 | |||||
Maximum Offering Price Per Share | $ | 18.17 | |||||
CLASS L: | |||||||
Net Assets | $ | 5,369 | |||||
| Shares Outstanding $0.001 par value shares of beneficial interest (unlimited shares authorized) (not in 000's) | 308,652 | ||||||
Net Asset Value, Offering and Redemption Price Per Share | $ | 17.40 | |||||
CLASS C: | |||||||
Net Assets | $ | 1,776 | |||||
| Shares Outstanding $0.001 par value shares of beneficial interest (unlimited shares authorized) (not in 000's) | 102,913 | ||||||
Net Asset Value, Offering and Redemption Price Per Share | $ | 17.25 | |||||
CLASS IS: | |||||||
Net Assets | $ | 12 | |||||
| Shares Outstanding $0.001 par value shares of beneficial interest (unlimited shares authorized) (not in 000's) | 685 | ||||||
Net Asset Value, Offering and Redemption Price Per Share | $ | 17.42 | |||||
@ Amount is less than $500.
The accompanying notes are an integral part of the financial statements.
10
Morgan Stanley Institutional Fund, Inc.
Annual Report — December 31, 2015
Advantage Portfolio
Statement of Operations | Year Ended December 31, 2015 (000) | ||||||
Investment Income: | |||||||
Dividends from Securities of Unaffiliated Issuers (Net of $7 of Foreign Taxes Withheld) | $ | 306 | |||||
Dividends from Security of Affiliated Issuer (Note G) | 3 | ||||||
Total Investment Income | 309 | ||||||
Expenses: | |||||||
Advisory Fees (Note B) | 225 | ||||||
Professional Fees | 106 | ||||||
Shareholder Services Fees — Class A (Note D) | 17 | ||||||
Distribution and Shareholder Services Fees — Class L (Note D) | 51 | ||||||
Distribution and Shareholder Services Fees — Class C (Note D) | 4 | ||||||
Registration Fees | 57 | ||||||
Shareholder Reporting Fees | 29 | ||||||
Administration Fees (Note C) | 27 | ||||||
Sub Transfer Agency Fees — Class I | 8 | ||||||
Sub Transfer Agency Fees — Class A | 9 | ||||||
Sub Transfer Agency Fees — Class L | 8 | ||||||
Sub Transfer Agency Fees — Class C | — | @ | |||||
Custodian Fees (Note F) | 18 | ||||||
Transfer Agency Fees — Class I (Note E) | 2 | ||||||
Transfer Agency Fees — Class A (Note E) | 4 | ||||||
Transfer Agency Fees — Class L (Note E) | 2 | ||||||
Transfer Agency Fees — Class C (Note E) | 1 | ||||||
Transfer Agency Fees — Class IS (Note E) | 2 | ||||||
Pricing Fees | 3 | ||||||
Directors' Fees and Expenses | 1 | ||||||
Other Expenses | 23 | ||||||
Total Expenses | 597 | ||||||
Waiver of Advisory Fees (Note B) | (209 | ) | |||||
Distribution Fees — Class L Shares Waived (Note D) | (49 | ) | |||||
Reimbursement of Class Specific Expenses — Class I (Note B) | (2 | ) | |||||
Reimbursement of Class Specific Expenses — Class A (Note B) | (4 | ) | |||||
Reimbursement of Class Specific Expenses — Class L (Note B) | (2 | ) | |||||
Reimbursement of Class Specific Expenses — Class C (Note B) | (1 | ) | |||||
Reimbursement of Class Specific Expenses — Class IS (Note B) | (2 | ) | |||||
Rebate from Morgan Stanley Affiliate (Note G) | (2 | ) | |||||
Net Expenses | 326 | ||||||
Net Investment Loss | (17 | ) | |||||
Realized Gain: | |||||||
Investments Sold | 3,973 | ||||||
Foreign Currency Transactions | 1 | ||||||
Net Realized Gain | 3,974 | ||||||
Change in Unrealized Appreciation (Depreciation): | |||||||
Investments | (475 | ) | |||||
Foreign Currency Translations | — | @ | |||||
Net Change in Unrealized Appreciation (Depreciation) | (475 | ) | |||||
Net Realized Gain and Change in Unrealized Appreciation (Depreciation) | 3,499 | ||||||
Net Increase in Net Assets Resulting from Operations | $ | 3,482 | |||||
@ Amount is less than $500.
The accompanying notes are an integral part of the financial statements.
11
Morgan Stanley Institutional Fund, Inc.
Annual Report — December 31, 2015
Advantage Portfolio
Statements of Changes in Net Assets | Year Ended December 31, 2015 (000) | Year Ended December 31, 2014 (000) | |||||||||
Increase (Decrease) in Net Assets: | |||||||||||
Operations: | |||||||||||
Net Investment Income (Loss) | $ | (17 | ) | $ | 39 | ||||||
Net Realized Gain | 3,974 | 1,140 | |||||||||
Net Change in Unrealized Appreciation (Depreciation) | (475 | ) | 716 | ||||||||
Net Increase in Net Assets Resulting from Operations | 3,482 | 1,895 | |||||||||
Distributions from and/or in Excess of: | |||||||||||
Class I: | |||||||||||
Net Investment Income | (18 | ) | (5 | ) | |||||||
Net Realized Gain | (1,736 | ) | (781 | ) | |||||||
Class A: | |||||||||||
Net Investment Income | — | — | |||||||||
Net Realized Gain | (866 | ) | (166 | ) | |||||||
Class L: | |||||||||||
Net Investment Income | — | (1 | ) | ||||||||
Net Realized Gain | (453 | ) | (267 | ) | |||||||
Class C: | |||||||||||
Net Investment Income | (— | @) | — | ||||||||
Net Realized Gain | (114 | ) | — | ||||||||
Class IS: | |||||||||||
Net Investment Income | (— | @) | (— | @) | |||||||
Net Realized Gain | (1 | ) | (1 | ) | |||||||
Total Distributions | (3,188 | ) | (1,221 | ) | |||||||
Capital Share Transactions:(1) | |||||||||||
Class I: | |||||||||||
Subscribed | 13,669 | 4,207 | |||||||||
Distributions Reinvested | 1,253 | 434 | |||||||||
Redeemed | (8,664 | ) | (1,822 | ) | |||||||
Class A: | |||||||||||
Subscribed | 11,449 | 2,507 | |||||||||
Distributions Reinvested | 864 | 166 | |||||||||
Redeemed | (3,697 | ) | (2,170 | ) | |||||||
Class L: | |||||||||||
Subscribed | 2,971 | 3,222 | |||||||||
Distributions Reinvested | 426 | 254 | |||||||||
Redeemed | (4,908 | ) | (967 | ) | |||||||
Class C: | |||||||||||
Subscribed | 1,907 | * | — | ||||||||
Distributions Reinvested | 113 | * | — | ||||||||
Redeemed | (133 | )* | — | ||||||||
Net Increase in Net Assets Resulting from Capital Share Transactions | 15,250 | 5,831 | |||||||||
Total Increase in Net Assets | 15,544 | 6,505 | |||||||||
Net Assets: | |||||||||||
Beginning of Period | 28,270 | 21,765 | |||||||||
| End of Period (Including Accumulated Net Investment Loss and Accumulated Undistributed Net Investment Income of $(10) and $22) | $ | 43,814 | $ | 28,270 | |||||||
The accompanying notes are an integral part of the financial statements.
12
Morgan Stanley Institutional Fund, Inc.
Annual Report — December 31, 2015
Advantage Portfolio
Statements of Changes in Net Assets (cont'd) | Year Ended December 31, 2015 (000) | Year Ended December 31,2014 (000) | |||||||||
(1) Capital Share Transactions: | |||||||||||
Class I: | |||||||||||
Shares Subscribed | 755 | 255 | |||||||||
Shares Issued on Distributions Reinvested | 71 | 27 | |||||||||
Shares Redeemed | (474 | ) | (111 | ) | |||||||
Net Increase in Class I Shares Outstanding | 352 | 171 | |||||||||
Class A: | |||||||||||
Shares Subscribed | 627 | 155 | |||||||||
Shares Issued on Distributions Reinvested | 50 | 10 | |||||||||
Shares Redeemed | (207 | ) | (133 | ) | |||||||
Net Increase in Class A Shares Outstanding | 470 | 32 | |||||||||
Class L: | |||||||||||
Shares Subscribed | 164 | 194 | |||||||||
Shares Issued on Distributions Reinvested | 24 | 16 | |||||||||
Shares Redeemed | (269 | ) | (59 | ) | |||||||
Net Increase (Decrease) in Class L Shares Outstanding | (81 | ) | 151 | ||||||||
Class C: | |||||||||||
Shares Subscribed | 104 | * | — | ||||||||
Shares Issued on Distributions Reinvested | 7 | * | — | ||||||||
Shares Redeemed | (8 | )* | — | ||||||||
Net Increase in Class C Shares Outstanding | 103 | — | |||||||||
@ Amount is less than $500.
* For the period April 30, 2015 through December 31, 2015.
The accompanying notes are an integral part of the financial statements.
13
Morgan Stanley Institutional Fund, Inc.
Annual Report — December 31, 2015
Financial Highlights
Advantage Portfolio
Class I | |||||||||||||||||||||||
Year Ended December 31, | |||||||||||||||||||||||
Selected Per Share Data and Ratios | 2015 | 2014 | 2013 | 2012 | 2011 | ||||||||||||||||||
Net Asset Value, Beginning of Period | $ | 16.83 | $ | 16.41 | $ | 12.40 | $ | 11.38 | $ | 10.87 | |||||||||||||
Income from Investment Operations: | |||||||||||||||||||||||
Net Investment Income† | 0.01 | 0.04 | 0.01 | 0.14 | 0.04 | ||||||||||||||||||
Net Realized and Unrealized Gain | 2.11 | 1.15 | 4.54 | 1.72 | 0.54 | ||||||||||||||||||
Total from Investment Operations | 2.12 | 1.19 | 4.55 | 1.86 | 0.58 | ||||||||||||||||||
Distributions from and/or in Excess of: | |||||||||||||||||||||||
Net Investment Income | (0.02 | ) | (0.01 | ) | — | (0.10 | ) | (0.07 | ) | ||||||||||||||
Net Realized Gain | (1.53 | ) | (0.76 | ) | (0.54 | ) | (0.74 | ) | — | ||||||||||||||
Total Distributions | (1.55 | ) | (0.77 | ) | (0.54 | ) | (0.84 | ) | (0.07 | ) | |||||||||||||
Net Asset Value, End of Period | $ | 17.40 | $ | 16.83 | $ | 16.41 | $ | 12.40 | $ | 11.38 | |||||||||||||
Total Return++ | 12.56 | % | 7.43 | % | 37.11 | % | 16.38 | % | 5.33 | % | |||||||||||||
Ratios and Supplemental Data: | |||||||||||||||||||||||
Net Assets, End of Period (Thousands) | $ | 24,718 | $ | 17,971 | $ | 14,712 | $ | 8,595 | $ | 7,239 | |||||||||||||
Ratio of Expenses to Average Net Assets (1) | 0.86 | %+^ | 1.04 | %+ | 1.04 | %+ | 1.05 | %+ | 1.05 | %+ | |||||||||||||
Ratio of Net Investment Income to Average Net Assets (1) | 0.06 | %+ | 0.23 | %+ | 0.11 | %+ | 1.08 | %+ | 0.39 | %+ | |||||||||||||
Ratio of Rebate from Morgan Stanley Affiliates to Average Net Assets | 0.00 | %§ | 0.01 | % | 0.01 | % | 0.00 | %§ | 0.00 | %§ | |||||||||||||
Portfolio Turnover Rate | 51 | % | 31 | % | 36 | % | 50 | % | 28 | % | |||||||||||||
(1) Supplemental Information on the Ratios to Average Net Assets: | |||||||||||||||||||||||
Ratios Before Expense Limitation: | |||||||||||||||||||||||
Expenses to Average Net Assets | 1.49 | % | 1.78 | % | 2.33 | % | 2.34 | % | 3.43 | % | |||||||||||||
Net Investment Loss to Average Net Assets | (0.57 | )% | (0.51 | )% | (1.18 | )% | (0.21 | )% | (1.99 | )% | |||||||||||||
† Per share amount is based on average shares outstanding.
++ Calculated based on the net asset value as of the last business day of the period.
+ The Ratios of Expenses and Net Investment Income reflect the rebate of certain Portfolio expenses in connection with the investments in Morgan Stanley affiliates during the period. The effect of the rebate on the ratios is disclosed in the above table as "Ratio of Rebate from Morgan Stanley Affiliates to Average Net Assets."
^ Effective January 23, 2015, the Adviser has agreed to limit the ratio of expenses to average net assets to the maximum of 0.85% for Class I shares. Prior to January 23, 2015, the maximum ratio was 1.05% for Class I shares.
§ Amount is less than 0.005%.
The accompanying notes are an integral part of the financial statements.
14
Morgan Stanley Institutional Fund, Inc.
Annual Report — December 31, 2015
Financial Highlights
Advantage Portfolio
Class A | |||||||||||||||||||||||
Year Ended December 31, | |||||||||||||||||||||||
Selected Per Share Data and Ratios | 2015 | 2014 | 2013 | 2012 | 2011 | ||||||||||||||||||
Net Asset Value, Beginning of Period | $ | 16.70 | $ | 16.34 | $ | 12.39 | $ | 11.37 | $ | 10.86 | |||||||||||||
Income (Loss) from Investment Operations: | |||||||||||||||||||||||
Net Investment Income (Loss)† | (0.06 | ) | (0.03 | ) | (0.07 | ) | 0.11 | 0.02 | |||||||||||||||
Net Realized and Unrealized Gain | 2.11 | 1.15 | 4.56 | 1.72 | 0.53 | ||||||||||||||||||
Total from Investment Operations | 2.05 | 1.12 | 4.49 | 1.83 | 0.55 | ||||||||||||||||||
Distributions from and/or in Excess of: | |||||||||||||||||||||||
Net Investment Income | — | — | — | (0.07 | ) | (0.04 | ) | ||||||||||||||||
Net Realized Gain | (1.53 | ) | (0.76 | ) | (0.54 | ) | (0.74 | ) | — | ||||||||||||||
Total Distributions | (1.53 | ) | (0.76 | ) | (0.54 | ) | (0.81 | ) | (0.04 | ) | |||||||||||||
Net Asset Value, End of Period | $ | 17.22 | $ | 16.70 | $ | 16.34 | $ | 12.39 | $ | 11.37 | |||||||||||||
Total Return++ | 12.20 | % | 7.05 | % | 36.65 | % | 16.11 | % | 5.07 | % | |||||||||||||
Ratios and Supplemental Data: | |||||||||||||||||||||||
Net Assets, End of Period (Thousands) | $ | 11,939 | $ | 3,738 | $ | 3,134 | $ | 12 | $ | 11 | |||||||||||||
Ratio of Expenses to Average Net Assets (1) | 1.18 | %+^^ | 1.39 | %+ | 1.35 | %+^ | 1.30 | %+ | 1.30 | %+ | |||||||||||||
Ratio of Net Investment Income (Loss) to Average Net Assets (1) | (0.31 | )%+ | (0.15 | )%+ | (0.44 | )%+ | 0.83 | %+ | 0.14 | %+ | |||||||||||||
Ratio of Rebate from Morgan Stanley Affiliates to Average Net Assets | 0.01 | % | 0.01 | % | 0.00 | %§ | 0.00 | %§ | 0.00 | %§ | |||||||||||||
Portfolio Turnover Rate | 51 | % | 31 | % | 36 | % | 50 | % | 28 | % | |||||||||||||
(1) Supplemental Information on the Ratios to Average Net Assets: | |||||||||||||||||||||||
Ratios Before Expense Limitation: | |||||||||||||||||||||||
Expenses to Average Net Assets | 1.87 | % | 2.14 | % | 2.68 | % | 2.59 | % | 3.68 | % | |||||||||||||
Net Investment Loss to Average Net Assets | (1.00 | )% | (0.90 | )% | (1.77 | )% | (0.46 | )% | (2.24 | )% | |||||||||||||
† Per share amount is based on average shares outstanding.
++ Calculated based on the net asset value which does not reflect sales charges, if applicable, as of the last business day of the period.
+ The Ratios of Expenses and Net Investment Income (Loss) reflect the rebate of certain Portfolio expenses in connection with the investments in Morgan Stanley affiliates during the period. The effect of the rebate on the ratios is disclosed in the above table as "Ratio of Rebate from Morgan Stanley Affiliates to Average Net Assets."
^ Effective September 16, 2013, the Adviser has agreed to limit the ratio of expenses to average net assets to the maximum ratio of 1.40% for Class A shares. Prior to September 16, 2013, the maximum ratio was 1.30% for Class A shares.
^^ Effective January 23, 2015, the Adviser has agreed to limit the ratio of expenses to average net assets to the maximum of 1.20% for Class A shares. Prior to January 23, 2015, the maximum ratio was 1.40% for Class A shares.
§ Amount is less than 0.005%.
The accompanying notes are an integral part of the financial statements.
15
Morgan Stanley Institutional Fund, Inc.
Annual Report — December 31, 2015
Financial Highlights
Advantage Portfolio
Class L | |||||||||||||||||||||||
Year Ended December 31, | |||||||||||||||||||||||
Selected Per Share Data and Ratios | 2015 | 2014 | 2013 | 2012 | 2011 | ||||||||||||||||||
Net Asset Value, Beginning of Period | $ | 16.82 | $ | 16.42 | $ | 12.42 | $ | 11.39 | $ | 10.89 | |||||||||||||
Income (Loss) from Investment Operations: | |||||||||||||||||||||||
Net Investment Income (Loss)† | (0.01 | ) | 0.02 | (0.01 | ) | 0.13 | 0.04 | ||||||||||||||||
Net Realized and Unrealized Gain | 2.12 | 1.14 | 4.55 | 1.74 | 0.52 | ||||||||||||||||||
Total from Investment Operations | 2.11 | 1.16 | 4.54 | 1.87 | 0.56 | ||||||||||||||||||
Distributions from and/or in Excess of: | |||||||||||||||||||||||
Net Investment Income | — | (0.00 | )‡ | — | (0.10 | ) | (0.06 | ) | |||||||||||||||
Net Realized Gain | (1.53 | ) | (0.76 | ) | (0.54 | ) | (0.74 | ) | — | ||||||||||||||
Total Distributions | (1.53 | ) | (0.76 | ) | (0.54 | ) | (0.84 | ) | (0.06 | ) | |||||||||||||
Net Asset Value, End of Period | $ | 17.40 | $ | 16.82 | $ | 16.42 | $ | 12.42 | $ | 11.39 | |||||||||||||
Total Return++ | 12.47 | % | 7.28 | % | 36.97 | % | 16.42 | % | 5.19 | % | |||||||||||||
Ratios and Supplemental Data: | |||||||||||||||||||||||
Net Assets, End of Period (Thousands) | $ | 5,369 | $ | 6,549 | $ | 3,908 | $ | 722 | $ | 208 | |||||||||||||
Ratio of Expenses to Average Net Assets (1) | 0.97 | %+^^ | 1.18 | %+ | 1.08 | %+^ | 1.09 | %+ | 1.09 | %+ | |||||||||||||
Ratio of Net Investment Income (Loss) to Average Net Assets (1) | (0.03 | )%+ | 0.12 | %+ | (0.06 | )%+ | 1.04 | %+ | 0.35 | %+ | |||||||||||||
Ratio of Rebate from Morgan Stanley Affiliates to Average Net Assets | 0.01 | % | 0.01 | % | 0.01 | % | 0.00 | %§ | 0.00 | %§ | |||||||||||||
Portfolio Turnover Rate | 51 | % | 31 | % | 36 | % | 50 | % | 28 | % | |||||||||||||
(1) Supplemental Information on the Ratios to Average Net Assets: | |||||||||||||||||||||||
Ratios Before Expense Limitation: | |||||||||||||||||||||||
Expenses to Average Net Assets | 2.33 | % | 2.64 | % | 3.10 | % | 3.09 | % | 4.18 | % | |||||||||||||
Net Investment Loss to Average Net Assets | (1.39 | )% | (1.34 | )% | (2.08 | )% | (0.96 | )% | (2.74 | )% | |||||||||||||
† Per share amount is based on average shares outstanding.
‡ Amount is less than $0.005 per share.
++ Calculated based on the net asset value as of the last business day of the period.
+ The Ratios of Expenses and Net Investment Income (Loss) reflect the rebate of certain Portfolio expenses in connection with the investments in Morgan Stanley affiliates during the period. The effect of the rebate on the ratios is disclosed in the above table as "Ratio of Rebate from Morgan Stanley Affiliates to Average Net Assets."
^ Effective September 16, 2013, the Adviser has agreed to limit the ratio of expenses to average net assets to the maximum ratio of 1.19% for Class L shares. Prior to September 16, 2013, the maximum ratio was 1.09% for Class L shares.
^^ Effective January 23, 2015, the Adviser has agreed to limit the ratio of expenses to average net assets to the maximum of 0.99% for Class L shares. Prior to January 23, 2015, the maximum ratio was 1.19% for Class L shares.
§ Amount is less than 0.005%.
The accompanying notes are an integral part of the financial statements.
16
Morgan Stanley Institutional Fund, Inc.
Annual Report — December 31, 2015
Financial Highlights
Advantage Portfolio
Class C | |||||||
Selected Per Share Data and Ratios | Period from April 30, 2015^ to December 31,2015 | ||||||
Net Asset Value, Beginning of Period | $ | 18.08 | |||||
Income (Loss) from Investment Operations: | |||||||
Net Investment Loss† | (0.14 | ) | |||||
Net Realized and Unrealized Gain | 0.86 | ||||||
Total from Investment Operations | 0.72 | ||||||
Distributions from and/or in Excess of: | |||||||
Net Investment Income | (0.02 | ) | |||||
Net Realized Gain | (1.53 | ) | |||||
Total Distributions | (1.55 | ) | |||||
Net Asset Value, End of Period | $ | 17.25 | |||||
Total Return++ | 3.91 | %# | |||||
Ratios and Supplemental Data: | |||||||
Net Assets, End of Period (Thousands) | $ | 1,776 | |||||
Ratios of Expenses to Average Net Assets (1) | 1.94 | %+* | |||||
Ratio of Net Investment Loss to Average Net Assets Gain (1) | (1.15 | )%+* | |||||
Ratio of Rebate from Morgan Stanley Affiliates to Average Net Assets | 0.01 | %* | |||||
Portfolio Turnover Rate | 51 | % | |||||
(1) Supplemental Information on the Ratios to Average Net Assets: | |||||||
Ratios Before Expense Limitation: | |||||||
Expense to Average Net Assets | 2.83 | %* | |||||
Net Investment Loss to Average Net Assets | (2.04 | )%* | |||||
^ Commencement of Offering.
† Per share amount is based on average shares outstanding.
++ Calculated based on the net asset value which does not reflect sales charges, if applicable, as of the last business day of the period.
+ The Ratios of Expenses and Net Investment Loss reflect the rebate of certain Portfolio expenses in connection with the investments in Morgan Stanley affiliates during the period. The effect of the rebate on the ratios is disclosed in the above table as "Ratio of Rebate from Morgan Stanley Affiliates to Average Net Assets."
# Not Annualized.
* Annualized.
The accompanying notes are an integral part of the financial statements.
17
Morgan Stanley Institutional Fund, Inc.
Annual Report — December 31, 2015
Financial Highlights
Advantage Portfolio
Class IS | |||||||||||||||
Year Ended December 31, | Period from September 13, 2013^ to | ||||||||||||||
Selected Per Share Data and Ratios | 2015 | 2014 | December 31, 2013 | ||||||||||||
Net Asset Value, Beginning of Period | $ | 16.84 | $ | 16.41 | $ | 14.59 | |||||||||
Income (Loss) from Investment Operations: | |||||||||||||||
Net Investment Income (Loss)† | 0.02 | 0.04 | (0.01 | ) | |||||||||||
Net Realized and Unrealized Gain | 2.11 | 1.16 | 2.21 | ||||||||||||
Total from Investment Operations | 2.13 | 1.20 | 2.20 | ||||||||||||
Distributions from and/or in Excess of: | |||||||||||||||
Net Investment Income | (0.02 | ) | (0.01 | ) | — | ||||||||||
Net Realized Gain | (1.53 | ) | (0.76 | ) | (0.38 | ) | |||||||||
Total Distributions | (1.55 | ) | (0.77 | ) | (0.38 | ) | |||||||||
Net Asset Value, End of Period | $ | 17.42 | $ | 16.84 | $ | 16.41 | |||||||||
Total Return++ | 12.65 | % | 7.50 | % | 15.15 | %# | |||||||||
Ratios and Supplemental Data: | |||||||||||||||
Net Assets, End of Period (Thousands) | $ | 12 | $ | 12 | $ | 11 | |||||||||
Ratio of Expenses to Average Net Assets (1) | 0.82 | %+^^^ | 1.00 | %+ | 1.01 | %+^^* | |||||||||
Ratio of Net Investment Income (Loss) to Average Net Assets (1) | 0.10 | %+ | 0.26 | %+ | (0.25 | )%+* | |||||||||
Ratio of Rebate from Morgan Stanley Affiliates to Average Net Assets | 0.00 | %§ | 0.01 | % | 0.00 | %§* | |||||||||
Portfolio Turnover Rate | 51 | % | 31 | % | 36 | %# | |||||||||
(1) Supplemental Information on the Ratios to Average Net Assets: | |||||||||||||||
Ratios Before Expense Limitation | |||||||||||||||
Expenses to Average Net Assets | 14.53 | % | 18.84 | % | 7.31 | %* | |||||||||
Net Investment Loss to Average Net Assets | (13.61 | )% | (17.58 | )% | (6.55 | )%* | |||||||||
^ Commencement of Offering.
† Per share amount is based on average shares outstanding.
++ Calculated based on the net asset value as of the last business day of the period.
+ The Ratios of Expenses and Net Investment Income (Loss) reflect the rebate of certain Portfolio expenses in connection with the investments in Morgan Stanley affiliates during the period. The effect of the rebate on the ratios is disclosed in the above table as "Ratio of Rebate from Morgan Stanley Affiliates to Average Net Assets."
^^ Effective September 16, 2013, the Adviser has agreed to limit the ratio of expenses to average net assets to the maximum ratio of 1.01% for Class IS shares.
^^^ Effective January 23, 2015, the Adviser has agreed to limit the ratio of expenses to average net assets to the maximum of 0.81% for Class IS shares. Prior to January 23, 2015, the maximum ratio was 1.01% for Class IS shares.
§ Amount is less than 0.005%.
# Not Annualized.
* Annualized.
The accompanying notes are an integral part of the financial statements.
18
Morgan Stanley Institutional Fund, Inc.
Annual Report — December 31, 2015
Notes to Financial Statements
Morgan Stanley Institutional Fund, Inc. (the "Fund") is registered under the Investment Company Act of 1940, as amended (the "Act"), as an open-end management investment company. The Fund is comprised of twenty-six separate, active, diversified and non-diversified portfolios (individually referred to as a "Portfolio", collectively as the "Portfolios"). The Fund applies investment company accounting and reporting guidance.
The accompanying financial statements relate to the Advantage Portfolio. The Portfolio seeks long-term capital appreciation.
The Portfolio offers five classes of shares — Class I, Class A, Class L, Class C and Class IS. On April 30, 2015, the Portfolio commenced offering Class C shares and suspended offering of Class L shares. Existing Class L shareholders may invest through reinvestment of dividends and distributions.
A. Significant Accounting Policies: The following significant accounting policies are in conformity with U.S. generally accepted accounting principles ("GAAP"). Such policies are consistently followed by the Fund in the preparation of its financial statements. GAAP may require management to make estimates and assumptions that affect the reported amounts and disclosures in the financial statements. Actual results may differ from those estimates.
1. Security Valuation: (1) An equity portfolio security listed or traded on an exchange is valued at its latest reported sales price (or at the exchange official closing price if such exchange reports an official closing price), if there were no sales on a given day, the security is valued at the mean between the last reported bid and asked prices; (2) all other equity portfolio securities for which over-the-counter ("OTC") market quotations are readily available are valued at its latest reported sales price. In cases where a security is traded on more than one exchange, the security is valued on the exchange designated as the primary market; (3) listed options are valued at the last reported sales price on the exchange on which they are listed (or at the exchange official closing price if such exchange reports an official closing price). If an official closing price or last reported sales price is unavailable, the listed option should be fair valued at the mean between their latest bid and asked price. Unlisted options are valued by an outside pricing service approved by the Fund's Board of Directors (the "Directors") or quotes from a broker or dealer; (4) when market quotations are not readily available, including circumstances under which Morgan Stanley Investment Management Inc. (the "Adviser") determines
that the closing price, last sale price or the mean between the last reported bid and asked prices are not reflective of a security's market value, portfolio securities are valued at their fair value as determined in good faith under procedures established by and under the general supervision of the Directors. Occasionally, developments affecting the closing prices of securities and other assets may occur between the times at which valuations of such securities are determined (that is, close of the foreign market on which the securities trade) and the close of business of the New York Stock Exchange ("NYSE"). If developments occur during such periods that are expected to materially affect the value of such securities, such valuations may be adjusted to reflect the estimated fair value of such securities as of the close of the NYSE, as determined in good faith by the Directors or by the Adviser using a pricing service and/or procedures approved by the Directors; (5) quotations of foreign portfolio securities, other assets and liabilities and forward contracts stated in foreign currency are translated into U.S. dollar equivalents at the prevailing market rates prior to the close of the NYSE; (6) investments in mutual funds, including the Morgan Stanley Institutional Liquidity Funds, are valued at the net asset value ("NAV") as of the close of each business day; and (7) short-term debt securities with remaining maturities of 60 days or less at the time of purchase may be valued at amortized cost, unless the Adviser determines such valuation does not reflect the securities' market value, in which case these securities will be valued at their fair market value determined by the Adviser.
The Directors have responsibility for determining in good faith the fair value of the investments, and the Directors may appoint others, such as the Fund's Adviser or a valuation committee, to assist the Directors in determining fair value and to make the actual calculations pursuant to the fair valuation methodologies previously approved by the Directors. Under procedures approved by the Directors, the Fund's Adviser has formed a Valuation Committee whose members are approved by the Directors. The Valuation Committee provides administration and oversight of the Fund's valuation policies and procedures, which are reviewed at least annually by the Directors. These procedures allow the Fund to utilize independent pricing services, quotations from securities and financial instrument dealers, and other market sources to determine fair value.
19
Morgan Stanley Institutional Fund, Inc.
Annual Report — December 31, 2015
Notes to Financial Statements (cont'd)
The Fund has procedures to determine the fair value of securities and other financial instruments for which market prices are not readily available. Under these procedures, the Valuation Committee convenes on a regular and ad hoc basis to review such securities and considers a number of factors, including valuation methodologies and significant unobservable valuation inputs, when arriving at fair value. The Valuation Committee may employ a market-based approach which may use related or comparable assets or liabilities, recent transactions, market multiples, book values, and other relevant information for the investment to determine the fair value of the investment. An income-based valuation approach may also be used in which the anticipated future cash flows of the investment are discounted to calculate fair value. Discounts may also be applied due to the nature or duration of any restrictions on the disposition of the investments. Due to the inherent uncertainty of valuations of such investments, the fair values may differ significantly from the values that would have been used had an active market existed. The Valuation Committee employs various methods for calibrating these valuation approaches including a regular review of valuation methodologies, key inputs and assumptions, transactional back-testing or disposition analysis, and reviews of any related market activity.
2. Fair Value Measurement: Financial Accounting Standards Board ("FASB") Accounting Standards CodificationTM ("ASC") 820, "Fair Value Measurement" ("ASC 820"), defines fair value as the value that the Fund would receive to sell an investment or pay to transfer a liability in a timely transaction with an independent buyer in the principal market, or in the absence of a principal market the most advantageous market for the investment or liability. ASC 820 establishes a three-tier hierarchy to distinguish between (1) inputs that reflect the assumptions market participants would use in valuing an asset or liability developed based on market data obtained from sources independent of the reporting entity (observable inputs) and (2) inputs that reflect the reporting entity's own assumptions about the assumptions market participants would use in valuing an asset or liability developed based on the best information available in the circumstances (unobservable inputs) and to establish classification of fair value measurements for disclosure purposes. Various inputs are used in determining the value of the Fund's in-
vestments. The inputs are summarized in the three broad levels listed below.
• Level 1 – unadjusted quoted prices in active markets for identical investments
• Level 2 – other significant observable inputs (including quoted prices for similar investments, interest rates, prepayment speeds, credit risk, etc.)
• Level 3 – significant unobservable inputs including the Fund's own assumptions in determining the fair value of investments. Factors considered in making this determination may include, but are not limited to, information obtained by contacting the issuer, analysts, or the appropriate stock exchange (for exchange-traded securities), analysis of the issuer's financial statements or other available documents and, if necessary, available information concerning other securities in similar circumstances
The inputs or methodology used for valuing securities are not necessarily an indication of the risk associated with investing in those securities and the determination of the significance of a particular input to the fair value measurement in its entirety requires judgment and considers factors specific to each security.
The following is a summary of the inputs used to value the Portfolio's investments as of December 31, 2015.
Investment Type | Level 1 Unadjusted quoted prices (000) | Level 2 Other significant observable inputs (000) | Level 3 Significant unobservable inputs (000) | Total (000) | |||||||||||||||
Assets: | |||||||||||||||||||
Common Stocks | |||||||||||||||||||
Aerospace & Defense | $ | 1,037 | $ | — | $ | — | $ | 1,037 | |||||||||||
Beverages | 1,809 | — | — | 1,809 | |||||||||||||||
| Diversified Financial Services | 1,955 | — | — | 1,955 | |||||||||||||||
Food & Staples Retailing | 2,000 | — | — | 2,000 | |||||||||||||||
Food Products | 4,829 | — | — | 4,829 | |||||||||||||||
| Hotels, Restaurants & Leisure | 875 | — | — | 875 | |||||||||||||||
Household Products | 605 | — | — | 605 | |||||||||||||||
| Information Technology Services | 3,696 | — | — | 3,696 | |||||||||||||||
Insurance | 388 | — | — | 388 | |||||||||||||||
Internet & Catalog Retail | 3,771 | — | — | 3,771 | |||||||||||||||
| Internet Software & Services | 8,644 | — | — | 8,644 | |||||||||||||||
| Life Sciences Tools & Services | 910 | — | — | 910 | |||||||||||||||
20
Morgan Stanley Institutional Fund, Inc.
Annual Report — December 31, 2015
Notes to Financial Statements (cont'd)
Investment Type | Level 1 Unadjusted quoted prices (000) | Level 2 Other significant observable inputs (000) | Level 3 Significant unobservable inputs (000) | Total (000) | |||||||||||||||
Common Stocks (cont'd) | |||||||||||||||||||
Media | $ | 1,313 | $ | 586 | $ | — | $ | 1,899 | |||||||||||
Personal Products | 616 | — | — | 616 | |||||||||||||||
Pharmaceuticals | 1,233 | — | — | 1,233 | |||||||||||||||
Specialty Retail | 994 | — | — | 994 | |||||||||||||||
| Tech Hardware, Storage & Peripherals | 2,202 | — | — | 2,202 | |||||||||||||||
| Textiles, Apparel & Luxury Goods | 283 | 783 | — | 1,066 | |||||||||||||||
Total Common Stocks | 37,160 | 1,369 | — | 38,529 | |||||||||||||||
Call Option Purchased | — | 83 | — | 83 | |||||||||||||||
Short-Term Investment | |||||||||||||||||||
Investment Company | 3,368 | — | — | 3,368 | |||||||||||||||
Total Assets | $ | 40,528 | $ | 1,452 | $ | — | $ | 41,980 | |||||||||||
Transfers between investment levels may occur as the markets fluctuate and/or the availability of data used in an investment's valuation changes. The Portfolio recognizes transfers between the levels as of the end of the period. As of December 31, 2015, the Portfolio did not have any investments transfer between investment levels. At December 31, 2015, the fair value of certain securities were adjusted due to developments which occurred between the time of the close of the foreign markets on which they trade and the close of business on the NYSE which resulted in their level 2 classification.
3. Foreign Currency Translation and Foreign Investments: The books and records of the Portfolio are maintained in U.S. dollars. Foreign currency amounts are translated into U.S. dollars as follows:
– investments, other assets and liabilities at the prevailing rate of exchange on the valuation date;
– investment transactions and investment income at the prevailing rates of exchange on the dates of such transactions.
Although the net assets of the Portfolio are presented at the foreign exchange rates and market values at the close of the period, the Portfolio does not isolate that portion of the results of operations arising as a result of changes in the foreign exchange rates from the fluctuations arising from changes in the market prices of securities held at period end. Similarly, the Portfolio does not isolate the effect of changes in foreign exchange rates from the fluctuations arising from changes in the market prices of securities sold during the period. Accordingly, realized and unrealized foreign currency gains (losses) on
investments in securities are included in the reported net realized and unrealized gains (losses) on investment transactions and balances. However, pursuant to U.S. Federal income tax regulations, gains and losses from certain foreign currency transactions and the foreign currency portion of gains and losses realized on sales and maturities of foreign denominated debt securities are treated as ordinary income for U.S. Federal income tax purposes.
Net realized gains (losses) on foreign currency transactions represent net foreign exchange gains (losses) from foreign currency forward exchange contracts, disposition of foreign currencies, currency gains (losses) realized between the trade and settlement dates on securities transactions, and the difference between the amount of investment income and foreign withholding taxes recorded on the Portfolio's books and the U.S. dollar equivalent amounts actually received or paid. Net unrealized currency gains (losses) from valuing foreign currency denominated assets and liabilities at period end exchange rates are reflected as a component of unrealized appreciation (depreciation) in the Statement of Assets and Liabilities. The change in unrealized currency gains (losses) on foreign currency translations for the period is reflected in the Statement of Operations.
Foreign security and currency transactions may involve certain considerations and risks not typically associated with those of U.S. dollar denominated transactions as a result of, among other factors, fluctuations of exchange rates in relation to the U.S. dollar, the possibility of lower levels of governmental supervision and regulation of foreign securities markets and the possibility of political or economic instability.
Governmental approval for foreign investments may be required in advance of making an investment under certain circumstances in some countries, and the extent of foreign investments in domestic companies may be subject to limitation in other countries. Foreign ownership limitations also may be imposed by the charters of individual companies to prevent, among other concerns, violations of foreign investment limitations. As a result, an additional class of shares (identified as "Foreign" in the Portfolio of Investments) may be created and offered for investment. The "local" and "foreign shares" market values may differ. In the absence of trading of the foreign shares in such markets, the Portfolio values the
21
Morgan Stanley Institutional Fund, Inc.
Annual Report — December 31, 2015
Notes to Financial Statements (cont'd)
foreign shares at the closing exchange price of the local shares.
4. Derivatives: The Portfolio may, but is not required to, use derivative instruments for a variety of purposes, including hedging, risk management, portfolio management or to earn income. Derivatives are financial instruments whose value is based, in part, on the value of an underlying asset, interest rate, index or financial instrument. Prevailing interest rates and volatility levels, among other things, also affect the value of derivative instruments. A derivative instrument often has risks similar to its underlying asset and may have additional risks, including imperfect correlation between the value of the derivative and the underlying asset, risks of default by the counterparty to certain transactions, magnification of losses incurred due to changes in the market value of the securities, instruments, indices or interest rates to which the derivative instrument relates, risks that the transactions may not be liquid and risks arising from margin requirements. The use of derivatives involves risks that are different from, and possibly greater than, the risks associated with other portfolio investments. Derivatives may involve the use of highly specialized instruments that require investment techniques and risk analyses different from those associated with other portfolio investments. All of the Portfolio's holdings, including derivative instruments, are marked-to-market each day with the change in value reflected in unrealized appreciation (depreciation). Upon disposition, a realized gain or loss is recognized.
Certain derivative transactions may give rise to a form of leverage. Leverage magnifies the potential for gain and the risk of loss. Leverage associated with derivative transactions may cause the Portfolio to liquidate portfolio positions when it may not be advantageous to do so to satisfy its obligations or to meet earmarking or segregation requirements, pursuant to applicable Securities and Exchange Commission rules and regulations, or may cause the Portfolio to be more volatile than if the Portfolio had not been leveraged. Although the Adviser seeks to use derivatives to further the Portfolio's investment objectives, there is no assurance that the use of derivatives will achieve this result.
Following is a description of the derivative instruments and techniques that the Portfolio used during the period and their associated risks:
Options: With respect to options, the Portfolio is subject to equity risk, interest rate risk and foreign currency exchange risk in the normal course of pursuing its investment objectives. If the Portfolio buys an option, it buys a legal contract giving it the right to buy or sell a specific amount of the underlying instrument or futures contract on the underlying instrument, at an agreed-upon price typically in exchange for a premium paid by the Portfolio. The Portfolio may purchase and/or sell put and call options. Purchasing call options tends to increase the Portfolio's exposure to the underlying (or similar) instrument. Purchasing put options tends to decrease the Portfolio's exposure to the underlying (or similar) instrument. When entering into purchased option contracts, the Portfolio bears the risk of interest or exchange rates or securities prices moving unexpectedly, in which case, the Portfolio may not achieve the anticipated benefits of the purchased option contracts; however the risk of loss is limited to the premium paid. Purchased options are reported as part of "Total Investments in Securities" in the Statement of Assets and Liabilities. Premium paid for purchasing options which expired are treated as realized losses. If the Portfolio sells an option, it sells to another party the right to buy from or sell to the Portfolio a specific amount of the underlying instrument or futures contract on the underlying instrument at an agreed-upon price typically in exchange for a premium received by the Portfolio. When options are purchased OTC, the Portfolio bears the risk that the counterparty that wrote the option will be unable or unwilling to perform its obligations under the option contract. Options may also be illiquid and the Portfolio may have difficulty closing out its position. A decision as to whether, when and how to use options involves the exercise of skill and judgment and even a well-conceived option transaction may be unsuccessful because of market behavior or unexpected events. The prices of options can be highly volatile and the use of options can lower total returns.
FASB ASC 815, "Derivatives and Hedging" ("ASC 815"), is intended to improve financial reporting about derivative instruments by requiring enhanced disclosures to enable investors to better understand how and why the Portfolio uses derivative instruments, how these derivative instruments are accounted for and their effects on the Portfolio's financial position and results of operations.
22
Morgan Stanley Institutional Fund, Inc.
Annual Report — December 31, 2015
Notes to Financial Statements (cont'd)
The following table sets forth the fair value of the Portfolio's derivative contracts by primary risk exposure as of December 31, 2015.
| Asset Derivatives Statement of Assets and Liabilities Location | Primary Risk Exposure | Value (000) | |||||||||||||
| Call Option Purchased | Investments, at Value (Call Options Purchased) | Currency Risk | $ | 83 | (a) | ||||||||||
(a) Amounts are included in Investments in Securities in the Statement of Assets and Liabilities.
The following tables set forth by primary risk exposure the Portfolio's realized gains (losses) and change in unrealized appreciation (depreciation) by type of derivative contract for the year ended December 31, 2015 in accordance with ASC 815.
Realized Gain (Loss) | |||||||||||
Primary Risk Exposure | Derivative Type | Value (000) | |||||||||
Currency Risk | Investments (Call Options Purchased) | $ | (27 | )(b) | |||||||
(b) Amounts are included in Investments Sold in the Statement of Operations.
Change in Unrealized Appreciation (Depreciation) | |||||||||||
Primary Risk Exposure | Derivative Type | Value (000) | |||||||||
Currency Risk | Investments (Call Options Purchased) | $ | 61 | (c) | |||||||
(c) Amounts are included in Investments in the Statement of Operations.
At December 31, 2015, the Portfolio's derivative assets and liabilities are as follows:
| Gross Amounts of Assets and Liabilities Presented in the Statement of Assets and Liabilities | |||||||||||
Derivatives | Assets(d) (000) | Liabilities(d) (000) | |||||||||
Call Option Purchased | $ | 83 | (a) | $ | — | ||||||
(a) Amounts are included in Investments in Securities in the Statement of Assets and Liabilities.
(d) Absent an event of default or early termination, OTC derivative assets and liabilities are presented gross and not offset in the Statement of Assets and Liabilities.
The Portfolio typically enters into International Swaps and Derivatives Association, Inc. Master Agreements ("ISDA Master Agreements") or similar master agreements (collectively, "Master Agreements") with its contract counterparties for certain OTC derivatives in order to, among other things, reduce its credit risk to counterparties. ISDA Master Agreements include provisions for general obligations, representations, collateral and events of default or termination. Under an ISDA Master Agreement, the Portfolio typically may offset with the counterparty certain OTC derivative financial instruments' payables and/or
receivables with collateral held and/or posted and create one single net payment (close-out netting) in the event of default, termination and/or potential deterioration in the credit quality of the counterparty. Various Master Agreements govern the terms of certain transactions with counterparties, including transactions such as swap, forward, repurchase and reverse repurchase agreements. These Master Agreements typically attempt to reduce the counterparty risk associated with such transactions by specifying credit protection mechanisms and providing standardization that improves legal certainty. Cross-termination provisions under Master Agreements typically provide that a default in connection with one transaction between the Portfolio and a counterparty gives the non-defaulting party the right to terminate any other transactions in place with the defaulting party to create one single net payment due to/due from the defaulting party and may be a feature in certain Master Agreements. In the event the Portfolio exercises its right to terminate a Master Agreement after a counterparty experiences a termination event as defined in the Master Agreement, the return of collateral with market value in excess of the Portfolio's net liability may be delayed or denied.
The following table presents derivative financial instruments that are subject to enforceable netting arrangements as of December 31, 2015.
Gross Amounts Not Offset in the Statement of Assets and Liabilities | |||||||||||||||||||
Counterparty | Gross Asset Derivatives Presented in Statement of Assets and Liabilities (000) | Financial Instrument (000) | Collateral Received (000) | Net Amount (not less than $0) (000) | |||||||||||||||
Royal Bank of Scotland | $ | 83 | $ | — | $ | — | $ | 83 | |||||||||||
For the year ended December 31, 2015, the approximate average monthly amount outstanding for each derivative type is as follows:
Call Option Purchased: | |||||||
Average monthly notional amount | 8,318,000 | ||||||
5. Indemnifications: The Fund enters into contracts that contain a variety of indemnifications. The Fund's maximum exposure under these arrangements is unknown. However, the Fund has not had prior claims or losses pursuant to these contracts and expects the risk of loss to be remote.
6. Dividends and Distributions to Shareholders: Dividend income and distributions to shareholders are
23
Morgan Stanley Institutional Fund, Inc.
Annual Report — December 31, 2015
Notes to Financial Statements (cont'd)
recorded on the ex-dividend date. Dividends from net investment income, if any, are declared and paid annually. Net realized capital gains, if any, are distributed at least annually.
7. Security Transactions, Income and Expenses: Security transactions are accounted for on the trade date (date the order to buy or sell is executed). Realized gains and losses on the sale of investment securities are determined on the specific identified cost method. Dividend income and other distributions are recorded on the ex-dividend date (except for certain foreign dividends which may be recorded as soon as the Portfolio is informed of such dividends) net of applicable withholding taxes. Interest income is recognized on the accrual basis except where collection is in doubt. Discounts are accreted and premiums are amortized over the life of the respective securities. Most expenses of the Fund can be directly attributed to a particular Portfolio. Expenses which cannot be directly attributed are apportioned among the Portfolios based upon relative net assets or other appropriate methods. Income, expenses (other than class specific expenses — distribution and shareholder services, transfer agency and sub transfer agency fees) and realized and unrealized gains or losses are allocated to each class of shares based upon their relative net assets.
B. Advisory Fees: The Adviser, a wholly-owned subsidiary of Morgan Stanley, provides the Portfolio with advisory services under the terms of an Investment Advisory Agreement, paid quarterly, at the annual rate based on the daily net assets as follows:
| First $750 million | Next $750 million | Over $1.5 billion | |||||||||
| 0.75 | % | 0.70 | % | 0.65 | % | ||||||
Effective March 2, 2015, the Portfolio's annual rate based on the daily net assets was reduced and is as follows:
| First $750 million | Next $750 million | Over $1.5 billion | |||||||||
| 0.65 | % | 0.60 | % | 0.55 | % | ||||||
For the year ended December 31, 2015, the advisory fee rate (net of waivers/rebate) was equivalent to an annual effective rate of 0.04% of the Portfolio's average daily net assets.
The Adviser has agreed to reduce its advisory fee and/or reimburse the Portfolio so that total annual portfolio operating expenses, excluding certain investment related expenses, taxes, interest and other extraordinary expenses (including litigation), will not exceed 1.05% for Class I shares, 1.40% for Class A
shares, 1.19% for Class L shares and 1.01% for Class IS shares. Effective January 23, 2015, the Adviser has agreed to reduce its advisory fee and/or reimburse the Portfolio so that total annual portfolio operating expenses will not exceed 0.85% for Class I shares, 1.20% for Class A shares, 0.99% for Class L shares, 1.95% for Class C shares (effective April 30, 2015) and 0.81% for Class IS shares. The fee waivers and/or expense reimbursements will continue for at least one year from the date of the Portfolio's prospectus or until such time as the Directors act to discontinue all or a portion of such waivers and/or reimbursements when they deem such action is appropriate. For the year ended December 31, 2015, approximately $209,000 of advisory fees were waived and approximately $11,000 of other expenses were reimbursed by the Adviser pursuant to this arrangement.
C. Administration Fees: The Adviser also serves as Administrator to the Fund and provides administrative services pursuant to an Administration Agreement for an annual fee, accrued daily and paid monthly, of 0.08% of the Portfolio's average daily net assets.
Under a Sub-Administration Agreement between the Administrator and State Street Bank and Trust Company ("State Street"), State Street provides certain administrative services to the Fund. For such services, the Administrator pays State Street a portion of the fee the Administrator receives from the Portfolio.
D. Distribution and Shareholder Services Fees: Morgan Stanley Distribution, Inc. ("MSDI" or the "Distributor"), a wholly-owned subsidiary of the Adviser and an indirect subsidiary of Morgan Stanley, serves as the Fund's Distributor of Portfolio shares pursuant to a Distribution Agreement. The Fund has adopted a Shareholder Services Plan with respect to Class A shares pursuant to Rule 12b-1 under the Act. Under the Shareholder Services Plan, the Portfolio pays the Distributor a shareholder services fee, accrued daily and paid monthly, at an annual rate of 0.25% of the Portfolio's average daily net assets attributable to Class A shares.
The Fund has adopted a Distribution and Shareholder Services Plan with respect to Class L shares pursuant to Rule 12b-1 under the Act. Under the Distribution and Shareholder Services Plan, the Portfolio pays the Distributor a distribution fee, accrued daily and paid monthly, at an annual rate of 0.50% and a shareholder services fee, accrued daily and paid monthly, at an annual rate of 0.25% of the Portfolio's average daily net assets attributable to Class L shares. The Distributor has agreed to waive for at least one year the 12b-1 fees on Class L shares
24
Morgan Stanley Institutional Fund, Inc.
Annual Report — December 31, 2015
Notes to Financial Statements (cont'd)
of the Portfolio to the extent it exceeds 0.04% of the average daily net assets of such shares on an annualized basis. For the year ended December 31, 2015, this waiver amounted to approximately $49,000.
The Fund has adopted a Distribution and Shareholder Services Plan with respect to Class C shares pursuant to Rule 12b-1 under the Act. Under the Distribution and Shareholder Services Plan, the Portfolio pays the Distributor a distribution fee, accrued daily and paid monthly, at an annual rate of 0.75% and a shareholder services fee, accrued daily and paid monthly, at an annual rate of 0.25% of the Portfolio's average daily net assets attributable to Class C shares.
The distribution and shareholder services fees are used to support the expenses associated with servicing and maintaining accounts. The Distributor may compensate other parties for providing shareholder support services to investors who purchase Class A, Class L and Class C shares.
E. Dividend Disbursing and Transfer Agent: The Fund's dividend disbursing and transfer agent is Boston Financial Data Services, Inc. ("BFDS"). Pursuant to a Transfer Agency Agreement, the Fund pays BFDS a fee based on the number of classes, accounts and transactions relating to the Portfolios of the Fund.
F. Custodian Fees: State Street (the "Custodian") serves as Custodian for the Fund in accordance with a Custodian Agreement. The Custodian holds cash, securities, and other assets of the Fund as required by the Act. Custody fees are payable monthly based on assets held in custody, investment purchases and sales activity and account maintenance fees, plus reimbursement for certain out-of-pocket expenses.
G. Security Transactions and Transactions with Affiliates: For the year ended December 31, 2015, purchases and sales of investment securities for the Portfolio, other than long-term U.S. Government securities and short-term investments, were approximately $24,786,000 and $16,494,000, respectively. There were no purchases and sales of long-term U.S. Government securities for the year ended December 31, 2015.
The Portfolio invests in the Institutional Class of the Morgan Stanley Institutional Liquidity Funds — Money Market Portfolio (the "Liquidity Funds"), an open-end management investment company managed by the Adviser. Advisory fees paid by the Portfolio are reduced by an amount equal to its pro-rata share of the advisory and administration fees paid by the
Portfolio due to its investment in the Liquidity Funds. For the year ended December 31, 2015, advisory fees paid were reduced by approximately $2,000 relating to the Portfolio's investment in the Liquidity Funds.
A summary of the Portfolio's transactions in shares of the Liquidity Funds during the year ended December 31, 2015 is as follows:
| Value December 31, 2014 (000) | Purchases at Cost (000) | Sales (000) | Dividend Income (000) | Value December 31, 2015 (000) | |||||||||||||||
| $ | 1,407 | $ | 26,480 | $ | 24,519 | $ | 3 | $ | 3,368 | ||||||||||
During the year ended December 31, 2015, the Portfolio incurred approximately $1,000 in brokerage commissions with Morgan Stanley & Co., LLC, an affiliate of the Adviser/Administrator and Distributor, for portfolio transactions executed on behalf of the Portfolio.
The Portfolio has an unfunded Deferred Compensation Plan (the "Compensation Plan"), which allows each independent Director to defer payment of all, or a portion, of the fees he or she receives for serving on the Board of Directors. Each eligible Director generally may elect to have the deferred amounts credited with a return equal to the total return on one or more of the Morgan Stanley funds that are offered as investment options under the Compensation Plan. Appreciation/depreciation and distributions received from these investments are recorded with an offsetting increase/decrease in the deferred compensation obligation and do not affect the NAV of the Portfolio.
H. Federal Income Taxes: It is the Portfolio's intention to continue to qualify as a regulated investment company and distribute all of its taxable and tax-exempt income. Accordingly, no provision for Federal income taxes is required in the financial statements.
The Portfolio may be subject to taxes imposed by countries in which it invests. Such taxes are generally based on income and/or capital gains earned or repatriated. Taxes are accrued based on net investment income, net realized gains and net unrealized appreciation as such income and/or gains are earned. Taxes may also be based on transactions in foreign currency and are accrued based on the value of investments denominated in such currency.
FASB ASC 740-10, "Income Taxes — Overall", sets forth a minimum threshold for financial statement recognition of the benefit of a tax position taken or expected to be taken in a tax return. Management has concluded there are no significant uncertain tax positions that would require recognition in the
25
Morgan Stanley Institutional Fund, Inc.
Annual Report — December 31, 2015
Notes to Financial Statements (cont'd)
financial statements. If applicable, the Portfolio recognizes interest accrued related to unrecognized tax benefits in "Interest Expense" and penalties in "Other Expenses" in the Statement of Operations. The Portfolio files tax returns with the U.S. Internal Revenue Service, New York and various states. Generally, each of the tax years in the four-year period ended December 31, 2015, remains subject to examination by taxing authorities.
The tax character of distributions paid may differ from the character of distributions shown in the Statements of Changes in Net Assets due to short-term capital gains being treated as ordinary income for tax purposes. The tax character of distributions paid during fiscal 2015 and 2014 was as follows:
| 2015 Distributions Paid From: | 2014 Distributions Paid From: | ||||||||||||||
| Ordinary Income (000) | Long-Term Capital Gain (000) | Ordinary Income (000) | Long-Term Capital Gain (000) | ||||||||||||
| $ | 18 | $ | 3,170 | $ | 121 | $ | 1,100 | ||||||||
The amount and character of income and gains to be distributed are determined in accordance with income tax regulations which may differ from GAAP. These book/tax differences are either considered temporary or permanent in nature.
Temporary differences are primarily due to differing book and tax treatments in the timing of the recognition of gains (losses) on certain investment transactions and the timing of the deductibility of certain expenses.
Permanent differences, primarily due to differing treatments of gains (losses) related to foreign currency transactions and a net operating loss, resulted in the following reclassifications among the components of net assets at December 31, 2015:
| Accumulated Net Investment Loss (000) | Accumulated Net Realized Gain (000) | Paid-in- Capital (000) | |||||||||
| $ | 3 | $ | 1 | $ | (4 | ) | |||||
At December 31, 2015, the components of distributable earnings for the Portfolio on a tax basis were as follows:
| Undistributed Ordinary Income (000) | Undistributed Long-Term Capital Gain (000) | ||||||
| $ | — | $ | 1,201 | ||||
Capital losses and specified ordinary losses, including currency losses, incurred after October 31 but within the taxable year are deemed to arise on the first day of the Portfolio's next taxable year. For the year ended December 31, 2015, the
Portfolio deferred to January 1, 2016 for U.S. Federal income tax purposes the following losses:
| Post-October Currency and Specified Ordinary Losses (000) | Post-October Capital Losses (000) | ||||||
| $ | 14 | $ | — | ||||
I. Other: At December 31, 2015, the Portfolio had record owners of 10% or greater. Investment activities of these shareholders could have a material impact on the Portfolio. The aggregate percentage of such owners was 14.4%.
26
Morgan Stanley Institutional Fund, Inc.
Annual Report — December 31, 2015
Report of Independent Registered Public Accounting Firm
To the Shareholders and Board of Directors of
Morgan Stanley Institutional Fund, Inc. —
Advantage Portfolio
We have audited the accompanying statement of assets and liabilities, including the portfolio of investments, of Advantage Portfolio (one of the portfolios constituting Morgan Stanley Institutional Fund, Inc.) (the "Portfolio") as of December 31, 2015, and the related statement of operations for the year then ended, the statements of changes in net assets for each of the two years in the period then ended and the financial highlights for each of the years or periods indicated therein. These financial statements and financial highlights are the responsibility of the Portfolio's management. Our responsibility is to express an opinion on these financial statements and financial highlights based on our audits.
We conducted our audits in accordance with the standards of the Public Company Accounting Oversight Board (United States). Those standards require that we plan and perform the audit to obtain reasonable assurance about whether the financial statements and financial highlights are free of material misstatement. We were not engaged to perform an audit of the Portfolio's internal control over financial reporting. Our audits included consideration of internal control over financial reporting as a basis for designing audit procedures that are appropriate in the circumstances, but not for the purpose of expressing an opinion on the effectiveness of the Portfolio's internal control over financial reporting. Accordingly, we express no such opinion. An audit also includes examining, on a test basis, evidence supporting the amounts and disclosures in the financial statements and financial highlights, assessing the accounting principles used and significant estimates made by management, and evaluating the overall financial statement presentation. Our procedures included confirmation of securities owned as of December 31, 2015, by correspondence with the custodian and others. We believe that our audits provide a reasonable basis for our opinion.
In our opinion, the financial statements and financial highlights referred to above present fairly, in all material respects, the financial position of Advantage Portfolio (one of the portfolios constituting Morgan Stanley Institutional Fund, Inc.) at December 31, 2015, the results of its operations for the year then ended, the changes in its net assets for each of the two years in the period then ended and the financial highlights for each of the years or periods indicated therein, in conformity with U.S. generally accepted accounting principles.

Boston, Massachusetts
February 26, 2016
27
Morgan Stanley Institutional Fund, Inc.
Annual Report — December 31, 2015
Federal Tax Notice (unaudited)
For Federal income tax purposes, the following information is furnished with respect to the distributions paid by the Portfolio during its taxable year ended December 31, 2015. For corporate shareholders, 100.0% of the dividends qualified for the dividends received deduction.
The Portfolio designated and paid approximately $3,170,000 as a long-term capital gain distribution.
For Federal income tax purposes, the following information is furnished with respect to the Portfolio's earnings for its taxable year ended December 31, 2015. When distributed, certain earnings may be subject to a maximum tax rate of 15% as provided for the Jobs and Growth Tax Relief Reconciliation Act of 2003. The Portfolio designated up to a maximum of approximately $18,000 as taxable at this lower rate.
In January, the Portfolio provides tax information to shareholders for the preceding calendar year.
28
Morgan Stanley Institutional Fund, Inc.
Annual Report — December 31, 2015
U.S. Privacy Policy (unaudited)
AN IMPORTANT NOTICE CONCERNING OUR U.S. PRIVACY POLICY
This privacy notice describes the U.S. privacy policy of Morgan Stanley Distribution, Inc., and the Morgan Stanley family of mutual funds ("us", "our", "we").
We are required by federal law to provide you with notice of our U.S. privacy policy ("Policy"). This Policy applies to both our current and former clients unless we state otherwise and is intended for individual clients who purchase products or receive services from us for personal, family or household purposes. This Policy is not applicable to partnerships, corporations, trusts or other non-individual clients or account holders, nor is this Policy applicable to individuals who are either beneficiaries of a trust for which we serve as trustee or participants in an employee benefit plan administered or advised by us. This Policy is, however, applicable to individuals who select us to be a custodian of securities or assets in individual retirement accounts, 401(k) accounts, or accounts subject to the Uniform Gifts to Minors Act.
This notice sets out our business practices to protect your privacy; how we collect and share personal information about you; and how you can limit our sharing or certain uses by others of this information. We may amend this Policy at any time, and will inform you of any changes to our Policy as required by law.
WE RESPECT YOUR PRIVACY
We appreciate that you have provided us with your personal financial information and understand your concerns about your information. We strive to safeguard the information our clients entrust to us. Protecting the confidentiality and security of client information is an important part of how we conduct our business.
This notice describes what personal information we collect about you, how we collect it, when we may share it with others, and how certain others may use it. It discusses the steps you may take to limit our sharing of certain information about you with our affiliated companies, including, but not limited to our affiliated banking businesses, brokerage firms and credit service affiliates. It also discloses how you may limit our affiliates' use of shared information for marketing purposes.
Throughout this Policy, we refer to the nonpublic information that personally identifies you as "personal information." We also use the term "affiliated company" in this notice. An affiliated company is a company in our family of companies and includes companies with the Morgan Stanley name. These affiliated companies are financial institutions such as broker-dealers, banks, investment advisers and credit card issuers. We refer to any company that is not an affiliated company as a nonaffiliated third party. For purposes of Section 5 of this notice, and your ability to limit certain uses of personal information by our affiliates, this notice applies to the use of personal information by our affiliated companies.
1. WHAT PERSONAL INFORMATION DO WE COLLECT FROM YOU?
We may collect the following types of information about you: (i) information provided by you, including information from applications and other forms we receive from you, (ii) information about your transactions with us or our affiliates, (iii) information about your transactions with nonaffiliated third parties, (iv) information from consumer reporting agencies, (v) information obtained from our websites, and (vi) information obtained from other sources. For example:
• We collect information such as your name, address, e-mail address, telephone/fax numbers, assets, income and investment objectives through applications and other forms you submit to us.
• We may obtain information about account balances, your use of account(s) and the types of products and services you prefer to receive from us through your dealings and transactions with us and other sources.
• We may obtain information about your creditworthiness and credit history from consumer reporting agencies.
• We may collect background information from and through third-party vendors to verify representations you have made and to comply with various regulatory requirements.
2. WHEN DO WE DISCLOSE PERSONAL INFORMATION WE COLLECT ABOUT YOU?
We may disclose personal information we collect about you in each of the categories listed above to affiliated and nonaffiliated third parties.
29
Morgan Stanley Institutional Fund, Inc.
Annual Report — December 31, 2015
U.S. Privacy Policy (unaudited) (cont'd)
a. Information We Disclose to Affiliated Companies.
We may disclose personal information that we collect about you to our affiliated companies to manage your account(s) effectively, to service and process your transactions, and to let you know about products and services offered by us and affiliated companies, to manage our business, and as otherwise required or permitted by law. Offers for products and services from affiliated companies are developed under conditions designed to safeguard your personal information.
b. Information We Disclose to Third Parties.
We may disclose personal information that we collect about you to nonaffiliated third parties to provide marketing services on our behalf or to other financial institutions with whom we have joint marketing agreements. We may also disclose all of the information we collect to other nonaffiliated third parties for our everyday business purposes, such as to process transactions, maintain account(s), respond to court orders and legal investigations, report to credit bureaus, offer our own products and services, protect against fraud, for institutional risk control, to perform services on our behalf, and as otherwise required or permitted by law.
When we share personal information about you with a nonaffiliated third party, they are required to limit their use of personal information about you to the particular purpose for which it was shared and they are not allowed to share personal information about you with others except to fulfill that limited purpose or as may be permitted or required by law.
3. HOW DO WE PROTECT THE SECURITY AND CONFIDENTIALITY OF PERSONAL INFORMATION WE COLLECT ABOUT YOU?
We maintain physical, electronic and procedural security measures that comply with applicable law and regulations to help safeguard the personal information we collect about you. We have internal policies governing the proper handling of client information by employees. Third parties that provide support or marketing services on our behalf may also receive personal information about you, and we require them to adhere to appropriate security standards with respect to such information.
4. HOW CAN YOU LIMIT OUR SHARING CERTAIN PERSONAL INFORMATION ABOUT YOU WITH OUR AFFILIATED COMPANIES FOR ELIGIBILITY DETERMINATION?
By following the opt-out procedures in Section 6 below, you may limit the extent to which we share with our affiliated companies, personal information that was collected to determine your eligibility for products and services such as your credit reports and other information that you have provided to us or that we may obtain from third parties ("eligibility information"). Eligibility information does not include your identification information or personal information pertaining to our transactions or experiences with you. Please note that, even if you direct us not to share eligibility information with our affiliated companies, we may still share your personal information, including eligibility information, with our affiliated companies under circumstances that are permitted under applicable law, such as to process transactions or to service your account.
5. HOW CAN YOU LIMIT THE USE OF CERTAIN PERSONAL INFORMATION ABOUT YOU BY OUR AFFILIATED COMPANIES FOR MARKETING?
By following the opt-out instructions in Section 6 below, you may limit our affiliated companies from marketing their products or services to you based on personal information we disclose to them. This information may include, for example, your income and account history with us. Please note that, even if you choose to limit our affiliated companies from using personal information about you that we may share with them for marketing their products and services to you, our affiliated companies may use your personal information that they obtain from us to market to you in circumstances permitted by law, such as if the affiliated party has its own relationship with you.
30
Morgan Stanley Institutional Fund, Inc.
Annual Report — December 31, 2015
U.S. Privacy Policy (unaudited) (cont'd)
6. HOW CAN YOU SEND US AN OPT-OUT INSTRUCTION?
If you wish to limit our sharing of eligibility information about you with our affiliated companies, or our affiliated companies' use of personal information for marketing purposes, as described in this notice, you may do so by:
• Calling us at (800) 548-7786
Monday–Friday between 8a.m. and 6p.m. (EST)
• Writing to us at the following address:
Boston Financial Data Services, Inc.
c/o Privacy Coordinator
P.O. Box 219804
Kansas City, Missouri 64121
If you choose to write to us, your request should include: your name, address, telephone number and account number(s) to which the opt-out applies and whether you are opting out with respect to sharing of eligibility information (Section 4 above), or information used for marketing (Section 5 above), or both. Written opt-out requests should not be sent with any other correspondence. In order to process your request, we require that the request be provided by you directly and not through a third party. Once you have informed us about your privacy preferences, your opt-out preference will remain in effect with respect to this Policy (as it may be amended) until you notify us otherwise. If you are a joint account owner, we will accept instructions from any one of you and apply those instructions to the entire account.
Please understand that if you limit our sharing or our affiliated companies' use of personal information, you and any joint account holder(s) may not receive information about our affiliated companies' products and services, including products or services that could help you manage your financial resources and achieve your investment objectives.
If you have more than one account or relationship with us, please specify the accounts to which you would like us to apply your privacy choices. If you have accounts or relationships with our affiliates, you may receive multiple privacy policies from them, and will need to separately notify those companies of your privacy choices for those accounts or relationships.
7. WHAT IF AN AFFILIATED COMPANY BECOMES A NONAFFILIATED THIRD PARTY?
If, at any time in the future, an affiliated company becomes a nonaffiliated third party, further disclosures of personal information made to the former affiliated company will be limited to those described in Section 2(b) above relating to nonaffiliated third parties. If you elected under Section 6 to limit disclosures we make to affiliated companies, or use of personal information by affiliated companies, your election will not apply to use by any former affiliated company of your personal information in their possession once it becomes a nonaffiliated third party.
SPECIAL NOTICE TO RESIDENTS OF VERMONT
The following section supplements our Policy with respect to our individual clients who have a Vermont address and supersedes anything to the contrary in the above Policy with respect to those clients only.
The State of Vermont requires financial institutions to obtain your consent prior to sharing personal information that they collect about you with nonaffiliated third parties, or eligibility information with affiliated companies, other than in certain limited circumstances. Except as permitted by law, we will not share personal information we collect about you with nonaffiliated third parties or eligibility information with affiliated companies, unless you provide us with your written consent to share such information.
SPECIAL NOTICE TO RESIDENTS OF CALIFORNIA
The following section supplements our Policy with respect to our individual clients who have a California address and supersedes anything to the contrary in the above Policy with respect to those clients only.
In response to a California law, if your account has a California home address, your personal information will not be disclosed to nonaffiliated third parties except as permitted by applicable California law, and we will limit sharing such personal information with our affiliates to comply with California privacy laws that apply to us.
31
Morgan Stanley Institutional Fund, Inc.
Annual Report — December 31, 2015
Director and Officer Information (unaudited)
Independent Directors:
| Name, Age and Address of Independent Director | Positions(s) Held with Registrant | Length of Time Served | Principal Occupation(s) During Past 5 Years and Other Relevant Professional Experience | Number of Portfolios in Fund Complex Overseen by Director** | Other Directorships Held by Independent Director*** | ||||||||||||||||||
| Frank L. Bowman (71) c/o Kramer Levin Naftalis & Frankel LLP Counsel to the Independent Directors 1177 Avenue of the Americas New York, NY 10036 | Director | Since August 2006 | President, Strategic Decisions, LLC (consulting) (since February 2009); Director or Trustee of various Morgan Stanley Funds (since August 2006); Chairperson of the Compliance and Insurance Committee (since October 2015); Formerly, Chairperson of the Insurance Sub-Committee of the Compliance and Insurance Committee (February 2007-December 2015); served as President and Chief Executive Officer of the Nuclear Energy Institute (policy organization) (February 2005-November 2008); retired as Admiral, U.S. Navy after serving over 38 years on active duty including 8 years as Director of the Naval Nuclear Propulsion Program in the Department of the Navy and the U.S. Department of Energy (1996-2004); served as Chief of Naval Personnel (July 1994-September 1996); and on the Joint Staff as Director of Political Military Affairs (June 1992-July1994); knighted as Honorary Knight Commander of the Most Excellent Order of the British Empire; awarded the Officier de l'Orde National du Mérite by the French Government; elected to the National Academy of Engineering (2009). | 98 | Director of BP p.l.c.; Director of Naval and Nuclear Technologies LLP; Director Emeritus of the Armed Services YMCA; Director of the U.S. Naval Submarine League; Member of National Security Advisory Council of the Center for U.S. Global Engagement and a member of the CNA Military Advisory Board; Chairman of the Charity, J Street Cup Golf, Trustee of Fairhaven United Methodist Church; and Director of other various non-profit organizations. | ||||||||||||||||||
| Kathleen A. Dennis (62) c/o Kramer Levin Naftalis & Frankel LLP Counsel to the Independent Directors 1177 Avenue of the Americas New York, NY 10036 | Director | Since August 2006 | President, Cedarwood Associates (mutual fund and investment management consulting) (since July 2006); Chairperson of the Money Market and Alternatives Sub-Committee of the Investment Committee (since October 2006) and Director or Trustee of various Morgan Stanley Funds (since August 2006); formerly, Senior Managing Director of Victory Capital Management (1993-2006). | 98 | Director of various nonprofit organizations. | ||||||||||||||||||
| Nancy C. Everett (61) c/o Kramer Levin Naftalis & Frankel LLP Counsel to the Independent Directors 1177 Avenue of the Americas New York, NY 10036 | Director | Since January 2015 | Chief Executive Officer, Virginia Commonwealth University Investment Company (since November 2015); Owner, OBIR, LLC (investment management consulting) (since June 2014); formerly, Managing Director, BlackRock Inc. (February 2011-December 2013); and Chief Executive Officer, General Motors Asset Management (a/k/a Promark Global Advisors, Inc.) (June 2005-May 2010). | 98 | Member of Virginia Commonwealth University School of Business Foundation; formerly, Member of Virginia Commonwealth University Board of Visitors (2013-2015); Member of Committee on Directors for Emerging Markets Growth Fund, Inc. (2007-2010); Chairperson of Performance Equity Management, LLC (2006-2010); and Chairperson, GMAM Absolute Return Strategies Fund, LLC (2006-2010). | ||||||||||||||||||
32
Morgan Stanley Institutional Fund, Inc.
Annual Report — December 31, 2015
Director and Officer Information (unaudited) (cont'd)
Independent Directors: (cont'd)
| Name, Age and Address of Independent Director | Positions(s) Held with Registrant | Length of Time Served | Principal Occupation(s) During Past 5 Years and Other Relevant Professional Experience | Number of Portfolios in Fund Complex Overseen by Director** | Other Directorships Held by Independent Director*** | ||||||||||||||||||
| Jakki L. Haussler (58) c/o Kramer Levin Naftalis & Frankel LLP Counsel to the Independent Directors 1177 Avenue of the Americas New York, NY 10036 | Director | Since January 2015 | Chairman and Chief Executive Officer, Opus Capital Group (since January 1996); and formerly, Director, Capvest Venture Fund, LP (May 2000-December 2011); Partner, Adena Ventures, LP (July 1999-December 2010); Director, The Victory Funds (February 2005-July 2008). | 98 | Director of Cincinnati Bell Inc. and Member, Audit Committee and Compensation Committee; Director of Northern Kentucky University Foundation and Member, Investment Committee; Member of Chase College of Law Transactional Law Practice Center Board of Advisors; Director of Best Transport; Chase College of Law Board of Visitors; formerly, Member, University of Cincinnati Foundation Investment Committee; Member, Miami University Board of Visitors (2008-2011); Trustee of Victory Funds (2005-2008) and Chairman, Investment Committee (2007-2008) and Member, Service Provider Committee (2005-2008). | ||||||||||||||||||
| Dr. Manuel H. Johnson (67) c/o Johnson Smick International, Inc. 220 I Street, N.E. — Suite 200 Washington, D.C. 20002 | Director | Since July 1991 | Senior Partner, Johnson Smick International, Inc. (consulting firm); Chairperson of the Investment Committee (since October 2006) and Director or Trustee of various Morgan Stanley Funds (since July 1991); Co-Chairman and a founder of the Group of Seven Council (G7C) (international economic commission); formerly Chairperson of the Audit Committee (July 1991-September 2006), Vice Chairman of the Board of Governors of the Federal Reserve System and Assistant Secretary of the U.S. Treasury. | 100 | Director of NVR, Inc. (home construction). | ||||||||||||||||||
| Joseph J. Kearns (73) c/o Kearns & Associates LLC 23823 Malibu Road S-50-440 Malibu, CA 90265 | Director | Since August 1994 | President, Kearns & Associates LLC (investment consulting); Chairperson of the Audit Committee (since October 2006) and Director or Trustee of various Morgan Stanley Funds (since August 1994); formerly, Deputy Chairperson of the Audit Committee (July 2003-September 2006) and Chairperson of the Audit Committee of various Morgan Stanley Funds (since August 1994); CFO of the J. Paul Getty Trust. | 101 | Director of Electro Rent Corporation (equipment leasing). Prior to December 31, 2013, Director of The Ford Family Foundation. | ||||||||||||||||||
33
Morgan Stanley Institutional Fund, Inc.
Annual Report — December 31, 2015
Director and Officer Information (unaudited) (cont'd)
Independent Directors: (cont'd)
| Name, Age and Address of Independent Director | Positions(s) Held with Registrant | Length of Time Served | Principal Occupation(s) During Past 5 Years and Other Relevant Professional Experience | Number of Portfolios in Fund Complex Overseen by Director** | Other Directorships Held by Independent Director*** | ||||||||||||||||||
| Michael F. Klein (57) c/o Kramer Levin Naftalis & Frankel LLP Counsel to the Independent Directors 1177 Avenue of the Americas New York, NY 10036 | Director | Since August 2006 | Managing Director, Aetos Capital, LLC (since March 2000); Co-President, Aetos Alternatives Management, LLC (since January 2004); and Co-Chief Executive Officer of Aetos Capital LLC (since August 2013); Chairperson of the Fixed Income Sub-Committee of the Investment Committee (since October 2006) and Director or Trustee of various Morgan Stanley Funds (since August 2006); formerly, Managing Director, Morgan Stanley & Co. Inc. and Morgan Stanley Dean Witter Investment Management, President, various Morgan Stanley Funds (June1998-March 2000) and Principal, Morgan Stanley & Co. Inc. and Morgan Stanley Dean Witter Investment Management (August 1997-December 1999). | 97 | Director of certain investment funds managed or sponsored by Aetos Capital, LLC. Director of Sanitized AG and Sanitized Marketing AG (specialty chemicals). | ||||||||||||||||||
| Michael E. Nugent (79) 522 Fifth Avenue New York, NY 10036 | Chair of the Board and Director | Chair of the Boards since July 2006 and Director since July 1991 | Chair of the Boards of various Morgan Stanley Funds (since July 2006); Chairperson of the Closed-End Fund Committee (since June 2012) and Director or Trustee of various Morgan Stanley Funds (since July 1991); formerly, Chairperson of the Insurance Committee (until July 2006), General Partner, TriumphCapital, L.P. (private investment partnership) (1988-2013). | 100 | None. | ||||||||||||||||||
| W. Allen Reed (68) c/o Kramer Levin Naftalis & Frankel LLP Counsel to the Independent Directors 1177 Avenue of the Americas New York, NY 10036 | Director | Since August 2006 | Chairperson of the Equity Sub-Committee of the Investment Committee (since October 2006) and Director or Trustee of various Morgan Stanley Funds (since August 2006); formerly, President and CEO of General Motors Asset Management; Chairman and Chief Executive Officer of the GM Trust Bank and Corporate Vice President of General Motors Corporation (August 1994-December 2005). | 98 | Director of Legg Mason, Inc.; formerly, Director of the Auburn University Foundation (2010-2015). | ||||||||||||||||||
| Fergus Reid (83) c/o Joe Pietryka, Inc. 85 Charles Colman Blvd. Pawling, NY 12564 | Director | Since June 1992 | Chairman, Joe Pietryka, Inc.; Chairperson of the Governance Committee and Director or Trustee of various Morgan Stanley Funds (since June 1992). | 100 | Formerly, Trustee and Director of certain investment companies in the JP Morgan Fund Complex managed by JP Morgan Investment Management Inc. (1987-2012). | ||||||||||||||||||
34
Morgan Stanley Institutional Fund, Inc.
Annual Report — December 31, 2015
Director and Officer Information (unaudited) (cont'd)
Interested Director:
| Name, Age and Address of Interested Director | Positions(s) Held with Registrant | Length of Time Served* | Principal Occupation(s) During Past 5 Years | Number of Portfolios in Fund Complex Overseen by Interested Director** | Other Directorships Held by Interested Director*** | ||||||||||||||||||
| James F. Higgins (68) One New York Plaza, New York, NY 10004 | Director | Since June 2000 | Director or Trustee of various Morgan Stanley Funds (since June 2000); Senior Advisor of Morgan Stanley (since August 2000). | 99 | Formerly, Director of AXA Financial, Inc. and AXA Equitable Life Insurance Company (2002-2011) and Director of AXA MONY Life Insurance Company and AXA MONY Life Insurance Company of America (2004-2011). | ||||||||||||||||||
* This is the earliest date the Director began serving the Morgan Stanley Funds. Each Director serves an indefinite term, until his or her successor is elected.
** The Fund Complex includes (as of December 31, 2015) all open-end and closed-end funds (including all of their portfolios) advised by Morgan Stanley Investment Management Inc. (the "Adviser") and any funds that have an adviser that is an affiliated person of the Adviser (including, but not limited to, Morgan Stanley AIP GP LP).
*** This includes any directorships at public companies and registered investment companies held by the Director at any time during the past five years.
Executive Officers:
Name, Age and Address of Executive Officer | Position(s) Held with Registrant | Length of Time Served**** | Principal Occupation(s) During Past 5 Years | ||||||||||||
| John H. Gernon (52) 522 Fifth Avenue New York, NY 10036 | President and Principal Executive Officer | Since September 2013 | President and Principal Executive Officer of the Equity and Fixed Income Funds and the Morgan Stanley AIP Funds (since September 2013) and the Liquidity Funds and various money market funds (since May 2014) in the Fund Complex, Managing Director of the Adviser; Head of Product (since 2006). | ||||||||||||
| Stefanie V. Chang Yu (49) 522 Fifth Avenue New York, NY 10036 | Chief Compliance Officer | Since December 1997 | Managing Director of the Adviser and various entities affiliated with the Adviser; Chief Compliance Officer of various Morgan Stanley Funds and the Adviser (since January 2014); formerly, Vice President of various Morgan Stanley Funds (December 1997-January 2014). | ||||||||||||
| Joseph C. Benedetti (50) 522 Fifth Avenue New York, NY 10036 | Vice President | Since January 2014 | Managing Director of the Adviser and various entities affiliated with the Adviser; Vice President of various Morgan Stanley Funds (since January 2014); formerly, Assistant Secretary of various Morgan Stanley Funds (October 2004-January 2014). | ||||||||||||
| Francis J. Smith (50) 522 Fifth Avenue New York, NY 10036 | Treasurer and Principal Financial Officer | Treasurer since July 2003 and Principal Financial Officer since September 2002 | Executive Director of the Adviser and various entities affiliated with the Adviser; Treasurer (since July 2003) and Principal Financial Officer of various Morgan Stanley Funds (since September 2002). | ||||||||||||
| Mary E. Mullin (48) 522 Fifth Avenue New York, NY 10036 | Secretary | Since June 1999 | Executive Director of the Adviser; Secretary of various Morgan Stanley Funds (since June 1999). | ||||||||||||
**** This is the earliest date the officer began serving the Morgan Stanley Funds. Each officer serves a one-year term, until his or her successor is elected and has qualified.
35
Morgan Stanley Institutional Fund, Inc.
Annual Report — December 31, 2015
Adviser and Administrator
Morgan Stanley Investment Management Inc.
522 Fifth Avenue
New York, New York 10036
Distributor
Morgan Stanley Distribution, Inc.
522 Fifth Avenue
New York, New York 10036
Dividend Disbursing and Transfer Agent
Boston Financial Data Services, Inc.
2000 Crown Colony Drive
Quincy, Massachusetts 02169
Custodian
State Street Bank and Trust Company
One Lincoln Street
Boston, Massachusetts 02111
Legal Counsel
Dechert LLP
1095 Avenue of the Americas
New York, New York 10036
Counsel to the Independent Directors
Kramer Levin Naftalis & Frankel LLP
1177 Avenue of the Americas
New York, New York 10036
Independent Registered Public Accounting Firm
Ernst & Young LLP
200 Clarendon Street
Boston, Massachusetts 02116
Reporting to Shareholders
Each Morgan Stanley fund provides a complete schedule of portfolio holdings in its semi-annual and annual reports within 60 days of the end of the fund's second and fourth fiscal quarters. The semi-annual and annual reports are filed electronically with the Securities and Exchange Commission (SEC) on Form N-CSRS and Form N-CSR, respectively. Morgan Stanley also delivers the semi-annual and annual reports to fund shareholders and makes these reports available on its public website, www.morganstanley.com/im. Each Morgan Stanley fund also files a complete schedule of portfolio holdings with the SEC for the fund's first and third fiscal quarters on Form N-Q. Morgan Stanley does not deliver the reports for the first and third fiscal quarters to shareholders, nor are the reports posted to the Morgan Stanley public website. You may, however, obtain the Form N-Q filings (as well as the Form N-CSR and N-CSRS filings) by accessing the SEC's website, www.sec.gov. You may also review and copy them at the SEC's Public Reference Room in Washington, DC. Information on the operation of the SEC's Public Reference Room may be obtained by calling the SEC toll free at 1 (800) SEC-0330. You can also request copies of these materials, upon payment of a duplicating fee, by electronic request at the SEC's email address (publicinfo@sec.gov) or by writing the Public Reference Room of the SEC, Washington, DC 20549-0102.
Proxy Voting Policies and Procedures and Proxy Voting Record
You may obtain a copy of the Fund's Proxy Voting Policy and Procedures and information regarding how the Fund voted proxies relating to portfolio securities during the most recent twelve-month period ended June 30, without charge, upon request, by calling toll free 1 (800) 548-7786 or by visiting our website at www.morganstanley.com/im. This information is also available on the SEC's website at www.sec.gov.
This report is authorized for distribution only when preceded or accompanied by a prospectus of the Morgan Stanley Institutional Fund, Inc., which describes in detail each Portfolio's investment policies, risks, fees and expenses. Please read the prospectus carefully before you invest or send money. For additional information, including information regarding the investments comprising the Portfolio, please visit our website at www.morganstanley.com/im or call toll free 1 (800) 548-7786.
36
Printed in U.S.A.
This Report has been prepared for shareholders and may be distributed to others only if preceded or accompanied by a current prospectus.
Morgan Stanley Investment Management Inc.
522 Fifth Avenue
New York, New York 10036
© 2016 Morgan Stanley. Morgan Stanley Distribution, Inc.

IFIADVANN
1407747 EXP. 02.28.17
INVESTMENT MANAGEMENT

Morgan Stanley Institutional Fund, Inc.
Asia Opportunity Portfolio
Annual Report
December 31, 2015

Morgan Stanley Institutional Fund, Inc.
Annual Report — December 31, 2015
Table of Contents
Shareholders' Letter | 2 | ||||||
Expense Example | 3 | ||||||
Investment Overview | 4 | ||||||
Portfolio of Investments | 5 | ||||||
Statement of Assets and Liabilities | 6 | ||||||
Statement of Operations | 7 | ||||||
Statement of Changes in Net Assets | 8 | ||||||
Financial Highlights | 9 | ||||||
Notes to Financial Statements | 13 | ||||||
Report of Independent Registered Public Accounting Firm | 19 | ||||||
Investment Advisory Agreement Approval | 20 | ||||||
U.S. Privacy Policy | 22 | ||||||
Director and Officer Information | 25 | ||||||
This report is authorized for distribution only when preceded or accompanied by prospectuses of the Morgan Stanley Institutional Fund, Inc. To receive a prospectus and/or statement of additional information (SAI), which contains more complete information such as investment objectives, charges, expenses, policies for voting proxies, risk considerations, and describes in detail each of the Portfolio's investment policies to the prospective investor, please call toll free 1 (800) 548-7786. Please read the prospectuses carefully before you invest or send money.
Additionally, you can access portfolio information including performance, characteristics, and investment team commentary through Morgan Stanley Investment Management's website: www.morganstanley.com/im.
Market forecasts provided in this report may not necessarily come to pass. There is no guarantee that any sectors mentioned will continue to perform as discussed herein or that securities in such sectors will be held by the Portfolio in the future. There is no assurance that a Portfolio will achieve its investment objective. Portfolios are subject to market risk, which is the possibility that market values of securities owned by the Portfolio will decline and, therefore, the value of the Portfolio's shares may be less than what you paid for them. Accordingly, you can lose money investing in this Portfolio. Please see the prospectus for more complete information on investment risks.
1
Morgan Stanley Institutional Fund, Inc.
Annual Report — December 31, 2015
Shareholders' Letter (unaudited)
Dear Shareholders,
We are pleased to provide this Annual report, in which you will learn how your investment in Asia Opportunity Portfolio (the "Portfolio") performed during the period ended December 31, 2015.
Morgan Stanley Investment Management is a client-centric, investor-led organization. Our global presence, intellectual capital, and breadth of products and services enable us to partner with investors to meet the evolving challenges of today's financial markets. We aim to deliver superior investment service and to empower our clients to make the informed decisions that help them reach their investment goals.
As always, we thank you for selecting Morgan Stanley Investment Management, and look forward to working with you in the months and years ahead.
Sincerely,

John H. Gernon
President and Principal Executive Officer
January 2016
2
Morgan Stanley Institutional Fund, Inc.
Annual Report — December 31, 2015
Expense Example (unaudited)
Asia Opportunity Portfolio
As a shareholder of the Portfolio, you incur two types of costs: (1) transactional costs; including redemptions fees and (2) ongoing costs, including advisory fees, administration fees, distribution and shareholder services fees and other Portfolio expenses. This example is intended to help you understand your ongoing costs (in dollars) of investing in the Portfolio and to compare these costs with the ongoing costs of investing in other mutual funds.
This example is based on an investment of $1,000 invested at the beginning of the period and held for the entire period 12/29/15 — 12/31/15 (unless otherwise noted).
Actual Expenses
The table below provides information about actual account values and actual expenses. You may use the information in this table, together with the amount you invested, to estimate the expenses that you paid over the period. Simply divide your account value by $1,000 (for example, an $8,600 account value divided by $1,000 = 8.6), then multiply the result by the number in the table under the heading entitled "Actual Expenses Paid During Period" to estimate the expenses you paid on your account during this period.
Hypothetical Example for Comparison Purposes
The table below provides information about hypothetical account values and hypothetical expenses based on the Portfolio's actual expense ratio and an assumed rate of return of 5% per year before expenses, which is not the Portfolio's actual return. The hypothetical account values and expenses may not be used to estimate the actual ending account balance or expenses you paid for the period. You may use this information to compare the ongoing costs of investing in the Portfolio and other funds. To do so, compare this 5% hypothetical example with the 5% hypothetical examples that appear in the shareholder reports of the other funds.
Please note that the expenses shown in the table are meant to highlight your ongoing costs only and do not reflect any transactional costs, such as sales charges (loads) and redemption fees. Therefore, the information for each class in the table is useful in comparing ongoing costs only, and will not help you determine the relative total costs of owning different funds. In addition, if these transactional costs were included, your costs would have been higher.
| Beginning Account Value 12/29/15 | Actual Ending Account Value 12/31/15 | Hypothetical Ending Account Value | Actual Expenses Paid During Period* | Hypothetical Expenses Paid During Period* | Net Expense Ratio During Period** | ||||||||||||||||||||||
Asia Opportunity Portfolio Class I^ | $ | 1,000.00 | $ | 1,003.00 | $ | 1,000.22 | $ | 0.06 | $ | 0.06 | 1.03 | % | |||||||||||||||
Asia Opportunity Portfolio Class A^ | 1,000.00 | 1,003.00 | 1,000.20 | 0.08 | 0.08 | 1.40 | |||||||||||||||||||||
Asia Opportunity Portfolio Class C^ | 1,000.00 | 1,003.00 | 1,000.16 | 0.12 | 0.12 | 2.17 | |||||||||||||||||||||
Asia Opportunity Portfolio Class IS^ | 1,000.00 | 1,003.00 | 1,000.22 | 0.06 | 0.06 | 1.02 | |||||||||||||||||||||
* Expenses are calculated using each Portfolio Class' annualized net expense ratio (as disclosed), multiplied by the average account value over the period, and multiplied by 2/365 (to reflect the actual days in the period).
** Annualized.
^ Class I, A, C and IS commenced operations on 12/29/15.
3
Morgan Stanley Institutional Fund, Inc.
Annual Report — December 31, 2015
Investment Overview (unaudited)
Asia Opportunity Portfolio
The Portfolio seeks long-term capital appreciation.
Performance
For the period from inception on December 29, 2015 through December 31, 2015, the Portfolio's Class I shares had a total return of 0.30%, net of fees. The Portfolio's benchmark, the MSCI All Country Asia ex Japan Index (the "Index"), returned –0.18% for the same period.
Factors Affecting Performance
• The Portfolio launched a few days prior to the close of the reporting period. Such a short time frame would not provide a meaningful performance analysis as short-term returns may not be indicative of the Portfolio's long-term performance potential.
Management Strategies
• The Growth Team seeks high-quality companies, which we define primarily as those with sustainable competitive advantages. Our team continues to focus on bottom-up stock selection and the long-term outlook for companies owned in the Portfolio.
Performance Compared to the MSCI All Country Asia ex Japan Index(1) and the Lipper Pacific Region ex Japan Funds Index(2)
| Period Ended December 31, 2015 Total Returns(3) | |||||||||||||||||||
| One Year | Five Years | Ten Years | Since Inception(5) | ||||||||||||||||
| Portfolio — Class I Shares w/o sales charges(4) | — | — | — | 0.30 | % | ||||||||||||||
| Portfolio — Class A Shares w/o sales charges(4) | — | — | — | 0.30 | |||||||||||||||
| Portfolio — Class A Shares with maximum 5.25% sales charges(4) | — | — | — | –4.93 | |||||||||||||||
| Portfolio — Class C Shares w/o sales charges(4) | — | — | — | 0.30 | |||||||||||||||
| Portfolio — Class C Shares with maximum 1.00% deferred sales charges(4) | — | — | — | –0.70 | |||||||||||||||
| Portfolio — Class IS Shares w/o sales charges(4) | — | — | — | 0.30 | |||||||||||||||
MSCI All Country Asia ex Japan Index | — | — | — | –0.18 | |||||||||||||||
| Lipper Pacific Region ex Japan Funds Index | — | — | — | –0.66 | |||||||||||||||
Performance data quoted represents past performance, which is no guarantee of future results, and current performance may be lower or higher than the figures shown. Performance assumes that all dividends and distributions, if any, were reinvested. For the most recent month-end performance figures, please visit www.morganstanley.com/im. Investment return and principal value will fluctuate so that Portfolio shares, when redeemed, may be worth more or less than their original cost. Total returns do not reflect the deduction of taxes that a shareholder would pay on Portfolio distributions or the redemption of Portfolio shares. Returns for periods less than one year are not annualized. Performance of share classes will vary due to difference in sales charges and expenses.
(1) The MSCI All Country Asia ex Japan Index is a free float-adjusted market capitalization weighted index that is designed to measure the equity market performance of Asia, excluding Japan. The performance of the Index is listed in U.S. dollars and assumes reinvestment of net dividends. The Index is unmanaged and its returns do not include any sales charges or fees. Such costs would lower performance. It is not possible to invest directly in an index.
(2) The Lipper Pacific Region ex Japan Funds Index is an equally weighted performance index of the largest qualifying funds (based on net assets) in the Lipper Pacific Region ex Japan Funds classification. The Index, which is adjusted for capital gains distributions and income dividends, is unmanaged and should not be considered an investment. There are currently 10 funds represented in this Index. As of the date of this report, the Portfolio was in the Lipper Pacific Region ex Japan Funds classification.
(3) Total returns for the Portfolio reflect fees waived and expenses reimbursed, if applicable, by the Adviser. Without such waivers and reimbursements, total returns would have been lower.
(4) Commenced operations on December 29, 2015.
(5) For comparative purposes, average annual since inception returns listed for the Indexes refer to the inception date of the Portfolio, not the inception of the Index.
4
Morgan Stanley Institutional Fund, Inc.
Annual Report — December 31, 2015
Portfolio of Investments
Asia Opportunity Portfolio
Shares | Value (000) | ||||||||||
Common Stocks (81.6%) | |||||||||||
China (40.3%) | |||||||||||
Autohome, Inc. ADR (a) | 3,134 | $ | 110 | ||||||||
Baidu, Inc. ADR (a) | 581 | 110 | |||||||||
China Resources Beer Holdings Company Ltd. (b) | 110,000 | 235 | |||||||||
Ctrip.com International Ltd. ADR (a) | 3,504 | 162 | |||||||||
| Foshan Haitian Flavouring & Food Co., Ltd., Class A | 20,600 | 112 | |||||||||
| Inner Mongolia Yili Industrial Group Co., Ltd., Class A | 44,100 | 111 | |||||||||
JD.com, Inc. ADR (a) | 6,146 | 198 | |||||||||
Jiangsu Hengrui Medicine Co., Ltd., Class A | 29,700 | 224 | |||||||||
Kweichow Moutai Co., Ltd., Class A (a) | 5,800 | 194 | |||||||||
TAL Education Group ADR (a) | 8,929 | 415 | |||||||||
Tencent Holdings Ltd. (b) | 20,100 | 392 | |||||||||
2,263 | |||||||||||
Hong Kong (6.8%) | |||||||||||
AIA Group Ltd. | 44,800 | 267 | |||||||||
Wenzhou Kangning Hospital Co., Ltd. H Shares (a) | 19,200 | 115 | |||||||||
382 | |||||||||||
India (4.9%) | |||||||||||
HDFC Bank Ltd. ADR | 4,450 | 274 | |||||||||
Korea, Republic of (18.2%) | |||||||||||
Amorepacific Corp. (a) | 639 | 224 | |||||||||
Loen Entertainment, Inc. (a) | 3,217 | 229 | |||||||||
Medy-Tox, Inc. | 619 | 266 | |||||||||
NAVER Corp. (a) | 204 | 114 | |||||||||
ViroMed Co., Ltd. (a) | 1,218 | 189 | |||||||||
1,022 | |||||||||||
Philippines (2.5%) | |||||||||||
Universal Robina Corp. | 35,970 | 142 | |||||||||
Taiwan (2.5%) | |||||||||||
Taiwan Semiconductor Manufacturing Co., Ltd. | 32,000 | 138 | |||||||||
United States (6.4%) | |||||||||||
Cognizant Technology Solutions Corp., Class A (a) | 6,017 | 361 | |||||||||
Total Common Stocks (Cost $4,587) | 4,582 | ||||||||||
Participation Notes (11.9%) | |||||||||||
China (9.4%) | |||||||||||
| Jiangsu Yanghe Brewery, Class A, Equity Linked Notes, expires 1/23/17 (a) | 26,141 | 275 | |||||||||
| Midea Group Co., Ltd., Class A, Equity Linked Notes, expires 1/6/20 (a) | 29,300 | 148 | |||||||||
| Zhejiang Supor Cookware Co., Ltd., Class A, Equity Linked Notes, expires 12/24/18 (a) | 25,200 | 108 | |||||||||
531 | |||||||||||
India (2.5%) | |||||||||||
| Monsanto India Ltd., Equity Linked Notes, expires 12/29/17 (a) | 4,170 | 138 | |||||||||
Total Participation Notes (Cost $657) | 669 | ||||||||||
Shares | Value (000) | ||||||||||
Short-Term Investment (85.8%) | |||||||||||
Investment Company (85.8%) | |||||||||||
| Morgan Stanley Institutional Liquidity Funds — Money Market Portfolio — Institutional Class (See Note G) (Cost $4,820) | 4,820,213 | $ | 4,820 | ||||||||
Total Investments (179.3%) (Cost $10,064) (c)(d) | 10,071 | ||||||||||
Liabilities in Excess of Other Assets (–79.3%) | (4,454 | ) | |||||||||
Net Assets (100.0%) | $ | 5,617 | |||||||||
(a) Non-income producing security.
(b) Security trades on the Hong Kong exchange.
(c) The approximate fair value and percentage of net assets, $2,837,000 and 50.5%, respectively, represent the securities that have been fair valued under the fair valuation policy for international investments as described in Note A-1 within the Notes to the Financial Statements.
(d) At December 31, 2015, the aggregate cost for Federal income tax purposes is approximately $10,064,000. The aggregate gross unrealized appreciation is approximately $46,000 and the aggregate gross unrealized depreciation is approximately $39,000 resulting in net unrealized appreciation of approximately $7,000.
ADR American Depositary Receipt.
Portfolio Composition
Classification | Percentage of Total Investments | ||||||
Short-Term Investment | 47.9 | % | |||||
Other* | 44.9 | ||||||
Internet Software & Services | 7.2 | ||||||
Total Investments | 100.0 | % | |||||
* Industries and/or investment types representing less than 5% of total investments.
The accompanying notes are an integral part of the financial statements.
5
Morgan Stanley Institutional Fund, Inc.
Annual Report — December 31, 2015
Asia Opportunity Portfolio
Statement of Assets and Liabilities | December 31, 2015 (000) | ||||||
Assets: | |||||||
Investments in Securities of Unaffiliated Issuers, at Value (Cost $5,244) | $ | 5,251 | |||||
Investment in Security of Affiliated Issuer, at Value (Cost $4,820) | 4,820 | ||||||
Total Investments in Securities, at Value (Cost $10,064) | 10,071 | ||||||
Prepaid Offering Costs | 150 | ||||||
Due from Adviser | 38 | ||||||
Receivable from Affiliate | — | @ | |||||
Other Assets | 2 | ||||||
Total Assets | 10,261 | ||||||
Liabilities: | |||||||
Payable for Investments Purchased | 4,455 | ||||||
Payable for Offering Costs | 151 | ||||||
Payable for Professional Fees | 34 | ||||||
Payable for Transfer Agency Fees — Class I | — | @ | |||||
Payable for Transfer Agency Fees — Class A | — | @ | |||||
Payable for Transfer Agency Fees — Class C | — | @ | |||||
Payable for Shareholder Services Fees — Class A | — | @ | |||||
Payable for Distribution and Shareholder Services Fees — Class C | — | @ | |||||
Payable for Custodian Fees | — | @ | |||||
Payable for Administration Fees | — | @ | |||||
Other Liabilities | 4 | ||||||
Total Liabilities | 4,644 | ||||||
Net Assets | $ | 5,617 | |||||
Net Assets Consist Of: | |||||||
Paid-in-Capital | $ | 5,600 | |||||
Accumulated Undistributed Net Investment Income | 8 | ||||||
Unrealized Appreciation (Depreciation) on: | |||||||
Investments | 7 | ||||||
Foreign Currency Translations | 2 | ||||||
Net Assets | $ | 5,617 | |||||
CLASS I: | |||||||
Net Assets | $ | 5,587 | |||||
| Shares Outstanding $0.001 par value shares of beneficial interest (unlimited shares authorized) (not in 000's) | 557,000 | ||||||
Net Asset Value, Offering and Redemption Price Per Share | $ | 10.03 | |||||
CLASS A: | |||||||
Net Assets | $ | 10 | |||||
| Shares Outstanding $0.001 par value shares of beneficial interest (unlimited shares authorized) (not in 000's) | 1,000 | ||||||
Net Asset Value, Redemption Price Per Share | $ | 10.03 | |||||
Maximum Sales Load | 5.25 | % | |||||
Maximum Sales Charge | $ | 0.56 | |||||
Maximum Offering Price Per Share | $ | 10.59 | |||||
CLASS C: | |||||||
Net Assets | $ | 10 | |||||
| Shares Outstanding $0.001 par value shares of beneficial interest (unlimited shares authorized) (not in 000's) | 1,000 | ||||||
Net Asset Value, Offering and Redemption Price Per Share | $ | 10.03 | |||||
CLASS IS: | |||||||
Net Assets | $ | 10 | |||||
| Shares Outstanding $0.001 par value shares of beneficial interest (unlimited shares authorized) (not in 000's) | 1,000 | ||||||
Net Asset Value, Offering and Redemption Price Per Share | $ | 10.03 | |||||
@ Amount is less than $500.
The accompanying notes are an integral part of the financial statements.
6
Morgan Stanley Institutional Fund, Inc.
Annual Report — December 31, 2015
Asia Opportunity Portfolio
Statement of Operations | Period from December 29, 2015^ to December 31, 2015 (000) | ||||||
Investment Income: | |||||||
Dividends from Security of Affiliated Issuer (Note G) | $ | — | @ | ||||
Expenses: | |||||||
Professional Fees | 34 | ||||||
Shareholder Reporting Fees | 3 | ||||||
Offering Costs | 1 | ||||||
Transfer Agency Fees — Class I (Note E) | — | @ | |||||
Transfer Agency Fees — Class A (Note E) | — | @ | |||||
Transfer Agency Fees — Class C (Note E) | — | @ | |||||
Transfer Agency Fees — Class IS (Note E) | — | @ | |||||
Shareholder Services Fees — Class A (Note D) | — | @ | |||||
Distribution and Shareholder Services Fees — Class C (Note D) | — | @ | |||||
Advisory Fees (Note B) | — | @ | |||||
Custodian Fees (Note F) | — | @ | |||||
Administration Fees (Note C) | — | @ | |||||
Pricing Fees | — | @ | |||||
Other Expenses | — | @ | |||||
Total Expenses | 38 | ||||||
Expenses Reimbursed by Adviser (Note B) | (38 | ) | |||||
Reimbursement of Class Specific Expenses — Class A (Note B) | (— | @) | |||||
Reimbursement of Class Specific Expenses — Class C (Note B) | (— | @) | |||||
Reimbursement of Class Specific Expenses — Class IS (Note B) | (— | @) | |||||
Waiver of Advisory Fees (Note B) | (— | @) | |||||
Rebate from Morgan Stanley Affiliate (Note G) | (— | @) | |||||
Net Expenses | — | @ | |||||
Net Investment Loss | (— | @) | |||||
Realized Gain: | |||||||
Foreign Currency Transactions | 8 | ||||||
Change in Unrealized Appreciation (Depreciation): | |||||||
Investments | 7 | ||||||
Foreign Currency Translations | 2 | ||||||
Net Change in Unrealized Appreciation (Depreciation) | 9 | ||||||
Net Realized Gain and Change in Unrealized Appreciation (Depreciation) | 17 | ||||||
Net Increase in Net Assets Resulting from Operations | $ | 17 | |||||
^ Commencement of Operations.
@ Amount is less than $500.
The accompanying notes are an integral part of the financial statements.
7
Morgan Stanley Institutional Fund, Inc.
Annual Report — December 31, 2015
Asia Opportunity Portfolio
Statement of Changes in Net Assets | Period from December 29, 2015^ to December 31, 2015 (000) | ||||||
Increase (Decrease) in Net Assets: | |||||||
Operations: | |||||||
Net Investment Loss | $ | (-— | @) | ||||
Net Realized Gain | 8 | ||||||
Net Change in Unrealized Appreciation (Depreciation) | 9 | ||||||
Net Increase in Net Assets Resulting from Operations | 17 | ||||||
Capital Share Transactions:(1) | |||||||
Class I: | |||||||
Subscribed | 5,570 | ||||||
Class A: | |||||||
Subscribed | 10 | ||||||
Class C: | |||||||
Subscribed | 10 | ||||||
Class IS: | |||||||
Subscribed | 10 | ||||||
Net Increase in Net Assets Resulting from Capital Share Transactions | 5,600 | ||||||
Total Increase in Net Assets | 5,617 | ||||||
Net Assets: | |||||||
Beginning of Period | — | ||||||
End of Period (Including Accumulated Undistributed Net Investment Income of $8) | $ | 5,617 | |||||
(1) Capital Share Transactions: | |||||||
Class I: | |||||||
Shares Subscribed | 557 | ||||||
Class A: | |||||||
Shares Subscribed | 1 | ||||||
Class C: | |||||||
Shares Subscribed | 1 | ||||||
Class IS: | |||||||
Shares Subscribed | 1 | ||||||
^ Commencement of Operations.
@ Amount is less than $500.
The accompanying notes are an integral part of the financial statements.
8
Morgan Stanley Institutional Fund, Inc.
Annual Report — December 31, 2015
Financial Highlights
Asia Opportunity Portfolio
Class I | |||||||
Selected Per Share Data and Ratios | Period from December 29, 2015^ to December 31, 2015 | ||||||
Net Asset Value, Beginning of Period | $ | 10.00 | |||||
Income (Loss) from Investment Operations: | |||||||
Net Investment Loss† | (0.00 | )‡ | |||||
Net Realized and Unrealized Gain | 0.03 | ||||||
Total from Investment Operations | 0.03 | ||||||
Net Asset Value, End of Period | $ | 10.03 | |||||
Total Return++ | 0.30 | %# | |||||
Ratios and Supplemental Data: | |||||||
Net Assets, End of Period (Thousands) | $ | 5,587 | |||||
Ratio of Expenses to Average Net Assets (1) | 1.03 | %+* | |||||
Ratio of Net Investment Loss to Average Net Assets (1) | (0.71 | )%+* | |||||
Ratio of Rebate from Morgan Stanley Affiliates to Average Net Assets | 0.04 | %* | |||||
Portfolio Turnover Rate | 0 | % | |||||
(1) Supplemental Information on the Ratios to Average Net Assets: | |||||||
Ratios Before Expense Limitation: | |||||||
Expenses to Average Net Assets | 125.50 | %* | |||||
Net Investment Loss to Average Net Assets | (125.18 | )%* | |||||
^ Commencement of Operations.
† Per share amount is based on average shares outstanding.
‡ Amount is less than $0.005 per share.
++ Calculated based on the net asset value as of the last business day of the period.
+ The Ratios of Expenses and Net Investment Loss reflect the rebate of certain Portfolio expenses in connection with the investments in Morgan Stanley affiliates during the period. The effect of the rebate on the ratios is disclosed in the above table as "Ratio of Rebate from Morgan Stanley Affiliates to Average Net Assets."
# Not Annualized.
* Annualized.
The accompanying notes are an integral part of the financial statements.
9
Morgan Stanley Institutional Fund, Inc.
Annual Report — December 31, 2015
Financial Highlights
Asia Opportunity Portfolio
Class A | |||||||
Selected Per Share Data and Ratios | Period from December 29, 2015^ to December 31, 2015 | ||||||
Net Asset Value, Beginning of Period | $ | 10.00 | |||||
Income (Loss) from Investment Operations: | |||||||
Net Investment Loss† | (0.00 | )‡ | |||||
Net Realized and Unrealized Gain | 0.03 | ||||||
Total from Investment Operations | 0.03 | ||||||
Net Asset Value, End of Period | $ | 10.03 | |||||
Total Return++ | 0.30 | %# | |||||
Ratios and Supplemental Data: | |||||||
Net Assets, End of Period (Thousands) | $ | 10 | |||||
Ratio of Expenses to Average Net Assets (1) | 1.40 | %+* | |||||
Ratio of Net Investment Loss to Average Net Assets (1) | (1.09 | )%+* | |||||
Ratio of Rebate from Morgan Stanley Affiliates to Average Net Assets | 0.05 | %* | |||||
Portfolio Turnover Rate | 0 | % | |||||
(1) Supplemental Information on the Ratios to Average Net Assets: | |||||||
Ratios Before Expense Limitation: | |||||||
Expenses to Average Net Assets | 139.50 | %* | |||||
Net Investment Loss to Average Net Assets | (139.19 | )%* | |||||
^ Commencement of Operations.
† Per share amount is based on average shares outstanding.
‡ Amount is less than $0.005 per share.
++ Calculated based on the net asset value, which does not reflect sales charges, if applicable, as of the last business day of the period.
+ The Ratios of Expenses and Net Investment Loss reflect the rebate of certain Portfolio expenses in connection with the investments in Morgan Stanley affiliates during the period. The effect of the rebate on the ratios is disclosed in the above table as "Ratio of Rebate from Morgan Stanley Affiliates to Average Net Assets."
# Not Annualized.
* Annualized.
The accompanying notes are an integral part of the financial statements.
10
Morgan Stanley Institutional Fund, Inc.
Annual Report — December 31, 2015
Financial Highlights
Asia Opportunity Portfolio
Class C | |||||||
Selected Per Share Data and Ratios | Period from December 29, 2015^ to December 31, 2015 | ||||||
Net Asset Value, Beginning of Period | $ | 10.00 | |||||
Income (Loss) from Investment Operations: | |||||||
Net Investment Loss† | (0.00 | )‡ | |||||
Net Realized and Unrealized Gain | 0.03 | ||||||
Total from Investment Operations | 0.03 | ||||||
Net Asset Value, End of Period | $ | 10.03 | |||||
Total Return++ | 0.30 | %# | |||||
Ratios and Supplemental Data: | |||||||
Net Assets, End of Period (Thousands) | $ | 10 | |||||
Ratio of Expenses to Average Net Assets (1) | 2.17 | %+* | |||||
Ratio of Net Investment Loss to Average Net Assets (1) | (1.84 | )%+* | |||||
Ratio of Rebate from Morgan Stanley Affiliates to Average Net Assets | 0.03 | %* | |||||
Portfolio Turnover Rate | 0 | % | |||||
(1) Supplemental Information on the Ratios to Average Net Assets: | |||||||
Ratios Before Expense Limitation: | |||||||
Expenses to Average Net Assets | 140.25 | %* | |||||
Net Investment Loss to Average Net Assets | (139.92 | )%* | |||||
^ Commencement of Operations.
† Per share amount is based on average shares outstanding.
‡ Amount is less than $0.005 per share.
++ Calculated based on the net asset value, which does not reflect sales charges, if applicable, as of the last business day of the period.
+ The Ratios of Expenses and Net Investment Loss reflect the rebate of certain Portfolio expenses in connection with the investments in Morgan Stanley affiliates during the period. The effect of the rebate on the ratios is disclosed in the above table as "Ratio of Rebate from Morgan Stanley Affiliates to Average Net Assets."
# Not Annualized.
* Annualized.
The accompanying notes are an integral part of the financial statements.
11
Morgan Stanley Institutional Fund, Inc.
Annual Report — December 31, 2015
Financial Highlights
Asia Opportunity Portfolio
Class IS | |||||||
Selected Per Share Data and Ratios | Period from December 29, 2015^ to December 31, 2015 | ||||||
Net Asset Value, Beginning of Period | $ | 10.00 | |||||
Income (Loss) from Investment Operations: | |||||||
Net Investment Loss† | (0.00 | )‡ | |||||
Net Realized and Unrealized Gain | 0.03 | ||||||
Total from Investment Operations | 0.03 | ||||||
Net Asset Value, End of Period | $ | 10.03 | |||||
Total Return++ | 0.30 | %# | |||||
Ratios and Supplemental Data: | |||||||
Net Assets, End of Period (Thousands) | $ | 10 | |||||
Ratio of Expenses to Average Net Assets (1) | 1.02 | %+* | |||||
Ratio of Net Investment Loss to Average Net Assets (1) | (0.69 | )%+* | |||||
Ratio of Rebate from Morgan Stanley Affiliates to Average Net Assets | 0.03 | %* | |||||
Portfolio Turnover Rate | 0 | % | |||||
(1) Supplemental Information on the Ratios to Average Net Assets: | |||||||
Ratios Before Expense Limitation: | |||||||
Expenses to Average Net Assets | 139.25 | %* | |||||
Net Investment Loss to Average Net Assets | (138.92 | )%* | |||||
^ Commencement of Operations.
† Per share amount is based on average shares outstanding.
‡ Amount is less than $0.005 per share.
++ Calculated based on the net asset value as of the last business day of the period.
+ The Ratios of Expenses and Net Investment Loss reflect the rebate of certain Portfolio expenses in connection with the investments in Morgan Stanley affiliates during the period. The effect of the rebate on the ratios is disclosed in the above table as "Ratio of Rebate from Morgan Stanley Affiliates to Average Net Assets."
# Not Annualized.
* Annualized.
The accompanying notes are an integral part of the financial statements.
12
Morgan Stanley Institutional Fund, Inc.
Annual Report — December 31, 2015
Notes to Financial Statements
Morgan Stanley Institutional Fund, Inc. (the "Fund") is registered under the Investment Company Act of 1940, as amended (the "Act"), as an open-end management investment company. The Fund is comprised of twenty-six separate, active, diversified and non-diversified portfolios (individually referred to as a "Portfolio", collectively as the "Portfolios"). The Fund applies investment company accounting and reporting guidance.
The accompanying financial statements relate to the Asia Opportunity Portfolio. The Portfolio seeks long-term capital appreciation.
The Portfolio commenced operations on December 29, 2015 and offers four classes of shares — Class I, Class A, Class C and Class IS.
A. Significant Accounting Policies: The following significant accounting policies are in conformity with U.S. generally accepted accounting principles ("GAAP"). Such policies are consistently followed by the Fund in the preparation of its financial statements. GAAP may require management to make estimates and assumptions that affect the reported amounts and disclosures in the financial statements. Actual results may differ from those estimates.
1. Security Valuation: (1) An equity portfolio security listed or traded on an exchange is valued at its latest reported sales price (or at the exchange official closing price if such exchange reports an official closing price), if there were no sales on a given day, the security is valued at the mean between the last reported bid and asked prices; (2) all other equity portfolio securities for which over-the-counter ("OTC") market quotations are readily available are valued at its latest reported sales price. In cases where a security is traded on more than one exchange, the security is valued on the exchange designated as the primary market; (3) Certain portfolio securities may be valued by an outside pricing service approved by the Fund's Board of Directors (the "Directors"). The pricing service may utilize a matrix system or other model incorporating attributes such as security quality, maturity and coupon as the evaluation model parameters, and/or research evaluations by its staff, including review of broker dealer market price quotations in determining what it believes is the fair valuation of the portfolios securities valued by such pricing service; (4) when market quotations are not readily available, including circumstances under which Morgan Stanley Investment Management Inc. (the "Adviser") determines that the closing price, last sale price or the mean between
the last reported bid and asked prices are not reflective of a security's market value, portfolio securities are valued at their fair value as determined in good faith under procedures established by and under the general supervision of the Directors. Occasionally, developments affecting the closing prices of securities and other assets may occur between the times at which valuations of such securities are determined (that is, close of the foreign market on which the securities trade) and the close of business of the New York Stock Exchange ("NYSE"). If developments occur during such periods that are expected to materially affect the value of such securities, such valuations may be adjusted to reflect the estimated fair value of such securities as of the close of the NYSE, as determined in good faith by the Directors or by the Adviser using a pricing service and/or procedures approved by the Directors; (5) quotations of foreign portfolio securities, other assets and liabilities and forward contracts stated in foreign currency are translated into U.S. dollar equivalents at the prevailing market rates prior to the close of the NYSE; (6) investments in mutual funds, including the Morgan Stanley Institutional Liquidity Funds, are valued at the net asset value ("NAV") as of the close of each business day; and (7) short-term debt securities with remaining maturities of 60 days or less at the time of purchase may be valued at amortized cost, unless the Adviser determines such valuation does not reflect the securities' market value, in which case these securities will be valued at their fair market value determined by the Adviser.
The Directors have responsibility for determining in good faith the fair value of the investments, and the Directors may appoint others, such as the Fund's Adviser or a valuation committee, to assist the Directors in determining fair value and to make the actual calculations pursuant to the fair valuation methodologies previously approved by the Directors. Under procedures approved by the Directors, the Fund's Adviser has formed a Valuation Committee whose members are approved by the Directors. The Valuation Committee provides administration and oversight of the Fund's valuation policies and procedures, which are reviewed at least annually by the Directors. These procedures allow the Fund to utilize independent pricing services, quotations from securities and financial instrument dealers, and other market sources to determine fair value.
13
Morgan Stanley Institutional Fund, Inc.
Annual Report — December 31, 2015
Notes to Financial Statements (cont'd)
The Fund has procedures to determine the fair value of securities and other financial instruments for which market prices are not readily available. Under these procedures, the Valuation Committee convenes on a regular and ad hoc basis to review such securities and considers a number of factors, including valuation methodologies and significant unobservable valuation inputs, when arriving at fair value. The Valuation Committee may employ a market-based approach which may use related or comparable assets or liabilities, recent transactions, market multiples, book values, and other relevant information for the investment to determine the fair value of the investment. An income-based valuation approach may also be used in which the anticipated future cash flows of the investment are discounted to calculate fair value. Discounts may also be applied due to the nature or duration of any restrictions on the disposition of the investments. Due to the inherent uncertainty of valuations of such investments, the fair values may differ significantly from the values that would have been used had an active market existed. The Valuation Committee employs various methods for calibrating these valuation approaches including a regular review of valuation methodologies, key inputs and assumptions, transactional back-testing or disposition analysis, and reviews of any related market activity.
2. Fair Value Measurement: Financial Accounting Standards Board ("FASB") Accounting Standards CodificationTM ("ASC") 820, "Fair Value Measurement" ("ASC 820"), defines fair value as the value that the Fund would receive to sell an investment or pay to transfer a liability in a timely transaction with an independent buyer in the principal market, or in the absence of a principal market the most advantageous market for the investment or liability. ASC 820 establishes a three-tier hierarchy to distinguish between (1) inputs that reflect the assumptions market participants would use in valuing an asset or liability developed based on market data obtained from sources independent of the reporting entity (observable inputs) and (2) inputs that reflect the reporting entity's own assumptions about the assumptions market participants would use in valuing an asset or liability developed based on the best information available in the circumstances (unobservable inputs) and to establish classification of fair value measurements for disclosure purposes. Various inputs are used in determining the value of the Fund's
investments. The inputs are summarized in the three broad levels listed below.
• Level 1 – unadjusted quoted prices in active markets for identical investments
• Level 2 – other significant observable inputs (including quoted prices for similar investments, interest rates, prepayment speeds, credit risk, etc.)
• Level 3 – significant unobservable inputs including the Fund's own assumptions in determining the fair value of investments. Factors considered in making this determination may include, but are not limited to, information obtained by contacting the issuer, analysts, or the appropriate stock exchange (for exchange-traded securities), analysis of the issuer's financial statements or other available documents and, if necessary, available information concerning other securities in similar circumstances
The inputs or methodology used for valuing securities are not necessarily an indication of the risk associated with investing in those securities and the determination of the significance of a particular input to the fair value measurement in its entirety requires judgment and considers factors specific to each security.
The following is a summary of the inputs used to value the Portfolio's investments as of December 31, 2015.
Investment Type | Level 1 Unadjusted quoted prices (000) | Level 2 Other significant observable inputs (000) | Level 3 Significant unobservable inputs (000) | Total (000) | |||||||||||||||
Assets: | |||||||||||||||||||
Common Stocks | |||||||||||||||||||
Banks | $ | 274 | $ | — | $ | — | $ | 274 | |||||||||||
Beverages | — | 194 | — | 194 | |||||||||||||||
Biotechnology | — | 455 | — | 455 | |||||||||||||||
| Diversified Consumer Services | 415 | — | — | 415 | |||||||||||||||
Food & Staples Retailing | — | 235 | — | 235 | |||||||||||||||
Food Products | — | 365 | — | 365 | |||||||||||||||
| Health Care Providers & Services | 115 | — | — | 115 | |||||||||||||||
| Information Technology Services | 361 | — | — | 361 | |||||||||||||||
Insurance | — | 267 | — | 267 | |||||||||||||||
Internet & Catalog Retail | 360 | — | — | 360 | |||||||||||||||
| Internet Software & Services | 220 | 506 | — | 726 | |||||||||||||||
Media | — | 229 | — | 229 | |||||||||||||||
14
Morgan Stanley Institutional Fund, Inc.
Annual Report — December 31, 2015
Notes to Financial Statements (cont'd)
Investment Type | Level 1 Unadjusted quoted prices (000) | Level 2 Other significant observable inputs (000) | Level 3 Significant unobservable inputs (000) | Total (000) | |||||||||||||||
Common Stocks (cont'd) | |||||||||||||||||||
Personal Products | $ | — | $ | 224 | $ | — | $ | 224 | |||||||||||
Pharmaceuticals | — | 224 | — | 224 | |||||||||||||||
| Semiconductors & Semiconductor Equipment | — | 138 | — | 138 | |||||||||||||||
Total Common Stocks | 1,745 | 2,837 | — | 4,582 | |||||||||||||||
Participation Notes | — | 669 | — | 669 | |||||||||||||||
Short-Term Investment | |||||||||||||||||||
Investment Company | 4,820 | — | — | 4,820 | |||||||||||||||
Total Assets | $ | 6,565 | $ | 3,506 | $ | — | $ | 10,071 | |||||||||||
Transfers between investment levels may occur as the markets fluctuate and/or the availability of data used in an investment's valuation changes. The Portfolio recognizes transfers between the levels as of the end of the period. As of December 31, 2015, the Portfolio did not have any investments transfer between investment levels. At December 31, 2015, the fair value of certain securities were adjusted due to developments which occurred between the time of the close of the foreign markets on which they trade and the close of business on the NYSE which resulted in their level 2 classification.
3. Foreign Currency Translation and Foreign Investments: The books and records of the Portfolio are maintained in U.S. dollars. Foreign currency amounts are translated into U.S. dollars as follows:
– investments, other assets and liabilities at the prevailing rate of exchange on the valuation date;
– investment transactions and investment income at the prevailing rates of exchange on the dates of such transactions.
Although the net assets of the Portfolio are presented at the foreign exchange rates and market values at the close of the period, the Portfolio does not isolate that portion of the results of operations arising as a result of changes in the foreign exchange rates from the fluctuations arising from changes in the market prices of securities held at period end. Similarly, the Portfolio does not isolate the effect of changes in foreign exchange rates from the fluctuations arising from changes in the market prices of securities sold during the period. Accordingly, realized and unrealized foreign currency gains (losses) on investments in securities are included in the reported net
realized and unrealized gains (losses) on investment transactions and balances. However, pursuant to U.S. Federal income tax regulations, gains and losses from certain foreign currency transactions and the foreign currency portion of gains and losses realized on sales and maturities of foreign denominated debt securities are treated as ordinary income for U.S. Federal income tax purposes.
Net realized gains (losses) on foreign currency transactions represent net foreign exchange gains (losses) from foreign currency forward exchange contracts, disposition of foreign currencies, currency gains (losses) realized between the trade and settlement dates on securities transactions, and the difference between the amount of investment income and foreign withholding taxes recorded on the Portfolio's books and the U.S. dollar equivalent amounts actually received or paid. Net unrealized currency gains (losses) from valuing foreign currency denominated assets and liabilities at period end exchange rates are reflected as a component of unrealized appreciation (depreciation) in the Statement of Assets and Liabilities. The change in unrealized currency gains (losses) on foreign currency translations for the period is reflected in the Statement of Operations.
Foreign security and currency transactions may involve certain considerations and risks not typically associated with those of U.S. dollar denominated transactions as a result of, among other factors, fluctuations of exchange rates in relation to the U.S. dollar, the possibility of lower levels of governmental supervision and regulation of foreign securities markets and the possibility of political or economic instability.
Governmental approval for foreign investments may be required in advance of making an investment under certain circumstances in some countries, and the extent of foreign investments in domestic companies may be subject to limitation in other countries. Foreign ownership limitations also may be imposed by the charters of individual companies to prevent, among other concerns, violations of foreign investment limitations. As a result, an additional class of shares (identified as "Foreign" in the Portfolio of Investments) may be created and offered for investment. The "local" and "foreign shares" market values may differ. In the absence of trading of the foreign shares in such markets, the Portfolio values the foreign shares at the closing exchange price of the local shares.
15
Morgan Stanley Institutional Fund, Inc.
Annual Report — December 31, 2015
Notes to Financial Statements (cont'd)
4. Structured Investments: The Portfolio invested a portion of its assets in structured investments. A structured investment is a derivative security designed to offer a return linked to a particular underlying security, currency, commodity or market. Structured investments may come in various forms including notes (such as exchange-traded notes), warrants and options to purchase securities. The Portfolio will typically use structured investments to gain exposure to a permitted underlying security, currency, commodity or market when direct access to a market is limited or inefficient from a tax or cost standpoint. There can be no assurance that structured investments will trade at the same price or have the same value as the underlying security, currency, commodity or market. Investments in structured investments involve risks including issuer risk, counterparty risk and market risk. Holders of structured investments bear risks of the underlying investment and are subject to issuer or counterparty risk because the Portfolio is relying on the creditworthiness of such issuer or counterparty and has no rights with respect to the underlying investment. Certain structured investments may be thinly traded or have a limited trading market and may have the effect of increasing the Portfolio's illiquidity to the extent that the Portfolio, at a particular time, may be unable to find qualified buyers for these securities.
5. Redemption Fees: The Portfolio will assess a 2% redemption fee on Class I shares, Class A shares, Class C shares and Class IS shares, which is paid directly to the Portfolio, for shares redeemed or exchanged within thirty days of purchase, subject to certain exceptions. The redemption fee is designed to protect the Portfolio and its remaining shareholders from the effects of short-term trading. These fees, if any, are included in the Statement of Changes in Net Assets.
6. Indemnifications: The Fund enters into contracts that contain a variety of indemnifications. The Fund's maximum exposure under these arrangements is unknown. However, the Fund has not had prior claims or losses pursuant to these contracts and expects the risk of loss to be remote.
7. Dividends and Distributions to Shareholders: Dividend income and distributions to shareholders are recorded on the ex-dividend date. Dividends from net investment income, if any, are declared and paid annually. Net realized capital gains, if any, are distributed at least annually.
8. Security Transactions, Income and Expenses: Security transactions are accounted for on the trade date (date the order to buy or sell is executed). Realized gains and losses on the sale of investment securities are determined on the specific identified cost method. Dividend income and other distributions are recorded on the ex-dividend date (except for certain foreign dividends which may be recorded as soon as the Portfolio is informed of such dividends) net of applicable withholding taxes. Interest income is recognized on the accrual basis except where collection is in doubt. Discounts are accreted and premiums are amortized over the life of the respective securities. Most expenses of the Fund can be directly attributed to a particular Portfolio. Expenses which cannot be directly attributed are apportioned among the Portfolios based upon relative net assets or other appropriate methods. Income, expenses (other than class specific expenses — distribution and shareholder services, transfer agency and sub transfer agency fees) and realized and unrealized gains or losses are allocated to each class of shares based upon their relative net assets.
B. Advisory Fees: The Adviser, a wholly-owned subsidiary of Morgan Stanley, provides the Portfolio with advisory services under the terms of an Investment Advisory Agreement, paid quarterly, at the annual rate based on the daily net assets as follows:
| First $750 million | Next $750 million | Over $1.5 billion | |||||||||
| 0.80 | % | 0.75 | % | 0.70 | % | ||||||
For the period ended December 31, 2015, the advisory fee rate (net of waivers/rebate) was equivalent to an annual effective rate of 0.00% of the Portfolio's average daily net assets.
The Adviser has agreed to reduce its advisory fee and/or reimburse the Portfolio so that total annual portfolio operating expenses, excluding certain investment related expenses, taxes, interest and other extraordinary expenses (including litigation), will not exceed 1.10% for Class I shares, 1.45% for Class A shares, 2.20% for Class C shares and 1.05% for Class IS shares. The fee waivers and/or expense reimbursements will continue for at least one year from the date of the Portfolio's prospectus or until such time as the Directors act to discontinue all or a portion of such waivers and/or reimbursements when they deem such action is appropriate. For the period ended December 31, 2015, less than $500 of advisory fees were waived and approximately $38,000 of other expenses were reimbursed by the Adviser pursuant to this arrangement.
16
Morgan Stanley Institutional Fund, Inc.
Annual Report — December 31, 2015
Notes to Financial Statements (cont'd)
C. Administration Fees: The Adviser also serves as Administrator to the Fund and provides administrative services pursuant to an Administration Agreement for an annual fee, accrued daily and paid monthly, of 0.08% of the Portfolio's average daily net assets.
Under a Sub-Administration Agreement between the Administrator and State Street Bank and Trust Company ("State Street"), State Street provides certain administrative services to the Fund. For such services, the Administrator pays State Street a portion of the fee the Administrator receives from the Portfolio.
D. Distribution and Shareholder Services Fees: Morgan Stanley Distribution, Inc. ("MSDI" or the "Distributor"), a wholly-owned subsidiary of the Adviser and an indirect subsidiary of Morgan Stanley, serves as the Fund's Distributor of Portfolio shares pursuant to a Distribution Agreement. The Fund has adopted a Shareholder Services Plan with respect to Class A shares pursuant to Rule 12b-1 under the Act. Under the Shareholder Services Plan, the Portfolio pays the Distributor a shareholder services fee, accrued daily and paid monthly, at an annual rate of 0.25% of the Portfolio's average daily net assets attributable to Class A shares.
The Fund has adopted a Distribution and Shareholder Services Plan with respect to Class C shares pursuant to Rule 12b-1 under the Act. Under the Distribution and Shareholder Services Plan, the Portfolio pays the Distributor a distribution fee, accrued daily and paid monthly, at an annual rate of 0.75% and a shareholder services fee, accrued daily and paid monthly, at an annual rate of 0.25% of the Portfolio's average daily net assets attributable to Class C shares.
The distribution and shareholder services fees are used to support the expenses associated with servicing and maintaining accounts. The Distributor may compensate other parties for providing shareholder support services to investors who purchase Class A and Class C shares.
E. Dividend Disbursing and Transfer Agent: The Fund's dividend disbursing and transfer agent is Boston Financial Data Services, Inc. ("BFDS"). Pursuant to a Transfer Agency Agreement, the Fund pays BFDS a fee based on the number of classes, accounts and transactions relating to the Portfolios of the Fund.
F. Custodian Fees: State Street (the "Custodian") serves as Custodian for the Fund in accordance with a Custodian Agreement. The Custodian holds cash, securities, and other assets of the Fund as required by the Act. Custody fees are payable
monthly based on assets held in custody, investment purchases and sales activity and account maintenance fees, plus reimbursement for certain out-of-pocket expenses.
G. Security Transactions and Transactions with Affiliates: For the period ended December 31, 2015, purchases and sales of investment securities for the Portfolio, other than long-term U.S. Government securities and short-term investments, were approximately $5,243,000 and $0, respectively. There were no purchases and sales of long-term U.S. Government securities for the period ended December 31, 2015.
The Portfolio invests in the Institutional Class of the Morgan Stanley Institutional Liquidity Funds — Money Market Portfolio (the "Liquidity Funds"), an open-end management investment company managed by the Adviser. Advisory fees paid by the Portfolio are reduced by an amount equal to its pro-rata share of the advisory and administration fees paid by the Portfolio due to its investment in the Liquidity Funds. For the period ended December 31, 2015, advisory fees paid were reduced by less than $500 relating to the Portfolio's investment in the Liquidity Funds.
A summary of the Portfolio's transactions in shares of the Liquidity Funds during the period ended December 31, 2015 is as follows:
| Value December 29, 2015 (000) | Purchases at Cost (000) | Sales (000) | Dividend Income (000) | Value December 31, 2015 (000) | |||||||||||||||
| $ | — | $ | 4,820 | $ | — | $ | — | @ | $ | 4,820 | |||||||||
@ Amount is less than $500.
The Portfolio has an unfunded Deferred Compensation Plan (the "Compensation Plan"), which allows each independent Director to defer payment of all, or a portion, of the fees he or she receives for serving on the Board of Directors. Each eligible Director generally may elect to have the deferred amounts credited with a return equal to the total return on one or more of the Morgan Stanley funds that are offered as investment options under the Compensation Plan. Appreciation/depreciation and distributions received from these investments are recorded with an offsetting increase/decrease in the deferred compensation obligation and do not affect the NAV of the Portfolio.
H. Federal Income Taxes: It is the Portfolio's intention to continue to qualify as a regulated investment company and distribute all of its taxable and tax-exempt income. Accordingly, no provision for Federal income taxes is required in the financial statements.
17
Morgan Stanley Institutional Fund, Inc.
Annual Report — December 31, 2015
Notes to Financial Statements (cont'd)
The Portfolio may be subject to taxes imposed by countries in which it invests. Such taxes are generally based on income and/or capital gains earned or repatriated. Taxes are accrued based on net investment income, net realized gains and net unrealized appreciation as such income and/or gains are earned. Taxes may also be based on transactions in foreign currency and are accrued based on the value of investments denominated in such currency.
FASB ASC 740-10, "Income Taxes — Overall", sets forth a minimum threshold for financial statement recognition of the benefit of a tax position taken or expected to be taken in a tax return. Management has concluded there are no significant uncertain tax positions that would require recognition in the financial statements. If applicable, the Portfolio recognizes interest accrued related to unrecognized tax benefits in "Interest Expense" and penalties in "Other Expenses" in the Statement of Operations. The Portfolio files tax returns with the U.S. Internal Revenue Service, New York and various states.
The tax character of distributions paid may differ from the character of distributions shown in the Statement of Changes in Net Assets due to short-term capital gains being treated as ordinary income for tax purposes. There were no distributions paid during fiscal 2015.
The amount and character of income and gains to be distributed are determined in accordance with income tax regulations which may differ from GAAP. These book/tax differences are either considered temporary or permanent in nature.
Temporary differences are primarily due to differing book and tax treatments in the timing of the recognition of gains (losses) on certain investment transactions and the timing of the deductibility of certain expenses.
Permanent differences, primarily due to differing treatments of gains (losses) related to foreign currency transactions, resulted in the following reclassifications among the components of net assets at December 31, 2015:
| Accumulated Undistributed Net Investment Income (000) | Accumulated Net Realized Gain (000) | Paid-in- Capital (000) | |||||||||
| $ | 8 | $ | (8 | ) | $ | — | |||||
At December 31, 2015, the components of distributable earnings for the Portfolio on a tax basis were as follows:
| Undistributed Ordinary Income (000) | Undistributed Long-Term Capital Gain (000) | ||||||
| $ | 8 | $ | — | ||||
18
Morgan Stanley Institutional Fund, Inc.
Annual Report — December 31, 2015
Report of Independent Registered Public Accounting Firm
To the Shareholders and Board of Directors of
Morgan Stanley Institutional Fund, Inc. —
Asia Opportunity Portfolio
We have audited the accompanying statement of assets and liabilities, including the portfolio of investments, of Asia Opportunity Portfolio (one of the portfolios constituting Morgan Stanley Institutional Fund, Inc.) (the "Portfolio") as of December 31, 2015, and the related statement of operations and changes in net assets and the financial highlights for the period from December 29, 2015 (commencement of operations) to December 31, 2015. These financial statements and financial highlights are the responsibility of the Portfolio's management. Our responsibility is to express an opinion on these financial statements and financial highlights based on our audits.
We conducted our audit in accordance with the standards of the Public Company Accounting Oversight Board (United States). Those standards require that we plan and perform the audit to obtain reasonable assurance about whether the financial statements and financial highlights are free of material misstatement. We were not engaged to perform an audit of the Portfolio's internal control over financial reporting. Our audit included consideration of internal control over financial reporting as a basis for designing audit procedures that are appropriate in the circumstances, but not for the purpose of expressing an opinion on the effectiveness of the Portfolio's internal control over financial reporting. Accordingly, we express no such opinion. An audit also includes examining, on a test basis, evidence supporting the amounts and disclosures in the financial statements and financial highlights, assessing the accounting principles used and significant estimates made by management, and evaluating the overall financial statement presentation. Our procedures included confirmation of securities owned as of December 31, 2015, by correspondence with the custodian and others or by other appropriate auditing procedures where replies from others were not received. We believe that our audit provides a reasonable basis for our opinion.
In our opinion, the financial statements and financial highlights referred to above present fairly, in all material respects, the financial position of Asia Opportunity Portfolio (one of the portfolios constituting Morgan Stanley Institutional Fund, Inc.) at December 31, 2015, the results of its operations, changes in its net assets and the financial highlights for the period from December 29, 2015 (commencement of operations) to December 31, 2015, in conformity with U.S. generally accepted accounting principles.

Boston, Massachusetts
February 26, 2016
19
Morgan Stanley Institutional Fund, Inc.
Annual Report — December 31, 2015
Investment Advisory Agreement Approval (unaudited)
The Board considered the following factors at the time of approval of the contracts which occurred prior to commencement of operations.
Nature, Extent and Quality of Services
The Board reviewed and considered the nature and extent of the investment advisory services to be provided by the Adviser (as defined herein) under the advisory agreement, including portfolio management, investment research and equity and fixed income securities trading. The Board also reviewed and considered the nature and extent of the non-advisory, administrative services to be provided by the Adviser under the administration agreement, including accounting, operations, clerical, bookkeeping, compliance, business management and planning, legal services and the provision of supplies, office space and utilities at the Adviser's expense. The Board also considered the Adviser's investment in personnel and infrastructure that benefits the Portfolio. (The advisory and administration agreements together are referred to as the "Management Agreement.") The Board also considered that the Adviser serves a variety of other investment advisory clients and has experience overseeing service providers. The Board also compared the nature of the services to be provided by the Adviser with similar services provided by non-affiliated advisers as reported to the Board by Lipper, Inc.
The Board reviewed and considered the qualifications of the portfolio managers, the senior administrative managers and other key personnel of the Adviser who will provide the administrative and advisory services to the Portfolio. The Board determined that the Adviser's portfolio managers and key personnel are well qualified by education and/or training and experience to perform the services in an efficient and professional manner. The Board concluded that the nature and extent of the advisory and administrative services to be provided were necessary and appropriate for the conduct of the business and investment activities of the Portfolio and supported its decision to approve the Management Agreement.
Performance, Fees and Expenses of the Portfolio
The Board considered that the Adviser plans to arrange for a public offering of shares of the Portfolio to raise assets for investment and that the offering had not yet begun and concluded that, since the Portfolio currently had no assets to invest (other than seed capital required under the Investment Company Act) and had no track record of performance, this was not a factor it needed to address at the present time.
The Board reviewed the advisory and administrative fee rates (the "management fee rates") proposed to be paid by the Portfolio under the Management Agreement relative to comparable funds advised by the Adviser, when applicable, and compared to their peers as determined by the Adviser, and reviewed the anticipated total expense ratio of the Portfolio. The Board considered that the Portfolio requires the Adviser to develop processes, invest in additional resources and incur additional risks to successfully manage the Portfolio and concluded that the proposed management fee rate and anticipated total expense ratio would be competitive with its peer group average.
Economies of Scale
The Board considered the growth prospects of the Portfolio and the structure of the proposed management fee schedule, which includes breakpoints for the Portfolio. The Board considered that the Portfolio's potential growth was uncertain and concluded that it would be premature to consider economies of scale as a factor in approving the Management Agreement at the present time.
Profitability of the Adviser and Affiliates
Since the Portfolio had not begun operations and had not paid any fees to the Adviser, the Board concluded that this was not a factor that needed to be considered at the present time.
Other Benefits of the Relationship
The Board considered other direct and indirect benefits to the Adviser and/or its affiliates to be derived from their relationship with the Portfolio and other funds advised by the Adviser. These benefits may include, among other things, fees for trading, distribution and/or shareholder servicing and for transaction processing and reporting platforms used by securities lending agents, and research received by the Adviser generated from commission dollars spent on funds' portfolio trading. Since the Portfolio had not begun operations and had not paid any fees to the Adviser, the Board concluded that these benefits were not a factor that needed to be considered at the present time.
20
Morgan Stanley Institutional Fund, Inc.
Annual Report — December 31, 2015
Investment Advisory Agreement Approval (unaudited) (cont'd)
Resources of the Adviser and Historical Relationship Between the Portfolio and the Adviser
The Board considered whether the Adviser is financially sound and has the resources necessary to perform its obligations under the Management Agreement. The Board also reviewed and considered the organizational structure of the Adviser, the policies and procedures formulated and adopted by the Adviser for managing the Portfolio's operations and the Board's confidence in the competence and integrity of the senior managers and key personnel of the Adviser. The Board concluded that the Adviser has the financial resources necessary to fulfill its obligations under the Management Agreement and that it is beneficial for the Portfolio to enter into this relationship with the Adviser.
Other Factors and Current Trends
The Board considered the controls and procedures adopted and implemented by the Adviser and monitored by the Fund's Chief Compliance Officer and concluded that the conduct of business by the Adviser indicates a good faith effort on its part to adhere to high ethical standards in the conduct of the Portfolio's business.
General Conclusion
After considering and weighing all of the above factors, with various written materials and verbal information presented by the Adviser, the Board concluded that it would be in the best interest of the Portfolio and its future shareholders to approve the Management Agreement, which will remain in effect for two years and thereafter must be approved annually by the Board of the Portfolio if it is to continue in effect. In reaching this conclusion the Board did not give particular weight to any single piece of information or factor referenced above. It is possible that individual Board members may have weighed these factors, and the information presented, differently in reaching their individual decisions to approve the Management Agreement.
21
Morgan Stanley Institutional Fund, Inc.
Annual Report — December 31, 2015
U.S. Privacy Policy (unaudited)
AN IMPORTANT NOTICE CONCERNING OUR U.S. PRIVACY POLICY
This privacy notice describes the U.S. privacy policy of Morgan Stanley Distribution, Inc., and the Morgan Stanley family of mutual funds ("us", "our", "we").
We are required by federal law to provide you with notice of our U.S. privacy policy ("Policy"). This Policy applies to both our current and former clients unless we state otherwise and is intended for individual clients who purchase products or receive services from us for personal, family or household purposes. This Policy is not applicable to partnerships, corporations, trusts or other non-individual clients or account holders, nor is this Policy applicable to individuals who are either beneficiaries of a trust for which we serve as trustee or participants in an employee benefit plan administered or advised by us. This Policy is, however, applicable to individuals who select us to be a custodian of securities or assets in individual retirement accounts, 401(k) accounts, or accounts subject to the Uniform Gifts to Minors Act.
This notice sets out our business practices to protect your privacy; how we collect and share personal information about you; and how you can limit our sharing or certain uses by others of this information. We may amend this Policy at any time, and will inform you of any changes to our Policy as required by law.
WE RESPECT YOUR PRIVACY
We appreciate that you have provided us with your personal financial information and understand your concerns about your information. We strive to safeguard the information our clients entrust to us. Protecting the confidentiality and security of client information is an important part of how we conduct our business.
This notice describes what personal information we collect about you, how we collect it, when we may share it with others, and how certain others may use it. It discusses the steps you may take to limit our sharing of certain information about you with our affiliated companies, including, but not limited to our affiliated banking businesses, brokerage firms and credit service affiliates. It also discloses how you may limit our affiliates' use of shared information for marketing purposes.
Throughout this Policy, we refer to the nonpublic information that personally identifies you as "personal information." We also use the term "affiliated company" in this notice. An affiliated company is a company in our family of companies and includes companies with the Morgan Stanley name. These affiliated companies are financial institutions such as broker-dealers, banks, investment advisers and credit card issuers. We refer to any company that is not an affiliated company as a nonaffiliated third party. For purposes of Section 5 of this notice, and your ability to limit certain uses of personal information by our affiliates, this notice applies to the use of personal information by our affiliated companies.
1. WHAT PERSONAL INFORMATION DO WE COLLECT FROM YOU?
We may collect the following types of information about you: (i) information provided by you, including information from applications and other forms we receive from you, (ii) information about your transactions with us or our affiliates, (iii) information about your transactions with nonaffiliated third parties, (iv) information from consumer reporting agencies, (v) information obtained from our websites, and (vi) information obtained from other sources. For example:
• We collect information such as your name, address, e-mail address, telephone/fax numbers, assets, income and investment objectives through applications and other forms you submit to us.
• We may obtain information about account balances, your use of account(s) and the types of products and services you prefer to receive from us through your dealings and transactions with us and other sources.
• We may obtain information about your creditworthiness and credit history from consumer reporting agencies.
• We may collect background information from and through third-party vendors to verify representations you have made and to comply with various regulatory requirements.
2. WHEN DO WE DISCLOSE PERSONAL INFORMATION WE COLLECT ABOUT YOU?
We may disclose personal information we collect about you in each of the categories listed above to affiliated and nonaffiliated third parties.
22
Morgan Stanley Institutional Fund, Inc.
Annual Report — December 31, 2015
U.S. Privacy Policy (unaudited) (cont'd)
a. Information We Disclose to Affiliated Companies.
We may disclose personal information that we collect about you to our affiliated companies to manage your account(s) effectively, to service and process your transactions, and to let you know about products and services offered by us and affiliated companies, to manage our business, and as otherwise required or permitted by law. Offers for products and services from affiliated companies are developed under conditions designed to safeguard your personal information.
b. Information We Disclose to Third Parties.
We may disclose personal information that we collect about you to nonaffiliated third parties to provide marketing services on our behalf or to other financial institutions with whom we have joint marketing agreements. We may also disclose all of the information we collect to other nonaffiliated third parties for our everyday business purposes, such as to process transactions, maintain account(s), respond to court orders and legal investigations, report to credit bureaus, offer our own products and services, protect against fraud, for institutional risk control, to perform services on our behalf, and as otherwise required or permitted by law.
When we share personal information about you with a nonaffiliated third party, they are required to limit their use of personal information about you to the particular purpose for which it was shared and they are not allowed to share personal information about you with others except to fulfill that limited purpose or as may be permitted or required by law.
3. HOW DO WE PROTECT THE SECURITY AND CONFIDENTIALITY OF PERSONAL INFORMATION WE COLLECT ABOUT YOU?
We maintain physical, electronic and procedural security measures that comply with applicable law and regulations to help safeguard the personal information we collect about you. We have internal policies governing the proper handling of client information by employees. Third parties that provide support or marketing services on our behalf may also receive personal information about you, and we require them to adhere to appropriate security standards with respect to such information.
4. HOW CAN YOU LIMIT OUR SHARING CERTAIN PERSONAL INFORMATION ABOUT YOU WITH OUR AFFILIATED COMPANIES FOR ELIGIBILITY DETERMINATION?
By following the opt-out procedures in Section 6 below, you may limit the extent to which we share with our affiliated companies, personal information that was collected to determine your eligibility for products and services such as your credit reports and other information that you have provided to us or that we may obtain from third parties ("eligibility information"). Eligibility information does not include your identification information or personal information pertaining to our transactions or experiences with you. Please note that, even if you direct us not to share eligibility information with our affiliated companies, we may still share your personal information, including eligibility information, with our affiliated companies under circumstances that are permitted under applicable law, such as to process transactions or to service your account.
5. HOW CAN YOU LIMIT THE USE OF CERTAIN PERSONAL INFORMATION ABOUT YOU BY OUR AFFILIATED COMPANIES FOR MARKETING?
By following the opt-out instructions in Section 6 below, you may limit our affiliated companies from marketing their products or services to you based on personal information we disclose to them. This information may include, for example, your income and account history with us. Please note that, even if you choose to limit our affiliated companies from using personal information about you that we may share with them for marketing their products and services to you, our affiliated companies may use your personal information that they obtain from us to market to you in circumstances permitted by law, such as if the affiliated party has its own relationship with you.
23
Morgan Stanley Institutional Fund, Inc.
Annual Report — December 31, 2015
U.S. Privacy Policy (unaudited) (cont'd)
6. HOW CAN YOU SEND US AN OPT-OUT INSTRUCTION?
If you wish to limit our sharing of eligibility information about you with our affiliated companies, or our affiliated companies' use of personal information for marketing purposes, as described in this notice, you may do so by:
• Calling us at (800) 548-7786
Monday–Friday between 8a.m. and 6p.m. (EST)
• Writing to us at the following address:
Boston Financial Data Services, Inc.
c/o Privacy Coordinator
P.O. Box 219804
Kansas City, Missouri 64121
If you choose to write to us, your request should include: your name, address, telephone number and account number(s) to which the opt-out applies and whether you are opting out with respect to sharing of eligibility information (Section 4 above), or information used for marketing (Section 5 above), or both. Written opt-out requests should not be sent with any other correspondence. In order to process your request, we require that the request be provided by you directly and not through a third party. Once you have informed us about your privacy preferences, your opt-out preference will remain in effect with respect to this Policy (as it may be amended) until you notify us otherwise. If you are a joint account owner, we will accept instructions from any one of you and apply those instructions to the entire account.
Please understand that if you limit our sharing or our affiliated companies' use of personal information, you and any joint account holder(s) may not receive information about our affiliated companies' products and services, including products or services that could help you manage your financial resources and achieve your investment objectives.
If you have more than one account or relationship with us, please specify the accounts to which you would like us to apply your privacy choices. If you have accounts or relationships with our affiliates, you may receive multiple privacy policies from them, and will need to separately notify those companies of your privacy choices for those accounts or relationships.
7. WHAT IF AN AFFILIATED COMPANY BECOMES A NONAFFILIATED THIRD PARTY?
If, at any time in the future, an affiliated company becomes a nonaffiliated third party, further disclosures of personal information made to the former affiliated company will be limited to those described in Section 2(b) above relating to nonaffiliated third parties. If you elected under Section 6 to limit disclosures we make to affiliated companies, or use of personal information by affiliated companies, your election will not apply to use by any former affiliated company of your personal information in their possession once it becomes a nonaffiliated third party.
SPECIAL NOTICE TO RESIDENTS OF VERMONT
The following section supplements our Policy with respect to our individual clients who have a Vermont address and supersedes anything to the contrary in the above Policy with respect to those clients only.
The State of Vermont requires financial institutions to obtain your consent prior to sharing personal information that they collect about you with nonaffiliated third parties, or eligibility information with affiliated companies, other than in certain limited circumstances. Except as permitted by law, we will not share personal information we collect about you with nonaffiliated third parties or eligibility information with affiliated companies, unless you provide us with your written consent to share such information.
SPECIAL NOTICE TO RESIDENTS OF CALIFORNIA
The following section supplements our Policy with respect to our individual clients who have a California address and supersedes anything to the contrary in the above Policy with respect to those clients only.
In response to a California law, if your account has a California home address, your personal information will not be disclosed to nonaffiliated third parties except as permitted by applicable California law, and we will limit sharing such personal information with our affiliates to comply with California privacy laws that apply to us.
24
Morgan Stanley Institutional Fund, Inc.
Annual Report — December 31, 2015
Director and Officer Information (unaudited)
Independent Directors:
| Name, Age and Address of Independent Director | Positions(s) Held with Registrant | Length of Time Served* | Principal Occupation(s) During Past 5 Years and Other Relevant Professional Experience | Number of Portfolios in Fund Complex Overseen by Director** | Other Directorships Held by Independent Director*** | ||||||||||||||||||
| Frank L. Bowman (71) c/o Kramer Levin Naftalis & Frankel LLP Counsel to the Independent Directors 1177 Avenue of the Americas New York, NY 10036 | Director | Since August 2006 | President, Strategic Decisions, LLC (consulting) (since February 2009); Director or Trustee of various Morgan Stanley Funds (since August 2006); Chairperson of the Compliance and Insurance Committee (since October 2015); Formerly, Chairperson of the Insurance Sub-Committee of the Compliance and Insurance Committee (February 2007-December 2015); served as President and Chief Executive Officer of the Nuclear Energy Institute (policy organization) (February 2005-November 2008); retired as Admiral, U.S. Navy after serving over 38 years on active duty including 8 years as Director of the Naval Nuclear Propulsion Program in the Department of the Navy and the U.S. Department of Energy (1996-2004); served as Chief of Naval Personnel (July 1994-September 1996); and on the Joint Staff as Director of Political Military Affairs (June 1992-July 1994); knighted as Honorary Knight Commander of the Most Excellent Order of the British Empire; awarded the Officier de l'Orde National du Mérite by the French Government; elected to the National Academy of Engineering (2009). | 98 | Director of BP p.l.c.; Director of Naval and Nuclear Technologies LLP; Director Emeritus of the Armed Services YMCA; Director of the U.S. Naval Submarine League; Member of National Security Advisory Council of the Center for U.S. Global Engagement and a member of the CNA Military Advisory Board; Chairman of the Charity, J Street Cup Golf, Trustee of Fairhaven United Methodist Church; and Director of other various non-profit organizations. | ||||||||||||||||||
| Kathleen A. Dennis (62) c/o Kramer Levin Naftalis & Frankel LLP Counsel to the Independent Directors 1177 Avenue of the Americas New York, NY 10036 | Director | Since August 2006 | President, Cedarwood Associates (mutual fund and investment management consulting) (since July 2006); Chairperson of the Money Market and Alternatives Sub-Committee of the Investment Committee (since October 2006) and Director or Trustee of various Morgan Stanley Funds (since August 2006); formerly, Senior Managing Director of Victory Capital Management (1993-2006). | 98 | Director of various nonprofit organizations. | ||||||||||||||||||
| Nancy C. Everett (61) c/o Kramer Levin Naftalis & Frankel LLP Counsel to the Independent Directors 1177 Avenue of the Americas New York, NY 10036 | Director | Since January 2015 | Chief Executive Officer, Virginia Commonwealth University Investment Company (since November 2015); Owner, OBIR, LLC (investment management consulting) (since June 2014); formerly, Managing Director, BlackRock Inc. (February 2011-December 2013); and Chief Executive Officer, General Motors Asset Management (a/k/a Promark Global Advisors, Inc.) (June 2005-May 2010). | 98 | Member of Virginia Commonwealth University School of Business Foundation; formerly, Member of Virginia Commonwealth University Board of Visitors (2013-2015); Member of Committee on Directors for Emerging Markets Growth Fund, Inc. (2007-2010); Chairperson of Performance Equity Management, LLC (2006-2010); and Chairperson, GMAM Absolute Return Strategies Fund, LLC (2006-2010). | ||||||||||||||||||
25
Morgan Stanley Institutional Fund, Inc.
Annual Report — December 31, 2015
Director and Officer Information (unaudited) (cont'd)
Independent Directors: (cont'd)
| Name, Age and Address of Independent Director | Positions(s) Held with Registrant | Length of Time Served* | Principal Occupation(s) During Past 5 Years and Other Relevant Professional Experience | Number of Portfolios in Fund Complex Overseen by Director** | Other Directorships Held by Independent Director*** | ||||||||||||||||||
| Jakki L. Haussler (58) c/o Kramer Levin Naftalis & Frankel LLP Counsel to the Independent Directors 1177 Avenue of the Americas New York, NY 10036 | Director | Since January 2015 | Chairman and Chief Executive Officer, Opus Capital Group (since January 1996); and formerly, Director, Capvest Venture Fund, LP (May 2000-December 2011); Partner, Adena Ventures, LP (July 1999-December 2010); Director, The Victory Funds (February 2005-July 2008). | 98 | Director of Cincinnati Bell Inc. and Member, Audit Committee and Compensation Committee; Director of Northern Kentucky University Foundation and Member, Investment Committee; Member of Chase College of Law Transactional Law Practice Center Board of Advisors; Director of Best Transport; Chase College of Law Board of Visitors; formerly Member, University of Cincinnati Foundation Investment Committee; Member, Miami University Board of Visitors (2008-2011); Trustee of Victory Funds (2005-2008) and Chairman, Investment Committee (2007-2008) and Member, Service Provider Committee (2005-2008). | ||||||||||||||||||
| Dr. Manuel H. Johnson (67) c/o Johnson Smick International, Inc. 220 I Street, N.E. — Suite 200 Washington, D.C. 20002 | Director | Since July 1991 | Senior Partner, Johnson Smick International, Inc. (consulting firm); Chairperson of the Investment Committee (since October 2006) and Director or Trustee of various Morgan Stanley Funds (since July 1991); Co-Chairman and a founder of the Group of Seven Council (G7C) (international economic commission); formerly Chairperson of the Audit Committee (July 1991-September 2006), Vice Chairman of the Board of Governors of the Federal Reserve System and Assistant Secretary of the U.S. Treasury. | 100 | Director of NVR, Inc. (home construction). | ||||||||||||||||||
| Joseph J. Kearns (73) c/o Kearns & Associates LLC 23823 Malibu Road S-50-440 Malibu, CA 90265 | Director | Since August 1994 | President, Kearns & Associates LLC (investment consulting); Chairperson of the Audit Committee (since October 2006) and Director or Trustee of various Morgan Stanley Funds (since August 1994); formerly, Deputy Chairperson of the Audit Committee (July 2003-September 2006) and Chairperson of the Audit Committee of various Morgan Stanley Funds (since August 1994); CFO of the J. Paul Getty Trust. | 101 | Director of Electro Rent Corporation (equipment leasing). Prior to December 31, 2013, Director of The Ford Family Foundation. | ||||||||||||||||||
26
Morgan Stanley Institutional Fund, Inc.
Annual Report — December 31, 2015
Director and Officer Information (unaudited) (cont'd)
Independent Directors: (cont'd)
| Name, Age and Address of Independent Director | Positions(s) Held with Registrant | Length of Time Served* | Principal Occupation(s) During Past 5 Years and Other Relevant Professional Experience | Number of Portfolios in Fund Complex Overseen by Director** | Other Directorships Held by Independent Director*** | ||||||||||||||||||
| Michael F. Klein (57) c/o Kramer Levin Naftalis & Frankel LLP Counsel to the Independent Directors 1177 Avenue of the Americas New York, NY 10036 | Director | Since August 2006 | Managing Director, Aetos Capital, LLC (since March 2000); Co-President, Aetos Alternatives Management, LLC (since January 2004); and Co-Chief Executive Officer of Aetos Capital LLC (since August 2013); Chairperson of the Fixed Income Sub-Committee of the Investment Committee (since October 2006) and Director or Trustee of various Morgan Stanley Funds (since August 2006); formerly, Managing Director, Morgan Stanley & Co. Inc. and Morgan Stanley Dean Witter Investment Management, President, various Morgan Stanley Funds (June1998-March 2000) and Principal, Morgan Stanley & Co. Inc. and Morgan Stanley Dean Witter Investment Management (August 1997-December 1999). | 97 | Director of certain investment funds managed or sponsored by Aetos Capital, LLC. Director of Sanitized AG and Sanitized Marketing AG (specialty chemicals). | ||||||||||||||||||
| Michael E. Nugent (79) 522 Fifth Avenue New York, NY 10036 | Chair of the Board and Director | Chair of the Boards since July 2006 and Director since July 1991 | Chair of the Boards of various Morgan Stanley Funds (since July 2006); Chairperson of the Closed-End Fund Committee (since June 2012) and Director or Trustee of various Morgan Stanley Funds (since July 1991); formerly, Chairperson of the Insurance Committee (until July 2006), General Partner, TriumphCapital, L.P. (private investment partnership) (1988-2013). | 100 | None. | ||||||||||||||||||
| W. Allen Reed (68) c/o Kramer Levin Naftalis & Frankel LLP Counsel to the Independent Directors 1177 Avenue of the Americas New York, NY 10036 | Director | Since August 2006 | Chairperson of the Equity Sub-Committee of the Investment Committee (since October 2006) and Director or Trustee of various Morgan Stanley Funds (since August 2006); formerly, President and CEO of General Motors Asset Management; Chairman and Chief Executive Officer of the GM Trust Bank and Corporate Vice President of General Motors Corporation (August 1994-December 2005). | 98 | Director of Legg Mason, Inc.; formerly Director of the Auburn University Foundation (2010-2015). | ||||||||||||||||||
| Fergus Reid (83) c/o Joe Pietryka, Inc. 85 Charles Colman Blvd. Pawling, NY 12564 | Director | Since June 1992 | Chairman, Joe Pietryka, Inc.; Chairperson of the Governance Committee and Director or Trustee of various Morgan Stanley Funds (since June 1992). | 100 | Formerly, Trustee and Director of certain investment companies in the JP Morgan Fund Complex managed by JP Morgan Investment Management Inc. (1987-2012). | ||||||||||||||||||
27
Morgan Stanley Institutional Fund, Inc.
Annual Report — December 31, 2015
Director and Officer Information (unaudited) (cont'd)
Interested Director:
| Name, Age and Address of Interested Director | Positions(s) Held with Registrant | Length of Time Served* | Principal Occupation(s) During Past 5 Years | Number of Portfolios in Fund Complex Overseen by Interested Director** | Other Directorships Held by Interested Director*** | ||||||||||||||||||
| James F. Higgins (68) One New York Plaza, New York, NY 10004 | Director | Since June 2000 | Director or Trustee of various Morgan Stanley Funds (since June 2000); Senior Advisor of Morgan Stanley (since August 2000). | 99 | Formerly, Director of AXA Financial, Inc. and AXA Equitable Life Insurance Company (2002-2011) and Director of AXA MONY Life Insurance Company and AXA MONY Life Insurance Company of America (2004-2011). | ||||||||||||||||||
* This is the earliest date the Director began serving the Morgan Stanley Funds. Each Director serves an indefinite term, until his or her successor is elected.
** The Fund Complex includes (as of December 31, 2015) all open-end and closed-end funds (including all of their portfolios) advised by Morgan Stanley Investment Management Inc. (the "Adviser") and any funds that have an adviser that is an affiliated person of the Adviser (including, but not limited to, Morgan Stanley AIP GP LP).
*** This includes any directorships at public companies and registered investment companies held by the Director at any time during the past five years.
Executive Officers:
Name, Age and Address of Executive Officer | Position(s) Held with Registrant | Length of Time Served**** | Principal Occupation(s) During Past 5 Years | ||||||||||||
| John H. Gernon (52) 522 Fifth Avenue New York, NY 10036 | President and Principal Executive Officer | Since September 2013 | President and Principal Executive Officer of the Equity and Fixed Income Funds and the Morgan Stanley AIP Funds (since September 2013) and the Liquidity Funds and various money market funds (since May 2014) in the Fund Complex, Managing Director of the Adviser; Head of Product (since 2006). | ||||||||||||
| Stefanie V. Chang Yu (49) 522 Fifth Avenue New York, NY 10036 | Chief Compliance Officer | Since December 1997 | Managing Director of the Adviser and various entities affiliated with the Adviser; Chief Compliance Officer of various Morgan Stanley Funds and the Adviser (since January 2014); formerly, Vice President of various Morgan Stanley Funds (December 1997-January 2014). | ||||||||||||
| Joseph C. Benedetti (50) 522 Fifth Avenue New York, NY 10036 | Vice President | Since January 2014 | Managing Director of the Adviser and various entities affiliated with the Adviser; Vice President of various Morgan Stanley Funds (since January 2014); formerly, Assistant Secretary of various Morgan Stanley Funds (October 2004-January 2014). | ||||||||||||
| Francis J. Smith (50) 522 Fifth Avenue New York, NY 10036 | Treasurer and Principal Financial Officer | Treasurer since July 2003 and Principal Financial Officer since September 2002 | Executive Director of the Adviser and various entities affiliated with the Adviser; Treasurer (since July 2003) and Principal Financial Officer of various Morgan Stanley Funds (since September 2002). | ||||||||||||
| Mary E. Mullin (48) 522 Fifth Avenue New York, NY 10036 | Secretary | Since June 1999 | Executive Director of the Adviser; Secretary of various Morgan Stanley Funds (since June 1999). | ||||||||||||
**** This is the earliest date the officer began serving the Morgan Stanley Funds. Each officer serves a one-year term, until his or her successor is elected and has qualified.
28
Morgan Stanley Institutional Fund, Inc.
Annual Report — December 31, 2015
Adviser and Administrator
Morgan Stanley Investment Management Inc.
522 Fifth Avenue
New York, New York 10036
Distributor
Morgan Stanley Distribution, Inc.
522 Fifth Avenue
New York, New York 10036
Dividend Disbursing and Transfer Agent
Boston Financial Data Services, Inc.
2000 Crown Colony Drive
Quincy, Massachusetts 02169
Custodian
State Street Bank and Trust Company
One Lincoln Street
Boston, Massachusetts 02111
Legal Counsel
Dechert LLP
1095 Avenue of the Americas
New York, New York 10036
Counsel to the Independent Directors
Kramer Levin Naftalis & Frankel LLP
1177 Avenue of the Americas
New York, New York 10036
Independent Registered Public Accounting Firm
Ernst & Young LLP
200 Clarendon Street
Boston, Massachusetts 02116
Reporting to Shareholders
Each Morgan Stanley fund provides a complete schedule of portfolio holdings in its semi-annual and annual reports within 60 days of the end of the fund's second and fourth fiscal quarters. The semi-annual and annual reports are filed electronically with the Securities and Exchange Commission (SEC) on Form N-CSRS and Form N-CSR, respectively. Morgan Stanley also delivers the semi-annual and annual reports to fund shareholders and makes these reports available on its public website, www.morganstanley.com/im. Each Morgan Stanley fund also files a complete schedule of portfolio holdings with the SEC for the fund's first and third fiscal quarters on Form N-Q. Morgan Stanley does not deliver the reports for the first and third fiscal quarters to shareholders, nor are the reports posted to the Morgan Stanley public website. You may, however, obtain the Form N-Q filings (as well as the Form N-CSR and N-CSRS filings) by accessing the SEC's website, www.sec.gov. You may also review and copy them at the SEC's Public Reference Room in Washington, DC. Information on the operation of the SEC's Public Reference Room may be obtained by calling the SEC toll free at 1 (800) SEC-0330. You can also request copies of these materials, upon payment of a duplicating fee, by electronic request at the SEC's email address (publicinfo@sec.gov) or by writing the Public Reference Room of the SEC, Washington, DC 20549-0102.
Proxy Voting Policies and Procedures and Proxy Voting Record
You may obtain a copy of the Fund's Proxy Voting Policy and Procedures and information regarding how the Fund voted proxies relating to portfolio securities during the most recent twelve-month period ended June 30, without charge, upon request, by calling toll free 1 (800) 548-7786 or by visiting our website at www.morganstanley.com/im. This information is also available on the SEC's website at www.sec.gov.
This report is authorized for distribution only when preceded or accompanied by a prospectus of the Morgan Stanley Institutional Fund, Inc., which describes in detail each Portfolio's investment policies, risks, fees and expenses. Please read the prospectus carefully before you invest or send money. For additional information, including information regarding the investments comprising the Portfolio, please visit our website at www.morganstanley.com/im or call toll free 1 (800) 548-7786.
29
Printed in U.S.A.
This Report has been prepared for shareholders and may be distributed to others only if preceded or accompanied by a current prospectus.
Morgan Stanley Investment Management Inc.
522 Fifth Avenue
New York, New York 10036
© 2016 Morgan Stanley. Morgan Stanley Distribution, Inc.

IFIASOPPANN
1407691 EXP. 02.28.17
INVESTMENT MANAGEMENT

Morgan Stanley Institutional Fund, Inc.
Global Opportunity Portfolio
Annual Report
December 31, 2015

Morgan Stanley Institutional Fund, Inc.
Annual Report — December 31, 2015
Table of Contents
Shareholders' Letter | 2 | ||||||
Expense Example | 3 | ||||||
Investment Overview | 4 | ||||||
Portfolio of Investments | 6 | ||||||
Statement of Assets and Liabilities | 8 | ||||||
Statement of Operations | 10 | ||||||
Statements of Changes in Net Assets | 11 | ||||||
Financial Highlights | 13 | ||||||
Notes to Financial Statements | 18 | ||||||
Report of Independent Registered Public Accounting Firm | 28 | ||||||
Federal Tax Notice | 29 | ||||||
U.S. Privacy Policy | 30 | ||||||
Director and Officer Information | 33 | ||||||
This report is authorized for distribution only when preceded or accompanied by prospectuses of the Morgan Stanley Institutional Fund, Inc. To receive a prospectus and/or statement of additional information (SAI), which contains more complete information such as investment objectives, charges, expenses, policies for voting proxies, risk considerations, and describes in detail each of the Portfolio's investment policies to the prospective investor, please call toll free 1 (800) 548-7786. Please read the prospectuses carefully before you invest or send money.
Additionally, you can access portfolio information including performance, characteristics, and investment team commentary through Morgan Stanley Investment Management's website: www.morganstanley.com/im.
Market forecasts provided in this report may not necessarily come to pass. There is no guarantee that any sectors mentioned will continue to perform as discussed herein or that securities in such sectors will be held by the Portfolio in the future. There is no assurance that a Portfolio will achieve its investment objective. Portfolios are subject to market risk, which is the possibility that market values of securities owned by the Portfolio will decline and, therefore, the value of the Portfolio's shares may be less than what you paid for them. Accordingly, you can lose money investing in this Portfolio. Please see the prospectus for more complete information on investment risks.
1
Morgan Stanley Institutional Fund, Inc.
Annual Report — December 31, 2015
Shareholders' Letter (unaudited)
Dear Shareholders,
We are pleased to provide this Annual report, in which you will learn how your investment in Global Opportunity Portfolio (the "Portfolio") performed during the latest twelve-month period.
Morgan Stanley Investment Management is a client-centric, investor-led organization. Our global presence, intellectual capital, and breadth of products and services enable us to partner with investors to meet the evolving challenges of today's financial markets. We aim to deliver superior investment service and to empower our clients to make the informed decisions that help them reach their investment goals.
As always, we thank you for selecting Morgan Stanley Investment Management, and look forward to working with you in the months and years ahead.
Sincerely,

John H. Gernon
President and Principal Executive Officer
January 2016
2
Morgan Stanley Institutional Fund, Inc.
Annual Report — December 31, 2015
Expense Example (unaudited)
Global Opportunity Portfolio
As a shareholder of the Portfolio, you incur two types of costs: (1) transactional costs; and (2) ongoing costs, including advisory fees, administration fees, distribution and shareholder services fees and other Portfolio expenses. This example is intended to help you understand your ongoing costs (in dollars) of investing in the Portfolio and to compare these costs with the ongoing costs of investing in other mutual funds.
This example is based on an investment of $1,000 invested at the beginning of the six-month period ended December 31, 2015 and held for the entire six-month period.
Actual Expenses
The table below provides information about actual account values and actual expenses. You may use the information in this table, together with the amount you invested, to estimate the expenses that you paid over the period. Simply divide your account value by $1,000 (for example, an $8,600 account value divided by $1,000 = 8.6), then multiply the result by the number in the table under the heading entitled "Actual Expenses Paid During Period" to estimate the expenses you paid on your account during this period.
Hypothetical Example for Comparison Purposes
The table below provides information about hypothetical account values and hypothetical expenses based on the Portfolio's actual expense ratio and an assumed rate of return of 5% per year before expenses, which is not the Portfolio's actual return. The hypothetical account values and expenses may not be used to estimate the actual ending account balance or expenses you paid for the period. You may use this information to compare the ongoing costs of investing in the Portfolio and other funds. To do so, compare this 5% hypothetical example with the 5% hypothetical examples that appear in the shareholder reports of the other funds.
Please note that the expenses shown in the table are meant to highlight your ongoing costs only and do not reflect any transactional costs, such as sales charges (loads). Therefore, the information for each class in the table is useful in comparing ongoing costs only, and will not help you determine the relative total costs of owning different funds. In addition, if these transactional costs were included, your costs would have been higher.
| Beginning Account Value 7/1/15 | Actual Ending Account Value 12/31/15 | Hypothetical Ending Account Value | Actual Expenses Paid During Period* | Hypothetical Expenses Paid During Period* | Net Expense Ratio During Period** | ||||||||||||||||||||||
Global Opportunity Portfolio Class I | $ | 1,000.00 | $ | 1,030.90 | $ | 1,020.32 | $ | 4.97 | $ | 4.94 | 0.97 | % | |||||||||||||||
Global Opportunity Portfolio Class A | 1,000.00 | 1,029.50 | 1,019.06 | 6.24 | 6.21 | 1.22 | |||||||||||||||||||||
Global Opportunity Portfolio Class L | 1,000.00 | 1,029.20 | 1,018.90 | 6.39 | 6.36 | 1.25 | |||||||||||||||||||||
Global Opportunity Portfolio Class C | 1,000.00 | 1,025.30 | 1,014.97 | 10.36 | 10.31 | 2.03 | |||||||||||||||||||||
Global Opportunity Portfolio Class IS | 1,000.00 | 1,032.10 | 1,021.48 | 3.79 | 3.77 | 0.74 | |||||||||||||||||||||
* Expenses are calculated using each Portfolio Class' annualized net expense ratio (as disclosed), multiplied by the average account value over the period, and multiplied by 184/365 (to reflect the most recent one-half year period).
** Annualized.
3
Morgan Stanley Institutional Fund, Inc.
Annual Report — December 31, 2015
Investment Overview (unaudited)
Global Opportunity Portfolio
The Portfolio seeks long-term capital appreciation.
Performance
For the year ended December 31, 2015, the Portfolio's Class I shares had a total return based on net asset value and reinvestment of distributions per share of 18.50%, net of fees. The Portfolio's Class I shares outperformed the Portfolio's benchmark, the MSCI All Country World Index (the "Index"), which returned –2.36%. Please keep in mind that high double-digit returns are highly unusual and cannot be sustained.
Factors Affecting Performance
• Global equity markets posted a flat return for the 12-month period. A backdrop of weak global economic growth, intensifying concerns about China's slowdown, shifting sentiment about central bank policies and a sustained decline in commodity prices weighed on the markets throughout the year. On a regional basis, Japan's 9.6% gain outperformed the S&P 500 Index's flat return of 1.4% and Europe's modest 2.8% decline, while emerging market equities suffered a double-digit loss, down 14.9% (as measured by the MSCI Japan Index, MSCI Europe Index and MSCI Emerging Markets Index, respectively).
• The Portfolio's relative outperformance versus the Index was driven primarily by stock selection. Sector allocation, a result of where we're finding the most attractive individual stock opportunities, also contributed positively to relative performance.
• Information technology (IT) was the top contributor in the Portfolio during the period, due to strong stock selection and a sector overweight position. The Portfolio's holdings in two IT services providers with cost advantages in software development outsourcing were the second- and third-largest contributors to the performance of the Portfolio during the period. Performance also benefited from the Portfolio's largest position in a social networking platform that was the fifth largest contributor to returns.
• Stock selection in the consumer discretionary sector was the second-largest contributor to the Portfolio during the period. Relative gains in the sector were led by positions in an online retail and cloud computing leader in the U.S. and a provider of after-school private tutoring services to primary and secondary students in China, the first- and fourth-largest contributors, respectively, to Portfolio performance during the period. Within the sector, performance was negatively impacted by positions
in a U.K. luxury goods retailer and a U.S. hospitality company.
• The Portfolio's lack of exposure to the energy sector, which was the worst-performing sector in the Index during the period, was advantageous to relative to performance.
• Stock selection in the materials sector, primarily due to a position in an agricultural products company in India, was the main detractor from relative performance and the second-worst performing sector in the Index during the period.
• The Portfolio's underweight position in the health care sector, which was the best-performing sector in the Index during the period, was the second-largest detractor from relative returns.
Management Strategies
• There were no changes to our bottom-up investment process during the period. The Growth Team seeks high quality companies, which we define primarily as those with sustainable competitive advantages. Our team continues to focus on bottom-up stock selection and the long-term outlook for companies owned in the portfolio; accordingly, we have had very limited turnover in the portfolio to date, as our ongoing work reaffirms our assessment of quality and competitive advantage in the names we own.

* Minimum Investment for Class I shares
** Commenced Operations on May 30, 2008.
In accordance with SEC regulations, the Portfolio's performance shown assumes that all recurring fees (including management fees) were deducted and all dividends and distributions were reinvested. The performance of Class A, L, C and IS shares will vary from the performance of Class I shares based upon their different inception dates and will be impacted by additional fees assessed to those classes (if applicable).
4
Morgan Stanley Institutional Fund, Inc.
Annual Report — December 31, 2015
Investment Overview (unaudited) (cont'd)
Global Opportunity Portfolio
Performance Compared to the MSCI All Country World Index(1) and the Lipper Global Multi-Cap Growth Funds Index(2)
| Period Ended December 31, 2015 Total Returns(3) | |||||||||||||||||||
Average Annual | |||||||||||||||||||
| One Year | Five Years | Ten Years | Since Inception(7) | ||||||||||||||||
| Portfolio — Class I Shares w/o sales charges(4) | 18.50 | % | 13.62 | % | — | 10.96 | % | ||||||||||||
| Portfolio — Class A Shares w/o sales charges(4) | 18.16 | 13.27 | — | 17.73 | |||||||||||||||
| Portfolio — Class A Shares with maximum 5.25% sales charges(4) | 11.97 | 12.06 | — | 16.60 | |||||||||||||||
| Portfolio — Class L Shares w/o sales charges(4) | 18.03 | 13.21 | — | 10.57 | |||||||||||||||
| Portfolio — Class C Shares w/o sales charges(6) | — | — | — | 4.95 | |||||||||||||||
| Portfolio — Class C Shares with maximum 1.00% deferred sales charges(6) | — | — | — | 3.95 | |||||||||||||||
| Portfolio — Class IS Shares w/o sales charges(5) | 18.64 | — | — | 20.32 | |||||||||||||||
MSCI All Country World Index | –2.36 | 6.09 | — | 2.56 | |||||||||||||||
| Lipper Global Multi-Cap Growth Funds Index | 0.44 | 5.93 | — | 3.65 | |||||||||||||||
Performance data quoted represents past performance, which is no guarantee of future results, and current performance may be lower or higher than the figures shown. Performance assumes that all dividends and distributions, if any, were reinvested. For the most recent month-end performance figures, please visit www.morganstanley.com/im. Investment return and principal value will fluctuate so that Portfolio shares, when redeemed, may be worth more or less than their original cost. Total returns do not reflect the deduction of taxes that a shareholder would pay on Portfolio distributions or the redemption of Portfolio shares. Returns for periods less than one year are not annualized. Performance of share classes will vary due to difference in sales charges and expenses.
(1) The MSCI All Country World Index (ACWI) is a free float-adjusted market capitalization weighted index designed to measure the equity market performance of developed and emerging markets. The term "free float" represents the portion of shares outstanding that are deemed to be available for purchase in the public equity markets by investors. The Index is unmanaged and its returns do not include any sales charges or fees. Such costs would lower performance. It is not possible to invest directly in an index.
(2) The Lipper Global Multi-Cap Growth Funds Index is an equally weighted performance index of the largest qualifying funds (based on net assets) in the Lipper Global Multi-Cap Growth Funds classification. The Index, which is adjusted for capital gains distributions and income dividends, is unmanaged and should not be considered an investment. There are currently 30 funds represented in this Index. As of the date of this report, the Portfolio is in the Lipper Global Multi-Cap Growth Funds classification.
(3) Total returns for the Portfolio reflect fees waived and expenses reimbursed, if applicable, by the Adviser. Without such waivers and reimbursements, total returns would have been lower.
(4) On May 21, 2010, Class C and Class I shares of Van Kampen Global Growth Fund ("the Predecessor Fund") were reorganized into Class L and Class I shares of Morgan Stanley Global Growth Portfolio ("the Portfolio"), respectively. Class L and Class I shares' returns of the Portfolio will differ from the Predecessor Fund as they have different expenses. Performance shown for the Portfolio's Class I and Class L shares reflects the performance of the shares of the Predecessor Fund for periods prior to May 21, 2010. The Class C and I shares of the Predecessor Fund commenced operations on May 30, 2008. Class P shares, which were renamed Class A shares effective September 9, 2013, commenced operations on May 21, 2010. In October 2010, the Morgan Stanley Global Growth Portfolio changed its name to the Morgan Stanley Global Opportunity Portfolio.
(5) Commenced offering on September 13, 2013.
(6) Commenced offering on April 30, 2015.
(7) For comparative purposes, average annual since inception returns listed for the Indexes refer to the inception date of Class I of the Portfolio, not the inception of the Index.
5
Morgan Stanley Institutional Fund, Inc.
Annual Report — December 31, 2015
Portfolio of Investments
Global Opportunity Portfolio
Shares | Value (000) | ||||||||||
Common Stocks (88.5%) | |||||||||||
Australia (0.0%) | |||||||||||
AET&D Holdings No. 1 Ltd. (a)(b)(c) | 36,846 | $ | — | ||||||||
Belgium (1.6%) | |||||||||||
Anheuser-Busch InBev N.V. | 83,151 | 10,271 | |||||||||
Brazil (1.5%) | |||||||||||
CETIP SA — Mercados Organizados | 998,412 | 9,429 | |||||||||
Canada (1.6%) | |||||||||||
Brookfield Infrastructure Partners LP | 269,661 | 10,223 | |||||||||
China (10.6%) | |||||||||||
Autohome, Inc. ADR (a) | 210,179 | 7,340 | |||||||||
China Resources Beer Holdings Company Ltd. (d) | 60,000 | 128 | |||||||||
JD.com, Inc. ADR (a) | 173,994 | 5,614 | |||||||||
Jiangsu Hengrui Medicine Co., Ltd., Class A | 1,694,991 | 12,786 | |||||||||
TAL Education Group ADR (a) | 636,332 | 29,570 | |||||||||
Tencent Holdings Ltd. (d) | 611,000 | 11,919 | |||||||||
Vipshop Holdings Ltd. ADR (a) | 28,037 | 428 | |||||||||
67,785 | |||||||||||
Denmark (4.4%) | |||||||||||
DSV A/S | 720,954 | 28,323 | |||||||||
France (0.4%) | |||||||||||
Hermes International | 6,847 | 2,309 | |||||||||
India (1.9%) | |||||||||||
Jubilant Foodworks Ltd. | 301,622 | 6,751 | |||||||||
Monsanto India Ltd. | 171,516 | 5,698 | |||||||||
12,449 | |||||||||||
Japan (5.9%) | |||||||||||
Calbee, Inc. | 468,000 | 19,641 | |||||||||
Japan Airport Terminal Co., Ltd. | 410,700 | 18,214 | |||||||||
37,855 | |||||||||||
Korea, Republic of (6.0%) | |||||||||||
Loen Entertainment, Inc. (a) | 198,516 | 14,135 | |||||||||
NAVER Corp. (a) | 18,069 | 10,063 | |||||||||
ViroMed Co., Ltd. (a) | 94,171 | 14,576 | |||||||||
38,774 | |||||||||||
South Africa (2.2%) | |||||||||||
Naspers Ltd., Class N | 102,074 | 13,956 | |||||||||
Switzerland (1.4%) | |||||||||||
Kuehne & Nagel International AG (Registered) | 66,791 | 9,158 | |||||||||
United Kingdom (3.9%) | |||||||||||
Burberry Group PLC | 775,624 | 13,642 | |||||||||
Just Eat PLC (a) | 1,604,766 | 11,672 | |||||||||
25,314 | |||||||||||
United States (47.1%) | |||||||||||
Alphabet, Inc., Class C (a) | 29,113 | 22,093 | |||||||||
Amazon.com, Inc. (a) | 55,850 | 37,748 | |||||||||
Cognizant Technology Solutions Corp., Class A (a) | 438,577 | 26,323 | |||||||||
EPAM Systems, Inc. (a) | 490,932 | 38,597 | |||||||||
Facebook, Inc., Class A (a) | 529,184 | 55,384 | |||||||||
Globant SA (a) | 99,033 | 3,715 | |||||||||
Luxoft Holding, Inc. (a) | 378,291 | 29,178 | |||||||||
Shares | Value (000) | ||||||||||
Mastercard, Inc., Class A | 243,588 | $ | 23,716 | ||||||||
Monsanto Co. | 92,761 | 9,139 | |||||||||
Priceline Group, Inc. (The) (a) | 16,686 | 21,274 | |||||||||
Visa, Inc., Class A | 299,724 | 23,244 | |||||||||
WisdomTree Investments, Inc. | 775,800 | 12,164 | |||||||||
302,575 | |||||||||||
Total Common Stocks (Cost $461,804) | 568,421 | ||||||||||
Preferred Stocks (2.3%) | |||||||||||
India (0.0%) | |||||||||||
| Flipkart Online Services Pvt Ltd. Series D (a)(b)(c)(e) (acquisition cost — $52; acquired 10/4/13) | 2,242 | 233 | |||||||||
United States (2.3%) | |||||||||||
| Airbnb, Inc. Series D (a)(b)(c)(e) (acquisition cost — $1,594; acquired 4/16/14) | 39,153 | 3,275 | |||||||||
| Magic Leap Series C (a)(b)(c)(e) (acquisition cost — $3,175; acquired 12/22/15) | 137,829 | 3,175 | |||||||||
| Uber Techonologies Series G (a)(b)(c)(e) (acquisition cost — $8,232; acquired 12/3/15) | 168,793 | 8,232 | |||||||||
14,682 | |||||||||||
Total Preferred Stocks (Cost $13,053) | 14,915 | ||||||||||
Convertible Preferred Stock (0.0%) | |||||||||||
China (0.0%) | |||||||||||
| Youku Tudou, Inc., Class A (a)(b)(e) (acquisition cost — $—@; acquired 9/16/10) (Cost $—@) | 9 | — | @ | ||||||||
Participation Notes (1.4%) | |||||||||||
China (1.4%) | |||||||||||
| Jiangsu Yanghe Brewery, Class A, Equity Linked Notes, expires 1/23/17 (a) | 275,800 | 2,905 | |||||||||
| Kweichow Moutai Co., Ltd., Class A, Equity Linked Notes, expires 3/4/21 (a) | 190,623 | 6,388 | |||||||||
Total Participation Notes (Cost $7,594) | 9,293 | ||||||||||
| Notional Amount | |||||||||||
Call Option Purchased (0.1%) | |||||||||||
Foreign Currency Option (0.1%) | |||||||||||
| USD/CNY June 2016 @ CNY 6.70, Royal Bank of Scotland (Cost $152) | 39,034,821 | 673 | |||||||||
Shares | |||||||||||
Short-Term Investment (5.2%) | |||||||||||
Investment Company (5.2%) | |||||||||||
| Morgan Stanley Institutional Liquidity Funds — Money Market Portfolio — Institutional Class (See Note G) (Cost $33,417) | 33,417,424 | 33,417 | |||||||||
| Total Investments (97.5%) (Cost $516,020) (f)(g) | 626,719 | ||||||||||
Other Assets in Excess of Liabilities (2.5%) | 15,791 | ||||||||||
Net Assets (100.0%) | $ | 642,510 | |||||||||
(a) Non-income producing security.
(b) Security has been deemed illiquid at December 31, 2015.
The accompanying notes are an integral part of the financial statements.
6
Morgan Stanley Institutional Fund, Inc.
Annual Report — December 31, 2015
Portfolio of Investments (cont'd)
Global Opportunity Portfolio
(c) At December 31, 2015, the Portfolio held fair valued securities valued at approximately $14,915,000, representing 2.3% of net assets. These securities have been fair valued as determined in good faith under procedures established by and under the general supervision of the Fund's Directors.
(d) Security trades on the Hong Kong exchange.
(e) Security cannot be offered for public resale without first being registered under the Securities Act of 1933 and related rules ("restricted security"). Acquisition date represents the day on which an enforceable right to acquire such security is obtained and is presented along with related cost in the security description. The Portfolio has registration rights for certain restricted securities. Any costs related to such registration are borne by the issuer. The aggregate value of restricted securities (excluding 144A holdings) at December 31, 2015 amounts to approximately $14,915,000 and represents 2.3% of net assets.
(f) The approximate fair value and percentage of net assets, $212,671,000 and 33.1%, respectively, represent the securities that have been fair valued under the fair valuation policy for international investments as described in Note A-1 within the Notes to the Financial Statements.
(g) At December 31, 2015, the aggregate cost for Federal income tax purposes is approximately $517,591,000. The aggregate gross unrealized appreciation is approximately $118,005,000 and the aggregate gross unrealized depreciation is approximately $8,877,000 resulting in net unrealized appreciation of approximately $109,128,000.
@ Value is less than $500.
ADR American Depositary Receipt.
CNY Chinese Yuan Renminbi
USD United States Dollar
Portfolio Composition
Classification | Percentage of Total Investments | ||||||
Other* | 41.0 | % | |||||
Information Technology Services | 22.5 | ||||||
Internet Software & Services | 18.9 | ||||||
Internet & Catalog Retail | 12.3 | ||||||
Short-Term Investment | 5.3 | ||||||
Total Investments | 100.0 | % | |||||
* Industries and/or investment types representing less than 5% of total investments.
The accompanying notes are an integral part of the financial statements.
7
Morgan Stanley Institutional Fund, Inc.
Annual Report — December 31, 2015
Global Opportunity Portfolio
Statement of Assets and Liabilities | December 31, 2015 (000) | ||||||
Assets: | |||||||
Investments in Securities of Unaffiliated Issuers, at Value (Cost $482,603) | $ | 593,302 | |||||
Investment in Security of Affiliated Issuer, at Value (Cost $33,417) | 33,417 | ||||||
Total Investments in Securities, at Value (Cost $516,020) | 626,719 | ||||||
Foreign Currency, at Value (Cost $238) | 238 | ||||||
Cash | 50 | ||||||
Receivable for Investments Sold | 34,043 | ||||||
Receivable for Portfolio Shares Sold | 7,296 | ||||||
Dividends Receivable | 205 | ||||||
Tax Reclaim Receivable | 32 | ||||||
Receivable from Affiliate | 11 | ||||||
Other Assets | 64 | ||||||
Total Assets | 668,658 | ||||||
Liabilities: | |||||||
Payable for Investments Purchased | 23,089 | ||||||
Payable for Portfolio Shares Redeemed | 1,230 | ||||||
Payable for Advisory Fees | 691 | ||||||
Due to Broker | 690 | ||||||
Payable for Shareholder Services Fees — Class A | 72 | ||||||
Payable for Distribution and Shareholder Services Fees — Class L | 11 | ||||||
Payable for Distribution and Shareholder Services Fees — Class C | 14 | ||||||
Payable for Transfer Agency Fees — Class I | 2 | ||||||
Payable for Transfer Agency Fees — Class A | 80 | ||||||
Payable for Transfer Agency Fees — Class L | 12 | ||||||
Payable for Transfer Agency Fees — Class C | — | @ | |||||
Payable for Sub Transfer Agency Fees — Class I | 5 | ||||||
Payable for Sub Transfer Agency Fees — Class A | 54 | ||||||
Payable for Sub Transfer Agency Fees — Class L | 11 | ||||||
Payable for Sub Transfer Agency Fees — Class C | 2 | ||||||
Payable for Professional Fees | 51 | ||||||
Payable for Reorganization Expense | 45 | ||||||
Payable for Administration Fees | 41 | ||||||
Payable for Custodian Fees | 31 | ||||||
Other Liabilities | 17 | ||||||
Total Liabilities | 26,148 | ||||||
Net Assets | $ | 642,510 | |||||
Net Assets Consist Of: | |||||||
Paid-in-Capital | $ | 492,902 | |||||
Accumulated Net Investment Loss | (9 | ) | |||||
Accumulated Undistributed Net Realized Gain | 38,925 | ||||||
Unrealized Appreciation (Depreciation) on: | |||||||
Investments | 110,699 | ||||||
Foreign Currency Translations | (7 | ) | |||||
Net Assets | $ | 642,510 | |||||
The accompanying notes are an integral part of the financial statements.
8
Morgan Stanley Institutional Fund, Inc.
Annual Report — December 31, 2015
Global Opportunity Portfolio
Statement of Assets and Liabilities (cont'd) | December 31, 2015 (000) | ||||||
CLASS I: | |||||||
Net Assets | $ | 238,920 | |||||
| Shares Outstanding $0.001 par value shares of beneficial interest (unlimited shares authorized) (not in 000's) | 14,600,891 | ||||||
Net Asset Value, Offering and Redemption Price Per Share | $ | 16.36 | |||||
CLASS A: | |||||||
Net Assets | $ | 347,683 | |||||
| Shares Outstanding $0.001 par value shares of beneficial interest (unlimited shares authorized) (not in 000's) | 21,690,940 | ||||||
Net Asset Value, Redemption Price Per Share | $ | 16.03 | |||||
Maximum Sales Load | 5.25 | % | |||||
Maximum Sales Charge | $ | 0.89 | |||||
Maximum Offering Price Per Share | $ | 16.92 | |||||
CLASS L: | |||||||
Net Assets | $ | 34,628 | |||||
| Shares Outstanding $0.001 par value shares of beneficial interest (unlimited shares authorized) (not in 000's) | 2,181,786 | ||||||
Net Asset Value, Offering and Redemption Price Per Share | $ | 15.87 | |||||
CLASS C: | |||||||
Net Assets | $ | 20,475 | |||||
| Shares Outstanding $0.001 par value shares of beneficial interest (unlimited shares authorized) (not in 000's) | 1,295,519 | ||||||
Net Asset Value, Offering and Redemption Price Per Share | $ | 15.80 | |||||
CLASS IS: | |||||||
Net Assets | $ | 804 | |||||
| Shares Outstanding $0.001 par value shares of beneficial interest (unlimited shares authorized) (not in 000's) | 49,095 | ||||||
Net Asset Value, Offering and Redemption Price Per Share | $ | 16.38 | |||||
@ Amount is less than $500.
The accompanying notes are an integral part of the financial statements.
9
Morgan Stanley Institutional Fund, Inc.
Annual Report — December 31, 2015
Global Opportunity Portfolio
Statement of Operations | Year Ended December 31, 2015 (000) | ||||||
Investment Income: | |||||||
Dividends from Securities of Unaffiliated Issuers (Net of $30 of Foreign Taxes Withheld) | $ | 774 | |||||
Dividends from Security of Affiliated Issuer (Note G) | 19 | ||||||
Total Investment Income | 793 | ||||||
Expenses: | |||||||
Advisory Fees (Note B) | 1,017 | ||||||
Shareholder Services Fees — Class A (Note D) | 150 | ||||||
Distribution and Shareholder Services Fees — Class L (Note D) | 36 | ||||||
Distribution and Shareholder Services Fees — Class C (Note D) | 43 | ||||||
Professional Fees | 111 | ||||||
Administration Fees (Note C) | 101 | ||||||
Custodian Fees (Note F) | 76 | ||||||
Sub Transfer Agency Fees — Class I | 19 | ||||||
Sub Transfer Agency Fees — Class A | 44 | ||||||
Sub Transfer Agency Fees — Class L | 3 | ||||||
Sub Transfer Agency Fees — Class C | 3 | ||||||
Registration Fees | 56 | ||||||
Shareholder Reporting Fees | 44 | ||||||
Reorganization Expense | 30 | ||||||
Transfer Agency Fees — Class I (Note E) | 3 | ||||||
Transfer Agency Fees — Class A (Note E) | 13 | ||||||
Transfer Agency Fees — Class L (Note E) | 3 | ||||||
Transfer Agency Fees — Class C (Note E) | 1 | ||||||
Transfer Agency Fees — Class IS (Note E) | 2 | ||||||
Pricing Fees | 6 | ||||||
Directors' Fees and Expenses | 2 | ||||||
Other Expenses | 22 | ||||||
Total Expenses | 1,785 | ||||||
Waiver of Advisory Fees (Note B) | (289 | ) | |||||
Distribution Fees — Class L Shares Waived (Note D) | (22 | ) | |||||
Rebate from Morgan Stanley Affiliate (Note G) | (8 | ) | |||||
Reimbursement of Class Specific Expenses — Class IS (Note B) | (2 | ) | |||||
Net Expenses | 1,464 | ||||||
Net Investment Loss | (671 | ) | |||||
Realized Gain: | |||||||
Investments Sold (Net of $8 of Capital Gain Country Tax) | 40,506 | ||||||
Foreign Currency Transactions | 135 | ||||||
Net Realized Gain | 40,641 | ||||||
Change in Unrealized Appreciation (Depreciation): | |||||||
Investments (Net of Decrease in Deferred Capital Gain Country Tax of $19) | (35,579 | ) | |||||
Foreign Currency Translations | (7 | ) | |||||
Net Change in Unrealized Appreciation (Depreciation) | (35,586 | ) | |||||
Net Realized Gain and Change in Unrealized Appreciation (Depreciation) | 5,055 | ||||||
Net Increase in Net Assets Resulting from Operations | $ | 4,384 | |||||
The accompanying notes are an integral part of the financial statements.
10
Morgan Stanley Institutional Fund, Inc.
Annual Report — December 31, 2015
Global Opportunity Portfolio
Statements of Changes in Net Assets | Year Ended December 31, 2015 (000) | Year Ended December 31, 2014 (000) | |||||||||
Increase (Decrease) in Net Assets: | |||||||||||
Operations: | |||||||||||
Net Investment Loss | $ | (671 | ) | $ | (99 | ) | |||||
Net Realized Gain | 40,641 | 1,331 | |||||||||
Net Change in Unrealized Appreciation (Depreciation) | (35,586 | ) | 37 | ||||||||
Net Increase in Net Assets Resulting from Operations | 4,384 | 1,269 | |||||||||
Distributions from and/or in Excess of: | |||||||||||
Class I: | |||||||||||
Net Realized Gain | (1,177 | ) | (523 | ) | |||||||
Class A: | |||||||||||
Net Realized Gain | (910 | ) | (586 | ) | |||||||
Class L: | |||||||||||
Net Realized Gain | (40 | ) | (71 | ) | |||||||
Class C: | |||||||||||
Net Realized Gain | (123 | ) | — | ||||||||
Class IS: | |||||||||||
Net Realized Gain | (— | @) | (1 | ) | |||||||
Total Distributions | (2,250 | ) | (1,181 | ) | |||||||
Capital Share Transactions:(1) | |||||||||||
Class I: | |||||||||||
Subscribed | 163,052 | 3,648 | |||||||||
Issued due to a tax-free reorganization | 77,071 | — | |||||||||
Distributions Reinvested | 1,081 | 124 | |||||||||
Redeemed | (16,394 | ) | (166 | ) | |||||||
Class A: | |||||||||||
Subscribed | 113,695 | 10,218 | |||||||||
Issued due to a tax-free reorganization | 235,675 | — | |||||||||
Distributions Reinvested | 906 | 586 | |||||||||
Redeemed | (14,930 | ) | �� | (1,863 | ) | ||||||
Class L: | |||||||||||
Subscribed | 2,004 | 809 | |||||||||
Issued due to a tax-free reorganization | 32,385 | — | |||||||||
Distributions Reinvested | 38 | 62 | |||||||||
Redeemed | (558 | ) | (303 | ) | |||||||
Class C: | |||||||||||
Subscribed | 21,201 | * | — | ||||||||
Distributions Reinvested | 122 | * | — | ||||||||
Redeemed | (869 | )* | — | ||||||||
Class IS: | |||||||||||
Subscribed | 7 | — | |||||||||
Issued due to a tax-free reorganization | 799 | — | |||||||||
Net Increase in Net Assets Resulting from Capital Share Transactions | 615,285 | 13,115 | |||||||||
Total Increase in Net Assets | 617,419 | 13,203 | |||||||||
Net Assets: | |||||||||||
Beginning of Period | 25,091 | 11,888 | |||||||||
End of Period (Including Accumulated Net Investment Loss of $(9) and $( —@)) | $ | 642,510 | $ | 25,091 | |||||||
The accompanying notes are an integral part of the financial statements.
11
Morgan Stanley Institutional Fund, Inc.
Annual Report — December 31, 2015
Global Opportunity Portfolio
Statements of Changes in Net Assets (cont'd) | Year Ended December 31, 2015 (000) | Year Ended December 31, 2014 (000) | |||||||||
(1) Capital Share Transactions: | |||||||||||
Class I: | |||||||||||
Shares Subscribed | 10,166 | 258 | |||||||||
Shares Issued due to a tax-free reorganization | 4,618 | — | |||||||||
Shares Issued on Distributions Reinvested | 65 | 9 | |||||||||
Shares Redeemed | (1,038 | ) | (12 | ) | |||||||
Net Increase in Class I Shares Outstanding | 13,811 | 255 | |||||||||
Class A: | |||||||||||
Shares Subscribed | 7,220 | 734 | |||||||||
Shares Issued due to a tax-free reorganization | 14,414 | — | |||||||||
Shares Issued on Distributions Reinvested | 56 | 43 | |||||||||
Shares Redeemed | (941 | ) | (136 | ) | |||||||
Net Increase in Class A Shares Outstanding | 20,749 | 641 | |||||||||
Class L: | |||||||||||
Shares Subscribed | 136 | 58 | |||||||||
Shares Issued due to a tax-free reorganization | 2,000 | — | |||||||||
Shares Issued on Distributions Reinvested | 2 | 5 | |||||||||
Shares Redeemed | (36 | ) | (22 | ) | |||||||
Net Increase in Class L Shares Outstanding | 2,102 | 41 | |||||||||
Class C: | |||||||||||
Shares Subscribed | 1,345 | * | — | ||||||||
Shares Issued on Distributions Reinvested | 8 | * | — | ||||||||
Shares Redeemed | (57 | )* | — | ||||||||
Net Increase in Class C Shares Outstanding | 1,296 | — | |||||||||
Class IS: | |||||||||||
Shares Subscribed | — | @@ | — | ||||||||
Shares Issued due to a tax-free reorganization | 48 | — | |||||||||
Net Increase in Class IS Shares Outstanding | 48 | — | |||||||||
* For the period April 30, 2015 through December 31, 2015.
@ Amount is less than $500.
@@ Amount is less than 500 shares.
The accompanying notes are an integral part of the financial statements.
12
Morgan Stanley Institutional Fund, Inc.
Annual Report — December 31, 2015
Financial Highlights
Global Opportunity Portfolio
Class I | |||||||||||||||||||||||
Year Ended December 31, | |||||||||||||||||||||||
Selected Per Share Data and Ratios | 2015 | 2014 | 2013 | 2012 | 2011 | ||||||||||||||||||
Net Asset Value, Beginning of Period | $ | 13.98 | $ | 13.65 | $ | 10.84 | $ | 10.26 | $ | 11.58 | |||||||||||||
Income (Loss) from Investment Operations: | |||||||||||||||||||||||
Net Investment Income (Loss)† | (0.05 | ) | (0.06 | ) | (0.02 | ) | 0.01 | 0.02 | |||||||||||||||
Net Realized and Unrealized Gain (Loss) | 2.64 | 1.26 | 4.21 | 1.01 | (0.57 | ) | |||||||||||||||||
Total from Investment Operations | 2.59 | 1.20 | 4.19 | 1.02 | (0.55 | ) | |||||||||||||||||
Distributions from and/or in Excess of: | |||||||||||||||||||||||
Net Realized Gain | (0.21 | ) | (0.87 | ) | (1.38 | ) | (0.44 | ) | (0.77 | ) | |||||||||||||
Redemption Fees | — | — | — | — | 0.00 | ‡ | |||||||||||||||||
Net Asset Value, End of Period | $ | 16.36 | $ | 13.98 | $ | 13.65 | $ | 10.84 | $ | 10.26 | |||||||||||||
Total Return++ | 18.50 | % | 9.04 | % | 40.12 | % | 9.99 | % | (4.90 | )% | |||||||||||||
Ratios and Supplemental Data: | |||||||||||||||||||||||
Net Assets, End of Period (Thousands) | $ | 238,920 | $ | 11,037 | $ | 7,293 | $ | 5,069 | $ | 8,386 | |||||||||||||
Ratio of Expenses to Average Net Assets (1) | 0.98 | %+^ | 1.17 | %+ | 1.24 | %+ | 1.25 | %+ | 1.25 | %+ | |||||||||||||
Ratio of Net Investment Income (Loss) to Average Net Assets (1) | (0.33 | )%+ | (0.42 | )%+ | (0.21 | )%+ | 0.06 | %+ | 0.13 | %+ | |||||||||||||
Ratio of Rebate from Morgan Stanley Affiliates to Average Net Assets | 0.01 | % | 0.01 | % | 0.00 | %§ | 0.00 | %§ | 0.00 | %§ | |||||||||||||
Portfolio Turnover Rate | 115 | % | 29 | % | 38 | % | 33 | % | 39 | % | |||||||||||||
(1) Supplemental Information on the Ratios to Average Net Assets: | |||||||||||||||||||||||
Ratios Before Expense Limitation: | |||||||||||||||||||||||
Expenses to Average Net Assets | 1.20 | % | 2.47 | % | 3.36 | % | 2.57 | % | 2.92 | % | |||||||||||||
Net Investment Loss to Average Net Assets | (0.55 | )% | (1.72 | )% | (2.33 | )% | (1.26 | )% | (1.54 | )% | |||||||||||||
† Per share amount is based on average shares outstanding.
‡ Amount is less than $0.005 per share.
++ Calculated based on the net asset value as of the last business day of the period.
+ The Ratios of Expenses and Net Investment Income (Loss) reflect the rebate of certain Portfolio expenses in connection with the investments in Morgan Stanley affiliates during the period. The effect of the rebate on the ratios is disclosed in the above table as "Ratio of Rebate from Morgan Stanley Affiliates to Average Net Assets."
^ Effective December 7, 2015, the Adviser has agreed to limit the ratio of expenses to average net assets to the maximum ratio of 0.81% for Class I shares. Prior to December 7, 2015, the maximum ratio was 1.10% for Class I shares. Prior to January 23, 2015, the maximum ratio was 1.25% for Class I shares.
§ Amount is less than 0.005%.
The accompanying notes are an integral part of the financial statements.
13
Morgan Stanley Institutional Fund, Inc.
Annual Report — December 31, 2015
Financial Highlights
Global Opportunity Portfolio
Class A | |||||||||||||||||||||||
Year Ended December 31, | |||||||||||||||||||||||
Selected Per Share Data and Ratios | 2015 | 2014 | 2013 | 2012 | 2011 | ||||||||||||||||||
Net Asset Value, Beginning of Period | $ | 13.75 | $ | 13.48 | $ | 10.75 | $ | 10.21 | $ | 11.56 | |||||||||||||
Income (Loss) from Investment Operations: | |||||||||||||||||||||||
Net Investment Loss† | (0.10 | ) | (0.11 | ) | (0.15 | ) | (0.02 | ) | (0.01 | ) | |||||||||||||
Net Realized and Unrealized Gain (Loss) | 2.59 | 1.25 | 4.26 | 1.00 | (0.57 | ) | |||||||||||||||||
Total from Investment Operations | 2.49 | 1.14 | 4.11 | 0.98 | (0.58 | ) | |||||||||||||||||
Distributions from and/or in Excess of: | |||||||||||||||||||||||
Net Realized Gain | (0.21 | ) | (0.87 | ) | (1.38 | ) | (0.44 | ) | (0.77 | ) | |||||||||||||
Redemption Fees | — | — | — | — | 0.00 | ‡ | |||||||||||||||||
Net Asset Value, End of Period | $ | 16.03 | $ | 13.75 | $ | 13.48 | $ | 10.75 | $ | 10.21 | |||||||||||||
Total Return++ | 18.16 | % | 8.55 | % | 39.80 | % | 9.65 | % | (5.16 | )% | |||||||||||||
Ratios and Supplemental Data: | |||||||||||||||||||||||
Net Assets, End of Period (Thousands) | $ | 347,683 | $ | 12,952 | $ | 4,057 | $ | 87 | $ | 10 | |||||||||||||
Ratio of Expenses to Average Net Assets (1) | 1.25 | %+^^ | 1.56 | %+ | 1.59 | %+^ | 1.50 | %+ | 1.50 | %+ | |||||||||||||
Ratio of Net Investment Loss to Average Net Assets (1) | (0.64 | )%+ | (0.82 | )%+ | (1.15 | )%+ | (0.19 | )%+ | (0.12 | )%+ | |||||||||||||
Ratio of Rebate from Morgan Stanley Affiliates to Average Net Assets | 0.01 | % | 0.01 | % | 0.00 | %§ | 0.00 | %§ | 0.00 | %§ | |||||||||||||
Portfolio Turnover Rate | 115 | % | 29 | % | 38 | % | 33 | % | 39 | % | |||||||||||||
(1) Supplemental Information on the Ratios to Average Net Assets: | |||||||||||||||||||||||
Ratios Before Expense Limitation: | |||||||||||||||||||||||
Expenses to Average Net Assets | 1.50 | % | 2.86 | % | 3.93 | % | 2.82 | % | 3.17 | % | |||||||||||||
Net Investment Loss to Average Net Assets | (0.89 | )% | (2.12 | )% | (3.49 | )% | (1.51 | )% | (1.79 | )% | |||||||||||||
† Per share amount is based on average shares outstanding.
‡ Amount is less than $0.005 per share.
++ Calculated based on the net asset value which does not reflect sales charges, if applicable, as of the last business day of the period.
+ The Ratios of Expenses and Net Investment Loss reflect the rebate of certain Portfolio expenses in connection with the investments in Morgan Stanley affiliates during the period. The effect of the rebate on the ratios is disclosed in the above table as "Ratio of Rebate from Morgan Stanley Affiliates to Average Net Assets."
^ Effective September 16, 2013, the Adviser has agreed to limit the ratio of expenses to average net assets to the maximum ratio of 1.60% for Class A shares. Prior to September 16, 2013, the maximum ratio was 1.50% for Class A shares.
^^ Effective December 7, 2015, the Adviser has agreed to limit the ratio of expenses to average net assets to the maximum ratio of 1.23% for Class A shares. Prior to December 7, 2015, the maximum ratio was 1.45% for Class A shares. Prior to January 23, 2015, the maximum ratio was 1.60% for Class A shares.
§ Amount is less than 0.005%.
The accompanying notes are an integral part of the financial statements.
14
Morgan Stanley Institutional Fund, Inc.
Annual Report — December 31, 2015
Financial Highlights
Global Opportunity Portfolio
Class L | |||||||||||||||||||||||
Year Ended December 31, | |||||||||||||||||||||||
Selected Per Share Data and Ratios | 2015 | 2014 | 2013 | 2012 | 2011 | ||||||||||||||||||
Net Asset Value, Beginning of Period | $ | 13.62 | $ | 13.38 | $ | 10.68 | $ | 10.15 | $ | 11.50 | |||||||||||||
Income (Loss) from Investment Operations: | |||||||||||||||||||||||
Net Investment Loss† | (0.11 | ) | (0.12 | ) | (0.07 | ) | (0.03 | ) | (0.02 | ) | |||||||||||||
Net Realized and Unrealized Gain (Loss) | 2.57 | 1.23 | 4.15 | 1.00 | (0.56 | ) | |||||||||||||||||
Total from Investment Operations | 2.46 | 1.11 | 4.08 | 0.97 | (0.58 | ) | |||||||||||||||||
Distributions from and/or in Excess of: | |||||||||||||||||||||||
Net Realized Gain | (0.21 | ) | (0.87 | ) | (1.38 | ) | (0.44 | ) | (0.77 | ) | |||||||||||||
Redemption Fees | — | — | — | — | 0.00 | ‡ | |||||||||||||||||
Net Asset Value, End of Period | $ | 15.87 | $ | 13.62 | $ | 13.38 | $ | 10.68 | $ | 10.15 | |||||||||||||
Total Return++ | 18.03 | % | 8.46 | % | 39.79 | % | 9.61 | % | (5.19 | )% | |||||||||||||
Ratios and Supplemental Data: | |||||||||||||||||||||||
Net Assets, End of Period (Thousands) | $ | 34,628 | $ | 1,091 | $ | 527 | $ | 396 | $ | 505 | |||||||||||||
Ratio of Expenses to Average Net Assets (1) | 1.30 | %+^^ | 1.64 | %+ | 1.58 | %+^ | 1.55 | %+ | 1.55 | %+ | |||||||||||||
Ratio of Net Investment Loss to Average Net Assets (1) | (0.70 | )%+ | (0.87 | )%+ | (0.57 | )%+ | (0.24 | )%+ | (0.17 | )%+ | |||||||||||||
Ratio of Rebate from Morgan Stanley Affiliates to Average Net Assets | 0.01 | % | 0.01 | % | 0.00 | %§ | 0.00 | %§ | 0.00 | %§ | |||||||||||||
Portfolio Turnover Rate | 115 | % | 29 | % | 38 | % | 33 | % | 39 | % | |||||||||||||
(1) Supplemental Information on the Ratios to Average Net Assets: | |||||||||||||||||||||||
Ratios Before Expense Limitation: | |||||||||||||||||||||||
Expenses to Average Net Assets | 2.03 | % | 3.52 | % | 4.23 | % | 3.32 | % | 3.67 | % | |||||||||||||
Net Investment Loss to Average Net Assets | (1.43 | )% | (2.75 | )% | (3.22 | )% | (2.01 | )% | (2.29 | )% | |||||||||||||
† Per share amount is based on average shares outstanding.
‡ Amount is less than $0.005 per share.
++ Calculated based on the net asset value as of the last business day of the period.
+ The Ratios of Expenses and Net Investment Loss reflect the rebate of certain Portfolio expenses in connection with the investments in Morgan Stanley affiliates during the period. The effect of the rebate on the ratios is disclosed in the above table as "Ratio of Rebate from Morgan Stanley Affiliates to Average Net Assets."
^ Effective September 16, 2013, the Adviser has agreed to limit the ratio of expenses to average net assets to the maximum ratio of 1.65% for Class L shares. Prior to September 16, 2013, the maximum ratio was 1.55% for Class L shares.
^^ Effective January 23, 2015, the Adviser has agreed to limit the ratio of expenses to average net assets to the maximum ratio of 1.50% for Class L shares. Prior to January 23, 2015, the maximum ratio was 1.65% for Class L shares.
§ Amount is less than 0.005%.
The accompanying notes are an integral part of the financial statements.
15
Morgan Stanley Institutional Fund, Inc.
Annual Report — December 31, 2015
Financial Highlights
Global Opportunity Portfolio
Class C | |||||||
Selected Per Share Data and Ratios | Period from April 30, 2015^ to December 31, 2015 | ||||||
Net Asset Value, Beginning of Period | $ | 15.25 | |||||
Income (Loss) from Investment Operations: | |||||||
Net Investment Loss† | (0.15 | ) | |||||
Net Realized and Unrealized Gain | 0.91 | ||||||
Total from Investment Operations | 0.76 | ||||||
Distributions from and/or in Excess of: | |||||||
Net Realized Gain | (0.21 | ) | |||||
Net Asset Value, End of Period | $ | 15.80 | |||||
Total Return++ | 4.95 | %# | |||||
Ratios and Supplemental Data: | |||||||
Net Assets, End of Period (Thousands) | $ | 20,475 | |||||
Ratios of Expenses to Average Net Assets (1) | 2.03 | %+* | |||||
Ratio of Net Investment Loss to Average Net Assets (1) | (1.40 | )%+* | |||||
Ratio of Rebate from Morgan Stanley Affiliates to Average Net Assets | 0.01 | %* | |||||
Portfolio Turnover Rate | 115 | % | |||||
(1) Supplemental Information on the Ratios to Average Net Assets: | |||||||
Ratios Before Expense Limitation: | |||||||
Expense to Average Net Assets | 2.22 | %* | |||||
Net Investment Loss to Average Net Assets | (1.59 | )%* | |||||
^ Commencement of Offering.
† Per share amount is based on average shares outstanding.
++ Calculated based on the net asset value which does not reflect sales charges, if applicable, as of the last business day of the period.
+ The Ratios of Expenses and Net Investment Loss reflect the rebate of certain Portfolio expenses in connection with the investments in Morgan Stanley affiliates during the period. The effect of the rebate on the ratios is disclosed in the above table as "Ratio of Rebate from Morgan Stanley Affiliates to Average Net Assets."
# Not Annualized.
* Annualized.
The accompanying notes are an integral part of the financial statements.
16
Morgan Stanley Institutional Fund, Inc.
Annual Report — December 31, 2015
Financial Highlights
Global Opportunity Portfolio
Class IS | |||||||||||||||
Year Ended December 31, | Period from September 13, 2013^ to | ||||||||||||||
Selected Per Share Data and Ratios | 2015 | 2014 | December 31, 2013 | ||||||||||||
Net Asset Value, Beginning of Period | $ | 13.99 | $ | 13.65 | $ | 12.43 | |||||||||
Income (Loss) from Investment Operations: | |||||||||||||||
Net Investment Loss† | (0.05 | ) | (0.06 | ) | (0.03 | ) | |||||||||
Net Realized and Unrealized Gain | 2.65 | 1.27 | 2.27 | ||||||||||||
Total from Investment Operations | 2.60 | 1.21 | 2.24 | ||||||||||||
Distributions from and/or in Excess of: | |||||||||||||||
Net Realized Gain | (0.21 | ) | (0.87 | ) | (1.02 | ) | |||||||||
Net Asset Value, End of Period | $ | 16.38 | $ | 13.99 | $ | 13.65 | |||||||||
Total Return++ | 18.64 | % | 8.96 | % | 18.35 | %# | |||||||||
Ratios and Supplemental Data: | |||||||||||||||
Net Assets, End of Period (Thousands) | $ | 804 | $ | 11 | $ | 11 | |||||||||
Ratio of Expenses to Average Net Assets (1) | 0.77 | %+^^^ | 1.17 | %+ | 1.18 | %+^^* | |||||||||
Ratio of Net Investment Loss to Average Net Assets (1) | (0.28 | )%+ | (0.42 | )%+ | (0.74 | )%+* | |||||||||
Ratio of Rebate from Morgan Stanley Affiliates to Average Net Assets | 0.01 | % | 0.01 | % | 0.00 | %§* | |||||||||
Portfolio Turnover Rate | 115 | % | 29 | % | 38 | %# | |||||||||
(1) Supplemental Information on the Ratios to Average Net Assets: | |||||||||||||||
Ratios Before Expense Limitation: | |||||||||||||||
Expenses to Average Net Assets | 3.56 | % | 19.50 | % | 8.44 | %* | |||||||||
Net Investment Loss to Average Net Assets | (3.07 | )% | (18.75 | )% | (8.00 | )%* | |||||||||
^ Commencement of Offering.
† Per share amount is based on average shares outstanding.
++ Calculated based on the net asset value as of the last business day of the period.
+ The Ratios of Expenses and Net Investment Loss reflect the rebate of certain Portfolio expenses in connection with the investments in Morgan Stanley affiliates during the period. The effect of the rebate on the ratios is disclosed in the above table as "Ratio of Rebate from Morgan Stanley Affiliates to Average Net Assets."
^^ Effective September 16, 2013, the Adviser has agreed to limit the ratio of expenses to average net assets to the maximum ratio of 1.18% for Class IS shares.
^^^ Effective December 7, 2015, the Adviser has agreed to limit the ratio of expenses to average net assets to the maximum ratio of 0.72% for Class IS shares. Prior to December 7, 2015, the maximum ratio was 1.03% for Class IS shares. Prior to January 23, 2015, the maximum ratio was 1.18% for Class IS shares.
§ Amount is less than 0.005%.
# Not Annualized.
* Annualized.
The accompanying notes are an integral part of the financial statements.
17
Morgan Stanley Institutional Fund, Inc.
Annual Report — December 31, 2015
Notes to Financial Statements
Morgan Stanley Institutional Fund, Inc. (the "Fund") is registered under the Investment Company Act of 1940, as amended (the "Act"), as an open-end management investment company. The Fund is comprised of twenty-six separate, active, diversified and non-diversified portfolios (individually referred to as a "Portfolio", collectively as the "Portfolios"). The Fund applies investment company accounting and reporting guidance.
The accompanying financial statements relate to the Global Opportunity Portfolio. The Portfolio seeks long-term capital appreciation by investing primarily in established and emerging companies located throughout the world, with capitalizations within the range of companies included in the MSCI All Country World Index.
The Portfolio offers five classes of shares — Class I, Class A, Class L, Class C and Class IS. On April 30, 2015, the Portfolio commenced offering Class C shares and suspended offering of Class L shares. Existing Class L shareholders may invest through reinvestment of dividends and distributions.
On December 7, 2015, the Portfolio acquired the net assets of the Fund's Opportunity Portfolio ("Opportunity Portfolio"), an open-end investment company. Based on the respective valuations as of the close of business on December 4, 2015, pursuant to a Plan of Reorganization approved by the shareholders of Opportunity Portfolio on November 6, 2015 ("Reorganization"). The purpose of the transaction was to combine two portfolios managed by Morgan Stanley Investment Management Inc., (the "Adviser") with comparable investment objectives and strategies. The acquisition was accomplished by a tax-free exchange of 4,617,804 Class I shares of the Portfolio at a net asset value of $16.69 for 3,034,694 Class I shares of Opportunity Portfolio; 14,414,387 Class A shares of the Portfolio at a net asset value of $16.35 for 9,470,228 Class A shares of Opportunity Portfolio; 2,000,306 Class L shares of the Portfolio at a net asset value of $16.19 for 1,518,730 Class L shares of Opportunity Portfolio; 47,839 Class IS shares of the Portfolio at a net asset value of $16.70 for 31,397 Class IS shares of Opportunity Portfolio. The net assets of Opportunity Portfolio before the Reorganization were approximately $345,930,000, including unrealized appreciation of approximately $141,511,000 at December 4, 2015. The investment portfolio of Opportunity Portfolio, with a fair value of approximately $346,957,000 and identified cost of approximately $205,446,000 on December 4, 2015, was the principal asset acquired by the Portfolio. For financial reporting purposes, assets received and shares issued by the Portfolio were recorded at fair value; however, the cost basis of the investments received
from Opportunity Portfolio was carried forward to align ongoing reporting of the Portfolio's realized and unrealized gains and losses with amounts distributable to shareholders for tax purposes. Immediately prior to the Reorganization, the net assets of the Portfolio were approximately $246,567,000. Immediately after the Reorganization, the net assets of the Portfolio were approximately $592,513,000.
Upon closing of the Reorganization, shareholders of Opportunity Portfolio received shares of the Portfolio as follows:
| Opportunity Portfolio | Global Opportunity Portfolio | ||||||
| Class I | Class I | ||||||
| Class A | Class A | ||||||
| Class L | Class L | ||||||
| Class IS | Class IS | ||||||
Assuming the acquisition had been completed on January 1, 2015, the beginning of the annual reporting period of the Portfolio, the Portfolio's pro forma results of operations for the year ended December 31, 2015, are as follows:
Net investment income(1) | $ | 3,760,000 | |||||
Net realized gain and unrealized gain(2) | $ | 61,642,000 | |||||
| Net increase (decrease) in net assets resulting from operations | $ | 65,402,000 | |||||
(1) Approximately $(671,000) as reported, plus approximately $1,533,000 Opportunity Portfolio prior to the Reorganization, plus approximately $2,898,000 of estimated pro-forma eliminated expenses.
(2) Approximately $40,641,000 as reported, plus approximately $21,001,000 Opportunity Portfolio prior to the Reorganization.
Because the combined investment portfolios have been managed as a single integrated portfolio since the acquisition was completed, it is not practicable to separate the amounts of revenue and earnings of Opportunity Portfolio that have been included in the Portfolio's Statement of Operations since December 7, 2015.
A. Significant Accounting Policies: The following significant accounting policies are in conformity with U.S. generally accepted accounting principles ("GAAP"). Such policies are consistently followed by the Fund in the preparation of its financial statements. GAAP may require management to make estimates and assumptions that affect the reported amounts and disclosures in the financial statements. Actual results may differ from those estimates.
1. Security Valuation: (1) An equity portfolio security listed or traded on an exchange is valued at its latest reported sales price (or at the exchange official closing price if such exchange reports an official closing price), if there were no sales on a given day, the security is valued at the mean between the last reported bid and asked prices;
18
Morgan Stanley Institutional Fund, Inc.
Annual Report — December 31, 2015
Notes to Financial Statements (cont'd)
(2) all other equity portfolio securities for which over-the-counter ("OTC") market quotations are readily available are valued at its latest reported sales price. In cases where a security is traded on more than one exchange, the security is valued on the exchange designated as the primary market; (3) Certain portfolio securities may be valued by an outside pricing service approved by the Fund's Board of Directors (the "Directors"). The pricing service may utilize a matrix system or other model incorporating attributes such as security quality, maturity and coupon as the evaluation model parameters, and/or research evaluations by its staff, including review of broker-dealer market price quotations in determining what it believes is the fair valuation of the portfolios securities valued by such pricing service; (4) listed options are valued at the last reported sales price on the exchange on which they are listed (or at the exchange official closing price if such exchange reports an official closing price). If an official closing price or last reported sales price is unavailable, the listed option should be fair valued at the mean between their latest bid and asked price. Unlisted options are valued by an outside pricing service approved by the Directors or quotes from a broker or dealer; (5) when market quotations are not readily available, including circumstances under which the Adviser determines that the closing price, last sale price or the mean between the last reported bid and asked prices are not reflective of a security's market value, portfolio securities are valued at their fair value as determined in good faith under procedures established by and under the general supervision of the Directors. Occasionally, developments affecting the closing prices of securities and other assets may occur between the times at which valuations of such securities are determined (that is, close of the foreign market on which the securities trade) and the close of business of the New York Stock Exchange ("NYSE"). If developments occur during such periods that are expected to materially affect the value of such securities, such valuations may be adjusted to reflect the estimated fair value of such securities as of the close of the NYSE, as determined in good faith by the Directors or by the Adviser using a pricing service and/or procedures approved by the Directors; (6) quotations of foreign portfolio securities, other assets and liabilities and forward contracts stated in foreign currency are translated into U.S. dollar equivalents at the prevailing market rates prior to the close of the NYSE; (7) investments in mutual funds, including the Morgan Stanley Institutional Liquidity Funds, are valued at the net
asset value ("NAV") as of the close of each business day; and (8) short-term debt securities with remaining maturities of 60 days or less at the time of purchase may be valued at amortized cost, unless the Adviser determines such valuation does not reflect the securities' market value, in which case these securities will be valued at their fair market value determined by the Adviser.
The Directors have responsibility for determining in good faith the fair value of the investments, and the Directors may appoint others, such as the Fund's Adviser or a valuation committee, to assist the Directors in determining fair value and to make the actual calculations pursuant to the fair valuation methodologies previously approved by the Directors. Under procedures approved by the Directors, the Fund's Adviser has formed a Valuation Committee whose members are approved by the Directors. The Valuation Committee provides administration and oversight of the Fund's valuation policies and procedures, which are reviewed at least annually by the Directors. These procedures allow the Fund to utilize independent pricing services, quotations from securities and financial instrument dealers, and other market sources to determine fair value.
The Fund has procedures to determine the fair value of securities and other financial instruments for which market prices are not readily available. Under these procedures, the Valuation Committee convenes on a regular and ad hoc basis to review such securities and considers a number of factors, including valuation methodologies and significant unobservable valuation inputs, when arriving at fair value. The Valuation Committee may employ a market-based approach which may use related or comparable assets or liabilities, recent transactions, market multiples, book values, and other relevant information for the investment to determine the fair value of the investment. An income-based valuation approach may also be used in which the anticipated future cash flows of the investment are discounted to calculate fair value. Discounts may also be applied due to the nature or duration of any restrictions on the disposition of the investments. Due to the inherent uncertainty of valuations of such investments, the fair values may differ significantly from the values that would have been used had an active market existed. The Valuation Committee employs various methods for calibrating these valuation approaches including a regular review of valuation
19
Morgan Stanley Institutional Fund, Inc.
Annual Report — December 31, 2015
Notes to Financial Statements (cont'd)
methodologies, key inputs and assumptions, transactional back-testing or disposition analysis, and reviews of any related market activity.
2. Fair Value Measurement: Financial Accounting Standards Board ("FASB") Accounting Standards CodificationTM ("ASC") 820, "Fair Value Measurement" ("ASC 820"), defines fair value as the value that the Fund would receive to sell an investment or pay to transfer a liability in a timely transaction with an independent buyer in the principal market, or in the absence of a principal market the most advantageous market for the investment or liability. ASC 820 establishes a three-tier hierarchy to distinguish between (1) inputs that reflect the assumptions market participants would use in valuing an asset or liability developed based on market data obtained from sources independent of the reporting entity (observable inputs) and (2) inputs that reflect the reporting entity's own assumptions about the assumptions market participants would use in valuing an asset or liability developed based on the best information available in the circumstances (unobservable inputs) and to establish classification of fair value measurements for disclosure purposes. Various inputs are used in determining the value of the Fund's investments. The inputs are summarized in the three broad levels listed below.
• Level 1 – unadjusted quoted prices in active markets for identical investments
• Level 2 – other significant observable inputs (including quoted prices for similar investments, interest rates, prepayment speeds, credit risk, etc.)
• Level 3 – significant unobservable inputs including the Fund's own assumptions in determining the fair value of investments. Factors considered in making this determination may include, but are not limited to, information obtained by contacting the issuer, analysts, or the appropriate stock exchange (for exchange-traded securities), analysis of the issuer's financial statements or other available documents and, if necessary, available information concerning other securities in similar circumstances
The inputs or methodology used for valuing securities are not necessarily an indication of the risk associated
with investing in those securities and the determination of the significance of a particular input to the fair value measurement in its entirety requires judgment and considers factors specific to each security.
The following is a summary of the inputs used to value the Portfolio's investments as of December 31, 2015.
Investment Type | Level 1 Unadjusted quoted prices (000) | Level 2 Other significant observable inputs (000) | Level 3 Significant unobservable inputs (000) | Total (000) | |||||||||||||||
Assets: | |||||||||||||||||||
Common Stocks | |||||||||||||||||||
Beverages | $ | — | $ | 10,271 | $ | — | $ | 10,271 | |||||||||||
Biotechnology | — | 14,576 | — | 14,576 | |||||||||||||||
Capital Markets | 12,164 | 9,429 | — | 21,593 | |||||||||||||||
Chemicals | 9,139 | 5,698 | — | 14,837 | |||||||||||||||
| Diversified Consumer Services | 29,570 | — | — | 29,570 | |||||||||||||||
Electric Utilities | 10,223 | — | — | 10,223 | |||||||||||||||
| Food & Staples Retailing | — | 128 | — | 128 | |||||||||||||||
Food Products | — | 19,641 | — | 19,641 | |||||||||||||||
| Hotels, Restaurants & Leisure | — | 6,751 | — | 6,751 | |||||||||||||||
| Information Technology Services | 141,058 | — | — | 141,058 | |||||||||||||||
| Internet & Catalog Retail | 65,064 | — | — | 65,064 | |||||||||||||||
| Internet Software & Services | 84,817 | 33,654 | — | 118,471 | |||||||||||||||
Marine | — | 9,158 | — | 9,158 | |||||||||||||||
Media | — | 28,091 | — | 28,091 | |||||||||||||||
Multi-Utilities | — | — | — | † | — | † | |||||||||||||
Pharmaceuticals | — | 12,786 | — | 12,786 | |||||||||||||||
Road & Rail | — | 28,323 | — | 28,323 | |||||||||||||||
Software | 3,715 | — | — | 3,715 | |||||||||||||||
| Textiles, Apparel & Luxury Goods | — | 15,951 | — | 15,951 | |||||||||||||||
| Transportation Infrastructure | — | 18,214 | — | 18,214 | |||||||||||||||
Total Common Stocks | 355,750 | 212,671 | — | † | 568,421 | † | |||||||||||||
Preferred Stocks | — | — | 14,915 | 14,915 | |||||||||||||||
| Convertible Preferred Stock | — | — | @ | — | — | @ | |||||||||||||
Participation Notes | — | 9,293 | — | 9,293 | |||||||||||||||
Call Option Purchased | — | 673 | — | 673 | |||||||||||||||
Short-Term Investment | |||||||||||||||||||
Investment Company | 33,417 | — | — | 33,417 | |||||||||||||||
Total Assets | $ | 389,167 | $ | 222,637 | $ | 14,915 | † | $ | 626,719 | † | |||||||||
@ Value is less than $500.
† Includes one security which is valued at zero.
20
Morgan Stanley Institutional Fund, Inc.
Annual Report — December 31, 2015
Notes to Financial Statements (cont'd)
Transfers between investment levels may occur as the markets fluctuate and/or the availability of data used in an investment's valuation changes. The Portfolio recognizes transfers between the levels as of the end of the period. At December 31, 2015, the Fund held a security with an approximate value of less than $500 that transferred from Level 3 to Level 2. This security was valued using significant unobservable inputs at December 31, 2014 and was valued using other significant observable inputs at December 31, 2015. At December 31, 2015, the fair value of certain securities were adjusted due to developments which occurred between the time of the close of the foreign markets on which they trade and the close of business on the NYSE which resulted in their level 2 classification.
Following is a reconciliation of investments in which significant unobservable inputs (Level 3) were used in determining fair value.
| Common Stock (000) | Preferred Stocks (000) | Convertible Preferred Stock (000) | |||||||||||||
Beginning Balance | $ | — | † | $ | 382 | $ | — | @ | |||||||
Purchases | — | 12,909 | — | ||||||||||||
Sales | — | — | — | ||||||||||||
Amortization of discount | — | — | — | ||||||||||||
Transfers in | — | — | — | ||||||||||||
Transfers out | — | — | (— | @) | |||||||||||
Corporate actions | — | — | — | ||||||||||||
| Change in unrealized appreciation (depreciation) | — | 1,624 | — | @ | |||||||||||
Realized gains (losses) | — | — | — | ||||||||||||
Ending Balance | $ | — | † | $ | 14,915 | $ | — | ||||||||
| Net change in unrealized appreciation (depreciation) from investments still held as of December 31, 2015 | $ | — | $ | 1,624 | $ | — | @ | ||||||||
@ Value is less than $500.
† Includes one security which is valued at zero.
The following table presents additional information about valuation techniques and inputs used for investments that are measured at fair value and categorized within Level 3 as of December 31, 2015. Various valuation techniques were used in the valuation of certain investments and weighted based on the level of significance.
| Fair Value at December 31, 2015 (000) | Valuation Technique | Unobservable Input | Range | Selected Value | Impact to Valuation from an Increase in Input | ||||||||||||||||||||||||||
Electronic Equipment, Instruments & Components | |||||||||||||||||||||||||||||||
Preferred Stock | $ | 3,175 | Market Transaction Method | Precedent Transaction | $ | 23.03 | $ | 23.03 | $ | 23.03 | Increase | ||||||||||||||||||||
Internet & Catalog Retail | |||||||||||||||||||||||||||||||
Preferred Stocks | $ | 3,275 | Market Transaction Method | Precedent Transaction | $ | 93.09 | $ | 93.09 | $ | 93.09 | Increase | ||||||||||||||||||||
Discounted Cash Flow | Weighted Average Cost of Capital | 16.0 | % | 18.0 | % | 17.0 | % | Decrease | |||||||||||||||||||||||
Perpetual Growth Rate | 3.0 | % | 4.0 | % | 3.5 | % | Increase | ||||||||||||||||||||||||
| Market Comparable Companies | Enterprise Value/ Revenue | 11.1 | x | 17.9 | x | 17.9 | x | Increase | |||||||||||||||||||||||
| Discount for Lack of Marketability | 20.0 | % | 20.0 | % | 20.0 | % | Decrease | ||||||||||||||||||||||||
$ | 233 | Discounted Cash Flow | Weighted Average Cost of Capital | 17.0 | % | 19.0 | % | 18.0 | % | Decrease | |||||||||||||||||||||
Perpetual Growth Rate | 3.5 | % | 4.5 | % | 4.0 | % | Increase | ||||||||||||||||||||||||
| Market Comparable Companies | Enterprise Value/ Revenue | 3.1 | x | 5.2 | x | 3.1 | x | Increase | |||||||||||||||||||||||
| Discount for Lack of Marketability | 20.0 | % | 20.0 | % | 20.0 | % | Decrease | ||||||||||||||||||||||||
| $ | 8,232 | Market Transaction Method | Precedent Transaction | $ | 48.77 | $ | 48.77 | $ | 48.77 | Increase | ||||||||||||||||||||
21
Morgan Stanley Institutional Fund, Inc.
Annual Report — December 31, 2015
Notes to Financial Statements (cont'd)
3. Foreign Currency Translation and Foreign Investments: The books and records of the Portfolio are maintained in U.S. dollars. Foreign currency amounts are translated into U.S. dollars as follows:
– investments, other assets and liabilities at the prevailing rate of exchange on the valuation date;
– investment transactions and investment income at the prevailing rates of exchange on the dates of such transactions.
Although the net assets of the Portfolio are presented at the foreign exchange rates and market values at the close of the period, the Portfolio does not isolate that portion of the results of operations arising as a result of changes in the foreign exchange rates from the fluctuations arising from changes in the market prices of securities held at period end. Similarly, the Portfolio does not isolate the effect of changes in foreign exchange rates from the fluctuations arising from changes in the market prices of securities sold during the period. Accordingly, realized and unrealized foreign currency gains (losses) on investments in securities are included in the reported net realized and unrealized gains (losses) on investment transactions and balances. However, pursuant to U.S. Federal income tax regulations, gains and losses from certain foreign currency transactions and the foreign currency portion of gains and losses realized on sales and maturities of foreign denominated debt securities are treated as ordinary income for U.S. Federal income tax purposes.
Net realized gains (losses) on foreign currency transactions represent net foreign exchange gains (losses) from foreign currency forward exchange contracts, disposition of foreign currencies, currency gains (losses) realized between the trade and settlement dates on securities transactions, and the difference between the amount of investment income and foreign withholding taxes recorded on the Portfolio's books and the U.S. dollar equivalent amounts actually received or paid. Net unrealized currency gains (losses) from valuing foreign currency denominated assets and liabilities at period end exchange rates are reflected as a component of unrealized appreciation (depreciation) in the Statement of Assets and Liabilities. The change in unrealized currency gains (losses) on foreign currency translations for the period is reflected in the Statement of Operations.
Foreign security and currency transactions may involve certain considerations and risks not typically associated with those of U.S. dollar denominated transactions as a result of, among other factors, fluctuations of exchange rates in relation to the U.S. dollar, the possibility of lower levels of governmental supervision and regulation of foreign securities markets and the possibility of political or economic instability.
Governmental approval for foreign investments may be required in advance of making an investment under certain circumstances in some countries, and the extent of foreign investments in domestic companies may be subject to limitation in other countries. Foreign ownership limitations also may be imposed by the charters of individual companies to prevent, among other concerns, violations of foreign investment limitations. As a result, an additional class of shares (identified as "Foreign" in the Portfolio of Investments) may be created and offered for investment. The "local" and "foreign shares" market values may differ. In the absence of trading of the foreign shares in such markets, the Portfolio values the foreign shares at the closing exchange price of the local shares.
4. Derivatives: The Portfolio may, but is not required to, use derivative instruments for a variety of purposes, including hedging, risk management, portfolio management or to earn income. Derivatives are financial instruments whose value is based, in part, on the value of an underlying asset, interest rate, index or financial instrument. Prevailing interest rates and volatility levels, among other things, also affect the value of derivative instruments. A derivative instrument often has risks similar to its underlying asset and may have additional risks, including imperfect correlation between the value of the derivative and the underlying asset, risks of default by the counterparty to certain transactions, magnification of losses incurred due to changes in the market value of the securities, instruments, indices or interest rates to which the derivative instrument relates, risks that the transactions may not be liquid and risks arising from margin requirements. The use of derivatives involves risks that are different from, and possibly greater than, the risks associated with other portfolio investments. Derivatives may involve the use of highly specialized instruments that require investment techniques and risk analyses different from those associated with other portfolio investments. All of the Portfolio's
22
Morgan Stanley Institutional Fund, Inc.
Annual Report — December 31, 2015
Notes to Financial Statements (cont'd)
holdings, including derivative instruments, are marked-to-market each day with the change in value reflected in unrealized appreciation (depreciation). Upon disposition, a realized gain or loss is recognized.
Certain derivative transactions may give rise to a form of leverage. Leverage magnifies the potential for gain and the risk of loss. Leverage associated with derivative transactions may cause the Portfolio to liquidate portfolio positions when it may not be advantageous to do so to satisfy its obligations or to meet earmarking or segregation requirements, pursuant to applicable Securities and Exchange Commission rules and regulations, or may cause the Portfolio to be more volatile than if the Portfolio had not been leveraged. Although the Adviser seeks to use derivatives to further the Portfolio's investment objectives, there is no assurance that the use of derivatives will achieve this result.
Following is a description of the derivative instruments and techniques that the Portfolio used during the period and their associated risks:
Options: With respect to options, the Portfolio is subject to equity risk, interest rate risk and foreign currency exchange risk in the normal course of pursuing its investment objectives. If the Portfolio buys an option, it buys a legal contract giving it the right to buy or sell a specific amount of the underlying instrument or futures contract on the underlying instrument, at an agreed-upon price typically in exchange for a premium paid by the Portfolio. The Portfolio may purchase and/or sell put and call options. Purchasing call options tends to increase the Portfolio's exposure to the underlying (or similar) instrument. Purchasing put options tends to decrease the Portfolio's exposure to the underlying (or similar) instrument. When entering into purchased option contracts, the Portfolio bears the risk of interest or exchange rates or securities prices moving unexpectedly, in which case, the Portfolio may not achieve the anticipated benefits of the purchased option contracts; however the risk of loss is limited to the premium paid. Purchased options are reported as part of "Total Investments in Securities" in the Statement of Assets and Liabilities. Premium paid for purchasing options which expired are treated as realized losses. If the Portfolio sells an option, it sells to another party the right to buy from or sell to the Portfolio a specific amount of the underlying instrument or futures contract on the underlying
instrument at an agreed-upon price typically in exchange for a premium received by the Portfolio. When options are purchased OTC, the Portfolio bears the risk that the counterparty that wrote the option will be unable or unwilling to perform its obligations under the option contract. Options may also be illiquid and the Portfolio may have difficulty closing out its position. A decision as to whether, when and how to use options involves the exercise of skill and judgment and even a well-conceived option transaction may be unsuccessful because of market behavior or unexpected events. The prices of options can be highly volatile and the use of options can lower total returns.
FASB ASC 815, "Derivatives and Hedging" ("ASC 815"), is intended to improve financial reporting about derivative instruments by requiring enhanced disclosures to enable investors to better understand how and why the Portfolio uses derivative instruments, how these derivative instruments are accounted for and their effects on the Portfolio's financial position and results of operations.
The following table sets forth the fair value of the Portfolio's derivative contracts by primary risk exposure as of December 31, 2015.
| Asset Derivatives Statement of Assets and Liabilities Location | Primary Risk Exposure | Value (000) | |||||||||||||
| Call Options Purchased | Investments, at Value (Call Options Purchased) | Currency Risk | $ | 673 | (a) | ||||||||||
(a) Amounts are included in Investments in Securities in the Statement of Assets and Liabilities.
The following tables set forth by primary risk exposure the Portfolio's realized gains (losses) and change in unrealized appreciation (depreciation) by type of derivative contract for the year ended December 31, 2015 in accordance with ASC 815.
Realized Gain (Loss) | |||||||||||
Primary Risk Exposure | Derivative Type | Value (000) | |||||||||
| Currency Risk | Investments (Call Options Purchased) | $ | (17 | )(b) | |||||||
(b) Amounts are included in Investments Sold in the Statement of Operations.
Change in Unrealized Appreciation (Depreciation) | |||||||||||
Primary Risk Exposure | Derivative Type | Value (000) | |||||||||
| Currency Risk | Investments (Call Options Purchased) | $ | 519 | (c) | |||||||
(c) Amounts are included in Investments in the Statement of Operations.
23
Morgan Stanley Institutional Fund, Inc.
Annual Report — December 31, 2015
Notes to Financial Statements (cont'd)
At December 31, 2015, the Portfolio's derivative assets and liabilities are as follows:
| Gross Amounts of Assets and Liabilities Presented in the Statement of Assets and Liabilities | |||||||||||
Derivatives | Assets(d) (000) | Liabilities(d) (000) | |||||||||
Call Options Purchased | $ | 673 | (a) | $ | — | ||||||
(a) Amounts are included in Investments in Securities in the Statement of Assets and Liabilities.
(d) Absent an event of default or early termination, OTC derivative assets and liabilities are presented gross and not offset in the Statement of Assets and Liabilities.
The Portfolio typically enters into International Swaps and Derivatives Association, Inc. Master Agreements ("ISDA Master Agreements") or similar master agreements (collectively, "Master Agreements") with its contract counterparties for certain OTC derivatives in order to, among other things, reduce its credit risk to counterparties. ISDA Master Agreements include provisions for general obligations, representations, collateral and events of default or termination. Under an ISDA Master Agreement, the Portfolio typically may offset with the counterparty certain OTC derivative financial instruments' payables and/or receivables with collateral held and/or posted and create one single net payment (close-out netting) in the event of default, termination and/or potential deterioration in the credit quality of the counterparty. Various Master Agreements govern the terms of certain transactions with counterparties, including transactions such as swap, forward, repurchase and reverse repurchase agreements. These Master Agreements typically attempt to reduce the counterparty risk associated with such transactions by specifying credit protection mechanisms and providing standardization that improves legal certainty. Cross-termination provisions under Master Agreements typically provide that a default in connection with one transaction between the Portfolio and a counterparty gives the non-defaulting party the right to terminate any other transactions in place with the defaulting party to create one single net payment due to/due from the defaulting party and may be a feature in certain Master Agreements. In the event the Portfolio exercises its right to terminate a Master Agreement after a counterparty experiences a termination event as defined in the Master Agreement, the return of collateral with market value in excess of the Portfolio's net liability may be delayed or denied.
The following table presents derivative financial instruments that are subject to enforceable netting arrangements as of December 31, 2015.
Gross Amounts Not Offset in the Statement of Assets and Liabilities | |||||||||||||||||||
Counterparty | Gross Asset Derivatives Presented in Statement of Assets and Liabilities (000) | Financial Instrument (000) | Collateral Received(e) (000) | Net Amount (not less than $0) (000) | |||||||||||||||
Royal Bank of Scotland | $ | 673 | $ | — | $ | (673 | ) | $ | 0 | ||||||||||
(e) In some instances, the actual collateral received may be more than the amount shown here due to overcollateralization.
For the year ended December 31, 2015, the approximate average monthly amount outstanding for each derivative type is as follows:
Call Options Purchased: | |||||||
Average monthly notional amount | 10,949,000 | ||||||
5. Structured Investments: The Portfolio invested a portion of its assets in structured investments. A structured investment is a derivative security designed to offer a return linked to a particular underlying security, currency, commodity or market. Structured investments may come in various forms including notes (such as exchange-traded notes), warrants and options to purchase securities. The Portfolio will typically use structured investments to gain exposure to a permitted underlying security, currency, commodity or market when direct access to a market is limited or inefficient from a tax or cost standpoint. There can be no assurance that structured investments will trade at the same price or have the same value as the underlying security, currency, commodity or market. Investments in structured investments involve risks including issuer risk, counterparty risk and market risk. Holders of structured investments bear risks of the underlying investment and are subject to issuer or counterparty risk because the Portfolio is relying on the creditworthiness of such issuer or counterparty and has no rights with respect to the underlying investment. Certain structured investments may be thinly traded or have a limited trading market and may have the effect of increasing the Portfolio's illiquidity to the extent that the Portfolio, at a particular time, may be unable to find qualified buyers for these securities.
6. Restricted Securities: The Portfolio invests in unregistered or otherwise restricted securities. The term "restricted securities" refers to securities that are unregistered
24
Morgan Stanley Institutional Fund, Inc.
Annual Report — December 31, 2015
Notes to Financial Statements (cont'd)
or are held by control persons of the issuer and securities that are subject to contractual restrictions on their resale. As a result, restricted securities may be more difficult to value and the Portfolio may have difficulty disposing of such assets either in a timely manner or for a reasonable price. In order to dispose of an unregistered security, the Portfolio, where it has contractual rights to do so, may have to cause such security to be registered. A considerable period may elapse between the time the decision is made to sell the security and the time the security is registered so that the Portfolio could sell it. Contractual restrictions on the resale of securities vary in length and scope and are generally the result of a negotiation between the issuer and acquirer of the securities. The Portfolio would, in either case, bear market risks during that period. Restricted securities are identified in the Portfolio of Investments.
7. Indemnifications: The Fund enters into contracts that contain a variety of indemnifications. The Fund's maximum exposure under these arrangements is unknown. However, the Fund has not had prior claims or losses pursuant to these contracts and expects the risk of loss to be remote.
8. Dividends and Distributions to Shareholders: Dividend income and distributions to shareholders are recorded on the ex-dividend date. Dividends from net investment income, if any, are declared and paid annually. Net realized capital gains, if any, are distributed at least annually.
9. Security Transactions, Income and Expenses: Security transactions are accounted for on the trade date (date the order to buy or sell is executed). Realized gains and losses on the sale of investment securities are determined on the specific identified cost method. Dividend income and other distributions are recorded on the ex-dividend date (except for certain foreign dividends which may be recorded as soon as the Portfolio is informed of such dividends) net of applicable withholding taxes. Interest income is recognized on the accrual basis except where collection is in doubt. Discounts are accreted and premiums are amortized over the life of the respective securities. Most expenses of the Fund can be directly attributed to a particular Portfolio. Expenses which cannot be directly attributed are apportioned among the Portfolios based upon relative net assets or other appropriate methods. Income, expenses (other than class specific
expenses — distribution and shareholder services, transfer agency and sub transfer agency fees) and realized and unrealized gains or losses are allocated to each class of shares based upon their relative net assets.
B. Advisory Fees: The Adviser, a wholly-owned subsidiary of Morgan Stanley, provides the Portfolio with advisory services under the terms of an Investment Advisory Agreement, paid quarterly, at the annual rate based on the daily net assets as follows:
| First $750 million | Next $750 million | Over $1.5 billion | |||||||||
0.90 | % | 0.85 | % | 0.80 | % | ||||||
Effective March 2, 2015, the Portfolio's annual rate based on the daily net assets was reduced and is as follows:
| First $750 million | Next $750 million | Over $1.5 billion | |||||||||
0.80 | % | 0.75 | % | 0.70 | % | ||||||
For the year ended December 31, 2015, the advisory fee rate (net of waivers/rebate) was equivalent to an annual effective rate of 0.57% of the Portfolio's average daily net assets.
The Adviser has agreed to reduce its advisory fee and/or reimburse the Portfolio so that total annual portfolio operating expenses, excluding certain investment related expenses, taxes, interest and other extraordinary expenses (including litigation), will not exceed 1.25% for Class I shares, 1.60% for Class A shares, 1.65% for Class L shares and 1.18% for Class IS shares. Effective January 23, 2015, the Adviser has agreed to reduce its advisory fee and/or reimburse the Portfolio so that total annual portfolio operating expenses will not exceed 1.10% for Class I shares, 1.45% for Class A shares, 1.50% for Class L shares, 2.20% for Class C shares (effective April 30, 2015) and 1.03% for Class IS shares. Effective December 7, 2015, the Adviser has agreed to reduced its advisory fee and/or reimburse the Portfolio so that total annual portfolio operating expense will not exceed 0.81% for Class I shares, 1.23% for Class A shares and 0.72% for Class IS shares. The fee waivers and/or expense reimbursements will continue for at least one year from the date of the Portfolio's prospectus or until such time as the Directors act to discontinue all or a portion of such waivers and/or reimbursements when they deem such action is appropriate. For the year ended December 31, 2015, approximately $289,000 of advisory fees were waived and approximately $2,000 of other expenses were reimbursed by the Adviser pursuant to this arrangement.
C. Administration Fees: The Adviser also serves as Administrator to the Fund and provides administrative services pur-
25
Morgan Stanley Institutional Fund, Inc.
Annual Report — December 31, 2015
Notes to Financial Statements (cont'd)
suant to an Administration Agreement for an annual fee, accrued daily and paid monthly, of 0.08% of the Portfolio's average daily net assets.
Under a Sub-Administration Agreement between the Administrator and State Street Bank and Trust Company ("State Street"), State Street provides certain administrative services to the Fund. For such services, the Administrator pays State Street a portion of the fee the Administrator receives from the Portfolio.
D. Distribution and Shareholder Services Fees: Morgan Stanley Distribution, Inc. ("MSDI" or the "Distributor"), a wholly-owned subsidiary of the Adviser and an indirect subsidiary of Morgan Stanley, serves as the Fund's Distributor of Portfolio shares pursuant to a Distribution Agreement. The Fund has adopted a Shareholder Services Plan with respect to Class A shares pursuant to Rule 12b-1 under the Act. Under the Shareholder Services Plan, the Portfolio pays the Distributor a shareholder services fee, accrued daily and paid monthly, at an annual rate of 0.25% of the Portfolio's average daily net assets attributable to Class A shares.
The Fund has adopted a Distribution and Shareholder Services Plan with respect to Class L shares pursuant to Rule 12b-1 under the Act. Under the Distribution and Shareholder Services Plan, the Portfolio pays the Distributor a distribution fee, accrued daily and paid monthly, at an annual rate of 0.50% and a shareholder services fee, accrued daily and paid monthly, at an annual rate of 0.25% of the Portfolio's average daily net assets attributable to Class L shares. The Distributor has agreed to waive for at least one year the 12b-1 fees on Class L shares of the Portfolio to the extent it exceeds 0.30% of the average daily net assets of such shares on an annualized basis. For the year ended December 31, 2015, this waiver amounted to approximately $22,000.
The Fund has adopted a Distribution and Shareholder Services Plan with respect to Class C shares pursuant to Rule 12b-1 under the Act. Under the Distribution and Shareholder Services Plan, the Portfolio pays the Distributor a distribution fee, accrued daily and paid monthly, at an annual rate of 0.75% and a shareholder services fee, accrued daily and paid monthly, at an annual rate of 0.25% of the Portfolio's average daily net assets attributable to Class C shares.
The distribution and shareholder services fees are used to support the expenses associated with servicing and maintaining accounts. The Distributor may compensate other parties for
providing shareholder support services to investors who purchase Class A, Class L and Class C shares.
E. Dividend Disbursing and Transfer Agent: The Fund's dividend disbursing and transfer agent is Boston Financial Data Services, Inc. ("BFDS"). Pursuant to a Transfer Agency Agreement, the Fund pays BFDS a fee based on the number of classes, accounts and transactions relating to the Portfolios of the Fund.
F. Custodian Fees: State Street (the "Custodian") serves as Custodian for the Fund in accordance with a Custodian Agreement. The Custodian holds cash, securities, and other assets of the Fund as required by the Act. Custody fees are payable monthly based on assets held in custody, investment purchases and sales activity and account maintenance fees, plus reimbursement for certain out-of-pocket expenses.
G. Security Transactions and Transactions with Affiliates: For the year ended December 31, 2015, purchases and sales of investment securities for the Portfolio, other than long-term U.S. Government securities and short-term investments, were approximately $396,172,000 and $143,281,000, respectively. There were no purchases and sales of long-term U.S. Government securities for the year ended December 31, 2015.
The Portfolio invests in the Institutional Class of the Morgan Stanley Institutional Liquidity Funds — Money Market Portfolio (the "Liquidity Funds"), an open-end management investment company managed by the Adviser. Advisory fees paid by the Portfolio are reduced by an amount equal to its pro-rata share of the advisory and administration fees paid by the Portfolio due to its investment in the Liquidity Funds. For the year ended December 31, 2015, advisory fees paid were reduced by approximately $8,000 relating to the Portfolio's investment in the Liquidity Funds.
A summary of the Portfolio's transactions in shares of the Liquidity Funds during the year ended December 31, 2015 is as follows:
| Value December 31, 2014 (000) | Purchases at Cost (000) | Sales (000) | Dividend Income (000) | Value December 31, 2015 (000) | |||||||||||||||
| $ | 619 | $ | 227,049 | $ | 194,251 | $ | 19 | $ | 33,417 | ||||||||||
During the year ended December 31, 2015, the Portfolio incurred approximately $7,000 in brokerage commissions with Morgan Stanley & Co., LLC, an affiliate of the Adviser/Administrator and Distributor, for portfolio transactions executed on behalf of the Portfolio.
26
Morgan Stanley Institutional Fund, Inc.
Annual Report — December 31, 2015
Notes to Financial Statements (cont'd)
The Portfolio has an unfunded Deferred Compensation Plan (the "Compensation Plan"), which allows each independent Director to defer payment of all, or a portion, of the fees he or she receives for serving on the Board of Directors. Each eligible Director generally may elect to have the deferred amounts credited with a return equal to the total return on one or more of the Morgan Stanley funds that are offered as investment options under the Compensation Plan. Appreciation/depreciation and distributions received from these investments are recorded with an offsetting increase/decrease in the deferred compensation obligation and do not affect the NAV of the Portfolio.
H. Federal Income Taxes: It is the Portfolio's intention to continue to qualify as a regulated investment company and distribute all of its taxable and tax-exempt income. Accordingly, no provision for Federal income taxes is required in the financial statements.
The Portfolio may be subject to taxes imposed by countries in which it invests. Such taxes are generally based on income and/or capital gains earned or repatriated. Taxes are accrued based on net investment income, net realized gains and net unrealized appreciation as such income and/or gains are earned. Taxes may also be based on transactions in foreign currency and are accrued based on the value of investments denominated in such currency.
FASB ASC 740-10, "Income Taxes — Overall", sets forth a minimum threshold for financial statement recognition of the benefit of a tax position taken or expected to be taken in a tax return. Management has concluded there are no significant uncertain tax positions that would require recognition in the financial statements. If applicable, the Portfolio recognizes interest accrued related to unrecognized tax benefits in "Interest Expense" and penalties in "Other Expenses" in the Statement of Operations. The Portfolio files tax returns with the U.S. Internal Revenue Service, New York and various states. Generally, each of the tax years in the four-year period ended December 31, 2015, remains subject to examination by taxing authorities.
The tax character of distributions paid may differ from the character of distributions shown in the Statements of Changes in Net Assets due to short-term capital gains being treated as
ordinary income for tax purposes. The tax character of distributions paid during fiscal 2015 and 2014 was as follows:
| 2015 Distributions Paid From: | 2014 Distributions Paid From: | ||||||||||||||
| Ordinary Income (000) | Long-Term Capital Gain (000) | Ordinary Income (000) | Long-Term Capital Gain (000) | ||||||||||||
| $ | 3 | $ | 2,247 | $ | 160 | $ | 1,020 | ||||||||
The amount and character of income and gains to be distributed are determined in accordance with income tax regulations which may differ from GAAP. These book/tax differences are either considered temporary or permanent in nature.
Temporary differences are primarily due to differing book and tax treatments in the timing of the recognition of gains (losses) on certain investment transactions and the timing of the deductibility of certain expenses.
Permanent differences, primarily due to differing treatments of gains (losses) related to foreign currency transactions, a net operating loss and merger adjustments, resulted in the following reclassifications among the components of net assets at December 31, 2015:
| Accumulated Net Investment Loss (000) | Accumulated Net Realized Gain (000) | Paid-in- Capital (000) | |||||||||
| $ | 662 | $ | 209 | $ | (871 | ) | |||||
At December 31, 2015, the components of distributable earnings for the Portfolio on a tax basis were as follows:
| Undistributed Ordinary Income (000) | Undistributed Long-Term Capital Gain (000) | ||||||
| $ | — | $ | 41,756 | ||||
Capital losses and specified ordinary losses, including currency losses, incurred after October 31 but within the taxable year are deemed to arise on the first day of the Portfolio's next taxable year. For the year ended December 31, 2015, the Portfolio deferred to January 1, 2016 for U.S. Federal income tax purposes the following losses:
| Post-October Currency and Specified Ordinary Losses (000) | Post-October Capital Losses (000) | ||||||
| $ | — | $ | 1,260 | ||||
I. Other: At December 31, 2015, the Portfolio had record owners of 10% or greater. Investment activities of these shareholders could have a material impact on the Portfolio. The aggregate percentage of such owners was 22.1%.
27
Morgan Stanley Institutional Fund, Inc.
Annual Report — December 31, 2015
Report of Independent Registered Public Accounting Firm
To the Shareholders and Board of Directors of
Morgan Stanley Institutional Fund, Inc. —
Global Opportunity Portfolio
We have audited the accompanying statement of assets and liabilities, including the portfolio of investments, of Global Opportunity Portfolio (one of the portfolios constituting Morgan Stanley Institutional Fund, Inc.) (the "Portfolio") as of December 31, 2015, and the related statement of operations for the year then ended, the statements of changes in net assets for each of the two years in the period then ended and the financial highlights for each of the years or periods indicated therein. These financial statements and financial highlights are the responsibility of the Portfolio's management. Our responsibility is to express an opinion on these financial statements and financial highlights based on our audits.
We conducted our audits in accordance with the standards of the Public Company Accounting Oversight Board (United States). Those standards require that we plan and perform the audit to obtain reasonable assurance about whether the financial statements and financial highlights are free of material misstatement. We were not engaged to perform an audit of the Portfolio's internal control over financial reporting. Our audits included consideration of internal control over financial reporting as a basis for designing audit procedures that are appropriate in the circumstances, but not for the purpose of expressing an opinion on the effectiveness of the Portfolio's internal control over financial reporting. Accordingly, we express no such opinion. An audit also includes examining, on a test basis, evidence supporting the amounts and disclosures in the financial statements and financial highlights, assessing the accounting principles used and significant estimates made by management, and evaluating the overall financial statement presentation. Our procedures included confirmation of securities owned as of December 31, 2015, by correspondence with the custodian and others or by other appropriate auditing procedures where replies from others were not received. We believe that our audits provide a reasonable basis for our opinion.
In our opinion, the financial statements and financial highlights referred to above present fairly, in all material respects, the financial position of Global Opportunity Portfolio (one of the portfolios constituting Morgan Stanley Institutional Fund, Inc.) at December 31, 2015, the results of its operations for the year then ended, the changes in its net assets for each of the two years in the period then ended and the financial highlights for each of the years or periods indicated therein, in conformity with U.S. generally accepted accounting principles.

Boston, Massachusetts
February 26, 2016
28
Morgan Stanley Institutional Fund, Inc.
Annual Report — December 31, 2015
Federal Tax Notice (unaudited)
For Federal income tax purposes, the following information is furnished with respect to the distributions paid by the Portfolio during its taxable year ended December 31, 2015. For corporate shareholders, 18.4% of the dividends qualified for the dividends received deduction.
The Portfolio designated and paid approximately $2,247,000 as a long-term capital gain distribution.
For Federal income tax purposes, the following information is furnished with respect to the Portfolio's earnings for its taxable year ended December 31, 2015. When distributed, certain earnings may be subject to a maximum tax rate of 15% as provided for the Jobs and Growth Tax Relief Reconciliation Act of 2003. The Portfolio designated up to a maximum of approximately $3,000 as taxable at this lower rate.
In January, the Portfolio provides tax information to shareholders for the preceding calendar year.
29
Morgan Stanley Institutional Fund, Inc.
Annual Report — December 31, 2015
U.S. Privacy Policy (unaudited)
AN IMPORTANT NOTICE CONCERNING OUR U.S. PRIVACY POLICY
This privacy notice describes the U.S. privacy policy of Morgan Stanley Distribution, Inc., and the Morgan Stanley family of mutual funds ("us", "our", "we").
We are required by federal law to provide you with notice of our U.S. privacy policy ("Policy"). This Policy applies to both our current and former clients unless we state otherwise and is intended for individual clients who purchase products or receive services from us for personal, family or household purposes. This Policy is not applicable to partnerships, corporations, trusts or other non-individual clients or account holders, nor is this Policy applicable to individuals who are either beneficiaries of a trust for which we serve as trustee or participants in an employee benefit plan administered or advised by us. This Policy is, however, applicable to individuals who select us to be a custodian of securities or assets in individual retirement accounts, 401(k) accounts, or accounts subject to the Uniform Gifts to Minors Act.
This notice sets out our business practices to protect your privacy; how we collect and share personal information about you; and how you can limit our sharing or certain uses by others of this information. We may amend this Policy at any time, and will inform you of any changes to our Policy as required by law.
WE RESPECT YOUR PRIVACY
We appreciate that you have provided us with your personal financial information and understand your concerns about your information. We strive to safeguard the information our clients entrust to us. Protecting the confidentiality and security of client information is an important part of how we conduct our business.
This notice describes what personal information we collect about you, how we collect it, when we may share it with others, and how certain others may use it. It discusses the steps you may take to limit our sharing of certain information about you with our affiliated companies, including, but not limited to our affiliated banking businesses, brokerage firms and credit service affiliates. It also discloses how you may limit our affiliates' use of shared information for marketing purposes.
Throughout this Policy, we refer to the nonpublic information that personally identifies you as "personal information." We also use the term "affiliated company" in this notice. An affiliated company is a company in our family of companies and includes companies with the Morgan Stanley name. These affiliated companies are financial institutions such as broker-dealers, banks, investment advisers and credit card issuers. We refer to any company that is not an affiliated company as a nonaffiliated third party. For purposes of Section 5 of this notice, and your ability to limit certain uses of personal information by our affiliates, this notice applies to the use of personal information by our affiliated companies.
1. WHAT PERSONAL INFORMATION DO WE COLLECT FROM YOU?
We may collect the following types of information about you: (i) information provided by you, including information from applications and other forms we receive from you, (ii) information about your transactions with us or our affiliates, (iii) information about your transactions with nonaffiliated third parties, (iv) information from consumer reporting agencies, (v) information obtained from our websites, and (vi) information obtained from other sources. For example:
• We collect information such as your name, address, e-mail address, telephone/fax numbers, assets, income and investment objectives through applications and other forms you submit to us.
• We may obtain information about account balances, your use of account(s) and the types of products and services you prefer to receive from us through your dealings and transactions with us and other sources.
• We may obtain information about your creditworthiness and credit history from consumer reporting agencies.
• We may collect background information from and through third-party vendors to verify representations you have made and to comply with various regulatory requirements.
2. WHEN DO WE DISCLOSE PERSONAL INFORMATION WE COLLECT ABOUT YOU?
We may disclose personal information we collect about you in each of the categories listed above to affiliated and nonaffiliated third parties.
30
Morgan Stanley Institutional Fund, Inc.
Annual Report — December 31, 2015
U.S. Privacy Policy (unaudited) (cont'd)
a. Information We Disclose to Affiliated Companies.
We may disclose personal information that we collect about you to our affiliated companies to manage your account(s) effectively, to service and process your transactions, and to let you know about products and services offered by us and affiliated companies, to manage our business, and as otherwise required or permitted by law. Offers for products and services from affiliated companies are developed under conditions designed to safeguard your personal information.
b. Information We Disclose to Third Parties.
We may disclose personal information that we collect about you to nonaffiliated third parties to provide marketing services on our behalf or to other financial institutions with whom we have joint marketing agreements. We may also disclose all of the information we collect to other nonaffiliated third parties for our everyday business purposes, such as to process transactions, maintain account(s), respond to court orders and legal investigations, report to credit bureaus, offer our own products and services, protect against fraud, for institutional risk control, to perform services on our behalf, and as otherwise required or permitted by law.
When we share personal information about you with a nonaffiliated third party, they are required to limit their use of personal information about you to the particular purpose for which it was shared and they are not allowed to share personal information about you with others except to fulfill that limited purpose or as may be permitted or required by law.
3. HOW DO WE PROTECT THE SECURITY AND CONFIDENTIALITY OF PERSONAL INFORMATION WE COLLECT ABOUT YOU?
We maintain physical, electronic and procedural security measures that comply with applicable law and regulations to help safeguard the personal information we collect about you. We have internal policies governing the proper handling of client information by employees. Third parties that provide support or marketing services on our behalf may also receive personal information about you, and we require them to adhere to appropriate security standards with respect to such information.
4. HOW CAN YOU LIMIT OUR SHARING CERTAIN PERSONAL INFORMATION ABOUT YOU WITH OUR AFFILIATED COMPANIES FOR ELIGIBILITY DETERMINATION?
By following the opt-out procedures in Section 6 below, you may limit the extent to which we share with our affiliated companies, personal information that was collected to determine your eligibility for products and services such as your credit reports and other information that you have provided to us or that we may obtain from third parties ("eligibility information"). Eligibility information does not include your identification information or personal information pertaining to our transactions or experiences with you. Please note that, even if you direct us not to share eligibility information with our affiliated companies, we may still share your personal information, including eligibility information, with our affiliated companies under circumstances that are permitted under applicable law, such as to process transactions or to service your account.
5. HOW CAN YOU LIMIT THE USE OF CERTAIN PERSONAL INFORMATION ABOUT YOU BY OUR AFFILIATED COMPANIES FOR MARKETING?
By following the opt-out instructions in Section 6 below, you may limit our affiliated companies from marketing their products or services to you based on personal information we disclose to them. This information may include, for example, your income and account history with us. Please note that, even if you choose to limit our affiliated companies from using personal information about you that we may share with them for marketing their products and services to you, our affiliated companies may use your personal information that they obtain from us to market to you in circumstances permitted by law, such as if the affiliated party has its own relationship with you.
31
Morgan Stanley Institutional Fund, Inc.
Annual Report — December 31, 2015
U.S. Privacy Policy (unaudited) (cont'd)
6. HOW CAN YOU SEND US AN OPT-OUT INSTRUCTION?
If you wish to limit our sharing of eligibility information about you with our affiliated companies, or our affiliated companies' use of personal information for marketing purposes, as described in this notice, you may do so by:
• Calling us at (800) 548-7786
Monday–Friday between 8a.m. and 6p.m. (EST)
• Writing to us at the following address:
Boston Financial Data Services, Inc.
c/o Privacy Coordinator
P.O. Box 219804
Kansas City, Missouri 64121
If you choose to write to us, your request should include: your name, address, telephone number and account number(s) to which the opt-out applies and whether you are opting out with respect to sharing of eligibility information (Section 4 above), or information used for marketing (Section 5 above), or both. Written opt-out requests should not be sent with any other correspondence. In order to process your request, we require that the request be provided by you directly and not through a third party. Once you have informed us about your privacy preferences, your opt-out preference will remain in effect with respect to this Policy (as it may be amended) until you notify us otherwise. If you are a joint account owner, we will accept instructions from any one of you and apply those instructions to the entire account.
Please understand that if you limit our sharing or our affiliated companies' use of personal information, you and any joint account holder(s) may not receive information about our affiliated companies' products and services, including products or services that could help you manage your financial resources and achieve your investment objectives.
If you have more than one account or relationship with us, please specify the accounts to which you would like us to apply your privacy choices. If you have accounts or relationships with our affiliates, you may receive multiple privacy policies from them, and will need to separately notify those companies of your privacy choices for those accounts or relationships.
7. WHAT IF AN AFFILIATED COMPANY BECOMES A NONAFFILIATED THIRD PARTY?
If, at any time in the future, an affiliated company becomes a nonaffiliated third party, further disclosures of personal information made to the former affiliated company will be limited to those described in Section 2(b) above relating to nonaffiliated third parties. If you elected under Section 6 to limit disclosures we make to affiliated companies, or use of personal information by affiliated companies, your election will not apply to use by any former affiliated company of your personal information in their possession once it becomes a nonaffiliated third party.
SPECIAL NOTICE TO RESIDENTS OF VERMONT
The following section supplements our Policy with respect to our individual clients who have a Vermont address and supersedes anything to the contrary in the above Policy with respect to those clients only.
The State of Vermont requires financial institutions to obtain your consent prior to sharing personal information that they collect about you with nonaffiliated third parties, or eligibility information with affiliated companies, other than in certain limited circumstances. Except as permitted by law, we will not share personal information we collect about you with nonaffiliated third parties or eligibility information with affiliated companies, unless you provide us with your written consent to share such information.
SPECIAL NOTICE TO RESIDENTS OF CALIFORNIA
The following section supplements our Policy with respect to our individual clients who have a California address and supersedes anything to the contrary in the above Policy with respect to those clients only.
In response to a California law, if your account has a California home address, your personal information will not be disclosed to nonaffiliated third parties except as permitted by applicable California law, and we will limit sharing such personal information with our affiliates to comply with California privacy laws that apply to us.
32
Morgan Stanley Institutional Fund, Inc.
Annual Report — December 31, 2015
Director and Officer Information (unaudited)
Independent Directors:
| Name, Age and Address of Independent Director | Positions(s) Held with Registrant | Length of Time Served* | Principal Occupation(s) During Past 5 Years and Other Relevant Professional Experience | Number of Portfolios in Fund Complex Overseen by Director** | Other Directorships Held by Independent Director*** | ||||||||||||||||||
| Frank L. Bowman (71) c/o Kramer Levin Naftalis & Frankel LLP Counsel to the Independent Directors 1177 Avenue of the Americas New York, NY 10036 | Director | Since August 2006 | President, Strategic Decisions, LLC (consulting) (since February 2009); Director or Trustee of various Morgan Stanley Funds (since August 2006); Chairperson of the Compliance and Insurance Committee (since October 2015); Formerly, Chairperson of the Insurance Sub-Committee of the Compliance and Insurance Committee (February 2007-December 2015); served as President and Chief Executive Officer of the Nuclear Energy Institute (policy organization) (February 2005-November 2008); retired as Admiral, U.S. Navy after serving over 38 years on active duty including 8 years as Director of the Naval Nuclear Propulsion Program in the Department of the Navy and the U.S. Department of Energy (1996-2004); served as Chief of Naval Personnel (July 1994-September 1996); and on the Joint Staff as Director of Political Military Affairs (June 1992-July1994); knighted as Honorary Knight Commander of the Most Excellent Order of the British Empire; awarded the Officier de l'Orde National du Mérite by the French Government; elected to the National Academy of Engineering (2009). | 98 | Director of BP p.l.c.; Director of Naval and Nuclear Technologies LLP; Director Emeritus of the Armed Services YMCA; Director of the U.S. Naval Submarine League; Member of National Security Advisory Council of the Center for U.S. Global Engagement and a member of the CNA Military Advisory Board; Chairman of the Charity, J Street Cup Golf, Trustee of Fairhaven United Methodist Church; and Director of other various non-profit organizations. | ||||||||||||||||||
| Kathleen A. Dennis (62) c/o Kramer Levin Naftalis & Frankel LLP Counsel to the Independent Directors 1177 Avenue of the Americas New York, NY 10036 | Director | Since August 2006 | President, Cedarwood Associates (mutual fund and investment management consulting) (since July 2006); Chairperson of the Money Market and Alternatives Sub-Committee of the Investment Committee (since October 2006) and Director or Trustee of various Morgan Stanley Funds (since August 2006); formerly, Senior Managing Director of Victory Capital Management (1993-2006). | 98 | Director of various nonprofit organizations. | ||||||||||||||||||
| Nancy C. Everett (61) c/o Kramer Levin Naftalis & Frankel LLP Counsel to the Independent Directors 1177 Avenue of the Americas New York, NY 10036 | Director | Since January 2015 | Chief Executive Officer, Virginia Commonwealth University Investment Company (since November 2015); Owner, OBIR, LLC (investment management consulting) (since June 2014); formerly, Managing Director, BlackRock Inc. (February 2011-December 2013); and Chief Executive Officer, General Motors Asset Management (a/k/a Promark Global Advisors, Inc.) (June 2005-May 2010). | 98 | Member of Virginia Commonwealth University School of Business Foundation; formerly, Member of Virginia Commonwealth University Board of Visitors (2013-2015); Member of Committee on Directors for Emerging Markets Growth Fund, Inc. (2007-2010); Chairperson of Performance Equity Management, LLC (2006-2010); and Chairperson, GMAM Absolute Return Strategies Fund, LLC (2006-2010). | ||||||||||||||||||
33
Morgan Stanley Institutional Fund, Inc.
Annual Report — December 31, 2015
Director and Officer Information (unaudited) (cont'd)
Independent Directors: (cont'd)
| Name, Age and Address of Independent Director | Positions(s) Held with Registrant | Length of Time Served* | Principal Occupation(s) During Past 5 Years and Other Relevant Professional Experience | Number of Portfolios in Fund Complex Overseen by Director** | Other Directorships Held by Independent Director*** | ||||||||||||||||||
| Jakki L. Haussler (58) c/o Kramer Levin Naftalis & Frankel LLP Counsel to the Independent Directors 1177 Avenue of the Americas New York, NY 10036 | Director | Since January 2015 | Chairman and Chief Executive Officer, Opus Capital Group (since January 1996); and formerly, Director, Capvest Venture Fund, LP (May 2000-December 2011); Partner, Adena Ventures, LP (July 1999-December 2010); Director, The Victory Funds (February 2005-July 2008). | 98 | Director of Cincinnati Bell Inc. and Member, Audit Committee and Compensation Committee; Director of Northern Kentucky University Foundation and Member, Investment Committee; Member of Chase College of Law Transactional Law Practice Center Board of Advisors; Director of Best Transport; Chase College of Law Board of Visitors; formerly, Member, University of Cincinnati Foundation Investment Committee; Member, Miami University Board of Visitors (2008-2011); Trustee of Victory Funds (2005-2008) and Chairman, Investment Committee (2007-2008) and Member, Service Provider Committee (2005-2008). | ||||||||||||||||||
| Dr. Manuel H. Johnson (67) c/o Johnson Smick International, Inc. 220 I Street, N.E. — Suite 200 Washington, D.C. 20002 | Director | Since July 1991 | Senior Partner, Johnson Smick International, Inc. (consulting firm); Chairperson of the Investment Committee (since October 2006) and Director or Trustee of various Morgan Stanley Funds (since July 1991); Co-Chairman and a founder of the Group of Seven Council (G7C) (international economic commission); formerly Chairperson of the Audit Committee (July 1991-September 2006), Vice Chairman of the Board of Governors of the Federal Reserve System and Assistant Secretary of the U.S. Treasury. | 100 | Director of NVR, Inc. (home construction). | ||||||||||||||||||
| Joseph J. Kearns (73) c/o Kearns & Associates LLC 23823 Malibu Road S-50-440 Malibu, CA 90265 | Director | Since August 1994 | President, Kearns & Associates LLC (investment consulting); Chairperson of the Audit Committee (since October 2006) and Director or Trustee of various Morgan Stanley Funds (since August 1994); formerly, Deputy Chairperson of the Audit Committee (July 2003-September 2006) and Chairperson of the Audit Committee of various Morgan Stanley Funds (since August 1994); CFO of the J. Paul Getty Trust. | 101 | Director of Electro Rent Corporation (equipment leasing). Prior to December 31, 2013, Director of The Ford Family Foundation. | ||||||||||||||||||
34
Morgan Stanley Institutional Fund, Inc.
Annual Report — December 31, 2015
Director and Officer Information (unaudited) (cont'd)
Independent Directors: (cont'd)
| Name, Age and Address of Independent Director | Positions(s) Held with Registrant | Length of Time Served* | Principal Occupation(s) During Past 5 Years and Other Relevant Professional Experience | Number of Portfolios in Fund Complex Overseen by Director** | Other Directorships Held by Independent Director*** | ||||||||||||||||||
| Michael F. Klein (57) c/o Kramer Levin Naftalis & Frankel LLP Counsel to the Independent Directors 1177 Avenue of the Americas New York, NY 10036 | Director | Since August 2006 | Managing Director, Aetos Capital, LLC (since March 2000); Co-President, Aetos Alternatives Management, LLC (since January 2004); and Co-Chief Executive Officer of Aetos Capital LLC (since August 2013); Chairperson of the Fixed Income Sub-Committee of the Investment Committee (since October 2006) and Director or Trustee of various Morgan Stanley Funds (since August 2006); formerly, Managing Director, Morgan Stanley & Co. Inc. and Morgan Stanley Dean Witter Investment Management, President, various Morgan Stanley Funds (June1998-March 2000) and Principal, Morgan Stanley & Co. Inc. and Morgan Stanley Dean Witter Investment Management (August 1997-December 1999). | 97 | Director of certain investment funds managed or sponsored by Aetos Capital, LLC. Director of Sanitized AG and Sanitized Marketing AG (specialty chemicals). | ||||||||||||||||||
| Michael E. Nugent (79) 522 Fifth Avenue New York, NY 10036 | Chair of the Board and Director | Chair of the Boards since July 2006 and Director since July 1991 | Chair of the Boards of various Morgan Stanley Funds (since July 2006); Chairperson of the Closed-End Fund Committee (since June 2012) and Director or Trustee of various Morgan Stanley Funds (since July 1991); formerly, Chairperson of the Insurance Committee (until July 2006), General Partner, TriumphCapital, L.P. (private investment partnership) (1988-2013). | 100 | None. | ||||||||||||||||||
| W. Allen Reed (68) c/o Kramer Levin Naftalis & Frankel LLP Counsel to the Independent Directors 1177 Avenue of the Americas New York, NY 10036 | Director | Since August 2006 | Chairperson of the Equity Sub-Committee of the Investment Committee (since October 2006) and Director or Trustee of various Morgan Stanley Funds (since August 2006); formerly, President and CEO of General Motors Asset Management; Chairman and Chief Executive Officer of the GM Trust Bank and Corporate Vice President of General Motors Corporation (August 1994-December 2005). | 98 | Director of Legg Mason, Inc.; formerly, Director of the Auburn University Foundation (2010-2015). | ||||||||||||||||||
| Fergus Reid (83) c/o Joe Pietryka, Inc. 85 Charles Colman Blvd. Pawling, NY 12564 | Director | Since June 1992 | Chairman, Joe Pietryka, Inc.; Chairperson of the Governance Committee and Director or Trustee of various Morgan Stanley Funds (since June 1992). | 100 | Formerly, Trustee and Director of certain investment companies in the JP Morgan Fund Complex managed by JP Morgan Investment Management Inc. (1987-2012). | ||||||||||||||||||
35
Morgan Stanley Institutional Fund, Inc.
Annual Report — December 31, 2015
Director and Officer Information (unaudited) (cont'd)
Interested Director:
| Name, Age and Address of Interested Director | Positions(s) Held with Registrant | Length of Time Served* | Principal Occupation(s) During Past 5 Years | Number of Portfolios in Fund Complex Overseen by Interested Director** | Other Directorships Held by Interested Director*** | ||||||||||||||||||
| James F. Higgins (68) One New York Plaza, New York, NY 10004 | Director | Since June 2000 | Director or Trustee of various Morgan Stanley Funds (since June 2000); Senior Advisor of Morgan Stanley (since August 2000). | 99 | Formerly, Director of AXA Financial, Inc. and AXA Equitable Life Insurance Company (2002-2011) and Director of AXA MONY Life Insurance Company and AXA MONY Life Insurance Company of America (2004-2011). | ||||||||||||||||||
* This is the earliest date the Director began serving the Morgan Stanley Funds. Each Director serves an indefinite term, until his or her successor is elected.
** The Fund Complex includes (as of December 31, 2015) all open-end and closed-end funds (including all of their portfolios) advised by Morgan Stanley Investment Management Inc. (the "Adviser") and any funds that have an adviser that is an affiliated person of the Adviser (including, but not limited to, Morgan Stanley AIP GP LP).
*** This includes any directorships at public companies and registered investment companies held by the Director at any time during the past five years.
Executive Officers:
Name, Age and Address of Executive Officer | Position(s) Held with Registrant | Length of Time Served**** | Principal Occupation(s) During Past 5 Years | ||||||||||||
| John H. Gernon (52) 522 Fifth Avenue New York, NY 10036 | President and Principal Executive Officer | Since September 2013 | President and Principal Executive Officer of the Equity and Fixed Income Funds and the Morgan Stanley AIP Funds (since September 2013) and the Liquidity Funds and various money market funds (since May 2014) in the Fund Complex, Managing Director of the Adviser; Head of Product (since 2006). | ||||||||||||
| Stefanie V. Chang Yu (49) 522 Fifth Avenue New York, NY 10036 | Chief Compliance Officer | Since December 1997 | Managing Director of the Adviser and various entities affiliated with the Adviser; Chief Compliance Officer of various Morgan Stanley Funds and the Adviser (since January 2014); formerly, Vice President of various Morgan Stanley Funds (December 1997-January 2014). | ||||||||||||
| Joseph C. Benedetti (50) 522 Fifth Avenue New York, NY 10036 | Vice President | Since January 2014 | Managing Director of the Adviser and various entities affiliated with the Adviser; Vice President of various Morgan Stanley Funds (since January 2014); formerly, Assistant Secretary of various Morgan Stanley Funds (October 2004-January 2014). | ||||||||||||
| Francis J. Smith (50) 522 Fifth Avenue New York, NY 10036 | Treasurer and Principal Financial Officer | Treasurer since July 2003 and Principal Financial Officer since September 2002 | Executive Director of the Adviser and various entities affiliated with the Adviser; Treasurer (since July 2003) and Principal Financial Officer of various Morgan Stanley Funds (since September 2002). | ||||||||||||
| Mary E. Mullin (48) 522 Fifth Avenue New York, NY 10036 | Secretary | Since June 1999 | Executive Director of the Adviser; Secretary of various Morgan Stanley Funds (since June 1999). | ||||||||||||
**** This is the earliest date the officer began serving the Morgan Stanley Funds. Each officer serves a one-year term, until his or her successor is elected and has qualified.
36
Morgan Stanley Institutional Fund, Inc.
Annual Report — December 31, 2015
Adviser and Administrator
Morgan Stanley Investment Management Inc.
522 Fifth Avenue
New York, New York 10036
Distributor
Morgan Stanley Distribution, Inc.
522 Fifth Avenue
New York, New York 10036
Dividend Disbursing and Transfer Agent
Boston Financial Data Services, Inc.
2000 Crown Colony Drive
Quincy, Massachusetts 02169
Custodian
State Street Bank and Trust Company
One Lincoln Street
Boston, Massachusetts 02111
Legal Counsel
Dechert LLP
1095 Avenue of the Americas
New York, New York 10036
Counsel to the Independent Directors
Kramer Levin Naftalis & Frankel LLP
1177 Avenue of the Americas
New York, New York 10036
Independent Registered Public Accounting Firm
Ernst & Young LLP
200 Clarendon Street
Boston, Massachusetts 02116
Reporting to Shareholders
Each Morgan Stanley fund provides a complete schedule of portfolio holdings in its semi-annual and annual reports within 60 days of the end of the fund's second and fourth fiscal quarters. The semi-annual and annual reports are filed electronically with the Securities and Exchange Commission (SEC) on Form N-CSRS and Form N-CSR, respectively. Morgan Stanley also delivers the semi-annual and annual reports to fund shareholders and makes these reports available on its public website, www.morganstanley.com/im. Each Morgan Stanley fund also files a complete schedule of portfolio holdings with the SEC for the fund's first and third fiscal quarters on Form N-Q. Morgan Stanley does not deliver the reports for the first and third fiscal quarters to shareholders, nor are the reports posted to the Morgan Stanley public website. You may, however, obtain the Form N-Q filings (as well as the Form N-CSR and N-CSRS filings) by accessing the SEC's website, www.sec.gov. You may also review and copy them at the SEC's Public Reference Room in Washington, DC. Information on the operation of the SEC's Public Reference Room may be obtained by calling the SEC toll free at 1 (800) SEC-0330. You can also request copies of these materials, upon payment of a duplicating fee, by electronic request at the SEC's email address (publicinfo@sec.gov) or by writing the Public Reference Room of the SEC, Washington, DC 20549-0102.
Proxy Voting Policies and Procedures and Proxy Voting Record
You may obtain a copy of the Fund's Proxy Voting Policy and Procedures and information regarding how the Fund voted proxies relating to portfolio securities during the most recent twelve-month period ended June 30, without charge, upon request, by calling toll free 1 (800) 548-7786 or by visiting our website at www.morganstanley.com/im. This information is also available on the SEC's website at www.sec.gov.
This report is authorized for distribution only when preceded or accompanied by a prospectus of the Morgan Stanley Institutional Fund, Inc., which describes in detail each Portfolio's investment policies, risks, fees and expenses. Please read the prospectus carefully before you invest or send money. For additional information, including information regarding the investments comprising the Portfolio, please visit our website at www.morganstanley.com/im or call toll free 1 (800) 548-7786.
37
Printed in U.S.A.
This Report has been prepared for shareholders and may be distributed to others only if preceded or accompanied by a current prospectus.
Morgan Stanley Investment Management Inc.
522 Fifth Avenue
New York, New York 10036
© 2016 Morgan Stanley. Morgan Stanley Distribution, Inc.

IFIGOANN
1407527 EXP. 02.28.17
INVESTMENT MANAGEMENT

Morgan Stanley Institutional Fund, Inc.
Global Infrastructure Portfolio
(formerly Select Global Infrastructure Portfolio)
Annual Report
December 31, 2015

Morgan Stanley Institutional Fund, Inc.
Annual Report — December 31, 2015
Table of Contents
Shareholders' Letter | 2 | ||||||
Expense Example | 3 | ||||||
Investment Overview | 4 | ||||||
Portfolio of Investments | 7 | ||||||
Statement of Assets and Liabilities | 9 | ||||||
Statement of Operations | 11 | ||||||
Statements of Changes in Net Assets | 12 | ||||||
Financial Highlights | 14 | ||||||
Notes to Financial Statements | 19 | ||||||
Report of Independent Registered Public Accounting Firm | 27 | ||||||
Federal Tax Notice | 28 | ||||||
U.S. Privacy Policy | 29 | ||||||
Director and Officer Information | 32 | ||||||
This report is authorized for distribution only when preceded or accompanied by prospectuses of the Morgan Stanley Institutional Fund, Inc. To receive a prospectus and/or statement of additional information (SAI), which contains more complete information such as investment objectives, charges, expenses, policies for voting proxies, risk considerations, and describes in detail each of the Portfolio's investment policies to the prospective investor, please call toll free 1 (800) 548-7786. Please read the prospectuses carefully before you invest or send money.
Additionally, you can access portfolio information including performance, characteristics, and investment team commentary through Morgan Stanley Investment Management's website: www.morganstanley.com/im.
Market forecasts provided in this report may not necessarily come to pass. There is no guarantee that any sectors mentioned will continue to perform as discussed herein or that securities in such sectors will be held by the Portfolio in the future. There is no assurance that a Portfolio will achieve its investment objective. Portfolios are subject to market risk, which is the possibility that market values of securities owned by the Portfolio will decline and, therefore, the value of the Portfolio's shares may be less than what you paid for them. Accordingly, you can lose money investing in this Portfolio. Please see the prospectus for more complete information on investment risks.
1
Morgan Stanley Institutional Fund, Inc.
Annual Report — December 31, 2015
Shareholders' Letter (unaudited)
Dear Shareholders,
We are pleased to provide this Annual report, in which you will learn how your investment in Global Infrastructure Portfolio (the "Portfolio") performed during the latest twelve-month period.
Morgan Stanley Investment Management is a client-centric, investor-led organization. Our global presence, intellectual capital, and breadth of products and services enable us to partner with investors to meet the evolving challenges of today's financial markets. We aim to deliver superior investment service and to empower our clients to make the informed decisions that help them reach their investment goals.
As always, we thank you for selecting Morgan Stanley Investment Management, and look forward to working with you in the months and years ahead.
Sincerely,

John H. Gernon
President and Principal Executive Officer
January 2016
2
Morgan Stanley Institutional Fund, Inc.
Annual Report — December 31, 2015
Expense Example (unaudited)
Global Infrastructure Portfolio
As a shareholder of the Portfolio, you incur two types of costs: (1) transactional costs; and (2) ongoing costs, including advisory fees, administration fees, distribution and shareholder services fees and other Portfolio expenses. This example is intended to help you understand your ongoing costs (in dollars) of investing in the Portfolio and to compare these costs with the ongoing costs of investing in other mutual funds.
This example is based on an investment of $1,000 invested at the beginning of the six-month period ended December 31, 2015 and held for the entire six-month period.
Actual Expenses
The table below provides information about actual account values and actual expenses. You may use the information in this table, together with the amount you invested, to estimate the expenses that you paid over the period. Simply divide your account value by $1,000 (for example, an $8,600 account value divided by $1,000 = 8.6), then multiply the result by the number in the table under the heading entitled "Actual Expenses Paid During Period" to estimate the expenses you paid on your account during this period.
Hypothetical Example for Comparison Purposes
The table below provides information about hypothetical account values and hypothetical expenses based on the Portfolio's actual expense ratio and an assumed rate of return of 5% per year before expenses, which is not the Portfolio's actual return. The hypothetical account values and expenses may not be used to estimate the actual ending account balance or expenses you paid for the period. You may use this information to compare the ongoing costs of investing in the Portfolio and other funds. To do so, compare this 5% hypothetical example with the 5% hypothetical examples that appear in the shareholder reports of the other funds.
Please note that the expenses shown in the table are meant to highlight your ongoing costs only and do not reflect any transactional costs, such as sales charges (loads). Therefore, the information for each class in the table is useful in comparing ongoing costs only, and will not help you determine the relative total costs of owning different funds. In addition, if these transactional costs were included, your costs would have been higher.
| Beginning Account Value 7/1/15 | Actual Ending Account Value 12/31/15 | Hypothetical Ending Account Value | Actual Expenses Paid During Period* | Hypothetical Expenses Paid During Period* | Net Expense Ratio During Period** | ||||||||||||||||||||||
Global Infrastructure Portfolio Class I | $ | 1,000.00 | $ | 878.70 | $ | 1,021.07 | $ | 3.88 | $ | 4.18 | 0.82 | % | |||||||||||||||
Global Infrastructure Portfolio Class A | 1,000.00 | 877.40 | 1,019.61 | 5.25 | 5.65 | 1.11 | |||||||||||||||||||||
Global Infrastructure Portfolio Class L | 1,000.00 | 875.30 | 1,016.74 | 7.94 | 8.54 | 1.68 | |||||||||||||||||||||
Global Infrastructure Portfolio Class C | 1,000.00 | 873.90 | 1,015.27 | 9.30 | 10.01 | 1.97 | |||||||||||||||||||||
Global Infrastructure Portfolio Class IS | 1,000.00 | 878.00 | 1,020.97 | 3.98 | 4.28 | 0.84 | |||||||||||||||||||||
* Expenses are calculated using each Portfolio Class' annualized net expense ratio (as disclosed), multiplied by the average account value over the period, and multiplied by 184/365 (to reflect the most recent one-half year period).
** Annualized.
3
Morgan Stanley Institutional Fund, Inc.
Annual Report — December 31, 2015
Investment Overview (unaudited)
Global Infrastructure Portfolio
The Portfolio seeks to provide both capital appreciation and income.
Performance
For the year ended December 31, 2015, the Portfolio's Class I shares had a total return based on net asset value and reinvestment of distributions per share of –13.90%, net of fees. The Portfolio's Class I shares outperformed the Portfolio's benchmark, the Dow Jones Brookfield Global Infrastructure IndexSM (the "Index"), which returned –14.40%, but underperformed the S&P Global BMI Index, a proxy for global equities, which returned –1.58%.
Factors Affecting Performance
• Infrastructure shares meaningfully declined 14.40% during the period, as measured by the Index. Among the major infrastructure sectors, the toll roads, gas distribution utilities, European regulated utilities, communications, and electricity transmission & distribution sectors outperformed the Index, while gas midstream and pipeline companies underperformed the Index. Among sectors with more modest benchmark weightings, the airports, water, and diversified sectors outperformed, while the ports sector underperformed.
• The favorable performance achieved by global listed infrastructure securities over the last few years reversed in 2015, marked by greater volatility within certain sectors, most notably those related to energy infrastructure (i.e., gas midstream and pipeline companies). Macro considerations also provided a headwind in 2015.
• Infrastructure shares ended the year on a difficult note, with significant losses in energy infrastructure providing a headwind for the asset class as a whole. Much of this decline was the result of ongoing weakness in crude prices, which highlighted the possibility of reduced growth opportunities and/or lower cash flows for some (but not all) energy infrastructure companies. This was exacerbated by concerns over some companies' ability to access attractive external capital markets funding. As a result of the ongoing decline in energy infrastructure share prices and the resultant high cost of capital, external equity capital markets funding has closed for most energy infrastructure companies over the near term. Increasingly,
investors are questioning whether certain companies require a dividend cut to fund growth internally.
• On a more positive note, outside of energy infrastructure we witnessed a relatively benign fundamental environment at the end of the year, with traffic/volume trends for most traditional transportation infrastructure companies continuing their healthy single-digit growth rates and utilities observing positive regulatory developments in a number of jurisdictions. In the U.S., utility performance exhibited considerable resilience despite the Federal Reserve's (Fed) decision to raise the fed funds rate by 25 basis points, underscoring our view that investors have already priced in higher interest rate levels than the current market.
• For the reporting period, the Portfolio realized outperformance from both bottom-up stock selection and top-down positioning. From a bottom-up perspective, the Portfolio benefited from favorable stock selection in the toll roads, gas midstream, and communications sectors, which was partially offset by negative results from stock selection in the pipeline companies and airports sectors. From a top-down perspective, the Portfolio benefited from an underweight to gas midstream and overweights to toll roads, water, and communications. This was partially offset by relative losses from underweights to European regulated utilities, gas distribution utilities, and electricity transmission & distribution, as well as overweights to pipeline companies and power purchase agreement (PPA)-contracted renewables.
Management Strategies
• We remain committed to our core investment philosophy as an infrastructure value investor. As value-oriented, bottom-up driven investors, our investment perspective is that over the medium and long term, the key factor in determining the performance of infrastructure securities will be underlying infrastructure asset values. Given the large and growing private infrastructure market, we believe that there are limits as to the level of premium or discount at which the public sector should trade relative to its underlying private infrastructure value. These limits can be viewed as the point at which the arbitrage opportunity between owning infrastructure in the private versus public markets becomes compelling. In aiming to
4
Morgan Stanley Institutional Fund, Inc.
Annual Report — December 31, 2015
Investment Overview (unaudited) (cont'd)
Global Infrastructure Portfolio
achieve core infrastructure exposure in a cost effective manner, we invest in equity securities of publicly listed infrastructure companies we believe offer the best value relative to their underlying infrastructure value and Net Asset Value growth prospects.
• Our research currently leads us to an overweighting in the Portfolio to a group of companies in the pipeline companies, toll roads, diversified, water, and communications sectors, and an underweighting to companies in the gas midstream, European regulated utilities, gas distribution utilities, electricity transmission & distribution, airports, and ports sectors. In addition, we have out-of-benchmark positions in PPA-contracted renewables and railroads, both of which we deem appropriate infrastructure investments under our definition of core infrastructure.
• The year ending December 31, 2015 was a disappointing one for global infrastructure securities. While we believe some of the volatility exhibited in 2015 is likely to carry into 2016, driven in large part by broad macro concerns that have yet to resolve themselves (direction of interest rates, currencies, commodity prices, credit market liquidity, global economic growth trajectory more broadly and more specifically relating to China), we view the current period as a potentially attractive entry point for medium- to long-term investors. In a number of sectors, we are able to own companies at meaningful discounts to intrinsic value, translating to high single-digit to low double-digit equity internal rates of return well in excess of companies' cost of capital. Furthermore, for a growing number of companies, assets are trading below core value and may offer double-digit returns through income (i.e., the dividend yield) on existing assets alone. As a result, even without meaningful capital appreciation in 2016, the return of stability to equity market share prices has the potential to produce solid infrastructure returns. We are encouraged by the level of value in infrastructure securities today.
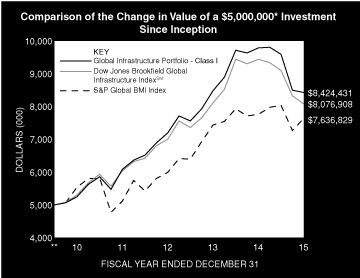
* Minimum Investment for Class I shares
** Commenced Operations on September 20, 2010.
In accordance with SEC regulations, the Portfolio's performance shown assumes that all recurring fees (including management fees) were deducted and all dividends and distributions were reinvested. The performance of Class A, L, C and IS shares will vary from the performance of Class I shares based on their different inception dates and will be impacted by additional fees assessed to those classes (if applicable).
5
Morgan Stanley Institutional Fund, Inc.
Annual Report — December 31, 2015
Investment Overview (unaudited) (cont'd)
Global Infrastructure Portfolio
Performance Compared to the Dow Jones Brookfield Global Infrastructure IndexSM(1) and the S&P Global BMI Index(2)
| Period Ended December 31, 2015 Total Returns(3) | |||||||||||||||||||
Average Annual | |||||||||||||||||||
| One Year | Five Years | Ten Years | Since Inception(7) | ||||||||||||||||
| Portfolio — Class I Shares w/o sales charges(4) | –13.90 | % | 9.93 | % | — | 10.39 | % | ||||||||||||
| Portfolio — Class A Shares w/o sales charges(4) | –14.08 | 9.64 | — | 10.09 | |||||||||||||||
| Portfolio — Class A Shares with maximum 5.25% sales charges(4) | –18.58 | 8.46 | — | 8.98 | |||||||||||||||
| Portfolio — Class L Shares w/o sales charges(4) | –14.64 | 9.05 | — | 9.50 | |||||||||||||||
| Portfolio — Class C Shares w/o sales charges(6) | — | — | — | –17.62 | |||||||||||||||
| Portfolio — Class C Shares with maximum 1.00% deferred sales charges(6) | — | — | — | –18.41 | |||||||||||||||
| Portfolio — Class IS Shares w/o sales charges(5) | –13.96 | — | — | 3.74 | |||||||||||||||
| Dow Jones Brookfield Global Infrastructure IndexSM | –14.40 | 8.78 | — | 9.51 | |||||||||||||||
S&P Global BMI Index | –1.58 | 6.63 | — | 8.35 | |||||||||||||||
Performance data quoted represents past performance, which is no guarantee of future results, and current performance may be lower or higher than the figures shown. Performance assumes that all dividends and distributions, if any, were reinvested. For the most recent month-end performance figures, please visit www.morganstanley.com/im. Investment return and principal value will fluctuate so that Portfolio shares, when redeemed, may be worth more or less than their original cost. Total returns do not reflect the deduction of taxes that a shareholder would pay on Portfolio distributions or the redemption of Portfolio shares. Returns for periods less than one year are not annualized. Performance of share classes will vary due to difference in sales charges and expenses.
(1) The Dow Jones Brookfield Global Infrastructure IndexSM is a float-adjusted market capitalization weighted index that measures the stock performance of companies that exhibit strong infrastructure characteristics. The Index intends to measure all sectors of the infrastructure market. The Index is unmanaged and its returns do not include any sales charges or fees. Such costs would lower performance. It is not possible to invest directly in an index.
(2) The Standard & Poor's Global BMI Index (S&P Global BMI Index) is a broad market index designed to capture exposure to equities in all countries in the world that meet minimum size and liquidity requirements. As of the date of this Report, there are approximately 11,000 index members representing 25 developed and 22 emerging market countries. The Index is unmanaged and its returns do not include any sales charges or fees. Such costs would lower performance. It is not possible to invest directly in an index.
(3) Total returns for the Portfolio reflect fees waived and expenses reimbursed, if applicable, by the Adviser. Without such waivers and reimbursements, total returns would have been lower.
(4) Commenced operations on September 20, 2010.
(5) Commenced offering on September 13, 2013.
(6) Commenced offering on April 30, 2015.
(7) For comparative purposes, average annual since inception returns listed for the Indexes refer to the inception date of Class I of the Portfolio, not the inception of the Index.
6
Morgan Stanley Institutional Fund, Inc.
Annual Report — December 31, 2015
Portfolio of Investments
Global Infrastructure Portfolio
Shares | Value (000) | ||||||||||
Common Stocks (96.9%) | |||||||||||
Australia (3.7%) | |||||||||||
Macquarie Atlas Roads Group | 1,048,715 | $ | 3,086 | ||||||||
Sydney Airport | 488,056 | 2,246 | |||||||||
Transurban Group | 852,950 | 6,476 | |||||||||
11,808 | |||||||||||
Brazil (1.7%) | |||||||||||
Arteris SA | 1,799,500 | 4,389 | |||||||||
CCR SA | 366,840 | 1,156 | |||||||||
5,545 | |||||||||||
Canada (14.9%) | |||||||||||
Enbridge, Inc. | 724,769 | 24,094 | |||||||||
Hydro One Ltd. (a)(b)(c) | 152,404 | 2,455 | |||||||||
Inter Pipeline Ltd. (a) | 298,768 | 4,796 | |||||||||
Pembina Pipeline Corp. (a) | 161,742 | 3,524 | |||||||||
TransCanada Corp. (a) | 389,141 | 12,709 | |||||||||
47,578 | |||||||||||
China (5.8%) | |||||||||||
China Everbright International Ltd. (d) | 2,248,000 | 2,867 | |||||||||
Guangdong Investment Ltd. (d) | 5,454,000 | 7,712 | |||||||||
Hopewell Highway Infrastructure Ltd. (d) | 16,901,000 | 8,145 | |||||||||
18,724 | |||||||||||
France (4.1%) | |||||||||||
Aeroports de Paris | 1,730 | 200 | |||||||||
Eutelsat Communications SA | 78,551 | 2,346 | |||||||||
Groupe Eurotunnel SE | 13,110 | 163 | |||||||||
SES SA | 101,561 | 2,815 | |||||||||
Vinci SA | 117,620 | 7,543 | |||||||||
13,067 | |||||||||||
Italy (1.0%) | |||||||||||
Atlantia SpA | 122,876 | 3,255 | |||||||||
Japan (1.1%) | |||||||||||
Tokyo Gas Co., Ltd. | 758,000 | 3,561 | |||||||||
Mexico (0.3%) | |||||||||||
Infraestructura Energetica Nova SAB de CV | 197,246 | 824 | |||||||||
Spain (4.7%) | |||||||||||
Abertis Infraestructuras SA | 66,830 | 1,042 | |||||||||
Ferrovial SA | 192,258 | 4,339 | |||||||||
Saeta Yield SA | 1,047,521 | 9,764 | |||||||||
15,145 | |||||||||||
Switzerland (1.0%) | |||||||||||
Flughafen Zuerich AG (Registered) | 4,379 | 3,285 | |||||||||
United Kingdom (12.8%) | |||||||||||
John Laing Group PLC (c) | 3,358,341 | 10,393 | |||||||||
National Grid PLC | 1,397,389 | 19,220 | |||||||||
Pennon Group PLC | 266,461 | 3,380 | |||||||||
Severn Trent PLC | 115,810 | 3,714 | |||||||||
United Utilities Group PLC | 298,522 | 4,114 | |||||||||
40,821 | |||||||||||
Shares | Value (000) | ||||||||||
United States (45.8%) | |||||||||||
American Tower Corp. REIT | 228,840 | $ | 22,186 | ||||||||
American Water Works Co., Inc. | 54,420 | 3,252 | |||||||||
Atmos Energy Corp. | 102,012 | 6,431 | |||||||||
CenterPoint Energy, Inc. | 76,322 | 1,401 | |||||||||
Cheniere Energy, Inc. (b) | 68,251 | 2,542 | |||||||||
Columbia Pipeline Group, Inc. | 114,884 | 2,298 | |||||||||
Crown Castle International Corp. REIT | 159,475 | 13,787 | |||||||||
Enbridge Energy Management LLC (b) | 545,229 | 12,175 | |||||||||
Eversource Energy | 119,461 | 6,101 | |||||||||
ITC Holdings Corp. | 89,119 | 3,498 | |||||||||
Kinder Morgan, Inc. | 295,401 | 4,407 | |||||||||
NiSource, Inc. | 265,614 | 5,182 | |||||||||
ONEOK, Inc. (a) | 39,410 | 972 | |||||||||
Pattern Energy Group, Inc. | 734,349 | 15,355 | |||||||||
PG&E Corp. | 262,886 | 13,983 | |||||||||
SBA Communications Corp., Class A (b) | 50,130 | 5,267 | |||||||||
SemGroup Corp., Class A | 25,544 | 737 | |||||||||
Sempra Energy | 138,385 | 13,010 | |||||||||
Spectra Energy Corp. | 328,452 | 7,863 | |||||||||
Targa Resources Corp. | 19,850 | 537 | |||||||||
Union Pacific Corp. | 23,730 | 1,856 | |||||||||
Williams Cos., Inc. (The) | 137,723 | 3,539 | |||||||||
146,379 | |||||||||||
Total Common Stocks (Cost $287,957) | 309,992 | ||||||||||
Short-Term Investments (9.8%) | |||||||||||
Securities held as Collateral on Loaned Securities (6.6%) | |||||||||||
Investment Company (5.6%) | |||||||||||
| Morgan Stanley Institutional Liquidity Funds — Treasury Securities Portfolio — Institutional Class (See Note G) | 17,923,316 | 17,923 | |||||||||
| Face Amount (000) | |||||||||||
Repurchase Agreements (1.0%) | |||||||||||
| Barclays Capital, Inc., (0.32%, dated 12/31/15, due 1/4/16; proceeds $773; fully collateralized by a U.S. Government obligation; 2.00% due 11/30/22; valued at $788) | $ | 773 | 773 | ||||||||
| Merrill Lynch & Co., Inc., (0.31%, dated 12/31/15, due 1/4/16; proceeds $2,246; fully collateralized by a U.S. Government agency security; 4.00% due 11/20/45; valued at $2,291) | 2,246 | 2,246 | |||||||||
3,019 | |||||||||||
| Total Securities held as Collateral on Loaned Securities (Cost $20,942) | 20,942 | ||||||||||
The accompanying notes are an integral part of the financial statements.
7
Morgan Stanley Institutional Fund, Inc.
Annual Report — December 31, 2015
Portfolio of Investments (cont'd)
Global Infrastructure Portfolio
Shares | Value (000) | ||||||||||
Investment Company (3.2%) | |||||||||||
| Morgan Stanley Institutional Liquidity Funds — Treasury Portfolio — Institutional Class (See Note G) (Cost $10,239) | 10,238,901 | $ | 10,239 | ||||||||
Total Short-Term Investments (Cost $31,181) | 31,181 | ||||||||||
| Total Investments (106.7%) (Cost $319,138) Including $20,082 of Securities Loaned (e)(f) | 341,173 | ||||||||||
Liabilities in Excess of Other Assets (–6.7%) | (21,381 | ) | |||||||||
Net Assets (100.0%) | $ | 319,792 | |||||||||
(a) All or a portion of this security was on loan at December 31, 2015.
(b) Non-income producing security.
(c) 144A security — Certain conditions for public sale may exist. Unless otherwise noted, these securities are deemed to be liquid.
(d) Security trades on the Hong Kong exchange.
(e) The approximate fair value and percentage of net assets, $115,211,000 and 36.0%, respectively, represent the securities that have been fair valued under the fair valuation policy for international investments as described in Note A-1 within the Notes to the Financial Statements.
(f) At December 31, 2015, the aggregate cost for Federal income tax purposes is approximately $324,750,000. The aggregate gross unrealized appreciation is approximately $37,983,000 and the aggregate gross unrealized depreciation is approximately $21,560,000 resulting in net unrealized appreciation of approximately $16,423,000.
Portfolio Composition*
Classification | Percentage of Total Investments | ||||||
Oil & Gas Storage & Transportation | 34.1 | % | |||||
Communications | 14.5 | ||||||
Electricity Transmission & Distribution | 14.1 | ||||||
Toll Roads | 11.0 | ||||||
PPA Contracted Renewables | 7.9 | ||||||
Water | 7.8 | ||||||
Other** | 5.6 | ||||||
Diversified | 5.0 | ||||||
Total Investments | 100.0 | % | |||||
* Percentages indicated are based upon total investments (excluding Securities held as Collateral on Loaned Securities) as of December 31, 2015.
** Industries and/or investment types representing less than 5% of total investments.
The accompanying notes are an integral part of the financial statements.
8
Morgan Stanley Institutional Fund, Inc.
Annual Report — December 31, 2015
Global Infrastructure Portfolio
Statement of Assets and Liabilities | December 31, 2015 (000) | ||||||
Assets: | |||||||
Investments in Securities of Unaffiliated Issuers, at Value(1) (Cost $290,976) | $ | 313,011 | |||||
Investments in Securities of Affiliated Issuer, at Value (Cost $28,162) | 28,162 | ||||||
Total Investments in Securities, at Value (Cost $319,138) | 341,173 | ||||||
Foreign Currency, at Value (Cost $377) | 374 | ||||||
Dividends Receivable | 1,301 | ||||||
Receivable for Investments Sold | 938 | ||||||
Receivable for Portfolio Shares Sold | 235 | ||||||
Tax Reclaim Receivable | 57 | ||||||
Receivable from Affiliate | 1 | ||||||
Other Assets | 58 | ||||||
Total Assets | 344,137 | ||||||
Liabilities: | |||||||
Collateral on Securities Loaned, at Value | 20,942 | ||||||
Payable for Investments Purchased | 1,428 | ||||||
Payable for Portfolio Shares Redeemed | 1,042 | ||||||
Payable for Advisory Fees | 555 | ||||||
Payable for Sub Transfer Agency Fees — Class I | 1 | ||||||
Payable for Sub Transfer Agency Fees — Class A | 122 | ||||||
Payable for Sub Transfer Agency Fees — Class L | 4 | ||||||
Payable for Shareholder Services Fees — Class A | 57 | ||||||
Payable for Distribution and Shareholder Services Fees — Class L | 4 | ||||||
Payable for Distribution and Shareholder Services Fees — Class C | 1 | ||||||
Payable for Custodian Fees | 33 | ||||||
Payable for Administration Fees | 22 | ||||||
Payable for Professional Fees | 21 | ||||||
Payable for Transfer Agency Fees — Class I | — | @ | |||||
Payable for Transfer Agency Fees — Class A | 16 | ||||||
Payable for Transfer Agency Fees — Class L | 1 | ||||||
Payable for Transfer Agency Fees — Class C | — | @ | |||||
Payable for Transfer Agency Fees — Class IS | — | @ | |||||
Other Liabilities | 96 | ||||||
Total Liabilities | 24,345 | ||||||
Net Assets | $ | 319,792 | |||||
Net Assets Consist Of: | |||||||
Paid-in-Capital | $ | 308,290 | |||||
Distributions in Excess of Net Investment Income | (190 | ) | |||||
Distributions in Excess of Net Realized Gain | (10,325 | ) | |||||
Unrealized Appreciation (Depreciation) on: | |||||||
Investments | 22,035 | ||||||
Foreign Currency Translations | (18 | ) | |||||
Net Assets | $ | 319,792 | |||||
The accompanying notes are an integral part of the financial statements.
9
Morgan Stanley Institutional Fund, Inc.
Annual Report — December 31, 2015
Global Infrastructure Portfolio
Statement of Assets and Liabilities (cont'd) | December 31, 2015 (000) | ||||||
CLASS I: | |||||||
Net Assets | $ | 47,878 | |||||
| Shares Outstanding $0.001 par value shares of beneficial interest (unlimited shares authorized) (not in 000's) | 3,802,982 | ||||||
Net Asset Value, Offering and Redemption Price Per Share | $ | 12.59 | |||||
CLASS A: | |||||||
Net Assets | $ | 263,702 | |||||
| Shares Outstanding $0.001 par value shares of beneficial interest (unlimited shares authorized) (not in 000's) | 20,994,896 | ||||||
Net Asset Value, Redemption Price Per Share | $ | 12.56 | |||||
Maximum Sales Load | 5.25 | % | |||||
Maximum Sales Charge | $ | 0.70 | |||||
Maximum Offering Price Per Share | $ | 13.26 | |||||
CLASS L: | |||||||
Net Assets | $ | 5,529 | |||||
| Shares Outstanding $0.001 par value shares of beneficial interest (unlimited shares authorized) (not in 000's) | 441,710 | ||||||
Net Asset Value, Offering and Redemption Price Per Share | $ | 12.52 | |||||
CLASS C: | |||||||
Net Assets | $ | 516 | |||||
| Shares Outstanding $0.001 par value shares of beneficial interest (unlimited shares authorized) (not in 000's) | 41,374 | ||||||
Net Asset Value, Offering and Redemption Price Per Share | $ | 12.47 | |||||
CLASS IS: | |||||||
Net Assets | $ | 2,167 | |||||
| Shares Outstanding $0.001 par value shares of beneficial interest (unlimited shares authorized) (not in 000's) | 172,239 | ||||||
Net Asset Value, Offering and Redemption Price Per Share | $ | 12.58 | |||||
| (1) Including: Securities on Loan, at Value: | $ | 20,082 | |||||
@ Amount is less than $500.
The accompanying notes are an integral part of the financial statements.
10
Morgan Stanley Institutional Fund, Inc.
Annual Report — December 31, 2015
Global Infrastructure Portfolio
Statement of Operations | Year Ended December 31, 2015 (000) | ||||||
Investment Income: | |||||||
Dividends from Securities of Unaffiliated Issuers (Net of $506 of Foreign Taxes Withheld) | $ | 11,261 | |||||
Income from Securities Loaned — Net | 163 | ||||||
Dividends from Security of Affiliated Issuer (Note G) | 3 | ||||||
Total Investment Income | 11,427 | ||||||
Expenses: | |||||||
Advisory Fees (Note B) | 2,581 | ||||||
Shareholder Services Fees — Class A (Note D) | 616 | ||||||
Distribution and Shareholder Services Fees — Class L (Note D) | 41 | ||||||
Distribution and Shareholder Services Fees — Class C (Note D) | 4 | ||||||
Administration Fees (Note C) | 243 | ||||||
Sub Transfer Agency Fees — Class I | 5 | ||||||
Sub Transfer Agency Fees — Class A | 151 | ||||||
Sub Transfer Agency Fees — Class L | 6 | ||||||
Sub Transfer Agency Fees — Class C | — | @ | |||||
Custodian Fees (Note F) | 110 | ||||||
Registration Fees | 64 | ||||||
Professional Fees | 56 | ||||||
Transfer Agency Fees — Class I (Note E) | 2 | ||||||
Transfer Agency Fees — Class A (Note E) | 47 | ||||||
Transfer Agency Fees — Class L (Note E) | 3 | ||||||
Transfer Agency Fees — Class C (Note E) | 1 | ||||||
Transfer Agency Fees — Class IS (Note E) | 2 | ||||||
Shareholder Reporting Fees | 46 | ||||||
Directors' Fees and Expenses | 13 | ||||||
Pricing Fees | 7 | ||||||
Other Expenses | 14 | ||||||
Total Expenses | 4,012 | ||||||
Waiver of Advisory Fees (Note B) | (547 | ) | |||||
Reimbursement of Class Specific Expenses — Class I (Note B) | (9 | ) | |||||
Reimbursement of Class Specific Expenses — Class A (Note B) | (147 | ) | |||||
Reimbursement of Class Specific Expenses — Class L (Note B) | (4 | ) | |||||
Reimbursement of Class Specific Expenses — Class C (Note B) | (1 | ) | |||||
Reimbursement of Class Specific Expenses — Class IS (Note B) | (2 | ) | |||||
Rebate from Morgan Stanley Affiliate (Note G) | (3 | ) | |||||
Net Expenses | 3,299 | ||||||
Net Investment Income | 8,128 | ||||||
Realized Loss: | |||||||
Investments Sold | (1,538 | ) | |||||
Foreign Currency Transactions | (57 | ) | |||||
Net Realized Loss | (1,595 | ) | |||||
Change in Unrealized Appreciation (Depreciation): | |||||||
Investments | (64,016 | ) | |||||
Foreign Currency Translations | (17 | ) | |||||
Net Change in Unrealized Appreciation (Depreciation) | (64,033 | ) | |||||
Net Realized Loss and Change in Unrealized Appreciation (Depreciation) | (65,628 | ) | |||||
Net Decrease in Net Assets Resulting from Operations | $ | (57,500 | ) | ||||
@ Amount is less than $500.
The accompanying notes are an integral part of the financial statements.
11
Morgan Stanley Institutional Fund, Inc.
Annual Report — December 31, 2015
Global Infrastructure Portfolio
Statements of Changes in Net Assets | Year Ended December 31, 2015 (000) | Year Ended December 31, 2014 (000) | |||||||||
Increase (Decrease) in Net Assets: | |||||||||||
Operations: | |||||||||||
Net Investment Income | $ | 8,128 | $ | 836 | |||||||
Net Realized Gain (Loss) | (1,595 | ) | 3,542 | ||||||||
Net Change in Unrealized Appreciation (Depreciation) | (64,033 | ) | 1,321 | ||||||||
Net Increase (Decrease) in Net Assets Resulting from Operations | (57,500 | ) | 5,699 | ||||||||
Distributions from and/or in Excess of: | |||||||||||
Class I: | |||||||||||
Net Investment Income | (1,297 | ) | (542 | ) | |||||||
Net Realized Gain | (1,192 | ) | (1,898 | ) | |||||||
Paid-in-Capital | (18 | ) | — | ||||||||
Class A: | |||||||||||
Net Investment Income | (6,564 | ) | (251 | ) | |||||||
Net Realized Gain | (6,710 | ) | (965 | ) | |||||||
Paid-in-Capital | (101 | ) | — | ||||||||
Class L: | |||||||||||
Net Investment Income | (110 | ) | (6 | ) | |||||||
Net Realized Gain | (145 | ) | (46 | ) | |||||||
Paid-in-Capital | (2 | ) | — | ||||||||
Class C: | |||||||||||
Net Investment Income | (16 | ) | — | ||||||||
Net Realized Gain | (16 | ) | — | ||||||||
Paid-in-Capital | (— | @) | — | ||||||||
Class IS: | |||||||||||
Net Investment Income | (49 | ) | (— | @) | |||||||
Net Realized Gain | (39 | ) | (1 | ) | |||||||
Paid-in-Capital | (1 | ) | — | ||||||||
Total Distributions | (16,260 | ) | (3,709 | ) | |||||||
Capital Share Transactions:(1) | |||||||||||
Class I: | |||||||||||
Subscribed | 24,423 | 13,096 | |||||||||
Issued due to a tax-free reorganization | 4,898 | — | |||||||||
Distributions Reinvested | 1,825 | 1,454 | |||||||||
Redeemed | (13,168 | ) | (2,618 | ) | |||||||
Class A: | |||||||||||
Subscribed | 4,487 | 24,454 | |||||||||
Issued due to a tax-free reorganization | 340,098 | — | |||||||||
Distributions Reinvested | 13,073 | 1,197 | |||||||||
Redeemed | (53,249 | ) | (8,386 | ) | |||||||
Class L: | |||||||||||
Subscribed | 234 | 723 | |||||||||
Issued due to a tax-free reorganization | 6,284 | — | |||||||||
Distributions Reinvested | 243 | 44 | |||||||||
Redeemed | (1,039 | ) | (253 | ) | |||||||
Class C: | |||||||||||
Subscribed | 844 | * | — | ||||||||
Distributions Reinvested | 31 | * | — | ||||||||
Redeemed | (220 | )* | — | ||||||||
Class IS: | |||||||||||
Subscribed | 2,328 | — | |||||||||
Distributions Reinvested | 89 | — | |||||||||
Redeemed | (47 | ) | — | ||||||||
Net Increase in Net Assets Resulting from Capital Share Transactions | 331,134 | 29,711 | |||||||||
Total Increase in Net Assets | 257,374 | 31,701 | |||||||||
Net Assets: | |||||||||||
Beginning of Period | 62,418 | 30,717 | |||||||||
| End of Period (Including Distributions in Excess of Net Investment Income and Accumulated Undistributed Net Investment Income of $(190) and $9) | $ | 319,792 | $ | 62,418 | |||||||
The accompanying notes are an integral part of the financial statements.
12
Morgan Stanley Institutional Fund, Inc.
Annual Report — December 31, 2015
Global Infrastructure Portfolio
Statements of Changes in Net Assets (cont'd) | Year Ended December 31, 2015 (000) | Year Ended December 31,2014 (000) | |||||||||
(1) Capital Share Transactions: | |||||||||||
Class I: | |||||||||||
Shares Subscribed | 1,627 | 845 | |||||||||
Shares Issued due to a tax-free reorganization | 316 | — | |||||||||
Shares Issued on Distributions Reinvested | 144 | 98 | |||||||||
Shares Redeemed | (911 | ) | (170 | ) | |||||||
Net Increase in Class I Shares Outstanding | 1,176 | 773 | |||||||||
Class A: | |||||||||||
Shares Subscribed | 293 | 1,547 | |||||||||
Shares Issued due to a tax-free reorganization | 22,027 | — | |||||||||
Shares Issued on Distributions Reinvested | 1,031 | 81 | |||||||||
Shares Redeemed | (3,710 | ) | (535 | ) | |||||||
Net Increase in Class A Shares Outstanding | 19,641 | 1,093 | |||||||||
Class L: | |||||||||||
Shares Subscribed | 15 | 46 | |||||||||
Shares Issued due to a tax-free reorganization | 409 | — | |||||||||
Shares Issued on Distributions Reinvested | 19 | 3 | |||||||||
Shares Redeemed | (74 | ) | (17 | ) | |||||||
Net Increase in Class L Shares Outstanding | 369 | 32 | |||||||||
Class C: | |||||||||||
Shares Subscribed | 57 | * | — | ||||||||
Shares Issued on Distributions Reinvested | 2 | * | — | ||||||||
Shares Redeemed | (18 | )* | — | ||||||||
Net Increase in Class C Shares Outstanding | 41 | — | |||||||||
Class IS: | |||||||||||
Shares Subscribed | 168 | — | |||||||||
Shares Issued on Distributions Reinvested | 7 | — | |||||||||
Shares Redeemed | (3 | ) | — | ||||||||
Net Increase in Class IS Shares Outstanding | 172 | — | |||||||||
@ Amount is less than $500.
* For the period April 30, 2015 through December 31, 2015.
The accompanying notes are an integral part of the financial statements.
13
Morgan Stanley Institutional Fund, Inc.
Annual Report — December 31, 2015
Financial Highlights
Global Infrastructure Portfolio
Class I | |||||||||||||||||||||||
Year Ended December 31, | |||||||||||||||||||||||
Selected Per Share Data and Ratios | 2015 | 2014 | 2013 | 2012 | 2011 | ||||||||||||||||||
Net Asset Value, Beginning of Period | $ | 15.41 | $ | 14.26 | $ | 12.91 | $ | 11.50 | $ | 10.40 | |||||||||||||
Income (Loss) from Investment Operations: | |||||||||||||||||||||||
Net Investment Income† | 0.40 | 0.28 | 0.26 | 0.27 | 0.23 | ||||||||||||||||||
Net Realized and Unrealized Gain (Loss) | (2.54 | ) | 1.87 | 2.00 | 1.82 | 1.42 | |||||||||||||||||
Total from Investment Operations | (2.14 | ) | 2.15 | 2.26 | 2.09 | 1.65 | |||||||||||||||||
Distributions from and/or in Excess of: | |||||||||||||||||||||||
Net Investment Income | (0.35 | ) | (0.22 | ) | (0.25 | ) | (0.26 | ) | (0.22 | ) | |||||||||||||
Net Realized Gain | (0.32 | ) | (0.78 | ) | (0.66 | ) | (0.42 | ) | (0.33 | ) | |||||||||||||
Paid-in-Capital | (0.01 | ) | — | — | — | — | |||||||||||||||||
Total Distributions | (0.68 | ) | (1.00 | ) | (0.91 | ) | (0.68 | ) | (0.55 | ) | |||||||||||||
Net Asset Value, End of Period | $ | 12.59 | $ | 15.41 | $ | 14.26 | $ | 12.91 | $ | 11.50 | |||||||||||||
Total Return++ | (13.90 | )% | 15.38 | % | 17.91 | % | 18.21 | % | 15.95 | % | |||||||||||||
Ratios and Supplemental Data: | |||||||||||||||||||||||
Net Assets, End of Period (Thousands) | $ | 47,878 | $ | 40,477 | $ | 26,428 | $ | 15,707 | $ | 12,589 | |||||||||||||
Ratio of Expenses to Average Net Assets (1) | 0.88 | %+^ | 1.08 | %+ | 1.12 | %+ | 1.15 | %+ | 1.15 | %+ | |||||||||||||
Ratio of Net Investment Income to Average Net Assets (1) | 2.70 | %+ | 1.82 | %+ | 1.87 | %+ | 2.18 | %+ | 2.09 | %+ | |||||||||||||
Ratio of Rebate from Morgan Stanley Affiliates to Average Net Assets | 0.00 | %§ | 0.00 | %§ | 0.01 | % | 0.00 | %§ | 0.00 | %§ | |||||||||||||
Portfolio Turnover Rate | 48 | % | 40 | % | 30 | % | 33 | % | 51 | % | |||||||||||||
(1) Supplemental Information on the Ratios to Average Net Assets: | |||||||||||||||||||||||
Ratios Before Expense Limitation: | |||||||||||||||||||||||
Expenses to Average Net Assets | 1.10 | % | 1.42 | % | 2.04 | % | 2.39 | % | 2.93 | % | |||||||||||||
Net Investment Income to Average Net Assets | 2.48 | % | 1.48 | % | 0.95 | % | 0.94 | % | 0.31 | % | |||||||||||||
† Per share amount is based on average shares outstanding.
++ Calculated based on the net asset value as of the last business day of the period.
+ The Ratios of Expenses and Net Investment Income reflect the rebate of certain Portfolio expenses in connection with the investments in Morgan Stanley affiliates during the period. The effect of the rebate on the ratios is disclosed in the above table as "Ratio of Rebate from Morgan Stanley Affiliates to Average Net Assets."
^ Effective March 30, 2015, the Adviser has agreed to limit the ratio of expenses to average net assets to the maximum ratio of 0.87% for Class I Shares. Prior to March 30, 2015, the maximum ratio was 1.15% for Class I Shares.
§ Amount is less than 0.005%.
The accompanying notes are an integral part of the financial statements.
14
Morgan Stanley Institutional Fund, Inc.
Annual Report — December 31, 2015
Financial Highlights
Global Infrastructure Portfolio
Class A | |||||||||||||||||||||||
Year Ended December 31, | |||||||||||||||||||||||
Selected Per Share Data and Ratios | 2015 | 2014 | 2013 | 2012 | 2011 | ||||||||||||||||||
Net Asset Value, Beginning of Period | $ | 15.38 | $ | 14.25 | $ | 12.90 | $ | 11.50 | $ | 10.40 | |||||||||||||
Income (Loss) from Investment Operations: | |||||||||||||||||||||||
Net Investment Income† | 0.39 | 0.24 | 0.26 | 0.24 | 0.21 | ||||||||||||||||||
Net Realized and Unrealized Gain (Loss) | (2.56 | ) | 1.86 | 1.97 | 1.80 | 1.41 | |||||||||||||||||
Total from Investment Operations | (2.17 | ) | 2.10 | 2.23 | 2.04 | 1.62 | |||||||||||||||||
Distributions from and/or in Excess of: | |||||||||||||||||||||||
Net Investment Income | (0.32 | ) | (0.19 | ) | (0.22 | ) | (0.22 | ) | (0.19 | ) | |||||||||||||
Net Realized Gain | (0.32 | ) | (0.78 | ) | (0.66 | ) | (0.42 | ) | (0.33 | ) | |||||||||||||
Paid-in-Capital | (0.01 | ) | — | — | — | — | |||||||||||||||||
Total Distributions | (0.65 | ) | (0.97 | ) | (0.88 | ) | (0.64 | ) | (0.52 | ) | |||||||||||||
Net Asset Value, End of Period | $ | 12.56 | $ | 15.38 | $ | 14.25 | $ | 12.90 | $ | 11.50 | |||||||||||||
Total Return++ | (14.08 | )% | 14.94 | % | 17.69 | % | 17.85 | % | 15.67 | % | |||||||||||||
Ratios and Supplemental Data: | |||||||||||||||||||||||
Net Assets, End of Period (Thousands) | $ | 263,702 | $ | 20,815 | $ | 3,706 | $ | 129 | $ | 115 | |||||||||||||
Ratio of Expenses to Average Net Assets (1) | 1.12 | %^^ | 1.42 | %+ | 1.37 | %+^ | 1.40 | %+ | 1.40 | %+ | |||||||||||||
Ratio of Net Investment Income to Average Net Assets (1) | 2.67 | %+ | 1.53 | %+ | 1.81 | %+ | 1.93 | %+ | 1.84 | %+ | |||||||||||||
Ratio of Rebate from Morgan Stanley Affiliates to Average Net Assets | 0.00 | %§ | 0.00 | %§ | 0.01 | % | 0.00 | %§ | 0.00 | %§ | |||||||||||||
Portfolio Turnover Rate | 48 | % | 40 | % | 30 | % | 33 | % | �� | 51 | % | ||||||||||||
(1) Supplemental Information on the Ratios to Average Net Assets: | |||||||||||||||||||||||
Ratios Before Expense Limitation: | |||||||||||||||||||||||
Expenses to Average Net Assets | 1.35 | % | 1.76 | % | 2.43 | % | 2.64 | % | 3.18 | % | |||||||||||||
Net Investment Income to Average Net Assets | 2.44 | % | 1.19 | % | 0.75 | % | 0.69 | % | 0.06 | % | |||||||||||||
† Per share amount is based on average shares outstanding.
++ Calculated based on the net asset value which does not reflect sales charges, if applicable, as of the last business day of the period.
+ The Ratios of Expenses and Net Investment Income reflect the rebate of certain Portfolio expenses in connection with the investments in Morgan Stanley affiliates during the period. The effect of the rebate on the ratios is disclosed in the above table as "Ratio of Rebate from Morgan Stanley Affiliates to Average Net Assets."
^ Effective September 16, 2013, the Adviser has agreed to limit the ratio of expenses to average net assets to the maximum ratio of 1.50% for Class A shares. Prior to September 16, 2013, the maximum ratio was 1.40% for Class A shares.
^^ Effective March 30, 2015, the Adviser has agreed to limit the ratio of expenses to average net assets to the maximum ratio of 1.11% for Class A Shares. Prior to March 30, 2015, the maximum ratio was 1.50% for Class A Shares.
§ Amount is less than 0.005%.
The accompanying notes are an integral part of the financial statements.
15
Morgan Stanley Institutional Fund, Inc.
Annual Report — December 31, 2015
Financial Highlights
Global Infrastructure Portfolio
Class L | |||||||||||||||||||||||
Year Ended December 31, | |||||||||||||||||||||||
Selected Per Share Data and Ratios | 2015 | 2014 | 2013 | 2012 | 2011 | ||||||||||||||||||
Net Asset Value, Beginning of Period | $ | 15.34 | $ | 14.22 | $ | 12.90 | $ | 11.50 | $ | 10.40 | |||||||||||||
Income (Loss) from Investment Operations: | |||||||||||||||||||||||
Net Investment Income† | 0.30 | 0.14 | 0.16 | 0.18 | 0.15 | ||||||||||||||||||
Net Realized and Unrealized Gain (Loss) | (2.55 | ) | 1.87 | 1.98 | 1.80 | 1.42 | |||||||||||||||||
Total from Investment Operations | (2.25 | ) | 2.01 | 2.14 | 1.98 | 1.57 | |||||||||||||||||
Distributions from and/or in Excess of: | |||||||||||||||||||||||
Net Investment Income | (0.24 | ) | (0.11 | ) | (0.16 | ) | (0.16 | ) | (0.14 | ) | |||||||||||||
Net Realized Gain | (0.32 | ) | (0.78 | ) | (0.66 | ) | (0.42 | ) | (0.33 | ) | |||||||||||||
Paid-in-Capital | (0.01 | ) | — | — | — | — | |||||||||||||||||
Total Distributions | (0.57 | ) | (0.89 | ) | (0.82 | ) | (0.58 | ) | (0.47 | ) | |||||||||||||
Net Asset Value, End of Period | $ | 12.52 | $ | 15.34 | $ | 14.22 | $ | 12.90 | $ | 11.50 | |||||||||||||
Total Return++ | (14.64 | )% | 14.35 | % | 16.98 | % | 17.31 | % | 15.12 | % | |||||||||||||
Ratios and Supplemental Data: | |||||||||||||||||||||||
Net Assets, End of Period (Thousands) | $ | 5,529 | $ | 1,115 | $ | 573 | $ | 129 | $ | 115 | |||||||||||||
Ratio of Expenses to Average Net Assets (1) | 1.69 | %+^^ | 2.00 | %+ | 1.93 | %+^ | 1.90 | %+ | 1.90 | %+ | |||||||||||||
Ratio of Net Investment Income to Average Net Assets (1) | 2.06 | %+ | 0.91 | %+ | 1.16 | %+ | 1.43 | %+ | 1.34 | %+ | |||||||||||||
Ratio of Rebate from Morgan Stanley Affiliates to Average Net Assets | 0.00 | %§ | 0.00 | %§ | 0.00 | %§ | 0.00 | %§ | 0.00 | %§ | |||||||||||||
Portfolio Turnover Rate | 48 | % | 40 | % | 30 | % | 33 | % | 51 | % | |||||||||||||
(1) Supplemental Information on the Ratios to Average Net Assets: | |||||||||||||||||||||||
Ratios Before Expense Limitation: | |||||||||||||||||||||||
Expenses to Average Net Assets | 1.95 | % | 2.41 | % | 2.86 | % | 3.14 | % | 3.68 | % | |||||||||||||
Net Investment Income (Loss) to Average Net Assets | 1.80 | % | 0.50 | % | 0.23 | % | 0.19 | % | (0.44 | )% | |||||||||||||
† Per share amount is based on average shares outstanding.
++ Calculated based on the net asset value as of the last business day of the period.
+ The Ratios of Expenses and Net Investment Income reflect the rebate of certain Portfolio expenses in connection with the investments in Morgan Stanley affiliates during the period. The effect of the rebate on the ratios is disclosed in the above table as "Ratio of Rebate from Morgan Stanley Affiliates to Average Net Assets."
^ Effective September 16, 2013, the Adviser has agreed to limit the ratio of expenses to average net assets to the maximum ratio of 2.00% for Class L shares. Prior to September 16, 2013, the maximum ratio was 1.90% for Class L shares.
^^ Effective March 30, 2015, the Adviser has agreed to limit the ratio of expenses to average net assets to the maximum ratio of 1.68% for Class L Shares. Prior to March 30, 2015, the maximum ratio was 2.00% for Class L Shares.
§ Amount is less than 0.005%.
The accompanying notes are an integral part of the financial statements.
16
Morgan Stanley Institutional Fund, Inc.
Annual Report — December 31, 2015
Financial Highlights
Global Infrastructure Portfolio
Class C | |||||||
Selected Per Share Data and Ratios | Period from April 30, 2015^ to December 31, 2015 | ||||||
Net Asset Value, Beginning of Period | $ | 15.87 | |||||
Income (Loss) from Investment Operations: | |||||||
Net Investment Income† | 0.17 | ||||||
Net Realized and Unrealized Loss | (2.97 | ) | |||||
Total from Investment Operations | (2.80 | ) | |||||
Distributions from and/or in Excess of: | |||||||
Net Investment Income | (0.27 | ) | |||||
Net Realized Gain | (0.32 | ) | |||||
Paid-in-Capital | (0.01 | ) | |||||
Total Distributions | (0.60 | ) | |||||
Net Asset Value, End of Period | $ | 12.47 | |||||
Total Return++ | (17.62 | )%# | |||||
Ratios and Supplemental Data: | |||||||
Net Assets, End of Period (Thousands) | $ | 516 | |||||
Ratio of Expenses to Average Net Assets (1) | 1.97 | %+* | |||||
Ratio of Net Investment Income to Average Net Assets (1) | 1.81 | %+* | |||||
Ratio of Rebate from Morgan Stanley Affiliates to Average Net Assets | 0.00 | %§* | |||||
Portfolio Turnover Rate | 48 | % | |||||
(1) Supplemental Information on the Ratios to Average Net Assets: | |||||||
Ratios Before Expense Limitation: | |||||||
Expenses to Average | 2.34 | %* | |||||
Net Investment Income to Average Net Assets | 1.44 | %* | |||||
^ Commencement of Offering.
† Per share amount is based on average shares outstanding.
++ Calculated based on the net asset value which does not reflect sales charges, if applicable, as of the last business day of the period.
+ The Ratios of Expenses and Net Investment Income reflect the rebate of certain Portfolio expenses in connection with the investments in Morgan Stanley affiliates during the period. The effect of the rebate on the ratios is disclosed in the above table as "Ratio of Rebate from Morgan Stanley Affiliates to Average Net Assets."
§ Amount is less than 0.005%.
# Not Annualized.
* Annualized.
The accompanying notes are an integral part of the financial statements.
17
Morgan Stanley Institutional Fund, Inc.
Annual Report — December 31, 2015
Financial Highlights
Global Infrastructure Portfolio
Class IS | |||||||||||||||
Year Ended December 31, | Period from September 13, 2013^ to | ||||||||||||||
Selected Per Share Data and Ratios | 2015 | 2014 | December 31, 2013 | ||||||||||||
Net Asset Value, Beginning of Period | $ | 15.41 | $ | 14.26 | $ | 13.73 | |||||||||
Income (Loss) from Investment Operations: | |||||||||||||||
Net Investment Income† | 0.53 | 0.28 | 0.09 | ||||||||||||
Net Realized and Unrealized Gain (Loss) | (2.68 | ) | 1.87 | 1.20 | |||||||||||
Total from Investment Operations | (2.15 | ) | 2.15 | 1.29 | |||||||||||
Distributions from and/or in Excess of: | |||||||||||||||
Net Investment Income | (0.35 | ) | (0.22 | ) | (0.25 | ) | |||||||||
Net Realized Gain | (0.32 | ) | (0.78 | ) | (0.51 | ) | |||||||||
Paid-in-Capital | (0.01 | ) | — | — | |||||||||||
Total Distributions | (0.68 | ) | (1.00 | ) | (0.76 | ) | |||||||||
Net Asset Value, End of Period | $ | 12.58 | $ | 15.41 | $ | 14.26 | |||||||||
Total Return++ | (13.96 | )% | 15.38 | % | 9.60 | %# | |||||||||
Ratios and Supplemental Data: | |||||||||||||||
Net Assets, End of Period (Thousands) | $ | 2,167 | $ | 11 | $ | 10 | |||||||||
Ratio of Expenses to Average Net Assets (1) | 0.84 | %+^^ | 1.08 | %+ | 1.07 | %+^* | |||||||||
Ratio of Net Investment Income to Average Net Assets (1) | 3.91 | %+ | 1.79 | %+ | 2.13 | %+* | |||||||||
Ratio of Rebate from Morgan Stanley Affiliates to Average Net Assets | 0.00 | %§ | 0.00 | %§ | 0.01 | %* | |||||||||
Portfolio Turnover Rate | 48 | % | 40 | % | 30 | %# | |||||||||
(1) Supplemental Information on the Ratios to Average Net Assets: | |||||||||||||||
Ratios Before Expense Limitation | |||||||||||||||
Expenses to Average Net Assets | 1.41 | % | 18.56 | % | 7.27 | %* | |||||||||
Net Investment Income (Loss) to Average Net Assets | 3.34 | % | (15.69 | )% | (4.07 | )%* | |||||||||
^ Commencement of Offering.
† Per share amount is based on average shares outstanding.
++ Calculated based on the net asset value as of the last business day of the period.
+ The Ratios of Expenses and Net Investment Income reflect the rebate of certain Portfolio expenses in connection with the investments in Morgan Stanley affiliates during the period. The effect of the rebate on the ratios is disclosed in the above table as "Ratio of Rebate from Morgan Stanley Affiliates to Average Net Assets."
^ Effective September 16, 2013, the Adviser has agreed to limit the ratio of expenses to average net assets to the maximum ratio of 1.08% for Class IS shares.
^^ Effective March 30, 2015, the Adviser has agreed to limit the ratio of expenses to average net assets to the maximum ratio of 0.84% for Class IS Shares. Prior to March 30, 2015, the maximum ratio was 1.08% for Class IS Share.
§ Amount is less than 0.005%.
# Not Annualized.
* Annualized.
The accompanying notes are an integral part of the financial statements.
18
Morgan Stanley Institutional Fund, Inc.
Annual Report — December 31, 2015
Notes to Financial Statements
Morgan Stanley Institutional Fund, Inc. (the "Fund") is registered under the Investment Company Act of 1940, as amended (the "Act"), as an open-end management investment company. The Fund is comprised of twenty-six separate, active, diversified and non-diversified portfolios (individually referred to as a "Portfolio", collectively as the "Portfolios"). The Fund applies investment company accounting and reporting guidance.
The accompanying financial statements relate to the Global Infrastructure Portfolio (name changed on March 30, 2015, formerly Select Global Infrastructure Portfolio). The Portfolio's adviser, Morgan Stanley Investment Management Inc. (the "Adviser") and sub-advisers, Morgan Stanley Investment Management Limited ("MSIM Limited") and Morgan Stanley Investment Management Company ("MSIM Company") (together, the "Sub-Advisers"), seek to provide both capital appreciation and income by investing primarily in equity securities issued by companies located throughout the world that are engaged in the infrastructure business. Using internal proprietary research, the Adviser seeks to identify public infrastructure companies that are believed to offer the best value relative to their underlying assets and growth prospects.
The Portfolio offers five classes of shares — Class I, Class A, Class L, Class C and Class IS. On April 30, 2015, the Portfolio commenced offering Class C shares and suspended offering of Class L shares. Existing Class L shareholders may invest through reinvestment of dividends and distributions.
On March 30, 2015, the Portfolio acquired the net assets of Morgan Stanley Global Infrastructure Fund ("Global Infrastructure Fund"), an open-end investment company, based on the respective valuations as of the close of business on March 27, 2015, pursuant to a Plan of Reorganization approved by the shareholders of Global Infrastructure Fund on February 27, 2015 ("Reorganization"). The purpose of the transaction was to combine two portfolios managed by the Adviser with comparable investment objectives and strategies. The acquisition was accomplished by a tax-free exchange of 316,431 Class I shares of the Portfolio at a net asset value of $15.48 for 679,771 Class I shares of Global Infrastructure Fund; 22,027,075 Class A shares of the Portfolio at a net asset value of $15.44 for 12,300,653 Class A shares, 152,892 Class B shares and 33,435,791 Class Q shares of Global Infrastructure Fund; 408,846 Class L shares of the Portfolio at a net asset value of $15.37 for 848,685 Class L shares of Global Infrastructure Fund; The net assets of Global Infrastructure Fund before the Reorganization were approximately
$351,280,000, including unrealized appreciation of approximately $79,957,000 at March 27, 2015. The investment portfolio of Global Infrastructure Fund, with a fair value of approximately $350,947,000 and identified cost of approximately $270,989,000 on March 27, 2015, was the principal asset acquired by the Portfolio. For financial reporting purposes, assets received and shares issued by the Portfolio were recorded at fair value; however, the cost basis of the investments received from Global Infrastructure Fund was carried forward to align ongoing reporting of the Portfolio's realized and unrealized gains and losses with amounts distributable to shareholders for tax purposes. Immediately prior to the Reorganization, the net assets of the Portfolio were approximately $67,309,000. Immediately after the Reorganization, the net assets of the Portfolio were approximately $418,700,000.
Upon closing of the Reorganization, shareholders of Global Infrastructure Fund received shares of the Portfolio as follows:
| Global Infrastructure Fund | MSIF Global Infrastructure Portfolio | ||||||
| Class I | Class I | ||||||
| Class A | Class A | ||||||
| Class B | Class A | ||||||
| Class Q | Class A | ||||||
| Class L | Class L | ||||||
Assuming the acquisition had been completed on January 1, 2015, the beginning of the annual reporting period of the Portfolio, the Portfolio's pro forma results of operations for the period ended December 31, 2015, are as follows:
Net investment income(1) | $ | 11,286,000 | |||||
Net realized gain and unrealized gain/loss(2) | $ | (52,825,000 | ) | ||||
| Net increase (decrease) in net assets resulting from operations | $ | 41,539,000 | |||||
(1) Approximately $8,128,000 as reported, plus approximately $2,099,000 Global Infrastructure Fund prior to the Reorganization, plus approximately $1,059,000 of estimated pro-forma eliminated expenses.
(2) Approximately $(65,628,000) as reported, plus approximately $12,803,000 Global Infrastructure Fund prior to the Reorganization.
Because the combined investment portfolios have been managed as a single integrated portfolio since the acquisition was completed, it is not practicable to separate the amounts of revenue and earnings of Global Infrastructure Fund that have been included in the Portfolio's Statement of Operations since March 30, 2015.
A. Significant Accounting Policies: The following significant accounting policies are in conformity with U.S. generally accepted accounting principles ("GAAP"). Such policies are consistently followed by the Fund in the preparation of its financial statements. GAAP may require management to make
19
Morgan Stanley Institutional Fund, Inc.
Annual Report — December 31, 2015
Notes to Financial Statements (cont'd)
estimates and assumptions that affect the reported amounts and disclosures in the financial statements. Actual results may differ from those estimates.
1. Security Valuation: (1) An equity portfolio security listed or traded on an exchange is valued at its latest reported sales price (or at the exchange official closing price if such exchange reports an official closing price), if there were no sales on a given day, the security is valued at the mean between the last reported bid and asked prices; (2) all other equity portfolio securities for which over-the-counter ("OTC") market quotations are readily available are valued at its latest reported sales price. In cases where a security is traded on more than one exchange, the security is valued on the exchange designated as the primary market; (3) when market quotations are not readily available, including circumstances under which the Adviser or Sub-Advisers determine that the closing price, last sale price or the mean between the last reported bid and asked prices are not reflective of a security's market value, portfolio securities are valued at their fair value as determined in good faith under procedures established by and under the general supervision of the Fund's Board of Directors (the "Directors"). Occasionally, developments affecting the closing prices of securities and other assets may occur between the times at which valuations of such securities are determined (that is, close of the foreign market on which the securities trade) and the close of business of the New York Stock Exchange ("NYSE"). If developments occur during such periods that are expected to materially affect the value of such securities, such valuations may be adjusted to reflect the estimated fair value of such securities as of the close of the NYSE, as determined in good faith by the Directors or by the Adviser using a pricing service and/or procedures approved by the Directors; (4) quotations of foreign portfolio securities, other assets and liabilities and forward contracts stated in foreign currency are translated into U.S. dollar equivalents at the prevailing market rates prior to the close of the NYSE; (5) investments in mutual funds, including the Morgan Stanley Institutional Liquidity Funds, are valued at the net asset value ("NAV") as of the close of each business day; and (6) short-term debt securities with remaining maturities of 60 days or less at the time of purchase may be valued at amortized cost, unless the Adviser determines such valuation does not reflect the securities' market value, in which case these securities will be valued at their fair market value determined by the Adviser.
The Directors have responsibility for determining in good faith the fair value of the investments, and the Directors may appoint others, such as the Fund's Adviser or a valuation committee, to assist the Directors in determining fair value and to make the actual calculations pursuant to the fair valuation methodologies previously approved by the Directors. Under procedures approved by the Directors, the Fund's Adviser has formed a Valuation Committee whose members are approved by the Directors. The Valuation Committee provides administration and oversight of the Fund's valuation policies and procedures, which are reviewed at least annually by the Directors. These procedures allow the Fund to utilize independent pricing services, quotations from securities and financial instrument dealers, and other market sources to determine fair value.
The Fund has procedures to determine the fair value of securities and other financial instruments for which market prices are not readily available. Under these procedures, the Valuation Committee convenes on a regular and ad hoc basis to review such securities and considers a number of factors, including valuation methodologies and significant unobservable valuation inputs, when arriving at fair value. The Valuation Committee may employ a market-based approach which may use related or comparable assets or liabilities, recent transactions, market multiples, book values, and other relevant information for the investment to determine the fair value of the investment. An income-based valuation approach may also be used in which the anticipated future cash flows of the investment are discounted to calculate fair value. Discounts may also be applied due to the nature or duration of any restrictions on the disposition of the investments. Due to the inherent uncertainty of valuations of such investments, the fair values may differ significantly from the values that would have been used had an active market existed. The Valuation Committee employs various methods for calibrating these valuation approaches including a regular review of valuation methodologies, key inputs and assumptions, transactional back-testing or disposition analysis, and reviews of any related market activity.
2. Fair Value Measurement: Financial Accounting Standards Board ("FASB") Accounting Standards CodificationTM ("ASC") 820, "Fair Value Measurement" ("ASC 820"), defines fair value as the value that the Fund would receive to sell an investment or pay to transfer a
20
Morgan Stanley Institutional Fund, Inc.
Annual Report — December 31, 2015
Notes to Financial Statements (cont'd)
liability in a timely transaction with an independent buyer in the principal market, or in the absence of a principal market the most advantageous market for the investment or liability. ASC 820 establishes a three-tier hierarchy to distinguish between (1) inputs that reflect the assumptions market participants would use in valuing an asset or liability developed based on market data obtained from sources independent of the reporting entity (observable inputs) and (2) inputs that reflect the reporting entity's own assumptions about the assumptions market participants would use in valuing an asset or liability developed based on the best information available in the circumstances (unobservable inputs) and to establish classification of fair value measurements for disclosure purposes. Various inputs are used in determining the value of the Fund's investments. The inputs are summarized in the three broad levels listed below.
• Level 1 – unadjusted quoted prices in active markets for identical investments
• Level 2 – other significant observable inputs (including quoted prices for similar investments, interest rates, prepayment speeds, credit risk, etc.)
• Level 3 – significant unobservable inputs including the Fund's own assumptions in determining the fair value of investments. Factors considered in making this determination may include, but are not limited to, information obtained by contacting the issuer, analysts, or the appropriate stock exchange (for exchange-traded securities), analysis of the issuer's financial statements or other available documents and, if necessary, available information concerning other securities in similar circumstances
The inputs or methodology used for valuing securities are not necessarily an indication of the risk associated with investing in those securities and the determination of the significance of a particular input to the fair value measurement in its entirety requires judgment and considers factors specific to each security.
The following is a summary of the inputs used to value the Portfolio's investments as of December 31, 2015.
Investment Type | Level 1 Unadjusted quoted prices (000) | Level 2 Other significant observable inputs (000) | Level 3 Significant unobservable inputs (000) | Total (000) | |||||||||||||||
Assets: | |||||||||||||||||||
Common Stocks | |||||||||||||||||||
Airports | $ | — | $ | 5,731 | $ | — | $ | 5,731 | |||||||||||
Communications | 41,240 | 5,161 | — | 46,401 | |||||||||||||||
Diversified | 1,401 | 14,732 | — | 16,133 | |||||||||||||||
| Electricity Transmission & Distribution | 26,037 | 19,220 | — | 45,257 | |||||||||||||||
| Oil & Gas Storage & Transportation | 105,640 | 3,561 | — | 109,201 | |||||||||||||||
| PPA Contracted Renewables | 15,355 | 9,764 | — | 25,119 | |||||||||||||||
Railroads | 1,856 | — | — | 1,856 | |||||||||||||||
Toll Roads | — | 35,255 | — | 35,255 | |||||||||||||||
Water | 3,252 | 21,787 | — | 25,039 | |||||||||||||||
Total Common Stocks | 194,781 | 115,211 | — | 309,992 | |||||||||||||||
Short-Term Investments | |||||||||||||||||||
Investment Companies | 28,162 | — | — | 28,162 | |||||||||||||||
Repurchase Agreements | — | 3,019 | — | 3,019 | |||||||||||||||
| Total Short-Term Investments | 28,162 | 3,019 | — | 31,181 | |||||||||||||||
Total Assets | $ | 222,943 | $ | 118,230 | $ | — | $ | 341,173 | |||||||||||
Transfers between investment levels may occur as the markets fluctuate and/or the availability of data used in an investment's valuation changes. The Portfolio recognizes transfers between the levels as of the end of the period. As of December 31, 2015, the Portfolio did not have any investments transfer between investment levels.
3. Repurchase Agreements: The Portfolio may enter into repurchase agreements under which the Portfolio lends cash and takes possession of securities with an agreement that the counterparty will repurchase such securities. In connection with transactions in repurchase agreements, a bank as custodian for the Portfolio takes possession of the underlying securities which are held as collateral, with a market value at least equal to the amount of the repurchase transaction, including principal and accrued interest. To the extent that any repurchase transaction exceeds one business day, the value of the collateral is marked-to-market on a daily basis to determine that the value of the collateral does not decrease below the repurchase price plus accrued interest as earned. If such a decrease occurs, additional collateral will be requested and, when received, will be added
21
Morgan Stanley Institutional Fund, Inc.
Annual Report — December 31, 2015
Notes to Financial Statements (cont'd)
to the account to maintain full collateralization. In the event of default on the obligation to repurchase, the Portfolio has the right to liquidate the collateral and apply the proceeds in satisfaction of the obligation. In the event of default or bankruptcy by the counterparty to the agreement, realization of the collateral proceeds may be subject to cost and delays. The Portfolio, along with other affiliated investment companies, may utilize a joint trading account for the purpose of entering into repurchase agreements.
4. Foreign Currency Translation and Foreign Investments: The books and records of the Portfolio are maintained in U.S. dollars. Foreign currency amounts are translated into U.S. dollars as follows:
– investments, other assets and liabilities at the prevailing rate of exchange on the valuation date;
– investment transactions and investment income at the prevailing rates of exchange on the dates of such transactions.
Although the net assets of the Portfolio are presented at the foreign exchange rates and market values at the close of the period, the Portfolio does not isolate that portion of the results of operations arising as a result of changes in the foreign exchange rates from the fluctuations arising from changes in the market prices of securities held at period end. Similarly, the Portfolio does not isolate the effect of changes in foreign exchange rates from the fluctuations arising from changes in the market prices of securities sold during the period. Accordingly, realized and unrealized foreign currency gains (losses) on investments in securities are included in the reported net realized and unrealized gains (losses) on investment transactions and balances. However, pursuant to U.S. Federal income tax regulations, gains and losses from certain foreign currency transactions and the foreign currency portion of gains and losses realized on sales and maturities of foreign denominated debt securities are treated as ordinary income for U.S. Federal income tax purposes.
Net realized gains (losses) on foreign currency transactions represent net foreign exchange gains (losses) from foreign currency forward exchange contracts, disposition of foreign currencies, currency gains (losses) realized between the trade and settlement dates on securities transactions, and the difference between the amount of
investment income and foreign withholding taxes recorded on the Portfolio's books and the U.S. dollar equivalent amounts actually received or paid. Net unrealized currency gains (losses) from valuing foreign currency denominated assets and liabilities at period end exchange rates are reflected as a component of unrealized appreciation (depreciation) in the Statement of Assets and Liabilities. The change in unrealized currency gains (losses) on foreign currency translations for the period is reflected in the Statement of Operations.
Foreign security and currency transactions may involve certain considerations and risks not typically associated with those of U.S. dollar denominated transactions as a result of, among other factors, fluctuations of exchange rates in relation to the U.S. dollar, the possibility of lower levels of governmental supervision and regulation of foreign securities markets and the possibility of political or economic instability.
Governmental approval for foreign investments may be required in advance of making an investment under certain circumstances in some countries, and the extent of foreign investments in domestic companies may be subject to limitation in other countries. Foreign ownership limitations also may be imposed by the charters of individual companies to prevent, among other concerns, violations of foreign investment limitations. As a result, an additional class of shares (identified as "Foreign" in the Portfolio of Investments) may be created and offered for investment. The "local" and "foreign shares" market values may differ. In the absence of trading of the foreign shares in such markets, the Portfolio values the foreign shares at the closing exchange price of the local shares.
5. Securities Lending: The Portfolio lends securities to qualified financial institutions, such as broker-dealers, to earn additional income. Any increase or decrease in the fair value of the securities loaned that might occur and any interest earned or dividends declared on those securities during the term of the loan would remain in the Portfolio. The Portfolio would receive cash or securities as collateral in an amount equal to or exceeding 100% of the current fair value of the loaned securities. The collateral is marked-to-market daily by State Street Bank and Trust Company ("State Street"), the securities lending agent, to ensure that a minimum of 100% collateral coverage is maintained.
22
Morgan Stanley Institutional Fund, Inc.
Annual Report — December 31, 2015
Notes to Financial Statements (cont'd)
Based on pre-established guidelines, the securities lending agent invests any cash collateral that is received in an affiliated money market portfolio and repurchase agreements. Securities lending income is generated from the earnings on the invested collateral and borrowing fees, less any rebates owed to the borrowers and compensation to the lending agent, and is recorded as "Income from Securities Loaned — Net" in the Portfolio's Statement of Operations. Risks in securities lending transactions are that a borrower may not provide additional collateral when required or return the securities when due, and that the value of the short-term investments will be less than the amount of cash collateral plus any rebate that is required to be returned to the borrower.
The Portfolio has the right under the lending agreement to recover the securities from the borrower on demand.
The following table presents financial instruments that are subject to enforceable netting arrangements as of December 31, 2015.
Gross Amounts Not Offset in the Statement of Assets and Liabilities | |||||||||||||||
| Gross Asset Amounts Presented in Statement of Assets and Liabilities (000) | Financial Instrument (000) | Collateral Received (000) | Net Amount (not less than $0) (000) | ||||||||||||
| $ | 20,082 | (a) | $ | — | $ | (20,082 | )(b)(c) | $ | 0 | ||||||
(a) Represents market value of loaned securities at period end.
(b) The Portfolio received cash collateral of approximately $20,942,000, which was subsequently invested in Repurchase Agreements and Morgan Stanley Institutional Liquidity Funds as reported in the Portfolio of Investments. In addition, the Portfolio received non-cash collateral of approximately $20,000 in the form of U.S. Government obligations, which the Portfolio cannot sell or repledge, and accordingly are not reflected in the Portfolio of Investments.
(c) The actual collateral received is greater than the amount shown here due to overcollateralization.
The Portfolio has adopted the disclosure provisions of FASB Accounting Standards Update No. 2014-11 ("ASU No. 2014-11"), "Transfers & Servicing (Topic 860): Repurchase-to-Maturity Transactions, Repurchase Financings, and Disclosures". ASU No. 2014-11 is intended to provide increased transparency about the types of collateral pledged in securities lending transactions and other similar transactions that are accounted for as secured borrowing.
The following table displays a breakdown of transactions accounted for as secured borrowings, the gross obligations by class of collateral pledged, and the remaining contractual maturity of those transactions as of December 31, 2015.
Remaining Contractual Maturity of the Agreements As of December 31, 2015 | |||||||||||||||||||||||
| Overnight and Continuous (000) | <30 days (000) | Between 30 & 90 days (000) | >90 days (000) | Total (000) | |||||||||||||||||||
Securities Lending Transactions | |||||||||||||||||||||||
Common Stocks | $ | 20,942 | $ | — | $ | — | $ | — | $ | 20,942 | |||||||||||||
Total Borrowings | $ | 20,942 | $ | — | $ | — | $ | — | $ | 20,942 | |||||||||||||
Gross amount of recognized liabilities for securities lending transactions | $ | 20,942 | |||||||||||||||||||||
6. Indemnifications: The Fund enters into contracts that contain a variety of indemnifications. The Fund's maximum exposure under these arrangements is unknown. However, the Fund has not had prior claims or losses pursuant to these contracts and expects the risk of loss to be remote.
7. Dividends and Distributions to Shareholders: Dividend income and distributions to shareholders are recorded on the ex-dividend date. Dividends from net investment income, if any, are declared and paid annually. Net realized capital gains, if any, are distributed at least annually.
8. Security Transactions, Income and Expenses: Security transactions are accounted for on the trade date (date the order to buy or sell is executed). Realized gains and losses on the sale of investment securities are determined on the specific identified cost method. Dividend income and other distributions are recorded on the ex-dividend date (except for certain foreign dividends which may be recorded as soon as the Portfolio is informed of such dividends) net of applicable withholding taxes. Interest income is recognized on the accrual basis except where collection is in doubt. Discounts are accreted and premiums are amortized over the life of the respective
23
Morgan Stanley Institutional Fund, Inc.
Annual Report — December 31, 2015
Notes to Financial Statements (cont'd)
securities. Most expenses of the Fund can be directly attributed to a particular Portfolio. Expenses which cannot be directly attributed are apportioned among the Portfolios based upon relative net assets or other appropriate methods. Income, expenses (other than class specific expenses — distribution and shareholder services, transfer agency and sub transfer agency fees) and realized and unrealized gains or losses are allocated to each class of shares based upon their relative net assets.
The Portfolio owns shares of real estate investment trusts ("REITs") which report information on the source of their distributions annually in the following calendar year. A portion of distributions received from REITs during the year is estimated to be a return of capital and is recorded as a reduction of their cost.
B. Advisory/Sub-Advisory Fees: The Adviser, a wholly-owned subsidiary of Morgan Stanley, provides the Portfolio with advisory services under the terms of an Investment Advisory Agreement, paid quarterly, at an annual rate of 0.85% of the daily net assets of the Portfolio.
The Adviser has agreed to reduce its advisory fee and/or reimburse the Portfolio so that total annual portfolio operating expenses, excluding certain investment related expenses, taxes, interest and other extraordinary expenses (including litigation), will not exceed 1.15% for Class I shares, 1.50% for Class A shares, 2.00% for Class L shares and 1.08% for Class IS shares. Effective March 30, 2015, pursuant to the Reorganization, the Adviser has agreed to reduce its advisory fee and/or reimburse the Portfolio so that total annual portfolio operating expenses will not exceed 0.87% for Class I shares, 1.11% for Class A shares, 1.68% for Class L shares, 1.97% for Class C (effective April 30, 2015) shares and 0.84% for Class IS shares. The fee waivers and/or expense reimbursements will continue for at least two years from the date of the Reorganization or until such time as the Directors act to discontinue all or a portion of such waivers and/or reimbursements when they deem such action is appropriate. For the year ended December 31, 2015, approximately $547,000 of advisory fees were waived and approximately $163,000 of other expenses were reimbursed by the Adviser pursuant to this arrangement.
The Adviser has entered into a Sub-Advisory Agreement with the Sub-Advisers, each a wholly-owned subsidiary of Morgan Stanley. The Sub-Advisers provide the Portfolio with advisory services subject to the overall supervision of the Adviser and the Fund's Officers and Directors. The Adviser pays the Sub-
Advisers on a monthly basis a portion of the net advisory fees the Adviser receives from the Portfolio.
C. Administration Fees: The Adviser also serves as Administrator to the Fund and provides administrative services pursuant to an Administration Agreement for an annual fee, accrued daily and paid monthly, of 0.08% of the Portfolio's average daily net assets.
Under a Sub-Administration Agreement between the Administrator and State Street, State Street provides certain administrative services to the Fund. For such services, the Administrator pays State Street a portion of the fee the Administrator receives from the Portfolio.
D. Distribution and Shareholder Services Fees: Morgan Stanley Distribution, Inc. ("MSDI" or the "Distributor"), a wholly-owned subsidiary of the Adviser and Sub-Advisers and an indirect subsidiary of Morgan Stanley, serves as the Fund's Distributor of Portfolio shares pursuant to a Distribution Agreement. The Fund has adopted a Shareholder Services Plan with respect to Class A shares pursuant to Rule 12b-1 under the Act. Under the Shareholder Services Plan, the Portfolio pays the Distributor a shareholder services fee, accrued daily and paid monthly, at an annual rate of 0.25% of the Portfolio's average daily net assets attributable to Class A shares.
The Fund has adopted a Distribution and Shareholder Services Plan with respect to Class L shares pursuant to Rule 12b-1 under the Act. Under the Distribution and Shareholder Services Plan, the Portfolio pays the Distributor a distribution fee, accrued daily and paid monthly, at an annual rate of 0.50% and a shareholder services fee, accrued daily and paid monthly, at an annual rate of 0.25% of the Portfolio's average daily net assets attributable to Class L shares.
The Fund has adopted a Distribution and Shareholder Services Plan with respect to Class C shares pursuant to Rule 12b-1 under the Act. Under the Distribution and Shareholder Services Plan, the Portfolio pays the Distributor a distribution fee, accrued daily and paid monthly, at an annual rate of 0.75% and a shareholder services fee, accrued daily and paid monthly, at an annual rate of 0.25% of the Portfolio's average daily net assets attributable to Class C shares.
The distribution and shareholder services fees are used to support the expenses associated with servicing and maintaining accounts. The Distributor may compensate other parties for
24
Morgan Stanley Institutional Fund, Inc.
Annual Report — December 31, 2015
Notes to Financial Statements (cont'd)
providing shareholder support services to investors who purchase Class A, Class L and Class C shares.
E. Dividend Disbursing and Transfer Agent: The Fund's dividend disbursing and transfer agent is Boston Financial Data Services, Inc. ("BFDS"). Pursuant to a Transfer Agency Agreement, the Fund pays BFDS a fee based on the number of classes, accounts and transactions relating to the Portfolios of the Fund.
F. Custodian Fees: State Street (the "Custodian") serves as Custodian for the Fund in accordance with a Custodian Agreement. The Custodian holds cash, securities, and other assets of the Fund as required by the Act. Custody fees are payable monthly based on assets held in custody, investment purchases and sales activity and account maintenance fees, plus reimbursement for certain out-of-pocket expenses.
G. Security Transactions and Transactions with Affiliates: For the year ended December 31, 2015, purchases and sales of investment securities for the Portfolio, other than long-term U.S. Government securities and short-term investments, were approximately $141,567,000 and $167,455,000, respectively. There were no purchases and sales of long-term U.S. Government securities for the year ended December 31, 2015.
The Portfolio invests in the Institutional Class of the Morgan Stanley Institutional Liquidity Funds (the "Liquidity Funds"), an open-end management investment company managed by the Adviser, both directly and as a portion of the securities held as collateral on loaned securities. Advisory fees paid by the Portfolio are reduced by an amount equal to its pro-rata share of the advisory and administration fees paid by the Portfolio due to its investment in the Liquidity Funds. For the year ended December 31, 2015, advisory fees paid were reduced by approximately $3,000 relating to the Portfolio's investment in the Liquidity Funds.
A summary of the Portfolio's transactions in shares of the Liquidity Funds during the year ended December 31, 2015 is as follows:
| Value December 31, 2014 (000) | Purchases at Cost (000) | Sales (000) | Dividend Income (000) | Value December 31, 2015 (000) | |||||||||||||||
| $ | 9,409 | $ | 116,925 | $ | 98,172 | $ | 3 | $ | 28,162 | ||||||||||
During the year ended December 31, 2015, the Portfolio incurred approximately $2,000 in brokerage commissions
with Morgan Stanley & Co., LLC, an affiliate of the Adviser/Administrator, Sub-Advisers and Distributor, for portfolio transactions executed on behalf of the Portfolio.
The Portfolio has an unfunded Deferred Compensation Plan (the "Compensation Plan"), which allows each independent Director to defer payment of all, or a portion, of the fees he or she receives for serving on the Board of Directors. Each eligible Director generally may elect to have the deferred amounts credited with a return equal to the total return on one or more of the Morgan Stanley funds that are offered as investment options under the Compensation Plan. Appreciation/depreciation and distributions received from these investments are recorded with an offsetting increase/decrease in the deferred compensation obligation and do not affect the NAV of the Portfolio.
H. Federal Income Taxes: It is the Portfolio's intention to continue to qualify as a regulated investment company and distribute all of its taxable and tax-exempt income. Accordingly, no provision for Federal income taxes is required in the financial statements.
The Portfolio may be subject to taxes imposed by countries in which it invests. Such taxes are generally based on income and/or capital gains earned or repatriated. Taxes are accrued based on net investment income, net realized gains and net unrealized appreciation as such income and/or gains are earned. Taxes may also be based on transactions in foreign currency and are accrued based on the value of investments denominated in such currency.
FASB ASC 740-10, "Income Taxes — Overall", sets forth a minimum threshold for financial statement recognition of the benefit of a tax position taken or expected to be taken in a tax return. Management has concluded there are no significant uncertain tax positions that would require recognition in the financial statements. If applicable, the Portfolio recognizes interest accrued related to unrecognized tax benefits in "Interest Expense" and penalties in "Other Expenses" in the Statement of Operations. The Portfolio files tax returns with the U.S. Internal Revenue Service, New York and various states. Generally, each of the tax years in the four-year period ended December 31, 2015, remains subject to examination by taxing authorities.
The tax character of distributions paid may differ from the character of distributions shown in the Statements of Changes
25
Morgan Stanley Institutional Fund, Inc.
Annual Report — December 31, 2015
Notes to Financial Statements (cont'd)
in Net Assets due to short-term capital gains being treated as ordinary income for tax purposes. The tax character of distributions paid during fiscal 2015 and 2014 was as follows:
| 2015 Distributions Paid From: | 2014 Distributions Paid From: | ||||||||||||||||||
| Ordinary Income (000) | Long-Term Capital Gain (000) | Paid-in- Capital (000) | Ordinary Income (000) | Long-Term Capital Gain (000) | |||||||||||||||
| $ | 7,533 | $ | 8,605 | $ | 122 | $ | 941 | $ | 2,768 | ||||||||||
The amount and character of income and gains to be distributed are determined in accordance with income tax regulations which may differ from GAAP. These book/tax differences are either considered temporary or permanent in nature.
Temporary differences are primarily due to differing book and tax treatments in the timing of the recognition of gains (losses) on certain investment transactions and the timing of the deductibility of certain expenses.
Permanent differences, primarily due to differing treatments of gains (losses) related to foreign currency transactions, capital gain distributions from real estate investment trusts, a dividend redesignation and merger adjustments, resulted in the following reclassifications among the components of net assets at December 31, 2015:
| Distributions in Excess of Net Investment Income (000) | Distributions in Excess of Net Realized Gain (000) | Paid-in-Capital (000) | |||||||||
| $ | (291 | ) | $ | (1,679 | ) | $ | 1,970 | ||||
At December 31, 2015, the Portfolio had no distributable earnings on a tax basis.
Capital losses and specified ordinary losses, including currency losses, incurred after October 31 but within the taxable year are deemed to arise on the first day of the Portfolio's next taxable year. For the year ended December 31, 2015, the Portfolio deferred to January 1, 2016 for U.S. Federal income tax purposes the following losses:
| Post-October Currency and Specified Ordinary Losses (000) | Post-October Capital Losses (000) | ||||||
| $ | 17 | $ | 4,713 | ||||
I. Other: At December 31, 2015, the Portfolio had record owners of 10% or greater. Investment activities of these shareholders could have a material impact on the Portfolio. The aggregate percentage of such owners was 60.3%.
26
Morgan Stanley Institutional Fund, Inc.
Annual Report — December 31, 2015
Report of Independent Registered Public Accounting Firm
To the Shareholders and Board of Directors of
Morgan Stanley Institutional Fund, Inc. —
Global Infrastructure Portfolio
We have audited the accompanying statement of assets and liabilities, including the portfolio of investments, of Global Infrastructure Portfolio (one of the portfolios constituting Morgan Stanley Institutional Fund, Inc.) (the "Portfolio") as of December 31, 2015, and the related statement of operations for the year then ended, the statements of changes in net assets for each of the two years in the period then ended and the financial highlights for each of the years or periods indicated therein. These financial statements and financial highlights are the responsibility of the Portfolio's management. Our responsibility is to express an opinion on these financial statements and financial highlights based on our audits.
We conducted our audits in accordance with the standards of the Public Company Accounting Oversight Board (United States). Those standards require that we plan and perform the audit to obtain reasonable assurance about whether the financial statements and financial highlights are free of material misstatement. We were not engaged to perform an audit of the Portfolio's internal control over financial reporting. Our audits included consideration of internal control over financial reporting as a basis for designing audit procedures that are appropriate in the circumstances, but not for the purpose of expressing an opinion on the effectiveness of the Portfolio's internal control over financial reporting. Accordingly, we express no such opinion. An audit also includes examining, on a test basis, evidence supporting the amounts and disclosures in the financial statements and financial highlights, assessing the accounting principles used and significant estimates made by management, and evaluating the overall financial statement presentation. Our procedures included confirmation of securities owned as of December 31, 2015, by correspondence with the custodian and others or by other appropriate auditing procedures where replies from others were not received. We believe that our audits provide a reasonable basis for our opinion.
In our opinion, the financial statements and financial highlights referred to above present fairly, in all material respects, the financial position of Global Infrastructure Portfolio (one of the portfolios constituting Morgan Stanley Institutional Fund, Inc.) at December 31, 2015, the results of its operations for the year then ended, the changes in its net assets for each of the two years in the period then ended and the financial highlights for each of the years or periods indicated therein, in conformity with U.S. generally accepted accounting principles.

Boston, Massachusetts
February 26, 2016
27
Morgan Stanley Institutional Fund, Inc.
Annual Report — December 31, 2015
Federal Tax Notice (unaudited)
For Federal income tax purposes, the following information is furnished with respect to the distributions paid by the Portfolio during its taxable year ended December 31, 2015. For corporate shareholders, 41.9% of the dividends qualified for the dividends received deduction.
The Portfolio designated and paid approximately $8,605,000 as a long-term capital gain distribution.
For Federal income tax purposes, the following information is furnished with respect to the Portfolio's earnings for its taxable year ended December 31, 2015. When distributed, certain earnings may be subject to a maximum tax rate of 15% as provided for the Jobs and Growth Tax Relief Reconciliation Act of 2003. The Portfolio designated up to a maximum of approximately $6,675,000 as taxable at this lower rate.
The Portfolio intends to pass through foreign tax credits of approximately $160,000, and has derived income from sources within foreign countries amounting to approximately $6,324,000.
In January, the Portfolio provides tax information to shareholders for the preceding calendar year.
28
Morgan Stanley Institutional Fund, Inc.
Annual Report — December 31, 2015
U.S. Privacy Policy (unaudited)
AN IMPORTANT NOTICE CONCERNING OUR U.S. PRIVACY POLICY
This privacy notice describes the U.S. privacy policy of Morgan Stanley Distribution, Inc., and the Morgan Stanley family of mutual funds ("us", "our", "we").
We are required by federal law to provide you with notice of our U.S. privacy policy ("Policy"). This Policy applies to both our current and former clients unless we state otherwise and is intended for individual clients who purchase products or receive services from us for personal, family or household purposes. This Policy is not applicable to partnerships, corporations, trusts or other non-individual clients or account holders, nor is this Policy applicable to individuals who are either beneficiaries of a trust for which we serve as trustee or participants in an employee benefit plan administered or advised by us. This Policy is, however, applicable to individuals who select us to be a custodian of securities or assets in individual retirement accounts, 401(k) accounts, or accounts subject to the Uniform Gifts to Minors Act.
This notice sets out our business practices to protect your privacy; how we collect and share personal information about you; and how you can limit our sharing or certain uses by others of this information. We may amend this Policy at any time, and will inform you of any changes to our Policy as required by law.
WE RESPECT YOUR PRIVACY
We appreciate that you have provided us with your personal financial information and understand your concerns about your information. We strive to safeguard the information our clients entrust to us. Protecting the confidentiality and security of client information is an important part of how we conduct our business.
This notice describes what personal information we collect about you, how we collect it, when we may share it with others, and how certain others may use it. It discusses the steps you may take to limit our sharing of certain information about you with our affiliated companies, including, but not limited to our affiliated banking businesses, brokerage firms and credit service affiliates. It also discloses how you may limit our affiliates' use of shared information for marketing purposes.
Throughout this Policy, we refer to the nonpublic information that personally identifies you as "personal information." We also use the term "affiliated company" in this notice. An affiliated company is a company in our family of companies and includes companies with the Morgan Stanley name. These affiliated companies are financial institutions such as broker-dealers, banks, investment advisers and credit card issuers. We refer to any company that is not an affiliated company as a nonaffiliated third party. For purposes of Section 5 of this notice, and your ability to limit certain uses of personal information by our affiliates, this notice applies to the use of personal information by our affiliated companies.
1. WHAT PERSONAL INFORMATION DO WE COLLECT FROM YOU?
We may collect the following types of information about you: (i) information provided by you, including information from applications and other forms we receive from you, (ii) information about your transactions with us or our affiliates, (iii) information about your transactions with nonaffiliated third parties, (iv) information from consumer reporting agencies, (v) information obtained from our websites, and (vi) information obtained from other sources. For example:
• We collect information such as your name, address, e-mail address, telephone/fax numbers, assets, income and investment objectives through applications and other forms you submit to us.
• We may obtain information about account balances, your use of account(s) and the types of products and services you prefer to receive from us through your dealings and transactions with us and other sources.
• We may obtain information about your creditworthiness and credit history from consumer reporting agencies.
• We may collect background information from and through third-party vendors to verify representations you have made and to comply with various regulatory requirements.
2. WHEN DO WE DISCLOSE PERSONAL INFORMATION WE COLLECT ABOUT YOU?
We may disclose personal information we collect about you in each of the categories listed above to affiliated and nonaffiliated third parties.
29
Morgan Stanley Institutional Fund, Inc.
Annual Report — December 31, 2015
U.S. Privacy Policy (unaudited) (cont'd)
a. Information We Disclose to Affiliated Companies.
We may disclose personal information that we collect about you to our affiliated companies to manage your account(s) effectively, to service and process your transactions, and to let you know about products and services offered by us and affiliated companies, to manage our business, and as otherwise required or permitted by law. Offers for products and services from affiliated companies are developed under conditions designed to safeguard your personal information.
b. Information We Disclose to Third Parties.
We may disclose personal information that we collect about you to nonaffiliated third parties to provide marketing services on our behalf or to other financial institutions with whom we have joint marketing agreements. We may also disclose all of the information we collect to other nonaffiliated third parties for our everyday business purposes, such as to process transactions, maintain account(s), respond to court orders and legal investigations, report to credit bureaus, offer our own products and services, protect against fraud, for institutional risk control, to perform services on our behalf, and as otherwise required or permitted by law.
When we share personal information about you with a nonaffiliated third party, they are required to limit their use of personal information about you to the particular purpose for which it was shared and they are not allowed to share personal information about you with others except to fulfill that limited purpose or as may be permitted or required by law.
3. HOW DO WE PROTECT THE SECURITY AND CONFIDENTIALITY OF PERSONAL INFORMATION WE COLLECT ABOUT YOU?
We maintain physical, electronic and procedural security measures that comply with applicable law and regulations to help safeguard the personal information we collect about you. We have internal policies governing the proper handling of client information by employees. Third parties that provide support or marketing services on our behalf may also receive personal information about you, and we require them to adhere to appropriate security standards with respect to such information.
4. HOW CAN YOU LIMIT OUR SHARING CERTAIN PERSONAL INFORMATION ABOUT YOU WITH OUR AFFILIATED COMPANIES FOR ELIGIBILITY DETERMINATION?
By following the opt-out procedures in Section 6 below, you may limit the extent to which we share with our affiliated companies, personal information that was collected to determine your eligibility for products and services such as your credit reports and other information that you have provided to us or that we may obtain from third parties ("eligibility information"). Eligibility information does not include your identification information or personal information pertaining to our transactions or experiences with you. Please note that, even if you direct us not to share eligibility information with our affiliated companies, we may still share your personal information, including eligibility information, with our affiliated companies under circumstances that are permitted under applicable law, such as to process transactions or to service your account.
5. HOW CAN YOU LIMIT THE USE OF CERTAIN PERSONAL INFORMATION ABOUT YOU BY OUR AFFILIATED COMPANIES FOR MARKETING?
By following the opt-out instructions in Section 6 below, you may limit our affiliated companies from marketing their products or services to you based on personal information we disclose to them. This information may include, for example, your income and account history with us. Please note that, even if you choose to limit our affiliated companies from using personal information about you that we may share with them for marketing their products and services to you, our affiliated companies may use your personal information that they obtain from us to market to you in circumstances permitted by law, such as if the affiliated party has its own relationship with you.
30
Morgan Stanley Institutional Fund, Inc.
Annual Report — December 31, 2015
U.S. Privacy Policy (unaudited) (cont'd)
6. HOW CAN YOU SEND US AN OPT-OUT INSTRUCTION?
If you wish to limit our sharing of eligibility information about you with our affiliated companies, or our affiliated companies' use of personal information for marketing purposes, as described in this notice, you may do so by:
• Calling us at (800) 548-7786
Monday–Friday between 8a.m. and 6p.m. (EST)
• Writing to us at the following address:
Boston Financial Data Services, Inc.
c/o Privacy Coordinator
P.O. Box 219804
Kansas City, Missouri 64121
If you choose to write to us, your request should include: your name, address, telephone number and account number(s) to which the opt-out applies and whether you are opting out with respect to sharing of eligibility information (Section 4 above), or information used for marketing (Section 5 above), or both. Written opt-out requests should not be sent with any other correspondence. In order to process your request, we require that the request be provided by you directly and not through a third party. Once you have informed us about your privacy preferences, your opt-out preference will remain in effect with respect to this Policy (as it may be amended) until you notify us otherwise. If you are a joint account owner, we will accept instructions from any one of you and apply those instructions to the entire account.
Please understand that if you limit our sharing or our affiliated companies' use of personal information, you and any joint account holder(s) may not receive information about our affiliated companies' products and services, including products or services that could help you manage your financial resources and achieve your investment objectives.
If you have more than one account or relationship with us, please specify the accounts to which you would like us to apply your privacy choices. If you have accounts or relationships with our affiliates, you may receive multiple privacy policies from them, and will need to separately notify those companies of your privacy choices for those accounts or relationships.
7. WHAT IF AN AFFILIATED COMPANY BECOMES A NONAFFILIATED THIRD PARTY?
If, at any time in the future, an affiliated company becomes a nonaffiliated third party, further disclosures of personal information made to the former affiliated company will be limited to those described in Section 2(b) above relating to nonaffiliated third parties. If you elected under Section 6 to limit disclosures we make to affiliated companies, or use of personal information by affiliated companies, your election will not apply to use by any former affiliated company of your personal information in their possession once it becomes a nonaffiliated third party.
SPECIAL NOTICE TO RESIDENTS OF VERMONT
The following section supplements our Policy with respect to our individual clients who have a Vermont address and supersedes anything to the contrary in the above Policy with respect to those clients only.
The State of Vermont requires financial institutions to obtain your consent prior to sharing personal information that they collect about you with nonaffiliated third parties, or eligibility information with affiliated companies, other than in certain limited circumstances. Except as permitted by law, we will not share personal information we collect about you with nonaffiliated third parties or eligibility information with affiliated companies, unless you provide us with your written consent to share such information.
SPECIAL NOTICE TO RESIDENTS OF CALIFORNIA
The following section supplements our Policy with respect to our individual clients who have a California address and supersedes anything to the contrary in the above Policy with respect to those clients only.
In response to a California law, if your account has a California home address, your personal information will not be disclosed to nonaffiliated third parties except as permitted by applicable California law, and we will limit sharing such personal information with our affiliates to comply with California privacy laws that apply to us.
31
Morgan Stanley Institutional Fund, Inc.
Annual Report — December 31, 2015
Director and Officer Information (unaudited)
Independent Directors:
| Name, Age and Address of Independent Director | Positions(s) Held with Registrant | Length of Time Served* | Principal Occupation(s) During Past 5 Years and Other Relevant Professional Experience | Number of Portfolios in Fund Complex Overseen by Director** | Other Directorships Held by Independent Director*** | ||||||||||||||||||
| Frank L. Bowman (71) c/o Kramer Levin Naftalis & Frankel LLP Counsel to the Independent Directors 1177 Avenue of the Americas New York, NY 10036 | Director | Since August 2006 | President, Strategic Decisions, LLC (consulting) (since February 2009); Director or Trustee of various Morgan Stanley Funds (since August 2006); Chairperson of the Compliance and Insurance Committee (since October 2015); Formerly, Chairperson of the Insurance Sub-Committee of the Compliance and Insurance Committee (February 2007-December 2015); served as President and Chief Executive Officer of the Nuclear Energy Institute (policy organization) (February 2005-November 2008); retired as Admiral, U.S. Navy after serving over 38 years on active duty including 8 years as Director of the Naval Nuclear Propulsion Program in the Department of the Navy and the U.S. Department of Energy (1996-2004); served as Chief of Naval Personnel (July 1994-September 1996); and on the Joint Staff as Director of Political Military Affairs (June 1992-July1994); knighted as Honorary Knight Commander of the Most Excellent Order of the British Empire; awarded the Officier de l'Orde National du Mérite by the French Government; elected to the National Academy of Engineering (2009). | 98 | Director of BP p.l.c.; Director of Naval and Nuclear Technologies LLP; Director Emeritus of the Armed Services YMCA; Director of the U.S. Naval Submarine League; Member of the National Security Advisory Council of the Center for U.S. Global Engagement and a member of the CNA Military Advisory Board; Chairman of the Charity, J Street Cup Golf, Trustee of Fairhaven United Methodist Church; and Director of other various non-profit organizations. | ||||||||||||||||||
| Kathleen A. Dennis (62) c/o Kramer Levin Naftalis & Frankel LLP Counsel to the Independent Directors 1177 Avenue of the Americas New York, NY 10036 | Director | Since August 2006 | President, Cedarwood Associates (mutual fund and investment management consulting) (since July 2006); Chairperson of the Money Market and Alternatives Sub-Committee of the Investment Committee (since October 2006) and Director or Trustee of various Morgan Stanley Funds (since August 2006); formerly, Senior Managing Director of Victory Capital Management (1993-2006). | 98 | Director of various nonprofit organizations. | ||||||||||||||||||
| Nancy C. Everett (61) c/o Kramer Levin Naftalis & Frankel LLP Counsel to the Independent Trustees 1177 Avenue of the Americas New York, NY 10036 | Trustee | Since January 2015 | Chief Executive Officer, Virginia Commonwealth University Investment Company (since November 2015); Owner OBIR, LLC (institutional investment management consulting) (since June 2014); formerly, Managing Director, BlackRock, Inc. (February 2011-December 2013); and Chief Executive Officer, General Motors Asset Management (a/k/a Promark Global Advisors, Inc.) (June 2005-May 2010). | 98 | Member of Virginia Commonwealth University School of Business Foundation; formerly, Member of Virginia Commonwealth University Board of Visitors (2013-2015); Member of Committee on Directors for Emerging Markets Growth Fund, Inc. (2007-2010); Chairperson of Performance Equity Management, LLC (2006-2010); and Chairperson, GMAM Absolute Return Strategies Fund, LLC (2006-2010). | ||||||||||||||||||
32
Morgan Stanley Institutional Fund, Inc.
Annual Report — December 31, 2015
Director and Officer Information (unaudited) (cont'd)
Independent Directors: (cont'd)
| Name, Age and Address of Independent Director | Positions(s) Held with Registrant | Length of Time Served* | Principal Occupation(s) During Past 5 Years and Other Relevant Professional Experience | Number of Portfolios in Fund Complex Overseen by Director** | Other Directorships Held by Independent Director*** | ||||||||||||||||||
| Jakki L. Haussler (58) c/o Kramer Levin Naftalis & Frankel LLP Counsel to the Independent Directors 1177 Avenue of the Americas New York, NY 10036 | Director | Since January 2015 | Chairman and Chief Executive Officer, Opus Capital Group (since January 1996); and formerly, Director, Capvest Venture Fund, LP (May 2000-December 2011); Partner, Adena Ventures, LP (July 1999-December 2010); Director, The Victory Funds (February 2005-July 2008). | 98 | Director of Cincinnati Bell Inc. and Member, Audit Committee and Compensation Committee; Director of Northern Kentucky University Foundation and Member, Investment Committee; Member of Chase College of Law Transactional Law Practice Center Board of Advisors; Director of Best Transport; Chase College of Law Board of Visitors; formerly Member, University of Cincinnati Foundation Investment Committee; Member, Miami University Board of Visitors (2008-2011); Trustee of Victory Funds (2005-2008) and Chairman, Investment Committee (2007-2008) and Member, Service Provider Committee (2005-2008). | ||||||||||||||||||
| Dr. Manuel H. Johnson (67) c/o Johnson Smick International, Inc. 220 I Street, N.E. — Suite 200 Washington, D.C. 20002 | Director | Since July 1991 | Senior Partner, Johnson Smick International, Inc. (consulting firm); Chairperson of the Investment Committee (since October 2006) and Director or Trustee of various Morgan Stanley Funds (since July 1991); Co-Chairman and a founder of the Group of Seven Council (G7C) (international economic commission); formerly Chairperson of the Audit Committee (July 1991-September 2006), Vice Chairman of the Board of Governors of the Federal Reserve System and Assistant Secretary of the U.S. Treasury. | 100 | Director of NVR, Inc. (home construction). | ||||||||||||||||||
| Joseph J. Kearns (73) c/o Kearns & Associates LLC 23823 Malibu Road S-50-440 Malibu, CA 90265 | Director | Since August 1994 | President, Kearns & Associates LLC (investment consulting); Chairperson of the Audit Committee (since October 2006) and Director or Trustee of various Morgan Stanley Funds (since August 1994); formerly, Deputy Chairperson of the Audit Committee (July 2003-September 2006) and Chairperson of the Audit Committee of various Morgan Stanley Funds (since August 1994); CFO of the J. Paul Getty Trust. | 101 | Director of Electro Rent Corporation (equipment leasing). Prior to December 31, 2013, Director of The Ford Family Foundation. | ||||||||||||||||||
33
Morgan Stanley Institutional Fund, Inc.
Annual Report — December 31, 2015
Director and Officer Information (unaudited) (cont'd)
Independent Directors: (cont'd)
| Name, Age and Address of Independent Director | Positions(s) Held with Registrant | Length of Time Served* | Principal Occupation(s) During Past 5 Years and Other Relevant Professional Experience | Number of Portfolios in Fund Complex Overseen by Director** | Other Directorships Held by Independent Director*** | ||||||||||||||||||
| Michael F. Klein (57) c/o Kramer Levin Naftalis & Frankel LLP Counsel to the Independent Directors 1177 Avenue of the Americas New York, NY 10036 | Director | Since August 2006 | Managing Director, Aetos Capital, LLC (since March 2000); Co-President, Aetos Alternatives Management, LLC (since January 2004); and Co-Chief Executive Officer of Aetos Capital LLC (since August 2013); Chairperson of the Fixed Income Sub-Committee of the Investment Committee (since October 2006) and Director or Trustee of various Morgan Stanley Funds (since August 2006); formerly, Managing Director, Morgan Stanley & Co. Inc. and Morgan Stanley Dean Witter Investment Management, President, various Morgan Stanley Funds (June 1998-March 2000) and Principal, Morgan Stanley & Co. Inc. and Morgan Stanley Dean Witter Investment Management (August 1997-December 1999). | 97 | Director of certain investment funds managed or sponsored by Aetos Capital, LLC. Director of Sanitized AG and Sanitized Marketing AG (specialty chemicals). | ||||||||||||||||||
| Michael E. Nugent (79) 522 Fifth Avenue New York, NY 10036 | Chair of the Board and Director | Chair of the Boards since July 2006 and Director since July 1991 | Chair of the Boards of various Morgan Stanley Funds (since July 2006); Chairperson of the Closed-End Fund Committee (since June 2012) and Director or Trustee of various Morgan Stanley Funds (since July 1991); formerly, Chairperson of the Insurance Committee (until July 2006), General Partner, TriumphCapital, L.P. (private investment partnership) (1988-2013). | 100 | None. | ||||||||||||||||||
| W. Allen Reed (68) c/o Kramer Levin Naftalis & Frankel LLP Counsel to the Independent Directors 1177 Avenue of the Americas New York, NY 10036 | Director | Since August 2006 | Chairperson of the Equity Sub-Committee of the Investment Committee (since October 2006) and Director or Trustee of various Morgan Stanley Funds (since August 2006); formerly, President and CEO of General Motors Asset Management; Chairman and Chief Executive Officer of the GM Trust Bank and Corporate Vice President of General Motors Corporation (August 1994-December 2005). | 98 | Director of Legg Mason, Inc.; formerly Director of the Auburn University Foundation (2010-2015). | ||||||||||||||||||
| Fergus Reid (83) c/o Joe Pietryka, Inc. 85 Charles Colman Blvd. Pawling, NY 12564 | Director | Since June 1992 | Chairman, Joe Pietryka, Inc.; Chairperson of the Governance Committee and Director or Trustee of various Morgan Stanley Funds (since June 1992). | 100 | Formerly, Trustee and Director of certain investment companies in the JP Morgan Fund Complex managed by JP Morgan Investment Management Inc. (1987-2012). | ||||||||||||||||||
34
Morgan Stanley Institutional Fund, Inc.
Annual Report — December 31, 2015
Director and Officer Information (unaudited) (cont'd)
Interested Director:
| Name, Age and Address of Interested Director | Positions(s) Held with Registrant | Length of Time Served* | Principal Occupation(s) During Past 5 Years | Number of Portfolios in Fund Complex Overseen by Interested Director** | Other Directorships Held by Interested Director*** | ||||||||||||||||||
| James F. Higgins (68) One New York Plaza, New York, NY 10004 | Director | Since June 2000 | Director or Trustee of various Morgan Stanley Funds (since June 2000); Senior Advisor of Morgan Stanley (since August 2000). | 99 | Formerly, Director of AXA Financial, Inc. and AXA Equitable Life Insurance Company (2002-2011) and Director of AXA MONY Life Insurance Company and AXA MONY Life Insurance Company of America (2004-2011). | ||||||||||||||||||
* This is the earliest date the Director began serving the Morgan Stanley Funds. Each Director serves an indefinite term, until his or her successor is elected.
** The Fund Complex includes (as of December 31, 2015) all open-end and closed-end funds (including all of their portfolios) advised by Morgan Stanley Investment Management Inc. (the "Adviser") and any funds that have an adviser that is an affiliated person of the Adviser (including, but not limited to, Morgan Stanley AIP GP LP).
*** This includes any directorships at public companies and registered investment companies held by the Director at any time during the past five years.
Executive Officers:
Name, Age and Address of Executive Officer | Position(s) Held with Registrant | Length of Time Served**** | Principal Occupation(s) During Past 5 Years | ||||||||||||
| John H. Gernon (52) 522 Fifth Avenue New York, NY 10036 | President and Principal Executive Officer | Since September 2013 | President and Principal Executive Officer of the Equity and Fixed Income Funds and the Morgan Stanley AIP Funds (since September 2013) and the Liquidity Funds and various money market funds (since May 2014) in the Fund Complex, Managing Director of the Adviser; Head of Product (since 2006). | ||||||||||||
| Stefanie V. Chang Yu (49) 522 Fifth Avenue New York, NY 10036 | Chief Compliance Officer | Since December 1997 | Managing Director of the Adviser and various entities affiliated with the Adviser; Chief Compliance Officer of various Morgan Stanley Funds and the Adviser (since January 2014); formerly, Vice President of various Morgan Stanley Funds (December 1997-January 2014). | ||||||||||||
| Joseph C. Benedetti (50) 522 Fifth Avenue New York, NY 10036 | Vice President | Since January 2014 | Managing Director of the Adviser and various entities affiliated with the Adviser; Vice President of various Morgan Stanley Funds (since January 2014); formerly, Assistant Secretary of various Morgan Stanley Funds (October 2004-January 2014). | ||||||||||||
| Francis J. Smith (50) 522 Fifth Avenue New York, NY 10036 | Treasurer and Principal Financial Officer | Treasurer since July 2003 and Principal Financial Officer since September 2002 | Executive Director of the Adviser and various entities affiliated with the Adviser; Treasurer (since July 2003) and Principal Financial Officer of various Morgan Stanley Funds (since September 2002). | ||||||||||||
| Mary E. Mullin (48) 522 Fifth Avenue New York, NY 10036 | Secretary | Since June 1999 | Executive Director of the Adviser; Secretary of various Morgan Stanley Funds (since June 1999). | ||||||||||||
**** This is the earliest date the officer began serving the Morgan Stanley Funds. Each officer serves a one-year term, until his or her successor is elected and has qualified.
35
Morgan Stanley Institutional Fund, Inc.
Annual Report — December 31, 2015
Adviser and Administrator
Morgan Stanley Investment Management Inc.
522 Fifth Avenue
New York, New York 10036
Sub-Advisers
Morgan Stanley Investment Management Limited
25 Cabot Square, Canary Wharf
London, E14 4QA, England
Morgan Stanley Investment Management Company
23 Church Street
16-01 Capital Square, Singapore 049481
Distributor
Morgan Stanley Distribution, Inc.
522 Fifth Avenue
New York, New York 10036
Dividend Disbursing and Transfer Agent
Boston Financial Data Services, Inc.
2000 Crown Colony Drive
Quincy, Massachusetts 02169
Custodian
State Street Bank and Trust Company
One Lincoln Street
Boston, Massachusetts 02111
Legal Counsel
Dechert LLP
1095 Avenue of the Americas
New York, New York 10036
Counsel to the Independent Directors
Kramer Levin Naftalis & Frankel LLP
1177 Avenue of the Americas
New York, New York 10036
Independent Registered Public Accounting Firm
Ernst & Young LLP
200 Clarendon Street
Boston, Massachusetts 02116
Reporting to Shareholders
Each Morgan Stanley fund provides a complete schedule of portfolio holdings in its semi-annual and annual reports within 60 days of the end of the fund's second and fourth fiscal quarters. The semi-annual and annual reports are filed electronically with the Securities and Exchange Commission (SEC) on Form N-CSRS and Form N-CSR, respectively. Morgan Stanley also delivers the semi-annual and annual reports to fund shareholders and makes these reports available on its public website, www.morganstanley.com/im. Each Morgan Stanley fund also files a complete schedule of portfolio holdings with the SEC for the fund's first and third fiscal quarters on Form N-Q. Morgan Stanley does not deliver the reports for the first and third fiscal quarters to shareholders, nor are the reports posted to the Morgan Stanley public website. You may, however, obtain the Form N-Q filings (as well as the Form N-CSR and N-CSRS filings) by accessing the SEC's website, www.sec.gov. You may also review and copy them at the SEC's Public Reference Room in Washington, DC. Information on the operation of the SEC's Public Reference Room may be obtained by calling the SEC toll free at 1 (800) SEC-0330. You can also request copies of these materials, upon payment of a duplicating fee, by electronic request at the SEC's email address (publicinfo@sec.gov) or by writing the Public Reference Room of the SEC, Washington, DC 20549-0102.
Proxy Voting Policies and Procedures and Proxy Voting Record
You may obtain a copy of the Fund's Proxy Voting Policy and Procedures and information regarding how the Fund voted proxies relating to portfolio securities during the most recent twelve-month period ended June 30, without charge, upon request, by calling toll free 1 (800) 548-7786 or by visiting our website at www.morganstanley.com/im. This information is also available on the SEC's website at www.sec.gov.
This report is authorized for distribution only when preceded or accompanied by a prospectus of the Morgan Stanley Institutional Fund, Inc., which describes in detail each Portfolio's investment policies, risks, fees and expenses. Please read the prospectus carefully before you invest or send money. For additional information, including information regarding the investments comprising the Portfolio, please visit our website at www.morganstanley.com/im or call toll free 1 (800) 548-7786.
36
Printed in U.S.A.
This Report has been prepared for shareholders and may be distributed to others only if preceded or accompanied by a current prospectus.
Morgan Stanley Investment Management Inc.
522 Fifth Avenue
New York, New York 10036
© 2016 Morgan Stanley. Morgan Stanley Distribution, Inc.

IFISGIANN
1406252 EXP. 02.28.17
INVESTMENT MANAGEMENT

Morgan Stanley Institutional Fund, Inc.
Global Advantage Portfolio
Annual Report
December 31, 2015

Morgan Stanley Institutional Fund, Inc.
Annual Report — December 31, 2015
Table of Contents
Shareholders' Letter | 2 | ||||||
Expense Example | 3 | ||||||
Investment Overview | 4 | ||||||
Portfolio of Investments | 6 | ||||||
Statement of Assets and Liabilities | 7 | ||||||
Statement of Operations | 9 | ||||||
Statements of Changes in Net Assets | 10 | ||||||
Financial Highlights | 12 | ||||||
Notes to Financial Statements | 16 | ||||||
Report of Independent Registered Public Accounting Firm | 24 | ||||||
Federal Tax Notice | 25 | ||||||
U.S. Privacy Policy | 26 | ||||||
Director and Officer Information | 29 | ||||||
This report is authorized for distribution only when preceded or accompanied by prospectuses of the Morgan Stanley Institutional Fund, Inc. To receive a prospectus and/or statement of additional information (SAI), which contains more complete information such as investment objectives, charges, expenses, policies for voting proxies, risk considerations, and describes in detail each of the Portfolio's investment policies to the prospective investor, please call toll free 1 (800) 548-7786. Please read the prospectuses carefully before you invest or send money.
Additionally, you can access portfolio information including performance, characteristics, and investment team commentary through Morgan Stanley Investment Management's website: www.morganstanley.com/im.
Market forecasts provided in this report may not necessarily come to pass. There is no guarantee that any sectors mentioned will continue to perform as discussed herein or that securities in such sectors will be held by the Portfolio in the future. There is no assurance that a Portfolio will achieve its investment objective. Portfolios are subject to market risk, which is the possibility that market values of securities owned by the Portfolio will decline and, therefore, the value of the Portfolio's shares may be less than what you paid for them. Accordingly, you can lose money investing in this Portfolio. Please see the prospectus for more complete information on investment risks.
1
Morgan Stanley Institutional Fund, Inc.
Annual Report — December 31, 2015
Shareholders' Letter (unaudited)
Dear Shareholders,
We are pleased to provide this Annual report, in which you will learn how your investment in Global Advantage Portfolio (the "Portfolio") performed during the latest twelve-month period.
Morgan Stanley Investment Management is a client-centric, investor-led organization. Our global presence, intellectual capital, and breadth of products and services enable us to partner with investors to meet the evolving challenges of today's financial markets. We aim to deliver superior investment service and to empower our clients to make the informed decisions that help them reach their investment goals.
As always, we thank you for selecting Morgan Stanley Investment Management, and look forward to working with you in the months and years ahead.
Sincerely,

John H. Gernon
President and Principal Executive Officer
January 2016
2
Morgan Stanley Institutional Fund, Inc.
Annual Report — December 31, 2015
Expense Example (unaudited)
Global Advantage Portfolio
As a shareholder of the Portfolio, you incur two types of costs: (1) transactional costs; and (2) ongoing costs, including advisory fees, administration fees, distribution and shareholder services fees and other Portfolio expenses. This example is intended to help you understand your ongoing costs (in dollars) of investing in the Portfolio and to compare these costs with the ongoing costs of investing in other mutual funds.
This example is based on an investment of $1,000 invested at the beginning of the six-month period ended December 31, 2015 and held for the entire six-month period.
Actual Expenses
The table below provides information about actual account values and actual expenses. You may use the information in this table, together with the amount you invested, to estimate the expenses that you paid over the period. Simply divide your account value by $1,000 (for example, an $8,600 account value divided by $1,000 = 8.6), then multiply the result by the number in the table under the heading entitled "Actual Expenses Paid During Period" to estimate the expenses you paid on your account during this period.
Hypothetical Example for Comparison Purposes
The table below provides information about hypothetical account values and hypothetical expenses based on the Portfolio's actual expense ratio and an assumed rate of return of 5% per year before expenses, which is not the Portfolio's actual return. The hypothetical account values and expenses may not be used to estimate the actual ending account balance or expenses you paid for the period. You may use this information to compare the ongoing costs of investing in the Portfolio and other funds. To do so, compare this 5% hypothetical example with the 5% hypothetical examples that appear in the shareholder reports of the other funds.
Please note that the expenses shown in the table are meant to highlight your ongoing costs only and do not reflect any transactional costs, such as sales charges (loads). Therefore, the information for each class in the table is useful in comparing ongoing costs only, and will not help you determine the relative total costs of owning different funds. In addition, if these transactional costs were included, your costs would have been higher.
| Beginning Account Value 7/1/15 | Actual Ending Account Value 12/31/15 | Hypothetical Ending Account Value | Actual Expenses Paid During Period* | Hypothetical Expenses Paid During Period* | Net Expense Ratio During Period** | ||||||||||||||||||||||
Global Advantage Portfolio Class I | $ | 1,000.00 | $ | 988.80 | $ | 1,019.71 | $ | 5.46 | $ | 5.55 | 1.09 | % | |||||||||||||||
Global Advantage Portfolio Class A | 1,000.00 | 986.60 | 1,017.95 | 7.21 | 7.32 | 1.44 | |||||||||||||||||||||
Global Advantage Portfolio Class L | 1,000.00 | 984.90 | 1,015.43 | 9.71 | 9.86 | 1.94 | |||||||||||||||||||||
Global Advantage Portfolio Class C | 1,000.00 | 984.00 | 1,014.17 | 10.95 | 11.12 | 2.19 | |||||||||||||||||||||
* Expenses are calculated using each Portfolio Class' annualized net expense ratio (as disclosed), multiplied by the average account value over the period, and multiplied by 184/365 (to reflect the most recent one-half year period).
** Annualized.
3
Morgan Stanley Institutional Fund, Inc.
Annual Report — December 31, 2015
Investment Overview (unaudited)
Global Advantage Portfolio
The Portfolio seeks long-term capital appreciation.
Performance
For the year ended December 31, 2015, the Portfolio's Class I shares had a total return based on net asset value and reinvestment of distributions per share of 3.85%, net of fees. The Portfolio's Class I shares outperformed the Portfolio's benchmark, the MSCI All Country World Index (the "Index"), which returned –2.36%.
Factors Affecting Performance
• Global equity markets were slightly down for the 12-month period. A backdrop of weak global economic growth, intensifying concerns about China's slowdown, shifting sentiment about central bank policies and a sustained decline in commodity prices weighed on the markets throughout the year. On a regional basis, Japan's 9.6% gain outperformed the S&P 500 Index's flat return of 1.4% and Europe's modest 2.8% decline, while emerging market equities suffered a double-digit loss, down 14.9% (as measured by the MSCI Japan Index, MSCI Europe Index and MSCI Emerging Markets Index, respectively).
• The consumer discretionary sector contributed nearly all of the Portfolio's outperformance relative to the Index during this period. Performance was led by a holding in an U.S.-based online retail and cloud computing leader. The company reported strong quarterly results, with revenue and profit growth in both its core retail business and its web services business ahead of Wall Street expectations. Given its brand and scale competitive advantages, we believe the company is well positioned to continue gaining market share.
• The Portfolio's lack of exposure to the energy sector added a small gain to relative performance. Energy was the worst-performing sector in the Index.
• Stock selection in the health care sector was disadvantageous to performance during the period. A Canada-based specialty drug maker led the group lower, as its shares were plagued by growing drug pricing scrutiny across the industry, which we believe has largely been a function of a more
politically sensitive environment ahead of the 2016 U.S. presidential elections. During October, the shares declined further due to allegations regarding its relationships and business practices with specialty pharmacies. We eliminated the position during the month, due to our assessment of the relative risk/reward profile.
• The consumer staples sector was a detractor, driven primarily by unfavorable stock selection. A position in a U.S.-based leading single-serve coffee provider was the biggest drag on results in the sector. The company's poor execution around the launch of its 2.0 coffee brewer resulted in weaker-than-expected fundamentals, and both the price point and timeline to launch its new cold beverage system had also disappointed investors. Although the shares spiked in early December on news that the company agreed to be acquired by a privately held company at an 80 percent premium, the stock detracted from performance for the period overall.
Management Strategies
• There were no changes to our bottom-up investment process during the period. We continued to look for franchises with strong name recognition and sustainable competitive advantages. We typically favor companies with rising returns on invested capital, above average business visibility, strong free cash flow generation and an attractive risk/reward profile. Our emphasis is on secular growth, and as a result short-term market events are not as meaningful in the stock selection process.
• The long-term investment horizon and conviction-weighted investment approach embraced by the team since 1998 can result in periods of performance deviation from the benchmark and peers, as was the case during this reporting period. Our team continues to focus on bottom-up stock selection and the long-term outlook for companies owned in the Portfolio; accordingly, we have had very little turnover in the Portfolio to date, as our ongoing work reaffirms our assessment of quality and competitive advantage in the names we own.
4
Morgan Stanley Institutional Fund, Inc.
Annual Report — December 31, 2015
Investment Overview (unaudited) (cont'd)
Global Advantage Portfolio
* Minimum Investment for Class I shares
** Commenced Operations on December 28, 2010.
In accordance with SEC regulations, the Portfolio's performance shown assumes that all recurring fees (including management fees) were deducted and all dividends and distributions were reinvested. The performance of Class A, L and C shares will vary from the performance of Class I shares based upon their different inception dates and will be negatively impacted by additional fees assessed to those classes.
Performance Compared to the MSCI All Country World Index(1) and the Lipper Global Multi-Cap Growth Funds Index(2)
| Period Ended December 31, 2015 Total Returns(3) | |||||||||||||||||||
Average Annual | |||||||||||||||||||
| One Year | Five Years | Ten Years | Since Inception(6) | ||||||||||||||||
| Portfolio — Class I Shares w/o sales charges(4) | 3.85 | % | 10.85 | % | — | 10.86 | % | ||||||||||||
| Portfolio — Class A Shares w/o sales charges(4) | 3.40 | 10.51 | — | 10.51 | |||||||||||||||
| Portfolio — Class A Shares with maximum 5.25% sales charges(4) | –2.00 | 9.33 | — | 9.34 | |||||||||||||||
| Portfolio — Class L Shares w/o sales charges(4) | 2.96 | 9.97 | — | 9.97 | |||||||||||||||
| Portfolio — Class C Shares w/o sales charges(5) | — | — | — | –2.94 | |||||||||||||||
| Portfolio — Class C Shares with maximum 1.00% deferred sales charges(5) | — | — | — | –3.84 | |||||||||||||||
MSCI All Country World Index | –2.36 | 6.09 | — | 6.21 | |||||||||||||||
| Lipper Global Multi-Cap Growth Funds Index | 0.44 | 5.93 | — | 6.04 | |||||||||||||||
Performance data quoted represents past performance, which is no guarantee of future results, and current performance may be lower or higher than the figures shown. Performance assumes that all dividends and distributions, if any, were reinvested. For the most recent month-end performance figures, please visit www.morganstanley.com/im. Investment return and principal value will fluctuate so that Portfolio shares, when redeemed, may be worth more or less than their original cost. Total returns do not reflect the deduction of taxes that a shareholder would pay on Portfolio distributions or the redemption of Portfolio shares.Returns for periods less than one year are not annualized. Performance of share classes will vary due to difference in expenses.
(1) The MSCI All Country World Index (ACWI) is a free float-adjusted market capitalization weighted index designed to measure the equity market performance of developed and emerging markets. The term "free float" represents the portion of shares outstanding that are deemed to be available for purchase in the public equity markets by investors. It is not possible to invest directly in an index. The Index is unmanaged and its returns do not include any sales charges or fees. Such costs would lower performance. It is not possible to invest directly in an index.
(2) The Lipper Global Multi-Cap Growth Funds Index is an equally weighted performance index of the largest qualifying funds (based on net assets) in the Lipper Global Multi-Cap Growth Funds classification. The Index, which is adjusted for capital gains distributions and income dividends, is unmanaged and should not be considered an investment. There are currently 30 funds represented in this Index. As of the date of this report, the Portfolio is in the Lipper Global Multi-Cap Growth Funds classification.
(3) Total returns for the Portfolio reflect fees waived and expenses reimbursed, if applicable, by the Adviser. Without such waivers and reimbursements, total returns would have been lower.
(4) Commenced operations on December 28, 2010.
(5) Commenced offering on April 30, 2015.
(6) For comparative purposes, average annual since inception returns listed for the Indexes refer to the inception date of Class I of the Portfolio, not the inception of the Index.
5
Morgan Stanley Institutional Fund, Inc.
Annual Report — December 31, 2015
Portfolio of Investments
Global Advantage Portfolio
Shares | Value (000) | ||||||||||
Common Stocks (95.1%) | |||||||||||
Brazil (1.1%) | |||||||||||
MercadoLibre, Inc. | 520 | $ | 60 | ||||||||
China (4.2%) | |||||||||||
Alibaba Group Holding Ltd. ADR (a) | 1,776 | 145 | |||||||||
JD.com, Inc. ADR (a) | 2,892 | 93 | |||||||||
238 | |||||||||||
France (6.0%) | |||||||||||
Christian Dior SE | 1,152 | 196 | |||||||||
Edenred | 3,102 | 58 | |||||||||
Eurazeo SA | 1,181 | 81 | |||||||||
335 | |||||||||||
Japan (4.3%) | |||||||||||
Calbee, Inc. | 3,200 | 134 | |||||||||
Japan Airport Terminal Co., Ltd. | 2,500 | 111 | |||||||||
245 | |||||||||||
Korea, Republic of (1.0%) | |||||||||||
Loen Entertainment, Inc. (a) | 777 | 55 | |||||||||
Netherlands (0.8%) | |||||||||||
OCI N.V. (a) | 1,854 | 46 | |||||||||
South Africa (4.9%) | |||||||||||
Naspers Ltd., Class N | 1,394 | 191 | |||||||||
SABMiller PLC | 1,455 | 87 | |||||||||
278 | |||||||||||
Spain (1.4%) | |||||||||||
Industria de Diseno Textil SA | 2,283 | 78 | |||||||||
Switzerland (4.8%) | |||||||||||
Nestle SA ADR | 3,607 | 269 | |||||||||
United Kingdom (9.4%) | |||||||||||
BBA Aviation PLC | 18,083 | 50 | |||||||||
Burberry Group PLC | 6,492 | 114 | |||||||||
Diageo PLC ADR | 687 | 75 | |||||||||
Intertek Group PLC | 1,971 | 81 | |||||||||
Manchester United PLC, Class A | 4,300 | 77 | |||||||||
Reckitt Benckiser Group PLC | 1,428 | 131 | |||||||||
528 | |||||||||||
United States (57.2%) | |||||||||||
Alphabet, Inc., Class C (a) | 274 | 208 | |||||||||
Amazon.com, Inc. (a) | 701 | 474 | |||||||||
Anheuser-Busch InBev N.V. ADR | 1,078 | 135 | |||||||||
Apple, Inc. | 2,455 | 258 | |||||||||
Berkshire Hathaway, Inc., Class B (a) | 559 | 74 | |||||||||
Cognizant Technology Solutions Corp., Class A (a) | 1,955 | 117 | |||||||||
Facebook, Inc., Class A (a) | 3,866 | 405 | |||||||||
LinkedIn Corp., Class A (a) | 804 | 181 | |||||||||
Mastercard, Inc., Class A | 2,280 | 222 | |||||||||
McGraw Hill Financial, Inc. | 973 | 96 | |||||||||
Mead Johnson Nutrition Co. | 1,314 | 104 | |||||||||
Monster Beverage Corp. (a) | 764 | 114 | |||||||||
Thermo Fisher Scientific, Inc. | 610 | 86 | |||||||||
TJX Cos., Inc. (The) | 1,181 | 84 | |||||||||
Shares | Value (000) | ||||||||||
Twitter, Inc. (a) | 5,054 | $ | 117 | ||||||||
United Technologies Corp. | 883 | 85 | |||||||||
Visa, Inc., Class A | 1,785 | 138 | |||||||||
Walgreens Boots Alliance, Inc. | 1,571 | 134 | |||||||||
Walt Disney Co. (The) | 690 | 72 | |||||||||
Zoetis, Inc. | 2,594 | 124 | |||||||||
3,228 | |||||||||||
Total Common Stocks (Cost $4,831) | 5,360 | ||||||||||
| Notional Amount | |||||||||||
Call Option Purchased (0.2%) | |||||||||||
Foreign Currency Option (0.2%) | |||||||||||
| USD/CNY June 2016 @ CNY 6.70, Royal Bank of Scotland (Cost $2) | 630,774 | 11 | |||||||||
Shares | |||||||||||
Short-Term Investment (3.9%) | |||||||||||
Investment Company (3.9%) | |||||||||||
| Morgan Stanley Institutional Liquidity Funds — Money Market Portfolio — Institutional Class (See Note G) (Cost $222) | 222,230 | 222 | |||||||||
Total Investments (99.2%) (Cost $5,055) (b)(c) | 5,593 | ||||||||||
Other Assets in Excess of Liabilities (0.8%) | 47 | ||||||||||
Net Assets (100.0%) | $ | 5,640 | |||||||||
(a) Non-income producing security.
(b) The approximate fair value and percentage of net assets, $1,413,000 and 25.1%, respectively, represent the securities that have been fair valued under the fair valuation policy for international investments as described in Note A-1 within the Notes to the Financial Statements.
(c) At December 31, 2015, the aggregate cost for Federal income tax purposes is approximately $5,077,000. The aggregate gross unrealized appreciation is approximately $702,000 and the aggregate gross unrealized depreciation is approximately $186,000 resulting in net unrealized appreciation of approximately $516,000.
ADR American Depositary Receipt.
CNY — Chinese Yuan Renminbi
USD — United States Dollar
Portfolio Composition
Classification | Percentage of Total Investments | ||||||
Other* | 32.4 | % | |||||
Internet Software & Services | 20.0 | ||||||
Internet & Catalog Retail | 10.1 | ||||||
Food Products | 9.1 | ||||||
Information Technology Services | 8.5 | ||||||
Beverages | 7.3 | ||||||
Media | 7.1 | ||||||
Textiles, Apparel & Luxury Goods | 5.5 | ||||||
Total Investments | 100.0 | % | |||||
* Industries and/or investment types representing less than 5% of total investments.
The accompanying notes are an integral part of the financial statements.
6
Morgan Stanley Institutional Fund, Inc.
Annual Report — December 31, 2015
Global Advantage Portfolio
Statement of Assets and Liabilities | December 31, 2015 (000) | ||||||
Assets: | |||||||
Investments in Securities of Unaffiliated Issuers, at Value (Cost $4,833) | $ | 5,371 | |||||
Investment in Security of Affiliated Issuer, at Value (Cost $222) | 222 | ||||||
Total Investments in Securities, at Value (Cost $5,055) | 5,593 | ||||||
Foreign Currency, at Value (Cost —@) | — | @ | |||||
Due from Adviser | 47 | ||||||
Dividends Receivable | 2 | ||||||
Receivable from Affiliate | — | @ | |||||
Other Assets | 34 | ||||||
Total Assets | 5,676 | ||||||
Liabilities: | |||||||
Payable for Professional Fees | 16 | ||||||
Payable for Custodian Fees | 10 | ||||||
Payable for Transfer Agency Fees — Class I | — | @ | |||||
Payable for Transfer Agency Fees — Class A | — | @ | |||||
Payable for Transfer Agency Fees — Class L | — | @ | |||||
Payable for Transfer Agency Fees — Class C | — | @ | |||||
Payable for Shareholder Services Fees — Class A | 1 | ||||||
Payable for Distribution and Shareholder Services Fees — Class L | — | @ | |||||
Payable for Distribution and Shareholder Services Fees — Class C | — | @ | |||||
Payable for Sub Transfer Agency Fees — Class I | — | @ | |||||
Payable for Sub Transfer Agency Fees — Class A | — | @ | |||||
Payable for Sub Transfer Agency Fees — Class L | — | @ | |||||
Payable for Sub Transfer Agency Fees — Class C | — | @ | |||||
Payable for Administration Fees | — | @ | |||||
Other Liabilities | 9 | ||||||
Total Liabilities | 36 | ||||||
Net Assets | $ | 5,640 | |||||
Net Assets Consist Of: | |||||||
Paid-in-Capital | $ | 5,052 | |||||
Accumulated Net Investment Loss | (4 | ) | |||||
Accumulated Net Realized Gain | 54 | ||||||
Unrealized Appreciation (Depreciation) on: | |||||||
Investments | 538 | ||||||
Foreign Currency Translations | (— | @) | |||||
Net Assets | $ | 5,640 | |||||
The accompanying notes are an integral part of the financial statements.
7
Morgan Stanley Institutional Fund, Inc.
Annual Report — December 31, 2015
Global Advantage Portfolio
Statement of Assets and Liabilities (cont'd) | December 31, 2015 (000) | ||||||
CLASS I: | |||||||
Net Assets | $ | 1,785 | |||||
| Shares Outstanding $0.001 par value shares of beneficial interest (unlimited shares authorized) (not in 000's) | 144,351 | ||||||
Net Asset Value, Offering and Redemption Price Per Share | $ | 12.36 | |||||
CLASS A: | |||||||
Net Assets | $ | 3,414 | |||||
| Shares Outstanding $0.001 par value shares of beneficial interest (unlimited shares authorized) (not in 000's) | 277,698 | ||||||
Net Asset Value, Redemption Price Per Share | $ | 12.29 | |||||
Maximum Sales Load | 5.25 | % | |||||
Maximum Sales Charge | $ | 0.68 | |||||
Maximum Offering Price Per Share | $ | 12.97 | |||||
CLASS L: | |||||||
Net Assets | $ | 382 | |||||
| Shares Outstanding $0.001 par value shares of beneficial interest (unlimited shares authorized) (not in 000's) | 31,567 | ||||||
Net Asset Value, Offering and Redemption Price Per Share | $ | 12.09 | |||||
CLASS C: | |||||||
Net Assets | $ | 59 | |||||
| Shares Outstanding $0.001 par value shares of beneficial interest (unlimited shares authorized) (not in 000's) | 4,899 | ||||||
Net Asset Value, Offering and Redemption Price Per Share | $ | 12.04 | |||||
@ Amount is less than $500.
The accompanying notes are an integral part of the financial statements.
8
Morgan Stanley Institutional Fund, Inc.
Annual Report — December 31, 2015
Global Advantage Portfolio
Statement of Operations | Year Ended December 31, 2015 (000) | ||||||
Investment Income: | |||||||
Dividends from Securities of Unaffiliated Issuers (Net of $4 of Foreign Taxes Withheld) | $ | 61 | |||||
Dividends from Security of Affiliated Issuer (Note G) | — | @ | |||||
Total Investment Income | 61 | ||||||
Expenses: | |||||||
Professional Fees | 93 | ||||||
Registration Fees | 42 | ||||||
Advisory Fees (Note B) | 37 | ||||||
Custodian Fees (Note F) | 32 | ||||||
Shareholder Reporting Fees | 8 | ||||||
Shareholder Services Fees — Class A (Note D) | 4 | ||||||
Distribution and Shareholder Services Fees — Class L (Note D) | 3 | ||||||
Distribution and Shareholder Services Fees — Class C (Note D) | — | @ | |||||
Transfer Agency Fees — Class I (Note E) | 2 | ||||||
Transfer Agency Fees — Class A (Note E) | 2 | ||||||
Transfer Agency Fees — Class L (Note E) | 2 | ||||||
Transfer Agency Fees — Class C (Note E) | 1 | ||||||
Pricing Fees | 6 | ||||||
Administration Fees (Note C) | 4 | ||||||
Sub Transfer Agency Fees — Class I | — | @ | |||||
Sub Transfer Agency Fees — Class A | 1 | ||||||
Sub Transfer Agency Fees — Class L | — | @ | |||||
Sub Transfer Agency Fees — Class C | — | @ | |||||
Directors' Fees and Expenses | 1 | ||||||
Other Expenses | 20 | ||||||
Total Expenses | 258 | ||||||
Expenses Reimbursed by Adviser (Note B) | (156 | ) | |||||
Waiver of Advisory Fees (Note B) | (37 | ) | |||||
Reimbursement of Class Specific Expenses — Class I (Note B) | (2 | ) | |||||
Reimbursement of Class Specific Expenses — Class A (Note B) | (1 | ) | |||||
Reimbursement of Class Specific Expenses — Class L (Note B) | (1 | ) | |||||
Reimbursement of Class Specific Expenses — Class C (Note B) | (1 | ) | |||||
Rebate from Morgan Stanley Affiliate (Note G) | (— | @) | |||||
Net Expenses | 60 | ||||||
Net Investment Income | 1 | ||||||
Realized Gain (Loss): | |||||||
Investments Sold | 325 | ||||||
Foreign Currency Transactions | (2 | ) | |||||
Net Realized Gain | 323 | ||||||
Change in Unrealized Appreciation (Depreciation): | |||||||
Investments | (27 | ) | |||||
Foreign Currency Translations | (— | @) | |||||
Net Change in Unrealized Appreciation (Depreciation) | (27 | ) | |||||
Net Realized Gain and Change in Unrealized Appreciation (Depreciation) | 296 | ||||||
Net Increase in Net Assets Resulting from Operations | $ | 297 | |||||
@ Amount is less than $500.
The accompanying notes are an integral part of the financial statements.
9
Morgan Stanley Institutional Fund, Inc.
Annual Report — December 31, 2015
Global Advantage Portfolio
Statements of Changes in Net Assets | Year Ended December 31, 2015 (000) | Year Ended December 31, 2014 (000) | |||||||||
Increase (Decrease) in Net Assets: | |||||||||||
Operations: | |||||||||||
Net Investment Income | $ | 1 | $ | 13 | |||||||
Net Realized Gain | 323 | 272 | |||||||||
Net Change in Unrealized Appreciation (Depreciation) | (27 | ) | (258 | ) | |||||||
Net Increase in Net Assets Resulting from Operations | 297 | 27 | |||||||||
Distributions from and/or in Excess of: | |||||||||||
Class I: | |||||||||||
Net Investment Income | (7 | ) | (2 | ) | |||||||
Net Realized Gain | (148 | ) | (221 | ) | |||||||
Class A: | |||||||||||
Net Investment Income | — | (1 | ) | ||||||||
Net Realized Gain | (172 | ) | (58 | ) | |||||||
Class L: | |||||||||||
Net Investment Income | — | (— | @) | ||||||||
Net Realized Gain | (27 | ) | (24 | ) | |||||||
Class C: | |||||||||||
Net Investment Income | (— | @) | — | ||||||||
Net Realized Gain | (3 | ) | — | ||||||||
Total Distributions | (357 | ) | (306 | ) | |||||||
Capital Share Transactions:(1) | |||||||||||
Class I: | |||||||||||
Subscribed | 497 | 1,143 | |||||||||
Distributions Reinvested | 131 | 176 | |||||||||
Redeemed | (2,065 | ) | (805 | ) | |||||||
Class A: | |||||||||||
Subscribed | 2,665 | 500 | |||||||||
Distributions Reinvested | 155 | 41 | |||||||||
Redeemed | (116 | ) | (378 | ) | |||||||
Class L: | |||||||||||
Subscribed | 128 | 108 | |||||||||
Distributions Reinvested | 18 | 15 | |||||||||
Redeemed | (86 | ) | (15 | ) | |||||||
Class C: | |||||||||||
Subscribed | 62 | * | — | ||||||||
Distributions Reinvested | 2 | * | — | ||||||||
Redeemed | (— | @)* | — | ||||||||
Net Increase in Net Assets Resulting from Capital Share Transactions | 1,391 | 785 | |||||||||
Total Increase in Net Assets | 1,331 | 506 | |||||||||
Net Assets: | |||||||||||
Beginning of Period | 4,309 | 3,803 | |||||||||
| End of Period (Including Accumulated Net Investment Loss and Accumulated Undistributed Net Investment Income of $(4) and $8) | $ | 5,640 | $ | 4,309 | |||||||
The accompanying notes are an integral part of the financial statements.
10
Morgan Stanley Institutional Fund, Inc.
Annual Report — December 31, 2015
Global Advantage Portfolio
Statements of Changes in Net Assets (cont'd) | Year Ended December 31, 2015 (000) | Year Ended December 31, 2014 (000) | |||||||||
(1) Capital Share Transactions: | |||||||||||
Class I: | |||||||||||
Shares Subscribed | 37 | 84 | |||||||||
Shares Issued on Distributions Reinvested | 10 | 14 | |||||||||
Shares Redeemed | (152 | ) | (60 | ) | |||||||
Net Increase (Decrease) in Class I Shares Outstanding | (105 | ) | 38 | ||||||||
Class A: | |||||||||||
Shares Subscribed | 212 | 37 | |||||||||
Shares Issued on Distributions Reinvested | 12 | 3 | |||||||||
Shares Redeemed | (9 | ) | (28 | ) | |||||||
Net Increase in Class A Shares Outstanding | 215 | 12 | |||||||||
Class L: | |||||||||||
Shares Subscribed | 10 | 8 | |||||||||
Shares Issued on Distributions Reinvested | 1 | 1 | |||||||||
Shares Redeemed | (6 | ) | (1 | ) | |||||||
Net Increase in Class L Shares Outstanding | 5 | 8 | |||||||||
Class C: | |||||||||||
Shares Subscribed | 5 | * | — | ||||||||
Shares Issued on Distributions Reinvested | — | @@* | — | ||||||||
Shares Redeemed | (— | @@)* | — | ||||||||
Net Increase in Class C Shares Outstanding | 5 | — | |||||||||
@ Amount is less than $500.
@@ Amount is less than 500 shares.
* For the period April 30, 2015 through December 31, 2015.
The accompanying notes are an integral part of the financial statements.
11
Morgan Stanley Institutional Fund, Inc.
Annual Report — December 31, 2015
Financial Highlights
Global Advantage Portfolio
Class I | |||||||||||||||||||||||
Year Ended December 31, | |||||||||||||||||||||||
Selected Per Share Data and Ratios | 2015 | 2014 | 2013 | 2012 | 2011 | ||||||||||||||||||
Net Asset Value, Beginning of Period | $ | 12.74 | $ | 13.57 | $ | 11.37 | $ | 9.97 | $ | 10.01 | |||||||||||||
Income (Loss) from Investment Operations: | |||||||||||||||||||||||
Net Investment Income† | 0.05 | 0.05 | 0.04 | 0.16 | 0.06 | ||||||||||||||||||
Net Realized and Unrealized Gain (Loss) | 0.46 | 0.04 | 3.27 | 2.12 | (0.03 | ) | |||||||||||||||||
Total from Investment Operations | 0.51 | 0.09 | 3.31 | 2.28 | 0.03 | ||||||||||||||||||
Distributions from and/or in Excess of: | |||||||||||||||||||||||
Net Investment Income | (0.03 | ) | (0.01 | ) | (0.08 | ) | (0.12 | ) | (0.07 | ) | |||||||||||||
Net Realized Gain | (0.86 | ) | (0.91 | ) | (1.03 | ) | (0.76 | ) | — | ||||||||||||||
Total Distributions | (0.89 | ) | (0.92 | ) | (1.11 | ) | (0.88 | ) | (0.07 | ) | |||||||||||||
Net Asset Value, End of Period | $ | 12.36 | $ | 12.74 | $ | 13.57 | $ | 11.37 | $ | 9.97 | |||||||||||||
Total Return++ | 3.85 | % | 0.83 | % | 29.71 | % | 22.83 | % | 0.34 | % | |||||||||||||
Ratios and Supplemental Data: | |||||||||||||||||||||||
Net Assets, End of Period (Thousands) | $ | 1,785 | $ | 3,181 | $ | 2,868 | $ | 1,129 | $ | 1,603 | |||||||||||||
Ratio of Expenses to Average Net Assets (1) | 1.11 | %+^^ | 1.30 | %+ | 1.29 | %+ | 1.30 | %+ | 1.30 | %+ | |||||||||||||
Ratio of Net Investment Income to Average Net Assets (1) | 0.37 | %+ | 0.40 | %+ | 0.29 | %+ | 1.39 | %+ | 0.57 | %+ | |||||||||||||
Ratio of Rebate from Morgan Stanley Affiliates to Average Net Assets | 0.00 | %§ | 0.00 | %§ | 0.01 | % | 0.00 | %§ | 0.00 | %§ | |||||||||||||
Portfolio Turnover Rate | 90 | % | 46 | % | 57 | % | 63 | % | 42 | % | |||||||||||||
(1) Supplemental Information on the Ratios to Average Net Assets: | |||||||||||||||||||||||
Ratios Before Expense Limitation: | |||||||||||||||||||||||
Expenses to Average Net Assets | 5.38 | % | 5.31 | % | 8.07 | % | 7.28 | % | 7.31 | % | |||||||||||||
Net Investment Loss to Average Net Assets | (3.90 | )% | (3.61 | )% | (6.49 | )% | (4.59 | )% | (5.44 | )% | |||||||||||||
† Per share amount is based on average shares outstanding.
++ Calculated based on the net asset value as of the last business day of the period.
+ The Ratios of Expenses and Net Investment Income reflect the rebate of certain Portfolio expenses in connection with the investments in Morgan Stanley affiliates during the period. The effect of the rebate on the ratios is disclosed in the above table as "Ratio of Rebate from Morgan Stanley Affiliates to Average Net Assets."
^^ Effective January 23, 2015, the Adviser has agreed to limit the ratio of expenses to average net assets to the maximum ratio of 1.10% for Class I Shares. Prior to January 23, 2015, the maximum ratio was 1.30% for Class I Shares.
§ Amount is less than 0.005%.
The accompanying notes are an integral part of the financial statements.
12
Morgan Stanley Institutional Fund, Inc.
Annual Report — December 31, 2015
Financial Highlights
Global Advantage Portfolio
Class A | |||||||||||||||||||||||
Year Ended December 31, | |||||||||||||||||||||||
Selected Per Share Data and Ratios | 2015 | 2014 | 2013 | 2012 | 2011 | ||||||||||||||||||
Net Asset Value, Beginning of Period | $ | 12.70 | $ | 13.57 | $ | 11.36 | $ | 9.97 | $ | 10.01 | |||||||||||||
Income (Loss) from Investment Operations: | |||||||||||||||||||||||
Net Investment Income (Loss)† | (0.04 | ) | 0.01 | (0.04 | ) | 0.13 | 0.03 | ||||||||||||||||
Net Realized and Unrealized Gain (Loss) | 0.49 | 0.04 | 3.31 | 2.11 | (0.02 | ) | |||||||||||||||||
Total from Investment Operations | 0.45 | 0.05 | 3.27 | 2.24 | 0.01 | ||||||||||||||||||
Distributions from and/or in Excess of: | |||||||||||||||||||||||
Net Investment Income | — | (0.01 | ) | (0.03 | ) | (0.09 | ) | (0.05 | ) | ||||||||||||||
Net Realized Gain | (0.86 | ) | (0.91 | ) | (1.03 | ) | (0.76 | ) | — | ||||||||||||||
Total Distributions | (0.86 | ) | (0.92 | ) | (1.06 | ) | (0.85 | ) | (0.05 | ) | |||||||||||||
Net Asset Value, End of Period | $ | 12.29 | $ | 12.70 | $ | 13.57 | $ | 11.36 | $ | 9.97 | |||||||||||||
Total Return++ | 3.40 | % | 0.46 | % | 29.48 | % | 22.44 | % | 0.07 | % | |||||||||||||
Ratios and Supplemental Data: | |||||||||||||||||||||||
Net Assets, End of Period (Thousands) | $ | 3,414 | $ | 790 | $ | 681 | $ | 114 | $ | 100 | |||||||||||||
Ratio of Expenses to Average Net Assets (1) | 1.45 | %+^^^ | 1.65 | %+ | 1.60 | %+^^ | 1.55 | %+ | 1.55 | %+ | |||||||||||||
Ratio of Net Investment Income (Loss) to Average Net Assets (1) | (0.34 | )%+ | 0.05 | %+ | (0.35 | )%+ | 1.14 | %+ | 0.32 | %+ | |||||||||||||
Ratio of Rebate from Morgan Stanley Affiliates to Average Net Assets | 0.01 | % | 0.00 | %§ | 0.01 | % | 0.00 | %§ | 0.00 | %§ | |||||||||||||
Portfolio Turnover Rate | 90 | % | 46 | % | 57 | % | 63 | % | 42 | % | |||||||||||||
(1) Supplemental Information on the Ratios to Average Net Assets: | |||||||||||||||||||||||
Ratios Before Expense Limitation: | |||||||||||||||||||||||
Expenses to Average Net Assets | 5.92 | % | 5.79 | % | 8.43 | % | 7.53 | % | 7.56 | % | |||||||||||||
Net Investment Loss to Average Net Assets | (4.81 | )% | (4.09 | )% | (7.18 | )% | (4.84 | )% | (5.69 | )% | |||||||||||||
† Per share amount is based on average shares outstanding.
++ Calculated based on the net asset value which does not reflect sales charges, if applicable, as of the last business day of the period.
+ The Ratios of Expenses and Net Investment Income (Loss) reflect the rebate of certain Portfolio expenses in connection with the investments in Morgan Stanley affiliates during the period. The effect of the rebate on the ratios is disclosed in the above table as "Ratio of Rebate from Morgan Stanley Affiliates to Average Net Assets."
^^ Effective September 16, 2013, the Adviser has agreed to limit the ratio of expenses to average net assets to the maximum ratios of 1.65% for Class A shares. Prior to September 16, 2013, the maximum ratio was 1.55% for Class A shares.
^^^ Effective January 23, 2015, the Adviser has agreed to limit the ratio of expenses to average net assets to the maximum ratio of 1.45% for Class A Shares. Prior to January 23, 2015, the maximum ratio was 1.65% for Class A Shares.
§ Amount is less than 0.005%.
The accompanying notes are an integral part of the financial statements.
13
Morgan Stanley Institutional Fund, Inc.
Annual Report — December 31, 2015
Financial Highlights
Global Advantage Portfolio
Class L | |||||||||||||||||||||||
Year Ended December 31, | |||||||||||||||||||||||
Selected Per Share Data and Ratios | 2015 | 2014 | 2013 | 2012 | 2011 | ||||||||||||||||||
Net Asset Value, Beginning of Period | $ | 12.56 | $ | 13.50 | $ | 11.35 | $ | 9.96 | $ | 10.01 | |||||||||||||
Income (Loss) from Investment Operations: | |||||||||||||||||||||||
Net Investment Income (Loss)† | (0.08 | ) | (0.06 | ) | (0.09 | ) | 0.07 | (0.02 | ) | ||||||||||||||
Net Realized and Unrealized Gain (Loss) | 0.47 | 0.04 | 3.28 | 2.11 | (0.02 | ) | |||||||||||||||||
Total from Investment Operations | 0.39 | (0.02 | ) | 3.19 | 2.18 | (0.04 | ) | ||||||||||||||||
Distributions from and/or in Excess of: | |||||||||||||||||||||||
Net Investment Income | — | (0.01 | ) | (0.01 | ) | (0.03 | ) | (0.01 | ) | ||||||||||||||
Net Realized Gain | (0.86 | ) | (0.91 | ) | (1.03 | ) | (0.76 | ) | — | ||||||||||||||
Total Distributions | (0.86 | ) | (0.92 | ) | (1.04 | ) | (0.79 | ) | (0.01 | ) | |||||||||||||
Net Asset Value, End of Period | $ | 12.09 | $ | 12.56 | $ | 13.50 | $ | 11.35 | $ | 9.96 | |||||||||||||
Total Return++ | 2.96 | % | (0.07 | )% | 28.78 | % | 21.89 | % | (0.44 | )% | |||||||||||||
Ratios and Supplemental Data: | |||||||||||||||||||||||
Net Assets, End of Period (Thousands) | $ | 382 | $ | 338 | $ | 254 | $ | 113 | $ | 100 | |||||||||||||
Ratio of Expenses to Average Net Assets (1) | 1.96 | %+^^^ | 2.15 | %+ | 2.09 | %+^^ | 2.05 | %+ | 2.05 | %+ | |||||||||||||
Ratio of Net Investment Income (Loss) to Average Net Assets (1) | (0.60 | )%+ | (0.45 | )%+ | (0.71 | )%+ | 0.64 | %+ | (0.18 | )%+ | |||||||||||||
Ratio of Rebate from Morgan Stanley Affiliates to Average Net Assets | 0.00 | %§ | 0.00 | %§ | 0.01 | % | 0.00 | %§ | 0.00 | %§ | |||||||||||||
Portfolio Turnover Rate | 90 | % | 46 | % | 57 | % | 63 | % | 42 | % | |||||||||||||
(1) Supplemental Information on the Ratios to Average Net Assets: | |||||||||||||||||||||||
Ratios Before Expense Limitation: | |||||||||||||||||||||||
Expenses to Average Net Assets | 6.58 | % | 6.55 | % | 9.07 | % | 8.03 | % | 8.06 | % | |||||||||||||
Net Investment Loss to Average Net Assets | (5.22 | )% | (4.85 | )% | (7.69 | )% | (5.34 | )% | (6.19 | )% | |||||||||||||
† Per share amount is based on average shares outstanding.
++ Calculated based on the net asset value as of the last business day of the period.
+ The Ratios of Expenses and Net Investment Income (Loss) reflect the rebate of certain Portfolio expenses in connection with the investments in Morgan Stanley affiliates during the period. The effect of the rebate on the ratios is disclosed in the above table as "Ratio of Rebate from Morgan Stanley Affiliates to Average Net Assets."
^^ Effective September 16, 2013, the Adviser has agreed to limit the ratio of expenses to average net assets to the maximum ratio of 2.15% for Class L shares. Prior to September 16, 2013, the maximum ratio was 2.05% for Class L shares.
^^^ Effective January 23, 2015, the Adviser has agreed to limit the ratio of expenses to average net assets to the maximum ratio of 1.95% for Class L Shares. Prior to January 23, 2015, the maximum ratio was 2.15% for Class L Share.
§ Amount is less than 0.005%.
The accompanying notes are an integral part of the financial statements.
14
Morgan Stanley Institutional Fund, Inc.
Annual Report — December 31, 2015
Financial Highlights
Global Advantage Portfolio
Class C | |||||||
Selected Per Share Data and Ratios | Period from April 30, 2015^ to December 31, 2015 | ||||||
Net Asset Value, Beginning of Period | $ | 13.30 | |||||
Loss from Investment Operations: | |||||||
Net Investment Loss† | (0.11 | ) | |||||
Net Realized and Unrealized Loss | (0.26 | ) | |||||
Total from Investment Operations | (0.37 | ) | |||||
Distributions from and/or in Excess of: | |||||||
Net Investment Income | (0.03 | ) | |||||
Net Realized Gain | (0.86 | ) | |||||
Total Distributions | (0.89 | ) | |||||
Net Asset Value, End of Period | $ | 12.04 | |||||
Total Return++ | (2.94 | )%# | |||||
Ratios and Supplemental Data: | |||||||
Net Assets, End of Period (Thousands) | $ | 59 | |||||
Ratios of Expenses to Average Net Assets (1) | 2.20 | %+* | |||||
Ratio of Net Investment Loss to Average Net Assets Gain (1) | (1.33 | )%+* | |||||
Ratio of Rebate from Morgan Stanley Affiliates to Average Net Assets | 0.00 | %§* | |||||
Portfolio Turnover Rate | 90 | % | |||||
(1) Supplemental Information on the Ratios to Average Net Assets: | |||||||
Ratios Before Expense Limitation: | |||||||
Expense to Average Net Assets | 12.84 | %* | |||||
Net Investment Loss to Average Net Assets | (11.97 | )%* | |||||
^ Commencement of Offering.
† Per share amount is based on average shares outstanding.
++ Calculated based on the net asset value which does not reflect sales charges, if applicable, as of the last business day of the period.
+ The Ratios of Expenses and Net Investment Loss reflect the rebate of certain Portfolio expenses in connection with the investments in Morgan Stanley affiliates during the period. The effect of the rebate on the ratios is disclosed in the above table as "Ratio of Rebate from Morgan Stanley Affiliates to Average Net Assets."
# Not Annualized.
* Annualized.
The accompanying notes are an integral part of the financial statements.
15
Morgan Stanley Institutional Fund, Inc.
Annual Report — December 31, 2015
Notes to Financial Statements
Morgan Stanley Institutional Fund, Inc. (the "Fund") is registered under the Investment Company Act of 1940, as amended (the "Act"), as an open-end management investment company. The Fund is comprised of twenty-six separate, active, diversified and non-diversified portfolios (individually referred to as a "Portfolio", collectively as the "Portfolios"). The Fund applies investment company accounting and reporting guidance.
The accompanying financial statements relate to the Global Advantage Portfolio. The Portfolio seeks long-term capital appreciation by investing primarily in established companies located throughout the world, with capitalizations within the range of companies included in the MSCI All Country World Index.
The Portfolio offers four classes of shares — Class I, Class A, Class L and Class C. On April 30, 2015, the Portfolio commenced offering Class C shares and suspended offering Class L shares. Existing Class L shareholders may invest through reinvestment of dividends and distributions.
A. Significant Accounting Policies: The following significant accounting policies are in conformity with U.S. generally accepted accounting principles ("GAAP"). Such policies are consistently followed by the Fund in the preparation of its financial statements. GAAP may require management to make estimates and assumptions that affect the reported amounts and disclosures in the financial statements. Actual results may differ from those estimates.
1. Security Valuation: (1) An equity portfolio security listed or traded on an exchange is valued at its latest reported sales price (or at the exchange official closing price if such exchange reports an official closing price), if there were no sales on a given day, the security is valued at the mean between the last reported bid and asked prices; (2) all other equity portfolio securities for which over-the-counter ("OTC") market quotations are readily available are valued at its latest reported sales price. In cases where a security is traded on more than one exchange, the security is valued on the exchange designated as the primary market; (3) listed options are valued at the last reported sales price on the exchange on which they are listed (or at the exchange official closing price if such exchange reports an official closing price). If an official closing price or last reported sales price is unavailable, the listed option should be fair valued at the mean between their latest bid and asked price. Unlisted options are valued by an outside pricing service approved by the Fund's
Board of Directors (the "Directors") or quotes from a broker or dealer; (4) when market quotations are not readily available, including circumstances under which Morgan Stanley Investment Management Inc. (the "Adviser") determines that the closing price, last sale price or the mean between the last reported bid and asked prices are not reflective of a security's market value, portfolio securities are valued at their fair value as determined in good faith under procedures established by and under the general supervision of the Directors. Occasionally, developments affecting the closing prices of securities and other assets may occur between the times at which valuations of such securities are determined (that is, close of the foreign market on which the securities trade) and the close of business of the New York Stock Exchange ("NYSE"). If developments occur during such periods that are expected to materially affect the value of such securities, such valuations may be adjusted to reflect the estimated fair value of such securities as of the close of the NYSE, as determined in good faith by the Directors or by the Adviser using a pricing service and/or procedures approved by the Directors; (5) quotations of foreign portfolio securities, other assets and liabilities and forward contracts stated in foreign currency are translated into U.S. dollar equivalents at the prevailing market rates prior to the close of the NYSE; (6) investments in mutual funds, including the Morgan Stanley Institutional Liquidity Funds, are valued at the net asset value ("NAV") as of the close of each business day; and (7) short-term debt securities with remaining maturities of 60 days or less at the time of purchase may be valued at amortized cost, unless the Adviser determines such valuation does not reflect the securities' market value, in which case these securities will be valued at their fair market value determined by the Adviser.
The Directors have responsibility for determining in good faith the fair value of the investments, and the Directors may appoint others, such as the Fund's Adviser or a valuation committee, to assist the Directors in determining fair value and to make the actual calculations pursuant to the fair valuation methodologies previously approved by the Directors. Under procedures approved by the Directors, the Fund's Adviser has formed a Valuation Committee whose members are approved by the Directors. The Valuation Committee provides administration and oversight of the Fund's valuation policies and procedures, which are reviewed at
16
Morgan Stanley Institutional Fund, Inc.
Annual Report — December 31, 2015
Notes to Financial Statements (cont'd)
least annually by the Directors. These procedures allow the Fund to utilize independent pricing services, quotations from securities and financial instrument dealers, and other market sources to determine fair value.
The Fund has procedures to determine the fair value of securities and other financial instruments for which market prices are not readily available. Under these procedures, the Valuation Committee convenes on a regular and ad hoc basis to review such securities and considers a number of factors, including valuation methodologies and significant unobservable valuation inputs, when arriving at fair value. The Valuation Committee may employ a market-based approach which may use related or comparable assets or liabilities, recent transactions, market multiples, book values, and other relevant information for the investment to determine the fair value of the investment. An income-based valuation approach may also be used in which the anticipated future cash flows of the investment are discounted to calculate fair value. Discounts may also be applied due to the nature or duration of any restrictions on the disposition of the investments. Due to the inherent uncertainty of valuations of such investments, the fair values may differ significantly from the values that would have been used had an active market existed. The Valuation Committee employs various methods for calibrating these valuation approaches including a regular review of valuation methodologies, key inputs and assumptions, transactional back-testing or disposition analysis, and reviews of any related market activity.
2. Fair Value Measurement: Financial Accounting Standards Board ("FASB") Accounting Standards CodificationTM ("ASC") 820, "Fair Value Measurement" ("ASC 820"), defines fair value as the value that the Fund would receive to sell an investment or pay to transfer a liability in a timely transaction with an independent buyer in the principal market, or in the absence of a principal market the most advantageous market for the investment or liability. ASC 820 establishes a three-tier hierarchy to distinguish between (1) inputs that reflect the assumptions market participants would use in valuing an asset or liability developed based on market data obtained from sources independent of the reporting entity (observable inputs) and (2) inputs that reflect the reporting entity's own assumptions about the assumptions market participants would use
in valuing an asset or liability developed based on the best information available in the circumstances (unobservable inputs) and to establish classification of fair value measurements for disclosure purposes. Various inputs are used in determining the value of the Fund's investments. The inputs are summarized in the three broad levels listed below.
• Level 1 – unadjusted quoted prices in active markets for identical investments
• Level 2 – other significant observable inputs (including quoted prices for similar investments, interest rates, prepayment speeds, credit risk, etc.)
• Level 3 – significant unobservable inputs including the Fund's own assumptions in determining the fair value of investments. Factors considered in making this determination may include, but are not limited to, information obtained by contacting the issuer, analysts, or the appropriate stock exchange (for exchange-traded securities), analysis of the issuer's financial statements or other available documents and, if necessary, available information concerning other securities in similar circumstances
The inputs or methodology used for valuing securities are not necessarily an indication of the risk associated with investing in those securities and the determination of the significance of a particular input to the fair value measurement in its entirety requires judgment and considers factors specific to each security.
The following is a summary of the inputs used to value the Portfolio's investments as of December 31, 2015.
Investment Type | Level 1 Unadjusted quoted prices (000) | Level 2 Other significant observable inputs (000) | Level 3 Significant unobservable inputs (000) | Total (000) | |||||||||||||||
Assets: | |||||||||||||||||||
Common Stocks | |||||||||||||||||||
Aerospace & Defense | $ | 85 | $ | — | $ | — | $ | 85 | |||||||||||
Beverages | 324 | 87 | — | 411 | |||||||||||||||
Chemicals | — | 46 | — | 46 | |||||||||||||||
| Commercial Services & Supplies | — | 58 | — | 58 | |||||||||||||||
| Diversified Financial Services | 170 | 81 | — | 251 | |||||||||||||||
Food & Staples Retailing | 134 | — | — | 134 | |||||||||||||||
17
Morgan Stanley Institutional Fund, Inc.
Annual Report — December 31, 2015
Notes to Financial Statements (cont'd)
Investment Type | Level 1 Unadjusted quoted prices (000) | Level 2 Other significant observable inputs (000) | Level 3 Significant unobservable inputs (000) | Total (000) | |||||||||||||||
Common Stocks (cont'd) | |||||||||||||||||||
Food Products | $ | 373 | $ | 134 | $ | — | $ | 507 | |||||||||||
Household Products | — | 131 | — | 131 | |||||||||||||||
| Information Technology Services | 477 | — | — | 477 | |||||||||||||||
Internet & Catalog Retail | 567 | — | — | 567 | |||||||||||||||
| Internet Software & Services | 1,116 | — | — | 1,116 | |||||||||||||||
| Life Sciences Tools & Services | 86 | — | — | 86 | |||||||||||||||
Media | 149 | 246 | — | 395 | |||||||||||||||
Pharmaceuticals | 124 | — | — | 124 | |||||||||||||||
Professional Services | — | 81 | — | 81 | |||||||||||||||
Specialty Retail | 84 | 78 | — | 162 | |||||||||||||||
| Tech Hardware, Storage & Peripherals | 258 | — | — | 258 | |||||||||||||||
| Textiles, Apparel & Luxury Goods | — | 310 | — | 310 | |||||||||||||||
| Transportation Infrastructure | — | 161 | — | 161 | |||||||||||||||
Total Common Stocks | 3,947 | 1,413 | — | 5,360 | |||||||||||||||
Call Option Purchased | — | 11 | — | 11 | |||||||||||||||
Short-Term Investment | |||||||||||||||||||
Investment Company | 222 | — | — | 222 | |||||||||||||||
Total Assets | $ | 4,169 | $ | 1,424 | $ | — | $ | 5,593 | |||||||||||
Transfers between investment levels may occur as the markets fluctuate and/or the availability of data used in an investment's valuation changes. The Portfolio recognizes transfers between the levels as of the end of the period. As of December 31, 2015, the Portfolio did not have any investments transfer between investment levels. At December 31, 2015, the fair value of certain securities were adjusted due to developments which occurred between the time of the close of the foreign markets on which they trade and the close of business on the NYSE which resulted in their Level 2 classification.
3. Foreign Currency Translation and Foreign Investments: The books and records of the Portfolio are maintained in U.S. dollars. Foreign currency amounts are translated into U.S. dollars as follows:
– investments, other assets and liabilities at the prevailing rate of exchange on the valuation date;
– investment transactions and investment income at the prevailing rates of exchange on the dates of such transactions.
Although the net assets of the Portfolio are presented at the foreign exchange rates and market values at the close of the period, the Portfolio does not isolate that portion
of the results of operations arising as a result of changes in the foreign exchange rates from the fluctuations arising from changes in the market prices of securities held at period end. Similarly, the Portfolio does not isolate the effect of changes in foreign exchange rates from the fluctuations arising from changes in the market prices of securities sold during the period. Accordingly, realized and unrealized foreign currency gains (losses) on investments in securities are included in the reported net realized and unrealized gains (losses) on investment transactions and balances. However, pursuant to U.S. Federal income tax regulations, gains and losses from certain foreign currency transactions and the foreign currency portion of gains and losses realized on sales and maturities of foreign denominated debt securities are treated as ordinary income for U.S. Federal income tax purposes.
Net realized gains (losses) on foreign currency transactions represent net foreign exchange gains (losses) from foreign currency forward exchange contracts, disposition of foreign currencies, currency gains (losses) realized between the trade and settlement dates on securities transactions, and the difference between the amount of investment income and foreign withholding taxes recorded on the Portfolio's books and the U.S. dollar equivalent amounts actually received or paid. Net unrealized currency gains (losses) from valuing foreign currency denominated assets and liabilities at period end exchange rates are reflected as a component of unrealized appreciation (depreciation) in the Statement of Assets and Liabilities. The change in unrealized currency gains (losses) on foreign currency translations for the period is reflected in the Statement of Operations.
Foreign security and currency transactions may involve certain considerations and risks not typically associated with those of U.S. dollar denominated transactions as a result of, among other factors, fluctuations of exchange rates in relation to the U.S. dollar, the possibility of lower levels of governmental supervision and regulation of foreign securities markets and the possibility of political or economic instability.
Governmental approval for foreign investments may be required in advance of making an investment under certain circumstances in some countries, and the extent of foreign investments in domestic companies may be
18
Morgan Stanley Institutional Fund, Inc.
Annual Report — December 31, 2015
Notes to Financial Statements (cont'd)
subject to limitation in other countries. Foreign ownership limitations also may be imposed by the charters of individual companies to prevent, among other concerns, violations of foreign investment limitations. As a result, an additional class of shares (identified as "Foreign" in the Portfolio of Investments) may be created and offered for investment. The "local" and "foreign shares" market values may differ. In the absence of trading of the foreign shares in such markets, the Portfolio values the foreign shares at the closing exchange price of the local shares.
4. Derivatives: The Portfolio may, but is not required to, use derivative instruments for a variety of purposes, including hedging, risk management, portfolio management or to earn income. Derivatives are financial instruments whose value is based, in part, on the value of an underlying asset, interest rate, index or financial instrument. Prevailing interest rates and volatility levels, among other things, also affect the value of derivative instruments. A derivative instrument often has risks similar to its underlying asset and may have additional risks, including imperfect correlation between the value of the derivative and the underlying asset, risks of default by the counterparty to certain transactions, magnification of losses incurred due to changes in the market value of the securities, instruments, indices or interest rates to which the derivative instrument relates, risks that the transactions may not be liquid and risks arising from margin requirements. The use of derivatives involves risks that are different from, and possibly greater than, the risks associated with other portfolio investments. Derivatives may involve the use of highly specialized instruments that require investment techniques and risk analyses different from those associated with other portfolio investments. All of the Portfolio's holdings, including derivative instruments, are marked-to-market each day with the change in value reflected in unrealized appreciation (depreciation). Upon disposition, a realized gain or loss is recognized.
Certain derivative transactions may give rise to a form of leverage. Leverage magnifies the potential for gain and the risk of loss. Leverage associated with derivative transactions may cause the Portfolio to liquidate portfolio positions when it may not be advantageous to do so to satisfy its obligations or to meet earmarking or segregation requirements, pursuant to applicable Securities and Exchange Commission rules and regulations, or may cause the Portfolio to be more volatile than if the
Portfolio had not been leveraged. Although the Adviser seeks to use derivatives to further the Portfolio's investment objectives, there is no assurance that the use of derivatives will achieve this result.
Following is a description of the derivative instruments and techniques that the Portfolio used during the period and their associated risks:
Options: With respect to options, the Portfolio is subject to equity risk, interest rate risk and foreign currency exchange risk in the normal course of pursuing its investment objectives. If the Portfolio buys an option, it buys a legal contract giving it the right to buy or sell a specific amount of the underlying instrument or futures contract on the underlying instrument, at an agreed-upon price typically in exchange for a premium paid by the Portfolio. The Portfolio may purchase and/or sell put and call options. Purchasing call options tends to increase the Portfolio's exposure to the underlying (or similar) instrument. Purchasing put options tends to decrease the Portfolio's exposure to the underlying (or similar) instrument. When entering into purchased option contracts, the Portfolio bears the risk of interest or exchange rates or securities prices moving unexpectedly, in which case, the Portfolio may not achieve the anticipated benefits of the purchased option contracts; however the risk of loss is limited to the premium paid. Purchased options are reported as part of "Total Investments in Securities" in the Statement of Assets and Liabilities. Premium paid for purchasing options which expired are treated as realized losses. If the Portfolio sells an option, it sells to another party the right to buy from or sell to the Portfolio a specific amount of the underlying instrument or futures contract on the underlying instrument at an agreed-upon price typically in exchange for a premium received by the Portfolio. When options are purchased OTC, the Portfolio bears the risk that the counterparty that wrote the option will be unable or unwilling to perform its obligations under the option contract. Options may also be illiquid and the Portfolio may have difficulty closing out its position. A decision as to whether, when and how to use options involves the exercise of skill and judgment and even a well-conceived option transaction may be unsuccessful because of market behavior or unexpected events. The prices of options can be highly volatile and the use of options can lower total returns.
19
Morgan Stanley Institutional Fund, Inc.
Annual Report — December 31, 2015
Notes to Financial Statements (cont'd)
FASB ASC 815, "Derivatives and Hedging" ("ASC 815"), is intended to improve financial reporting about derivative instruments by requiring enhanced disclosures to enable investors to better understand how and why the Portfolio uses derivative instruments, how these derivative instruments are accounted for and their effects on the Portfolio's financial position and results of operations.
The following table sets forth the fair value of the Portfolio's derivative contracts by primary risk exposure as of December 31, 2015.
| Asset Derivatives Statement of Assets and Liabilities Location | Primary Risk Exposure | Value (000) | |||||||||||||
| Call Option Purchased | Investments, at Value (Call Option Purchased) | Currency Risk | $ | 11 | (a) | ||||||||||
(a) Amounts are included in Investments in Securities in the Statement of Assets and Liabilities.
The following tables set forth by primary risk exposure the Portfolio's realized gains (losses) and change in unrealized appreciation (depreciation) by type of derivative contract for the year ended December 31, 2015 in accordance with ASC 815.
Realized Gain (Loss) | |||||||||||
Primary Risk Exposure | Derivative Type | Value (000) | |||||||||
| Currency Risk | Investments (Call Option Purchased) | $ | (5 | )(b) | |||||||
(b) Amounts are included in Investments Sold in the Statement of Operations.
Change in Unrealized Appreciation (Depreciation) | |||||||||||
Primary Risk Exposure | Derivative Type | Value (000) | |||||||||
| Currency Risk | Investments (Call Option Purchased) | $ | 9 | (c) | |||||||
(c) Amounts are included in Investments in the Statement of Operations.
At December 31, 2015, the Portfolio's derivative assets and liabilities are as follows:
| Gross Amounts of Assets and Liabilities Presented in the Statement of Assets and Liabilities | |||||||||||
Derivatives | Assets(d) (000) | Liabilities(d) (000) | |||||||||
Call Option Purchased | $ | 11 | (a) | $ | — | ||||||
(a) Amounts are included in Investments in Securities in the Statement of Assets and Liabilities.
(d) Absent an event of default or early termination, OTC derivative assets and liabilities are presented gross and not offset in the Statement of Assets and Liabilities.
The Portfolio typically enters into International Swaps and Derivatives Association, Inc. Master Agreements ("ISDA Master Agreements") or similar master agreements (collectively, "Master Agreements") with its
contract counterparties for certain OTC derivatives in order to, among other things, reduce its credit risk to counterparties. ISDA Master Agreements include provisions for general obligations, representations, collateral and events of default or termination. Under an ISDA Master Agreement, the Portfolio typically may offset with the counterparty certain OTC derivative financial instruments' payables and/or receivables with collateral held and/or posted and create one single net payment (close-out netting) in the event of default, termination and/or potential deterioration in the credit quality of the counterparty. Various Master Agreements govern the terms of certain transactions with counterparties, including transactions such as swap, forward, repurchase and reverse repurchase agreements. These Master Agreements typically attempt to reduce the counterparty risk associated with such transactions by specifying credit protection mechanisms and providing standardization that improves legal certainty. Cross-termination provisions under Master Agreements typically provide that a default in connection with one transaction between the Portfolio and a counterparty gives the non-defaulting party the right to terminate any other transactions in place with the defaulting party to create one single net payment due to/due from the defaulting party and may be a feature in certain Master Agreements. In the event the Portfolio exercises its right to terminate a Master Agreement after a counterparty experiences a termination event as defined in the Master Agreement, the return of collateral with market value in excess of the Portfolio's net liability may be delayed or denied.
The following table presents derivative financial instruments that are subject to enforceable netting arrangements as of December 31, 2015.
Gross Amounts Not Offset in the Statement of Assets and Liabilities | |||||||||||||||||||
Counterparty | Gross Asset Derivatives Presented in Statement of Assets and Liabilities (000) | Financial Instrument (000) | Collateral Received (000) | Net Amount (not less than $0) (000) | |||||||||||||||
Royal Bank of Scotland | $ | 11 | $ | — | $ | — | $ | 11 | |||||||||||
For the year ended December 31, 2015, the approximate average monthly amount outstanding for each derivative type is as follows:
Call Option Purchased: | |||||||
Average monthly notional amount | 1,334,000 | ||||||
20
Morgan Stanley Institutional Fund, Inc.
Annual Report — December 31, 2015
Notes to Financial Statements (cont'd)
5. Indemnifications: The Fund enters into contracts that contain a variety of indemnifications. The Fund's maximum exposure under these arrangements is unknown. However, the Fund has not had prior claims or losses pursuant to these contracts and expects the risk of loss to be remote.
6. Dividends and Distributions to Shareholders: Dividend income and distributions to shareholders are recorded on the ex-dividend date. Dividends from net investment income, if any, are declared and paid annually. Net realized capital gains, if any, are distributed at least annually.
7. Security Transactions, Income and Expenses: Security transactions are accounted for on the trade date (date the order to buy or sell is executed). Realized gains and losses on the sale of investment securities are determined on the specific identified cost method. Dividend income and other distributions are recorded on the ex-dividend date (except for certain foreign dividends which may be recorded as soon as the Portfolio is informed of such dividends) net of applicable withholding taxes. Interest income is recognized on the accrual basis except where collection is in doubt. Discounts are accreted and premiums are amortized over the life of the respective securities. Most expenses of the Fund can be directly attributed to a particular Portfolio. Expenses which cannot be directly attributed are apportioned among the Portfolios based upon relative net assets or other appropriate methods. Income, expenses (other than class specific expenses — distribution and shareholder services, transfer agency and sub transfer agency fees) and realized and unrealized gains or losses are allocated to each class of shares based upon their relative net assets.
B. Advisory Fees: The Adviser, a wholly-owned subsidiary of Morgan Stanley, provides the Portfolio with advisory services under the terms of an Investment Advisory Agreement, paid quarterly, at the annual rate based on the daily net assets as follows:
| First $1 billion | Over $1 billion | ||||||
| 0.90 | % | 0.85 | % | ||||
Effective March 2, 2015, the Portfolio's annual rate based on the daily net assets was reduced and is as follows:
| First $1 billion | Over $1 billion | ||||||
| 0.80 | % | 0.75 | % | ||||
For the year ended December 31, 2015, the advisory fee rate (net of waivers/rebate) was equivalent to an annual effective rate of 0.00% of the Portfolio's average daily net assets.
The Adviser has agreed to reduce its advisory fee and/or reimburse the Portfolio so that total annual portfolio operating expenses, excluding certain investment related expenses, taxes, interest and other extraordinary expenses (including litigation), will not exceed 1.30% for Class I shares, 1.65% for Class A shares and 2.15% for Class L shares. Effective January 23, 2015, the Adviser has agreed to reduce its advisory fee and/or reimburse the Portfolio so that total annual portfolio operating expenses will not exceed 1.10% for Class I shares, 1.45% for Class A shares, 1.95% for Class L shares and 2.20% for Class C shares (Effective April 30, 2015). The fee waivers and/or expense reimbursements will continue for at least one year from the date of the Portfolio's prospectus or until such time as the Directors act to discontinue all or a portion of such waivers and/or reimbursements when they deem such action is appropriate. For the year ended December 31, 2015, approximately $37,000 of advisory fees were waived and approximately $161,000 of other expenses were reimbursed by the Adviser pursuant to this arrangement.
C. Administration Fees: The Adviser also serves as Administrator to the Fund and provides administrative services pursuant to an Administration Agreement for an annual fee, accrued daily and paid monthly, of 0.08% of the Portfolio's average daily net assets.
Under a Sub-Administration Agreement between the Administrator and State Street Bank and Trust Company ("State Street"), State Street provides certain administrative services to the Fund. For such services, the Administrator pays State Street a portion of the fee the Administrator receives from the Portfolio.
D. Distribution and Shareholder Services Fees: Morgan Stanley Distribution, Inc. ("MSDI" or the "Distributor"), a wholly-owned subsidiary of the Adviser and an indirect subsidiary of Morgan Stanley, serves as the Fund's Distributor of Portfolio shares pursuant to a Distribution Agreement. The Fund has adopted a Shareholder Services Plan with respect to Class A shares pursuant to Rule 12b-1 under the Act. Under the Shareholder Services Plan, the Portfolio pays the Distributor a shareholder services fee, accrued daily and paid monthly, at an annual rate of 0.25% of the Portfolio's average daily net assets attributable to Class A shares.
The Fund has adopted a Distribution and Shareholder Services Plan with respect to Class L shares pursuant to Rule 12b-1
21
Morgan Stanley Institutional Fund, Inc.
Annual Report — December 31, 2015
Notes to Financial Statements (cont'd)
under the Act. Under the Distribution and Shareholder Services Plan, the Portfolio pays the Distributor a distribution fee, accrued daily and paid monthly, at an annual rate of 0.50% and a shareholder services fee, accrued daily and paid monthly, at an annual rate of 0.25% of the Portfolio's average daily net assets attributable to Class L shares.
The Fund has adopted a Distribution and Shareholder Services Plan with respect to Class C shares pursuant to Rule 12b-1 under the Act. Under the Distribution and Shareholder Services Plan, the Portfolio pays the Distributor a distribution fee, accrued daily and paid monthly, at an annual rate of 0.75% and a shareholder services fee, accrued daily and paid monthly, at an annual rate of 0.25% of the Portfolio's average daily net assets attributable to Class C shares.
The distribution and shareholder services fees are used to support the expenses associated with servicing and maintaining accounts. The Distributor may compensate other parties for providing shareholder support services to investors who purchase Class A, Class L and Class C shares.
E. Dividend Disbursing and Transfer Agent: The Fund's dividend disbursing and transfer agent is Boston Financial Data Services, Inc. ("BFDS"). Pursuant to a Transfer Agency Agreement, the Fund pays BFDS a fee based on the number of classes, accounts and transactions relating to the Portfolios of the Fund.
F. Custodian Fees: State Street (the "Custodian") serves as Custodian for the Fund in accordance with a Custodian Agreement. The Custodian holds cash, securities, and other assets of the Fund as required by the Act. Custody fees are payable monthly based on assets held in custody, investment purchases and sales activity and account maintenance fees, plus reimbursement for certain out-of-pocket expenses.
G. Security Transactions and Transactions with Affiliates: For the year ended December 31, 2015, purchases and sales of investment securities for the Portfolio, other than long-term U.S. Government securities and short-term investments, were approximately $4,742,000 and $3,874,000, respectively. There were no purchases and sales of long-term U.S. Government securities for the year ended December 31, 2015.
The Portfolio invests in the Institutional Class of the Morgan Stanley Institutional Liquidity Funds — Money Market Portfolio (the "Liquidity Funds"), an open-end management investment company managed by the Adviser. Advisory fees
paid by the Portfolio are reduced by an amount equal to its pro-rata share of the advisory and administration fees paid by the Portfolio due to its investment in the Liquidity Funds. For the year ended December 31, 2015, advisory fees paid were reduced by less than $500 relating to the Portfolio's investment in the Liquidity Funds.
A summary of the Portfolio's transactions in shares of the Liquidity Funds during the year ended December 31, 2015 is as follows:
| Value December 31, 2014 (000) | Purchases at Cost (000) | Sales (000) | Dividend Income (000) | Value December 31, 2015 (000) | |||||||||||||||
| $ | 107 | $ | 3,483 | $ | 3,368 | $ | — | @ | $ | 222 | |||||||||
@ Amount is less than $500.
The Portfolio has an unfunded Deferred Compensation Plan (the "Compensation Plan"), which allows each independent Director to defer payment of all, or a portion, of the fees he or she receives for serving on the Board of Directors. Each eligible Director generally may elect to have the deferred amounts credited with a return equal to the total return on one or more of the Morgan Stanley funds that are offered as investment options under the Compensation Plan. Appreciation/depreciation and distributions received from these investments are recorded with an offsetting increase/decrease in the deferred compensation obligation and do not affect the NAV of the Portfolio.
H. Federal Income Taxes: It is the Portfolio's intention to continue to qualify as a regulated investment company and distribute all of its taxable and tax-exempt income. Accordingly, no provision for Federal income taxes is required in the financial statements.
The Portfolio may be subject to taxes imposed by countries in which it invests. Such taxes are generally based on income and/or capital gains earned or repatriated. Taxes are accrued based on net investment income, net realized gains and net unrealized appreciation as such income and/or gains are earned. Taxes may also be based on transactions in foreign currency and are accrued based on the value of investments denominated in such currency.
FASB ASC 740-10, "Income Taxes — Overall", sets forth a minimum threshold for financial statement recognition of the benefit of a tax position taken or expected to be taken in a tax return. Management has concluded there are no significant uncertain tax positions that would require recognition in the financial statements. If applicable, the Portfolio recognizes interest accrued related to unrecognized tax benefits in
22
Morgan Stanley Institutional Fund, Inc.
Annual Report — December 31, 2015
Notes to Financial Statements (cont'd)
"Interest Expense" and penalties in "Other Expenses" in the Statement of Operations. The Portfolio files tax returns with the U.S. Internal Revenue Service, New York and various states. Generally, each of the tax years in the four-year period ended December 31, 2015, remains subject to examination by taxing authorities.
The tax character of distributions paid may differ from the character of distributions shown in the Statements of Changes in Net Assets due to short-term capital gains being treated as ordinary income for tax purposes. The tax character of distributions paid during fiscal 2015 and 2014 was as follows:
| 2015 Distributions Paid From: | 2014 Distributions Paid From: | ||||||||||||||
| Ordinary Income (000) | Long-Term Capital Gain (000) | Ordinary Income (000) | Long-Term Capital Gain (000) | ||||||||||||
| $ | 7 | $ | 350 | $ | 58 | $ | 248 | ||||||||
The amount and character of income and gains to be distributed are determined in accordance with income tax regulations which may differ from GAAP. These book/tax differences are either considered temporary or permanent in nature.
Temporary differences are primarily due to differing book and tax treatments in the timing of the recognition of gains (losses) on certain investment transactions and the timing of the deductibility of certain expenses.
Permanent differences, primarily due to differing treatments of gains (losses) related to foreign currency transactions, a net operating loss and a nondeductible expense, resulted in the following reclassifications among the components of net assets at December 31, 2015:
| Accumulated Net Investment Loss (000) | Accumulated Net Realized Gain (000) | Paid-in- Capital (000) | |||||||||
| $ | (6 | ) | $ | 6 | $ | — | @ | ||||
At December 31, 2015, the components of distributable earnings for the Portfolio on a tax basis were as follows:
| Undistributed Ordinary Income (000) | Undistributed Long-Term Capital Gain (000) | ||||||
| $ | — | $ | 76 | ||||
Capital losses and specified ordinary losses, including currency losses, incurred after October 31 but within the taxable year are deemed to arise on the first day of the Portfolio's next taxable year. For the year ended December 31, 2015, the Portfolio
deferred to January 1, 2016 for U.S. Federal income tax purposes the following losses:
| Post-October Currency and Specified Ordinary Losses (000) | Post-October Capital Losses (000) | ||||||
| $ | 3 | $ | — | ||||
@ Amount is less than $500.
I. Other: At December 31, 2015, the Portfolio had record owners of 10% or greater. Investment activities of these shareholders could have a material impact on the Portfolio. The aggregate percentage of such owners was 70.4%.
23
Morgan Stanley Institutional Fund, Inc.
Annual Report — December 31, 2015
Report of Independent Registered Public Accounting Firm
To the Shareholders and Board of Directors of
Morgan Stanley Institutional Fund, Inc. —
Global Advantage Portfolio
We have audited the accompanying statement of assets and liabilities, including the portfolio of investments, of Global Advantage Portfolio (one of the portfolios constituting Morgan Stanley Institutional Fund, Inc.) (the "Portfolio") as of December 31, 2015, and the related statement of operations for the year then ended, the statements of changes in net assets for each of the two years in the period then ended and the financial highlights for each of the years or periods indicated therein. These financial statements and financial highlights are the responsibility of the Portfolio's management. Our responsibility is to express an opinion on these financial statements and financial highlights based on our audits.
We conducted our audits in accordance with the standards of the Public Company Accounting Oversight Board (United States). Those standards require that we plan and perform the audit to obtain reasonable assurance about whether the financial statements and financial highlights are free of material misstatement. We were not engaged to perform an audit of the Portfolio's internal control over financial reporting. Our audits included consideration of internal control over financial reporting as a basis for designing audit procedures that are appropriate in the circumstances, but not for the purpose of expressing an opinion on the effectiveness of the Portfolio's internal control over financial reporting. Accordingly, we express no such opinion. An audit also includes examining, on a test basis, evidence supporting the amounts and disclosures in the financial statements and financial highlights, assessing the accounting principles used and significant estimates made by management, and evaluating the overall financial statement presentation. Our procedures included confirmation of securities owned as of December 31, 2015, by correspondence with the custodian and others. We believe that our audits provide a reasonable basis for our opinion.
In our opinion, the financial statements and financial highlights referred to above present fairly, in all material respects, the financial position of Global Advantage Portfolio (one of the portfolios constituting Morgan Stanley Institutional Fund, Inc.) at December 31, 2015, the results of its operations for the year then ended, the changes in its net assets for each of the two years in the period then ended and the financial highlights for each of the years or periods indicated therein, in conformity with U.S. generally accepted accounting principles.

Boston, Massachusetts
February 26, 2016
24
Morgan Stanley Institutional Fund, Inc.
Annual Report — December 31, 2015
Federal Tax Notice (unaudited)
For Federal income tax purposes, the following information is furnished with respect to the distributions paid by the Portfolio during its taxable year ended December 31, 2015. For corporate shareholders, 100.0% of the dividends qualified for the dividends received deduction.
The Portfolio designated and paid approximately $350,000 as a long-term capital gain distribution.
For Federal income tax purposes, the following information is furnished with respect to the Portfolio's earnings for its taxable year ended December 31, 2015. When distributed, certain earnings may be subject to a maximum tax rate of 15% as provided for the Jobs and Growth Tax Relief Reconciliation Act of 2003. The Portfolio designated up to a maximum of approximately $7,000 as taxable at this lower rate.
In January, the Portfolio provides tax information to shareholders for the preceding calendar year.
25
Morgan Stanley Institutional Fund, Inc.
Annual Report — December 31, 2015
U.S. Privacy Policy (unaudited)
AN IMPORTANT NOTICE CONCERNING OUR U.S. PRIVACY POLICY
This privacy notice describes the U.S. privacy policy of Morgan Stanley Distribution, Inc., and the Morgan Stanley family of mutual funds ("us", "our", "we").
We are required by federal law to provide you with notice of our U.S. privacy policy ("Policy"). This Policy applies to both our current and former clients unless we state otherwise and is intended for individual clients who purchase products or receive services from us for personal, family or household purposes. This Policy is not applicable to partnerships, corporations, trusts or other non-individual clients or account holders, nor is this Policy applicable to individuals who are either beneficiaries of a trust for which we serve as trustee or participants in an employee benefit plan administered or advised by us. This Policy is, however, applicable to individuals who select us to be a custodian of securities or assets in individual retirement accounts, 401(k) accounts, or accounts subject to the Uniform Gifts to Minors Act.
This notice sets out our business practices to protect your privacy; how we collect and share personal information about you; and how you can limit our sharing or certain uses by others of this information. We may amend this Policy at any time, and will inform you of any changes to our Policy as required by law.
WE RESPECT YOUR PRIVACY
We appreciate that you have provided us with your personal financial information and understand your concerns about your information. We strive to safeguard the information our clients entrust to us. Protecting the confidentiality and security of client information is an important part of how we conduct our business.
This notice describes what personal information we collect about you, how we collect it, when we may share it with others, and how certain others may use it. It discusses the steps you may take to limit our sharing of certain information about you with our affiliated companies, including, but not limited to our affiliated banking businesses, brokerage firms and credit service affiliates. It also discloses how you may limit our affiliates' use of shared information for marketing purposes.
Throughout this Policy, we refer to the nonpublic information that personally identifies you as "personal information." We also use the term "affiliated company" in this notice. An affiliated company is a company in our family of companies and includes companies with the Morgan Stanley name. These affiliated companies are financial institutions such as broker-dealers, banks, investment advisers and credit card issuers. We refer to any company that is not an affiliated company as a nonaffiliated third party. For purposes of Section 5 of this notice, and your ability to limit certain uses of personal information by our affiliates, this notice applies to the use of personal information by our affiliated companies.
1. WHAT PERSONAL INFORMATION DO WE COLLECT FROM YOU?
We may collect the following types of information about you: (i) information provided by you, including information from applications and other forms we receive from you, (ii) information about your transactions with us or our affiliates, (iii) information about your transactions with nonaffiliated third parties, (iv) information from consumer reporting agencies, (v) information obtained from our websites, and (vi) information obtained from other sources. For example:
• We collect information such as your name, address, e-mail address, telephone/fax numbers, assets, income and investment objectives through applications and other forms you submit to us.
• We may obtain information about account balances, your use of account(s) and the types of products and services you prefer to receive from us through your dealings and transactions with us and other sources.
• We may obtain information about your creditworthiness and credit history from consumer reporting agencies.
• We may collect background information from and through third-party vendors to verify representations you have made and to comply with various regulatory requirements.
2. WHEN DO WE DISCLOSE PERSONAL INFORMATION WE COLLECT ABOUT YOU?
We may disclose personal information we collect about you in each of the categories listed above to affiliated and nonaffiliated third parties.
26
Morgan Stanley Institutional Fund, Inc.
Annual Report — December 31, 2015
U.S. Privacy Policy (unaudited) (cont'd)
a. Information We Disclose to Affiliated Companies.
We may disclose personal information that we collect about you to our affiliated companies to manage your account(s) effectively, to service and process your transactions, and to let you know about products and services offered by us and affiliated companies, to manage our business, and as otherwise required or permitted by law. Offers for products and services from affiliated companies are developed under conditions designed to safeguard your personal information.
b. Information We Disclose to Third Parties.
We may disclose personal information that we collect about you to nonaffiliated third parties to provide marketing services on our behalf or to other financial institutions with whom we have joint marketing agreements. We may also disclose all of the information we collect to other nonaffiliated third parties for our everyday business purposes, such as to process transactions, maintain account(s), respond to court orders and legal investigations, report to credit bureaus, offer our own products and services, protect against fraud, for institutional risk control, to perform services on our behalf, and as otherwise required or permitted by law.
When we share personal information about you with a nonaffiliated third party, they are required to limit their use of personal information about you to the particular purpose for which it was shared and they are not allowed to share personal information about you with others except to fulfill that limited purpose or as may be permitted or required by law.
3. HOW DO WE PROTECT THE SECURITY AND CONFIDENTIALITY OF PERSONAL INFORMATION WE COLLECT ABOUT YOU?
We maintain physical, electronic and procedural security measures that comply with applicable law and regulations to help safeguard the personal information we collect about you. We have internal policies governing the proper handling of client information by employees. Third parties that provide support or marketing services on our behalf may also receive personal information about you, and we require them to adhere to appropriate security standards with respect to such information.
4. HOW CAN YOU LIMIT OUR SHARING CERTAIN PERSONAL INFORMATION ABOUT YOU WITH OUR AFFILIATED COMPANIES FOR ELIGIBILITY DETERMINATION?
By following the opt-out procedures in Section 6 below, you may limit the extent to which we share with our affiliated companies, personal information that was collected to determine your eligibility for products and services such as your credit reports and other information that you have provided to us or that we may obtain from third parties ("eligibility information"). Eligibility information does not include your identification information or personal information pertaining to our transactions or experiences with you. Please note that, even if you direct us not to share eligibility information with our affiliated companies, we may still share your personal information, including eligibility information, with our affiliated companies under circumstances that are permitted under applicable law, such as to process transactions or to service your account.
5. HOW CAN YOU LIMIT THE USE OF CERTAIN PERSONAL INFORMATION ABOUT YOU BY OUR AFFILIATED COMPANIES FOR MARKETING?
By following the opt-out instructions in Section 6 below, you may limit our affiliated companies from marketing their products or services to you based on personal information we disclose to them. This information may include, for example, your income and account history with us. Please note that, even if you choose to limit our affiliated companies from using personal information about you that we may share with them for marketing their products and services to you, our affiliated companies may use your personal information that they obtain from us to market to you in circumstances permitted by law, such as if the affiliated party has its own relationship with you.
27
Morgan Stanley Institutional Fund, Inc.
Annual Report — December 31, 2015
U.S. Privacy Policy (unaudited) (cont'd)
6. HOW CAN YOU SEND US AN OPT-OUT INSTRUCTION?
If you wish to limit our sharing of eligibility information about you with our affiliated companies, or our affiliated companies' use of personal information for marketing purposes, as described in this notice, you may do so by:
• Calling us at (800) 548-7786
Monday–Friday between 8a.m. and 6p.m. (EST)
• Writing to us at the following address:
Boston Financial Data Services, Inc.
c/o Privacy Coordinator
P.O. Box 219804
Kansas City, Missouri 64121
If you choose to write to us, your request should include: your name, address, telephone number and account number(s) to which the opt-out applies and whether you are opting out with respect to sharing of eligibility information (Section 4 above), or information used for marketing (Section 5 above), or both. Written opt-out requests should not be sent with any other correspondence. In order to process your request, we require that the request be provided by you directly and not through a third party. Once you have informed us about your privacy preferences, your opt-out preference will remain in effect with respect to this Policy (as it may be amended) until you notify us otherwise. If you are a joint account owner, we will accept instructions from any one of you and apply those instructions to the entire account.
Please understand that if you limit our sharing or our affiliated companies' use of personal information, you and any joint account holder(s) may not receive information about our affiliated companies' products and services, including products or services that could help you manage your financial resources and achieve your investment objectives.
If you have more than one account or relationship with us, please specify the accounts to which you would like us to apply your privacy choices. If you have accounts or relationships with our affiliates, you may receive multiple privacy policies from them, and will need to separately notify those companies of your privacy choices for those accounts or relationships.
7. WHAT IF AN AFFILIATED COMPANY BECOMES A NONAFFILIATED THIRD PARTY?
If, at any time in the future, an affiliated company becomes a nonaffiliated third party, further disclosures of personal information made to the former affiliated company will be limited to those described in Section 2(b) above relating to nonaffiliated third parties. If you elected under Section 6 to limit disclosures we make to affiliated companies, or use of personal information by affiliated companies, your election will not apply to use by any former affiliated company of your personal information in their possession once it becomes a nonaffiliated third party.
SPECIAL NOTICE TO RESIDENTS OF VERMONT
The following section supplements our Policy with respect to our individual clients who have a Vermont address and supersedes anything to the contrary in the above Policy with respect to those clients only.
The State of Vermont requires financial institutions to obtain your consent prior to sharing personal information that they collect about you with nonaffiliated third parties, or eligibility information with affiliated companies, other than in certain limited circumstances. Except as permitted by law, we will not share personal information we collect about you with nonaffiliated third parties or eligibility information with affiliated companies, unless you provide us with your written consent to share such information.
SPECIAL NOTICE TO RESIDENTS OF CALIFORNIA
The following section supplements our Policy with respect to our individual clients who have a California address and supersedes anything to the contrary in the above Policy with respect to those clients only.
In response to a California law, if your account has a California home address, your personal information will not be disclosed to nonaffiliated third parties except as permitted by applicable California law, and we will limit sharing such personal information with our affiliates to comply with California privacy laws that apply to us.
28
Morgan Stanley Institutional Fund, Inc.
Annual Report — December 31, 2015
Director and Officer Information (unaudited)
Independent Directors:
| Name, Age and Address of Independent Director | Positions(s) Held with Registrant | Length of Time Served | Principal Occupation(s) During Past 5 Years and Other Relevant Professional Experience | Number of Portfolios in Fund Complex Overseen by Director** | Other Directorships Held by Independent Director*** | ||||||||||||||||||
| Frank L. Bowman (71) c/o Kramer Levin Naftalis & Frankel LLP Counsel to the Independent Directors 1177 Avenue of the Americas New York, NY 10036 | Director | Since August 2006 | President, Strategic Decisions, LLC (consulting) (since February 2009); Director or Trustee of various Morgan Stanley Funds (since August 2006); Chairperson of the Compliance and Insurance Committee (since October 2015); Formerly, Chairperson of the Insurance Sub-Committee of the Compliance and Insurance Committee (February 2007-December 2015); served as President and Chief Executive Officer of the Nuclear Energy Institute (policy organization) (February 2005-November 2008); retired as Admiral, U.S. Navy after serving over 38 years on active duty including 8 years as Director of the Naval Nuclear Propulsion Program in the Department of the Navy and the U.S. Department of Energy (1996-2004); served as Chief of Naval Personnel (July 1994-September 1996); and on the Joint Staff as Director of Political Military Affairs (June 1992-July1994); knighted as Honorary Knight Commander of the Most Excellent Order of the British Empire; awarded the Officier de l'Orde National du Mérite by the French Government; elected to the National Academy of Engineering (2009). | 98 | Director of BP p.l.c.; Director of Naval and Nuclear Technologies LLP; Director Emeritus of the Armed Services YMCA; Director of the U.S. Naval Submarine League; Member of the National Security Advisory Council of the Center for U.S. Global Engagement and a member of the CNA Military Advisory Board; Chairman of the Charity, J Street Cup Golf, Trustee of Fairhaven United Methodist Church; and Director of other various non-profit organizations. | ||||||||||||||||||
| Kathleen A. Dennis (62) c/o Kramer Levin Naftalis & Frankel LLP Counsel to the Independent Directors 1177 Avenue of the Americas New York, NY 10036 | Director | Since August 2006 | President, Cedarwood Associates (mutual fund and investment management consulting) (since July 2006); Chairperson of the Money Market and Alternatives Sub-Committee of the Investment Committee (since October 2006) and Director or Trustee of various Morgan Stanley Funds (since August 2006); formerly, Senior Managing Director of Victory Capital Management (1993-2006). | 98 | Director of various nonprofit organizations. | ||||||||||||||||||
| Nancy C. Everett (61) c/o Kramer Levin Naftalis & Frankel LLP Counsel to the Independent Trustees 1177 Avenue of the Americas New York, NY 10036 | Trustee | Since January 2015 | Chief Executive Officer, Virginia Commonwealth University Investment Company (since November 2015); Owner OBIR, LLC (institutional investment management consulting) (since June 2014); formerly, Managing Director, BlackRock, Inc. (February 2011-December 2013); and Chief Executive Officer, General Motors Asset Management (a/k/a Promark Global Advisors, Inc.) (June 2005-May 2010). | 98 | Member of Virginia Commonwealth University School of Business Foundation; formerly, Member of Virginia Commonwealth University Board of Visitors (2013-2015); Member of Committee on Directors for Emerging Markets Growth Fund, Inc. (2007-2010); Chairperson of Performance Equity Management, LLC (2006-2010); and Chairperson, GMAM Absolute Return Strategies Fund, LLC (2006-2010). | ||||||||||||||||||
29
Morgan Stanley Institutional Fund, Inc.
Annual Report — December 31, 2015
Director and Officer Information (unaudited) (cont'd)
Independent Directors: (cont'd)
| Name, Age and Address of Independent Director | Positions(s) Held with Registrant | Length of Time Served | Principal Occupation(s) During Past 5 Years and Other Relevant Professional Experience | Number of Portfolios in Fund Complex Overseen by Director** | Other Directorships Held by Independent Director*** | ||||||||||||||||||
| Jakki L. Haussler (58) c/o Kramer Levin Naftalis & Frankel LLP Counsel to the Independent Directors 1177 Avenue of the Americas New York, NY 10036 | Director | Since January 2015 | Chairman and Chief Executive Officer, Opus Capital Group (since January 1996); and formerly, Director, Capvest Venture Fund, LP (May 2000-December 2011); Partner, Adena Ventures, LP (July 1999-December 2010); Director, The Victory Funds (February 2005-July 2008). | 98 | Director of Cincinnati Bell Inc. and Member, Audit Committee and Compensation Committee; Director of Northern Kentucky University Foundation and Member, Investment Committee; Member of Chase College of Law Transactional Law Practice Center Board of Advisors; Director of Best Transport; Chase College of Law Board of Visitors; formerly Member, University of Cincinnati Foundation Investment Committee; Member, Miami University Board of Visitors (2008-2011); Trustee of Victory Funds (2005-2008) and Chairman, Investment Committee (2007-2008) and Member, Service Provider Committee (2005-2008). | ||||||||||||||||||
| Dr. Manuel H. Johnson (67) c/o Johnson Smick International, Inc. 220 I Street, N.E. — Suite 200 Washington, D.C. 20002 | Director | Since July 1991 | Senior Partner, Johnson Smick International, Inc. (consulting firm); Chairperson of the Investment Committee (since October 2006) and Director or Trustee of various Morgan Stanley Funds (since July 1991); Co-Chairman and a founder of the Group of Seven Council (G7C) (international economic commission); formerly Chairperson of the Audit Committee (July 1991-September 2006), Vice Chairman of the Board of Governors of the Federal Reserve System and Assistant Secretary of the U.S. Treasury. | 100 | Director of NVR, Inc. (home construction). | ||||||||||||||||||
| Joseph J. Kearns (73) c/o Kearns & Associates LLC 23823 Malibu Road S-50-440 Malibu, CA 90265 | Director | Since August 1994 | President, Kearns & Associates LLC (investment consulting); Chairperson of the Audit Committee (since October 2006) and Director or Trustee of various Morgan Stanley Funds (since August 1994); formerly, Deputy Chairperson of the Audit Committee (July 2003-September 2006) and Chairperson of the Audit Committee of various Morgan Stanley Funds (since August 1994); CFO of the J. Paul Getty Trust. | 101 | Director of Electro Rent Corporation (equipment leasing). Prior to December 31, 2013, Director of The Ford Family Foundation. | ||||||||||||||||||
30
Morgan Stanley Institutional Fund, Inc.
Annual Report — December 31, 2015
Director and Officer Information (unaudited) (cont'd)
Independent Directors: (cont'd)
| Name, Age and Address of Independent Director | Positions(s) Held with Registrant | Length of Time Served | Principal Occupation(s) During Past 5 Years and Other Relevant Professional Experience | Number of Portfolios in Fund Complex Overseen by Director** | Other Directorships Held by Independent Director*** | ||||||||||||||||||
| Michael F. Klein (57) c/o Kramer Levin Naftalis & Frankel LLP Counsel to the Independent Directors 1177 Avenue of the Americas New York, NY 10036 | Director | Since August 2006 | Managing Director, Aetos Capital, LLC (since March 2000); Co-President, Aetos Alternatives Management, LLC (since January 2004); and Co-Chief Executive Officer of Aetos Capital LLC (since August 2013); Chairperson of the Fixed Income Sub-Committee of the Investment Committee (since October 2006) and Director or Trustee of various Morgan Stanley Funds (since August 2006); formerly, Managing Director, Morgan Stanley & Co. Inc. and Morgan Stanley Dean Witter Investment Management, President, various Morgan Stanley Funds (June1998-March 2000) and Principal, Morgan Stanley & Co. Inc. and Morgan Stanley Dean Witter Investment Management (August 1997-December 1999). | 97 | Director of certain investment funds managed or sponsored by Aetos Capital, LLC. Director of Sanitized AG and Sanitized Marketing AG (specialty chemicals). | ||||||||||||||||||
| Michael E. Nugent (79) 522 Fifth Avenue New York, NY 10036 | Chair of the Board and Director | Chair of the Boards since July 2006 and Director since July 1991 | Chair of the Boards of various Morgan Stanley Funds (since July 2006); Chairperson of the Closed-End Fund Committee (since June 2012) and Director or Trustee of various Morgan Stanley Funds (since July 1991); formerly, Chairperson of the Insurance Committee (until July 2006), General Partner, TriumphCapital, L.P. (private investment partnership) (1988-2013). | 100 | None. | ||||||||||||||||||
| W. Allen Reed (68) c/o Kramer Levin Naftalis & Frankel LLP Counsel to the Independent Directors 1177 Avenue of the Americas New York, NY 10036 | Director | Since August 2006 | Chairperson of the Equity Sub-Committee of the Investment Committee (since October 2006) and Director or Trustee of various Morgan Stanley Funds (since August 2006); formerly, President and CEO of General Motors Asset Management; Chairman and Chief Executive Officer of the GM Trust Bank and Corporate Vice President of General Motors Corporation (August 1994-December 2005). | 98 | Director of Legg Mason, Inc.; formerly Director of the Auburn University Foundation (2010-2015). | ||||||||||||||||||
| Fergus Reid (83) c/o Joe Pietryka, Inc. 85 Charles Colman Blvd. Pawling, NY 12564 | Director | Since June 1992 | Chairman, Joe Pietryka, Inc.; Chairperson of the Governance Committee and Director or Trustee of various Morgan Stanley Funds (since June 1992). | 100 | Formerly, Trustee and Director of certain investment companies in the JP Morgan Fund Complex managed by JP Morgan Investment Management Inc. (1987-2012). | ||||||||||||||||||
31
Morgan Stanley Institutional Fund, Inc.
Annual Report — December 31, 2015
Director and Officer Information (unaudited) (cont'd)
Interested Director:
| Name, Age and Address of Interested Director | Positions(s) Held with Registrant | Length of Time Served* | Principal Occupation(s) During Past 5 Years | Number of Portfolios in Fund Complex Overseen by Interested Director** | Other Directorships Held by Interested Director*** | ||||||||||||||||||
| James F. Higgins (68) One New York Plaza, New York, NY 10004 | Director | Since June 2000 | Director or Trustee of various Morgan Stanley Funds (since June 2000); Senior Advisor of Morgan Stanley (since August 2000). | 99 | Formerly, Director of AXA Financial, Inc. and AXA Equitable Life Insurance Company (2002-2011) and Director of AXA MONY Life Insurance Company and AXA MONY Life Insurance Company of America (2004-2011). | ||||||||||||||||||
* This is the earliest date the Director began serving the Morgan Stanley Funds. Each Director serves an indefinite term, until his or her successor is elected.
** The Fund Complex includes (as of December 31, 2015) all open-end and closed-end funds (including all of their portfolios) advised by Morgan Stanley Investment Management Inc. (the "Adviser") and any funds that have an adviser that is an affiliated person of the Adviser (including, but not limited to, Morgan Stanley AIP GP LP).
*** This includes any directorships at public companies and registered investment companies held by the Director at any time during the past five years.
Executive Officers:
Name, Age and Address of Executive Officer | Position(s) Held with Registrant | Length of Time Served**** | Principal Occupation(s) During Past 5 Years | ||||||||||||
| John H. Gernon (52) 522 Fifth Avenue New York, NY 10036 | President and Principal Executive Officer | Since September 2013 | President and Principal Executive Officer of the Equity and Fixed Income Funds and the Morgan Stanley AIP Funds (since September 2013) and the Liquidity Funds and various money market funds (since May 2014) in the Fund Complex, Managing Director of the Adviser; Head of Product (since 2006). | ||||||||||||
| Stefanie V. Chang Yu (49) 522 Fifth Avenue New York, NY 10036 | Chief Compliance Officer | Since December 1997 | Managing Director of the Adviser and various entities affiliated with the Adviser; Chief Compliance Officer of various Morgan Stanley Funds and the Adviser (since January 2014); formerly, Vice President of various Morgan Stanley Funds (December 1997-January 2014). | ||||||||||||
| Joseph C. Benedetti (50) 522 Fifth Avenue New York, NY 10036 | Vice President | Since January 2014 | Managing Director of the Adviser and various entities affiliated with the Adviser; Vice President of various Morgan Stanley Funds (since January 2014); formerly, Assistant Secretary of various Morgan Stanley Funds (October 2004-January 2014). | ||||||||||||
| Francis J. Smith (50) 522 Fifth Avenue New York, NY 10036 | Treasurer and Principal Financial Officer | Treasurer since July 2003 and Principal Financial Officer since September 2002 | Executive Director of the Adviser and various entities affiliated with the Adviser; Treasurer (since July 2003) and Principal Financial Officer of various Morgan Stanley Funds (since September 2002). | ||||||||||||
| Mary E. Mullin (48) 522 Fifth Avenue New York, NY 10036 | Secretary | Since June 1999 | Executive Director of the Adviser; Secretary of various Morgan Stanley Funds (since June 1999). | ||||||||||||
**** This is the earliest date the officer began serving the Morgan Stanley Funds. Each officer serves a one-year term, until his or her successor is elected and has qualified.
32
Morgan Stanley Institutional Fund, Inc.
Annual Report — December 31, 2015
Adviser and Administrator
Morgan Stanley Investment Management Inc.
522 Fifth Avenue
New York, New York 10036
Distributor
Morgan Stanley Distribution, Inc.
522 Fifth Avenue
New York, New York 10036
Dividend Disbursing and Transfer Agent
Boston Financial Data Services, Inc.
2000 Crown Colony Drive
Quincy, Massachusetts 02169
Custodian
State Street Bank and Trust Company
One Lincoln Street
Boston, Massachusetts 02111
Legal Counsel
Dechert LLP
1095 Avenue of the Americas
New York, New York 10036
Counsel to the Independent Directors
Kramer Levin Naftalis & Frankel LLP
1177 Avenue of the Americas
New York, New York 10036
Independent Registered Public Accounting Firm
Ernst & Young LLP
200 Clarendon Street
Boston, Massachusetts 02116
Reporting to Shareholders
Each Morgan Stanley fund provides a complete schedule of portfolio holdings in its semi-annual and annual reports within 60 days of the end of the fund's second and fourth fiscal quarters. The semi-annual and annual reports are filed electronically with the Securities and Exchange Commission (SEC) on Form N-CSRS and Form N-CSR, respectively. Morgan Stanley also delivers the semi-annual and annual reports to fund shareholders and makes these reports available on its public website, www.morganstanley.com/im. Each Morgan Stanley fund also files a complete schedule of portfolio holdings with the SEC for the fund's first and third fiscal quarters on Form N-Q. Morgan Stanley does not deliver the reports for the first and third fiscal quarters to shareholders, nor are the reports posted to the Morgan Stanley public website. You may, however, obtain the Form N-Q filings (as well as the Form N-CSR and N-CSRS filings) by accessing the SEC's website, www.sec.gov. You may also review and copy them at the SEC's Public Reference Room in Washington, DC. Information on the operation of the SEC's Public Reference Room may be obtained by calling the SEC toll free at 1 (800) SEC-0330. You can also request copies of these materials, upon payment of a duplicating fee, by electronic request at the SEC's email address (publicinfo@sec.gov) or by writing the Public Reference Room of the SEC, Washington, DC 20549-0102.
Proxy Voting Policies and Procedures and Proxy Voting Record
You may obtain a copy of the Fund's Proxy Voting Policy and Procedures and information regarding how the Fund voted proxies relating to portfolio securities during the most recent twelve-month period ended June 30, without charge, upon request, by calling toll free 1 (800) 548-7786 or by visiting our website at www.morganstanley.com/im. This information is also available on the SEC's website at www.sec.gov.
This report is authorized for distribution only when preceded or accompanied by a prospectus of the Morgan Stanley Institutional Fund, Inc., which describes in detail each Portfolio's investment policies, risks, fees and expenses. Please read the prospectus carefully before you invest or send money. For additional information, including information regarding the investments comprising the Portfolio, please visit our website at www.morganstanley.com/im or call toll free 1 (800) 548-7786.
33
Printed in U.S.A.
This Report has been prepared for shareholders and may be distributed to others only if preceded or accompanied by a current prospectus.
Morgan Stanley Investment Management Inc.
522 Fifth Avenue
New York, New York 10036
© 2016 Morgan Stanley. Morgan Stanley Distribution, Inc.

IFIGAANN
1405114 EXP. 02.28.17
INVESTMENT MANAGEMENT

Morgan Stanley Institutional Fund, Inc.
Global Discovery Portfolio
Annual Report
December 31, 2015

Morgan Stanley Institutional Fund, Inc.
Annual Report — December 31, 2015
Table of Contents
Shareholders' Letter | 2 | ||||||
Expense Example | 3 | ||||||
Investment Overview | 4 | ||||||
Portfolio of Investments | 6 | ||||||
Statement of Assets and Liabilities | 8 | ||||||
Statement of Operations | 10 | ||||||
Statements of Changes in Net Assets | 11 | ||||||
Financial Highlights | 13 | ||||||
Notes to Financial Statements | 17 | ||||||
Report of Independent Registered Public Accounting Firm | 28 | ||||||
Federal Tax Notice | 29 | ||||||
U.S. Privacy Policy | 30 | ||||||
Director and Officer Information | 33 | ||||||
This report is authorized for distribution only when preceded or accompanied by prospectuses of the Morgan Stanley Institutional Fund, Inc. To receive a prospectus and/or statement of additional information (SAI), which contains more complete information such as investment objectives, charges, expenses, policies for voting proxies, risk considerations, and describes in detail each of the Portfolio's investment policies to the prospective investor, please call toll free 1 (800) 548-7786. Please read the prospectuses carefully before you invest or send money.
Additionally, you can access portfolio information including performance, characteristics, and investment team commentary through Morgan Stanley Investment Management's website: www.morganstanley.com/im.
Market forecasts provided in this report may not necessarily come to pass. There is no guarantee that any sectors mentioned will continue to perform as discussed herein or that securities in such sectors will be held by the Portfolio in the future. There is no assurance that a Portfolio will achieve its investment objective. Portfolios are subject to market risk, which is the possibility that market values of securities owned by the Portfolio will decline and, therefore, the value of the Portfolio's shares may be less than what you paid for them. Accordingly, you can lose money investing in this Portfolio. Please see the prospectus for more complete information on investment risks.
1
Morgan Stanley Institutional Fund, Inc.
Annual Report — December 31, 2015
Shareholders' Letter (unaudited)
Dear Shareholders,
We are pleased to provide this Annual report, in which you will learn how your investment in Global Discovery Portfolio (the "Portfolio") performed during the latest twelve-month period.
Morgan Stanley Investment Management is a client-centric, investor-led organization. Our global presence, intellectual capital, and breadth of products and services enable us to partner with investors to meet the evolving challenges of today's financial markets. We aim to deliver superior investment service and to empower our clients to make the informed decisions that help them reach their investment goals.
As always, we thank you for selecting Morgan Stanley Investment Management, and look forward to working with you in the months and years ahead.
Sincerely,

John H. Gernon
President and Principal Executive Officer
January 2016
2
Morgan Stanley Institutional Fund, Inc.
Annual Report — December 31, 2015
Expense Example (unaudited)
Global Discovery Portfolio
As a shareholder of the Portfolio, you incur two types of costs: (1) transactional costs; and (2) ongoing costs, including advisory fees, administration fees, distribution and shareholder services fees and other Portfolio expenses. This example is intended to help you understand your ongoing costs (in dollars) of investing in the Portfolio and to compare these costs with the ongoing costs of investing in other mutual funds.
This example is based on an investment of $1,000 invested at the beginning of the six-month period ended December 31, 2015 and held for the entire six-month period.
Actual Expenses
The table below provides information about actual account values and actual expenses. You may use the information in this table, together with the amount you invested, to estimate the expenses that you paid over the period. Simply divide your account value by $1,000 (for example, an $8,600 account value divided by $1,000 = 8.6), then multiply the result by the number in the table under the heading entitled "Actual Expenses Paid During Period" to estimate the expenses you paid on your account during this period.
Hypothetical Example for Comparison Purposes
The table below provides information about hypothetical account values and hypothetical expenses based on the Portfolio's actual expense ratio and an assumed rate of return of 5% per year before expenses, which is not the Portfolio's actual return. The hypothetical account values and expenses may not be used to estimate the actual ending account balance or expenses you paid for the period. You may use this information to compare the ongoing costs of investing in the Portfolio and other funds. To do so, compare this 5% hypothetical example with the 5% hypothetical examples that appear in the shareholder reports of the other funds.
Please note that the expenses shown in the table are meant to highlight your ongoing costs only and do not reflect any transactional costs, such as sales charges (loads). Therefore, the information for each class in the table is useful in comparing ongoing costs only, and will not help you determine the relative total costs of owning different funds. In addition, if these transactional costs were included, your costs would have been higher.
| Beginning Account Value 7/1/15 | Actual Ending Account Value 12/31/15 | Hypothetical Ending Account Value | Actual Expenses Paid During Period* | Hypothetical Expenses Paid During Period* | Net Expense Ratio During Period** | ||||||||||||||||||||||
Global Discovery Portfolio Class I | $ | 1,000.00 | $ | 915.90 | $ | 1,018.40 | $ | 6.52 | $ | 6.87 | 1.35 | % | |||||||||||||||
Global Discovery Portfolio Class A | 1,000.00 | 914.50 | 1,016.64 | 8.20 | 8.64 | 1.70 | |||||||||||||||||||||
Global Discovery Portfolio Class L | 1,000.00 | 911.60 | 1,014.12 | 10.60 | 11.17 | 2.20 | |||||||||||||||||||||
Global Discovery Portfolio Class C | 1,000.00 | 911.30 | 1,012.85 | 11.80 | 12.43 | 2.45 | |||||||||||||||||||||
* Expenses are calculated using each Portfolio Class' annualized net expense ratio (as disclosed), multiplied by the average account value over the period, and multiplied by 184/365 (to reflect the most recent one-half year period).
** Annualized.
3
Morgan Stanley Institutional Fund, Inc.
Annual Report — December 31, 2015
Investment Overview (unaudited)
Global Discovery Portfolio
The Portfolio seeks long-term capital appreciation.
Performance
For the year ended December 31, 2015, the Portfolio's Class I shares had a total return based on net asset value and reinvestment of distributions per share of -4.27%, net of fees. The Portfolio's Class I shares underperformed the Portfolio's benchmark, the MSCI All Country World Index (the "Index"), which returned -2.36%.
Factors Affecting Performance
• Global equity markets were slightly down for the 12-month period. A backdrop of weak global economic growth, intensifying concerns about China's slowdown, shifting sentiment about central bank policies and a sustained decline in commodity prices weighed on the markets throughout the year. On a regional basis, Japan's 9.6% gain outperformed the S&P 500 Index's flat return of 1.4% and Europe's modest 2.8% decline, while emerging market equities suffered a double-digit loss, down 14.9% (as measured by the MSCI Japan Index, MSCI Europe Index and MSCI Emerging Markets Index, respectively).
• Stock selection in the industrials sector was the Portfolio's largest detractor from relative performance, with underperformance led by a holding in a U.S. construction crane and foodservice refrigeration manufacturer.
• The health care sector was a relatively weak performer for the Portfolio. Both stock selection and an underweight position in the sector were unfavorable in this reporting period. In particular, the Portfolio was hurt by a position in a U.S. health care information company that provides a technology platform for companies and consumers to compare pricing for health care and medical procedures.
• An underweight position in the consumer staples sector hurt relative results, although the positive impact of our stock selection partially offset some of the relative loss.
• Stock selection and an underweight position in the financials sector aided relative performance. Relative gains in the sector were led by an Italy-based investment bank.
• The Portfolio's underweight to the energy sector was beneficial to relative returns, as it was the worst-performing sector in the Index. However,
weak stock selection in energy stocks detracted slightly.
• The information technology sector also contributed positively to performance, with modest gains from both stock selection and an underweight in the sector.
Management Strategies
• There were no changes to our bottom-up investment process during the period. We continued to look for franchises with sustainable competitive advantages. We typically favor companies with strong cash generation, attractive returns on capital, hard-to-replicate assets and a favorable risk/reward profile. Our emphasis is on secular growth, and as a result short-term market events are not as meaningful in the stock selection process.
• The long-term investment horizon and conviction-weighted investment approach embraced by the team since 1998 can result in periods of performance deviation from the benchmark and peers, as was the case during this reporting period. Our team continues to focus on bottom-up stock selection and the long-term outlook for companies owned in the Portfolio; accordingly, we have had very little turnover in the Portfolio to date, as our ongoing work reaffirms our assessment of quality and competitive advantage in the names we own.
* Minimum Investment for Class I shares
** Commenced Operations on December 28, 2010.
In accordance with SEC regulations, the Portfolio's performance shown assumes that all recurring fees (including management fees) were deducted and all dividends and distributions were reinvested. The performance of Class A, L and C shares will vary from the performance of Class I shares based upon their different inception dates and will be impacted by additional fees assessed to those classes.
4
Morgan Stanley Institutional Fund, Inc.
Annual Report — December 31, 2015
Investment Overview (unaudited) (cont'd)
Global Discovery Portfolio
Performance Compared to the MSCI All Country World Index(1) and the Lipper Global Small/Mid-Cap Funds Index(2)
| Period Ended December 31, 2015 Total Returns(3) | |||||||||||||||||||
Average Annual | |||||||||||||||||||
| One Year | Five Years | Ten Years | Since Inception(6) | ||||||||||||||||
| Portfolio — Class I Shares w/o sales charges(4) | –4.27 | % | 9.92 | % | — | 9.83 | % | ||||||||||||
| Portfolio — Class A Shares w/o sales charges(4) | –4.59 | 9.61 | — | 9.53 | |||||||||||||||
| Portfolio — Class A Shares with maximum 5.25% sales charges(4) | –9.61 | 8.44 | — | 8.37 | |||||||||||||||
| Portfolio — Class L Shares w/o sales charges(4) | –5.05 | 9.05 | — | 8.97 | |||||||||||||||
| Portfolio — Class C Shares w/o sales charges(5) | — | — | — | –9.28 | |||||||||||||||
| Portfolio — Class C Shares with maximum 1.00% deferred sales charges(5) | — | — | — | –10.17 | |||||||||||||||
MSCI All Country World Index | –2.36 | 6.09 | — | 6.21 | |||||||||||||||
| Lipper Global Small/Mid-Cap Funds Index | –0.68 | 4.62 | — | 4.79 | |||||||||||||||
Performance data quoted represents past performance, which is no guarantee of future results, and current performance may be lower or higher than the figures shown. Performance assumes that all dividends and distributions, if any, were reinvested. For the most recent month-end performance figures, please visit www.morganstanley.com/im. Investment return and principal value will fluctuate so that Portfolio shares, when redeemed, may be worth more or less than their original cost. Total returns do not reflect the deduction of taxes that a shareholder would pay on Portfolio distributions or the redemption of Portfolio shares. Returns for periods less than one year are not annualized. Performance of share classes will vary due to difference in expenses.
(1) The MSCI All Country World Index (ACWI) is a free float-adjusted market capitalization weighted index designed to measure the equity market performance of developed and emerging markets. The term "free float" represents the portion of shares outstanding that are deemed to be available for purchase in the public equity markets by investors. The Index is unmanaged and its returns do not include any sales charges or fees. Such costs would lower performance. It is not possible to invest directly in an index.
(2) The Lipper Global Small/Mid Cap Funds Index is an equally weighted performance index of the largest qualifying funds (based on net assets) in the Lipper Global Small/Mid-Cap Funds classification. The Index, which is adjusted for capital gains distributions and income dividends, is unmanaged and should not be considered an investment. There are currently 30 funds represented in this Index. As of the date of this report, the Portfolio is in the Lipper Global Small/Mid-Cap Funds classification.
(3) Total returns for the Portfolio reflect fees waived and expenses reimbursed, if applicable, by the Adviser. Without such waivers and reimbursements, total returns would have been lower.
(4) Commenced operations on December 28, 2010.
(5) Commenced offering on April 30, 2015.
(6) For comparative purposes, average annual since inception returns listed for the Indexes refer to the inception date of Class I of the Portfolio, not the inception of the Index.
5
Morgan Stanley Institutional Fund, Inc.
Annual Report — December 31, 2015
Portfolio of Investments
Global Discovery Portfolio
Shares | Value (000) | ||||||||||
Common Stocks (90.8%) | |||||||||||
Brazil (2.4%) | |||||||||||
GAEC Educacao SA | 46,975 | $ | 163 | ||||||||
JHSF Participacoes SA (a) | 235,640 | 75 | |||||||||
238 | |||||||||||
Canada (2.3%) | |||||||||||
Dominion Diamond Corp. (a) | 10,322 | 106 | |||||||||
Second Cup Ltd. (The) (a) | 53,664 | 128 | |||||||||
234 | |||||||||||
China (1.2%) | |||||||||||
Jumei International Holding Ltd. ADR (a) | 12,857 | 116 | |||||||||
France (13.9%) | |||||||||||
Christian Dior SE | 6,075 | 1,032 | |||||||||
Edenred | 12,100 | 228 | |||||||||
Eurazeo SA | 1,790 | 123 | |||||||||
1,383 | |||||||||||
Germany (1.1%) | |||||||||||
windeln.de AG (a)(b) | 3,820 | 43 | |||||||||
Zalando SE (a)(b) | 1,587 | 63 | |||||||||
106 | |||||||||||
Greece (1.4%) | |||||||||||
Titan Cement Co., SA (Preference) (a) | 14,966 | 140 | |||||||||
Italy (1.1%) | |||||||||||
Tamburi Investment Partners SpA | 29,116 | 106 | |||||||||
Netherlands (3.9%) | |||||||||||
Koninklijke Philips N.V. | 15,482 | 394 | |||||||||
Sweden (1.0%) | |||||||||||
Investment AB Kinnevik | 3,189 | 98 | |||||||||
United Kingdom (5.2%) | |||||||||||
BBA Aviation PLC | 184,436 | 514 | |||||||||
United States (57.3%) | |||||||||||
BWX Technologies, Inc. | 41,774 | 1,327 | |||||||||
Castlight Health, Inc., Class B (a)(c) | 13,690 | 58 | |||||||||
Cosan Ltd., Class A | 32,757 | 121 | |||||||||
| Dropbox, Inc. (a)(d)(e)(f) (acquisition cost — $25; acquired 5/1/12) | 2,743 | 39 | |||||||||
eBay, Inc. (a) | 15,621 | 429 | |||||||||
Garmin Ltd. | 4,614 | 172 | |||||||||
GrubHub, Inc. (a) | 3,393 | 82 | |||||||||
Joy Global, Inc. (c) | 37,573 | 474 | |||||||||
Manitowoc Co., Inc. (The) | 74,929 | 1,150 | |||||||||
PayPal Holdings, Inc. (a) | 13,220 | 479 | |||||||||
RenaissanceRe Holdings Ltd. | 2,162 | 245 | |||||||||
Shutterstock, Inc. (a)(c) | 2,659 | 86 | |||||||||
Terex Corp. | 34,204 | 632 | |||||||||
Time Warner, Inc. | 6,195 | 401 | |||||||||
5,695 | |||||||||||
Total Common Stocks (Cost $9,809) | 9,024 | ||||||||||
Shares | Value (000) | ||||||||||
Preferred Stocks (5.8%) | |||||||||||
India (2.0%) | |||||||||||
| Flipkart Online Services Pvt Ltd. Series D (a)(d)(e)(f) (acquisition cost — $44; acquired 10/4/13) | 1,910 | $ | 199 | ||||||||
United States (3.8%) | |||||||||||
| Airbnb, Inc. Series D (a)(d)(e)(f) (acquisition cost — $78; acquired 4/16/14) | 1,917 | 160 | |||||||||
| Blue Bottle Coffee, Inc. Series B (a)(d)(e)(f) (acquisition cost — $56; acquirred 1/24/14) | 3,945 | 74 | |||||||||
| DOMO, Inc. (a)(d)(e)(f) (acquisition cost — $37; acquired 1/31/14 — 2/7/14) | 9,082 | 60 | |||||||||
| Lookout, Inc. Series F (a)(d)(e)(f) (acquisition cost — $73; acquired 6/17/14) | 6,374 | 38 | |||||||||
| Palantir Technologies, Inc. Series G (a)(d)(e)(f) (acquisition cost — $9; acquired 7/19/12) | 2,935 | 23 | |||||||||
| Palantir Technologies, Inc. Series H (a)(d)(e)(f) (acquisition cost — $6; acquired 10/25/13) | 1,572 | 12 | |||||||||
| Palantir Technologies, Inc. Series H1 (a)(d)(e)(f) (acquisition cost — $6; acquired 10/25/13) | 1,572 | 12 | |||||||||
379 | |||||||||||
Total Preferred Stocks (Cost $309) | 578 | ||||||||||
Convertible Preferred Stock (0.0%) | |||||||||||
United States (0.0%) | |||||||||||
| Dropbox, Inc. Series A (a)(d)(e)(f) (acquisition cost — $3; acquired 5/25/12) (Cost $3) | 277 | 4 | |||||||||
Participation Note (0.1%) | |||||||||||
Italy (0.1%) | |||||||||||
| Tamburi Investment Partners SpA, Equity Linked Notes, expires 6/30/20 (a) (Cost $3) | 9,604 | 4 | |||||||||
| Notional Amount | |||||||||||
Call Options Purchased (1.6%) | |||||||||||
United States (1.6%) | |||||||||||
| Intuitive Surgical, Inc. January 2016 @ $300, UBS Securities, LLC (g) | 5 | 123 | |||||||||
| United Technologies Corp. January 2017 @ $110, UBS Securities, LLC (g) | 148 | 31 | |||||||||
| United Technologies Corp. January 2018 @ $120, UBS Securities, LLC (g) | 35 | 9 | |||||||||
Total Call Options Purchased (Cost $132) | 163 | ||||||||||
Shares | |||||||||||
Short-Term Investments (4.3%) | |||||||||||
Securities held as Collateral on Loaned Securities (2.1%) | |||||||||||
Investment Company (1.8%) | |||||||||||
| Morgan Stanley Institutional Liquidity Funds — Treasury Securities Portfolio — Institutional Class (See Note G) | 182,026 | 182 | |||||||||
The accompanying notes are an integral part of the financial statements.
6
Morgan Stanley Institutional Fund, Inc.
Annual Report — December 31, 2015
Portfolio of Investments (cont'd)
Global Discovery Portfolio
| Face Amount (000) | Value (000) | ||||||||||
Repurchase Agreements (0.3%) | |||||||||||
| Barclays Capital, Inc., (0.32%, dated 12/31/15, due 1/4/16; proceeds $8; fully collateralized by a U.S. Government obligation; 2.00% due 11/30/22; valued at $8) | $ | 8 | $ | 8 | |||||||
| Merrill Lynch & Co., Inc., (0.31%, dated 12/31/15, due 1/4/16; proceeds $23; fully collateralized by a U.S. Government agency security; 4.00% due 11/20/45; valued at $23) | 23 | 23 | |||||||||
31 | |||||||||||
| Total Securities held as Collateral on Loaned Securities (Cost $213) | 213 | ||||||||||
Shares | |||||||||||
Investment Company (2.2%) | |||||||||||
| Morgan Stanley Institutional Liquidity Funds — Money Market Portfolio — Institutional Class (See Note G) (Cost $221) | 221,343 | 221 | |||||||||
Total Short-Term Investments (Cost $434) | 434 | ||||||||||
| Total Investments (102.6%) (Cost $10,690) Including $205 of Securities Loaned (h)(i) | 10,207 | ||||||||||
Liabilities in Excess of Other Assets (-2.6%) | (263 | ) | |||||||||
Net Assets (100.0%) | $ | 9,944 | |||||||||
(a) Non-income producing security.
(b) 144A security — Certain conditions for public sale may exist. Unless otherwise noted, these securities are deemed to be liquid.
(c) All or a portion of this security was on loan at December 31, 2015.
(d) Security has been deemed illiquid at December 31, 2015.
(e) Security cannot be offered for public resale without first being registered under the Securities Act of 1933 and related rules ("restricted security"). Acquisition date represents the day on which an enforceable right to acquire such security is obtained and is presented along with related cost in the security description. The Portfolio has registration rights for certain restricted securities. Any costs related to such registration are borne by the issuer. The aggregate value of restricted securities (excluding 144A holdings) at December 31, 2015 amounts to approximately $621,000 and represents 6.2% of net assets.
(f) At December 31, 2015, the Portfolio held fair valued securities valued at approximately $621,000, representing 6.2% of net assets. These securities have been fair valued as determined in good faith under procedures established by and under the general supervision of the Fund's Directors.
(g) Cleared option.
(h) The approximate fair value and percentage of net assets, $2,839,000 and 28.6%, respectively, represent the securities that have been fair valued under the fair valuation policy for international investments as described in Note A-1 within the Notes to the Financial Statements.
(i) At December 31, 2015, the aggregate cost for Federal income tax purposes is approximately $10,797,000. The aggregate gross unrealized appreciation is approximately $789,000 and the aggregate gross unrealized depreciation is approximately $1,379,000 resulting in net unrealized depreciation of approximately $590,000.
ADR American Depositary Receipt.
Portfolio Composition*
Classification | Percentage of Total Investments | ||||||
Other** | 36.1 | % | |||||
Machinery | 22.6 | ||||||
Aerospace & Defense | 13.7 | ||||||
Textiles, Apparel & Luxury Goods | 10.3 | ||||||
Internet Software & Services | 6.4 | ||||||
Internet & Catalog Retail | 5.8 | ||||||
Transportation Infrastructure | 5.1 | ||||||
Total Investments | 100.0 | % | |||||
* Percentages indicated are based upon total investments (excluding Securities held as Collateral on Loaned Securities) as of December 31, 2015.
** Industries and/or investment types representing less than 5% of total investments.
The accompanying notes are an integral part of the financial statements.
7
Morgan Stanley Institutional Fund, Inc.
Annual Report — December 31, 2015
Global Discovery Portfolio
Statement of Assets and Liabilities | December 31, 2015 (000) | ||||||
Assets: | |||||||
Investments in Securities of Unaffiliated Issuers, at Value(1) (Cost $10,287) | $ | 9,804 | |||||
Investments in Securities of Affiliated Issuer, at Value (Cost $403) | 403 | ||||||
Total Investments in Securities, at Value (Cost $10,690) | 10,207 | ||||||
Cash | 1 | ||||||
Due from Adviser | 33 | ||||||
Tax Reclaim Receivable | 3 | ||||||
Receivable for Portfolio Shares Sold | 3 | ||||||
Dividends Receivable | — | @ | |||||
Receivable from Affiliate | — | @ | |||||
Other Assets | 36 | ||||||
Total Assets | 10,283 | ||||||
Liabilities: | |||||||
Collateral on Securities Loaned, at Value | 213 | ||||||
Payable for Investments Purchased | 72 | ||||||
Payable for Portfolio Shares Redeemed | 21 | ||||||
Payable for Professional Fees | 13 | ||||||
Payable for Custodian Fees | 9 | ||||||
Payable for Shareholder Services Fees — Class A | 1 | ||||||
Payable for Distribution and Shareholder Services Fees — Class L | — | @ | |||||
Payable for Distribution and Shareholder Services Fees — Class C | — | @ | |||||
Payable for Transfer Agency Fees — Class I | — | @ | |||||
Payable for Transfer Agency Fees — Class A | — | @ | |||||
Payable for Transfer Agency Fees — Class L | — | @ | |||||
Payable for Transfer Agency Fees — Class C | — | @ | |||||
Payable for Administration Fees | 1 | ||||||
Payable for Sub Transfer Agency Fees — Class I | — | @ | |||||
Payable for Sub Transfer Agency Fees — Class A | 1 | ||||||
Payable for Sub Transfer Agency Fees — Class L | — | @ | |||||
Payable for Sub Transfer Agency Fees — Class C | — | @ | |||||
Other Liabilities | 8 | ||||||
Total Liabilities | 339 | ||||||
Net Assets | $ | 9,944 | |||||
Net Assets Consist Of: | |||||||
Paid-in-Capital | $ | 10,623 | |||||
Distributions in Excess of Net Investment Income | (10 | ) | |||||
Accumulated Net Realized Loss | (186 | ) | |||||
Unrealized Appreciation (Depreciation) on: | |||||||
Investments | (483 | ) | |||||
Foreign Currency Translations | (— | @) | |||||
Net Assets | $ | 9,944 | |||||
The accompanying notes are an integral part of the financial statements.
8
Morgan Stanley Institutional Fund, Inc.
Annual Report — December 31, 2015
Global Discovery Portfolio
Statement of Assets and Liabilities (cont'd) | December 31, 2015 (000) | ||||||
CLASS I: | |||||||
Net Assets | $ | 3,867 | |||||
| Shares Outstanding $0.001 par value shares of beneficial interest (unlimited shares authorized) (not in 000's) | 385,880 | ||||||
Net Asset Value, Offering and Redemption Price Per Share | $ | 10.02 | |||||
CLASS A: | |||||||
Net Assets | $ | 5,375 | |||||
| Shares Outstanding $0.001 par value shares of beneficial interest (unlimited shares authorized) (not in 000's) | 537,100 | ||||||
Net Asset Value, Redemption Price Per Share | $ | 10.01 | |||||
Maximum Sales Load | 5.25 | % | |||||
Maximum Sales Charge | $ | 0.55 | |||||
Maximum Offering Price Per Share | $ | 10.56 | |||||
CLASS L: | |||||||
Net Assets | $ | 259 | |||||
| Shares Outstanding $0.001 par value shares of beneficial interest (unlimited shares authorized) (not in 000's) | 25,896 | ||||||
Net Asset Value, Offering and Redemption Price Per Share | $ | 9.99 | |||||
CLASS C: | |||||||
Net Assets | $ | 443 | |||||
| Shares Outstanding $0.001 par value shares of beneficial interest (unlimited shares authorized) (not in 000's) | 44,716 | ||||||
Net Asset Value, Offering and Redemption Price Per Share | $ | 9.92 | |||||
| (1) Including: Securities on Loan, at Value: | $ | 205 | |||||
@ Amount is less than $500.
The accompanying notes are an integral part of the financial statements.
9
Morgan Stanley Institutional Fund, Inc.
Annual Report — December 31, 2015
Global Discovery Portfolio
Statement of Operations | Year Ended December 31, 2015 (000) | ||||||
Investment Income: | |||||||
Dividends from Securities of Unaffiliated Issuers (Net of $8 of Foreign Taxes Withheld) | $ | 174 | |||||
Income from Securities Loaned — Net | 18 | ||||||
Dividends from Security of Affiliated Issuer (Note G) | 1 | ||||||
Total Investment Income | 193 | ||||||
Expenses: | |||||||
Professional Fees | 97 | ||||||
Advisory Fees (Note B) | 84 | ||||||
Registration Fees | 45 | ||||||
Custodian Fees (Note F) | 30 | ||||||
Shareholder Services Fees — Class A (Note D) | 9 | ||||||
Distribution and Shareholder Services Fees — Class L (Note D) | 2 | ||||||
Distribution and Shareholder Services Fees — Class C (Note D) | 1 | ||||||
Administration Fees (Note C) | 8 | ||||||
Transfer Agency Fees — Class I (Note E) | 2 | ||||||
Transfer Agency Fees — Class A (Note E) | 2 | ||||||
Transfer Agency Fees — Class L (Note E) | 2 | ||||||
Transfer Agency Fees — Class C (Note E) | 1 | ||||||
Shareholder Reporting Fees | 6 | ||||||
Pricing Fees | 6 | ||||||
Sub Transfer Agency Fees — Class I | — | @ | |||||
Sub Transfer Agency Fees — Class A | 3 | ||||||
Sub Transfer Agency Fees — Class L | — | @ | |||||
Sub Transfer Agency Fees — Class C | — | @ | |||||
Directors' Fees and Expenses | 1 | ||||||
Other Expenses | 12 | ||||||
Total Expenses | 311 | ||||||
Waiver of Advisory Fees (Note B) | (84 | ) | |||||
Expenses Reimbursed by Adviser (Note B) | (79 | ) | |||||
Reimbursement of Class Specific Expenses — Class I (Note B) | (2 | ) | |||||
Reimbursement of Class Specific Expenses — Class A (Note B) | (1 | ) | |||||
Reimbursement of Class Specific Expenses — Class L (Note B) | (1 | ) | |||||
Reimbursement of Class Specific Expenses — Class C (Note B) | (1 | ) | |||||
Rebate from Morgan Stanley Affiliate (Note G) | (1 | ) | |||||
Net Expenses | 142 | ||||||
Net Investment Income | 51 | ||||||
Realized Gain (Loss): | |||||||
Investments Sold | 201 | ||||||
Foreign Currency Transactions | (3 | ) | |||||
Net Realized Gain | 198 | ||||||
Change in Unrealized Appreciation (Depreciation): | |||||||
Investments | (498 | ) | |||||
Foreign Currency Translations | — | @ | |||||
Net Change in Unrealized Appreciation (Depreciation) | (498 | ) | |||||
Net Realized Gain and Change in Unrealized Appreciation (Depreciation) | (300 | ) | |||||
Net Decrease in Net Assets Resulting from Operations | $ | (249 | ) | ||||
@ Amount is less than $500.
The accompanying notes are an integral part of the financial statements.
10
Morgan Stanley Institutional Fund, Inc.
Annual Report — December 31, 2015
Global Discovery Portfolio
Statements of Changes in Net Assets | Year Ended December 31, 2015 (000) | Year Ended December 31, 2014 (000) | |||||||||
Increase (Decrease) in Net Assets: | |||||||||||
Operations: | |||||||||||
Net Investment Income | $ | 51 | $ | 396 | |||||||
Net Realized Gain | 198 | 580 | |||||||||
Net Change in Unrealized Appreciation (Depreciation) | (498 | ) | (1,311 | ) | |||||||
Net Decrease in Net Assets Resulting from Operations | (249 | ) | (335 | ) | |||||||
Distributions from and/or in Excess of: | |||||||||||
Class I: | |||||||||||
Net Investment Income | (55 | ) | (295 | ) | |||||||
Net Realized Gain | — | (1,086 | ) | ||||||||
Paid-in-Capital | — | (151 | ) | ||||||||
Class A: | |||||||||||
Net Investment Income | (66 | ) | (123 | ) | |||||||
Net Realized Gain | — | (473 | ) | ||||||||
Paid-in-Capital | — | (68 | ) | ||||||||
Class L: | |||||||||||
Net Investment Income | (2 | ) | (8 | ) | |||||||
Net Realized Gain | — | (37 | ) | ||||||||
Paid-in-Capital | — | (6 | ) | ||||||||
Class C: | |||||||||||
Net Investment Income | (5 | )* | — | ||||||||
Total Distributions | (128 | ) | (2,247 | ) | |||||||
Capital Share Transactions:(1) | |||||||||||
Class I: | |||||||||||
Subscribed | 2,778 | 2,992 | |||||||||
Distributions Reinvested | 45 | 1,334 | |||||||||
Redeemed | (5,353 | ) | (4,608 | ) | |||||||
Class A: | |||||||||||
Subscribed | 3,385 | 3,257 | |||||||||
Distributions Reinvested | 63 | 600 | |||||||||
Redeemed | (729 | ) | (1,615 | ) | |||||||
Class L: | |||||||||||
Subscribed | 108 | 8 | |||||||||
Distributions Reinvested | 1 | 25 | |||||||||
Redeemed | (61 | ) | (16 | ) | |||||||
Class C: | |||||||||||
Subscribed | 467 | * | — | ||||||||
Distributions Reinvested | 5 | * | — | ||||||||
Redeemed | (— | @)* | — | ||||||||
Net Increase in Net Assets Resulting from Capital Share Transactions | 709 | 1,977 | |||||||||
Total Increase (Decrease) in Net Assets | 332 | (605 | ) | ||||||||
Net Assets: | |||||||||||
Beginning of Period | 9,612 | 10,217 | |||||||||
End of Period (Including Distributions in Excess of Net Investment Income of $(10) and $(82)) | $ | 9,944 | $ | 9,612 | |||||||
The accompanying notes are an integral part of the financial statements.
11
Morgan Stanley Institutional Fund, Inc.
Annual Report — December 31, 2015
Global Discovery Portfolio
Statements of Changes in Net Assets (cont'd) | Year Ended December 31, 2015 (000) | Year Ended December 31, 2014 (000) | |||||||||
(1) Capital Share Transactions: | |||||||||||
Class I: | |||||||||||
Shares Subscribed | 260 | 220 | |||||||||
Shares Issued on Distributions Reinvested | 5 | 120 | |||||||||
Shares Redeemed | (484 | ) | (355 | ) | |||||||
Net Decrease in Class I Shares Outstanding | (219 | ) | (15 | ) | |||||||
Class A: | |||||||||||
Shares Subscribed | 321 | 246 | |||||||||
Shares Issued on Distributions Reinvested | 6 | 54 | |||||||||
Shares Redeemed | (69 | ) | (127 | ) | |||||||
Net Increase in Class A Shares Outstanding | 258 | 173 | |||||||||
Class L: | |||||||||||
Shares Subscribed | 11 | 1 | |||||||||
Shares Issued on Distributions Reinvested | — | @@ | 2 | ||||||||
Shares Redeemed | (6 | ) | (1 | ) | |||||||
Net Increase in Class L Shares Outstanding | 5 | 2 | |||||||||
Class C: | |||||||||||
Shares Subscribed | 44 | * | — | ||||||||
Shares Issued on Distributions Reinvested | 1 | * | — | ||||||||
Shares Redeemed | (— | @@) | — | ||||||||
Net Increase in Class C Shares Outstanding | 45 | — | |||||||||
* For the period April 30, 2015 through December 31, 2015.
@ Amount is less than $500.
@@ Amount is less than 500 shares.
The accompanying notes are an integral part of the financial statements.
12
Morgan Stanley Institutional Fund, Inc.
Annual Report — December 31, 2015
Financial Highlights
Global Discovery Portfolio
Class I | |||||||||||||||||||||||
Year Ended December 31, | |||||||||||||||||||||||
Selected Per Share Data and Ratios | 2015 | 2014 | 2013 | 2012 | 2011 | ||||||||||||||||||
Net Asset Value, Beginning of Period | $ | 10.62 | $ | 13.70 | $ | 11.11 | $ | 9.06 | $ | 9.97 | |||||||||||||
Income (Loss) from Investment Operations: | |||||||||||||||||||||||
Net Investment Income (Loss)† | 0.10 | 0.48 | (0.01 | ) | 0.25 | 0.13 | |||||||||||||||||
Net Realized and Unrealized Gain (Loss) | (0.55 | ) | (0.77 | ) | 4.43 | 2.62 | (0.92 | ) | |||||||||||||||
Total from Investment Operations | (0.45 | ) | (0.29 | ) | 4.42 | 2.87 | (0.79 | ) | |||||||||||||||
Distributions from and/or in Excess of: | |||||||||||||||||||||||
Net Investment Income | (0.15 | ) | (0.55 | ) | (0.07 | ) | (0.30 | ) | (0.12 | ) | |||||||||||||
Net Realized Gain | — | (1.95 | ) | (1.76 | ) | (0.52 | ) | (0.00 | )‡ | ||||||||||||||
Paid-in-Capital | — | (0.29 | ) | — | — | — | |||||||||||||||||
Total Distributions | (0.15 | ) | (2.79 | ) | (1.83 | ) | (0.82 | ) | (0.12 | ) | |||||||||||||
Net Asset Value, End of Period | $ | 10.02 | $ | 10.62 | $ | 13.70 | $ | 11.11 | $ | 9.06 | |||||||||||||
Total Return++ | (4.27 | )% | (1.96 | )% | 40.72 | % | 31.64 | % | (7.72 | )% | |||||||||||||
Ratios and Supplemental Data: | |||||||||||||||||||||||
Net Assets, End of Period (Thousands) | $ | 3,867 | $ | 6,421 | $ | 8,493 | $ | 3,432 | $ | 2,446 | |||||||||||||
Ratio of Expenses to Average Net Assets (1) | 1.34 | %+ | 1.34 | %+ | 1.34 | %+ | 1.35 | %+ | 1.35 | %+ | |||||||||||||
Ratio of Net Investment Income (Loss) to Average Net Assets (1) | 0.88 | %+ | 3.70 | %+ | (0.07 | )%+ | 2.41 | %+ | 1.39 | %+ | |||||||||||||
Ratio of Rebate from Morgan Stanley Affiliates to Average Net Assets | 0.01 | % | 0.01 | % | 0.01 | % | 0.00 | %§ | 0.00 | %§ | |||||||||||||
Portfolio Turnover Rate | 118 | % | 84 | % | 100 | % | 96 | % | 83 | % | |||||||||||||
(1) Supplemental Information on the Ratios to Average Net Assets: | |||||||||||||||||||||||
Ratios Before Expense Limitation: | |||||||||||||||||||||||
Expenses to Average Net Assets | 3.09 | % | 2.65 | % | 3.65 | % | 4.33 | % | 5.52 | % | |||||||||||||
Net Investment Income (Loss) to Average Net Assets | (0.87 | )% | 2.39 | % | (2.38 | )% | (0.57 | )% | (2.78 | )% | |||||||||||||
† Per share amount is based on average shares outstanding.
‡ Amount is less than $0.005 per share.
++ Calculated based on the net asset value as of the last business day of the period.
+ The Ratios of Expenses and Net Investment Income (Loss) reflect the rebate of certain Portfolio expenses in connection with the investments in Morgan Stanley affiliates during the period. The effect of the rebate on the ratios is disclosed in the above table as "Ratio of Rebate from Morgan Stanley Affiliates to Average Net Assets."
§ Amount is less than 0.005%.
The accompanying notes are an integral part of the financial statements.
13
Morgan Stanley Institutional Fund, Inc.
Annual Report — December 31, 2015
Financial Highlights
Global Discovery Portfolio
Class A | |||||||||||||||||||||||
Year Ended December 31, | |||||||||||||||||||||||
Selected Per Share Data and Ratios | 2015 | 2014 | 2013 | 2012 | 2011 | ||||||||||||||||||
Net Asset Value, Beginning of Period | $ | 10.62 | $ | 13.69 | $ | 11.11 | $ | 9.07 | $ | 9.97 | |||||||||||||
Income (Loss) from Investment Operations: | |||||||||||||||||||||||
Net Investment Income (Loss)† | 0.02 | 0.44 | (0.09 | ) | 0.22 | 0.12 | |||||||||||||||||
Net Realized and Unrealized Gain (Loss) | (0.51 | ) | (0.76 | ) | 4.47 | 2.62 | (0.92 | ) | |||||||||||||||
Total from Investment Operations | (0.49 | ) | (0.32 | ) | 4.38 | 2.84 | (0.80 | ) | |||||||||||||||
Distributions from and/or in Excess of: | |||||||||||||||||||||||
Net Investment Income | (0.12 | ) | (0.51 | ) | (0.04 | ) | (0.28 | ) | (0.10 | ) | |||||||||||||
Net Realized Gain | — | (1.95 | ) | (1.76 | ) | (0.52 | ) | (0.00 | )‡ | ||||||||||||||
Paid-in-Capital | — | (0.29 | ) | — | — | — | |||||||||||||||||
Total Distributions | (0.12 | ) | (2.75 | ) | (1.80 | ) | (0.80 | ) | (0.10 | ) | |||||||||||||
Net Asset Value, End of Period | $ | 10.01 | $ | 10.62 | $ | 13.69 | $ | 11.11 | $ | 9.07 | |||||||||||||
Total Return++ | (4.59 | )% | (2.25 | )% | 40.33 | % | 31.40 | % | (7.98 | )% | |||||||||||||
Ratios and Supplemental Data: | |||||||||||||||||||||||
Net Assets, End of Period (Thousands) | $ | 5,375 | $ | 2,965 | $ | 1,455 | $ | 137 | $ | 91 | |||||||||||||
Ratio of Expenses to Average Net Assets (1) | 1.69 | %+ | 1.69 | %+ | 1.65 | %+^^ | 1.60 | %+ | 1.60 | %+ | |||||||||||||
Ratio of Net Investment Income (Loss) to Average Net Assets (1) | 0.16 | %+ | 3.35 | %+ | (0.66 | )%+ | 2.16 | %+ | 1.14 | %+ | |||||||||||||
Ratio of Rebate from Morgan Stanley Affiliates to Average Net Assets | 0.01 | % | 0.01 | % | 0.01 | % | 0.00 | %§ | 0.00 | %§ | |||||||||||||
Portfolio Turnover Rate | 118 | % | 84 | % | 100 | % | 96 | % | 83 | % | |||||||||||||
(1) Supplemental Information on the Ratios to Average Net Assets: | |||||||||||||||||||||||
Ratios Before Expense Limitation: | |||||||||||||||||||||||
Expenses to Average Net Assets | 3.52 | % | 3.02 | % | 3.87 | % | 4.58 | % | 5.77 | % | |||||||||||||
Net Investment Income (Loss) to Average Net Assets | (1.67 | )% | 2.02 | % | (2.88 | )% | (0.82 | )% | (3.03 | )% | |||||||||||||
‡ Amount is less than $0.005 per share.
† Per share amount is based on average shares outstanding.
++ Calculated based on the net asset value which does not reflect sales charges, if applicable, as of the last business day of the period.
+ The Ratios of Expenses and Net Investment Income (Loss) reflect the rebate of certain Portfolio expenses in connection with the investments in Morgan Stanley affiliates during the period. The effect of the rebate on the ratios is disclosed in the above table as "Ratio of Rebate from Morgan Stanley Affiliates to Average Net Assets."
^^ Effective September 16, 2013, the Adviser has agreed to limit the ratio of expenses to average net assets to the maximum ratio of 1.70% for Class A shares. Prior to September 16, 2013, the maximum ratio was 1.60% for Class A shares.
§ Amount is less than 0.005%.
The accompanying notes are an integral part of the financial statements.
14
Morgan Stanley Institutional Fund, Inc.
Annual Report — December 31, 2015
Financial Highlights
Global Discovery Portfolio
Class L | |||||||||||||||||||||||
Year Ended December 31, | |||||||||||||||||||||||
Selected Per Share Data and Ratios | 2015 | 2014 | 2013 | 2012 | 2011 | ||||||||||||||||||
Net Asset Value, Beginning of Period | $ | 10.59 | $ | 13.64 | $ | 11.11 | $ | 9.07 | $ | 9.97 | |||||||||||||
Income (Loss) from Investment Operations: | |||||||||||||||||||||||
Net Investment Income (Loss)† | (0.03 | ) | 0.37 | (0.14 | ) | 0.17 | 0.06 | ||||||||||||||||
Net Realized and Unrealized Gain (Loss) | (0.51 | ) | (0.76 | ) | 4.45 | 2.61 | (0.91 | ) | |||||||||||||||
Total from Investment Operations | (0.54 | ) | (0.39 | ) | 4.31 | 2.78 | (0.85 | ) | |||||||||||||||
Distributions from and/or in Excess of: | |||||||||||||||||||||||
Net Investment Income | (0.06 | ) | (0.42 | ) | (0.02 | ) | (0.22 | ) | (0.05 | ) | |||||||||||||
Net Realized Gain | — | (1.95 | ) | (1.76 | ) | (0.52 | ) | (0.00 | )‡ | ||||||||||||||
Paid-in-Capital | — | (0.29 | ) | — | — | — | |||||||||||||||||
Total Distributions | (0.06 | ) | (2.66 | ) | (1.78 | ) | (0.74 | ) | (0.05 | ) | |||||||||||||
Net Asset Value, End of Period | $ | 9.99 | $ | 10.59 | $ | 13.64 | $ | 11.11 | $ | 9.07 | |||||||||||||
Total Return++ | (5.05 | )% | (2.81 | )% | 39.68 | % | 30.62 | % | (8.41 | )% | |||||||||||||
Ratios and Supplemental Data: | |||||||||||||||||||||||
Net Assets, End of Period (Thousands) | $ | 259 | $ | 226 | $ | 269 | $ | 111 | $ | 91 | |||||||||||||
Ratio of Expenses to Average Net Assets (1) | 2.19 | %+ | 2.19 | %+ | 2.13 | %+^^ | 2.10 | %+ | 2.10 | %+ | |||||||||||||
Ratio of Net Investment Income (Loss) to Average Net Assets (1) | (0.26 | )%+ | 2.85 | %+ | (1.05 | )%+ | 1.66 | %+ | 0.64 | %+ | |||||||||||||
Ratio of Rebate from Morgan Stanley Affiliates to Average Net Assets | 0.01 | % | 0.01 | % | 0.01 | % | 0.00 | %§ | 0.00 | %§ | |||||||||||||
Portfolio Turnover Rate | 118 | % | 84 | % | 100 | % | 96 | % | 83 | % | |||||||||||||
(1) Supplemental Information on the Ratios to Average Net Assets: | |||||||||||||||||||||||
Ratios Before Expense Limitation: | |||||||||||||||||||||||
Expenses to Average Net Assets | 4.55 | % | 4.08 | % | 4.62 | % | 5.08 | % | 6.27 | % | |||||||||||||
Net Investment Income (Loss) to Average Net Assets | (2.62 | )% | 0.96 | % | (3.54 | )% | (1.32 | )% | (3.53 | )% | |||||||||||||
† Per share amount is based on average shares outstanding.
‡ Amount is less than $0.005 per share.
++ Calculated based on the net asset value as of the last business day of the period.
+ The Ratios of Expenses and Net Investment Income (Loss) reflect the rebate of certain Portfolio expenses in connection with the investments in Morgan Stanley affiliates during the period. The effect of the rebate on the ratios is disclosed in the above table as "Ratio of Rebate from Morgan Stanley Affiliates to Average Net Assets."
^^ Effective September 16, 2013, the Adviser has agreed to limit the ratio of expenses to average net assets to the maximum ratio of 2.20% for Class L shares. Prior to September 16, 2013, the maximum ratio was 2.10% for Class L shares.
§ Amount is less than 0.005%.
The accompanying notes are an integral part of the financial statements.
15
Morgan Stanley Institutional Fund, Inc.
Annual Report — December 31, 2015
Financial Highlights
Global Discovery Portfolio
Class C | |||||||
| Selected Per Share Data and Ratios | Period from April 30, 2015^ to December 31, 2015 | ||||||
Net Asset Value, Beginning of Period | $ | 11.07 | |||||
Loss from Investment Operations: | |||||||
Net Investment Loss† | (0.08 | ) | |||||
Net Realized and Unrealized Loss | (0.95 | ) | |||||
Total from Investment Operations | (1.03 | ) | |||||
Distributions from and/or in Excess of: | |||||||
Net Investment Income | (0.12 | ) | |||||
Net Asset Value, End of Period | $ | 9.92 | |||||
Total Return++ | (9.28 | )%# | |||||
Ratios and Supplemental Data: | |||||||
Net Assets, End of Period (Thousands) | $ | 443 | |||||
Ratios of Expenses to Average Net Assets (1) | 2.45 | %+* | |||||
Ratio of Net Investment Loss to Average Net Assets (1) | (1.21 | )%+* | |||||
Ratio of Rebate from Morgan Stanley Affiliates to Average Net Assets | 0.00 | %§* | |||||
Portfolio Turnover Rate | 118 | % | |||||
(1) Supplemental Information on the Ratios to Average Net Assets: | |||||||
Ratios Before Expense Limitation: | |||||||
Expense to Average Net Assets | 5.66 | %* | |||||
Net Investment Loss to Average Net Assets | (4.42 | )%* | |||||
^ Commencement of Offering.
† Per share amount is based on average shares outstanding.
++ Calculated based on the net asset value which does not reflect sales charges, if applicable, as of the last business day of the period.
+ The Ratios of Expenses and Net Investment Loss reflect the rebate of certain Portfolio expenses in connection with the investments in Morgan Stanley affiliates during the period. The effect of the rebate on the ratios is disclosed in the above table as "Ratio of Rebate from Morgan Stanley Affiliates to Average Net Assets."
§ Amount is less than 0.005%.
# Not Annualized.
* Annualized.
The accompanying notes are an integral part of the financial statements.
16
Morgan Stanley Institutional Fund, Inc.
Annual Report — December 31, 2015
Notes to Financial Statements
Morgan Stanley Institutional Fund, Inc. (the "Fund") is registered under the Investment Company Act of 1940, as amended (the "Act"), as an open-end management investment company. The Fund is comprised of twenty-six separate, active, diversified and non-diversified portfolios (individually referred to as a "Portfolio", collectively as the "Portfolios"). The Fund applies investment company accounting and reporting guidance.
The accompanying financial statements relate to the Global Discovery Portfolio. The Portfolio seeks long-term capital appreciation by investing primarily in established and emerging companies located throughout the world, with capitalizations within the range of companies included in the MSCI All Country World Index.
The Portfolio offers four classes of shares — Class I, Class A, Class L and Class C. On April 30, 2015, the Portfolio commenced offering Class C shares and suspended offering Class L shares. Existing Class L shareholders may invest through reinvestment of dividends and distributions.
A. Significant Accounting Policies: The following significant accounting policies are in conformity with U.S. generally accepted accounting principles ("GAAP"). Such policies are consistently followed by the Fund in the preparation of its financial statements. GAAP may require management to make estimates and assumptions that affect the reported amounts and disclosures in the financial statements. Actual results may differ from those estimates.
1. Security Valuation: (1) An equity portfolio security listed or traded on an exchange is valued at its latest reported sales price (or at the exchange official closing price if such exchange reports an official closing price), if there were no sales on a given day, the security is valued at the mean between the last reported bid and asked prices; (2) all other equity portfolio securities for which over-the-counter ("OTC") market quotations are readily available are valued at its latest reported sales price. In cases where a security is traded on more than one exchange, the security is valued on the exchange designated as the primary market; (3) listed options are valued at the last reported sales price on the exchange on which they are listed (or at the exchange official closing price if such exchange reports an official closing price). If an official closing price or last reported sales price is unavailable, the listed option should be fair valued at the mean between their latest bid and asked price. Unlisted options are
valued by an outside pricing service approved by the Fund's Board of Directors (the "Directors") or quotes from a broker or dealer; (4) certain portfolio securities may be valued by an outside pricing service approved by the Directors. The pricing service may utilize a matrix system or other model incorporating attributes such as security quality, maturity and coupon as the evaluation model parameters, and/or research evaluations by its staff, including review of broker-dealer market price quotations in determining what it believes is the fair valuation of the portfolios securities valued by such pricing service; (5) when market quotations are not readily available, including circumstances under which Morgan Stanley Investment Management Inc. (the "Adviser") determines that the closing price, last sale price or the mean between the last reported bid and asked prices are not reflective of a security's market value, portfolio securities are valued at their fair value as determined in good faith under procedures established by and under the general supervision of the Directors. Occasionally, developments affecting the closing prices of securities and other assets may occur between the times at which valuations of such securities are determined (that is, close of the foreign market on which the securities trade) and the close of business of the New York Stock Exchange ("NYSE"). If developments occur during such periods that are expected to materially affect the value of such securities, such valuations may be adjusted to reflect the estimated fair value of such securities as of the close of the NYSE, as determined in good faith by the Directors or by the Adviser using a pricing service and/or procedures approved by the Directors; (6) quotations of foreign portfolio securities, other assets and liabilities and forward contracts stated in foreign currency are translated into U.S. dollar equivalents at the prevailing market rates prior to the close of the NYSE; (7) investments in mutual funds, including the Morgan Stanley Institutional Liquidity Funds, are valued at the net asset value ("NAV") as of the close of each business day; and (8) short-term debt securities with remaining maturities of 60 days or less at the time of purchase may be valued at amortized cost, unless the Adviser determines such valuation does not reflect the securities' market value, in which case these securities will be valued at their fair market value determined by the Adviser.
The Directors have responsibility for determining in good faith the fair value of the investments, and the Directors may appoint others, such as the Fund's
17
Morgan Stanley Institutional Fund, Inc.
Annual Report — December 31, 2015
Notes to Financial Statements (cont'd)
Adviser or a valuation committee, to assist the Directors in determining fair value and to make the actual calculations pursuant to the fair valuation methodologies previously approved by the Directors. Under procedures approved by the Directors, the Fund's Adviser has formed a Valuation Committee whose members are approved by the Directors. The Valuation Committee provides administration and oversight of the Fund's valuation policies and procedures, which are reviewed at least annually by the Directors. These procedures allow the Fund to utilize independent pricing services, quotations from securities and financial instrument dealers, and other market sources to determine fair value.
The Fund has procedures to determine the fair value of securities and other financial instruments for which market prices are not readily available. Under these procedures, the Valuation Committee convenes on a regular and ad hoc basis to review such securities and considers a number of factors, including valuation methodologies and significant unobservable valuation inputs, when arriving at fair value. The Valuation Committee may employ a market-based approach which may use related or comparable assets or liabilities, recent transactions, market multiples, book values, and other relevant information for the investment to determine the fair value of the investment. An income-based valuation approach may also be used in which the anticipated future cash flows of the investment are discounted to calculate fair value. Discounts may also be applied due to the nature or duration of any restrictions on the disposition of the investments. Due to the inherent uncertainty of valuations of such investments, the fair values may differ significantly from the values that would have been used had an active market existed. The Valuation Committee employs various methods for calibrating these valuation approaches including a regular review of valuation methodologies, key inputs and assumptions, transactional back-testing or disposition analysis, and reviews of any related market activity.
2. Fair Value Measurement: Financial Accounting Standards Board ("FASB") Accounting Standards CodificationTM ("ASC") 820, "Fair Value Measurement" ("ASC 820"), defines fair value as the value that the Fund would receive to sell an investment or pay to transfer a liability in a timely transaction with an independent buyer
in the principal market, or in the absence of a principal market the most advantageous market for the investment or liability. ASC 820 establishes a three-tier hierarchy to distinguish between (1) inputs that reflect the assumptions market participants would use in valuing an asset or liability developed based on market data obtained from sources independent of the reporting entity (observable inputs) and (2) inputs that reflect the reporting entity's own assumptions about the assumptions market participants would use in valuing an asset or liability developed based on the best information available in the circumstances (unobservable inputs) and to establish classification of fair value measurements for disclosure purposes. Various inputs are used in determining the value of the Fund's investments. The inputs are summarized in the three broad levels listed below.
• Level 1 – unadjusted quoted prices in active markets for identical investments
• Level 2 – other significant observable inputs (including quoted prices for similar investments, interest rates, prepayment speeds, credit risk, etc.)
• Level 3 – significant unobservable inputs including the Fund's own assumptions in determining the fair value of investments. Factors considered in making this determination may include, but are not limited to, information obtained by contacting the issuer, analysts, or the appropriate stock exchange (for exchange-traded securities), analysis of the issuer's financial statements or other available documents and, if necessary, available information concerning other securities in similar circumstances
The inputs or methodology used for valuing securities are not necessarily an indication of the risk associated with investing in those securities and the determination of the significance of a particular input to the fair value measurement in its entirety requires judgment and considers factors specific to each security.
18
Morgan Stanley Institutional Fund, Inc.
Annual Report — December 31, 2015
Notes to Financial Statements (cont'd)
The following is a summary of the inputs used to value the Portfolio's investments as of December 31, 2015.
Investment Type | Level 1 Unadjusted quoted prices (000) | Level 2 Other significant observable inputs (000) | Level 3 Significant unobservable inputs (000) | Total (000) | |||||||||||||||
Assets: | |||||||||||||||||||
Common Stocks | |||||||||||||||||||
Aerospace & Defense | $ | 1,327 | $ | — | $ | — | $ | 1,327 | |||||||||||
Capital Markets | — | 106 | — | 106 | |||||||||||||||
| Commercial Services & Supplies | — | 228 | — | 228 | |||||||||||||||
Construction Materials | 140 | — | — | 140 | |||||||||||||||
| Diversified Consumer Services | — | 163 | — | 163 | |||||||||||||||
| Diversified Financial Services | — | 221 | — | 221 | |||||||||||||||
Health Care Technology | 58 | — | — | 58 | |||||||||||||||
| Hotels, Restaurants & Leisure | 128 | — | — | 128 | |||||||||||||||
Household Durables | 172 | — | — | 172 | |||||||||||||||
Industrial Conglomerates | — | 394 | — | 394 | |||||||||||||||
| Information Technology Services | 479 | — | — | 479 | |||||||||||||||
Insurance | 245 | — | — | 245 | |||||||||||||||
Internet & Catalog Retail | 116 | 106 | — | 222 | |||||||||||||||
| Internet Software & Services | 597 | — | 39 | 636 | |||||||||||||||
Machinery | 2,256 | — | — | 2,256 | |||||||||||||||
Media | 401 | — | — | 401 | |||||||||||||||
Metals & Mining | 106 | — | — | 106 | |||||||||||||||
| Oil, Gas & Consumable Fuels | 121 | — | — | 121 | |||||||||||||||
| Real Estate Management & Development | — | 75 | — | 75 | |||||||||||||||
| Textiles, Apparel & Luxury Goods | — | 1,032 | — | 1,032 | |||||||||||||||
| Transportation Infrastructure | — | 514 | — | 514 | |||||||||||||||
Total Common Stocks | 6,146 | 2,839 | 39 | 9,024 | |||||||||||||||
Preferred Stocks | — | — | 578 | 578 | |||||||||||||||
| Convertible Preferred Stock | — | — | 4 | 4 | |||||||||||||||
Participation Note | 4 | — | — | 4 | |||||||||||||||
Call Options Purchased | 163 | — | — | 163 | |||||||||||||||
Short-Term Investments | |||||||||||||||||||
Investment Companies | 403 | — | — | 403 | |||||||||||||||
Repurchase Agreements | — | 31 | — | 31 | |||||||||||||||
| Total Short-Term Investments | 403 | 31 | — | 434 | |||||||||||||||
Total Assets | $ | 6,716 | $ | 2,870 | $ | 621 | $ | 10,207 | |||||||||||
Transfers between investment levels may occur as the markets fluctuate and/or the availability of data used in an investment's valuation changes. The Portfolio recognizes transfers between the levels as of the end of the period. As of December 31, 2015, securities with a total value of approximately $140,000 transferred from Level 2 to Level 1. Securities that were valued using other significant observable inputs at December 31, 2014 were valued using unadjusted quoted prices at December 31, 2015. At December 31, 2015, the fair value of certain securities were adjusted due to developments which occurred between the time of the close of the foreign markets on which they trade and the close of business on the NYSE which resulted in their Level 2 classification.
Following is a reconciliation of investments in which significant unobservable inputs (Level 3) were used in determining fair value.
| Common Stock (000) | Preferred Stocks (000) | Convertible Preferred Stock (000) | |||||||||||||
Beginning Balance | $ | 52 | $ | 534 | $ | 5 | |||||||||
Purchases | — | — | — | ||||||||||||
Sales | — | — | — | ||||||||||||
Amortization of discount | — | — | — | ||||||||||||
Transfers in | — | — | — | ||||||||||||
Transfers out | — | — | — | ||||||||||||
Corporate actions | — | — | — | ||||||||||||
| Change in unrealized appreciation (depreciation) | (13 | ) | 44 | (1 | ) | ||||||||||
Realized gains (losses) | — | — | — | ||||||||||||
Ending Balance | $ | 39 | $ | 578 | $ | 4 | |||||||||
| Net change in unrealized appreciation (depreciation) from investments still held as of December 31, 2015 | $ | (13 | ) | $ | 44 | $ | (1 | ) | |||||||
19
Morgan Stanley Institutional Fund, Inc.
Annual Report — December 31, 2015
Notes to Financial Statements (cont'd)
The following table presents additional information about valuation techniques and inputs used for investments that are measured at fair value and categorized within Level 3 as of December 31, 2015. Various valuation techniques were used in the valuation of certain investments and weighted based on the level of significance.
| Fair Value at December 31, 2015 (000) | Valuation Technique | Unobservable Input | Range | Selected Value | Impact to Valuation from an Increase in Input | ||||||||||||||||||||||||||
Hotels, Restaurants & Leisure | |||||||||||||||||||||||||||||||
| Preferred Stock | $ | 74 | Discounted Cash Flow | Weighted Average Cost of Capital | 19.0 | % | 21.0 | % | 20.0 | % | Decrease | ||||||||||||||||||||
Perpetual Growth Rate | 2.5 | % | 3.5 | % | 3.0 | % | Increase | ||||||||||||||||||||||||
| Market Comparable Companies | Enterprise Value/ Revenue | 4.2 | x | 8.2 | x | 5.4 | x | Increase | |||||||||||||||||||||||
| Discount for Lack of Marketability | 20.0 | % | 20.0 | % | 20.0 | % | Decrease | ||||||||||||||||||||||||
Internet & Catalog Retail | |||||||||||||||||||||||||||||||
| Preferred Stocks | $ | 160 | Market Transaction Method | Precedent Transaction | $ | 93.09 | $ | 93.09 | $ | 93.09 | Increase | ||||||||||||||||||||
Discounted Cash Flow | Weighted Average Cost of Capital | 16.0 | % | 18.0 | % | 17.0 | % | Decrease | |||||||||||||||||||||||
Perpetual Growth Rate | 3.0 | % | 4.0 | % | 3.5 | % | Increase | ||||||||||||||||||||||||
| Market Comparable Companies | Enterprise Value/ Revenue | 11.1 | x | 17.9 | x | 17.9 | x | Increase | |||||||||||||||||||||||
| Discount for Lack of Marketability | 20.0 | % | 20.0 | % | 20.0 | % | Decrease | ||||||||||||||||||||||||
$ | 199 | Discounted Cash Flow | Weighted Average Cost of Capital | 17.0 | % | 19.0 | % | 18.0 | % | Decrease | |||||||||||||||||||||
Perpetual Growth Rate | 3.5 | % | 4.5 | % | 4.0 | % | Increase | ||||||||||||||||||||||||
| Market Comparable Companies | Enterprise Value/ Revenue | 3.1 | x | 5.2 | x | 3.1 | x | Increase | |||||||||||||||||||||||
| Discount for Lack of Marketability | 20.0 | % | 20.0 | % | 20.0 | % | Decrease | ||||||||||||||||||||||||
Internet Software & Services | |||||||||||||||||||||||||||||||
| Common Stock | $ | 39 | Discounted Cash Flow | Weighted Average Cost of Capital | 17.0 | % | 19.0 | % | 18.0 | % | Decrease | ||||||||||||||||||||
| Convertible Preferred Stock | $ | 4 | Perpetual Growth Rate | 2.5 | % | 3.5 | % | 3.0 | % | Increase | |||||||||||||||||||||
| Market Comparable Companies | Enterprise Value/ Revenue | 7.8 | x | 20.1 | x | 11.0 | x | Increase | |||||||||||||||||||||||
| Discount for Lack of Marketability | 20.0 | % | 20.0 | % | 20.0 | % | Decrease | ||||||||||||||||||||||||
20
Morgan Stanley Institutional Fund, Inc.
Annual Report — December 31, 2015
Notes to Financial Statements (cont'd)
| Fair Value at December 31, 2015 (000) | Valuation Technique | Unobservable Input | Range | Selected Value | Impact to Valuation from an Increase in Input | ||||||||||||||||||||||||||
Software | |||||||||||||||||||||||||||||||
| Preferred Stocks | $ | 60 | Discounted Cash Flow | Weighted Average Cost of Capital | 17.5 | % | 19.5 | % | 18.5 | % | Decrease | ||||||||||||||||||||
Perpetual Growth Rate | 3.0 | % | 4.0 | % | 3.5 | % | Increase | ||||||||||||||||||||||||
| Market Comparable Companies | Enterprise Value/ Revenue | 11.1 | x | 12.6 | x | 12.6 | x | Increase | |||||||||||||||||||||||
| Discount for Lack of Marketability | 20.0 | % | 20.0 | % | 20.0 | % | Decrease | ||||||||||||||||||||||||
$ | 38 | Discounted Cash Flow | Weighted Average Cost of Capital | 18.5 | % | 20.5 | % | 19.5 | % | Decrease | |||||||||||||||||||||
Perpetual Growth Rate | 3.0 | % | 4.0 | % | 3.5 | % | Increase | ||||||||||||||||||||||||
| Market Comparable Companies | Enterprise Value/ Revenue | 6.3 | x | 43.5 | x | 12.7 | x | Increase | |||||||||||||||||||||||
| Discount for Lack of Marketability | 20.0 | % | 20.0 | % | 20.0 | % | Decrease | ||||||||||||||||||||||||
$ | 47 | Market Transaction Method | Precendent Transaction | $ | 11.38 | $ | 11.38 | $ | 11.38 | Increase | |||||||||||||||||||||
Discounted Cash Flow | Weighted Average Cost of Capital | 16.0 | % | 18.0 | % | 17.0 | % | Decrease | |||||||||||||||||||||||
Perpetual Growth Rate | 2.5 | % | 3.5 | % | 3.0 | % | Increase | ||||||||||||||||||||||||
| Market Comparable Companies | Enterprise Value/ Revenue | 10.3 | x | 11.2 | x | 11.2 | x | Increase | |||||||||||||||||||||||
| Discount for Lack of Marketability | 20.0 | % | 20.0 | % | 20.0 | % | Decrease | ||||||||||||||||||||||||
3. Repurchase Agreements: The Portfolio may enter into repurchase agreements under which the Portfolio lends cash and takes possession of securities with an agreement that the counterparty will repurchase such securities. In connection with transactions in repurchase agreements, a bank as custodian for the Portfolio takes possession of the underlying securities which are held as collateral, with a market value at least equal to the amount of the repurchase transaction, including principal and accrued interest. To the extent that any repurchase transaction exceeds one business day, the value of the collateral is marked-to-market on a daily basis to determine that the value of the collateral does not decrease below the repurchase price plus accrued interest as earned. If such a decrease occurs, additional collateral will be requested and, when received, will be added to the account to maintain full collateralization. In the event of default on the obligation to repurchase, the Portfolio has the right to liquidate the collateral and apply the proceeds
in satisfaction of the obligation. In the event of default or bankruptcy by the counterparty to the agreement, realization of the collateral proceeds may be subject to cost and delays. The Portfolio, along with other affiliated investment companies, may utilize a joint trading account for the purpose of entering into repurchase agreements.
4. Foreign Currency Translation and Foreign Investments: The books and records of the Portfolio are maintained in U.S. dollars. Foreign currency amounts are translated into U.S. dollars as follows:
– investments, other assets and liabilities at the prevailing rate of exchange on the valuation date;
– investment transactions and investment income at the prevailing rates of exchange on the dates of such transactions.
Although the net assets of the Portfolio are presented at the foreign exchange rates and market values at the close
21
Morgan Stanley Institutional Fund, Inc.
Annual Report — December 31, 2015
Notes to Financial Statements (cont'd)
of the period, the Portfolio does not isolate that portion of the results of operations arising as a result of changes in the foreign exchange rates from the fluctuations arising from changes in the market prices of securities held at period end. Similarly, the Portfolio does not isolate the effect of changes in foreign exchange rates from the fluctuations arising from changes in the market prices of securities sold during the period. Accordingly, realized and unrealized foreign currency gains (losses) on investments in securities are included in the reported net realized and unrealized gains (losses) on investment transactions and balances. However, pursuant to U.S. Federal income tax regulations, gains and losses from certain foreign currency transactions and the foreign currency portion of gains and losses realized on sales and maturities of foreign denominated debt securities are treated as ordinary income for U.S. Federal income tax purposes.
Net realized gains (losses) on foreign currency transactions represent net foreign exchange gains (losses) from foreign currency forward exchange contracts, disposition of foreign currencies, currency gains (losses) realized between the trade and settlement dates on securities transactions, and the difference between the amount of investment income and foreign withholding taxes recorded on the Portfolio's books and the U.S. dollar equivalent amounts actually received or paid. Net unrealized currency gains (losses) from valuing foreign currency denominated assets and liabilities at period end exchange rates are reflected as a component of unrealized appreciation (depreciation) in the Statement of Assets and Liabilities. The change in unrealized currency gains (losses) on foreign currency translations for the period is reflected in the Statement of Operations.
Foreign security and currency transactions may involve certain considerations and risks not typically associated with those of U.S. dollar denominated transactions as a result of, among other factors, fluctuations of exchange rates in relation to the U.S. dollar, the possibility of lower levels of governmental supervision and regulation of foreign securities markets and the possibility of political or economic instability.
Governmental approval for foreign investments may be required in advance of making an investment under certain circumstances in some countries, and the extent of
foreign investments in domestic companies may be subject to limitation in other countries. Foreign ownership limitations also may be imposed by the charters of individual companies to prevent, among other concerns, violations of foreign investment limitations. As a result, an additional class of shares (identified as "Foreign" in the Portfolio of Investments) may be created and offered for investment. The "local" and "foreign shares" market values may differ. In the absence of trading of the foreign shares in such markets, the Portfolio values the foreign shares at the closing exchange price of the local shares.
5. Derivatives: The Portfolio may, but is not required to, use derivative instruments for a variety of purposes, including hedging, risk management, portfolio management or to earn income. Derivatives are financial instruments whose value is based, in part, on the value of an underlying asset, interest rate, index or financial instrument. Prevailing interest rates and volatility levels, among other things, also affect the value of derivative instruments. A derivative instrument often has risks similar to its underlying asset and may have additional risks, including imperfect correlation between the value of the derivative and the underlying asset, risks of default by the counterparty to certain transactions, magnification of losses incurred due to changes in the market value of the securities, instruments, indices or interest rates to which the derivative instrument relates, risks that the transactions may not be liquid and risks arising from margin requirements. The use of derivatives involves risks that are different from, and possibly greater than, the risks associated with other portfolio investments. Derivatives may involve the use of highly specialized instruments that require investment techniques and risk analyses different from those associated with other portfolio investments. All of the Portfolio's holdings, including derivative instruments, are marked-to-market each day with the change in value reflected in unrealized appreciation (depreciation). Upon disposition, a realized gain or loss is recognized.
Certain derivative transactions may give rise to a form of leverage. Leverage magnifies the potential for gain and the risk of loss. Leverage associated with derivative transactions may cause the Portfolio to liquidate portfolio positions when it may not be advantageous to do so to satisfy its obligations or to meet earmarking or segregation requirements, pursuant to applicable Securities and Exchange Commission rules and regulations, or
22
Morgan Stanley Institutional Fund, Inc.
Annual Report — December 31, 2015
Notes to Financial Statements (cont'd)
may cause the Portfolio to be more volatile than if the Portfolio had not been leveraged. Although the Adviser seeks to use derivatives to further the Portfolio's investment objectives, there is no assurance that the use of derivatives will achieve this result.
Following is a description of the derivative instruments and techniques that the Portfolio used during the period and their associated risks:
Options: With respect to options, the Portfolio is subject to equity risk, interest rate risk and foreign currency exchange risk in the normal course of pursuing its investment objectives. If the Portfolio buys an option, it buys a legal contract giving it the right to buy or sell a specific amount of the underlying instrument or futures contract on the underlying instrument, at an agreed-upon price typically in exchange for a premium paid by the Portfolio. The Portfolio may purchase and/or sell put and call options. Purchasing call options tends to increase the Portfolio's exposure to the underlying (or similar) instrument. Purchasing put options tends to decrease the Portfolio's exposure to the underlying (or similar) instrument. When entering into purchased option contracts, the Portfolio bears the risk of interest or exchange rates or securities prices moving unexpectedly, in which case, the Portfolio may not achieve the anticipated benefits of the purchased option contracts; however the risk of loss is limited to the premium paid. Purchased options are reported as part of "Total Investments in Securities" in the Statement of Assets and Liabilities. Premium paid for purchasing options which expired are treated as realized losses. If the Portfolio sells an option, it sells to another party the right to buy from or sell to the Portfolio a specific amount of the underlying instrument or futures contract on the underlying instrument at an agreed-upon price typically in exchange for a premium received by the Portfolio. When options are purchased OTC, the Portfolio bears the risk that the counterparty that wrote the option will be unable or unwilling to perform its obligations under the option contract. Options may also be illiquid and the Portfolio may have difficulty closing out its position. A decision as to whether, when and how to use options involves the exercise of skill and judgment and even a well-conceived option transaction may be unsuccessful because of market behavior or unexpected events. The prices of options can be highly volatile and the use of options can lower total returns.
FASB ASC 815, "Derivatives and Hedging" ("ASC 815"), is intended to improve financial reporting about derivative instruments by requiring enhanced disclosures to enable investors to better understand how and why the Portfolio uses derivative instruments, how these derivative instruments are accounted for and their effects on the Portfolio's financial position and results of operations.
The following table sets forth the fair value of the Portfolio's derivative contracts by primary risk exposure as of December 31, 2015.
| Asset Derivatives Statement of Assets and Liabilities Location | Primary Risk Exposure | Value (000) | |||||||||||||
| Call Options Purchased | Investments, at Value (Call Options Purchased) | Equity Risk | $ | 163 | (a) | ||||||||||
(a) Amounts are included in Investments in Securities in the Statement of Assets and Liabilities.
The following tables set forth by primary risk exposure the Portfolio's realized gains (losses) and change in unrealized appreciation (depreciation) by type of derivative contract for the year ended December 31, 2015 in accordance with ASC 815.
Realized Gain (Loss) | |||||||||||
Primary Risk Exposure | Derivative Type | Value (000) | |||||||||
| Equity Risk | Investments (Call Options Purchased) | $ | 290 | (b) | |||||||
(b) Amounts are included in Investments Sold in the Statement of Operations.
Change in Unrealized Appreciation (Depreciation) | |||||||||||
Primary Risk Exposure | Derivative Type | Value (000) | |||||||||
| Equity Risk | Investments (Call Options Purchased) | $ | (330 | )(c) | |||||||
(c) Amounts are included in Investments in the Statement of Operations.
For the year ended December 31, 2015, the approximate average monthly amount outstanding for each derivative type is as follows:
Call Options Purchased: | |||||||
Average monthly notional amount | 9,000 | ||||||
6. Securities Lending: The Portfolio lends securities to qualified financial institutions, such as broker-dealers, to earn additional income. Any increase or decrease in the fair value of the securities loaned that might occur and any interest earned or dividends declared on those securities during the term of the loan would remain in the Portfolio. The Portfolio would receive cash or securities as collateral in an amount equal to or exceeding 100% of the current fair value of the loaned securities. The collateral is marked-to-market
23
Morgan Stanley Institutional Fund, Inc.
Annual Report — December 31, 2015
Notes to Financial Statements (cont'd)
daily by State Street Bank and Trust Company ("State Street"), the securities lending agent, to ensure that a minimum of 100% collateral coverage is maintained.
Based on pre-established guidelines, the securities lending agent invests any cash collateral that is received in an affiliated money market portfolio and repurchase agreements. Securities lending income is generated from the earnings on the invested collateral and borrowing fees, less any rebates owed to the borrowers and compensation to the lending agent, and is recorded as "Income from Securities Loaned-Net" in the Portfolio's Statement of Operations. Risks in securities lending transactions are that a borrower may not provide additional collateral when required or return the securities when due, and that the value of the short-term investments will be less than the amount of cash collateral plus any rebate that is required to be returned to the borrower.
The Portfolio has the right under the lending agreement to recover the securities from the borrower on demand.
The following table presents financial instruments that are subject to enforceable netting arrangements as of December 31, 2015.
Gross Amounts Not Offset in the Statement of Assets and Liabilities | |||||||||||||||
| Gross Asset Amounts Presented in Statement of Assets and Liabilities (000) | Financial Instrument (000) | Collateral Received (000) | Net Amount (not less than $0) (000) | ||||||||||||
| $ | 205 | (e) | $ | — | $ | (205 | )(f)(g) | $ | 0 | ||||||
(e) Represents market value of loaned securities at period end.
(f) The Portfolio received cash collateral of approximately $213,000, which was subsequently invested in Repurchase Agreements and Morgan Stanley Institutional Liquidity Funds as reported in the Portfolio of Investments.
(g) The actual collateral received is greater than the amount shown here due to overcollateralization.
The Portfolio has adopted the disclosure provisions of FASB Accounting Standards Update No. 2014-11 ("ASU No. 2014-11"), "Transfers & Servicing (Topic 860): Repurchase-to-Maturity Transactions, Repurchase Financings, and Disclosures". ASU No. 2014-11 is intended to provide increased transparency about the types of collateral pledged in securities lending transactions and other similar transactions that are accounted for as secured borrowing.
The following table displays a breakdown of transactions accounted for as secured borrowings, the gross obligations by class of collateral pledged, and the remaining contractual maturity of those transactions as of December 31, 2015.
Remaining Contractual Maturity of the Agreements As of December 31, 2015 | |||||||||||||||||||||||
| Overnight and Continuous (000) | <30 days (000) | Between 30 & 90 days (000) | >90 days (000) | Total (000) | |||||||||||||||||||
Securities Lending Transactions | |||||||||||||||||||||||
Common Stocks | $ | 213 | $ | — | $ | — | $ | — | $ | 213 | |||||||||||||
Total Borrowings | $ | 213 | $ | — | $ | — | $ | — | $ | 213 | |||||||||||||
Gross amount of recognized liabilities for securities lending transactions | $ | 213 | |||||||||||||||||||||
7. Restricted Securities: The Portfolio invests in unregistered or otherwise restricted securities. The term "restricted securities" refers to securities that are unregistered or are held by control persons of the issuer and securities that are subject to contractual restrictions on their resale. As a result, restricted securities may be more difficult to value and the Portfolio may have difficulty disposing of such assets either in a timely manner or for a reasonable price. In order to dispose of an unregistered security, the Portfolio, where it has contractual rights to do so, may have to cause such security to be registered. A considerable period may elapse between the time the decision is made to sell the security and the time the security is registered so that the
Portfolio could sell it. Contractual restrictions on the resale of securities vary in length and scope and are generally the result of a negotiation between the issuer and acquirer of the securities. The Portfolio would, in either case, bear market risks during that period. Restricted securities are identified in the Portfolio of Investments.
8. Structured Investments: The Portfolio invested a portion of its assets in structured investments. A structured investment is a derivative security designed to offer a return linked to a particular underlying security, currency, commodity or market. Structured investments may come in various forms including notes (such as exchange-traded notes), warrants and options to purchase securities. The
24
Morgan Stanley Institutional Fund, Inc.
Annual Report — December 31, 2015
Notes to Financial Statements (cont'd)
Portfolio will typically use structured investments to gain exposure to a permitted underlying security, currency, commodity or market when direct access to a market is limited or inefficient from a tax or cost standpoint. There can be no assurance that structured investments will trade at the same price or have the same value as the underlying security, currency, commodity or market. Investments in structured investments involve risks including issuer risk, counterparty risk and market risk. Holders of structured investments bear risks of the underlying investment and are subject to issuer or counterparty risk because the Portfolio is relying on the creditworthiness of such issuer or counterparty and has no rights with respect to the underlying investment. Certain structured investments may be thinly traded or have a limited trading market and may have the effect of increasing the Portfolio's illiquidity to the extent that the Portfolio, at a particular time, may be unable to find qualified buyers for these securities.
9. Indemnifications: The Fund enters into contracts that contain a variety of indemnifications. The Fund's maximum exposure under these arrangements is unknown. However, the Fund has not had prior claims or losses pursuant to these contracts and expects the risk of loss to be remote.
10. Dividends and Distributions to Shareholders: Dividend income and distributions to shareholders are recorded on the ex-dividend date. Dividends from net investment income, if any, are declared and paid annually. Net realized capital gains, if any, are distributed at least annually.
11. Security Transactions, Income and Expenses: Security transactions are accounted for on the trade date (date the order to buy or sell is executed). Realized gains and losses on the sale of investment securities are determined on the specific identified cost method. Dividend income and other distributions are recorded on the ex-dividend date (except for certain foreign dividends which may be recorded as soon as the Portfolio is informed of such dividends) net of applicable withholding taxes. Interest income is recognized on the accrual basis except where collection is in doubt. Discounts are accreted and premiums are amortized over the life of the respective securities. Most expenses of the Fund can be directly attributed to a particular Portfolio. Expenses which cannot be directly attributed are apportioned among the Portfolios based upon relative net assets or other appropriate
methods. Income, expenses (other than class specific expenses — distribution and shareholder services, transfer agency and sub transfer agency fees) and realized and unrealized gains or losses are allocated to each class of shares based upon their relative net assets.
B. Advisory Fees: The Adviser, a wholly-owned subsidiary of Morgan Stanley, provides the Portfolio with advisory services under the terms of an Investment Advisory Agreement, paid quarterly, at the annual rate based on the daily net assets as follows:
| First $1 billion | Over $1 billion | ||||||
| 0.90 | % | 0.85 | % | ||||
For the year ended December 31, 2015, the advisory fee rate (net of waivers/rebate) was equivalent to an annual effective rate of 0.00% of the Portfolio's average daily net assets.
The Adviser has agreed to reduce its advisory fee and/or reimburse the Portfolio so that total annual portfolio operating expenses, excluding certain investment related expenses, taxes, interest and other extraordinary expenses (including litigation), will not exceed 1.35% for Class I shares, 1.70% for Class A shares, 2.20% for Class L shares and 2.45% for Class C shares. The fee waivers and/or expense reimbursements will continue for at least one year from the date of the Portfolio's prospectus or until such time as the Directors act to discontinue all or a portion of such waivers and/or reimbursements when they deem such action is appropriate. For the year ended December 31, 2015, approximately $84,000 of advisory fees were waived and approximately $84,000 of other expenses were reimbursed by the Adviser pursuant to this arrangement.
C. Administration Fees: The Adviser also serves as Administrator to the Fund and provides administrative services pursuant to an Administration Agreement for an annual fee, accrued daily and paid monthly, of 0.08% of the Portfolio's average daily net assets.
Under a Sub-Administration Agreement between the Administrator and State Street, State Street provides certain administrative services to the Fund. For such services, the Administrator pays State Street a portion of the fee the Administrator receives from the Portfolio.
D. Distribution and Shareholder Services Fees: Morgan Stanley Distribution, Inc. ("MSDI" or the "Distributor"), a wholly-owned subsidiary of the Adviser and an indirect subsidiary of Morgan Stanley, serves as the Fund's Distributor
25
Morgan Stanley Institutional Fund, Inc.
Annual Report — December 31, 2015
Notes to Financial Statements (cont'd)
of Portfolio shares pursuant to a Distribution Agreement. The Fund has adopted a Shareholder Services Plan with respect to Class A shares pursuant to Rule 12b-1 under the Act. Under the Shareholder Services Plan, the Portfolio pays the Distributor a shareholder services fee, accrued daily and paid monthly, at an annual rate of 0.25% of the Portfolio's average daily net assets attributable to Class A shares.
The Fund has adopted a Distribution and Shareholder Services Plan with respect to Class L shares pursuant to Rule 12b-1 under the Act. Under the Distribution and Shareholder Services Plan, the Portfolio pays the Distributor a distribution fee, accrued daily and paid monthly, at an annual rate of 0.50% and a shareholder services fee, accrued daily and paid monthly, at an annual rate of 0.25% of the Portfolio's average daily net assets attributable to Class L shares.
The Fund has adopted a Distribution and Shareholder Services Plan with respect to Class C shares pursuant to Rule 12b-1 under the Act. Under the Distribution and Shareholder Services Plan, the Portfolio pays the Distributor a distribution fee, accrued daily and paid monthly, at an annual rate of 0.75% and a shareholder services fee, accrued daily and paid monthly, at an annual rate of 0.25% of the Portfolio's average daily net assets attributable to Class C shares.
The distribution and shareholder services fees are used to support the expenses associated with servicing and maintaining accounts. The Distributor may compensate other parties for providing shareholder support services to investors who purchase Class A, Class L and Class C shares.
E. Dividend Disbursing and Transfer Agent: The Fund's dividend disbursing and transfer agent is Boston Financial Data Services, Inc. ("BFDS"). Pursuant to a Transfer Agency Agreement, the Fund pays BFDS a fee based on the number of classes, accounts and transactions relating to the Portfolios of the Fund.
F. Custodian Fees: State Street (the "Custodian") serves as Custodian for the Fund in accordance with a Custodian Agreement. The Custodian holds cash, securities, and other assets of the Fund as required by the Act. Custody fees are payable monthly based on assets held in custody, investment purchases and sales activity and account maintenance fees, plus reimbursement for certain out-of-pocket expenses.
G. Security Transactions and Transactions with Affiliates: For the year ended December 31, 2015, purchases and sales of investment securities for the Portfolio, other than
long-term U.S. Government securities and short-term investments, were approximately $12,033,000 and $10,479,000, respectively. There were no purchases and sales of long-term U.S. Government securities for the year ended December 31, 2015.
The Portfolio invests in the Institutional Class of the Morgan Stanley Institutional Liquidity Funds (the "Liquidity Funds"), an open-end management investment company managed by the Adviser, both directly and as a portion of the securities held as collateral on loaned securities. Advisory fees paid by the Portfolio are reduced by an amount equal to its pro-rata share of the advisory and administration fees paid by the Portfolio due to its investment in the Liquidity Funds. For the year ended December 31, 2015, advisory fees paid were reduced by approximately $1,000 relating to the Portfolio's investment in the Liquidity Funds.
A summary of the Portfolio's transactions in shares of the Liquidity Funds during the year ended December 31, 2015 is as follows:
| Value December 31, 2014 (000) | Purchases at Cost (000) | Sales (000) | Dividend Income (000) | Value December 31, 2015 (000) | |||||||||||||||
| $ | 1,198 | $ | 10,505 | $ | 11,300 | $ | 1 | $ | 403 | ||||||||||
The Portfolio has an unfunded Deferred Compensation Plan (the "Compensation Plan"), which allows each independent Director to defer payment of all, or a portion, of the fees he or she receives for serving on the Board of Directors. Each eligible Director generally may elect to have the deferred amounts credited with a return equal to the total return on one or more of the Morgan Stanley funds that are offered as investment options under the Compensation Plan. Appreciation/depreciation and distributions received from these investments are recorded with an offsetting increase/decrease in the deferred compensation obligation and do not affect the NAV of the Portfolio.
H. Federal Income Taxes: It is the Portfolio's intention to continue to qualify as a regulated investment company and distribute all of its taxable and tax-exempt income. Accordingly, no provision for Federal income taxes is required in the financial statements.
The Portfolio may be subject to taxes imposed by countries in which it invests. Such taxes are generally based on income and/or capital gains earned or repatriated. Taxes are accrued based on net investment income, net realized gains and net unrealized appreciation as such income and/or gains are earned. Taxes may also be based on transactions in foreign currency
26
Morgan Stanley Institutional Fund, Inc.
Annual Report — December 31, 2015
Notes to Financial Statements (cont'd)
and are accrued based on the value of investments denominated in such currency.
FASB ASC 740-10, "Income Taxes — Overall," sets forth a minimum threshold for financial statement recognition of the benefit of a tax position taken or expected to be taken in a tax return. Management has concluded there are no significant uncertain tax positions that would require recognition in the financial statements. If applicable, the Portfolio recognizes interest accrued related to unrecognized tax benefits in "Interest Expense" and penalties in "Other Expenses" in the Statement of Operations. The Portfolio files tax returns with the U.S. Internal Revenue Service, New York and various states. Generally, each of the tax years in the four-year period ended December 31, 2015, remains subject to examination by taxing authorities.
The tax character of distributions paid may differ from the character of distributions shown in the Statements of Changes in Net Assets due to short-term capital gains being treated as ordinary income for tax purposes. The tax character of distributions paid during fiscal 2015 and 2014 was as follows:
| 2015 Distributions Paid From: | 2014 Distributions Paid From: | ||||||||||||||||||
| Ordinary Income (000) | Long-Term Capital Gain (000) | Ordinary Income (000) | Long-Term Capital Gain (000) | Paid-in- Capital (000) | |||||||||||||||
| $ | 128 | $ | — | $ | 941 | $ | 1,081 | $ | 225 | ||||||||||
The amount and character of income and gains to be distributed are determined in accordance with income tax regulations which may differ from GAAP. These book/tax differences are either considered temporary or permanent in nature.
Temporary differences are primarily due to differing book and tax treatments in the timing of the recognition of gains (losses) on certain investment transactions and the timing of the deductibility of certain expenses.
Permanent differences, primarily due to differing treatments of gains (losses) related to foreign currency transactions and basis adjustments on certain equity securities designated as passive foreign investment companies, resulted in the following reclassifications among the components of net assets at December 31, 2015:
| Distributions in Excess of Net Investment Income (000) | Accumulated Net Realized Loss (000) | Paid-in-Capital (000) | |||||||||
| $ | 149 | $ | (149 | ) | $ | — | |||||
At December 31, 2015, the Portfolio had no distributable earnings on a tax basis.
At December 31, 2015, the Portfolio had available for Federal income tax purposes unused short-term capital losses of approximately $88,000 that do not have an expiration date.
To the extent that capital loss carryforwards are used to offset any future capital gains realized, no capital gains tax liability will be incurred by the Portfolio for gains realized and not distributed. To the extent that capital gains are offset, such gains will not be distributed to the shareholders.
Capital losses and specified ordinary losses, including currency losses, incurred after October 31 but within the taxable year are deemed to arise on the first day of the Portfolio's next taxable year. For the year ended December 31, 2015, the Portfolio deferred to January 1, 2016 for U.S. Federal income tax purposes the following losses:
| Post-October Currency and Specified Ordinary Losses (000) | Post-October Capital Losses (000) | ||||||
| $ | 1 | $ | — | ||||
I. Other: At December 31, 2015, the Portfolio had record owners of 10% or greater. Investment activities of these shareholders could have a material impact on the Portfolio. The aggregate percentage of such owners was 72.2%.
27
Morgan Stanley Institutional Fund, Inc.
Annual Report — December 31, 2015
Report of Independent Registered Public Accounting Firm
To the Shareholders and Board of Directors of
Morgan Stanley Institutional Fund, Inc. —
Global Discovery Portfolio
We have audited the accompanying statement of assets and liabilities, including the portfolio of investments, of Global Discovery Portfolio (one of the portfolios constituting Morgan Stanley Institutional Fund, Inc.) (the "Portfolio") as of December 31, 2015, and the related statement of operations for the year then ended, the statements of changes in net assets for each of the two years in the period then ended and the financial highlights for each of the years or periods indicated therein. These financial statements and financial highlights are the responsibility of the Portfolio's management. Our responsibility is to express an opinion on these financial statements and financial highlights based on our audits.
We conducted our audits in accordance with the standards of the Public Company Accounting Oversight Board (United States). Those standards require that we plan and perform the audit to obtain reasonable assurance about whether the financial statements and financial highlights are free of material misstatement. We were not engaged to perform an audit of the Portfolio's internal control over financial reporting. Our audits included consideration of internal control over financial reporting as a basis for designing audit procedures that are appropriate in the circumstances, but not for the purpose of expressing an opinion on the effectiveness of the Portfolio's internal control over financial reporting. Accordingly, we express no such opinion. An audit also includes examining, on a test basis, evidence supporting the amounts and disclosures in the financial statements and financial highlights, assessing the accounting principles used and significant estimates made by management, and evaluating the overall financial statement presentation. Our procedures included confirmation of securities owned as of December 31, 2015, by correspondence with the custodian and others or by other appropriate auditing procedures where replies from others were not received. We believe that our audits provide a reasonable basis for our opinion.
In our opinion, the financial statements and financial highlights referred to above present fairly, in all material respects, the financial position of Global Discovery Portfolio (one of the portfolios constituting Morgan Stanley Institutional Fund, Inc.) at December 31, 2015, the results of its operations for the year then ended, the changes in its net assets for each of the two years in the period then ended and the financial highlights for each of the years or periods indicated therein, in conformity with U.S. generally accepted accounting principles.

Boston, Massachusetts
February 26, 2016
28
Morgan Stanley Institutional Fund, Inc.
Annual Report — December 31, 2015
Federal Tax Notice (unaudited)
For Federal income tax purposes, the following information is furnished with respect to the distributions paid by the Portfolio during its taxable year ended December 31, 2015. For corporate shareholders, 16.7% of the dividends qualified for the dividends received deduction.
For Federal income tax purposes, the following information is furnished with respect to the Portfolio's earnings for its taxable year ended December 31, 2015. When distributed, certain earnings may be subject to a maximum tax rate of 15% as provided for the Jobs and Growth Tax Relief Reconciliation Act of 2003. The Portfolio designated up to a maximum of approximately $113,000 as taxable at this lower rate.
In January, the Portfolio provides tax information to shareholders for the preceding calendar year.
29
Morgan Stanley Institutional Fund, Inc.
Annual Report — December 31, 2015
U.S. Privacy Policy (unaudited)
AN IMPORTANT NOTICE CONCERNING OUR U.S. PRIVACY POLICY
This privacy notice describes the U.S. privacy policy of Morgan Stanley Distribution, Inc., and the Morgan Stanley family of mutual funds ("us", "our", "we").
We are required by federal law to provide you with notice of our U.S. privacy policy ("Policy"). This Policy applies to both our current and former clients unless we state otherwise and is intended for individual clients who purchase products or receive services from us for personal, family or household purposes. This Policy is not applicable to partnerships, corporations, trusts or other non-individual clients or account holders, nor is this Policy applicable to individuals who are either beneficiaries of a trust for which we serve as trustee or participants in an employee benefit plan administered or advised by us. This Policy is, however, applicable to individuals who select us to be a custodian of securities or assets in individual retirement accounts, 401(k) accounts, or accounts subject to the Uniform Gifts to Minors Act.
This notice sets out our business practices to protect your privacy; how we collect and share personal information about you; and how you can limit our sharing or certain uses by others of this information. We may amend this Policy at any time, and will inform you of any changes to our Policy as required by law.
WE RESPECT YOUR PRIVACY
We appreciate that you have provided us with your personal financial information and understand your concerns about your information. We strive to safeguard the information our clients entrust to us. Protecting the confidentiality and security of client information is an important part of how we conduct our business.
This notice describes what personal information we collect about you, how we collect it, when we may share it with others, and how certain others may use it. It discusses the steps you may take to limit our sharing of certain information about you with our affiliated companies, including, but not limited to our affiliated banking businesses, brokerage firms and credit service affiliates. It also discloses how you may limit our affiliates' use of shared information for marketing purposes.
Throughout this Policy, we refer to the nonpublic information that personally identifies you as "personal information." We also use the term "affiliated company" in this notice. An affiliated company is a company in our family of companies and includes companies with the Morgan Stanley name. These affiliated companies are financial institutions such as broker-dealers, banks, investment advisers and credit card issuers. We refer to any company that is not an affiliated company as a nonaffiliated third party. For purposes of Section 5 of this notice, and your ability to limit certain uses of personal information by our affiliates, this notice applies to the use of personal information by our affiliated companies.
1. WHAT PERSONAL INFORMATION DO WE COLLECT FROM YOU?
We may collect the following types of information about you: (i) information provided by you, including information from applications and other forms we receive from you, (ii) information about your transactions with us or our affiliates, (iii) information about your transactions with nonaffiliated third parties, (iv) information from consumer reporting agencies, (v) information obtained from our websites, and (vi) information obtained from other sources. For example:
• We collect information such as your name, address, e-mail address, telephone/fax numbers, assets, income and investment objectives through applications and other forms you submit to us.
• We may obtain information about account balances, your use of account(s) and the types of products and services you prefer to receive from us through your dealings and transactions with us and other sources.
• We may obtain information about your creditworthiness and credit history from consumer reporting agencies.
• We may collect background information from and through third-party vendors to verify representations you have made and to comply with various regulatory requirements.
2. WHEN DO WE DISCLOSE PERSONAL INFORMATION WE COLLECT ABOUT YOU?
We may disclose personal information we collect about you in each of the categories listed above to affiliated and nonaffiliated third parties.
30
Morgan Stanley Institutional Fund, Inc.
Annual Report — December 31, 2015
U.S. Privacy Policy (unaudited) (cont'd)
a. Information We Disclose to Affiliated Companies.
We may disclose personal information that we collect about you to our affiliated companies to manage your account(s) effectively, to service and process your transactions, and to let you know about products and services offered by us and affiliated companies, to manage our business, and as otherwise required or permitted by law. Offers for products and services from affiliated companies are developed under conditions designed to safeguard your personal information.
b. Information We Disclose to Third Parties.
We may disclose personal information that we collect about you to nonaffiliated third parties to provide marketing services on our behalf or to other financial institutions with whom we have joint marketing agreements. We may also disclose all of the information we collect to other nonaffiliated third parties for our everyday business purposes, such as to process transactions, maintain account(s), respond to court orders and legal investigations, report to credit bureaus, offer our own products and services, protect against fraud, for institutional risk control, to perform services on our behalf, and as otherwise required or permitted by law.
When we share personal information about you with a nonaffiliated third party, they are required to limit their use of personal information about you to the particular purpose for which it was shared and they are not allowed to share personal information about you with others except to fulfill that limited purpose or as may be permitted or required by law.
3. HOW DO WE PROTECT THE SECURITY AND CONFIDENTIALITY OF PERSONAL INFORMATION WE COLLECT ABOUT YOU?
We maintain physical, electronic and procedural security measures that comply with applicable law and regulations to help safeguard the personal information we collect about you. We have internal policies governing the proper handling of client information by employees. Third parties that provide support or marketing services on our behalf may also receive personal information about you, and we require them to adhere to appropriate security standards with respect to such information.
4. HOW CAN YOU LIMIT OUR SHARING CERTAIN PERSONAL INFORMATION ABOUT YOU WITH OUR AFFILIATED COMPANIES FOR ELIGIBILITY DETERMINATION?
By following the opt-out procedures in Section 6 below, you may limit the extent to which we share with our affiliated companies, personal information that was collected to determine your eligibility for products and services such as your credit reports and other information that you have provided to us or that we may obtain from third parties ("eligibility information"). Eligibility information does not include your identification information or personal information pertaining to our transactions or experiences with you. Please note that, even if you direct us not to share eligibility information with our affiliated companies, we may still share your personal information, including eligibility information, with our affiliated companies under circumstances that are permitted under applicable law, such as to process transactions or to service your account.
5. HOW CAN YOU LIMIT THE USE OF CERTAIN PERSONAL INFORMATION ABOUT YOU BY OUR AFFILIATED COMPANIES FOR MARKETING?
By following the opt-out instructions in Section 6 below, you may limit our affiliated companies from marketing their products or services to you based on personal information we disclose to them. This information may include, for example, your income and account history with us. Please note that, even if you choose to limit our affiliated companies from using personal information about you that we may share with them for marketing their products and services to you, our affiliated companies may use your personal information that they obtain from us to market to you in circumstances permitted by law, such as if the affiliated party has its own relationship with you.
31
Morgan Stanley Institutional Fund, Inc.
Annual Report — December 31, 2015
U.S. Privacy Policy (unaudited) (cont'd)
6. HOW CAN YOU SEND US AN OPT-OUT INSTRUCTION?
If you wish to limit our sharing of eligibility information about you with our affiliated companies, or our affiliated companies' use of personal information for marketing purposes, as described in this notice, you may do so by:
• Calling us at (800) 548-7786
Monday–Friday between 8a.m. and 6p.m. (EST)
• Writing to us at the following address:
Boston Financial Data Services, Inc.
c/o Privacy Coordinator
P.O. Box 219804
Kansas City, Missouri 64121
If you choose to write to us, your request should include: your name, address, telephone number and account number(s) to which the opt-out applies and whether you are opting out with respect to sharing of eligibility information (Section 4 above), or information used for marketing (Section 5 above), or both. Written opt-out requests should not be sent with any other correspondence. In order to process your request, we require that the request be provided by you directly and not through a third party. Once you have informed us about your privacy preferences, your opt-out preference will remain in effect with respect to this Policy (as it may be amended) until you notify us otherwise. If you are a joint account owner, we will accept instructions from any one of you and apply those instructions to the entire account.
Please understand that if you limit our sharing or our affiliated companies' use of personal information, you and any joint account holder(s) may not receive information about our affiliated companies' products and services, including products or services that could help you manage your financial resources and achieve your investment objectives.
If you have more than one account or relationship with us, please specify the accounts to which you would like us to apply your privacy choices. If you have accounts or relationships with our affiliates, you may receive multiple privacy policies from them, and will need to separately notify those companies of your privacy choices for those accounts or relationships.
7. WHAT IF AN AFFILIATED COMPANY BECOMES A NONAFFILIATED THIRD PARTY?
If, at any time in the future, an affiliated company becomes a nonaffiliated third party, further disclosures of personal information made to the former affiliated company will be limited to those described in Section 2(b) above relating to nonaffiliated third parties. If you elected under Section 6 to limit disclosures we make to affiliated companies, or use of personal information by affiliated companies, your election will not apply to use by any former affiliated company of your personal information in their possession once it becomes a nonaffiliated third party.
SPECIAL NOTICE TO RESIDENTS OF VERMONT
The following section supplements our Policy with respect to our individual clients who have a Vermont address and supersedes anything to the contrary in the above Policy with respect to those clients only.
The State of Vermont requires financial institutions to obtain your consent prior to sharing personal information that they collect about you with nonaffiliated third parties, or eligibility information with affiliated companies, other than in certain limited circumstances. Except as permitted by law, we will not share personal information we collect about you with nonaffiliated third parties or eligibility information with affiliated companies, unless you provide us with your written consent to share such information.
SPECIAL NOTICE TO RESIDENTS OF CALIFORNIA
The following section supplements our Policy with respect to our individual clients who have a California address and supersedes anything to the contrary in the above Policy with respect to those clients only.
In response to a California law, if your account has a California home address, your personal information will not be disclosed to nonaffiliated third parties except as permitted by applicable California law, and we will limit sharing such personal information with our affiliates to comply with California privacy laws that apply to us.
32
Morgan Stanley Institutional Fund, Inc.
Annual Report — December 31, 2015
Director and Officer Information (unaudited)
Independent Directors:
| Name, Age and Address of Independent Director | Positions(s) Held with Registrant | Length of Time Served* | Principal Occupation(s) During Past 5 Years and Other Relevant Professional Experience | Number of Portfolios in Fund Complex Overseen by Director** | Other Directorships Held by Independent Director*** | ||||||||||||||||||
| Frank L. Bowman (71) c/o Kramer Levin Naftalis & Frankel LLP Counsel to the Independent Directors 1177 Avenue of the Americas New York, NY 10036 | Director | Since August 2006 | President, Strategic Decisions, LLC (consulting) (since February 2009); Director or Trustee of various Morgan Stanley Funds (since August 2006); Chairperson of the Compliance and Insurance Committee (since October 2015); Formerly, Chairperson of the Insurance Sub-Committee of the Compliance and Insurance Committee (February 2007-December 2015); served as President and Chief Executive Officer of the Nuclear Energy Institute (policy organization) (February 2005-November 2008); retired as Admiral, U.S. Navy after serving over 38 years on active duty including 8 years as Director of the Naval Nuclear Propulsion Program in the Department of the Navy and the U.S. Department of Energy (1996-2004); served as Chief of Naval Personnel (July 1994-September 1996); and on the Joint Staff as Director of Political Military Affairs (June 1992-July 1994); knighted as Honorary Knight Commander of the Most Excellent Order of the British Empire; awarded the Officier de l'Orde National du Mérite by the French Government; elected to the National Academy of Engineering (2009). | 98 | Director of BP p.l.c.; Director of Naval and Nuclear Technologies LLP; Director Emeritus of the Armed Services YMCA; Director of the U.S. Naval Submarine League; Member of the National Security Advisory Council of the Center for U.S. Global Engagement and a member of the CNA Military Advisory Board; Chairman of the Charity, J Street Cup Golf, Trustee of Fairhaven United Methodist Church; and Director of other various non-profit organizations. | ||||||||||||||||||
| Kathleen A. Dennis (62) c/o Kramer Levin Naftalis & Frankel LLP Counsel to the Independent Directors 1177 Avenue of the Americas New York, NY 10036 | Director | Since August 2006 | President, Cedarwood Associates (mutual fund and investment management consulting) (since July 2006); Chairperson of the Money Market and Alternatives Sub-Committee of the Investment Committee (since October 2006) and Director or Trustee of various Morgan Stanley Funds (since August 2006); formerly, Senior Managing Director of Victory Capital Management (1993-2006). | 98 | Director of various nonprofit organizations. | ||||||||||||||||||
| Nancy C. Everett (61) c/o Kramer Levin Naftalis & Frankel LLP Counsel to the Independent Directors 1177 Avenue of the Americas New York, NY 10036 | Director | Since January 2015 | Chief Executive Officer, Virginia Commonwealth University Investment Company (since November 2015); Owner, OBIR, LLC (investment management consulting) (since June 2014); formerly, Managing Director, BlackRock Inc. (February 2011-December 2013); and Chief Executive Officer, General Motors Asset Management (a/k/a Promark Global Advisors, Inc.) (June 2005-May 2010). | 98 | Member of Virginia Commonwealth University School of Business Foundation; formerly, Member of Virginia Commonwealth University Board of Visitors (2013-2015); Member of Committee on Directors for Emerging Markets Growth Fund, Inc. (2007-2010); Chairperson of Performance Equity Management, LLC (2006-2010); and Chairperson, GMAM Absolute Return Strategies Fund, LLC (2006-2010). | ||||||||||||||||||
33
Morgan Stanley Institutional Fund, Inc.
Annual Report — December 31, 2015
Director and Officer Information (unaudited) (cont'd)
Independent Directors: (cont'd)
| Name, Age and Address of Independent Director | Positions(s) Held with Registrant | Length of Time Served* | Principal Occupation(s) During Past 5 Years and Other Relevant Professional Experience | Number of Portfolios in Fund Complex Overseen by Director** | Other Directorships Held by Independent Director*** | ||||||||||||||||||
| Jakki L. Haussler (58) c/o Kramer Levin Naftalis & Frankel LLP Counsel to the Independent Directors 1177 Avenue of the Americas New York, NY 10036 | Director | Since January 2015 | Chairman and Chief Executive Officer, Opus Capital Group (since January 1996); and formerly, Director, Capvest Venture Fund, LP (May 2000-December 2011); Partner, Adena Ventures, LP (July 1999-December 2010); Director, The Victory Funds (February 2005-July 2008). | 98 | Director of Cincinnati Bell Inc. and Member, Audit Committee and Compensation Committee; Director of Northern Kentucky University Foundation and Member, Investment Committee; Member of Chase College of Law Transactional Law Practice Center Board of Advisors; Director of Best Transport; Chase College of Law Board of Visitors; formerly Member, University of Cincinnati Foundation Investment Committee; Member, Miami University Board of Visitors (2008-2011); Trustee of Victory Funds (2005-2008) and Chairman, Investment Committee (2007-2008) and Member, Service Provider Committee (2005-2008). | ||||||||||||||||||
| Dr. Manuel H. Johnson (67) c/o Johnson Smick International, Inc. 220 I Street, N.E. — Suite 200 Washington, D.C. 20002 | Director | Since July 1991 | Senior Partner, Johnson Smick International, Inc. (consulting firm); Chairperson of the Investment Committee (since October 2006) and Director or Trustee of various Morgan Stanley Funds (since July 1991); Co-Chairman and a founder of the Group of Seven Council (G7C) (international economic commission); formerly Chairperson of the Audit Committee (July 1991-September 2006), Vice Chairman of the Board of Governors of the Federal Reserve System and Assistant Secretary of the U.S. Treasury. | 100 | Director of NVR, Inc. (home construction). | ||||||||||||||||||
| Joseph J. Kearns (73) c/o Kearns & Associates LLC 23823 Malibu Road S-50-440 Malibu, CA 90265 | Director | Since August 1994 | President, Kearns & Associates LLC (investment consulting); Chairperson of the Audit Committee (since October 2006) and Director or Trustee of various Morgan Stanley Funds (since August 1994); formerly, Deputy Chairperson of the Audit Committee (July 2003-September 2006) and Chairperson of the Audit Committee of various Morgan Stanley Funds (since August 1994); CFO of the J. Paul Getty Trust. | 101 | Director of Electro Rent Corporation (equipment leasing). Prior to December 31, 2013, Director of The Ford Family Foundation. | ||||||||||||||||||
34
Morgan Stanley Institutional Fund, Inc.
Annual Report — December 31, 2015
Director and Officer Information (unaudited) (cont'd)
Independent Directors: (cont'd)
| Name, Age and Address of Independent Director | Positions(s) Held with Registrant | Length of Time Served* | Principal Occupation(s) During Past 5 Years and Other Relevant Professional Experience | Number of Portfolios in Fund Complex Overseen by Director** | Other Directorships Held by Independent Director*** | ||||||||||||||||||
| Michael F. Klein (57) c/o Kramer Levin Naftalis & Frankel LLP Counsel to the Independent Directors 1177 Avenue of the Americas New York, NY 10036 | Director | Since August 2006 | Managing Director, Aetos Capital, LLC (since March 2000); Co-President, Aetos Alternatives Management, LLC (since January 2004); and Co-Chief Executive Officer of Aetos Capital LLC (since August 2013); Chairperson of the Fixed Income Sub-Committee of the Investment Committee (since October 2006) and Director or Trustee of various Morgan Stanley Funds (since August 2006); formerly, Managing Director, Morgan Stanley & Co. Inc. and Morgan Stanley Dean Witter Investment Management, President, various Morgan Stanley Funds (June1998-March 2000) and Principal, Morgan Stanley & Co. Inc. and Morgan Stanley Dean Witter Investment Management (August 1997-December 1999). | 97 | Director of certain investment funds managed or sponsored by Aetos Capital, LLC. Director of Sanitized AG and Sanitized Marketing AG (specialty chemicals). | ||||||||||||||||||
| Michael E. Nugent (79) 522 Fifth Avenue New York, NY 10036 | Chair of the Board and Director | Chair of the Boards since July 2006 and Director since July 1991 | Chair of the Boards of various Morgan Stanley Funds (since July 2006); Chairperson of the Closed-End Fund Committee (since June 2012) and Director or Trustee of various Morgan Stanley Funds (since July 1991); formerly, Chairperson of the Insurance Committee (until July 2006), General Partner, TriumphCapital, L.P. (private investment partnership) (1988-2013). | 100 | None. | ||||||||||||||||||
| W. Allen Reed (68) c/o Kramer Levin Naftalis & Frankel LLP Counsel to the Independent Directors 1177 Avenue of the Americas New York, NY 10036 | Director | Since August 2006 | Chairperson of the Equity Sub-Committee of the Investment Committee (since October 2006) and Director or Trustee of various Morgan Stanley Funds (since August 2006); formerly, President and CEO of General Motors Asset Management; Chairman and Chief Executive Officer of the GM Trust Bank and Corporate Vice President of General Motors Corporation (August 1994-December 2005). | 98 | Director of Legg Mason, Inc., formerly Director of the Auburn University Foundation (2010-2015). | ||||||||||||||||||
| Fergus Reid (83) c/o Joe Pietryka, Inc. 85 Charles Colman Blvd. Pawling, NY 12564 | Director | Since June 1992 | Chairman, Joe Pietryka, Inc.; Chairperson of the Governance Committee and Director or Trustee of various Morgan Stanley Funds (since June 1992). | 100 | Formerly, Trustee and Director of certain investment companies in the JP Morgan Fund Complex managed by JP Morgan Investment Management Inc. (1987-2012). | ||||||||||||||||||
35
Morgan Stanley Institutional Fund, Inc.
Annual Report — December 31, 2015
Director and Officer Information (unaudited) (cont'd)
Interested Director:
| Name, Age and Address of Interested Director | Positions(s) Held with Registrant | Length of Time Served* | Principal Occupation(s) During Past 5 Years | Number of Portfolios in Fund Complex Overseen by Interested Director** | Other Directorships Held by Interested Director*** | ||||||||||||||||||
| James F. Higgins (68) One New York Plaza, New York, NY 10004 | Director | Since June 2000 | Director or Trustee of various Morgan Stanley Funds (since June 2000); Senior Advisor of Morgan Stanley (since August 2000). | 99 | Formerly, Director of AXA Financial, Inc. and AXA Equitable Life Insurance Company (2002-2011) and Director of AXA MONY Life Insurance Company and AXA MONY Life Insurance Company of America (2004-2011). | ||||||||||||||||||
* This is the earliest date the Director began serving the Morgan Stanley Funds. Each Director serves an indefinite term, until his or her successor is elected.
** The Fund Complex includes (as of December 31, 2015) all open-end and closed-end funds (including all of their portfolios) advised by Morgan Stanley Investment Management Inc. (the "Adviser") and any funds that have an adviser that is an affiliated person of the Adviser (including, but not limited to, Morgan Stanley AIP GP LP).
*** This includes any directorships at public companies and registered investment companies held by the Director at any time during the past five years.
Executive Officers:
Name, Age and Address of Executive Officer | Position(s) Held with Registrant | Length of Time Served**** | Principal Occupation(s) During Past 5 Years | ||||||||||||
| John H. Gernon (52) 522 Fifth Avenue New York, NY 10036 | President and Principal Executive Officer | Since September 2013 | President and Principal Executive Officer of the Equity and Fixed Income Funds and the Morgan Stanley AIP Funds (since September 2013) and the Liquidity Funds and various money market funds (since May 2014) in the Fund Complex, Managing Director of the Adviser; Head of Product (since 2006). | ||||||||||||
| Stefanie V. Chang Yu (49) 522 Fifth Avenue New York, NY 10036 | Chief Compliance Officer | Since December 1997 | Managing Director of the Adviser and various entities affiliated with the Adviser; Chief Compliance Officer of various Morgan Stanley Funds and the Adviser (since January 2014); formerly, Vice President of various Morgan Stanley Funds (December 1997-January 2014). | ||||||||||||
| Joseph C. Benedetti (50) 522 Fifth Avenue New York, NY 10036 | Vice President | Since January 2014 | Managing Director of the Adviser and various entities affiliated with the Adviser; Vice President of various Morgan Stanley Funds (since January 2014); formerly, Assistant Secretary of various Morgan Stanley Funds (October 2004-January 2014). | ||||||||||||
| Francis J. Smith (50) 522 Fifth Avenue New York, NY 10036 | Treasurer and Principal Financial Officer | Treasurer since July 2003 and Principal Financial Officer since September 2002 | Executive Director of the Adviser and various entities affiliated with the Adviser; Treasurer (since July 2003) and Principal Financial Officer of various Morgan Stanley Funds (since September 2002). | ||||||||||||
| Mary E. Mullin (48) 522 Fifth Avenue New York, NY 10036 | Secretary | Since June 1999 | Executive Director of the Adviser; Secretary of various Morgan Stanley Funds (since June 1999). | ||||||||||||
**** This is the earliest date the officer began serving the Morgan Stanley Funds. Each officer serves a one-year term, until his or her successor is elected and has qualified.
36
Morgan Stanley Institutional Fund, Inc.
Annual Report — December 31, 2015
Adviser and Administrator
Morgan Stanley Investment Management Inc.
522 Fifth Avenue
New York, New York 10036
Distributor
Morgan Stanley Distribution, Inc.
522 Fifth Avenue
New York, New York 10036
Dividend Disbursing and Transfer Agent
Boston Financial Data Services, Inc.
2000 Crown Colony Drive
Quincy, Massachusetts 02169
Custodian
State Street Bank and Trust Company
One Lincoln Street
Boston, Massachusetts 02111
Legal Counsel
Dechert LLP
1095 Avenue of the Americas
New York, New York 10036
Counsel to the Independent Directors
Kramer Levin Naftalis & Frankel LLP
1177 Avenue of the Americas
New York, New York 10036
Independent Registered Public Accounting Firm
Ernst & Young LLP
200 Clarendon Street
Boston, Massachusetts 02116
Reporting to Shareholders
Each Morgan Stanley fund provides a complete schedule of portfolio holdings in its semi-annual and annual reports within 60 days of the end of the fund's second and fourth fiscal quarters. The semi-annual and annual reports are filed electronically with the Securities and Exchange Commission (SEC) on Form N-CSRS and Form N-CSR, respectively. Morgan Stanley also delivers the semi-annual and annual reports to fund shareholders and makes these reports available on its public website, www.morganstanley.com/im. Each Morgan Stanley fund also files a complete schedule of portfolio holdings with the SEC for the fund's first and third fiscal quarters on Form N-Q. Morgan Stanley does not deliver the reports for the first and third fiscal quarters to shareholders, nor are the reports posted to the Morgan Stanley public website. You may, however, obtain the Form N-Q filings (as well as the Form N-CSR and N-CSRS filings) by accessing the SEC's website, www.sec.gov. You may also review and copy them at the SEC's Public Reference Room in Washington, DC. Information on the operation of the SEC's Public Reference Room may be obtained by calling the SEC toll free at 1 (800) SEC-0330. You can also request copies of these materials, upon payment of a duplicating fee, by electronic request at the SEC's email address (publicinfo@sec.gov) or by writing the Public Reference Room of the SEC, Washington, DC 20549-0102.
Proxy Voting Policies and Procedures and Proxy Voting Record
You may obtain a copy of the Fund's Proxy Voting Policy and Procedures and information regarding how the Fund voted proxies relating to portfolio securities during the most recent twelve-month period ended June 30, without charge, upon request, by calling toll free 1 (800) 548-7786 or by visiting our website at www.morganstanley.com/im. This information is also available on the SEC's website at www.sec.gov.
This report is authorized for distribution only when preceded or accompanied by a prospectus of the Morgan Stanley Institutional Fund, Inc., which describes in detail each Portfolio's investment policies, risks, fees and expenses. Please read the prospectus carefully before you invest or send money. For additional information, including information regarding the investments comprising the Portfolio, please visit our website at www.morganstanley.com/im or call toll free 1 (800) 548-7786.
37
Printed in U.S.A.
This Report has been prepared for shareholders and may be distributed to others only if preceded or accompanied by a current prospectus.
Morgan Stanley Investment Management Inc.
522 Fifth Avenue
New York, New York 10036
© 2016 Morgan Stanley. Morgan Stanley Distribution, Inc.

IFIGDANN
1405141 EXP. 02.28.17
INVESTMENT MANAGEMENT

Morgan Stanley Institutional Fund, Inc.
International Advantage Portfolio
Annual Report
December 31, 2015

Morgan Stanley Institutional Fund, Inc.
Annual Report — December 31, 2015
Table of Contents
Shareholders' Letter | 2 | ||||||
Expense Example | 3 | ||||||
Investment Overview | 4 | ||||||
Portfolio of Investments | 6 | ||||||
Statement of Assets and Liabilities | 8 | ||||||
Statement of Operations | 10 | ||||||
Statements of Changes in Net Assets | 11 | ||||||
Financial Highlights | 13 | ||||||
Notes to Financial Statements | 17 | ||||||
Report of Independent Registered Public Accounting Firm | 26 | ||||||
Federal Tax Notice | 27 | ||||||
U.S. Privacy Policy | 28 | ||||||
Director and Officer Information | 31 | ||||||
This report is authorized for distribution only when preceded or accompanied by prospectuses of the Morgan Stanley Institutional Fund, Inc. To receive a prospectus and/or statement of additional information (SAI), which contains more complete information such as investment objectives, charges, expenses, policies for voting proxies, risk considerations, and describes in detail each of the Portfolio's investment policies to the prospective investor, please call toll free 1 (800) 548-7786. Please read the prospectuses carefully before you invest or send money.
Additionally, you can access portfolio information including performance, characteristics, and investment team commentary through Morgan Stanley Investment Management's website: www.morganstanley.com/im.
Market forecasts provided in this report may not necessarily come to pass. There is no guarantee that any sectors mentioned will continue to perform as discussed herein or that securities in such sectors will be held by the Portfolio in the future. There is no assurance that a Portfolio will achieve its investment objective. Portfolios are subject to market risk, which is the possibility that market values of securities owned by the Portfolio will decline and, therefore, the value of the Portfolio's shares may be less than what you paid for them. Accordingly, you can lose money investing in this Portfolio. Please see the prospectus for more complete information on investment risks.
1
Morgan Stanley Institutional Fund, Inc.
Annual Report — December 31, 2015
Shareholders' Letter (unaudited)
Dear Shareholders,
We are pleased to provide this Annual report, in which you will learn how your investment in International Advantage Portfolio (the "Portfolio") performed during the latest twelve-month period.
Morgan Stanley Investment Management is a client-centric, investor-led organization. Our global presence, intellectual capital, and breadth of products and services enable us to partner with investors to meet the evolving challenges of today's financial markets. We aim to deliver superior investment service and to empower our clients to make the informed decisions that help them reach their investment goals.
As always, we thank you for selecting Morgan Stanley Investment Management, and look forward to working with you in the months and years ahead.
Sincerely,

John H. Gernon
President and Principal Executive Officer
January 2016
2
Morgan Stanley Institutional Fund, Inc.
Annual Report — December 31, 2015
Expense Example (unaudited)
International Advantage Portfolio
As a shareholder of the Portfolio, you incur two types of costs: (1) transactional costs, including redemptions fees; and (2) ongoing costs, including advisory fees, administration fees, distribution and shareholder services fees and other Portfolio expenses. This example is intended to help you understand your ongoing costs (in dollars) of investing in the Portfolio and to compare these costs with the ongoing costs of investing in other mutual funds.
This example is based on an investment of $1,000 invested at the beginning of the six-month period ended December 31, 2015 and held for the entire six-month period.
Actual Expenses
The table below provides information about actual account values and actual expenses. You may use the information in this table, together with the amount you invested, to estimate the expenses that you paid over the period. Simply divide your account value by $1,000 (for example, an $8,600 account value divided by $1,000 = 8.6), then multiply the result by the number in the table under the heading entitled "Actual Expenses Paid During Period" to estimate the expenses you paid on your account during this period.
Hypothetical Example for Comparison Purposes
The table below provides information about hypothetical account values and hypothetical expenses based on the Portfolio's actual expense ratio and an assumed rate of return of 5% per year before expenses, which is not the Portfolio's actual return. The hypothetical account values and expenses may not be used to estimate the actual ending account balance or expenses you paid for the period. You may use this information to compare the ongoing costs of investing in the Portfolio and other funds. To do so, compare this 5% hypothetical example with the 5% hypothetical examples that appear in the shareholder reports of the other funds.
Please note that the expenses shown in the table are meant to highlight your ongoing costs only and do not reflect any transactional costs, such as sales charges (loads) and redemption fees. Therefore, the information for each class in the table is useful in comparing ongoing costs only, and will not help you determine the relative total costs of owning different funds. In addition, if these transactional costs were included, your costs would have been higher.
| Beginning Account Value 7/1/15 | Actual Ending Account Value 12/31/15 | Hypothetical Ending Account Value | Actual Expenses Paid During Period* | Hypothetical Expenses Paid During Period* | Net Expense Ratio During Period** | ||||||||||||||||||||||
International Advantage Portfolio Class I | $ | 1,000.00 | $ | 980.20 | $ | 1,020.16 | $ | 4.99 | $ | 5.09 | 1.00 | % | |||||||||||||||
International Advantage Portfolio Class A | 1,000.00 | 979.60 | 1,018.40 | 6.74 | 6.87 | 1.35 | |||||||||||||||||||||
International Advantage Portfolio Class L | 1,000.00 | 976.70 | 1,015.88 | 9.22 | 9.40 | 1.85 | |||||||||||||||||||||
International Advantage Portfolio Class C | 1,000.00 | 975.10 | 1,014.62 | 10.45 | 10.66 | 2.10 | |||||||||||||||||||||
* Expenses are calculated using each Portfolio Class' annualized net expense ratio (as disclosed), multiplied by the average account value over the period, and multiplied by 184/365 (to reflect the most recent one-half year period).
** Annualized.
3
Morgan Stanley Institutional Fund, Inc.
Annual Report — December 31, 2015
Investment Overview (unaudited)
International Advantage Portfolio
The Portfolio seeks long-term capital appreciation.
Performance
For the year ended December 31, 2015, the Portfolio's Class I shares had a total return based on net asset value and reinvestment of distributions per share of 10.23%, net of fees. The Portfolio's Class I shares outperformed the Portfolio's benchmark, the MSCI All Country World Index ex USA Index (the "Index"), which returned –5.66%.
Factors Affecting Performance
• International equity markets declined 5.66% for the period, as measured by the Index. A backdrop of weak global economic growth, intensifying concerns about China's slowdown, shifting sentiment about central bank policies and a sustained decline in commodity prices weighed on the markets throughout the year. On a regional basis, Japan's 9.6% gain outperformed Europe's modest decline of 2.8%, while emerging market equities suffered a 14.9% loss (as measured by the MSCI Japan Index, MSCI Europe Index and MSCI Emerging Markets Index, respectively).
• The Portfolio's relative outperformance versus the Index was driven primarily by stock selection. Sector allocation, a result of where we're finding the most attractive individual stock opportunities, also contributed positively to relative performance.
• Stock selection in the consumer discretionary sector added the most to relative returns, where positions in a provider of after-school private tutoring services to primary and secondary students in China and a vertically-integrated music streaming provider in Korea were the third- and fifth-largest contributors, respectively, to Portfolio performance during the period. Within the sector, performance was negatively impacted by a position in a U.K. luxury goods retailer that was the main detractor from relative performance.
• Stock selection in the information technology (IT) sector was the second-largest contributor to the Portfolio during the period. The Portfolio's holdings in two IT services providers with cost advantages in software development outsourcing were the respective first- and second-largest contributors to the performance of the Portfolio during the period. Performance was hampered by a position in a Korean internet search and messaging provider.
• The consumer staples sector was the third-largest contributor to the Portfolio during the period due to stock selection and an overweight position, led by holdings in a liquor producer in China (which is not represented in the Index)(i) and a snack foods company in Japan.
• The Portfolio's lack of exposure to the materials sector also contributed positively to performance.
• The Portfolio's lack of exposure to the telecommunication services sector and individual positions in the financial services sector, including a Cayman property and casualty reinsurer and Brazilian clearing house, also detracted from relative performance versus the Index during the period.
Management Strategies
• There were no changes to our bottom-up investment process during the period. The Growth Team seeks high quality companies, which we define primarily as those with sustainable competitive advantages. Our team continues to focus on bottom-up stock selection and the long-term outlook for companies owned in the portfolio; accordingly, we have had very limited turnover in the portfolio to date, as our ongoing work reaffirms our assessment of quality and competitive advantage in the names we own.
(i) To gain exposure to the stock, the Portfolio utilized a P-note (participation note), which is intended to mirror the performance of the underlying stock. There is no leverage associated with P-notes.
4
Morgan Stanley Institutional Fund, Inc.
Annual Report — December 31, 2015
Investment Overview (unaudited) (cont'd)
International Advantage Portfolio
* Minimum Investment for Class I shares
** Commenced Operations on December 28, 2010.
In accordance with SEC regulations, the Portfolio's performance shown assumes that all recurring fees (including management fees) were deducted and all dividends and distributions were reinvested. The performance of Class A, L and C shares will vary from the performance of Class I shares based upon their different incept dates and will be impacted by additional fees assessed to those classes.
Performance Compared to the MSCI All Country World ex USA Index(1) and the Lipper International Multi-Cap Growth Funds Index(2)
| Period Ended December 31, 2015 Total Returns(3) | |||||||||||||||||||
Average Annual | |||||||||||||||||||
| One Year | Five Years | Ten Years | Since Inception(6) | ||||||||||||||||
| Portfolio — Class I Shares w/o sales charges(4) | 10.23 | % | 8.81 | % | — | 8.78 | % | ||||||||||||
| Portfolio — Class A Shares w/o sales charges(4) | 9.92 | 8.51 | — | 8.47 | |||||||||||||||
| Portfolio — Class A Shares with maximum 5.25% sales charges(4) | 4.12 | 7.35 | — | 7.32 | |||||||||||||||
| Portfolio — Class L Shares w/o sales charges(4) | 9.34 | 7.96 | — | 7.93 | |||||||||||||||
| Portfolio — Class C Shares w/o sales charges(5) | — | — | — | –2.63 | |||||||||||||||
| Portfolio — Class C Shares with maximum 1.00% deferred sales charges(5) | — | — | — | –3.48 | |||||||||||||||
| MSCI All Country World ex USA Index | –5.66 | 1.06 | — | 1.28 | |||||||||||||||
| Lipper International Multi-Cap Growth Funds Index | –1.31 | 2.70 | — | 2.92 | |||||||||||||||
Performance data quoted represents past performance, which is no guarantee of future results, and current performance may be lower or higher than the figures shown. Performance assumes that all dividends and distributions, if any, were reinvested. For the most recent month-end performance figures, please visit www.morganstanley.com/im. Investment return and principal value will fluctuate so that Portfolio shares, when redeemed, may be worth more or less than their original cost. Total returns do not reflect the deduction of taxes that a shareholder would pay on Portfolio distributions or the redemption of Portfolio shares. Returns for periods less than one year are not annualized. Performance of share classes will vary due to difference in sales charges and expenses.
(1) The MSCI All Country World ex USA Index is a free float-adjusted market capitalization weighted index designed to measure the equity market performance of developed and emerging markets, excluding the United States. The term "free float" represents the portion of shares outstanding that are deemed to be available for purchase in the public equity markets by investors. The Index is unmanaged and its returns do not include any sales charges or fees. Such costs would lower performance. It is not possible to invest directly in an index.
(2) The Lipper International Multi-Cap Growth Funds Index is an equally weighted performance index of the largest qualifying funds (based on net assets) in the Lipper International Multi-Cap Growth Funds classification. The Index, which is adjusted for capital gains distributions and income dividends, is unmanaged and should not be considered an investment. There are currently 30 funds represented in this Index. As of the date of this report, the Portfolio was in the Lipper International Multi-Cap Growth Funds classification.
(3) Total returns for the Portfolio reflect fees waived and expenses reimbursed, if applicable, by the Adviser. Without such waivers and reimbursements, total returns would have been lower.
(4) Commenced operations on December 28, 2010.
(5) Commenced offering on April 30, 2015.
(6) For comparative purposes, average annual since inception returns listed for the Indexes refer to the inception date of Class I of the Portfolio, not the inception of the Index.
5
Morgan Stanley Institutional Fund, Inc.
Annual Report — December 31, 2015
Portfolio of Investments
International Advantage Portfolio
Shares | Value (000) | ||||||||||
Common Stocks (96.0%) | |||||||||||
Australia (3.1%) | |||||||||||
Aurizon Holding Ltd. | 20,115 | $ | 64 | ||||||||
CSL Ltd. | 1,499 | 114 | |||||||||
178 | |||||||||||
Belgium (3.6%) | |||||||||||
Anheuser-Busch InBev N.V. | 1,711 | 211 | |||||||||
Brazil (1.4%) | |||||||||||
CETIP SA — Mercados Organizados | 8,571 | 81 | |||||||||
Canada (4.5%) | |||||||||||
Brookfield Asset Management, Inc., Class A | 3,105 | 98 | |||||||||
Brookfield Infrastructure Partners LP | 4,293 | 163 | |||||||||
261 | |||||||||||
China (9.0%) | |||||||||||
Jiangsu Hengrui Medicine Co., Ltd., Class A | 15,200 | 115 | |||||||||
TAL Education Group ADR (a) | 5,225 | 243 | |||||||||
Tencent Holdings Ltd. (b) | 8,300 | 162 | |||||||||
520 | |||||||||||
Denmark (6.4%) | |||||||||||
DSV A/S | 9,396 | 369 | |||||||||
France (9.3%) | |||||||||||
Christian Dior SE | 1,064 | 180 | |||||||||
Danone SA | 1,778 | 120 | |||||||||
Hermes International | 370 | 125 | |||||||||
Pernod Ricard SA | 1,001 | 114 | |||||||||
539 | |||||||||||
Germany (2.6%) | |||||||||||
Adidas AG | 1,563 | 152 | |||||||||
Hong Kong (3.0%) | |||||||||||
AIA Group Ltd. | 29,200 | 174 | |||||||||
Japan (8.8%) | |||||||||||
Calbee, Inc. | 6,800 | 285 | |||||||||
Japan Airport Terminal Co., Ltd. | 5,000 | 222 | |||||||||
507 | |||||||||||
Korea, Republic of (5.6%) | |||||||||||
Loen Entertainment, Inc. (a) | 3,182 | 226 | |||||||||
NAVER Corp. (a) | 177 | 99 | |||||||||
325 | |||||||||||
Norway (2.6%) | |||||||||||
Telenor ASA | 3,472 | 58 | |||||||||
TGS Nopec Geophysical Co., ASA | 5,783 | 91 | |||||||||
149 | |||||||||||
Switzerland (5.8%) | |||||||||||
Kuehne & Nagel International AG (Registered) | 1,214 | 167 | |||||||||
Nestle SA (Registered) | 2,259 | 167 | |||||||||
334 | |||||||||||
United Kingdom (13.2%) | |||||||||||
Burberry Group PLC | 11,531 | 203 | |||||||||
Diageo PLC | 4,247 | 116 | |||||||||
Hargreaves Lansdown PLC | 6,445 | 143 | |||||||||
Shares | Value (000) | ||||||||||
Intertek Group PLC | 2,648 | $ | 108 | ||||||||
Reckitt Benckiser Group PLC | 2,115 | 194 | |||||||||
764 | |||||||||||
United States (17.1%) | |||||||||||
Cognizant Technology Solutions Corp., Class A (a) | 4,020 | 241 | |||||||||
EPAM Systems, Inc. (a) | 3,356 | 264 | |||||||||
Globant SA (a) | 1,225 | 46 | |||||||||
Luxoft Holding, Inc. (a) | 3,156 | 244 | |||||||||
Priceline Group, Inc. (The) (a) | 153 | 195 | |||||||||
990 | |||||||||||
Total Common Stocks (Cost $5,272) | 5,554 | ||||||||||
Participation Notes (2.4%) | |||||||||||
China (2.4%) | |||||||||||
| Foshan Haitian Flavouring & Food Company Ltd., Class A, Equity Linked Notes, expires 10/11/24 (a) | 9,060 | 49 | |||||||||
| Kweichow Moutai Co., Ltd., Class A, Equity Linked Notes, expires 3/4/21 (a) | 2,614 | 88 | |||||||||
Total Participation Notes (Cost $100) | 137 | ||||||||||
| Notional Amount | |||||||||||
Call Option Purchased (0.2%) | |||||||||||
Foreign Currency Option (0.2%) | |||||||||||
| USD/CNY June 2016 @ CNY 6.70, Royal Bank of Scotland (Cost $3) | 834,971 | 14 | |||||||||
Shares | |||||||||||
Short-Term Investment (5.6%) | |||||||||||
Investment Company (5.6%) | |||||||||||
| Morgan Stanley Institutional Liquidity Funds — Money Market Portfolio — Institutional Class (See Note G) (Cost $325) | 324,561 | 325 | |||||||||
Total Investments (104.2%) (Cost $5,700) (c)(d) | 6,030 | ||||||||||
Liabilities in Excess of Other Assets (–4.2%) | (245 | ) | |||||||||
Net Assets (100.0%) | $ | 5,785 | |||||||||
(a) Non-income producing security.
(b) Security trades on the Hong Kong exchange.
(c) The approximate fair value and percentage of net assets, $4,060,000 and 70.2%, respectively, represent the securities that have been fair valued under the fair valuation policy for international investments as described in Note A-1 within the Notes to the Financial Statements.
(d) At December 31, 2015, the aggregate cost for Federal income tax purposes is approximately $5,717,000. The aggregate gross unrealized appreciation is approximately $477,000 and the aggregate gross unrealized depreciation is approximately $164,000 resulting in net unrealized appreciation of approximately $313,000.
ADR American Depositary Receipt.
CNY Chinese Yuan Renminbi
USD United States Dollar
The accompanying notes are an integral part of the financial statements.
6
Morgan Stanley Institutional Fund, Inc.
Annual Report — December 31, 2015
Portfolio of Investments (cont'd)
International Advantage Portfolio
Portfolio Composition
Classification | Percentage of Total Investments | ||||||
Other* | 45.0 | % | |||||
Information Technology Services | 12.4 | ||||||
Textiles, Apparel & Luxury Goods | 10.9 | ||||||
Food Products | 10.3 | ||||||
Beverages | 8.8 | ||||||
Road & Rail | 7.2 | ||||||
Short-Term Investment | 5.4 | ||||||
Total Investments | 100.0 | % | |||||
* Industries and/or investment types representing less than 5% of total investments.
The accompanying notes are an integral part of the financial statements.
7
Morgan Stanley Institutional Fund, Inc.
Annual Report — December 31, 2015
International Advantage Portfolio
Statement of Assets and Liabilities | December 31, 2015 (000) | ||||||
Assets: | |||||||
Investments in Securities of Unaffiliated Issuers, at Value (Cost $5,375) | $ | 5,705 | |||||
Investment in Security of Affiliated Issuer, at Value (Cost $325) | 325 | ||||||
Total Investments in Securities, at Value (Cost $5,700) | 6,030 | ||||||
Foreign Currency, at Value (Cost $1) | 1 | ||||||
Cash | 2 | ||||||
Receivable for Investments Sold | 220 | ||||||
Due from Adviser | 53 | ||||||
Receivable for Portfolio Shares Sold | 17 | ||||||
Tax Reclaim Receivable | 7 | ||||||
Dividends Receivable | 2 | ||||||
Receivable from Affiliate | — | @ | |||||
Other Assets | 35 | ||||||
Total Assets | 6,367 | ||||||
Liabilities: | |||||||
Payable for Investments Purchased | 543 | ||||||
Payable for Professional Fees | 18 | ||||||
Payable for Custodian Fees | 10 | ||||||
Payable for Transfer Agency Fees — Class I | — | @ | |||||
Payable for Transfer Agency Fees — Class A | — | @ | |||||
Payable for Transfer Agency Fees — Class L | — | @ | |||||
Payable for Transfer Agency Fees — Class C | — | @ | |||||
Payable for Shareholder Services Fees — Class A | 1 | ||||||
Payable for Distribution and Shareholder Services Fees — Class L | — | @ | |||||
Payable for Distribution and Shareholder Services Fees — Class C | — | @ | |||||
Payable for Sub Transfer Agency Fees — Class I | — | @ | |||||
Payable for Sub Transfer Agency Fees — Class A | — | @ | |||||
Payable for Sub Transfer Agency Fees — Class L | — | @ | |||||
Payable for Sub Transfer Agency Fees — Class C | — | @ | |||||
Payable for Administration Fees | — | @ | |||||
Other Liabilities | 10 | ||||||
Total Liabilities | 582 | ||||||
Net Assets | $ | 5,785 | |||||
Net Assets Consist Of: | |||||||
Paid-in-Capital | $ | 5,488 | |||||
Distributions in Excess of Net Investment Income | (— | @) | |||||
Distributions in Excess of Net Realized Gain | (32 | ) | |||||
Unrealized Appreciation (Depreciation) on: | |||||||
Investments | 330 | ||||||
Foreign Currency Translations | (1 | ) | |||||
Net Assets | $ | 5,785 | |||||
The accompanying notes are an integral part of the financial statements.
8
Morgan Stanley Institutional Fund, Inc.
Annual Report — December 31, 2015
International Advantage Portfolio
Statement of Assets and Liabilities (cont'd) | December 31, 2015 (000) | ||||||
CLASS I: | |||||||
Net Assets | $ | 2,361 | |||||
| Shares Outstanding $0.001 par value shares of beneficial interest (unlimited shares authorized) (not in 000's) | 199,979 | ||||||
Net Asset Value, Offering and Redemption Price Per Share | $ | 11.80 | |||||
CLASS A: | |||||||
Net Assets | $ | 2,966 | |||||
| Shares Outstanding $0.001 par value shares of beneficial interest (unlimited shares authorized) (not in 000's) | 251,558 | ||||||
Net Asset Value, Redemption Price Per Share | $ | 11.79 | |||||
Maximum Sales Load | 5.25 | % | |||||
Maximum Sales Charge | $ | 0.65 | |||||
Maximum Offering Price Per Share | $ | 12.44 | |||||
CLASS L: | |||||||
Net Assets | $ | 211 | |||||
| Shares Outstanding $0.001 par value shares of beneficial interest (unlimited shares authorized) (not in 000's) | 18,039 | ||||||
Net Asset Value, Offering and Redemption Price Per Share | $ | 11.69 | |||||
CLASS C: | |||||||
Net Assets | $ | 247 | |||||
| Shares Outstanding $0.001 par value shares of beneficial interest (unlimited shares authorized) (not in 000's) | 21,198 | ||||||
Net Asset Value, Offering and Redemption Price Per Share | $ | 11.66 | |||||
@ Amount is less than $500.
The accompanying notes are an integral part of the financial statements.
9
Morgan Stanley Institutional Fund, Inc.
Annual Report — December 31, 2015
International Advantage Portfolio
Statement of Operations | Year Ended December 31, 2015 (000) | ||||||
Investment Income: | |||||||
Dividends from Securities of Unaffiliated Issuers (Net of $10 of Foreign Taxes Withheld) | $ | 86 | |||||
Income from Securities Loaned — Net | 2 | ||||||
Dividends from Security of Affiliated Issuer (Note G) | — | @ | |||||
Total Investment Income | 88 | ||||||
Expenses: | |||||||
Professional Fees | 82 | ||||||
Registration Fees | 45 | ||||||
Advisory Fees (Note B) | 42 | ||||||
Custodian Fees (Note F) | 35 | ||||||
Transfer Agency Fees — Class I (Note E) | 2 | ||||||
Transfer Agency Fees — Class A (Note E) | 2 | ||||||
Transfer Agency Fees — Class L (Note E) | 2 | ||||||
Transfer Agency Fees — Class C (Note E) | 1 | ||||||
Pricing Fees | 6 | ||||||
Shareholder Reporting Fees | 5 | ||||||
Shareholder Services Fees — Class A (Note D) | 3 | ||||||
Distribution and Shareholder Services Fees — Class L (Note D) | 1 | ||||||
Distribution and Shareholder Services Fees — Class C (Note D) | 1 | ||||||
Administration Fees (Note C) | 4 | ||||||
Sub Transfer Agency Fees — Class I | — | @ | |||||
Sub Transfer Agency Fees — Class A | 1 | ||||||
Sub Transfer Agency Fees — Class L | — | @ | |||||
Sub Transfer Agency Fees — Class C | — | @ | |||||
Directors' Fees and Expenses | 1 | ||||||
Other Expenses | 19 | ||||||
Total Expenses | 252 | ||||||
Expenses Reimbursed by Adviser (Note B) | (141 | ) | |||||
Waiver of Advisory Fees (Note B) | (42 | ) | |||||
Reimbursement of Class Specific Expenses — Class I (Note B) | (2 | ) | |||||
Reimbursement of Class Specific Expenses — Class A (Note B) | (2 | ) | |||||
Reimbursement of Class Specific Expenses — Class L (Note B) | (2 | ) | |||||
Reimbursement of Class Specific Expenses — Class C (Note B) | (1 | ) | |||||
Rebate from Morgan Stanley Affiliate (Note G) | (— | @) | |||||
Net Expenses | 62 | ||||||
Net Investment Income | 26 | ||||||
Realized Gain (Loss): | |||||||
Investments Sold | 598 | ||||||
Foreign Currency Transactions | (4 | ) | |||||
Net Realized Gain | 594 | ||||||
Change in Unrealized Appreciation (Depreciation): | |||||||
Investments | (85 | ) | |||||
Foreign Currency Translations | (— | @) | |||||
Net Change in Unrealized Appreciation (Depreciation) | (85 | ) | |||||
Net Realized Gain and Change in Unrealized Appreciation (Depreciation) | 509 | ||||||
Net Increase in Net Assets Resulting from Operations | $ | 535 | |||||
@ Amount is less than $500.
The accompanying notes are an integral part of the financial statements.
10
Morgan Stanley Institutional Fund, Inc.
Annual Report — December 31, 2015
International Advantage Portfolio
Statements of Changes in Net Assets | Year Ended December 31, 2015 (000) | Year Ended December 31, 2014 (000) | |||||||||
Increase (Decrease) in Net Assets: | |||||||||||
Operations: | |||||||||||
Net Investment Income | $ | 26 | $ | 40 | |||||||
Net Realized Gain | 594 | 114 | |||||||||
Net Change in Unrealized Appreciation (Depreciation) | (85 | ) | (54 | ) | |||||||
Net Increase in Net Assets Resulting from Operations | 535 | 100 | |||||||||
Distributions from and/or in Excess of: | |||||||||||
Class I: | |||||||||||
Net Investment Income | (24 | ) | (18 | ) | |||||||
Net Realized Gain | (340 | ) | (73 | ) | |||||||
Class A: | |||||||||||
Net Investment Income | (11 | ) | (2 | ) | |||||||
Net Realized Gain | (343 | ) | (16 | ) | |||||||
Class L: | |||||||||||
Net Investment Income | (1 | ) | (— | @) | |||||||
Net Realized Gain | (26 | ) | (3 | ) | |||||||
Class C: | |||||||||||
Net Investment Income | (— | @) | — | ||||||||
Net Realized Gain | (29 | ) | — | ||||||||
Total Distributions | (774 | ) | (112 | ) | |||||||
Capital Share Transactions:(1) | |||||||||||
Class I: | |||||||||||
Subscribed | 1,649 | 1,201 | |||||||||
Distributions Reinvested | 307 | 61 | |||||||||
Redeemed | (3,117 | ) | (508 | ) | |||||||
Class A: | |||||||||||
Subscribed | 2,595 | 688 | |||||||||
Distributions Reinvested | 318 | 12 | |||||||||
Redeemed | (508 | ) | (52 | ) | |||||||
Class L: | |||||||||||
Subscribed | 91 | 26 | |||||||||
Distributions Reinvested | 9 | — | @ | ||||||||
Redeemed | (25 | ) | — | ||||||||
Class C: | |||||||||||
Subscribed | 253 | * | — | ||||||||
Distributions Reinvested | 28 | * | — | ||||||||
Net Increase in Net Assets Resulting from Capital Share Transactions | 1,600 | 1,428 | |||||||||
Redemption Fees | — | — | @ | ||||||||
Total Increase in Net Assets | 1,361 | 1,416 | |||||||||
Net Assets: | |||||||||||
Beginning of Period | 4,424 | 3,008 | |||||||||
| End of Period (Including Distributions in Excess of Net Investment Income and Accumulated Undistributed Net Investment Income of $(—@) and $19) | $ | 5,785 | $ | 4,424 | |||||||
The accompanying notes are an integral part of the financial statements.
11
Morgan Stanley Institutional Fund, Inc.
Annual Report — December 31, 2015
International Advantage Portfolio
Statements of Changes in Net Assets (cont'd) | Year Ended December 31, 2015 (000) | Year Ended December 31, 2014 (000) | |||||||||
(1) Capital Share Transactions: | |||||||||||
Class I: | |||||||||||
Shares Subscribed | 126 | 97 | |||||||||
Shares Issued on Distributions Reinvested | 25 | 5 | |||||||||
Shares Redeemed | (225 | ) | (41 | ) | |||||||
Net Increase (Decrease) in Class I Shares Outstanding | (74 | ) | 61 | ||||||||
Class A: | |||||||||||
Shares Subscribed | 193 | 55 | |||||||||
Shares Issued on Distributions Reinvested | 26 | 1 | |||||||||
Shares Redeemed | (39 | ) | (4 | ) | |||||||
Net Increase in Class A Shares Outstanding | 180 | 52 | |||||||||
Class L: | |||||||||||
Shares Subscribed | 7 | 2 | |||||||||
Shares Issued on Distributions Reinvested | 1 | — | @@ | ||||||||
Shares Redeemed | (2 | ) | — | ||||||||
Net Increase in Class L Shares Outstanding | 6 | 2 | |||||||||
Class C: | |||||||||||
Shares Subscribed | 19 | * | — | ||||||||
Shares Issued on Distributions Reinvested | 2 | * | — | ||||||||
Net Increase in Class C Shares Outstanding | 21 | — | |||||||||
* For the period April 30, 2015 through December 31, 2015.
@ Amount is less than $500.
@@ Amount is less than 500 shares.
The accompanying notes are an integral part of the financial statements.
12
Morgan Stanley Institutional Fund, Inc.
Annual Report — December 31, 2015
Financial Highlights
International Advantage Portfolio
Class I | |||||||||||||||||||||||
Year Ended December 31, | |||||||||||||||||||||||
Selected Per Share Data and Ratios | 2015 | 2014 | 2013 | 2012 | 2011 | ||||||||||||||||||
Net Asset Value, Beginning of Period | $ | 12.36 | $ | 12.36 | $ | 11.60 | $ | 9.65 | $ | 9.99 | |||||||||||||
Income (Loss) from Investment Operations: | |||||||||||||||||||||||
Net Investment Income† | 0.10 | 0.13 | 0.13 | 0.12 | 0.12 | ||||||||||||||||||
Net Realized and Unrealized Gain (Loss) | 1.18 | 0.20 | 1.32 | 1.93 | (0.26 | ) | |||||||||||||||||
Total from Investment Operations | 1.28 | 0.33 | 1.45 | 2.05 | (0.14 | ) | |||||||||||||||||
Distributions from and/or in Excess of: | |||||||||||||||||||||||
Net Investment Income | (0.10 | ) | (0.07 | ) | (0.12 | ) | (0.10 | ) | (0.11 | ) | |||||||||||||
Net Realized Gain | (1.74 | ) | (0.26 | ) | (0.57 | ) | — | (0.09 | ) | ||||||||||||||
Total Distributions | (1.84 | ) | (0.33 | ) | (0.69 | ) | (0.10 | ) | (0.20 | ) | |||||||||||||
Redemption Fees | — | 0.00 | ‡ | — | — | — | |||||||||||||||||
Net Asset Value, End of Period | $ | 11.80 | $ | 12.36 | $ | 12.36 | $ | 11.60 | $ | 9.65 | |||||||||||||
Total Return++ | 10.23 | % | 2.58 | % | 12.72 | % | 21.27 | % | (1.31 | )% | |||||||||||||
Ratios and Supplemental Data: | |||||||||||||||||||||||
Net Assets, End of Period (Thousands) | $ | 2,361 | $ | 3,387 | $ | 2,637 | $ | 1,421 | $ | 1,255 | |||||||||||||
Ratio of Expenses to Average Net Assets (1) | 1.16 | %+^ | 1.24 | %+ | 1.24 | %+ | 1.24 | %+ | 1.24 | %+ | |||||||||||||
Ratio of Net Investment Income to Average Net Assets (1) | 0.76 | %+ | 1.05 | %+ | 1.04 | %+ | 1.08 | %+ | 1.17 | %+ | |||||||||||||
Ratio of Rebate from Morgan Stanley Affiliates to Average Net Assets | 0.00 | %§ | 0.01 | % | 0.00 | %§ | 0.01 | % | 0.01 | % | |||||||||||||
Portfolio Turnover Rate | 96 | % | 30 | % | 49 | % | 40 | % | 27 | % | |||||||||||||
(1) Supplemental Information on the Ratios to Average Net Assets: | |||||||||||||||||||||||
Ratios Before Expense Limitation: | |||||||||||||||||||||||
Expenses to Average Net Assets | 4.82 | % | 5.47 | % | 6.30 | % | 8.89 | % | 7.08 | %+ | |||||||||||||
Net Investment Loss to Average Net Assets | (2.90 | )% | (3.18 | )% | (4.02 | )% | (6.57 | )% | (4.67 | )%+ | |||||||||||||
† Per share amount is based on average shares outstanding.
‡ Amount is less than $0.005 per share.
++ Calculated based on the net asset value as of the last business day of the period.
+ The Ratios of Expenses and Net Investment Income reflect the rebate of certain Portfolio expenses in connection with the investments in Morgan Stanley affiliates during the period. The effect of the rebate on the ratios is disclosed in the above table as "Ratio of Rebate from Morgan Stanley Affiliates to Average Net Assets."
^ Effective July 1, 2015, the Adviser has agreed to limit the ratio of expenses to average net assets to the maximum ratio of 1.00% for Class I shares. Prior to July 1, 2015, the maximum ratio was 1.25% for Class I shares.
§ Amount is less than 0.005%.
The accompanying notes are an integral part of the financial statements.
13
Morgan Stanley Institutional Fund, Inc.
Annual Report — December 31, 2015
Financial Highlights
International Advantage Portfolio
Class A | |||||||||||||||||||||||
Year Ended December 31, | |||||||||||||||||||||||
Selected Per Share Data and Ratios | 2015 | 2014 | 2013 | 2012 | 2011 | ||||||||||||||||||
Net Asset Value, Beginning of Period | $ | 12.37 | $ | 12.38 | $ | 11.60 | $ | 9.65 | $ | 9.99 | |||||||||||||
Income (Loss) from Investment Operations: | |||||||||||||||||||||||
Net Investment Income† | 0.01 | 0.09 | 0.04 | 0.09 | 0.09 | ||||||||||||||||||
Net Realized and Unrealized Gain (Loss) | 1.23 | 0.19 | 1.38 | 1.94 | (0.25 | ) | |||||||||||||||||
Total from Investment Operations | 1.24 | 0.28 | 1.42 | 2.03 | (0.16 | ) | |||||||||||||||||
Distributions from and/or in Excess of: | |||||||||||||||||||||||
Net Investment Income | (0.08 | ) | (0.03 | ) | (0.07 | ) | (0.08 | ) | (0.09 | ) | |||||||||||||
Net Realized Gain | (1.74 | ) | (0.26 | ) | (0.57 | ) | — | (0.09 | ) | ||||||||||||||
Total Distributions | (1.82 | ) | (0.29 | ) | (0.64 | ) | (0.08 | ) | (0.18 | ) | |||||||||||||
Redemption Fees | — | 0.00 | ‡ | — | — | — | |||||||||||||||||
Net Asset Value, End of Period | $ | 11.79 | $ | 12.37 | $ | 12.38 | $ | 11.60 | $ | 9.65 | |||||||||||||
Total Return++ | 9.92 | % | 2.21 | % | 12.43 | % | 20.99 | % | (1.57 | )% | |||||||||||||
Ratios and Supplemental Data: | |||||||||||||||||||||||
Net Assets, End of Period (Thousands) | $ | 2,966 | $ | 889 | $ | 248 | $ | 116 | $ | 96 | |||||||||||||
Ratio of Expenses to Average Net Assets (1) | 1.46 | %+^^ | 1.59 | %+ | 1.55 | %+^ | 1.49 | %+ | 1.49 | %+ | |||||||||||||
Ratio of Net Investment Income to Average Net Assets (1) | 0.09 | %+ | 0.70 | %+ | 0.29 | %+ | 0.83 | %+ | 0.92 | %+ | |||||||||||||
Ratio of Rebate from Morgan Stanley Affiliates to Average Net Assets | 0.00 | %§ | 0.01 | % | 0.00 | %§ | 0.01 | % | 0.01 | % | |||||||||||||
Portfolio Turnover Rate | 96 | % | 30 | % | 49 | % | 40 | % | 27 | % | |||||||||||||
(1) Supplemental Information on the Ratios to Average Net Assets: | |||||||||||||||||||||||
Ratios Before Expense Limitation: | |||||||||||||||||||||||
Expenses to Average Net Assets | 5.77 | % | 6.03 | % | 6.89 | % | 9.14 | % | 7.33 | %+ | |||||||||||||
Net Investment Loss to Average Net Assets | (4.22 | )% | (3.74 | )% | (5.05 | )% | (6.82 | )% | (4.92 | )%+ | |||||||||||||
† Per share amount is based on average shares outstanding.
‡ Amount is less than $0.005 per share.
++ Calculated based on the net asset value which does not reflect sales charges, if applicable, as of the last business day of the period.
+ The Ratios of Expenses and Net Investment Income reflect the rebate of certain Portfolio expenses in connection with the investments in Morgan Stanley affiliates during the period. The effect of the rebate on the ratios is disclosed in the above table as "Ratio of Rebate from Morgan Stanley Affiliates to Average Net Assets."
^ Effective September 16, 2013, the Adviser has agreed to limit the ratio of expenses to average net assets to the maximum ratio of 1.60% for Class A shares. Prior to September 16, 2013, the maximum ratio was 1.50% for Class A shares.
^^ Effective July 1, 2015, the Adviser has agreed to limit the ratio of expenses to average net assets to the maximum ratio of 1.35% for Class A shares. Prior to July 1, 2015, the maximum ratio was 1.60% for Class A shares.
§ Amount is less than 0.005%.
The accompanying notes are an integral part of the financial statements.
14
Morgan Stanley Institutional Fund, Inc.
Annual Report — December 31, 2015
Financial Highlights
International Advantage Portfolio
Class L | |||||||||||||||||||||||
Year Ended December 31, | |||||||||||||||||||||||
Selected Per Share Data and Ratios | 2015 | 2014 | 2013 | 2012 | 2011 | ||||||||||||||||||
Net Asset Value, Beginning of Period | $ | 12.31 | $ | 12.36 | $ | 11.60 | $ | 9.65 | $ | 9.99 | |||||||||||||
Income (Loss) from Investment Operations: | |||||||||||||||||||||||
Net Investment Income (Loss)† | (0.04 | ) | 0.02 | 0.02 | 0.04 | 0.04 | |||||||||||||||||
Net Realized and Unrealized Gain (Loss) | 1.20 | 0.20 | 1.34 | 1.93 | (0.25 | ) | |||||||||||||||||
Total from Investment Operations | 1.16 | 0.22 | 1.36 | 1.97 | (0.21 | ) | |||||||||||||||||
Distributions from and/or in Excess of: | |||||||||||||||||||||||
Net Investment Income | (0.04 | ) | (0.01 | ) | (0.03 | ) | (0.02 | ) | (0.04 | ) | |||||||||||||
Net Realized Gain | (1.74 | ) | (0.26 | ) | (0.57 | ) | — | (0.09 | ) | ||||||||||||||
Total Distributions | (1.78 | ) | (0.27 | ) | (0.60 | ) | (0.02 | ) | (0.13 | ) | |||||||||||||
Redemption Fees | — | 0.00 | ‡ | — | — | — | |||||||||||||||||
Net Asset Value, End of Period | $ | 11.69 | $ | 12.31 | $ | 12.36 | $ | 11.60 | $ | 9.65 | |||||||||||||
Total Return++ | 9.34 | % | 1.69 | % | 11.88 | % | 20.43 | % | (2.09 | )% | |||||||||||||
Ratios and Supplemental Data: | |||||||||||||||||||||||
Net Assets, End of Period (Thousands) | $ | 211 | $ | 148 | $ | 123 | $ | 116 | $ | 97 | |||||||||||||
Ratio of Expenses to Average Net Assets (1) | 1.97 | %+^^ | 2.09 | %+ | 2.03 | %+^ | 1.99 | %+ | 1.99 | %+ | |||||||||||||
Ratio of Net Investment Income (Loss) to Average Net Assets (1) | (0.31 | )%+ | 0.20 | %+ | 0.18 | %+ | 0.33 | %+ | 0.42 | %+ | |||||||||||||
Ratio of Rebate from Morgan Stanley Affiliates to Average Net Assets | 0.00 | %§ | 0.01 | % | 0.00 | %§ | 0.01 | % | 0.01 | % | |||||||||||||
Portfolio Turnover Rate | 96 | % | 30 | % | 49 | % | 40 | % | 27 | % | |||||||||||||
(1) Supplemental Information on the Ratios to Average Net Assets: | |||||||||||||||||||||||
Ratios Before Expense Limitation: | |||||||||||||||||||||||
Expenses to Average Net Assets | 6.87 | % | 7.42 | % | 7.43 | % | 9.64 | % | 7.83 | %+ | |||||||||||||
Net Investment Loss to Average Net Assets | (5.21 | )% | (5.13 | )% | (5.22 | )% | (7.32 | )% | (5.42 | )%+ | |||||||||||||
† Per share amount is based on average shares outstanding.
‡ Amount is less than $0.005 per share.
++ Calculated based on the net asset value as of the last business day of the period.
+ The Ratios of Expenses and Net Investment Income (Loss) reflect the rebate of certain Portfolio expenses in connection with the investments in Morgan Stanley affiliates during the period. The effect of the rebate on the ratios is disclosed in the above table as "Ratio of Rebate from Morgan Stanley Affiliates to Average Net Assets."
^ Effective September 16, 2013, the Adviser has agreed to limit the ratio of expenses to average net assets to the maximum ratio of 2.10% for Class L shares. Prior to September 16, 2013, the maximum ratio was 2.00% for Class L shares.
^^ Effective July 1, 2015, the Adviser has agreed to limit the ratio of expenses to average net assets to the maximum ratio of 1.85% for Class L shares. Prior to July 1, 2015, the maximum ratio was 2.10% for Class L shares.
§ Amount is less than 0.005%.
The accompanying notes are an integral part of the financial statements.
15
Morgan Stanley Institutional Fund, Inc.
Annual Report — December 31, 2015
Financial Highlights
International Advantage Portfolio
Class C | |||||||
Selected Per Share Data and Ratios | Period from April 30, 2015^ to December 31, 2015 | ||||||
Net Asset Value, Beginning of Period | $ | 13.80 | |||||
Loss from Investment Operations: | |||||||
Net Investment Loss† | (0.08 | ) | |||||
Net Realized and Unrealized Loss | (0.26 | ) | |||||
Total from Investment Operations | (0.34 | ) | |||||
Distributions from and/or in Excess of: | |||||||
Net Investment Income | (0.06 | ) | |||||
Net Realized Gain | (1.74 | ) | |||||
Total Distributions | (1.80 | ) | |||||
Net Asset Value, End of Period | $ | 11.66 | |||||
Total Return++ | (2.63 | )%# | |||||
Ratios and Supplemental Data: | |||||||
Net Assets, End of Period (Thousands) | $ | 247 | |||||
Ratios of Expenses to Average Net Assets (1) | 2.11 | %+*^^ | |||||
Ratio of Net Investment Loss to Average Net Assets (1) | (0.94 | )%+* | |||||
Ratio of Rebate from Morgan Stanley Affiliates to Average Net Assets | 0.00 | %§ | |||||
Portfolio Turnover Rate | 96 | % | |||||
(1) Supplemental Information on the Ratios to Average Net Assets: | |||||||
Ratios Before Expense Limitation: | |||||||
Expense to Average Net Assets | 9.11 | %* | |||||
Net Investment Loss to Average Net Assets | (7.94 | )%* | |||||
^ Commencement of Offering.
† Per share amount is based on average shares outstanding.
++ Calculated based on the net asset value which does not reflect sales charges, if applicable, as of the last business day of the period.
+ The Ratios of Expenses and Net Investment Loss reflect the rebate of certain Portfolio expenses in connection with the investments in Morgan Stanley affiliates during the period. The effect of the rebate on the ratios is disclosed in the above table as "Ratio of Rebate from Morgan Stanley Affiliates to Average Net Assets."
^^ Effective July 1, 2015, the Adviser has agreed to limit the ratio of expenses to average net assets to the maximum ratio of 2.10% for Class C shares. Prior to July 1, 2015, the maximum ratio was 2.35% for Class C shares.
§ Amount is less than 0.005%.
# Not Annualized.
* Annualized.
The accompanying notes are an integral part of the financial statements.
16
Morgan Stanley Institutional Fund, Inc.
Annual Report — December 31, 2015
Notes to Financial Statements
Morgan Stanley Institutional Fund, Inc. (the "Fund") is registered under the Investment Company Act of 1940, as amended (the "Act"), as an open-end management investment company. The Fund is comprised of twenty-six separate, active, diversified and non-diversified portfolios (individually referred to as a "Portfolio", collectively as the "Portfolios"). The Fund applies investment company accounting and reporting guidance.
The accompanying financial statements relate to the International Advantage Portfolio. The Portfolio seeks long-term capital appreciation by investing primarily in established companies on an international basis, with capitalizations within the range of companies included in the MSCI All Country World Index ex USA Index.
The Portfolio offers four classes of shares—Class I, Class A, Class L and Class C. On April 30, 2015, the Portfolio commenced offering Class C shares and suspended offering of Class L shares. Existing Class L shareholders may invest through reinvestment of dividends and distributions.
A. Significant Accounting Policies: The following significant accounting policies are in conformity with U.S. generally accepted accounting principles ("GAAP"). Such policies are consistently followed by the Fund in the preparation of its financial statements. GAAP may require management to make estimates and assumptions that affect the reported amounts and disclosures in the financial statements. Actual results may differ from those estimates.
1. Security Valuation: (1) An equity portfolio security listed or traded on an exchange is valued at its latest reported sales price (or at the exchange official closing price if such exchange reports an official closing price), if there were no sales on a given day, the security is valued at the mean between the last reported bid and asked prices; (2) all other equity portfolio securities for which over-the-counter ("OTC") market quotations are readily available are valued at its latest reported sales price. In cases where a security is traded on more than one exchange, the security is valued on the exchange designated as the primary market; (3) Certain portfolio securities may be valued by an outside pricing service approved by the Fund's Board of Directors (the "Directors"). The pricing service may utilize a matrix system or other model incorporating attributes such as security quality, maturity and coupon as the evaluation model parameters, and/or research evaluations by its
staff, including review of broker dealer market price quotations in determining what it believes is the fair valuation of the portfolios securities valued by such pricing service; (4) listed options are valued at the last reported sales price on the exchange on which they are listed (or at the exchange official closing price if such exchange reports an official closing price). If an official closing price or last reported sales price is unavailable, the listed option should be fair valued at the mean between their latest bid and asked price. Unlisted options are valued by an outside pricing service approved by the Directors or quotes from a broker or dealer; (5) when market quotations are not readily available, including circumstances under which Morgan Stanley Investment Management Inc. (the "Adviser") determines that the closing price, last sale price or the mean between the last reported bid and asked prices are not reflective of a security's market value, portfolio securities are valued at their fair value as determined in good faith under procedures established by and under the general supervision of the Directors. Occasionally, developments affecting the closing prices of securities and other assets may occur between the times at which valuations of such securities are determined (that is, close of the foreign market on which the securities trade) and the close of business of the New York Stock Exchange ("NYSE"). If developments occur during such periods that are expected to materially affect the value of such securities, such valuations may be adjusted to reflect the estimated fair value of such securities as of the close of the NYSE, as determined in good faith by the Directors or by the Adviser using a pricing service and/or procedures approved by the Directors; (6) quotations of foreign portfolio securities, other assets and liabilities and forward contracts stated in foreign currency are translated into U.S. dollar equivalents at the prevailing market rates prior to the close of the NYSE; (7) investments in mutual funds, including the Morgan Stanley Institutional Liquidity Funds, are valued at the net asset value ("NAV") as of the close of each business day; and (8) short-term debt securities with remaining maturities of 60 days or less at the time of purchase may be valued at amortized cost, unless the Adviser determines such valuation does not reflect the securities' market value, in which case these securities will be valued at their fair market value determined by the Adviser.
The Directors have responsibility for determining in good faith the fair value of the investments, and the
17
Morgan Stanley Institutional Fund, Inc.
Annual Report — December 31, 2015
Notes to Financial Statements (cont'd)
Directors may appoint others, such as the Fund's Adviser or a valuation committee, to assist the Directors in determining fair value and to make the actual calculations pursuant to the fair valuation methodologies previously approved by the Directors. Under procedures approved by the Directors, the Fund's Adviser has formed a Valuation Committee whose members are approved by the Directors. The Valuation Committee provides administration and oversight of the Fund's valuation policies and procedures, which are reviewed at least annually by the Directors. These procedures allow the Fund to utilize independent pricing services, quotations from securities and financial instrument dealers, and other market sources to determine fair value.
The Fund has procedures to determine the fair value of securities and other financial instruments for which market prices are not readily available. Under these procedures, the Valuation Committee convenes on a regular and ad hoc basis to review such securities and considers a number of factors, including valuation methodologies and significant unobservable valuation inputs, when arriving at fair value. The Valuation Committee may employ a market-based approach which may use related or comparable assets or liabilities, recent transactions, market multiples, book values, and other relevant information for the investment to determine the fair value of the investment. An income-based valuation approach may also be used in which the anticipated future cash flows of the investment are discounted to calculate fair value. Discounts may also be applied due to the nature or duration of any restrictions on the disposition of the investments. Due to the inherent uncertainty of valuations of such investments, the fair values may differ significantly from the values that would have been used had an active market existed. The Valuation Committee employs various methods for calibrating these valuation approaches including a regular review of valuation methodologies, key inputs and assumptions, transactional back-testing or disposition analysis, and reviews of any related market activity.
2. Fair Value Measurement: Financial Accounting Standards Board ("FASB") Accounting Standards CodificationTM ("ASC") 820, "Fair Value Measurement" ("ASC 820"), defines fair value as the value that the Fund would receive to sell an investment or pay to transfer a
liability in a timely transaction with an independent buyer in the principal market, or in the absence of a principal market the most advantageous market for the investment or liability. ASC 820 establishes a three-tier hierarchy to distinguish between (1) inputs that reflect the assumptions market participants would use in valuing an asset or liability developed based on market data obtained from sources independent of the reporting entity (observable inputs) and (2) inputs that reflect the reporting entity's own assumptions about the assumptions market participants would use in valuing an asset or liability developed based on the best information available in the circumstances (unobservable inputs) and to establish classification of fair value measurements for disclosure purposes. Various inputs are used in determining the value of the Fund's investments. The inputs are summarized in the three broad levels listed below.
• Level 1 – unadjusted quoted prices in active markets for identical investments
• Level 2 – other significant observable inputs (including quoted prices for similar investments, interest rates, prepayment speeds, credit risk, etc.)
• Level 3 – significant unobservable inputs including the Fund's own assumptions in determining the fair value of investments. Factors considered in making this determination may include, but are not limited to, information obtained by contacting the issuer, analysts, or the appropriate stock exchange (for exchange-traded securities), analysis of the issuer's financial statements or other available documents and, if necessary, available information concerning other securities in similar circumstances
The inputs or methodology used for valuing securities are not necessarily an indication of the risk associated with investing in those securities and the determination of the significance of a particular input to the fair value measurement in its entirety requires judgment and considers factors specific to each security.
The following is a summary of the inputs used to value the Portfolio's investments as of December 31, 2015.
18
Morgan Stanley Institutional Fund, Inc.
Annual Report — December 31, 2015
Notes to Financial Statements (cont'd)
Investment Type | Level 1 Unadjusted quoted prices (000) | Level 2 Other significant observable inputs (000) | Level 3 Significant unobservable inputs (000) | Total (000) | |||||||||||||||
Assets: | |||||||||||||||||||
Common Stocks | |||||||||||||||||||
Beverages | $ | — | $ | 441 | $ | — | $ | 441 | |||||||||||
Biotechnology | — | 114 | — | 114 | |||||||||||||||
Capital Markets | — | 224 | — | 224 | |||||||||||||||
| Diversified Consumer Services | 243 | — | — | 243 | |||||||||||||||
| Diversified Telecommunication Services | — | 58 | — | 58 | |||||||||||||||
Electric Utilities | 163 | — | — | 163 | |||||||||||||||
| Energy Equipment & Services | — | 91 | — | 91 | |||||||||||||||
Food Products | — | 572 | — | 572 | |||||||||||||||
Household Products | — | 194 | — | 194 | |||||||||||||||
| Information Technology Services | 749 | — | — | 749 | |||||||||||||||
Insurance | — | 174 | — | 174 | |||||||||||||||
Internet & Catalog Retail | 195 | — | — | 195 | |||||||||||||||
Internet Software & Services | — | 261 | — | 261 | |||||||||||||||
Marine | — | 167 | — | 167 | |||||||||||||||
Media | — | 226 | — | 226 | |||||||||||||||
Pharmaceuticals | — | 115 | — | 115 | |||||||||||||||
Professional Services | — | 108 | — | 108 | |||||||||||||||
| Real Estate Management & Development | 98 | — | — | 98 | |||||||||||||||
Road & Rail | — | 433 | — | 433 | |||||||||||||||
Software | 46 | — | — | 46 | |||||||||||||||
| Textiles, Apparel & Luxury Goods | — | 660 | — | 660 | |||||||||||||||
| Transportation Infrastructure | — | 222 | — | 222 | |||||||||||||||
Total Common Stocks | 1,494 | 4,060 | — | 5,554 | |||||||||||||||
Participation Notes | — | 137 | — | 137 | |||||||||||||||
Call Option Purchased | — | 14 | — | 14 | |||||||||||||||
Short-Term Investment | |||||||||||||||||||
Investment Company | 325 | — | — | 325 | |||||||||||||||
Total Assets | $ | 1,819 | $ | 4,211 | $ | — | $ | 6,030 | |||||||||||
Transfers between investment levels may occur as the markets fluctuate and/or the availability of data used in an investment's valuation changes. The Portfolio recognizes transfers between the levels as of the end of the period. As of December 31, 2015, the Portfolio did not have any investments transfer between investment levels. At December 31, 2015, the fair value of certain securities were adjusted due to developments which occurred between the time of the close of the foreign markets on which they trade and the close of business on the NYSE which resulted in their level 2 classification.
3. Foreign Currency Translation and Foreign Investments: The books and records of the Portfolio are maintained in U.S. dollars. Foreign currency amounts are translated into U.S. dollars as follows:
– investments, other assets and liabilities at the prevailing rate of exchange on the valuation date;
– investment transactions and investment income at the prevailing rates of exchange on the dates of such transactions.
Although the net assets of the Portfolio are presented at the foreign exchange rates and market values at the close of the period, the Portfolio does not isolate that portion of the results of operations arising as a result of changes in the foreign exchange rates from the fluctuations arising from changes in the market prices of securities held at period end. Similarly, the Portfolio does not isolate the effect of changes in foreign exchange rates from the fluctuations arising from changes in the market prices of securities sold during the period. Accordingly, realized and unrealized foreign currency gains (losses) on investments in securities are included in the reported net realized and unrealized gains (losses) on investment transactions and balances. However, pursuant to U.S. Federal income tax regulations, gains and losses from certain foreign currency transactions and the foreign currency portion of gains and losses realized on sales and maturities of foreign denominated debt securities are treated as ordinary income for U.S. Federal income tax purposes.
Net realized gains (losses) on foreign currency transactions represent net foreign exchange gains (losses) from foreign currency forward exchange contracts, disposition of foreign currencies, currency gains (losses) realized between the trade and settlement dates on securities transactions, and the difference between the amount of investment income and foreign withholding taxes recorded on the Portfolio's books and the U.S. dollar equivalent amounts actually received or paid. Net unrealized currency gains (losses) from valuing foreign currency denominated assets and liabilities at period end exchange rates are reflected as a component of unrealized appreciation (depreciation) in the Statement of Assets and Liabilities. The change in unrealized currency gains (losses) on foreign currency translations for the period is reflected in the Statement of Operations.
19
Morgan Stanley Institutional Fund, Inc.
Annual Report — December 31, 2015
Notes to Financial Statements (cont'd)
Foreign security and currency transactions may involve certain considerations and risks not typically associated with those of U.S. dollar denominated transactions as a result of, among other factors, fluctuations of exchange rates in relation to the U.S. dollar, the possibility of lower levels of governmental supervision and regulation of foreign securities markets and the possibility of political or economic instability.
Governmental approval for foreign investments may be required in advance of making an investment under certain circumstances in some countries, and the extent of foreign investments in domestic companies may be subject to limitation in other countries. Foreign ownership limitations also may be imposed by the charters of individual companies to prevent, among other concerns, violations of foreign investment limitations. As a result, an additional class of shares (identified as "Foreign" in the Portfolio of Investments) may be created and offered for investment. The "local" and "foreign shares" market values may differ. In the absence of trading of the foreign shares in such markets, the Portfolio values the foreign shares at the closing exchange price of the local shares.
4. Derivatives: The Portfolio may, but is not required to, use derivative instruments for a variety of purposes, including hedging, risk management, portfolio management or to earn income. Derivatives are financial instruments whose value is based, in part, on the value of an underlying asset, interest rate, index or financial instrument. Prevailing interest rates and volatility levels, among other things, also affect the value of derivative instruments. A derivative instrument often has risks similar to its underlying asset and may have additional risks, including imperfect correlation between the value of the derivative and the underlying asset, risks of default by the counterparty to certain transactions, magnification of losses incurred due to changes in the market value of the securities, instruments, indices or interest rates to which the derivative instrument relates, risks that the transactions may not be liquid and risks arising from margin requirements. The use of derivatives involves risks that are different from, and possibly greater than, the risks associated with other portfolio investments. Derivatives may involve the use of highly specialized instruments that require investment techniques and risk analyses different from those associated with other portfolio investments. All of the Portfolio's
holdings, including derivative instruments, are marked-to-market each day with the change in value reflected in unrealized appreciation (depreciation). Upon disposition, a realized gain or loss is recognized.
Certain derivative transactions may give rise to a form of leverage. Leverage magnifies the potential for gain and the risk of loss. Leverage associated with derivative transactions may cause the Portfolio to liquidate portfolio positions when it may not be advantageous to do so to satisfy its obligations or to meet earmarking or segregation requirements, pursuant to applicable Securities and Exchange Commission rules and regulations, or may cause the Portfolio to be more volatile than if the Portfolio had not been leveraged. Although the Adviser seeks to use derivatives to further the Portfolio's investment objectives, there is no assurance that the use of derivatives will achieve this result.
Following is a description of the derivative instruments and techniques that the Portfolio used during the period and their associated risks:
Options: With respect to options, the Portfolio is subject to equity risk, interest rate risk and foreign currency exchange risk in the normal course of pursuing its investment objectives. If the Portfolio buys an option, it buys a legal contract giving it the right to buy or sell a specific amount of the underlying instrument or futures contract on the underlying instrument, at an agreed-upon price typically in exchange for a premium paid by the Portfolio. The Portfolio may purchase and/or sell put and call options. Purchasing call options tends to increase the Portfolio's exposure to the underlying (or similar) instrument. Purchasing put options tends to decrease the Portfolio's exposure to the underlying (or similar) instrument. When entering into purchased option contracts, the Portfolio bears the risk of interest or exchange rates or securities prices moving unexpectedly, in which case, the Portfolio may not achieve the anticipated benefits of the purchased option contracts; however the risk of loss is limited to the premium paid. Purchased options are reported as part of "Total Investments in Securities" in the Statement of Assets and Liabilities. Premium paid for purchasing options which expired are treated as realized losses. If the Portfolio sells an option, it sells to another party the right to buy from or sell to the Portfolio a specific amount of the underlying instrument or futures
20
Morgan Stanley Institutional Fund, Inc.
Annual Report — December 31, 2015
Notes to Financial Statements (cont'd)
contract on the underlying instrument at an agreed-upon price typically in exchange for a premium received by the Portfolio. When options are purchased OTC, the Portfolio bears the risk that the counterparty that wrote the option will be unable or unwilling to perform its obligations under the option contract. Options may also be illiquid and the Portfolio may have difficulty closing out its position. A decision as to whether, when and how to use options involves the exercise of skill and judgment and even a well-conceived option transaction may be unsuccessful because of market behavior or unexpected events. The prices of options can be highly volatile and the use of options can lower total returns.
FASB ASC 815, "Derivatives and Hedging" ("ASC 815"), is intended to improve financial reporting about derivative instruments by requiring enhanced disclosures to enable investors to better understand how and why the Portfolio uses derivative instruments, how these derivative instruments are accounted for and their effects on the Portfolio's financial position and results of operations.
The following table sets forth the fair value of the Portfolio's derivative contracts by primary risk exposure as of December 31, 2015.
| Asset Derivatives Statement of Assets and Liabilities Location | Primary Risk Exposure | Value (000) | |||||||||||||
| Call Options Purchased | Investments, at Value (Call Options Purchased) | Currency Risk | $ | 14 | (a) | ||||||||||
(a) Amounts are included in Investments in Securities in the Statement of Assets and Liabilities.
The following tables set forth by primary risk exposure the Portfolio's realized gains (losses) and change in unrealized appreciation (depreciation) by type of derivative contract for the year ended December 31, 2015 in accordance with ASC 815.
Realized Gain (Loss) | |||||||||||
Primary Risk Exposure | Derivative Type | Value (000) | |||||||||
| Currency Risk | Investments (Call Options Purchased) | $ | (5 | )(b) | |||||||
(b) Amounts are included in Investments Sold in the Statement of Operations.
Change in Unrealized Appreciation (Depreciation) | |||||||||||
Primary Risk Exposure | Derivative Type | Value (000) | |||||||||
| Currency Risk | Investments (Call Options Purchased) | $ | 11 | (c) | |||||||
(c) Amounts are included in Investments in the Statement of Operations.
At December 31, 2015, the Portfolio's derivative assets and liabilities are as follows:
| Gross Amounts of Assets and Liabilities Presented in the Statement of Assets and Liabilities | |||||||||||
Derivatives | Assets(d) (000) | Liabilities(d) (000) | |||||||||
Call Options Purchased | $ | 14 | (a) | $ | — | ||||||
(a) Amounts are included in Investments in Securities in the Statement of Assets and Liabilities.
(d) Absent an event of default or early termination, OTC derivative assets and liabilities are presented gross and not offset in the Statement of Assets and Liabilities.
The Portfolio typically enters into International Swaps and Derivatives Association, Inc. Master Agreements ("ISDA Master Agreements") or similar master agreements (collectively, "Master Agreements") with its contract counterparties for certain OTC derivatives in order to, among other things, reduce its credit risk to counterparties. ISDA Master Agreements include provisions for general obligations, representations, collateral and events of default or termination. Under an ISDA Master Agreement, the Portfolio typically may offset with the counterparty certain OTC derivative financial instruments' payables and/or receivables with collateral held and/or posted and create one single net payment (close-out netting) in the event of default, termination and/or potential deterioration in the credit quality of the counterparty. Various Master Agreements govern the terms of certain transactions with counterparties, including transactions such as swap, forward, repurchase and reverse repurchase agreements. These Master Agreements typically attempt to reduce the counterparty risk associated with such transactions by specifying credit protection mechanisms and providing standardization that improves legal certainty. Cross-termination provisions under Master Agreements typically provide that a default in connection with one transaction between the Portfolio and a counterparty gives the non-defaulting party the right to terminate any other transactions in place with the defaulting party to create one single net payment due to/due from the defaulting party and may be a feature in certain Master Agreements. In the event the Portfolio exercises its right to terminate a Master Agreement after a counterparty experiences a termination event as defined in the Master Agreement, the return of collateral with market value in excess of the Portfolio's net liability may be delayed or denied.
21
Morgan Stanley Institutional Fund, Inc.
Annual Report — December 31, 2015
Notes to Financial Statements (cont'd)
The following table presents derivative financial instruments that are subject to enforceable netting arrangements as of December 31, 2015.
Gross Amounts Not Offset in the Statement of Assets and Liabilities | |||||||||||||||||||
Counterparty | Gross Asset Derivatives Presented in Statement of Assets and Liabilities (000) | Financial Instrument (000) | Collateral Received (000) | Net Amount (not less than $0) (000) | |||||||||||||||
Royal Bank of Scotland | $ | 14 | $ | — | $ | — | $ | 14 | |||||||||||
For the year ended December 31, 2015, the approximate average monthly amount outstanding for each derivative type is as follows:
Call Options Purchased: | |||||||
Average monthly notional amount | 1,450,000 | ||||||
5. Securities Lending: The Portfolio lends securities to qualified financial institutions, such as broker-dealers, to earn additional income. Any increase or decrease in the fair value of the securities loaned that might occur and any interest earned or dividends declared on those securities during the term of the loan would remain in the Portfolio. The Portfolio would receive cash or securities as collateral in an amount equal to or exceeding 100% of the current fair value of the loaned securities. The collateral is marked-to-market daily by State Street Bank and Trust Company ("State Street"), the securities lending agent, to ensure that a minimum of 100% collateral coverage is maintained.
Based on pre-established guidelines, the securities lending agent invests any cash collateral that is received in an affiliated money market portfolio and repurchase agreements. Securities lending income is generated from the earnings on the invested collateral and borrowing fees, less any rebates owed to the borrowers and compensation to the lending agent, and is recorded as "Income from Securities Loaned — Net" in the Portfolio's Statement of Operations. Risks in securities lending transactions are that a borrower may not provide additional collateral when required or return the securities when due, and that the value of the short-term investments will be less than the amount of cash collateral plus any rebate that is required to be returned to the borrower.
The Portfolio has the right under the lending agreement to recover the securities from the borrower on demand.
At December 31, 2015, the Portfolio did not have any outstanding securities on loan.
6. Structured Investments: The Portfolio invested a portion of its assets in structured investments. A structured investment is a derivative security designed to offer a return linked to a particular underlying security, currency, commodity or market. Structured investments may come in various forms including notes (such as exchange-traded notes), warrants and options to purchase securities. The Portfolio will typically use structured investments to gain exposure to a permitted underlying security, currency, commodity or market when direct access to a market is limited or inefficient from a tax or cost standpoint. There can be no assurance that structured investments will trade at the same price or have the same value as the underlying security, currency, commodity or market. Investments in structured investments involve risks including issuer risk, counterparty risk and market risk. Holders of structured investments bear risks of the underlying investment and are subject to issuer or counterparty risk because the Portfolio is relying on the creditworthiness of such issuer or counterparty and has no rights with respect to the underlying investment. Certain structured investments may be thinly traded or have a limited trading market and may have the effect of increasing the Portfolio's illiquidity to the extent that the Portfolio, at a particular time, may be unable to find qualified buyers for these securities.
7. Redemption Fees: The Portfolio will assess a 2% redemption fee on Class I shares, Class A shares, Class L shares and Class C shares, which is paid directly to the Portfolio, for shares redeemed or exchanged within thirty days of purchase, subject to certain exceptions. The redemption fee is designed to protect the Portfolio and its remaining shareholders from the effects of short-term trading. These fees, if any, are included in the Statements of Changes in Net Assets.
8. Indemnifications: The Fund enters into contracts that contain a variety of indemnifications. The Fund's maximum exposure under these arrangements is unknown. However, the Fund has not had prior claims or losses pursuant to these contracts and expects the risk of loss to be remote.
9. Dividends and Distributions to Shareholders: Dividend income and distributions to shareholders are recorded on the ex-dividend date. Dividends from net investment income, if any, are declared and paid annually. Net realized capital gains, if any, are distributed at least annually.
22
Morgan Stanley Institutional Fund, Inc.
Annual Report — December 31, 2015
Notes to Financial Statements (cont'd)
10. Security Transactions, Income and Expenses: Security transactions are accounted for on the trade date (date the order to buy or sell is executed). Realized gains and losses on the sale of investment securities are determined on the specific identified cost method. Dividend income and other distributions are recorded on the ex-dividend date (except for certain foreign dividends which may be recorded as soon as the Portfolio is informed of such dividends) net of applicable withholding taxes. Interest income is recognized on the accrual basis except where collection is in doubt. Discounts are accreted and premiums are amortized over the life of the respective securities. Most expenses of the Fund can be directly attributed to a particular Portfolio. Expenses which cannot be directly attributed are apportioned among the Portfolios based upon relative net assets or other appropriate methods. Income, expenses (other than class specific expenses — distribution and shareholder services, transfer agency and sub transfer agency fees) and realized and unrealized gains or losses are allocated to each class of shares based upon their relative net assets.
B. Advisory Fees: The Adviser, a wholly-owned subsidiary of Morgan Stanley, provides the Portfolio with advisory services under the terms of an Investment Advisory Agreement, paid quarterly, at the annual rate based on the daily net assets as follows:
| First $1 billion | Over $1 billion | ||||||
| 0.90 | % | 0.85 | % | ||||
Effective July 1, 2015, the Portfolio's annual rate based on the daily net assets was reduced and is as follows:
| First $1 billion | Over $1 billion | ||||||
| 0.80 | % | 0.75 | % | ||||
For the year ended December 31, 2015, the advisory fee rate (net of waivers/rebate) was equivalent to an annual effective rate of 0.00% of the Portfolio's average daily net assets.
The Adviser has agreed to reduce its advisory fee and/or reimburse the Portfolio so that total annual portfolio operating expenses, excluding certain investment related expenses, taxes, interest and other extraordinary expenses (including litigation), will not exceed 1.25% for Class I shares, 1.60% for Class A shares, 2.10% for Class L shares and 2.35% for Class C shares. Effective July 1, 2015, the Adviser has agreed to reduce its advisory fee and/or reimburse the Portfolio so that total annual portfolio operating expenses will not exceed 1.00% for Class I
shares, 1.35% for Class A shares, 1.85% for Class L shares and 2.10% for Class C shares. The fee waivers and/or expense reimbursements will continue for at least one year from the date of the Portfolio's prospectus or until such time as the Directors act to discontinue all or a portion of such waivers and/or reimbursements when they deem such action is appropriate. For the year ended December 31, 2015, approximately $42,000 of advisory fees were waived and approximately $148,000 of other expenses were reimbursed by the Adviser pursuant to this arrangement.
C. Administration Fees: The Adviser also serves as Administrator to the Fund and provides administrative services pursuant to an Administration Agreement for an annual fee, accrued daily and paid monthly, of 0.08% of the Portfolio's average daily net assets.
Under a Sub-Administration Agreement between the Administrator and State Street, State Street provides certain administrative services to the Fund. For such services, the Administrator pays State Street a portion of the fee the Administrator receives from the Portfolio.
D. Distribution and Shareholder Services Fees: Morgan Stanley Distribution, Inc. ("MSDI" or the "Distributor"), a wholly-owned subsidiary of the Adviser and an indirect subsidiary of Morgan Stanley, serves as the Fund's Distributor of Portfolio shares pursuant to a Distribution Agreement. The Fund has adopted a Shareholder Services Plan with respect to Class A shares pursuant to Rule 12b-1 under the Act. Under the Shareholder Services Plan, the Portfolio pays the Distributor a shareholder services fee, accrued daily and paid monthly, at an annual rate of 0.25% of the Portfolio's average daily net assets attributable to Class A shares.
The Fund has adopted a Distribution and Shareholder Services Plan with respect to Class L shares pursuant to Rule 12b-1 under the Act. Under the Distribution and Shareholder Services Plan, the Portfolio pays the Distributor a distribution fee, accrued daily and paid monthly, at an annual rate of 0.50% and a shareholder services fee, accrued daily and paid monthly, at an annual rate of 0.25% of the Portfolio's average daily net assets attributable to Class L shares.
The Fund has adopted a Distribution and Shareholder Services Plan with respect to Class C shares pursuant to Rule 12b-1 under the Act. Under the Distribution and Shareholder Services Plan, the Portfolio pays the Distributor a distribution fee, accrued daily and paid monthly, at an annual rate of 0.75% and a shareholder services fee, accrued daily and paid monthly, at
23
Morgan Stanley Institutional Fund, Inc.
Annual Report — December 31, 2015
Notes to Financial Statements (cont'd)
an annual rate of 0.25% of the Portfolio's average daily net assets attributable to Class C shares.
The distribution and shareholder services fees are used to support the expenses associated with servicing and maintaining accounts. The Distributor may compensate other parties for providing shareholder support services to investors who purchase Class A, Class L and Class C shares.
E. Dividend Disbursing and Transfer Agent: The Fund's dividend disbursing and transfer agent is Boston Financial Data Services, Inc. ("BFDS"). Pursuant to a Transfer Agency Agreement, the Fund pays BFDS a fee based on the number of classes, accounts and transactions relating to the Portfolios of the Fund.
F. Custodian Fees: State Street (the "Custodian") serves as Custodian for the Fund in accordance with a Custodian Agreement. The Custodian holds cash, securities, and other assets of the Fund as required by the Act. Custody fees are payable monthly based on assets held in custody, investment purchases and sales activity and account maintenance fees, plus reimbursement for certain out-of-pocket expenses.
G. Security Transactions and Transactions with Affiliates: For the year ended December 31, 2015, purchases and sales of investment securities for the Portfolio, other than long-term U.S. Government securities and short-term investments, were approximately $5,443,000 and $4,400,000, respectively. There were no purchases and sales of long-term U.S. Government securities for the year ended December 31, 2015.
The Portfolio invests in the Institutional Class of the Morgan Stanley Institutional Liquidity Funds (the "Liquidity Funds"), an open-end management investment company managed by the Adviser, both directly and as a portion of the securities held as collateral on loaned securities. Advisory fees paid by the Portfolio are reduced by an amount equal to its pro-rata share of the advisory and administration fees paid by the Portfolio due to its investment in the Liquidity Funds. For the year ended December 31, 2015, advisory fees paid were reduced by less than $500 relating to the Portfolio's investment in the Liquidity Funds.
A summary of the Portfolio's transactions in shares of the Liquidity Funds during the year ended December 31, 2015 is as follows:
| Value December 31, 2014 (000) | Purchases at Cost (000) | Sales (000) | Dividend Income (000) | Value December 31, 2015 (000) | |||||||||||||||
| $ | 119 | $ | 5,429 | $ | 5,223 | $ | — | @ | $ | 325 | |||||||||
@ Amount is less than $500.
The Portfolio has an unfunded Deferred Compensation Plan (the "Compensation Plan"), which allows each independent Director to defer payment of all, or a portion, of the fees he or she receives for serving on the Board of Directors. Each eligible Director generally may elect to have the deferred amounts credited with a return equal to the total return on one or more of the Morgan Stanley funds that are offered as investment options under the Compensation Plan. Appreciation/depreciation and distributions received from these investments are recorded with an offsetting increase/decrease in the deferred compensation obligation and do not affect the NAV of the Portfolio.
H. Federal Income Taxes: It is the Portfolio's intention to continue to qualify as a regulated investment company and distribute all of its taxable and tax-exempt income. Accordingly, no provision for Federal income taxes is required in the financial statements.
The Portfolio may be subject to taxes imposed by countries in which it invests. Such taxes are generally based on income and/or capital gains earned or repatriated. Taxes are accrued based on net investment income, net realized gains and net unrealized appreciation as such income and/or gains are earned. Taxes may also be based on transactions in foreign currency and are accrued based on the value of investments denominated in such currency.
FASB ASC 740-10, "Income Taxes — Overall", sets forth a minimum threshold for financial statement recognition of the benefit of a tax position taken or expected to be taken in a tax return. Management has concluded there are no significant uncertain tax positions that would require recognition in the financial statements. If applicable, the Portfolio recognizes interest accrued related to unrecognized tax benefits in "Interest Expense" and penalties in "Other Expenses" in the Statement of Operations. The Portfolio files tax returns with the U.S. Internal Revenue Service, New York and various states.
24
Morgan Stanley Institutional Fund, Inc.
Annual Report — December 31, 2015
Notes to Financial Statements (cont'd)
Generally, each of the tax years in the four-year period ended December 31, 2015, remains subject to examination by taxing authorities.
The tax character of distributions paid may differ from the character of distributions shown in the Statements of Changes in Net Assets due to short-term capital gains being treated as ordinary income for tax purposes. The tax character of distributions paid during fiscal 2015 and 2014 was as follows:
| 2015 Distributions Paid From: | 2014 Distributions Paid From: | ||||||||||||||
| Ordinary Income (000) | Long-Term Capital Gain (000) | Ordinary Income (000) | Long-Term Capital Gain (000) | ||||||||||||
| $ | 229 | $ | 545 | $ | 36 | $ | 76 | ||||||||
The amount and character of income and gains to be distributed are determined in accordance with income tax regulations which may differ from GAAP. These book/tax differences are either considered temporary or permanent in nature.
Temporary differences are primarily due to differing book and tax treatments in the timing of the recognition of gains (losses) on certain investment transactions and the timing of the deductibility of certain expenses.
Permanent differences, primarily due to differing treatments of gains (losses) related to foreign currency transactions, resulted in the following reclassifications among the components of net assets at December 31, 2015:
| Distributions in Excess of Net Investment Income (000) | Distributions in Excess of Net Realized Gain (000) | Paid-in- Capital (000) | |||||||||
| $ | (9 | ) | $ | 9 | $ | — | |||||
At December 31, 2015, the Portfolio had no distributable earnings on a tax basis.
Capital losses and specified ordinary losses, including currency losses, incurred after October 31 but within the taxable year are deemed to arise on the first day of the Portfolio's next taxable year. For the year ended December 31, 2015, the Portfolio deferred to January 1, 2016 for U.S. Federal income tax purposes the following losses:
| Post-October Currency and Specified Ordinary Losses (000) | Post-October Capital Losses (000) | ||||||
| $ | 1 | $ | 15 | ||||
I. Other: At December 31, 2015, the Portfolio had record owners of 10% or greater. Investment activities of these shareholders could have a material impact on the Portfolio. The aggregate percentage of such owners was 50.6%.
25
Morgan Stanley Institutional Fund, Inc.
Annual Report — December 31, 2015
Report of Independent Registered Public Accounting Firm
To the Shareholders and Board of Directors of
Morgan Stanley Institutional Fund, Inc. —
International Advantage Portfolio
We have audited the accompanying statement of assets and liabilities, including the portfolio of investments, of International Advantage Portfolio (one of the portfolios constituting Morgan Stanley Institutional Fund, Inc.) (the "Portfolio") as of December 31, 2015, and the related statement of operations for the year then ended, the statements of changes in net assets for each of the two years in the period then ended and the financial highlights for each of the years or periods indicated therein. These financial statements and financial highlights are the responsibility of the Portfolio's management. Our responsibility is to express an opinion on these financial statements and financial highlights based on our audits.
We conducted our audits in accordance with the standards of the Public Company Accounting Oversight Board (United States). Those standards require that we plan and perform the audit to obtain reasonable assurance about whether the financial statements and financial highlights are free of material misstatement. We were not engaged to perform an audit of the Portfolio's internal control over financial reporting. Our audits included consideration of internal control over financial reporting as a basis for designing audit procedures that are appropriate in the circumstances, but not for the purpose of expressing an opinion on the effectiveness of the Portfolio's internal control over financial reporting. Accordingly, we express no such opinion. An audit also includes examining, on a test basis, evidence supporting the amounts and disclosures in the financial statements and financial highlights, assessing the accounting principles used and significant estimates made by management, and evaluating the overall financial statement presentation. Our procedures included confirmation of securities owned as of December 31, 2015, by correspondence with the custodian and others or by other appropriate auditing procedures where replies from others were not received. We believe that our audits provide a reasonable basis for our opinion.
In our opinion, the financial statements and financial highlights referred to above present fairly, in all material respects, the financial position of International Advantage Portfolio (one of the portfolios constituting Morgan Stanley Institutional Fund, Inc.) at December 31, 2015, the results of its operations for the year then ended, the changes in its net assets for each of the two years in the period then ended and the financial highlights for each of the years or periods indicated therein, in conformity with U.S. generally accepted accounting principles.

Boston, Massachusetts
February 26, 2016
26
Morgan Stanley Institutional Fund, Inc.
Annual Report — December 31, 2015
Federal Tax Notice (unaudited)
For Federal income tax purposes, the following information is furnished with respect to the distributions paid by the Portfolio during its taxable year ended December 31, 2015.
The Portfolio designated and paid approximately $545,000 as a long-term capital gain distribution.
For Federal income tax purposes, the following information is furnished with respect to the Portfolio's earnings for its taxable year ended December 31, 2015. When distributed, certain earnings may be subject to a maximum tax rate of 15% as provided for the Jobs and Growth Tax Relief Reconciliation Act of 2003. The Portfolio designated up to a maximum of approximately $119,000 as taxable at this lower rate.
In January, the Portfolio provides tax information to shareholders for the preceding calendar year.
27
Morgan Stanley Institutional Fund, Inc.
Annual Report — December 31, 2015
U.S. Privacy Policy (unaudited)
AN IMPORTANT NOTICE CONCERNING OUR U.S. PRIVACY POLICY
This privacy notice describes the U.S. privacy policy of Morgan Stanley Distribution, Inc., and the Morgan Stanley family of mutual funds ("us", "our", "we").
We are required by federal law to provide you with notice of our U.S. privacy policy ("Policy"). This Policy applies to both our current and former clients unless we state otherwise and is intended for individual clients who purchase products or receive services from us for personal, family or household purposes. This Policy is not applicable to partnerships, corporations, trusts or other non-individual clients or account holders, nor is this Policy applicable to individuals who are either beneficiaries of a trust for which we serve as trustee or participants in an employee benefit plan administered or advised by us. This Policy is, however, applicable to individuals who select us to be a custodian of securities or assets in individual retirement accounts, 401(k) accounts, or accounts subject to the Uniform Gifts to Minors Act.
This notice sets out our business practices to protect your privacy; how we collect and share personal information about you; and how you can limit our sharing or certain uses by others of this information. We may amend this Policy at any time, and will inform you of any changes to our Policy as required by law.
WE RESPECT YOUR PRIVACY
We appreciate that you have provided us with your personal financial information and understand your concerns about your information. We strive to safeguard the information our clients entrust to us. Protecting the confidentiality and security of client information is an important part of how we conduct our business.
This notice describes what personal information we collect about you, how we collect it, when we may share it with others, and how certain others may use it. It discusses the steps you may take to limit our sharing of certain information about you with our affiliated companies, including, but not limited to our affiliated banking businesses, brokerage firms and credit service affiliates. It also discloses how you may limit our affiliates' use of shared information for marketing purposes.
Throughout this Policy, we refer to the nonpublic information that personally identifies you as "personal information." We also use the term "affiliated company" in this notice. An affiliated company is a company in our family of companies and includes companies with the Morgan Stanley name. These affiliated companies are financial institutions such as broker-dealers, banks, investment advisers and credit card issuers. We refer to any company that is not an affiliated company as a nonaffiliated third party. For purposes of Section 5 of this notice, and your ability to limit certain uses of personal information by our affiliates, this notice applies to the use of personal information by our affiliated companies.
1. WHAT PERSONAL INFORMATION DO WE COLLECT FROM YOU?
We may collect the following types of information about you: (i) information provided by you, including information from applications and other forms we receive from you, (ii) information about your transactions with us or our affiliates, (iii) information about your transactions with nonaffiliated third parties, (iv) information from consumer reporting agencies, (v) information obtained from our websites, and (vi) information obtained from other sources. For example:
• We collect information such as your name, address, e-mail address, telephone/fax numbers, assets, income and investment objectives through applications and other forms you submit to us.
• We may obtain information about account balances, your use of account(s) and the types of products and services you prefer to receive from us through your dealings and transactions with us and other sources.
• We may obtain information about your creditworthiness and credit history from consumer reporting agencies.
• We may collect background information from and through third-party vendors to verify representations you have made and to comply with various regulatory requirements.
2. WHEN DO WE DISCLOSE PERSONAL INFORMATION WE COLLECT ABOUT YOU?
We may disclose personal information we collect about you in each of the categories listed above to affiliated and nonaffiliated third parties.
28
Morgan Stanley Institutional Fund, Inc.
Annual Report — December 31, 2015
U.S. Privacy Policy (unaudited) (cont'd)
a. Information We Disclose to Affiliated Companies.
We may disclose personal information that we collect about you to our affiliated companies to manage your account(s) effectively, to service and process your transactions, and to let you know about products and services offered by us and affiliated companies, to manage our business, and as otherwise required or permitted by law. Offers for products and services from affiliated companies are developed under conditions designed to safeguard your personal information.
b. Information We Disclose to Third Parties.
We may disclose personal information that we collect about you to nonaffiliated third parties to provide marketing services on our behalf or to other financial institutions with whom we have joint marketing agreements. We may also disclose all of the information we collect to other nonaffiliated third parties for our everyday business purposes, such as to process transactions, maintain account(s), respond to court orders and legal investigations, report to credit bureaus, offer our own products and services, protect against fraud, for institutional risk control, to perform services on our behalf, and as otherwise required or permitted by law.
When we share personal information about you with a nonaffiliated third party, they are required to limit their use of personal information about you to the particular purpose for which it was shared and they are not allowed to share personal information about you with others except to fulfill that limited purpose or as may be permitted or required by law.
3. HOW DO WE PROTECT THE SECURITY AND CONFIDENTIALITY OF PERSONAL INFORMATION WE COLLECT ABOUT YOU?
We maintain physical, electronic and procedural security measures that comply with applicable law and regulations to help safeguard the personal information we collect about you. We have internal policies governing the proper handling of client information by employees. Third parties that provide support or marketing services on our behalf may also receive personal information about you, and we require them to adhere to appropriate security standards with respect to such information.
4. HOW CAN YOU LIMIT OUR SHARING CERTAIN PERSONAL INFORMATION ABOUT YOU WITH OUR AFFILIATED COMPANIES FOR ELIGIBILITY DETERMINATION?
By following the opt-out procedures in Section 6 below, you may limit the extent to which we share with our affiliated companies, personal information that was collected to determine your eligibility for products and services such as your credit reports and other information that you have provided to us or that we may obtain from third parties ("eligibility information"). Eligibility information does not include your identification information or personal information pertaining to our transactions or experiences with you. Please note that, even if you direct us not to share eligibility information with our affiliated companies, we may still share your personal information, including eligibility information, with our affiliated companies under circumstances that are permitted under applicable law, such as to process transactions or to service your account.
5. HOW CAN YOU LIMIT THE USE OF CERTAIN PERSONAL INFORMATION ABOUT YOU BY OUR AFFILIATED COMPANIES FOR MARKETING?
By following the opt-out instructions in Section 6 below, you may limit our affiliated companies from marketing their products or services to you based on personal information we disclose to them. This information may include, for example, your income and account history with us. Please note that, even if you choose to limit our affiliated companies from using personal information about you that we may share with them for marketing their products and services to you, our affiliated companies may use your personal information that they obtain from us to market to you in circumstances permitted by law, such as if the affiliated party has its own relationship with you.
29
Morgan Stanley Institutional Fund, Inc.
Annual Report — December 31, 2015
U.S. Privacy Policy (unaudited) (cont'd)
6. HOW CAN YOU SEND US AN OPT-OUT INSTRUCTION?
If you wish to limit our sharing of eligibility information about you with our affiliated companies, or our affiliated companies' use of personal information for marketing purposes, as described in this notice, you may do so by:
• Calling us at (800) 548-7786
Monday–Friday between 8a.m. and 6p.m. (EST)
• Writing to us at the following address:
Boston Financial Data Services, Inc.
c/o Privacy Coordinator
P.O. Box 219804
Kansas City, Missouri 64121
If you choose to write to us, your request should include: your name, address, telephone number and account number(s) to which the opt-out applies and whether you are opting out with respect to sharing of eligibility information (Section 4 above), or information used for marketing (Section 5 above), or both. Written opt-out requests should not be sent with any other correspondence. In order to process your request, we require that the request be provided by you directly and not through a third party. Once you have informed us about your privacy preferences, your opt-out preference will remain in effect with respect to this Policy (as it may be amended) until you notify us otherwise. If you are a joint account owner, we will accept instructions from any one of you and apply those instructions to the entire account.
Please understand that if you limit our sharing or our affiliated companies' use of personal information, you and any joint account holder(s) may not receive information about our affiliated companies' products and services, including products or services that could help you manage your financial resources and achieve your investment objectives.
If you have more than one account or relationship with us, please specify the accounts to which you would like us to apply your privacy choices. If you have accounts or relationships with our affiliates, you may receive multiple privacy policies from them, and will need to separately notify those companies of your privacy choices for those accounts or relationships.
7. WHAT IF AN AFFILIATED COMPANY BECOMES A NONAFFILIATED THIRD PARTY?
If, at any time in the future, an affiliated company becomes a nonaffiliated third party, further disclosures of personal information made to the former affiliated company will be limited to those described in Section 2(b) above relating to nonaffiliated third parties. If you elected under Section 6 to limit disclosures we make to affiliated companies, or use of personal information by affiliated companies, your election will not apply to use by any former affiliated company of your personal information in their possession once it becomes a nonaffiliated third party.
SPECIAL NOTICE TO RESIDENTS OF VERMONT
The following section supplements our Policy with respect to our individual clients who have a Vermont address and supersedes anything to the contrary in the above Policy with respect to those clients only.
The State of Vermont requires financial institutions to obtain your consent prior to sharing personal information that they collect about you with nonaffiliated third parties, or eligibility information with affiliated companies, other than in certain limited circumstances. Except as permitted by law, we will not share personal information we collect about you with nonaffiliated third parties or eligibility information with affiliated companies, unless you provide us with your written consent to share such information.
SPECIAL NOTICE TO RESIDENTS OF CALIFORNIA
The following section supplements our Policy with respect to our individual clients who have a California address and supersedes anything to the contrary in the above Policy with respect to those clients only.
In response to a California law, if your account has a California home address, your personal information will not be disclosed to nonaffiliated third parties except as permitted by applicable California law, and we will limit sharing such personal information with our affiliates to comply with California privacy laws that apply to us.
30
Morgan Stanley Institutional Fund, Inc.
Annual Report — December 31, 2015
Director and Officer Information (unaudited)
Independent Directors:
| Name, Age and Address of Independent Director | Positions(s) Held with Registrant | Length of Time Served* | Principal Occupation(s) During Past 5 Years and Other Relevant Professional Experience | Number of Portfolios in Fund Complex Overseen by Director** | Other Directorships Held by Independent Director*** | ||||||||||||||||||
| Frank L. Bowman (71) c/o Kramer Levin Naftalis & Frankel LLP Counsel to the Independent Directors 1177 Avenue of the Americas New York, NY 10036 | Director | Since August 2006 | President, Strategic Decisions, LLC (consulting) (since February 2009); Director or Trustee of various Morgan Stanley Funds (since August 2006); Chairperson of the Compliance and Insurance Committee (since October 2015); Formerly, Chairperson of the Insurance Sub-Committee of the Compliance and Insurance Committee (February 2007-December 2015); served as President and Chief Executive Officer of the Nuclear Energy Institute (policy organization) (February 2005-November 2008); retired as Admiral, U.S. Navy after serving over 38 years on active duty including 8 years as Director of the Naval Nuclear Propulsion Program in the Department of the Navy and the U.S. Department of Energy (1996-2004); served as Chief of Naval Personnel (July 1994-September 1996); and on the Joint Staff as Director of Political Military Affairs (June 1992-July1994); knighted as Honorary Knight Commander of the Most Excellent Order of the British Empire; awarded the Officier de l'Orde National du Mérite by the French Government; elected to the National Academy of Engineering (2009). | 98 | Director of BP p.l.c.; Director of Naval and Nuclear Technologies LLP; Director Emeritus of the Armed Services YMCA; Director of the U.S. Naval Submarine League; Member of the National Security Advisory Council of the Center for U.S. Global Engagement and a member of the CNA Military Advisory Board; Chairman of the Charity, J Street Cup Golf, Trustee of Fairhaven United Methodist Church; and Director of other various non-profit organizations. | ||||||||||||||||||
| Kathleen A. Dennis (62) c/o Kramer Levin Naftalis & Frankel LLP Counsel to the Independent Directors 1177 Avenue of the Americas New York, NY 10036 | Director | Since August 2006 | President, Cedarwood Associates (mutual fund and investment management consulting) (since July 2006); Chairperson of the Money Market and Alternatives Sub-Committee of the Investment Committee (since October 2006) and Director or Trustee of various Morgan Stanley Funds (since August 2006); formerly, Senior Managing Director of Victory Capital Management (1993-2006). | 98 | Director of various nonprofit organizations. | ||||||||||||||||||
| Nancy C. Everett (61) c/o Kramer Levin Naftalis & Frankel LLP Counsel to the Independent Directors 1177 Avenue of the Americas New York, NY 10036 | Director | Since January 2015 | Chief Executive Officer, Virginia Commonwealth University Investment Company (since November 2015); Owner, OBIR, LLC (investment management consulting) (since June 2014); formerly, Managing Director, BlackRock Inc. (February 2011-December 2013); and Chief Executive Officer, General Motors Asset Management (a/k/a Promark Global Advisors, Inc.) (June 2005-May 2010). | 98 | Member of Virginia Commonwealth University School of Business Foundation; formerly, Member of Virginia Commonwealth University Board of Visitors (2013-2015); Member of Committee on Directors for Emerging Markets Growth Fund, Inc. (2007-2010); Chairperson of Performance Equity Management, LLC (2006-2010); and Chairperson, GMAM Absolute Return Strategies Fund, LLC (2006-2010). | ||||||||||||||||||
31
Morgan Stanley Institutional Fund, Inc.
Annual Report — December 31, 2015
Director and Officer Information (unaudited) (cont'd)
Independent Directors: (cont'd)
| Name, Age and Address of Independent Director | Positions(s) Held with Registrant | Length of Time Served* | Principal Occupation(s) During Past 5 Years and Other Relevant Professional Experience | Number of Portfolios in Fund Complex Overseen by Director** | Other Directorships Held by Independent Director*** | ||||||||||||||||||
| Jakki L. Haussler (58) c/o Kramer Levin Naftalis & Frankel LLP Counsel to the Independent Directors 1177 Avenue of the Americas New York, NY 10036 | Director | Since January 2015 | Chairman and Chief Executive Officer, Opus Capital Group (since January 1996); and formerly, Director, Capvest Venture Fund, LP (May 2000-December 2011); Partner, Adena Ventures, LP (July 1999-December 2010); Director, The Victory Funds (February 2005-July 2008). | 98 | Director of Cincinnati Bell Inc. and Member, Audit Committee and Compensation Committee; Director of Northern Kentucky University Foundation and Member, Investment Committee; Member of Chase College of Law Transactional Law Practice Center Board of Advisors; Director of Best Transport; Chase College of Law Board of Visitors; formerly Member, University of Cincinnati Foundation Investment Committee; Member, Miami University Board of Visitors (2008-2011); Trustee of Victory Funds (2005-2008) and Chairman, Investment Committee (2007-2008) and Member, Service Provider Committee (2005-2008). | ||||||||||||||||||
| Dr. Manuel H. Johnson (67) c/o Johnson Smick International, Inc. 220 I Street, N.E. — Suite 200 Washington, D.C. 20002 | Director | Since July 1991 | Senior Partner, Johnson Smick International, Inc. (consulting firm); Chairperson of the Investment Committee (since October 2006) and Director or Trustee of various Morgan Stanley Funds (since July 1991); Co-Chairman and a founder of the Group of Seven Council (G7C) (international economic commission); formerly Chairperson of the Audit Committee (July 1991-September 2006), Vice Chairman of the Board of Governors of the Federal Reserve System and Assistant Secretary of the U.S. Treasury. | 100 | Director of NVR, Inc. (home construction). | ||||||||||||||||||
| Joseph J. Kearns (73) c/o Kearns & Associates LLC 23823 Malibu Road S-50-440 Malibu, CA 90265 | Director | Since August 1994 | President, Kearns & Associates LLC (investment consulting); Chairperson of the Audit Committee (since October 2006) and Director or Trustee of various Morgan Stanley Funds (since August 1994); formerly, Deputy Chairperson of the Audit Committee (July 2003-September 2006) and Chairperson of the Audit Committee of various Morgan Stanley Funds (since August 1994); CFO of the J. Paul Getty Trust. | 101 | Director of Electro Rent Corporation (equipment leasing). Prior to December 31, 2013, Director of The Ford Family Foundation. | ||||||||||||||||||
32
Morgan Stanley Institutional Fund, Inc.
Annual Report — December 31, 2015
Director and Officer Information (unaudited) (cont'd)
Independent Directors: (cont'd)
| Name, Age and Address of Independent Director | Positions(s) Held with Registrant | Length of Time Served* | Principal Occupation(s) During Past 5 Years and Other Relevant Professional Experience | Number of Portfolios in Fund Complex Overseen by Director** | Other Directorships Held by Independent Director*** | ||||||||||||||||||
| Michael F. Klein (57) c/o Kramer Levin Naftalis & Frankel LLP Counsel to the Independent Directors 1177 Avenue of the Americas New York, NY 10036 | Director | Since August 2006 | Managing Director, Aetos Capital, LLC (since March 2000); Co-President, Aetos Alternatives Management, LLC (since January 2004); and Co-Chief Executive Officer of Aetos Capital LLC (since August 2013); Chairperson of the Fixed Income Sub-Committee of the Investment Committee (since October 2006) and Director or Trustee of various Morgan Stanley Funds (since August 2006); formerly, Managing Director, Morgan Stanley & Co. Inc. and Morgan Stanley Dean Witter Investment Management, President, various Morgan Stanley Funds (June1998-March 2000) and Principal, Morgan Stanley & Co. Inc. and Morgan Stanley Dean Witter Investment Management (August 1997-December 1999). | 97 | Director of certain investment funds managed or sponsored by Aetos Capital, LLC. Director of Sanitized AG and Sanitized Marketing AG (specialty chemicals). | ||||||||||||||||||
| Michael E. Nugent (79) 522 Fifth Avenue New York, NY 10036 | Chair of the Board and Director | Chair of the Boards since July 2006 and Director since July 1991 | Chair of the Boards of various Morgan Stanley Funds (since July 2006); Chairperson of the Closed-End Fund Committee (since June 2012) and Director or Trustee of various Morgan Stanley Funds (since July 1991); formerly, Chairperson of the Insurance Committee (until July 2006), General Partner, TriumphCapital, L.P. (private investment partnership) (1988-2013). | 100 | None. | ||||||||||||||||||
| W. Allen Reed (68) c/o Kramer Levin Naftalis & Frankel LLP Counsel to the Independent Directors 1177 Avenue of the Americas New York, NY 10036 | Director | Since August 2006 | Chairperson of the Equity Sub-Committee of the Investment Committee (since October 2006) and Director or Trustee of various Morgan Stanley Funds (since August 2006); formerly, President and CEO of General Motors Asset Management; Chairman and Chief Executive Officer of the GM Trust Bank and Corporate Vice President of General Motors Corporation (August 1994-December 2005). | 98 | Director of Legg Mason, Inc.; formerly Director of the Auburn University Foundation (2010-2015). | ||||||||||||||||||
| Fergus Reid (83) c/o Joe Pietryka, Inc. 85 Charles Colman Blvd. Pawling, NY 12564 | Director | Since June 1992 | Chairman, Joe Pietryka, Inc.; Chairperson of the Governance Committee and Director or Trustee of various Morgan Stanley Funds (since June 1992). | 100 | Formerly, Trustee and Director of certain investment companies in the JP Morgan Fund Complex managed by JP Morgan Investment Management Inc. (1987-2012). | ||||||||||||||||||
33
Morgan Stanley Institutional Fund, Inc.
Annual Report — December 31, 2015
Director and Officer Information (unaudited) (cont'd)
Interested Director:
| Name, Age and Address of Interested Director | Positions(s) Held with Registrant | Length of Time Served* | Principal Occupation(s) During Past 5 Years | Number of Portfolios in Fund Complex Overseen by Interested Director** | Other Directorships Held by Interested Director*** | ||||||||||||||||||
| James F. Higgins (68) One New York Plaza, New York, NY 10004 | Director | Since June 2000 | Director or Trustee of various Morgan Stanley Funds (since June 2000); Senior Advisor of Morgan Stanley (since August 2000). | 99 | Formerly, Director of AXA Financial, Inc. and AXA Equitable Life Insurance Company (2002-2011) and Director of AXA MONY Life Insurance Company and AXA MONY Life Insurance Company of America (2004-2011). | ||||||||||||||||||
* This is the earliest date the Director began serving the Morgan Stanley Funds. Each Director serves an indefinite term, until his or her successor is elected.
** The Fund Complex includes (as of December 31, 2015) all open-end and closed-end funds (including all of their portfolios) advised by Morgan Stanley Investment Management Inc. (the "Adviser") and any funds that have an adviser that is an affiliated person of the Adviser (including, but not limited to, Morgan Stanley AIP GP LP).
*** This includes any directorships at public companies and registered investment companies held by the Director at any time during the past five years.
Executive Officers:
Name, Age and Address of Executive Officer | Position(s) Held with Registrant | Length of Time Served**** | Principal Occupation(s) During Past 5 Years | ||||||||||||
| John H. Gernon (52) 522 Fifth Avenue New York, NY 10036 | President and Principal Executive Officer | Since September 2013 | President and Principal Executive Officer of the Equity and Fixed Income Funds and the Morgan Stanley AIP Funds (since September 2013) and the Liquidity Funds and various money market funds (since May 2014) in the Fund Complex, Managing Director of the Adviser; Head of Product (since 2006). | ||||||||||||
| Stefanie V. Chang Yu (49) 522 Fifth Avenue New York, NY 10036 | Chief Compliance Officer | Since December 1997 | Managing Director of the Adviser and various entities affiliated with the Adviser; Chief Compliance Officer of various Morgan Stanley Funds and the Adviser (since January 2014); formerly, Vice President of various Morgan Stanley Funds (December 1997-January 2014). | ||||||||||||
| Joseph C. Benedetti (50) 522 Fifth Avenue New York, NY 10036 | Vice President | Since January 2014 | Managing Director of the Adviser and various entities affiliated with the Adviser; Vice President of various Morgan Stanley Funds (since January 2014); formerly, Assistant Secretary of various Morgan Stanley Funds (October 2004-January 2014). | ||||||||||||
| Francis J. Smith (50) 522 Fifth Avenue New York, NY 10036 | Treasurer and Principal Financial Officer | Treasurer since July 2003 and Principal Financial Officer since September 2002 | Executive Director of the Adviser and various entities affiliated with the Adviser; Treasurer (since July 2003) and Principal Financial Officer of various Morgan Stanley Funds (since September 2002). | ||||||||||||
| Mary E. Mullin (48) 522 Fifth Avenue New York, NY 10036 | Secretary | Since June 1999 | Executive Director of the Adviser; Secretary of various Morgan Stanley Funds (since June 1999). | ||||||||||||
**** This is the earliest date the officer began serving the Morgan Stanley Funds. Each officer serves a one-year term, until his or her successor is elected and has qualified.
34
Morgan Stanley Institutional Fund, Inc.
Annual Report — December 31, 2015
Adviser and Administrator
Morgan Stanley Investment Management Inc.
522 Fifth Avenue
New York, New York 10036
Distributor
Morgan Stanley Distribution, Inc.
522 Fifth Avenue
New York, New York 10036
Dividend Disbursing and Transfer Agent
Boston Financial Data Services, Inc.
2000 Crown Colony Drive
Quincy, Massachusetts 02169
Custodian
State Street Bank and Trust Company
One Lincoln Street
Boston, Massachusetts 02111
Legal Counsel
Dechert LLP
1095 Avenue of the Americas
New York, New York 10036
Counsel to the Independent Directors
Kramer Levin Naftalis & Frankel LLP
1177 Avenue of the Americas
New York, New York 10036
Independent Registered Public Accounting Firm
Ernst & Young LLP
200 Clarendon Street
Boston, Massachusetts 02116
Reporting to Shareholders
Each Morgan Stanley fund provides a complete schedule of portfolio holdings in its semi-annual and annual reports within 60 days of the end of the fund's second and fourth fiscal quarters. The semi-annual and annual reports are filed electronically with the Securities and Exchange Commission (SEC) on Form N-CSRS and Form N-CSR, respectively. Morgan Stanley also delivers the semi-annual and annual reports to fund shareholders and makes these reports available on its public website, www.morganstanley.com/im. Each Morgan Stanley fund also files a complete schedule of portfolio holdings with the SEC for the fund's first and third fiscal quarters on Form N-Q. Morgan Stanley does not deliver the reports for the first and third fiscal quarters to shareholders, nor are the reports posted to the Morgan Stanley public website. You may, however, obtain the Form N-Q filings (as well as the Form N-CSR and N-CSRS filings) by accessing the SEC's website, www.sec.gov. You may also review and copy them at the SEC's Public Reference Room in Washington, DC. Information on the operation of the SEC's Public Reference Room may be obtained by calling the SEC toll free at 1 (800) SEC-0330. You can also request copies of these materials, upon payment of a duplicating fee, by electronic request at the SEC's email address (publicinfo@sec.gov) or by writing the Public Reference Room of the SEC, Washington, DC 20549-0102.
Proxy Voting Policies and Procedures and Proxy Voting Record
You may obtain a copy of the Fund's Proxy Voting Policy and Procedures and information regarding how the Fund voted proxies relating to portfolio securities during the most recent twelve-month period ended June 30, without charge, upon request, by calling toll free 1 (800) 548-7786 or by visiting our website at www.morganstanley.com/im. This information is also available on the SEC's website at www.sec.gov.
This report is authorized for distribution only when preceded or accompanied by a prospectus of the Morgan Stanley Institutional Fund, Inc., which describes in detail each Portfolio's investment policies, risks, fees and expenses. Please read the prospectus carefully before you invest or send money. For additional information, including information regarding the investments comprising the Portfolio, please visit our website at www.morganstanley.com/im or call toll free 1 (800) 548-7786.
35
(This Page has been left blank intentionally.)
Printed in U.S.A.
This Report has been prepared for shareholders and may be distributed to others only if preceded or accompanied by a current prospectus.
Morgan Stanley Investment Management Inc.
522 Fifth Avenue
New York, New York 10036
© 2016 Morgan Stanley. Morgan Stanley Distribution, Inc.

IFIIAANN
1406932 EXP. 02.28.17
INVESTMENT MANAGEMENT

Morgan Stanley Institutional Fund, Inc.
Asian Equity Portfolio
Annual Report
December 31, 2015

Morgan Stanley Institutional Fund, Inc.
Annual Report — December 31, 2015
Table of Contents
Shareholders' Letter | 2 | ||||||
Expense Example | 3 | ||||||
Investment Overview | 4 | ||||||
Portfolio of Investments | 6 | ||||||
Statement of Assets and Liabilities | 8 | ||||||
Statement of Operations | 10 | ||||||
Statements of Changes in Net Assets | 11 | ||||||
Financial Highlights | 13 | ||||||
Notes to Financial Statements | 17 | ||||||
Report of Independent Registered Public Accounting Firm | 26 | ||||||
Federal Tax Notice | 27 | ||||||
U.S. Privacy Policy | 28 | ||||||
Director and Officer Information | 31 | ||||||
This report is authorized for distribution only when preceded or accompanied by prospectuses of the Morgan Stanley Institutional Fund, Inc. To receive a prospectus and/or statement of additional information (SAI), which contains more complete information such as investment objectives, charges, expenses, policies for voting proxies, risk considerations, and describes in detail each of the Portfolio's investment policies to the prospective investor, please call toll free 1 (800) 548-7786. Please read the prospectuses carefully before you invest or send money.
Additionally, you can access portfolio information including performance, characteristics, and investment team commentary through Morgan Stanley Investment Management's website: www.morganstanley.com/im.
Market forecasts provided in this report may not necessarily come to pass. There is no guarantee that any sectors mentioned will continue to perform as discussed herein or that securities in such sectors will be held by the Portfolio in the future. There is no assurance that a Portfolio will achieve its investment objective. Portfolios are subject to market risk, which is the possibility that market values of securities owned by the Portfolio will decline and, therefore, the value of the Portfolio's shares may be less than what you paid for them. Accordingly, you can lose money investing in this Portfolio. Please see the prospectus for more complete information on investment risks.
1
Morgan Stanley Institutional Fund, Inc.
Annual Report — December 31, 2015
Shareholders' Letter (unaudited)
Dear Shareholders,
We are pleased to provide this Annual report, in which you will learn how your investment in Asian Equity Portfolio (the "Portfolio") performed during the latest twelve-month period.
Morgan Stanley Investment Management is a client-centric, investor-led organization. Our global presence, intellectual capital, and breadth of products and services enable us to partner with investors to meet the evolving challenges of today's financial markets. We aim to deliver superior investment service and to empower our clients to make the informed decisions that help them reach their investment goals.
As always, we thank you for selecting Morgan Stanley Investment Management, and look forward to working with you in the months and years ahead.
Sincerely,

John H. Gernon
President and Principal Executive Officer
January 2016
2
Morgan Stanley Institutional Fund, Inc.
Annual Report — December 31, 2015
Expense Example (unaudited)
Asian Equity Portfolio
As a shareholder of the Portfolio, you incur two types of costs: (1) transactional costs, including redemptions fees; and (2) ongoing costs, including advisory fees, administration fees, distribution and shareholder services fees and other Portfolio expenses. This example is intended to help you understand your ongoing costs (in dollars) of investing in the Portfolio and to compare these costs with the ongoing costs of investing in other mutual funds.
This example is based on an investment of $1,000 invested at the beginning of the six-month period ended December 31, 2015 and held for the entire six-month period.
Actual Expenses
The table below provides information about actual account values and actual expenses. You may use the information in this table, together with the amount you invested, to estimate the expenses that you paid over the period. Simply divide your account value by $1,000 (for example, an $8,600 account value divided by $1,000 = 8.6), then multiply the result by the number in the table under the heading entitled "Actual Expenses Paid During Period" to estimate the expenses you paid on your account during this period.
Hypothetical Example for Comparison Purposes
The table below provides information about hypothetical account values and hypothetical expenses based on the Portfolio's actual expense ratio and an assumed rate of return of 5% per year before expenses, which is not the Portfolio's actual return. The hypothetical account values and expenses may not be used to estimate the actual ending account balance or expenses you paid for the period. You may use this information to compare the ongoing costs of investing in the Portfolio and other funds. To do so, compare this 5% hypothetical example with the 5% hypothetical examples that appear in the shareholder reports of the other funds.
Please note that the expenses shown in the table are meant to highlight your ongoing costs only and do not reflect any transactional costs, such as sales charges (loads) and redemption fees. Therefore, the information for each class in the table is useful in comparing ongoing costs only, and will not help you determine the relative total costs of owning different funds. In addition, if these transactional costs were included, your costs would have been higher.
| Beginning Account Value 7/1/15 | Actual Ending Account Value 12/31/15 | Hypothetical Ending Account Value | Actual Expenses Paid During Period* | Hypothetical Expenses Paid During Period* | Net Expense Ratio During Period** | ||||||||||||||||||||||
Asian Equity Portfolio Class I | $ | 1,000.00 | $ | 857.20 | $ | 1,017.90 | $ | 6.79 | $ | 7.37 | 1.45 | % | |||||||||||||||
Asian Equity Portfolio Class A | 1,000.00 | 856.60 | 1,016.13 | 8.42 | 9.15 | 1.80 | |||||||||||||||||||||
Asian Equity Portfolio Class L | 1,000.00 | 854.10 | 1,013.61 | 10.75 | 11.67 | 2.30 | |||||||||||||||||||||
Asian Equity Portfolio Class C | 1,000.00 | 853.20 | 1,012.35 | 11.91 | 12.93 | 2.55 | |||||||||||||||||||||
* Expenses are calculated using each Portfolio Class' annualized net expense ratio (as disclosed), multiplied by the average account value over the period, and multiplied by 184/365 (to reflect the most recent one-half year period).
** Annualized.
3
Morgan Stanley Institutional Fund, Inc.
Annual Report — December 31, 2015
Investment Overview (unaudited)
Asian Equity Portfolio
The Portfolio seeks long-term capital appreciation by investing primarily in equity securities of companies in the Asia-Pacific region, excluding Japan.
Performance
For the year ended December 31, 2015, the Portfolio's Class I shares had a total return based on net asset value and reinvestment of distributions per share of –7.06%, net of fees. The Portfolio's Class I shares outperformed the Portfolio's benchmark, the MSCI All Country Asia ex Japan Index (the "Index"), which returned –9.17%.
Factors Affecting Performance
• Asian markets underperformed global developed markets in 2015, returning –9.17%, as measured by the Index, versus the MSCI World Index's flat return of –0.87%. Over the course of the year, markets grew increasingly concerned about China's slowing economy and waning liquidity with the Federal Reserve interest rate hike looming, both of which put downward pressure on global growth. While commodity prices declined, providing a windfall to the consumer, corporate profits hit multi-year lows.
• The Portfolio benefited from favorable stock selection in China, India, Hong Kong and Taiwan. Stock selection across a range of sectors, including consumer discretionary, industrials, materials, information technology and consumer staples, also contributed positively to performance.
• Detracting from relative gains was our stock selection in Korea, Thailand and the Philippines. Stock selection in health care, telecommunication services and financials was also disadvantageous to performance.
Management Strategies
• Several factors are likely to contribute to continued market volatility for some time this year: comprehension of China's true economic growth trajectory; reaction to potential additional devaluation of China's currency; and further adjustment to the consequences of the Fed's rate increase path.
• But we think Asian equities may be heading toward an eventual important turning point, even if precise timing is difficult to determine. Presently, Asia valuations in aggregate appear attractive at about a
30% discount to developed equities — not as deep as the 50% discount as in the 1997-98 period, but below their 20-year average discount of over 20%.i But as a catalyst, we think what could drive Asia equities at some point, perhaps later this year, is when the market focuses on economic growth inflections shifting in favor of Asia and emerging markets relative to developed markets. Historically, the best time to buy Asia, as an asset class, has been when their countries' gross domestic product growth rates were increasing by more than those in developed countries. We believe strongly that there will be big differences among countries for both growth rates and equity performance. Country allocation will be critical to generating excess returns in this environment.
• Our Portfolio has long been positioned for this in terms of both country allocation and sector positioning. In the Portfolio, we are underweight to Hong Kong/China, Singapore and Malaysia, while maintaining our overweight exposures primarily to Taiwan, Philippines and South Korea. From a sector perspective, we have overweight exposures to the information technology, consumer discretionary and telecommunication services sectors, and underweight exposure to financials, energy and utilities. We remain focused on quality and growth.
(i) Source: FactSet and Morgan Stanley Investment Management. Asia markets and developed markets are represented by the MSCI All Country Asia ex Japan Index and MSCI World Index, respectively.
4
Morgan Stanley Institutional Fund, Inc.
Annual Report — December 31, 2015
Investment Overview (unaudited) (cont'd)
Asian Equity Portfolio

* Minimum Investment for Class I shares
** Commenced Operations on December 28, 2010.
In accordance with SEC regulations, the Portfolio's performance shown assumes that all recurring fees (including management fees) were deducted and all dividends and distributions were reinvested. The performance of Class A, L and C shares will vary from the performance of Class I shares based upon their different inception dates and will be impacted by additional fees assessed to those classes.
Performance Compared to the MSCI All Country Asia ex Japan Index(1) and the Lipper Pacific Region ex Japan Funds Index(2)
| Period Ended December 31, 2015 Total Returns(3) | |||||||||||||||||||
Average Annual | |||||||||||||||||||
| One Year | Five Years | Ten Years | Since Inception(6) | ||||||||||||||||
| Portfolio — Class I Shares w/o sales charges(4) | –7.06 | % | 1.98 | % | — | 2.36 | % | ||||||||||||
| Portfolio — Class A Shares w/o sales charges(4) | –7.36 | 1.72 | — | 2.10 | |||||||||||||||
| Portfolio — Class A Shares with maximum 5.25% sales charges(4) | –12.21 | 0.64 | — | 1.01 | |||||||||||||||
| Portfolio — Class L Shares w/o sales charges(4) | –7.82 | 1.19 | — | 1.57 | |||||||||||||||
| Portfolio — Class C Shares w/o sales charges(5) | — | — | — | –16.57 | |||||||||||||||
| Portfolio — Class C Shares with maximum 1.00% deferred sales charges(5) | — | — | — | –17.17 | |||||||||||||||
| MSCI All Country Asia ex Japan Index | –9.17 | –0.14 | — | 0.27 | |||||||||||||||
| Lipper Pacific Region ex Japan Funds Index | –5.56 | 0.99 | — | 1.42 | |||||||||||||||
Performance data quoted represents past performance, which is no guarantee of future results, and current performance may be lower or higher than the figures shown. Performance assumes that all dividends and distributions, if any, were reinvested. For the most recent month-end performance figures, please visit www.morganstanley.com/im. Investment return and principal value will fluctuate so that Portfolio shares, when redeemed, may be worth more or less than their original cost. Total returns do not reflect the deduction of taxes that a shareholder would pay on Portfolio distributions or the redemption of Portfolio shares. Returns for periods less than one year are not annualized. Performance of share classes will vary due to difference in sales charges and expenses.
(1) The MSCI All Country Asia ex Japan Index is a free float-adjusted market capitalization weighted index that is designed to measure the equity market performance of Asia, excluding Japan. The performance of the Index is listed in U.S. dollars and assumes reinvestment of net dividends. The Index is unmanaged and its returns do not include any sales charges or fees. Such costs would lower performance. It is not possible to invest directly in an index.
(2) The Lipper Pacific Region ex Japan Funds Index is an equally weighted performance index of the largest qualifying funds (based on net assets) in the Lipper Pacific Region ex Japan Funds classification. The Index, which is adjusted for capital gains distributions and income dividends, is unmanaged and should not be considered an investment. There are currently 10 funds represented in this Index. As of the date of this report, the Portfolio was in the Lipper Pacific Region ex Japan Funds classification.
(3) Total returns for the Portfolio reflect fees waived and expenses reimbursed, if applicable, by the Adviser. Without such waivers and reimbursements, total returns would have been lower.
(4) Commenced operations on December 28, 2010.
(5) Commenced offering on April 30, 2015.
(6) For comparative purposes, average annual since inception returns listed for the Indexes refer to the inception date of Class I of the Portfolio, not the inception of the Index.
5
Morgan Stanley Institutional Fund, Inc.
Annual Report — December 31, 2015
Portfolio of Investments
Asian Equity Portfolio
Shares | Value (000) | ||||||||||
Common Stocks (84.0%) | |||||||||||
China (26.8%) | |||||||||||
Alibaba Group Holding Ltd. ADR (a) | 100 | $ | 8 | ||||||||
Bank of China Ltd. H Shares (b) | 75,000 | 33 | |||||||||
China Construction Bank Corp. H Shares (b) | 46,000 | 31 | |||||||||
China Machinery Engineering Corp. H Shares (b) | 6,000 | 4 | |||||||||
China Mengniu Dairy Co., Ltd. (b) | 5,000 | 8 | |||||||||
China Mobile Ltd. (b) | 4,000 | 45 | |||||||||
China Overseas Land & Investment Ltd. (b) | 6,000 | 21 | |||||||||
China Pacific Insurance Group Co., Ltd. H Shares (b) | 5,000 | 21 | |||||||||
China Taiping Insurance Holdings Co., Ltd. (a)(b) | 2,800 | 9 | |||||||||
China Unicom Hong Kong Ltd. (b) | 4,000 | 5 | |||||||||
Chongqing Changan Automobile Co., Ltd. B Shares | 2,200 | 5 | |||||||||
| CRCC High-Tech Equipment Corp., Ltd. H Shares (a)(b) | 16,000 | 10 | |||||||||
Huadian Power International Corp., Ltd. H Shares (b) | 8,000 | 5 | |||||||||
JD.com, Inc. ADR (a) | 347 | 11 | |||||||||
NetEase, Inc. ADR | 54 | 10 | |||||||||
| Shanghai Jin Jiang International Hotels Group Co., Ltd. H Shares (b) | 8,000 | 3 | |||||||||
Shenzhen International Holdings Ltd. (b) | 3,000 | 6 | |||||||||
Shenzhou International Group Holdings Ltd. (b) | 2,000 | 11 | |||||||||
Sihuan Pharmaceutical Holdings Group Ltd. (c)(d) | 113,000 | 42 | |||||||||
TAL Education Group ADR (a) | 170 | 8 | |||||||||
Tencent Holdings Ltd. (b) | 4,200 | 82 | |||||||||
378 | |||||||||||
Hong Kong (10.6%) | |||||||||||
AIA Group Ltd. | 1,800 | 11 | |||||||||
BOC Hong Kong Holdings Ltd. | 9,500 | 29 | |||||||||
Cheung Kong Property Holdings Ltd. | 3,128 | 20 | |||||||||
CK Hutchison Holdings Ltd. | 3,128 | 42 | |||||||||
HKT Trust & HKT Ltd. | 13,520 | 17 | |||||||||
Hong Kong Exchanges and Clearing Ltd. | 300 | 8 | |||||||||
L'Occitane International SA | 1,250 | 2 | |||||||||
Samsonite International SA | 6,600 | 20 | |||||||||
149 | |||||||||||
India (2.1%) | |||||||||||
HDFC Bank Ltd. ADR | 269 | 17 | |||||||||
Larsen & Toubro Ltd. GDR | 649 | 12 | |||||||||
29 | |||||||||||
Indonesia (3.1%) | |||||||||||
AKR Corporindo Tbk PT | 8,500 | 4 | |||||||||
Jasa Marga Persero Tbk PT | 2,400 | 1 | |||||||||
Kalbe Farma Tbk PT | 98,500 | 9 | |||||||||
Link Net Tbk PT (a) | 10,000 | 3 | |||||||||
Matahari Department Store Tbk PT | 7,700 | 10 | |||||||||
Nippon Indosari Corpindo Tbk PT | 49,600 | 5 | |||||||||
Surya Citra Media Tbk PT | 20,100 | 4 | |||||||||
United Tractors Tbk PT | 2,800 | 3 | |||||||||
XL Axiata Tbk PT (a) | 17,200 | 5 | |||||||||
44 | |||||||||||
Shares | Value (000) | ||||||||||
Korea, Republic of (18.2%) | |||||||||||
Amorepacific Corp. (a) | 57 | $ | 20 | ||||||||
Cosmax, Inc. (a) | 40 | 6 | |||||||||
Coway Co., Ltd. (a) | 261 | 19 | |||||||||
Hotel Shilla Co., Ltd. (a) | 181 | 12 | |||||||||
| Hyundai Development Co-Engineering & Construction (a) | 169 | 6 | |||||||||
KB Financial Group, Inc. (a) | 337 | 9 | |||||||||
KEPCO Plant Service & Engineering Co., Ltd. (a) | 97 | 7 | |||||||||
Kia Motors Corp. (a) | 424 | 19 | |||||||||
Korea Aerospace Industries Ltd. (a) | 134 | 9 | |||||||||
LG Chem Ltd. (a) | 62 | 17 | |||||||||
LIG Nex1 Co., Ltd. (a) | 105 | 9 | |||||||||
NAVER Corp. (a) | 26 | 14 | |||||||||
Samsung Electronics Co., Ltd. | 62 | 66 | |||||||||
Samsung Electronics Co., Ltd. (Preference) | 30 | 28 | |||||||||
SK Holdings Co., Ltd. (a) | 72 | 15 | |||||||||
SK Telecom Co., Ltd. | 7 | 1 | |||||||||
257 | |||||||||||
Philippines (3.3%) | |||||||||||
Ayala Corp. | 690 | 11 | |||||||||
BDO Unibank, Inc. | 1,590 | 4 | |||||||||
DMCI Holdings, Inc. | 12,300 | 4 | |||||||||
International Container Terminal Services, Inc. | 2,280 | 3 | |||||||||
LT Group, Inc. | 12,600 | 4 | |||||||||
Metro Pacific Investments Corp. | 53,300 | 6 | |||||||||
Metropolitan Bank & Trust Co. | 3,071 | 5 | |||||||||
Rizal Commercial Banking Corp. | 5,990 | 4 | |||||||||
SM Investments Corp. | 270 | 5 | |||||||||
46 | |||||||||||
Singapore (2.9%) | |||||||||||
DBS Group Holdings Ltd. | 894 | 11 | |||||||||
Jardine Cycle & Carriage Ltd. | 500 | 12 | |||||||||
Keppel Infrastructure Trust (Units) (e) | 31,600 | 11 | |||||||||
OSIM International Ltd. | 3,700 | 3 | |||||||||
Raffles Medical Group Ltd. | 1,281 | 4 | |||||||||
41 | |||||||||||
Taiwan (15.2%) | |||||||||||
Advanced Semiconductor Engineering, Inc. | 11,000 | 13 | |||||||||
Advanced Semiconductor Engineering, Inc. ADR | 209 | 1 | |||||||||
Catcher Technology Co., Ltd. | 2,000 | 17 | |||||||||
Chailease Holding Co., Ltd. | 5,827 | 10 | |||||||||
Delta Electronics, Inc. | 3,262 | 15 | |||||||||
Eclat Textile Co., Ltd. | 2,320 | 32 | |||||||||
Formosa Plastics Corp. | 2,000 | 5 | |||||||||
Fubon Financial Holding Co., Ltd. | 9,000 | 12 | |||||||||
Hon Hai Precision Industry Co., Ltd. | 11,250 | 27 | |||||||||
PChome Online, Inc. | 1,000 | 10 | |||||||||
Pegatron Corp. | 5,000 | 11 | |||||||||
Taiwan Semiconductor Manufacturing Co., Ltd. | 10,000 | 43 | |||||||||
Uni-President Enterprises Corp. | 11,462 | 19 | |||||||||
215 | |||||||||||
The accompanying notes are an integral part of the financial statements.
6
Morgan Stanley Institutional Fund, Inc.
Annual Report — December 31, 2015
Portfolio of Investments (cont'd)
Asian Equity Portfolio
Shares | Value (000) | ||||||||||
Thailand (1.3%) | |||||||||||
Advanced Info Service PCL (Foreign) | 1,300 | $ | 6 | ||||||||
Land and Houses PCL (Foreign) | 15,560 | 4 | |||||||||
Minor International PCL (Foreign) | 7,200 | 7 | |||||||||
Total Access Communication PCL NVDR | 2,700 | 2 | |||||||||
19 | |||||||||||
United States (0.5%) | |||||||||||
Nien Made Enterprise Co., Ltd. (a) | 1,000 | 7 | |||||||||
Total Common Stocks (Cost $1,187) | 1,185 | ||||||||||
Investment Company (5.9%) | |||||||||||
India (5.9%) | |||||||||||
| iShares MSCI India ETF (Cost $94) | 3,046 | 84 | |||||||||
Participation Notes (4.9%) | |||||||||||
India (4.9%) | |||||||||||
| Ashok Leyland Ltd., Equity Linked Notes, expires 5/13/19 (a) | 7,343 | 10 | |||||||||
| Bharat Petroleum Corp., Ltd., Equity Linked Notes, expires 3/13/19 (a) | 460 | 6 | |||||||||
| Gateway Distriparks Ltd., Equity Linked Notes, expires 10/17/19 (a) | 752 | 4 | |||||||||
| Glenmark Pharmaceuticals Ltd., Equity Linked Notes, expires 6/28/18 (a) | 376 | 5 | |||||||||
| Idea Cellular Ltd., Equity Linked Notes, expires 6/7/18 (a) | 1,122 | 2 | |||||||||
| IndusInd Bank Ltd., Equity Linked Notes, expires 8/28/18 (a) | 652 | 10 | |||||||||
| Inox Leisure Ltd., Equity Linked Notes, expires 9/23/19 (a) | 536 | 2 | |||||||||
| Marico Ltd., Equity Linked Notes, expires 1/9/20 (a) | 454 | 2 | |||||||||
| Marico Ltd., Equity Linked Notes, expires 6/10/20 (a) | 1,400 | 5 | |||||||||
| Maruti Suzuki India Ltd., Equity Linked Notes, expires 12/4/18 (a) | 115 | 8 | |||||||||
| Shree Cement Ltd., Equity Linked Notes, expires 7/7/20 (a) | 37 | 6 | |||||||||
| Shriram Transport Finance Co., Ltd., Equity Linked Notes, expires 1/30/19 (a) | 558 | 7 | |||||||||
| Sun Pharmaceutical Industries Ltd., Equity Linked Notes, expires 6/3/20 (a) | 196 | 2 | |||||||||
Total Participation Notes (Cost $64) | 69 | ||||||||||
Short-Term Investment (0.6%) | |||||||||||
Investment Company (0.6%) | |||||||||||
| Morgan Stanley Institutional Liquidity Funds — Money Market Portfolio — Institutional Class (See Note G) (Cost $9) | 9,336 | 9 | |||||||||
Total Investments (95.4%) (Cost $1,354) (f)(g) | 1,347 | ||||||||||
Other Assets in Excess of Liabilities (4.6%) | 65 | ||||||||||
Net Assets (100.0%) | $ | 1,412 | |||||||||
(a) Non-income producing security.
(b) Security trades on the Hong Kong exchange.
(c) At December 31, 2015, the Portfolio held a fair valued security valued at approximately $42,000, representing 3.0% of net assets. This security has been fair valued as determined in good faith under procedures established by and under the general supervision of the Fund's Directors.
(d) Security has been deemed illiquid at December 31, 2015.
(e) Consists of one or more classes of securities traded together as a unit; stocks with attached warrants.
(f) The approximate fair value and percentage of net assets, $1,066,000 and 75.5%, respectively, represent the securities that have been fair valued under the fair valuation policy for international investments as described in Note A-1 within the Notes to the Financial Statements.
(g) At December 31, 2015, the aggregate cost for Federal income tax purposes is approximately $1,389,000. The aggregate gross unrealized appreciation is approximately $112,000 and the aggregate gross unrealized depreciation is approximately $154,000 resulting in net unrealized depreciation of approximately $42,000.
ADR American Depositary Receipt.
ETF Exchange Traded Fund.
GDR Global Depositary Receipt.
NVDR Non-Voting Depositary Receipt.
Portfolio Composition
Classification | Percentage of Total Investments | ||||||
Other* | 54.7 | % | |||||
Banks | 11.4 | ||||||
Wireless Telecommunication Services | 10.4 | ||||||
Internet Software & Services | 9.2 | ||||||
Tech Hardware, Storage & Peripherals | 9.1 | ||||||
Industrial Conglomerates | 5.2 | ||||||
Total Investments | 100.0 | % | |||||
* Industries and/or investment types representing less than 5% of total investments.
The accompanying notes are an integral part of the financial statements.
7
Morgan Stanley Institutional Fund, Inc.
Annual Report — December 31, 2015
Asian Equity Portfolio
Statement of Assets and Liabilities | December 31, 2015 (000) | ||||||
Assets: | |||||||
Investments in Securities of Unaffiliated Issuers, at Value (Cost $1,345) | $ | 1,338 | |||||
Investment in Security of Affiliated Issuer, at Value (Cost $9) | 9 | ||||||
Total Investments in Securities, at Value (Cost $1,354) | 1,347 | ||||||
Foreign Currency, at Value (Cost —@) | — | @ | |||||
Due from Adviser | 64 | ||||||
Receivable for Portfolio Shares Sold | 21 | ||||||
Receivable for Investments Sold | 1 | ||||||
Dividends Receivable | — | @ | |||||
Receivable from Affiliate | — | @ | |||||
Other Assets | 35 | ||||||
Total Assets | 1,468 | ||||||
Liabilities: | |||||||
Payable for Custodian Fees | 37 | ||||||
Payable for Professional Fees | 13 | ||||||
Payable for Transfer Agency Fees — Class I | — | @ | |||||
Payable for Transfer Agency Fees — Class A | — | @ | |||||
Payable for Transfer Agency Fees — Class L | — | @ | |||||
Payable for Transfer Agency Fees — Class C | — | @ | |||||
Payable for Investments Purchased | 1 | ||||||
Payable for Shareholder Services Fees — Class A | — | @ | |||||
Payable for Distribution and Shareholder Services Fees — Class L | — | @ | |||||
Payable for Distribution and Shareholder Services Fees — Class C | — | @ | |||||
Payable for Sub Transfer Agency Fees — Class I | — | @ | |||||
Payable for Sub Transfer Agency Fees — Class A | — | @ | |||||
Payable for Sub Transfer Agency Fees — Class L | — | @ | |||||
Payable for Administration Fees | — | @ | |||||
Other Liabilities | 5 | ||||||
Total Liabilities | 56 | ||||||
Net Assets | $ | 1,412 | |||||
Net Assets Consist Of: | |||||||
Paid-in-Capital | $ | 1,550 | |||||
Distributions in Excess of Net Investment Income | (1 | ) | |||||
Distributions in Excess of Net Realized Gain | (130 | ) | |||||
Unrealized Appreciation (Depreciation) on: | |||||||
Investments | (7 | ) | |||||
Foreign Currency Translations | — | @ | |||||
Net Assets | $ | 1,412 | |||||
The accompanying notes are an integral part of the financial statements.
8
Morgan Stanley Institutional Fund, Inc.
Annual Report — December 31, 2015
Asian Equity Portfolio
Statement of Assets and Liabilities (cont'd) | December 31, 2015 (000) | ||||||
CLASS I: | |||||||
Net Assets | $ | 314 | |||||
| Shares Outstanding $0.001 par value shares of beneficial interest (unlimited shares authorized) (not in 000's) | 45,148 | ||||||
Net Asset Value, Offering and Redemption Price Per Share | $ | 6.97 | |||||
CLASS A: | |||||||
Net Assets | $ | 1,019 | |||||
| Shares Outstanding $0.001 par value shares of beneficial interest (unlimited shares authorized) (not in 000's) | 147,449 | ||||||
Net Asset Value, Redemption Price Per Share | $ | 6.91 | |||||
Maximum Sales Load | 5.25 | % | |||||
Maximum Sales Charge | $ | 0.38 | |||||
Maximum Offering Price Per Share | $ | 7.29 | |||||
CLASS L: | |||||||
Net Assets | $ | 73 | |||||
| Shares Outstanding $0.001 par value shares of beneficial interest (unlimited shares authorized) (not in 000's) | 10,700 | ||||||
Net Asset Value, Offering and Redemption Price Per Share | $ | 6.78 | |||||
CLASS C: | |||||||
Net Assets | $ | 6 | |||||
| Shares Outstanding $0.001 par value shares of beneficial interest (unlimited shares authorized) (not in 000's) | 887 | ||||||
Net Asset Value, Offering and Redemption Price Per Share | $ | 6.77 | |||||
@ Amount is less than $500.
The accompanying notes are an integral part of the financial statements.
9
Morgan Stanley Institutional Fund, Inc.
Annual Report — December 31, 2015
Asian Equity Portfolio
Statement of Operations | Year Ended December 31, 2015 (000) | ||||||
Investment Income: | |||||||
Dividends from Securities of Unaffiliated Issuers (Net of $20 of Foreign Taxes Withheld) | $ | 157 | |||||
Dividends from Security of Affiliated Issuer (Note G) | — | @ | |||||
Total Investment Income | 157 | ||||||
Expenses: | |||||||
Custodian Fees (Note F) | 172 | ||||||
Professional Fees | 79 | ||||||
Advisory Fees (Note B) | 70 | ||||||
Registration Fees | 44 | ||||||
Pricing Fees | 11 | ||||||
Transfer Agency Fees — Class I (Note E) | 2 | ||||||
Transfer Agency Fees — Class A (Note E) | 2 | ||||||
Transfer Agency Fees — Class L (Note E) | 2 | ||||||
Transfer Agency Fees — Class C (Note E) | 1 | ||||||
Administration Fees (Note C) | 6 | ||||||
Shareholder Services Fees — Class A (Note D) | 4 | ||||||
Distribution and Shareholder Services Fees — Class L (Note D) | 1 | ||||||
Distribution and Shareholder Services Fees — Class C (Note D) | — | @ | |||||
Shareholder Reporting Fees | 4 | ||||||
Sub Transfer Agency Fees — Class I | 1 | ||||||
Sub Transfer Agency Fees — Class A | 1 | ||||||
Sub Transfer Agency Fees — Class L | — | @ | |||||
Directors' Fees and Expenses | 1 | ||||||
Other Expenses | 13 | ||||||
Total Expenses | 414 | ||||||
Expenses Reimbursed by Adviser (Note B) | (224 | ) | |||||
Waiver of Advisory Fees (Note B) | (70 | ) | |||||
Reimbursement of Class Specific Expenses — Class I (Note B) | (3 | ) | |||||
Reimbursement of Class Specific Expenses — Class A (Note B) | (1 | ) | |||||
Reimbursement of Class Specific Expenses — Class L (Note B) | (2 | ) | |||||
Reimbursement of Class Specific Expenses — Class C (Note B) | (1 | ) | |||||
Rebate from Morgan Stanley Affiliate (Note G) | (— | @) | |||||
Net Expenses | 113 | ||||||
Net Investment Income | 44 | ||||||
Realized Gain (Loss): | |||||||
Investments Sold | 396 | ||||||
Foreign Currency Forward Exchange Contracts | (6 | ) | |||||
Foreign Currency Transactions | (43 | ) | |||||
Net Realized Gain | 347 | ||||||
Change in Unrealized Appreciation (Depreciation): | |||||||
Investments | (393 | ) | |||||
Foreign Currency Translations | — | @ | |||||
Net Change in Unrealized Appreciation (Depreciation) | (393 | ) | |||||
Net Realized Gain and Change in Unrealized Appreciation (Depreciation) | (46 | ) | |||||
Net Decrease in Net Assets Resulting from Operations | $ | (2 | ) | ||||
@ Amount is less than $500.
The accompanying notes are an integral part of the financial statements.
10
Morgan Stanley Institutional Fund, Inc.
Annual Report — December 31, 2015
Asian Equity Portfolio
Statements of Changes in Net Assets | Year Ended December 31, 2015 (000) | Year Ended December 31, 2014 (000) | |||||||||
Increase (Decrease) in Net Assets: | |||||||||||
Operations: | |||||||||||
Net Investment Income | $ | 44 | $ | 58 | |||||||
Net Realized Gain | 347 | 783 | |||||||||
Net Change in Unrealized Appreciation (Depreciation) | (393 | ) | 78 | ||||||||
Net Increase (Decrease) in Net Assets Resulting from Operations | (2 | ) | 919 | ||||||||
Distributions from and/or in Excess of: | |||||||||||
Class I: | |||||||||||
Net Investment Income | (3 | ) | (47 | ) | |||||||
Net Realized Gain | (184 | ) | (696 | ) | |||||||
Class A: | |||||||||||
Net Investment Income | (1 | ) | (11 | ) | |||||||
Net Realized Gain | (306 | ) | (246 | ) | |||||||
Class L: | |||||||||||
Net Investment Income | (— | @) | (— | @) | |||||||
Net Realized Gain | (29 | ) | (16 | ) | |||||||
Class C: | |||||||||||
Net Investment Income | (— | @) | — | ||||||||
Net Realized Gain | (2 | ) | — | ||||||||
Total Distributions | (525 | ) | (1,016 | ) | |||||||
Capital Share Transactions:(1) | |||||||||||
Class I: | |||||||||||
Subscribed | 5,615 | 5,728 | |||||||||
Distributions Reinvested | 61 | 560 | |||||||||
Redeemed | (13,668 | ) | (2,673 | ) | |||||||
Class A: | |||||||||||
Subscribed | 175 | 943 | |||||||||
Distributions Reinvested | 253 | 227 | |||||||||
Redeemed | (981 | ) | (374 | ) | |||||||
Class L: | |||||||||||
Subscribed | 5 | 62 | |||||||||
Distributions Reinvested | 3 | 1 | |||||||||
Redeemed | (12 | ) | (57 | ) | |||||||
Class C: | |||||||||||
Subscribed | 10 | * | — | ||||||||
Net Increase (Decrease) in Net Assets Resulting from Capital Share Transactions | (8,539 | ) | 4,417 | ||||||||
Redemption Fees | — | 1 | |||||||||
Total Increase (Decrease) in Net Assets | (9,066 | ) | 4,321 | ||||||||
Net Assets: | |||||||||||
Beginning of Period | 10,478 | 6,157 | |||||||||
End of Period (Including Distributions in Excess of Net Investment Income of $(1) and $(7)) | $ | 1,412 | $ | 10,478 | |||||||
The accompanying notes are an integral part of the financial statements.
11
Morgan Stanley Institutional Fund, Inc.
Annual Report — December 31, 2015
Asian Equity Portfolio
Statements of Changes in Net Assets (cont'd) | Year Ended December 31, 2015 (000) | Year Ended December 31, 2014 (000) | |||||||||
(1) Capital Share Transactions: | |||||||||||
Class I: | |||||||||||
Shares Subscribed | 522 | 531 | |||||||||
Shares Issued on Distributions Reinvested | 5 | 53 | |||||||||
Shares Redeemed | (1,289 | ) | (237 | ) | |||||||
Net Increase (Decrease) in Class I Shares Outstanding | (762 | ) | 347 | ||||||||
Class A: | |||||||||||
Shares Subscribed | 18 | 80 | |||||||||
Shares Issued on Distributions Reinvested | 36 | 22 | |||||||||
Shares Redeemed | (103 | ) | (32 | ) | |||||||
Net Increase (Decrease) in Class A Shares Outstanding | (49 | ) | 70 | ||||||||
Class L: | |||||||||||
Shares Subscribed | 1 | 6 | |||||||||
Shares Issued on Distributions Reinvested | — | @@ | — | @@ | |||||||
Shares Redeemed | (1 | ) | (5 | ) | |||||||
Net Increase in Class L Shares Outstanding | — | @@ | 1 | ||||||||
Class C: | |||||||||||
Shares Subscribed | 1 | * | — | ||||||||
* For the period April 30, 2015 through December 31, 2015.
@ Amount is less than $500.
@@ Amount is less than 500 shares.
The accompanying notes are an integral part of the financial statements.
12
Morgan Stanley Institutional Fund, Inc.
Annual Report — December 31, 2015
Financial Highlights
Asian Equity Portfolio
Class I | |||||||||||||||||||||||
Year Ended December 31, | |||||||||||||||||||||||
Selected Per Share Data and Ratios | 2015 | 2014 | 2013 | 2012 | 2011 | ||||||||||||||||||
Net Asset Value, Beginning of Period | $ | 10.33 | $ | 10.33 | $ | 10.40 | $ | 8.47 | $ | 10.19 | |||||||||||||
Income (Loss) from Investment Operations: | |||||||||||||||||||||||
Net Investment Income† | 0.08 | 0.09 | 0.05 | 0.04 | 0.00 | ‡ | |||||||||||||||||
Net Realized and Unrealized Gain (Loss) | (0.77 | ) | 1.44 | (0.05 | ) | 2.00 | (1.72 | ) | |||||||||||||||
Total from Investment Operations | (0.69 | ) | 1.53 | (0.00 | )‡ | 2.04 | (1.72 | ) | |||||||||||||||
Distributions from and/or in Excess of: | |||||||||||||||||||||||
Net Investment Income | (0.00 | )‡ | (0.10 | ) | (0.07 | ) | (0.11 | ) | — | ||||||||||||||
Net Realized Gain | (2.67 | ) | (1.43 | ) | — | — | — | ||||||||||||||||
Total Distributions | (2.67 | ) | (1.53 | ) | (0.07 | ) | (0.11 | ) | — | ||||||||||||||
Redemption Fees | — | 0.00 | ‡ | — | — | — | |||||||||||||||||
Net Asset Value, End of Period | $ | 6.97 | $ | 10.33 | $ | 10.33 | $ | 10.40 | $ | 8.47 | |||||||||||||
Total Return++ | (7.06 | )% | 15.15 | % | (0.05 | )% | 24.08 | % | (16.88 | )% | |||||||||||||
Ratios and Supplemental Data: | |||||||||||||||||||||||
Net Assets, End of Period (Thousands) | $ | 314 | $ | 8,340 | $ | 4,753 | $ | 3,996 | $ | 1,201 | |||||||||||||
Ratio of Expenses to Average Net Assets (1) | 1.45 | %+ | 1.45 | %+ | 1.45 | %+ | 1.45 | %+ | 1.45 | %+ | |||||||||||||
Ratio of Net Investment Income to Average Net Assets (1) | 0.73 | %+ | 0.81 | %+ | 0.52 | %+ | 0.39 | %+ | 0.01 | %+ | |||||||||||||
Ratio of Rebate from Morgan Stanley Affiliates to Average Net Assets | 0.00 | %§ | 0.00 | %§ | 0.00 | %§ | 0.00 | %§ | 0.00 | %§ | |||||||||||||
Portfolio Turnover Rate | 113 | % | 86 | % | 114 | % | 80 | % | 38 | % | |||||||||||||
(1) Supplemental Information on the Ratios to Average Net Assets: | |||||||||||||||||||||||
Ratios Before Expense Limitation: | |||||||||||||||||||||||
Expenses to Average Net Assets | 5.34 | % | 4.68 | % | 4.28 | % | 5.79 | % | 11.86 | % | |||||||||||||
Net Investment Loss to Average Net Assets | (3.16 | )% | (2.42 | )% | (2.31 | )% | (3.95 | )% | (10.40 | )% | |||||||||||||
† Per share amount is based on average shares outstanding.
‡ Amount is less than $0.005 per share.
++ Calculated based on the net asset value as of the last business day of the period.
+ The Ratios of Expenses and Net Investment Income reflect the rebate of certain Portfolio expenses in connection with the investments in Morgan Stanley affiliates during the period. The effect of the rebate on the ratios is disclosed in the above table as "Ratio of Rebate from Morgan Stanley Affiliates to Average Net Assets."
§ Amount is less than 0.005%.
The accompanying notes are an integral part of the financial statements.
13
Morgan Stanley Institutional Fund, Inc.
Annual Report — December 31, 2015
Financial Highlights
Asian Equity Portfolio
Class A | |||||||||||||||||||||||
Year Ended December 31, | |||||||||||||||||||||||
Selected Per Share Data and Ratios | 2015 | 2014 | 2013 | 2012 | 2011 | ||||||||||||||||||
Net Asset Value, Beginning of Period | $ | 10.31 | $ | 10.31 | $ | 10.37 | $ | 8.45 | $ | 10.19 | |||||||||||||
Income (Loss) from Investment Operations: | |||||||||||||||||||||||
Net Investment Income (Loss)† | 0.03 | 0.05 | 0.01 | 0.01 | (0.02 | ) | |||||||||||||||||
Net Realized and Unrealized Gain (Loss) | (0.76 | ) | 1.44 | (0.03 | ) | 2.00 | (1.72 | ) | |||||||||||||||
Total from Investment Operations | (0.73 | ) | 1.49 | (0.02 | ) | 2.01 | (1.74 | ) | |||||||||||||||
Distributions from and/or in Excess of: | |||||||||||||||||||||||
Net Investment Income | (0.00 | )‡ | (0.06 | ) | (0.04 | ) | (0.09 | ) | — | ||||||||||||||
Net Realized Gain | (2.67 | ) | (1.43 | ) | — | — | — | ||||||||||||||||
Total Distributions | (2.67 | ) | (1.49 | ) | (0.04 | ) | (0.09 | ) | — | ||||||||||||||
Redemption Fees | — | 0.00 | ‡ | — | — | — | |||||||||||||||||
Net Asset Value, End of Period | $ | 6.91 | $ | 10.31 | $ | 10.31 | $ | 10.37 | $ | 8.45 | |||||||||||||
Total Return++ | (7.36 | )% | 14.71 | % | (0.15 | )% | 23.76 | % | (17.08 | )% | |||||||||||||
Ratios and Supplemental Data: | |||||||||||||||||||||||
Net Assets, End of Period (Thousands) | $ | 1,019 | $ | 2,024 | $ | 1,302 | $ | 1,201 | $ | 84 | |||||||||||||
Ratio of Expenses to Average Net Assets (1) | 1.80 | %+ | 1.80 | %+ | 1.73 | %+^^ | 1.70 | %+ | 1.70 | %+ | |||||||||||||
Ratio of Net Investment Income (Loss) to Average Net Assets (1) | 0.27 | %+ | 0.46 | %+ | 0.09 | %+ | 0.14 | %+ | (0.24 | )%+ | |||||||||||||
Ratio of Rebate from Morgan Stanley Affiliates to Average Net Assets | 0.00 | %§ | 0.00 | %§ | 0.00 | %§ | 0.00 | %§ | 0.00 | %§ | |||||||||||||
Portfolio Turnover Rate | 113 | % | 86 | % | 114 | % | 80 | % | 38 | % | |||||||||||||
(1) Supplemental Information on the Ratios to Average Net Assets: | |||||||||||||||||||||||
Ratios Before Expense Limitation: | |||||||||||||||||||||||
Expenses to Average Net Assets | 6.35 | % | 5.05 | % | 4.68 | % | 6.04 | % | 12.11 | % | |||||||||||||
Net Investment Loss to Average Net Assets | (4.28 | )% | (2.79 | )% | (2.86 | )% | (4.20 | )% | (10.65 | )% | |||||||||||||
† Per share amount is based on average shares outstanding.
‡ Amount is less than $0.005 per share.
++ Calculated based on the net asset value which does not reflect sales charges, if applicable, as of the last business day of the period.
+ The Ratios of Expenses and Net Investment Income (Loss) reflect the rebate of certain Portfolio expenses in connection with the investments in Morgan Stanley affiliates during the period. The effect of the rebate on the ratios is disclosed in the above table as "Ratio of Rebate from Morgan Stanley Affiliates to Average Net Assets."
^^ Effective September 16, 2013, the Adviser has agreed to limit the ratio of expenses to average net assets to the maximum ratio of 1.80% for Class A Shares. Prior to September 16, 2013, the maximum ratio was 1.70% for Class A Shares.
§ Amount is less than 0.005%.
The accompanying notes are an integral part of the financial statements.
14
Morgan Stanley Institutional Fund, Inc.
Annual Report — December 31, 2015
Financial Highlights
Asian Equity Portfolio
Class L | |||||||||||||||||||||||
Year Ended December 31, | |||||||||||||||||||||||
Selected Per Share Data and Ratios | 2015 | 2014 | 2013 | 2012 | 2011 | ||||||||||||||||||
Net Asset Value, Beginning of Period | $ | 10.22 | $ | 10.23 | $ | 10.31 | $ | 8.40 | $ | 10.19 | |||||||||||||
Income (Loss) from Investment Operations: | |||||||||||||||||||||||
Net Investment Loss† | (0.04 | ) | (0.00 | )‡ | (0.04 | ) | (0.03 | ) | (0.07 | ) | |||||||||||||
Net Realized and Unrealized Gain (Loss) | (0.73 | ) | 1.42 | (0.03 | ) | 1.98 | (1.72 | ) | |||||||||||||||
Total from Investment Operations | (0.77 | ) | 1.42 | (0.07 | ) | 1.95 | (1.79 | ) | |||||||||||||||
Distributions from and/or in Excess of: | |||||||||||||||||||||||
Net Investment Income | (0.00 | )‡ | (0.00 | )‡ | (0.01 | ) | (0.04 | ) | — | ||||||||||||||
Net Realized Gain | (2.67 | ) | (1.43 | ) | — | — | — | ||||||||||||||||
Total Distributions | (2.67 | ) | (1.43 | ) | (0.01 | ) | (0.04 | ) | — | ||||||||||||||
Redemption Fees | — | 0.00 | ‡ | — | — | — | |||||||||||||||||
Net Asset Value, End of Period | $ | 6.78 | $ | 10.22 | $ | 10.23 | $ | 10.31 | $ | 8.40 | |||||||||||||
Total Return++ | (7.82 | )% | 13.97 | % | (0.56 | )% | 23.18 | % | (17.57 | )% | |||||||||||||
Ratios and Supplemental Data: | |||||||||||||||||||||||
Net Assets, End of Period (Thousands) | $ | 73 | $ | 114 | $ | 102 | $ | 103 | $ | 84 | |||||||||||||
Ratio of Expenses to Average Net Assets (1) | 2.30 | %+ | 2.30 | %+ | 2.22 | %+^^ | 2.20 | %+ | 2.20 | %+ | |||||||||||||
Ratio of Net Investment Loss to Average Net Assets (1) | (0.38 | )%+ | (0.04 | )%+ | (0.35 | )%+ | (0.36 | )%+ | (0.74 | )%+ | |||||||||||||
Ratio of Rebate from Morgan Stanley Affiliates to Average Net Assets | 0.00 | %§ | 0.00 | %§ | 0.00 | %§ | 0.00 | %§ | 0.00 | %§ | |||||||||||||
Portfolio Turnover Rate | 113 | % | 86 | % | 114 | % | 80 | % | 38 | % | |||||||||||||
(1) Supplemental Information on the Ratios to Average Net Assets: | |||||||||||||||||||||||
Ratios Before Expense Limitation: | |||||||||||||||||||||||
Expenses to Average Net Assets | 8.52 | % | 6.75 | % | 5.59 | % | 6.54 | % | 12.61 | % | |||||||||||||
Net Investment Loss to Average Net Assets | (6.60 | )% | (4.49 | )% | (3.72 | )% | (4.70 | )% | (11.15 | )% | |||||||||||||
† Per share amount is based on average shares outstanding.
‡ Amount is less than $0.005 per share.
++ Calculated based on the net asset value as of the last business day of the period.
+ The Ratios of Expenses and Net Investment Loss reflect the rebate of certain Portfolio expenses in connection with the investments in Morgan Stanley affiliates during the period. The effect of the rebate on the ratios is disclosed in the above table as "Ratio of Rebate from Morgan Stanley Affiliates to Average Net Assets."
^^ Effective September 16, 2013, the Adviser has agreed to limit the ratio of expenses to average net assets to the maximum ratio of 2.30% for Class L shares. Prior to September 16, 2013, the maximum ratio was 2.20% for Class L shares.
§ Amount is less than 0.005%.
The accompanying notes are an integral part of the financial statements.
15
Morgan Stanley Institutional Fund, Inc.
Annual Report — December 31, 2015
Financial Highlights
Asian Equity Portfolio
Class C | |||||||
Selected Per Share Data and Ratios | Period from April 30, 2015^ to December 31,2015 | ||||||
Net Asset Value, Beginning of Period | $ | 11.28 | |||||
Loss from Investment Operations: | |||||||
Net Investment Loss† | (0.01 | ) | |||||
Net Realized and Unrealized Loss | (1.83 | ) | |||||
Total from Investment Operations | (1.84 | ) | |||||
Distributions from and/or in Excess of: | |||||||
Net Investment Income | (0.00 | )‡ | |||||
Net Realized Gain | (2.67 | ) | |||||
Total Distributions | (2.67 | ) | |||||
Net Asset Value, End of Period | $ | 6.77 | |||||
Total Return++ | (16.57 | )%# | |||||
Ratios and Supplemental Data: | |||||||
Net Assets, End of Period (Thousands) | $ | 6 | |||||
Ratios of Expenses to Average Net Assets (1) | 2.55 | %+* | |||||
Ratio of Net Investment Loss to Average Net Assets (1) | (0.20 | )%+* | |||||
Ratio of Rebate from Morgan Stanley Affiliates to Average Net Assets | 0.00 | %§* | |||||
Portfolio Turnover Rate | 113 | % | |||||
(1) Supplemental Information on the Ratios to Average Net Assets: | |||||||
Ratios Before Expense Limitation: | |||||||
Expense to Average Net Assets | 28.89 | %* | |||||
Net Investment Loss to Average Net Assets | (26.54 | )%* | |||||
^ Commencement of Offering.
† Per share amount is based on average shares outstanding.
‡ Amount is less than $0.005 per share.
++ Calculated based on the net asset value which does not reflect sales charges, if applicable, as of the last business day of the period.
+ The Ratios of Expenses and Net Investment Loss reflect the rebate of certain Portfolio expenses in connection with the investments in Morgan Stanley affiliates during the period. The effect of the rebate on the ratios is disclosed in the above table as "Ratio of Rebate from Morgan Stanley Affiliates to Average Net Assets."
§ Amount is less than 0.005%.
# Not Annualized.
* Annualized.
The accompanying notes are an integral part of the financial statements.
16
Morgan Stanley Institutional Fund, Inc.
Annual Report — December 31, 2015
Notes to Financial Statements
Morgan Stanley Institutional Fund, Inc. (the "Fund") is registered under the Investment Company Act of 1940, as amended (the "Act"), as an open-end management investment company. The Fund is comprised of twenty-six separate, active, diversified and non-diversified portfolios (individually referred to as a "Portfolio", collectively as the "Portfolios"). The Fund applies investment company accounting and reporting guidance.
The accompanying financial statements relate to the Asian Equity Portfolio. The Portfolio's adviser, Morgan Stanley Investment Management Inc. (the "Adviser") and sub-adviser, Morgan Stanley Investment Management Company ("MSIM Company") (the "Sub-Adviser"), seek long-term capital appreciation by investing primarily in equity securities of companies in the Asia-Pacific region, excluding Japan.
The Portfolio offers four classes of shares — Class I, Class A, Class L and Class C. On April 30, 2015, the Portfolio commenced offering Class C shares and suspended offering of Class L shares. Existing Class L shareholders may invest through reinvestment of dividends and distributions.
A. Significant Accounting Policies: The following significant accounting policies are in conformity with U.S. generally accepted accounting principles ("GAAP"). Such policies are consistently followed by the Fund in the preparation of its financial statements. GAAP may require management to make estimates and assumptions that affect the reported amounts and disclosures in the financial statements. Actual results may differ from those estimates.
1. Security Valuation: (1) An equity portfolio security listed or traded on an exchange is valued at its latest reported sales price (or at the exchange official closing price if such exchange reports an official closing price), if there were no sales on a given day, the security is valued at the mean between the last reported bid and asked prices; (2) all other equity portfolio securities for which over-the-counter ("OTC") market quotations are readily available are valued at its latest reported sales price. In cases where a security is traded on more than one exchange, the security is valued on the exchange designated as the primary market; (3) Certain portfolio securities may be valued by an outside pricing service approved by the Fund's Board of Directors (the "Directors"). The pricing service may utilize a matrix system or other model incorporating attributes such as security quality, maturity and coupon as the evaluation model parameters, and/or research evaluations by its
staff, including review of broker dealer market price quotations in determining what it believes is the fair valuation of the portfolios securities valued by such pricing service; (4) when market quotations are not readily available, including circumstances under which the Adviser or Sub-Adviser determines that the closing price, last sale price or the mean between the last reported bid and asked prices are not reflective of a security's market value, portfolio securities are valued at their fair value as determined in good faith under procedures established by and under the general supervision of the Directors. Occasionally, developments affecting the closing prices of securities and other assets may occur between the times at which valuations of such securities are determined (that is, close of the foreign market on which the securities trade) and the close of business of the New York Stock Exchange ("NYSE"). If developments occur during such periods that are expected to materially affect the value of such securities, such valuations may be adjusted to reflect the estimated fair value of such securities as of the close of the NYSE, as determined in good faith by the Directors or by the Adviser using a pricing service and/or procedures approved by the Directors; (5) quotations of foreign portfolio securities, other assets and liabilities and forward contracts stated in foreign currency are translated into U.S. dollar equivalents at the prevailing market rates prior to the close of the NYSE; (6) investments in mutual funds, including the Morgan Stanley Institutional Liquidity Funds, are valued at the net asset value ("NAV") as of the close of each business day; and (7) short-term debt securities with remaining maturities of 60 days or less at the time of purchase may be valued at amortized cost, unless the Adviser determines such valuation does not reflect the securities' market value, in which case these securities will be valued at their fair market value determined by the Adviser.
The Directors have responsibility for determining in good faith the fair value of the investments, and the Directors may appoint others, such as the Fund's Adviser or a valuation committee, to assist the Directors in determining fair value and to make the actual calculations pursuant to the fair valuation methodologies previously approved by the Directors. Under procedures approved by the Directors, the Fund's Adviser has formed a Valuation Committee whose members are approved by the Directors. The Valuation Committee provides administration and oversight of the Fund's valuation policies
17
Morgan Stanley Institutional Fund, Inc.
Annual Report — December 31, 2015
Notes to Financial Statements (cont'd)
and procedures, which are reviewed at least annually by the Directors. These procedures allow the Fund to utilize independent pricing services, quotations from securities and financial instrument dealers, and other market sources to determine fair value.
The Fund has procedures to determine the fair value of securities and other financial instruments for which market prices are not readily available. Under these procedures, the Valuation Committee convenes on a regular and ad hoc basis to review such securities and considers a number of factors, including valuation methodologies and significant unobservable valuation inputs, when arriving at fair value. The Valuation Committee may employ a market-based approach which may use related or comparable assets or liabilities, recent transactions, market multiples, book values, and other relevant information for the investment to determine the fair value of the investment. An income-based valuation approach may also be used in which the anticipated future cash flows of the investment are discounted to calculate fair value. Discounts may also be applied due to the nature or duration of any restrictions on the disposition of the investments. Due to the inherent uncertainty of valuations of such investments, the fair values may differ significantly from the values that would have been used had an active market existed. The Valuation Committee employs various methods for calibrating these valuation approaches including a regular review of valuation methodologies, key inputs and assumptions, transactional back-testing or disposition analysis, and reviews of any related market activity.
2. Fair Value Measurement: Financial Accounting Standards Board ("FASB") Accounting Standards CodificationTM ("ASC") 820, "Fair Value Measurement" ("ASC 820"), defines fair value as the value that the Fund would receive to sell an investment or pay to transfer a liability in a timely transaction with an independent buyer in the principal market, or in the absence of a principal market the most advantageous market for the investment or liability. ASC 820 establishes a three-tier hierarchy to distinguish between (1) inputs that reflect the assumptions market participants would use in valuing an asset or liability developed based on market data obtained from sources independent of the reporting entity (observable inputs) and (2) inputs that reflect the reporting entity's own assumptions about the assumptions market participants
would use in valuing an asset or liability developed based on the best information available in the circumstances (unobservable inputs) and to establish classification of fair value measurements for disclosure purposes. Various inputs are used in determining the value of the Fund's investments. The inputs are summarized in the three broad levels listed below.
• Level 1 – unadjusted quoted prices in active markets for identical investments
• Level 2 – other significant observable inputs (including quoted prices for similar investments, interest rates, prepayment speeds, credit risk, etc.)
• Level 3 – significant unobservable inputs including the Fund's own assumptions in determining the fair value of investments. Factors considered in making this determination may include, but are not limited to, information obtained by contacting the issuer, analysts, or the appropriate stock exchange (for exchange-traded securities), analysis of the issuer's financial statements or other available documents and, if necessary, available information concerning other securities in similar circumstances
The inputs or methodology used for valuing securities are not necessarily an indication of the risk associated with investing in those securities and the determination of the significance of a particular input to the fair value measurement in its entirety requires judgment and considers factors specific to each security.
The following is a summary of the inputs used to value the Portfolio's investments as of December 31, 2015.
Investment Type | Level 1 Unadjusted quoted prices (000) | Level 2 Other significant observable inputs (000) | Level 3 Significant unobservable inputs (000) | Total (000) | |||||||||||||||
Assets: | |||||||||||||||||||
Common Stocks | |||||||||||||||||||
Aerospace & Defense | $ | — | $ | 18 | $ | — | $ | 18 | |||||||||||
Automobiles | — | 24 | — | 24 | |||||||||||||||
Banks | 17 | 126 | — | 143 | |||||||||||||||
Chemicals | — | 22 | — | 22 | |||||||||||||||
| Commercial Services & Supplies | — | 7 | — | 7 | |||||||||||||||
| Construction & Engineering | 12 | 10 | — | 22 | |||||||||||||||
18
Morgan Stanley Institutional Fund, Inc.
Annual Report — December 31, 2015
Notes to Financial Statements (cont'd)
Investment Type | Level 1 Unadjusted quoted prices (000) | Level 2 Other significant observable inputs (000) | Level 3 Significant unobservable inputs (000) | Total (000) | |||||||||||||||
Common Stocks (cont'd) | |||||||||||||||||||
Distributors | $ | — | $ | 12 | $ | — | $ | 12 | |||||||||||
| Diversified Consumer Services | 8 | — | — | 8 | |||||||||||||||
| Diversified Financial Services | — | 47 | — | 47 | |||||||||||||||
| Diversified Telecommunication Services | — | 30 | — | 30 | |||||||||||||||
| Electronic Equipment, Instruments & Components | — | 42 | — | 42 | |||||||||||||||
Food Products | — | 32 | — | 32 | |||||||||||||||
| Health Care Providers & Services | — | 4 | — | 4 | |||||||||||||||
| Hotels, Restaurants & Leisure | — | 10 | — | 10 | |||||||||||||||
Household Durables | — | 26 | — | 26 | |||||||||||||||
| Independent Power Producers & Energy Traders | — | 5 | — | 5 | |||||||||||||||
Industrial Conglomerates | — | 70 | — | 70 | |||||||||||||||
Insurance | — | 41 | — | 41 | |||||||||||||||
Internet & Catalog Retail | 11 | — | — | 11 | |||||||||||||||
| Internet Software & Services | 18 | 106 | — | 124 | |||||||||||||||
Machinery | 10 | 3 | — | 13 | |||||||||||||||
Media | — | 4 | — | 4 | |||||||||||||||
Multi-Utilities | — | 11 | — | 11 | |||||||||||||||
Multi-line Retail | — | 10 | — | 10 | |||||||||||||||
Personal Products | — | 26 | — | 26 | |||||||||||||||
Pharmaceuticals | — | 9 | 42 | 51 | |||||||||||||||
| Real Estate Management & Development | — | 45 | — | 45 | |||||||||||||||
| Semiconductors & Semiconductor Equipment | 1 | 56 | — | 57 | |||||||||||||||
Specialty Retail | — | 17 | — | 17 | |||||||||||||||
| Tech Hardware, Storage & Peripherals | — | 122 | — | 122 | |||||||||||||||
| Textiles, Apparel & Luxury Goods | — | 63 | — | 63 | |||||||||||||||
| Trading Companies & Distributors | — | 4 | — | 4 | |||||||||||||||
| Transportation Infrastructure | — | 10 | — | 10 | |||||||||||||||
| Wireless Telecommunication Services | — | 54 | — | 54 | |||||||||||||||
Total Common Stocks | 77 | 1,066 | 42 | 1,185 | |||||||||||||||
Investment Company | 84 | — | — | 84 | |||||||||||||||
Participation Notes | — | 69 | — | 69 | |||||||||||||||
Short-Term Investment | |||||||||||||||||||
Investment Company | 9 | — | — | 9 | |||||||||||||||
Total Assets | $ | 170 | $ | 1,135 | $ | 42 | $ | 1,347 | |||||||||||
Transfers between investment levels may occur as the markets fluctuate and/or the availability of data used in an investment's valuation changes. The Portfolio recognizes transfers between the levels as of the end of the period. As of December 31, 2015, securities with a total value of approximately $42,000 transferred from Level 2 to Level 3. Securities that were valued using other significant observable inputs at December 31, 2014 were valued using significant unobservable inputs at December 31, 2015.
Following is a reconciliation of investments in which significant unobservable inputs (Level 3) were used in determining fair value.
| Common Stock (000) | |||||||
Beginning Balance | $ | — | |||||
Purchases | — | ||||||
Sales | — | ||||||
Amortization of discount | — | ||||||
Transfers in | 42 | ||||||
Transfers out | — | ||||||
Corporate actions | — | ||||||
Change in unrealized appreciation (depreciation) | — | ||||||
Realized gains (losses) | — | ||||||
Ending Balance | $ | 42 | |||||
| Net change in unrealized appreciation (depreciation) from investments still held as of December 31, 2015 | $ | — | |||||
19
Morgan Stanley Institutional Fund, Inc.
Annual Report — December 31, 2015
Notes to Financial Statements (cont'd)
The following table presents additional information about valuation techniques and inputs used for investments that are measured at fair value and categorized within Level 3 as of December 31, 2015. Various valuation techniques were used in the valuation of certain investments and weighted based on the level of significance.
| Fair Value at December 31, 2015 (000) | Valuation Technique | Unobservable Input | Range | Selected Value | Impact to Valuation from an Increase in Input | ||||||||||||||||||||||||||
Pharmaceuticals | |||||||||||||||||||||||||||||||
Common Stock | $ | 42 | Market Transaction Method | Precedent Transaction | $ | 0.23 | $ | 0.23 | $ | 0.23 | Increase | ||||||||||||||||||||
Discounted Cash Flow | Weighted Average Cost of Capital | 16.5 | % | 16.5 | % | 16.5 | % | Decrease | |||||||||||||||||||||||
Long-Term Growth Rate | 2.0 | % | 3.0 | % | 2.5 | % | Increase | ||||||||||||||||||||||||
| Market Comparable Companies | Enterprise Value/ EBITDA | 11.5 | x | 15.8 | x | 11.5 | x | Increase | |||||||||||||||||||||||
| Discount for Lack of Marketability/ Company Specific Risk | 30.0 | % | 30.0 | % | 30.0 | % | Decrease | ||||||||||||||||||||||||
3. Foreign Currency Translation and Foreign Investments: The books and records of the Portfolio are maintained in U.S. dollars. Foreign currency amounts are translated into U.S. dollars as follows:
– investments, other assets and liabilities at the prevailing rate of exchange on the valuation date;
– investment transactions and investment income at the prevailing rates of exchange on the dates of such transactions.
Although the net assets of the Portfolio are presented at the foreign exchange rates and market values at the close of the period, the Portfolio does not isolate that portion of the results of operations arising as a result of changes in the foreign exchange rates from the fluctuations arising from changes in the market prices of securities held at period end. Similarly, the Portfolio does not isolate the effect of changes in foreign exchange rates from the fluctuations arising from changes in the market prices of securities sold during the period. Accordingly, realized and unrealized foreign currency gains (losses) on investments in securities are included in the reported net realized and unrealized gains (losses) on investment transactions and balances. However, pursuant to U.S. Federal income tax regulations, gains and losses from certain foreign currency transactions and the foreign currency portion of gains and losses realized on sales and maturities of foreign denominated debt securities are treated as ordinary income for U.S. Federal income tax purposes.
Net realized gains (losses) on foreign currency transactions represent net foreign exchange gains (losses) from foreign currency forward exchange contracts, disposition of foreign currencies, currency gains (losses) realized between the trade and settlement dates on securities transactions, and the difference between the amount of investment income and foreign withholding taxes recorded on the Portfolio's books and the U.S. dollar equivalent amounts actually received or paid. Net unrealized currency gains (losses) from valuing foreign currency denominated assets and liabilities at period end exchange rates are reflected as a component of unrealized appreciation (depreciation) in the Statement of Assets and Liabilities. The change in unrealized currency gains (losses) on foreign currency translations for the period is reflected in the Statement of Operations.
Foreign security and currency transactions may involve certain considerations and risks not typically associated with those of U.S. dollar denominated transactions as a result of, among other factors, fluctuations of exchange rates in relation to the U.S. dollar, the possibility of lower levels of governmental supervision and regulation of foreign securities markets and the possibility of political or economic instability.
Governmental approval for foreign investments may be required in advance of making an investment under certain circumstances in some countries, and the extent of foreign investments in domestic companies may be subject to limitation in other countries. Foreign ownership
20
Morgan Stanley Institutional Fund, Inc.
Annual Report — December 31, 2015
Notes to Financial Statements (cont'd)
limitations also may be imposed by the charters of individual companies to prevent, among other concerns, violations of foreign investment limitations. As a result, an additional class of shares (identified as "Foreign" in the Portfolio of Investments) may be created and offered for investment. The "local" and "foreign shares" market values may differ. In the absence of trading of the foreign shares in such markets, the Portfolio values the foreign shares at the closing exchange price of the local shares.
4. Derivatives: The Portfolio may, but is not required to, use derivative instruments for a variety of purposes, including hedging, risk management, portfolio management or to earn income. Derivatives are financial instruments whose value is based, in part, on the value of an underlying asset, interest rate, index or financial instrument. Prevailing interest rates and volatility levels, among other things, also affect the value of derivative instruments. A derivative instrument often has risks similar to its underlying asset and may have additional risks, including imperfect correlation between the value of the derivative and the underlying asset, risks of default by the counterparty to certain transactions, magnification of losses incurred due to changes in the market value of the securities, instruments, indices or interest rates to which the derivative instrument relates, risks that the transactions may not be liquid and risks arising from margin requirements. The use of derivatives involves risks that are different from, and possibly greater than, the risks associated with other portfolio investments. Derivatives may involve the use of highly specialized instruments that require investment techniques and risk analyses different from those associated with other portfolio investments. All of the Portfolio's holdings, including derivative instruments, are marked-to-market each day with the change in value reflected in unrealized appreciation (depreciation). Upon disposition, a realized gain or loss is recognized.
Certain derivative transactions may give rise to a form of leverage. Leverage magnifies the potential for gain and the risk of loss. Leverage associated with derivative transactions may cause the Portfolio to liquidate portfolio positions when it may not be advantageous to do so to satisfy its obligations or to meet earmarking or segregation requirements, pursuant to applicable Securities and Exchange Commission rules and regulations, or may cause the Portfolio to be more volatile than if the Portfolio had not been leveraged. Although the Adviser
and/or Sub-Adviser seek to use derivatives to further the Portfolio's investment objectives, there is no assurance that the use of derivatives will achieve this result.
Following is a description of the derivative instruments and techniques that the Portfolio used during the period and their associated risks:
Foreign Currency Forward Exchange Contracts: In connection with its investments in foreign securities, the Portfolio also entered into contracts with banks, brokers or dealers to purchase or sell securities or foreign currencies at a future date. A foreign currency forward exchange contract ("currency contract") is a negotiated agreement between the contracting parties to exchange a specified amount of currency at a specified future time at a specified rate. The rate can be higher or lower than the spot rate between the currencies that are the subject of the contract. Currency contracts may be used to protect against uncertainty in the level of future foreign currency exchange rates or to gain or modify exposure to a particular currency. To the extent hedged by the use of currency contracts, the precise matching of the currency contract amounts and the value of the securities involved will not generally be possible because the future value of such securities in foreign currencies will change as a consequence of market movements in the value of those securities between the date on which the contract is entered into and the date it matures. Furthermore, such transactions may reduce or preclude the opportunity for gain if the value of the currency should move in the direction opposite to the position taken. There is additional risk to the extent that currency contracts create exposure to currencies in which the Portfolio's securities are not denominated. Unanticipated changes in currency prices may result in poorer overall performance for the Portfolio than if it had not entered into such contracts. The use of currency contracts involves the risk of loss from the insolvency or bankruptcy of the counterparty to the contract or the failure of the counterparty to make payments or otherwise comply with the terms of the contract. A currency contract is marked-to-market daily and the change in market value is recorded by the Portfolio as unrealized gain or loss. The Portfolio records realized gains (losses) when the currency contract is closed equal to the difference between the value of the currency contract at the time it was opened and the value at the time it was closed.
21
Morgan Stanley Institutional Fund, Inc.
Annual Report — December 31, 2015
Notes to Financial Statements (cont'd)
As of December 31, 2015, the Portfolio did not have any open foreign currency forward exchange contracts.
FASB ASC 815, "Derivatives and Hedging" ("ASC 815"), is intended to improve financial reporting about derivative instruments by requiring enhanced disclosures to enable investors to better understand how and why the Portfolio uses derivative instruments, how these derivative instruments are accounted for and their effects on the Portfolio's financial position and results of operations.
The following tables set forth by primary risk exposure the Portfolio's realized gains (losses) by type of derivative contract for the year ended December 31, 2015 in accordance with ASC 815.
Realized Gain (Loss) | |||||||||||
Primary Risk Exposure | Derivative Type | Value (000) | |||||||||
Currency Risk | Foreign Currency Forward Exchange Contracts | $ | (6 | ) | |||||||
For the year ended December 31, 2015, the approximate average monthly amount outstanding for each derivative type is as follows:
Foreign Currency Forward Exchange Contracts: | |||||||
Average monthly principal amount | $ | 42,000 | |||||
5. Structured Investments: The Portfolio invested a portion of its assets in structured investments. A structured investment is a derivative security designed to offer a return linked to a particular underlying security, currency, commodity or market. Structured investments may come in various forms including notes (such as exchange-traded notes), warrants and options to purchase securities. The Portfolio will typically use structured investments to gain exposure to a permitted underlying security, currency, commodity or market when direct access to a market is limited or inefficient from a tax or cost standpoint. There can be no assurance that structured investments will trade at the same price or have the same value as the underlying security, currency, commodity or market. Investments in structured investments involve risks including issuer risk, counterparty risk and market risk. Holders of structured investments bear risks of the underlying investment and are subject to issuer or counterparty risk because the Portfolio is relying on the creditworthiness of such issuer or counterparty and has no rights with respect to the underlying investment. Certain structured investments may be thinly traded or have a limited trading market and may have the effect of increasing the Portfolio's illiquidity to
the extent that the Portfolio, at a particular time, may be unable to find qualified buyers for these securities.
6. Redemption Fees: The Portfolio will assess a 2% redemption fee on Class I shares, Class A shares, Class L shares and Class C shares, which is paid directly to the Portfolio, for shares redeemed or exchanged within thirty days of purchase, subject to certain exceptions. The redemption fee is designed to protect the Portfolio and its remaining shareholders from the effects of short-term trading. These fees, if any, are included in the Statements of Changes in Net Assets.
7. Indemnifications: The Fund enters into contracts that contain a variety of indemnifications. The Fund's maximum exposure under these arrangements is unknown. However, the Fund has not had prior claims or losses pursuant to these contracts and expects the risk of loss to be remote.
8. Dividends and Distributions to Shareholders: Dividend income and distributions to shareholders are recorded on the ex-dividend date. Dividends from net investment income, if any, are declared and paid annually. Net realized capital gains, if any, are distributed at least annually.
9. Security Transactions, Income and Expenses: Security transactions are accounted for on the trade date (date the order to buy or sell is executed). Realized gains and losses on the sale of investment securities are determined on the specific identified cost method. Dividend income and other distributions are recorded on the ex-dividend date (except for certain foreign dividends which may be recorded as soon as the Portfolio is informed of such dividends) net of applicable withholding taxes. Interest income is recognized on the accrual basis except where collection is in doubt. Discounts are accreted and premiums are amortized over the life of the respective securities. Most expenses of the Fund can be directly attributed to a particular Portfolio. Expenses which cannot be directly attributed are apportioned among the Portfolios based upon relative net assets or other appropriate methods. Income, expenses (other than class specific expenses — distribution and shareholder services, transfer agency and sub transfer agency fees) and realized and unrealized gains or losses are allocated to each class of shares based upon their relative net assets.
22
Morgan Stanley Institutional Fund, Inc.
Annual Report — December 31, 2015
Notes to Financial Statements (cont'd)
B. Advisory/Sub-Advisory Fees: The Adviser, a wholly-owned subsidiary of Morgan Stanley, provides the Portfolio with advisory services under the terms of an Investment Advisory Agreement, paid quarterly, at the annual rate based on the daily net assets as follows:
| First $1 billion | Over $1 billion | ||||||
| 0.95 | % | 0.90 | % | ||||
For the year ended December 31, 2015, the advisory fee rate (net of waivers/rebate) was equivalent to an annual effective rate of 0.00% of the Portfolio's average daily net assets.
The Adviser has agreed to reduce its advisory fee and/or reimburse the Portfolio so that total annual portfolio operating expenses, excluding certain investment related expenses, taxes, interest and other extraordinary expenses (including litigation), will not exceed 1.45% for Class I shares, 1.80% for Class A shares, 2.30% for Class L shares and 2.55% for Class C shares. The fee waivers and/or expense reimbursements will continue for at least one year from the date of the Portfolio's prospectus or until such time as the Directors act to discontinue all or a portion of such waivers and/or reimbursements when they deem such action is appropriate. For the year ended December 31, 2015, approximately $70,000 of advisory fees were waived and approximately $231,000 of other expenses were reimbursed by the Adviser pursuant to this arrangement.
The Adviser has entered into a Sub-Advisory Agreement with the Sub-Adviser, a wholly-owned subsidiary of Morgan Stanley. The Sub-Adviser provides the Portfolio with advisory services subject to the overall supervision of the Adviser and the Fund's Officers and Trustees. The Adviser pays the Sub-Adviser on a monthly basis a portion of the net advisory fees the Adviser receives from the Portfolio.
C. Administration Fees: The Adviser also serves as Administrator to the Fund and provides administrative services pursuant to an Administration Agreement for an annual fee, accrued daily and paid monthly, of 0.08% of the Portfolio's average daily net assets.
Under a Sub-Administration Agreement between the Administrator and State Street Bank and Trust Company ("State Street"), State Street provides certain administrative services to the Fund. For such services, the Administrator pays State Street a portion of the fee the Administrator receives from the Portfolio.
D. Distribution and Shareholder Services Fees: Morgan Stanley Distribution, Inc. ("MSDI" or the "Distributor"),
a wholly-owned subsidiary of the Adviser and Sub-Adviser and an indirect subsidiary of Morgan Stanley, serves as the Fund's Distributor of Portfolio shares pursuant to a Distribution Agreement. The Fund has adopted a Shareholder Services Plan with respect to Class A shares pursuant to Rule 12b-1 under the Act. Under the Shareholder Services Plan, the Portfolio pays the Distributor a shareholder services fee, accrued daily and paid monthly, at an annual rate of 0.25% of the Portfolio's average daily net assets attributable to Class A shares.
The Fund has adopted a Distribution and Shareholder Services Plan with respect to Class L shares pursuant to Rule 12b-1 under the Act. Under the Distribution and Shareholder Services Plan, the Portfolio pays the Distributor a distribution fee, accrued daily and paid monthly, at an annual rate of 0.50% and a shareholder services fee, accrued daily and paid monthly, at an annual rate of 0.25% of the Portfolio's average daily net assets attributable to Class L shares.
The Fund has adopted a Distribution and Shareholder Services Plan with respect to Class C shares pursuant to Rule 12b-1 under the Act. Under the Distribution and Shareholder Services Plan, the Portfolio pays the Distributor a distribution fee, accrued daily and paid monthly, at an annual rate of 0.75% and a shareholder services fee, accrued daily and paid monthly, at an annual rate of 0.25% of the Portfolio's average daily net assets attributable to Class C shares.
The distribution and shareholder services fees are used to support the expenses associated with servicing and maintaining accounts. The Distributor may compensate other parties for providing shareholder support services to investors who purchase Class A, Class L and Class C shares.
E. Dividend Disbursing and Transfer Agent: The Fund's dividend disbursing and transfer agent is Boston Financial Data Services, Inc. ("BFDS"). Pursuant to a Transfer Agency Agreement, the Fund pays BFDS a fee based on the number of classes, accounts and transactions relating to the Portfolios of the Fund.
F. Custodian Fees: State Street (the "Custodian") serves as Custodian for the Fund in accordance with a Custodian Agreement. The Custodian holds cash, securities, and other assets of the Fund as required by the Act. Custody fees are payable monthly based on assets held in custody, investment purchases and sales activity and account maintenance fees, plus reimbursement for certain out-of-pocket expenses.
23
Morgan Stanley Institutional Fund, Inc.
Annual Report — December 31, 2015
Notes to Financial Statements (cont'd)
G. Security Transactions and Transactions with Affiliates: For the year ended December 31, 2015, purchases and sales of investment securities for the Portfolio, other than long-term U.S. Government securities and short-term investments, were approximately $8,135,000 and $16,967,000, respectively. There were no purchases and sales of long-term U.S. Government securities for the year ended December 31, 2015.
The Portfolio invests in the Institutional Class of the Morgan Stanley Institutional Liquidity Funds — Money Market Portfolio (the "Liquidity Funds"), an open-end management investment company managed by the Adviser. Advisory fees paid by the Portfolio are reduced by an amount equal to its pro-rata share of the advisory and administration fees paid by the Portfolio due to its investment in the Liquidity Funds. For the year ended December 31, 2015, advisory fees paid were reduced by less than $500 relating to the Portfolio's investment in the Liquidity Funds.
A summary of the Portfolio's transactions in shares of the Liquidity Funds during the year ended December 31, 2015 is as follows:
| Value December 31, 2014 (000) | Purchases at Cost (000) | Sales (000) | Dividend Income (000) | Value December 31, 2015 (000) | |||||||||||||||
| $ | 419 | $ | 11,080 | $ | 11,490 | $ | — | @ | $ | 9 | |||||||||
@ Amount is less than $500.
During the year ended December 31, 2015, the Portfolio incurred approximately $1,000 in brokerage commissions with Morgan Stanley & Co., LLC, an affiliate of the Adviser/Administrator, Sub-Adviser and Distributor, for portfolio transactions executed on behalf of the Portfolio.
The Portfolio has an unfunded Deferred Compensation Plan (the "Compensation Plan"), which allows each independent Director to defer payment of all, or a portion, of the fees he or she receives for serving on the Board of Directors. Each eligible Director generally may elect to have the deferred amounts credited with a return equal to the total return on one or more of the Morgan Stanley funds that are offered as investment options under the Compensation Plan. Appreciation/depreciation and distributions received from these investments are recorded with an offsetting increase/decrease in the deferred compensation obligation and do not affect the NAV of the Portfolio.
H. Federal Income Taxes: It is the Portfolio's intention to continue to qualify as a regulated investment company and distribute all of its taxable and tax-exempt income. Accordingly,
no provision for Federal income taxes is required in the financial statements.
The Portfolio may be subject to taxes imposed by countries in which it invests. Such taxes are generally based on income and/or capital gains earned or repatriated. Taxes are accrued based on net investment income, net realized gains and net unrealized appreciation as such income and/or gains are earned. Taxes may also be based on transactions in foreign currency and are accrued based on the value of investments denominated in such currency.
FASB ASC 740-10, "Income Taxes — Overall", sets forth a minimum threshold for financial statement recognition of the benefit of a tax position taken or expected to be taken in a tax return. Management has concluded there are no significant uncertain tax positions that would require recognition in the financial statements. If applicable, the Portfolio recognizes interest accrued related to unrecognized tax benefits in "Interest Expense" and penalties in "Other Expenses" in the Statement of Operations. The Portfolio files tax returns with the U.S. Internal Revenue Service, New York and various states. Generally, each of the tax years in the four-year period ended December 31, 2015, remains subject to examination by taxing authorities.
The tax character of distributions paid may differ from the character of distributions shown in the Statements of Changes in Net Assets due to short-term capital gains being treated as ordinary income for tax purposes. The tax character of distributions paid during fiscal 2015 and 2014 was as follows:
| 2015 Distributions Paid From: | 2014 Distributions Paid From: | ||||||||||||||
| Ordinary Income (000) | Long-Term Capital Gain (000) | Ordinary Income (000) | Long-Term Capital Gain (000) | ||||||||||||
| $ | 4 | $ | 521 | $ | 656 | $ | 360 | ||||||||
The amount and character of income and gains to be distributed are determined in accordance with income tax regulations which may differ from GAAP. These book/tax differences are either considered temporary or permanent in nature.
Temporary differences are primarily due to differing book and tax treatments in the timing of the recognition of gains (losses) on certain investment transactions and the timing of the deductibility of certain expenses.
Permanent differences, primarily due to differing treatments of gains (losses) related to foreign currency transactions and basis adjustments on certain equity securities designated as passive
24
Morgan Stanley Institutional Fund, Inc.
Annual Report — December 31, 2015
Notes to Financial Statements (cont'd)
foreign investment companies, resulted in the following reclassifications among the components of net assets at December 31, 2015:
| Distributions in Excess of Net Investment Income (000) | Distributions in Excess of Net Realized Gain (000) | Paid-in- Capital (000) | |||||||||
| $ | (34 | ) | $ | 40 | $ | (6 | ) | ||||
At December 31, 2015, the Portfolio had no distributable earnings on a tax basis.
Capital losses and specified ordinary losses, including currency losses, incurred after October 31 but within the taxable year are deemed to arise on the first day of the Portfolio's next taxable year. For the year ended December 31, 2015, the Portfolio deferred to January 1, 2016 for U.S. Federal income tax purposes the following losses:
| Post-October Currency and Specified Ordinary Losses (000) | Post-October Capital Losses (000) | ||||||
| $ | — | $ | 96 | ||||
I. Other: At December 31, 2015, the Portfolio had record owners of 10% or greater. Investment activities of these shareholders could have a material impact on the Portfolio. The aggregate percentage of such owners was 58.8%.
25
Morgan Stanley Institutional Fund, Inc.
Annual Report — December 31, 2015
Report of Independent Registered Public Accounting Firm
To the Shareholders and Board of Directors of
Morgan Stanley Institutional Fund, Inc. —
Asian Equity Portfolio
We have audited the accompanying statement of assets and liabilities, including the portfolio of investments, of Asian Equity Portfolio (one of the portfolios constituting Morgan Stanley Institutional Fund, Inc.) (the "Portfolio") as of December 31, 2015, and the related statement of operations for the year then ended, the statements of changes in net assets for each of the two years in the period then ended and the financial highlights for each of the years or periods indicated therein. These financial statements and financial highlights are the responsibility of the Portfolio's management. Our responsibility is to express an opinion on these financial statements and financial highlights based on our audits.
We conducted our audits in accordance with the standards of the Public Company Accounting Oversight Board (United States). Those standards require that we plan and perform the audit to obtain reasonable assurance about whether the financial statements and financial highlights are free of material misstatement. We were not engaged to perform an audit of the Portfolio's internal control over financial reporting. Our audits included consideration of internal control over financial reporting as a basis for designing audit procedures that are appropriate in the circumstances, but not for the purpose of expressing an opinion on the effectiveness of the Portfolio's internal control over financial reporting. Accordingly, we express no such opinion. An audit also includes examining, on a test basis, evidence supporting the amounts and disclosures in the financial statements and financial highlights, assessing the accounting principles used and significant estimates made by management, and evaluating the overall financial statement presentation. Our procedures included confirmation of securities owned as of December 31, 2015, by correspondence with the custodian and others or by other appropriate auditing procedures where replies from others were not received or by other appropriate auditing procedures where replies from others were not received. We believe that our audits provide a reasonable basis for our opinion.
In our opinion, the financial statements and financial highlights referred to above present fairly, in all material respects, the financial position of Asian Equity Portfolio (one of the portfolios constituting Morgan Stanley Institutional Fund, Inc.) at December 31, 2015, the results of its operations for the year then ended, the changes in its net assets for each of the two years in the period then ended and the financial highlights for each of the years or periods indicated therein, in conformity with U.S. generally accepted accounting principles.

Boston, Massachusetts
February 26, 2016
26
Morgan Stanley Institutional Fund, Inc.
Annual Report — December 31, 2015
Federal Tax Notice (unaudited)
For Federal income tax purposes, the following information is furnished with respect to the distributions paid by the Portfolio during its taxable year ended December 31, 2015.
The Portfolio designated and paid approximately $521,000 as a long-term capital gain distribution.
For Federal income tax purposes, the following information is furnished with respect to the Portfolio's earnings for its taxable year ended December 31, 2015. When distributed, certain earnings may be subject to a maximum tax rate of 15% as provided for the Jobs and Growth Tax Relief Reconciliation Act of 2003. The Portfolio designated up to a maximum of approximately $24,000 as taxable at this lower rate.
The Portfolio intends to pass through foreign tax credits of approximately $20,000 and has derived net income from sources within foreign countries amounting to approximately $176,000.
In January, the Portfolio provides tax information to shareholders for the preceding calendar year.
27
Morgan Stanley Institutional Fund, Inc.
Annual Report — December 31, 2015
U.S. Privacy Policy (unaudited)
AN IMPORTANT NOTICE CONCERNING OUR U.S. PRIVACY POLICY
This privacy notice describes the U.S. privacy policy of Morgan Stanley Distribution, Inc., and the Morgan Stanley family of mutual funds ("us", "our", "we").
We are required by federal law to provide you with notice of our U.S. privacy policy ("Policy"). This Policy applies to both our current and former clients unless we state otherwise and is intended for individual clients who purchase products or receive services from us for personal, family or household purposes. This Policy is not applicable to partnerships, corporations, trusts or other non-individual clients or account holders, nor is this Policy applicable to individuals who are either beneficiaries of a trust for which we serve as trustee or participants in an employee benefit plan administered or advised by us. This Policy is, however, applicable to individuals who select us to be a custodian of securities or assets in individual retirement accounts, 401(k) accounts, or accounts subject to the Uniform Gifts to Minors Act.
This notice sets out our business practices to protect your privacy; how we collect and share personal information about you; and how you can limit our sharing or certain uses by others of this information. We may amend this Policy at any time, and will inform you of any changes to our Policy as required by law.
WE RESPECT YOUR PRIVACY
We appreciate that you have provided us with your personal financial information and understand your concerns about your information. We strive to safeguard the information our clients entrust to us. Protecting the confidentiality and security of client information is an important part of how we conduct our business.
This notice describes what personal information we collect about you, how we collect it, when we may share it with others, and how certain others may use it. It discusses the steps you may take to limit our sharing of certain information about you with our affiliated companies, including, but not limited to our affiliated banking businesses, brokerage firms and credit service affiliates. It also discloses how you may limit our affiliates' use of shared information for marketing purposes.
Throughout this Policy, we refer to the nonpublic information that personally identifies you as "personal information." We also use the term "affiliated company" in this notice. An affiliated company is a company in our family of companies and includes companies with the Morgan Stanley name. These affiliated companies are financial institutions such as broker-dealers, banks, investment advisers and credit card issuers. We refer to any company that is not an affiliated company as a nonaffiliated third party. For purposes of Section 5 of this notice, and your ability to limit certain uses of personal information by our affiliates, this notice applies to the use of personal information by our affiliated companies.
1. WHAT PERSONAL INFORMATION DO WE COLLECT FROM YOU?
We may collect the following types of information about you: (i) information provided by you, including information from applications and other forms we receive from you, (ii) information about your transactions with us or our affiliates, (iii) information about your transactions with nonaffiliated third parties, (iv) information from consumer reporting agencies, (v) information obtained from our websites, and (vi) information obtained from other sources. For example:
• We collect information such as your name, address, e-mail address, telephone/fax numbers, assets, income and investment objectives through applications and other forms you submit to us.
• We may obtain information about account balances, your use of account(s) and the types of products and services you prefer to receive from us through your dealings and transactions with us and other sources.
• We may obtain information about your creditworthiness and credit history from consumer reporting agencies.
• We may collect background information from and through third-party vendors to verify representations you have made and to comply with various regulatory requirements.
2. WHEN DO WE DISCLOSE PERSONAL INFORMATION WE COLLECT ABOUT YOU?
We may disclose personal information we collect about you in each of the categories listed above to affiliated and nonaffiliated third parties.
28
Morgan Stanley Institutional Fund, Inc.
Annual Report — December 31, 2015
U.S. Privacy Policy (unaudited) (cont'd)
a. Information We Disclose to Affiliated Companies.
We may disclose personal information that we collect about you to our affiliated companies to manage your account(s) effectively, to service and process your transactions, and to let you know about products and services offered by us and affiliated companies, to manage our business, and as otherwise required or permitted by law. Offers for products and services from affiliated companies are developed under conditions designed to safeguard your personal information.
b. Information We Disclose to Third Parties.
We may disclose personal information that we collect about you to nonaffiliated third parties to provide marketing services on our behalf or to other financial institutions with whom we have joint marketing agreements. We may also disclose all of the information we collect to other nonaffiliated third parties for our everyday business purposes, such as to process transactions, maintain account(s), respond to court orders and legal investigations, report to credit bureaus, offer our own products and services, protect against fraud, for institutional risk control, to perform services on our behalf, and as otherwise required or permitted by law.
When we share personal information about you with a nonaffiliated third party, they are required to limit their use of personal information about you to the particular purpose for which it was shared and they are not allowed to share personal information about you with others except to fulfill that limited purpose or as may be permitted or required by law.
3. HOW DO WE PROTECT THE SECURITY AND CONFIDENTIALITY OF PERSONAL INFORMATION WE COLLECT ABOUT YOU?
We maintain physical, electronic and procedural security measures that comply with applicable law and regulations to help safeguard the personal information we collect about you. We have internal policies governing the proper handling of client information by employees. Third parties that provide support or marketing services on our behalf may also receive personal information about you, and we require them to adhere to appropriate security standards with respect to such information.
4. HOW CAN YOU LIMIT OUR SHARING CERTAIN PERSONAL INFORMATION ABOUT YOU WITH OUR AFFILIATED COMPANIES FOR ELIGIBILITY DETERMINATION?
By following the opt-out procedures in Section 6 below, you may limit the extent to which we share with our affiliated companies, personal information that was collected to determine your eligibility for products and services such as your credit reports and other information that you have provided to us or that we may obtain from third parties ("eligibility information"). Eligibility information does not include your identification information or personal information pertaining to our transactions or experiences with you. Please note that, even if you direct us not to share eligibility information with our affiliated companies, we may still share your personal information, including eligibility information, with our affiliated companies under circumstances that are permitted under applicable law, such as to process transactions or to service your account.
5. HOW CAN YOU LIMIT THE USE OF CERTAIN PERSONAL INFORMATION ABOUT YOU BY OUR AFFILIATED COMPANIES FOR MARKETING?
By following the opt-out instructions in Section 6 below, you may limit our affiliated companies from marketing their products or services to you based on personal information we disclose to them. This information may include, for example, your income and account history with us. Please note that, even if you choose to limit our affiliated companies from using personal information about you that we may share with them for marketing their products and services to you, our affiliated companies may use your personal information that they obtain from us to market to you in circumstances permitted by law, such as if the affiliated party has its own relationship with you.
29
Morgan Stanley Institutional Fund, Inc.
Annual Report — December 31, 2015
U.S. Privacy Policy (unaudited) (cont'd)
6. HOW CAN YOU SEND US AN OPT-OUT INSTRUCTION?
If you wish to limit our sharing of eligibility information about you with our affiliated companies, or our affiliated companies' use of personal information for marketing purposes, as described in this notice, you may do so by:
• Calling us at (800) 548-7786
Monday–Friday between 8a.m. and 6p.m. (EST)
• Writing to us at the following address:
Boston Financial Data Services, Inc.
c/o Privacy Coordinator
P.O. Box 219804
Kansas City, Missouri 64121
If you choose to write to us, your request should include: your name, address, telephone number and account number(s) to which the opt-out applies and whether you are opting out with respect to sharing of eligibility information (Section 4 above), or information used for marketing (Section 5 above), or both. Written opt-out requests should not be sent with any other correspondence. In order to process your request, we require that the request be provided by you directly and not through a third party. Once you have informed us about your privacy preferences, your opt-out preference will remain in effect with respect to this Policy (as it may be amended) until you notify us otherwise. If you are a joint account owner, we will accept instructions from any one of you and apply those instructions to the entire account.
Please understand that if you limit our sharing or our affiliated companies' use of personal information, you and any joint account holder(s) may not receive information about our affiliated companies' products and services, including products or services that could help you manage your financial resources and achieve your investment objectives.
If you have more than one account or relationship with us, please specify the accounts to which you would like us to apply your privacy choices. If you have accounts or relationships with our affiliates, you may receive multiple privacy policies from them, and will need to separately notify those companies of your privacy choices for those accounts or relationships.
7. WHAT IF AN AFFILIATED COMPANY BECOMES A NONAFFILIATED THIRD PARTY?
If, at any time in the future, an affiliated company becomes a nonaffiliated third party, further disclosures of personal information made to the former affiliated company will be limited to those described in Section 2(b) above relating to nonaffiliated third parties. If you elected under Section 6 to limit disclosures we make to affiliated companies, or use of personal information by affiliated companies, your election will not apply to use by any former affiliated company of your personal information in their possession once it becomes a nonaffiliated third party.
SPECIAL NOTICE TO RESIDENTS OF VERMONT
The following section supplements our Policy with respect to our individual clients who have a Vermont address and supersedes anything to the contrary in the above Policy with respect to those clients only.
The State of Vermont requires financial institutions to obtain your consent prior to sharing personal information that they collect about you with nonaffiliated third parties, or eligibility information with affiliated companies, other than in certain limited circumstances. Except as permitted by law, we will not share personal information we collect about you with nonaffiliated third parties or eligibility information with affiliated companies, unless you provide us with your written consent to share such information.
SPECIAL NOTICE TO RESIDENTS OF CALIFORNIA
The following section supplements our Policy with respect to our individual clients who have a California address and supersedes anything to the contrary in the above Policy with respect to those clients only.
In response to a California law, if your account has a California home address, your personal information will not be disclosed to nonaffiliated third parties except as permitted by applicable California law, and we will limit sharing such personal information with our affiliates to comply with California privacy laws that apply to us.
30
Morgan Stanley Institutional Fund, Inc.
Annual Report — December 31, 2015
Director and Officer Information (unaudited)
Independent Directors:
| Name, Age and Address of Independent Director | Positions(s) Held with Registrant | Length of Time Served | Principal Occupation(s) During Past 5 Years and Other Relevant Professional Experience | Number of Portfolios in Fund Complex Overseen by Director** | Other Directorships Held by Independent Director*** | ||||||||||||||||||
| Frank L. Bowman (71) c/o Kramer Levin Naftalis & Frankel LLP Counsel to the Independent Directors 1177 Avenue of the Americas New York, NY 10036 | Director | Since August 2006 | President, Strategic Decisions, LLC (consulting) (since February 2009); Director or Trustee of various Morgan Stanley Funds (since August 2006); Chairperson of the Compliance and Insurance Committee (since October 2015); Formerly, Chairperson of the Insurance Sub-Committee of the Compliance and Insurance Committee (February 2007-December 2015); served as President and Chief Executive Officer of the Nuclear Energy Institute (policy organization) (February 2005-November 2008); retired as Admiral, U.S. Navy after serving over 38 years on active duty including 8 years as Director of the Naval Nuclear Propulsion Program in the Department of the Navy and the U.S. Department of Energy (1996-2004); served as Chief of Naval Personnel (July 1994-September 1996); and on the Joint Staff as Director of Political Military Affairs (June 1992-July1994); knighted as Honorary Knight Commander of the Most Excellent Order of the British Empire; awarded the Officier de l'Orde National du Mérite by the French Government; elected to the National Academy of Engineering (2009). | 98 | Director of BP p.l.c.; Director of Naval and Nuclear Technologies LLP; Director Emeritus of the Armed Services YMCA; Director of the U.S. Naval Submarine League; Member of the National Security Advisory Council of the Center for U.S. Global Engagement and a member of the CNA Military Advisory Board; Chairman of the Charity, J Street Cup Golf, Trustee of Fairhaven United Methodist Church; and Director of other various non-profit organizations. | ||||||||||||||||||
| Kathleen A. Dennis (62) c/o Kramer Levin Naftalis & Frankel LLP Counsel to the Independent Directors 1177 Avenue of the Americas New York, NY 10036 | Director | Since August 2006 | President, Cedarwood Associates (mutual fund and investment management consulting) (since July 2006); Chairperson of the Money Market and Alternatives Sub-Committee of the Investment Committee (since October 2006) and Director or Trustee of various Morgan Stanley Funds (since August 2006); formerly, Senior Managing Director of Victory Capital Management (1993-2006). | 98 | Director of various nonprofit organizations. | ||||||||||||||||||
| Nancy C. Everett (61) c/o Kramer Levin Naftalis & Frankel LLP Counsel to the Independent Trustees 1177 Avenue of the Americas New York, NY 10036 | Trustee | Since January 2015 | Chief Executive Officer, Virginia Commonwealth University Investment Company (since November 2015); Owner OBIR, LLC (institutional investment management consulting) (since June 2014); formerly, Managing Director, BlackRock, Inc. (February 2011-December 2013); and Chief Executive Officer, General Motors Asset Management (a/k/a Promark Global Advisors, Inc.) (June 2005-May 2010). | 98 | Member of Virginia Commonwealth University School of Business Foundation; formerly, Member of Virginia Commonwealth University Board of Visitors (2013-2015); Member of Committee on Directors for Emerging Markets Growth Fund, Inc. (2007-2010); Chairperson of Performance Equity Management, LLC (2006-2010); and Chairperson, GMAM Absolute Return Strategies Fund, LLC (2006-2010). | ||||||||||||||||||
31
Morgan Stanley Institutional Fund, Inc.
Annual Report — December 31, 2015
Director and Officer Information (unaudited) (cont'd)
Independent Directors: (cont'd)
| Name, Age and Address of Independent Director | Positions(s) Held with Registrant | Length of Time Served | Principal Occupation(s) During Past 5 Years and Other Relevant Professional Experience | Number of Portfolios in Fund Complex Overseen by Director** | Other Directorships Held by Independent Director*** | ||||||||||||||||||
| Jakki L. Haussler (58) c/o Kramer Levin Naftalis & Frankel LLP Counsel to the Independent Directors 1177 Avenue of the Americas New York, NY 10036 | Director | Since January 2015 | Chairman and Chief Executive Officer, Opus Capital Group (since January 1996); and formerly, Director, Capvest Venture Fund, LP (May 2000-December 2011); Partner, Adena Ventures, LP (July 1999-December 2010); Director, The Victory Funds (February 2005-July 2008). | 98 | Director of Cincinnati Bell Inc. and Member, Audit Committee and Compensation Committee; Director of Northern Kentucky University Foundation and Member, Investment Committee; Member of Chase College of Law Transactional Law Practice Center Board of Advisors; Director of Best Transport; Chase College of Law Board of Visitors; formerly, Member, University of Cincinnati Foundation Investment Committee; Member, Miami University Board of Visitors (2008-2011); Trustee of Victory Funds (2005-2008) and Chairman, Investment Committee (2007-2008) and Member, Service Provider Committee (2005-2008). | ||||||||||||||||||
| Dr. Manuel H. Johnson (67) c/o Johnson Smick International, Inc. 220 I Street, N.E. — Suite 200 Washington, D.C. 20002 | Director | Since July 1991 | Senior Partner, Johnson Smick International, Inc. (consulting firm); Chairperson of the Investment Committee (since October 2006) and Director or Trustee of various Morgan Stanley Funds (since July 1991); Co-Chairman and a founder of the Group of Seven Council (G7C) (international economic commission); formerly Chairperson of the Audit Committee (July 1991-September 2006), Vice Chairman of the Board of Governors of the Federal Reserve System and Assistant Secretary of the U.S. Treasury. | 100 | Director of NVR, Inc. (home construction). | ||||||||||||||||||
| Joseph J. Kearns (73) c/o Kearns & Associates LLC 23823 Malibu Road S-50-440 Malibu, CA 90265 | Director | Since August 1994 | President, Kearns & Associates LLC (investment consulting); Chairperson of the Audit Committee (since October 2006) and Director or Trustee of various Morgan Stanley Funds (since August 1994); formerly, Deputy Chairperson of the Audit Committee (July 2003-September 2006) and Chairperson of the Audit Committee of various Morgan Stanley Funds (since August 1994); CFO of the J. Paul Getty Trust. | 101 | Director of Electro Rent Corporation (equipment leasing). Prior to December 31, 2013, Director of The Ford Family Foundation. | ||||||||||||||||||
32
Morgan Stanley Institutional Fund, Inc.
Annual Report — December 31, 2015
Director and Officer Information (unaudited) (cont'd)
Independent Directors: (cont'd)
| Name, Age and Address of Independent Director | Positions(s) Held with Registrant | Length of Time Served | Principal Occupation(s) During Past 5 Years and Other Relevant Professional Experience | Number of Portfolios in Fund Complex Overseen by Director** | Other Directorships Held by Independent Director*** | ||||||||||||||||||
| Michael F. Klein (57) c/o Kramer Levin Naftalis & Frankel LLP Counsel to the Independent Directors 1177 Avenue of the Americas New York, NY 10036 | Director | Since August 2006 | Managing Director, Aetos Capital, LLC (since March 2000); Co-President, Aetos Alternatives Management, LLC (since January 2004); and Co-Chief Executive Officer of Aetos Capital LLC (since August 2013); Chairperson of the Fixed Income Sub-Committee of the Investment Committee (since October 2006) and Director or Trustee of various Morgan Stanley Funds (since August 2006); formerly, Managing Director, Morgan Stanley & Co. Inc. and Morgan Stanley Dean Witter Investment Management, President, various Morgan Stanley Funds (June1998-March 2000) and Principal, Morgan Stanley & Co. Inc. and Morgan Stanley Dean Witter Investment Management (August 1997-December 1999). | 97 | Director of certain investment funds managed or sponsored by Aetos Capital, LLC. Director of Sanitized AG and Sanitized Marketing AG (specialty chemicals). | ||||||||||||||||||
| Michael E. Nugent (79) 522 Fifth Avenue New York, NY 10036 | Chair of the Board and Director | Chair of the Boards since July 2006 and Director since July 1991 | Chair of the Boards of various Morgan Stanley Funds (since July 2006); Chairperson of the Closed-End Fund Committee (since June 2012) and Director or Trustee of various Morgan Stanley Funds (since July 1991); formerly, Chairperson of the Insurance Committee (until July 2006), General Partner, TriumphCapital, L.P. (private investment partnership) (1988-2013). | 100 | None. | ||||||||||||||||||
| W. Allen Reed (68) c/o Kramer Levin Naftalis & Frankel LLP Counsel to the Independent Directors 1177 Avenue of the Americas New York, NY 10036 | Director | Since August 2006 | Chairperson of the Equity Sub-Committee of the Investment Committee (since October 2006) and Director or Trustee of various Morgan Stanley Funds (since August 2006); formerly, President and CEO of General Motors Asset Management; Chairman and Chief Executive Officer of the GM Trust Bank and Corporate Vice President of General Motors Corporation (August 1994-December 2005). | 98 | Director of Legg Mason, Inc.; formerly, Director of the Auburn University Foundation (2010-2015). | ||||||||||||||||||
| Fergus Reid (83) c/o Joe Pietryka, Inc. 85 Charles Colman Blvd. Pawling, NY 12564 | Director | Since June 1992 | Chairman, Joe Pietryka, Inc.; Chairperson of the Governance Committee and Director or Trustee of various Morgan Stanley Funds (since June 1992). | 100 | Formerly, Trustee and Director of certain investment companies in the JP Morgan Fund Complex managed by JP Morgan Investment Management Inc. (1987-2012). | ||||||||||||||||||
33
Morgan Stanley Institutional Fund, Inc.
Annual Report — December 31, 2015
Director and Officer Information (unaudited) (cont'd)
Interested Director:
| Name, Age and Address of Interested Director | Positions(s) Held with Registrant | Length of Time Served* | Principal Occupation(s) During Past 5 Years | Number of Portfolios in Fund Complex Overseen by Interested Director** | Other Directorships Held by Interested Director*** | ||||||||||||||||||
| James F. Higgins (68) One New York Plaza, New York, NY 10004 | Director | Since June 2000 | Director or Trustee of various Morgan Stanley Funds (since June 2000); Senior Advisor of Morgan Stanley (since August 2000). | 99 | Formerly, Director of AXA Financial, Inc. and AXA Equitable Life Insurance Company (2002-2011) and Director of AXA MONY Life Insurance Company and AXA MONY Life Insurance Company of America (2004-2011). | ||||||||||||||||||
* This is the earliest date the Director began serving the Morgan Stanley Funds. Each Director serves an indefinite term, until his or her successor is elected.
** The Fund Complex includes (as of December 31, 2015) all open-end and closed-end funds (including all of their portfolios) advised by Morgan Stanley Investment Management Inc. (the "Adviser") and any funds that have an adviser that is an affiliated person of the Adviser (including, but not limited to, Morgan Stanley AIP GP LP).
*** This includes any directorships at public companies and registered investment companies held by the Director at any time during the past five years.
Executive Officers:
Name, Age and Address of Executive Officer | Position(s) Held with Registrant | Length of Time Served**** | Principal Occupation(s) During Past 5 Years | ||||||||||||
| John H. Gernon (52) 522 Fifth Avenue New York, NY 10036 | President and Principal Executive Officer | Since September 2013 | President and Principal Executive Officer of the Equity and Fixed Income Funds and the Morgan Stanley AIP Funds (since September 2013) and the Liquidity Funds and various money market funds (since May 2014) in the Fund Complex, Managing Director of the Adviser; Head of Product (since 2006). | ||||||||||||
| Stefanie V. Chang Yu (49) 522 Fifth Avenue New York, NY 10036 | Chief Compliance Officer | Since December 1997 | Managing Director of the Adviser and various entities affiliated with the Adviser; Chief Compliance Officer of various Morgan Stanley Funds and the Adviser (since January 2014); formerly, Vice President of various Morgan Stanley Funds (December 1997-January 2014). | ||||||||||||
| Joseph C. Benedetti (50) 522 Fifth Avenue New York, NY 10036 | Vice President | Since January 2014 | Managing Director of the Adviser and various entities affiliated with the Adviser; Vice President of various Morgan Stanley Funds (since January 2014); formerly, Assistant Secretary of various Morgan Stanley Funds (October 2004-January 2014). | ||||||||||||
| Francis J. Smith (50) 522 Fifth Avenue New York, NY 10036 | Treasurer and Principal Financial Officer | Treasurer since July 2003 and Principal Financial Officer since September 2002 | Executive Director of the Adviser and various entities affiliated with the Adviser; Treasurer (since July 2003) and Principal Financial Officer of various Morgan Stanley Funds (since September 2002). | ||||||||||||
| Mary E. Mullin (48) 522 Fifth Avenue New York, NY 10036 | Secretary | Since June 1999 | Executive Director of the Adviser; Secretary of various Morgan Stanley Funds (since June 1999). | ||||||||||||
**** This is the earliest date the officer began serving the Morgan Stanley Funds. Each officer serves a one-year term, until his or her successor is elected and has qualified.
34
Morgan Stanley Institutional Fund, Inc.
Annual Report — December 31, 2015
Adviser and Administrator
Morgan Stanley Investment Management Inc.
522 Fifth Avenue
New York, New York 10036
Sub-Adviser
Morgan Stanley Investment Management Company
23 Church Street
16-01 Capital Square, Singapore 049481
Distributor
Morgan Stanley Distribution, Inc.
522 Fifth Avenue
New York, New York 10036
Dividend Disbursing and Transfer Agent
Boston Financial Data Services, Inc.
2000 Crown Colony Drive
Quincy, Massachusetts 02169
Custodian
State Street Bank and Trust Company
One Lincoln Street
Boston, Massachusetts 02111
Legal Counsel
Dechert LLP
1095 Avenue of the Americas
New York, New York 10036
Counsel to the Independent Directors
Kramer Levin Naftalis & Frankel LLP
1177 Avenue of the Americas
New York, New York 10036
Independent Registered Public Accounting Firm
Ernst & Young LLP
200 Clarendon Street
Boston, Massachusetts 02116
Reporting to Shareholders
Each Morgan Stanley fund provides a complete schedule of portfolio holdings in its semi-annual and annual reports within 60 days of the end of the fund's second and fourth fiscal quarters. The semi-annual and annual reports are filed electronically with the Securities and Exchange Commission (SEC) on Form N-CSRS and Form N-CSR, respectively. Morgan Stanley also delivers the semi-annual and annual reports to fund shareholders and makes these reports available on its public website, www.morganstanley.com/im. Each Morgan Stanley fund also files a complete schedule of portfolio holdings with the SEC for the fund's first and third fiscal quarters on Form N-Q. Morgan Stanley does not deliver the reports for the first and third fiscal quarters to shareholders, nor are the reports posted to the Morgan Stanley public website. You may, however, obtain the Form N-Q filings (as well as the Form N-CSR and N-CSRS filings) by accessing the SEC's website, www.sec.gov. You may also review and copy them at the SEC's Public Reference Room in Washington, DC. Information on the operation of the SEC's Public Reference Room may be obtained by calling the SEC toll free at 1 (800) SEC-0330. You can also request copies of these materials, upon payment of a duplicating fee, by electronic request at the SEC's email address (publicinfo@sec.gov) or by writing the Public Reference Room of the SEC, Washington, DC 20549-0102.
Proxy Voting Policies and Procedures and Proxy Voting Record
You may obtain a copy of the Fund's Proxy Voting Policy and Procedures and information regarding how the Fund voted proxies relating to portfolio securities during the most recent twelve-month period ended June 30, without charge, upon request, by calling toll free 1 (800) 548-7786 or by visiting our website at www.morganstanley.com/im. This information is also available on the SEC's website at www.sec.gov.
This report is authorized for distribution only when preceded or accompanied by a prospectus of the Morgan Stanley Institutional Fund, Inc., which describes in detail each Portfolio's investment policies, risks, fees and expenses. Please read the prospectus carefully before you invest or send money. For additional information, including information regarding the investments comprising the Portfolio, please visit our website at www.morganstanley.com/im or call toll free 1 (800) 548-7786.
35
(This Page has been left blank intentionally.)
Printed in U.S.A.
This Report has been prepared for shareholders and may be distributed to others only if preceded or accompanied by a current prospectus.
Morgan Stanley Investment Management Inc.
522 Fifth Avenue
New York, New York 10036
© 2016 Morgan Stanley. Morgan Stanley Distribution, Inc.

IFIAEANN
1406875 EXP. 02.28.17
INVESTMENT MANAGEMENT

Morgan Stanley Institutional Fund, Inc.
Insight Portfolio
Annual Report
December 31, 2015

Morgan Stanley Institutional Fund, Inc.
Annual Report — December 31, 2015
Table of Contents
Shareholders' Letter | 2 | ||||||
Expense Example | 3 | ||||||
Investment Overview | 4 | ||||||
Portfolio of Investments | 6 | ||||||
Statement of Assets and Liabilities | 8 | ||||||
Statement of Operations | 10 | ||||||
Statements of Changes in Net Assets | 11 | ||||||
Financial Highlights | 13 | ||||||
Notes to Financial Statements | 17 | ||||||
Report of Independent Registered Public Accounting Firm | 24 | ||||||
Federal Tax Notice | 25 | ||||||
U.S. Privacy Policy | 26 | ||||||
Director and Officer Information | 29 | ||||||
This report is authorized for distribution only when preceded or accompanied by prospectuses of the Morgan Stanley Institutional Fund, Inc. To receive a prospectus and/or statement of additional information (SAI), which contains more complete information such as investment objectives, charges, expenses, policies for voting proxies, risk considerations, and describes in detail each of the Portfolio's investment policies to the prospective investor, please call toll free 1 (800) 548-7786. Please read the prospectuses carefully before you invest or send money.
Additionally, you can access portfolio information including performance, characteristics, and investment team commentary through Morgan Stanley Investment Management's website: www.morganstanley.com/im.
Market forecasts provided in this report may not necessarily come to pass. There is no guarantee that any sectors mentioned will continue to perform as discussed herein or that securities in such sectors will be held by the Portfolio in the future. There is no assurance that a Portfolio will achieve its investment objective. Portfolios are subject to market risk, which is the possibility that market values of securities owned by the Portfolio will decline and, therefore, the value of the Portfolio's shares may be less than what you paid for them. Accordingly, you can lose money investing in this Portfolio. Please see the prospectus for more complete information on investment risks.
1
Morgan Stanley Institutional Fund, Inc.
Annual Report — December 31, 2015
Shareholders' Letter (unaudited)
Dear Shareholders,
We are pleased to provide this Annual report, in which you will learn how your investment in Insight Portfolio (the "Portfolio") performed during the latest twelve-month period.
Morgan Stanley Investment Management is a client-centric, investor-led organization. Our global presence, intellectual capital, and breadth of products and services enable us to partner with investors to meet the evolving challenges of today's financial markets. We aim to deliver superior investment service and to empower our clients to make the informed decisions that help them reach their investment goals.
As always, we thank you for selecting Morgan Stanley Investment Management, and look forward to working with you in the months and years ahead.
Sincerely,

John H. Gernon
President and Principal Executive Officer
January 2016
2
Morgan Stanley Institutional Fund, Inc.
Annual Report — December 31, 2015
Expense Example (unaudited)
Insight Portfolio
As a shareholder of the Portfolio, you incur two types of costs: (1) transactional costs; and (2) ongoing costs, including advisory fees, administration fees, distribution and shareholder services fees and other Portfolio expenses. This example is intended to help you understand your ongoing costs (in dollars) of investing in the Portfolio and to compare these costs with the ongoing costs of investing in other mutual funds.
This example is based on an investment of $1,000 invested at the beginning of the six-month period ended December 31, 2015 and held for the entire six-month period.
Actual Expenses
The table below provides information about actual account values and actual expenses. You may use the information in this table, together with the amount you invested, to estimate the expenses that you paid over the period. Simply divide your account value by $1,000 (for example, an $8,600 account value divided by $1,000 = 8.6), then multiply the result by the number in the table under the heading entitled "Actual Expenses Paid During Period" to estimate the expenses you paid on your account during this period.
Hypothetical Example for Comparison Purposes
The table below provides information about hypothetical account values and hypothetical expenses based on the Portfolio's actual expense ratio and an assumed rate of return of 5% per year before expenses, which is not the Portfolio's actual return. The hypothetical account values and expenses may not be used to estimate the actual ending account balance or expenses you paid for the period. You may use this information to compare the ongoing costs of investing in the Portfolio and other funds. To do so, compare this 5% hypothetical example with the 5% hypothetical examples that appear in the shareholder reports of the other funds.
Please note that the expenses shown in the table are meant to highlight your ongoing costs only and do not reflect any transactional costs, such as sales charges (loads). Therefore, the information for each class in the table is useful in comparing ongoing costs only, and will not help you determine the relative total costs of owning different funds. In addition, if these transactional costs were included, your costs would have been higher.
| Beginning Account Value 7/1/15 | Actual Ending Account Value 12/31/15 | Hypothetical Ending Account Value | Actual Expenses Paid During Period* | Hypothetical Expenses Paid During Period* | Net Expense Ratio During Period** | ||||||||||||||||||||||
Insight Portfolio Class I | $ | 1,000.00 | $ | 944.90 | $ | 1,019.91 | $ | 5.15 | $ | 5.35 | 1.05 | % | |||||||||||||||
Insight Portfolio Class A | 1,000.00 | 943.10 | 1,018.15 | 6.86 | 7.12 | 1.40 | |||||||||||||||||||||
Insight Portfolio Class L | 1,000.00 | 940.00 | 1,015.63 | 9.29 | 9.65 | 1.90 | |||||||||||||||||||||
Insight Portfolio Class C | 1,000.00 | 938.60 | 1,014.37 | 10.51 | 10.92 | 2.15 | |||||||||||||||||||||
* Expenses are calculated using each Portfolio Class' annualized net expense ratio (as disclosed), multiplied by the average account value over the period, and multiplied by 184/365 (to reflect the most recent one-half year period).
** Annualized.
3
Morgan Stanley Institutional Fund, Inc.
Annual Report — December 31, 2015
Investment Overview (unaudited)
Insight Portfolio
The Portfolio seeks long-term capital appreciation.
Performance
For the year ended December 31, 2015, the Portfolio's Class I shares had a total return based on net asset value and reinvestment of distributions per share of -5.58%, net of fees. The Portfolio's Class I shares underperformed the Portfolio's benchmark, the Russell 3000® Value Index (the "Index"), which returned -4.13%.
Factors Affecting Performance
• The broad stock market ended the 12-month period at nearly the same level where it started, masking the considerable gyrations stock prices endured in between. The anticipation of the U.S. Federal Reserve's (Fed) first rate increase, the persistent slide in commodity prices, and global economic weakness, especially in China, weighed on the market throughout the period. Although U.S. economic data were mixed throughout the period, the economy's slow recovery continued, sufficiently that the Fed decided in December to raise its main policy interest rate, after keeping it near zero since December 2008 to stimulate growth.
• Slowing corporate earnings growth and a record year for merger and acquisition deals dominated the business headlines. Falling oil and raw materials prices caused considerable tumult for share prices in the energy, materials and industrials sectors. Although expectations were that consumer-oriented companies would benefit from consumers spending less at the gas pump, the boost to discretionary spending disappointed as consumers tended to pocket the savings. The U.S. dollar's strength relative to other major currencies, propelled by the Fed's move to a tightening stance while other global central banks were easing, also hurt the profits of U.S. multinational companies. Their foreign sales are worth less when translated back into U.S. dollars, and overseas demand is crimped when U.S. products become more expensive.
• In the Portfolio, our overall stock selection detracted from relative performance during this period, although positive results from sector allocation, which is driven by our stock selection process rather than top-down decisions, partially offset the relative weakness.
• The industrials sector was detrimental to relative returns, due to stock selection within the sector. A holding in a manufacturer of underground mining equipment was the largest detractor in the sector and in the whole Portfolio over the period.
• Both an overweight position and stock selection in the materials sector dampened performance. The Portfolio's exposure to a company that mines minerals and produces crop fertilizers led performance in the sector lower.
• The consumer discretionary sector also posted relative losses, primarily due to unfavorable stock selection. The biggest laggard in the sector was a holding in a U.S multinational media company.
• Positive contributions came from the Fund's energy position. An underweight in the energy sector was beneficial, and stock selection in the sector added to performance to a lesser degree.
• Stock selection in the financials sector was advantageous to performance, led by good performance from a position in an automobile insurance company.
• The information technology (IT) sector added to relative gains, with positive results from our stock selection within the sector and a small boost from the Portfolio's overweight to the sector. The leading IT sector contributor was a holding in an e-commerce marketplace operating online shopping and auction services globally.
Management Strategies
• There were no changes to our bottom-up investment process during the period. We seek to invest primarily in established and cyclical franchise companies that we believe have strong name recognition, sustainable competitive advantages, and ample growth prospects, and are trading at an attractive discount to future cash flow generation capacity or asset value. We typically favor companies with the ability to generate attractive free cash flow yields. We utilize a bottom-up stock selection process, seeking attractive investments on an individual company basis. Our emphasis is on secular growth, and as a result short-term market events are not as meaningful in the stock selection process.
4
Morgan Stanley Institutional Fund, Inc.
Annual Report — December 31, 2015
Investment Overview (unaudited) (cont'd)
Insight Portfolio
• The long-term investment horizon and conviction-weighted investment approach embraced by the team since 1998 can result in periods of performance deviation from the benchmark and peers, as was the case during this reporting period. Our team continues to focus on bottom-up stock selection and the long-term outlook for companies owned in the Portfolio; accordingly, we have had very little turnover in the Portfolio to date, as our ongoing work reaffirms our assessment of quality and competitive advantage in the names we own.

* Minimum Investment for Class I shares
** Commenced Operations on December 28, 2011.
In accordance with SEC regulations, the Portfolio's performance shown assumes that all recurring fees (including management fees) were deducted and all dividends and distributions were reinvested. The performance of Class A, L and C shares will vary from the performance of Class I shares based upon their difference inception dates and will be impacted by additional fees assessed to those classes.
Performance Compared to the Russell 3000® Value Index(1) and the Lipper Multi-Cap Core Funds Index(2)
| Period Ended December 31, 2015 Total Returns(3) | |||||||||||||||||||
Average Annual | |||||||||||||||||||
| One Year | Five Years | Ten Years | Since Inception(6) | ||||||||||||||||
| Portfolio — Class I Shares w/o sales charges(4) | –5.58 | % | — | — | 15.96 | % | |||||||||||||
| Portfolio — Class A Shares w/o sales charges(4) | –5.97 | — | — | 15.62 | |||||||||||||||
| Portfolio — Class A Shares with maximum 5.25% sales charges(4) | –10.93 | — | — | 14.08 | |||||||||||||||
| Portfolio — Class L Shares w/o sales charges(4) | –6.49 | — | — | 15.02 | |||||||||||||||
| Portfolio — Class C Shares w/o sales charges(5) | — | — | — | –6.42 | |||||||||||||||
| Portfolio — Class C Shares with maximum 1.00% deferred sales charges(5) | — | — | — | –7.23 | |||||||||||||||
Russell 3000® Value Index | –4.13 | — | — | 14.11 | |||||||||||||||
Lipper Multi-Cap Core Funds Index | –1.47 | — | — | 13.86 | |||||||||||||||
Performance data quoted represents past performance, which is no guarantee of future results, and current performance may be lower or higher than the figures shown. Performance assumes that all dividends and distributions, if any, were reinvested. For the most recent month-end performance figures, please visit www.morganstanley.com/im. Investment return and principal value will fluctuate so that Portfolio shares, when redeemed, may be worth more or less than their original cost. Total returns do not reflect the deduction of taxes that a shareholder would pay on Portfolio distributions or the redemption of Portfolio shares. Returns for periods less than one year are not annualized. Performance of share classes will vary due to difference in sales charges and expenses.
(1) The Russell 3000® Value Index measures the performance of those companies in the Russell 3000® Index with lower price-to-book ratios and lower forecasted growth values. The Russell 3000® Index measures the performance of the largest 3000 U.S. companies representing approximately 98% of the investable U.S. equity market. The Index is unmanaged and its returns do not include any sales charges or fees. Such costs would lower performance. It is not possible to invest directly in an index.
(2) The Lipper Multi-Cap Core Funds Index is an equally weighted performance index of the largest qualifying funds (based on net assets) in the Lipper Multi-Cap Core Funds classification. The Index, which is adjusted for capital gains distributions and income dividends, is unmanaged and should not be considered an investment. There are currently 30 funds represented in this Index. As of the date of this report, the Portfolio is in the Lipper Multi-Cap Core Funds classification.
(3) Total returns for the Portfolio reflect fees waived and expenses reimbursed, if applicable, by the Adviser. Without such waivers and reimbursements, total returns would have been lower.
(4) Commenced operations on December 28, 2011.
(5) Commenced offering on April 30, 2015.
(6) For comparative purposes, average annual since inception returns listed for the Indexes refer to the inception date of Class I of the Portfolio, not the inception of the Index.
5
Morgan Stanley Institutional Fund, Inc.
Annual Report — December 31, 2015
Portfolio of Investments
Insight Portfolio
Shares | Value (000) | ||||||||||
Common Stocks (97.8%) | |||||||||||
Aerospace & Defense (15.1%) | |||||||||||
BWX Technologies, Inc. | 5,328 | $ | 169 | ||||||||
United Technologies Corp. | 2,224 | 214 | |||||||||
383 | |||||||||||
Beverages (0.2%) | |||||||||||
Big Rock Brewery, Inc. (Canada) (a) | 1,422 | 5 | |||||||||
Chemicals (3.5%) | |||||||||||
Mosaic Co. (The) | 3,174 | 88 | |||||||||
Commercial Services & Supplies (2.2%) | |||||||||||
Copart, Inc. (a) | 1,489 | 57 | |||||||||
Diversified Financial Services (5.3%) | |||||||||||
Berkshire Hathaway, Inc., Class B (a) | 418 | 55 | |||||||||
Leucadia National Corp. | 4,492 | 78 | |||||||||
133 | |||||||||||
Health Care Equipment & Supplies (5.1%) | |||||||||||
Intuitive Surgical, Inc. (a) | 235 | 128 | |||||||||
Health Care Technology (0.2%) | |||||||||||
Castlight Health, Inc., Class B (a)(b) | 1,512 | 6 | |||||||||
Hotels, Restaurants & Leisure (1.4%) | |||||||||||
Bojangles', Inc. (a) | 1,168 | 18 | |||||||||
Habit Restaurants, Inc. (The) (a)(b) | 550 | 13 | |||||||||
Wingstop, Inc. (a) | 161 | 4 | |||||||||
35 | |||||||||||
Household Durables (4.2%) | |||||||||||
Garmin Ltd. | 2,832 | 105 | |||||||||
Industrial Conglomerates (4.6%) | |||||||||||
Koninklijke Philips N.V. (Netherlands) | 4,544 | 116 | |||||||||
Information Technology Services (5.3%) | |||||||||||
PayPal Holdings, Inc. (a) | 3,675 | 133 | |||||||||
Insurance (9.3%) | |||||||||||
Progressive Corp. (The) | 3,486 | 111 | |||||||||
RenaissanceRe Holdings Ltd. | 1,103 | 125 | |||||||||
236 | |||||||||||
Internet Software & Services (7.1%) | |||||||||||
eBay, Inc. (a) | 4,327 | 119 | |||||||||
GrubHub, Inc. (a) | 1,036 | 25 | |||||||||
Shutterstock, Inc. (a)(b) | 407 | 13 | |||||||||
Twitter, Inc. (a) | 982 | 23 | |||||||||
180 | |||||||||||
Leisure Products (1.1%) | |||||||||||
Vista Outdoor, Inc. (a) | 615 | 27 | |||||||||
Machinery (15.1%) | |||||||||||
Joy Global, Inc. | 7,698 | 97 | |||||||||
Manitowoc Co., Inc. (The) | 11,173 | 171 | |||||||||
Terex Corp. | 6,091 | 113 | |||||||||
381 | |||||||||||
Shares | Value (000) | ||||||||||
Media (6.4%) | |||||||||||
News Corp., Class A | 3,400 | $ | 45 | ||||||||
Time Warner, Inc. | 1,818 | 118 | |||||||||
163 | |||||||||||
Metals & Mining (1.1%) | |||||||||||
Dominion Diamond Corp. (Canada) (a) | 2,709 | 28 | |||||||||
Software (4.3%) | |||||||||||
Solera Holdings, Inc. | 1,966 | 108 | |||||||||
Specialty Retail (0.3%) | |||||||||||
Container Store Group, Inc. (The) (a) | 825 | 7 | |||||||||
Trading Companies & Distributors (4.0%) | |||||||||||
Fastenal Co. | 2,480 | 101 | |||||||||
Transportation Infrastructure (2.0%) | |||||||||||
BBA Aviation PLC (United Kingdom) | 18,393 | 51 | |||||||||
Total Common Stocks (Cost $2,648) | 2,471 | ||||||||||
| No. of Warrants | |||||||||||
Warrant (0.0%) | |||||||||||
Real Estate Management & Development (0.0%) | |||||||||||
| Tejon Ranch Co., expires 8/31/16 (a) (Cost $1) | 119 | — | @ | ||||||||
Shares | |||||||||||
Short-Term Investments (2.3%) | |||||||||||
Securities held as Collateral on Loaned Securities (1.3%) | |||||||||||
Investment Company (1.1%) | |||||||||||
| Morgan Stanley Institutional Liquidity Funds — Treasury Securities Portfolio — Institutional Class (See Note G) | 28,411 | 28 | |||||||||
| Face Amount (000) | |||||||||||
Repurchase Agreements (0.2%) | |||||||||||
| Barclays Capital, Inc., (0.32%, dated 12/31/15, due 1/4/16; proceeds $1; fully collateralized by a U.S. Government obligation; 2.00% due 11/30/22; valued at $1) | $ | 1 | 1 | ||||||||
| Merrill Lynch & Co., Inc., (0.31%, dated 12/31/15, due 1/4/16; proceeds $4; fully collateralized by a U.S. Government agency security; 4.00% due 11/20/45; valued at $4) | 4 | 4 | |||||||||
5 | |||||||||||
| Total Securities held as Collateral on Loaned Securities (Cost $33) | 33 | ||||||||||
The accompanying notes are an integral part of the financial statements.
6
Morgan Stanley Institutional Fund, Inc.
Annual Report — December 31, 2015
Portfolio of Investments (cont'd)
Insight Portfolio
Shares | Value (000) | ||||||||||
Investment Company (1.0%) | |||||||||||
| Morgan Stanley Institutional Liquidity Funds — Money Market Portfolio — Institutional Class (See Note G) (Cost $26) | 25,887 | $ | 26 | ||||||||
Total Short-Term Investments (Cost $59) | 59 | ||||||||||
| Total Investments (100.1%) (Cost $2,708) Including $32 of Securities Loaned (c)(d) | 2,530 | ||||||||||
Liabilities in Excess of Other Assets (–0.1%) | (2 | ) | |||||||||
Net Assets (100.0%) | $ | 2,528 | |||||||||
(a) Non-income producing security.
(b) All or a portion of this security was on loan at December 31, 2015.
(c) The approximate fair value and percentage of net assets, $51,000 and 2.0%, respectively, represent the securities that have been fair valued under the fair valuation policy for international investments as described in Note A-1 within the Notes to the Financial Statements.
(d) At December 31, 2015, the aggregate cost for Federal income tax purposes is approximately $2,709,000. The aggregate gross unrealized appreciation is approximately $187,000 and the aggregate gross unrealized depreciation is approximately $366,000 resulting in net unrealized depreciation of approximately $179,000.
@ Value is less than $500.
Portfolio Composition*
Classification | Percentage of Total Investments | ||||||
Other** | 30.4 | % | |||||
Aerospace & Defense | 15.4 | ||||||
Machinery | 15.3 | ||||||
Insurance | 9.5 | ||||||
Internet Software & Services | 7.2 | ||||||
Media | 6.5 | ||||||
Diversified Financial Services | 5.3 | ||||||
Information Technology Services | 5.3 | ||||||
Health Care Equipment & Supplies | 5.1 | ||||||
Total Investments | 100.0 | % | |||||
* Percentages indicated are based upon total investments (excluding Securities held as Collateral on Loaned Securities) as of December 31, 2015.
** Industries and/or investment types representing less than 5% of total investments.
The accompanying notes are an integral part of the financial statements.
7
Morgan Stanley Institutional Fund, Inc.
Annual Report — December 31, 2015
Insight Portfolio
Statement of Assets and Liabilities | December 31, 2015 (000) | ||||||
Assets: | |||||||
Investments in Securities of Unaffiliated Issuers, at Value(1) (Cost $2,654) | $ | 2,476 | |||||
Investments in Securities of Affiliated Issuer, at Value (Cost $54) | 54 | ||||||
Total Investments in Securities, at Value (Cost $2,708) | 2,530 | ||||||
Cash | 1 | ||||||
Due from Adviser | 47 | ||||||
Receivable for Portfolio Shares Sold | 28 | ||||||
Dividends Receivable | — | @ | |||||
Receivable from Affiliate | — | @ | |||||
Other Assets | 37 | ||||||
Total Assets | 2,643 | ||||||
Liabilities: | |||||||
Payable for Portfolio Shares Redeemed | 57 | ||||||
Collateral on Securities Loaned, at Value | 33 | ||||||
Payable for Professional Fees | 12 | ||||||
Payable for Custodian Fees | 7 | ||||||
Payable for Transfer Agency Fees — Class I | — | @ | |||||
Payable for Transfer Agency Fees — Class A | — | @ | |||||
Payable for Transfer Agency Fees — Class L | — | @ | |||||
Payable for Transfer Agency Fees — Class C | — | @ | |||||
Payable for Shareholder Services Fees — Class A | — | @ | |||||
Payable for Distribution and Shareholder Services Fees — Class L | — | @ | |||||
Payable for Distribution and Shareholder Services Fees — Class C | — | @ | |||||
Payable for Sub Transfer Agency Fees — Class I | — | @ | |||||
Payable for Sub Transfer Agency Fees — Class A | — | @ | |||||
Payable for Sub Transfer Agency Fees — Class L | — | @ | |||||
Payable for Sub Transfer Agency Fees — Class C | — | @ | |||||
Payable for Administration Fees | — | @ | |||||
Other Liabilities | 6 | ||||||
Total Liabilities | 115 | ||||||
Net Assets | $ | 2,528 | |||||
Net Assets Consist Of: | |||||||
Paid-in-Capital | $ | 2,700 | |||||
Accumulated Undistributed Net Investment Income | 3 | ||||||
Accumulated Net Realized Gain | 3 | ||||||
Unrealized Appreciation (Depreciation) on: | |||||||
Investments | (178 | ) | |||||
Net Assets | $ | 2,528 | |||||
The accompanying notes are an integral part of the financial statements.
8
Morgan Stanley Institutional Fund, Inc.
Annual Report — December 31, 2015
Insight Portfolio
Statement of Assets and Liabilities (cont'd) | December 31, 2015 (000) | ||||||
CLASS I: | |||||||
Net Assets | $ | 1,981 | |||||
| Shares Outstanding $0.001 par value shares of beneficial interest (unlimited shares authorized) (not in 000's) | 176,790 | ||||||
Net Asset Value, Offering and Redemption Price Per Share | $ | 11.21 | |||||
CLASS A: | |||||||
Net Assets | $ | 399 | |||||
| Shares Outstanding $0.001 par value shares of beneficial interest (unlimited shares authorized) (not in 000's) | 35,593 | ||||||
Net Asset Value, Redemption Price Per Share | $ | 11.21 | |||||
Maximum Sales Load | 5.25 | % | |||||
Maximum Sales Charge | $ | 0.62 | |||||
Maximum Offering Price Per Share | $ | 11.83 | |||||
CLASS L: | |||||||
Net Assets | $ | 90 | |||||
| Shares Outstanding $0.001 par value shares of beneficial interest (unlimited shares authorized) (not in 000's) | 8,128 | ||||||
Net Asset Value, Offering and Redemption Price Per Share | $ | 11.02 | |||||
CLASS C: | |||||||
Net Assets | $ | 58 | |||||
| Shares Outstanding $0.001 par value shares of beneficial interest (unlimited shares authorized) (not in 000's) | 5,314 | ||||||
Net Asset Value, Offering and Redemption Price Per Share | $ | 11.00 | |||||
| (1) Including: Securities on Loan, at Value: | $ | 32 | |||||
@ Amount is less than $500.
The accompanying notes are an integral part of the financial statements.
9
Morgan Stanley Institutional Fund, Inc.
Annual Report — December 31, 2015
Insight Portfolio
Statement of Operations | Year Ended December 31, 2015 (000) | ||||||
Investment Income: | |||||||
Dividends from Securities of Unaffiliated Issuers (Net of $—@ of foreign Taxes Withheld) | $ | 46 | |||||
Income from Securities Loaned — Net | 1 | ||||||
Dividends from Security of Affiliated Issuer (Note G) | — | @ | |||||
Total Investment Income | 47 | ||||||
Expenses: | |||||||
Professional Fees | 76 | ||||||
Registration Fees | 44 | ||||||
Custodian Fees (Note F) | 24 | ||||||
Advisory Fees (Note B) | 21 | ||||||
Shareholder Reporting Fees | 14 | ||||||
Transfer Agency Fees — Class I (Note E) | 2 | ||||||
Transfer Agency Fees — Class A (Note E) | 2 | ||||||
Transfer Agency Fees — Class L (Note E) | 2 | ||||||
Transfer Agency Fees — Class C (Note E) | 1 | ||||||
Shareholder Services Fees — Class A (Note D) | 1 | ||||||
Distribution and Shareholder Services Fees — Class L (Note D) | 1 | ||||||
Distribution and Shareholder Services Fees — Class C (Note D) | — | @ | |||||
Administration Fees (Note C) | 2 | ||||||
Pricing Fees | 2 | ||||||
Sub Transfer Agency Fees — Class I | — | @ | |||||
Sub Transfer Agency Fees — Class A | — | @ | |||||
Sub Transfer Agency Fees — Class L | — | @ | |||||
Sub Transfer Agency Fees — Class C | — | @ | |||||
Directors' Fees and Expenses | — | @ | |||||
Other Expenses | 9 | ||||||
Total Expenses | 201 | ||||||
Expenses Reimbursed by Adviser (Note B) | (143 | ) | |||||
Waiver of Advisory Fees (Note B) | (21 | ) | |||||
Reimbursement of Class Specific Expenses — Class I (Note B) | (2 | ) | |||||
Reimbursement of Class Specific Expenses — Class A (Note B) | (2 | ) | |||||
Reimbursement of Class Specific Expenses — Class L (Note B) | (2 | ) | |||||
Reimbursement of Class Specific Expenses — Class C (Note B) | (1 | ) | |||||
Rebate from Morgan Stanley Affiliate (Note G) | (— | @) | |||||
Net Expenses | 30 | ||||||
Net Investment Income | 17 | ||||||
Realized Gain (Loss): | |||||||
Investments Sold | 203 | ||||||
Foreign Currency Transactions | (— | @) | |||||
Net Realized Gain | 203 | ||||||
Change in Unrealized Appreciation (Depreciation): | |||||||
Investments | (376 | ) | |||||
Foreign Currency Translations | (— | @) | |||||
Net Change in Unrealized Appreciation (Depreciation) | (376 | ) | |||||
Net Realized Gain and Change in Unrealized Appreciation (Depreciation) | (173 | ) | |||||
Net Decrease in Net Assets Resulting from Operations | $ | (156 | ) | ||||
@ Amount is less than $500.
The accompanying notes are an integral part of the financial statements.
10
Morgan Stanley Institutional Fund, Inc.
Annual Report — December 31, 2015
Insight Portfolio
Statements of Changes in Net Assets | Year Ended December 31, 2015 (000) | Year Ended December 31, 2014 (000) | |||||||||
Increase (Decrease) in Net Assets: | |||||||||||
Operations: | |||||||||||
Net Investment Income | $ | 17 | $ | 8 | |||||||
Net Realized Gain | 203 | 353 | |||||||||
Net Change in Unrealized Appreciation (Depreciation) | (376 | ) | (220 | ) | |||||||
Net Increase (Decrease) in Net Assets Resulting from Operations | (156 | ) | 141 | ||||||||
Distributions from and/or in Excess of: | |||||||||||
Class I: | |||||||||||
Net Investment Income | (15 | ) | (5 | ) | |||||||
Net Realized Gain | (256 | ) | (331 | ) | |||||||
Class A: | |||||||||||
Net Investment Income | (2 | ) | (— | @) | |||||||
Net Realized Gain | (53 | ) | (38 | ) | |||||||
Class L: | |||||||||||
Net Investment Income | (— | @) | (— | @) | |||||||
Net Realized Gain | (16 | ) | (9 | ) | |||||||
Class C: | |||||||||||
Net Investment Income | (— | @) | — | ||||||||
Net Realized Gain | (7 | ) | — | ||||||||
Total Distributions | (349 | ) | (383 | ) | |||||||
Capital Share Transactions:(1) | |||||||||||
Class I: | |||||||||||
Subscribed | 188 | — | |||||||||
Distributions Reinvested | 270 | 335 | |||||||||
Redeemed | (53 | ) | (11 | ) | |||||||
Class A: | |||||||||||
Subscribed | 320 | 25 | |||||||||
Distributions Reinvested | 52 | 35 | |||||||||
Redeemed | (121 | ) | (16 | ) | |||||||
Class L: | |||||||||||
Subscribed | 129 | — | |||||||||
Distributions Reinvested | 15 | 6 | |||||||||
Redeemed | (80 | ) | (70 | ) | |||||||
Class C: | |||||||||||
Subscribed | 72 | * | — | ||||||||
Distributions Reinvested | 6 | * | — | ||||||||
Redeemed | (10 | )* | — | ||||||||
Net Increase in Net Assets Resulting from Capital Share Transactions | 788 | 304 | |||||||||
Total Increase in Net Assets | 283 | 62 | |||||||||
Net Assets: | |||||||||||
Beginning of Period | 2,245 | 2,183 | |||||||||
End of Period (Including Accumulated Undistributed Net Investment Income of $3 and $3) | $ | 2,528 | $ | 2,245 | |||||||
The accompanying notes are an integral part of the financial statements.
11
Morgan Stanley Institutional Fund, Inc.
Annual Report — December 31, 2015
Insight Portfolio
Statements of Changes in Net Assets (cont'd) | Year Ended December 31, 2015 (000) | Year Ended December 31, 2014 (000) | |||||||||
(1) Capital Share Transactions: | |||||||||||
Class I: | |||||||||||
Shares Subscribed | 14 | — | |||||||||
Shares Issued on Distributions Reinvested | 23 | 24 | |||||||||
Shares Redeemed | (4 | ) | (1 | ) | |||||||
Net Increase in Class I Shares Outstanding | 33 | 23 | |||||||||
Class A: | |||||||||||
Shares Subscribed | 24 | 2 | |||||||||
Shares Issued on Distributions Reinvested | 4 | 2 | |||||||||
Shares Redeemed | (9 | ) | (1 | ) | |||||||
Net Increase in Class A Shares Outstanding | 19 | 3 | |||||||||
Class L: | |||||||||||
Shares Subscribed | 10 | — | |||||||||
Shares Issued on Distributions Reinvested | 2 | — | @@ | ||||||||
Shares Redeemed | (7 | ) | (4 | ) | |||||||
Net Increase (Decrease) in Class L Shares Outstanding | 5 | (4 | ) | ||||||||
Class C: | |||||||||||
Shares Subscribed | 6 | * | — | ||||||||
Shares Issued on Distributions Reinvested | — | @@* | — | ||||||||
Shares Redeemed | (1 | )* | — | ||||||||
Net Increase in Class C Shares Outstanding | 5 | — | |||||||||
* For the period April 30, 2015 through December 31, 2015.
@ Amount is less than $500.
@@ Amount is less than 500 shares.
The accompanying notes are an integral part of the financial statements.
12
Morgan Stanley Institutional Fund, Inc.
Annual Report — December 31, 2015
Financial Highlights
Insight Portfolio
Class I | |||||||||||||||||||||||
Year Ended December 31, | Period from December 28, 2011^ to | ||||||||||||||||||||||
Selected Per Share Data and Ratios | 2015 | 2014 | 2013 | 2012 | December 31, 2011 | ||||||||||||||||||
Net Asset Value, Beginning of Period | $ | 13.65 | $ | 15.40 | $ | 11.86 | $ | 10.06 | $ | 10.00 | |||||||||||||
Income (Loss) from Investment Operations: | |||||||||||||||||||||||
Net Investment Income (Loss)† | 0.10 | 0.06 | 0.18 | 0.17 | (0.00 | )‡ | |||||||||||||||||
Net Realized and Unrealized Gain (Loss) | (0.82 | ) | 0.87 | 4.52 | 2.59 | 0.06 | |||||||||||||||||
Total from Investment Operations | (0.72 | ) | 0.93 | 4.70 | 2.76 | 0.06 | |||||||||||||||||
Distributions from and/or in Excess of: | |||||||||||||||||||||||
Net Investment Income | (0.10 | ) | (0.04 | ) | (0.16 | ) | (0.14 | ) | — | ||||||||||||||
Net Realized Gain | (1.62 | ) | (2.64 | ) | (1.00 | ) | (0.82 | ) | — | ||||||||||||||
Total Distributions | (1.72 | ) | (2.68 | ) | (1.16 | ) | (0.96 | ) | — | ||||||||||||||
Net Asset Value, End of Period | $ | 11.21 | $ | 13.65 | $ | 15.40 | $ | 11.86 | $ | 10.06 | |||||||||||||
Total Return++ | (5.58 | )% | 6.66 | % | 40.20 | % | 27.47 | % | 0.60 | %# | |||||||||||||
Ratios and Supplemental Data: | |||||||||||||||||||||||
Net Assets, End of Period (Thousands) | $ | 1,981 | $ | 1,968 | $ | 1,859 | $ | 12 | $ | 10 | |||||||||||||
Ratio of Expenses to Average Net Assets (1) | 1.04 | %+ | 1.04 | %+ | 1.04 | %+ | 1.04 | %+ | 1.05 | %* | |||||||||||||
Ratio of Net Investment Income (Loss) to Average Net Assets (1) | 0.78 | %+ | 0.44 | %+ | 1.25 | %+ | 1.47 | %+ | (0.94 | )%* | |||||||||||||
Ratio of Rebate from Morgan Stanley Affiliates to Average Net Assets | 0.01 | % | 0.01 | % | 0.01 | % | 0.01 | % | N/A | ||||||||||||||
Portfolio Turnover Rate | 55 | % | 82 | % | 51 | % | 62 | % | 0 | %# | |||||||||||||
(1) Supplemental Information on the Ratios to Average Net Assets: | |||||||||||||||||||||||
Ratios Before Expense Limitation: | |||||||||||||||||||||||
Expenses to Average Net Assets | 7.50 | % | 7.69 | % | 10.83 | % | 11.61 | % | 380.17 | %* | |||||||||||||
Net Investment Loss to Average Net Assets | (5.68 | )% | (6.21 | )% | (8.54 | )% | (9.10 | )% | (380.06 | )%* | |||||||||||||
^ Commencement of Operations.
† Per share amount is based on average shares outstanding.
‡ Amount is less than $0.005 per share.
++ Calculated based on the net asset value as of the last business day of the period.
+ The Ratios of Expenses and Net Investment Income (Loss) reflect the rebate of certain Portfolio expenses in connection with the investments in Morgan Stanley affiliates during the period. The effect of the rebate on the ratios is disclosed in the above table as "Ratio of Rebate from Morgan Stanley Affiliates to Average Net Assets."
# Not Annualized.
* Annualized.
The accompanying notes are an integral part of the financial statements.
13
Morgan Stanley Institutional Fund, Inc.
Annual Report — December 31, 2015
Financial Highlights
Insight Portfolio
Class A | |||||||||||||||||||||||
Year Ended December 31, | Period from December 28, 2011^ to | ||||||||||||||||||||||
Selected Per Share Data and Ratios | 2015 | 2014 | 2013 | 2012 | December 31, 2011 | ||||||||||||||||||
Net Asset Value, Beginning of Period | $ | 13.66 | $ | 15.43 | $ | 11.86 | $ | 10.06 | $ | 10.00 | |||||||||||||
Income (Loss) from Investment Operations: | |||||||||||||||||||||||
Net Investment Income (Loss)† | 0.05 | 0.01 | 0.07 | 0.14 | (0.00 | )‡ | |||||||||||||||||
Net Realized and Unrealized Gain (Loss) | (0.82 | ) | 0.87 | 4.58 | 2.59 | 0.06 | |||||||||||||||||
Total from Investment Operations | (0.77 | ) | 0.88 | 4.65 | 2.73 | 0.06 | |||||||||||||||||
Distributions from and/or in Excess of: | |||||||||||||||||||||||
Net Investment Income | (0.06 | ) | (0.01 | ) | (0.08 | ) | (0.11 | ) | — | ||||||||||||||
Net Realized Gain | (1.62 | ) | (2.64 | ) | (1.00 | ) | (0.82 | ) | — | ||||||||||||||
Total Distributions | (1.68 | ) | (2.65 | ) | (1.08 | ) | (0.93 | ) | — | ||||||||||||||
Net Asset Value, End of Period | $ | 11.21 | $ | 13.66 | $ | 15.43 | $ | 11.86 | $ | 10.06 | |||||||||||||
Total Return++ | (5.97 | )% | 6.41 | % | 39.73 | % | 27.21 | % | 0.60 | %# | |||||||||||||
Ratios and Supplemental Data: | |||||||||||||||||||||||
Net Assets, End of Period (Thousands) | $ | 399 | $ | 230 | $ | 209 | $ | 1,144 | $ | 815 | |||||||||||||
Ratio of Expenses to Average Net Assets (1) | 1.39 | %+ | 1.39 | %+ | 1.30 | %+^^ | 1.29 | %+ | 1.30 | %* | |||||||||||||
Ratio of Net Investment Income (Loss) to Average Net Assets (1) | 0.42 | %+ | 0.09 | %+ | 0.50 | %+ | 1.22 | %+ | (1.19 | )%* | |||||||||||||
Ratio of Rebate from Morgan Stanley Affiliates to Average Net Assets | 0.01 | % | 0.01 | % | 0.01 | % | 0.01 | % | N/A | ||||||||||||||
Portfolio Turnover Rate | 55 | % | 82 | % | 51 | % | 62 | % | 0 | %# | |||||||||||||
(1) Supplemental Information on the Ratios to Average Net Assets: | |||||||||||||||||||||||
Ratios Before Expense Limitation: | |||||||||||||||||||||||
Expenses to Average Net Assets | 8.32 | % | 8.91 | % | 13.79 | % | 11.86 | % | 380.42 | %* | |||||||||||||
Net Investment Loss to Average Net Assets | (6.51 | )% | (7.43 | )% | (11.99 | )% | (9.35 | )% | (380.31 | )%* | |||||||||||||
^ Commencement of Operations.
† Per share amount is based on average shares outstanding.
‡ Amount is less than $0.005 per share.
++ Calculated based on the net asset value which does not reflect sales charges, if applicable, as of the last business day of the period.
+ The Ratios of Expenses and Net Investment Income (Loss) reflect the rebate of certain Portfolio expenses in connection with the investments in Morgan Stanley affiliates during the period. The effect of the rebate on the ratios is disclosed in the above table as "Ratio of Rebate from Morgan Stanley Affiliates to Average Net Assets."
^^ Effective September 16, 2013, the Adviser has agreed to limit the ratio of expenses to average net assets to the maximum ratio of 1.40% for Class A shares. Prior to September 16, 2013, the maximum ratio was 1.30% for Class A shares.
# Not Annualized.
* Annualized.
The accompanying notes are an integral part of the financial statements.
14
Morgan Stanley Institutional Fund, Inc.
Annual Report — December 31, 2015
Financial Highlights
Insight Portfolio
Class L | |||||||||||||||||||||||
Year Ended December 31, | Period from December 28, 2011^ to | ||||||||||||||||||||||
Selected Per Share Data and Ratios | 2015 | 2014 | 2013 | 2012 | December 31, 2011 | ||||||||||||||||||
Net Asset Value, Beginning of Period | $ | 13.50 | $ | 15.35 | $ | 11.85 | $ | 10.06 | $ | 10.00 | |||||||||||||
Income (Loss) from Investment Operations: | |||||||||||||||||||||||
Net Investment Income (Loss)† | (0.01 | ) | (0.06 | ) | 0.08 | 0.08 | (0.00 | )‡ | |||||||||||||||
Net Realized and Unrealized Gain (Loss) | (0.82 | ) | 0.86 | 4.49 | 2.58 | 0.06 | |||||||||||||||||
Total from Investment Operations | (0.83 | ) | 0.80 | 4.57 | 2.66 | 0.06 | |||||||||||||||||
Distributions from and/or in Excess of: | |||||||||||||||||||||||
Net Investment Income | (0.03 | ) | (0.01 | ) | (0.07 | ) | (0.05 | ) | — | ||||||||||||||
Net Realized Gain | (1.62 | ) | (2.64 | ) | (1.00 | ) | (0.82 | ) | — | ||||||||||||||
Total Distributions | (1.65 | ) | (2.65 | ) | (1.07 | ) | (0.87 | ) | — | ||||||||||||||
Net Asset Value, End of Period | $ | 11.02 | $ | 13.50 | $ | 15.35 | $ | 11.85 | $ | 10.06 | |||||||||||||
Total Return++ | (6.49 | )% | 5.83 | % | 39.13 | % | 26.52 | % | 0.60 | %# | |||||||||||||
Ratios and Supplemental Data: | |||||||||||||||||||||||
Net Assets, End of Period (Thousands) | $ | 90 | $ | 47 | $ | 115 | $ | 12 | $ | 10 | |||||||||||||
Ratio of Expenses to Average Net Assets (1) | 1.89 | %+ | 1.89 | %+ | 1.84 | %+^^ | 1.79 | %+ | 1.80 | %* | |||||||||||||
Ratio of Net Investment Income (Loss) to Average Net Assets (1) | (0.09 | )%+ | (0.41 | )%+ | 0.54 | %+ | 0.72 | %+ | (1.70 | )%* | |||||||||||||
Ratio of Rebate from Morgan Stanley Affiliates to Average Net Assets | 0.01 | % | 0.01 | % | 0.01 | % | 0.01 | % | N/A | ||||||||||||||
Portfolio Turnover Rate | 55 | % | 82 | % | 51 | % | 62 | % | 0 | %# | |||||||||||||
(1) Supplemental Information on the Ratios to Average Net Assets: | |||||||||||||||||||||||
Ratios Before Expense Limitation: | |||||||||||||||||||||||
Expenses to Average Net Assets | 10.04 | % | 10.64 | % | 12.31 | % | 12.36 | % | 380.92 | %* | |||||||||||||
Net Investment Loss to Average Net Assets | (8.24 | )% | (9.16 | )% | (9.93 | )% | (9.85 | )% | (380.82 | )%* | |||||||||||||
^ Commencement of Operations.
† Per share amount is based on average shares outstanding.
‡ Amount is less than $0.005 per share.
++ Calculated based on the net asset value as of the last business day of the period.
+ The Ratios of Expenses and Net Investment Income (Loss) reflect the rebate of certain Portfolio expenses in connection with the investments in Morgan Stanley affiliates during the period. The effect of the rebate on the ratios is disclosed in the above table as "Ratio of Rebate from Morgan Stanley Affiliates to Average Net Assets."
^^ Effective September 16, 2013, the Adviser has agreed to limit the ratio of expenses to average net assets to the maximum ratio of 1.90% for Class L shares. Prior to September 16, 2013, the maximum ratio was 1.80% for Class L shares.
# Not Annualized.
* Annualized.
The accompanying notes are an integral part of the financial statements.
15
Morgan Stanley Institutional Fund, Inc.
Annual Report — December 31, 2015
Financial Highlights
Insight Portfolio
Class C | |||||||
Selected Per Share Data and Ratios | Period from April 30, 2015^ to December 31, 2015 | ||||||
Net Asset Value, Beginning of Period | $ | 13.47 | |||||
Loss from Investment Operations: | |||||||
Net Investment Loss† | (0.08 | ) | |||||
Net Realized and Unrealized Loss | (0.74 | ) | |||||
Total from Investment Operations | (0.82 | ) | |||||
Distributions from and/or in Excess of: | |||||||
Net Investment Income | (0.03 | ) | |||||
Net Realized Gain | (1.62 | ) | |||||
Total Distributions | (1.65 | ) | |||||
Net Asset Value, End of Period | $ | 11.00 | |||||
Total Return++ | (6.42 | )%# | |||||
Ratios and Supplemental Data: | |||||||
Net Assets, End of Period (Thousands) | $ | 58 | |||||
Ratios of Expenses to Average Net Assets (1) | 2.14 | %+* | |||||
Ratio of Net Investment Loss to Average Net Assets (1) | (0.91 | )%+* | |||||
Ratio of Rebate from Morgan Stanley Affiliates to Average Net Assets | 0.01 | %* | |||||
Portfolio Turnover Rate | 55 | % | |||||
(1) Supplemental Information on the Ratios to Average Net Assets: | |||||||
Ratios Before Expense Limitation: | |||||||
Expense to Average Net Assets | 12.97 | %* | |||||
Net Investment Loss to Average Net Assets | (11.74 | )%* | |||||
^ Commencement of Offering.
† Per share amount is based on average shares outstanding.
++ Calculated based on the net asset value which does not reflect sales charges, if applicable, as of the last business day of the period.
+ The Ratios of Expenses and Net Investment Loss reflect the rebate of certain Portfolio expenses in connection with the investments in Morgan Stanley affiliates during the period. The effect of the rebate on the ratios is disclosed in the above table as "Ratio of Rebate from Morgan Stanley Affiliates to Average Net Assets."
# Not Annualized.
* Annualized.
The accompanying notes are an integral part of the financial statements.
16
Morgan Stanley Institutional Fund, Inc.
Annual Report — December 31, 2015
Notes to Financial Statements
Morgan Stanley Institutional Fund, Inc. (the "Fund") is registered under the Investment Company Act of 1940, as amended (the "Act"), as an open-end management investment company. The Fund is comprised of twenty-six separate, active, diversified and non-diversified portfolios (individually referred to as a "Portfolio", collectively as the "Portfolios"). The Fund applies investment company accounting and reporting guidance.
The accompanying financial statements relate to the Insight Portfolio. The Portfolio seeks long-term capital appreciation by investing primarily in established and cyclical companies with market capitalizations within the range of companies included in the Russell 3000® Value Index.
The Portfolio offers four classes of shares — Class I, Class A, Class L and Class C. On April 30, 2015, the Portfolio commenced offering Class C shares and suspended offering of Class L shares. Existing Class L shareholders may invest through reinvestment of dividends and distributions.
A. Significant Accounting Policies: The following significant accounting policies are in conformity with U.S. generally accepted accounting principles ("GAAP"). Such policies are consistently followed by the Fund in the preparation of its financial statements. GAAP may require management to make estimates and assumptions that affect the reported amounts and disclosures in the financial statements. Actual results may differ from those estimates.
1. Security Valuation: (1) An equity portfolio security listed or traded on an exchange is valued at its latest reported sales price (or at the exchange official closing price if such exchange reports an official closing price), if there were no sales on a given day, the security is valued at the mean between the last reported bid and asked prices; (2) all other equity portfolio securities for which over-the-counter ("OTC") market quotations are readily available are valued at its latest reported sales price. In cases where a security is traded on more than one exchange, the security is valued on the exchange designated as the primary market; (3) when market quotations are not readily available, including circumstances under which Morgan Stanley Investment Management Inc. (the "Adviser") determines that the closing price, last sale price or the mean between the last reported bid and asked prices are not reflective of a security's market value, portfolio securities are valued at their fair value as determined in good faith under procedures established by and under the general supervision of the Fund's Board of Directors (the "Directors"). Occasionally, developments affecting the closing prices of securities and
other assets may occur between the times at which valuations of such securities are determined (that is, close of the foreign market on which the securities trade) and the close of business of the New York Stock Exchange ("NYSE"). If developments occur during such periods that are expected to materially affect the value of such securities, such valuations may be adjusted to reflect the estimated fair value of such securities as of the close of the NYSE, as determined in good faith by the Directors or by the Adviser using a pricing service and/or procedures approved by the Directors; (4) quotations of foreign portfolio securities, other assets and liabilities and forward contracts stated in foreign currency are translated into U.S. dollar equivalents at the prevailing market rates prior to the close of the NYSE; (5) investments in mutual funds, including the Morgan Stanley Institutional Liquidity Funds, are valued at the net asset value ("NAV") as of the close of each business day; and (6) short-term debt securities with remaining maturities of 60 days or less at the time of purchase may be valued at amortized cost, unless the Adviser determines such valuation does not reflect the securities' market value, in which case these securities will be valued at their fair market value determined by the Adviser.
The Directors have responsibility for determining in good faith the fair value of the investments, and the Directors may appoint others, such as the Fund's Adviser or a valuation committee, to assist the Directors in determining fair value and to make the actual calculations pursuant to the fair valuation methodologies previously approved by the Directors. Under procedures approved by the Directors, the Fund's Adviser has formed a Valuation Committee whose members are approved by the Directors. The Valuation Committee provides administration and oversight of the Fund's valuation policies and procedures, which are reviewed at least annually by the Directors. These procedures allow the Fund to utilize independent pricing services, quotations from securities and financial instrument dealers, and other market sources to determine fair value.
The Fund has procedures to determine the fair value of securities and other financial instruments for which market prices are not readily available. Under these procedures, the Valuation Committee convenes on a regular and ad hoc basis to review such securities and considers a number of factors, including valuation methodologies and significant unobservable valuation inputs, when
17
Morgan Stanley Institutional Fund, Inc.
Annual Report — December 31, 2015
Notes to Financial Statements (cont'd)
arriving at fair value. The Valuation Committee may employ a market-based approach which may use related or comparable assets or liabilities, recent transactions, market multiples, book values, and other relevant information for the investment to determine the fair value of the investment. An income-based valuation approach may also be used in which the anticipated future cash flows of the investment are discounted to calculate fair value. Discounts may also be applied due to the nature or duration of any restrictions on the disposition of the investments. Due to the inherent uncertainty of valuations of such investments, the fair values may differ significantly from the values that would have been used had an active market existed. The Valuation Committee employs various methods for calibrating these valuation approaches including a regular review of valuation methodologies, key inputs and assumptions, transactional back-testing or disposition analysis, and reviews of any related market activity.
2. Fair Value Measurement: Financial Accounting Standards Board ("FASB") Accounting Standards CodificationTM ("ASC") 820, "Fair Value Measurement" ("ASC 820"), defines fair value as the value that the Fund would receive to sell an investment or pay to transfer a liability in a timely transaction with an independent buyer in the principal market, or in the absence of a principal market the most advantageous market for the investment or liability. ASC 820 establishes a three-tier hierarchy to distinguish between (1) inputs that reflect the assumptions market participants would use in valuing an asset or liability developed based on market data obtained from sources independent of the reporting entity (observable inputs) and (2) inputs that reflect the reporting entity's own assumptions about the assumptions market participants would use in valuing an asset or liability developed based on the best information available in the circumstances (unobservable inputs) and to establish classification of fair value measurements for disclosure purposes. Various inputs are used in determining the value of the Fund's investments. The inputs are summarized in the three broad levels listed below.
• Level 1 – unadjusted quoted prices in active markets for identical investments
• Level 2 – other significant observable inputs (including quoted prices for similar investments, interest rates, prepayment speeds, credit risk, etc.)
• Level 3 – significant unobservable inputs including the Fund's own assumptions in determining the fair value of investments. Factors considered in making this determination may include, but are not limited to, information obtained by contacting the issuer, analysts, or the appropriate stock exchange (for exchange-traded securities), analysis of the issuer's financial statements or other available documents and, if necessary, available information concerning other securities in similar circumstances
The inputs or methodology used for valuing securities are not necessarily an indication of the risk associated with investing in those securities and the determination of the significance of a particular input to the fair value measurement in its entirety requires judgment and considers factors specific to each security.
The following is a summary of the inputs used to value the Portfolio's investments as of December 31, 2015.
Investment Type | Level 1 Unadjusted quoted prices (000) | Level 2 Other significant observable inputs (000) | Level 3 Significant unobservable inputs (000) | Total (000) | |||||||||||||||
Assets: | |||||||||||||||||||
Common Stocks | |||||||||||||||||||
Aerospace & Defense | $ | 383 | $ | — | $ | — | $ | 383 | |||||||||||
Beverages | 5 | — | — | 5 | |||||||||||||||
Chemicals | 88 | — | — | 88 | |||||||||||||||
| Commercial Services & Supplies | 57 | — | — | 57 | |||||||||||||||
| Diversified Financial Services | 133 | — | — | 133 | |||||||||||||||
| Health Care Equipment & Supplies | 128 | — | — | 128 | |||||||||||||||
Health Care Technology | 6 | — | — | 6 | |||||||||||||||
| Hotels, Restaurants & Leisure | 35 | — | — | 35 | |||||||||||||||
Household Durables | 105 | — | — | 105 | |||||||||||||||
Industrial Conglomerates | 116 | — | — | 116 | |||||||||||||||
| Information Technology Services | 133 | — | — | 133 | |||||||||||||||
Insurance | 236 | — | — | 236 | |||||||||||||||
| Internet Software & Services | 180 | — | — | 180 | |||||||||||||||
Leisure Products | 27 | — | — | 27 | |||||||||||||||
Machinery | 381 | — | — | 381 | |||||||||||||||
Media | 163 | — | — | 163 | |||||||||||||||
Metals & Mining | 28 | — | — | 28 | |||||||||||||||
Software | 108 | — | — | 108 | |||||||||||||||
Specialty Retail | 7 | — | — | 7 | |||||||||||||||
| Trading Companies & Distributors | 101 | — | — | 101 | |||||||||||||||
| Transportation Infrastructure | — | 51 | — | 51 | |||||||||||||||
Total Common Stocks | 2,420 | 51 | — | 2,471 | |||||||||||||||
18
Morgan Stanley Institutional Fund, Inc.
Annual Report — December 31, 2015
Notes to Financial Statements (cont'd)
Investment Type | Level 1 Unadjusted quoted prices (000) | Level 2 Other significant observable inputs (000) | Level 3 Significant unobservable inputs (000) | Total (000) | |||||||||||||||
Warrant | $ | — | @ | $ | — | $ | — | $ | — | @ | |||||||||
Short-Term Investments | |||||||||||||||||||
Investment Companies | 54 | — | — | 54 | |||||||||||||||
Repurchase Agreements | — | 5 | — | 5 | |||||||||||||||
| Total Short-Term Investments | 54 | 5 | — | 59 | |||||||||||||||
Total Assets | $ | 2,474 | $ | 56 | $ | — | $ | 2,530 | |||||||||||
@ Value is less than $500.
Transfers between investment levels may occur as the markets fluctuate and/or the availability of data used in an investment's valuation changes. The Portfolio recognizes transfers between the levels as of the end of the period. As of December 31, 2015, the Portfolio did not have any investments transfer between investment levels. At December 31, 2015, the fair value of certain securities were adjusted due to developments which occurred between the time of the close of the foreign markets on which they trade and the close of business on the NYSE which resulted in their Level 2 classification.
3. Repurchase Agreements: The Portfolio may enter into repurchase agreements under which the Portfolio lends cash and takes possession of securities with an agreement that the counterparty will repurchase such securities. In connection with transactions in repurchase agreements, a bank as custodian for the Portfolio takes possession of the underlying securities which are held as collateral, with a market value at least equal to the amount of the repurchase transaction, including principal and accrued interest. To the extent that any repurchase transaction exceeds one business day, the value of the collateral is marked-to-market on a daily basis to determine that the value of the collateral does not decrease below the repurchase price plus accrued interest as earned. If such a decrease occurs, additional collateral will be requested and, when received, will be added to the account to maintain full collateralization. In the event of default on the obligation to repurchase, the Portfolio has the right to liquidate the collateral and apply the proceeds in satisfaction of the obligation. In the event of default or bankruptcy by the counterparty to the agreement, realization of the collateral proceeds may be subject to cost and delays. The Portfolio, along with other affiliated investment companies, may utilize a
joint trading account for the purpose of entering into repurchase agreements.
4. Foreign Currency Translation and Foreign Investments: The books and records of the Portfolio are maintained in U.S. dollars. Foreign currency amounts are translated into U.S. dollars as follows:
– investments, other assets and liabilities at the prevailing rate of exchange on the valuation date;
– investment transactions and investment income at the prevailing rates of exchange on the dates of such transactions.
Although the net assets of the Portfolio are presented at the foreign exchange rates and market values at the close of the period, the Portfolio does not isolate that portion of the results of operations arising as a result of changes in the foreign exchange rates from the fluctuations arising from changes in the market prices of securities held at period end. Similarly, the Portfolio does not isolate the effect of changes in foreign exchange rates from the fluctuations arising from changes in the market prices of securities sold during the period. Accordingly, realized and unrealized foreign currency gains (losses) on investments in securities are included in the reported net realized and unrealized gains (losses) on investment transactions and balances. However, pursuant to U.S. Federal income tax regulations, gains and losses from certain foreign currency transactions and the foreign currency portion of gains and losses realized on sales and maturities of foreign denominated debt securities are treated as ordinary income for U.S. Federal income tax purposes.
Net realized gains (losses) on foreign currency transactions represent net foreign exchange gains (losses) from foreign currency forward exchange contracts, disposition of foreign currencies, currency gains (losses) realized between the trade and settlement dates on securities transactions, and the difference between the amount of investment income and foreign withholding taxes recorded on the Portfolio's books and the U.S. dollar equivalent amounts actually received or paid. Net unrealized currency gains (losses) from valuing foreign currency denominated assets and liabilities at period end exchange rates are reflected as a component of unrealized appreciation (depreciation) in the Statement of Assets and Liabilities. The change in unrealized currency
19
Morgan Stanley Institutional Fund, Inc.
Annual Report — December 31, 2015
Notes to Financial Statements (cont'd)
gains (losses) on foreign currency translations for the period is reflected in the Statement of Operations.
Foreign security and currency transactions may involve certain considerations and risks not typically associated with those of U.S. dollar denominated transactions as a result of, among other factors, fluctuations of exchange rates in relation to the U.S. dollar, the possibility of lower levels of governmental supervision and regulation of foreign securities markets and the possibility of political or economic instability.
Governmental approval for foreign investments may be required in advance of making an investment under certain circumstances in some countries, and the extent of foreign investments in domestic companies may be subject to limitation in other countries. Foreign ownership limitations also may be imposed by the charters of individual companies to prevent, among other concerns, violations of foreign investment limitations. As a result, an additional class of shares (identified as "Foreign" in the Portfolio of Investments) may be created and offered for investment. The "local" and "foreign shares" market values may differ. In the absence of trading of the foreign shares in such markets, the Portfolio values the foreign shares at the closing exchange price of the local shares.
5. Securities Lending: The Portfolio lends securities to qualified financial institutions, such as broker-dealers, to earn additional income. Any increase or decrease in the fair value of the securities loaned that might occur and any interest earned or dividends declared on those securities during the term of the loan would remain in the Portfolio. The Portfolio would receive cash or securities as collateral in an amount equal to or exceeding 100% of the current fair value of the loaned securities. The collateral is marked-to-market daily by State Street Bank and Trust Company ("State Street"), the securities lending agent, to ensure that a minimum of 100% collateral coverage is maintained.
Based on pre-established guidelines, the securities lending agent invests any cash collateral that is received in an
affiliated money market portfolio and repurchase agreements. Securities lending income is generated from the earnings on the invested collateral and borrowing fees, less any rebates owed to the borrowers and compensation to the lending agent, and is recorded as "Income from Securities Loaned-Net" in the Portfolio's Statement of Operations. Risks in securities lending transactions are that a borrower may not provide additional collateral when required or return the securities when due, and that the value of the short-term investments will be less than the amount of cash collateral plus any rebate that is required to be returned to the borrower.
The Portfolio has the right under the lending agreement to recover the securities from the borrower on demand.
The following table presents financial instruments that are subject to enforceable netting arrangements as of December 31, 2015.
Gross Amounts Not Offset in the Statement of Assets and Liabilities | |||||||||||||||
| Gross Asset Amounts Presented in Statement of Assets and Liabilities (000) | Financial Instrument (000) | Collateral Received (000) | Net Amount (not less than $0) (000) | ||||||||||||
| $ | 32 | (a) | $ | — | $ | 32 | (b)(c) | $ | 0 | ||||||
(a) Represents market value of loaned securities at period end.
(b) The Portfolio received cash collateral of approximately $33,000, which was subsequently invested in Repurchase Agreements and Morgan Stanley Institutional Liquidity Funds as reported in the Portfolio of Investments.
(c) The actual collateral received is greater than the amount shown here due to overcollateralization.
The Portfolio has adopted the disclosure provisions of FASB Accounting Standards Update No. 2014-11 ("ASU No. 2014-11"), "Transfers & Servicing (Topic 860): Repurchase-to-Maturity Transactions, Repurchase Financings, and Disclosures". ASU No. 2014-11 is intended to provide increased transparency about the types of collateral pledged in securities lending transactions and other similar transactions that are accounted for as secured borrowing.
20
Morgan Stanley Institutional Fund, Inc.
Annual Report — December 31, 2015
Notes to Financial Statements (cont'd)
The following table displays a breakdown of transactions accounted for as secured borrowings, the gross obligations by class of collateral pledged, and the remaining contractual maturity of those transactions as of December 31, 2015.
Remaining Contractual Maturity of the Agreements As of December 31, 2015 | |||||||||||||||||||||||
| Overnight and Continuous (000) | <30 days (000) | Between 30 & 90 days (000) | >90 days (000) | Total (000) | |||||||||||||||||||
Securities Lending Transactions | |||||||||||||||||||||||
Common Stocks | $ | 33 | $ | — | $ | — | $ | — | $ | 33 | |||||||||||||
Total Borrowings | $ | 33 | $ | — | $ | — | $ | — | $ | 33 | |||||||||||||
Gross amount of recognized liabilities for securities lending transactions | $ | 33 | |||||||||||||||||||||
6. Indemnifications: The Fund enters into contracts that contain a variety of indemnifications. The Fund's maximum exposure under these arrangements is unknown. However, the Fund has not had prior claims or losses pursuant to these contracts and expects the risk of loss to be remote.
7. Dividends and Distributions to Shareholders: Dividend income and distributions to shareholders are recorded on the ex-dividend date. Dividends from net investment income, if any, are declared and paid annually. Net realized capital gains, if any, are distributed at least annually.
8. Security Transactions, Income and Expenses: Security transactions are accounted for on the trade date (date the order to buy or sell is executed). Realized gains and losses on the sale of investment securities are determined on the specific identified cost method. Dividend income and other distributions are recorded on the ex-dividend date (except for certain foreign dividends which may be recorded as soon as the Portfolio is informed of such dividends) net of applicable withholding taxes. Interest income is recognized on the accrual basis except where collection is in doubt. Discounts are accreted and premiums are amortized over the life of the respective securities. Most expenses of the Fund can be directly attributed to a particular Portfolio. Expenses which cannot be directly attributed are apportioned among the Portfolios based upon relative net assets or other appropriate methods. Income, expenses (other than class specific expenses — distribution and shareholder services, transfer agency and sub transfer agency fees) and realized and unrealized gains or losses are allocated to each class of shares based upon their relative net assets.
B. Advisory Fees: The Adviser, a wholly-owned subsidiary of Morgan Stanley, provides the Portfolio with advisory services under the terms of an Investment Advisory Agreement,
paid quarterly, at the annual rate based on the daily net assets as follows:
| First $750 million | Next $750 million | Over $1.5 billion | |||||||||
0.80 | % | 0.75 | % | 0.70 | % | ||||||
For the year ended December 31, 2015, the advisory fee rate (net of waivers/rebate) was equivalent to an annual effective rate of 0.00% of the Portfolio's average daily net assets.
The Adviser has agreed to reduce its advisory fee and/or reimburse the Portfolio so that total annual portfolio operating expenses, excluding certain investment related expenses, taxes, interest and other extraordinary expenses (including litigation), will not exceed 1.05% for Class I shares, 1.40% for Class A shares, 1.90% for Class L shares and 2.15% for Class C shares. The fee waivers and/or expense reimbursements will continue for at least one year from the date of the Portfolio's prospectus or until such time as the Directors act to discontinue all or a portion of such waivers and/or reimbursements when they deem such action is appropriate. For the year ended December 31, 2015, approximately $21,000 of advisory fees were waived and approximately $150,000 of other expenses were reimbursed by the Adviser pursuant to this arrangement.
C. Administration Fees: The Adviser also serves as Administrator to the Fund and provides administrative services pursuant to an Administration Agreement for an annual fee, accrued daily and paid monthly, of 0.08% of the Portfolio's average daily net assets.
Under a Sub-Administration Agreement between the Administrator and State Street, State Street provides certain administrative services to the Fund. For such services, the Administrator pays State Street a portion of the fee the Administrator receives from the Portfolio.
D. Distribution and Shareholder Services Fees: Morgan Stanley Distribution, Inc. ("MSDI" or the "Distributor"), a wholly-owned subsidiary of the Adviser and an indirect subsidiary of Morgan Stanley, serves as the Fund's Distributor
21
Morgan Stanley Institutional Fund, Inc.
Annual Report — December 31, 2015
Notes to Financial Statements (cont'd)
of Portfolio shares pursuant to a Distribution Agreement. The Fund has adopted a Shareholder Services Plan with respect to Class A shares pursuant to Rule 12b-1 under the Act. Under the Shareholder Services Plan, the Portfolio pays the Distributor a shareholder services fee, accrued daily and paid monthly, at an annual rate of 0.25% of the Portfolio's average daily net assets attributable to Class A shares.
The Fund has adopted a Distribution and Shareholder Services Plan with respect to Class L shares pursuant to Rule 12b-1 under the Act. Under the Distribution and Shareholder Services Plan, the Portfolio pays the Distributor a distribution fee, accrued daily and paid monthly, at an annual rate of 0.50% and a shareholder services fee, accrued daily and paid monthly, at an annual rate of 0.25% of the Portfolio's average daily net assets attributable to Class L shares.
The Fund has adopted a Distribution and Shareholder Services Plan with respect to Class C shares pursuant to Rule 12b-1 under the Act. Under the Distribution and Shareholder Services Plan, the Portfolio pays the Distributor a distribution fee, accrued daily and paid monthly, at an annual rate of 0.75% and a shareholder services fee, accrued daily and paid monthly, at an annual rate of 0.25% of the Portfolio's average daily net assets attributable to Class C shares.
The distribution and shareholder services fees are used to support the expenses associated with servicing and maintaining accounts. The Distributor may compensate other parties for providing shareholder support services to investors who purchase Class A, Class L and Class C shares.
E. Dividend Disbursing and Transfer Agent: The Fund's dividend disbursing and transfer agent is Boston Financial Data Services, Inc. ("BFDS"). Pursuant to a Transfer Agency Agreement, the Fund pays BFDS a fee based on the number of classes, accounts and transactions relating to the Portfolios of the Fund.
F. Custodian Fees: State Street (the "Custodian") serves as Custodian for the Fund in accordance with a Custodian Agreement. The Custodian holds cash, securities, and other assets of the Fund as required by the Act. Custody fees are payable monthly based on assets held in custody, investment purchases and sales activity and account maintenance fees, plus reimbursement for certain out-of-pocket expenses.
G. Security Transactions and Transactions with Affiliates: For the year ended December 31, 2015, purchases and sales of investment securities for the Portfolio, other than
long-term U.S. Government securities and short-term investments, were approximately $2,021,000 and $1,273,000, respectively. There were no purchases and sales of long-term U.S. Government securities for the year ended December 31, 2015.
The Portfolio invests in the Institutional Class of the Morgan Stanley Institutional Liquidity Funds (the "Liquidity Funds"), an open-end management investment company managed by the Adviser, both directly and as a portion of the securities held as collateral on loaned securities. Advisory fees paid by the Portfolio are reduced by an amount equal to its pro-rata share of the advisory and administration fees paid by the Portfolio due to its investment in the Liquidity Funds. For the year ended December 31, 2015, advisory fees paid were reduced by less than $500 relating to the Portfolio's investment in the Liquidity Funds.
A summary of the Portfolio's transactions in shares of the Liquidity Funds during the year ended December 31, 2015 is as follows:
| Value December 31, 2014 (000) | Purchases at Cost (000) | Sales (000) | Dividend Income (000) | Value December 31, 2015 (000) | |||||||||||||||
| $ | 206 | $ | 1,257 | $ | 1,409 | $ | — | @ | $ | 54 | |||||||||
@ Amount is less than $500.
The Portfolio has an unfunded Deferred Compensation Plan (the "Compensation Plan"), which allows each independent Director to defer payment of all, or a portion, of the fees he or she receives for serving on the Board of Directors. Each eligible Director generally may elect to have the deferred amounts credited with a return equal to the total return on one or more of the Morgan Stanley funds that are offered as investment options under the Compensation Plan. Appreciation/depreciation and distributions received from these investments are recorded with an offsetting increase/decrease in the deferred compensation obligation and do not affect the NAV of the Portfolio.
H. Federal Income Taxes: It is the Portfolio's intention to continue to qualify as a regulated investment company and distribute all of its taxable and tax-exempt income. Accordingly, no provision for Federal income taxes is required in the financial statements.
The Portfolio may be subject to taxes imposed by countries in which it invests. Such taxes are generally based on income and/or capital gains earned or repatriated. Taxes are accrued based on net investment income, net realized gains and net unrealized appreciation as such income and/or gains are earned. Taxes may also be based on transactions in foreign currency
22
Morgan Stanley Institutional Fund, Inc.
Annual Report — December 31, 2015
Notes to Financial Statements (cont'd)
and are accrued based on the value of investments denominated in such currency.
FASB ASC 740-10, "Income Taxes — Overall", sets forth a minimum threshold for financial statement recognition of the benefit of a tax position taken or expected to be taken in a tax return. Management has concluded there are no significant uncertain tax positions that would require recognition in the financial statements. If applicable, the Portfolio recognizes interest accrued related to unrecognized tax benefits in "Interest Expense" and penalties in "Other Expenses" in the Statement of Operations. The Portfolio files tax returns with the U.S. Internal Revenue Service, New York and various states. Generally, each of the tax years in the four-year period ended December 31, 2015, remains subject to examination by taxing authorities.
The tax character of distributions paid may differ from the character of distributions shown in the Statements of Changes in Net Assets due to short-term capital gains being treated as ordinary income for tax purposes. The tax character of distributions paid during fiscal 2015 and 2014 was as follows:
| 2015 Distributions Paid From: | 2014 Distributions Paid From: | ||||||||||||||
| Ordinary Income (000) | Long-Term Capital Gain (000) | Ordinary Income (000) | Long-Term Capital Gain (000) | ||||||||||||
| $ | 127 | $ | 223 | $ | 82 | $ | 301 | ||||||||
The amount and character of income and gains to be distributed are determined in accordance with income tax regulations which may differ from GAAP. These book/tax differences are either considered temporary or permanent in nature.
Temporary differences are primarily due to differing book and tax treatments in the timing of the recognition of gains (losses) on certain investment transactions and the timing of the deductibility of certain expenses.
Permanent differences, primarily due to differing treatments of gains (losses) related to foreign currency transactions, resulted in the following reclassifications among the components of net assets at December 31, 2015:
| Accumulated Undistributed Net Investment Income (000) | Accumulated Net Realized Gain (000) | Paid-in- Capital (000) | |||||||||
| $ | (— | @) | $ | — | @ | $ | — | ||||
At December 31, 2015, the components of distributable earnings for the Portfolio on a tax basis were as follows:
| Undistributed Ordinary Income (000) | Undistributed Long-Term Capital Gain (000) | ||||||
| $ | 3 | $ | 5 | ||||
@ Amount is less than $500
I. Other: At December 31, 2015, the Portfolio had record owners of 10% or greater. Investment activities of these shareholders could have a material impact on the Portfolio. The aggregate percentage of such owners was 72.9%.
23
Morgan Stanley Institutional Fund, Inc.
Annual Report — December 31, 2015
Report of Independent Registered Public Accounting Firm
To the Shareholders and Board of Directors of
Morgan Stanley Institutional Fund, Inc. —
Insight Portfolio
We have audited the accompanying statement of assets and liabilities, including the portfolio of investments, of Insight Portfolio (one of the portfolios constituting Morgan Stanley Institutional Fund, Inc.) (the "Portfolio") as of December 31, 2015, and the related statement of operations for the year then ended, the statements of changes in net assets for each of the two years in the period then ended and the financial highlights for each of the years or periods indicated therein. These financial statements and financial highlights are the responsibility of the Portfolio's management. Our responsibility is to express an opinion on these financial statements and financial highlights based on our audits.
We conducted our audits in accordance with the standards of the Public Company Accounting Oversight Board (United States). Those standards require that we plan and perform the audit to obtain reasonable assurance about whether the financial statements and financial highlights are free of material misstatement. We were not engaged to perform an audit of the Portfolio's internal control over financial reporting. Our audits included consideration of internal control over financial reporting as a basis for designing audit procedures that are appropriate in the circumstances, but not for the purpose of expressing an opinion on the effectiveness of the Portfolio's internal control over financial reporting. Accordingly, we express no such opinion. An audit also includes examining, on a test basis, evidence supporting the amounts and disclosures in the financial statements and financial highlights, assessing the accounting principles used and significant estimates made by management, and evaluating the overall financial statement presentation. Our procedures included confirmation of securities owned as of December 31, 2015, by correspondence with the custodian and others. We believe that our audits provide a reasonable basis for our opinion.
In our opinion, the financial statements and financial highlights referred to above present fairly, in all material respects, the financial position of Insight Portfolio (one of the portfolios constituting Morgan Stanley Institutional Fund, Inc.) at December 31, 2015, the results of its operations for the year then ended, the changes in its net assets for each of the two years in the period then ended and the financial highlights for each of the years or periods indicated therein, in conformity with U.S. generally accepted accounting principles.

Boston, Massachusetts
February 26, 2016
24
Morgan Stanley Institutional Fund, Inc.
Annual Report — December 31, 2015
Federal Tax Notice (unaudited)
For Federal income tax purposes, the following information is furnished with respect to the distributions paid by the Portfolio during its taxable year ended December 31, 2015. For corporate shareholders, 22.2% of the dividends qualified for the dividends received deduction.
The Portfolio designated and paid approximately $223,000 as a long-term capital gain distribution.
For Federal income tax purposes, the following information is furnished with respect to the Portfolio's earnings for its taxable year ended December 31, 2015. When distributed, certain earnings may be subject to a maximum tax rate of 15% as provided for the Jobs and Growth Tax Relief Reconciliation Act of 2003. The Portfolio designated up to a maximum of approximately $38,000 as taxable at this lower rate.
In January, the Portfolio provides tax information to shareholders for the preceding calendar year.
25
Morgan Stanley Institutional Fund, Inc.
Annual Report — December 31, 2015
U.S. Privacy Policy (unaudited)
AN IMPORTANT NOTICE CONCERNING OUR U.S. PRIVACY POLICY
This privacy notice describes the U.S. privacy policy of Morgan Stanley Distribution, Inc., and the Morgan Stanley family of mutual funds ("us", "our", "we").
We are required by federal law to provide you with notice of our U.S. privacy policy ("Policy"). This Policy applies to both our current and former clients unless we state otherwise and is intended for individual clients who purchase products or receive services from us for personal, family or household purposes. This Policy is not applicable to partnerships, corporations, trusts or other non-individual clients or account holders, nor is this Policy applicable to individuals who are either beneficiaries of a trust for which we serve as trustee or participants in an employee benefit plan administered or advised by us. This Policy is, however, applicable to individuals who select us to be a custodian of securities or assets in individual retirement accounts, 401(k) accounts, or accounts subject to the Uniform Gifts to Minors Act.
This notice sets out our business practices to protect your privacy; how we collect and share personal information about you; and how you can limit our sharing or certain uses by others of this information. We may amend this Policy at any time, and will inform you of any changes to our Policy as required by law.
WE RESPECT YOUR PRIVACY
We appreciate that you have provided us with your personal financial information and understand your concerns about your information. We strive to safeguard the information our clients entrust to us. Protecting the confidentiality and security of client information is an important part of how we conduct our business.
This notice describes what personal information we collect about you, how we collect it, when we may share it with others, and how certain others may use it. It discusses the steps you may take to limit our sharing of certain information about you with our affiliated companies, including, but not limited to our affiliated banking businesses, brokerage firms and credit service affiliates. It also discloses how you may limit our affiliates' use of shared information for marketing purposes.
Throughout this Policy, we refer to the nonpublic information that personally identifies you as "personal information." We also use the term "affiliated company" in this notice. An affiliated company is a company in our family of companies and includes companies with the Morgan Stanley name. These affiliated companies are financial institutions such as broker-dealers, banks, investment advisers and credit card issuers. We refer to any company that is not an affiliated company as a nonaffiliated third party For purposes of Section 5 of this notice, and your ability to limit certain uses of personal information by our affiliates, this notice applies to the use of personal information by our affiliated companies.
1. WHAT PERSONAL INFORMATION DO WE COLLECT FROM YOU?
We may collect the following types of information about you: (i) information provided by you, including information from applications and other forms we receive from you, (ii) information about your transactions with us or our affiliates, (iii) information about your transactions with nonaffiliated third parties, (iv) information from consumer reporting agencies, (v) information obtained from our websites, and (vi) information obtained from other sources. For example:
• We collect information such as your name, address, e-mail address, telephone/fax numbers, assets, income and investment objectives through applications and other forms you submit to us.
• We may obtain information about account balances, your use of account(s) and the types of products and services you prefer to receive from us through your dealings and transactions with us and other sources.
• We may obtain information about your creditworthiness and credit history from consumer reporting agencies.
• We may collect background information from and through third-party vendors to verify representations you have made and to comply with various regulatory requirements.
2. WHEN DO WE DISCLOSE PERSONAL INFORMATION WE COLLECT ABOUT YOU?
We may disclose personal information we collect about you in each of the categories listed above to affiliated and nonaffiliated third parties.
26
Morgan Stanley Institutional Fund, Inc.
Annual Report — December 31, 2015
U.S. Privacy Policy (unaudited) (cont'd)
a. Information We Disclose to Affiliated Companies.
We may disclose personal information that we collect about you to our affiliated companies to manage your account(s) effectively, to service and process your transactions, and to let you know about products and services offered by us and affiliated companies, to manage our business, and as otherwise required or permitted by law. Offers for products and services from affiliated companies are developed under conditions designed to safeguard your personal information.
b. Information We Disclose to Third Parties.
We may disclose personal information that we collect about you to nonaffiliated third parties to provide marketing services on our behalf or to other financial institutions with whom we have joint marketing agreements. We may also disclose all of the information we collect to other nonaffiliated third parties for our everyday business purposes, such as to process transactions, maintain account(s), respond to court orders and legal investigations, report to credit bureaus, offer our own products and services, protect against fraud, for institutional risk control, to perform services on our behalf, and as otherwise required or permitted by law.
When we share personal information about you with a nonaffiliated third party, they are required to limit their use of personal information about you to the particular purpose for which it was shared and they are not allowed to share personal information about you with others except to fulfill that limited purpose or as may be permitted or required by law.
3. HOW DO WE PROTECT THE SECURITY AND CONFIDENTIALITY OF PERSONAL INFORMATION WE COLLECT ABOUT YOU?
We maintain physical, electronic and procedural security measures that comply with applicable law and regulations to help safeguard the personal information we collect about you. We have internal policies governing the proper handling of client information by employees. Third parties that provide support or marketing services on our behalf may also receive personal information about you, and we require them to adhere to appropriate security standards with respect to such information.
4. HOW CAN YOU LIMIT OUR SHARING CERTAIN PERSONAL INFORMATION ABOUT YOU WITH OUR AFFILIATED COMPANIES FOR ELIGIBILITY DETERMINATION?
By following the opt-out procedures in Section 6 below, you may limit the extent to which we share with our affiliated companies, personal information that was collected to determine your eligibility for products and services such as your credit reports and other information that you have provided to us or that we may obtain from third parties ("eligibility information"). Eligibility information does not include your identification information or personal information pertaining to our transactions or experiences with you. Please note that, even if you direct us not to share eligibility information with our affiliated companies, we may still share your personal information, including eligibility information, with our affiliated companies under circumstances that are permitted under applicable law, such as to process transactions or to service your account.
5. HOW CAN YOU LIMIT THE USE OF CERTAIN PERSONAL INFORMATION ABOUT YOU BY OUR AFFILIATED COMPANIES FOR MARKETING?
By following the opt-out instructions in Section 6 below, you may limit our affiliated companies from marketing their products or services to you based on personal information we disclose to them. This information may include, for example, your income and account history with us. Please note that, even if you choose to limit our affiliated companies from using personal information about you that we may share with them for marketing their products and services to you, our affiliated companies may use your personal information that they obtain from us to market to you in circumstances permitted by law, such as if the affiliated party has its own relationship with you.
27
Morgan Stanley Institutional Fund, Inc.
Annual Report — December 31, 2015
U.S. Privacy Policy (unaudited) (cont'd)
6. HOW CAN YOU SEND US AN OPT-OUT INSTRUCTION?
If you wish to limit our sharing of eligibility information about you with our affiliated companies, or our affiliated companies' use of personal information for marketing purposes, as described in this notice, you may do so by:
• Calling us at (800) 548-7786
Monday–Friday between 8a.m. and 6p.m. (EST)
• Writing to us at the following address:
Boston Financial Data Services, Inc.
c/o Privacy Coordinator
P.O. Box 219804
Kansas City, Missouri 64121
If you choose to write to us, your request should include: your name, address, telephone number and account number(s) to which the opt-out applies and whether you are opting out with respect to sharing of eligibility information (Section 4 above), or information used for marketing (Section 5 above), or both. Written opt-out requests should not be sent with any other correspondence. In order to process your request, we require that the request be provided by you directly and not through a third party. Once you have informed us about your privacy preferences, your opt-out preference will remain in effect with respect to this Policy (as it may be amended) until you notify us otherwise. If you are a joint account owner, we will accept instructions from any one of you and apply those instructions to the entire account.
Please understand that if you limit our sharing or our affiliated companies' use of personal information, you and any joint account holder(s) may not receive information about our affiliated companies' products and services, including products or services that could help you manage your financial resources and achieve your investment objectives.
If you have more than one account or relationship with us, please specify the accounts to which you would like us to apply your privacy choices. If you have accounts or relationships with our affiliates, you may receive multiple privacy policies from them, and will need to separately notify those companies of your privacy choices for those accounts or relationships.
7. WHAT IF AN AFFILIATED COMPANY BECOMES A NONAFFILIATED THIRD PARTY?
If, at any time in the future, an affiliated company becomes a nonaffiliated third party, further disclosures of personal information made to the former affiliated company will be limited to those described in Section 2(b) above relating to nonaffiliated third parties. If you elected under Section 6 to limit disclosures we make to affiliated companies, or use of personal information by affiliated companies, your election will not apply to use by any former affiliated company of your personal information in their possession once it becomes a nonaffiliated third party.
SPECIAL NOTICE TO RESIDENTS OF VERMONT
The following section supplements our Policy with respect to our individual clients who have a Vermont address and supersedes anything to the contrary in the above Policy with respect to those clients only.
The State of Vermont requires financial institutions to obtain your consent prior to sharing personal information that they collect about you with nonaffiliated third parties, or eligibility information with affiliated companies, other than in certain limited circumstances. Except as permitted by law, we will not share personal information we collect about you with nonaffiliated third parties or eligibility information with affiliated companies, unless you provide us with your written consent to share such information.
SPECIAL NOTICE TO RESIDENTS OF CALIFORNIA
The following section supplements our Policy with respect to our individual clients who have a California address and supersedes anything to the contrary in the above Policy with respect to those clients only.
In response to a California law, if your account has a California home address, your personal information will not be disclosed to nonaffiliated third parties except as permitted by applicable California law, and we will limit sharing such personal information with our affiliates to comply with California privacy laws that apply to us.
28
Morgan Stanley Institutional Fund, Inc.
Annual Report — December 31, 2015
Director and Officer Information (unaudited)
Independent Directors:
| Name, Age and Address of Independent Director | Positions(s) Held with Registrant | Length of Time Served* | Principal Occupation(s) During Past 5 Years and Other Relevant Professional Experience | Number of Portfolios in Fund Complex Overseen by Director** | Other Directorships Held by Independent Director*** | ||||||||||||||||||
| Frank L. Bowman (71) c/o Kramer Levin Naftalis & Frankel LLP Counsel to the Independent Directors 1177 Avenue of the Americas New York, NY 10036 | Director | Since August 2006 | President, Strategic Decisions, LLC (consulting) (since February 2009); Director or Trustee of various Morgan Stanley Funds (since August 2006); Chairperson of the Compliance and Insurance Committee (since October 2015); Formerly, Chairperson of the Insurance Sub-Committee of the Compliance and Insurance Committee (February 2007-December 2015); served as President and Chief Executive Officer of the Nuclear Energy Institute (policy organization) (February 2005-November 2008); retired as Admiral, U.S. Navy after serving over 38 years on active duty including 8 years as Director of the Naval Nuclear Propulsion Program in the Department of the Navy and the U.S. Department of Energy (1996-2004); served as Chief of Naval Personnel (July 1994-September 1996); and on the Joint Staff as Director of Political Military Affairs (June 1992-July1994); knighted as Honorary Knight Commander of the Most Excellent Order of the British Empire; awarded the Officier de l'Orde National du Mérite by the French Government; elected to the National Academy of Engineering (2009). | 98 | Director of BP p.l.c.; Director of Naval and Nuclear Technologies LLP; Director Emeritus of the Armed Services YMCA; Director of the U.S. Naval Submarine League; Member of the National Security Advisory Council of the Center for U.S. Global Engagement and a member of the CNA Military Advisory Board; Chairman of the Charity, J Street Cup Golf, Trustee of Fairhaven United Methodist Church; and Director of other various non-profit organizations. | ||||||||||||||||||
| Kathleen A. Dennis (62) c/o Kramer Levin Naftalis & Frankel LLP Counsel to the Independent Directors 1177 Avenue of the Americas New York, NY 10036 | Director | Since August 2006 | President, Cedarwood Associates (mutual fund and investment management consulting) (since July 2006); Chairperson of the Money Market and Alternatives Sub-Committee of the Investment Committee (since October 2006) and Director or Trustee of various Morgan Stanley Funds (since August 2006); formerly, Senior Managing Director of Victory Capital Management (1993-2006). | 98 | Director of various nonprofit organizations. | ||||||||||||||||||
| Nancy C. Everett (61) c/o Kramer Levin Naftalis & Frankel LLP Counsel to the Independent Directors 1177 Avenue of the Americas New York, NY 10036 | Director | Since January 2015 | Chief Executive Officer, Virginia Commonwealth University Investment Company (since November 2015); Owner, OBIR, LLC (investment management consulting) (since June 2014); formerly, Managing Director, BlackRock Inc. (February 2011-December 2013); and Chief Executive Officer, General Motors Asset Management (a/k/a Promark Global Advisors, Inc.) (June 2005-May 2010). | 98 | Member of Virginia Commonwealth University School of Business Foundation; formerly, Member of Virginia Commonwealth University Board of Visitors (2013-2015); Member of Committee on Directors for Emerging Markets Growth Fund, Inc. (2007-2010); Chairperson of Performance Equity Management, LLC (2006-2010); and Chairperson, GMAM Absolute Return Strategies Fund, LLC (2006-2010). | ||||||||||||||||||
29
Morgan Stanley Institutional Fund, Inc.
Annual Report — December 31, 2015
Director and Officer Information (unaudited) (cont'd)
Independent Directors: (cont'd)
| Name, Age and Address of Independent Director | Positions(s) Held with Registrant | Length of Time Served* | Principal Occupation(s) During Past 5 Years and Other Relevant Professional Experience | Number of Portfolios in Fund Complex Overseen by Director** | Other Directorships Held by Independent Director*** | ||||||||||||||||||
| Jakki L. Haussler (58) c/o Kramer Levin Naftalis & Frankel LLP Counsel to the Independent Directors 1177 Avenue of the Americas New York, NY 10036 | Director | Since January 2015 | Chairman and Chief Executive Officer, Opus Capital Group (since January 1996); and formerly, Director, Capvest Venture Fund, LP (May 2000-December 2011); Partner, Adena Ventures, LP (July 1999-December 2010); Director, The Victory Funds (February 2005-July 2008). | 98 | Director of Cincinnati Bell Inc. and Member, Audit Committee and Compensation Committee; Director of Northern Kentucky University Foundation and Member, Investment Committee; Member of Chase College of Law Transactional Law Practice Center Board of Advisors; Director of Best Transport; Chase College of Law Board of Visitors; formerly Member, University of Cincinnati Foundation Investment Committee; Member, Miami University Board of Visitors (2008-2011); Trustee of Victory Funds (2005-2008) and Chairman, Investment Committee (2007-2008) and Member, Service Provider Committee (2005-2008). | ||||||||||||||||||
| Dr. Manuel H. Johnson (67) c/o Johnson Smick International, Inc. 220 I Street, N.E. — Suite 200 Washington, D.C. 20002 | Director | Since July 1991 | Senior Partner, Johnson Smick International, Inc. (consulting firm); Chairperson of the Investment Committee (since October 2006) and Director or Trustee of various Morgan Stanley Funds (since July 1991); Co-Chairman and a founder of the Group of Seven Council (G7C) (international economic commission); formerly Chairperson of the Audit Committee (July 1991-September 2006), Vice Chairman of the Board of Governors of the Federal Reserve System and Assistant Secretary of the U.S. Treasury. | 100 | Director of NVR, Inc. (home construction). | ||||||||||||||||||
| Joseph J. Kearns (73) c/o Kearns & Associates LLC 23823 Malibu Road S-50-440 Malibu, CA 90265 | Director | Since August 1994 | President, Kearns & Associates LLC (investment consulting); Chairperson of the Audit Committee (since October 2006) and Director or Trustee of various Morgan Stanley Funds (since August 1994); formerly, Deputy Chairperson of the Audit Committee (July 2003-September 2006) and Chairperson of the Audit Committee of various Morgan Stanley Funds (since August 1994); CFO of the J. Paul Getty Trust. | 101 | Director of Electro Rent Corporation (equipment leasing). Prior to December 31, 2013, Director of The Ford Family Foundation. | ||||||||||||||||||
30
Morgan Stanley Institutional Fund, Inc.
Annual Report — December 31, 2015
Director and Officer Information (unaudited) (cont'd)
Independent Directors: (cont'd)
| Name, Age and Address of Independent Director | Positions(s) Held with Registrant | Length of Time Served* | Principal Occupation(s) During Past 5 Years and Other Relevant Professional Experience | Number of Portfolios in Fund Complex Overseen by Director** | Other Directorships Held by Independent Director*** | ||||||||||||||||||
| Michael F. Klein (57) c/o Kramer Levin Naftalis & Frankel LLP Counsel to the Independent Directors 1177 Avenue of the Americas New York, NY 10036 | Director | Since August 2006 | Managing Director, Aetos Capital, LLC (since March 2000); Co-President, Aetos Alternatives Management, LLC (since January 2004); and Co-Chief Executive Officer of Aetos Capital LLC (since August 2013); Chairperson of the Fixed Income Sub-Committee of the Investment Committee (since October 2006) and Director or Trustee of various Morgan Stanley Funds (since August 2006); formerly, Managing Director, Morgan Stanley & Co. Inc. and Morgan Stanley Dean Witter Investment Management, President, various Morgan Stanley Funds (June1998-March 2000) and Principal, Morgan Stanley & Co. Inc. and Morgan Stanley Dean Witter Investment Management (August 1997-December 1999). | 97 | Director of certain investment funds managed or sponsored by Aetos Capital, LLC. Director of Sanitized AG and Sanitized Marketing AG (specialty chemicals). | ||||||||||||||||||
| Michael E. Nugent (79) 522 Fifth Avenue New York, NY 10036 | Chair of the Board and Director | Chair of the Boards since July 2006 and Director since July 1991 | Chair of the Boards of various Morgan Stanley Funds (since July 2006); Chairperson of the Closed-End Fund Committee (since June 2012) and Director or Trustee of various Morgan Stanley Funds (since July 1991); formerly, Chairperson of the Insurance Committee (until July 2006), General Partner, TriumphCapital, L.P. (private investment partnership) (1988-2013). | 100 | None. | ||||||||||||||||||
| W. Allen Reed (68) c/o Kramer Levin Naftalis & Frankel LLP Counsel to the Independent Directors 1177 Avenue of the Americas New York, NY 10036 | Director | Since August 2006 | Chairperson of the Equity Sub-Committee of the Investment Committee (since October 2006) and Director or Trustee of various Morgan Stanley Funds (since August 2006); formerly, President and CEO of General Motors Asset Management; Chairman and Chief Executive Officer of the GM Trust Bank and Corporate Vice President of General Motors Corporation (August 1994-December 2005). | 98 | Director of Legg Mason, Inc.; formerly Director of the Auburn University Foundation (2010-2015). | ||||||||||||||||||
| Fergus Reid (83) c/o Joe Pietryka, Inc. 85 Charles Colman Blvd. Pawling, NY 12564 | Director | Since June 1992 | Chairman, Joe Pietryka, Inc.; Chairperson of the Governance Committee and Director or Trustee of various Morgan Stanley Funds (since June 1992). | 100 | Formerly, Trustee and Director of certain investment companies in the JP Morgan Fund Complex managed by JP Morgan Investment Management Inc. (1987-2012). | ||||||||||||||||||
31
Morgan Stanley Institutional Fund, Inc.
Annual Report — December 31, 2015
Director and Officer Information (unaudited) (cont'd)
Interested Director:
| Name, Age and Address of Interested Director | Positions(s) Held with Registrant | Length of Time Served* | Principal Occupation(s) During Past 5 Years | Number of Portfolios in Fund Complex Overseen by Interested Director** | Other Directorships Held by Interested Director*** | ||||||||||||||||||
| James F. Higgins (68) One New York Plaza, New York, NY 10004 | Director | Since June 2000 | Director or Trustee of various Morgan Stanley Funds (since June 2000); Senior Advisor of Morgan Stanley (since August 2000). | 99 | Formerly, Director of AXA Financial, Inc. and AXA Equitable Life Insurance Company (2002-2011) and Director of AXA MONY Life Insurance Company and AXA MONY Life Insurance Company of America (2004-2011). | ||||||||||||||||||
* This is the earliest date the Director began serving the Morgan Stanley Funds. Each Director serves an indefinite term, until his or her successor is elected.
** The Fund Complex includes (as of December 31, 2015) all open-end and closed-end funds (including all of their portfolios) advised by Morgan Stanley Investment Management Inc. (the "Adviser") and any funds that have an adviser that is an affiliated person of the Adviser (including, but not limited to, Morgan Stanley AIP GP LP).
*** This includes any directorships at public companies and registered investment companies held by the Director at any time during the past five years.
Executive Officers:
Name, Age and Address of Executive Officer | Position(s) Held with Registrant | Length of Time Served**** | Principal Occupation(s) During Past 5 Years | ||||||||||||
| John H. Gernon (52) 522 Fifth Avenue New York, NY 10036 | President and Principal Executive Officer | Since September 2013 | President and Principal Executive Officer of the Equity and Fixed Income Funds and the Morgan Stanley AIP Funds (since September 2013) and the Liquidity Funds and various money market funds (since May 2014) in the Fund Complex, Managing Director of the Adviser; Head of Product (since 2006). | ||||||||||||
| Stefanie V. Chang Yu (49) 522 Fifth Avenue New York, NY 10036 | Chief Compliance Officer | Since December 1997 | Managing Director of the Adviser and various entities affiliated with the Adviser; Chief Compliance Officer of various Morgan Stanley Funds and the Adviser (since January 2014); formerly, Vice President of various Morgan Stanley Funds (December 1997-January 2014). | ||||||||||||
| Joseph C. Benedetti (50) 522 Fifth Avenue New York, NY 10036 | Vice President | Since January 2014 | Managing Director of the Adviser and various entities affiliated with the Adviser; Vice President of various Morgan Stanley Funds (since January 2014); formerly, Assistant Secretary of various Morgan Stanley Funds (October 2004-January 2014). | ||||||||||||
| Francis J. Smith (50) 522 Fifth Avenue New York, NY 10036 | Treasurer and Principal Financial Officer | Treasurer since July 2003 and Principal Financial Officer since September 2002 | Executive Director of the Adviser and various entities affiliated with the Adviser; Treasurer (since July 2003) and Principal Financial Officer of various Morgan Stanley Funds (since September 2002). | ||||||||||||
| Mary E. Mullin (48) 522 Fifth Avenue New York, NY 10036 | Secretary | Since June 1999 | Executive Director of the Adviser; Secretary of various Morgan Stanley Funds (since June 1999). | ||||||||||||
**** This is the earliest date the officer began serving the Morgan Stanley Funds. Each officer serves a one-year term, until his or her successor is elected and has qualified.
32
Morgan Stanley Institutional Fund, Inc.
Annual Report — December 31, 2015
Adviser and Administrator
Morgan Stanley Investment Management Inc.
522 Fifth Avenue
New York, New York 10036
Distributor
Morgan Stanley Distribution, Inc.
522 Fifth Avenue
New York, New York 10036
Dividend Disbursing and Transfer Agent
Boston Financial Data Services, Inc.
2000 Crown Colony Drive
Quincy, Massachusetts 02169
Custodian
State Street Bank and Trust Company
One Lincoln Street
Boston, Massachusetts 02111
Legal Counsel
Dechert LLP
1095 Avenue of the Americas
New York, New York 10036
Counsel to the Independent Directors
Kramer Levin Naftalis & Frankel LLP
1177 Avenue of the Americas
New York, New York 10036
Independent Registered Public Accounting Firm
Ernst & Young LLP
200 Clarendon Street
Boston, Massachusetts 02116
Reporting to Shareholders
Each Morgan Stanley fund provides a complete schedule of portfolio holdings in its semi-annual and annual reports within 60 days of the end of the fund's second and fourth fiscal quarters. The semi-annual and annual reports are filed electronically with the Securities and Exchange Commission (SEC) on Form N-CSRS and Form N-CSR, respectively. Morgan Stanley also delivers the semi-annual and annual reports to fund shareholders and makes these reports available on its public website, www.morganstanley.com/im. Each Morgan Stanley fund also files a complete schedule of portfolio holdings with the SEC for the fund's first and third fiscal quarters on Form N-Q. Morgan Stanley does not deliver the reports for the first and third fiscal quarters to shareholders, nor are the reports posted to the Morgan Stanley public website. You may, however, obtain the Form N-Q filings (as well as the Form N-CSR and N-CSRS filings) by accessing the SEC's website, www.sec.gov. You may also review and copy them at the SEC's Public Reference Room in Washington, DC. Information on the operation of the SEC's Public Reference Room may be obtained by calling the SEC toll free at 1 (800) SEC-0330. You can also request copies of these materials, upon payment of a duplicating fee, by electronic request at the SEC's email address (publicinfo@sec.gov) or by writing the Public Reference Room of the SEC, Washington, DC 20549-0102.
Proxy Voting Policies and Procedures and Proxy Voting Record
You may obtain a copy of the Fund's Proxy Voting Policy and Procedures and information regarding how the Fund voted proxies relating to portfolio securities during the most recent twelve-month period ended June 30, without charge, upon request, by calling toll free 1 (800) 548-7786 or by visiting our website at www.morganstanley.com/im. This information is also available on the SEC's website at www.sec.gov.
This report is authorized for distribution only when preceded or accompanied by a prospectus of the Morgan Stanley Institutional Fund, Inc., which describes in detail each Portfolio's investment policies, risks, fees and expenses. Please read the prospectus carefully before you invest or send money. For additional information, including information regarding the investments comprising the Portfolio, please visit our website at www.morganstanley.com/im or call toll free 1 (800) 548-7786.
33
Printed in U.S.A.
This Report has been prepared for shareholders and may be distributed to others only if preceded or accompanied by a current prospectus.
Morgan Stanley Investment Management Inc.
522 Fifth Avenue
New York, New York 10036
© 2016 Morgan Stanley. Morgan Stanley Distribution, Inc.

IFIINSGTANN
1405338 EXP. 02.28.17
INVESTMENT MANAGEMENT

Morgan Stanley Institutional Fund, Inc.
Global Insight Portfolio
Annual Report
December 31, 2015

Morgan Stanley Institutional Fund, Inc.
Annual Report — December 31, 2015
Table of Contents
Shareholders' Letter | 2 | ||||||
Expense Example | 3 | ||||||
Investment Overview | 4 | ||||||
Portfolio of Investments | 6 | ||||||
Statement of Assets and Liabilities | 8 | ||||||
Statement of Operations | 10 | ||||||
Statements of Changes in Net Assets | 11 | ||||||
Financial Highlights | 13 | ||||||
Notes to Financial Statements | 17 | ||||||
Report of Independent Registered Public Accounting Firm | 24 | ||||||
Federal Tax Notice | 25 | ||||||
U.S. Privacy Policy | 26 | ||||||
Director and Officer Information | 29 | ||||||
This report is authorized for distribution only when preceded or accompanied by prospectuses of the Morgan Stanley Institutional Fund, Inc. To receive a prospectus and/or statement of additional information (SAI), which contains more complete information such as investment objectives, charges, expenses, policies for voting proxies, risk considerations, and describes in detail each of the Portfolio's investment policies to the prospective investor, please call toll free 1 (800) 548-7786. Please read the prospectuses carefully before you invest or send money.
Additionally, you can access portfolio information including performance, characteristics, and investment team commentary through Morgan Stanley Investment Management's website: www.morganstanley.com/im.
Market forecasts provided in this report may not necessarily come to pass. There is no guarantee that any sectors mentioned will continue to perform as discussed herein or that securities in such sectors will be held by the Portfolio in the future. There is no assurance that a Portfolio will achieve its investment objective. Portfolios are subject to market risk, which is the possibility that market values of securities owned by the Portfolio will decline and, therefore, the value of the Portfolio's shares may be less than what you paid for them. Accordingly, you can lose money investing in this Portfolio. Please see the prospectus for more complete information on investment risks.
1
Morgan Stanley Institutional Fund, Inc.
Annual Report — December 31, 2015
Shareholders' Letter (unaudited)
Dear Shareholders,
We are pleased to provide this Annual report, in which you will learn how your investment in Global Insight Portfolio (the "Portfolio") performed during the latest twelve-month period.
Morgan Stanley Investment Management is a client-centric, investor-led organization. Our global presence, intellectual capital, and breadth of products and services enable us to partner with investors to meet the evolving challenges of today's financial markets. We aim to deliver superior investment service and to empower our clients to make the informed decisions that help them reach their investment goals.
As always, we thank you for selecting Morgan Stanley Investment Management, and look forward to working with you in the months and years ahead.
Sincerely,

John H. Gernon
President and Principal Executive Officer
January 2016
2
Morgan Stanley Institutional Fund, Inc.
Annual Report — December 31, 2015
Expense Example (unaudited)
Global Insight Portfolio
As a shareholder of the Portfolio, you incur two types of costs: (1) transactional costs; and (2) ongoing costs, including advisory fees, administration fees, distribution and shareholder services fees and other Portfolio expenses. This example is intended to help you understand your ongoing costs (in dollars) of investing in the Portfolio and to compare these costs with the ongoing costs of investing in other mutual funds.
This example is based on an investment of $1,000 invested at the beginning of the six-month period ended December 31, 2015 and held for the entire six-month period.
Actual Expenses
The table below provides information about actual account values and actual expenses. You may use the information in this table, together with the amount you invested, to estimate the expenses that you paid over the period. Simply divide your account value by $1,000 (for example, an $8,600 account value divided by $1,000 = 8.6), then multiply the result by the number in the table under the heading entitled "Actual Expenses Paid During Period" to estimate the expenses you paid on your account during this period.
Hypothetical Example for Comparison Purposes
The table below provides information about hypothetical account values and hypothetical expenses based on the Portfolio's actual expense ratio and an assumed rate of return of 5% per year before expenses, which is not the Portfolio's actual return. The hypothetical account values and expenses may not be used to estimate the actual ending account balance or expenses you paid for the period. You may use this information to compare the ongoing costs of investing in the Portfolio and other funds. To do so, compare this 5% hypothetical example with the 5% hypothetical examples that appear in the shareholder reports of the other funds.
Please note that the expenses shown in the table are meant to highlight your ongoing costs only and do not reflect any transactional costs, such as sales charges (loads). Therefore, the information for each class in the table is useful in comparing ongoing costs only, and will not help you determine the relative total costs of owning different funds. In addition, if these transactional costs were included, your costs would have been higher.
| Beginning Account Value 7/1/15 | Actual Ending Account Value 12/31/15 | Hypothetical Ending Account Value | Actual Expenses Paid During Period* | Hypothetical Expenses Paid During Period* | Net Expense Ratio During Period** | ||||||||||||||||||||||
Global Insight Portfolio Class I | $ | 1,000.00 | $ | 920.30 | $ | 1,018.40 | $ | 6.53 | $ | 6.87 | 1.35 | % | |||||||||||||||
Global Insight Portfolio Class A | 1,000.00 | 919.00 | 1,016.64 | 8.22 | 8.64 | 1.70 | |||||||||||||||||||||
Global Insight Portfolio Class L | 1,000.00 | 915.80 | 1,014.12 | 10.62 | 11.17 | 2.20 | |||||||||||||||||||||
Global Insight Portfolio Class C | 1,000.00 | 915.30 | 1,012.85 | 11.83 | 12.43 | 2.45 | |||||||||||||||||||||
* Expenses are calculated using each Portfolio Class' annualized net expense ratio (as disclosed), multiplied by the average account value over the period, and multiplied by 184/365 (to reflect the most recent one-half year period).
** Annualized.
3
Morgan Stanley Institutional Fund, Inc.
Annual Report — December 31, 2015
Investment Overview (unaudited)
Global Insight Portfolio
The Portfolio seeks long-term capital appreciation.
Performance
For the year ended December 31, 2015, the Portfolio's Class I shares had a total return based on net asset value and reinvestment of distributions per share of –5.02%, net of fees. The Portfolio's Class I shares underperformed the Portfolio's benchmark, the MSCI All Country World Index (the "Index"), which returned –2.36%.
Factors Affecting Performance
• Global equity markets were slightly down for the 12-month period. A backdrop of weak global economic growth, intensifying concerns about China's slowdown, shifting sentiment about central bank policies and a sustained decline in commodity prices weighed on the markets throughout the year. On a regional basis, Japan's 9.6% gain outperformed the S&P 500 Index's flat return of 1.4% and Europe's modest 2.8% decline, while emerging market equities suffered a double-digit loss, down 14.9% (as measured by the MSCI Japan Index, MSCI Europe Index and MSCI Emerging Markets Index, respectively).
• Within the Portfolio, the materials sector led underperformance relative to the Index for the period. Our stock selection in the sector was most detrimental, and an overweight position there also hurt performance. While many of the Portfolio's materials stocks performed poorly during the period, a holding in a U.K.-based global mining company was the largest detractor in the sector and second-largest detractor in the overall Portfolio.
• The health care sector was a relatively weak performer for the Portfolio. Both stock selection and an underweight position in the sector were unfavorable in this reporting period. In particular, the Portfolio was hurt by a position in a U.S. health care information company that provides a technology platform for companies and consumers to compare pricing for health care and medical procedures.
• Stock selection in the industrials sector also detracted from performance, with underperformance led by a holding in a U.S. construction crane and foodservice refrigeration manufacturer.
• The main positive contributors to performance included stock selection and an underweight position in the financials sector. A Bermuda-based reinsurance provider added the most value in the sector.
• Relative gains in the information technology sector were driven by our stock selection. A U.K.-based online takeout food ordering platform that operates in Europe, South America, Australia and Canada was the sector's top contributor.
• The Portfolio's underweight exposure to the energy sector was advantageous during the period, as the sector was the worst performer in the Index.
Management Strategies
• There were no changes to our bottom-up investment process during the period. We seek to invest primarily in established and cyclical franchise companies that we believe have strong name recognition, sustainable competitive advantages, and ample growth prospects, and are trading at an attractive discount to future cash flow generation capacity or asset value. We typically favor companies with the ability to generate attractive free cash flow yields. We utilize a bottom-up stock selection process, seeking attractive investments on an individual company basis. Our emphasis is on secular growth, and as a result short-term market events are not as meaningful in the stock selection process.
• The long-term investment horizon and conviction-weighted investment approach embraced by the team since 1998 can result in periods of performance deviation from the benchmark and peers, as was the case during this reporting period. Our team continues to focus on bottom-up stock selection and the long-term outlook for companies owned in the Portfolio; accordingly, we have had very little turnover in the Portfolio to date, as our ongoing work reaffirms our assessment of quality and competitive advantage in the names we own.
4
Morgan Stanley Institutional Fund, Inc.
Annual Report — December 31, 2015
Investment Overview (unaudited) (cont'd)
Global Insight Portfolio

* Minimum Investment for Class I shares
** Commenced Operations on December 28, 2011.
In accordance with SEC regulations, the Portfolio's performance shown assumes that all recurring fees (including management fees) were deducted and all dividends and distributions were reinvested. The performance of Class A, L and C shares will vary from the performance of Class I shares based upon their different inception dates and will be impacted by additional fees assessed to those classes.
Performance Compared to the MSCI All Country World Index(1) and the Lipper Global Small/Mid-Cap Funds Index(2)
| Period Ended December 31, 2015 Total Returns(3) | |||||||||||||||||||
Average Annual | |||||||||||||||||||
| One Year | Five Years | Ten Years | Since Inception(6) | ||||||||||||||||
| Portfolio — Class I Shares w/o sales charges(4) | –5.02 | % | — | — | 11.80 | % | |||||||||||||
| Portfolio — Class A Shares w/o sales charges(4) | –5.32 | — | — | 11.48 | |||||||||||||||
| Portfolio — Class A Shares with maximum 5.25% sales charges(4) | –10.27 | — | — | 10.00 | |||||||||||||||
| Portfolio — Class L Shares w/o sales charges(4) | –5.87 | — | — | 10.89 | |||||||||||||||
| Portfolio — Class C Shares w/o sales charges(5) | — | — | — | –10.67 | |||||||||||||||
| Portfolio — Class C Shares with maximum 1.00% deferred sales charges(5) | — | — | — | –11.49 | |||||||||||||||
MSCI All Country World Index | –2.36 | — | — | 10.03 | |||||||||||||||
| Lipper Global Small/Mid-Cap Funds Index | –0.68 | — | — | 9.97 | |||||||||||||||
Performance data quoted represents past performance, which is no guarantee of future results, and current performance may be lower or higher than the figures shown. Performance assumes that all dividends and distributions, if any, were reinvested. For the most recent month-end performance figures, please visit www.morganstanley.com/im. Investment return and principal value will fluctuate so that Portfolio shares, when redeemed, may be worth more or less than their original cost. Total returns do not reflect the deduction of taxes that a shareholder would pay on Portfolio distributions or the redemption of Portfolio shares. Returns for periods less than one year are not annualized. Performance of share classes will vary due to difference in expenses.
(1) The MSCI All Country World Index (ACWI) is a free float-adjusted market capitalization weighted index designed to measure the equity market performance of developed and emerging markets. The term "free float" represents the portion of shares outstanding that are deemed to be available for purchase in the public equity markets by investors. The Index is unmanaged and its returns do not include any sales charges or fees. Such costs would lower performance. It is not possible to invest directly in an index.
(2) The Lipper Global Small/Mid-Cap Funds Index is an equally weighted performance index of the largest qualifying funds (based on net assets) in the Lipper Global Small/Mid-Cap Funds classification. The Index, which is adjusted for capital gains distributions and income dividends, is unmanaged and should not be considered an investment. There are currently 30 funds represented in this Index. As of the date of this report, the Portfolio is in the Lipper Global Small/Mid-Cap Funds classification.
(3) Total returns for the Portfolio reflect fees waived and expenses reimbursed, if applicable, by the Adviser. Without such waivers and reimbursements, total returns would have been lower.
(4) Commenced operations on December 28, 2011.
(5) Commenced offering on April 30, 2015.
(6) For comparative purposes, average annual since inception returns listed for the Indexes refer to the inception date of Class I of the Portfolio, not the inception of the Index.
5
Morgan Stanley Institutional Fund, Inc.
Annual Report — December 31, 2015
Portfolio of Investments
Global Insight Portfolio
Shares | Value (000) | ||||||||||
Common Stocks (93.2%) | |||||||||||
Australia (0.9%) | |||||||||||
Kathmandu Holdings Ltd. | 16,308 | $ | 17 | ||||||||
Brazil (2.3%) | |||||||||||
GAEC Educacao SA | 9,192 | 32 | |||||||||
JHSF Participacoes SA (a) | 27,643 | 9 | |||||||||
Vale SA (Preference) | 1,674 | 4 | |||||||||
45 | |||||||||||
Canada (3.2%) | |||||||||||
Bombardier, Inc. (a) | 37,251 | 36 | |||||||||
Dominion Diamond Corp. (a) | 2,792 | 29 | |||||||||
65 | |||||||||||
China (0.8%) | |||||||||||
Jumei International Holding Ltd. ADR (a) | 1,758 | 16 | |||||||||
France (9.5%) | |||||||||||
Christian Dior SE | 783 | 133 | |||||||||
Eurazeo SA | 824 | 57 | |||||||||
190 | |||||||||||
Germany (4.5%) | |||||||||||
ThyssenKrupp AG | 3,068 | 61 | |||||||||
windeln.de AG (a)(b) | 628 | 7 | |||||||||
Zalando SE (a)(b) | 570 | 22 | |||||||||
90 | |||||||||||
Greece (0.7%) | |||||||||||
Titan Cement Co., SA (Preference) (a) | 1,462 | 14 | |||||||||
Italy (2.0%) | |||||||||||
Brunello Cucinelli SpA | 1,064 | 19 | |||||||||
Tamburi Investment Partners SpA | 5,604 | 20 | |||||||||
39 | |||||||||||
Korea, Republic of (1.8%) | |||||||||||
NAVER Corp. (a) | 66 | 37 | |||||||||
Netherlands (4.4%) | |||||||||||
Koninklijke Philips N.V. | 3,428 | 87 | |||||||||
Singapore (1.2%) | |||||||||||
Mandarin Oriental International Ltd. | 16,000 | 25 | |||||||||
Spain (1.3%) | |||||||||||
Baron de Ley (a) | 221 | 27 | |||||||||
Sweden (1.4%) | |||||||||||
Investment AB Kinnevik | 886 | 27 | |||||||||
Switzerland (3.9%) | |||||||||||
Nestle SA (Registered) | 1,044 | 77 | |||||||||
United Kingdom (9.5%) | |||||||||||
Anglo American PLC | 2,490 | 11 | |||||||||
BBA Aviation PLC | 44,280 | 123 | |||||||||
Daily Mail & General Trust PLC | 3,357 | 35 | |||||||||
Just Eat PLC (a) | 2,874 | 21 | |||||||||
190 | |||||||||||
Shares | Value (000) | ||||||||||
United States (45.8%) | |||||||||||
BWX Technologies, Inc. | 2,989 | $ | 95 | ||||||||
Castlight Health, Inc., Class B (a)(c) | 995 | 4 | |||||||||
Cosan Ltd., Class A | 5,952 | 22 | |||||||||
eBay, Inc. (a) | 2,738 | 75 | |||||||||
Garmin Ltd. | 2,171 | 81 | |||||||||
Intuitive Surgical, Inc. (a) | 142 | 78 | |||||||||
Joy Global, Inc. | 2,998 | 38 | |||||||||
Manitowoc Co., Inc. (The) | 5,928 | 91 | |||||||||
Mosaic Co. (The) | 969 | 27 | |||||||||
PayPal Holdings, Inc. (a) | 2,437 | 88 | |||||||||
RenaissanceRe Holdings Ltd. | 771 | 87 | |||||||||
Terex Corp. | 2,038 | 38 | |||||||||
Time Warner, Inc. | 1,163 | 75 | |||||||||
United Technologies Corp. | 1,220 | 117 | |||||||||
916 | |||||||||||
Total Common Stocks (Cost $2,033) | 1,862 | ||||||||||
Participation Note (0.1%) | |||||||||||
Italy (0.1%) | |||||||||||
| Tamburi Investment Partners SpA, Equity Linked Notes, expires 6/30/20 (a) (Cost $1) | 2,697 | 1 | |||||||||
Short-Term Investments (0.4%) | |||||||||||
Securities held as Collateral on Loaned Securities (0.2%) | |||||||||||
Investment Company (0.2%) | |||||||||||
| Morgan Stanley Institutional Liquidity Funds — Treasury Securities Portfolio — Institutional Class (See Note G) | 3,832 | 4 | |||||||||
| Face Amount (000) | |||||||||||
Repurchase Agreements (0.0%) | |||||||||||
| Barclays Capital, Inc., (0.32%, dated 12/31/15, due 1/4/16; proceeds $—@; fully collateralized by a U.S. Government obligation; 2.00% due 11/30/22; valued at $—@) | $ | — | @ | — | @ | ||||||
| Merrill Lynch & Co., Inc., (0.31%, dated 12/31/15, due 1/4/16; proceeds $—@; fully collateralized by a U.S. Government agency security; 4.00% due 11/20/45; valued at $—@) | — | @ | — | @ | |||||||
— | @ | ||||||||||
| Total Securities held as Collateral on Loaned Securities (Cost $4) | 4 | ||||||||||
The accompanying notes are an integral part of the financial statements.
6
Morgan Stanley Institutional Fund, Inc.
Annual Report — December 31, 2015
Portfolio of Investments (cont'd)
Global Insight Portfolio
Shares | Value (000) | ||||||||||
Investment Company (0.2%) | |||||||||||
| Morgan Stanley Institutional Liquidity Funds — Money Market Portfolio — Institutional Class (See Note G) (Cost $4) | 3,661 | $ | 4 | ||||||||
Total Short-Term Investments (Cost $8) | 8 | ||||||||||
| Total Investments (93.7%) (Cost $2,042) Including $4 of Securities Loaned (d)(e) | 1,871 | ||||||||||
Other Assets in Excess of Liabilities (6.3%) | 126 | ||||||||||
Net Assets (100.0%) | $ | 1,997 | |||||||||
(a) Non-income producing security.
(b) 144A security — Certain conditions for public sale may exist. Unless otherwise noted, these securities are deemed to be liquid.
(c) All or a portion of this security was on loan at December 31, 2015.
(d) The approximate fair value and percentage of net assets, $851,000 and 42.6%, respectively, represent the securities that have been fair valued under the fair valuation policy for international investments as described in Note A-1 within the Notes to the Financial Statements.
(e) At December 31, 2015, the aggregate cost for Federal income tax purposes is approximately $2,062,000. The aggregate gross unrealized appreciation is approximately $171,000 and the aggregate gross unrealized depreciation is approximately $362,000 resulting in net unrealized depreciation of approximately $191,000.
@ Value is less than $500.
ADR American Depositary Receipt.
Portfolio Composition*
Classification | Percentage of Total Investments | ||||||
Other** | 44.4 | % | |||||
Aerospace & Defense | 13.3 | ||||||
Machinery | 9.0 | ||||||
Textiles, Apparel & Luxury Goods | 8.1 | ||||||
Internet Software & Services | 7.1 | ||||||
Transportation Infrastructure | 6.6 | ||||||
Media | 5.9 | ||||||
Metals & Mining | 5.6 | ||||||
Total Investments | 100.0 | % | |||||
* Percentages indicated are based upon total investments (excluding Securities held as Collateral on Loaned Securities) as of December 31, 2015.
** Industries and/or investment types representing less than 5% of total investments.
The accompanying notes are an integral part of the financial statements.
7
Morgan Stanley Institutional Fund, Inc.
Annual Report — December 31, 2015
Global Insight Portfolio
Statement of Assets and Liabilities | December 31, 2015 (000) | ||||||
Assets: | |||||||
Investments in Securities of Unaffiliated Issuers, at Value(1) (Cost $2,034) | $ | 1,863 | |||||
Investments in Securities of Affiliated Issuer, at Value (Cost $8) | 8 | ||||||
Total Investments in Securities, at Value (Cost $2,042) | 1,871 | ||||||
Foreign Currency, at Value (Cost —@) | — | @ | |||||
Cash | — | @ | |||||
Receivable for Portfolio Shares Sold | 57 | ||||||
Due from Adviser | 49 | ||||||
Receivable for Investments Sold | 9 | ||||||
Dividends Receivable | 1 | ||||||
Tax Reclaim Receivable | 1 | ||||||
Receivable from Affiliate | — | @ | |||||
Other Assets | 39 | ||||||
Total Assets | 2,027 | ||||||
Liabilities: | |||||||
Payable for Professional Fees | 12 | ||||||
Payable for Custodian Fees | 8 | ||||||
Collateral on Securities Loaned, at Value | 4 | ||||||
Payable for Transfer Agency Fees — Class I | — | @ | |||||
Payable for Transfer Agency Fees — Class A | — | @ | |||||
Payable for Transfer Agency Fees — Class L | — | @ | |||||
Payable for Transfer Agency Fees — Class C | — | @ | |||||
Payable for Shareholder Services Fees — Class A | — | @ | |||||
Payable for Distribution and Shareholder Services Fees — Class L | — | @ | |||||
Payable for Distribution and Shareholder Services Fees — Class C | — | @ | |||||
Payable for Sub Transfer Agency Fees — Class I | — | @ | |||||
Payable for Sub Transfer Agency Fees — Class A | — | @ | |||||
Payable for Sub Transfer Agency Fees — Class L | — | @ | |||||
Payable for Sub Transfer Agency Fees — Class C | — | @ | |||||
Payable for Administration Fees | — | @ | |||||
Other Liabilities | 6 | ||||||
Total Liabilities | 30 | ||||||
Net Assets | $ | 1,997 | |||||
Net Assets Consist Of: | |||||||
Paid-in-Capital | $ | 2,210 | |||||
Distributions in Excess of Net Investment Income | (21 | ) | |||||
Distributions in Excess of Net Realized Gain | (21 | ) | |||||
Unrealized Appreciation (Depreciation) on: | |||||||
Investments | (171 | ) | |||||
Foreign Currency Translations | (— | @) | |||||
Net Assets | $ | 1,997 | |||||
The accompanying notes are an integral part of the financial statements.
8
Morgan Stanley Institutional Fund, Inc.
Annual Report — December 31, 2015
Global Insight Portfolio
Statement of Assets and Liabilities (cont'd) | December 31, 2015 (000) | ||||||
CLASS I: | |||||||
Net Assets | $ | 1,560 | |||||
| Shares Outstanding $0.001 par value shares of beneficial interest (unlimited shares authorized) (not in 000's) | 154,865 | ||||||
Net Asset Value, Offering and Redemption Price Per Share | $ | 10.07 | |||||
CLASS A: | |||||||
Net Assets | $ | 335 | |||||
| Shares Outstanding $0.001 par value shares of beneficial interest (unlimited shares authorized) (not in 000's) | 33,197 | ||||||
Net Asset Value, Redemption Price Per Share | $ | 10.10 | |||||
Maximum Sales Load | 5.25 | % | |||||
Maximum Sales Charge | $ | 0.56 | |||||
Maximum Offering Price Per Share | $ | 10.66 | |||||
CLASS L: | |||||||
Net Assets | $ | 86 | |||||
| Shares Outstanding $0.001 par value shares of beneficial interest (unlimited shares authorized) (not in 000's) | 8,597 | ||||||
Net Asset Value, Offering and Redemption Price Per Share | $ | 10.01 | |||||
CLASS C: | |||||||
Net Assets | $ | 16 | |||||
| Shares Outstanding $0.001 par value shares of beneficial interest (unlimited shares authorized) (not in 000's) | 1,619 | ||||||
Net Asset Value, Offering and Redemption Price Per Share | $ | 9.99 | |||||
| (1) Including: Securities on Loan, at Value: | $ | 4 | |||||
@ Amount is less than $500.
The accompanying notes are an integral part of the financial statements.
9
Morgan Stanley Institutional Fund, Inc.
Annual Report — December 31, 2015
Global Insight Portfolio
Statement of Operations | Year Ended December 31, 2015 (000) | ||||||
Investment Income: | |||||||
Dividends from Securities of Unaffiliated Issuers (Net of $2 of Foreign Taxes Withheld) | $ | 35 | |||||
Income from Securities Loaned — Net | 2 | ||||||
Dividends from Security of Affiliated Issuer (Note G) | — | @ | |||||
Total Investment Income | 37 | ||||||
Expenses: | |||||||
Professional Fees | 83 | ||||||
Registration Fees | 43 | ||||||
Custodian Fees (Note F) | 29 | ||||||
Advisory Fees (Note B) | 19 | ||||||
Shareholder Reporting Fees | 12 | ||||||
Transfer Agency Fees — Class I (Note E) | 2 | ||||||
Transfer Agency Fees — Class A (Note E) | 2 | ||||||
Transfer Agency Fees — Class L (Note E) | 2 | ||||||
Transfer Agency Fees — Class C (Note E) | 1 | ||||||
Pricing Fees | 6 | ||||||
Administration Fees (Note C) | 2 | ||||||
Shareholder Services Fees — Class A (Note D) | 1 | ||||||
Distribution and Shareholder Services Fees — Class L (Note D) | — | @ | |||||
Distribution and Shareholder Services Fees — Class C (Note D) | — | @ | |||||
Sub Transfer Agency Fees — Class I | — | @ | |||||
Sub Transfer Agency Fees — Class A | — | @ | |||||
Sub Transfer Agency Fees — Class L | — | @ | |||||
Sub Transfer Agency Fees — Class C | — | @ | |||||
Other Expenses | 13 | ||||||
Total Expenses | 215 | ||||||
Expenses Reimbursed by Adviser (Note B) | (162 | ) | |||||
Waiver of Advisory Fees (Note B) | (19 | ) | |||||
Reimbursement of Class Specific Expenses — Class I (Note B) | (2 | ) | |||||
Reimbursement of Class Specific Expenses — Class A (Note B) | (2 | ) | |||||
Reimbursement of Class Specific Expenses — Class L (Note B) | (2 | ) | |||||
Reimbursement of Class Specific Expenses — Class C (Note B) | (1 | ) | |||||
Rebate from Morgan Stanley Affiliate (Note G) | (— | @) | |||||
Net Expenses | 27 | ||||||
Net Investment Income | 10 | ||||||
Realized Gain (Loss): | |||||||
Investments Sold | 93 | ||||||
Foreign Currency Transactions | (— | @) | |||||
Net Realized Gain | 93 | ||||||
Change in Unrealized Appreciation (Depreciation): | |||||||
Investments | (219 | ) | |||||
Foreign Currency Translations | (— | @) | |||||
Net Change in Unrealized Appreciation (Depreciation) | (219 | ) | |||||
Net Realized Gain and Change in Unrealized Appreciation (Depreciation) | (126 | ) | |||||
Net Decrease in Net Assets Resulting from Operations | $ | (116 | ) | ||||
@ Amount is less than $500.
The accompanying notes are an integral part of the financial statements.
10
Morgan Stanley Institutional Fund, Inc.
Annual Report — December 31, 2015
Global Insight Portfolio
Statements of Changes in Net Assets | Year Ended December 31, 2015 (000) | Year Ended December 31, 2014 (000) | |||||||||
Increase (Decrease) in Net Assets: | |||||||||||
Operations: | |||||||||||
Net Investment Income | $ | 10 | $ | 26 | |||||||
Net Realized Gain | 93 | 166 | |||||||||
Net Change in Unrealized Appreciation (Depreciation) | (219 | ) | (240 | ) | |||||||
Net Decrease in Net Assets Resulting from Operations | (116 | ) | (48 | ) | |||||||
Distributions from and/or in Excess of: | |||||||||||
Class I: | |||||||||||
Net Investment Income | (27 | ) | (13 | ) | |||||||
Net Realized Gain | (107 | ) | (164 | ) | |||||||
Class A: | |||||||||||
Net Investment Income | (4 | ) | (1 | ) | |||||||
Net Realized Gain | (23 | ) | (22 | ) | |||||||
Class L: | |||||||||||
Net Investment Income | (— | @) | (— | @) | |||||||
Net Realized Gain | (2 | ) | (2 | ) | |||||||
Class C: | |||||||||||
Net Investment Income | (— | @) | — | ||||||||
Net Realized Gain | (1 | ) | — | ||||||||
Total Distributions | (164 | ) | (202 | ) | |||||||
Capital Share Transactions:(1) | |||||||||||
Class I: | |||||||||||
Subscribed | 170 | 155 | |||||||||
Distributions Reinvested | 131 | 175 | |||||||||
Redeemed | (13 | ) | (18 | ) | |||||||
Class A: | |||||||||||
Subscribed | 187 | 29 | |||||||||
Distributions Reinvested | 27 | 21 | |||||||||
Redeemed | (24 | ) | (12 | ) | |||||||
Class L: | |||||||||||
Subscribed | 63 | 15 | |||||||||
Distributions Reinvested | 1 | 1 | |||||||||
Class C: | |||||||||||
Subscribed | 19 | * | — | ||||||||
Distributions Reinvested | 1 | * | — | ||||||||
Net Increase in Net Assets Resulting from Capital Share Transactions | 562 | 366 | |||||||||
Total Increase in Net Assets | 282 | 116 | |||||||||
Net Assets: | |||||||||||
Beginning of Period | 1,715 | 1,599 | |||||||||
End of Period (Including Distributions in Excess of Net Investment Income of $(21) and $(18)) | $ | 1,997 | $ | 1,715 | |||||||
The accompanying notes are an integral part of the financial statements.
11
Morgan Stanley Institutional Fund, Inc.
Annual Report — December 31, 2015
Global Insight Portfolio
| Statements of Changes in Net Assets (cont'd) | Year Ended December 31, 2015 (000) | Year Ended December 31, 2014 (000) | |||||||||
(1) Capital Share Transactions: | |||||||||||
Class I: | |||||||||||
Shares Subscribed | 14 | 11 | |||||||||
Shares Issued on Distributions Reinvested | 13 | 15 | |||||||||
Shares Redeemed | (1 | ) | (1 | ) | |||||||
Net Increase in Class I Shares Outstanding | 26 | 25 | |||||||||
Class A: | |||||||||||
Shares Subscribed | 15 | 2 | |||||||||
Shares Issued on Distributions Reinvested | 3 | 2 | |||||||||
Shares Redeemed | (2 | ) | (1 | ) | |||||||
Net Increase in Class A Shares Outstanding | 16 | 3 | |||||||||
Class L: | |||||||||||
Shares Subscribed | 6 | 1 | |||||||||
Shares Issued on Distributions Reinvested | — | @@ | — | @@ | |||||||
Net Increase in Class L Shares Outstanding | 6 | 1 | |||||||||
Class C: | |||||||||||
Shares Subscribed | 2 | * | — | ||||||||
Shares Issued on Distributions Reinvested | — | @@* | — | ||||||||
Net Increase in Class C Shares Outstanding | 2 | — | |||||||||
* For the period April 30, 2015 through December 31, 2015.
@ Amount is less than $500.
@@ Amount is less than 500 shares.
The accompanying notes are an integral part of the financial statements.
12
Morgan Stanley Institutional Fund, Inc.
Annual Report — December 31, 2015
Financial Highlights
Global Insight Portfolio
Class I | |||||||||||||||||||||||
Year Ended December 31, | Period from December 28, 2011^ to | ||||||||||||||||||||||
Selected Per Share Data and Ratios | 2015 | 2014 | 2013 | 2012 | December 31, 2011 | ||||||||||||||||||
Net Asset Value, Beginning of Period | $ | 11.55 | $ | 13.42 | $ | 11.99 | $ | 10.07 | $ | 10.00 | |||||||||||||
Income (Loss) from Investment Operations: | |||||||||||||||||||||||
Net Investment Income (Loss)† | 0.07 | 0.20 | 0.30 | 0.31 | (0.00 | )‡ | |||||||||||||||||
Net Realized and Unrealized Gain (Loss) | (0.62 | ) | (0.56 | ) | 3.32 | 2.53 | 0.07 | ||||||||||||||||
Total from Investment Operations | (0.55 | ) | (0.36 | ) | 3.62 | 2.84 | 0.07 | ||||||||||||||||
Distributions from and/or in Excess of: | |||||||||||||||||||||||
Net Investment Income | (0.18 | ) | (0.11 | ) | (0.45 | ) | (0.49 | ) | — | ||||||||||||||
Net Realized Gain | (0.75 | ) | (1.40 | ) | (1.74 | ) | (0.43 | ) | — | ||||||||||||||
Total Distributions | (0.93 | ) | (1.51 | ) | (2.19 | ) | (0.92 | ) | — | ||||||||||||||
Net Asset Value, End of Period | $ | 10.07 | $ | 11.55 | $ | 13.42 | $ | 11.99 | $ | 10.07 | |||||||||||||
Total Return++ | (5.02 | )% | (2.65 | )% | 30.89 | % | 28.31 | % | 0.70 | %# | |||||||||||||
Ratios and Supplemental Data: | |||||||||||||||||||||||
Net Assets, End of Period (Thousands) | $ | 1,560 | $ | 1,490 | $ | 1,397 | $ | 12 | $ | 10 | |||||||||||||
Ratio of Expenses to Average Net Assets (1) | 1.35 | %+ | 1.35 | %+ | 1.35 | %+ | 1.35 | %+ | 1.35 | %+* | |||||||||||||
Ratio of Net Investment Income (Loss) to Average Net Assets (1) | 0.58 | %+ | 1.49 | %+ | 2.17 | %+ | 2.74 | %+ | (1.27 | )%+* | |||||||||||||
Ratio of Rebate from Morgan Stanley Affiliates to Average Net Assets | 0.00 | %§ | 0.00 | %§ | 0.00 | %§ | 0.00 | %§ | N/A | ||||||||||||||
Portfolio Turnover Rate | 62 | % | 67 | % | 59 | % | 41 | % | 0 | %# | |||||||||||||
(1) Supplemental Information on the Ratios to Average Net Assets: | |||||||||||||||||||||||
Ratios Before Expense Limitation: | |||||||||||||||||||||||
Expenses to Average Net Assets | 10.84 | % | 10.82 | % | 14.22 | % | 16.10 | % | 381.10 | %* | |||||||||||||
Net Investment Loss to Average Net Assets | (8.91 | )% | (7.98 | )% | (10.70 | )% | (12.01 | )% | (381.02 | )%* | |||||||||||||
^ Commencement of Operations.
† Per share amount is based on average shares outstanding.
‡ Amount is less than $0.005 per share.
++ Calculated based on the net asset value as of the last business day of the period.
+ The Ratios of Expenses and Net Investment Income (Loss) reflect the rebate of certain Portfolio expenses in connection with the investments in Morgan Stanley affiliates during the period. The effect of the rebate on the ratios is disclosed in the above table as "Ratio of Rebate from Morgan Stanley Affiliates to Average Net Assets."
§ Amount is less than 0.005%.
# Not Annualized.
* Annualized.
The accompanying notes are an integral part of the financial statements.
13
Morgan Stanley Institutional Fund, Inc.
Annual Report — December 31, 2015
Financial Highlights
Global Insight Portfolio
Class A | |||||||||||||||||||||||
Year Ended December 31, | Period from December 28, 2011^ to | ||||||||||||||||||||||
Selected Per Share Data and Ratios | 2015 | 2014 | 2013 | 2012 | December 31, 2011 | ||||||||||||||||||
Net Asset Value, Beginning of Period | $ | 11.58 | $ | 13.45 | $ | 11.99 | $ | 10.07 | $ | 10.00 | |||||||||||||
Income (Loss) from Investment Operations: | |||||||||||||||||||||||
Net Investment Income (Loss)† | 0.02 | 0.15 | 0.01 | 0.28 | (0.00 | )‡ | |||||||||||||||||
Net Realized and Unrealized Gain (Loss) | (0.61 | ) | (0.55 | ) | 3.56 | 2.53 | 0.07 | ||||||||||||||||
Total from Investment Operations | (0.59 | ) | (0.40 | ) | 3.57 | 2.81 | 0.07 | ||||||||||||||||
Distributions from and/or in Excess of: | |||||||||||||||||||||||
Net Investment Income | (0.14 | ) | (0.07 | ) | (0.37 | ) | (0.46 | ) | — | ||||||||||||||
Net Realized Gain | (0.75 | ) | (1.40 | ) | (1.74 | ) | (0.43 | ) | — | ||||||||||||||
Total Distributions | (0.89 | ) | (1.47 | ) | (2.11 | ) | (0.89 | ) | — | ||||||||||||||
Net Asset Value, End of Period | $ | 10.10 | $ | 11.58 | $ | 13.45 | $ | 11.99 | $ | 10.07 | |||||||||||||
Total Return++ | (5.32 | )% | (2.97 | )% | 30.52 | % | 28.04 | % | 0.70 | %# | |||||||||||||
Ratios and Supplemental Data: | |||||||||||||||||||||||
Net Assets, End of Period (Thousands) | $ | 335 | $ | 199 | $ | 189 | $ | 1,151 | $ | 816 | |||||||||||||
Ratio of Expenses to Average Net Assets (1) | 1.70 | %+ | 1.70 | %+ | 1.60 | %+^^ | 1.60 | %+ | 1.60 | %+* | |||||||||||||
Ratio of Net Investment Income (Loss) to Average Net Assets (1) | 0.17 | %+ | 1.14 | %+ | 0.07 | %+ | 2.49 | %+ | (1.52 | )%+* | |||||||||||||
Ratio of Rebate from Morgan Stanley Affiliates to Average Net Assets | 0.00 | %§ | 0.00 | %§ | 0.01 | % | 0.00 | %§ | N/A | ||||||||||||||
Portfolio Turnover Rate | 62 | % | 67 | % | 59 | % | 41 | % | 0 | %# | |||||||||||||
(1) Supplemental Information on the Ratios to Average Net Assets: | |||||||||||||||||||||||
Ratios Before Expense Limitation: | |||||||||||||||||||||||
Expenses to Average Net Assets | 11.74 | % | 12.14 | % | 13.62 | % | 16.35 | % | 381.35 | %* | |||||||||||||
Net Investment Loss to Average Net Assets | (9.87 | )% | (9.30 | )% | (11.95 | )% | (12.26 | )% | (381.27 | )%* | |||||||||||||
^ Commencement of Operations.
† Per share amount is based on average shares outstanding.
‡ Amount is less than $0.005 per share.
++ Calculated based on the net asset value which does not reflect sales charges, if applicable, as of the last business day of the period.
+ The Ratios of Expenses and Net Investment Income (Loss) reflect the rebate of certain Portfolio expenses in connection with the investments in Morgan Stanley affiliates during the period. The effect of the rebate on the ratios is disclosed in the above table as "Ratio of Rebate from Morgan Stanley Affiliates to Average Net Assets."
^^ Effective September 16, 2013, the Adviser has agreed to limit the ratio of expenses to average net assets to the maximum ratio of 1.70% for Class A shares. Prior to September 16, 2013, the maximum ratio was 1.60% for Class A shares.
§ Amount is less than 0.005%.
# Not Annualized.
* Annualized.
The accompanying notes are an integral part of the financial statements.
14
Morgan Stanley Institutional Fund, Inc.
Annual Report — December 31, 2015
Financial Highlights
Global Insight Portfolio
Class L | |||||||||||||||||||||||
Year Ended December 31, | Period from December 28, 2011^ to | ||||||||||||||||||||||
Selected Per Share Data and Ratios | 2015 | 2014 | 2013 | 2012 | December 31, 2011 | ||||||||||||||||||
Net Asset Value, Beginning of Period | $ | 11.49 | $ | 13.39 | $ | 11.98 | $ | 10.07 | $ | 10.00 | |||||||||||||
Income (Loss) from Investment Operations: | |||||||||||||||||||||||
Net Investment Income (Loss)† | (0.03 | ) | 0.08 | 0.12 | 0.23 | (0.00 | )‡ | ||||||||||||||||
Net Realized and Unrealized Gain (Loss) | (0.61 | ) | (0.54 | ) | 3.37 | 2.51 | 0.07 | ||||||||||||||||
Total from Investment Operations | (0.64 | ) | (0.46 | ) | 3.49 | 2.74 | 0.07 | ||||||||||||||||
Distributions from and/or in Excess of: | |||||||||||||||||||||||
Net Investment Income | (0.09 | ) | (0.04 | ) | (0.34 | ) | (0.40 | ) | — | ||||||||||||||
Net Realized Gain | (0.75 | ) | (1.40 | ) | (1.74 | ) | (0.43 | ) | — | ||||||||||||||
Total Distributions | (0.84 | ) | (1.44 | ) | (2.08 | ) | (0.83 | ) | — | ||||||||||||||
Net Asset Value, End of Period | $ | 10.01 | $ | 11.49 | $ | 13.39 | $ | 11.98 | $ | 10.07 | |||||||||||||
Total Return++ | (5.87 | )% | (3.43 | )% | 29.82 | % | 27.36 | % | 0.70 | %# | |||||||||||||
Ratios and Supplemental Data: | |||||||||||||||||||||||
Net Assets, End of Period (Thousands) | $ | 86 | $ | 26 | $ | 13 | $ | 12 | $ | 10 | |||||||||||||
Ratio of Expenses to Average Net Assets (1) | 2.20 | %+ | 2.20 | %+ | 2.13 | %+^^ | 2.10 | %+ | 2.10 | %+* | |||||||||||||
Ratio of Net Investment Income (Loss) to Average Net Assets (1) | (0.26 | )%+ | 0.64 | %+ | 0.93 | %+ | 1.99 | %+ | (2.01 | )%+* | |||||||||||||
Ratio of Rebate from Morgan Stanley Affiliates to Average Net Assets | 0.00 | %§ | 0.00 | %§ | 0.00 | %§ | 0.00 | %§ | N/A | ||||||||||||||
Portfolio Turnover Rate | 62 | % | 67 | % | 59 | % | 41 | % | 0 | %# | |||||||||||||
(1) Supplemental Information on the Ratios to Average Net Assets: | |||||||||||||||||||||||
Ratios Before Expense Limitation: | |||||||||||||||||||||||
Expenses to Average Net Assets | 17.24 | % | 20.95 | % | 17.73 | % | 16.85 | % | 381.85 | %* | |||||||||||||
Net Investment Loss to Average Net Assets | (15.30 | )% | (18.11 | )% | (14.67 | )% | (12.76 | )% | (381.76 | )%* | |||||||||||||
^ Commencement of Operations.
† Per share amount is based on average shares outstanding.
‡ Amount is less than $0.005 per share.
++ Calculated based on the net asset value as of the last business day of the period.
+ The Ratios of Expenses and Net Investment Income (Loss) reflect the rebate of certain Portfolio expenses in connection with the investments in Morgan Stanley affiliates during the period. The effect of the rebate on the ratios is disclosed in the above table as "Ratio of Rebate from Morgan Stanley Affiliates to Average Net Assets."
^^ Effective September 16, 2013, the Adviser has agreed to limit the ratio of expenses to average net assets to the maximum ratio of 2.20% for Class L shares. Prior to September 16, 2013, the maximum ratio was 2.10% for Class L shares.
§ Amount is less than 0.005%.
# Not Annualized.
* Annualized.
The accompanying notes are an integral part of the financial statements.
15
Morgan Stanley Institutional Fund, Inc.
Annual Report — December 31, 2015
Financial Highlights
Global Insight Portfolio
Class C | |||||||
Selected Per Share Data and Ratios | Period from April 30, 2015^ to December 31, 2015 | ||||||
Net Asset Value, Beginning of Period | $ | 12.10 | |||||
Loss from Investment Operations: | |||||||
Net Investment Loss† | (0.07 | ) | |||||
Net Realized and Unrealized Loss | (1.19 | ) | |||||
Total from Investment Operations | (1.26 | ) | |||||
Distributions from and/or in Excess of: | |||||||
Net Investment Income | (0.10 | ) | |||||
Net Realized Gain | (0.75 | ) | |||||
Total Distributions | (0.85 | ) | |||||
Net Asset Value, End of Period | $ | 9.99 | |||||
Total Return++ | (10.67 | )%# | |||||
Ratios and Supplemental Data: | |||||||
Net Assets, End of Period (Thousands) | $ | 16 | |||||
Ratios of Expenses to Average Net Assets (1) | 2.45 | %+* | |||||
Ratio of Net Investment Loss to Average Net Assets (1) | (0.94 | )%+* | |||||
Ratio of Rebate from Morgan Stanley Affiliates to Average Net Assets | 0.00 | %§* | |||||
Portfolio Turnover Rate | 62 | % | |||||
(1) Supplemental Information on the Ratios to Average Net Assets: | |||||||
Ratios Before Expense Limitation: | |||||||
Expense to Average Net Assets | 23.24 | %* | |||||
Net Investment Loss to Average Net Assets | (21.73 | )%* | |||||
^ Commencement of Offering.
† Per share amount is based on average shares outstanding.
++ Calculated based on the net asset value which does not reflect sales charges, if applicable, as of the last business day of the period.
+ The Ratios of Expenses and Net Investment Loss reflect the rebate of certain Portfolio expenses in connection with the investments in Morgan Stanley affiliates during the period. The effect of the rebate on the ratios is disclosed in the above table as "Ratio of Rebate from Morgan Stanley Affiliates to Average Net Assets."
§ Amount is less than 0.005%.
# Not Annualized.
* Annualized.
The accompanying notes are an integral part of the financial statements.
16
Morgan Stanley Institutional Fund, Inc.
Annual Report — December 31, 2015
Notes to Financial Statements
Morgan Stanley Institutional Fund, Inc. (the "Fund") is registered under the Investment Company Act of 1940, as amended (the "Act"), as an open-end management investment company. The Fund is comprised of twenty-six separate, active, diversified and non-diversified portfolios (individually referred to as a "Portfolio", collectively as the "Portfolios"). The Fund applies investment company accounting and reporting guidance.
The accompanying financial statements relate to the Global Insight Portfolio. The Portfolio seeks long-term capital appreciation by investing primarily in established and cyclical companies located throughout the world with market capitalizations within the range of companies included in the MSCI All Country World Index.
The Portfolio offers four classes of shares — Class I, Class A, Class L and Class C. On April 30, 2015, the Portfolio commenced offering Class C shares and suspended offering of Class L shares. Existing Class L shareholders may invest through reinvestment of dividends and distributions.
A. Significant Accounting Policies: The following significant accounting policies are in conformity with U.S. generally accepted accounting principles ("GAAP"). Such policies are consistently followed by the Fund in the preparation of its financial statements. GAAP may require management to make estimates and assumptions that affect the reported amounts and disclosures in the financial statements. Actual results may differ from those estimates.
1. Security Valuation: (1) An equity portfolio security listed or traded on an exchange is valued at its latest reported sales price (or at the exchange official closing price if such exchange reports an official closing price), if there were no sales on a given day, the security is valued at the mean between the last reported bid and asked prices; (2) all other equity portfolio securities for which over-the-counter ("OTC") market quotations are readily available are valued at its latest reported sales price. In cases where a security is traded on more than one exchange, the security is valued on the exchange designated as the primary market; (3) Certain portfolio securities may be valued by an outside pricing service approved by the Fund's Board of Directors (the "Directors"). The pricing service may utilize a matrix system or other model incorporating attributes such as security quality, maturity and coupon as the evaluation model parameters, and/or research evaluations by its staff, including review of broker dealer market price quotations in determining what it believes is the fair valuation of the portfolios securities valued by such pricing service;
(4) when market quotations are not readily available, including circumstances under which Morgan Stanley Investment Management Inc. (the "Adviser") determines that the closing price, last sale price or the mean between the last reported bid and asked prices are not reflective of a security's market value, portfolio securities are valued at their fair value as determined in good faith under procedures established by and under the general supervision of the Directors. Occasionally, developments affecting the closing prices of securities and other assets may occur between the times at which valuations of such securities are determined (that is, close of the foreign market on which the securities trade) and the close of business of the New York Stock Exchange ("NYSE"). If developments occur during such periods that are expected to materially affect the value of such securities, such valuations may be adjusted to reflect the estimated fair value of such securities as of the close of the NYSE, as determined in good faith by the Directors or by the Adviser using a pricing service and/or procedures approved by the Directors; (5) quotations of foreign portfolio securities, other assets and liabilities and forward contracts stated in foreign currency are translated into U.S. dollar equivalents at the prevailing market rates prior to the close of the NYSE; (6) investments in mutual funds, including the Morgan Stanley Institutional Liquidity Funds, are valued at the net asset value ("NAV") as of the close of each business day; and (7) short-term debt securities with remaining maturities of 60 days or less at the time of purchase may be valued at amortized cost, unless the Adviser determines such valuation does not reflect the securities' market value, in which case these securities will be valued at their fair market value determined by the Adviser.
The Directors have responsibility for determining in good faith the fair value of the investments, and the Directors may appoint others, such as the Fund's Adviser or a valuation committee, to assist the Directors in determining fair value and to make the actual calculations pursuant to the fair valuation methodologies previously approved by the Directors. Under procedures approved by the Directors, the Fund's Adviser has formed a Valuation Committee whose members are approved by the Directors. The Valuation Committee provides administration and oversight of the Fund's valuation policies and procedures, which are reviewed at least annually by the Directors. These procedures allow the Fund to utilize independent pricing services, quotations from
17
Morgan Stanley Institutional Fund, Inc.
Annual Report — December 31, 2015
Notes to Financial Statements (cont'd)
securities and financial instrument dealers, and other market sources to determine fair value.
The Fund has procedures to determine the fair value of securities and other financial instruments for which market prices are not readily available. Under these procedures, the Valuation Committee convenes on a regular and ad hoc basis to review such securities and considers a number of factors, including valuation methodologies and significant unobservable valuation inputs, when arriving at fair value. The Valuation Committee may employ a market-based approach which may use related or comparable assets or liabilities, recent transactions, market multiples, book values, and other relevant information for the investment to determine the fair value of the investment. An income-based valuation approach may also be used in which the anticipated future cash flows of the investment are discounted to calculate fair value. Discounts may also be applied due to the nature or duration of any restrictions on the disposition of the investments. Due to the inherent uncertainty of valuations of such investments, the fair values may differ significantly from the values that would have been used had an active market existed. The Valuation Committee employs various methods for calibrating these valuation approaches including a regular review of valuation methodologies, key inputs and assumptions, transactional back-testing or disposition analysis, and reviews of any related market activity.
2. Fair Value Measurement: Financial Accounting Standards Board ("FASB") Accounting Standards CodificationTM ("ASC") 820, "Fair Value Measurement" ("ASC 820"), defines fair value as the value that the Fund would receive to sell an investment or pay to transfer a liability in a timely transaction with an independent buyer in the principal market, or in the absence of a principal market the most advantageous market for the investment or liability. ASC 820 establishes a three-tier hierarchy to distinguish between (1) inputs that reflect the assumptions market participants would use in valuing an asset or liability developed based on market data obtained from sources independent of the reporting entity (observable inputs) and (2) inputs that reflect the reporting entity's own assumptions about the assumptions market participants would use in valuing an asset or liability developed based on the best information available in the circumstances (unobservable inputs) and to establish
classification of fair value measurements for disclosure purposes. Various inputs are used in determining the value of the Fund's investments. The inputs are summarized in the three broad levels listed below.
• Level 1 – unadjusted quoted prices in active markets for identical investments
• Level 2 – other significant observable inputs (including quoted prices for similar investments, interest rates, prepayment speeds, credit risk, etc.)
• Level 3 – significant unobservable inputs including the Fund's own assumptions in determining the fair value of investments. Factors considered in making this determination may include, but are not limited to, information obtained by contacting the issuer, analysts, or the appropriate stock exchange (for exchange-traded securities), analysis of the issuer's financial statements or other available documents and, if necessary, available information concerning other securities in similar circumstances
The inputs or methodology used for valuing securities are not necessarily an indication of the risk associated with investing in those securities and the determination of the significance of a particular input to the fair value measurement in its entirety requires judgment and considers factors specific to each security.
The following is a summary of the inputs used to value the Portfolio's investments as of December 31, 2015.
Investment Type | Level 1 Unadjusted quoted prices (000) | Level 2 Other significant observable inputs (000) | Level 3 Significant unobservable inputs (000) | Total (000) | |||||||||||||||
Assets: | |||||||||||||||||||
Common Stocks | |||||||||||||||||||
Aerospace & Defense | $ | 248 | $ | — | $ | — | $ | 248 | |||||||||||
Beverages | — | 27 | — | 27 | |||||||||||||||
Capital Markets | — | 20 | — | 20 | |||||||||||||||
Chemicals | 27 | — | — | 27 | |||||||||||||||
Construction Materials | 14 | — | — | 14 | |||||||||||||||
| Diversified Consumer Services | — | 32 | — | 32 | |||||||||||||||
| Diversified Financial Services | — | 84 | — | 84 | |||||||||||||||
Food Products | — | 77 | — | 77 | |||||||||||||||
| Health Care Equipment & Supplies | 78 | — | — | 78 | |||||||||||||||
Health Care Technology | 4 | — | — | 4 | |||||||||||||||
18
Morgan Stanley Institutional Fund, Inc.
Annual Report — December 31, 2015
Notes to Financial Statements (cont'd)
Investment Type | Level 1 Unadjusted quoted prices (000) | Level 2 Other significant observable inputs (000) | Level 3 Significant unobservable inputs (000) | Total (000) | |||||||||||||||
Common Stocks (cont'd) | |||||||||||||||||||
| Hotels, Restaurants & Leisure | $ | — | $ | 25 | $ | — | $ | 25 | |||||||||||
Household Durables | 81 | — | — | 81 | |||||||||||||||
Industrial Conglomerates | — | 87 | — | 87 | |||||||||||||||
| Information Technology Services | 88 | — | — | 88 | |||||||||||||||
Insurance | 87 | — | — | 87 | |||||||||||||||
Internet & Catalog Retail | 16 | 29 | — | 45 | |||||||||||||||
| Internet Software & Services | 75 | 58 | — | 133 | |||||||||||||||
Machinery | 167 | — | — | 167 | |||||||||||||||
Media | 75 | 35 | — | 110 | |||||||||||||||
Metals & Mining | 29 | 76 | — | 105 | |||||||||||||||
| Oil, Gas & Consumable Fuels | 22 | — | — | 22 | |||||||||||||||
| Real Estate Management & Development | — | 9 | — | 9 | |||||||||||||||
Specialty Retail | — | 17 | — | 17 | |||||||||||||||
| Textiles, Apparel & Luxury Goods | — | 152 | — | 152 | |||||||||||||||
| Transportation Infrastructure | — | 123 | — | 123 | |||||||||||||||
Total Common Stocks | 1,011 | 851 | — | 1,862 | |||||||||||||||
Participation Note | 1 | — | — | 1 | |||||||||||||||
Short-Term Investments | |||||||||||||||||||
Investment Companies | 8 | — | — | 8 | |||||||||||||||
Repurchase Agreements | — | — | @ | — | — | @ | |||||||||||||
| Total Short-Term Investments | 8 | — | @ | — | 8 | ||||||||||||||
Total Assets | $ | 1,020 | $ | 851 | $ | — | $ | 1,871 | |||||||||||
@ Value is less than $500.
Transfers between investment levels may occur as the markets fluctuate and/or the availability of data used in an investment's valuation changes. The Portfolio recognizes transfers between the levels as of the end of the period. As of December 31, 2015, securities with a total value of approximately $14,000 transferred from Level 2 to Level 1. Securities that were valued using other significant observable inputs at December 31, 2014 were valued using unadjusted quoted prices at December 31, 2015. At December 31, 2015, the fair value of certain securities were adjusted due to developments which occurred between the time of the close of the foreign markets on which they trade and the close of business on the NYSE which resulted in their Level 2 classification.
3. Repurchase Agreements: The Portfolio may enter into repurchase agreements under which the Portfolio lends cash and takes possession of securities with an agreement that the counterparty will repurchase such securities.
In connection with transactions in repurchase agreements, a bank as custodian for the Portfolio takes possession of the underlying securities which are held as collateral, with a market value at least equal to the amount of the repurchase transaction, including principal and accrued interest. To the extent that any repurchase transaction exceeds one business day, the value of the collateral is marked-to-market on a daily basis to determine that the value of the collateral does not decrease below the repurchase price plus accrued interest as earned. If such a decrease occurs, additional collateral will be requested and, when received, will be added to the account to maintain full collateralization. In the event of default on the obligation to repurchase, the Portfolio has the right to liquidate the collateral and apply the proceeds in satisfaction of the obligation. In the event of default or bankruptcy by the counterparty to the agreement, realization of the collateral proceeds may be subject to cost and delays. The Portfolio, along with other affiliated investment companies, may utilize a joint trading account for the purpose of entering into repurchase agreements.
4. Foreign Currency Translation and Foreign Investments: The books and records of the Portfolio are maintained in U.S. dollars. Foreign currency amounts are translated into U.S. dollars as follows:
– investments, other assets and liabilities at the prevailing rate of exchange on the valuation date;
– investment transactions and investment income at the prevailing rates of exchange on the dates of such transactions.
Although the net assets of the Portfolio are presented at the foreign exchange rates and market values at the close of the period, the Portfolio does not isolate that portion of the results of operations arising as a result of changes in the foreign exchange rates from the fluctuations arising from changes in the market prices of securities held at period end. Similarly, the Portfolio does not isolate the effect of changes in foreign exchange rates from the fluctuations arising from changes in the market prices of securities sold during the period. Accordingly, realized and unrealized foreign currency gains (losses) on investments in securities are included in the reported net realized and unrealized gains (losses) on investment transactions and balances. However, pursuant to U.S. Federal income tax regulations, gains and losses from certain foreign currency transactions and the
19
Morgan Stanley Institutional Fund, Inc.
Annual Report — December 31, 2015
Notes to Financial Statements (cont'd)
foreign currency portion of gains and losses realized on sales and maturities of foreign denominated debt securities are treated as ordinary income for U.S. Federal income tax purposes.
Net realized gains (losses) on foreign currency transactions represent net foreign exchange gains (losses) from foreign currency forward exchange contracts, disposition of foreign currencies, currency gains (losses) realized between the trade and settlement dates on securities transactions, and the difference between the amount of investment income and foreign withholding taxes recorded on the Portfolio's books and the U.S. dollar equivalent amounts actually received or paid. Net unrealized currency gains (losses) from valuing foreign currency denominated assets and liabilities at period end exchange rates are reflected as a component of unrealized appreciation (depreciation) in the Statement of Assets and Liabilities. The change in unrealized currency gains (losses) on foreign currency translations for the period is reflected in the Statement of Operations.
Foreign security and currency transactions may involve certain considerations and risks not typically associated with those of U.S. dollar denominated transactions as a result of, among other factors, fluctuations of exchange rates in relation to the U.S. dollar, the possibility of lower levels of governmental supervision and regulation of foreign securities markets and the possibility of political or economic instability.
Governmental approval for foreign investments may be required in advance of making an investment under certain circumstances in some countries, and the extent of foreign investments in domestic companies may be subject to limitation in other countries. Foreign ownership limitations also may be imposed by the charters of individual companies to prevent, among other concerns, violations of foreign investment limitations. As a result, an additional class of shares (identified as "Foreign" in the Portfolio of Investments) may be created and offered for investment. The "local" and "foreign shares" market values may differ. In the absence of trading of the foreign shares in such markets, the Portfolio values the foreign shares at the closing exchange price of the local shares.
5. Securities Lending: The Portfolio lends securities to qualified financial institutions, such as broker-dealers, to earn additional income. Any increase or decrease in the
fair value of the securities loaned that might occur and any interest earned or dividends declared on those securities during the term of the loan would remain in the Portfolio. The Portfolio would receive cash or securities as collateral in an amount equal to or exceeding 100% of the current fair value of the loaned securities. The collateral is marked-to-market daily by State Street Bank and Trust Company ("State Street"), the securities lending agent, to ensure that a minimum of 100% collateral coverage is maintained.
Based on pre-established guidelines, the securities lending agent invests any cash collateral that is received in an affiliated money market portfolio and repurchase agreements. Securities lending income is generated from the earnings on the invested collateral and borrowing fees, less any rebates owed to the borrowers and compensation to the lending agent, and is recorded as "Income from Securities Loaned — Net" in the Portfolio's Statement of Operations. Risks in securities lending transactions are that a borrower may not provide additional collateral when required or return the securities when due, and that the value of the short-term investments will be less than the amount of cash collateral plus any rebate that is required to be returned to the borrower.
The Portfolio has the right under the lending agreement to recover the securities from the borrower on demand.
The following table presents financial instruments that are subject to enforceable netting arrangements as of December 31, 2015.
Gross Amounts Not Offset in the Statement of Assets and Liabilities | |||||||||||||||
| Gross Asset Amounts Presented in Statement of Assets and Liabilities (000) | Financial Instrument (000) | Collateral Received (000) | Net Amount (not less than $0) (000) | ||||||||||||
| $ | 4 | (a) | $ | — | $ | (4 | )(b)(c) | $ | 0 | ||||||
(a) Represents market value of loaned securities at period end.
(b) The Portfolio received cash collateral of approximately $4,000, which was subsequently invested in Repurchase Agreements and Morgan Stanley Institutional Liquidity Funds as reported in the Portfolio of Investments.
(c) The actual collateral received is greater than the amount shown here due to overcollateralization.
The Portfolio has adopted the disclosure provisions of FASB Accounting Standards Update No. 2014-11 ("ASU No. 2014-11"), "Transfers & Servicing (Topic 860): Repurchase-to-Maturity Transactions, Repurchase
20
Morgan Stanley Institutional Fund, Inc.
Annual Report — December 31, 2015
Notes to Financial Statements (cont'd)
Financings, and Disclosures". ASU No. 2014-11 is intended to provide increased transparency about the types of collateral pledged in securities lending transactions and other similar transactions that are accounted for as secured borrowing.
The following table displays a breakdown of transactions accounted for as secured borrowings, the gross obligations by class of collateral pledged, and the remaining contractual maturity of those transactions as of December 31, 2015.
Remaining Contractual Maturity of the Agreements As of December 31, 2015 | |||||||||||||||||||||||
| Overnight and Continuous (000) | <30 days (000) | Between 30 & 90 days (000) | >90 days (000) | Total (000) | |||||||||||||||||||
Securities Lending Transactions | |||||||||||||||||||||||
Common Stocks | $ | 4 | $ | — | $ | — | $ | — | $ | 4 | |||||||||||||
Total Borrowings | $ | 4 | $ | — | $ | — | $ | — | $ | 4 | |||||||||||||
Gross amount of recognized liabilities for securities lending transactions | $ | 4 | |||||||||||||||||||||
6. Structured Investments: The Portfolio invested a portion of its assets in structured investments. A structured investment is a derivative security designed to offer a return linked to a particular underlying security, currency, commodity or market. Structured investments may come in various forms including notes (such as exchange-traded notes), warrants and options to purchase securities. The Portfolio will typically use structured investments to gain exposure to a permitted underlying security, currency, commodity or market when direct access to a market is limited or inefficient from a tax or cost standpoint. There can be no assurance that structured investments will trade at the same price or have the same value as the underlying security, currency, commodity or market. Investments in structured investments involve risks including issuer risk, counterparty risk and market risk. Holders of structured investments bear risks of the underlying investment and are subject to issuer or counterparty risk because the Portfolio is relying on the creditworthiness of such issuer or counterparty and has no rights with respect to the underlying investment. Certain structured investments may be thinly traded or have a limited trading market and may have the effect of increasing the Portfolio's illiquidity to the extent that the Portfolio, at a particular time, may be unable to find qualified buyers for these securities.
7. Indemnifications: The Fund enters into contracts that contain a variety of indemnifications. The Fund's maximum exposure under these arrangements is unknown. However, the Fund has not had prior claims or losses pursuant to these contracts and expects the risk of loss to be remote.
8. Dividends and Distributions to Shareholders: Dividend income and distributions to shareholders are recorded on the ex-dividend date. Dividends from net investment income, if
any, are declared and paid annually. Net realized capital gains, if any, are distributed at least annually.
9. Security Transactions, Income and Expenses: Security transactions are accounted for on the trade date (date the order to buy or sell is executed). Realized gains and losses on the sale of investment securities are determined on the specific identified cost method. Dividend income and other distributions are recorded on the ex-dividend date (except for certain foreign dividends which may be recorded as soon as the Portfolio is informed of such dividends) net of applicable withholding taxes. Interest income is recognized on the accrual basis except where collection is in doubt. Discounts are accreted and premiums are amortized over the life of the respective securities. Most expenses of the Fund can be directly attributed to a particular Portfolio. Expenses which cannot be directly attributed are apportioned among the Portfolios based upon relative net assets or other appropriate methods. Income, expenses (other than class specific expenses — distribution and shareholder services, transfer agency and sub transfer agency fees) and realized and unrealized gains or losses are allocated to each class of shares based upon their relative net assets.
B. Advisory Fees: The Adviser, a wholly-owned subsidiary of Morgan Stanley, provides the Portfolio with advisory services under the terms of an Investment Advisory Agreement, paid quarterly, at the annual rate based on the daily net assets as follows:
| First $1 billion | Over $1 billion | ||||||
| 1.00 | % | 0.95 | % | ||||
For the year ended December 31, 2015, the advisory fee rate (net of waivers/rebate) was equivalent to an annual effective rate of 0.00% of the Portfolio's average daily net assets.
21
Morgan Stanley Institutional Fund, Inc.
Annual Report — December 31, 2015
Notes to Financial Statements (cont'd)
The Adviser has agreed to reduce its advisory fee and/or reimburse the Portfolio so that total annual portfolio operating expenses, excluding certain investment related expenses, taxes, interest and other extraordinary expenses (including litigation), will not exceed 1.35% for Class I shares, 1.70% for Class A shares, 2.20% for Class L shares and 2.45% for Class C shares. The fee waivers and/or expense reimbursements will continue for at least one year from the date of the Portfolio's prospectus or until such time as the Directors act to discontinue all or a portion of such waivers and/or reimbursements when they deem such action is appropriate. For the year ended December 31, 2015, approximately $19,000 of advisory fees were waived and approximately $169,000 of other expenses were reimbursed by the Adviser pursuant to this arrangement.
C. Administration Fees: The Adviser also serves as Administrator to the Fund and provides administrative services pursuant to an Administration Agreement for an annual fee, accrued daily and paid monthly, of 0.08% of the Portfolio's average daily net assets.
Under a Sub-Administration Agreement between the Administrator and State Street, State Street provides certain administrative services to the Fund. For such services, the Administrator pays State Street a portion of the fee the Administrator receives from the Portfolio.
D. Distribution and Shareholder Services Fees: Morgan Stanley Distribution, Inc. ("MSDI" or the "Distributor"), a wholly-owned subsidiary of the Adviser and an indirect subsidiary of Morgan Stanley, serves as the Fund's Distributor of Portfolio shares pursuant to a Distribution Agreement. The Fund has adopted a Shareholder Services Plan with respect to Class A shares pursuant to Rule 12b-1 under the Act. Under the Shareholder Services Plan, the Portfolio pays the Distributor a shareholder services fee, accrued daily and paid monthly, at an annual rate of 0.25% of the Portfolio's average daily net assets attributable to Class A shares.
The Fund has adopted a Distribution and Shareholder Services Plan with respect to Class L shares pursuant to Rule 12b-1 under the Act. Under the Distribution and Shareholder Services Plan, the Portfolio pays the Distributor a distribution fee, accrued daily and paid monthly, at an annual rate of 0.50% and a shareholder services fee, accrued daily and paid monthly, at an annual rate of 0.25% of the Portfolio's average daily net assets attributable to Class L shares.
The Fund has adopted a Distribution and Shareholder Services Plan with respect to Class C shares pursuant to Rule 12b-1 under
the Act. Under the Distribution and Shareholder Services Plan, the Portfolio pays the Distributor a distribution fee, accrued daily and paid monthly, at an annual rate of 0.75% and a shareholder services fee, accrued daily and paid monthly, at an annual rate of 0.25% of the Portfolio's average daily net assets attributable to Class C shares.
The distribution and shareholder services fees are used to support the expenses associated with servicing and maintaining accounts. The Distributor may compensate other parties for providing shareholder support services to investors who purchase Class A, Class L and Class C shares.
E. Dividend Disbursing and Transfer Agent: The Fund's dividend disbursing and transfer agent is Boston Financial Data Services, Inc. ("BFDS"). Pursuant to a Transfer Agency Agreement, the Fund pays BFDS a fee based on the number of classes, accounts and transactions relating to the Portfolios of the Fund.
F. Custodian Fees: State Street (the "Custodian") serves as Custodian for the Fund in accordance with a Custodian Agreement. The Custodian holds cash, securities, and other assets of the Fund as required by the Act. Custody fees are payable monthly based on assets held in custody, investment purchases and sales activity and account maintenance fees, plus reimbursement for certain out-of-pocket expenses.
G. Security Transactions and Transactions with Affiliates: For the year ended December 31, 2015, purchases and sales of investment securities for the Portfolio, other than long-term U.S. Government securities and short-term investments, were approximately $1,477,000 and $1,131,000, respectively. There were no purchases and sales of long-term U.S. Government securities for the year ended December 31, 2015.
The Portfolio invests in the Institutional Class of the Morgan Stanley Institutional Liquidity Funds (the "Liquidity Funds"), an open-end management investment company managed by the Adviser, both directly and as a portion of the securities held as collateral on loaned securities. Advisory fees paid by the Portfolio are reduced by an amount equal to its pro-rata share of the advisory and administration fees paid by the Portfolio due to its investment in the Liquidity Funds. For the year ended December 31, 2015, advisory fees paid were reduced by less than $500 relating to the Portfolio's investment in the Liquidity Funds.
22
Morgan Stanley Institutional Fund, Inc.
Annual Report — December 31, 2015
Notes to Financial Statements (cont'd)
A summary of the Portfolio's transactions in shares of the Liquidity Funds during the year ended December 31, 2015 is as follows:
| Value December 31, 2014 (000) | Purchases at Cost (000) | Sales (000) | Dividend Income (000) | Value December 31, 2015 (000) | |||||||||||||||
| $ | 135 | $ | 896 | $ | 1,023 | $ | — | @ | $ | 8 | |||||||||
@ Amount is less than $500.
The Portfolio has an unfunded Deferred Compensation Plan (the "Compensation Plan"), which allows each independent Director to defer payment of all, or a portion, of the fees he or she receives for serving on the Board of Directors. Each eligible Director generally may elect to have the deferred amounts credited with a return equal to the total return on one or more of the Morgan Stanley funds that are offered as investment options under the Compensation Plan. Appreciation/depreciation and distributions received from these investments are recorded with an offsetting increase/decrease in the deferred compensation obligation and do not affect the NAV of the Portfolio.
H. Federal Income Taxes: It is the Portfolio's intention to continue to qualify as a regulated investment company and distribute all of its taxable and tax-exempt income. Accordingly, no provision for Federal income taxes is required in the financial statements.
The Portfolio may be subject to taxes imposed by countries in which it invests. Such taxes are generally based on income and/or capital gains earned or repatriated. Taxes are accrued based on net investment income, net realized gains and net unrealized appreciation as such income and/or gains are earned. Taxes may also be based on transactions in foreign currency and are accrued based on the value of investments denominated in such currency.
FASB ASC 740-10, "Income Taxes — Overall", sets forth a minimum threshold for financial statement recognition of the benefit of a tax position taken or expected to be taken in a tax return. Management has concluded there are no significant uncertain tax positions that would require recognition in the financial statements. If applicable, the Portfolio recognizes interest accrued related to unrecognized tax benefits in "Interest Expense" and penalties in "Other Expenses" in the Statement of Operations. The Portfolio files tax returns with the U.S. Internal Revenue Service, New York and various states. Generally, each of the tax years in the four-year period ended December 31, 2015, remains subject to examination by taxing authorities.
The tax character of distributions paid may differ from the character of distributions shown in the Statements of Changes in Net Assets due to short-term capital gains being treated as ordinary income for tax purposes. The tax character of distributions paid during fiscal 2015 and 2014 was as follows:
| 2015 Distributions Paid From: | 2014 Distributions Paid From: | ||||||||||||||
| Ordinary Income (000) | Long-Term Capital Gain (000) | Ordinary Income (000) | Long-Term Capital Gain (000) | ||||||||||||
| $ | 110 | $ | 54 | $ | 93 | $ | 109 | ||||||||
The amount and character of income and gains to be distributed are determined in accordance with income tax regulations which may differ from GAAP. These book/tax differences are either considered temporary or permanent in nature.
Temporary differences are primarily due to differing book and tax treatments in the timing of the recognition of gains (losses) on certain investment transactions and the timing of the deductibility of certain expenses.
Permanent differences, primarily due to differing treatments of gains (losses) related to foreign currency transactions and basis adjustments on certain equity securities designated as passive foreign investment companies, resulted in the following reclassifications among the components of net assets at December 31, 2015:
| Distributions in Excess of Net Investment Income (000) | Distributions in Excess of Net Realized Gain (000) | Paid-in- Capital (000) | |||||||||
| $ | 18 | $ | (17 | ) | $ | (1 | ) | ||||
At December 31, 2015, the Portfolio had no distributable earnings on a tax basis.
Capital losses and specified ordinary losses, including currency losses, incurred after October 31 but within the taxable year are deemed to arise on the first day of the Portfolio's next taxable year. For the year ended December 31, 2015, the Portfolio deferred to January 1, 2016 for U.S. Federal income tax purposes the following losses:
| Post-October Currency and Specified Ordinary Losses (000) | Post-October Capital Losses (000) | ||||||
| $ | 2 | $ | 20 | ||||
I. Other: At December 31, 2015, the Portfolio had record owners of 10% or greater. Investment activities of these shareholders could have a material impact on the Portfolio. The aggregate percentage of such owners was 71.3%.
23
Morgan Stanley Institutional Fund, Inc.
Annual Report — December 31, 2015
Report of Independent Registered Public Accounting Firm
To the Shareholders and Board of Directors of
Morgan Stanley Institutional Fund, Inc. —
Global Insight Portfolio
We have audited the accompanying statement of assets and liabilities, including the portfolio of investments, of Global Insight Portfolio (one of the portfolios constituting Morgan Stanley Institutional Fund, Inc.) (the "Portfolio") as of December 31, 2015, and the related statement of operations for the year then ended, the statements of changes in net assets for each of the two years in the period then ended and the financial highlights for each of the years or periods indicated therein. These financial statements and financial highlights are the responsibility of the Portfolio's management. Our responsibility is to express an opinion on these financial statements and financial highlights based on our audits.
We conducted our audits in accordance with the standards of the Public Company Accounting Oversight Board (United States). Those standards require that we plan and perform the audit to obtain reasonable assurance about whether the financial statements and financial highlights are free of material misstatement. We were not engaged to perform an audit of the Portfolio's internal control over financial reporting. Our audits included consideration of internal control over financial reporting as a basis for designing audit procedures that are appropriate in the circumstances, but not for the purpose of expressing an opinion on the effectiveness of the Portfolio's internal control over financial reporting. Accordingly, we express no such opinion. An audit also includes examining, on a test basis, evidence supporting the amounts and disclosures in the financial statements and financial highlights, assessing the accounting principles used and significant estimates made by management, and evaluating the overall financial statement presentation. Our procedures included confirmation of securities owned as of December 31, 2015, by correspondence with the custodian and others or by other appropriate auditing procedures where replies from others were not received. We believe that our audits provide a reasonable basis for our opinion.
In our opinion, the financial statements and financial highlights referred to above present fairly, in all material respects, the financial position of Global Insight Portfolio (one of the portfolios constituting Morgan Stanley Institutional Fund, Inc.) at December 31, 2015, the results of its operations for the year then ended, the changes in its net assets for each of the two years in the period then ended and the financial highlights for each of the years or periods indicated therein, in conformity with U.S. generally accepted accounting principles.

Boston, Massachusetts
February 26, 2016
24
Morgan Stanley Institutional Fund, Inc.
Annual Report — December 31, 2015
Federal Tax Notice (unaudited)
For Federal income tax purposes, the following information is furnished with respect to the distributions paid by the Portfolio during its taxable year ended December 31, 2015. For corporate shareholders, 9.5% of the dividends qualified for the dividends received deduction.
The Portfolio designated and paid approximately $54,000 as a long-term capital gain distribution.
For Federal income tax purposes, the following information is furnished with respect to the Portfolio's earnings for its taxable year ended December 31, 2015. When distributed, certain earnings may be subject to a maximum tax rate of 15% as provided for the Jobs and Growth Tax Relief Reconciliation Act of 2003. The Portfolio designated up to a maximum of approximately $27,000 as taxable at this lower rate.
In January, the Portfolio provides tax information to shareholders for the preceding calendar year.
25
Morgan Stanley Institutional Fund, Inc.
Annual Report — December 31, 2015
U.S. Privacy Policy (unaudited)
AN IMPORTANT NOTICE CONCERNING OUR U.S. PRIVACY POLICY
This privacy notice describes the U.S. privacy policy of Morgan Stanley Distribution, Inc., and the Morgan Stanley family of mutual funds ("us", "our", "we").
We are required by federal law to provide you with notice of our U.S. privacy policy ("Policy"). This Policy applies to both our current and former clients unless we state otherwise and is intended for individual clients who purchase products or receive services from us for personal, family or household purposes. This Policy is not applicable to partnerships, corporations, trusts or other non-individual clients or account holders, nor is this Policy applicable to individuals who are either beneficiaries of a trust for which we serve as trustee or participants in an employee benefit plan administered or advised by us. This Policy is, however, applicable to individuals who select us to be a custodian of securities or assets in individual retirement accounts, 401(k) accounts, or accounts subject to the Uniform Gifts to Minors Act.
This notice sets out our business practices to protect your privacy; how we collect and share personal information about you; and how you can limit our sharing or certain uses by others of this information. We may amend this Policy at any time, and will inform you of any changes to our Policy as required by law.
WE RESPECT YOUR PRIVACY
We appreciate that you have provided us with your personal financial information and understand your concerns about your information. We strive to safeguard the information our clients entrust to us. Protecting the confidentiality and security of client information is an important part of how we conduct our business.
This notice describes what personal information we collect about you, how we collect it, when we may share it with others, and how certain others may use it. It discusses the steps you may take to limit our sharing of certain information about you with our affiliated companies, including, but not limited to our affiliated banking businesses, brokerage firms and credit service affiliates. It also discloses how you may limit our affiliates' use of shared information for marketing purposes.
Throughout this Policy, we refer to the nonpublic information that personally identifies you as "personal information." We also use the term "affiliated company" in this notice. An affiliated company is a company in our family of companies and includes companies with the Morgan Stanley name. These affiliated companies are financial institutions such as broker-dealers, banks, investment advisers and credit card issuers. We refer to any company that is not an affiliated company as a nonaffiliated third party. For purposes of Section 5 of this notice, and your ability to limit certain uses of personal information by our affiliates, this notice applies to the use of personal information by our affiliated companies.
1. WHAT PERSONAL INFORMATION DO WE COLLECT FROM YOU?
We may collect the following types of information about you: (i) information provided by you, including information from applications and other forms we receive from you, (ii) information about your transactions with us or our affiliates, (iii) information about your transactions with nonaffiliated third parties, (iv) information from consumer reporting agencies, (v) information obtained from our websites, and (vi) information obtained from other sources. For example:
• We collect information such as your name, address, e-mail address, telephone/fax numbers, assets, income and investment objectives through applications and other forms you submit to us.
• We may obtain information about account balances, your use of account(s) and the types of products and services you prefer to receive from us through your dealings and transactions with us and other sources.
• We may obtain information about your creditworthiness and credit history from consumer reporting agencies.
• We may collect background information from and through third-party vendors to verify representations you have made and to comply with various regulatory requirements.
2. WHEN DO WE DISCLOSE PERSONAL INFORMATION WE COLLECT ABOUT YOU?
We may disclose personal information we collect about you in each of the categories listed above to affiliated and nonaffiliated third parties.
26
Morgan Stanley Institutional Fund, Inc.
Annual Report — December 31, 2015
U.S. Privacy Policy (unaudited) (cont'd)
a. Information We Disclose to Affiliated Companies.
We may disclose personal information that we collect about you to our affiliated companies to manage your account(s) effectively, to service and process your transactions, and to let you know about products and services offered by us and affiliated companies, to manage our business, and as otherwise required or permitted by law. Offers for products and services from affiliated companies are developed under conditions designed to safeguard your personal information.
b. Information We Disclose to Third Parties.
We may disclose personal information that we collect about you to nonaffiliated third parties to provide marketing services on our behalf or to other financial institutions with whom we have joint marketing agreements. We may also disclose all of the information we collect to other nonaffiliated third parties for our everyday business purposes, such as to process transactions, maintain account(s), respond to court orders and legal investigations, report to credit bureaus, offer our own products and services, protect against fraud, for institutional risk control, to perform services on our behalf, and as otherwise required or permitted by law.
When we share personal information about you with a nonaffiliated third party, they are required to limit their use of personal information about you to the particular purpose for which it was shared and they are not allowed to share personal information about you with others except to fulfill that limited purpose or as may be permitted or required by law.
3. HOW DO WE PROTECT THE SECURITY AND CONFIDENTIALITY OF PERSONAL INFORMATION WE COLLECT ABOUT YOU?
We maintain physical, electronic and procedural security measures that comply with applicable law and regulations to help safeguard the personal information we collect about you. We have internal policies governing the proper handling of client information by employees. Third parties that provide support or marketing services on our behalf may also receive personal information about you, and we require them to adhere to appropriate security standards with respect to such information.
4. HOW CAN YOU LIMIT OUR SHARING CERTAIN PERSONAL INFORMATION ABOUT YOU WITH OUR AFFILIATED COMPANIES FOR ELIGIBILITY DETERMINATION?
By following the opt-out procedures in Section 6 below, you may limit the extent to which we share with our affiliated companies, personal information that was collected to determine your eligibility for products and services such as your credit reports and other information that you have provided to us or that we may obtain from third parties ("eligibility information"). Eligibility information does not include your identification information or personal information pertaining to our transactions or experiences with you. Please note that, even if you direct us not to share eligibility information with our affiliated companies, we may still share your personal information, including eligibility information, with our affiliated companies under circumstances that are permitted under applicable law, such as to process transactions or to service your account.
5. HOW CAN YOU LIMIT THE USE OF CERTAIN PERSONAL INFORMATION ABOUT YOU BY OUR AFFILIATED COMPANIES FOR MARKETING?
By following the opt-out instructions in Section 6 below, you may limit our affiliated companies from marketing their products or services to you based on personal information we disclose to them. This information may include, for example, your income and account history with us. Please note that, even if you choose to limit our affiliated companies from using personal information about you that we may share with them for marketing their products and services to you, our affiliated companies may use your personal information that they obtain from us to market to you in circumstances permitted by law, such as if the affiliated party has its own relationship with you.
27
Morgan Stanley Institutional Fund, Inc.
Annual Report — December 31, 2015
U.S. Privacy Policy (unaudited) (cont'd)
6. HOW CAN YOU SEND US AN OPT-OUT INSTRUCTION?
If you wish to limit our sharing of eligibility information about you with our affiliated companies, or our affiliated companies' use of personal information for marketing purposes, as described in this notice, you may do so by:
• Calling us at (800) 548-7786
Monday–Friday between 8a.m. and 6p.m. (EST)
• Writing to us at the following address:
Boston Financial Data Services, Inc.
c/o Privacy Coordinator
P.O. Box 219804
Kansas City, Missouri 64121
If you choose to write to us, your request should include: your name, address, telephone number and account number(s) to which the opt-out applies and whether you are opting out with respect to sharing of eligibility information (Section 4 above), or information used for marketing (Section 5 above), or both. Written opt-out requests should not be sent with any other correspondence. In order to process your request, we require that the request be provided by you directly and not through a third party. Once you have informed us about your privacy preferences, your opt-out preference will remain in effect with respect to this Policy (as it may be amended) until you notify us otherwise. If you are a joint account owner, we will accept instructions from any one of you and apply those instructions to the entire account.
Please understand that if you limit our sharing or our affiliated companies' use of personal information, you and any joint account holder(s) may not receive information about our affiliated companies' products and services, including products or services that could help you manage your financial resources and achieve your investment objectives.
If you have more than one account or relationship with us, please specify the accounts to which you would like us to apply your privacy choices. If you have accounts or relationships with our affiliates, you may receive multiple privacy policies from them, and will need to separately notify those companies of your privacy choices for those accounts or relationships.
7. WHAT IF AN AFFILIATED COMPANY BECOMES A NONAFFILIATED THIRD PARTY?
If, at any time in the future, an affiliated company becomes a nonaffiliated third party, further disclosures of personal information made to the former affiliated company will be limited to those described in Section 2(b) above relating to nonaffiliated third parties. If you elected under Section 6 to limit disclosures we make to affiliated companies, or use of personal information by affiliated companies, your election will not apply to use by any former affiliated company of your personal information in their possession once it becomes a nonaffiliated third party.
SPECIAL NOTICE TO RESIDENTS OF VERMONT
The following section supplements our Policy with respect to our individual clients who have a Vermont address and supersedes anything to the contrary in the above Policy with respect to those clients only.
The State of Vermont requires financial institutions to obtain your consent prior to sharing personal information that they collect about you with nonaffiliated third parties, or eligibility information with affiliated companies, other than in certain limited circumstances. Except as permitted by law, we will not share personal information we collect about you with nonaffiliated third parties or eligibility information with affiliated companies, unless you provide us with your written consent to share such information.
SPECIAL NOTICE TO RESIDENTS OF CALIFORNIA
The following section supplements our Policy with respect to our individual clients who have a California address and supersedes anything to the contrary in the above Policy with respect to those clients only.
In response to a California law, if your account has a California home address, your personal information will not be disclosed to nonaffiliated third parties except as permitted by applicable California law, and we will limit sharing such personal information with our affiliates to comply with California privacy laws that apply to us.
28
Morgan Stanley Institutional Fund, Inc.
Annual Report — December 31, 2015
Director and Officer Information (unaudited)
Independent Directors:
| Name, Age and Address of Independent Director | Positions(s) Held with Registrant | Length of Time Served* | Principal Occupation(s) During Past 5 Years and Other Relevant Professional Experience | Number of Portfolios in Fund Complex Overseen by Director** | Other Directorships Held by Independent Director*** | ||||||||||||||||||
| Frank L. Bowman (71) c/o Kramer Levin Naftalis & Frankel LLP Counsel to the Independent Directors 1177 Avenue of the Americas New York, NY 10036 | Director | Since August 2006 | President, Strategic Decisions, LLC (consulting) (since February 2009); Director or Trustee of various Morgan Stanley Funds (since August 2006); Chairperson of the Compliance and Insurance Committee (since October 2015); Formerly, Chairperson of the Insurance Sub-Committee of the Compliance and Insurance Committee (February 2007-December 2015); served as President and Chief Executive Officer of the Nuclear Energy Institute (policy organization) (February 2005-November 2008); retired as Admiral, U.S. Navy after serving over 38 years on active duty including 8 years as Director of the Naval Nuclear Propulsion Program in the Department of the Navy and the U.S. Department of Energy (1996-2004); served as Chief of Naval Personnel (July 1994-September 1996); and on the Joint Staff as Director of Political Military Affairs (June 1992-July1994); knighted as Honorary Knight Commander of the Most Excellent Order of the British Empire; awarded the Officier de l'Orde National du Mérite by the French Government; elected to the National Academy of Engineering (2009). | 98 | Director of BP p.l.c.; Director of Naval and Nuclear Technologies LLP; Director Emeritus of the Armed Services YMCA; Director of the U.S. Naval Submarine League; Member of the National Security Advisory Council of the Center for U.S. Global Engagement and a member of the CNA Military Advisory Board; Chairman of the Charity, J Street Cup Golf, Trustee of Fairhaven United Methodist Church; and Director of other various non-profit organizations. | ||||||||||||||||||
| Kathleen A. Dennis (62) c/o Kramer Levin Naftalis & Frankel LLP Counsel to the Independent Directors 1177 Avenue of the Americas New York, NY 10036 | Director | Since August 2006 | President, Cedarwood Associates (mutual fund and investment management consulting) (since July 2006); Chairperson of the Money Market and Alternatives Sub-Committee of the Investment Committee (since October 2006) and Director or Trustee of various Morgan Stanley Funds (since August 2006); formerly, Senior Managing Director of Victory Capital Management (1993-2006). | 98 | Director of various nonprofit organizations. | ||||||||||||||||||
| Nancy C. Everett (61) c/o Kramer Levin Naftalis & Frankel LLP Counsel to the Independent Trustees 1177 Avenue of the Americas New York, NY 10036 | Trustee | Since January 2015 | Chief Executive Officer, Virginia Commonwealth University Investment Company (since November 2015); Owner OBIR, LLC (institutional investment management consulting) (since June 2014); formerly, Managing Director, BlackRock, Inc. (February 2011-December 2013); and Chief Executive Officer, General Motors Asset Management (a/k/a Promark Global Advisors, Inc.) (June 2005-May 2010). | 98 | Member of Virginia Commonwealth University School of Business Foundation; formerly, Member of Virginia Commonwealth University Board of Visitors (2013-2015); Member of Committee on Directors for Emerging Markets Growth Fund, Inc. (2007-2010); Chairperson of Performance Equity Management, LLC (2006-2010); and Chairperson, GMAM Absolute Return Strategies Fund, LLC (2006-2010). | ||||||||||||||||||
29
Morgan Stanley Institutional Fund, Inc.
Annual Report — December 31, 2015
Director and Officer Information (unaudited) (cont'd)
Independent Directors: (cont'd)
| Name, Age and Address of Independent Director | Positions(s) Held with Registrant | Length of Time Served* | Principal Occupation(s) During Past 5 Years and Other Relevant Professional Experience | Number of Portfolios in Fund Complex Overseen by Director** | Other Directorships Held by Independent Director*** | ||||||||||||||||||
| Jakki L. Haussler (58) c/o Kramer Levin Naftalis & Frankel LLP Counsel to the Independent Directors 1177 Avenue of the Americas New York, NY 10036 | Director | Since January 2015 | Chairman and Chief Executive Officer, Opus Capital Group (since January 1996); and formerly, Director, Capvest Venture Fund, LP (May 2000-December 2011); Partner, Adena Ventures, LP (July 1999-December 2010); Director, The Victory Funds (February 2005-July 2008). | 98 | Director of Cincinnati Bell Inc. and Member, Audit Committee and Compensation Committee; Director of Northern Kentucky University Foundation and Member, Investment Committee; Member of Chase College of Law Transactional Law Practice Center Board of Advisors; Director of Best Transport; Chase College of Law Board of Visitors; formerly Member, University of Cincinnati Foundation Investment Committee; Member, Miami University Board of Visitors (2008-2011); Trustee of Victory Funds (2005-2008) and Chairman, Investment Committee (2007-2008) and Member, Service Provider Committee (2005-2008). | ||||||||||||||||||
| Dr. Manuel H. Johnson (67) c/o Johnson Smick International, Inc. 220 I Street, N.E. — Suite 200 Washington, D.C. 20002 | Director | Since July 1991 | Senior Partner, Johnson Smick International, Inc. (consulting firm); Chairperson of the Investment Committee (since October 2006) and Director or Trustee of various Morgan Stanley Funds (since July 1991); Co-Chairman and a founder of the Group of Seven Council (G7C) (international economic commission); formerly Chairperson of the Audit Committee (July 1991-September 2006), Vice Chairman of the Board of Governors of the Federal Reserve System and Assistant Secretary of the U.S. Treasury. | 100 | Director of NVR, Inc. (home construction). | ||||||||||||||||||
| Joseph J. Kearns (73) c/o Kearns & Associates LLC 23823 Malibu Road S-50-440 Malibu, CA 90265 | Director | Since August 1994 | President, Kearns & Associates LLC (investment consulting); Chairperson of the Audit Committee (since October 2006) and Director or Trustee of various Morgan Stanley Funds (since August 1994); formerly, Deputy Chairperson of the Audit Committee (July 2003-September 2006) and Chairperson of the Audit Committee of various Morgan Stanley Funds (since August 1994); CFO of the J. Paul Getty Trust. | 101 | Director of Electro Rent Corporation (equipment leasing). Prior to December 31, 2013, Director of The Ford Family Foundation. | ||||||||||||||||||
30
Morgan Stanley Institutional Fund, Inc.
Annual Report — December 31, 2015
Director and Officer Information (unaudited) (cont'd)
Independent Directors: (cont'd)
| Name, Age and Address of Independent Director | Positions(s) Held with Registrant | Length of Time Served* | Principal Occupation(s) During Past 5 Years and Other Relevant Professional Experience | Number of Portfolios in Fund Complex Overseen by Director** | Other Directorships Held by Independent Director*** | ||||||||||||||||||
| Michael F. Klein (57) c/o Kramer Levin Naftalis & Frankel LLP Counsel to the Independent Directors 1177 Avenue of the Americas New York, NY 10036 | Director | Since August 2006 | Managing Director, Aetos Capital, LLC (since March 2000); Co-President, Aetos Alternatives Management, LLC (since January 2004); and Co-Chief Executive Officer of Aetos Capital LLC (since August 2013); Chairperson of the Fixed Income Sub-Committee of the Investment Committee (since October 2006) and Director or Trustee of various Morgan Stanley Funds (since August 2006); formerly, Managing Director, Morgan Stanley & Co. Inc. and Morgan Stanley Dean Witter Investment Management, President, various Morgan Stanley Funds (June 1998-March 2000) and Principal, Morgan Stanley & Co. Inc. and Morgan Stanley Dean Witter Investment Management (August 1997-December 1999). | 97 | Director of certain investment funds managed or sponsored by Aetos Capital, LLC. Director of Sanitized AG and Sanitized Marketing AG (specialty chemicals). | ||||||||||||||||||
| Michael E. Nugent (79) 522 Fifth Avenue New York, NY 10036 | Chair of the Board and Director | Chair of the Boards since July 2006 and Director since July 1991 | Chair of the Boards of various Morgan Stanley Funds (since July 2006); Chairperson of the Closed-End Fund Committee (since June 2012) and Director or Trustee of various Morgan Stanley Funds (since July 1991); formerly, Chairperson of the Insurance Committee (until July 2006), General Partner, TriumphCapital, L.P. (private investment partnership) (1988-2013). | 100 | None. | ||||||||||||||||||
| W. Allen Reed (68) c/o Kramer Levin Naftalis & Frankel LLP Counsel to the Independent Directors 1177 Avenue of the Americas New York, NY 10036 | Director | Since August 2006 | Chairperson of the Equity Sub-Committee of the Investment Committee (since October 2006) and Director or Trustee of various Morgan Stanley Funds (since August 2006); formerly, President and CEO of General Motors Asset Management; Chairman and Chief Executive Officer of the GM Trust Bank and Corporate Vice President of General Motors Corporation (August 1994-December 2005). | 98 | Director of Legg Mason, Inc.; formerly Director of the Auburn University Foundation (2010-2015). | ||||||||||||||||||
| Fergus Reid (83) c/o Joe Pietryka, Inc. 85 Charles Colman Blvd. Pawling, NY 12564 | Director | Since June 1992 | Chairman, Joe Pietryka, Inc.; Chairperson of the Governance Committee and Director or Trustee of various Morgan Stanley Funds (since June 1992). | 100 | Formerly, Trustee and Director of certain investment companies in the JP Morgan Fund Complex managed by JP Morgan Investment Management Inc. (1987-2012). | ||||||||||||||||||
31
Morgan Stanley Institutional Fund, Inc.
Annual Report — December 31, 2015
Director and Officer Information (unaudited) (cont'd)
Interested Director:
| Name, Age and Address of Interested Director | Positions(s) Held with Registrant | Length of Time Served* | Principal Occupation(s) During Past 5 Years | Number of Portfolios in Fund Complex Overseen by Interested Director** | Other Directorships Held by Interested Director*** | ||||||||||||||||||
| James F. Higgins (68) One New York Plaza, New York, NY 10004 | Director | Since June 2000 | Director or Trustee of various Morgan Stanley Funds (since June 2000); Senior Advisor of Morgan Stanley (since August 2000). | 99 | Formerly, Director of AXA Financial, Inc. and AXA Equitable Life Insurance Company (2002-2011) and Director of AXA MONY Life Insurance Company and AXA MONY Life Insurance Company of America (2004-2011). | ||||||||||||||||||
* This is the earliest date the Director began serving the Morgan Stanley Funds. Each Director serves an indefinite term, until his or her successor is elected.
** The Fund Complex includes (as of December 31, 2015) all open-end and closed-end funds (including all of their portfolios) advised by Morgan Stanley Investment Management Inc. (the "Adviser") and any funds that have an adviser that is an affiliated person of the Adviser (including, but not limited to, Morgan Stanley AIP GP LP).
*** This includes any directorships at public companies and registered investment companies held by the Director at any time during the past five years.
Executive Officers:
Name, Age and Address of Executive Officer | Position(s) Held with Registrant | Length of Time Served**** | Principal Occupation(s) During Past 5 Years | ||||||||||||
| John H. Gernon (52) 522 Fifth Avenue New York, NY 10036 | President and Principal Executive Officer | Since September 2013 | President and Principal Executive Officer of the Equity and Fixed Income Funds and the Morgan Stanley AIP Funds (since September 2013) and the Liquidity Funds and various money market funds (since May 2014) in the Fund Complex, Managing Director of the Adviser; Head of Product (since 2006). | ||||||||||||
| Stefanie V. Chang Yu (49) 522 Fifth Avenue New York, NY 10036 | Chief Compliance Officer | Since December 1997 | Managing Director of the Adviser and various entities affiliated with the Adviser; Chief Compliance Officer of various Morgan Stanley Funds and the Adviser (since January 2014); formerly, Vice President of various Morgan Stanley Funds (December 1997-January 2014). | ||||||||||||
| Joseph C. Benedetti (50) 522 Fifth Avenue New York, NY 10036 | Vice President | Since January 2014 | Managing Director of the Adviser and various entities affiliated with the Adviser; Vice President of various Morgan Stanley Funds (since January 2014); formerly, Assistant Secretary of various Morgan Stanley Funds (October 2004-January 2014). | ||||||||||||
| Francis J. Smith (50) 522 Fifth Avenue New York, NY 10036 | Treasurer and Principal Financial Officer | Treasurer since July 2003 and Principal Financial Officer since September 2002 | Executive Director of the Adviser and various entities affiliated with the Adviser; Treasurer (since July 2003) and Principal Financial Officer of various Morgan Stanley Funds (since September 2002). | ||||||||||||
| Mary E. Mullin (48) 522 Fifth Avenue New York, NY 10036 | Secretary | Since June 1999 | Executive Director of the Adviser; Secretary of various Morgan Stanley Funds (since June 1999). | ||||||||||||
**** This is the earliest date the officer began serving the Morgan Stanley Funds. Each officer serves a one-year term, until his or her successor is elected and has qualified.
32
Morgan Stanley Institutional Fund, Inc.
Annual Report — December 31, 2015
Adviser and Administrator
Morgan Stanley Investment Management Inc.
522 Fifth Avenue
New York, New York 10036
Distributor
Morgan Stanley Distribution, Inc.
522 Fifth Avenue
New York, New York 10036
Dividend Disbursing and Transfer Agent
Boston Financial Data Services, Inc.
2000 Crown Colony Drive
Quincy, Massachusetts 02169
Custodian
State Street Bank and Trust Company
One Lincoln Street
Boston, Massachusetts 02111
Legal Counsel
Dechert LLP
1095 Avenue of the Americas
New York, New York 10036
Counsel to the Independent Directors
Kramer Levin Naftalis & Frankel LLP
1177 Avenue of the Americas
New York, New York 10036
Independent Registered Public Accounting Firm
Ernst & Young LLP
200 Clarendon Street
Boston, Massachusetts 02116
Reporting to Shareholders
Each Morgan Stanley fund provides a complete schedule of portfolio holdings in its semi-annual and annual reports within 60 days of the end of the fund's second and fourth fiscal quarters. The semi-annual and annual reports are filed electronically with the Securities and Exchange Commission (SEC) on Form N-CSRS and Form N-CSR, respectively. Morgan Stanley also delivers the semi-annual and annual reports to fund shareholders and makes these reports available on its public website, www.morganstanley.com/im. Each Morgan Stanley fund also files a complete schedule of portfolio holdings with the SEC for the fund's first and third fiscal quarters on Form N-Q. Morgan Stanley does not deliver the reports for the first and third fiscal quarters to shareholders, nor are the reports posted to the Morgan Stanley public website. You may, however, obtain the Form N-Q filings (as well as the Form N-CSR and N-CSRS filings) by accessing the SEC's website, www.sec.gov. You may also review and copy them at the SEC's Public Reference Room in Washington, DC. Information on the operation of the SEC's Public Reference Room may be obtained by calling the SEC toll free at 1 (800) SEC-0330. You can also request copies of these materials, upon payment of a duplicating fee, by electronic request at the SEC's email address (publicinfo@sec.gov) or by writing the Public Reference Room of the SEC, Washington, DC 20549-0102.
Proxy Voting Policies and Procedures and Proxy Voting Record
You may obtain a copy of the Fund's Proxy Voting Policy and Procedures and information regarding how the Fund voted proxies relating to portfolio securities during the most recent twelve-month period ended June 30, without charge, upon request, by calling toll free 1 (800) 548-7786 or by visiting our website at www.morganstanley.com/im. This information is also available on the SEC's website at www.sec.gov.
This report is authorized for distribution only when preceded or accompanied by a prospectus of the Morgan Stanley Institutional Fund, Inc., which describes in detail each Portfolio's investment policies, risks, fees and expenses. Please read the prospectus carefully before you invest or send money. For additional information, including information regarding the investments comprising the Portfolio, please visit our website at www.morganstanley.com/im or call toll free 1 (800) 548-7786.
33
Printed in U.S.A.
This Report has been prepared for shareholders and may be distributed to others only if preceded or accompanied by a current prospectus.
Morgan Stanley Investment Management Inc.
522 Fifth Avenue
New York, New York 10036
© 2016 Morgan Stanley. Morgan Stanley Distribution, Inc.

IFIGIANN
1406350 EXP. 02.28.17
INVESTMENT MANAGEMENT

Morgan Stanley Institutional Fund, Inc.
Emerging Markets Fixed Income Opportunities Portfolio
(formerly Emerging Markets External Debt Portfolio)
Annual Report
December 31, 2015

Morgan Stanley Institutional Fund, Inc.
Annual Report — December 31, 2015
Table of Contents
Shareholders' Letter | 2 | ||||||
Expense Example | 3 | ||||||
Investment Overview | 4 | ||||||
Portfolio of Investments | 8 | ||||||
Statement of Assets and Liabilities | 12 | ||||||
Statement of Operations | 14 | ||||||
Statements of Changes in Net Assets | 15 | ||||||
Financial Highlights | 17 | ||||||
Notes to Financial Statements | 22 | ||||||
Report of Independent Registered Public Accounting Firm | 31 | ||||||
U.S. Privacy Policy | 32 | ||||||
Director and Officer Information | 35 | ||||||
This report is authorized for distribution only when preceded or accompanied by prospectuses of the Morgan Stanley Institutional Fund, Inc. To receive a prospectus and/or statement of additional information (SAI), which contains more complete information such as investment objectives, charges, expenses, policies for voting proxies, risk considerations, and describes in detail each of the Portfolio's investment policies to the prospective investor, please call toll free 1 (800) 548-7786. Please read the prospectuses carefully before you invest or send money.
Additionally, you can access portfolio information including performance, characteristics, and investment team commentary through Morgan Stanley Investment Management's website: www.morganstanley.com/im.
Market forecasts provided in this report may not necessarily come to pass. There is no guarantee that any sectors mentioned will continue to perform as discussed herein or that securities in such sectors will be held by the Portfolio in the future. There is no assurance that a Portfolio will achieve its investment objective. Portfolios are subject to market risk, which is the possibility that market values of securities owned by the Portfolio will decline and, therefore, the value of the Portfolio's shares may be less than what you paid for them. Accordingly, you can lose money investing in this Portfolio. Please see the prospectus for more complete information on investment risks.
1
Morgan Stanley Institutional Fund, Inc.
Annual Report — December 31, 2015
Shareholders' Letter (unaudited)
Dear Shareholders,
We are pleased to provide this Annual report, in which you will learn how your investment in Emerging Markets Fixed Income Opportunities Portfolio (the "Portfolio") performed during the latest twelve-month period.
Morgan Stanley Investment Management is a client-centric, investor-led organization. Our global presence, intellectual capital, and breadth of products and services enable us to partner with investors to meet the evolving challenges of today's financial markets. We aim to deliver superior investment service and to empower our clients to make the informed decisions that help them reach their investment goals.
As always, we thank you for selecting Morgan Stanley Investment Management, and look forward to working with you in the months and years ahead.
Sincerely,

John H. Gernon
President and Principal Executive Officer
January 2016
2
Morgan Stanley Institutional Fund, Inc.
Annual Report — December 31, 2015
Expense Example (unaudited)
Emerging Markets Fixed Income Opportunities Portfolio
As a shareholder of the Portfolio, you incur two types of costs: (1) transactional costs, including redemptions fees; and (2) ongoing costs, including advisory fees, administration fees, distribution and shareholder services fees and other Portfolio expenses. This example is intended to help you understand your ongoing costs (in dollars) of investing in the Portfolio and to compare these costs with the ongoing costs of investing in other mutual funds.
This example is based on an investment of $1,000 invested at the beginning of the six-month period ended December 31, 2015 and held for the entire six-month period.
Actual Expenses
The table below provides information about actual account values and actual expenses. You may use the information in this table, together with the amount you invested, to estimate the expenses that you paid over the period. Simply divide your account value by $1,000 (for example, an $8,600 account value divided by $1,000 = 8.6), then multiply the result by the number in the table under the heading entitled "Actual Expenses Paid During Period" to estimate the expenses you paid on your account during this period.
Hypothetical Example for Comparison Purposes
The table below provides information about hypothetical account values and hypothetical expenses based on the Portfolio's actual expense ratio and an assumed rate of return of 5% per year before expenses, which is not the Portfolio's actual return. The hypothetical account values and expenses may not be used to estimate the actual ending account balance or expenses you paid for the period. You may use this information to compare the ongoing costs of investing in the Portfolio and other funds. To do so, compare this 5% hypothetical example with the 5% hypothetical examples that appear in the shareholder reports of the other funds.
Please note that the expenses shown in the table are meant to highlight your ongoing costs only and do not reflect any transactional costs, such as sales charges (loads) and redemption fees. Therefore, the information for each class in the table is useful in comparing ongoing costs only, and will not help you determine the relative total costs of owning different funds. In addition, if these transactional costs were included, your costs would have been higher.
| Beginning Account Value 7/1/15 | Actual Ending Account Value 12/31/15 | Hypothetical Ending Account Value | Actual Expenses Paid During Period* | Hypothetical Expenses Paid During Period* | Net Expense Ratio During Period** | ||||||||||||||||||||||
| Emerging Markets Fixed Income Opportunities Portfolio Class I | $ | 1,000.00 | $ | 969.30 | $ | 1,021.02 | $ | 4.12 | $ | 4.23 | 0.83 | % | |||||||||||||||
| Emerging Markets Fixed Income Opportunities Portfolio Class A | 1,000.00 | 967.20 | 1,019.16 | 5.95 | 6.11 | 1.20 | |||||||||||||||||||||
| Emerging Markets Fixed Income Opportunities Portfolio Class L | 1,000.00 | 964.90 | 1,017.90 | 7.18 | 7.37 | 1.45 | |||||||||||||||||||||
| Emerging Markets Fixed Income Opportunities Portfolio Class C | 1,000.00 | 962.90 | 1,015.38 | 9.65 | 9.91 | 1.95 | |||||||||||||||||||||
| Emerging Markets Fixed Income Opportunities Portfolio Class IS | 1,000.00 | 968.30 | 1,021.07 | 4.07 | 4.18 | 0.82 | |||||||||||||||||||||
* Expenses are calculated using each Portfolio Class' annualized net expense ratio (as disclosed), multiplied by the average account value over the period, and multiplied by 184/365 (to reflect the most recent one-half year period).
** Annualized.
3
Morgan Stanley Institutional Fund, Inc.
Annual Report — December 31, 2015
Investment Overview (unaudited)
Emerging Markets Fixed Income Opportunities Portfolio
The Portfolio seeks high total return by investing at least 80% of its assets in debt securities of issuers located in emerging market countries, which may include U.S. dollar-denominated, local currency, and corporate debt securities.
Performance
Following close of business on September 25, 2015, Morgan Stanley Institutional Fund, Inc. Emerging Markets Domestic Debt Portfolio merged into Morgan Stanley Institutional Fund, Inc. Emerging Markets External Debt Portfolio. In conjunction with this Reorganization, the Portfolio was renamed Morgan Stanley Institutional Fund, Inc. Emerging Markets Fixed Income Opportunities Portfolio and changed its principal investment policy. In addition, effective on the consummation of the Reorganization, the Portfolio changed its benchmark from the J.P. Morgan Emerging Markets Bond Global Index(1) to a blend of three broad indices ("Blended Index") comprised of one-third J.P. Morgan Emerging Markets Bond Global Index (which returned 1.23% for the year), one-third J.P. Morgan GBI-EM Global Diversified Index(2) (which returned -14.92% for the year) and one third J.P. Morgan CEMBI Broad Diversified Index(3) (which returned 1.30% for the year). The Fund's new Performance Linked benchmark, the Emerging Markets Fixed Income Blend Index(4) which reflects the performance of the J.P. Morgan Emerging Markets Bond Global Index from the beginning of the fiscal period to September 25, 2015 and the performance of the Blended Index for the period thereafter to December 31, 2015, returned 0.46%.
Factors Affecting Performance
For the full 12 months ended December 31, 2015, the J.P. Morgan Emerging Markets Bond Global Index posted a 1.23% return. The Fund's Performance Linked benchmark, the Emerging Markets Fixed Income Blend Index (represented by performance of the J.P. Morgan Emerging Markets Bond Global Index for periods from the beginning of the fiscal year to September 25, 2015 and the Blended Index for periods thereafter through December 31, 2015) returned 0.46%.
• In 2015, downgrades to the outlook for global economic growth, particularly in China, pressured commodity prices, especially oil, which touched multi-year lows. Geopolitics and idiosyncratic events added to the headwinds facing investors, driving an increase in market volatility, a modest rise in U.S. Treasury yields, and further depreciation in emerging market (EM) currencies.
• Economic weakness in Europe was met by quantitative easing (QE) support by the European Central Bank (ECB), lowering yields across Europe and driving a search for yield, which benefited assets of EM European countries. However, the ECB failed to fully commit to an open-ended QE program. This was in contrast to steady growth in the U.S., supporting the U.S. Federal Reserve's (Fed) December decision to hike interest rates for the first time in over nine years, which, leading up to the event, contributed to broad U.S. dollar strength and an appreciation of the dollar versus the euro of over 10%.(i)
• EM external sovereign and quasi-sovereign debt performed in line with corporate debt and outperformed domestic debt, as currencies weakened versus the dollar. Higher-yielding, lower-quality countries, such as Ukraine, Argentina, Russia, and Venezuela, outperformed investment grade countries, such as Brazil, Colombia, Mexico, South Africa, and Indonesia. However, beginning in 2016, Brazil will no longer be classified as investment grade by the major index providers after being downgraded by S&P and Fitch in 2015 due to ongoing economic challenges and political dysfunction amid a far-reaching corruption investigation. In Ukraine, after a de-escalation in tensions with Russia, the government completed a debt restructuring with external creditors, which, along with supportive actions by the Russian Central Bank, drove a strong rally in Russian and Ukrainian assets over the year. In Latin America, opposition wins in Venezuela and Argentina brought political change and spurred hope for new economic policies to revive the challenged economies.
• For the 12-month period, contributing to the Portfolio's relative performance versus the Emerging Markets Fixed Income Blend Index were the Portfolio's overweight position in Venezuela and security selection in China, the Philippines, and South Africa, as well as an underweight position in Turkey.
• Conversely, relative to the Emerging Markets Fixed Income Blend Index, exposure to EM domestic debt and the use of U.S. Treasury futures to hedge U.S. interest rate duration detracted from relative performance in the period. Security selection in
4
Morgan Stanley Institutional Fund, Inc.
Annual Report — December 31, 2015
Investment Overview (unaudited) (cont'd)
Emerging Markets Fixed Income Opportunities Portfolio
Brazil, Colombia, and Russia also detracted from relative performance, as did underweight positions in Ukraine, and Argentina.
Management Strategies
• Over the next few months, the primary risks that we will continue to monitor include the potential for rising U.S. interest rates; the path of Chinese economic growth, currency and monetary policy; and the direction of commodity prices.
• We expect U.S. rates to remain range-bound until we get more clarity on the likely direction of the U.S. economy and inflation. The inflationary environment should remain relatively benign for the world as a whole, especially given continued low energy price pressures. We don't expect an EM "Taper Tantrum II" after the December Fed hike, but certainly some volatility spikes, especially among the weaker EM sovereigns, are possible. We plan to take advantage of market reactions that are overshooting fundamentals. With the first Fed hike behind us, the focus has shifted to the pace of future hikes. We believe that EM assets can handle, and are priced for, two to three rate hikes in 2016 but remain vulnerable to any hawkish surprises, especially if such policy surprises do not reflect an upward assessment in U.S./global growth prospects, but instead reveal incipient inflationary concerns.
• Broadly, we expect a modest rebound in EM growth in 2016 and 2017 as the negative impact from Brazil and Russia lessen. In China, we continue to believe that the country will avoid a hard landing, supported by higher frequency economic indicators pointing to an ongoing stabilization at a lower level of growth. Risks remain on the downside.
• Despite a narrowing of the emerging market/developed market growth differential and a weakening of fundamentals since the global financial crisis, EM economies are still in better health than they were 10 to 15 years ago with lower levels of external debt as a percentage of gross domestic product (GDP), freely floating exchange rates, relatively large buffers in the form of foreign currency reserves, and growing local debt markets supported by generally robust and well-capitalized banking systems, limiting the risks of external funding pressures inflicting severe damage on their economies. In the absence of extremely attractive
valuations and/or an improving fundamental outlook, EM economies must recommit to structural reforms to address economic challenges and restore widespread faith by the investment community. The election of reform-minded candidates, like those in Indonesia, India, and most recently Argentina, are steps in the right direction for these economies. There may even be some scope for political reforms in Venezuela after the opposition victory in the recent congressional elections. For long-term investors, EM debt still offers attractive real yields for an investment grade asset (on average, but deteriorating), providing relative yield advantages and potential spread compression, which could provide a buffer should interest rates rise in the U.S. With many in the market forecasting moderate growth and low inflation, we believe EM debt should perform reasonably well for investors looking for diversification, yield, and total return potential.
• Following close of business on September 25, 2015, Morgan Stanley Institutional Fund, Inc. ("MSIF") — Emerging Markets Domestic Debt Portfolio merged into MSIF Emerging Markets External Debt Portfolio ("Portfolio"). In conjunction with the merger, the Portfolio was renamed "MSIF Emerging Markets Fixed Income Opportunities Portfolio" and changed its principal investment policy such that under normal circumstances, it seeks to achieve its investment objective of high total return by investing at least 80% of its assets in debt securities of issuers located in emerging market countries, which may include U.S. dollar-denominated, local currency, and corporate debt securities. In addition, the Portfolio changed its benchmark from the J.P. Morgan Emerging Markets Bond Global Index to a blend of three broad indices: one-third J.P. Morgan Emerging Markets Bond Global Index, one-third J.P. Morgan GBI-EM Global Diversified Index and one-third J.P. Morgan CEMBI Broad Diversified Index.
5
Morgan Stanley Institutional Fund, Inc.
Annual Report — December 31, 2015
Investment Overview (unaudited) (cont'd)
Emerging Markets Fixed Income Opportunities Portfolio
* Minimum Investment for Class I shares
** Commenced Operations on May 24, 2012.
In accordance with SEC regulations, the Portfolio's performance shown assumes that all recurring fees (including management fees) were deducted and all dividends and distributions were reinvested. The performance of Class A, L, C and IS shares will vary from the performance of Class I shares based upon their different inception dates and will be impacted by additional fees assessed to those classes (if applicable).
Performance Compared to the J.P. Morgan Emerging Markets Bond Global Index(1), J.P. Morgan GBI-EM Global Diversified Index(2), J.P. Morgan CEMBI Broad Diversified Index(3), the Emerging Markets Fixed Income Blend Index(4) and the Lipper Emerging Markets Hard Currency Debt Funds Index(5)
| Period Ended December 31, 2015 Total Returns(6) | |||||||||||||||||||
Average Annual | |||||||||||||||||||
| One Year | Five Years | Ten Years | Since Inception(10) | ||||||||||||||||
| Portfolio — Class I Shares w/o sales charges(7) | –1.83 | % | — | — | 1.71 | % | |||||||||||||
| Portfolio — Class A Shares w/o sales charges(7) | –2.14 | — | — | 1.36 | |||||||||||||||
| Portfolio — Class A Shares with maximum 4.25% sales charges(7) | –6.31 | — | — | 0.16 | |||||||||||||||
| Portfolio — Class L Shares w/o sales charges(7) | –2.53 | — | — | 1.05 | |||||||||||||||
| Portfolio — Class C Shares w/o sales charges(9) | — | — | — | –6.95 | |||||||||||||||
| Portfolio — Class C Shares with maximum 1.00% deferred sales charges(9) | — | — | — | –7.84 | |||||||||||||||
| Portfolio — Class IS Shares w/o sales charges(8) | –1.83 | — | — | 1.48 | |||||||||||||||
| Period Ended December 31, 2015 Total Returns(6) | |||||||||||||||||||
Average Annual | |||||||||||||||||||
| One Year | Five Years | Ten Years | Since Inception(10) | ||||||||||||||||
| J.P. Morgan Emerging Markets Bond Global Index | 1.23 | % | — | — | 3.64 | % | |||||||||||||
| J.P. Morgan GBI-EM Global Diversified Index | –14.92 | — | — | –5.11 | |||||||||||||||
| J.P. Morgan CEMBI Broad Diversified Index | 1.30 | — | — | 4.22 | |||||||||||||||
| Emerging Markets Fixed Income Blend Index | 0.46 | — | — | 3.42 | |||||||||||||||
| Lipper Emerging Markets Hard Currency Debt Funds Index | –3.01 | — | — | 1.69 | |||||||||||||||
Performance data quoted represents past performance, which is no guarantee of future results, and current performance may be lower or higher than the figures shown. Performance assumes that all dividends and distributions, if any, were reinvested. For the most recent month-end performance figures, please visit www.morganstanley.com/im. Investment return and principal value will fluctuate so that Portfolio shares, when redeemed, may be worth more or less than their original cost. Total returns do not reflect the deduction of taxes that a shareholder would pay on Portfolio distributions or the redemption of Portfolio shares. Returns for periods less than one year are not annualized. Performance of share classes will vary due to difference in expenses.
(1) The J.P. Morgan Emerging Markets Bond Global Index tracks total returns for U.S. dollar-denominated debt instruments issued by emerging market sovereign and quasi-sovereign entities: Brady Bonds, loans, Eurobonds and local market instruments for emerging market countries. The Index is unmanaged and its returns do not include any sales charges or fees. Such costs would lower performance. It is not possible to invest directly in an index.
(2) The J.P. Morgan Government Bond Index-Emerging Markets Global Diversified Index (GBI-EM Global Diversified Index) tracks local currency government bonds issued by emerging markets. The Index is unmanaged and its returns do not include any sales charges or fees. Such costs would lower performance. It is not possible to invest directly in an index.
(3) The J.P. Morgan Corporate Emerging Markets Bond Index Broad Diversified (CEMBI Broad Diversified Index) which tracks performance of corporate issued debt instruments issued by emerging markets. The Index is unmanaged and its returns do not include any sales charges or fees. Such costs would lower performance. It is not possible to invest directly in an index.
(4) The Emerging Markets Fixed Income Blend Index is a performance linked benchmark of the old and new benchmark of the Portfolio, the old represented by J.P. Morgan Emerging Markets Bond Global Index for period from the Portfolio's inception to September 25, 2015 and the new Blended Index which consists of 1/3 J.P. Morgan EMBI Global Index, 1/3 J.P. Morgan GBI-EM Global Diversified Index, 1/3 J.P. Morgan CEMBI Broad Diversified Index for periods thereafter. The Index is unmanaged and its returns do not include any sales charges or fees. Such costs would lower performance. It is not possible to invest directly in an index. Following close of business on September 25, 2015, Morgan Stanley Institutional Fund, Inc. Emerging Markets Domestic Debt Portfolio merged into Morgan Stanley Institutional Fund, Inc. Emerging Markets External Debt Portfolio. In conjunction with this Reorganization, the Portfolio was renamed Morgan Stanley Institutional Fund, Inc. Emerging Markets Fixed Income Opportunities Portfolio and changed its principal investment policy. In addition, the Portfolio's benchmark was changed to the Blended Index after the Reorganization.
(5) The Lipper Emerging Markets Hard Currency Debt Funds Index is an equally weighted performance index of the largest qualifying funds (based on net assets) in the Lipper Emerging Markets Hard Currency Debt Funds classification. The Index, which is adjusted for capital gains distributions and income dividends, is unmanaged and should not be considered an investment. There are currently 30 funds represented in this Index. As of the date of this report, the Portfolio is in the Lipper Emerging Markets Hard Currency Debt Funds classification.
6
Morgan Stanley Institutional Fund, Inc.
Annual Report — December 31, 2015
Investment Overview (unaudited) (cont'd)
Emerging Markets Fixed Income Opportunities Portfolio
(6) Total returns for the Portfolio reflect fees waived and expenses reimbursed, if applicable, by the Adviser. Without such waivers and reimbursements, total returns would have been lower.
(7) Commenced operations on May 24, 2012.
(8) Commenced offering on September 13, 2013.
(9) Commenced offering on April 30, 2015.
(10) For comparative purposes, average annual since inception returns listed for the Indexes refer to the inception date of Class I of the Portfolio, not the inception of the Index.
7
Morgan Stanley Institutional Fund, Inc.
Annual Report — December 31, 2015
Portfolio of Investments
Emerging Markets Fixed Income Opportunities Portfolio
| Face Amount (000) | Value (000) | ||||||||||
Fixed Income Securities (96.2%) | |||||||||||
Angola (0.9%) | |||||||||||
Sovereign (0.9%) | |||||||||||
| Republic of Angola, 9.50%, 11/12/25 (a) | $ | 210 | $ | 196 | |||||||
Argentina (2.1%) | |||||||||||
Corporate Bond (2.1%) | |||||||||||
YPF SA, | |||||||||||
8.88%, 12/19/18 | 460 | 466 | |||||||||
Brazil (5.3%) | |||||||||||
Corporate Bond (0.5%) | |||||||||||
Odebrecht Offshore Drilling Finance Ltd., | |||||||||||
6.75%, 10/1/23 (a) | 425 | 102 | |||||||||
Sovereign (4.8%) | |||||||||||
Brazil Letras do Tesouro Nacional, | |||||||||||
0.00%, 7/1/17 - 1/1/19 | BRL | 3,366 | 600 | ||||||||
Brazilian Government International Bond, | |||||||||||
4.88%, 1/22/21 | $ | 311 | 288 | ||||||||
5.00%, 1/27/45 | 238 | 160 | |||||||||
1,048 | |||||||||||
1,150 | |||||||||||
Chile (1.7%) | |||||||||||
Corporate Bonds (1.7%) | |||||||||||
Cencosud SA, | |||||||||||
5.15%, 2/12/25 | 200 | 186 | |||||||||
Empresa Electrica Angamos SA, | |||||||||||
4.88%, 5/25/29 (a) | 200 | 179 | |||||||||
365 | |||||||||||
China (5.4%) | |||||||||||
Corporate Bonds (5.4%) | |||||||||||
Country Garden Holdings Co., Ltd., | |||||||||||
7.50%, 3/9/20 | 435 | 464 | |||||||||
KWG Property Holding Ltd., | |||||||||||
8.25%, 8/5/19 | 450 | 468 | |||||||||
West China Cement Ltd., | |||||||||||
6.50%, 9/11/19 | 250 | 264 | |||||||||
1,196 | |||||||||||
Colombia (3.8%) | |||||||||||
Corporate Bond (0.2%) | |||||||||||
Ecopetrol SA, | |||||||||||
5.88%, 5/28/45 | 60 | 43 | |||||||||
Sovereign (3.6%) | |||||||||||
Colombia Government International Bond, | |||||||||||
4.38%, 3/21/23 | COP | 254,000 | 67 | ||||||||
5.00%, 6/15/45 | $ | 266 | 223 | ||||||||
11.75%, 2/25/20 | 116 | 151 | |||||||||
Colombian TES, | |||||||||||
10.00%, 7/24/24 | COP | 797,300 | 278 | ||||||||
11.00%, 7/24/20 | 210,000 | 74 | |||||||||
793 | |||||||||||
836 | |||||||||||
| Face Amount (000) | Value (000) | ||||||||||
Croatia (1.0%) | |||||||||||
Sovereign (1.0%) | |||||||||||
Croatia Government International Bond, | |||||||||||
5.50%, 4/4/23 | $ | 220 | $ | 224 | |||||||
Dominican Republic (2.4%) | |||||||||||
Sovereign (2.4%) | |||||||||||
Dominican Republic International Bond, | |||||||||||
6.85%, 1/27/45 (a) | 460 | 436 | |||||||||
7.45%, 4/30/44 (a) | 100 | 101 | |||||||||
537 | |||||||||||
Ecuador (1.0%) | |||||||||||
Sovereign (1.0%) | |||||||||||
Ecuador Government International Bond, | |||||||||||
10.50%, 3/24/20 | 260 | 211 | |||||||||
Ghana (0.9%) | |||||||||||
Sovereign (0.9%) | |||||||||||
Republic of Ghana, | |||||||||||
10.75%, 10/14/30 (a) | 200 | 203 | |||||||||
Hungary (3.7%) | |||||||||||
Sovereign (3.7%) | |||||||||||
Hungary Government Bond, | |||||||||||
3.00%, 6/26/24 | HUF | 37,220 | 125 | ||||||||
5.50%, 6/24/25 | 171,280 | 692 | |||||||||
817 | |||||||||||
India (3.9%) | |||||||||||
Corporate Bonds (3.9%) | |||||||||||
ABJA Investment Co. Pte Ltd., | |||||||||||
5.95%, 7/31/24 | $ | 450 | 377 | ||||||||
Greenko Dutch BV, | |||||||||||
8.00%, 8/1/19 | 450 | 474 | |||||||||
851 | |||||||||||
Indonesia (9.3%) | |||||||||||
Corporate Bonds (6.0%) | |||||||||||
Jababeka International BV, | |||||||||||
7.50%, 9/24/19 | 460 | 437 | |||||||||
MPM Global Pte Ltd., | |||||||||||
6.75%, 9/19/19 | 450 | 422 | |||||||||
Pakuwon Prima Pte Ltd., | |||||||||||
7.13%, 7/2/19 | 450 | 450 | |||||||||
1,309 | |||||||||||
Sovereign (3.3%) | |||||||||||
Indonesia Treasury Bond, | |||||||||||
9.00%, 3/15/29 | IDR | 9,902,000 | 719 | ||||||||
2,028 | |||||||||||
Ivory Coast (1.9%) | |||||||||||
Sovereign (1.9%) | |||||||||||
Ivory Coast Government International Bond, | |||||||||||
5.38%, 7/23/24 (a) | $ | 200 | 178 | ||||||||
5.75%, 12/31/32 | 274 | 245 | |||||||||
423 | |||||||||||
The accompanying notes are an integral part of the financial statements.
8
Morgan Stanley Institutional Fund, Inc.
Annual Report — December 31, 2015
Portfolio of Investments (cont'd)
Emerging Markets Fixed Income Opportunities Portfolio
| Face Amount (000) | Value (000) | ||||||||||
Jamaica (1.7%) | |||||||||||
Corporate Bond (1.7%) | |||||||||||
Digicel Group Ltd., | |||||||||||
8.25%, 9/30/20 | $ | 460 | $ | 382 | |||||||
Kenya (1.8%) | |||||||||||
Sovereign (1.8%) | |||||||||||
Kenya Government International Bond, | |||||||||||
6.88%, 6/24/24 (a) | 450 | 396 | |||||||||
Malaysia (3.0%) | |||||||||||
Sovereign (3.0%) | |||||||||||
Malaysia Government Bond, | |||||||||||
3.39%, 3/15/17 | MYR | 208 | 49 | ||||||||
3.96%, 9/15/25 | 1,750 | 400 | |||||||||
4.16%, 7/15/21 | 215 | 51 | |||||||||
4.18%, 7/15/24 | 430 | 100 | |||||||||
4.50%, 4/15/30 | 245 | 56 | |||||||||
656 | |||||||||||
Mexico (9.9%) | |||||||||||
Corporate Bonds (1.8%) | |||||||||||
Alfa SAB de CV, | |||||||||||
6.88%, 3/25/44 | $ | 200 | 187 | ||||||||
Nemak SAB de CV, | |||||||||||
5.50%, 2/28/23 | 200 | 201 | |||||||||
388 | |||||||||||
Sovereign (8.1%) | |||||||||||
Mexican Bonos, | |||||||||||
10.00%, 12/5/24 | MXN | 8,245 | 603 | ||||||||
Series M | |||||||||||
8.00%, 6/11/20 | 5,600 | 358 | |||||||||
Petroleos Mexicanos, | |||||||||||
3.50%, 1/30/23 | $ | 79 | 69 | ||||||||
4.88%, 1/24/22 | 780 | 753 | |||||||||
1,783 | |||||||||||
2,171 | |||||||||||
Namibia (1.0%) | |||||||||||
Sovereign (1.0%) | |||||||||||
Namibia International Bonds, | |||||||||||
5.25%, 10/29/25 (a) | 232 | 217 | |||||||||
Nigeria (1.9%) | |||||||||||
Corporate Bond (1.9%) | |||||||||||
GTB Finance BV, | |||||||||||
6.00%, 11/8/18 | 450 | 417 | |||||||||
Pakistan (2.1%) | |||||||||||
Sovereign (2.1%) | |||||||||||
Islamic Republic of Pakistan, | |||||||||||
8.25%, 9/30/25 (a) | 450 | 460 | |||||||||
Peru (0.5%) | |||||||||||
Sovereign (0.5%) | |||||||||||
| Peruvian Government International Bond (Units), | |||||||||||
6.95%, 8/12/31 (b) | PEN | 380 | 104 | ||||||||
| Face Amount (000) | Value (000) | ||||||||||
Philippines (4.8%) | |||||||||||
Corporate Bonds (4.8%) | |||||||||||
Petron Corp., | |||||||||||
7.50%, 8/6/18 (c)(d) | $ | 480 | $ | 495 | |||||||
Royal Capital B.V., | |||||||||||
5.50%, 5/5/21 (c)(d) | 570 | 554 | |||||||||
1,049 | |||||||||||
Poland (2.3%) | |||||||||||
Sovereign (2.3%) | |||||||||||
Poland Government Bond, | |||||||||||
3.25%, 7/25/25 | PLN | 475 | 125 | ||||||||
4.00%, 10/25/23 | 915 | 253 | |||||||||
5.75%, 10/25/21 - 9/23/22 | 400 | 120 | |||||||||
498 | |||||||||||
Romania (1.1%) | |||||||||||
Sovereign (1.1%) | |||||||||||
Romania Government Bond, | |||||||||||
4.75%, 2/24/25 | RON | 865 | 225 | ||||||||
5.85%, 4/26/23 | 50 | 14 | |||||||||
239 | |||||||||||
Russia (6.6%) | |||||||||||
Corporate Bond (2.0%) | |||||||||||
Metalloinvest Finance Ltd., | |||||||||||
5.63%, 4/17/20 | $ | 450 | 434 | ||||||||
Sovereign (4.6%) | |||||||||||
Russian Federal Bond — OFZ, | |||||||||||
6.20%, 1/31/18 | RUB | 5,172 | 66 | ||||||||
6.80%, 12/11/19 | 22,100 | 276 | |||||||||
7.00%, 8/16/23 | 21,397 | 255 | |||||||||
Russian Foreign Bond — Eurobond, | |||||||||||
4.50%, 4/4/22 | $ | 400 | 403 | ||||||||
1,000 | |||||||||||
1,434 | |||||||||||
South Africa (2.6%) | |||||||||||
Sovereign (2.6%) | |||||||||||
South Africa Government Bond, | |||||||||||
6.75%, 3/31/21 | ZAR | 1,170 | 68 | ||||||||
8.00%, 1/31/30 | 8,451 | 464 | |||||||||
10.50%, 12/21/26 | 600 | 41 | |||||||||
573 | |||||||||||
Thailand (1.4%) | |||||||||||
Sovereign (1.4%) | |||||||||||
Thailand Government Bond, | |||||||||||
3.63%, 6/16/23 | THB | 10,100 | 304 | ||||||||
Turkey (5.3%) | |||||||||||
Corporate Bond (2.1%) | |||||||||||
Finansbank AS, | |||||||||||
6.25%, 4/30/19 | $ | 450 | 473 | ||||||||
The accompanying notes are an integral part of the financial statements.
9
Morgan Stanley Institutional Fund, Inc.
Annual Report — December 31, 2015
Portfolio of Investments (cont'd)
Emerging Markets Fixed Income Opportunities Portfolio
| Face Amount (000) | Value (000) | ||||||||||
Sovereign (3.2%) | |||||||||||
Turkey Government Bond, | |||||||||||
7.10%, 3/8/23 | TRY | 365 | $ | 104 | |||||||
8.00%, 3/12/25 | 60 | 18 | |||||||||
9.00%, 3/8/17 - 7/24/24 | 1,478 | 475 | |||||||||
10.40%, 3/20/24 | 290 | 98 | |||||||||
695 | |||||||||||
1,168 | |||||||||||
United Arab Emirates (4.1%) | |||||||||||
Corporate Bonds (4.1%) | |||||||||||
DP World Ltd., | |||||||||||
6.85%, 7/2/37 | $ | 450 | 444 | ||||||||
MAF Global Securities Ltd., | |||||||||||
7.13%, 10/29/18 (c)(d) | 450 | 458 | |||||||||
902 | |||||||||||
Venezuela (2.8%) | |||||||||||
Sovereign (2.8%) | |||||||||||
Petroleos de Venezuela SA, | |||||||||||
6.00%, 11/15/26 | 1,642 | 608 | |||||||||
Total Fixed Income Securities (Cost $22,645) | 21,081 | ||||||||||
| No. of Warrants | |||||||||||
Warrant (0.0%) | |||||||||||
Venezuela (0.0%) | |||||||||||
| Venezuela Government International Bond, Oil-Linked Payment Obligation, expires 4/15/20 (d)(e) (Cost $—) | 495 | 3 | |||||||||
Shares | Value (000) | ||||||||||
Short-Term Investment (1.4%) | |||||||||||
Investment Company (1.4%) | |||||||||||
| Morgan Stanley Institutional Liquidity Funds — Money Market Portfolio — Institutional Class (See Note G) (Cost $315) | 314,627 | $ | 315 | ||||||||
Total Investments (97.6%) (Cost $22,960) (f)(g) | 21,399 | ||||||||||
Other Assets in Excess of Liabilities (2.4%) | 533 | ||||||||||
Net Assets (100.0%) | $ | 21,932 | |||||||||
(a) 144A security — Certain conditions for public sale may exist. Unless otherwise noted, these securities are deemed to be liquid.
(b) Consists of one or more classes of securities traded together as a unit; stocks with attached warrants.
(c) Perpetual — One or more securities do not have a predetermined maturity date. Rates for these securities are fixed for a period of time, after which they revert to a floating rate. Interest rates in effect are as of December 31, 2015.
(d) Variable/Floating Rate Security — Interest rate changes on these instruments are based on changes in a designated base rate. The rates shown are those in effect on December 31, 2015.
(e) Security has been deemed illiquid at December 31, 2015.
(f) Securities are available for collateral in connection with open foreign currency forward exchange contracts.
(g) At December 31, 2015, the aggregate cost for Federal income tax purposes is approximately $23,124,000. The aggregate gross unrealized appreciation is approximately $121,000 and the aggregate gross unrealized depreciation is approximately $1,846,000 resulting in net unrealized depreciation of approximately $1,725,000.
OFZ Obilgatsyi Federal'novo Zaima (Russian Federal Loan Obligation)
Foreign Currency Forward Exchange Contracts:
The Portfolio had the following foreign currency forward exchange contracts open at December 31, 2015:
Counterparty | Contracts to Deliver (000) | In Exchange For (000) | Delivery Date | Unrealized Appreciation (Depreciation) (000) | |||||||||||||||
Deutsche Bank AG | CLP | 35,000 | $ | 49 | 1/4/16 | $ | — | @ | |||||||||||
Deutsche Bank AG | $ | 50 | CLP | 35,000 | 1/4/16 | (1 | ) | ||||||||||||
JPMorgan Chase Bank NA | CLP | 35,000 | $ | 50 | 1/4/16 | — | @ | ||||||||||||
JPMorgan Chase Bank NA | IDR | 1,590,000 | $ | 114 | 1/4/16 | (1 | ) | ||||||||||||
JPMorgan Chase Bank NA | IDR | 805,000 | $ | 58 | 1/4/16 | (— | @) | ||||||||||||
JPMorgan Chase Bank NA | IDR | 785,000 | $ | 57 | 1/4/16 | (— | @) | ||||||||||||
JPMorgan Chase Bank NA | TRY | 220 | $ | 75 | 1/4/16 | (— | @) | ||||||||||||
JPMorgan Chase Bank NA | TRY | 370 | $ | 126 | 1/4/16 | (1 | ) | ||||||||||||
JPMorgan Chase Bank NA | TRY | 196 | $ | 67 | 1/4/16 | — | @ | ||||||||||||
JPMorgan Chase Bank NA | $ | 49 | CLP | 35,000 | 1/4/16 | (— | @) | ||||||||||||
JPMorgan Chase Bank NA | $ | 56 | IDR | 785,000 | 1/4/16 | 1 | |||||||||||||
JPMorgan Chase Bank NA | $ | 59 | IDR | 805,000 | 1/4/16 | (1 | ) | ||||||||||||
JPMorgan Chase Bank NA | $ | 115 | IDR | 1,590,000 | 1/4/16 | — | @ | ||||||||||||
JPMorgan Chase Bank NA | $ | 121 | TRY | 352 | 1/4/16 | — | @ | ||||||||||||
JPMorgan Chase Bank NA | $ | 45 | TRY | 134 | 1/4/16 | 1 | |||||||||||||
JPMorgan Chase Bank NA | $ | 101 | TRY | 300 | 1/4/16 | 2 | |||||||||||||
JPMorgan Chase Bank NA | BRL | 260 | $ | 66 | 1/5/16 | — | @ | ||||||||||||
JPMorgan Chase Bank NA | BRL | 652 | $ | 164 | 1/5/16 | (1 | ) | ||||||||||||
JPMorgan Chase Bank NA | BRL | 400 | $ | 102 | 1/5/16 | 1 | |||||||||||||
JPMorgan Chase Bank NA | BRL | 261 | $ | 67 | 1/5/16 | 1 | |||||||||||||
JPMorgan Chase Bank NA | BRL | 251 | $ | 64 | 1/5/16 | 1 | |||||||||||||
JPMorgan Chase Bank NA | $ | 105 | BRL | 400 | 1/5/16 | (4 | ) | ||||||||||||
The accompanying notes are an integral part of the financial statements.
10
Morgan Stanley Institutional Fund, Inc.
Annual Report — December 31, 2015
Portfolio of Investments (cont'd)
Emerging Markets Fixed Income Opportunities Portfolio
Foreign Currency Forward Exchange Contracts (cont'd):
Counterparty | Contracts to Deliver (000) | In Exchange For (000) | Delivery Date | Unrealized Appreciation (Depreciation) (000) | |||||||||||||||
JPMorgan Chase Bank NA | $ | 69 | BRL | 261 | 1/5/16 | $ | (3 | ) | |||||||||||
JPMorgan Chase Bank NA | $ | 64 | BRL | 251 | 1/5/16 | (1 | ) | ||||||||||||
JPMorgan Chase Bank NA | $ | 67 | BRL | 260 | 1/5/16 | (1 | ) | ||||||||||||
JPMorgan Chase Bank NA | $ | 167 | BRL | 652 | 1/5/16 | (2 | ) | ||||||||||||
JPMorgan Chase Bank NA | PHP | 5,500 | $ | 116 | 1/6/16 | (1 | ) | ||||||||||||
JPMorgan Chase Bank NA | PHP | 5,400 | $ | 113 | 1/6/16 | (2 | ) | ||||||||||||
JPMorgan Chase Bank NA | $ | 36 | PHP | 1,700 | 1/6/16 | — | @ | ||||||||||||
JPMorgan Chase Bank NA | $ | 233 | PHP | 11,000 | 1/6/16 | 1 | |||||||||||||
JPMorgan Chase Bank NA | $ | 109 | PHP | 5,200 | 1/6/16 | 1 | |||||||||||||
JPMorgan Chase Bank NA | INR | 7,600 | $ | 113 | 1/11/16 | (2 | ) | ||||||||||||
JPMorgan Chase Bank NA | $ | 113 | INR | 7,600 | 1/11/16 | 2 | |||||||||||||
JPMorgan Chase Bank NA | $ | 112 | INR | 7,500 | 1/11/16 | 2 | |||||||||||||
JPMorgan Chase Bank NA | MYR | 629 | $ | 146 | 1/19/16 | (1 | ) | ||||||||||||
JPMorgan Chase Bank NA | RUB | 16,950 | $ | 238 | 1/19/16 | 7 | |||||||||||||
JPMorgan Chase Bank NA | $ | 56 | MYR | 241 | 1/19/16 | — | @ | ||||||||||||
JPMorgan Chase Bank NA | $ | 56 | RUB | 4,000 | 1/19/16 | (1 | ) | ||||||||||||
Deutsche Bank AG | $ | 72 | ZAR | 1,092 | 1/25/16 | (2 | ) | ||||||||||||
JPMorgan Chase Bank NA | MXN | 3,560 | $ | 207 | 1/25/16 | 1 | |||||||||||||
JPMorgan Chase Bank NA | PEN | 1,080 | $ | 318 | 1/25/16 | 2 | |||||||||||||
JPMorgan Chase Bank NA | $ | 105 | COP | 350,000 | 1/25/16 | 5 | |||||||||||||
Deutsche Bank AG | CLP | 35,000 | $ | 50 | 1/28/16 | 1 | |||||||||||||
JPMorgan Chase Bank NA | HUF | 118,201 | $ | 413 | 1/28/16 | 6 | |||||||||||||
JPMorgan Chase Bank NA | RON | 89 | $ | 22 | 1/28/16 | — | @ | ||||||||||||
JPMorgan Chase Bank NA | $ | 282 | PLN | 1,100 | 1/28/16 | (2 | ) | ||||||||||||
JPMorgan Chase Bank NA | IDR | 805,000 | $ | 59 | 1/29/16 | 1 | |||||||||||||
JPMorgan Chase Bank NA | TRY | 240 | $ | 81 | 1/29/16 | (— | @) | ||||||||||||
JPMorgan Chase Bank NA | $ | 67 | TRY | 196 | 1/29/16 | (— | @) | ||||||||||||
JPMorgan Chase Bank NA | BRL | 280 | $ | 71 | 2/2/16 | 1 | |||||||||||||
JPMorgan Chase Bank NA | $ | 162 | BRL | 652 | 2/2/16 | 1 | |||||||||||||
$ | 11 | ||||||||||||||||||
BRL — Brazilian Real
CLP — Chilean Peso
COP — Colombian Peso
HUF — Hungarian Forint
IDR — Indonesian Rupiah
INR — Indian Rupee
MXN — Mexican Peso
MYR — Malaysian Ringgit
PEN — Peruvian Nuevo Sol
PHP — Philippine Peso
PLN — Polish Zloty
RON — Romanian New Leu
RUB — Russian Ruble
THB — Thai Baht
TRY — Turkish Lira
ZAR — South African Rand
Portfolio Composition
Classification | Percentage of Total Investments | ||||||
Sovereign | 59.4 | % | |||||
Corporate Bonds | 39.1 | ||||||
Other* | 1.5 | ||||||
Total Investments | 100.0 | %** | |||||
* Industries and/or investment types representing less than 5% of total investments.
** Does not include open foreign currency forward exchange contracts with net unrealized appreciation of approximately $11,000.
The accompanying notes are an integral part of the financial statements.
11
Morgan Stanley Institutional Fund, Inc.
Annual Report — December 31, 2015
Emerging Markets Fixed Income Opportunities Portfolio
Statement of Assets and Liabilities | December 31, 2015 (000) | ||||||
Assets: | |||||||
Investments in Securities of Unaffiliated Issuers, at Value (Cost $22,645) | $ | 21,084 | |||||
Investment in Security of Affiliated Issuer, at Value (Cost $315) | 315 | ||||||
Total Investments in Securities, at Value (Cost $22,960) | 21,399 | ||||||
Foreign Currency, at Value (Cost $190) | 191 | ||||||
Cash | 8 | ||||||
Interest Receivable | 402 | ||||||
Due from Adviser | 73 | ||||||
Unrealized Appreciation on Foreign Currency Forward Exchange Contracts | 38 | ||||||
Dividends Receivable | — | @ | |||||
Receivable from Affiliate | — | @ | |||||
Receivable for Portfolio Shares Sold | — | @ | |||||
Other Assets | 43 | ||||||
Total Assets | 22,154 | ||||||
Liabilities: | |||||||
Payable for Investments Purchased | 78 | ||||||
Payable for Professional Fees | 59 | ||||||
Payable for Custodian Fees | 28 | ||||||
Unrealized Depreciation on Foreign Currency Forward Exchange Contracts | 27 | ||||||
Payable for Directors' Fees and Expenses | 7 | ||||||
Deferred Capital Gain Country Tax | 3 | ||||||
Payable for Transfer Agency Fees — Class I | 1 | ||||||
Payable for Transfer Agency Fees — Class A | 1 | ||||||
Payable for Transfer Agency Fees — Class L | 1 | ||||||
Payable for Transfer Agency Fees — Class C | — | @ | |||||
Payable for Transfer Agency Fees — Class IS | 1 | ||||||
Payable for Administration Fees | 2 | ||||||
Payable for Sub Transfer Agency Fees — Class I | — | @ | |||||
Payable for Sub Transfer Agency Fees — Class A | 1 | ||||||
Payable for Shareholder Services Fees — Class A | — | @ | |||||
Payable for Distribution and Shareholder Services Fees — Class L | — | @ | |||||
Payable for Distribution and Shareholder Services Fees — Class C | — | @ | |||||
Other Liabilities | 13 | ||||||
Total Liabilities | 222 | ||||||
Net Assets | $ | 21,932 | |||||
Net Assets Consist Of: | |||||||
Paid-in-Capital | $ | 28,972 | |||||
Distributions in Excess of Net Investment Income | (113 | ) | |||||
Accumulated Net Realized Loss | (5,372 | ) | |||||
Unrealized Appreciation (Depreciation) on: | |||||||
Investments | (1,561 | ) | |||||
Foreign Currency Forward Exchange Contracts | 11 | ||||||
Foreign Currency Translations | (5 | ) | |||||
Net Assets | $ | 21,932 | |||||
The accompanying notes are an integral part of the financial statements.
12
Morgan Stanley Institutional Fund, Inc.
Annual Report — December 31, 2015
Emerging Markets Fixed Income Opportunities Portfolio
Statement of Assets and Liabilities (cont'd) | December 31, 2015 (000) | ||||||
CLASS I: | |||||||
Net Assets | $ | 19,219 | |||||
| Shares Outstanding $0.001 par value shares of beneficial interest (unlimited shares authorized) (not in 000's) | 2,253,106 | ||||||
Net Asset Value, Offering and Redemption Price Per Share | $ | 8.53 | |||||
CLASS A: | |||||||
Net Assets | $ | 1,103 | |||||
| Shares Outstanding $0.001 par value shares of beneficial interest (unlimited shares authorized) (not in 000's) | 129,362 | ||||||
Net Asset Value, Redemption Price Per Share | $ | 8.52 | |||||
Maximum Sales Load | 4.25 | % | |||||
Maximum Sales Charge | $ | 0.38 | |||||
Maximum Offering Price Per Share | $ | 8.90 | |||||
CLASS L: | |||||||
Net Assets | $ | 735 | |||||
| Shares Outstanding $0.001 par value shares of beneficial interest (unlimited shares authorized) (not in 000's) | 86,299 | ||||||
Net Asset Value, Offering and Redemption Price Per Share | $ | 8.51 | |||||
CLASS C: | |||||||
Net Assets | $ | 202 | |||||
| Shares Outstanding $0.001 par value shares of beneficial interest (unlimited shares authorized) (not in 000's) | 23,755 | ||||||
Net Asset Value, Offering and Redemption Price Per Share | $ | 8.52 | |||||
CLASS IS: | |||||||
Net Assets | $ | 673 | |||||
| Shares Outstanding $0.001 par value shares of beneficial interest (unlimited shares authorized) (not in 000's) | 78,874 | ||||||
Net Asset Value, Offering and Redemption Price Per Share | $ | 8.53 | |||||
@ Amount is less than $500.
The accompanying notes are an integral part of the financial statements.
13
Morgan Stanley Institutional Fund, Inc.
Annual Report — December 31, 2015
Emerging Markets Fixed Income Opportunities Portfolio
Statement of Operations | Year Ended December 31, 2015 (000) | ||||||
Investment Income: | |||||||
Interest from Securities of Unaffiliated Issuers (Net of $6 of Foreign Taxes Withheld) | $ | 1,834 | |||||
Dividends from Security of Affiliated Issuer (Note G) | 2 | ||||||
Dividends from Securities of Unaffiliated Issuers | 1 | ||||||
Total Investment Income | 1,837 | ||||||
Expenses: | |||||||
Advisory Fees (Note B) | 212 | ||||||
Professional Fees | 120 | ||||||
Registration Fees | 61 | ||||||
Custodian Fees (Note F) | 49 | ||||||
Administration Fees (Note C) | 23 | ||||||
Shareholder Reporting Fees | 21 | ||||||
Pricing Fees | 13 | ||||||
Transfer Agency Fees — Class I (Note E) | 2 | ||||||
Transfer Agency Fees — Class A (Note E) | 2 | ||||||
Transfer Agency Fees — Class L (Note E) | 2 | ||||||
Transfer Agency Fees — Class C (Note E) | 1 | ||||||
Transfer Agency Fees — Class IS (Note E) | 2 | ||||||
Shareholder Services Fees — Class A (Note D) | 1 | ||||||
Distribution and Shareholder Services Fees — Class L (Note D) | 1 | ||||||
Distribution and Shareholder Services Fees — Class C (Note D) | — | @ | |||||
Directors' Fees and Expenses | 1 | ||||||
Sub Transfer Agency Fees — Class I | — | @ | |||||
Sub Transfer Agency Fees — Class A | — | @ | |||||
Other Expenses | 15 | ||||||
Total Expenses | 526 | ||||||
Waiver of Advisory Fees (Note B) | (212 | ) | |||||
Expenses Reimbursed by Adviser (Note B) | (71 | ) | |||||
Reimbursement of Class Specific Expenses — Class A (Note B) | (1 | ) | |||||
Reimbursement of Class Specific Expenses — Class L (Note B) | (1 | ) | |||||
Reimbursement of Class Specific Expenses — Class C (Note B) | (1 | ) | |||||
Reimbursement of Class Specific Expenses — Class IS (Note B) | (2 | ) | |||||
Rebate from Morgan Stanley Affiliate (Note G) | (1 | ) | |||||
Net Expenses | 237 | ||||||
Net Investment Income | 1,600 | ||||||
Realized Gain (Loss): | |||||||
Investments Sold (Net of $3 of Capital Gain Country Tax) | (2,349 | ) | |||||
Foreign Currency Forward Exchange Contracts | 103 | ||||||
Foreign Currency Transactions | 103 | ||||||
Futures Contracts | (5 | ) | |||||
Net Realized Loss | (2,148 | ) | |||||
Change in Unrealized Appreciation (Depreciation): | |||||||
Investments | (228 | ) | |||||
Foreign Currency Forward Exchange Contracts | 11 | ||||||
Foreign Currency Translations | (5 | ) | |||||
Futures Contracts | (1 | ) | |||||
Net Change in Unrealized Appreciation (Depreciation) | (223 | ) | |||||
Net Realized Loss and Change in Unrealized Appreciation (Depreciation) | (2,371 | ) | |||||
Net Decrease in Net Assets Resulting from Operations | $ | (771 | ) | ||||
@ Amount is less than $500.
The accompanying notes are an integral part of the financial statements.
14
Morgan Stanley Institutional Fund, Inc.
Annual Report — December 31, 2015
Emerging Markets Fixed Income Opportunities Portfolio
Statements of Changes in Net Assets | Year Ended December 31, 2015 (000) | Year Ended December 31, 2014 (000) | |||||||||
Increase (Decrease) in Net Assets: | |||||||||||
Operations: | |||||||||||
Net Investment Income | $ | 1,600 | $ | 1,053 | |||||||
Net Realized Loss | (2,148 | ) | (374 | ) | |||||||
Net Change in Unrealized Appreciation (Depreciation) | (223 | ) | 15 | ||||||||
Net Increase (Decrease) in Net Assets Resulting from Operations | (771 | ) | 694 | ||||||||
Distributions from and/or in Excess of: | |||||||||||
Class I: | |||||||||||
Net Investment Income | (1,138 | ) | (1,013 | ) | |||||||
Class A: | |||||||||||
Net Investment Income | (45 | ) | (13 | ) | |||||||
Class L: | |||||||||||
Net Investment Income | (28 | ) | (5 | ) | |||||||
Class C: | |||||||||||
Net Investment Income | (5 | ) | — | ||||||||
Class IS: | |||||||||||
Net Investment Income | (430 | ) | (1 | ) | |||||||
Total Distributions | (1,646 | ) | (1,032 | ) | |||||||
Capital Share Transactions:(1) | |||||||||||
Class I: | |||||||||||
Subscribed | 834 | 241 | |||||||||
Issued due to a tax-free reorganization | 2,383 | — | |||||||||
Distributions Reinvested | 97 | 30 | |||||||||
Redeemed | (1,155 | ) | (852 | ) | |||||||
Class A: | |||||||||||
Subscribed | 36 | 181 | |||||||||
Issued due to a tax-free reorganization | 937 | — | |||||||||
Distributions Reinvested | 35 | 3 | |||||||||
Redeemed | (152 | ) | (80 | ) | |||||||
Class L: | |||||||||||
Subscribed | — | — | |||||||||
Issued due to a tax-free reorganization | 722 | — | |||||||||
Distributions Reinvested | 23 | — | @ | ||||||||
Redeemed | (85 | ) | — | ||||||||
Class C: | |||||||||||
Subscribed | 210 | * | — | ||||||||
Distributions Reinvested | 4 | * | — | ||||||||
Class IS: | |||||||||||
Subscribed | 18,208 | — | |||||||||
Issued due to a tax-free reorganization | 8 | — | |||||||||
Distributions Reinvested | 403 | — | |||||||||
Redeemed | (17,050 | ) | — | ||||||||
Net Increase (Decrease) in Net Assets Resulting from Capital Share Transactions | 5,458 | (477 | ) | ||||||||
Redemption Fees | — | @ | — | ||||||||
Total Increase (Decrease) in Net Assets | 3,041 | (815 | ) | ||||||||
Net Assets: | |||||||||||
Beginning of Period | 18,891 | 19,706 | |||||||||
| End of Period (Including Distributions in Excess of Net Investment Income) and Accumulated Undistributed Net Investment Income of $(113) and $23 | $ | 21,932 | $ | 18,891 | |||||||
The accompanying notes are an integral part of the financial statements.
15
Morgan Stanley Institutional Fund, Inc.
Annual Report — December 31, 2015
Emerging Markets Fixed Income Opportunities Portfolio
Statements of Changes in Net Assets (cont'd) | Year Ended December 31, 2015 (000) | Year Ended December 31, 2014 (000) | |||||||||
(1) Capital Share Transactions: | |||||||||||
Class I: | |||||||||||
Shares Subscribed | 94 | 25 | |||||||||
Shares Issued due to a tax-free reorganization | 272 | — | |||||||||
Shares Issued on Distributions Reinvested | 12 | 3 | |||||||||
Shares Redeemed | (131 | ) | (86 | ) | |||||||
Net Increase (Decrease) in Class I Shares Outstanding | 247 | (58 | ) | ||||||||
Class A: | |||||||||||
Shares Subscribed | 4 | 19 | |||||||||
Shares Issued due to a tax-free reorganization | 107 | — | |||||||||
Shares Issued on Distributions Reinvested | 4 | — | @@ | ||||||||
Shares Redeemed | (17 | ) | (8 | ) | |||||||
Net Increase in Class A Shares Outstanding | 98 | 11 | |||||||||
Class L: | |||||||||||
Shares Subscribed | — | — | |||||||||
Shares Issued due to a tax-free reorganization | 83 | — | |||||||||
Shares Issued on Distributions Reinvested | 3 | — | @@ | ||||||||
Shares Redeemed | (10 | ) | — | ||||||||
Net Increase in Class L Shares Outstanding | 76 | — | |||||||||
Class C: | |||||||||||
Shares Subscribed | 23 | * | — | ||||||||
Shares Issued on Distributions Reinvested | 1 | * | — | ||||||||
Net Increase in Class C Shares Outstanding | 24 | — | |||||||||
Class IS: | |||||||||||
Shares Subscribed | 1,934 | — | |||||||||
Shares Issued due to a tax-free reorganization | 1 | — | |||||||||
Shares Issued on Distributions Reinvested | 43 | — | |||||||||
Shares Redeemed | (1,900 | ) | — | ||||||||
Net Increase in Class IS Shares Outstanding | 78 | — | |||||||||
* For the period April 30, 2015 through December 31, 2015.
@ Amount is less than $500.
@@ Amount is less than 500 shares.
The accompanying notes are an integral part of the financial statements.
16
Morgan Stanley Institutional Fund, Inc.
Annual Report — December 31, 2015
Financial Highlights
Emerging Markets Fixed Income Opportunities Portfolio
Class I | |||||||||||||||||||
Year Ended December 31, | Period from May 24, 2012^ to | ||||||||||||||||||
Selected Per Share Data and Ratios | 2015 | 2014 | 2013 | December 31, 2012 | |||||||||||||||
Net Asset Value, Beginning of Period | $ | 9.22 | $ | 9.40 | $ | 11.11 | $ | 10.00 | |||||||||||
Income (Loss) from Investment Operations: | |||||||||||||||||||
Net Investment Income† | 0.52 | 0.51 | 0.53 | 0.30 | |||||||||||||||
Net Realized and Unrealized Gain (Loss) | (0.68 | ) | (0.19 | ) | (1.50 | ) | 1.18 | ||||||||||||
Total from Investment Operations | (0.16 | ) | 0.32 | (0.97 | ) | 1.48 | |||||||||||||
Distributions from and/or in Excess of: | |||||||||||||||||||
Net Investment Income | (0.53 | ) | (0.50 | ) | (0.48 | ) | (0.30 | ) | |||||||||||
Net Realized Gain | — | — | (0.26 | ) | (0.07 | ) | |||||||||||||
Total Distributions | (0.53 | ) | (0.50 | ) | (0.74 | ) | (0.37 | ) | |||||||||||
Redemption Fees | 0.00 | ‡ | — | 0.00 | ‡ | — | |||||||||||||
Net Asset Value, End of Period | $ | 8.53 | $ | 9.22 | $ | 9.40 | $ | 11.11 | |||||||||||
Total Return++ | (1.83 | )% | 3.38 | % | (8.79 | )% | 14.83 | %# | |||||||||||
Ratios and Supplemental Data: | |||||||||||||||||||
Net Assets, End of Period (Thousands) | $ | 19,219 | $ | 18,492 | $ | 19,400 | $ | 22,597 | |||||||||||
Ratio of Expenses to Average Net Assets (1) | 0.83 | %+ | 0.83 | %+ | 0.84 | %+ | 0.84 | %+* | |||||||||||
Ratio of Net Investment Income to Average Net Assets (1) | 5.74 | %+ | 5.23 | %+ | 5.14 | %+ | 4.63 | %+* | |||||||||||
Ratio of Rebate from Morgan Stanley Affiliates to Average Net Assets | 0.00 | %§ | 0.00 | %§ | 0.00 | %§ | 0.01 | %* | |||||||||||
Portfolio Turnover Rate | 111 | % | 95 | % | 94 | % | 29 | %# | |||||||||||
(1) Supplemental Information on the Ratios to Average Net Assets: | |||||||||||||||||||
Ratios Before Expense Limitation: | |||||||||||||||||||
Expenses to Average Net Assets | 1.82 | % | 1.91 | % | 2.15 | % | 2.02 | %* | |||||||||||
Net Investment Income to Average Net Assets | 4.75 | % | 4.15 | % | 3.83 | % | 3.45 | %* | |||||||||||
^ Commencement of Operations.
† Per share amount is based on average shares outstanding.
‡ Amount is less than $0.005 per share.
++ Calculated based on the net asset value as of the last business day of the period.
+ The Ratios of Expenses and Net Investment Income reflect the rebate of certain Portfolio expenses in connection with the investments in Morgan Stanley affiliates during the period. The effect of the rebate on the ratios is disclosed in the above table as "Ratio of Rebate from Morgan Stanley Affiliates to Average Net Assets."
§ Amount is less than 0.005%.
# Not Annualized.
* Annualized.
The accompanying notes are an integral part of the financial statements.
17
Morgan Stanley Institutional Fund, Inc.
Annual Report — December 31, 2015
Financial Highlights
Emerging Markets Fixed Income Opportunities Portfolio
Class A | |||||||||||||||||||
Year Ended December 31, | Period from May 24, 2012^ to | ||||||||||||||||||
Selected Per Share Data and Ratios | 2015 | 2014 | 2013 | December 31, 2012 | |||||||||||||||
Net Asset Value, Beginning of Period | $ | 9.21 | $ | 9.40 | $ | 11.11 | $ | 10.00 | |||||||||||
Income (Loss) from Investment Operations: | |||||||||||||||||||
Net Investment Income† | 0.50 | 0.47 | 0.49 | 0.29 | |||||||||||||||
Net Realized and Unrealized Gain (Loss) | (0.69 | ) | (0.19 | ) | (1.49 | ) | 1.17 | ||||||||||||
Total from Investment Operations | (0.19 | ) | 0.28 | (1.00 | ) | 1.46 | |||||||||||||
Distributions from and/or in Excess of: | |||||||||||||||||||
Net Investment Income | (0.50 | ) | (0.47 | ) | (0.45 | ) | (0.28 | ) | |||||||||||
Net Realized Gain | — | — | (0.26 | ) | (0.07 | ) | |||||||||||||
Total Distributions | (0.50 | ) | (0.47 | ) | (0.71 | ) | (0.35 | ) | |||||||||||
Redemption Fees | 0.00 | ‡ | — | 0.00 | ‡ | — | |||||||||||||
Net Asset Value, End of Period | $ | 8.52 | $ | 9.21 | $ | 9.40 | $ | 11.11 | |||||||||||
Total Return++ | (2.14 | )% | 2.90 | % | (9.05 | )% | 14.66 | %# | |||||||||||
Ratios and Supplemental Data: | |||||||||||||||||||
Net Assets, End of Period (Thousands) | $ | 1,103 | $ | 291 | $ | 196 | $ | 111 | |||||||||||
Ratio of Expenses to Average Net Assets (1) | 1.20 | %+ | 1.20 | %+ | 1.14 | %+^^ | 1.09 | %+* | |||||||||||
Ratio of Net Investment Income to Average Net Assets (1) | 5.61 | %+ | 4.88 | %+ | 4.88 | %+ | 4.38 | %+* | |||||||||||
Ratio of Rebate from Morgan Stanley Affiliates to Average Net Assets | 0.00 | %§ | 0.00 | %§ | 0.00 | %§ | 0.01 | %* | |||||||||||
Portfolio Turnover Rate | 111 | % | 95 | % | 94 | % | 29 | %# | |||||||||||
(1) Supplemental Information on the Ratios to Average Net Assets: | |||||||||||||||||||
Ratios Before Expense Limitation: | |||||||||||||||||||
Expenses to Average Net Assets | 2.49 | % | 2.85 | % | 2.76 | % | 2.27 | %* | |||||||||||
Net Investment Income to Average Net Assets | 4.32 | % | 3.23 | % | 3.26 | % | 3.20 | %* | |||||||||||
^ Commencement of Operations.
† Per share amount is based on average shares outstanding.
‡ Amount is less than $0.005 per share.
++ Calculated based on the net asset value which does not reflect sales charges, if applicable, as of the last business day of the period.
+ The Ratios of Expenses and Net Investment Income reflect the rebate of certain Portfolio expenses in connection with the investments in Morgan Stanley affiliates during the period. The effect of the rebate on the ratios is disclosed in the above table as "Ratio of Rebate from Morgan Stanley Affiliates to Average Net Assets."
^^ Effective September 16, 2013, the Adviser has agreed to limit the ratio of expenses to average net assets to the maximum ratio of 1.20% for Class A shares. Prior to September 16, 2013, the maximum ratio was 1.10% for Class A shares.
§ Amount is less than 0.005%.
# Not Annualized.
* Annualized.
The accompanying notes are an integral part of the financial statements.
18
Morgan Stanley Institutional Fund, Inc.
Annual Report — December 31, 2015
Financial Highlights
Emerging Markets Fixed Income Opportunities Portfolio
Class L | |||||||||||||||||||
Year Ended December 31, | Period from May 24, 2012^ to | ||||||||||||||||||
Selected Per Share Data and Ratios | 2015 | 2014 | 2013 | December 31, 2012 | |||||||||||||||
Net Asset Value, Beginning of Period | $ | 9.22 | $ | 9.39 | $ | 11.11 | $ | 10.00 | |||||||||||
Income (Loss) from Investment Operations: | |||||||||||||||||||
Net Investment Income† | 0.49 | 0.45 | 0.47 | 0.25 | |||||||||||||||
Net Realized and Unrealized Gain (Loss) | (0.72 | ) | (0.18 | ) | (1.51 | ) | 1.18 | ||||||||||||
Total from Investment Operations | (0.23 | ) | 0.27 | (1.04 | ) | 1.43 | |||||||||||||
Distributions from and/or in Excess of: | |||||||||||||||||||
Net Investment Income | (0.48 | ) | (0.44 | ) | (0.42 | ) | (0.25 | ) | |||||||||||
Net Realized Gain | — | — | (0.26 | ) | (0.07 | ) | |||||||||||||
Total Distributions | (0.48 | ) | (0.44 | ) | (0.68 | ) | (0.32 | ) | |||||||||||
Redemption Fees | 0.00 | ‡ | — | 0.00 | ‡ | — | |||||||||||||
Net Asset Value, End of Period | $ | 8.51 | $ | 9.22 | $ | 9.39 | $ | 11.11 | |||||||||||
Total Return++ | (2.53 | )% | 2.85 | % | (9.41 | )% | 14.33 | %# | |||||||||||
Ratios and Supplemental Data: | |||||||||||||||||||
Net Assets, End of Period (Thousands) | $ | 735 | $ | 98 | $ | 100 | $ | 111 | |||||||||||
Ratio of Expenses to Average Net Assets (1) | 1.45 | %+ | 1.45 | %+ | 1.41 | %+^^ | 1.59 | %+* | |||||||||||
Ratio of Net Investment Income to Average Net Assets (1) | 5.44 | %+ | 4.62 | %+ | 4.57 | %+ | 3.88 | %+* | |||||||||||
Ratio of Rebate from Morgan Stanley Affiliates to Average Net Assets | 0.00 | %§ | 0.00 | %§ | 0.00 | %§ | 0.01 | %* | |||||||||||
Portfolio Turnover Rate | 111 | % | 95 | % | 94 | % | 29 | %# | |||||||||||
(1) Supplemental Information on the Ratios to Average Net Assets: | |||||||||||||||||||
Ratios Before Expense Limitation: | |||||||||||||||||||
Expenses to Average Net Assets | 2.94 | % | 4.10 | % | 3.07 | % | 2.77 | %* | |||||||||||
Net Investment Income to Average Net Assets | 3.95 | % | 1.97 | % | 2.91 | % | 2.70 | %* | |||||||||||
^ Commencement of Operations.
† Per share amount is based on average shares outstanding.
‡ Amount is less than $0.005 per share.
++ Calculated based on the net asset value as of the last business day of the period.
+ The Ratios of Expenses and Net Investment Income reflect the rebate of certain Portfolio expenses in connection with the investments in Morgan Stanley affiliates during the period. The effect of the rebate on the ratios is disclosed in the above table as "Ratio of Rebate from Morgan Stanley Affiliates to Average Net Assets."
^^ Effective September 16, 2013, the Adviser has agreed to limit the ratio of expenses to average net assets to the maximum ratio of 1.45% for Class L shares. Prior to September 16, 2013, the maximum ratio was 1.35% for Class L shares.
§ Amount is less than 0.005%.
# Not Annualized.
* Annualized.
The accompanying notes are an integral part of the financial statements.
19
Morgan Stanley Institutional Fund, Inc.
Annual Report — December 31, 2015
Financial Highlights
Emerging Markets Fixed Income Opportunities Portfolio
Class C | |||||||
Selected Per Share Data and Ratios | Period from April 30, 2015^ to December 31, 2015 | ||||||
Net Asset Value, Beginning of Period | $ | 9.52 | |||||
Income (Loss) from Investment Operations: | |||||||
Net Investment Income† | 0.32 | ||||||
Net Realized and Unrealized Loss | (0.97 | ) | |||||
Total from Investment Operations | (0.65 | ) | |||||
Distributions from and/or in Excess of: | |||||||
Net Investment Income | (0.35 | ) | |||||
Redemption Fees | 0.00 | ‡ | |||||
Net Asset Value, End of Period | $ | 8.52 | |||||
Total Return++ | (6.95 | )%# | |||||
Ratios and Supplemental Data: | |||||||
Net Assets, End of Period (Thousands) | $ | 202 | |||||
Ratios of Expenses to Average Net Assets (1) | 1.95 | %+* | |||||
Ratio of Net Investment Income to Average Net Assets (1) | 5.34 | %+* | |||||
Ratio of Rebate from Morgan Stanley Affiliates to Average Net Assets | 0.00 | %§* | |||||
Portfolio Turnover Rate | 111 | % | |||||
(1) Supplemental Information on the Ratios to Average Net Assets: | |||||||
Ratios Before Expense Limitation: | |||||||
Expense to Average Net Assets | 6.28 | %* | |||||
Net Investment Income to Average Net Assets | 1.01 | %* | |||||
^ Commencement of Offering.
† Per share amount is based on average shares outstanding.
‡ Amount is less than $0.005 per share.
++ Calculated based on the net asset value which does not reflect sales charges, if applicable, as of the last business day of the period.
+ The Ratios of Expenses and Net Investment Income reflect the rebate of certain Portfolio expenses in connection with the investments in Morgan Stanley affiliates during the period. The effect of the rebate on the ratios is disclosed in the above table as "Ratio of Rebate from Morgan Stanley Affiliates to Average Net Assets."
§ Amount is less than 0.005%.
# Not Annualized.
* Annualized.
The accompanying notes are an integral part of the financial statements.
20
Morgan Stanley Institutional Fund, Inc.
Annual Report — December 31, 2015
Financial Highlights
Emerging Markets Fixed Income Opportunities Portfolio
Class IS | |||||||||||||||
| Year Ended December 31, | Period from September 13, 2013^ to | ||||||||||||||
Selected Per Share Data and Ratios | 2015 | 2014 | December 31, 2013 | ||||||||||||
Net Asset Value, Beginning of Period | $ | 9.22 | $ | 9.40 | $ | 9.65 | |||||||||
Income (Loss) from Investment Operations: | |||||||||||||||
Net Investment Income† | 0.50 | 0.51 | 0.15 | ||||||||||||
Net Realized and Unrealized Gain (Loss) | (0.66 | ) | (0.19 | ) | 0.04 | ||||||||||
Total from Investment Operations | (0.16 | ) | 0.32 | 0.19 | |||||||||||
Distributions from and/or in Excess of: | |||||||||||||||
Net Investment Income | (0.53 | ) | (0.50 | ) | (0.24 | ) | |||||||||
Net Realized Gain | — | — | (0.20 | ) | |||||||||||
Total Distributions | (0.53 | ) | (0.50 | ) | (0.44 | ) | |||||||||
Redemption Fees | 0.00 | ‡ | — | 0.00 | ‡ | ||||||||||
Net Asset Value, End of Period | $ | 8.53 | $ | 9.22 | $ | 9.40 | |||||||||
Total Return++ | (1.83 | )% | 3.39 | % | 1.92 | %# | |||||||||
Ratios and Supplemental Data: | |||||||||||||||
Net Assets, End of Period (Thousands) | $ | 673 | $ | 10 | $ | 10 | |||||||||
Ratio of Expenses to Average Net Assets (1) | 0.82 | %+ | 0.82 | %+ | 0.81 | %+^^* | |||||||||
Ratio of Net Investment Income to Average Net Assets (1) | 5.45 | %+ | 5.25 | %+ | 5.36 | %+* | |||||||||
Ratio of Rebate from Morgan Stanley Affiliates to Average Net Assets | 0.00 | %§ | 0.00 | %§ | 0.01 | %* | |||||||||
Portfolio Turnover Rate | 111 | % | 95 | % | 94 | %# | |||||||||
(1) Supplemental Information on the Ratios to Average Net Assets: | |||||||||||||||
Ratios Before Expense Limitation: | |||||||||||||||
Expenses to Average Net Assets | 1.86 | % | 21.21 | % | 7.70 | %* | |||||||||
Net Investment Income (Loss) to Average Net Assets | 4.41 | % | (15.14 | )% | (1.53 | )%* | |||||||||
^ Commencement of Offering.
† Per share amount is based on average shares outstanding.
‡ Amount is less than $0.005 per share.
++ Calculated based on the net asset value as of the last business day of the period.
+ The Ratios of Expenses and Net Investment Income reflect the rebate of certain Portfolio expenses in connection with the investments in Morgan Stanley affiliates during the period. The effect of the rebate on the ratios is disclosed in the above table as "Ratio of Rebate from Morgan Stanley Affiliates to Average Net Assets."
^^ Effective September 16, 2013, the Adviser has agreed to limit the ratio of expenses to average net assets to the maximum ratio of 0.82% for Class IS shares.
§ Amount is less than 0.005%.
# Not Annualized.
* Annualized.
The accompanying notes are an integral part of the financial statements.
21
Morgan Stanley Institutional Fund, Inc.
Annual Report — December 31, 2015
Notes to Financial Statements
Morgan Stanley Institutional Fund, Inc. (the "Fund") is registered under the Investment Company Act of 1940, as amended (the "Act"), as an open-end management investment company. The Fund is comprised of twenty-six separate, active, diversified and non-diversified portfolios (individually referred to as a "Portfolio", collectively as the "Portfolios"). The Fund applies investment company accounting and reporting guidance.
The accompanying financial statements relate to the Emerging Markets Fixed Income Opportunities Portfolio (name changed on September 28, 2015, formerly Emerging Markets External Debt portfolio). The Portfolio seeks high total return by investing at least 80% of its assets in debt securities of issuers located in emerging market countries, which may include U.S. dollar-denominated, local currency, and corporate debt securities.
The Portfolio offers five classes of shares — Class I, Class A, Class L, Class C and Class IS. On April 30, 2015, the Portfolio commenced offering Class C shares and suspended offering of Class L shares. Existing Class L shareholders may invest through reinvestment of dividends and distributions.
On September 28, 2015, the Portfolio acquired the net assets of the Emerging Markets Domestic Debt Portfolio ("Emerging Markets Domestic Debt Portfolio"), an open-end investment company. Based on the respective valuations as of the close of business on September 25, 2015, pursuant to a Plan of Reorganization approved by the shareholders of Emerging Markets Domestic Debt Portfolio on September 21, 2015 ("Reorganization"). The purpose of the transaction was to combine two portfolios managed by Morgan Stanley Investment Management Inc. with comparable investment objectives and strategies. The acquisition was accomplished by a tax-free exchange of 271,765 Class I shares of the Portfolio at a net asset value of $8.77 for 282,261 Class I shares of Emerging Markets Domestic Debt Portfolio; 106,956 Class A shares of the Portfolio at a net asset value of $8.76 for 108,632 Class A shares of Emerging Markets Domestic Debt Portfolio; 82,521 Class L shares of the Portfolio at a net asset value of $8.75 for 85,876 Class L shares of Emerging Markets Domestic Debt Portfolio; 874 Class IS shares of the Portfolio at a net asset value of $8.77 for 907 Class IS shares of Emerging Markets Domestic Debt Portfolio. The net assets of Emerging Markets Domestic Debt Portfolio before the Reorganization were approximately $4,050,000, including unrealized depreciation of approximately $589,000 at September 25, 2015. The investment portfolio of Emerging Markets Domestic Debt Portfolio, with a fair value of approximately $3,079,000 and identified cost of approximately
$3,690,000 on September 25, 2015, was the principal asset acquired by the Portfolio. For financial reporting purposes, assets received and shares issued by the Portfolio were recorded at fair value; however, the cost basis of the investments received from Emerging Markets Domestic Debt Portfolio was carried forward to align ongoing reporting of the Portfolio's realized and unrealized gains and losses with amounts distributable to shareholders for tax purposes. Immediately prior to the Reorganization, the net assets of the Portfolio were approximately $18,402,000. Immediately after the Reorganization, the net assets of the Portfolio were approximately $22,452,000.
Upon closing of the Reorganization, shareholders of Emerging Markets Domestic Debt Portfolio received shares of the Portfolio as follows:
| Emerging Markets Domestic Debt Portfolio | Emerging Markets Fixed Income Opportunities Portfolio | ||||||
| Class I | Class I | ||||||
| Class A | Class A | ||||||
| Class L | Class L | ||||||
| Class IS | Class IS | ||||||
Assuming the acquisition had been completed on January 1, 2015, the beginning of the annual reporting period of the Portfolio, the Portfolio's pro forma results of operations for the year ended December 31, 2015, are as follows:
Net investment income(1) | $ | 2,023,000 | |||||
Net realized gain and unrealized gain/loss(2) | $ | (4,861,000 | ) | ||||
| Net increase (decrease) in net assets resulting from operations | $ | (2,838,000 | ) | ||||
(1) Approximately $1,600,000 as reported, plus approximately $373,000 Emerging Markets Domestic Debt Portfolio prior to the Reorganization, plus approximately $50,000 of estimated pro-forma eliminated expenses.
(2) Approximately $(2,371,000) as reported, plus approximately $(2,490,000) Emerging Markets Domestic Debt Portfolio prior to the Reorganization.
Because the combined investment portfolios have been managed as a single integrated portfolio since the acquisition was completed, it is not practicable to separate the amounts of revenue and earnings of Emerging Markets Domestic Debt Portfolio that have been included in the Portfolio's Statement of Operations since September 28, 2015.
A. Significant Accounting Policies: The following significant accounting policies are in conformity with U.S. generally accepted accounting principles ("GAAP"). Such policies are consistently followed by the Fund in the preparation of its financial statements. GAAP may require management to make estimates and assumptions that affect the reported amounts
22
Morgan Stanley Institutional Fund, Inc.
Annual Report — December 31, 2015
Notes to Financial Statements (cont'd)
and disclosures in the financial statements. Actual results may differ from those estimates.
1. Security Valuation: (1) Certain portfolio securities may be valued by an outside pricing service approved by the Fund's Board of Directors (the "Directors"). The pricing service may utilize a matrix system or other model incorporating attributes such as security quality, maturity and coupon as the evaluation model parameters, and/or research evaluations by its staff, including review of broker-dealer market price quotations in determining what it believes is the fair valuation of the portfolios securities valued by such pricing service; (2) an equity portfolio security listed or traded on an exchange is valued at its latest reported sales price (or at the exchange official closing price if such exchange reports an official closing price), if there were no sales on a given day, the security is valued at the mean between the last reported bid and asked prices; (3) all other equity portfolio securities for which over-the-counter ("OTC") market quotations are readily available are valued at its latest reported sales price. In cases where a security is traded on more than one exchange, the security is valued on the exchange designated as the primary market; (4) futures are valued at the latest price published by the commodities exchange on which they trade; (5) when market quotations are not readily available, including circumstances under which Morgan Stanley Investment Management Inc. (the "Adviser") determines that the closing price, last sale price or the mean between the last reported bid and asked prices are not reflective of a security's market value, portfolio securities are valued at their fair value as determined in good faith under procedures established by and under the general supervision of the Directors. Occasionally, developments affecting the closing prices of securities and other assets may occur between the times at which valuations of such securities are determined (that is, close of the foreign market on which the securities trade) and the close of business of the New York Stock Exchange ("NYSE"). If developments occur during such periods that are expected to materially affect the value of such securities, such valuations may be adjusted to reflect the estimated fair value of such securities as of the close of the NYSE, as determined in good faith by the Directors or by the Adviser using a pricing service and/or procedures approved by the Directors; (6) quotations of foreign portfolio securities, other assets and liabilities and forward contracts stated in foreign currency are translated into U.S. dollar equivalents at the prevailing
market rates prior to the close of the NYSE; (7) investments in mutual funds, including the Morgan Stanley Institutional Liquidity Funds, are valued at the net asset value ("NAV") as of the close of each business day; and (8) short-term debt securities with remaining maturities of 60 days or less at the time of purchase may be valued at amortized cost, unless the Adviser determines such valuation does not reflect the securities' market value, in which case these securities will be valued at their fair market value determined by the Adviser.
The Directors have responsibility for determining in good faith the fair value of the investments, and the Directors may appoint others, such as the Fund's Adviser or a valuation committee, to assist the Directors in determining fair value and to make the actual calculations pursuant to the fair valuation methodologies previously approved by the Directors. Under procedures approved by the Directors, the Fund's Adviser has formed a Valuation Committee whose members are approved by the Directors. The Valuation Committee provides administration and oversight of the Fund's valuation policies and procedures, which are reviewed at least annually by the Directors. These procedures allow the Fund to utilize independent pricing services, quotations from securities and financial instrument dealers, and other market sources to determine fair value.
The Fund has procedures to determine the fair value of securities and other financial instruments for which market prices are not readily available. Under these procedures, the Valuation Committee convenes on a regular and ad hoc basis to review such securities and considers a number of factors, including valuation methodologies and significant unobservable valuation inputs, when arriving at fair value. The Valuation Committee may employ a market-based approach which may use related or comparable assets or liabilities, recent transactions, market multiples, book values, and other relevant information for the investment to determine the fair value of the investment. An income-based valuation approach may also be used in which the anticipated future cash flows of the investment are discounted to calculate fair value. Discounts may also be applied due to the nature or duration of any restrictions on the disposition of the investments. Due to the inherent uncertainty of valuations of such investments, the fair values may differ significantly from the values that would have been used had an active market existed. The Valuation Committee
23
Morgan Stanley Institutional Fund, Inc.
Annual Report — December 31, 2015
Notes to Financial Statements (cont'd)
employs various methods for calibrating these valuation approaches including a regular review of valuation methodologies, key inputs and assumptions, transactional back-testing or disposition analysis, and reviews of any related market activity.
2. Fair Value Measurement: Financial Accounting Standards Board ("FASB") Accounting Standards CodificationTM ("ASC") 820, "Fair Value Measurement" ("ASC 820"), defines fair value as the value that the Fund would receive to sell an investment or pay to transfer a liability in a timely transaction with an independent buyer in the principal market, or in the absence of a principal market the most advantageous market for the investment or liability. ASC 820 establishes a three-tier hierarchy to distinguish between (1) inputs that reflect the assumptions market participants would use in valuing an asset or liability developed based on market data obtained from sources independent of the reporting entity (observable inputs) and (2) inputs that reflect the reporting entity's own assumptions about the assumptions market participants would use in valuing an asset or liability developed based on the best information available in the circumstances (unobservable inputs) and to establish classification of fair value measurements for disclosure purposes. Various inputs are used in determining the value of the Fund's investments. The inputs are summarized in the three broad levels listed below.
• Level 1 – unadjusted quoted prices in active markets for identical investments
• Level 2 – other significant observable inputs (including quoted prices for similar investments, interest rates, prepayment speeds, credit risk, etc.)
• Level 3 – significant unobservable inputs including the Fund's own assumptions in determining the fair value of investments. Factors considered in making this determination may include, but are not limited to, information obtained by contacting the issuer, analysts, or the appropriate stock exchange (for exchange-traded securities), analysis of the issuer's financial statements or other available documents and, if necessary, available information concerning other securities in similar circumstances
The inputs or methodology used for valuing securities are not necessarily an indication of the risk associated with investing in those securities and the determination of the significance of a particular input to the fair value measurement in its entirety requires judgment and considers factors specific to each security.
The following is a summary of the inputs used to value the Portfolio's investments as of December 31, 2015.
Investment Type | Level 1 Unadjusted quoted prices (000) | Level 2 Other significant observable inputs (000) | Level 3 Significant unobservable inputs (000) | Total (000) | |||||||||||||||
Assets: | |||||||||||||||||||
Fixed Income Securities | |||||||||||||||||||
Corporate Bonds | $ | — | $ | 8,377 | $ | — | $ | 8,377 | |||||||||||
Sovereign | — | 12,704 | — | 12,704 | |||||||||||||||
| Total Fixed Income Securities | — | 21,081 | — | 21,081 | |||||||||||||||
Warrant | — | 3 | — | 3 | |||||||||||||||
Short-Term Investment | |||||||||||||||||||
Investment Company | 315 | — | — | 315 | |||||||||||||||
| Foreign Currency Forward Exchange Contracts | — | 38 | — | 38 | |||||||||||||||
Total Assets | 315 | 21,122 | — | 21,437 | |||||||||||||||
Liabilities: | |||||||||||||||||||
| Foreign Currency Forward Exchange Contracts | — | (27 | ) | — | (27 | ) | |||||||||||||
Total | $ | 315 | $ | 21,095 | $ | — | $ | 21,410 | |||||||||||
Transfers between investment levels may occur as the markets fluctuate and/or the availability of data used in an investment's valuation changes. The Portfolio recognizes transfers between the levels as of the end of the period. As of December 31, 2015, the Portfolio did not have any investments transfer between investment levels.
3. Foreign Currency Translation and Foreign Investments: The books and records of the Portfolio are maintained in U.S. dollars. Foreign currency amounts are translated into U.S. dollars as follows:
– investments, other assets and liabilities at the prevailing rate of exchange on the valuation date;
– investment transactions and investment income at the prevailing rates of exchange on the dates of such transactions.
24
Morgan Stanley Institutional Fund, Inc.
Annual Report — December 31, 2015
Notes to Financial Statements (cont'd)
Although the net assets of the Portfolio are presented at the foreign exchange rates and market values at the close of the period, the Portfolio does not isolate that portion of the results of operations arising as a result of changes in the foreign exchange rates from the fluctuations arising from changes in the market prices of securities held at period end. Similarly, the Portfolio does not isolate the effect of changes in foreign exchange rates from the fluctuations arising from changes in the market prices of securities sold during the period. Accordingly, realized and unrealized foreign currency gains (losses) on investments in securities are included in the reported net realized and unrealized gains (losses) on investment transactions and balances. However, pursuant to U.S. Federal income tax regulations, gains and losses from certain foreign currency transactions and the foreign currency portion of gains and losses realized on sales and maturities of foreign denominated debt securities are treated as ordinary income for U.S. Federal income tax purposes.
Net realized gains (losses) on foreign currency transactions represent net foreign exchange gains (losses) from foreign currency forward exchange contracts, disposition of foreign currencies, currency gains (losses) realized between the trade and settlement dates on securities transactions, and the difference between the amount of investment income and foreign withholding taxes recorded on the Portfolio's books and the U.S. dollar equivalent amounts actually received or paid. Net unrealized currency gains (losses) from valuing foreign currency denominated assets and liabilities at period end exchange rates are reflected as a component of unrealized appreciation (depreciation) in the Statement of Assets and Liabilities. The change in unrealized currency gains (losses) on foreign currency translations for the period is reflected in the Statement of Operations.
Foreign security and currency transactions may involve certain considerations and risks not typically associated with those of U.S. dollar denominated transactions as a result of, among other factors, fluctuations of exchange rates in relation to the U.S. dollar, the possibility of lower levels of governmental supervision and regulation of foreign securities markets and the possibility of political or economic instability.
Governmental approval for foreign investments may be required in advance of making an investment under certain circumstances in some countries, and the extent of foreign investments in domestic companies may be subject to limitation in other countries. Foreign ownership limitations also may be imposed by the charters of individual companies to prevent, among other concerns, violations of foreign investment limitations. As a result, an additional class of shares (identified as "Foreign" in the Portfolio of Investments) may be created and offered for investment. The "local" and "foreign shares" market values may differ. In the absence of trading of the foreign shares in such markets, the Portfolio values the foreign shares at the closing exchange price of the local shares.
4. Structured Investments: The Portfolio invested a portion of its assets in structured investments. A structured investment is a derivative security designed to offer a return linked to a particular underlying security, currency, commodity or market. Structured investments may come in various forms including notes (such as exchange-traded notes), warrants and options to purchase securities. The Portfolio will typically use structured investments to gain exposure to a permitted underlying security, currency, commodity or market when direct access to a market is limited or inefficient from a tax or cost standpoint. There can be no assurance that structured investments will trade at the same price or have the same value as the underlying security, currency, commodity or market. Investments in structured investments involve risks including issuer risk, counterparty risk and market risk. Holders of structured investments bear risks of the underlying investment and are subject to issuer or counterparty risk because the Portfolio is relying on the creditworthiness of such issuer or counterparty and has no rights with respect to the underlying investment. Certain structured investments may be thinly traded or have a limited trading market and may have the effect of increasing the Portfolio's illiquidity to the extent that the Portfolio, at a particular time, may be unable to find qualified buyers for these securities.
5. Derivatives: The Portfolio may, but is not required to, use derivative instruments for a variety of purposes, including hedging, risk management, portfolio management or to earn income. Derivatives are financial instruments whose value is based, in part, on the value of an underlying asset, interest rate, index or financial instrument. Prevailing interest rates and volatility levels, among other
25
Morgan Stanley Institutional Fund, Inc.
Annual Report — December 31, 2015
Notes to Financial Statements (cont'd)
things, also affect the value of derivative instruments. A derivative instrument often has risks similar to its underlying asset and may have additional risks, including imperfect correlation between the value of the derivative and the underlying asset, risks of default by the counterparty to certain transactions, magnification of losses incurred due to changes in the market value of the securities, instruments, indices or interest rates to which the derivative instrument relates, risks that the transactions may not be liquid and risks arising from margin requirements. The use of derivatives involves risks that are different from, and possibly greater than, the risks associated with other portfolio investments. Derivatives may involve the use of highly specialized instruments that require investment techniques and risk analyses different from those associated with other portfolio investments. All of the Portfolio's holdings, including derivative instruments, are marked-to-market each day with the change in value reflected in unrealized appreciation (depreciation). Upon disposition, a realized gain or loss is recognized.
Certain derivative transactions may give rise to a form of leverage. Leverage magnifies the potential for gain and the risk of loss. Leverage associated with derivative transactions may cause the Portfolio to liquidate portfolio positions when it may not be advantageous to do so to satisfy its obligations or to meet earmarking or segregation requirements, pursuant to applicable Securities and Exchange Commission rules and regulations, or may cause the Portfolio to be more volatile than if the Portfolio had not been leveraged. Although the Adviser seeks to use derivatives to further the Portfolio's investment objectives, there is no assurance that the use of derivatives will achieve this result.
Following is a description of the derivative instruments and techniques that the Portfolio used during the period and their associated risks:
Foreign Currency Forward Exchange Contracts: In connection with its investments in foreign securities, the Portfolio also entered into contracts with banks, brokers or dealers to purchase or sell securities or foreign currencies at a future date. A foreign currency forward exchange contract ("currency contract") is a negotiated agreement between the contracting parties to exchange a specified amount of currency at a specified future time at a specified rate. The rate can be higher or lower than
the spot rate between the currencies that are the subject of the contract. Currency contracts may be used to protect against uncertainty in the level of future foreign currency exchange rates or to gain or modify exposure to a particular currency. To the extent hedged by the use of currency contracts, the precise matching of the currency contract amounts and the value of the securities involved will not generally be possible because the future value of such securities in foreign currencies will change as a consequence of market movements in the value of those securities between the date on which the contract is entered into and the date it matures. Furthermore, such transactions may reduce or preclude the opportunity for gain if the value of the currency should move in the direction opposite to the position taken. There is additional risk to the extent that currency contracts create exposure to currencies in which the Portfolio's securities are not denominated. Unanticipated changes in currency prices may result in poorer overall performance for the Portfolio than if it had not entered into such contracts. The use of currency contracts involves the risk of loss from the insolvency or bankruptcy of the counterparty to the contract or the failure of the counterparty to make payments or otherwise comply with the terms of the contract. A currency contract is marked-to-market daily and the change in market value is recorded by the Portfolio as unrealized gain or loss. The Portfolio records realized gains (losses) when the currency contract is closed equal to the difference between the value of the currency contract at the time it was opened and the value at the time it was closed.
Futures: A futures contract is a standardized, exchange-traded agreement to buy or sell a specific quantity of an underlying asset, reference rate or index at a specific price at a specific future time. The value of a futures contract tends to increase and decrease in tandem with the value of the underlying instrument. Depending on the terms of the particular contract, futures contracts are settled through either physical delivery of the underlying instrument on the settlement date or by payment of a cash settlement amount on the settlement date. During the period the futures contract is open, payments are received from or made to the broker based upon changes in the value of the contract (the variation margin). A decision as to whether, when and how to use futures contracts involves the exercise of skill and judgment and
26
Morgan Stanley Institutional Fund, Inc.
Annual Report — December 31, 2015
Notes to Financial Statements (cont'd)
even a well-conceived futures transaction may be unsuccessful because of market behavior or unexpected events. In addition to the derivatives risks discussed above, the prices of futures contracts can be highly volatile, using futures contracts can lower total return, and the potential loss from futures contracts can exceed the Portfolio's initial investment in such contracts. No assurance can be given that a liquid market will exist for any particular futures contract at any particular time. There is also the risk of loss by the Portfolio of margin deposits in the event of bankruptcy of a broker with which the Portfolio has open positions in the futures contract.
As of December 31, 2015, the Portfolio did not have any open futures contracts.
FASB ASC 815, "Derivatives and Hedging" ("ASC 815"), is intended to improve financial reporting about derivative instruments by requiring enhanced disclosures to enable investors to better understand how and why the Portfolio uses derivative instruments, how these derivative instruments are accounted for and their effects on the Portfolio's financial position and results of operations.
The following table sets forth the fair value of the Portfolio's derivative contracts by primary risk exposure as of December 31, 2015.
| Asset Derivatives Statement of Assets and Liabilities Location | Primary Risk Exposure | Value (000) | |||||||||||||
| Foreign Currency Forward Exchange Contracts | Unrealized Appreciation on Foreign Currency Forward Exchange Contracts | Currency Risk | $ | 38 | |||||||||||
| Liability Derivatives Statement of Assets and Liabilities Location | Primary Risk Exposure | Value (000) | |||||||||||||
| Foreign Currency Forward Exchange Contracts | Unrealized Depreciation on Foreign Currency Forward Exchange Contracts | Currency Risk | $ | (27 | ) | ||||||||||
The following tables set forth by primary risk exposure the Portfolio's realized gains (losses) and change in unrealized appreciation (depreciation) by type of derivative contract for the year ended December 31, 2015 in accordance with ASC 815.
Realized Gain (Loss) | |||||||||||
Primary Risk Exposure | Derivative Type | Value (000) | |||||||||
| Currency Risk | Foreign Currency Forward Exchange Contracts | $ | 103 | ||||||||
Interest Rate Risk | Futures Contract | (5 | ) | ||||||||
Total | $ | 98 | |||||||||
Change in Unrealized Appreciation (Depreciation) | |||||||||||
Primary Risk Exposure | Derivative Type | Value (000) | |||||||||
| Currency Risk | Foreign Currency Forward Exchange Contracts | $ | 11 | ||||||||
Interest Rate Risk | Futures Contract | (1 | ) | ||||||||
Total | $ | 10 | |||||||||
At December 31, 2015, the Portfolio's derivative assets and liabilities are as follows:
| Gross Amounts of Assets and Liabilities Presented in the Statement of Assets and Liabilities | |||||||||||
Derivatives | Assets(a) (000) | Liabilities(a) (000) | |||||||||
Foreign Currency Forward Exchange Contracts | $ | 38 | $ | (27 | ) | ||||||
(a) Absent an event of default or early termination, OTC derivative assets and liabilities are presented gross and not offset in the Statement of Assets and Liabilities.
The Portfolio typically enters into International Swaps and Derivatives Association, Inc. Master Agreements ("ISDA Master Agreements") or similar master agreements (collectively, "Master Agreements") with its contract counterparties for certain OTC derivatives in order to, among other things, reduce its credit risk to counterparties. ISDA Master Agreements include provisions for general obligations, representations, collateral and events of default or termination. Under an ISDA Master Agreement, the Portfolio typically may offset with the counterparty certain OTC derivative financial instruments' payables and/or receivables with collateral held and/or posted and create one single net payment (close-out netting) in the event of default, termination and/or potential deterioration in the credit quality of the counterparty. Various Master Agreements govern the terms of certain transactions with counterparties, including transactions such as swap, forward, repurchase and reverse repurchase agreements. These Master Agreements typically attempt to reduce the counterparty risk associated with such transactions by specifying credit protection mechanisms and providing standardization that improves legal certainty. Cross-termination provisions under Master Agreements typically provide that a default in connection with one transaction between the Portfolio and a counterparty gives the non-defaulting party the right to terminate any other transactions in place with the defaulting party to create one single net payment due to/due from the defaulting party and may be a feature in certain Master Agreements. In the event the Portfolio exercises its right to terminate a Master Agreement after a counterparty experiences a termination event as defined in the Master Agreement, the return of collateral with market value in excess of the Portfolio's net liability may be delayed or denied.
27
Morgan Stanley Institutional Fund, Inc.
Annual Report — December 31, 2015
Notes to Financial Statements (cont'd)
The following tables present derivative financial instruments that are subject to enforceable netting arrangements as of December 31, 2015.
Gross Amounts Not Offset in the Statement of Assets and Liabilities | |||||||||||||||||||
Counterparty | Gross Asset Derivatives Presented in Statement of Assets and Liabilities (000) | Financial Instrument (000) | Collateral Received (000) | Net Amount (not less than $0) (000) | |||||||||||||||
Deutsche Bank AG | $ | 1 | $ | (1 | ) | $ | — | $ | 0 | ||||||||||
JPMorgan Chase Bank NA | 37 | (24 | ) | — | 13 | ||||||||||||||
Total | $ | 38 | $ | (25 | ) | $ | — | $ | 13 | ||||||||||
Gross Amounts Not Offset in the Statement of Assets and Liabilities | |||||||||||||||||||
Counterparty | Gross Liability Derivatives Presented in Statement of Assets and Liabilities (000) | Financial Instrument (000) | Collateral Pledged (000) | Net Amount (not less than $0) (000) | |||||||||||||||
Deutsche Bank AG | $ | 3 | $ | (1 | ) | $ | — | $ | 2 | ||||||||||
JPMorgan Chase Bank NA | 24 | (24 | ) | — | 0 | ||||||||||||||
Total | $ | 27 | $ | (25 | ) | $ | — | $ | 2 | ||||||||||
For the year ended December 31, 2015, the approximate average monthly amount outstanding for each derivative type is as follows:
Foreign Currency Forward Exchange Contracts: | |||||||
Average monthly principal amount | $ | 1,718,000 | |||||
Futures Contracts: | |||||||
Average monthly original value | $ | 4,276,000 | |||||
6. Redemption Fees: The Portfolio will assess a 2% redemption fee on Class I shares, Class A shares, Class L shares, Class C shares and Class IS shares, which is paid directly to the Portfolio, for shares redeemed or exchanged within thirty days of purchase, subject to certain exceptions. The redemption fee is designed to protect the Portfolio and its remaining shareholders from the effects of short-term trading. These fees, if any, are included in the Statements of Changes in Net Assets.
7. Indemnifications: The Fund enters into contracts that contain a variety of indemnifications. The Fund's maximum exposure under these arrangements is unknown. However, the Fund has not had prior claims or losses pursuant to these contracts and expects the risk of loss to be remote.
8. Dividends and Distributions to Shareholders: Dividend income and distributions to shareholders are recorded on the ex-dividend date. Dividends from net investment income, if any, are declared and paid quarterly.
Net realized capital gains, if any, are distributed at least annually.
9. Security Transactions, Income and Expenses: Security transactions are accounted for on the trade date (date the order to buy or sell is executed). Realized gains and losses on the sale of investment securities are determined on the specific identified cost method. Dividend income and other distributions are recorded on the ex-dividend date (except for certain foreign dividends which may be recorded as soon as the Portfolio is informed of such dividends) net of applicable withholding taxes. Interest income is recognized on the accrual basis except where collection is in doubt. Discounts are accreted and premiums are amortized over the life of the respective securities. Most expenses of the Fund can be directly attributed to a particular Portfolio. Expenses which cannot be directly attributed are apportioned among the Portfolios based upon relative net assets or other appropriate methods. Income, expenses (other than class specific expenses — distribution and shareholder services, transfer agency and sub transfer agency fees) and realized and unrealized gains or losses are allocated to each class of shares based upon their relative net assets.
B. Advisory Fees: The Adviser, a wholly-owned subsidiary of Morgan Stanley, provides the Portfolio with advisory services under the terms of an Investment Advisory Agreement, paid quarterly, at the annual rate based on the daily net assets as follows:
| First $500 million | Next $500 million | Over $1 billion | |||||||||
0.75 | % | 0.70 | % | 0.65 | % | ||||||
For the year ended December 31, 2015, the advisory fee rate (net of waivers/rebate) was equivalent to an annual effective rate of 0.00% of the Portfolio's average daily net assets.
The Adviser has agreed to reduce its advisory fee and/or reimburse the Portfolio so that total annual portfolio operating expenses, excluding certain investment related expenses, taxes, interest and other extraordinary expenses (including litigation), will not exceed 0.85% for Class I shares, 1.20% for Class A shares, 1.45% for Class L shares, 1.95% for Class C shares and 0.82% for Class IS shares. The fee waivers and/or expense reimbursements will continue for at least two years from the date of the date of the Reorganization or until such time as the Directors act to discontinue all or a portion of such waivers and/or reimbursements when they deem such action is appropriate. For the year ended December 31, 2015, approximately $212,000 of advisory fees were waived and approximately
28
Morgan Stanley Institutional Fund, Inc.
Annual Report — December 31, 2015
Notes to Financial Statements (cont'd)
$76,000 of other expenses were reimbursed by the Adviser pursuant to this arrangement.
C. Administration Fees: The Adviser also serves as Administrator to the Fund and provides administrative services pursuant to an Administration Agreement for an annual fee, accrued daily and paid monthly, of 0.08% of the Portfolio's average daily net assets.
Under a Sub-Administration Agreement between the Administrator and State Street Bank and Trust Company ("State Street"), State Street provides certain administrative services to the Fund. For such services, the Administrator pays State Street a portion of the fee the Administrator receives from the Portfolio.
D. Distribution and Shareholder Services Fees: Morgan Stanley Distribution, Inc. ("MSDI" or the "Distributor"), a wholly-owned subsidiary of the Adviser and an indirect subsidiary of Morgan Stanley, serves as the Fund's Distributor of Portfolio shares pursuant to a Distribution Agreement. The Fund has adopted a Shareholder Services Plan with respect to Class A shares pursuant to Rule 12b-1 under the Act. Under the Shareholder Services Plan, the Portfolio pays the Distributor a shareholder services fee, accrued daily and paid monthly, at an annual rate of 0.25% of the Portfolio's average daily net assets attributable to Class A shares.
The Fund has adopted a Distribution and Shareholder Services Plan with respect to Class L shares pursuant to Rule 12b-1 under the Act. Under the Distribution and Shareholder Services Plan, the Portfolio pays the Distributor a distribution fee, accrued daily and paid monthly, at an annual rate of 0.25% and a shareholder services fee, accrued daily and paid monthly, at an annual rate of 0.25% of the Portfolio's average daily net assets attributable to Class L shares.
The Fund has adopted a Distribution and Shareholder Services Plan with respect to Class C shares pursuant to Rule 12b-1 under the Act. Under the Distribution and Shareholder Services Plan, the Portfolio pays the Distributor a distribution fee, accrued daily and paid monthly, at an annual rate of 0.75% and a shareholder services fee, accrued daily and paid monthly, at an annual rate of 0.25% of the Portfolio's average daily net assets attributable to Class C shares.
The distribution and shareholder services fees are used to support the expenses associated with servicing and maintaining accounts. The Distributor may compensate other parties for providing shareholder support services to investors who purchase Class A, Class L and Class C shares.
E. Dividend Disbursing and Transfer Agent: The Fund's dividend disbursing and transfer agent is Boston Financial Data Services, Inc. ("BFDS"). Pursuant to a Transfer Agency Agreement, the Fund pays BFDS a fee based on the number of classes, accounts and transactions relating to the Portfolios of the Fund.
F. Custodian Fees: State Street (the "Custodian") serves as Custodian for the Fund in accordance with a Custodian Agreement. The Custodian holds cash, securities, and other assets of the Fund as required by the Act. Custody fees are payable monthly based on assets held in custody, investment purchases and sales activity and account maintenance fees, plus reimbursement for certain out-of-pocket expenses.
G. Security Transactions and Transactions with Affiliates: For the year ended December 31, 2015, purchases and sales of investment securities for the Portfolio, other than long-term U.S. Government securities and short-term investments, were approximately $44,279,000 and $29,532,000, respectively. There were no purchases and sales of long-term U.S. Government securities for the year ended December 31, 2015.
The Portfolio invests in the Institutional Class of the Morgan Stanley Institutional Liquidity Funds — Money Market Portfolio (the "Liquidity Funds"), an open-end management investment company managed by the Adviser. Advisory fees paid by the Portfolio are reduced by an amount equal to its pro-rata share of the advisory and administration fees paid by the Portfolio due to its investment in the Liquidity Funds. For the year ended December 31, 2015, advisory fees paid were reduced by approximately $1,000 relating to the Portfolio's investment in the Liquidity Funds.
A summary of the Portfolio's transactions in shares of the Liquidity Funds during the year ended December 31, 2015 is as follows:
| Value December 31, 2014 (000) | Purchases at Cost (000) | Sales (000) | Dividend Income (000) | Value December 31, 2015 (000) | |||||||||||||||
| $ | 120 | $ | 34,313 | $ | 34,118 | $ | 2 | $ | 315 | ||||||||||
The Portfolio has an unfunded Deferred Compensation Plan (the "Compensation Plan"), which allows each independent Director to defer payment of all, or a portion, of the fees he or she receives for serving on the Board of Directors. Each eligible Director generally may elect to have the deferred amounts credited with a return equal to the total return on one or more of the Morgan Stanley funds that are offered as investment options under the Compensation Plan. Appreciation/depreciation
29
Morgan Stanley Institutional Fund, Inc.
Annual Report — December 31, 2015
Notes to Financial Statements (cont'd)
and distributions received from these investments are recorded with an offsetting increase/decrease in the deferred compensation obligation and do not affect the NAV of the Portfolio.
H. Federal Income Taxes: It is the Portfolio's intention to continue to qualify as a regulated investment company and distribute all of its taxable and tax-exempt income. Accordingly, no provision for Federal income taxes is required in the financial statements.
The Portfolio may be subject to taxes imposed by countries in which it invests. Such taxes are generally based on income and/or capital gains earned or repatriated. Taxes are accrued based on net investment income, net realized gains and net unrealized appreciation as such income and/or gains are earned. Taxes may also be based on transactions in foreign currency and are accrued based on the value of investments denominated in such currency.
FASB ASC 740-10, "Income Taxes — Overall", sets forth a minimum threshold for financial statement recognition of the benefit of a tax position taken or expected to be taken in a tax return. Management has concluded there are no significant uncertain tax positions that would require recognition in the financial statements. If applicable, the Portfolio recognizes interest accrued related to unrecognized tax benefits in "Interest Expense" and penalties in "Other Expenses" in the Statement of Operations. The Portfolio files tax returns with the U.S. Internal Revenue Service, New York and various states. Generally, each of the tax years in the four-year period ended December 31, 2015, remains subject to examination by taxing authorities.
The tax character of distributions paid may differ from the character of distributions shown in the Statements of Changes in Net Assets due to short-term capital gains being treated as ordinary income for tax purposes. The tax character of distributions paid during fiscal 2015 and 2014 was as follows:
| 2015 Distributions Paid From: | 2014 Distributions Paid From: | ||||||||||||||
| Ordinary Income (000) | Long-Term Capital Gain (000) | Ordinary Income (000) | Long-Term Capital Gain (000) | ||||||||||||
| $ | 1,646 | $ | — | $ | 1,031 | $ | — | ||||||||
The amount and character of income and gains to be distributed are determined in accordance with income tax regulations which may differ from GAAP. These book/tax differences are either considered temporary or permanent in nature.
Temporary differences are primarily due to differing book and tax treatments in the timing of the recognition of gains (losses) on certain investment transactions and the timing of the deductibility of certain expenses.
Permanent differences, primarily due to differing treatments of gains (losses) related to foreign currency transactions, gains (losses) on paydowns, redemptions-in-kind, tax adjustments on debt securities sold by the Portfolio and merger adjustments, resulted in the following reclassifications among the components of net assets at December 31, 2015:
| Distributions in Excess of Net Investment Income (000) | Accumulated Net Realized Loss (000) | Paid-in- Capital (000) | |||||||||
| $ | (90 | ) | $ | (2,240 | ) | $ | 2,330 | ||||
At December 31, 2015, the components of distributable earnings for the Portfolio on a tax basis were as follows:
| Undistributed Ordinary Income (000) | Undistributed Long-Term Capital Gain (000) | ||||||
| $ | 25 | $ | — | ||||
At December 31, 2015, the Portfolio had available for Federal income tax purposes unused short-term capital losses of approximately $1,965,000 and long-term capital losses of approximately $3,365,000 that do not have an expiration date. These amounts include capital losses acquired from MSIF Emerging Markets Domestic Debt that may be subject to limitation under IRC Section 382 in future years.
To the extent that capital loss carryforwards are used to offset any future capital gains realized, no capital gains tax liability will be incurred by the Portfolio for gains realized and not distributed. To the extent that capital gains are offset, such gains will not be distributed to the shareholders.
For the year ended December 31, 2015, the Portfolio realized gains from in-kind redemptions of approximately $1,147,000. The gains are not taxable income to the Portfolio.
30
Morgan Stanley Institutional Fund, Inc.
Annual Report — December 31, 2015
Report of Independent Registered Public Accounting Firm
To the Shareholders and Board of Directors of
Morgan Stanley Institutional Fund, Inc. —
Emerging Markets Fixed Income Opportunities Portfolio
We have audited the accompanying statement of assets and liabilities, including the portfolio of investments, of Emerging Markets Fixed Income Opportunities Portfolio (one of the portfolios constituting Morgan Stanley Institutional Fund, Inc.) (the "Portfolio") as of December 31, 2015, and the related statement of operations for the year then ended, the statements of changes in net assets for each of the two years in the period then ended and the financial highlights for each of the years or periods indicated therein. These financial statements and financial highlights are the responsibility of the Portfolio's management. Our responsibility is to express an opinion on these financial statements and financial highlights based on our audits.
We conducted our audits in accordance with the standards of the Public Company Accounting Oversight Board (United States). Those standards require that we plan and perform the audit to obtain reasonable assurance about whether the financial statements and financial highlights are free of material misstatement. We were not engaged to perform an audit of the Portfolio's internal control over financial reporting. Our audits included consideration of internal control over financial reporting as a basis for designing audit procedures that are appropriate in the circumstances, but not for the purpose of expressing an opinion on the effectiveness of the Portfolio's internal control over financial reporting. Accordingly, we express no such opinion. An audit also includes examining, on a test basis, evidence supporting the amounts and disclosures in the financial statements and financial highlights, assessing the accounting principles used and significant estimates made by management, and evaluating the overall financial statement presentation. Our procedures included confirmation of securities owned as of December 31, 2015, by correspondence with the custodian and others or by other appropriate auditing procedures where replies from others were not received. We believe that our audits provide a reasonable basis for our opinion.
In our opinion, the financial statements and financial highlights referred to above present fairly, in all material respects, the financial position of Emerging Markets Fixed Income Opportunities Portfolio (one of the portfolios constituting Morgan Stanley Institutional Fund, Inc.) at December 31, 2015, the results of its operations for the year then ended, the changes in its net assets for each of the two years in the period then ended and the financial highlights for each of the years or periods indicated therein, in conformity with U.S. generally accepted accounting principles.

Boston, Massachusetts
February 26, 2016
31
Morgan Stanley Institutional Fund, Inc.
Annual Report — December 31, 2015
U.S. Privacy Policy (unaudited)
AN IMPORTANT NOTICE CONCERNING OUR U.S. PRIVACY POLICY
This privacy notice describes the U.S. privacy policy of Morgan Stanley Distribution, Inc., and the Morgan Stanley family of mutual funds ("us", "our", "we").
We are required by federal law to provide you with notice of our U.S. privacy policy ("Policy"). This Policy applies to both our current and former clients unless we state otherwise and is intended for individual clients who purchase products or receive services from us for personal, family or household purposes. This Policy is not applicable to partnerships, corporations, trusts or other non-individual clients or account holders, nor is this Policy applicable to individuals who are either beneficiaries of a trust for which we serve as trustee or participants in an employee benefit plan administered or advised by us. This Policy is, however, applicable to individuals who select us to be a custodian of securities or assets in individual retirement accounts, 401(k) accounts, or accounts subject to the Uniform Gifts to Minors Act.
This notice sets out our business practices to protect your privacy; how we collect and share personal information about you; and how you can limit our sharing or certain uses by others of this information. We may amend this Policy at any time, and will inform you of any changes to our Policy as required by law.
WE RESPECT YOUR PRIVACY
We appreciate that you have provided us with your personal financial information and understand your concerns about your information. We strive to safeguard the information our clients entrust to us. Protecting the confidentiality and security of client information is an important part of how we conduct our business.
This notice describes what personal information we collect about you, how we collect it, when we may share it with others, and how certain others may use it. It discusses the steps you may take to limit our sharing of certain information about you with our affiliated companies, including, but not limited to our affiliated banking businesses, brokerage firms and credit service affiliates. It also discloses how you may limit our affiliates' use of shared information for marketing purposes.
Throughout this Policy, we refer to the nonpublic information that personally identifies you as "personal information." We also use the term "affiliated company" in this notice. An affiliated company is a company in our family of companies and includes companies with the Morgan Stanley name. These affiliated companies are financial institutions such as broker-dealers, banks, investment advisers and credit card issuers. We refer to any company that is not an affiliated company as a nonaffiliated third party. For purposes of Section 5 of this notice, and your ability to limit certain uses of personal information by our affiliates, this notice applies to the use of personal information by our affiliated companies.
1. WHAT PERSONAL INFORMATION DO WE COLLECT FROM YOU?
We may collect the following types of information about you: (i) information provided by you, including information from applications and other forms we receive from you, (ii) information about your transactions with us or our affiliates, (iii) information about your transactions with nonaffiliated third parties, (iv) information from consumer reporting agencies, (v) information obtained from our websites, and (vi) information obtained from other sources. For example:
• We collect information such as your name, address, e-mail address, telephone/fax numbers, assets, income and investment objectives through applications and other forms you submit to us.
• We may obtain information about account balances, your use of account(s) and the types of products and services you prefer to receive from us through your dealings and transactions with us and other sources.
• We may obtain information about your creditworthiness and credit history from consumer reporting agencies.
• We may collect background information from and through third-party vendors to verify representations you have made and to comply with various regulatory requirements.
2. WHEN DO WE DISCLOSE PERSONAL INFORMATION WE COLLECT ABOUT YOU?
We may disclose personal information we collect about you in each of the categories listed above to affiliated and nonaffiliated third parties.
32
Morgan Stanley Institutional Fund, Inc.
Annual Report — December 31, 2015
U.S. Privacy Policy (unaudited) (cont'd)
a. Information We Disclose to Affiliated Companies.
We may disclose personal information that we collect about you to our affiliated companies to manage your account(s) effectively, to service and process your transactions, and to let you know about products and services offered by us and affiliated companies, to manage our business, and as otherwise required or permitted by law. Offers for products and services from affiliated companies are developed under conditions designed to safeguard your personal information.
b. Information We Disclose to Third Parties.
We may disclose personal information that we collect about you to nonaffiliated third parties to provide marketing services on our behalf or to other financial institutions with whom we have joint marketing agreements. We may also disclose all of the information we collect to other nonaffiliated third parties for our everyday business purposes, such as to process transactions, maintain account(s), respond to court orders and legal investigations, report to credit bureaus, offer our own products and services, protect against fraud, for institutional risk control, to perform services on our behalf, and as otherwise required or permitted by law.
When we share personal information about you with a nonaffiliated third party, they are required to limit their use of personal information about you to the particular purpose for which it was shared and they are not allowed to share personal information about you with others except to fulfill that limited purpose or as may be permitted or required by law.
3. HOW DO WE PROTECT THE SECURITY AND CONFIDENTIALITY OF PERSONAL INFORMATION WE COLLECT ABOUT YOU?
We maintain physical, electronic and procedural security measures that comply with applicable law and regulations to help safeguard the personal information we collect about you. We have internal policies governing the proper handling of client information by employees. Third parties that provide support or marketing services on our behalf may also receive personal information about you, and we require them to adhere to appropriate security standards with respect to such information.
4. HOW CAN YOU LIMIT OUR SHARING CERTAIN PERSONAL INFORMATION ABOUT YOU WITH OUR AFFILIATED COMPANIES FOR ELIGIBILITY DETERMINATION?
By following the opt-out procedures in Section 6 below, you may limit the extent to which we share with our affiliated companies, personal information that was collected to determine your eligibility for products and services such as your credit reports and other information that you have provided to us or that we may obtain from third parties ("eligibility information"). Eligibility information does not include your identification information or personal information pertaining to our transactions or experiences with you. Please note that, even if you direct us not to share eligibility information with our affiliated companies, we may still share your personal information, including eligibility information, with our affiliated companies under circumstances that are permitted under applicable law, such as to process transactions or to service your account.
5. HOW CAN YOU LIMIT THE USE OF CERTAIN PERSONAL INFORMATION ABOUT YOU BY OUR AFFILIATED COMPANIES FOR MARKETING?
By following the opt-out instructions in Section 6 below, you may limit our affiliated companies from marketing their products or services to you based on personal information we disclose to them. This information may include, for example, your income and account history with us. Please note that, even if you choose to limit our affiliated companies from using personal information about you that we may share with them for marketing their products and services to you, our affiliated companies may use your personal information that they obtain from us to market to you in circumstances permitted by law, such as if the affiliated party has its own relationship with you.
33
Morgan Stanley Institutional Fund, Inc.
Annual Report — December 31, 2015
U.S. Privacy Policy (unaudited) (cont'd)
6. HOW CAN YOU SEND US AN OPT-OUT INSTRUCTION?
If you wish to limit our sharing of eligibility information about you with our affiliated companies, or our affiliated companies' use of personal information for marketing purposes, as described in this notice, you may do so by:
• Calling us at (800) 548-7786
Monday–Friday between 8a.m. and 6p.m. (EST)
• Writing to us at the following address:
Boston Financial Data Services, Inc.
c/o Privacy Coordinator
P.O. Box 219804
Kansas City, Missouri 64121
If you choose to write to us, your request should include: your name, address, telephone number and account number(s) to which the opt-out applies and whether you are opting out with respect to sharing of eligibility information (Section 4 above), or information used for marketing (Section 5 above), or both. Written opt-out requests should not be sent with any other correspondence. In order to process your request, we require that the request be provided by you directly and not through a third party. Once you have informed us about your privacy preferences, your opt-out preference will remain in effect with respect to this Policy (as it may be amended) until you notify us otherwise. If you are a joint account owner, we will accept instructions from any one of you and apply those instructions to the entire account.
Please understand that if you limit our sharing or our affiliated companies' use of personal information, you and any joint account holder(s) may not receive information about our affiliated companies' products and services, including products or services that could help you manage your financial resources and achieve your investment objectives.
If you have more than one account or relationship with us, please specify the accounts to which you would like us to apply your privacy choices. If you have accounts or relationships with our affiliates, you may receive multiple privacy policies from them, and will need to separately notify those companies of your privacy choices for those accounts or relationships.
7. WHAT IF AN AFFILIATED COMPANY BECOMES A NONAFFILIATED THIRD PARTY?
If, at any time in the future, an affiliated company becomes a nonaffiliated third party, further disclosures of personal information made to the former affiliated company will be limited to those described in Section 2(b) above relating to nonaffiliated third parties. If you elected under Section 6 to limit disclosures we make to affiliated companies, or use of personal information by affiliated companies, your election will not apply to use by any former affiliated company of your personal information in their possession once it becomes a nonaffiliated third party.
SPECIAL NOTICE TO RESIDENTS OF VERMONT
The following section supplements our Policy with respect to our individual clients who have a Vermont address and supersedes anything to the contrary in the above Policy with respect to those clients only.
The State of Vermont requires financial institutions to obtain your consent prior to sharing personal information that they collect about you with nonaffiliated third parties, or eligibility information with affiliated companies, other than in certain limited circumstances. Except as permitted by law, we will not share personal information we collect about you with nonaffiliated third parties or eligibility information with affiliated companies, unless you provide us with your written consent to share such information.
SPECIAL NOTICE TO RESIDENTS OF CALIFORNIA
The following section supplements our Policy with respect to our individual clients who have a California address and supersedes anything to the contrary in the above Policy with respect to those clients only.
In response to a California law, if your account has a California home address, your personal information will not be disclosed to nonaffiliated third parties except as permitted by applicable California law, and we will limit sharing such personal information with our affiliates to comply with California privacy laws that apply to us.
34
Morgan Stanley Institutional Fund, Inc.
Annual Report — December 31, 2015
Director and Officer Information (unaudited)
Independent Directors:
| Name, Age and Address of Independent Director | Positions(s) Held with Registrant | Length of Time Served* | Principal Occupation(s) During Past 5 Years and Other Relevant Professional Experience | Number of Portfolios in Fund Complex Overseen by Director** | Other Directorships Held by Independent Director*** | ||||||||||||||||||
| Frank L. Bowman (71) c/o Kramer Levin Naftalis & Frankel LLP Counsel to the Independent Directors 1177 Avenue of the Americas New York, NY 10036 | Director | Since August 2006 | President, Strategic Decisions, LLC (consulting) (since February 2009); Director or Trustee of various Morgan Stanley Funds (since August 2006); Chairperson of the Compliance and Insurance Committee (since October 2015); Formerly, Chairperson of the Insurance Sub-Committee of the Compliance and Insurance Committee (February 2007-December 2015); served as President and Chief Executive Officer of the Nuclear Energy Institute (policy organization) (February 2005-November 2008); retired as Admiral, U.S. Navy after serving over 38 years on active duty including 8 years as Director of the Naval Nuclear Propulsion Program in the Department of the Navy and the U.S. Department of Energy (1996-2004); served as Chief of Naval Personnel (July 1994-September 1996); and on the Joint Staff as Director of Political Military Affairs (June 1992-July1994); knighted as Honorary Knight Commander of the Most Excellent Order of the British Empire; awarded the Officier de l'Orde National du Mérite by the French Government; elected to the National Academy of Engineering (2009). | 98 | Director of BP p.l.c.; Director of Naval and Nuclear Technologies LLP; Director Emeritus of the Armed Services YMCA; Director of the U.S. Naval Submarine League; Member of the National Security Advisory Council of the Center for U.S. Global Engagement and a member of the CNA Military Advisory Board; Chairman of the Charity, J Street Cup Golf, Trustee of Fairhaven United Methodist Church; and Director of other various non-profit organizations. | ||||||||||||||||||
| Kathleen A. Dennis (62) c/o Kramer Levin Naftalis & Frankel LLP Counsel to the Independent Directors 1177 Avenue of the Americas New York, NY 10036 | Director | Since August 2006 | President, Cedarwood Associates (mutual fund and investment management consulting) (since July 2006); Chairperson of the Money Market and Alternatives Sub-Committee of the Investment Committee (since October 2006) and Director or Trustee of various Morgan Stanley Funds (since August 2006); formerly, Senior Managing Director of Victory Capital Management (1993-2006). | 98 | Director of various nonprofit organizations. | ||||||||||||||||||
| Nancy C. Everett (61) c/o Kramer Levin Naftalis & Frankel LLP Counsel to the Independent Trustees 1177 Avenue of the Americas New York, NY 10036 | Trustee | Since January 2015 | Chief Executive Officer, Virginia Commonwealth University Investment Company (since November 2015); Owner, OBIR, LLC (institutional investment management consulting) (since June 2014); formerly, Managing Director, BlackRock Inc. (February 2011-December 2013); and Chief Executive Officer, General Motors Asset Management (a/k/a Promark Global Advisors, Inc.) (June 2005-May 2010). | 98 | Member of Virginia Commonwealth University School of Business Foundation; formerly, Member of Virginia Commonwealth University Board of Visitors (2013-2015); Member of Committee on Directors for Emerging Markets Growth Fund, Inc. (2007-2010); Chairperson of Performance Equity Management, LLC (2006-2010); and Chairperson, GMAM Absolute Return Strategies Fund, LLC (2006-2010). | ||||||||||||||||||
35
Morgan Stanley Institutional Fund, Inc.
Annual Report — December 31, 2015
Director and Officer Information (unaudited) (cont'd)
Independent Directors: (cont'd)
| Name, Age and Address of Independent Director | Positions(s) Held with Registrant | Length of Time Served* | Principal Occupation(s) During Past 5 Years and Other Relevant Professional Experience | Number of Portfolios in Fund Complex Overseen by Director** | Other Directorships Held by Independent Director*** | ||||||||||||||||||
| Jakki L. Haussler (58) c/o Kramer Levin Naftalis & Frankel LLP Counsel to the Independent Directors 1177 Avenue of the Americas New York, NY 10036 | Director | Since January 2015 | Chairman and Chief Executive Officer, Opus Capital Group (since January 1996); and formerly, Director, Capvest Venture Fund, LP (May 2000-December 2011); Partner, Adena Ventures, LP (July 1999-December 2010); Director, The Victory Funds (February 2005-July 2008). | 98 | Director of Cincinnati Bell Inc. and Member, Audit Committee and Compensation Committee; Director of Northern Kentucky University Foundation and Member, Investment Committee; Member of Chase College of Law Transactional Law Practice Center Board of Advisors; Director of Best Transport; Chase College of Law Board of Visitors; formerly Member, University of Cincinnati Foundation Investment Committee; formerly, Member, Miami University Board of Visitors (2008-2011); Trustee of Victory Funds (2005-2008) and Chairman, Investment Committee (2007-2008) and Member, Service Provider Committee (2005-2008). | ||||||||||||||||||
| Dr. Manuel H. Johnson (67) c/o Johnson Smick International, Inc. 220 I Street, N.E. — Suite 200 Washington, D.C. 20002 | Director | Since July 1991 | Senior Partner, Johnson Smick International, Inc. (consulting firm); Chairperson of the Investment Committee (since October 2006) and Director or Trustee of various Morgan Stanley Funds (since July 1991); Co-Chairman and a founder of the Group of Seven Council (G7C) (international economic commission); formerly Chairperson of the Audit Committee (July 1991-September 2006), Vice Chairman of the Board of Governors of the Federal Reserve System and Assistant Secretary of the U.S. Treasury. | 100 | Director of NVR, Inc. (home construction). | ||||||||||||||||||
| Joseph J. Kearns (73) c/o Kearns & Associates LLC 23823 Malibu Road S-50-440 Malibu, CA 90265 | Director | Since August 1994 | President, Kearns & Associates LLC (investment consulting); Chairperson of the Audit Committee (since October 2006) and Director or Trustee of various Morgan Stanley Funds (since August 1994); formerly, Deputy Chairperson of the Audit Committee (July 2003-September 2006) and Chairperson of the Audit Committee of various Morgan Stanley Funds (since August 1994); CFO of the J. Paul Getty Trust. | 101 | Director of Electro Rent Corporation (equipment leasing). Prior to December 31, 2013, Director of The Ford Family Foundation. | ||||||||||||||||||
36
Morgan Stanley Institutional Fund, Inc.
Annual Report — December 31, 2015
Director and Officer Information (unaudited) (cont'd)
Independent Directors: (cont'd)
| Name, Age and Address of Independent Director | Positions(s) Held with Registrant | Length of Time Served* | Principal Occupation(s) During Past 5 Years and Other Relevant Professional Experience | Number of Portfolios in Fund Complex Overseen by Director** | Other Directorships Held by Independent Director*** | ||||||||||||||||||
| Michael F. Klein (57) c/o Kramer Levin Naftalis & Frankel LLP Counsel to the Independent Directors 1177 Avenue of the Americas New York, NY 10036 | Director | Since August 2006 | Managing Director, Aetos Capital, LLC (since March 2000); Co-President, Aetos Alternatives Management, LLC (since January 2004); and Co-Chief Executive Officer of Aetos Capital LLC (since August 2013); Chairperson of the Fixed Income Sub-Committee of the Investment Committee (since October 2006) and Director or Trustee of various Morgan Stanley Funds (since August 2006); formerly, Managing Director, Morgan Stanley & Co. Inc. and Morgan Stanley Dean Witter Investment Management, President, various Morgan Stanley Funds (June 1998-March 2000) and Principal, Morgan Stanley & Co. Inc. and Morgan Stanley Dean Witter Investment Management (August 1997-December 1999). | 97 | Director of certain investment funds managed or sponsored by Aetos Capital, LLC. Director of Sanitized AG and Sanitized Marketing AG (specialty chemicals). | ||||||||||||||||||
| Michael E. Nugent (79) 522 Fifth Avenue New York, NY 10036 | Chair of the Board and Director | Chair of the Boards since July 2006 and Director since July 1991 | Chair of the Boards of various Morgan Stanley Funds (since July 2006); Chairperson of the Closed-End Fund Committee (since June 2012) and Director or Trustee of various Morgan Stanley Funds (since July 1991); formerly, Chairperson of the Insurance Committee (until July 2006), General Partner, TriumphCapital, L.P. (private investment partnership) (1988-2013). | 100 | None. | ||||||||||||||||||
| W. Allen Reed (68) c/o Kramer Levin Naftalis & Frankel LLP Counsel to the Independent Directors 1177 Avenue of the Americas New York, NY 10036 | Director | Since August 2006 | Chairperson of the Equity Sub-Committee of the Investment Committee (since October 2006) and Director or Trustee of various Morgan Stanley Funds (since August 2006); formerly, President and CEO of General Motors Asset Management; Chairman and Chief Executive Officer of the GM Trust Bank and Corporate Vice President of General Motors Corporation (August 1994-December 2005). | 98 | Director of Legg Mason, Inc.; formerly Director of the Auburn University Foundation (2010-2015). | ||||||||||||||||||
| Fergus Reid (83) c/o Joe Pietryka, Inc. 85 Charles Colman Blvd. Pawling, NY 12564 | Director | Since June 1992 | Chairman, Joe Pietryka, Inc.; Chairperson of the Governance Committee and Director or Trustee of various Morgan Stanley Funds (since June 1992). | 100 | Formerly, Trustee and Director of certain investment companies in the JP Morgan Fund Complex managed by JP Morgan Investment Management Inc. (1987-2012). | ||||||||||||||||||
37
Morgan Stanley Institutional Fund, Inc.
Annual Report — December 31, 2015
Director and Officer Information (unaudited) (cont'd)
Interested Director:
| Name, Age and Address of Interested Director | Positions(s) Held with Registrant | Length of Time Served* | Principal Occupation(s) During Past 5 Years | Number of Portfolios in Fund Complex Overseen by Interested Director** | Other Directorships Held by Interested Director*** | ||||||||||||||||||
| James F. Higgins (68) One New York Plaza, New York, NY 10004 | Director | Since June 2000 | Director or Trustee of various Morgan Stanley Funds (since June 2000); Senior Advisor of Morgan Stanley (since August 2000). | 99 | Formerly, Director of AXA Financial, Inc. and AXA Equitable Life Insurance Company (2002-2011) and Director of AXA MONY Life Insurance Company and AXA MONY Life Insurance Company of America (2004-2011). | ||||||||||||||||||
* This is the earliest date the Director began serving the Morgan Stanley Funds. Each Director serves an indefinite term, until his or her successor is elected.
** The Fund Complex includes (as of December 31, 2015) all open-end and closed-end funds (including all of their portfolios) advised by Morgan Stanley Investment Management Inc. (the "Adviser") and any funds that have an adviser that is an affiliated person of the Adviser (including, but not limited to, Morgan Stanley AIP GP LP).
*** This includes any directorships at public companies and registered investment companies held by the Director at any time during the past five years.
Executive Officers:
Name, Age and Address of Executive Officer | Position(s) Held with Registrant | Length of Time Served**** | Principal Occupation(s) During Past 5 Years | ||||||||||||
| John H. Gernon (52) 522 Fifth Avenue New York, NY 10036 | President and Principal Executive Officer | Since September 2013 | President and Principal Executive Officer of the Equity and Fixed Income Funds and the Morgan Stanley AIP Funds (since September 2013) and the Liquidity Funds and various money market funds (since May 2014) in the Fund Complex, Managing Director of the Adviser; Head of Product (since 2006). | ||||||||||||
| Stefanie V. Chang Yu (49) 522 Fifth Avenue New York, NY 10036 | Chief Compliance Officer | Since December 1997 | Managing Director of the Adviser and various entities affiliated with the Adviser; Chief Compliance Officer of various Morgan Stanley Funds and the Adviser (since January 2014); formerly, Vice President of various Morgan Stanley Funds (December 1997-January 2014). | ||||||||||||
| Joseph C. Benedetti (50) 522 Fifth Avenue New York, NY 10036 | Vice President | Since January 2014 | Managing Director of the Adviser and various entities affiliated with the Adviser; Vice President of various Morgan Stanley Funds (since January 2014); formerly, Assistant Secretary of various Morgan Stanley Funds (October 2004-January 2014). | ||||||||||||
| Francis J. Smith (50) 522 Fifth Avenue New York, NY 10036 | Treasurer and Principal Financial Officer | Treasurer since July 2003 and Principal Financial Officer since September 2002 | Executive Director of the Adviser and various entities affiliated with the Adviser; Treasurer (since July 2003) and Principal Financial Officer of various Morgan Stanley Funds (since September 2002). | ||||||||||||
| Mary E. Mullin (48) 522 Fifth Avenue New York, NY 10036 | Secretary | Since June 1999 | Executive Director of the Adviser; Secretary of various Morgan Stanley Funds (since June 1999). | ||||||||||||
**** This is the earliest date the officer began serving the Morgan Stanley Funds. Each officer serves a one-year term, until his or her successor is elected and has qualified.
38
Morgan Stanley Institutional Fund, Inc.
Annual Report — December 31, 2015
Adviser and Administrator
Morgan Stanley Investment Management Inc.
522 Fifth Avenue
New York, New York 10036
Distributor
Morgan Stanley Distribution, Inc.
522 Fifth Avenue
New York, New York 10036
Dividend Disbursing and Transfer Agent
Boston Financial Data Services, Inc.
2000 Crown Colony Drive
Quincy, Massachusetts 02169
Custodian
State Street Bank and Trust Company
One Lincoln Street
Boston, Massachusetts 02111
Legal Counsel
Dechert LLP
1095 Avenue of the Americas
New York, New York 10036
Counsel to the Independent Directors
Kramer Levin Naftalis & Frankel LLP
1177 Avenue of the Americas
New York, New York 10036
Independent Registered Public Accounting Firm
Ernst & Young LLP
200 Clarendon Street
Boston, Massachusetts 02116
Reporting to Shareholders
Each Morgan Stanley fund provides a complete schedule of portfolio holdings in its semi-annual and annual reports within 60 days of the end of the fund's second and fourth fiscal quarters. The semi-annual and annual reports are filed electronically with the Securities and Exchange Commission (SEC) on Form N-CSRS and Form N-CSR, respectively. Morgan Stanley also delivers the semi-annual and annual reports to fund shareholders and makes these reports available on its public website, www.morganstanley.com/im. Each Morgan Stanley fund also files a complete schedule of portfolio holdings with the SEC for the fund's first and third fiscal quarters on Form N-Q. Morgan Stanley does not deliver the reports for the first and third fiscal quarters to shareholders, nor are the reports posted to the Morgan Stanley public website. You may, however, obtain the Form N-Q filings (as well as the Form N-CSR and N-CSRS filings) by accessing the SEC's website, www.sec.gov. You may also review and copy them at the SEC's Public Reference Room in Washington, DC. Information on the operation of the SEC's Public Reference Room may be obtained by calling the SEC toll free at 1 (800) SEC-0330. You can also request copies of these materials, upon payment of a duplicating fee, by electronic request at the SEC's email address (publicinfo@sec.gov) or by writing the Public Reference Room of the SEC, Washington, DC 20549-0102.
Proxy Voting Policies and Procedures and Proxy Voting Record
You may obtain a copy of the Fund's Proxy Voting Policy and Procedures and information regarding how the Fund voted proxies relating to portfolio securities during the most recent twelve-month period ended June 30, without charge, upon request, by calling toll free 1 (800) 548-7786 or by visiting our website at www.morganstanley.com/im. This information is also available on the SEC's website at www.sec.gov.
This report is authorized for distribution only when preceded or accompanied by a prospectus of the Morgan Stanley Institutional Fund, Inc., which describes in detail each Portfolio's investment policies, risks, fees and expenses. Please read the prospectus carefully before you invest or send money. For additional information, including information regarding the investments comprising the Portfolio, please visit our website at www.morganstanley.com/im or call toll free 1 (800) 548-7786.
39
Printed in U.S.A.
This Report has been prepared for shareholders and may be distributed to others only if preceded or accompanied by a current prospectus.
Morgan Stanley Investment Management Inc.
522 Fifth Avenue
New York, New York 10036
© 2016 Morgan Stanley. Morgan Stanley Distribution, Inc.

IFIEMEDANN
1405313 EXP. 02.28.17
INVESTMENT MANAGEMENT

Morgan Stanley Institutional Fund, Inc.
Multi-Asset Portfolio
Annual Report
December 31, 2015

Morgan Stanley Institutional Fund, Inc.
Annual Report — December 31, 2015
Table of Contents
Shareholders' Letter | 2 | ||||||
Expense Example | 3 | ||||||
Investment Overview | 4 | ||||||
Portfolio of Investments | 8 | ||||||
Statement of Assets and Liabilities | 21 | ||||||
Statement of Operations | 23 | ||||||
Statements of Changes in Net Assets | 24 | ||||||
Financial Highlights | 26 | ||||||
Notes to Financial Statements | 31 | ||||||
Report of Independent Registered Public Accounting Firm | 44 | ||||||
Federal Tax Notice | 45 | ||||||
U.S. Privacy Policy | 46 | ||||||
Director and Officer Information | 49 | ||||||
This report is authorized for distribution only when preceded or accompanied by prospectuses of the Morgan Stanley Institutional Fund, Inc. To receive a prospectus and/or statement of additional information (SAI), which contains more complete information such as investment objectives, charges, expenses, policies for voting proxies, risk considerations, and describes in detail each of the Portfolio's investment policies to the prospective investor, please call toll free 1 (800) 548-7786. Please read the prospectuses carefully before you invest or send money.
Additionally, you can access portfolio information including performance, characteristics, and investment team commentary through Morgan Stanley Investment Management's website: www.morganstanley.com/im.
Market forecasts provided in this report may not necessarily come to pass. There is no guarantee that any sectors mentioned will continue to perform as discussed herein or that securities in such sectors will be held by the Portfolio in the future. There is no assurance that a Portfolio will achieve its investment objective. Portfolios are subject to market risk, which is the possibility that market values of securities owned by the Portfolio will decline and, therefore, the value of the Portfolio's shares may be less than what you paid for them. Accordingly, you can lose money investing in this Portfolio. Please see the prospectus for more complete information on investment risks.
1
Morgan Stanley Institutional Fund, Inc.
Annual Report — December 31, 2015
Shareholders' Letter (unaudited)
Dear Shareholders,
We are pleased to provide this Annual report, in which you will learn how your investment in Multi-Asset Portfolio (the "Portfolio") performed during the latest twelve-month period.
Morgan Stanley Investment Management is a client-centric, investor-led organization. Our global presence, intellectual capital, and breadth of products and services enable us to partner with investors to meet the evolving challenges of today's financial markets. We aim to deliver superior investment service and to empower our clients to make the informed decisions that help them reach their investment goals.
As always, we thank you for selecting Morgan Stanley Investment Management, and look forward to working with you in the months and years ahead.
Sincerely,

John H. Gernon
President and Principal Executive Officer
January 2016
2
Morgan Stanley Institutional Fund, Inc.
Annual Report — December 31, 2015
Expense Example (unaudited)
Multi-Asset Portfolio
As a shareholder of the Portfolio, you incur two types of costs: (1) transactional costs; and (2) ongoing costs, including advisory fees, administration fees, distribution and shareholder services fees and other Portfolio expenses. This example is intended to help you understand your ongoing costs (in dollars) of investing in the Portfolio and to compare these costs with the ongoing costs of investing in other mutual funds.
This example is based on an investment of $1,000 invested at the beginning of the six-month period ended December 31, 2015 and held for the entire six-month period.
Actual Expenses
The table below provides information about actual account values and actual expenses. You may use the information in this table, together with the amount you invested, to estimate the expenses that you paid over the period. Simply divide your account value by $1,000 (for example, an $8,600 account value divided by $1,000 = 8.6), then multiply the result by the number in the table under the heading entitled "Actual Expenses Paid During Period" to estimate the expenses you paid on your account during this period.
Hypothetical Example for Comparison Purposes
The table below provides information about hypothetical account values and hypothetical expenses based on the Portfolio's actual expense ratio and an assumed rate of return of 5% per year before expenses, which is not the Portfolio's actual return. The hypothetical account values and expenses may not be used to estimate the actual ending account balance or expenses you paid for the period. You may use this information to compare the ongoing costs of investing in the Portfolio and other funds. To do so, compare this 5% hypothetical example with the 5% hypothetical examples that appear in the shareholder reports of the other funds.
Please note that the expenses shown in the table are meant to highlight your ongoing costs only and do not reflect any transactional costs, such as sales charges (loads). Therefore, the information for each class in the table is useful in comparing ongoing costs only, and will not help you determine the relative total costs of owning different funds. In addition, if these transactional costs were included, your costs would have been higher.
| Beginning Account Value 7/1/15 | Actual Ending Account Value 12/31/15 | Hypothetical Ending Account Value | Actual Expenses Paid During Period* | Hypothetical Expenses Paid During Period* | Net Expense Ratio During Period** | ||||||||||||||||||||||
Multi-Asset Portfolio Class I | $ | 1,000.00 | $ | 955.20 | $ | 1,019.81 | $ | 5.27 | $ | 5.45 | 1.07 | % | |||||||||||||||
Multi-Asset Portfolio Class A | 1,000.00 | 953.00 | 1,018.05 | 6.99 | 7.22 | 1.42 | |||||||||||||||||||||
Multi-Asset Portfolio Class L | 1,000.00 | 950.50 | 1,015.53 | 9.44 | 9.75 | 1.92 | |||||||||||||||||||||
Multi-Asset Portfolio Class C | 1,000.00 | 949.60 | 1,014.27 | 10.66 | 11.02 | 2.17 | |||||||||||||||||||||
Multi-Asset Portfolio Class IS | 1,000.00 | 955.20 | 1,019.96 | 5.13 | 5.30 | 1.04 | |||||||||||||||||||||
* Expenses are calculated using each Portfolio Class' annualized net expense ratio (as disclosed), multiplied by the average account value over the period, and multiplied by 184/365 (to reflect the most recent one-half year period).
** Annualized.
3
Morgan Stanley Institutional Fund, Inc.
Annual Report — December 31, 2015
Investment Overview (unaudited)
Multi-Asset Portfolio
The Portfolio seeks total return. The Portfolio's "Adviser," Morgan Stanley Investment Management Inc., seeks to achieve this objective with an emphasis on positive absolute return and controlling downside portfolio risk.
Performance
For the year ended December 31, 2015, the Portfolio's Class I shares had a total return based on net asset value and reinvestment of distributions per share of –10.60%, net of fees. The Portfolio's Class I shares underperformed the Portfolio's primary benchmark, the Bank of America/Merrill Lynch U.S. Dollar 1-month LIBID Average Index (the "Index"), which returned 0.10%, and underperformed the secondary benchmark, the Customized MSIM Global Allocation Index (comprised of 60% MSCI All Country World Index, 30% Barclays Global Aggregate Bond Index, 5% S&P GSCI Light Energy Index, and 5% Bank of America/Merrill Lynch U.S. Dollar 1-Month LIBID Average Index), which returned –3.51%. (Portfolio and benchmark index performance in U.S. dollar ("USD") terms).
Factors Affecting Performance*
• Global equities were up 1.3% in local currency terms in 2015 (–2.4% USD), performing in line with bonds, which rose 1.3% in local currency terms (–2.6% USD), and outperforming commodities, which fell –32.9% USD.(i) The U.S. economic expansion gained momentum, and the U.S. Federal Reserve (Fed) hiked rates in December for the first time in over a decade, marking the end of the "ZIRP" (zero interest rate policy) regime. Meanwhile, China began exporting weakness to the rest of the world, and volatility spiked significantly in August as global growth fears mounted. Oil prices continued to tumble as OPEC (Organization of the Petroleum Exporting Countries) increased production, and inflation expectations fell across developed markets.
• U.S. equities slightly outperformed global equities in 2015 (with the S&P 500 Index advancing +1.4%). Employment data finally broke out of its tepid range in October, with the unemployment rate falling to 5.0% and wage growth picking up to +2.5% year-over-year.(ii) Although strength in the labor market came as a relief, U.S. equities began to sell off in December as the realization of monetary policy normalization set in amid slowing global growth.
• Eurozone equities gained +6.4% in local currency terms (as measured by the EUROSTOXX 50 Index) in 2015, but fell –4.4% in USD terms as the euro depreciated by –10.2% versus the U.S. dollar. Positive progress in the eurozone recovery was overshadowed by a second Greek debt crisis, which reached a boiling point in July, and then by investor fears over Europe's emerging market exposure during the sell-off in August and September. The European Central Bank (ECB) ended the year on a surprisingly hawkish note, disappointing investors by failing to increase easing measures.
• Emerging market equities underperformed in 2015, with the MSCI Emerging Markets Index tumbling –15.0% in USD. Massive fiscal and monetary policy easing in China fueled a bubble in the Chinese equities market, which burst in June as growth data failed to respond to government efforts. Activity failed to stabilize during the second half of the year, and growth remained weak in both the manufacturing and services sectors. The MSCI China Index finished the year down –7.8% in USD after falling –28% from its April peak. Falling commodity prices and a deepening recession in Brazil (MSCI Brazil Index declined –41.4% in USD) also weighed on emerging market assets, and stalling progress on reforms halted the rally in India (MSCI India Index lost –6.1% in USD).
• Japanese equities outperformed during 2015, with the MSCI Japan Index up +9.6% in local currency terms. Following early gains, Japan began to underperform during the second half of the year, as S&P downgraded its sovereign credit rating, citing disappointment with "Abenomics," and Japan narrowly escaped a technical recession during the third quarter.
* Certain of the Portfolio's investment themes may, in whole or part, be implemented through the use of derivatives, including the purchase and sale of futures, options, swaps, structured investments (including commodity-linked notes) and other related instruments and techniques. The Portfolio may also invest in foreign currency forward exchange contracts, which are also derivatives, in connection with its investments in foreign securities. The Portfolio may use derivative instruments for a variety of purposes, including hedging, risk management, portfolio management or to earn income. As a result, the use of derivatives had a material effect on the Portfolio's performance during the period.
(i) Data sources for index returns: Bloomberg L.P., FactSet. Global equities, bonds and commodities are represented by the MSCI All Country World Index, the JPMorgan Global Government Bond Index Unhedged, and the S&P GSCI Total Return Index, respectively.
(ii) Source: U.S. Bureau of Labor Statistics, data as of December 2015.
4
Morgan Stanley Institutional Fund, Inc.
Annual Report — December 31, 2015
Investment Overview (unaudited) (cont'd)
Multi-Asset Portfolio
• The Portfolio's best-performing investments in 2015 were positions with indirect exposure to our China slowdown theme, including short positions in China-sensitive currencies, global machinery stocks versus global equities, and copper. However, these gains were offset by losses from positions with direct exposure to China (short Chinese A-shares, short Chinese H-shares versus global equities), as we were stopped out of the majority of these positions before the bubble in Chinese equities ultimately burst.
• Tactical long positions in eurozone and global equities, which we initiated once sentiment reached an extreme in September, contributed positively to performance, as did our Swedish reflation theme (long Swedish krona versus Swiss franc, short Swedish versus German 10-year rates), and our long Russia theme (long Russian ruble and Russian bonds).
• Our higher U.S. rates/Fed behind the curve theme detracted from performance: short positions in U.S. 5-year and 2-year rates, long positions in gold mining stocks versus U.S. equities and in U.S. 10-year inflation breakevens. Within this theme, short positions in U.S. credit spreads contributed positively (U.S. high yield credit spreads increased by over +200 basis points during the year(iii)).
• Our eurozone recovery theme also detracted from performance, including long positions in eurozone versus U.S. equities, and a short position in European staples stocks versus European equities. A long position in Greek bonds contributed positively to performance.
• Our long energy theme (long U.S. energy stocks versus U.S. equities; long Brent oil) also detracted.
Management Strategies(iv)
• As of December 31, 2015, the Portfolio's net equity exposure was approximately –7.2%, net fixed income exposure was approximately 10.4% (–0.2% in U.S. 10-year Treasury duration-equivalent weights), and net commodities exposure was approximately –1.0%.(v)
• Heading into 2016, we are cautious on risky assets. We expect global growth to be soft due to slowing growth in China and emerging markets, with neither stocks nor bonds generating positive returns in 2016. However, we do see pockets of opportunity in financial markets where fundamentals are still
improving, such as Sweden and Europe, and where assets are mispriced: we believe that inflation in the U.S. is normalizing, and we are constructive real and inflation-sensitive assets including U.S. inflation breakevens; we believe the bull market in Japan is over, and are short Japanese equities; and we think the Chinese renminbi is still at record highs in trade-weighted terms, and that the currency is likely to depreciate further in the medium term.
• We are short U.S. equities. The U.S. economy is in the late stages of the cycle and margins are peaking. Our earnings models point to only 2-3% earnings per share (EPS) growth in 2016 (versus consensus expectations for 7.5% EPS growth), as wages and unit labor costs rise amid disappointing growth. Taking into account our forecast for a 5% earnings miss, and our expectation for roughly 7-10% multiple compression (a Fed tightening cycle has historically caused 10-15% multiple compression, on average), we believe that U.S. equities are unlikely to produce positive returns in 2016.
• We are long eurozone equities. We believe that the eurozone economic recovery will continue, with gross domestic product (GDP) growth accelerating to 1.8% in 2016. Eurozone unemployment has declined by 1% over the last year, and we expect this pace of cyclical improvement to persist through 2016. We also expect the weaker currency and lower energy prices to provide an ongoing tailwind. We expect GDP acceleration to drive robust earnings growth, particularly relative to the U.S., where we think the prospects for economic growth are weakening and 2016 consensus earnings expectations are likely to be disappointed. In contrast, we believe that eurozone earnings will beat consensus expectations, growing +9% in 2016 versus +7.5% expected by consensus. In addition, we expect monetary policies in the eurozone and the U.S. to continue to diverge as the Fed hikes rates while the ECB expands its balance sheet, supporting relative eurozone valuations.
(iii) Data based on the Barclays U.S. Corporate High Yield Index.
(iv) Source: Morgan Stanley Investment Management (MSIM) Global Multi-Asset Team analysis; consensus estimates sourced from Thomson Reuters IBES.
(v) The Portfolio seeks total return with an emphasis on positive absolute returns while controlling downside portfolio risk. The Portfolio seeks to achieve this objective by taking long and short positions (often in the form of paired or hedged trades) in a range of equity and equity related securities of any market capitalization, bonds, currencies and commodities, which can result in negative net exposures. As the Portfolio's primary benchmark (the Bank of America Merrill Lynch U.S. Dollar 1-month LIBID Average Index) represents cash, the Portfolio will maintain, from time to time, significant exposure to a risk-free asset class.
5
Morgan Stanley Institutional Fund, Inc.
Annual Report — December 31, 2015
Investment Overview (unaudited) (cont'd)
Multi-Asset Portfolio
• We are short Japanese equities. We believe the bull market in Japan is over. In contrast to the hype about "Abenomics," Japanese wages and consumption have flat-lined and employment growth is anemic. According to the Bank of Japan, trend GDP growth is only 0.25%, and as the Japanese economy is already quite advanced in its economic cycle, we expect growth to continue to slow (to 0.5% real GDP growth in 2016). 2015 profits were still strong, boosted by corporate tax cuts and the lagged effects of a lower yen, but these impacts are waning. Japan's sensitivity to China also exposes its economy to weakness, and we expect the ongoing emerging markets slowdown to exacerbate the already vulnerable situation, making it particularly difficult for Japan to reach its goal of continued inflation acceleration. As a result, we expect that the market will increasingly recognize that Abenomics' three components — monetary easing, fiscal stimulus and structural reform — have largely failed.
• We are neutral on emerging market equities. Although some leading indicators of Chinese growth had appeared to stabilize in the second half of 2015, activity has remained weak and credit, liquidity, and property momentum has since stalled. The emerging market manufacturing PMI (Purchasing Managers Index), excluding China, fell to a post-crisis low in November and remains in contraction territory. The Chinese central bank's announced intention to weaken its currency relative to a basket of trade partner currencies bears negative implications for growth and inflation throughout emerging markets. Moreover, China's massive monetary and fiscal policy easing still fails to address its structural excesses of over-indebtedness and overinvestment, which we expect to remain a headwind for broad emerging market growth over the medium term.
• We are neutral on fixed income. We expect the U.S. Fed to continue in normalizing rates, as the U.S. domestic economy is doing okay, the labor market is becoming tight, and we're at the point where, historically, wages have begun to accelerate. That
being said, the global growth outlook remains at risk, and U.S. manufacturing PMIs softened during the fourth quarter. We are actively monitoring the extent to which manufacturing weakness could spread to housing, investment and consumption, or whether this weakness will be reversed. If China weakens substantially, the Fed may moderate the pace and magnitude of hikes, and U.S. bonds could outperform. However, if China only slows moderately and the U.S. domestic economy continues to grow at a moderate pace, the Fed will likely have a bias to tighten, and it is typically difficult for bonds to make significant headway while interest rates are being raised.
• In sum, our main themes are centered around the eurozone economic recovery with particular outperformance in Sweden, the unwinding of the yield bubble, the slowdown in China and the commodity supply chain, and a few idiosyncratic themes such as the aerospace cycle peaking.

* Minimum Investment for Class I shares
** Commenced Operations on June 22, 2012.
In accordance with SEC regulations, the Portfolio's performance shown assumes that all recurring fees (including management fees) were deducted and all dividends and distributions were reinvested. The performance of Class A, L, C and IS shares will vary from the performance of Class I shares based upon their different inception dates and will be impacted by additional fees assessed to those classes (if applicable).
6
Morgan Stanley Institutional Fund, Inc.
Annual Report — December 31, 2015
Investment Overview (unaudited) (cont'd)
Multi-Asset Portfolio
Performance Compared to the Bank of America/Merrill Lynch U.S. Dollar 1-Month LIBID Average Index(1) the Customized MSIM Global Allocation Index(2) and the Lipper Alternative Global Macro Funds Index(3)
| Period Ended December 31, 2015 Total Returns(4) | |||||||||||||||||||
Averge Annual | |||||||||||||||||||
| One Year | Five Years | Ten Years | Since Inception(8) | ||||||||||||||||
| Portfolio — Class I Shares w/o sales charges(5) | –10.60 | % | — | — | 3.09 | % | |||||||||||||
| Portfolio — Class A Shares w/o sales charges(5) | –11.00 | — | — | 2.78 | |||||||||||||||
| Portfolio — Class A Shares with maximum 5.25% sales charges(5) | –15.69 | — | — | 1.23 | |||||||||||||||
| Portfolio — Class L Shares w/o sales charges(5) | –11.37 | — | — | 2.27 | |||||||||||||||
| Portfolio — Class C Shares w/o sales charges(6) | — | — | — | –9.07 | |||||||||||||||
| Portfolio — Class C Shares with maximum 1.00% deferred sales charges(6) | — | — | — | –9.96 | |||||||||||||||
| Portfolio — Class IS Shares w/o sales charges(7) | — | — | — | –6.89 | |||||||||||||||
| Bank of America/Merrill Lynch U.S. Dollar 1-Month LIBID Average Index | 0.10 | — | — | 0.10 | |||||||||||||||
| Customized MSIM Global Allocation Index | –3.51 | — | — | 5.25 | |||||||||||||||
| Lipper Alternative Global Macro Funds Index | –4.22 | — | — | 2.10 | |||||||||||||||
Performance data quoted represents past performance, which is no guarantee of future results, and current performance may be lower or higher than the figures shown. Performance assumes that all dividends and distributions, if any, were reinvested. For the most recent month-end performance figures, please visit www.morganstanley.com/im. Investment return and principal value will fluctuate so that Portfolio shares, when redeemed, may be worth more or less than their original cost. Total returns do not reflect the deduction of taxes that a shareholder would pay on Portfolio distributions or the redemption of Portfolio shares. Returns for periods less than one year are not annualized. Performance of share classes will vary due to difference in sales charges and expenses.
(1) The Bank of America/Merrill Lynch U.S. Dollar 1-Month LIBID Average Index tracks the performance of a basket of synthetic assets paying LIBID to a stated maturity. The index purchases a new instrument each day, priced at par, having exactly its stated maturity and with a coupon equal to that day's fixing rate. All issues are held to maturity. Therefore, each day the index is comprised of a basket of securities. The index is not marked to market. The returns of the index represent the accrued income generated by the equally weighted average of all the coupons in the basket for a given day. It is not possible to invest directly in an index.
(2) The Customized MSIM Global Allocation Index is comprised of 60% MSCI All Country World Index (benchmark that measures the equity market performance of developed and emerging markets), 30% Barclay Global Aggregate Bond Index (benchmark that provides a broadbased measure of the global investment grade fixed-rate debt markets), 5% S&P GSCI Light Energy Index (benchmark for investment performance in the energy commodity market), and 5% Bank of America/Merrill Lynch U.S. Dollar 1-Month LIBID Average Index (benchmark that tracks the performance of a basket of synthetic assets paying LIBID to a stated maturity). The Index is unmanaged and its returns do not include any sales charges or fees. Such costs would lower performance. It is not possible to invest directly in an index.
(3) The Lipper Alternative Global Macro Funds Index is an equally weighted performance index of the largest qualifying funds (based on net assets) in the Lipper Alternative Global Macro Funds classification. The Index, which is adjusted for capital gains distributions and income dividends, is unmanaged and should not be considered an investment. There are currently 30 funds represented in this Index. As of the date of this report, the Portfolio is in the Lipper Alternative Global Macro Funds classification.
(4) Total returns for the Portfolio reflect fees waived and expenses reimbursed, if applicable, by the Adviser. Without such waivers and reimbursements, total returns would have been lower.
(5) Commenced operations on June 22, 2012.
(6) Commenced offering on April 30, 2015.
(7) Commenced offering on May 29, 2015.
(8) For comparative purposes, average annual since inception returns listed for the Indexes refer to the inception date of Class I of the Portfolio, not the inception of the Index.
7
Morgan Stanley Institutional Fund, Inc.
Annual Report — December 31, 2015
Portfolio of Investments
Multi-Asset Portfolio
Shares | Value (000) | ||||||||||
Common Stocks (35.1%) | |||||||||||
Australia (0.4%) | |||||||||||
AGL Energy Ltd. | 473 | $ | 6 | ||||||||
ALS Ltd. | 384 | 1 | |||||||||
Alumina Ltd. | 2,423 | 2 | |||||||||
Amcor Ltd. | 900 | 9 | |||||||||
AMP Ltd. | 2,048 | 9 | |||||||||
APA Group | 1,025 | 6 | |||||||||
Arrium Ltd. (a) | 1,334 | — | @ | ||||||||
Asciano Ltd. | 1,125 | 7 | |||||||||
ASX Ltd. | 226 | 7 | |||||||||
Aurizon Holding Ltd. | 1,907 | 6 | |||||||||
Australia & New Zealand Banking Group Ltd. | 1,861 | 38 | |||||||||
Bank of Queensland Ltd. | 544 | 5 | |||||||||
Bendigo and Adelaide Bank Ltd. | 655 | 6 | |||||||||
BHP Billiton Ltd. | 1,945 | 25 | |||||||||
BlueScope Steel Ltd. | 476 | 2 | |||||||||
Boral Ltd. | 759 | 3 | |||||||||
Brambles Ltd. | 1,040 | 9 | |||||||||
carsales.com Ltd. | 259 | 2 | |||||||||
Coca-Cola Amatil Ltd. | 566 | 4 | |||||||||
Commonwealth Bank of Australia | 939 | 58 | |||||||||
Computershare Ltd. | 434 | 4 | |||||||||
Crown Resorts Ltd. | 383 | 3 | |||||||||
CSL Ltd. | 301 | 23 | |||||||||
Evolution Mining Ltd. | 95,100 | 97 | |||||||||
Flight Centre Travel Group Ltd. | 96 | 3 | |||||||||
Fortescue Metals Group Ltd. | 1,239 | 2 | |||||||||
Goodman Group REIT | 1,707 | 8 | |||||||||
Iluka Resources Ltd. | 391 | 2 | |||||||||
Incitec Pivot Ltd. | 1,499 | 4 | |||||||||
Insurance Australia Group Ltd. | 1,578 | 6 | |||||||||
James Hardie Industries PLC CDI | 430 | 5 | |||||||||
Lend Lease Group REIT | 547 | 6 | |||||||||
Macquarie Group Ltd. | 225 | 13 | |||||||||
Mirvac Group REIT | 4,373 | 6 | |||||||||
National Australia Bank Ltd. | 1,578 | 34 | |||||||||
Newcrest Mining Ltd. (a) | 43,837 | 414 | |||||||||
Northern Star Resources Ltd. | 64,790 | 131 | |||||||||
OceanaGold Corp. CDI | 8,893 | 17 | |||||||||
Oil Search Ltd. | 1,105 | 5 | |||||||||
Orica Ltd. | 285 | 3 | |||||||||
Origin Energy Ltd. | 726 | 2 | |||||||||
Qantas Airways Ltd. (a) | 2,485 | 7 | |||||||||
QBE Insurance Group Ltd. | 818 | 7 | |||||||||
Rio Tinto Ltd. | 287 | 9 | |||||||||
Santos Ltd. | 812 | 2 | |||||||||
Scentre Group REIT | 4,516 | 14 | |||||||||
Seek Ltd. | 315 | 4 | |||||||||
Sonic Healthcare Ltd. | 371 | 5 | |||||||||
South32 Ltd. (a) | 2,734 | 2 | |||||||||
South32 Ltd. (a) | 1,945 | 2 | |||||||||
Stockland REIT | 2,190 | 7 | |||||||||
Shares | Value (000) | ||||||||||
Suncorp Group Ltd. | 832 | $ | 7 | ||||||||
Sydney Airport | 1,573 | 7 | |||||||||
Tatts Group Ltd. | 2,566 | 8 | |||||||||
Telstra Corp., Ltd. | 7,362 | 30 | |||||||||
Transurban Group | 1,135 | 9 | |||||||||
Treasury Wine Estates Ltd. | 648 | 4 | |||||||||
Wesfarmers Ltd. | 683 | 21 | |||||||||
Westfield Corp. REIT | 1,283 | 9 | |||||||||
Westpac Banking Corp. | 1,900 | 46 | |||||||||
Woodside Petroleum Ltd. | 431 | 9 | |||||||||
Woolworths Ltd. | 767 | 14 | |||||||||
WorleyParsons Ltd. | 295 | 1 | |||||||||
1,217 | |||||||||||
Belgium (0.8%) | |||||||||||
Anheuser-Busch InBev N.V. | 21,562 | 2,663 | |||||||||
KBC Groep N.V. | 338 | 21 | |||||||||
UCB SA | 143 | 13 | |||||||||
2,697 | |||||||||||
Canada (0.9%) | |||||||||||
Agnico-Eagle Mines Ltd. | 10,910 | 287 | |||||||||
Barrick Gold Corp. | 50,680 | 374 | |||||||||
Centerra Gold, Inc. | 22,680 | 108 | |||||||||
Detour Gold Corp. (a) | 16,580 | 173 | |||||||||
Eldorado Gold Corp. | 52,570 | 156 | |||||||||
First Majestic Silver Corp. (a) | 860 | 3 | |||||||||
Franco-Nevada Corp. | 9,020 | 413 | |||||||||
Goldcorp, Inc. | 28,000 | 324 | |||||||||
Kinross Gold Corp. (a) | 109,090 | 198 | |||||||||
New Gold, Inc. (a) | 43,210 | 100 | |||||||||
Osisko Gold Royalties Ltd. | 7,130 | 70 | |||||||||
Pan American Silver Corp. | 14,520 | 94 | |||||||||
SEMAFO, Inc. (a) | 27,490 | 70 | |||||||||
Silver Wheaton Corp. | 23,540 | 292 | |||||||||
Yamana Gold, Inc. | 68,290 | 127 | |||||||||
2,789 | |||||||||||
China (1.4%) | |||||||||||
Brilliance China Automotive Holdings Ltd. (b) | 292,000 | 366 | |||||||||
Byd Co., Ltd. H Shares (a)(b) | 144,000 | 784 | |||||||||
Dongfeng Motor Group Co., Ltd. H Shares (b) | 584,000 | 773 | |||||||||
Geely Automobile Holdings Ltd. (b) | 1,360,000 | 720 | |||||||||
Great Wall Motor Co., Ltd. H Shares (b) | 980,000 | 1,134 | |||||||||
| Guangzhou Automobile Group Co., Ltd. H Shares (b) | 490,000 | 434 | |||||||||
Hanergy Thin Film Power Group Ltd. (a)(b)(c)(d) | 178,000 | 5 | |||||||||
Zhaojin Mining Industry Co., Ltd. H Shares (b) | 54,500 | 31 | |||||||||
Zijin Mining Group Co., Ltd. H Shares (b) | 550,000 | 144 | |||||||||
4,391 | |||||||||||
Denmark (0.1%) | |||||||||||
AP Moeller - Maersk A/S Series A | 29 | 37 | |||||||||
Danske Bank A/S | 2,244 | 60 | |||||||||
DSV A/S | 1,114 | 44 | |||||||||
Vestas Wind Systems A/S | 587 | 41 | |||||||||
182 | |||||||||||
The accompanying notes are an integral part of the financial statements.
8
Morgan Stanley Institutional Fund, Inc.
Annual Report — December 31, 2015
Portfolio of Investments (cont'd)
Multi-Asset Portfolio
Shares | Value (000) | ||||||||||
Finland (0.2%) | |||||||||||
Nokia Oyj | 92,242 | $ | 657 | ||||||||
Sampo Oyj, Class A | 1,382 | 70 | |||||||||
727 | |||||||||||
France (9.3%) | |||||||||||
Accor SA | 23,551 | 1,016 | |||||||||
Air Liquide SA | 10,228 | 1,149 | |||||||||
Airbus Group SE | 16,143 | 1,084 | |||||||||
Alcatel-Lucent (a) | 3,771 | 15 | |||||||||
Atos SE | 9,030 | 758 | |||||||||
AXA SA | 60,423 | 1,652 | |||||||||
BNP Paribas SA | 31,256 | 1,769 | |||||||||
Bouygues SA | 28,043 | 1,112 | |||||||||
Cap Gemini SA | 17,022 | 1,575 | |||||||||
Carrefour SA | 13,662 | 393 | |||||||||
Cie de Saint-Gobain | 42,836 | 1,843 | |||||||||
Cie Generale des Etablissements Michelin | 132 | 13 | |||||||||
Danone SA | 17,391 | 1,174 | |||||||||
Engie | 46,356 | 820 | |||||||||
Essilor International SA | 4,844 | 604 | |||||||||
Groupe Eurotunnel SE | 18,946 | 235 | |||||||||
Hermes International | 80 | 27 | |||||||||
L'Oreal SA | 7,045 | 1,185 | |||||||||
LVMH Moet Hennessy Louis Vuitton SE | 7,747 | 1,211 | |||||||||
Orange SA | 43,777 | 734 | |||||||||
Pernod Ricard SA | 132 | 15 | |||||||||
Renault SA | 20 | 2 | |||||||||
Rexel SA | 22,287 | 296 | |||||||||
Safran SA | 58 | 4 | |||||||||
Sanofi | 33,846 | 2,888 | |||||||||
Schneider Electric SE | 16,796 | 956 | |||||||||
Societe Generale SA | 22,694 | 1,047 | |||||||||
Technip SA | 52 | 3 | |||||||||
Total SA | 65,102 | 2,899 | |||||||||
Unibail-Rodamco SE REIT | 2,182 | 553 | |||||||||
Vinci SA | 37,286 | 2,391 | |||||||||
Vivendi SA | 37,044 | 798 | |||||||||
30,221 | |||||||||||
Germany (7.1%) | |||||||||||
Adidas AG | 482 | 47 | |||||||||
Allianz SE (Registered) | 13,984 | 2,477 | |||||||||
BASF SE | 25,227 | 1,929 | |||||||||
Bayer AG (Registered) | 24,261 | 3,044 | |||||||||
Bayerische Motoren Werke AG | 7,847 | 826 | |||||||||
Daimler AG (Registered) | 29,833 | 2,490 | |||||||||
Deutsche Bank AG (Registered) | 39,653 | 973 | |||||||||
Deutsche Boerse AG | 15,709 | 1,390 | |||||||||
Deutsche Post AG (Registered) | 27,273 | 768 | |||||||||
Deutsche Telekom AG (Registered) | 91,939 | 1,664 | |||||||||
E.ON SE | 60,784 | 588 | |||||||||
Fresenius Medical Care AG & Co., KGaA | 564 | 47 | |||||||||
Fresenius SE & Co., KGaA | 880 | 63 | |||||||||
Shares | Value (000) | ||||||||||
Linde AG | 443 | $ | 64 | ||||||||
Muenchener Rueckversicherungs AG (Registered) | 3,750 | 751 | |||||||||
ProSiebenSat.1 Media SE (Registered) | 15,143 | 766 | |||||||||
RWE AG | 10,558 | 135 | |||||||||
SAP SE | 26,350 | 2,099 | |||||||||
Siemens AG (Registered) | 23,468 | 2,277 | |||||||||
Volkswagen AG (Preference) | 4,742 | 687 | |||||||||
Vonovia SE | 1,182 | 37 | |||||||||
23,122 | |||||||||||
Hong Kong (0.0%) | |||||||||||
G-Resources Group Ltd. | 378,000 | 9 | |||||||||
Ireland (0.3%) | |||||||||||
CRH PLC | 33,824 | 982 | |||||||||
CRH PLC | 1,398 | 40 | |||||||||
1,022 | |||||||||||
Italy (2.3%) | |||||||||||
Assicurazioni Generali SpA | 33,802 | 618 | |||||||||
Atlantia SpA | 50,996 | 1,351 | |||||||||
Enel SpA | 205,944 | 861 | |||||||||
Eni SpA | 81,176 | 1,202 | |||||||||
Intesa Sanpaolo SpA | 429,091 | 1,430 | |||||||||
Mediobanca SpA | 119,955 | 1,150 | |||||||||
Telecom Italia SpA (a) | 40,930 | 52 | |||||||||
UniCredit SpA | 165,013 | 909 | |||||||||
7,573 | |||||||||||
Japan (1.0%) | |||||||||||
Advantest Corp. | 2,000 | 17 | |||||||||
Aeon Co., Ltd. | 1,200 | 18 | |||||||||
Alps Electric Co., Ltd. | 900 | 24 | |||||||||
Asahi Group Holdings Ltd. | 900 | 28 | |||||||||
Astellas Pharma, Inc. | 4,000 | 57 | |||||||||
Bridgestone Corp. | 900 | 31 | |||||||||
Canon, Inc. | 1,300 | 39 | |||||||||
Casio Computer Co., Ltd. | 1,000 | 23 | |||||||||
Central Japan Railway Co. | 200 | 35 | |||||||||
Chiyoda Corp. | 1,000 | 8 | |||||||||
Chugai Pharmaceutical Co., Ltd. | 900 | 31 | |||||||||
COMSYS Holdings Corp. | 1,100 | 15 | |||||||||
Credit Saison Co., Ltd. | 1,100 | 22 | |||||||||
Daiichi Sankyo Co., Ltd. | 1,000 | 21 | |||||||||
Daikin Industries Ltd. | 800 | 58 | |||||||||
Daiwa House Industry Co., Ltd. | 1,000 | 29 | |||||||||
Denso Corp. | 800 | 38 | |||||||||
Dentsu, Inc. | 900 | 49 | |||||||||
Dowa Holdings Co., Ltd. | 1,000 | 7 | |||||||||
Eisai Co., Ltd. | 900 | 59 | |||||||||
FANUC Corp. | 800 | 138 | |||||||||
Fast Retailing Co., Ltd. | 800 | 280 | |||||||||
Fuji Heavy Industries Ltd. | 900 | 37 | |||||||||
FUJIFILM Holdings Corp. | 1,000 | 42 | |||||||||
Hino Motors Ltd. | 1,000 | 12 | |||||||||
Hitachi Construction Machinery Co., Ltd. | 1,000 | 16 | |||||||||
The accompanying notes are an integral part of the financial statements.
9
Morgan Stanley Institutional Fund, Inc.
Annual Report — December 31, 2015
Portfolio of Investments (cont'd)
Multi-Asset Portfolio
Shares | Value (000) | ||||||||||
Japan (cont'd) | |||||||||||
Honda Motor Co., Ltd. | 1,700 | $ | 54 | ||||||||
Isetan Mitsukoshi Holdings Ltd. | 1,100 | 14 | |||||||||
ITOCHU Corp. | 1,300 | 15 | |||||||||
Japan Tobacco, Inc. | 800 | 29 | |||||||||
JGC Corp. | 1,000 | 15 | |||||||||
JTEKT Corp. | 900 | 15 | |||||||||
Kao Corp. | 1,000 | 51 | |||||||||
KDDI Corp. | 4,800 | 124 | |||||||||
Kikkoman Corp. | 1,000 | 35 | |||||||||
Kirin Holdings Co., Ltd. | 1,000 | 14 | |||||||||
Komatsu Ltd. | 1,000 | 16 | |||||||||
Konami Holdings Corp. | 900 | 21 | |||||||||
Kubota Corp. | 1,000 | 15 | |||||||||
Kuraray Co., Ltd. | 1,600 | 19 | |||||||||
Kyocera Corp. | 1,700 | 79 | |||||||||
Marui Group Co., Ltd. | 1,300 | 21 | |||||||||
Matsui Securities Co., Ltd. | 1,300 | 12 | |||||||||
Minebea Co., Ltd. | 1,000 | 9 | |||||||||
Mitsubishi Corp. | 1,100 | 18 | |||||||||
Mitsubishi Electric Corp. | 1,000 | 10 | |||||||||
Mitsubishi Estate Co., Ltd. | 1,000 | 21 | |||||||||
Mitsubishi Logistics Corp. | 1,000 | 13 | |||||||||
Mitsui & Co., Ltd. | 1,200 | 14 | |||||||||
Mitsui Fudosan Co., Ltd. | 1,000 | 25 | |||||||||
Mitsui OSK Lines Ltd. | 3,000 | 8 | |||||||||
Mitsumi Electric Co., Ltd. | 1,000 | 6 | |||||||||
NGK Insulators Ltd. | 1,000 | 23 | |||||||||
NH Foods Ltd. | 1,000 | 20 | |||||||||
Nikon Corp. | 900 | 12 | |||||||||
Nippon Kayaku Co., Ltd. | 1,000 | 11 | |||||||||
Nissan Chemical Industries Ltd. | 1,200 | 27 | |||||||||
Nisshinbo Holdings, Inc. | 2,000 | 21 | |||||||||
Nitto Denko Corp. | 900 | 66 | |||||||||
NSK Ltd. | 1,000 | 11 | |||||||||
NTT Data Corp. | 900 | 43 | |||||||||
Odakyu Electric Railway Co., Ltd. | 2,000 | 22 | |||||||||
OKUMA Corp. | 1,000 | 8 | |||||||||
Olympus Corp. | 800 | 32 | |||||||||
Panasonic Corp. | 900 | 9 | |||||||||
Ricoh Co., Ltd. | 1,000 | 10 | |||||||||
Secom Co., Ltd. | 900 | 61 | |||||||||
Sekisui House Ltd. | 1,100 | 18 | |||||||||
Seven & I Holdings Co., Ltd. | 900 | 41 | |||||||||
Shin-Etsu Chemical Co., Ltd. | 900 | 49 | |||||||||
Shionogi & Co., Ltd. | 900 | 41 | |||||||||
Shiseido Co., Ltd. | 1,000 | 21 | |||||||||
Shizuoka Bank Ltd. (The) | 3,000 | 29 | |||||||||
Showa Shell Sekiyu KK | 1,200 | 10 | |||||||||
SoftBank Group Corp. | 2,400 | 121 | |||||||||
Sony Corp. | 900 | 22 | |||||||||
Sumitomo Corp. | 1,400 | 14 | |||||||||
Sumitomo Dainippon Pharma Co., Ltd. | 900 | 11 | |||||||||
Sumitomo Electric Industries Ltd. | 1,300 | 18 | |||||||||
Shares | Value (000) | ||||||||||
Sumitomo Metal Mining Co., Ltd. | 1,000 | $ | 12 | ||||||||
Sumitomo Realty & Development Co., Ltd. | 1,000 | 28 | |||||||||
Suzuki Motor Corp. | 900 | 27 | |||||||||
Taiyo Yuden Co., Ltd. | 1,100 | 15 | |||||||||
Takeda Pharmaceutical Co., Ltd. | 800 | 40 | |||||||||
TDK Corp. | 900 | 58 | |||||||||
Terumo Corp. | 1,800 | 56 | |||||||||
Tokio Marine Holdings, Inc. | 900 | 35 | |||||||||
Tokyo Electron Ltd. | 800 | 48 | |||||||||
Tokyo Gas Co., Ltd. | 2,000 | 9 | |||||||||
Tokyo Tatemono Co., Ltd. | 500 | 5 | |||||||||
TOTO Ltd. | 500 | 18 | |||||||||
Toyo Seikan Group Holdings Ltd. | 1,300 | 24 | |||||||||
Toyota Motor Corp. | 800 | 49 | |||||||||
Toyota Tsusho Corp. | 1,000 | 23 | |||||||||
Trend Micro, Inc. | 900 | 37 | |||||||||
Yamaha Corp. | 1,100 | 27 | |||||||||
Yamato Holdings Co., Ltd. | 1,000 | 21 | |||||||||
Yaskawa Electric Corp. | 1,000 | 14 | |||||||||
Yokogawa Electric Corp. | 1,000 | 12 | |||||||||
Yokohama Rubber Co., Ltd. (The) | 500 | 8 | |||||||||
3,144 | |||||||||||
Mexico (0.0%) | |||||||||||
Primero Mining Corp. (a) | 15,200 | 35 | |||||||||
Netherlands (1.9%) | |||||||||||
Akzo Nobel N.V. | 234 | 16 | |||||||||
Altice N.V., Class A (a) | 74 | 1 | |||||||||
ASML Holding N.V. | 10,798 | 962 | |||||||||
Fiat Chrysler Automobiles N.V. (a) | 2,197 | 30 | |||||||||
ING Groep N.V. CVA | 108,832 | 1,465 | |||||||||
Koninklijke Ahold N.V. | 271 | 6 | |||||||||
Koninklijke Philips N.V. | 27,155 | 690 | |||||||||
Randstad Holding N.V. | 18,439 | 1,147 | |||||||||
Unilever N.V. CVA | 44,520 | 1,929 | |||||||||
6,246 | |||||||||||
Nicaragua (0.0%) | |||||||||||
B2Gold Corp. (a) | 33,300 | 34 | |||||||||
Norway (0.0%) | |||||||||||
Statoil ASA | 2,824 | 40 | |||||||||
Telenor ASA | 2,673 | 44 | |||||||||
84 | |||||||||||
Peru (0.0%) | |||||||||||
Cia de Minas Buenaventura SA ADR (a) | 28,200 | 121 | |||||||||
Portugal (0.0%) | |||||||||||
Banco Espirito Santo SA (Registered) (a)(c) | 570,338 | 1 | |||||||||
South Africa (0.2%) | |||||||||||
AngloGold Ashanti Ltd. ADR (a) | 37,400 | 266 | |||||||||
Gold Fields Ltd. ADR | 74,500 | 206 | |||||||||
Harmony Gold Mining Co., Ltd. ADR (a) | 16,600 | 16 | |||||||||
SABMiller PLC | 1,157 | 69 | |||||||||
557 | |||||||||||
The accompanying notes are an integral part of the financial statements.
10
Morgan Stanley Institutional Fund, Inc.
Annual Report — December 31, 2015
Portfolio of Investments (cont'd)
Multi-Asset Portfolio
Shares | Value (000) | ||||||||||
Spain (2.5%) | |||||||||||
Amadeus IT Holding SA, Class A | 244 | $ | 11 | ||||||||
Banco Bilbao Vizcaya Argentaria SA | 172,119 | 1,255 | |||||||||
Banco Santander SA | 350,388 | 1,720 | |||||||||
Ferrovial SA | 544 | 12 | |||||||||
Iberdrola SA | 158,820 | 1,126 | |||||||||
Industria de Diseno Textil SA | 30,259 | 1,039 | |||||||||
International Consolidated Airlines Group SA | 3,776 | 34 | |||||||||
International Consolidated Airlines Group SA | 146,523 | 1,306 | |||||||||
Repsol SA | 21,746 | 237 | |||||||||
Telefonica SA | 117,711 | 1,299 | |||||||||
8,039 | |||||||||||
Sweden (0.1%) | |||||||||||
Nordea Bank AB | 6,207 | 67 | |||||||||
Svenska Cellulosa AB SCA, Class B | 1,441 | 42 | |||||||||
Svenska Handelsbanken AB, Class A | 4,079 | 54 | |||||||||
Swedbank AB, Class A | 2,648 | 58 | |||||||||
Telefonaktiebolaget LM Ericsson, Class B | 6,176 | 60 | |||||||||
Volvo AB, Class B | 3,897 | 36 | |||||||||
317 | |||||||||||
Switzerland (0.6%) | |||||||||||
Adecco SA (Registered) (a) | 21,919 | 1,505 | |||||||||
Credit Suisse Group AG (Registered) (a) | 3,136 | 68 | |||||||||
Givaudan SA (Registered) (a) | 33 | 59 | |||||||||
LafargeHolcim Ltd. (Registered) (a) | 1,046 | 53 | |||||||||
Swiss Re AG | 812 | 79 | |||||||||
UBS Group AG (Registered) | 6,662 | 128 | |||||||||
Zurich Insurance Group AG (a) | 306 | 78 | |||||||||
1,970 | |||||||||||
Turkey (0.0%) | |||||||||||
Alacer Gold Corp. (a) | 17,400 | 31 | |||||||||
United Kingdom (1.0%) | |||||||||||
Anglo American PLC | 1,696 | 8 | |||||||||
ARM Holdings PLC | 1,926 | 29 | |||||||||
Associated British Foods PLC | 435 | 22 | |||||||||
AstraZeneca PLC | 1,450 | 98 | |||||||||
Aviva PLC | 7,270 | 55 | |||||||||
BAE Systems PLC | 5,294 | 39 | |||||||||
Barclays PLC | 19,090 | 62 | |||||||||
BG Group PLC | 3,981 | 58 | |||||||||
BHP Billiton PLC | 2,734 | 31 | |||||||||
| BP PLC | 21,549 | 112 | |||||||||
British American Tobacco PLC | 2,250 | 125 | |||||||||
BT Group PLC | 9,820 | 68 | |||||||||
Burberry Group PLC | 1,083 | 19 | |||||||||
Centrica PLC | 7,519 | 24 | |||||||||
Compass Group PLC | 3,291 | 57 | |||||||||
Diageo PLC | 3,086 | 84 | |||||||||
Experian PLC | 2,172 | 38 | |||||||||
GKN PLC | 4,999 | 23 | |||||||||
GlaxoSmithKline PLC | 5,632 | 114 | |||||||||
Glencore PLC (a) | 11,482 | 15 | |||||||||
Shares | Value (000) | ||||||||||
HSBC Holdings PLC | 21,071 | $ | 166 | ||||||||
Imperial Tobacco Group PLC | 1,226 | 65 | |||||||||
Indivior PLC | 800 | 2 | |||||||||
Legal & General Group PLC | 9,937 | 39 | |||||||||
Lloyds Banking Group PLC | 56,871 | 61 | |||||||||
London Stock Exchange Group PLC | 312 | 13 | |||||||||
Lonmin PLC (a) | 1 | — | @ | ||||||||
Marks & Spencer Group PLC | 2,749 | 18 | |||||||||
National Grid PLC | 5,325 | 73 | |||||||||
Next PLC | 305 | 33 | |||||||||
Pearson PLC | 1,258 | 14 | |||||||||
Prudential PLC | 3,932 | 88 | |||||||||
Reckitt Benckiser Group PLC | 800 | 74 | |||||||||
RELX PLC | 2,928 | 51 | |||||||||
Rio Tinto PLC | 1,475 | 43 | |||||||||
Rolls-Royce Holdings PLC (a) | 2,609 | 22 | |||||||||
Royal Bank of Scotland Group PLC (a) | 3,122 | 14 | |||||||||
Royal Dutch Shell PLC, Class A | 7,411 | 167 | |||||||||
Shire PLC | 747 | 51 | |||||||||
SSE PLC | 1,760 | 39 | |||||||||
Standard Chartered PLC | 2,445 | 20 | |||||||||
Tesco PLC (a) | 11,466 | 25 | |||||||||
Tullow Oil PLC (a) | 1,439 | 4 | |||||||||
Unilever PLC | 1,617 | 69 | |||||||||
Verizon Communications, Inc. | 1,444 | 67 | |||||||||
Verizon Communications, Inc. | 11,710 | 541 | |||||||||
Vodafone Group PLC | 29,966 | 97 | |||||||||
Whitbread PLC | 346 | 22 | |||||||||
Wolseley PLC | 817 | 44 | |||||||||
WPP PLC | 2,179 | 50 | |||||||||
3,053 | |||||||||||
United States (5.0%) | |||||||||||
Abbott Laboratories | 4,280 | 192 | |||||||||
AbbVie, Inc. | 4,820 | 286 | |||||||||
AES Corp. | 1,810 | 17 | |||||||||
Aetna, Inc. | 980 | 106 | |||||||||
Agilent Technologies, Inc. | 970 | 41 | |||||||||
AGL Resources, Inc. | 290 | 19 | |||||||||
Alamos Gold, Inc., Class A (a) | 23,540 | 77 | |||||||||
Alexion Pharmaceuticals, Inc. (a) | 680 | 130 | |||||||||
Allergan PLC (a) | 1,120 | 350 | |||||||||
Altria Group, Inc. | 5,390 | 314 | |||||||||
Ameren Corp. | 680 | 29 | |||||||||
American Electric Power Co., Inc. | 1,260 | 73 | |||||||||
AmerisourceBergen Corp. | 570 | 59 | |||||||||
Amgen, Inc. | 2,200 | 357 | |||||||||
Anthem, Inc. | 810 | 113 | |||||||||
Archer-Daniels-Midland Co. | 1,750 | 64 | |||||||||
AT&T, Inc. | 17,550 | 604 | |||||||||
Baxalta, Inc. | 1,540 | 60 | |||||||||
Baxter International, Inc. | 1,540 | 59 | |||||||||
Becton Dickinson and Co. | 580 | 89 | |||||||||
The accompanying notes are an integral part of the financial statements.
11
Morgan Stanley Institutional Fund, Inc.
Annual Report — December 31, 2015
Portfolio of Investments (cont'd)
Multi-Asset Portfolio
Shares | Value (000) | ||||||||||
United States (cont'd) | |||||||||||
Biogen, Inc. (a) | 670 | $ | 205 | ||||||||
Boston Scientific Corp. (a) | 3,870 | 71 | |||||||||
Bristol-Myers Squibb Co. | 4,830 | 332 | |||||||||
Brown-Forman Corp., Class B | 280 | 28 | |||||||||
Campbell Soup Co. | 530 | 28 | |||||||||
Cardinal Health, Inc. | 960 | 86 | |||||||||
Celgene Corp. (a) | 2,330 | 279 | |||||||||
CenterPoint Energy, Inc. | 1,220 | 22 | |||||||||
CenturyLink, Inc. | 1,550 | 39 | |||||||||
Cerner Corp. (a) | 850 | 51 | |||||||||
Cigna Corp. | 700 | 102 | |||||||||
Clorox Co. (The) | 310 | 39 | |||||||||
CMS Energy Corp. | 700 | 25 | |||||||||
Coca-Cola Co. | 10,670 | 458 | |||||||||
Coca-Cola Enterprises, Inc. | 570 | 28 | |||||||||
Coeur Mining, Inc. (a) | 13,140 | 33 | |||||||||
Colgate-Palmolive Co. | 2,480 | 165 | |||||||||
ConAgra Foods, Inc. | 1,230 | 52 | |||||||||
Consolidated Edison, Inc. | 810 | 52 | |||||||||
Constellation Brands, Inc., Class A | 530 | 75 | |||||||||
Costco Wholesale Corp. | 1,230 | 199 | |||||||||
CR Bard, Inc. | 250 | 47 | |||||||||
CVS Health Corp. | 3,040 | 297 | |||||||||
DaVita HealthCare Partners, Inc. (a) | 530 | 37 | |||||||||
DENTSPLY International, Inc. | 510 | 31 | |||||||||
Dominion Resources, Inc. | 1,540 | 104 | |||||||||
Dr. Pepper Snapple Group, Inc. | 540 | 50 | |||||||||
DTE Energy Co. | 530 | 43 | |||||||||
Duke Energy Corp. | 1,810 | 129 | |||||||||
Edison International | 850 | 50 | |||||||||
Edwards Lifesciences Corp. (a) | 670 | 53 | |||||||||
Eli Lilly & Co. | 2,780 | 234 | |||||||||
Endo International PLC (a) | 570 | 35 | |||||||||
Entergy Corp. | 530 | 36 | |||||||||
Estee Lauder Cos., Inc. (The), Class A | 580 | 51 | |||||||||
Eversource Energy | 830 | 42 | |||||||||
Exelon Corp. | 2,470 | 69 | |||||||||
Express Scripts Holding Co. (a) | 2,030 | 177 | |||||||||
FirstEnergy Corp. | 1,120 | 36 | |||||||||
Frontier Communications Corp. | 3,340 | 16 | |||||||||
General Mills, Inc. | 1,560 | 90 | |||||||||
Gilead Sciences, Inc. | 4,270 | 432 | |||||||||
HCA Holdings, Inc. (a) | 950 | 64 | |||||||||
Hecla Mining Co. | 37,370 | 71 | |||||||||
Henry Schein, Inc. (a) | 260 | 41 | |||||||||
Hershey Co. (The) | 400 | 36 | |||||||||
Hormel Foods Corp. | 310 | 25 | |||||||||
Humana, Inc. | 520 | 93 | |||||||||
IAMGOLD Corp. (a) | 33,160 | 47 | |||||||||
Illumina, Inc. (a) | 510 | 98 | |||||||||
Intuitive Surgical, Inc. (a) | 30 | 16 | |||||||||
JM Smucker Co. (The) | 300 | 37 | |||||||||
Shares | Value (000) | ||||||||||
Johnson & Johnson | 7,910 | $ | 813 | ||||||||
Kellogg Co. | 690 | 50 | |||||||||
Keurig Green Mountain, Inc. | 300 | 27 | |||||||||
Kimberly-Clark Corp. | 980 | 125 | |||||||||
Kraft Heinz Co. (The) | 1,560 | 114 | |||||||||
Kroger Co. (The) | 2,650 | 111 | |||||||||
Laboratory Corp. of America Holdings (a) | 280 | 35 | |||||||||
Level 3 Communications, Inc. (a) | 840 | 46 | |||||||||
Mallinckrodt PLC (a) | 300 | 22 | |||||||||
McCormick & Co., Inc. | 300 | 26 | |||||||||
McKesson Corp. | 680 | 134 | |||||||||
Mead Johnson Nutrition Co. | 560 | 44 | |||||||||
Medtronic PLC | 4,130 | 318 | |||||||||
Merck & Co., Inc. | 8,150 | 430 | |||||||||
Molson Coors Brewing Co., Class B | 520 | 49 | |||||||||
Mondelez International, Inc., Class A | 4,330 | 194 | |||||||||
Monster Beverage Corp. (a) | 510 | 76 | |||||||||
Mylan N.V. (a) | 1,220 | 66 | |||||||||
Newmont Mining Corp. | 22,680 | 408 | |||||||||
NextEra Energy, Inc. | 1,240 | 129 | |||||||||
NiSource, Inc. | 830 | 16 | |||||||||
NRG Energy, Inc. | 830 | 10 | |||||||||
Patterson Cos., Inc. | 270 | 12 | |||||||||
Pepco Holdings, Inc. | 690 | 18 | |||||||||
PepsiCo, Inc. | 4,010 | 401 | |||||||||
PerkinElmer, Inc. | 290 | 16 | |||||||||
Perrigo Co., PLC | 510 | 74 | |||||||||
Pfizer, Inc. | 17,820 | 575 | |||||||||
PG&E Corp. | 1,260 | 67 | |||||||||
Philip Morris International, Inc. | 4,270 | 375 | |||||||||
Pinnacle West Capital Corp. | 290 | 19 | |||||||||
PPL Corp. | 1,800 | 61 | |||||||||
Procter & Gamble Co. (The) | 7,460 | 592 | |||||||||
Public Service Enterprise Group, Inc. | 1,280 | 50 | |||||||||
Quest Diagnostics, Inc. | 510 | 36 | |||||||||
Regeneron Pharmaceuticals, Inc. (a) | 260 | 141 | |||||||||
Reynolds American, Inc. | 2,320 | 107 | |||||||||
Royal Gold, Inc. | 6,360 | 232 | |||||||||
SCANA Corp. | 400 | 24 | |||||||||
Sempra Energy | 580 | 55 | |||||||||
Sibanye Gold Ltd. ADR | 21,820 | 133 | |||||||||
Southern Co. (The) | 2,370 | 111 | |||||||||
St. Jude Medical, Inc. | 830 | 51 | |||||||||
Stryker Corp. | 940 | 87 | |||||||||
Sysco Corp. | 1,490 | 61 | |||||||||
Tahoe Resources, Inc. | 18,980 | 165 | |||||||||
TECO Energy, Inc. | 580 | 15 | |||||||||
Tenet Healthcare Corp. (a) | 280 | 8 | |||||||||
Thermo Fisher Scientific, Inc. | 1,210 | 172 | |||||||||
Twenty-First Century Fox, Inc., Class B | 161 | 4 | |||||||||
Tyson Foods, Inc., Class A | 840 | 45 | |||||||||
UnitedHealth Group, Inc. | 2,760 | 325 | |||||||||
Universal Health Services, Inc., Class B | 280 | 33 | |||||||||
The accompanying notes are an integral part of the financial statements.
12
Morgan Stanley Institutional Fund, Inc.
Annual Report — December 31, 2015
Portfolio of Investments (cont'd)
Multi-Asset Portfolio
Shares | Value (000) | ||||||||||
United States (cont'd) | |||||||||||
Varian Medical Systems, Inc. (a) | 280 | $ | 23 | ||||||||
Vertex Pharmaceuticals, Inc. (a) | 690 | 87 | |||||||||
Wal-Mart Stores, Inc. | 4,300 | 264 | |||||||||
Walgreens Boots Alliance, Inc. | 2,370 | 202 | |||||||||
Waters Corp. (a) | 260 | 35 | |||||||||
WEC Energy Group, Inc. | 830 | 43 | |||||||||
Whole Foods Market, Inc. | 970 | 33 | |||||||||
Xcel Energy, Inc. | 1,270 | 46 | |||||||||
Zimmer Biomet Holdings, Inc. | 530 | 54 | |||||||||
Zoetis, Inc. | 1,270 | 61 | |||||||||
16,151 | |||||||||||
Total Common Stocks (Cost $118,588) | 113,733 | ||||||||||
Investment Company (0.0%) | |||||||||||
United States (0.0%) | |||||||||||
| SPDR S&P 500 ETF Trust (Cost $50) | 303 | 62 | |||||||||
| No. of Rights | |||||||||||
Rights (0.0%) | |||||||||||
Italy (0.0%) | |||||||||||
UBI Banca (a) | 1,833 | — | |||||||||
United States (0.0%) | |||||||||||
Safeway Casa Ley CVR (a) | 1,077 | 1 | |||||||||
Safeway PDC, LLC CVR (a) | 1,077 | — | @ | ||||||||
1 | |||||||||||
Total Rights (Cost $1) | 1 | ||||||||||
| Face Amount (000) | |||||||||||
Fixed Income Securities (37.8%) | |||||||||||
Sovereign (1.6%) | |||||||||||
Greece (1.6%) | |||||||||||
| Hellenic Republic Government Bond, 3.00%, 2/24/23 - 2/24/42 (e) (Cost $5,208) | EUR | 7,640 | 5,194 | ||||||||
U.S. Treasury Securities (36.2%) | |||||||||||
United States (36.2%) | |||||||||||
| U.S. Treasury Inflation Indexed Bond, 0.38%, 7/15/25 (Cost $118,439) | $ | 121,086 | 117,324 | ||||||||
Total Fixed Income Securities (Cost $123,647) | 122,518 | ||||||||||
| Notional Amount | |||||||||||
Call Options Purchased (0.5%) | |||||||||||
China (0.5%) | |||||||||||
| USD/CNH October 2016 @ CNH 6.75, Citibank NA | 16,650,000 | 451 | |||||||||
| USD/CNH October 2016 @ CNH 6.75, Goldman Sachs International | 12,850,000 | 348 | |||||||||
| USD/CNH October 2016 @ CNH 6.75, JPMorgan Chase Bank NA | 27,270,000 | 739 | |||||||||
Total Call Options Purchased (Cost $1,094) | 1,538 | ||||||||||
| Notional Amount | Value (000) | ||||||||||
Put Option Purchased (0.2%) | |||||||||||
United States (0.2%) | |||||||||||
| EUR/USD March 2016 @ $1.10, Goldman Sachs International (Cost $493) | 42,690,000 | $ | 527 | ||||||||
Shares | |||||||||||
Short-Term Investments (19.2%) | |||||||||||
Investment Company (12.3%) | |||||||||||
| Morgan Stanley Institutional Liquidity Funds — Money Market Portfolio — Institutional Class (See Note G) (Cost $40,037) | 40,037,137 | 40,037 | |||||||||
| Face Amount (000) | |||||||||||
U.S. Treasury Securities (6.9%) | |||||||||||
| U.S. Treasury Bill, 0.51%, 6/9/16 (f) (Cost $22,510) | $ | 22,560 | 22,517 | ||||||||
Total Short-Term Investments (Cost $62,547) | 62,554 | ||||||||||
Total Investments (92.8%) (Cost $306,420) (g)(h)(i) | 300,933 | ||||||||||
| Other Assets in Excess of Liabilities (7.4%) | 24,134 | ||||||||||
Total Written Options Outstanding (–0.2%) (Premiums received $701) | (649 | ) | |||||||||
Net Assets (100.0%) | $ | 324,418 | |||||||||
(a) Non-income producing security.
(b) Security trades on the Hong Kong exchange.
(c) Security has been deemed illiquid at December 31, 2015.
(d) At December 31, 2015, the Portfolio held a fair valued security valued at approximately $5,000, representing less than 0.05% of net assets. This security has been fair valued as determined in good faith under procedures established by and under the general supervision of the Fund's Directors.
(e) Multi-step — Coupon rate changes in predetermined increments to maturity. Rate disclosed is as of December 31, 2015. Maturity date disclosed is the ultimate maturity date.
(f) Rate shown is the yield to maturity at December 31, 2015.
(g) Securities are available for collateral in connection with open call options written, put options written, foreign currency forward exchange contracts, futures contracts and swap agreements.
(h) The approximate fair value and percentage of net assets, $93,522,000 and 28.8%, respectively, represent the securities that have been fair valued under the fair valuation policy for international investments as described in Note A-1 within the Notes to the Financial Statements.
(i) At December 31, 2015, the aggregate cost for Federal income tax purposes is approximately $310,276,000. The aggregate gross unrealized appreciation is approximately $10,257,000 and the aggregate gross unrealized depreciation is approximately $19,600,000 resulting in net unrealized depreciation of approximately $9,343,000.
@ Value is less than $500.
ADR American Depositary Receipt.
CDI CHESS Depositary Interest.
CVA Certificaten Van Aandelen.
ETF Exchange Traded Fund.
REIT Real Estate Investment Trust.
SPDR Standard & Poor's Depository Receipt.
The accompanying notes are an integral part of the financial statements.
13
Morgan Stanley Institutional Fund, Inc.
Annual Report — December 31, 2015
Portfolio of Investments (cont'd)
Multi-Asset Portfolio
Call Options Written:
The Portfolio had the following call options written open at December 31, 2015:
| Counterparty | Notional Amount | Description | Strike Price | Expiration Date | Value (000) | ||||||||||||||||||
| Citibank NA | 16,650,000 | USD/CNH (Premiums received $171) | $ | 7.25 | Oct-16 | $ | (170 | ) | |||||||||||||||
| Goldman Sachs International | 12,850,000 | USD/CNH (Premiums received $132) | 7.25 | Oct-16 | (131 | ) | |||||||||||||||||
| JPMorgan Chase Bank NA | 27,270,000 | USD/CNH (Premiums received $281) | 7.25 | Oct-16 | (278 | ) | |||||||||||||||||
$ | (579 | ) | |||||||||||||||||||||
Put Option Written:
The Portfolio had the following put option written open at December 31, 2015:
| Counterparty | Notional Amount | Description | Strike Price | Expiration Date | Value (000) | ||||||||||||||||||
| Goldman Sachs International | 42,690,000 | EUR/USD (Premiums received $117) | $ | 1.15 | Mar-16 | $ | (70 | ) | |||||||||||||||
Foreign Currency Forward Exchange Contracts:
The Portfolio had the following foreign currency forward exchange contracts open at December 31, 2015:
Counterparty | Contracts to Deliver (000) | In Exchange For (000) | Delivery Date | Unrealized Appreciation (Depreciation) (000) | |||||||||||||||
Bank of America NA | EUR | 7,391 | $ | 8,082 | 1/21/16 | $ | 47 | ||||||||||||
Bank of America NA | GBP | 753 | $ | 1,133 | 1/21/16 | 23 | |||||||||||||
Bank of Montreal | AUD | 83 | $ | 59 | 1/21/16 | (1 | ) | ||||||||||||
Bank of Montreal | NZD | 46 | $ | 31 | 1/21/16 | (— | @) | ||||||||||||
Bank of Montreal | $ | 243 | CAD | 335 | 1/21/16 | (1 | ) | ||||||||||||
Bank of New York Mellon | CHF | 15,382 | $ | 15,553 | 1/21/16 | 185 | |||||||||||||
Bank of New York Mellon | $ | 11,981 | SEK | 101,686 | 1/21/16 | 71 | |||||||||||||
Barclays Bank PLC | AUD | 158 | $ | 113 | 1/21/16 | (2 | ) | ||||||||||||
Barclays Bank PLC | GBP | 476 | $ | 716 | 1/21/16 | 15 | |||||||||||||
Barclays Bank PLC | $ | 400 | SGD | 565 | 1/21/16 | (2 | ) | ||||||||||||
Citibank NA | CNY | 36,293 | $ | 5,816 | 5/19/16 | 270 | |||||||||||||
Citibank NA | CNY | 106,316 | $ | 17,034 | 5/19/16 | 788 | |||||||||||||
Citibank NA | EUR | 5,514 | $ | 6,030 | 1/21/16 | 35 | |||||||||||||
Citibank NA | GBP | 40 | $ | 61 | 1/21/16 | 1 | |||||||||||||
Citibank NA | $ | 699 | CNY | 4,497 | 5/19/16 | (12 | ) | ||||||||||||
Citibank NA | $ | 4,875 | CNY | 32,452 | 5/19/16 | 84 | |||||||||||||
Citibank NA | $ | 829 | CNY | 5,177 | 5/19/16 | (37 | ) | ||||||||||||
Citibank NA | $ | 1,613 | CNY | 10,597 | 5/19/16 | 6 | |||||||||||||
Citibank NA | $ | 468 | CNY | 3,119 | 5/19/16 | 9 | |||||||||||||
Citibank NA | $ | 437 | CNY | 2,860 | 5/19/16 | (— | @) | ||||||||||||
Citibank NA | $ | 2,597 | CNY | 16,859 | 5/19/16 | (21 | ) | ||||||||||||
Citibank NA | $ | 733 | JPY | 88,366 | 1/21/16 | 2 | |||||||||||||
Commonwealth Bank of Australia | $ | 2,454 | AUD | 3,371 | 1/21/16 | — | @ | ||||||||||||
Credit Suisse International | EUR | 6,145 | $ | 6,706 | 1/21/16 | 26 | |||||||||||||
Deutsche Bank AG | CHF | 31,300 | $ | 31,652 | 1/21/16 | 381 | |||||||||||||
Deutsche Bank AG | CNY | 70,878 | $ | 11,358 | 5/19/16 | 528 | |||||||||||||
Deutsche Bank AG | HKD | 34,732 | $ | 4,481 | 1/21/16 | (1 | ) | ||||||||||||
Deutsche Bank AG | HUF | 44,905 | $ | 155 | 1/21/16 | — | @ | ||||||||||||
Deutsche Bank AG | ILS | 94 | $ | 24 | 1/21/16 | — | @ | ||||||||||||
Deutsche Bank AG | JPY | 201,808 | $ | 1,660 | 1/21/16 | (19 | ) | ||||||||||||
Deutsche Bank AG | SEK | 2,984 | $ | 354 | 1/21/16 | — | @ | ||||||||||||
Deutsche Bank AG | $ | 1,135 | EUR | 1,033 | 1/21/16 | (12 | ) | ||||||||||||
Deutsche Bank AG | $ | 1,559 | EUR | 1,423 | 1/21/16 | (12 | ) | ||||||||||||
Deutsche Bank AG | $ | 826 | HKD | 6,401 | 1/21/16 | — | @ | ||||||||||||
Deutsche Bank AG | $ | 2,015 | JPY | 242,277 | 1/21/16 | 2 | |||||||||||||
Deutsche Bank AG | $ | 31,745 | SEK | 269,368 | 1/21/16 | 180 | |||||||||||||
Goldman Sachs International | CHF | 1,007 | $ | 1,010 | 1/21/16 | 3 | |||||||||||||
Goldman Sachs International | DKK | 4,045 | $ | 590 | 1/21/16 | 1 | |||||||||||||
The accompanying notes are an integral part of the financial statements.
14
Morgan Stanley Institutional Fund, Inc.
Annual Report — December 31, 2015
Portfolio of Investments (cont'd)
Multi-Asset Portfolio
Foreign Currency Forward Exchange Contracts (cont'd):
Counterparty | Contracts to Deliver (000) | In Exchange For (000) | Delivery Date | Unrealized Appreciation (Depreciation) (000) | |||||||||||||||
Goldman Sachs International | GBP | 97 | $ | 146 | 1/21/16 | $ | 3 | ||||||||||||
Goldman Sachs International | GBP | 767 | $ | 1,136 | 1/21/16 | 4 | |||||||||||||
Goldman Sachs International | HKD | 369 | $ | 48 | 1/21/16 | — | @ | ||||||||||||
Goldman Sachs International | JPY | 1,381,293 | $ | 11,363 | 1/21/16 | (133 | ) | ||||||||||||
Goldman Sachs International | $ | 2,474 | EUR | 2,272 | 1/21/16 | (3 | ) | ||||||||||||
Goldman Sachs International | $ | 1,816 | EUR | 1,667 | 1/21/16 | (4 | ) | ||||||||||||
Goldman Sachs International | $ | 4,503 | GBP | 3,038 | 1/21/16 | (25 | ) | ||||||||||||
JPMorgan Chase Bank NA | EUR | 1,245 | $ | 1,359 | 1/21/16 | 5 | |||||||||||||
JPMorgan Chase Bank NA | EUR | 919 | $ | 1,004 | 1/21/16 | 6 | |||||||||||||
JPMorgan Chase Bank NA | GBP | 111 | $ | 167 | 1/21/16 | 3 | |||||||||||||
JPMorgan Chase Bank NA | HKD | 44,893 | $ | 5,793 | 1/21/16 | (— | @) | ||||||||||||
JPMorgan Chase Bank NA | RUB | 75,634 | $ | 1,076 | 1/21/16 | 43 | |||||||||||||
JPMorgan Chase Bank NA | $ | 4,823 | HKD | 37,371 | 1/21/16 | — | @ | ||||||||||||
JPMorgan Chase Bank NA | $ | 432 | MXN | 7,467 | 1/21/16 | 1 | |||||||||||||
JPMorgan Chase Bank NA | $ | 853 | MXN | 14,836 | 1/21/16 | 7 | |||||||||||||
JPMorgan Chase Bank NA | $ | 11,806 | RUB | 822,680 | 1/21/16 | (566 | ) | ||||||||||||
State Street Bank and Trust Co. | CHF | 17,550 | $ | 17,755 | 1/21/16 | 222 | |||||||||||||
State Street Bank and Trust Co. | EUR | 1,993 | $ | 2,179 | 1/21/16 | 12 | |||||||||||||
State Street Bank and Trust Co. | JPY | 162,284 | $ | 1,335 | 1/21/16 | (15 | ) | ||||||||||||
State Street Bank and Trust Co. | MXN | 2,223 | $ | 129 | 1/21/16 | — | @ | ||||||||||||
State Street Bank and Trust Co. | SEK | 142,442 | $ | 16,896 | 1/21/16 | 14 | |||||||||||||
State Street Bank and Trust Co. | $ | 18,734 | CHF | 18,545 | 1/21/16 | (206 | ) | ||||||||||||
State Street Bank and Trust Co. | $ | 1,323 | DKK | 9,022 | 1/21/16 | (8 | ) | ||||||||||||
State Street Bank and Trust Co. | $ | 8,209 | MXN | 141,881 | 1/21/16 | 14 | |||||||||||||
State Street Bank and Trust Co. | $ | 22,809 | SEK | 193,606 | 1/21/16 | 136 | |||||||||||||
UBS AG | CHF | 15,907 | $ | 16,089 | 1/21/16 | 197 | |||||||||||||
UBS AG | EUR | 10,868 | $ | 11,884 | 1/21/16 | 69 | |||||||||||||
UBS AG | GBP | 225 | $ | 338 | 1/21/16 | 7 | |||||||||||||
UBS AG | INR | 46,268 | $ | 694 | 1/21/16 | (4 | ) | ||||||||||||
UBS AG | $ | 862 | CHF | 852 | 1/21/16 | (11 | ) | ||||||||||||
UBS AG | $ | 563 | CHF | 560 | 1/21/16 | (4 | ) | ||||||||||||
UBS AG | ZAR | 1,189 | $ | 79 | 1/21/16 | 2 | |||||||||||||
$ | 2,303 | ||||||||||||||||||
Futures Contracts:
The Portfolio had the following futures contracts open at December 31, 2015:
| Number of Contracts | Value (000) | Expiration Date | Unrealized Appreciation (Depreciation) (000) | ||||||||||||||||
Long: | |||||||||||||||||||
Euro Stoxx 50 Index (Germany) | 697 | $ | 24,860 | Mar-16 | $ | 370 | |||||||||||||
MSCI Emerging Market E Mini (United States) | 63 | 2,481 | Mar-16 | 16 | |||||||||||||||
NIKKEI 225 Index (Japan) | 5 | 390 | Mar-16 | (16 | ) | ||||||||||||||
S+P TSE 60 Index (Canada) | 4 | 440 | Mar-16 | (5 | ) | ||||||||||||||
U.S. Treasury 10 yr. Note (United States) | 358 | 45,074 | Mar-16 | (245 | ) | ||||||||||||||
Short: | |||||||||||||||||||
Brent Crude Futures (United Kingdom) | 91 | (3,392 | ) | Jan-16 | 161 | ||||||||||||||
FTSE 100 Index (United Kingdom) | 37 | (3,381 | ) | Mar-16 | (147 | ) | |||||||||||||
German Euro Bund (Germany) | 455 | (78,087 | ) | Mar-16 | 728 | ||||||||||||||
S&P 500 E MINI Index (United States) | 984 | (100,142 | ) | Mar-16 | (621 | ) | |||||||||||||
SPI 200 Index (Australia) | 5 | (479 | ) | Mar-16 | 3 | ||||||||||||||
TOPIX Index (Japan) | 81 | (10,428 | ) | Mar-16 | 274 | ||||||||||||||
U.S. Treasury 5 yr. Note (United States) | 189 | (22,362 | ) | Mar-16 | 26 | ||||||||||||||
U.S. Treasury Long Bond (United States) | 153 | (23,524 | ) | Mar-16 | 3 | ||||||||||||||
$ | 547 | ||||||||||||||||||
The accompanying notes are an integral part of the financial statements.
15
Morgan Stanley Institutional Fund, Inc.
Annual Report — December 31, 2015
Portfolio of Investments (cont'd)
Multi-Asset Portfolio
Credit Default Swap Agreement:
The Portfolio had the following credit default swap agreement open at December 31, 2015:
| Swap Counterparty and Reference Obligation | Buy/Sell Protection | Notional Amount (000) | Pay/Receive Fixed Rate | Termination Date | Upfront Payment Paid (000) | Unrealized Depreciation (000) | Value (000) | Credit Rating of Reference Obligation† (Unaudited) | |||||||||||||||||||||||||||
| Goldman Sachs International People's Republic of China | Buy | $ | 9,766 | 1.00 | % | 12/20/20 | $ | 124 | $ | (84 | ) | $ | 40 | AA- | |||||||||||||||||||||
Interest Rate Swap Agreements:
The Portfolio had the following interest rate swap agreements open at December 31, 2015:
Swap Counterparty | Floating Rate Index | Pay/Receive Floating Rate | Fixed Rate | Termination Date | Notional Amount (000) | Unrealized Appreciation (Depreciation) (000) | |||||||||||||||||||||
Bank of America NA | 1 Month TIIE | Receive | 4.32 | % | 7/27/17 | MXN | 47,531 | $ | (5 | ) | |||||||||||||||||
Bank of America NA | 1 Month TIIE | Receive | 4.33 | 7/27/17 | 48,170 | (5 | ) | ||||||||||||||||||||
Bank of America NA | 1 Month TIIE | Receive | 4.39 | 7/28/17 | 32,885 | (5 | ) | ||||||||||||||||||||
Bank of America NA | 1 Month TIIE | Receive | 4.39 | 12/11/17 | 178,508 | (2 | ) | ||||||||||||||||||||
Bank of America NA | 1 Month TIIE | Pay | 6.30 | 7/17/25 | 9,687 | (2 | ) | ||||||||||||||||||||
Bank of America NA | 1 Month TIIE | Pay | 6.32 | 7/17/25 | 11,183 | (2 | ) | ||||||||||||||||||||
Bank of America NA | 1 Month TIIE | Pay | 6.41 | 12/1/25 | 44,378 | 4 | |||||||||||||||||||||
Barclays Bank PLC | 1 Month TIIE | Receive | 4.30 | 7/26/17 | 72,098 | (7 | ) | ||||||||||||||||||||
Barclays Bank PLC | 1 Month TIIE | Receive | 4.36 | 7/27/17 | 138,018 | (18 | ) | ||||||||||||||||||||
Barclays Bank PLC | 1 Month TIIE | Receive | 4.34 | 12/19/17 | 119,473 | 9 | |||||||||||||||||||||
Barclays Bank PLC | 1 Month TIIE | Pay | 6.32 | 7/17/25 | 33,609 | (5 | ) | ||||||||||||||||||||
Barclays Bank PLC | 3 Month STIBOR | Receive | 1.34 | 10/12/25 | SEK | 16,671 | 42 | ||||||||||||||||||||
Barclays Bank PLC | 3 Month STIBOR | Receive | 1.37 | 10/14/25 | 19,441 | 41 | |||||||||||||||||||||
Barclays Bank PLC | 1 Month TIIE | Pay | 6.22 | 12/9/25 | MXN | 29,119 | (24 | ) | |||||||||||||||||||
BNP Paribas SA | 1 Month TIIE | Receive | 4.30 | 12/8/17 | 150,501 | 12 | |||||||||||||||||||||
BNP Paribas SA | 3 Month STIBOR | Receive | 1.34 | 10/12/25 | SEK | 17,791 | 46 | ||||||||||||||||||||
BNP Paribas SA | 1 Month TIIE | Pay | 6.29 | 11/28/25 | MXN | 36,419 | (16 | ) | |||||||||||||||||||
Citibank NA | 1 Month TIIE | Receive | 4.38 | 7/28/17 | 13,244 | (2 | ) | ||||||||||||||||||||
Citibank NA | 1 Month TIIE | Pay | 6.33 | 7/18/25 | 8,280 | (1 | ) | ||||||||||||||||||||
Citibank NA | 1 Month TIIE | Pay | 6.40 | 8/14/25 | 2,920 | 1 | |||||||||||||||||||||
Citibank NA | 3 Month STIBOR | Receive | 1.28 | 10/6/25 | SEK | 43,521 | 134 | ||||||||||||||||||||
Citibank NA | 3 Month STIBOR | Receive | 1.34 | 10/12/25 | 22,195 | 57 | |||||||||||||||||||||
Citibank NA | 3 Month STIBOR | Receive | 1.39 | 10/13/25 | 39,150 | 73 | |||||||||||||||||||||
Citibank NA | 3 Month STIBOR | Receive | 1.37 | 10/14/25 | 16,007 | 34 | |||||||||||||||||||||
Deutsche Bank AG | 1 Month TIIE | Receive | 4.38 | 7/28/17 | MXN | 145,680 | (23 | ) | |||||||||||||||||||
Deutsche Bank AG | 1 Month TIIE | Pay | 6.33 | 7/18/25 | 33,312 | (4 | ) | ||||||||||||||||||||
Goldman Sachs International | 1 Month TIIE | Receive | 4.38 | 7/28/17 | 145,343 | (22 | ) | ||||||||||||||||||||
Goldman Sachs International | 1 Month TIIE | Receive | 4.31 | 12/8/17 | 67,880 | 5 | |||||||||||||||||||||
Goldman Sachs International | 1 Month TIIE | Receive | 4.34 | 12/19/17 | 117,464 | 8 | |||||||||||||||||||||
Goldman Sachs International | 1 Month TIIE | Pay | 6.33 | 7/16/25 | 35,804 | (4 | ) | ||||||||||||||||||||
Goldman Sachs International | 3 Month STIBOR | Receive | 1.25 | 10/6/25 | SEK | 14,000 | 46 | ||||||||||||||||||||
Goldman Sachs International | 3 Month STIBOR | Receive | 1.29 | 10/7/25 | 12,000 | 37 | |||||||||||||||||||||
Goldman Sachs International | 3 Month STIBOR | Receive | 1.39 | 10/13/25 | 6,512 | 13 | |||||||||||||||||||||
Goldman Sachs International | 1 Month TIIE | Pay | 6.29 | 11/28/25 | MXN | 16,445 | (7 | ) | |||||||||||||||||||
Goldman Sachs International | 1 Month TIIE | Pay | 6.22 | 12/9/25 | 33,000 | (27 | ) | ||||||||||||||||||||
JPMorgan Chase Bank NA | 1 Month TIIE | Receive | 4.34 | 12/19/17 | 76,653 | 6 | |||||||||||||||||||||
JPMorgan Chase Bank NA | 1 Month TIIE | Pay | 6.33 | 7/17/25 | 5,000 | (1 | ) | ||||||||||||||||||||
JPMorgan Chase Bank NA | 3 Month STIBOR | Receive | 1.29 | 10/7/25 | SEK | 42,270 | 131 | ||||||||||||||||||||
JPMorgan Chase Bank NA | 3 Month STIBOR | Receive | 1.33 | 10/8/25 | 9,545 | 24 | |||||||||||||||||||||
JPMorgan Chase Bank NA | 3 Month STIBOR | Receive | 1.34 | 10/12/25 | 26,547 | 69 | |||||||||||||||||||||
JPMorgan Chase Bank NA | 3 Month STIBOR | Receive | 1.38 | 10/13/25 | 12,245 | 46 | |||||||||||||||||||||
The accompanying notes are an integral part of the financial statements.
16
Morgan Stanley Institutional Fund, Inc.
Annual Report — December 31, 2015
Portfolio of Investments (cont'd)
Multi-Asset Portfolio
Interest Rate Swap Agreements (cont'd):
Swap Counterparty | Floating Rate Index | Pay/Receive Floating Rate | Fixed Rate | Termination Date | Notional Amount (000) | Unrealized Appreciation (Depreciation) (000) | |||||||||||||||||||||
JPMorgan Chase Bank NA | 1 Month TIIE | Pay | 6.23 | 12/9/25 | MXN | 18,913 | $ | (15 | ) | ||||||||||||||||||
UBS AG | 1 Month TIIE | Receive | 4.30 | 7/26/17 | 95,560 | (8 | ) | ||||||||||||||||||||
UBS AG | 1 Month TIIE | Receive | 4.40 | 7/28/17 | 145,762 | (26 | ) | ||||||||||||||||||||
UBS AG | 1 Month TIIE | Receive | 4.31 | 12/8/17 | 144,166 | 11 | |||||||||||||||||||||
UBS AG | 1 Month TIIE | Receive | 4.38 | 12/11/17 | 343,840 | (1 | ) | ||||||||||||||||||||
UBS AG | 1 Month TIIE | Receive | 4.41 | 12/21/17 | 80,442 | — | @ | ||||||||||||||||||||
UBS AG | 1 Month TIIE | Pay | 6.34 | 7/16/25 | 23,615 | (1 | ) | ||||||||||||||||||||
UBS AG | 1 Month TIIE | Pay | 6.33 | 7/17/25 | 28,174 | (4 | ) | ||||||||||||||||||||
UBS AG | 1 Month TIIE | Pay | 6.30 | 11/28/25 | 34,886 | (13 | ) | ||||||||||||||||||||
UBS AG | 1 Month TIIE | Pay | 6.40 | 12/1/25 | 82,105 | 4 | |||||||||||||||||||||
UBS AG | 1 Month TIIE | Pay | 6.31 | 12/11/25 | 18,647 | (8 | ) | ||||||||||||||||||||
$ | 595 | ||||||||||||||||||||||||||
Total Return Swap Agreements:
The Portfolio had the following total return swap agreements open at December 31, 2015:
Swap Counterparty | Index | Notional Amount (000) | Floating Rate | Pay/Receive Total Return of Referenced Index | Maturity Date | Unrealized Appreciation (Depreciation) (000) | |||||||||||||||||||||
Barclays Bank PLC | Short U.S. Cyclicals Index†† | $ | 4,472 | 3 Month USD LIBOR minus 0.59% | Pay | 12/22/16 | $ | 45 | |||||||||||||||||||
Barclays Bank PLC | Short U.S. Cyclicals Index†† | 5,907 | 3 Month USD LIBOR minus 0.59% | Pay | 12/22/16 | (74 | ) | ||||||||||||||||||||
Barclays Bank PLC | Short U.S. Cyclicals Index†† | 5,147 | 3 Month USD LIBOR minus 0.60% | Pay | 12/22/16 | 41 | |||||||||||||||||||||
Goldman Sachs International | Short EU Quality Index†† | 7,761 | 3 Month USD LIBOR minus 0.36% | Pay | 11/10/16 | 22 | |||||||||||||||||||||
JPMorgan Chase Bank NA | JPM Aerospace Index†† | 12,389 | 3 Month USD LIBOR minus 0.26% | Pay | 9/8/16 | 274 | |||||||||||||||||||||
JPMorgan Chase Bank NA | JPM Aerospace Index†† | 17,154 | 3 Month USD LIBOR minus 0.36% | Pay | 9/8/16 | 377 | |||||||||||||||||||||
$ | 685 | ||||||||||||||||||||||||||
†† See tables below for details of the equity basket holdings underlying the swap.
The following table represents the equity basket holdings underlying the total return swap with Short U.S. Cyclicals Index as of December 31, 2015.
Security Description | Index Weight | ||||||
Short U.S. Cyclicals Index | |||||||
3M Co. | 1.10 | % | |||||
Accenture PLC | 0.80 | ||||||
Activision Blizzard, Inc. | 0.24 | ||||||
Adobe Systems, Inc. | 0.57 | ||||||
ADT Corp. (The) | 0.07 | ||||||
Advance Auto Parts, Inc. | 0.13 | ||||||
Air Products & Chemicals, Inc. | 0.31 | ||||||
Airgas, Inc. | 0.11 | ||||||
Akamai Technologies, Inc. | 0.11 | ||||||
Alcoa, Inc. | 0.15 | ||||||
Allegion PLC | 0.07 | ||||||
Alliance Data Systems Corp. | 0.21 | ||||||
Alphabet, Inc. | 2.75 | ||||||
Alphabet, Inc. | 2.75 | ||||||
Amazon.com, Inc. | 3.01 | ||||||
American Airlines Group, Inc. | 0.31 | ||||||
AMETEK, Inc. | 0.15 | ||||||
Amphenol Corp. | 0.20 | ||||||
Security Description | Index Weight | ||||||
Short U.S. Cyclicals Index (cont'd) | |||||||
Analog Devices, Inc. | 0.22 | % | |||||
Apple, Inc. | 7.33 | ||||||
Applied Materials, Inc. | 0.27 | ||||||
Autodesk, Inc. | 0.17 | ||||||
Automatic Data Processing, Inc. | 0.48 | ||||||
AutoNation, Inc. | 0.06 | ||||||
AutoZone, Inc. | 0.26 | ||||||
Avago Technologies Ltd. | 0.46 | ||||||
Avery Dennison Corp. | 0.07 | ||||||
Ball Corp. | 0.12 | ||||||
Bed Bath & Beyond, Inc. | 0.09 | ||||||
Best Buy Co., Inc. | 0.11 | ||||||
Boeing Co. (The) | 1.08 | ||||||
BorgWarner, Inc. | 0.12 | ||||||
Broadcom Corp. | 0.40 | ||||||
CA, Inc. | 0.11 | ||||||
Cablevision Systems Corp. | 0.08 | ||||||
CarMax, Inc. | 0.13 | ||||||
Carnival Corp. | 0.29 | ||||||
Caterpillar, Inc. | 0.48 | ||||||
CBS Corp. | 0.24 | ||||||
The accompanying notes are an integral part of the financial statements.
17
Morgan Stanley Institutional Fund, Inc.
Annual Report — December 31, 2015
Portfolio of Investments (cont'd)
Multi-Asset Portfolio
Security Description | Index Weight | ||||||
Short U.S. Cyclicals Index (cont'd) | |||||||
CF Industries Holdings, Inc. | 0.11 | % | |||||
CH Robinson Worldwide, Inc. | 0.10 | ||||||
Chipotle Mexican Grill, Inc. | 0.17 | ||||||
Cintas Corp. | 0.09 | ||||||
Cisco Systems, Inc. | 1.69 | ||||||
Citrix Systems, Inc. | 0.15 | ||||||
Coach, Inc. | 0.10 | ||||||
Cognizant Technology Solutions Corp. | 0.45 | ||||||
Comcast Corp. | 1.61 | ||||||
Corning, Inc. | 0.28 | ||||||
CSRA, Inc. | 0.06 | ||||||
CSX Corp. | 0.30 | ||||||
Cummins, Inc. | 0.17 | ||||||
Danaher Corp. | 0.64 | ||||||
Darden Restaurants, Inc. | 0.09 | ||||||
Deere & Co. | 0.28 | ||||||
Delphi Automotive PLC | 0.28 | ||||||
Delta Air Lines, Inc. | 0.48 | ||||||
Discovery Communications, Inc. | 0.08 | ||||||
Discovery Communications, Inc. | 0.05 | ||||||
Dollar General Corp. | 0.24 | ||||||
Dollar Tree, Inc. | 0.21 | ||||||
Dover Corp. | 0.11 | ||||||
Dow Chemical Co. (The) | 0.72 | ||||||
DR Horton, Inc. | 0.12 | ||||||
Dun & Bradstreet Corp. (The) | 0.04 | ||||||
Eastman Chemical Co. | 0.12 | ||||||
Eaton Corp., PLC. | 0.29 | ||||||
eBay, Inc. | 0.38 | ||||||
Ecolab, Inc. | 0.37 | ||||||
EI du Pont de Nemours & Co. | 0.72 | ||||||
Electronic Arts, Inc. | 0.26 | ||||||
EMC Corp. | 0.61 | ||||||
Emerson Electric Co. | 0.37 | ||||||
Equifax, Inc. | 0.15 | ||||||
Expedia, Inc. | 0.14 | ||||||
Expeditors International of Washington I | 0.10 | ||||||
F5 Networks, Inc. | 0.09 | ||||||
Facebook, Inc. | 2.89 | ||||||
Fastenal Co. | 0.14 | ||||||
FedEx Corp. | 0.46 | ||||||
Fidelity National Information Services I | 0.21 | ||||||
First Solar, Inc. | 0.07 | ||||||
Fiserv, Inc. | 0.26 | ||||||
FLIR Systems, Inc. | 0.05 | ||||||
Flowserve Corp. | 0.06 | ||||||
Fluor Corp. | 0.08 | ||||||
FMC Corp. | 0.06 | ||||||
Ford Motor Co. | 0.63 | ||||||
Fossil Group, Inc. | 0.02 | ||||||
Freeport-McMoRan, Inc. | 0.09 | ||||||
GameStop Corp. | 0.04 | ||||||
Gap, Inc. (The) | 0.07 | ||||||
Garmin Ltd. | 0.05 | ||||||
General Dynamics Corp. | 0.49 | ||||||
General Electric Co. | 3.44 | ||||||
General Motors Co. | 0.57 | ||||||
Genuine Parts Co. | 0.15 | ||||||
Goodyear Tire & Rubber Co. (The) | 0.10 | ||||||
Security Description | Index Weight | ||||||
Short U.S. Cyclicals Index (cont'd) | |||||||
H&R Block, Inc. | 0.09 | % | |||||
Hanesbrands, Inc. | 0.14 | ||||||
Harley-Davidson, Inc. | 0.10 | ||||||
Harman International Industries, Inc. | 0.08 | ||||||
Harris Corp. | 0.14 | ||||||
Hasbro, Inc. | 0.09 | ||||||
Hewlett Packard Enterprise Co. | 0.34 | ||||||
Home Depot, Inc. (The) | 1.97 | ||||||
Honeywell International, Inc. | 0.95 | ||||||
HP, Inc. | 0.26 | ||||||
Illinois Tool Works, Inc. | 0.36 | ||||||
Ingersoll-Rand PLC | 0.18 | ||||||
Intel Corp. | 2.01 | ||||||
International Business Machines Corp. | 1.51 | ||||||
International Flavors & Fragrances, Inc. | 0.11 | ||||||
International Paper Co. | 0.19 | ||||||
Interpublic Group of Cos, Inc. (The) | 0.11 | ||||||
Intuit, Inc. | 0.33 | ||||||
Jacobs Engineering Group, Inc. | 0.06 | ||||||
JB Hunt Transport Services, Inc. | 0.08 | ||||||
Johnson Controls, Inc. | 0.30 | ||||||
Juniper Networks, Inc. | 0.12 | ||||||
Kansas City Southern | 0.10 | ||||||
KLA-Tencor Corp. | 0.13 | ||||||
Kohl's Corp. | 0.11 | ||||||
L Brands, Inc. | 0.29 | ||||||
L-3 Communications Holdings, Inc. | 0.11 | ||||||
Lam Research Corp. | 0.15 | ||||||
Leggett & Platt, Inc. | 0.07 | ||||||
Lennar Corp. | 0.10 | ||||||
Linear Technology Corp. | 0.13 | ||||||
Lockheed Martin Corp. | 0.68 | ||||||
Lowe's Cos, Inc. | 0.82 | ||||||
LyondellBasell Industries N.V. | 0.39 | ||||||
Macy's, Inc. | 0.13 | ||||||
Marriott International, Inc. | 0.15 | ||||||
Martin Marietta Materials, Inc. | 0.11 | ||||||
Masco Corp. | 0.12 | ||||||
MasterCard, Inc. | 1.19 | ||||||
Mattel, Inc. | 0.11 | ||||||
McDonald's Corp. | 1.29 | ||||||
Michael Kors Holdings Ltd. | 0.09 | ||||||
Microchip Technology, Inc. | 0.12 | ||||||
Micron Technology, Inc. | 0.19 | ||||||
Microsoft Corp. | 5.43 | ||||||
Mohawk Industries, Inc. | 0.14 | ||||||
Monsanto Co. | 0.53 | ||||||
Mosaic Co. (The) | 0.11 | ||||||
Motorola Solutions, Inc. | 0.14 | ||||||
NetApp, Inc. | 0.09 | ||||||
Netflix, Inc. | 0.56 | ||||||
Newell Rubbermaid, Inc. | 0.14 | ||||||
Newmont Mining Corp. | 0.12 | ||||||
News Corp. | 0.06 | ||||||
News Corp. | 0.02 | ||||||
Nielsen Holdings PLC | 0.20 | ||||||
NIKE, Inc. | 0.99 | ||||||
Nordstrom, Inc. | 0.08 | ||||||
Norfolk Southern Corp. | 0.30 | ||||||
The accompanying notes are an integral part of the financial statements.
18
Morgan Stanley Institutional Fund, Inc.
Annual Report — December 31, 2015
Portfolio of Investments (cont'd)
Multi-Asset Portfolio
Security Description | Index Weight | ||||||
Short U.S. Cyclicals Index (cont'd) | |||||||
Northrop Grumman Corp. | 0.41 | % | |||||
Nucor Corp. | 0.15 | ||||||
NVIDIA Corp. | 0.21 | ||||||
Omnicom Group, Inc. | 0.22 | ||||||
Oracle Corp. | 1.45 | ||||||
O'Reilly Automotive, Inc. | 0.29 | ||||||
Owens-Illinois, Inc. | 0.03 | ||||||
PACCAR, Inc. | 0.20 | ||||||
Parker-Hannifin Corp. | 0.15 | ||||||
Paychex, Inc. | 0.21 | ||||||
PayPal Holdings, Inc. | 0.49 | ||||||
Pentair PLC | 0.11 | ||||||
Pitney Bowes, Inc. | 0.05 | ||||||
PPG Industries, Inc. | 0.32 | ||||||
Praxair, Inc. | 0.35 | ||||||
Precision Castparts Corp. | 0.37 | ||||||
Priceline Group, Inc. (The) | 0.75 | ||||||
PulteGroup, Inc. | 0.06 | ||||||
PVH Corp. | 0.07 | ||||||
Qorvo, Inc. | 0.09 | ||||||
QUALCOMM, Inc. | 0.96 | ||||||
Quanta Services, Inc. | 0.04 | ||||||
Ralph Lauren Corp. | 0.08 | ||||||
Raytheon Co. | 0.44 | ||||||
Red Hat, Inc. | 0.18 | ||||||
Republic Services, Inc. | 0.12 | ||||||
Robert Half International, Inc. | 0.07 | ||||||
Rockwell Automation, Inc. | 0.16 | ||||||
Rockwell Collins, Inc. | 0.15 | ||||||
Roper Technologies, Inc. | 0.23 | ||||||
Ross Stores, Inc. | 0.26 | ||||||
Royal Caribbean Cruises Ltd. | 0.20 | ||||||
Ryder System, Inc. | 0.04 | ||||||
salesforce.com, Inc. | 0.59 | ||||||
SanDisk Corp. | 0.19 | ||||||
Scripps Networks Interactive, Inc. | 0.06 | ||||||
Seagate Technology PLC | 0.14 | ||||||
Sealed Air Corp. | 0.12 | ||||||
Sherwin-Williams Co. (The) | 0.25 | ||||||
Signet Jewelers Ltd. | 0.12 | ||||||
Skyworks Solutions, Inc. | 0.18 | ||||||
Snap-on, Inc. | 0.11 | ||||||
Southwest Airlines Co. | 0.33 | ||||||
Stanley Black & Decker, Inc. | 0.19 | ||||||
Staples, Inc. | 0.07 | ||||||
Starbucks Corp. | 1.03 | ||||||
Starwood Hotels & Resorts Worldwide, Inc. | 0.13 | ||||||
Stericycle, Inc. | 0.12 | ||||||
Symantec Corp. | 0.18 | ||||||
Target Corp. | 0.53 | ||||||
TE Connectivity Ltd. | 0.32 | ||||||
TEGNA, Inc. | 0.07 | ||||||
Teradata Corp. | 0.04 | ||||||
Texas Instruments, Inc. | 0.69 | ||||||
Textron, Inc. | 0.13 | ||||||
Tiffany & Co. | 0.10 | ||||||
Time Warner Cable, Inc. | 0.61 | ||||||
Time Warner, Inc. | 0.61 | ||||||
TJX Cos, Inc. (The) | 0.56 | ||||||
Security Description | Index Weight | ||||||
Short U.S. Cyclicals Index (cont'd) | |||||||
Total System Services, Inc. | 0.10 | % | |||||
Tractor Supply Co. | 0.14 | ||||||
TripAdvisor, Inc. | 0.11 | ||||||
Twenty-First Century Fox, Inc. | 0.39 | ||||||
Twenty-First Century Fox, Inc. | 0.14 | ||||||
Tyco International Plc | 0.16 | ||||||
Under Armour, Inc. | 0.17 | ||||||
Union Pacific Corp. | 0.80 | ||||||
United Continental Holdings, Inc. | 0.26 | ||||||
United Parcel Service, Inc. | 0.79 | ||||||
United Rentals, Inc. | 0.09 | ||||||
United Technologies Corp. | 0.93 | ||||||
Urban Outfitters, Inc. | 0.02 | ||||||
VeriSign, Inc. | 0.11 | ||||||
Verisk Analytics, Inc. | 0.14 | ||||||
VF Corp. | 0.25 | ||||||
Viacom, Inc. | 0.16 | ||||||
Visa, Inc. | 1.85 | ||||||
Vulcan Materials Co. | 0.15 | ||||||
Walt Disney Co. (The) | 1.89 | ||||||
Waste Management, Inc. | 0.26 | ||||||
Western Digital Corp. | 0.17 | ||||||
Western Union Co. (The) | 0.11 | ||||||
WestRock Co. | 0.15 | ||||||
Whirlpool Corp. | 0.13 | ||||||
WW Grainger, Inc. | 0.15 | ||||||
Wyndham Worldwide Corp. | 0.10 | ||||||
Wynn Resorts Ltd. | 0.06 | ||||||
Xerox Corp. | 0.13 | ||||||
Xilinx, Inc. | 0.15 | ||||||
Xylem, Inc. | 0.08 | ||||||
Yahoo!, Inc. | 0.35 | ||||||
Yum! Brands, Inc. | 0.36 | ||||||
100.00 | % | ||||||
The following table represents the equity basket holdings underlying the total return swap with GS China Exposed Autos Index as of December 31, 2015.
Security Description | Index Weight | ||||||
GS China Exposed Autos Index | |||||||
Bayerische Motoren Werke AG | 12.19 | % | |||||
Daimler AG | 27.15 | ||||||
Ford Motor Co. | 17.52 | ||||||
General Motors Co. | 14.99 | ||||||
Hyundai Motor Co. | 7.02 | ||||||
Kia Motors Corp. | 4.26 | ||||||
Nissan Motor Co., Ltd. | 9.06 | ||||||
Volkswagen AG | 7.81 | ||||||
100.00 | % | ||||||
The following table represents the equity basket holdings underlying the total return swap with Short EU Quality Index as of December 31, 2015.
Security Description | Index Weight | ||||||
Short EU Quality Index | |||||||
ABB Ltd. | 1.44 | % | |||||
Actelion Ltd. | 0.58 | ||||||
Air Liquide SA | 1.43 | ||||||
The accompanying notes are an integral part of the financial statements.
19
Morgan Stanley Institutional Fund, Inc.
Annual Report — December 31, 2015
Portfolio of Investments (cont'd)
Multi-Asset Portfolio
Security Description | Index Weight | ||||||
Short EU Quality Index (cont'd) | |||||||
Airbus Group SE | 1.80 | % | |||||
ARM Holdings PLC | 0.81 | ||||||
ASML Holding N.V. | 0.95 | ||||||
Assa Abloy AB | 0.73 | ||||||
Associated British Foods PLC | 1.18 | ||||||
AstraZeneca PLC | 3.67 | ||||||
Atlas Copco AB | 1.03 | ||||||
BAE Systems PLC | 1.37 | ||||||
BASF SE | 2.62 | ||||||
British American Tobacco PLC | 4.64 | ||||||
Burberry Group PLC | 0.77 | ||||||
Capita PLC | 1.20 | ||||||
Centrica PLC | 0.63 | ||||||
Cie Financiere Richemont SA | 1.22 | ||||||
Coloplast A/S | 1.00 | ||||||
Compass Group PLC | 1.54 | ||||||
Continental AG | 1.04 | ||||||
Deutsche Boerse AG | 0.95 | ||||||
Deutsche Post AG | 1.17 | ||||||
Diageo PLC | 2.64 | ||||||
Essilor International SA | 0.76 | ||||||
Geberit AG | 0.84 | ||||||
Henkel AG & Co., KGaA | 1.08 | ||||||
Hennes & Mauritz AB | 2.09 | ||||||
Imperial Tobacco Group PLC | 2.44 | ||||||
Industria de Diseno Textil SA | 2.06 | ||||||
ITV PLC | 1.68 | ||||||
Kerry Group PLC | 1.16 | ||||||
Kone Oyj | 1.59 | ||||||
Legrand SA | 0.57 | ||||||
L'Oreal SA | 1.60 | ||||||
Nestle SA | 3.65 | ||||||
Next PLC | 0.68 | ||||||
Novartis AG | 3.24 | ||||||
Novo Nordisk A/S | 6.66 | ||||||
Novozymes A/S | 0.98 | ||||||
Pandora A/S | 0.86 | ||||||
Reckitt Benckiser Group PLC | 2.86 | ||||||
RELX N.V. | 1.08 | ||||||
RELX PLC | 1.44 | ||||||
Rio Tinto PLC | 1.44 | ||||||
Roche Holding AG | 4.14 | ||||||
Rolls-Royce Holdings PLC | 0.62 | ||||||
SABMiller PLC | 1.85 | ||||||
SAP SE | 2.83 | ||||||
SGS SA | 1.29 | ||||||
Shire PLC | 2.32 | ||||||
Sky PLC | 0.74 | ||||||
Smith & Nephew PLC | 1.22 | ||||||
Swatch Group AG (The) | 0.45 | ||||||
Syngenta AG | 1.35 | ||||||
Unilever N.V. | 3.96 | ||||||
Unilever PLC | 2.96 | ||||||
Valeo SA | 0.94 | ||||||
Whitbread PLC | 0.51 | ||||||
Wolseley PLC | 0.61 | ||||||
WPP PLC | 1.04 | ||||||
100.00 | % | ||||||
The following table represents the equity basket holdings underlying the total return swap with JPM Aerospace Index as of December 31, 2015.
Security Description | Index Weight | ||||||
JPM Aerospace Index | |||||||
Airbus Group SE | 14.88 | % | |||||
B/E Aerospace, Inc. | 1.38 | ||||||
Boeing Co. (The) | 34.77 | ||||||
Bombardier, Inc. | 0.53 | ||||||
KLX, Inc. | 0.50 | ||||||
Precision Castparts Corp. | 11.73 | ||||||
Rolls-Royce Holdings PLC | 4.60 | ||||||
Safran SA | 8.18 | ||||||
Textron, Inc. | 5.15 | ||||||
Thales SA | 2.91 | ||||||
TransDigm Group, Inc. | 3.77 | ||||||
United Technologies Corp. | 9.63 | ||||||
Zodiac Aerospace | 1.97 | ||||||
100.00 | % | ||||||
@ Value is less than $500.
† Credit rating as issued by Standard & Poor's.
LIBOR London Interbank Offered Rate.
STIBOR Stockholm Interbank Offered Rate.
TIIE Interbank Equilibrium Interest Rate.
AUD — Australian Dollar
CAD — Canadian Dollar
CHF — Swiss Franc
CNY — Chinese Yuan Renminbi
DKK — Danish Krone
EUR — Euro
GBP — British Pound
HKD — Hong Kong Dollar
HUF — Hungarian Forint
ILS — Israeli Shekel
INR — Indian Rupee
JPY — Japanese Yen
MXN — Mexican Peso
NZD — New Zealand Dollar
RUB — Russian Ruble
SEK — Swedish Krona
SGD — Singapore Dollar
USD — United States Dollar
ZAR — South African Rand
Portfolio Composition
Classification | Percentage of Total Investments | ||||||
Fixed Income Securities | 40.7 | % | |||||
Common Stocks | 37.8 | ||||||
Short-Term Investments | 20.8 | ||||||
Other* | 0.7 | ||||||
Total Investments | 100.0 | %** | |||||
* Industries and/or investment types representing less than 5% of total investments.
** Does not include open call options written with a value of approximately $579,000 and does not include an open put option written with a value of approximately $70,000. Does not include open long/short futures contracts with an underlying face amount of approximately $315,040,000 with net unrealized appreciation of approximately $547,000. Does not include open foreign currency forward exchange contracts with net unrealized appreciation of approximately $2,303,000 and does not include open swap agreements with net unrealized appreciation of approximately $1,196,000.
The accompanying notes are an integral part of the financial statements.
20
Morgan Stanley Institutional Fund, Inc.
Annual Report — December 31, 2015
Multi-Asset Portfolio
Statement of Assets and Liabilities | December 31, 2015 (000) | ||||||
Assets: | |||||||
Investments in Securities of Unaffiliated Issuers, at Value (Cost $266,383) | $ | 260,896 | |||||
Investment in Security of Affiliated Issuer, at Value (Cost $40,037) | 40,037 | ||||||
Total Investments in Securities, at Value (Cost $306,420) | 300,933 | ||||||
Foreign Currency, at Value (Cost $599) | 583 | ||||||
Cash | 6,938 | ||||||
Receivable for Investments Sold | 18,980 | ||||||
Receivable for Variation Margin on Futures Contracts | 11,210 | ||||||
Unrealized Appreciation on Foreign Currency Forward Exchange Contracts | 3,402 | ||||||
Unrealized Appreciation on Swap Agreements | 1,612 | ||||||
Interest Receivable | 420 | ||||||
Receivable for Portfolio Shares Sold | 371 | ||||||
Tax Reclaim Receivable | 136 | ||||||
Premium Paid on Open Swap Agreements | 124 | ||||||
Dividends Receivable | 86 | ||||||
Receivable from Affiliate | 21 | ||||||
Other Assets | 45 | ||||||
Total Assets | 344,861 | ||||||
Liabilities: | |||||||
Payable for Portfolio Shares Redeemed | 13,057 | ||||||
Due to Brokers | 3,909 | ||||||
Unrealized Depreciation on Foreign Currency Forward Exchange Contracts | 1,099 | ||||||
Payable for Advisory Fees | 768 | ||||||
Options Written, at Value (Premiums received $701) | 649 | ||||||
Unrealized Depreciation on Swap Agreements | 416 | ||||||
Payable for Swap Agreements Termination | 276 | ||||||
Payable for Custodian Fees | 115 | ||||||
Payable for Sub Transfer Agency Fees — Class I | 48 | ||||||
Payable for Sub Transfer Agency Fees — Class A | 6 | ||||||
Payable for Sub Transfer Agency Fees — Class L | 6 | ||||||
Payable for Sub Transfer Agency Fees — Class C | — | @ | |||||
Payable for Administration Fees | 26 | ||||||
Payable for Shareholder Services Fees — Class A | 7 | ||||||
Payable for Distribution and Shareholder Services Fees — Class L | 12 | ||||||
Payable for Distribution and Shareholder Services Fees — Class C | — | @ | |||||
Payable for Professional Fees | 12 | ||||||
Payable for Transfer Agency Fees — Class I | 1 | ||||||
Payable for Transfer Agency Fees — Class A | 8 | ||||||
Payable for Transfer Agency Fees — Class L | — | @ | |||||
Payable for Transfer Agency Fees — Class C | — | @ | |||||
Other Liabilities | 28 | ||||||
Total Liabilities | 20,443 | ||||||
Net Assets | $ | 324,418 | |||||
Net Assets Consist Of: | |||||||
Paid-in-Capital | $ | 401,895 | |||||
Accumulated Undistributed Net Investment Income | 438 | ||||||
Accumulated Net Realized Loss | (76,463 | ) | |||||
Unrealized Appreciation (Depreciation) on: | |||||||
Investments | (5,487 | ) | |||||
Futures Contracts | 547 | ||||||
Options Written | 52 | ||||||
Swap Agreements | 1,196 | ||||||
Foreign Currency Forward Exchange Contracts | 2,303 | ||||||
Foreign Currency Translations | (63 | ) | |||||
Net Assets | $ | 324,418 | |||||
The accompanying notes are an integral part of the financial statements.
21
Morgan Stanley Institutional Fund, Inc.
Annual Report — December 31, 2015
Multi-Asset Portfolio
Statement of Assets and Liabilities (cont'd) | December 31, 2015 (000) | ||||||
CLASS I: | |||||||
Net Assets | $ | 280,423 | |||||
| Shares Outstanding $0.001 par value shares of beneficial interest (unlimited shares authorized) (not in 000's) | 27,574,778 | ||||||
Net Asset Value, Offering and Redemption Price Per Share | $ | 10.17 | |||||
CLASS A: | |||||||
Net Assets | $ | 29,123 | |||||
| Shares Outstanding $0.001 par value shares of beneficial interest (unlimited shares authorized) (not in 000's) | 2,887,119 | ||||||
Net Asset Value, Redemption Price Per Share | $ | 10.09 | |||||
Maximum Sales Load | 5.25 | % | |||||
Maximum Sales Charge | $ | 0.56 | |||||
Maximum Offering Price Per Share | $ | 10.65 | |||||
CLASS L: | |||||||
Net Assets | $ | 14,443 | |||||
| Shares Outstanding $0.001 par value shares of beneficial interest (unlimited shares authorized) (not in 000's) | 1,452,507 | ||||||
Net Asset Value, Offering and Redemption Price Per Share | $ | 9.94 | |||||
CLASS C: | |||||||
Net Assets | $ | 420 | |||||
| Shares Outstanding $0.001 par value shares of beneficial interest (unlimited shares authorized) (not in 000's) | 42,228 | ||||||
Net Asset Value, Offering and Redemption Price Per Share | $ | 9.93 | |||||
CLASS IS: | |||||||
Net Assets | $ | 9 | |||||
| Shares Outstanding $0.001 par value shares of beneficial interest (unlimited shares authorized) (not in 000's) | 902 | ||||||
Net Asset Value, Offering and Redemption Price Per Share | $ | 10.17 | |||||
@ Amount is less than $500.
The accompanying notes are an integral part of the financial statements.
22
Morgan Stanley Institutional Fund, Inc.
Annual Report — December 31, 2015
Multi-Asset Portfolio
Statement of Operations | Year Ended December 31, 2015 (000) | ||||||
Investment Income: | |||||||
Dividends from Securities of Unaffiliated Issuers (Net of $576 of Foreign Taxes Withheld) | $ | 5,363 | |||||
Interest from Securities of Unaffiliated Issuers | 2,944 | ||||||
Dividends from Security of Affiliated Issuer (Note G) | 356 | ||||||
Total Investment Income | 8,663 | ||||||
Expenses: | |||||||
Advisory Fees (Note B) | 4,467 | ||||||
Custodian Fees (Note F) | 477 | ||||||
Administration Fees (Note C) | 420 | ||||||
Shareholder Services Fees — Class A (Note D) | 116 | ||||||
Distribution and Shareholder Services Fees — Class L (Note D) | 228 | ||||||
Distribution and Shareholder Services Fees — Class C (Note D) | 3 | ||||||
Sub Transfer Agency Fees — Class I | 228 | ||||||
Sub Transfer Agency Fees — Class A | 17 | ||||||
Sub Transfer Agency Fees — Class L | 25 | ||||||
Sub Transfer Agency Fees — Class C | — | @ | |||||
Professional Fees | 134 | ||||||
Registration Fees | 77 | ||||||
Pricing Fees | 58 | ||||||
Transfer Agency Fees — Class I (Note E) | 4 | ||||||
Transfer Agency Fees — Class A (Note E) | 45 | ||||||
Transfer Agency Fees — Class L (Note E) | 2 | ||||||
Transfer Agency Fees — Class C (Note E) | 1 | ||||||
Transfer Agency Fees — Class IS (Note E) | 1 | ||||||
Shareholder Reporting Fees | 46 | ||||||
Directors' Fees and Expenses | 14 | ||||||
Other Expenses | 32 | ||||||
Total Expenses | 6,395 | ||||||
Rebate from Morgan Stanley Affiliate (Note G) | (216 | ) | |||||
Waiver of Advisory Fees (Note B) | (151 | ) | |||||
Reimbursement of Class Specific Expenses — Class I (Note B) | (94 | ) | |||||
Reimbursement of Class Specific Expenses — Class A (Note B) | (16 | ) | |||||
Reimbursement of Class Specific Expenses — Class L (Note B) | (2 | ) | |||||
Reimbursement of Class Specific Expenses — Class C (Note B) | (1 | ) | |||||
Reimbursement of Class Specific Expenses — Class IS (Note B) | (1 | ) | |||||
Net Expenses | 5,914 | ||||||
Net Investment Income | 2,749 | ||||||
Realized Gain (Loss): | |||||||
Investments Sold | (38,846 | ) | |||||
Foreign Currency Forward Exchange Contracts | 14,862 | ||||||
Foreign Currency Transactions | (816 | ) | |||||
Futures Contracts | (12,848 | ) | |||||
Swap Agreements | (16,676 | ) | |||||
Net Realized Loss | (54,324 | ) | |||||
Change in Unrealized Appreciation (Depreciation): | |||||||
Investments | (6,316 | ) | |||||
Foreign Currency Forward Exchange Contracts | 501 | ||||||
Foreign Currency Translations | 12 | ||||||
Futures Contracts | 1,127 | ||||||
Swap Agreements | (2,413 | ) | |||||
Options Written | 52 | ||||||
Net Change in Unrealized Appreciation (Depreciation) | (7,037 | ) | |||||
Net Realized Loss and Change in Unrealized Appreciation (Depreciation) | (61,361 | ) | |||||
Net Decrease in Net Assets Resulting from Operations | $ | (58,612 | ) | ||||
@ Amount is less than $500.
The accompanying notes are an integral part of the financial statements.
23
Morgan Stanley Institutional Fund, Inc.
Annual Report — December 31, 2015
Multi-Asset Portfolio
Statements of Changes in Net Assets | Year Ended December 31, 2015 (000) | Year Ended December 31, 2014 (000) | |||||||||
Increase (Decrease) in Net Assets: | |||||||||||
Operations: | |||||||||||
Net Investment Income (Loss) | $ | 2,749 | $ | (887 | ) | ||||||
Net Realized Loss | (54,324 | ) | (4,348 | ) | |||||||
Net Change in Unrealized Appreciation (Depreciation) | (7,037 | ) | 2,506 | ||||||||
Net Decrease in Net Assets Resulting from Operations | (58,612 | ) | (2,729 | ) | |||||||
Distributions from and/or in Excess of: | |||||||||||
Class I: | |||||||||||
Net Investment Income | (6,910 | ) | (8,445 | ) | |||||||
Net Realized Gain | — | (180 | ) | ||||||||
Class A: | |||||||||||
Net Investment Income | (710 | ) | (857 | ) | |||||||
Net Realized Gain | — | (21 | ) | ||||||||
Class L: | |||||||||||
Net Investment Income | (453 | ) | (498 | ) | |||||||
Net Realized Gain | — | (16 | ) | ||||||||
Class C: | |||||||||||
Net Investment Income | (3 | ) | — | ||||||||
Class IS: | |||||||||||
Net Investment Income | (— | @) | — | ||||||||
Total Distributions | (8,076 | ) | (10,017 | ) | |||||||
Capital Share Transactions:(1) | |||||||||||
Class I: | |||||||||||
Subscribed | 132,370 | 497,148 | |||||||||
Distributions Reinvested | 6,894 | 8,613 | |||||||||
Redeemed | (297,687 | ) | (107,022 | ) | |||||||
Class A: | |||||||||||
Subscribed | 9,732 | 57,577 | |||||||||
Distributions Reinvested | 618 | 773 | |||||||||
Redeemed | (29,951 | ) | (16,062 | ) | |||||||
Class L: | |||||||||||
Subscribed | 4,714 | 39,846 | |||||||||
Distributions Reinvested | 453 | 515 | |||||||||
Redeemed | (27,947 | ) | (7,612 | ) | |||||||
Class C: | |||||||||||
Subscribed | 588 | * | — | ||||||||
Distributions Reinvested | 3 | * | — | ||||||||
Redeemed | (134 | )* | — | ||||||||
Class IS: | |||||||||||
Subscribed | 10 | ** | — | ||||||||
Net Increase (Decrease) in Net Assets Resulting from Capital Share Transactions | (200,337 | ) | 473,776 | ||||||||
Total Increase (Decrease) in Net Assets | (267,025 | ) | 461,030 | ||||||||
Net Assets: | |||||||||||
Beginning of Period | 591,443 | 130,413 | |||||||||
| End of Period (Including Accumulated Undistributed Net Investment Income of $438 and $2,825) | $ | 324,418 | $ | 591,443 | |||||||
The accompanying notes are an integral part of the financial statements.
24
Morgan Stanley Institutional Fund, Inc.
Annual Report — December 31, 2015
Multi-Asset Portfolio
Statements of Changes in Net Assets (cont'd) | Year Ended December 31, 2015 (000) | Year Ended December 31, 2014 (000) | |||||||||
(1) Capital Share Transactions: | |||||||||||
Class I: | |||||||||||
Shares Subscribed | 11,881 | 42,063 | |||||||||
Shares Issued on Distributions Reinvested | 645 | 744 | |||||||||
Shares Redeemed | (27,835 | ) | (9,127 | ) | |||||||
Net Increase (Decrease) in Class I Shares Outstanding | (15,309 | ) | 33,680 | ||||||||
Class A: | |||||||||||
Shares Subscribed | 875 | 4,919 | |||||||||
Shares Issued on Distributions Reinvested | 58 | 67 | |||||||||
Shares Redeemed | (2,810 | ) | (1,378 | ) | |||||||
Net Increase (Decrease) in Class A Shares Outstanding | (1,877 | ) | 3,608 | ||||||||
Class L: | |||||||||||
Shares Subscribed | 422 | 3,417 | |||||||||
Shares Issued on Distributions Reinvested | 43 | 45 | |||||||||
Shares Redeemed | (2,635 | ) | (665 | ) | |||||||
Net Increase (Decrease) in Class L Shares Outstanding | (2,170 | ) | 2,797 | ||||||||
Class C: | |||||||||||
Shares Subscribed | 56 | * | — | ||||||||
Shares Issued on Distributions Reinvested | — | @@* | — | ||||||||
Shares Redeemed | (14 | )* | — | ||||||||
Net Increase in Class C Shares Outstanding | 42 | — | |||||||||
Class IS: | |||||||||||
Shares Subscribed | 1 | ** | — | ||||||||
* For the period April 30, 2015 through December 31, 2015.
** For the period May 29, 2015 through December 31, 2015.
@ Amount is less than $500.
@@ Amount is less than 500 shares.
The accompanying notes are an integral part of the financial statements.
25
Morgan Stanley Institutional Fund, Inc.
Annual Report — December 31, 2015
Financial Highlights
Multi-Asset Portfolio
Class I | |||||||||||||||||||
Year Ended December 31, | Period from June 22, 2012^ to | ||||||||||||||||||
Selected Per Share Data and Ratios | 2015 | 2014 | 2013 | December 31, 2012 | |||||||||||||||
Net Asset Value, Beginning of Period | $ | 11.55 | $ | 11.68 | $ | 10.30 | $ | 10.00 | |||||||||||
Income (Loss) from Investment Operations: | |||||||||||||||||||
Net Investment Income (Loss)† | 0.07 | (0.02 | ) | 0.03 | (0.02 | ) | |||||||||||||
Net Realized and Unrealized Gain (Loss) | (1.29 | ) | 0.11 | 1.84 | 0.47 | ||||||||||||||
Total from Investment Operations | (1.22 | ) | 0.09 | 1.87 | 0.45 | ||||||||||||||
Distributions from and/or in Excess of: | |||||||||||||||||||
Net Investment Income | (0.16 | ) | (0.22 | ) | — | — | |||||||||||||
Net Realized Gain | — | (0.00 | )‡ | (0.49 | ) | (0.15 | ) | ||||||||||||
Total Distributions | (0.16 | ) | (0.22 | ) | (0.49 | ) | (0.15 | ) | |||||||||||
Net Asset Value, End of Period | $ | 10.17 | $ | 11.55 | $ | 11.68 | $ | 10.30 | |||||||||||
Total Return++ | (10.60 | )% | 0.77 | % | 18.24 | % | 4.53 | %# | |||||||||||
Ratios and Supplemental Data: | |||||||||||||||||||
Net Assets, End of Period (Thousands) | $ | 280,423 | $ | 495,419 | $ | 107,463 | $ | 20,496 | |||||||||||
Ratio of Expenses to Average Net Assets (1) | 1.05 | %+ | 1.01 | %+ | 1.03 | %+ | 1.01 | %+* | |||||||||||
Ratio of Net Investment Income (Loss) to Average Net Assets (1) | 0.60 | %+ | (0.14 | )%+ | 0.25 | %+ | (0.30 | )%+* | |||||||||||
Ratio of Rebate from Morgan Stanley Affiliates to Average Net Assets | 0.04 | % | 0.09 | % | 0.07 | % | 0.09 | %* | |||||||||||
Portfolio Turnover Rate | 355 | % | 264 | % | 223 | % | 167 | %# | |||||||||||
(1) Supplemental Information on the Ratios to Average Net Assets: | |||||||||||||||||||
Ratios Before Expense Limitation: | |||||||||||||||||||
Expenses to Average Net Assets | 1.14 | % | 1.21 | % | 1.97 | % | 2.41 | %* | |||||||||||
Net Investment Income (Loss) to Average Net Assets | 0.51 | % | (0.34 | )% | (0.69 | )% | (1.70 | )%* | |||||||||||
^ Commencement of Operations.
† Per share amount is based on average shares outstanding.
‡ Amount is less than $0.005 per share.
++ Calculated based on the net asset value as of the last business day of the period.
+ The Ratios of Expenses and Net Investment Income (Loss) reflect the rebate of certain Portfolio expenses in connection with the investments in Morgan Stanley affiliates during the period. The effect of the rebate on the ratios is disclosed in the above table as "Ratio of Rebate from Morgan Stanley Affiliates to Average Net Assets."
# Not Annualized.
* Annualized.
The accompanying notes are an integral part of the financial statements.
26
Morgan Stanley Institutional Fund, Inc.
Annual Report — December 31, 2015
Financial Highlights
Multi-Asset Portfolio
Class A | |||||||||||||||||||
Year Ended December 31, | Period from June 22, 2012^ to | ||||||||||||||||||
Selected Per Share Data and Ratios | 2015 | 2014 | 2013 | December 31, 2012 | |||||||||||||||
Net Asset Value, Beginning of Period | $ | 11.50 | $ | 11.63 | $ | 10.29 | $ | 10.00 | |||||||||||
Income (Loss) from Investment Operations: | |||||||||||||||||||
Net Investment Income (Loss)† | 0.03 | (0.05 | ) | 0.01 | (0.03 | ) | |||||||||||||
Net Realized and Unrealized Gain (Loss) | (1.28 | ) | 0.11 | 1.82 | 0.47 | ||||||||||||||
Total from Investment Operations | (1.25 | ) | 0.06 | 1.83 | 0.44 | ||||||||||||||
Distributions from and/or in Excess of: | |||||||||||||||||||
Net Investment Income | (0.16 | ) | (0.19 | ) | — | — | |||||||||||||
Net Realized Gain | — | (0.00 | )‡ | (0.49 | ) | (0.15 | ) | ||||||||||||
Total Distributions | (0.16 | ) | (0.19 | ) | (0.49 | ) | (0.15 | ) | |||||||||||
Net Asset Value, End of Period | $ | 10.09 | $ | 11.50 | $ | 11.63 | $ | 10.29 | |||||||||||
Total Return++ | (11.00 | )% | 0.55 | % | 17.86 | % | 4.43 | %# | |||||||||||
Ratios and Supplemental Data: | |||||||||||||||||||
Net Assets, End of Period (Thousands) | $ | 29,123 | $ | 54,771 | $ | 13,437 | $ | 103 | |||||||||||
Ratio of Expenses to Average Net Assets (1) | 1.37 | %+ | 1.30 | %+ | 1.30 | %+^^ | 1.26 | %+* | |||||||||||
Ratio of Net Investment Income (Loss) to Average Net Assets (1) | 0.27 | %+ | (0.43 | )%+ | 0.07 | %+ | (0.55 | )%+* | |||||||||||
Ratio of Rebate from Morgan Stanley Affiliates to Average Net Assets | 0.04 | % | 0.09 | % | 0.07 | % | 0.09 | %* | |||||||||||
Portfolio Turnover Rate | 355 | % | 264 | % | 223 | % | 167 | %# | |||||||||||
(1) Supplemental Information on the Ratios to Average Net Assets: | |||||||||||||||||||
Ratios Before Expense Limitation: | |||||||||||||||||||
Expenses to Average Net Assets | 1.47 | % | 1.46 | % | 2.24 | % | 2.66 | %* | |||||||||||
Net Investment Income (Loss) to Average Net Assets | 0.17 | % | (0.59 | )% | (0.87 | )% | (1.95 | )%* | |||||||||||
^ Commencement of Operations.
† Per share amount is based on average shares outstanding.
‡ Amount is less than $0.005 per share.
++ Calculated based on the net asset value which does not reflect sales charges, if applicable, as of the last business day of the period.
+ The Ratios of Expenses and Net Investment Income (Loss) reflect the rebate of certain Portfolio expenses in connection with the investments in Morgan Stanley affiliates during the period. The effect of the rebate on the ratios is disclosed in the above table as "Ratio of Rebate from Morgan Stanley Affiliates to Average Net Assets."
^^ Effective September 16, 2013, the Adviser has agreed to limit the ratio of expenses to average net assets to the maximum ratio of 1.45% for Class A shares. Prior to September 16, 2013, the maximum ratio was 1.35% for Class A shares.
# Not Annualized.
* Annualized.
The accompanying notes are an integral part of the financial statements.
27
Morgan Stanley Institutional Fund, Inc.
Annual Report — December 31, 2015
Financial Highlights
Multi-Asset Portfolio
Class L | |||||||||||||||||||
Year Ended December 31, | Period from June 22, 2012^ to | ||||||||||||||||||
Selected Per Share Data and Ratios | 2015 | 2014 | 2013 | December 31, 2012 | |||||||||||||||
Net Asset Value, Beginning of Period | $ | 11.39 | $ | 11.53 | $ | 10.26 | $ | 10.00 | |||||||||||
Income (Loss) from Investment Operations: | |||||||||||||||||||
Net Investment Loss† | (0.02 | ) | (0.10 | ) | (0.05 | ) | (0.06 | ) | |||||||||||
Net Realized and Unrealized Gain (Loss) | (1.27 | ) | 0.10 | 1.81 | 0.47 | ||||||||||||||
Total from Investment Operations | (1.29 | ) | (0.00 | )‡ | 1.76 | 0.41 | |||||||||||||
Distributions from and/or in Excess of: | |||||||||||||||||||
Net Investment Income | (0.16 | ) | (0.14 | ) | — | — | |||||||||||||
Net Realized Gain | — | (0.00 | )‡ | (0.49 | ) | (0.15 | ) | ||||||||||||
Total Distributions | (0.16 | ) | (0.14 | ) | (0.49 | ) | (0.15 | ) | |||||||||||
Net Asset Value, End of Period | $ | 9.94 | $ | 11.39 | $ | 11.53 | $ | 10.26 | |||||||||||
Total Return++ | (11.37 | )% | 0.02 | % | 17.23 | % | 4.13 | %# | |||||||||||
Ratios and Supplemental Data: | |||||||||||||||||||
Net Assets, End of Period (Thousands) | $ | 14,443 | $ | 41,253 | $ | 9,513 | $ | 337 | |||||||||||
Ratio of Expenses to Average Net Assets (1) | 1.85 | %+ | 1.77 | %+ | 1.79 | %+^^ | 1.76 | %+* | |||||||||||
Ratio of Net Investment Loss to Average Net Assets (1) | (0.18 | )%+ | (0.90 | )%+ | (0.46 | )%+ | (1.05 | )%+* | |||||||||||
Ratio of Rebate from Morgan Stanley Affiliates to Average Net Assets | 0.04 | % | 0.09 | % | 0.07 | % | 0.09 | %* | |||||||||||
Portfolio Turnover Rate | 355 | % | 264 | % | 223 | % | 167 | %# | |||||||||||
(1) Supplemental Information on the Ratios to Average Net Assets: | |||||||||||||||||||
Ratios Before Expense Limitation: | |||||||||||||||||||
Expenses to Average Net Assets | 1.92 | % | 1.93 | % | 2.73 | % | 3.16 | %* | |||||||||||
Net Investment Loss to Average Net Assets | (0.25 | )% | (1.06 | )% | (1.40 | )% | (2.45 | )%* | |||||||||||
^ Commencement of Operations.
† Per share amount is based on average shares outstanding.
‡ Amount is less than $0.005 per share.
++ Calculated based on the net asset value as of the last business day of the period.
+ The Ratios of Expenses and Net Investment Loss reflect the rebate of certain Portfolio expenses in connection with the investments in Morgan Stanley affiliates during the period. The effect of the rebate on the ratios is disclosed in the above table as "Ratio of Rebate from Morgan Stanley Affiliates to Average Net Assets."
^^ Effective September 16, 2013, the Adviser has agreed to limit the ratio of expenses to average net assets to the maximum ratio of 1.95% for Class L shares. Prior to September 16, 2013, the maximum ratio was 1.85% for Class L shares.
# Not Annualized.
* Annualized.
The accompanying notes are an integral part of the financial statements.
28
Morgan Stanley Institutional Fund, Inc.
Annual Report — December 31, 2015
Financial Highlights
Multi-Asset Portfolio
Class C | |||||||
Selected Per Share Data and Ratios | Period from April 30, 2015^ to December 31, 2015 | ||||||
Net Asset Value, Beginning of Period | $ | 11.09 | |||||
Loss from Investment Operations: | |||||||
Net Investment Loss† | (0.07 | ) | |||||
Net Realized and Unrealized Loss | (0.93 | ) | |||||
Total from Investment Operations | (1.00 | ) | |||||
Distributions from and/or in Excess of: | |||||||
Net Investment Income | (0.16 | ) | |||||
Net Asset Value, End of Period | $ | 9.93 | |||||
Total Return++ | (9.07 | )%# | |||||
Ratios and Supplemental Data: | |||||||
Net Assets, End of Period (Thousands) | $ | 420 | |||||
Ratios of Expenses to Average Net Assets (1) | 2.17 | %+* | |||||
Ratio of Net Investment Loss to Average Net Assets (1) | (1.07 | )%+* | |||||
Ratio of Rebate from Morgan Stanley Affiliates to Average Net Assets | 0.03 | %* | |||||
Portfolio Turnover Rate | 355 | % | |||||
(1) Supplemental Information on the Ratios to Average Net Assets: | |||||||
Ratios Before Expense Limitation: | |||||||
Expense to Average Net Assets | 2.59 | %* | |||||
Net Investment Loss to Average Net Assets | (1.49 | )%* | |||||
^ Commencement of Offering.
† Per share amount is based on average shares outstanding.
++ Calculated based on the net asset value which does not reflect sales charges, if applicable, as of the last business day of the period.
+ The Ratios of Expenses and Net Investment Loss reflect the rebate of certain Portfolio expenses in connection with the investments in Morgan Stanley affiliates during the period. The effect of the rebate on the ratios is disclosed in the above table as "Ratio of Rebate from Morgan Stanley Affiliates to Average Net Assets."
# Not Annualized.
* Annualized.
The accompanying notes are an integral part of the financial statements.
29
Morgan Stanley Institutional Fund, Inc.
Annual Report — December 31, 2015
Financial Highlights
Multi-Asset Portfolio
Class IS | |||||||
Selected Per Share Data and Ratios | Period from May 29, 2015^ to December 31, 2015 | ||||||
Net Asset Value, Beginning of Period | $ | 11.09 | |||||
Income (Loss) from Investment Operations: | |||||||
Net Investment Income† | 0.01 | ||||||
Net Realized and Unrealized Loss | (0.77 | ) | |||||
Total from Investment Operations | (0.76 | ) | |||||
Distributions from and/or in Excess of: | |||||||
Net Investment Income | (0.16 | ) | |||||
Net Asset Value, End of Period | $ | 10.17 | |||||
Total Return++ | (6.89 | )%# | |||||
Ratios and Supplemental Data: | |||||||
Net Assets, End of Period (Thousands) | $ | 9 | |||||
Ratio of Expenses to Average Net Assets (1) | 1.04 | %+* | |||||
Ratio of Net Investment Income to Average Net Assets (1) | 0.23 | %+* | |||||
Ratio of Rebate from Morgan Stanley Affiliates to Average Net Assets | 0.03 | %* | |||||
Portfolio Turnover Rate | 355 | % | |||||
(1) Supplemental Information on the Ratios to Average Net Assets: | |||||||
Ratios Before Expense Limitation: | |||||||
Expenses to Average Net Assets | 17.31 | %* | |||||
Net Investment Loss to Average Net Assets | (16.04 | )%* | |||||
^ Commencement of Offering.
† Per share amount is based on average shares outstanding.
++ Calculated based on the net asset value as of the last business day of the period.
+ The Ratios of Expenses and Net Investment Income reflect the rebate of certain Portfolio expenses in connection with the investments in Morgan Stanley affiliates during the period. The effect of the rebate on the ratios is disclosed in the above table as "Ratio of Rebate from Morgan Stanley Affiliates to Average Net Assets."
# Not Annualized.
* Annualized.
The accompanying notes are an integral part of the financial statements.
30
Morgan Stanley Institutional Fund, Inc.
Annual Report — December 31, 2015
Notes to Financial Statements
Morgan Stanley Institutional Fund, Inc. (the "Fund") is registered under the Investment Company Act of 1940, as amended (the "Act"), as an open-end management investment company. The Fund is comprised of twenty-six separate, active, diversified and non-diversified portfolios (individually referred to as a "Portfolio", collectively as the "Portfolios"). The Fund applies investment company accounting and reporting guidance.
The accompanying financial statements relate to the Multi-Asset Portfolio. The Portfolio seeks total return. The Portfolio's ("Adviser"), Morgan Stanley Investment Management Inc., seeks to achieve this objective with an emphasis on positive absolute return and controlling downside portfolio risk.
The Portfolio offers five classes of shares — Class I, Class A, Class L, Class C and Class IS shares. On April, 30, 2015, the Portfolio commenced offering Class C shares and suspended offering of Class L shares. Existing Class L shareholders may invest through reinvestment of dividends and distributions. On May 29, 2015, the Portfolio commenced offering Class IS shares.
A. Significant Accounting Policies: The following significant accounting policies are in conformity with U.S. generally accepted accounting principles ("GAAP"). Such policies are consistently followed by the Fund in the preparation of its financial statements. GAAP may require management to make estimates and assumptions that affect the reported amounts and disclosures in the financial statements. Actual results may differ from those estimates.
1. Security Valuation: (1) Certain portfolio securities may be valued by an outside pricing service approved by the Fund's Board of Directors (the "Directors"). The pricing service may utilize a matrix system or other model incorporating attributes such as security quality, maturity and coupon as the evaluation model parameters, and/or research evaluations by its staff, including review of broker-dealer market price quotations in determining what it believes is the fair valuation of the portfolios securities valued by such pricing service; (2) an equity portfolio security listed or traded on an exchange is valued at its latest reported sales price (or at the exchange official closing price if such exchange reports an official closing price), if there were no sales on a given day, the security is valued at the mean between the last reported bid and asked prices; (3) all other equity portfolio securities for which over-the-counter ("OTC") market quotations are readily available are valued at its latest reported sales price. In cases where a
security is traded on more than one exchange, the security is valued on the exchange designated as the primary market; (4) futures are valued at the latest price published by the commodities exchange on which they trade; (5) swaps are marked-to-market daily based upon quotations from market makers; (6) listed options are valued at the last reported sales price on the exchange on which they are listed (or at the exchange official closing price if such exchange reports an official closing price). If an official closing price or last reported sales price is unavailable, the listed option should be fair valued at the mean between their latest bid and asked price. Unlisted options are valued by an outside pricing service approved by the Directors or quotes from a broker or dealer; (7) when market quotations are not readily available, including circumstances under which the Adviser determines that the closing price, last sale price or the mean between the last reported bid and asked prices are not reflective of a security's market value, portfolio securities are valued at their fair value as determined in good faith under procedures established by and under the general supervision of the Directors. Occasionally, developments affecting the closing prices of securities and other assets may occur between the times at which valuations of such securities are determined (that is, close of the foreign market on which the securities trade) and the close of business of the New York Stock Exchange ("NYSE"). If developments occur during such periods that are expected to materially affect the value of such securities, such valuations may be adjusted to reflect the estimated fair value of such securities as of the close of the NYSE, as determined in good faith by the Directors or by the Adviser using a pricing service and/or procedures approved by the Directors; (8) quotations of foreign portfolio securities, other assets and liabilities and forward contracts stated in foreign currency are translated into U.S. dollar equivalents at the prevailing market rates prior to the close of the NYSE; (9) investments in mutual funds, including the Morgan Stanley Institutional Liquidity Funds, are valued at the net asset value ("NAV") as of the close of each business day; and (10) short-term taxable debt securities with remaining maturities of 60 days or less at the time of purchase may be valued at amortized cost, unless the Adviser determines such price does not reflect the securities' market value, in which case these securities will be valued at their fair market value determined by the Adviser. Other taxable short-term debt securities with maturities of more than 60 days
31
Morgan Stanley Institutional Fund, Inc.
Annual Report — December 31, 2015
Notes to Financial Statements (cont'd)
will be valued on a mark-to-market basis until such time as they reach a maturity of 60 days, whereupon they will be valued at amortized cost using their value on the 61st day unless the Adviser determines such price does not reflect the securities' fair value, in which case these securities will be valued at their fair market value as determined by the Adviser.
The Directors have responsibility for determining in good faith the fair value of the investments, and the Directors may appoint others, such as the Fund's Adviser or a valuation committee, to assist the Directors in determining fair value and to make the actual calculations pursuant to the fair valuation methodologies previously approved by the Directors. Under procedures approved by the Directors, the Fund's Adviser has formed a Valuation Committee whose members are approved by the Directors. The Valuation Committee provides administration and oversight of the Fund's valuation policies and procedures, which are reviewed at least annually by the Directors. These procedures allow the Fund to utilize independent pricing services, quotations from securities and financial instrument dealers, and other market sources to determine fair value.
The Fund has procedures to determine the fair value of securities and other financial instruments for which market prices are not readily available. Under these procedures, the Valuation Committee convenes on a regular and ad hoc basis to review such securities and considers a number of factors, including valuation methodologies and significant unobservable valuation inputs, when arriving at fair value. The Valuation Committee may employ a market-based approach which may use related or comparable assets or liabilities, recent transactions, market multiples, book values, and other relevant information for the investment to determine the fair value of the investment. An income-based valuation approach may also be used in which the anticipated future cash flows of the investment are discounted to calculate fair value. Discounts may also be applied due to the nature or duration of any restrictions on the disposition of the investments. Due to the inherent uncertainty of valuations of such investments, the fair values may differ significantly from the values that would have been used had an active market existed. The Valuation Committee employs various methods for calibrating these valuation approaches including a regular review of
valuation methodologies, key inputs and assumptions, transactional back-testing or disposition analysis, and reviews of any related market activity.
2. Fair Value Measurement: Financial Accounting Standards Board ("FASB") Accounting Standards CodificationTM ("ASC") 820, "Fair Value Measurement" ("ASC 820"), defines fair value as the value that the Fund would receive to sell an investment or pay to transfer a liability in a timely transaction with an independent buyer in the principal market, or in the absence of a principal market the most advantageous market for the investment or liability. ASC 820 establishes a three-tier hierarchy to distinguish between (1) inputs that reflect the assumptions market participants would use in valuing an asset or liability developed based on market data obtained from sources independent of the reporting entity (observable inputs) and (2) inputs that reflect the reporting entity's own assumptions about the assumptions market participants would use in valuing an asset or liability developed based on the best information available in the circumstances (unobservable inputs) and to establish classification of fair value measurements for disclosure purposes. Various inputs are used in determining the value of the Fund's investments. The inputs are summarized in the three broad levels listed below.
• Level 1 – unadjusted quoted prices in active markets for identical investments
• Level 2 – other significant observable inputs (including quoted prices for similar investments, interest rates, prepayment speeds, credit risk, etc.)
• Level 3 – significant unobservable inputs including the Fund's own assumptions in determining the fair value of investments. Factors considered in making this determination may include, but are not limited to, information obtained by contacting the issuer, analysts, or the appropriate stock exchange (for exchange-traded securities), analysis of the issuer's financial statements or other available documents and, if necessary, available information concerning other securities in similar circumstances
32
Morgan Stanley Institutional Fund, Inc.
Annual Report — December 31, 2015
Notes to Financial Statements (cont'd)
The inputs or methodology used for valuing securities are not necessarily an indication of the risk associated with investing in those securities and the determination of the significance of a particular input to the fair value measurement in its entirety requires judgment and considers factors specific to each security.
The following is a summary of the inputs used to value the Portfolio's investments as of December 31, 2015.
Investment Type | Level 1 Unadjusted quoted prices (000) | Level 2 Other significant observable inputs (000) | Level 3 Significant unobservable inputs (000) | Total (000) | |||||||||||||||
Assets: | |||||||||||||||||||
Common Stocks | |||||||||||||||||||
Aerospace & Defense | $ | — | $ | 1,149 | $ | — | $ | 1,149 | |||||||||||
Air Freight & Logistics | — | 789 | — | 789 | |||||||||||||||
Airlines | — | 1,347 | — | 1,347 | |||||||||||||||
Auto Components | — | 131 | — | 131 | |||||||||||||||
Automobiles | — | 8,413 | — | 8,413 | |||||||||||||||
Banks | 1 | 10,394 | — | 10,395 | |||||||||||||||
Beverages | 1,165 | 2,881 | — | 4,046 | |||||||||||||||
Biotechnology | 1,977 | 23 | — | 2,000 | |||||||||||||||
Building Products | — | 1,919 | — | 1,919 | |||||||||||||||
Capital Markets | — | 2,344 | — | 2,344 | |||||||||||||||
Chemicals | — | 3,396 | — | 3,396 | |||||||||||||||
| Commercial Services & Supplies | — | 70 | — | 70 | |||||||||||||||
| Communications Equipment | 15 | 717 | — | 732 | |||||||||||||||
| Construction & Engineering | — | 3,553 | — | 3,553 | |||||||||||||||
Construction Materials | — | 1,083 | — | 1,083 | |||||||||||||||
Consumer Finance | — | 22 | — | 22 | |||||||||||||||
Containers & Packaging | — | 33 | — | 33 | |||||||||||||||
| Diversified Financial Services | — | 1,410 | — | 1,410 | |||||||||||||||
| Diversified Telecommunication Services | 1,246 | 3,958 | — | 5,204 | |||||||||||||||
Electric Utilities | 819 | 2,026 | — | 2,845 | |||||||||||||||
Electrical Equipment | — | 1,007 | — | 1,007 | |||||||||||||||
| Electronic Equipment, Instruments & Components | — | 208 | — | 208 | |||||||||||||||
| Energy Equipment & Services | — | 4 | — | 4 | |||||||||||||||
Food & Staples Retailing | 1,167 | 518 | — | 1,685 | |||||||||||||||
Food Products | 832 | 1,251 | — | 2,083 | |||||||||||||||
Gas Utilities | 19 | 15 | — | 34 | |||||||||||||||
| Health Care Equipment & Supplies | 1,091 | 692 | — | 1,783 | |||||||||||||||
| Health Care Providers & Services | 1,461 | 115 | — | 1,576 | |||||||||||||||
Health Care Technology | 51 | — | — | 51 | |||||||||||||||
| Hotels, Restaurants & Leisure | — | 1,109 | — | 1,109 | |||||||||||||||
Investment Type | Level 1 Unadjusted quoted prices (000) | Level 2 Other significant observable inputs (000) | Level 3 Significant unobservable inputs (000) | Total (000) | |||||||||||||||
Common Stocks (cont'd) | |||||||||||||||||||
Household Durables | $ | — | $ | 84 | $ | — | $ | 84 | |||||||||||
Household Products | 921 | 116 | — | 1,037 | |||||||||||||||
| Independent Power Producers & Energy Traders | 27 | — | — | 27 | |||||||||||||||
Industrial Conglomerates | — | 2,988 | — | 2,988 | |||||||||||||||
| Information Technology Services | — | 2,391 | — | 2,391 | |||||||||||||||
Insurance | — | 5,971 | — | 5,971 | |||||||||||||||
| Internet Software & Services | — | 2 | — | 2 | |||||||||||||||
Leisure Products | — | 27 | — | 27 | |||||||||||||||
| Life Sciences Tools & Services | 362 | — | — | 362 | |||||||||||||||
Machinery | — | 299 | — | 299 | |||||||||||||||
Marine | — | 45 | — | 45 | |||||||||||||||
Media | 4 | 1,729 | — | 1,733 | |||||||||||||||
Metals & Mining | 4,664 | 1,005 | — | 5,669 | |||||||||||||||
Multi-Utilities | 545 | 1,646 | — | 2,191 | |||||||||||||||
Multi-line Retail | — | 86 | — | 86 | |||||||||||||||
| Oil, Gas & Consumable Fuels | — | 4,747 | — | 4,747 | |||||||||||||||
Personal Products | 51 | 3,255 | — | 3,306 | |||||||||||||||
Pharmaceuticals | 2,992 | 6,470 | — | 9,462 | |||||||||||||||
Professional Services | — | 2,695 | — | 2,695 | |||||||||||||||
| Real Estate Investment Trusts (REITs) | — | 597 | — | 597 | |||||||||||||||
| Real Estate Management & Development | — | 151 | — | 151 | |||||||||||||||
Road & Rail | — | 114 | — | 114 | |||||||||||||||
| Semiconductors & Semiconductor Equipment | — | 1,056 | 5 | 1,061 | |||||||||||||||
Software | — | 2,157 | — | 2,157 | |||||||||||||||
Specialty Retail | — | 1,319 | — | 1,319 | |||||||||||||||
| Tech Hardware, Storage & Peripherals | — | 91 | — | 91 | |||||||||||||||
| Textiles, Apparel & Luxury Goods | — | 1,304 | — | 1,304 | |||||||||||||||
Tobacco | 796 | 219 | — | 1,015 | |||||||||||||||
| Trading Companies & Distributors | — | 424 | — | 424 | |||||||||||||||
| Transportation Infrastructure | — | 1,615 | — | 1,615 | |||||||||||||||
| Wireless Telecommunication Services | — | 342 | — | 342 | |||||||||||||||
Total Common Stocks | 20,206 | 93,522 | 5 | 113,733 | |||||||||||||||
Investment Company | 62 | — | — | 62 | |||||||||||||||
Rights | — | 1 | † | — | 1 | † | |||||||||||||
Fixed Income Securities | |||||||||||||||||||
Sovereign | — | 5,194 | — | 5,194 | |||||||||||||||
U.S. Treasury Security | — | 117,324 | — | 117,324 | |||||||||||||||
| Total Fixed Income Securities | — | 122,518 | — | 122,518 | |||||||||||||||
33
Morgan Stanley Institutional Fund, Inc.
Annual Report — December 31, 2015
Notes to Financial Statements (cont'd)
Investment Type | Level 1 Unadjusted quoted prices (000) | Level 2 Other significant observable inputs (000) | Level 3 Significant unobservable inputs (000) | Total (000) | |||||||||||||||
Call Options Purchased | $ | — | $ | 1,538 | $ | — | $ | 1,538 | |||||||||||
Put Option Purchased | — | 527 | — | 527 | |||||||||||||||
Short-Term Investments | |||||||||||||||||||
Investment Company | 40,037 | — | — | 40,037 | |||||||||||||||
U.S. Treasury Security | — | 22,517 | — | 22,517 | |||||||||||||||
| Total Short-Term Investments | 40,037 | 22,517 | — | 62,554 | |||||||||||||||
| Foreign Currency Forward Exchange Contracts | — | 3,402 | — | 3,402 | |||||||||||||||
Futures Contracts | 1,581 | — | — | 1,581 | |||||||||||||||
| Interest Rate Swap Agreements | — | 853 | — | 853 | |||||||||||||||
| Total Return Swap Agreements | — | 759 | — | 759 | |||||||||||||||
Total Assets | 61,886 | 245,637 | † | 5 | 307,528 | † | |||||||||||||
Liabilities: | |||||||||||||||||||
Call Options Written | — | (579 | ) | — | (579 | ) | |||||||||||||
Put Option Written | — | (70 | ) | — | (70 | ) | |||||||||||||
| Foreign Currency Forward Exchange Contracts | — | (1,099 | ) | — | (1,099 | ) | |||||||||||||
Futures Contracts | (1,034 | ) | — | — | (1,034 | ) | |||||||||||||
| Credit Default Swap Agreement | — | (84 | ) | — | (84 | ) | |||||||||||||
| Interest Rate Swap Agreements | — | (258 | ) | — | (258 | ) | |||||||||||||
| Total Return Swap Agreements | — | (74 | ) | — | (74 | ) | |||||||||||||
Total Liabilities | (1,034 | ) | (2,164 | ) | — | (3,198 | ) | ||||||||||||
Total | $ | 60,852 | $ | 243,473 | † | $ | 5 | $ | 304,330 | † | |||||||||
† Includes one security which is valued at zero.
Transfers between investment levels may occur as the markets fluctuate and/or the availability of data used in an investment's valuation changes. The Portfolio recognizes transfers between the levels as of the end of the period. As of December 31, 2015, securities with a total value of approximately $2,000 transferred from Level 1 to Level 2. Securities that were valued using unadjusted quoted prices at December 31, 2014 were valued using other significant observable inputs at December 31, 2015.
Following is a reconciliation of investments in which significant unobservable inputs (Level 3) were used in determining fair value.
| Common Stock (000) | |||||||
Beginning Balance | $ | — | |||||
Purchases | 171 | ||||||
Sales | (14 | ) | |||||
Amortization of discount | — | ||||||
Transfers in | — | ||||||
Transfers out | — | ||||||
Corporate actions | — | ||||||
Change in unrealized appreciation (depreciation) | (154 | ) | |||||
Realized gains (losses) | 2 | ||||||
Ending Balance | $ | 5 | |||||
| Net change in unrealized appreciation (depreciation) from investments still held as of December 31, 2015 | $ | (154 | ) | ||||
The following table presents additional information about valuation techniques and inputs used for investments that are measured at fair value and categorized within Level 3 as of December 31, 2015.
| Fair Value at December 31, 2015 (000) | Valuation Technique | Unobservable Input | Range | Selected Value | Valuation from an Increase in Input | ||||||||||||||||||||||||||
Semiconductors & Semiconductors Equipment | |||||||||||||||||||||||||||||||
| Common Stock | $ | 5 | Market Transaction Method | Precedent Transaction | $ | 0.03 | $ | 0.03 | $ | 0.03 | Increase | ||||||||||||||||||||
34
Morgan Stanley Institutional Fund, Inc.
Annual Report — December 31, 2015
Notes to Financial Statements (cont'd)
3. Foreign Currency Translation and Foreign Investments: The books and records of the Portfolio are maintained in U.S. dollars. Foreign currency amounts are translated into U.S. dollars as follows:
– investments, other assets and liabilities at the prevailing rate of exchange on the valuation date;
– investment transactions and investment income at the prevailing rates of exchange on the dates of such transactions.
Although the net assets of the Portfolio are presented at the foreign exchange rates and market values at the close of the period, the Portfolio does not isolate that portion of the results of operations arising as a result of changes in the foreign exchange rates from the fluctuations arising from changes in the market prices of securities held at period end. Similarly, the Portfolio does not isolate the effect of changes in foreign exchange rates from the fluctuations arising from changes in the market prices of securities sold during the period. Accordingly, realized and unrealized foreign currency gains (losses) on investments in securities are included in the reported net realized and unrealized gains (losses) on investment transactions and balances. However, pursuant to U.S. Federal income tax regulations, gains and losses from certain foreign currency transactions and the foreign currency portion of gains and losses realized on sales and maturities of foreign denominated debt securities are treated as ordinary income for U.S. Federal income tax purposes.
Net realized gains (losses) on foreign currency transactions represent net foreign exchange gains (losses) from foreign currency forward exchange contracts, disposition of foreign currencies, currency gains (losses) realized between the trade and settlement dates on securities transactions, and the difference between the amount of investment income and foreign withholding taxes recorded on the Portfolio's books and the U.S. dollar equivalent amounts actually received or paid. Net unrealized currency gains (losses) from valuing foreign currency denominated assets and liabilities at period end exchange rates are reflected as a component of unrealized appreciation (depreciation) in the Statement of Assets and Liabilities. The change in unrealized currency gains (losses) on foreign currency translations for the period is reflected in the Statement of Operations.
Foreign security and currency transactions may involve certain considerations and risks not typically associated with those of U.S. dollar denominated transactions as a result of, among other factors, fluctuations of exchange rates in relation to the U.S. dollar, the possibility of lower levels of governmental supervision and regulation of foreign securities markets and the possibility of political or economic instability.
Governmental approval for foreign investments may be required in advance of making an investment under certain circumstances in some countries, and the extent of foreign investments in domestic companies may be subject to limitation in other countries. Foreign ownership limitations also may be imposed by the charters of individual companies to prevent, among other concerns, violations of foreign investment limitations. As a result, an additional class of shares (identified as "Foreign" in the Portfolio of Investments) may be created and offered for investment. The "local" and "foreign shares" market values may differ. In the absence of trading of the foreign shares in such markets, the Portfolio values the foreign shares at the closing exchange price of the local shares.
4. Derivatives: The Portfolio may, but is not required to, use derivative instruments for a variety of purposes, including hedging, risk management, portfolio management or to earn income. Derivatives are financial instruments whose value is based, in part, on the value of an underlying asset, interest rate, index or financial instrument. Prevailing interest rates and volatility levels, among other things, also affect the value of derivative instruments. A derivative instrument often has risks similar to its underlying asset and may have additional risks, including imperfect correlation between the value of the derivative and the underlying asset, risks of default by the counterparty to certain transactions, magnification of losses incurred due to changes in the market value of the securities, instruments, indices or interest rates to which the derivative instrument relates, risks that the transactions may not be liquid and risks arising from margin requirements. The use of derivatives involves risks that are different from, and possibly greater than, the risks associated with other portfolio investments. Derivatives may involve the use of highly specialized instruments that require investment techniques and risk analyses different from those associated with other portfolio investments. All of the Portfolio's holdings, including derivative instruments, are marked-to-market each
35
Morgan Stanley Institutional Fund, Inc.
Annual Report — December 31, 2015
Notes to Financial Statements (cont'd)
day with the change in value reflected in unrealized appreciation (depreciation). Upon disposition, a realized gain or loss is recognized.
Certain derivative transactions may give rise to a form of leverage. Leverage magnifies the potential for gain and the risk of loss. Leverage associated with derivative transactions may cause the Portfolio to liquidate portfolio positions when it may not be advantageous to do so to satisfy its obligations or to meet earmarking or segregation requirements, pursuant to applicable Securities and Exchange Commission rules and regulations, or may cause the Portfolio to be more volatile than if the Portfolio had not been leveraged. Although the Adviser seeks to use derivatives to further the Portfolio's investment objectives, there is no assurance that the use of derivatives will achieve this result.
Following is a description of the derivative instruments and techniques that the Portfolio used during the period and their associated risks:
Foreign Currency Forward Exchange Contracts: In connection with its investments in foreign securities, the Portfolio also entered into contracts with banks, brokers or dealers to purchase or sell securities or foreign currencies at a future date. A foreign currency forward exchange contract ("currency contract") is a negotiated agreement between the contracting parties to exchange a specified amount of currency at a specified future time at a specified rate. The rate can be higher or lower than the spot rate between the currencies that are the subject of the contract. Currency contracts may be used to protect against uncertainty in the level of future foreign currency exchange rates or to gain or modify exposure to a particular currency. To the extent hedged by the use of currency contracts, the precise matching of the currency contract amounts and the value of the securities involved will not generally be possible because the future value of such securities in foreign currencies will change as a consequence of market movements in the value of those securities between the date on which the contract is entered into and the date it matures. Furthermore, such transactions may reduce or preclude the opportunity for gain if the value of the currency should move in the direction opposite to the position taken. There is additional risk to the extent that currency contracts create exposure to currencies in which the Portfolio's securities are not denominated. Unanticipated changes in currency
prices may result in poorer overall performance for the Portfolio than if it had not entered into such contracts. The use of currency contracts involves the risk of loss from the insolvency or bankruptcy of the counterparty to the contract or the failure of the counterparty to make payments or otherwise comply with the terms of the contract. A currency contract is marked-to-market daily and the change in market value is recorded by the Portfolio as unrealized gain or loss. The Portfolio records realized gains (losses) when the currency contract is closed equal to the difference between the value of the currency contract at the time it was opened and the value at the time it was closed.
Futures: A futures contract is a standardized, exchange-traded agreement to buy or sell a specific quantity of an underlying asset, reference rate or index at a specific price at a specific future time. The value of a futures contract tends to increase and decrease in tandem with the value of the underlying instrument. Depending on the terms of the particular contract, futures contracts are settled through either physical delivery of the underlying instrument on the settlement date or by payment of a cash settlement amount on the settlement date. During the period the futures contract is open, payments are received from or made to the broker based upon changes in the value of the contract (the variation margin). A decision as to whether, when and how to use futures contracts involves the exercise of skill and judgment and even a well-conceived futures transaction may be unsuccessful because of market behavior or unexpected events. In addition to the derivatives risks discussed above, the prices of futures contracts can be highly volatile, using futures contracts can lower total return, and the potential loss from futures contracts can exceed the Portfolio's initial investment in such contracts. No assurance can be given that a liquid market will exist for any particular futures contract at any particular time. There is also the risk of loss by the Portfolio of margin deposits in the event of bankruptcy of a broker with which the Portfolio has open positions in the futures contract.
Swaps: The Portfolio may enter into OTC swap contracts or cleared swap transactions. A swap contract is an agreement between two parties pursuant to which the parties exchange payments at specified dates on the basis of a specified notional amount, with the payments calculated by reference to specified securities, indices,
36
Morgan Stanley Institutional Fund, Inc.
Annual Report — December 31, 2015
Notes to Financial Statements (cont'd)
reference rates, currencies or other instruments. Typically swap agreements provide that when the period payment dates for both parties are the same, the payments are made on a net basis (i.e., the two payment streams are netted out, with only the net amount paid by one party to the other). The Portfolio's obligations or rights under a swap contract entered into on a net basis will generally be equal only to the net amount to be paid or received under the agreement, based on the relative values of the positions held by each party. Cleared swap transactions may help reduce counterparty credit risk. In a cleared swap, the Portfolio's ultimate counterparty is a clearinghouse rather than a swap dealer, bank or other financial institution. OTC swap agreements are not entered into or traded on exchanges and often there is no central clearing or guaranty function for OTC swaps. These OTC swaps are often subject to credit risk or the risk of default or non-performance by the counterparty. Both OTC and cleared swaps could result in losses if interest rates, foreign currency exchange rates or other factors are not correctly anticipated by the Portfolio or if the reference index, security or investments do not perform as expected. During the period swap agreements are open, payments are received from or made to the clearinghouse or counterparty based upon changes in the value of the contract (variation margin). The Dodd-Frank Wall Street Reform and Consumer Protection Act and related regulatory developments require the clearing and exchange-trading of certain standardized swap transactions. Mandatory exchange-trading and clearing is occurring on a phased-in basis.
The Portfolio's use of swaps during the period included those based on the credit of an underlying security commonly referred to as "credit default swaps." The Portfolio may be either the buyer or seller in a credit default swap. Where the Portfolio is the buyer of a credit default swap contract, it would typically be entitled to receive the par (or other agreed-upon) value of a referenced debt obligation from the counterparty to the contract only in the event of a default or similar event by the issuer of the debt obligation. If no default occurs, the Portfolio would have paid to the counterparty a periodic stream of payments over the term of the contract and received no benefit from the contract. When the Portfolio is the seller of a credit default swap contract, it typically receives the stream of payments but is obligated to pay an
amount equal to the par (or other agreed-upon) value of a referenced debt obligation upon the default or similar event by the issuer of the referenced debt obligation. The use of credit default swaps could result in losses to the Portfolio if the Adviser fails to correctly evaluate the creditworthiness of the issuer of the referenced debt obligation.
If the Portfolio is a seller of protection and a credit event occurs, as defined under the terms of that particular swap agreement, the Portfolio will either (i) pay to the buyer of protection an amount equal to the notional amount of the swap agreement and take delivery of the referenced obligation, other deliverable obligations or underlying securities comprising the referenced index or (ii) pay a net settlement amount in the form of cash or securities equal to the notional amount of the swap agreement less the recovery value of the referenced obligation or underlying securities comprising the referenced index. If the Portfolio is a buyer of protection and a credit event occurs, as defined under the terms of that particular swap agreement, the Portfolio will either (i) receive from the seller of protection an amount equal to the notional amount of the swap agreement and deliver the referenced obligation, other deliverable obligations or underlying securities comprising the referenced index or (ii) receive a net settlement amount in the form of cash or securities equal to the notional amount of the swap agreement less the recovery value of the referenced obligation or underlying securities comprising the referenced index. Recovery values are estimated by market makers considering either industry standard recovery rates or entity specific factors and considerations until a credit event occurs. If a credit event has occurred, the recovery value is determined by a facilitated auction whereby a minimum number of allowable broker bids, together with a specified valuation method, are used to calculate the settlement value. The Portfolio's maximum risk of loss from counterparty risk, either as the protection seller or as the protection buyer, is the fair value of the swap agreement.
The current credit rating of each individual issuer is listed in the table following the Portfolio of Investments and serves as an indicator of the current status of the payment/performance risk of the credit derivative. Alternatively, for credit default swaps on an index of credits, the quoted market prices and current values
37
Morgan Stanley Institutional Fund, Inc.
Annual Report — December 31, 2015
Notes to Financial Statements (cont'd)
serve as an indicator of the current status of the payment/performance risk of the credit derivative. Generally, lower credit ratings and increasing market values, in absolute terms, represent a deterioration of the credit and a greater likelihood of an adverse credit event of the issuer.
When the Portfolio has an unrealized loss on a swap agreement, the Portfolio has instructed the custodian to pledge cash or liquid securities as collateral with a value approximately equal to the amount of the unrealized loss. Collateral pledges are monitored and subsequently adjusted if and when the swap valuations fluctuate. If applicable, cash collateral is included with "Due from (to) Broker" in the Statement of Assets and Liabilities.
Upfront payments paid or received by the Portfolio will be reflected as an asset or liability, respectively, in the Statement of Assets and Liabilities.
Options: With respect to options, the Portfolio is subject to equity risk, interest rate risk and foreign currency exchange risk in the normal course of pursuing its investment objectives. If the Portfolio buys an option, it buys a legal contract giving it the right to buy or sell a specific amount of the underlying instrument or futures contract on the underlying instrument, at an agreed-upon price typically in exchange for a premium paid by the Portfolio. The Portfolio may purchase and/or sell put and call options. Purchasing call options tends to increase the Portfolio's exposure to the underlying (or similar) instrument. Purchasing put options tends to decrease the Portfolio's exposure to the underlying (or similar) instrument. When entering into purchased option contracts, the Portfolio bears the risk of interest or exchange rates or securities prices moving unexpectedly, in which case, the Portfolio may not achieve the anticipated benefits of the purchased option contracts; however the risk of loss is limited to the premium paid. Purchased options are reported as part of "Total Investments in Securities" in the Statement of Assets and Liabilities. Premium paid for purchasing options which expired are treated as realized losses. If the Portfolio sells an option, it sells to another party the right to buy from or sell to the Portfolio a specific amount of the underlying instrument or futures contract on the underlying instrument at an agreed-upon price typically in exchange for a premium received by the Portfolio. The Portfolio may write call and put options on stock indexes, futures,
securities or currencies it owns or in which it may invest. Writing put options tend to increase the Portfolio's exposure to the underlying instrument. Writing call options tend to decrease the Portfolio's exposure to the underlying instruments. When the Portfolio writes a call or put option, an amount equal to the premium received is recorded as a liability. Any liability recorded is subsequently adjusted to reflect the current value of the options written. Premiums received from writing options which expire are treated as realized gains. Premiums received from writing options which are exercised or are closed are added to or offset against the proceeds or amount paid on the transaction to determine the net realized gain or loss. The Portfolio as a writer of an option has no control over whether the underlying future, security or currency may be sold (call) or purchased (put) and as a result bears the market risk of an unfavorable change in the price of the future, security or currency underlying the written option. When options are purchased OTC, the Portfolio bears the risk that the counterparty that wrote the option will be unable or unwilling to perform its obligations under the option contract. Options may also be illiquid and the Portfolio may have difficulty closing out its position. A decision as to whether, when and how to use options involves the exercise of skill and judgment and even a well-conceived option transaction may be unsuccessful because of market behavior or unexpected events. The prices of options can be highly volatile and the use of options can lower total returns.
Transactions in written options for the year ended December 31, 2015 were as follows:
| Written Options | Notional Amount (000) | Premiums Received (000) | |||||||||
Options outstanding at December 31, 2014 | — | $ | — | ||||||||
Options written | 99,460 | 701 | |||||||||
Options outstanding at December 31, 2015 | 99,460 | $ | 701 | ||||||||
FASB ASC 815, "Derivatives and Hedging" ("ASC 815"), is intended to improve financial reporting about derivative instruments by requiring enhanced disclosures to enable investors to better understand how and why the Portfolio uses derivative instruments, how these derivative instruments are accounted for and their effects on the Portfolio's financial position and results of operations.
38
Morgan Stanley Institutional Fund, Inc.
Annual Report — December 31, 2015
Notes to Financial Statements (cont'd)
The following tables set forth the fair value of the Portfolio's derivative contracts by primary risk exposure as of December 31, 2015.
| Asset Derivatives Statement of Assets and Liabilities Location | Primary Risk Exposure | Value (000) | |||||||||||||
| Options Purchased | Investments, at Value (Options Purchased) | Currency Risk | $ | 2,065 | (a) | ||||||||||
| Foreign Currency Forward Exchange Contracts | Unrealized Appreciation on Foreign Currency Forward Exchange Contracts | Currency Risk | 3,402 | ||||||||||||
| Futures Contract | Variation Margin on Futures Contract | Commodity Risk | 161 | (b) | |||||||||||
| Futures Contracts | Variation Margin on Futures Contracts | Interest Rate Risk | 29 | (b) | |||||||||||
| Futures Contracts | Variation Margin on Futures Contracts | Equity Risk | 1,391 | (b) | |||||||||||
Swap Agreements | Unrealized Appreciation on | ||||||||||||||
| Swap Agreements | Equity Risk | 759 | ||||||||||||
Swap Agreements | Unrealized Appreciation on | ||||||||||||||
| Swap Agreements | Interest Rate Risk | 853 | ||||||||||||
Total | $ | 8,660 | |||||||||||||
| Liability Derivatives Statement of Assets and Liabilities Location | Primary Risk Exposure | Value (000) | |||||||||||||
Options Written | Options Written, at Value | Currency Risk | $ | (649 | ) | ||||||||||
| Foreign Currency Forward Exchange Contracts | Unrealized Depreciation on Foreign Currency Forward Exchange Contracts | Currency Risk | (1,099 | ) | |||||||||||
| Futures Contracts | Variation Margin on Futures Contracts | Interest Rate Risk | (245 | )(b) | |||||||||||
| Futures Contracts | Variation Margin on Futures Contracts | Equity Risk | (789 | )(b) | |||||||||||
| Swap Agreements | Unrealized Depreciation on Swap Agreements | Credit Risk | (84 | ) | |||||||||||
| Swap Agreements | Unrealized Depreciation on Swap Agreements | Equity Risk | (74 | ) | |||||||||||
| Swap Agreements | Unrealized Depreciation on Swap Agreements | Interest Rate Risk | (258 | ) | |||||||||||
Total | $ | (3,198 | ) | ||||||||||||
(a) Amounts are included in Investments in Securities in the Statement of Assets and Liabilities.
(b) This amount represents the cumulative appreciation (depreciation) as reported in the Portfolio of Investments. The Statement of Assets and Liabilities only reflects the current day's net variation margin.
The following tables set forth by primary risk exposure the Portfolio's realized gains (losses) and change in unrealized appreciation (depreciation) by type of derivative contract for the year ended December 31, 2015 in accordance with ASC 815.
Realized Gain (Loss) | |||||||||||
Primary Risk Exposure | Derivative Type | Value (000) | |||||||||
| Currency Risk | Foreign Currency Forward Exchange Contracts | $ | 14,862 | ||||||||
Commodity Risk | Futures Contracts | 556 | |||||||||
Equity Risk | Futures Contracts | (13,789 | ) | ||||||||
Interest Rate Risk | Futures Contracts | 385 | |||||||||
Credit Risk | Swap Agreements | 2,937 | |||||||||
Equity Risk | Swap Agreements | (13,203 | ) | ||||||||
Interest Rate Risk | Swap Agreements | (6,410 | ) | ||||||||
Total | $ | (14,662 | ) | ||||||||
Change in Unrealized Appreciation (Depreciation) | |||||||||||
Primary Risk Exposure | Derivative Type | Value (000) | |||||||||
Currency Risk | Options Purchased | $ | 478 | (c) | |||||||
Currency Risk | Options Written | 52 | |||||||||
| Currency Risk | Foreign Currency Forward Exchange Contracts | 501 | |||||||||
Commodity Risk | Futures Contracts | 203 | |||||||||
Equity Risk | Futures Contracts | 1,140 | |||||||||
Interest Rate Risk | Futures Contracts | (216 | ) | ||||||||
Credit Risk | Swap Agreements | 467 | |||||||||
Equity Risk | Swap Agreements | (2,963 | ) | ||||||||
Interest Rate Risk | Swap Agreements | 83 | |||||||||
Total | $ | (255 | ) | ||||||||
(c) Amounts are included in Investments in the Statement of Operations.
At December 31, 2015, the Portfolio's derivative assets and liabilities are as follows:
| Gross Amounts of Assets and Liabilities Presented in the Statement of Assets and Liabilities | |||||||||||
| Derivatives(d) | Assets(e) (000) | Liabilities(e) (000) | |||||||||
Options Purchased | $ | 2,065 | (f) | $ | — | ||||||
Options Written | — | (649 | ) | ||||||||
| Foreign Currency Forward Exchange Contracts | 3,402 | (1,099 | ) | ||||||||
Swap Agreements | 1,612 | (416 | ) | ||||||||
Total | $ | 7,079 | $ | (2,164 | ) | ||||||
(d) Excludes exchange traded derivatives.
(e) Absent an event of default or early termination, OTC derivative assets and liabilities are presented gross and not offset in the Statement of Assets and Liabilities.
(f) Amounts are included in Investments in Securities in the Statement of Assets and Liabilities.
39
Morgan Stanley Institutional Fund, Inc.
Annual Report — December 31, 2015
Notes to Financial Statements (cont'd)
The Portfolio typically enters into International Swaps and Derivatives Association, Inc. Master Agreements ("ISDA Master Agreements") or similar master agreements (collectively, "Master Agreements") with its contract counterparties for certain OTC derivatives in order to, among other things, reduce its credit risk to counterparties. ISDA Master Agreements include provisions for general obligations, representations, collateral and events of default or termination. Under an ISDA Master Agreement, the Portfolio typically may offset with the counterparty certain OTC derivative financial instruments' payables and/or receivables with collateral held and/or posted and create one single net payment (close-out netting) in the event of default, termination and/or potential deterioration in the credit quality of the counterparty. Various Master Agreements govern the terms of certain transactions with counterparties, including transactions such as swap, forward, repurchase and reverse repurchase agreements. These Master Agreements typically attempt to reduce the counterparty risk associated with such transactions by specifying credit protection mechanisms and providing standardization that improves legal certainty. Cross-termination provisions under Master Agreements typically provide that a default in connection with one transaction between the Portfolio and a counterparty gives the non-defaulting party the right to terminate any other transactions in place with the defaulting party to create one single net payment due to/due from the defaulting party and may be a feature in certain Master Agreements. In the event the Portfolio exercises its right to terminate a Master Agreement after a counterparty experiences a termination event as defined in the Master Agreement, the return of collateral with market value in excess of the Portfolio's net liability may be delayed or denied.
The following tables present derivative financial instruments that are subject to enforceable netting arrangements as of December 31, 2015.
Gross Amounts Not Offset in the Statement of Assets and Liabilities | |||||||||||||||||||
| Counterparty | Gross Asset Derivatives Presented in Statement of Assets and Liabilities (000) | Financial Instrument (000) | Collateral Received(g) (000) | Net Amount (not less than $0) (000) | |||||||||||||||
Bank of America NA | $ | 74 | $ | (4 | ) | $ | — | $ | 70 | ||||||||||
Bank of New York Mellon | 256 | — | — | 256 | |||||||||||||||
Barclays Bank PLC | 193 | (132 | ) | — | 61 | ||||||||||||||
BNP Paribas SA | 58 | (16 | ) | — | 42 | ||||||||||||||
Citibank NA | 1,945 | (243 | ) | (1,314 | ) | 388 | |||||||||||||
| Commonwealth Bank of Australia | — | @ | — | — | — | @ | |||||||||||||
Credit Suisse International | 26 | — | — | 26 | |||||||||||||||
Deutsche Bank AG | 1,091 | (44 | ) | (910 | ) | 137 | |||||||||||||
Goldman Sachs International | 1,017 | (343 | ) | (674 | ) | 0 | |||||||||||||
JPMorgan Chase Bank NA | 1,731 | (359 | ) | (745 | ) | 627 | |||||||||||||
State Street Bank and Trust Co. | 398 | (229 | ) | — | 169 | ||||||||||||||
UBS AG | 290 | (34 | ) | — | 256 | ||||||||||||||
Total | $ | 7,079 | $ | (1,404 | ) | $ | (3,643 | ) | $ | 2,032 | |||||||||
(g) In some instances, the actual collateral received may be more than the amount shown here due to overcollateralization.
Gross Amounts Not Offset in the Statement of Assets and Liabilities | |||||||||||||||||||
| Counterparty | Gross Liability Derivatives Presented in Statement of Assets and Liabilities (000) | Financial Instrument (000) | Collateral Pledged (000) | Net Amount (not less than $0) (000) | |||||||||||||||
Bank of America NA | $ | 21 | $ | (4 | ) | $ | — | $ | 17 | ||||||||||
Bank of Montreal | 2 | — | — | 2 | |||||||||||||||
Barclays Bank PLC | 132 | (132 | ) | — | 0 | ||||||||||||||
BNP Paribas SA | 16 | (16 | ) | — | 0 | ||||||||||||||
Citibank NA | 243 | (243 | ) | — | 0 | ||||||||||||||
Deutsche Bank AG | 71 | (44 | ) | — | 27 | ||||||||||||||
Goldman Sachs International | 510 | (343 | ) | — | 167 | ||||||||||||||
JPMorgan Chase Bank NA | 860 | (359 | ) | — | 501 | ||||||||||||||
State Street Bank and Trust Co. | 229 | (229 | ) | — | 0 | ||||||||||||||
UBS AG | 80 | (34 | ) | — | 46 | ||||||||||||||
Total | $ | 2,164 | $ | (1,404 | ) | $ | — | $ | 760 | ||||||||||
40
Morgan Stanley Institutional Fund, Inc.
Annual Report — December 31, 2015
Notes to Financial Statements (cont'd)
For the year ended December 31, 2015, the approximate average monthly amount outstanding for each derivative type is as follows:
Foreign Currency Forward Exchange Contracts: | |||||||
Average monthly principal amount | $ | 431,837,000 | |||||
Futures Contracts: | |||||||
Average monthly original value | $ | 706,745,000 | |||||
Swap Agreements: | |||||||
Average monthly notional amount | $ | 916,455,000 | |||||
Options Purchased: | |||||||
Average monthly notional amount | 17,750,000 | ||||||
Options Written: | |||||||
| Average monthly notional amount | 17,750,000 | ||||||
5. Indemnifications: The Fund enters into contracts that contain a variety of indemnifications. The Fund's maximum exposure under these arrangements is unknown. However, the Fund has not had prior claims or losses pursuant to these contracts and expects the risk of loss to be remote.
6. Dividends and Distributions to Shareholders: Dividend income and distributions to shareholders are recorded on the ex-dividend date. Dividends from net investment income, if any, are declared and paid annually. Net realized capital gains, if any, are distributed at least annually.
7. Security Transactions, Income and Expenses: Security transactions are accounted for on the trade date (date the order to buy or sell is executed). Realized gains and losses on the sale of investment securities are determined on the specific identified cost method. Dividend income and other distributions are recorded on the ex-dividend date (except for certain foreign dividends which may be recorded as soon as the Portfolio is informed of such dividends) net of applicable withholding taxes. Interest income is recognized on the accrual basis except where collection is in doubt. Discounts are accreted and premiums are amortized over the life of the respective securities. Most expenses of the Fund can be directly attributed to a particular Portfolio. Expenses which cannot be directly attributed are apportioned among the Portfolios based upon relative net assets or other appropriate methods. Income, expenses (other than class specific expenses — distribution and shareholder services, transfer agency and sub transfer agency fees) and realized and unrealized gains or losses are allocated to each class of shares based upon their relative net assets.
The Portfolio owns shares of real estate investment trusts ("REITs") which report information on the source of their distributions annually in the following calendar year. A portion of distributions received from REITs during the year is estimated to be a return of capital and is recorded as a reduction of their cost.
B. Advisory Fees: The Adviser, a wholly-owned subsidiary of Morgan Stanley, provides the Portfolio with advisory services under the terms of an Investment Advisory Agreement, paid quarterly, at the annual rate based on the daily net assets as follows:
| First $750 million | Next $750 million | Over $1.5 billion | |||||||||
| 0.85 | % | 0.80 | % | 0.75 | % | ||||||
For the year ended December 31, 2015, the advisory fee rate (net of waivers/rebate) was equivalent to an annual effective rate of 0.78% of the Portfolio's average daily net assets.
The Adviser has agreed to reduce its advisory fee and/or reimburse the Portfolio so that total annual portfolio operating expenses, excluding certain investment related expenses, taxes, interest and other extraordinary expenses (including litigation), will not exceed 1.10% for Class I shares, 1.45% for Class A shares, 1.95% for Class L shares, 2.20% for Class C shares and 1.07% for Class IS shares. The fee waivers and/or expense reimbursements will continue for at least one year from the date of the Portfolio's prospectus or until such time as the Directors act to discontinue all or a portion of such waivers and/or reimbursements when they deem such action is appropriate. For the year ended December 31, 2015, approximately $151,000 of advisory fees were waived and approximately $114,000 of other expenses were reimbursed by the Adviser pursuant to this arrangement.
C. Administration Fees: The Adviser also serves as Administrator to the Fund and provides administrative services pursuant to an Administration Agreement for an annual fee, accrued daily and paid monthly, of 0.08% of the Portfolio's average daily net assets.
Under a Sub-Administration Agreement between the Administrator and State Street Bank and Trust Company ("State Street"), State Street provides certain administrative services to the Fund. For such services, the Administrator pays State Street a portion of the fee the Administrator receives from the Portfolio.
41
Morgan Stanley Institutional Fund, Inc.
Annual Report — December 31, 2015
Notes to Financial Statements (cont'd)
D. Distribution and Shareholder Services Fees: Morgan Stanley Distribution, Inc. ("MSDI" or the "Distributor"), a wholly-owned subsidiary of the Adviser and an indirect subsidiary of Morgan Stanley, serves as the Fund's Distributor of Portfolio shares pursuant to a Distribution Agreement. The Fund has adopted a Shareholder Services Plan with respect to Class A shares pursuant to Rule 12b-1 under the Act. Under the Shareholder Services Plan, the Portfolio pays the Distributor a shareholder services fee, accrued daily and paid monthly, at an annual rate of 0.25% of the Portfolio's average daily net assets attributable to Class A shares.
The Fund has adopted a Distribution and Shareholder Services Plan with respect to Class L shares pursuant to Rule 12b-1 under the Act. Under the Distribution and Shareholder Services Plan, the Portfolio pays the Distributor a distribution fee, accrued daily and paid monthly, at an annual rate of 0.50% and a shareholder services fee, accrued daily and paid monthly, at an annual rate of 0.25% of the Portfolio's average daily net assets attributable to Class L shares.
The Fund has adopted a Distribution and Shareholder Services Plan with respect to Class C shares pursuant to Rule 12b-1 under the Act. Under the Distribution and Shareholder Services Plan, the Portfolio pays the Distributor a distribution fee, accrued daily and paid monthly, at an annual rate of 0.75% and a shareholder services fee, accrued daily and paid monthly, at an annual rate of 0.25% of the Portfolio's average daily net assets attributable to Class C shares.
The distribution and shareholder services fees are used to support the expenses associated with servicing and maintaining accounts. The Distributor may compensate other parties for providing shareholder support services to investors who purchase Class A, Class L and Class C shares.
E. Dividend Disbursing and Transfer Agent: The Fund's dividend disbursing and transfer agent is Boston Financial Data Services, Inc. ("BFDS"). Pursuant to a Transfer Agency Agreement, the Fund pays BFDS a fee based on the number of classes, accounts and transactions relating to the Portfolios of the Fund.
F. Custodian Fees: State Street (the "Custodian") serves as Custodian for the Fund in accordance with a Custodian Agreement. The Custodian holds cash, securities, and other assets of the Fund as required by the Act. Custody fees are payable monthly based on assets held in custody, investment purchases and sales activity and account maintenance fees, plus reimbursement for certain out-of-pocket expenses.
G. Security Transactions and Transactions with Affiliates: For the year ended December 31, 2015, purchases and sales of investment securities for the Portfolio, other than long-term U.S. Government securities and short-term investments, were approximately $817,337,000 and $757,077,000, respectively. For the year ended December 31, 2015, purchases and sales of long-term U.S. Government securities were approximately $247,266,000 and $126,576,000, respectively.
The Portfolio invests in the Institutional Class of the Morgan Stanley Institutional Liquidity Funds — Money Market Portfolio (the "Liquidity Funds"), an open-end management investment company managed by the Adviser. Advisory fees paid by the Portfolio are reduced by an amount equal to its pro-rata share of the advisory and administration fees paid by the Portfolio due to its investment in the Liquidity Funds. For the year ended December 31, 2015, advisory fees paid were reduced by approximately $216,000 relating to the Portfolio's investment in the Liquidity Funds.
A summary of the Portfolio's transactions in shares of the Liquidity Funds during the year ended December 31, 2015 is as follows:
| Value December 31, 2014 (000) | Purchases at Cost (000) | Sales (000) | Dividend Income (000) | Value December 31, 2015 (000) | |||||||||||||||
| $ | 496,892 | $ | 687,533 | $ | 1,144,388 | $ | 356 | $ | 40,037 | ||||||||||
The Portfolio has an unfunded Deferred Compensation Plan (the "Compensation Plan"), which allows each independent Director to defer payment of all, or a portion, of the fees he or she receives for serving on the Board of Directors. Each eligible Director generally may elect to have the deferred amounts credited with a return equal to the total return on one or more of the Morgan Stanley funds that are offered as investment options under the Compensation Plan. Appreciation/depreciation and distributions received from these investments are recorded with an offsetting increase/decrease in the deferred compensation obligation and do not affect the NAV of the Portfolio.
H. Federal Income Taxes: It is the Portfolio's intention to continue to qualify as a regulated investment company and distribute all of its taxable and tax-exempt income. Accordingly, no provision for Federal income taxes is required in the financial statements.
The Portfolio may be subject to taxes imposed by countries in which it invests. Such taxes are generally based on income and/or capital gains earned or repatriated. Taxes are accrued based on net investment income, net realized gains and net
42
Morgan Stanley Institutional Fund, Inc.
Annual Report — December 31, 2015
Notes to Financial Statements (cont'd)
unrealized appreciation as such income and/or gains are earned. Taxes may also be based on transactions in foreign currency and are accrued based on the value of investments denominated in such currency.
FASB ASC 740-10, "Income Taxes — Overall", sets forth a minimum threshold for financial statement recognition of the benefit of a tax position taken or expected to be taken in a tax return. Management has concluded there are no significant uncertain tax positions that would require recognition in the financial statements. If applicable, the Portfolio recognizes interest accrued related to unrecognized tax benefits in "Interest Expense" and penalties in "Other Expenses" in the Statement of Operations. The Portfolio files tax returns with the U.S. Internal Revenue Service, New York and various states. Generally, each of the tax years in the four-year period ended December 31, 2015, remains subject to examination by taxing authorities.
The tax character of distributions paid may differ from the character of distributions shown in the Statements of Changes in Net Assets due to short-term capital gains being treated as ordinary income for tax purposes. The tax character of distributions paid during fiscal 2015 and 2014 was as follows:
| 2015 Distributions Paid From: | 2014 Distributions Paid From: | ||||||||||||||
| Ordinary Income (000) | Long-Term Capital Gain (000) | Ordinary Income (000) | Long-Term Capital Gain (000) | ||||||||||||
| $ | 8,076 | $ | — | $ | 9,800 | $ | 217 | ||||||||
The amount and character of income and gains to be distributed are determined in accordance with income tax regulations which may differ from GAAP. These book/tax differences are either considered temporary or permanent in nature.
Temporary differences are primarily due to differing book and tax treatments in the timing of the recognition of gains (losses) on certain investment transactions and the timing of the deductibility of certain expenses.
Permanent differences, primarily due to differing treatments of gains (losses) related to foreign currency transactions and swap income reclass, resulted in the following reclassifications among the components of net assets at December 31, 2015:
| Accumulated Undistributed Net Investment Income (000) | Accumulated Net Realized Loss (000) | Paid-in- Capital (000) | |||||||||
| $ | 2,940 | $ | (2,940 | ) | $ | — | |||||
At December 31, 2015, the components of distributable earnings for the Portfolio on a tax basis were as follows:
| Undistributed Ordinary Income (000) | Undistributed Long-Term Capital Gain (000) | ||||||
| $ | 3,531 | $ | — | ||||
At December 31, 2015, the Portfolio had available for Federal income tax purposes unused short-term capital losses of approximately $72,620,000 that do not have an expiration date.
To the extent that capital loss carryforwards are used to offset any future capital gains realized, no capital gains tax liability will be incurred by the Portfolio for gains realized and not distributed. To the extent that capital gains are offset, such gains will not be distributed to the shareholders.
I. Other: At December 31, 2015, the Portfolio had record owners of 10% or greater. Investment activities of these shareholders could have a material impact on the Portfolio. The aggregate percentage of such owners was 48.5%.
43
Morgan Stanley Institutional Fund, Inc.
Annual Report — December 31, 2015
Report of Independent Registered Public Accounting Firm
To the Shareholders and Board of Directors of
Morgan Stanley Institutional Fund, Inc. —
Multi-Asset Portfolio
We have audited the accompanying statement of assets and liabilities, including the portfolio of investments, of Multi-Asset Portfolio (one of the portfolios constituting Morgan Stanley Institutional Fund, Inc.) (the "Portfolio") as of December 31, 2015, and the related statement of operations for the year then ended, the statements of changes in net assets for each of the two years in the period then ended and the financial highlights for each of the years or periods indicated therein. These financial statements and financial highlights are the responsibility of the Portfolio's management. Our responsibility is to express an opinion on these financial statements and financial highlights based on our audits.
We conducted our audits in accordance with the standards of the Public Company Accounting Oversight Board (United States). Those standards require that we plan and perform the audit to obtain reasonable assurance about whether the financial statements and financial highlights are free of material misstatement. We were not engaged to perform an audit of the Portfolio's internal control over financial reporting. Our audits included consideration of internal control over financial reporting as a basis for designing audit procedures that are appropriate in the circumstances, but not for the purpose of expressing an opinion on the effectiveness of the Portfolio's internal control over financial reporting. Accordingly, we express no such opinion. An audit also includes examining, on a test basis, evidence supporting the amounts and disclosures in the financial statements and financial highlights, assessing the accounting principles used and significant estimates made by management, and evaluating the overall financial statement presentation. Our procedures included confirmation of securities owned as of December 31, 2015, by correspondence with the custodian and others or by other appropriate auditing procedures where replies from others were not received. We believe that our audits provide a reasonable basis for our opinion.
In our opinion, the financial statements and financial highlights referred to above present fairly, in all material respects, the financial position of Multi-Asset Portfolio (one of the portfolios constituting Morgan Stanley Institutional Fund, Inc.) at December 31, 2015, the results of its operations for the year then ended, the changes in its net assets for each of the two years in the period then ended and the financial highlights for each of the years or periods indicated therein, in conformity with U.S. generally accepted accounting principles.

Boston, Massachusetts
February 26, 2016
44
Morgan Stanley Institutional Fund, Inc.
Annual Report — December 31, 2015
Federal Tax Notice (unaudited)
For Federal income tax purposes, the following information is furnished with respect to the distributions paid by the Portfolio during its taxable year ended December 31, 2015. For corporate shareholders, 3.1% of the dividends qualified for the dividends received deduction.
For Federal income tax purposes, the following information is furnished with respect to the Portfolio's earnings for its taxable year ended December 31, 2015. When distributed, certain earnings may be subject to a maximum tax rate of 15% as provided for the Jobs and Growth Tax Relief Reconciliation Act of 2003. The Portfolio designated up to a maximum of approximately $5,373,000 as taxable at this lower rate.
In January, the Portfolio provides tax information to shareholders for the preceding calendar year.
45
Morgan Stanley Institutional Fund, Inc.
Annual Report — December 31, 2015
U.S. Privacy Policy (unaudited)
AN IMPORTANT NOTICE CONCERNING OUR U.S. PRIVACY POLICY
This privacy notice describes the U.S. privacy policy of Morgan Stanley Distribution, Inc., and the Morgan Stanley family of mutual funds ("us", "our", "we").
We are required by federal law to provide you with notice of our U.S. privacy policy ("Policy"). This Policy applies to both our current and former clients unless we state otherwise and is intended for individual clients who purchase products or receive services from us for personal, family or household purposes. This Policy is not applicable to partnerships, corporations, trusts or other non-individual clients or account holders, nor is this Policy applicable to individuals who are either beneficiaries of a trust for which we serve as trustee or participants in an employee benefit plan administered or advised by us. This Policy is, however, applicable to individuals who select us to be a custodian of securities or assets in individual retirement accounts, 401(k) accounts, or accounts subject to the Uniform Gifts to Minors Act.
This notice sets out our business practices to protect your privacy; how we collect and share personal information about you; and how you can limit our sharing or certain uses by others of this information. We may amend this Policy at any time, and will inform you of any changes to our Policy as required by law.
WE RESPECT YOUR PRIVACY
We appreciate that you have provided us with your personal financial information and understand your concerns about your information. We strive to safeguard the information our clients entrust to us. Protecting the confidentiality and security of client information is an important part of how we conduct our business.
This notice describes what personal information we collect about you, how we collect it, when we may share it with others, and how certain others may use it. It discusses the steps you may take to limit our sharing of certain information about you with our affiliated companies, including, but not limited to our affiliated banking businesses, brokerage firms and credit service affiliates. It also discloses how you may limit our affiliates' use of shared information for marketing purposes.
Throughout this Policy, we refer to the nonpublic information that personally identifies you as "personal information." We also use the term "affiliated company" in this notice. An affiliated company is a company in our family of companies and includes companies with the Morgan Stanley name. These affiliated companies are financial institutions such as broker-dealers, banks, investment advisers and credit card issuers. We refer to any company that is not an affiliated company as a nonaffiliated third party. For purposes of Section 5 of this notice, and your ability to limit certain uses of personal information by our affiliates, this notice applies to the use of personal information by our affiliated companies.
1. WHAT PERSONAL INFORMATION DO WE COLLECT FROM YOU?
We may collect the following types of information about you: (i) information provided by you, including information from applications and other forms we receive from you, (ii) information about your transactions with us or our affiliates, (iii) information about your transactions with nonaffiliated third parties, (iv) information from consumer reporting agencies, (v) information obtained from our websites, and (vi) information obtained from other sources. For example:
• We collect information such as your name, address, e-mail address, telephone/fax numbers, assets, income and investment objectives through applications and other forms you submit to us.
• We may obtain information about account balances, your use of account(s) and the types of products and services you prefer to receive from us through your dealings and transactions with us and other sources.
• We may obtain information about your creditworthiness and credit history from consumer reporting agencies.
• We may collect background information from and through third-party vendors to verify representations you have made and to comply with various regulatory requirements.
2. WHEN DO WE DISCLOSE PERSONAL INFORMATION WE COLLECT ABOUT YOU?
We may disclose personal information we collect about you in each of the categories listed above to affiliated and nonaffiliated third parties.
46
Morgan Stanley Institutional Fund, Inc.
Annual Report — December 31, 2015
U.S. Privacy Policy (unaudited) (cont'd)
a. Information We Disclose to Affiliated Companies.
We may disclose personal information that we collect about you to our affiliated companies to manage your account(s) effectively, to service and process your transactions, and to let you know about products and services offered by us and affiliated companies, to manage our business, and as otherwise required or permitted by law. Offers for products and services from affiliated companies are developed under conditions designed to safeguard your personal information.
b. Information We Disclose to Third Parties.
We may disclose personal information that we collect about you to nonaffiliated third parties to provide marketing services on our behalf or to other financial institutions with whom we have joint marketing agreements. We may also disclose all of the information we collect to other nonaffiliated third parties for our everyday business purposes, such as to process transactions, maintain account(s), respond to court orders and legal investigations, report to credit bureaus, offer our own products and services, protect against fraud, for institutional risk control, to perform services on our behalf, and as otherwise required or permitted by law.
When we share personal information about you with a nonaffiliated third party, they are required to limit their use of personal information about you to the particular purpose for which it was shared and they are not allowed to share personal information about you with others except to fulfill that limited purpose or as may be permitted or required by law.
3. HOW DO WE PROTECT THE SECURITY AND CONFIDENTIALITY OF PERSONAL INFORMATION WE COLLECT ABOUT YOU?
We maintain physical, electronic and procedural security measures that comply with applicable law and regulations to help safeguard the personal information we collect about you. We have internal policies governing the proper handling of client information by employees. Third parties that provide support or marketing services on our behalf may also receive personal information about you, and we require them to adhere to appropriate security standards with respect to such information.
4. HOW CAN YOU LIMIT OUR SHARING CERTAIN PERSONAL INFORMATION ABOUT YOU WITH OUR AFFILIATED COMPANIES FOR ELIGIBILITY DETERMINATION?
By following the opt-out procedures in Section 6 below, you may limit the extent to which we share with our affiliated companies, personal information that was collected to determine your eligibility for products and services such as your credit reports and other information that you have provided to us or that we may obtain from third parties ("eligibility information"). Eligibility information does not include your identification information or personal information pertaining to our transactions or experiences with you. Please note that, even if you direct us not to share eligibility information with our affiliated companies, we may still share your personal information, including eligibility information, with our affiliated companies under circumstances that are permitted under applicable law, such as to process transactions or to service your account.
5. HOW CAN YOU LIMIT THE USE OF CERTAIN PERSONAL INFORMATION ABOUT YOU BY OUR AFFILIATED COMPANIES FOR MARKETING?
By following the opt-out instructions in Section 6 below, you may limit our affiliated companies from marketing their products or services to you based on personal information we disclose to them. This information may include, for example, your income and account history with us. Please note that, even if you choose to limit our affiliated companies from using personal information about you that we may share with them for marketing their products and services to you, our affiliated companies may use your personal information that they obtain from us to market to you in circumstances permitted by law, such as if the affiliated party has its own relationship with you.
47
Morgan Stanley Institutional Fund, Inc.
Annual Report — December 31, 2015
U.S. Privacy Policy (unaudited) (cont'd)
6. HOW CAN YOU SEND US AN OPT-OUT INSTRUCTION?
If you wish to limit our sharing of eligibility information about you with our affiliated companies, or our affiliated companies' use of personal information for marketing purposes, as described in this notice, you may do so by:
• Calling us at (800) 548-7786
Monday–Friday between 8a.m. and 6p.m. (EST)
• Writing to us at the following address:
Boston Financial Data Services, Inc.
c/o Privacy Coordinator
P.O. Box 219804
Kansas City, Missouri 64121
If you choose to write to us, your request should include: your name, address, telephone number and account number(s) to which the opt-out applies and whether you are opting out with respect to sharing of eligibility information (Section 4 above), or information used for marketing (Section 5 above), or both. Written opt-out requests should not be sent with any other correspondence. In order to process your request, we require that the request be provided by you directly and not through a third party. Once you have informed us about your privacy preferences, your opt-out preference will remain in effect with respect to this Policy (as it may be amended) until you notify us otherwise. If you are a joint account owner, we will accept instructions from any one of you and apply those instructions to the entire account.
Please understand that if you limit our sharing or our affiliated companies' use of personal information, you and any joint account holder(s) may not receive information about our affiliated companies' products and services, including products or services that could help you manage your financial resources and achieve your investment objectives.
If you have more than one account or relationship with us, please specify the accounts to which you would like us to apply your privacy choices. If you have accounts or relationships with our affiliates, you may receive multiple privacy policies from them, and will need to separately notify those companies of your privacy choices for those accounts or relationships.
7. WHAT IF AN AFFILIATED COMPANY BECOMES A NONAFFILIATED THIRD PARTY?
If, at any time in the future, an affiliated company becomes a nonaffiliated third party, further disclosures of personal information made to the former affiliated company will be limited to those described in Section 2(b) above relating to nonaffiliated third parties. If you elected under Section 6 to limit disclosures we make to affiliated companies, or use of personal information by affiliated companies, your election will not apply to use by any former affiliated company of your personal information in their possession once it becomes a nonaffiliated third party.
SPECIAL NOTICE TO RESIDENTS OF VERMONT
The following section supplements our Policy with respect to our individual clients who have a Vermont address and supersedes anything to the contrary in the above Policy with respect to those clients only.
The State of Vermont requires financial institutions to obtain your consent prior to sharing personal information that they collect about you with nonaffiliated third parties, or eligibility information with affiliated companies, other than in certain limited circumstances. Except as permitted by law, we will not share personal information we collect about you with nonaffiliated third parties or eligibility information with affiliated companies, unless you provide us with your written consent to share such information.
SPECIAL NOTICE TO RESIDENTS OF CALIFORNIA
The following section supplements our Policy with respect to our individual clients who have a California address and supersedes anything to the contrary in the above Policy with respect to those clients only.
In response to a California law, if your account has a California home address, your personal information will not be disclosed to nonaffiliated third parties except as permitted by applicable California law, and we will limit sharing such personal information with our affiliates to comply with California privacy laws that apply to us.
48
Morgan Stanley Institutional Fund, Inc.
Annual Report — December 31, 2015
Director and Officer Information (unaudited)
Independent Directors:
| Name, Age and Address of Independent Director | Positions(s) Held with Registrant | Length of Time Served* | Principal Occupation(s) During Past 5 Years and Other Relevant Professional Experience | Number of Portfolios in Fund Complex Overseen by Director** | Other Directorships Held by Independent Director*** | ||||||||||||||||||
| Frank L. Bowman (71) c/o Kramer Levin Naftalis & Frankel LLP Counsel to the Independent Directors 1177 Avenue of the Americas New York, NY 10036 | Director | Since August 2006 | President, Strategic Decisions, LLC (consulting) (since February 2009); Director or Trustee of various Morgan Stanley Funds (since August 2006); Chairperson of the Compliance and Insurance Committee (since October 2015); Formerly, Chairperson of the Insurance Sub-Committee of the Compliance and Insurance Committee (February 2007-December 2015); served as President and Chief Executive Officer of the Nuclear Energy Institute (policy organization) (February 2005-November 2008); retired as Admiral, U.S. Navy after serving over 38 years on active duty including 8 years as Director of the Naval Nuclear Propulsion Program in the Department of the Navy and the U.S. Department of Energy (1996-2004); served as Chief of Naval Personnel (July 1994-September 1996); and on the Joint Staff as Director of Political Military Affairs (June 1992-July1994); knighted as Honorary Knight Commander of the Most Excellent Order of the British Empire; awarded the Officier de l'Orde National du Mérite by the French Government; elected to the National Academy of Engineering (2009). | 98 | Director of BP p.l.c.; Director of Naval and Nuclear Technologies LLP; Director Emeritus of the Armed Services YMCA; Director of the U.S. Naval Submarine League; Member of the National Security Advisory Council of the Center for U.S. Global Engagement and a member of the CNA Military Advisory Board; Chairman of the Charity, J Street Cup Golf, Trustee of Fairhaven United Methodist Church; and Director of other various non-profit organizations. | ||||||||||||||||||
| Kathleen A. Dennis (62) c/o Kramer Levin Naftalis & Frankel LLP Counsel to the Independent Directors 1177 Avenue of the Americas New York, NY 10036 | Director | Since August 2006 | President, Cedarwood Associates (mutual fund and investment management consulting) (since July 2006); Chairperson of the Money Market and Alternatives Sub-Committee of the Investment Committee (since October 2006) and Director or Trustee of various Morgan Stanley Funds (since August 2006); formerly, Senior Managing Director of Victory Capital Management (1993-2006). | 98 | Director of various nonprofit organizations. | ||||||||||||||||||
| Nancy C. Everett (61) c/o Kramer Levin Naftalis & Frankel LLP Counsel to the Independent Directors 1177 Avenue of the Americas New York, NY 10036 | Director | Since January 2015 | Chief Executive Officer, Virginia Commonwealth University Investment Company (since November 2015); Owner, OBIR, LLC (investment management consulting) (since June 2014); formerly, Managing Director, BlackRock Inc. (February 2011-December 2013); and Chief Executive Officer, General Motors Asset Management (a/k/a Promark Global Advisors, Inc.) (June 2005-May 2010). | 98 | Member of Virginia Commonwealth University School of Business Foundation; formerly, Member of Virginia Commonwealth University Board of Visitors (2013-2015); Member of Committee on Directors for Emerging Markets Growth Fund, Inc. (2007-2010); Chairperson of Performance Equity Management, LLC (2006-2010); and Chairperson, GMAM Absolute Return Strategies Fund, LLC (2006-2010). | ||||||||||||||||||
49
Morgan Stanley Institutional Fund, Inc.
Annual Report — December 31, 2015
Director and Officer Information (unaudited) (cont'd)
Independent Directors: (cont'd)
| Name, Age and Address of Independent Director | Positions(s) Held with Registrant | Length of Time Served* | Principal Occupation(s) During Past 5 Years and Other Relevant Professional Experience | Number of Portfolios in Fund Complex Overseen by Director** | Other Directorships Held by Independent Director*** | ||||||||||||||||||
| Jakki L. Haussler (58) c/o Kramer Levin Naftalis & Frankel LLP Counsel to the Independent Directors 1177 Avenue of the Americas New York, NY 10036 | Director | Since January 2015 | Chairman and Chief Executive Officer, Opus Capital Group (since January 1996); and formerly, Director, Capvest Venture Fund, LP (May 2000-December 2011); Partner, Adena Ventures, LP (July 1999-December 2010); Director, The Victory Funds (February 2005-July 2008). | 98 | Director of Cincinnati Bell Inc. and Member, Audit Committee and Compensation Committee; Director of Northern Kentucky University Foundation and Member, Investment Committee; Member of Chase College of Law Transactional Law Practice Center Board of Advisors; Director of Best Transport; Chase College of Law Board of Visitors; formerly, Member, University of Cincinnati Foundation Investment Committee; Member, Miami University Board of Visitors (2008-2011); Trustee of Victory Funds (2005-2008) and Chairman, Investment Committee (2007-2008) and Member, Service Provider Committee (2005-2008). | ||||||||||||||||||
| Dr. Manuel H. Johnson (67) c/o Johnson Smick International, Inc. 220 I Street, N.E. — Suite 200 Washington, D.C. 20002 | Director | Since July 1991 | Senior Partner, Johnson Smick International, Inc. (consulting firm); Chairperson of the Investment Committee (since October 2006) and Director or Trustee of various Morgan Stanley Funds (since July 1991); Co-Chairman and a founder of the Group of Seven Council (G7C) (international economic commission); formerly Chairperson of the Audit Committee (July 1991-September 2006), Vice Chairman of the Board of Governors of the Federal Reserve System and Assistant Secretary of the U.S. Treasury. | 100 | Director of NVR, Inc. (home construction). | ||||||||||||||||||
| Joseph J. Kearns (73) c/o Kearns & Associates LLC 23823 Malibu Road S-50-440 Malibu, CA 90265 | Director | Since August 1994 | President, Kearns & Associates LLC (investment consulting); Chairperson of the Audit Committee (since October 2006) and Director or Trustee of various Morgan Stanley Funds (since August 1994); formerly, Deputy Chairperson of the Audit Committee (July 2003-September 2006) and Chairperson of the Audit Committee of various Morgan Stanley Funds (since August 1994); CFO of the J. Paul Getty Trust. | 101 | Director of Electro Rent Corporation (equipment leasing). Prior to December 31, 2013, Director of The Ford Family Foundation. | ||||||||||||||||||
50
Morgan Stanley Institutional Fund, Inc.
Annual Report — December 31, 2015
Director and Officer Information (unaudited) (cont'd)
Independent Directors: (cont'd)
| Name, Age and Address of Independent Director | Positions(s) Held with Registrant | Length of Time Served* | Principal Occupation(s) During Past 5 Years and Other Relevant Professional Experience | Number of Portfolios in Fund Complex Overseen by Director** | Other Directorships Held by Independent Director*** | ||||||||||||||||||
| Michael F. Klein (57) c/o Kramer Levin Naftalis & Frankel LLP Counsel to the Independent Directors 1177 Avenue of the Americas New York, NY 10036 | Director | Since August 2006 | Managing Director, Aetos Capital, LLC (since March 2000); Co-President, Aetos Alternatives Management, LLC (since January 2004); and Co-Chief Executive Officer of Aetos Capital LLC (since August 2013); Chairperson of the Fixed Income Sub-Committee of the Investment Committee (since October 2006) and Director or Trustee of various Morgan Stanley Funds (since August 2006); formerly, Managing Director, Morgan Stanley & Co. Inc. and Morgan Stanley Dean Witter Investment Management, President, various Morgan Stanley Funds (June1998-March 2000) and Principal, Morgan Stanley & Co. Inc. and Morgan Stanley Dean Witter Investment Management (August 1997-December 1999). | 97 | Director of certain investment funds managed or sponsored by Aetos Capital, LLC. Director of Sanitized AG and Sanitized Marketing AG (specialty chemicals). | ||||||||||||||||||
| Michael E. Nugent (79) 522 Fifth Avenue New York, NY 10036 | Chair of the Board and Director | Chair of the Boards since July 2006 and Director since July 1991 | Chair of the Boards of various Morgan Stanley Funds (since July 2006); Chairperson of the Closed-End Fund Committee (since June 2012) and Director or Trustee of various Morgan Stanley Funds (since July 1991); formerly, Chairperson of the Insurance Committee (until July 2006), General Partner, TriumphCapital, L.P. (private investment partnership) (1988-2013). | 100 | None. | ||||||||||||||||||
| W. Allen Reed (68) c/o Kramer Levin Naftalis & Frankel LLP Counsel to the Independent Directors 1177 Avenue of the Americas New York, NY 10036 | Director | Since August 2006 | Chairperson of the Equity Sub-Committee of the Investment Committee (since October 2006) and Director or Trustee of various Morgan Stanley Funds (since August 2006); formerly, President and CEO of General Motors Asset Management; Chairman and Chief Executive Officer of the GM Trust Bank and Corporate Vice President of General Motors Corporation (August 1994-December 2005). | 98 | Director of Legg Mason, Inc.; formerly, Director of the Auburn University Foundation (2010-2015). | ||||||||||||||||||
| Fergus Reid (83) c/o Joe Pietryka, Inc. 85 Charles Colman Blvd. Pawling, NY 12564 | Director | Since June 1992 | Chairman, Joe Pietryka, Inc.; Chairperson of the Governance Committee and Director or Trustee of various Morgan Stanley Funds (since June 1992). | 100 | Formerly, Trustee and Director of certain investment companies in the JP Morgan Fund Complex managed by JP Morgan Investment Management Inc. (1987-2012). | ||||||||||||||||||
51
Morgan Stanley Institutional Fund, Inc.
Annual Report — December 31, 2015
Director and Officer Information (unaudited) (cont'd)
Interested Director:
| Name, Age and Address of Interested Director | Positions(s) Held with Registrant | Length of Time Served* | Principal Occupation(s) During Past 5 Years | Number of Portfolios in Fund Complex Overseen by Interested Director** | Other Directorships Held by Interested Director*** | ||||||||||||||||||
| James F. Higgins (68) One New York Plaza, New York, NY 10004 | Director | Since June 2000 | Director or Trustee of various Morgan Stanley Funds (since June 2000); Senior Advisor of Morgan Stanley (since August 2000). | 99 | Formerly, Director of AXA Financial, Inc. and AXA Equitable Life Insurance Company (2002-2011) and Director of AXA MONY Life Insurance Company and AXA MONY Life Insurance Company of America (2004-2011). | ||||||||||||||||||
* This is the earliest date the Director began serving the Morgan Stanley Funds. Each Director serves an indefinite term, until his or her successor is elected.
** The Fund Complex includes (as of December 31, 2015) all open-end and closed-end funds (including all of their portfolios) advised by Morgan Stanley Investment Management Inc. (the "Adviser") and any funds that have an adviser that is an affiliated person of the Adviser (including, but not limited to, Morgan Stanley AIP GP LP).
*** This includes any directorships at public companies and registered investment companies held by the Director at any time during the past five years.
Executive Officers:
Name, Age and Address of Executive Officer | Position(s) Held with Registrant | Length of Time Served**** | Principal Occupation(s) During Past 5 Years | ||||||||||||
| John H. Gernon (52) 522 Fifth Avenue New York, NY 10036 | President and Principal Executive Officer | Since September 2013 | President and Principal Executive Officer of the Equity and Fixed Income Funds and the Morgan Stanley AIP Funds (since September 2013) and the Liquidity Funds and various money market funds (since May 2014) in the Fund Complex, Managing Director of the Adviser; Head of Product (since 2006). | ||||||||||||
| Stefanie V. Chang Yu (49) 522 Fifth Avenue New York, NY 10036 | Chief Compliance Officer | Since December 1997 | Managing Director of the Adviser and various entities affiliated with the Adviser; Chief Compliance Officer of various Morgan Stanley Funds and the Adviser (since January 2014); formerly, Vice President of various Morgan Stanley Funds (December 1997-January 2014). | ||||||||||||
| Joseph C. Benedetti (50) 522 Fifth Avenue New York, NY 10036 | Vice President | Since January 2014 | Managing Director of the Adviser and various entities affiliated with the Adviser; Vice President of various Morgan Stanley Funds (since January 2014); formerly, Assistant Secretary of various Morgan Stanley Funds (October 2004-January 2014). | ||||||||||||
| Francis J. Smith (50) 522 Fifth Avenue New York, NY 10036 | Treasurer and Principal Financial Officer | Treasurer since July 2003 and Principal Financial Officer since September 2002 | Executive Director of the Adviser and various entities affiliated with the Adviser; Treasurer (since July 2003) and Principal Financial Officer of various Morgan Stanley Funds (since September 2002). | ||||||||||||
| Mary E. Mullin (48) 522 Fifth Avenue New York, NY 10036 | Secretary | Since June 1999 | Executive Director of the Adviser; Secretary of various Morgan Stanley Funds (since June 1999). | ||||||||||||
**** This is the earliest date the officer began serving the Morgan Stanley Funds. Each officer serves a one-year term, until his or her successor is elected and has qualified.
52
Morgan Stanley Institutional Fund, Inc.
Annual Report — December 31, 2015
Adviser and Administrator
Morgan Stanley Investment Management Inc.
522 Fifth Avenue
New York, New York 10036
Distributor
Morgan Stanley Distribution, Inc.
522 Fifth Avenue
New York, New York 10036
Dividend Disbursing and Transfer Agent
Boston Financial Data Services, Inc.
2000 Crown Colony Drive
Quincy, Massachusetts 02169
Custodian
State Street Bank and Trust Company
One Lincoln Street
Boston, Massachusetts 02111
Legal Counsel
Dechert LLP
1095 Avenue of the Americas
New York, New York 10036
Counsel to the Independent Directors
Kramer Levin Naftalis & Frankel LLP
1177 Avenue of the Americas
New York, New York 10036
Independent Registered Public Accounting Firm
Ernst & Young LLP
200 Clarendon Street
Boston, Massachusetts 02116
Reporting to Shareholders
Each Morgan Stanley fund provides a complete schedule of portfolio holdings in its semi-annual and annual reports within 60 days of the end of the fund's second and fourth fiscal quarters. The semi-annual and annual reports are filed electronically with the Securities and Exchange Commission (SEC) on Form N-CSRS and Form N-CSR, respectively. Morgan Stanley also delivers the semi-annual and annual reports to fund shareholders and makes these reports available on its public website, www.morganstanley.com/im. Each Morgan Stanley fund also files a complete schedule of portfolio holdings with the SEC for the fund's first and third fiscal quarters on Form N-Q. Morgan Stanley does not deliver the reports for the first and third fiscal quarters to shareholders, nor are the reports posted to the Morgan Stanley public website. You may, however, obtain the Form N-Q filings (as well as the Form N-CSR and N-CSRS filings) by accessing the SEC's website, www.sec.gov. You may also review and copy them at the SEC's Public Reference Room in Washington, DC. Information on the operation of the SEC's Public Reference Room may be obtained by calling the SEC toll free at 1 (800) SEC-0330. You can also request copies of these materials, upon payment of a duplicating fee, by electronic request at the SEC's email address (publicinfo@sec.gov) or by writing the Public Reference Room of the SEC, Washington, DC 20549-0102.
Proxy Voting Policies and Procedures and Proxy Voting Record
You may obtain a copy of the Fund's Proxy Voting Policy and Procedures and information regarding how the Fund voted proxies relating to portfolio securities during the most recent twelve-month period ended June 30, without charge, upon request, by calling toll free 1 (800) 548-7786 or by visiting our website at www.morganstanley.com/im. This information is also available on the SEC's website at www.sec.gov.
This report is authorized for distribution only when preceded or accompanied by a prospectus of the Morgan Stanley Institutional Fund, Inc., which describes in detail each Portfolio's investment policies, risks, fees and expenses. Please read the prospectus carefully before you invest or send money. For additional information, including information regarding the investments comprising the Portfolio, please visit our website at www.morganstanley.com/im or call toll free 1 (800) 548-7786.
53
Printed in U.S.A.
This Report has been prepared for shareholders and may be distributed to others only if preceded or accompanied by a current prospectus.
Morgan Stanley Investment Management Inc.
522 Fifth Avenue
New York, New York 10036
© 2016 Morgan Stanley. Morgan Stanley Distribution, Inc.

IFIMAANN
1405411 EXP. 02.28.17
INVESTMENT MANAGEMENT

Morgan Stanley Institutional Fund, Inc.
Frontier Emerging Markets Portfolio
Annual Report
December 31, 2015

Morgan Stanley Institutional Fund, Inc.
Annual Report — December 31, 2015
Table of Contents
Shareholders' Letter | 2 | ||||||
Expense Example | 3 | ||||||
Investment Overview | 4 | ||||||
Portfolio of Investments | 6 | ||||||
Statement of Assets and Liabilities | 8 | ||||||
Statement of Operations | 10 | ||||||
Statements of Changes in Net Assets | 11 | ||||||
Financial Highlights | 13 | ||||||
Notes to Financial Statements | 18 | ||||||
Report of Independent Registered Public Accounting Firm | 24 | ||||||
Federal Tax Notice | 25 | ||||||
U.S. Privacy Policy | 26 | ||||||
Director and Officer Information | 29 | ||||||
This report is authorized for distribution only when preceded or accompanied by prospectuses of the Morgan Stanley Institutional Fund, Inc. To receive a prospectus and/or statement of additional information (SAI), which contains more complete information such as investment objectives, charges, expenses, policies for voting proxies, risk considerations, and describes in detail each of the Portfolio's investment policies to the prospective investor, please call toll free 1 (800) 548-7786. Please read the prospectuses carefully before you invest or send money.
Additionally, you can access portfolio information including performance, characteristics, and investment team commentary through Morgan Stanley Investment Management's website: www.morganstanley.com/im.
Market forecasts provided in this report may not necessarily come to pass. There is no guarantee that any sectors mentioned will continue to perform as discussed herein or that securities in such sectors will be held by the Portfolio in the future. There is no assurance that a Portfolio will achieve its investment objective. Portfolios are subject to market risk, which is the possibility that market values of securities owned by the Portfolio will decline and, therefore, the value of the Portfolio's shares may be less than what you paid for them. Accordingly, you can lose money investing in this Portfolio. Please see the prospectus for more complete information on investment risks.
1
Morgan Stanley Institutional Fund, Inc.
Annual Report — December 31, 2015
Shareholders' Letter (unaudited)
Dear Shareholders,
We are pleased to provide this Annual report, in which you will learn how your investment in Frontier Emerging Markets Portfolio (the "Portfolio") performed during the latest twelve-month period.
Morgan Stanley Investment Management is a client-centric, investor-led organization. Our global presence, intellectual capital, and breadth of products and services enable us to partner with investors to meet the evolving challenges of today's financial markets. We aim to deliver superior investment service and to empower our clients to make the informed decisions that help them reach their investment goals.
As always, we thank you for selecting Morgan Stanley Investment Management, and look forward to working with you in the months and years ahead.
Sincerely,

John H. Gernon
President and Principal Executive Officer
January 2016
2
Morgan Stanley Institutional Fund, Inc.
Annual Report — December 31, 2015
Expense Example (unaudited)
Frontier Emerging Markets Portfolio
As a shareholder of the Portfolio, you incur two types of costs: (1) transactional costs, including redemptions fees; and (2) ongoing costs, including advisory fees, administration fees, distribution and shareholder services fees and other Portfolio expenses. This example is intended to help you understand your ongoing costs (in dollars) of investing in the Portfolio and to compare these costs with the ongoing costs of investing in other mutual funds.
This example is based on an investment of $1,000 invested at the beginning of the six-month period ended December 31, 2015 and held for the entire six-month period.
Actual Expenses
The table below provides information about actual account values and actual expenses. You may use the information in this table, together with the amount you invested, to estimate the expenses that you paid over the period. Simply divide your account value by $1,000 (for example, an $8,600 account value divided by $1,000 = 8.6), then multiply the result by the number in the table under the heading entitled "Actual Expenses Paid During Period" to estimate the expenses you paid on your account during this period.
Hypothetical Example for Comparison Purposes
The table below provides information about hypothetical account values and hypothetical expenses based on the Portfolio's actual expense ratio and an assumed rate of return of 5% per year before expenses, which is not the Portfolio's actual return. The hypothetical account values and expenses may not be used to estimate the actual ending account balance or expenses you paid for the period. You may use this information to compare the ongoing costs of investing in the Portfolio and other funds. To do so, compare this 5% hypothetical example with the 5% hypothetical examples that appear in the shareholder reports of the other funds.
Please note that the expenses shown in the table are meant to highlight your ongoing costs only and do not reflect any transactional costs, such as sales charges (loads) and redemption fees. Therefore, the information for each class in the table is useful in comparing ongoing costs only, and will not help you determine the relative total costs of owning different funds. In addition, if these transactional costs were included, your costs would have been higher.
| Beginning Account Value 7/1/15 | Actual Ending Account Value 12/31/15 | Hypothetical Ending Account Value | Actual Expenses Paid During Period* | Hypothetical Expenses Paid During Period* | Net Expense Ratio During Period** | ||||||||||||||||||||||
Frontier Emerging Markets Portfolio Class I | $ | 1,000.00 | $ | 898.50 | $ | 1,016.23 | $ | 8.52 | $ | 9.05 | 1.78 | % | |||||||||||||||
Frontier Emerging Markets Portfolio Class A | 1,000.00 | 897.20 | 1,014.42 | 10.23 | 10.87 | 2.14 | |||||||||||||||||||||
Frontier Emerging Markets Portfolio Class L | 1,000.00 | 894.10 | 1,010.79 | 13.65 | 14.50 | 2.86 | |||||||||||||||||||||
Frontier Emerging Markets Portfolio Class C | 1,000.00 | 893.30 | 1,010.33 | 14.08 | 14.95 | 2.95 | |||||||||||||||||||||
Frontier Emerging Markets Portfolio Class IS | 1,000.00 | 898.40 | 1,016.48 | 8.28 | 8.79 | 1.73 | |||||||||||||||||||||
* Expenses are calculated using each Portfolio Class' annualized net expense ratio (as disclosed), multiplied by the average account value over the period, and multiplied by 184/365 (to reflect the most recent one-half year period).
** Annualized.
3
Morgan Stanley Institutional Fund, Inc.
Annual Report — December 31, 2015
Investment Overview (unaudited)
Frontier Emerging Markets Portfolio
The Portfolio seeks long-term capital appreciation.
Performance
For the year ended December 31, 2015, the Portfolio's Class I shares had a total return based on net asset value and reinvestment of distributions per share of –10.58%, net of fees. The Portfolio's Class I shares outperformed the Portfolio's benchmark, the MSCI Frontier Markets Index (the "Index"), which returned –14.46%.
Factors Affecting Performance
• Frontier markets, down 14.46% as measured by the Index, declined closely in line with mainstream emerging markets, as represented by the MSCI Emerging Markets Net Index, which fell 14.92% in 2015. While frontier markets in aggregate have less direct trade with China than emerging markets, the economic slowdown in China not only further drove down commodities prices, but also contributed to investor concern about a potential global recession. Investors also broadly responded negatively to the prospects of waning liquidity as the U.S. Federal Reserve signaled and finally enacted its long-awaited interest rate hike in December. Lower oil prices helped the consumer broadly, as well as the current account balances of such net-importing frontier countries as Pakistan, Bangladesh and Sri Lanka. However, it hurt oil and/or commodity exporters such as Kazakhstan, Nigeria and Saudi Arabia.
• For the full year 2015, both stock selection and country allocation contributed to the Portfolio's outperformance.
• Chief sources of the Portfolio's outperformance for the full year were stock selection in and an overweight to Romania; zero allocation to Kazakhstan, which plunged; stock selection in and a country allocation to Argentina; stock selection in and an overweight to Vietnam; stock selection in and an underweight to Kuwait; stock selection in Bangladesh; exposure to Egypt; stock selection in Pakistan; stock selection within off-index United Arab Emirates; an underweight to Nigeria; and stock selection in Kenya.
• The chief detractors from the Portfolio's performance for the year were a lack of exposure to Lebanon, which was one of the few frontier markets to deliver positive performance, as well as an overweight to
Sri Lanka and zero exposure to Oman and Slovenia, which relatively outperformed the Index.
Management Strategies
• Though the world faces a low-growth environment, select frontier emerging market countries offer among the strongest growth prospects. Most of the oil-exporting countries in the Middle East and Nigeria will see slower growth from low oil prices; however, many frontier countries are oil importers, actually benefiting from lower oil prices. Meanwhile, as investors continue to react negatively to slowing macroeconomic data in China, the frontier markets, in aggregate, are less vulnerable because they have less direct trade with China than most emerging market countries. Even if U.S. interest rates rise and the dollar continues to remain strong, frontier markets in aggregate are less vulnerable to higher costs of external financing as they have smaller aggregate current account deficits than their emerging market peers. Combined, frontier countries have had little credit expansion relative to gross domestic product (GDP) over the past five years and several countries have de-levered or are at only nascent stages of a healthy credit expansion.
• In the Portfolio, we continue to focus on countries where we believe the outlook for reform is encouraging, as reform usually leads to higher levels of economic growth, which then translates to higher earnings growth at the corporate level. This is key to our investment case in Pakistan, Egypt and Kenya.
• Many frontier countries benefit from lower oil prices, which translate to lower inflation, increased purchasing power and improved trade balances. Key beneficiaries in this category are Kenya, Sri Lanka, Egypt, Pakistan and Bangladesh. New frontier markets such as Myanmar benefit from China's rising labor costs. Vietnam has been a main beneficiary of the manufacturing shift away from China. Pakistan remains our largest country position in the Portfolio. Significant overweights relative to the Index include Romania, Kenya, Vietnam and Bangladesh.
• We are actively underweight Index-dominant markets Kuwait and Nigeria. We maintain a zero weighting in Kazakhstan, Oman, Slovenia and Lebanon.
4
Morgan Stanley Institutional Fund, Inc.
Annual Report — December 31, 2015
Investment Overview (unaudited) (cont'd)
Frontier Emerging Markets Portfolio

* Minimum Investment for Class I shares
** Commenced Operations on August 25, 2008. Performance shown for the Portfolio's Class I shares reflects the performance of the common shares of the Predecessor Fund for periods prior to September 17, 2012.
In accordance with SEC regulations, the Portfolio's performance shown assumes that all recurring fees (including management fees) were deducted and all dividends and distributions were reinvested. The performance of Class A, L, C and IS shares will vary from the performance of Class I shares based upon their different inception dates and will be impacted by additional fees assessed to those classes (if applicable).
Performance Compared to the MSCI Frontier Markets Index(1) and the Lipper Emerging Markets Funds Index(2)
| Period Ended December 31, 2015 Total Returns(3) | |||||||||||||||||||
Average Annual | |||||||||||||||||||
| One Year | Five Years | Ten Years | Since Inception(8) | ||||||||||||||||
| Portfolio — Class I Shares w/o sales charges(4) | –10.58 | % | 2.77 | % | — | –0.28 | % | ||||||||||||
| Portfolio — Class A Shares w/o sales charges(5) | –10.90 | — | — | 7.67 | |||||||||||||||
| Portfolio — Class A Shares with maximum 5.25% sales charges(5) | –15.59 | — | — | 5.92 | |||||||||||||||
| Portfolio — Class L Shares w/o sales charges(5) | –11.49 | — | — | 7.03 | |||||||||||||||
| Portfolio — Class C Shares w/o sales charges(7) | — | — | — | –14.10 | |||||||||||||||
| Portfolio — Class C Shares with maximum 1.00% deferred sales charges(7) | — | — | — | –14.96 | |||||||||||||||
| Portfolio — Class IS Shares w/o sales charges(6) | — | — | — | –11.14 | |||||||||||||||
MSCI Frontier Markets Index | –14.46 | 0.36 | — | –4.36 | |||||||||||||||
Lipper Emerging Market Funds Index | –14.50 | –4.23 | — | –0.18 | |||||||||||||||
Performance data quoted represents past performance, which is no guarantee of future results, and current performance may be lower or higher than the figures shown. Performance assumes that all dividends and distributions, if any, were reinvested. For the most recent month-end performance figures, please visit www.morganstanley.com/im. Investment return and principal value will fluctuate so that Portfolio shares, when redeemed, may be worth more or less than their original cost. Total returns do not reflect the deduction of taxes that a shareholder would pay on Portfolio distributions or the redemption of Portfolio shares. Returns for periods less than one year are not annualized. Performance of share classes will vary due to difference in sales charges and expenses.
(1) The MSCI Frontier Markets Index is a free float-adjusted market capitalization index that is designed to measure equity market performance of frontier markets. The MSCI Frontier Markets Index currently consists of 23 frontier market country indices. The performance of the Index is calculated in U.S. dollars and assumes reinvestment of net dividends. "Net dividends" reflects a reduction in dividends after taking into account withholding of taxes by certain foreign countries represented in the Index. The Index is unmanaged and its returns do not include any sales charges or fees. Such costs would lower performance. It is not possible to invest directly in an index.
(2) The Lipper Emerging Market Funds Index is an equally weighted performance index of the largest qualifying funds (based on net assets) in the Lipper Emerging Market Funds classification. The Index, which is adjusted for capital gains distributions and income dividends, is unmanaged and should not be considered an investment. There are currently 30 funds represented in this Index. As of the date of this report, the Portfolio is in the Lipper Emerging Market Funds classification.
(3) Total returns for the Portfolio reflect fees waived and expenses reimbursed, if applicable, by the Adviser. Without such waivers and reimbursements, total returns would have been lower.
(4) On September 17, 2012, all assets of Morgan Stanley Frontier Emerging Markets Fund, Inc. (the "Predecessor Fund") were reorganized into Class I shares of Morgan Stanley Institutional Fund, Inc. Frontier Emerging Markets Portfolio ("the Portfolio"). Performance shown for Class I shares reflects the performance of the shares of the Predecessor Fund for periods prior to September 17, 2012. The Predecessor Fund may have performed differently if it were an open-end fund since closed-end funds are generally not subject to the cash flow fluctuations of an open-end fund. In addition, Class I shares' returns of the Portfolio will differ from the Predecessor Fund as they have different expenses. The Predecessor Fund commenced operations on August 25, 2008.
(5) Commenced offering on September 14, 2012.
(6) Commenced offering on February 27, 2015.
(7) Commenced offering on April 30, 2015.
(8) For comparative purposes, average annual since inception returns listed for the Indexes refer to the inception date of Class I of the Portfolio, not the inception of the Index.
5
Morgan Stanley Institutional Fund, Inc.
Annual Report — December 31, 2015
Portfolio of Investments
Frontier Emerging Markets Portfolio
Shares | Value (000) | ||||||||||
Common Stocks (91.6%) | |||||||||||
Argentina (10.3%) | |||||||||||
Banco Macro SA ADR (a) | 385,071 | $ | 22,380 | ||||||||
BBVA Banco Frances SA ADR (a) | 997,796 | 19,038 | |||||||||
Grupo Financiero Galicia SA ADR | 465,968 | 12,618 | |||||||||
Telecom Argentina SA ADR | 650,441 | 10,453 | |||||||||
64,489 | |||||||||||
Bangladesh (5.8%) | |||||||||||
Beximco Pharmaceuticals Ltd. | 7,664,740 | 8,218 | |||||||||
GrameenPhone Ltd. | 4,219,603 | 13,607 | |||||||||
Olympic Industries Ltd. | 4,429,759 | 14,636 | |||||||||
36,461 | |||||||||||
Brazil (2.2%) | |||||||||||
Adecoagro SA (a) | 627,489 | 7,712 | |||||||||
MercadoLibre, Inc. | 54,308 | 6,209 | |||||||||
13,921 | |||||||||||
Egypt (7.1%) | |||||||||||
Arabian Cement Co. | 4,374,258 | 5,346 | |||||||||
Commercial International Bank Egypt SAE | 3,849,161 | 18,680 | |||||||||
Edita Food Industries SAE (a) | 2,777,474 | 11,351 | |||||||||
Integrated Diagnostics Holdings PLC (a)(b) | 1,917,858 | 9,477 | |||||||||
44,854 | |||||||||||
Kenya (5.3%) | |||||||||||
East African Breweries Ltd. | 4,796,101 | 12,794 | |||||||||
Safaricom Ltd. | 129,609,319 | 20,654 | |||||||||
33,448 | |||||||||||
Kuwait (13.8%) | |||||||||||
Burgan Bank SAK | 13,309,696 | 16,886 | |||||||||
Kuwait Projects Co., Holding KSC | 8,062,022 | 15,338 | |||||||||
Mezzan Holding Co. KSCC (a) | 996,829 | 3,809 | |||||||||
National Bank of Kuwait | 19,085,602 | 50,329 | |||||||||
86,362 | |||||||||||
Morocco (2.4%) | |||||||||||
Attijariwafa Bank | 441,871 | 15,061 | |||||||||
Nigeria (7.2%) | |||||||||||
Guaranty Trust Bank PLC | 152,699,865 | 13,955 | |||||||||
Lafarge Africa PLC | 21,853,602 | 10,665 | |||||||||
Nigerian Breweries PLC | 16,928,586 | 11,592 | |||||||||
Zenith Bank PLC | 126,569,996 | 8,971 | |||||||||
45,183 | |||||||||||
Pakistan (12.5%) | |||||||||||
Habib Bank Ltd. | 7,025,000 | 13,410 | |||||||||
K-Electric Ltd. (a) | 131,728,900 | 9,410 | |||||||||
Lucky Cement Ltd. | 4,387,662 | 20,614 | |||||||||
Maple Leaf Cement Factory Ltd. | 14,325,783 | 10,205 | |||||||||
MCB Bank Ltd. | 2,579,943 | 5,368 | |||||||||
Pak Elektron Ltd. | 5,102,700 | 3,022 | |||||||||
United Bank Ltd. | 10,955,078 | 16,219 | |||||||||
78,248 | |||||||||||
Shares | Value (000) | ||||||||||
Panama (1.0%) | |||||||||||
Copa Holdings SA, Class A | 127,600 | $ | 6,158 | ||||||||
Qatar (1.4%) | |||||||||||
Qatar Islamic Bank | 295,319 | 8,633 | |||||||||
Romania (7.0%) | |||||||||||
Banca Transilvania (a) | 43,621,313 | 25,446 | |||||||||
BRD-Groupe Societe Generale SA (a) | 6,466,879 | 18,786 | |||||||||
44,232 | |||||||||||
Sri Lanka (4.0%) | |||||||||||
Commercial Bank of Ceylon PLC | 14,769,238 | 14,326 | |||||||||
John Keells Holdings PLC | 8,981,227 | 11,091 | |||||||||
25,417 | |||||||||||
Tanzania, United Republic of (1.2%) | |||||||||||
Tanzania Breweries Ltd. | 1,121,500 | 7,684 | |||||||||
United Arab Emirates (2.2%) | |||||||||||
Aramex PJSC | 4,064,355 | 3,473 | |||||||||
NMC Health PLC | 849,636 | 10,534 | |||||||||
14,007 | |||||||||||
United States (1.0%) | |||||||||||
Pricesmart, Inc. | 74,745 | 6,203 | |||||||||
Vietnam (7.2%) | |||||||||||
Bank for Foreign Trade of Vietnam JSC | 7,659,310 | 14,939 | |||||||||
Masan Group Corp. (a) | 3,276,910 | 11,268 | |||||||||
Vietnam Dairy Products JSC | 3,360,254 | 18,820 | |||||||||
45,027 | |||||||||||
Total Common Stocks (Cost $576,858) | 575,388 | ||||||||||
Participation Notes (6.7%) | |||||||||||
Saudi Arabia (6.3%) | |||||||||||
| Al Hammadi Development and Investment Co., Equity Linked Notes, expires 12/20/18 (a) | 568,074 | 7,399 | |||||||||
| Al Hammadi Development and Investment Co. Series 000A, Equity Linked Notes, expires 8/21/17 (a) | 820,468 | 10,687 | |||||||||
| Al Rajhi Bank, Equity Linked Notes, expires 9/27/16 (a) | 83,324 | 1,149 | |||||||||
| Al Rajhi Bank, Equity Linked Notes, expires 11/27/17 (a) | 609,430 | 8,401 | |||||||||
| Jarir Marketing Co. Series 0005, Equity Linked Notes, expires 12/12/16 (a)(b) | 279,491 | 11,853 | |||||||||
39,489 | |||||||||||
United Arab Emirates (0.1%) | |||||||||||
| Aramex PJSC, Equity Linked Notes, expires 3/30/16 (a) | 1,131,685 | 967 | |||||||||
Vietnam (0.3%) | |||||||||||
| Viet Nam Dairy Products JSC, Equity Linked Notes, expires 10/23/17 (a) | 133,329 | 747 | |||||||||
| Viet Nam Dairy Products JSC, Equity Linked Notes, expires 7/22/19 (a) | 203,515 | 1,140 | |||||||||
1,887 | |||||||||||
Total Participation Notes (Cost $47,599) | 42,343 | ||||||||||
The accompanying notes are an integral part of the financial statements.
6
Morgan Stanley Institutional Fund, Inc.
Annual Report — December 31, 2015
Portfolio of Investments (cont'd)
Frontier Emerging Markets Portfolio
Shares | Value (000) | ||||||||||
Short-Term Investment (2.6%) | |||||||||||
Investment Company (2.6%) | |||||||||||
| Morgan Stanley Institutional Liquidity Funds — Money Market Portfolio — Institutional Class (See Note G) (Cost $16,114) | 16,113,861 | $ | 16,114 | ||||||||
Total Investments (100.9%) (Cost $640,571) (c)(d) | 633,845 | ||||||||||
Liabilities in Excess of Other Assets (–0.9%) | (5,816 | ) | |||||||||
Net Assets (100.0%) | $ | 628,029 | |||||||||
(a) Non-income producing security.
(b) 144A security — Certain conditions for public sale may exist. Unless otherwise noted, these securities are deemed to be liquid.
(c) The approximate fair value and percentage of net assets, $476,933,000 and 75.9%, respectively, represent the securities that have been fair valued under the fair valuation policy for international investments as described in Note A-1 within the Notes to the Financial Statements.
(d) At December 31, 2015, the aggregate cost for Federal income tax purposes is approximately $645,797,000. The aggregate gross unrealized appreciation is approximately $55,102,000 and the aggregate gross unrealized depreciation is approximately $67,054,000 resulting in net unrealized depreciation of approximately $11,952,000.
ADR American Depositary Receipt.
PJSC Public Joint Stock Company.
Portfolio Composition
Classification | Percentage of Total Investments | ||||||
Banks | 48.0 | % | |||||
Other* | 17.1 | ||||||
Food Products | 11.0 | ||||||
Construction Materials | 7.4 | ||||||
Health Care Providers & Services | 6.0 | ||||||
Wireless Telecommunication Services | 5.4 | ||||||
Beverages | 5.1 | ||||||
Total Investments | 100.0 | % | |||||
* Industries and/or investment types representing less than 5% of total investments.
The accompanying notes are an integral part of the financial statements.
7
Morgan Stanley Institutional Fund, Inc.
Annual Report — December 31, 2015
Frontier Emerging Markets Portfolio
Statement of Assets and Liabilities | December 31, 2015 (000) | ||||||
Assets: | |||||||
Investments in Securities of Unaffiliated Issuers, at Value (Cost $624,457) | $ | 617,731 | |||||
Investment in Security of Affiliated Issuer, at Value (Cost $16,114) | 16,114 | ||||||
Total Investments in Securities, at Value (Cost $640,571) | 633,845 | ||||||
Foreign Currency, at Value (Cost $3,715) | 3,706 | ||||||
Cash | 84 | ||||||
Receivable for Portfolio Shares Sold | 3,145 | ||||||
Receivable for Investments Sold | 2,432 | ||||||
Dividends Receivable | 540 | ||||||
Receivable from Affiliate | 8 | ||||||
Tax Reclaim Receivable | 3 | ||||||
Other Assets | 75 | ||||||
Total Assets | 643,838 | ||||||
Liabilities: | |||||||
Payable for Investments Purchased | 6,332 | ||||||
Payable for Portfolio Shares Redeemed | 4,235 | ||||||
Deferred Capital Gain Country Tax | 2,608 | ||||||
Payable for Advisory Fees | 1,949 | ||||||
Payable for Custodian Fees | 394 | ||||||
Payable for Professional Fees | 137 | ||||||
Payable for Sub Transfer Agency Fees — Class I | 39 | ||||||
Payable for Sub Transfer Agency Fees — Class A | 11 | ||||||
Payable for Sub Transfer Agency Fees — Class L | 3 | ||||||
Payable for Administration Fees | 42 | ||||||
Payable for Shareholder Services Fees — Class A | 16 | ||||||
Payable for Distribution and Shareholder Services Fees — Class L | 3 | ||||||
Payable for Distribution and Shareholder Services Fees — Class C | 1 | ||||||
Payable for Transfer Agency Fees — Class I | 6 | ||||||
Payable for Transfer Agency Fees — Class A | 1 | ||||||
Payable for Transfer Agency Fees — Class L | 3 | ||||||
Payable for Transfer Agency Fees — Class C | — | @ | |||||
Payable for Transfer Agency Fees — Class IS | 1 | ||||||
Other Liabilities | 28 | ||||||
Total Liabilities | 15,809 | ||||||
Net Assets | $ | 628,029 | |||||
Net Assets Consist Of: | |||||||
Paid-in-Capital | $ | 729,574 | |||||
Distributions in Excess of Net Investment Income | (112 | ) | |||||
Accumulated Net Realized Loss | (92,426 | ) | |||||
Unrealized Appreciation (Depreciation) on: | |||||||
Investments (Net of $2,277 of Deferred Capital Gain Country Tax) | (9,003 | ) | |||||
Foreign Currency Translations | (4 | ) | |||||
Net Assets | $ | 628,029 | |||||
The accompanying notes are an integral part of the financial statements.
8
Morgan Stanley Institutional Fund, Inc.
Annual Report — December 31, 2015
Frontier Emerging Markets Portfolio
Statement of Assets and Liabilities (cont'd) | December 31, 2015 (000) | ||||||
CLASS I: | |||||||
Net Assets | $ | 531,927 | |||||
| Shares Outstanding $0.001 par value shares of beneficial interest (unlimited shares authorized) (not in 000's) | 31,333,675 | ||||||
Net Asset Value, Offering and Redemption Price Per Share | $ | 16.98 | |||||
CLASS A: | |||||||
Net Assets | $ | 82,480 | |||||
| Shares Outstanding $0.001 par value shares of beneficial interest (unlimited shares authorized) (not in 000's) | 4,881,065 | ||||||
Net Asset Value, Redemption Price Per Share | $ | 16.90 | |||||
Maximum Sales Load | 5.25 | % | |||||
Maximum Sales Charge | $ | 0.94 | |||||
Maximum Offering Price Per Share | $ | 17.84 | |||||
CLASS L: | |||||||
Net Assets | $ | 4,490 | |||||
| Shares Outstanding $0.001 par value shares of beneficial interest (unlimited shares authorized) (not in 000's) | 267,397 | ||||||
Net Asset Value, Offering and Redemption Price Per Share | $ | 16.79 | |||||
CLASS C: | |||||||
Net Assets | $ | 1,400 | |||||
| Shares Outstanding $0.001 par value shares of beneficial interest (unlimited shares authorized) (not in 000's) | 83,875 | ||||||
Net Asset Value, Offering and Redemption Price Per Share | $ | 16.69 | |||||
CLASS IS: | |||||||
Net Assets | $ | 7,732 | |||||
| Shares Outstanding $0.001 par value shares of beneficial interest (unlimited shares authorized) (not in 000's) | 455,662 | ||||||
Net Asset Value, Offering and Redemption Price Per Share | $ | 16.97 | |||||
@ Amount is less than $500.
The accompanying notes are an integral part of the financial statements.
9
Morgan Stanley Institutional Fund, Inc.
Annual Report — December 31, 2015
Frontier Emerging Markets Portfolio
Statement of Operations | Year Ended December 31, 2015 (000) | ||||||
Investment Income: | |||||||
Dividends from Securities of Unaffiliated Issuers (Net of $1,841 of Foreign Taxes Withheld) | $ | 18,061 | |||||
Dividends from Security of Affiliated Issuer (Note G) | 33 | ||||||
Total Investment Income | 18,094 | ||||||
Expenses: | |||||||
Advisory Fees (Note B) | 8,203 | ||||||
Custodian Fees (Note F) | 1,604 | ||||||
Administration Fees (Note C) | 525 | ||||||
Sub Transfer Agency Fees — Class I | 279 | ||||||
Sub Transfer Agency Fees — Class A | 109 | ||||||
Sub Transfer Agency Fees — Class L | 8 | ||||||
Sub Transfer Agency Fees — Class C | 1 | ||||||
Professional Fees | 380 | ||||||
Shareholder Services Fees — Class A (Note D) | 190 | ||||||
Distribution and Shareholder Services Fees — Class L (Note D) | 52 | ||||||
Distribution and Shareholder Services Fees — Class C (Note D) | 5 | ||||||
Registration Fees | 127 | ||||||
Shareholder Reporting Fees | 87 | ||||||
Transfer Agency Fees — Class I (Note E) | 27 | ||||||
Transfer Agency Fees — Class A (Note E) | 6 | ||||||
Transfer Agency Fees — Class L (Note E) | 13 | ||||||
Transfer Agency Fees — Class C (Note E) | 1 | ||||||
Transfer Agency Fees — Class IS (Note E) | 1 | ||||||
Directors' Fees and Expenses | 16 | ||||||
Pricing Fees | 7 | ||||||
Other Expenses | 26 | ||||||
Total Expenses | 11,667 | ||||||
Rebate from Morgan Stanley Affiliate (Note G) | (17 | ) | |||||
Reimbursement of Class Specific Expenses — Class L (Note B) | (2 | ) | |||||
Reimbursement of Class Specific Expenses — Class C (Note B) | (1 | ) | |||||
Reimbursement of Class Specific Expenses — Class IS (Note B) | (— | @) | |||||
Net Expenses | 11,647 | ||||||
Net Investment Income | 6,447 | ||||||
Realized Loss: | |||||||
Investments Sold (Net of $423 of Capital Gain Country Tax) | (48,942 | ) | |||||
Foreign Currency Transactions | (862 | ) | |||||
Net Realized Loss | (49,804 | ) | |||||
Change in Unrealized Appreciation (Depreciation): | |||||||
Investments (Net of Increase in Deferred Capital Gain Country Tax of $554) | (31,096 | ) | |||||
Foreign Currency Translations | 45 | ||||||
Net Change in Unrealized Appreciation (Depreciation) | (31,051 | ) | |||||
Net Realized Loss and Change in Unrealized Appreciation (Depreciation) | (80,855 | ) | |||||
Net Decrease in Net Assets Resulting from Operations | $ | (74,408 | ) | ||||
@ Amount is less than $500.
The accompanying notes are an integral part of the financial statements.
10
Morgan Stanley Institutional Fund, Inc.
Annual Report — December 31, 2015
Frontier Emerging Markets Portfolio
Statements of Changes in Net Assets | Year Ended December 31, 2015 (000) | Year Ended December 31, 2014 (000) | |||||||||
Increase (Decrease) in Net Assets: | |||||||||||
Operations: | |||||||||||
Net Investment Income | $ | 6,447 | $ | 5,958 | |||||||
Net Realized Loss | (49,804 | ) | (7,627 | ) | |||||||
Net Change in Unrealized Appreciation (Depreciation) | (31,051 | ) | (12,194 | ) | |||||||
Net Decrease in Net Assets Resulting from Operations | (74,408 | ) | (13,863 | ) | |||||||
Distributions from and/or in Excess of: | |||||||||||
Class I: | |||||||||||
Net Investment Income | (4,515 | ) | (4,928 | ) | |||||||
Paid-in-Capital | (211 | ) | (215 | ) | |||||||
Class A: | |||||||||||
Net Investment Income | (376 | ) | (524 | ) | |||||||
Paid-in-Capital | (18 | ) | (32 | ) | |||||||
Class L: | |||||||||||
Net Investment Income | — | (21 | ) | ||||||||
Paid-in-Capital | — | (3 | ) | ||||||||
Class C: | |||||||||||
Net Investment Income | (7 | ) | — | ||||||||
Paid-in-Capital | (— | @) | |||||||||
Class IS: | |||||||||||
Net Investment Income | (69 | ) | — | ||||||||
Paid-in-Capital | (3 | ) | |||||||||
Total Distributions | (5,199 | ) | (5,723 | ) | |||||||
Capital Share Transactions:(1) | |||||||||||
Class I: | |||||||||||
Subscribed | 378,909 | 436,382 | |||||||||
Distributions Reinvested | 3,040 | 3,342 | |||||||||
Redeemed | (332,045 | ) | (115,877 | ) | |||||||
Class A: | |||||||||||
Subscribed | 59,471 | 89,841 | |||||||||
Distributions Reinvested | 394 | 549 | |||||||||
Redeemed | (45,079 | ) | (33,970 | ) | |||||||
Class L: | |||||||||||
Subscribed | 1,339 | 7,270 | |||||||||
Distributions Reinvested | — | 24 | |||||||||
Redeemed | (4,069 | ) | (2,050 | ) | |||||||
Class C: | |||||||||||
Subscribed | 1,531 | * | — | ||||||||
Distributions Reinvested | 7 | * | — | ||||||||
Redeemed | (34 | )* | — | ||||||||
Class IS: | |||||||||||
Subscribed | 43,080 | ** | — | ||||||||
Distributions Reinvested | 72 | ** | — | ||||||||
Redeemed | (31,422 | )** | — | ||||||||
Net Increase in Net Assets Resulting from Capital Share Transactions | 75,194 | 385,511 | |||||||||
Redemption Fees | 65 | 100 | |||||||||
Total Increase (Decrease) in Net Assets | (4,348 | ) | 366,025 | ||||||||
Net Assets: | |||||||||||
Beginning of Period | 632,377 | 266,352 | |||||||||
End of Period (Including Distributions in Excess of Net Investment Income of $(112) and $(307)) | $ | 628,029 | $ | 632,377 | |||||||
The accompanying notes are an integral part of the financial statements.
11
Morgan Stanley Institutional Fund, Inc.
Annual Report — December 31, 2015
Frontier Emerging Markets Portfolio
Statements of Changes in Net Assets (cont'd) | Year Ended December 31, 2015 (000) | Year Ended December 31, 2014 (000) | |||||||||
(1) Capital Share Transactions: | |||||||||||
Class I: | |||||||||||
Shares Subscribed | 20,657 | 21,506 | |||||||||
Shares Issued on Distributions Reinvested | 181 | 185 | |||||||||
Shares Redeemed | (18,098 | ) | (5,792 | ) | |||||||
Net Increase in Class I Shares Outstanding | 2,740 | 15,899 | |||||||||
Class A: | |||||||||||
Shares Subscribed | 3,267 | 4,403 | |||||||||
Shares Issued on Distributions Reinvested | 24 | 30 | |||||||||
Shares Redeemed | (2,442 | ) | (1,667 | ) | |||||||
Net Increase in Class A Shares Outstanding | 849 | 2,766 | |||||||||
Class L: | |||||||||||
Shares Subscribed | 70 | 355 | |||||||||
Shares Issued on Distributions Reinvested | — | 1 | |||||||||
Shares Redeemed | (225 | ) | (106 | ) | |||||||
Net Increase (Decrease) in Class L Shares Outstanding | (155 | ) | 250 | ||||||||
Class C: | |||||||||||
Shares Subscribed | 86 | * | — | ||||||||
Shares Issued on Distributions Reinvested | — | @@* | — | ||||||||
Shares Redeemed | (2 | )* | — | ||||||||
Net Increase in Class C Shares Outstanding | 84 | — | |||||||||
Class IS: | |||||||||||
Shares Subscribed | 2,259 | ** | — | ||||||||
Shares Issued on Distributions Reinvested | 4 | ** | — | ||||||||
Shares Redeemed | (1,807 | )** | — | ||||||||
Net Increase in Class IS Shares Outstanding | 456 | — | |||||||||
* For the period April 30, 2015 through December 31, 2015.
** For the period February 27, 2015 through December 31, 2015.
@ Amount is less than $500.
@@ Amount is less than 500 shares.
The accompanying notes are an integral part of the financial statements.
12
Morgan Stanley Institutional Fund, Inc.
Annual Report — December 31, 2015
Financial Highlights
Frontier Emerging Markets Portfolio
Class I | |||||||||||||||||||||||||||
Year Ended December 31, | Period from November 1, 2012 to December 31, | Year Ended October 31, | |||||||||||||||||||||||||
Selected Per Share Data and Ratios | 2015 | 2014 | 2013 | 2012 | 2012@ | 2011 | |||||||||||||||||||||
Net Asset Value, Beginning of Period | $ | 19.15 | $ | 18.86 | $ | 14.24 | $ | 14.00 | $ | 12.75 | $ | 15.26 | |||||||||||||||
Income (Loss) from Investment Operations: | |||||||||||||||||||||||||||
Net Investment Income (Loss)† | 0.19 | 0.25 | 0.09 | (0.03 | ) | 0.19 | 0.34 | ||||||||||||||||||||
Net Realized and Unrealized Gain (Loss) | (2.21 | ) | 0.23 | 4.60 | 0.56 | 1.26 | (2.65 | ) | |||||||||||||||||||
Total from Investment Operations | (2.02 | ) | 0.48 | 4.69 | 0.53 | 1.45 | (2.31 | ) | |||||||||||||||||||
Distributions from and/or in Excess of: | |||||||||||||||||||||||||||
Net Investment Income | (0.14 | ) | (0.18 | ) | (0.07 | ) | (0.30 | ) | (0.22 | ) | (0.20 | ) | |||||||||||||||
Paid-in-Capital | (0.01 | ) | (0.01 | ) | — | — | — | — | |||||||||||||||||||
Total Distributions | (0.15 | ) | (0.19 | ) | (0.07 | ) | (0.30 | ) | (0.22 | ) | (0.20 | ) | |||||||||||||||
Redemption Fees | 0.00 | ‡ | 0.00 | ‡ | 0.00 | ‡ | 0.01 | 0.02 | — | ||||||||||||||||||
Net Asset Value, End of Period | $ | 16.98 | $ | 19.15 | $ | 18.86 | $ | 14.24 | $ | 14.00 | $ | 12.75 | |||||||||||||||
Total Return++ | (10.58 | )% | 2.66 | % | 32.95 | % | 3.94 | %# | 12.03 | % | (15.35 | )% | |||||||||||||||
Ratios and Supplemental Data: | |||||||||||||||||||||||||||
Net Assets, End of Period (Thousands) | $ | 531,927 | $ | 547,535 | $ | 239,378 | $ | 51,415 | $ | 58,729 | $ | 84,962 | |||||||||||||||
Ratio of Expenses to Average Net Assets (1) | 1.72 | %+ | 1.69 | %+ | 1.77 | %+ | 1.85 | %+* | 2.38 | %+ | 2.03 | %+ | |||||||||||||||
| Ratio of Expenses to Average Net Assets Excluding Non Operating Expenses | N/A | 1.71 | %+ | N/A | N/A | 2.38 | %+ | N/A | |||||||||||||||||||
| Ratio of Net Investment Income (Loss) to Average Net Assets (1) | 1.02 | %+ | 1.23 | %+ | 0.54 | %+ | (1.23 | )%+* | 1.47 | %+ | 2.32 | %+ | |||||||||||||||
| Ratio of Rebate from Morgan Stanley Affiliates to Average Net Assets | 0.00 | %§ | 0.01 | % | 0.01 | % | 0.00 | %§* | 0.01 | % | 0.00 | %§ | |||||||||||||||
Portfolio Turnover Rate | 37 | % | 52 | % | 34 | % | 13 | %# | 59 | % | 60 | % | |||||||||||||||
(1) Supplemental Information on the Ratios to Average Net Assets: | |||||||||||||||||||||||||||
Ratios Before Expense Limitation: | |||||||||||||||||||||||||||
Expenses to Average Net Assets | N/A | 1.72 | % | 1.89 | % | 3.31 | %* | 2.47 | % | N/A | |||||||||||||||||
Net Investment Income (Loss) to Average Net Assets | N/A | 1.20 | % | 0.42 | % | (2.69 | )%* | 1.38 | % | N/A | |||||||||||||||||
@ On September 17, 2012, all assets of Morgan Stanley Frontier Emerging Markets Fund, Inc. (the "Predecessor Fund") were reorganized into Class I shares of Morgan Stanley Institutional Fund, Inc. Frontier Emerging Markets Portfolio (the "Portfolio"). Per share data and ratios shown for Class I shares reflects the historical per share data and performance of the Predecessor Fund for periods prior to September 17, 2012.
† Per share amount is based on average shares outstanding.
‡ Amount is less than $0.005 per share.
++ Calculated based on the net asset value as of the last business day of the period.
+ The Ratios of Expenses and Net Investment Income (Loss) reflect the rebate of certain Portfolio expenses in connection with the investments in Morgan Stanley affiliates during the period. The effect of the rebate on the ratios is disclosed in the above table as "Ratio of Rebate from Morgan Stanley Affiliates to Average Net Assets."
§ Amount is less than 0.005%.
# Not Annualized.
* Annualized.
The accompanying notes are an integral part of the financial statements.
13
Morgan Stanley Institutional Fund, Inc.
Annual Report — December 31, 2015
Financial Highlights
Frontier Emerging Markets Portfolio
Class A | |||||||||||||||||||||||
Year Ended December 31, | Period from November 1, 2012 to | Period from September 14, 2012^ | |||||||||||||||||||||
Selected Per Share Data and Ratios | 2015 | 2014 | 2013 | December 31, 2012 | to October 31, 2012 | ||||||||||||||||||
Net Asset Value, Beginning of Period | $ | 19.06 | $ | 18.78 | $ | 14.20 | $ | 13.97 | $ | 13.76 | |||||||||||||
Income (Loss) from Investment Operations: | |||||||||||||||||||||||
Net Investment Income (Loss)† | 0.11 | 0.18 | (0.15 | ) | (0.03 | ) | (0.02 | ) | |||||||||||||||
Net Realized and Unrealized Gain (Loss) | (2.18 | ) | 0.24 | 4.79 | 0.56 | 0.23 | |||||||||||||||||
Total from Investment Operations | (2.07 | ) | 0.42 | 4.64 | 0.53 | 0.21 | |||||||||||||||||
Distributions from and/or in Excess of: | |||||||||||||||||||||||
Net Investment Income | (0.08 | ) | (0.13 | ) | (0.06 | ) | (0.30 | ) | — | ||||||||||||||
Paid-in-Capital | (0.01 | ) | (0.01 | ) | — | — | — | ||||||||||||||||
Total Distributions | (0.09 | ) | (0.14 | ) | (0.06 | ) | (0.30 | ) | — | ||||||||||||||
Redemption Fees | 0.00 | ‡ | 0.00 | ‡ | 0.00 | ‡ | — | — | |||||||||||||||
Net Asset Value, End of Period | $ | 16.90 | $ | 19.06 | $ | 18.78 | $ | 14.20 | $ | 13.97 | |||||||||||||
Total Return++ | (10.90 | )% | 2.39 | % | 32.53 | % | 3.77 | %# | 1.67 | %# | |||||||||||||
Ratios and Supplemental Data: | |||||||||||||||||||||||
Net Assets, End of Period (Thousands) | $ | 82,480 | $ | 76,839 | $ | 23,762 | $ | 10 | $ | 10 | |||||||||||||
Ratio of Expenses to Average Net Assets (1) | 2.07 | %+ | 2.02 | %+ | 1.95 | %+^^ | 2.10 | %+* | 2.10 | %+* | |||||||||||||
| Ratio of Expenses to Average Net Assets Excluding Non Operating Expenses | N/A | 2.04 | %+ | N/A | N/A | 2.09 | %+* | ||||||||||||||||
| Ratio of Net Investment Income (Loss) to Average Net Assets (1) | 0.60 | %+ | 0.90 | %+ | (0.81 | )%+ | (1.48 | )%+* | (0.88 | )%+* | |||||||||||||
| Ratio of Rebate from Morgan Stanley Affiliates to Average Net Assets | 0.00 | %§ | 0.01 | % | 0.01 | % | 0.00 | %§* | 0.01 | %* | |||||||||||||
Portfolio Turnover Rate | 37 | % | 52 | % | 34 | % | 13 | %# | 59 | %# | |||||||||||||
(1) Supplemental Information on the Ratios to Average Net Assets: | |||||||||||||||||||||||
Ratios Before Expense Limitation: | |||||||||||||||||||||||
Expenses to Average Net Assets | N/A | 2.05 | % | N/A | 3.56 | %* | 2.92 | %* | |||||||||||||||
Net Investment Income (Loss) to Average Net Assets | N/A | 0.87 | % | N/A | (2.94 | )%* | (1.70 | )%* | |||||||||||||||
^ Commencement of Offering.
† Per share amount is based on average shares outstanding.
‡ Amount is less than $0.005 per share.
++ Calculated based on the net asset value which does not reflect sales charges, if applicable, as of the last business day of the period.
+ The Ratios of Expenses and Net Investment Income (Loss) reflect the rebate of certain Portfolio expenses in connection with the investments in Morgan Stanley affiliates during the period. The effect of the rebate on the ratios is disclosed in the above table as "Ratio of Rebate from Morgan Stanley Affiliates to Average Net Assets."
^^ Effective September 16, 2013, the Adviser has agreed to limit the ratio of expenses to average net assets to the maximum ratio of 2.20% for Class A shares. Prior to September 16, 2013, the maximum ratio was 2.10% for Class A shares.
§ Amount is less than 0.005%.
# Not Annualized.
* Annualized.
The accompanying notes are an integral part of the financial statements.
14
Morgan Stanley Institutional Fund, Inc.
Annual Report — December 31, 2015
Financial Highlights
Frontier Emerging Markets Portfolio
Class L | |||||||||||||||||||||||
Year Ended December 31, | Period from November 1, 2012 to | Period from September 14, 2012^ | |||||||||||||||||||||
Selected Per Share Data and Ratios | 2015 | 2014 | 2013 | December 31, 2012 | to October 31, 2012 | ||||||||||||||||||
Net Asset Value, Beginning of Period | $ | 18.96 | $ | 18.71 | $ | 14.19 | $ | 13.96 | $ | 13.76 | |||||||||||||
Income (Loss) from Investment Operations: | |||||||||||||||||||||||
Net Investment Income (Loss)† | 0.05 | 0.06 | (0.16 | ) | (0.05 | ) | (0.02 | ) | |||||||||||||||
Net Realized and Unrealized Gain (Loss) | (2.22 | ) | 0.25 | 4.69 | 0.57 | 0.22 | |||||||||||||||||
Total from Investment Operations | (2.17 | ) | 0.31 | 4.53 | 0.52 | 0.20 | |||||||||||||||||
Distributions from and/or in Excess of: | |||||||||||||||||||||||
Net Investment Income | — | (0.05 | ) | (0.01 | ) | (0.29 | ) | — | |||||||||||||||
Paid-in-Capital | — | (0.01 | ) | — | — | — | |||||||||||||||||
Total Distributions | — | (0.06 | ) | (0.01 | ) | (0.29 | ) | — | |||||||||||||||
Redemption Fees | 0.00 | ‡ | 0.00 | ‡ | 0.00 | ‡ | — | — | |||||||||||||||
Net Asset Value, End of Period | $ | 16.79 | $ | 18.96 | $ | 18.71 | $ | 14.19 | $ | 13.96 | |||||||||||||
Total Return++ | (11.49 | )% | 1.77 | % | 31.81 | % | 3.71 | %# | 1.60 | %# | |||||||||||||
Ratios and Supplemental Data: | |||||||||||||||||||||||
Net Assets, End of Period (Thousands) | $ | 4,490 | $ | 8,003 | $ | 3,212 | $ | 10 | $ | 10 | |||||||||||||
Ratio of Expenses to Average Net Assets (1) | 2.70 | %+ | 2.65 | %+ | 2.53 | %+^^ | 2.60 | %+* | 2.60 | %+* | |||||||||||||
| Ratio of Expenses to Average Net Assets Excluding Non Operating Expenses | N/A | 2.67 | %+ | N/A | N/A | 2.59 | %+* | ||||||||||||||||
| Ratio of Net Investment Income (Loss) to Average Net Assets (1) | 0.26 | %+ | 0.27 | %+ | (0.92 | )%+ | (1.98 | )%+* | (1.37 | )%+* | |||||||||||||
| Ratio of Rebate from Morgan Stanley Affiliates to Average Net Assets | 0.00 | %§ | 0.01 | % | 0.00 | %§ | 0.00 | %§* | 0.01 | %* | |||||||||||||
Portfolio Turnover Rate | 37 | % | 52 | % | 34 | % | 13 | %# | 59 | %# | |||||||||||||
(1) Supplemental Information on the Ratios to Average Net Assets: | |||||||||||||||||||||||
Ratios Before Expense Limitation: | |||||||||||||||||||||||
Expenses to Average Net Assets | 2.73 | % | 2.68 | % | N/A | 4.08 | %* | 3.49 | %* | ||||||||||||||
Net Investment Income (Loss) to Average Net Assets | 0.23 | % | 0.24 | % | N/A | (3.46 | )%* | (2.26 | )%* | ||||||||||||||
^ Commencement of Offering.
† Per share amount is based on average shares outstanding.
‡ Amount is less than $0.005 per share.
++ Calculated based on the net asset value as of the last business day of the period.
+ The Ratios of Expenses and Net Investment Income (Loss) reflect the rebate of certain Portfolio expenses in connection with the investments in Morgan Stanley affiliates during the period. The effect of the rebate on the ratios is disclosed in the above table as "Ratio of Rebate from Morgan Stanley Affiliates to Average Net Assets."
^^ Effective September 16, 2013, the Adviser has agreed to limit the ratio of expenses to average net assets to the maximum ratio of 2.70% for Class L shares. Prior to September 16, 2013, the maximum ratio was 2.60% for Class L shares.
§ Amount is less than 0.005%.
# Not Annualized.
* Annualized.
The accompanying notes are an integral part of the financial statements.
15
Morgan Stanley Institutional Fund, Inc.
Annual Report — December 31, 2015
Financial Highlights
Frontier Emerging Markets Portfolio
Class C | |||||||
Selected Per Share Data and Ratios | Period from April 30, 2015^ to December 31, 2015 | ||||||
Net Asset Value, Beginning of Period | $ | 19.53 | |||||
Loss from Investment Operations: | |||||||
Net Investment Loss† | (0.16 | ) | |||||
Net Realized and Unrealized Loss | (2.60 | ) | |||||
Total from Investment Operations | (2.76 | ) | |||||
Distributions from and/or in Excess of: | |||||||
Net Investment Income | (0.07 | ) | |||||
Paid-in-Capital | (0.01 | ) | |||||
Total Distributions | (0.08 | ) | |||||
Redemption Fees | 0.00 | ‡ | |||||
Net Asset Value, End of Period | $ | 16.69 | |||||
Total Return++ | (14.10 | )%# | |||||
Ratios and Supplemental Data: | |||||||
Net Assets, End of Period (Thousands) | $ | 1,400 | |||||
Ratios of Expenses to Average Net Assets (1) | 2.95 | %+* | |||||
Ratio of Net Investment Loss to Average Net Assets (1) | (1.38 | )%+* | |||||
Ratio of Rebate from Morgan Stanley Affiliates to Average Net Assets | 0.00 | %§* | |||||
Portfolio Turnover Rate | 37 | % | |||||
(1) Supplemental Information on the Ratios to Average Net Assets: | |||||||
Ratios Before Expense Limitation: | |||||||
Expense to Average Net Assets | 3.17 | %* | |||||
Net Investment Loss to Average Net Assets | (1.60 | )%* | |||||
^ Commencement of Offering.
† Per share amount is based on average shares outstanding.
‡ Amount is less than $0.005 per share.
++ Calculated based on the net asset value which does not reflect sales charges, if applicable, as of the last business day of the period.
+ The Ratios of Expenses and Net Investment Loss reflect the rebate of certain Portfolio expenses in connection with the investments in Morgan Stanley affiliates during the period. The effect of the rebate on the ratios is disclosed in the above table as "Ratio of Rebate from Morgan Stanley Affiliates to Average Net Assets."
§ Amount is less than 0.005%.
# Not Annualized.
* Annualized.
The accompanying notes are an integral part of the financial statements.
16
Morgan Stanley Institutional Fund, Inc.
Annual Report — December 31, 2015
Financial Highlights
Frontier Emerging Markets Portfolio
Class IS | |||||||
Selected Per Share Data and Ratios | Period from February 27, 2015^ to December 31, 2015 | ||||||
Net Asset Value, Beginning of Period | $ | 19.28 | |||||
Income (Loss) from Investment Operations: | |||||||
Net Investment Income† | 0.26 | ||||||
Net Realized and Unrealized Loss | (2.41 | ) | |||||
Total from Investment Operations | (2.15 | ) | |||||
Distributions from and/or in Excess of: | |||||||
Net Investment Income | (0.15 | ) | |||||
Paid-in-Capital | (0.01 | ) | |||||
Total Distributions | (0.16 | ) | |||||
Redemption Fees | 0.00 | ‡ | |||||
Net Asset Value, End of Period | $ | 16.97 | |||||
Total Return++ | (11.14 | )%# | |||||
Ratios and Supplemental Data: | |||||||
Net Assets, End of Period (Thousands) | $ | 7,732 | |||||
Ratio of Expenses to Average Net Assets (1) | 1.68 | %+* | |||||
Ratio of Net Investment Income to Average Net Assets (1) | 1.67 | %+* | |||||
Ratio of Rebate from Morgan Stanley Affiliates to Average Net Assets | 0.00 | %§* | |||||
Portfolio Turnover Rate | 37 | % | |||||
(1) Supplemental Information on the Ratios to Average Net Assets: | |||||||
Ratios Before Expense Limitation: | |||||||
Expense to Average Net Assets | 1.68 | %* | |||||
Net Investment Income to Average Net Assets | 1.67 | %* | |||||
^ Commencement of Offering.
† Per share amount is based on average shares outstanding.
‡ Amount is less than $0.005 per share.
++ Calculated based on the net asset value as of the last business day of the period.
+ The Ratios of Expenses and Net Investment Income reflect the rebate of certain Portfolio expenses in connection with the investments in Morgan Stanley affiliates during the period. The effect of the rebate on the ratios is disclosed in the above table as "Ratio of Rebate from Morgan Stanley Affiliates to Average Net Assets."
§ Amount is less than 0.005%.
# Not Annualized.
* Annualized.
The accompanying notes are an integral part of the financial statements.
17
Morgan Stanley Institutional Fund, Inc.
Annual Report — December 31, 2015
Notes to Financial Statements
Morgan Stanley Institutional Fund, Inc. (the "Fund") is registered under the Investment Company Act of 1940, as amended (the "Act"), as an open-end management investment company. The Fund is comprised of twenty-six separate, active, diversified and non-diversified portfolios (individually referred to as a "Portfolio", collectively as the "Portfolios"). The Fund applies investment company accounting and reporting guidance.
The accompanying financial statements relate to the Frontier Emerging Markets Portfolio. The Portfolio seeks long-term capital appreciation.
The Portfolio offers five classes of shares — Class I, Class A, Class L, Class C and Class IS. On February 27, 2015, the Portfolio commenced offering Class IS shares. On April 30, 2015, the Portfolio commenced offering Class C shares and suspended offering of Class L shares. Existing Class L shareholders may invest through reinvestment of dividends and distributions.
A. Significant Accounting Policies: The following significant accounting policies are in conformity with U.S. generally accepted accounting principles ("GAAP"). Such policies are consistently followed by the Fund in the preparation of its financial statements. GAAP may require management to make estimates and assumptions that affect the reported amounts and disclosures in the financial statements. Actual results may differ from those estimates.
1. Security Valuation: (1) An equity portfolio security listed or traded on an exchange is valued at its latest reported sales price (or at the exchange official closing price if such exchange reports an official closing price), if there were no sales on a given day, the security is valued at the mean between the last reported bid and asked prices; (2) all other equity portfolio securities for which over-the-counter ("OTC") market quotations are readily available are valued at its latest reported sales price. In cases where a security is traded on more than one exchange, the security is valued on the exchange designated as the primary market; (3) certain portfolio securities may be valued by an outside pricing service approved by the Fund's Board of Directors (the "Directors"). The pricing service may utilize a matrix system or other model incorporating attributes such as security quality, maturity and coupon as the evaluation model parameters, and/or research evaluations by its staff, including review of broker-dealer market price quotations in determining what it believes is the fair valuation of the portfolios securities valued by such pricing service; (4) when market quotations are not readily available,
including circumstances under which Morgan Stanley Investment Management Inc. (the "Adviser") determines that the closing price, last sale price or the mean between the last reported bid and asked prices are not reflective of a security's market value, portfolio securities are valued at their fair value as determined in good faith under procedures established by and under the general supervision of the Directors. Occasionally, developments affecting the closing prices of securities and other assets may occur between the times at which valuations of such securities are determined (that is, close of the foreign market on which the securities trade) and the close of business of the New York Stock Exchange ("NYSE"). If developments occur during such periods that are expected to materially affect the value of such securities, such valuations may be adjusted to reflect the estimated fair value of such securities as of the close of the NYSE, as determined in good faith by the Directors or by the Adviser using a pricing service and/or procedures approved by the Directors; (5) quotations of foreign portfolio securities, other assets and liabilities and forward contracts stated in foreign currency are translated into U.S. dollar equivalents at the prevailing market rates prior to the close of the NYSE; (6) investments in mutual funds, including the Morgan Stanley Institutional Liquidity Funds, are valued at the net asset value ("NAV") as of the close of each business day; and (7) short-term debt securities with remaining maturities of 60 days or less at the time of purchase may be valued at amortized cost, unless the Adviser determines such valuation does not reflect the securities' market value, in which case these securities will be valued at their fair market value determined by the Adviser.
The Directors have responsibility for determining in good faith the fair value of the investments, and the Directors may appoint others, such as the Fund's Adviser or a valuation committee, to assist the Directors in determining fair value and to make the actual calculations pursuant to the fair valuation methodologies previously approved by the Directors. Under procedures approved by the Directors, the Fund's Adviser has formed a Valuation Committee whose members are approved by the Directors. The Valuation Committee provides administration and oversight of the Fund's valuation policies and procedures, which are reviewed at least annually by the Directors. These procedures allow the Fund to utilize independent pricing services, quotations from securities and financial instrument dealers, and other market sources to determine fair value.
18
Morgan Stanley Institutional Fund, Inc.
Annual Report — December 31, 2015
Notes to Financial Statements (cont'd)
The Fund has procedures to determine the fair value of securities and other financial instruments for which market prices are not readily available. Under these procedures, the Valuation Committee convenes on a regular and ad hoc basis to review such securities and considers a number of factors, including valuation methodologies and significant unobservable valuation inputs, when arriving at fair value. The Valuation Committee may employ a market-based approach which may use related or comparable assets or liabilities, recent transactions, market multiples, book values, and other relevant information for the investment to determine the fair value of the investment. An income-based valuation approach may also be used in which the anticipated future cash flows of the investment are discounted to calculate fair value. Discounts may also be applied due to the nature or duration of any restrictions on the disposition of the investments. Due to the inherent uncertainty of valuations of such investments, the fair values may differ significantly from the values that would have been used had an active market existed. The Valuation Committee employs various methods for calibrating these valuation approaches including a regular review of valuation methodologies, key inputs and assumptions, transactional back-testing or disposition analysis, and reviews of any related market activity.
2. Fair Value Measurement: Financial Accounting Standards Board ("FASB") Accounting Standards CodificationTM ("ASC") 820, "Fair Value Measurement" ("ASC 820"), defines fair value as the value that the Fund would receive to sell an investment or pay to transfer a liability in a timely transaction with an independent buyer in the principal market, or in the absence of a principal market the most advantageous market for the investment or liability. ASC 820 establishes a three-tier hierarchy to distinguish between (1) inputs that reflect the assumptions market participants would use in valuing an asset or liability developed based on market data obtained from sources independent of the reporting entity (observable inputs) and (2) inputs that reflect the reporting entity's own assumptions about the assumptions market participants would use in valuing an asset or liability developed based on the best information available in the circumstances (unobservable inputs) and to establish classification of fair value measurements for disclosure purposes. Various inputs are used in determining the value of the Fund's
investments. The inputs are summarized in the three broad levels listed below.
• Level 1 – unadjusted quoted prices in active markets for identical investments
• Level 2 – other significant observable inputs (including quoted prices for similar investments, interest rates, prepayment speeds, credit risk, etc.)
• Level 3 – significant unobservable inputs including the Fund's own assumptions in determining the fair value of investments. Factors considered in making this determination may include, but are not limited to, information obtained by contacting the issuer, analysts, or the appropriate stock exchange (for exchange-traded securities), analysis of the issuer's financial statements or other available documents and, if necessary, available information concerning other securities in similar circumstances
The inputs or methodology used for valuing securities are not necessarily an indication of the risk associated with investing in those securities and the determination of the significance of a particular input to the fair value measurement in its entirety requires judgment and considers factors specific to each security.
The following is a summary of the inputs used to value the Portfolio's investments as of December 31, 2015.
Investment Type | Level 1 Unadjusted quoted prices (000) | Level 2 Other significant observable inputs (000) | Level 3 Significant unobservable inputs (000) | Total (000) | |||||||||||||||
Assets: | |||||||||||||||||||
Common Stocks | |||||||||||||||||||
Air Freight & Logistics | $ | — | $ | 3,473 | $ | — | $ | 3,473 | |||||||||||
Airlines | 6,158 | — | — | 6,158 | |||||||||||||||
Banks | 54,036 | 241,009 | — | 295,045 | |||||||||||||||
Beverages | 7,684 | 24,386 | — | 32,070 | |||||||||||||||
Construction Materials | — | 46,830 | — | 46,830 | |||||||||||||||
| Diversified Financial Services | — | 15,338 | — | 15,338 | |||||||||||||||
| Diversified Telecommunication Services | 10,453 | — | — | 10,453 | |||||||||||||||
Electric Utilities | — | 9,410 | — | 9,410 | |||||||||||||||
Electrical Equipment | — | 3,022 | — | 3,022 | |||||||||||||||
Food & Staples Retailing | 6,203 | — | — | 6,203 | |||||||||||||||
Food Products | 7,712 | 59,884 | — | 67,596 | |||||||||||||||
| Health Care Providers & Services | — | 20,011 | — | 20,011 | |||||||||||||||
Industrial Conglomerates | — | 11,091 | — | 11,091 | |||||||||||||||
19
Morgan Stanley Institutional Fund, Inc.
Annual Report — December 31, 2015
Notes to Financial Statements (cont'd)
Investment Type | Level 1 Unadjusted quoted prices (000) | Level 2 Other significant observable inputs (000) | Level 3 Significant unobservable inputs (000) | Total (000) | |||||||||||||||
Common Stocks (cont'd) | |||||||||||||||||||
| Internet Software & Services | $ | 6,209 | $ | — | $ | — | $ | 6,209 | |||||||||||
Pharmaceuticals | — | 8,218 | — | 8,218 | |||||||||||||||
| Wireless Telecommunication Services | — | 34,261 | — | 34,261 | |||||||||||||||
Total Common Stocks | 98,455 | 476,933 | — | 575,388 | |||||||||||||||
Participation Notes | — | 42,343 | — | 42,343 | |||||||||||||||
Short-Term Investment | |||||||||||||||||||
Investment Company | 16,114 | — | — | 16,114 | |||||||||||||||
Total Assets | $ | 114,569 | $ | 519,276 | $ | — | $ | 633,845 | |||||||||||
Transfers between investment levels may occur as the markets fluctuate and/or the availability of data used in an investment's valuation changes. The Portfolio recognizes transfers between the levels as of the end of the period. As of December 31, 2015, securities with a total value of approximately $34,518,000 transferred from Level 1 to Level 2. Securities that were valued using unadjusted quoted prices at December 31, 2014 were valued using other significant observable inputs at December 31, 2015. At December 31, 2015, the fair value of certain securities were adjusted due to developments which occurred between the time of the close of the foreign markets on which they trade and the close of business on the NYSE which resulted in their Level 2 classification.
3. Foreign Currency Translation and Foreign Investments: The books and records of the Portfolio are maintained in U.S. dollars. Foreign currency amounts are translated into U.S. dollars as follows:
– investments, other assets and liabilities at the prevailing rate of exchange on the valuation date;
– investment transactions and investment income at the prevailing rates of exchange on the dates of such transactions.
Although the net assets of the Portfolio are presented at the foreign exchange rates and market values at the close of the period, the Portfolio does not isolate that portion of the results of operations arising as a result of changes in the foreign exchange rates from the fluctuations arising from changes in the market prices of securities held at period end. Similarly, the Portfolio does not isolate the effect of changes in foreign exchange rates from the fluctuations arising from changes in the market prices of securities sold during the period.
Accordingly, realized and unrealized foreign currency gains (losses) on investments in securities are included in the reported net realized and unrealized gains (losses) on investment transactions and balances. However, pursuant to U.S. Federal income tax regulations, gains and losses from certain foreign currency transactions and the foreign currency portion of gains and losses realized on sales and maturities of foreign denominated debt securities are treated as ordinary income for U.S. Federal income tax purposes.
Net realized gains (losses) on foreign currency transactions represent net foreign exchange gains (losses) from foreign currency forward exchange contracts, disposition of foreign currencies, currency gains (losses) realized between the trade and settlement dates on securities transactions, and the difference between the amount of investment income and foreign withholding taxes recorded on the Portfolio's books and the U.S. dollar equivalent amounts actually received or paid. Net unrealized currency gains (losses) from valuing foreign currency denominated assets and liabilities at period end exchange rates are reflected as a component of unrealized appreciation (depreciation) in the Statement of Assets and Liabilities. The change in unrealized currency gains (losses) on foreign currency translations for the period is reflected in the Statement of Operations.
A significant portion of the Portfolio's net assets consist of securities of issuers located in emerging markets, which are denominated in foreign currencies. Such securities may be concentrated in a limited number of countries and regions and may vary throughout the year. Changes in currency exchange rates will affect the value of and investment income from foreign currency denominated securities. Emerging market securities are often subject to greater price volatility, limited capitalization and liquidity, and higher rates of inflation than securities of companies based in the U.S. In addition, emerging market issuers may be subject to substantial governmental involvement in the economy and greater social, economic and political uncertainty.
Governmental approval for foreign investments may be required in advance of making an investment under certain circumstances in some countries, and the extent of foreign investments in domestic companies may be subject to limitation in other countries. Foreign ownership limitations also may be imposed by the charters of individual companies to prevent, among other concerns, violations of
20
Morgan Stanley Institutional Fund, Inc.
Annual Report — December 31, 2015
Notes to Financial Statements (cont'd)
foreign investment limitations. As a result, an additional class of shares (identified as "Foreign" in the Portfolio of Investments) may be created and offered for investment. The "local" and "foreign shares" market values may differ. In the absence of trading of the foreign shares in such markets, the Portfolio values the foreign shares at the closing exchange price of the local shares.
4. Structured Investments: The Portfolio invested a portion of its assets in structured investments. A structured investment is a derivative security designed to offer a return linked to a particular underlying security, currency, commodity or market. Structured investments may come in various forms including notes (such as exchange-traded notes), warrants and options to purchase securities. The Portfolio will typically use structured investments to gain exposure to a permitted underlying security, currency, commodity or market when direct access to a market is limited or inefficient from a tax or cost standpoint. There can be no assurance that structured investments will trade at the same price or have the same value as the underlying security, currency, commodity or market. Investments in structured investments involve risks including issuer risk, counterparty risk and market risk. Holders of structured investments bear risks of the underlying investment and are subject to issuer or counterparty risk because the Portfolio is relying on the creditworthiness of such issuer or counterparty and has no rights with respect to the underlying investment. Certain structured investments may be thinly traded or have a limited trading market and may have the effect of increasing the Portfolio's illiquidity to the extent that the Portfolio, at a particular time, may be unable to find qualified buyers for these securities.
5. Redemption Fees: The Portfolio will assess a 2% redemption fee on Class I shares, Class A shares, Class L shares, Class C shares and Class IS shares, which is paid directly to the Portfolio, for shares redeemed or exchanged within thirty days of purchase, subject to certain exceptions. The redemption fee is designed to protect the Portfolio and its remaining shareholders from the effects of short-term trading. These fees, if any, are included in the Statements of Changes in Net Assets.
6. Indemnifications: The Fund enters into contracts that contain a variety of indemnifications. The Fund's maximum exposure under these arrangements is unknown. However, the Fund has not had prior claims or losses pursuant to these contracts and expects the risk of loss to be remote.
7. Dividends and Distributions to Shareholders: Dividend income and distributions to shareholders are recorded on the ex-dividend date. Dividends from net investment income, if any, are declared and paid annually. Net realized capital gains, if any, are distributed at least annually.
8. Security Transactions, Income and Expenses: Security transactions are accounted for on the trade date (date the order to buy or sell is executed). Realized gains and losses on the sale of investment securities are determined on the specific identified cost method. Dividend income and other distributions are recorded on the ex-dividend date (except for certain foreign dividends which may be recorded as soon as the Portfolio is informed of such dividends) net of applicable withholding taxes. Interest income is recognized on the accrual basis except where collection is in doubt. Discounts are accreted and premiums are amortized over the life of the respective securities. Most expenses of the Fund can be directly attributed to a particular Portfolio. Expenses which cannot be directly attributed are apportioned among the Portfolios based upon relative net assets or other appropriate methods. Income, expenses (other than class specific expenses — distribution and shareholder services, transfer agency and sub transfer agency fees) and realized and unrealized gains or losses are allocated to each class of shares based upon their relative net assets.
B. Advisory Fees: The Adviser, a wholly-owned subsidiary of Morgan Stanley, provides the Portfolio with advisory services under the terms of an Investment Advisory Agreement, paid quarterly, at an annual rate of 1.25% of the daily net assets of the Portfolio.
The Adviser has agreed to reduce its advisory fee and/or reimburse the Portfolio so that total annual portfolio operating expenses, excluding certain investment related expenses, taxes, interest and other extraordinary expenses (including litigation), will not exceed 1.85% for Class I shares, 2.20% for Class A shares, 2.70% for Class L shares, 2.95% for Class C shares and 1.80% for Class IS shares. The fee waivers and/or expense reimbursements will continue for at least one year from the date of the Portfolio's prospectus or until such time as the Directors act to discontinue all or a portion of such waivers and/or reimbursements when they deem such action is appropriate. For the year ended December 31, 2015, approximately $3,000 of other expenses were reimbursed by the Adviser pursuant to this arrangement.
21
Morgan Stanley Institutional Fund, Inc.
Annual Report — December 31, 2015
Notes to Financial Statements (cont'd)
C. Administration Fees: The Adviser also serves as Administrator to the Fund and provides administrative services pursuant to an Administration Agreement for an annual fee, accrued daily and paid monthly, of 0.08% of the Portfolio's average daily net assets.
Under a Sub-Administration Agreement between the Administrator and State Street Bank and Trust Company ("State Street"), State Street provides certain administrative services to the Fund. For such services, the Administrator pays State Street a portion of the fee the Administrator receives from the Portfolio.
D. Distribution and Shareholder Services Fees: Morgan Stanley Distribution, Inc. ("MSDI" or the "Distributor"), a wholly-owned subsidiary of the Adviser and an indirect subsidiary of Morgan Stanley, serves as the Fund's Distributor of Portfolio shares pursuant to a Distribution Agreement. The Fund has adopted a Shareholder Services Plan with respect to Class A shares pursuant to Rule 12b-1 under the Act. Under the Shareholder Services Plan, the Portfolio pays the Distributor a shareholder services fee, accrued daily and paid monthly, at an annual rate of 0.25% of the Portfolio's average daily net assets attributable to Class A shares.
The Fund has adopted a Distribution and Shareholder Services Plan with respect to Class L shares pursuant to Rule 12b-1 under the Act. Under the Distribution and Shareholder Services Plan, the Portfolio pays the Distributor a distribution fee, accrued daily and paid monthly, at an annual rate of 0.50% and a shareholder services fee, accrued daily and paid monthly, at an annual rate of 0.25% of the Portfolio's average daily net assets attributable to Class L shares.
The Fund has adopted a Distribution and Shareholder Services Plan with respect to Class C shares pursuant to Rule 12b-1 under the Act. Under the Distribution and Shareholder Services Plan, the Portfolio pays the Distributor a distribution fee, accrued daily and paid monthly, at an annual rate of 0.75% and a shareholder services fee, accrued daily and paid monthly, at an annual rate of 0.25% of the Portfolio's average daily net assets attributable to Class C shares.
The distribution and shareholder services fees are used to support the expenses associated with servicing and maintaining accounts. The Distributor may compensate other parties for providing shareholder support services to investors who purchase Class A, Class L and Class C shares.
E. Dividend Disbursing and Transfer Agent: The Fund's dividend disbursing and transfer agent is Boston Financial Data Services, Inc. ("BFDS"). Pursuant to a Transfer Agency Agreement,
the Fund pays BFDS a fee based on the number of classes, accounts and transactions relating to the Portfolios of the Fund.
F. Custodian Fees: State Street (the "Custodian") serves as Custodian for the Fund in accordance with a Custodian Agreement. The Custodian holds cash, securities, and other assets of the Fund as required by the Act. Custody fees are payable monthly based on assets held in custody, investment purchases and sales activity and account maintenance fees, plus reimbursement for certain out-of-pocket expenses.
G. Security Transactions and Transactions with Affiliates: For the year ended December 31, 2015, purchases and sales of investment securities for the Portfolio, other than long-term U.S. Government securities and short-term investments, were approximately $331,940,000 and $231,534,000, respectively. There were no purchases and sales of long-term U.S. Government securities for the year ended December 31, 2015.
The Portfolio invests in the Institutional Class of the Morgan Stanley Institutional Liquidity Funds — Money Market Portfolio (the "Liquidity Funds"), an open-end management investment company managed by the Adviser. Advisory fees paid by the Portfolio are reduced by an amount equal to its pro-rata share of the advisory and administration fees paid by the Portfolio due to its investment in the Liquidity Funds. For the year ended December 31, 2015, advisory fees paid were reduced by approximately $17,000 relating to the Portfolio's investment in the Liquidity Funds.
A summary of the Portfolio's transactions in shares of the Liquidity Funds during the year ended December 31, 2015 is as follows:
| Value December 31, 2014 (000) | Purchases at Cost (000) | Sales (000) | Dividend Income (000) | Value December 31, 2015 (000) | |||||||||||||||
| $ | 51,451 | $ | 278,329 | $ | 313,666 | $ | 33 | $ | 16,114 | ||||||||||
During the year ended December 31, 2015, the Portfolio incurred approximately $61,000 in brokerage commissions with Morgan Stanley & Co., LLC, an affiliate of the Adviser/Administrator and Distributor, for portfolio transactions executed on behalf of the Portfolio.
The Portfolio has an unfunded Deferred Compensation Plan (the "Compensation Plan"), which allows each independent Director to defer payment of all, or a portion, of the fees he or she receives for serving on the Board of Directors. Each eligible Director generally may elect to have the deferred amounts credited with a return equal to the total return on one or more of the Morgan Stanley funds that are offered as investment options under the Compensation Plan. Appreciation/depreciation and distributions received
22
Morgan Stanley Institutional Fund, Inc.
Annual Report — December 31, 2015
Notes to Financial Statements (cont'd)
from these investments are recorded with an offsetting increase/decrease in the deferred compensation obligation and do not affect the NAV of the Portfolio.
H. Federal Income Taxes: It is the Portfolio's intention to continue to qualify as a regulated investment company and distribute all of its taxable and tax-exempt income. Accordingly, no provision for Federal income taxes is required in the financial statements.
The Portfolio may be subject to taxes imposed by countries in which it invests. Such taxes are generally based on income and/or capital gains earned or repatriated. Taxes are accrued based on net investment income, net realized gains and net unrealized appreciation as such income and/or gains are earned. Taxes may also be based on transactions in foreign currency and are accrued based on the value of investments denominated in such currency.
FASB ASC 740-10, "Income Taxes — Overall", sets forth a minimum threshold for financial statement recognition of the benefit of a tax position taken or expected to be taken in a tax return. Management has concluded there are no significant uncertain tax positions that would require recognition in the financial statements. If applicable, the Portfolio recognizes interest accrued related to unrecognized tax benefits in "Interest Expense" and penalties in "Other Expenses" in the Statement of Operations. The Portfolio files tax returns with the U.S. Internal Revenue Service, New York and various states. Generally, each of the tax periods from the tax period ended October 31, 2012 through the tax period ended December 31, 2015, remains subject to examination by taxing authorities.
The tax character of distributions paid may differ from the character of distributions shown in the Statements of Changes in Net Assets due to short-term capital gains being treated as ordinary income for tax purposes. The tax character of distributions paid during fiscal 2015 and 2014 was as follows:
| 2015 Distributions Paid From: | 2014 Distributions Paid From: | ||||||||||||||||||||||
| Ordinary Income (000) | Long-Term Capital Gain (000) | Paid-in- Capital (000) | Ordinary Income (000) | Long-Term Capital Gain (000) | Paid-in- Capital (000) | ||||||||||||||||||
| $ | 4,967 | $ | — | $ | 232 | $ | 5,473 | $ | — | $ | 250 | ||||||||||||
The amount and character of income and gains to be distributed are determined in accordance with income tax regulations which may differ from GAAP. These book/tax differences are either considered temporary or permanent in nature.
Temporary differences are attributable to differing book and tax treatments for the timing of the recognition of gains
(losses) on certain investment transactions and the timing of the deductibility of certain expenses.
Permanent differences, primarily due to differing treatments of gains (losses) related to foreign currency transactions and foreign taxes paid on capital gains, resulted in the following reclassifications among the components of net assets at December 31, 2015:
| Distributions in Excess of Net Investment Income (000) | Accumulated Net Realized Loss (000) | Paid-in- Capital (000) | |||||||||
| $ | (1,285 | ) | $ | 1,285 | $ | — | |||||
At December 31, 2015, the Portfolio had no distributable earnings on a tax basis.
At December 31, 2015, the Portfolio had available for Federal income tax purposes unused short-term capital losses of approximately $42,023,000 and long-term capital losses of approximately $20,978,000 that do not have an expiration date.
In addition, at December 31, 2015, the Portfolio had available capital loss carryforwards to offset future net capital gains, to the extent provided by regulations, through the indicated expiration dates:
| Amount (000) | Expiration | ||||||
| $ | 20,010 | December 31, 2017 | |||||
| 4,191 | December 31, 2018 | ||||||
To the extent that capital loss carryforwards are used to offset any future capital gains realized during the carryover period as provided by U.S. Federal income tax regulations, no capital gains tax liability will be incurred by the Portfolio for gains realized and not distributed. To the extent that capital gains are offset, such gains will not be distributed to the shareholders.
Capital losses and specified ordinary losses, including currency losses, incurred after October 31 but within the taxable year are deemed to arise on the first day of the Portfolio's next taxable year. For the year ended December 31, 2015, the Portfolio deferred to January 1, 2016 for U.S. Federal income tax purposes the following losses:
| Post-October Currency and Specified Ordinary Losses (000) | Post-October Capital Losses (000) | ||||||
| $ | 104 | $ | — | ||||
I. Other: At December 31, 2015, the Portfolio had record owners of 10% or greater. Investment activities of these shareholders could have a material impact on the Portfolio. The aggregate percentage of such owners was 59.0%.
23
Morgan Stanley Institutional Fund, Inc.
Annual Report — December 31, 2015
Report of Independent Registered Public Accounting Firm
To the Shareholders and Board of Directors of
Morgan Stanley Institutional Fund, Inc. —
Frontier Emerging Markets Portfolio
We have audited the accompanying statement of assets and liabilities, including the portfolio of investments, of Frontier Emerging Markets Portfolio (one of the portfolios constituting Morgan Stanley Institutional Fund, Inc.) (the "Portfolio") as of December 31, 2015, and the related statement of operations for the year then ended, the statements of changes in net assets for each of the two years in the period then ended and the financial highlights for each of the years or periods indicated therein. These financial statements and financial highlights are the responsibility of the Portfolio's management. Our responsibility is to express an opinion on these financial statements and financial highlights based on our audits.
We conducted our audits in accordance with the standards of the Public Company Accounting Oversight Board (United States). Those standards require that we plan and perform the audit to obtain reasonable assurance about whether the financial statements and financial highlights are free of material misstatement. We were not engaged to perform an audit of the Portfolio's internal control over financial reporting. Our audits included consideration of internal control over financial reporting as a basis for designing audit procedures that are appropriate in the circumstances, but not for the purpose of expressing an opinion on the effectiveness of the Portfolio's internal control over financial reporting. Accordingly, we express no such opinion. An audit also includes examining, on a test basis, evidence supporting the amounts and disclosures in the financial statements and financial highlights, assessing the accounting principles used and significant estimates made by management, and evaluating the overall financial statement presentation. Our procedures included confirmation of securities owned as of December 31, 2015, by correspondence with the custodian and others or by other appropriate auditing procedures where replies from others were not received. We believe that our audits provide a reasonable basis for our opinion.
In our opinion, the financial statements and financial highlights referred to above present fairly, in all material respects, the financial position of Frontier Emerging Markets Portfolio (one of the portfolios constituting Morgan Stanley Institutional Fund, Inc.) at December 31, 2015, the results of its operations for the year then ended, the changes in its net assets for each of the two years in the period then ended and the financial highlights for each of the years or periods indicated therein, in conformity with U.S. generally accepted accounting principles.

Boston, Massachusetts
February 26, 2016
24
Morgan Stanley Institutional Fund, Inc.
Annual Report — December 31, 2015
Federal Tax Notice (unaudited)
For Federal income tax purposes, the following information is furnished with respect to the Portfolio's earnings for its taxable year ended December 31, 2015. When distributed, certain earnings may be subject to a maximum tax rate of 15% as provided for the Jobs and Growth Tax Relief Reconciliation Act of 2003. The Portfolio designated up to a maximum of approximately $7,466,000 as taxable at this lower rate.
The Portfolio intends to pass through foreign tax credits of approximately $2,266,000 and has derived net income from sources within foreign countries amounting to approximately $19,896,000.
In January, the Portfolio provides tax information to shareholders for the preceding calendar year.
25
Morgan Stanley Institutional Fund, Inc.
Annual Report — December 31, 2015
U.S. Privacy Policy (unaudited)
AN IMPORTANT NOTICE CONCERNING OUR U.S. PRIVACY POLICY
This privacy notice describes the U.S. privacy policy of Morgan Stanley Distribution, Inc., and the Morgan Stanley family of mutual funds ("us", "our", "we").
We are required by federal law to provide you with notice of our U.S. privacy policy ("Policy"). This Policy applies to both our current and former clients unless we state otherwise and is intended for individual clients who purchase products or receive services from us for personal, family or household purposes. This Policy is not applicable to partnerships, corporations, trusts or other non-individual clients or account holders, nor is this Policy applicable to individuals who are either beneficiaries of a trust for which we serve as trustee or participants in an employee benefit plan administered or advised by us. This Policy is, however, applicable to individuals who select us to be a custodian of securities or assets in individual retirement accounts, 401(k) accounts, or accounts subject to the Uniform Gifts to Minors Act.
This notice sets out our business practices to protect your privacy; how we collect and share personal information about you; and how you can limit our sharing or certain uses by others of this information. We may amend this Policy at any time, and will inform you of any changes to our Policy as required by law.
WE RESPECT YOUR PRIVACY
We appreciate that you have provided us with your personal financial information and understand your concerns about your information. We strive to safeguard the information our clients entrust to us. Protecting the confidentiality and security of client information is an important part of how we conduct our business.
This notice describes what personal information we collect about you, how we collect it, when we may share it with others, and how certain others may use it. It discusses the steps you may take to limit our sharing of certain information about you with our affiliated companies, including, but not limited to our affiliated banking businesses, brokerage firms and credit service affiliates. It also discloses how you may limit our affiliates' use of shared information for marketing purposes.
Throughout this Policy, we refer to the nonpublic information that personally identifies you as "personal information." We also use the term "affiliated company" in this notice. An affiliated company is a company in our family of companies and includes companies with the Morgan Stanley name. These affiliated companies are financial institutions such as broker-dealers, banks, investment advisers and credit card issuers. We refer to any company that is not an affiliated company as a nonaffiliated third party. For purposes of Section 5 of this notice, and your ability to limit certain uses of personal information by our affiliates, this notice applies to the use of personal information by our affiliated companies.
1. WHAT PERSONAL INFORMATION DO WE COLLECT FROM YOU?
We may collect the following types of information about you: (i) information provided by you, including information from applications and other forms we receive from you, (ii) information about your transactions with us or our affiliates, (iii) information about your transactions with nonaffiliated third parties, (iv) information from consumer reporting agencies, (v) information obtained from our websites, and (vi) information obtained from other sources. For example:
• We collect information such as your name, address, e-mail address, telephone/fax numbers, assets, income and investment objectives through applications and other forms you submit to us.
• We may obtain information about account balances, your use of account(s) and the types of products and services you prefer to receive from us through your dealings and transactions with us and other sources.
• We may obtain information about your creditworthiness and credit history from consumer reporting agencies.
• We may collect background information from and through third-party vendors to verify representations you have made and to comply with various regulatory requirements.
2. WHEN DO WE DISCLOSE PERSONAL INFORMATION WE COLLECT ABOUT YOU?
We may disclose personal information we collect about you in each of the categories listed above to affiliated and nonaffiliated third parties.
26
Morgan Stanley Institutional Fund, Inc.
Annual Report — December 31, 2015
U.S. Privacy Policy (unaudited) (cont'd)
a. Information We Disclose to Affiliated Companies.
We may disclose personal information that we collect about you to our affiliated companies to manage your account(s) effectively, to service and process your transactions, and to let you know about products and services offered by us and affiliated companies, to manage our business, and as otherwise required or permitted by law. Offers for products and services from affiliated companies are developed under conditions designed to safeguard your personal information.
b. Information We Disclose to Third Parties.
We may disclose personal information that we collect about you to nonaffiliated third parties to provide marketing services on our behalf or to other financial institutions with whom we have joint marketing agreements. We may also disclose all of the information we collect to other nonaffiliated third parties for our everyday business purposes, such as to process transactions, maintain account(s), respond to court orders and legal investigations, report to credit bureaus, offer our own products and services, protect against fraud, for institutional risk control, to perform services on our behalf, and as otherwise required or permitted by law.
When we share personal information about you with a nonaffiliated third party, they are required to limit their use of personal information about you to the particular purpose for which it was shared and they are not allowed to share personal information about you with others except to fulfill that limited purpose or as may be permitted or required by law.
3. HOW DO WE PROTECT THE SECURITY AND CONFIDENTIALITY OF PERSONAL INFORMATION WE COLLECT ABOUT YOU?
We maintain physical, electronic and procedural security measures that comply with applicable law and regulations to help safeguard the personal information we collect about you. We have internal policies governing the proper handling of client information by employees. Third parties that provide support or marketing services on our behalf may also receive personal information about you, and we require them to adhere to appropriate security standards with respect to such information.
4. HOW CAN YOU LIMIT OUR SHARING CERTAIN PERSONAL INFORMATION ABOUT YOU WITH OUR AFFILIATED COMPANIES FOR ELIGIBILITY DETERMINATION?
By following the opt-out procedures in Section 6 below, you may limit the extent to which we share with our affiliated companies, personal information that was collected to determine your eligibility for products and services such as your credit reports and other information that you have provided to us or that we may obtain from third parties ("eligibility information"). Eligibility information does not include your identification information or personal information pertaining to our transactions or experiences with you. Please note that, even if you direct us not to share eligibility information with our affiliated companies, we may still share your personal information, including eligibility information, with our affiliated companies under circumstances that are permitted under applicable law, such as to process transactions or to service your account.
5. HOW CAN YOU LIMIT THE USE OF CERTAIN PERSONAL INFORMATION ABOUT YOU BY OUR AFFILIATED COMPANIES FOR MARKETING?
By following the opt-out instructions in Section 6 below, you may limit our affiliated companies from marketing their products or services to you based on personal information we disclose to them. This information may include, for example, your income and account history with us. Please note that, even if you choose to limit our affiliated companies from using personal information about you that we may share with them for marketing their products and services to you, our affiliated companies may use your personal information that they obtain from us to market to you in circumstances permitted by law, such as if the affiliated party has its own relationship with you.
27
Morgan Stanley Institutional Fund, Inc.
Annual Report — December 31, 2015
U.S. Privacy Policy (unaudited) (cont'd)
6. HOW CAN YOU SEND US AN OPT-OUT INSTRUCTION?
If you wish to limit our sharing of eligibility information about you with our affiliated companies, or our affiliated companies' use of personal information for marketing purposes, as described in this notice, you may do so by:
• Calling us at (800) 548-7786
Monday–Friday between 8a.m. and 6p.m. (EST)
• Writing to us at the following address:
Boston Financial Data Services, Inc.
c/o Privacy Coordinator
P.O. Box 219804
Kansas City, Missouri 64121
If you choose to write to us, your request should include: your name, address, telephone number and account number(s) to which the opt-out applies and whether you are opting out with respect to sharing of eligibility information (Section 4 above), or information used for marketing (Section 5 above), or both. Written opt-out requests should not be sent with any other correspondence. In order to process your request, we require that the request be provided by you directly and not through a third party. Once you have informed us about your privacy preferences, your opt-out preference will remain in effect with respect to this Policy (as it may be amended) until you notify us otherwise. If you are a joint account owner, we will accept instructions from any one of you and apply those instructions to the entire account.
Please understand that if you limit our sharing or our affiliated companies' use of personal information, you and any joint account holder(s) may not receive information about our affiliated companies' products and services, including products or services that could help you manage your financial resources and achieve your investment objectives.
If you have more than one account or relationship with us, please specify the accounts to which you would like us to apply your privacy choices. If you have accounts or relationships with our affiliates, you may receive multiple privacy policies from them, and will need to separately notify those companies of your privacy choices for those accounts or relationships.
7. WHAT IF AN AFFILIATED COMPANY BECOMES A NONAFFILIATED THIRD PARTY?
If, at any time in the future, an affiliated company becomes a nonaffiliated third party, further disclosures of personal information made to the former affiliated company will be limited to those described in Section 2(b) above relating to nonaffiliated third parties. If you elected under Section 6 to limit disclosures we make to affiliated companies, or use of personal information by affiliated companies, your election will not apply to use by any former affiliated company of your personal information in their possession once it becomes a nonaffiliated third party.
SPECIAL NOTICE TO RESIDENTS OF VERMONT
The following section supplements our Policy with respect to our individual clients who have a Vermont address and supersedes anything to the contrary in the above Policy with respect to those clients only.
The State of Vermont requires financial institutions to obtain your consent prior to sharing personal information that they collect about you with nonaffiliated third parties, or eligibility information with affiliated companies, other than in certain limited circumstances. Except as permitted by law, we will not share personal information we collect about you with nonaffiliated third parties or eligibility information with affiliated companies, unless you provide us with your written consent to share such information.
SPECIAL NOTICE TO RESIDENTS OF CALIFORNIA
The following section supplements our Policy with respect to our individual clients who have a California address and supersedes anything to the contrary in the above Policy with respect to those clients only.
In response to a California law, if your account has a California home address, your personal information will not be disclosed to nonaffiliated third parties except as permitted by applicable California law, and we will limit sharing such personal information with our affiliates to comply with California privacy laws that apply to us.
28
Morgan Stanley Institutional Fund, Inc.
Annual Report — December 31, 2015
Director and Officer Information (unaudited)
Independent Directors:
| Name, Age and Address of Independent Director | Positions(s) Held with Registrant | Length of Time Served* | Principal Occupation(s) During Past 5 Years and Other Relevant Professional Experience | Number of Portfolios in Fund Complex Overseen by Director** | Other Directorships Held by Independent Director*** | ||||||||||||||||||
| Frank L. Bowman (71) c/o Kramer Levin Naftalis & Frankel LLP Counsel to the Independent Directors 1177 Avenue of the Americas New York, NY 10036 | Director | Since August 2006 | President, Strategic Decisions, LLC (consulting) (since February 2009); Director or Trustee of various Morgan Stanley Funds (since August 2006); Chairperson of the Compliance and Insurance Committee (since October 2015); Formerly, Chairperson of the Insurance Sub-Committee of the Compliance and Insurance Committee (February 2007-December 2015); served as President and Chief Executive Officer of the Nuclear Energy Institute (policy organization) (February 2005-November 2008); retired as Admiral, U.S. Navy after serving over 38 years on active duty including 8 years as Director of the Naval Nuclear Propulsion Program in the Department of the Navy and the U.S. Department of Energy (1996-2004); served as Chief of Naval Personnel (July 1994-September 1996); and on the Joint Staff as Director of Political Military Affairs (June 1992-July1994); knighted as Honorary Knight Commander of the Most Excellent Order of the British Empire; awarded the Officier de l'Orde National du Mérite by the French Government; elected to the National Academy of Engineering (2009). | 98 | Director of BP p.l.c.; Director of Naval and Nuclear Technologies LLP; Director Emeritus of the Armed Services YMCA; Director of the U.S. Naval Submarine League; Member of National Security Advisory Council of the Center for U.S. Global Engagement and a member of the CNA Military Advisory Board; Chairman of the Charity, J Street Cup Golf, Trustee of Fairhaven United Methodist Church; and Director of other various non-profit organizations. | ||||||||||||||||||
| Kathleen A. Dennis (62) c/o Kramer Levin Naftalis & Frankel LLP Counsel to the Independent Directors 1177 Avenue of the Americas New York, NY 10036 | Director | Since August 2006 | President, Cedarwood Associates (mutual fund and investment management consulting) (since July 2006); Chairperson of the Money Market and Alternatives Sub-Committee of the Investment Committee (since October 2006) and Director or Trustee of various Morgan Stanley Funds (since August 2006); formerly, Senior Managing Director of Victory Capital Management (1993-2006). | 98 | Director of various nonprofit organizations. | ||||||||||||||||||
| Nancy C. Everett (61) c/o Kramer Levin Naftalis & Frankel LLP Counsel to the Independent Directors 1177 Avenue of the Americas New York, NY 10036 | Director | Since January 2015 | Chief Executive Officer, Virginia Commonwealth University Investment Company (since November 2015); Owner, OBIR, LLC (investment management consulting) (since June 2014); formerly, Managing Director, BlackRock Inc. (February 2011-December 2013); and Chief Executive Officer, General Motors Asset Management (a/k/a Promark Global Advisors, Inc.) (June 2005-May 2010). | 98 | Member of Virginia Commonwealth University School of Business Foundation; formerly, Member of Virginia Commonwealth University Board of Visitors (2013-2015); Member of Committee on Directors for Emerging Markets Growth Fund, Inc. (2007-2010); Chairperson of Performance Equity Management, LLC (2006-2010); and Chairperson, GMAM Absolute Return Strategies Fund, LLC (2006-2010). | ||||||||||||||||||
29
Morgan Stanley Institutional Fund, Inc.
Annual Report — December 31, 2015
Director and Officer Information (unaudited) (cont'd)
Independent Directors: (cont'd)
| Name, Age and Address of Independent Director | Positions(s) Held with Registrant | Length of Time Served* | Principal Occupation(s) During Past 5 Years and Other Relevant Professional Experience | Number of Portfolios in Fund Complex Overseen by Director** | Other Directorships Held by Independent Director*** | ||||||||||||||||||
| Jakki L. Haussler (58) c/o Kramer Levin Naftalis & Frankel LLP Counsel to the Independent Directors 1177 Avenue of the Americas New York, NY 10036 | Director | Since January 2015 | Chairman and Chief Executive Officer, Opus Capital Group (since January 1996); and formerly, Director, Capvest Venture Fund, LP (May 2000-December 2011); Partner, Adena Ventures, LP (July 1999-December 2010); Director, The Victory Funds (February 2005-July 2008). | 98 | Director of Cincinnati Bell Inc. and Member, Audit Committee and Compensation Committee; Director of Northern Kentucky University Foundation and Member, Investment Committee; Member of Chase College of Law Transactional Law Practice Center Board of Advisors; Director of Best Transport; Chase College of Law Board of Visitors; formerly Member, University of Cincinnati Foundation Investment Committee; Member, Miami University Board of Visitors (2008-2011); Trustee of Victory Funds (2005-2008) and Chairman, Investment Committee (2007-2008) and Member, Service Provider Committee (2005-2008). | ||||||||||||||||||
| Dr. Manuel H. Johnson (67) c/o Johnson Smick International, Inc. 220 I Street, N.E. — Suite 200 Washington, D.C. 20002 | Director | Since July 1991 | Senior Partner, Johnson Smick International, Inc. (consulting firm); Chairperson of the Investment Committee (since October 2006) and Director or Trustee of various Morgan Stanley Funds (since July 1991); Co-Chairman and a founder of the Group of Seven Council (G7C) (international economic commission); formerly Chairperson of the Audit Committee (July 1991-September 2006), Vice Chairman of the Board of Governors of the Federal Reserve System and Assistant Secretary of the U.S. Treasury. | 100 | Director of NVR, Inc. (home construction). | ||||||||||||||||||
| Joseph J. Kearns (73) c/o Kearns & Associates LLC 23823 Malibu Road S-50-440 Malibu, CA 90265 | Director | Since August 1994 | President, Kearns & Associates LLC (investment consulting); Chairperson of the Audit Committee (since October 2006) and Director or Trustee of various Morgan Stanley Funds (since August 1994); formerly, Deputy Chairperson of the Audit Committee (July 2003-September 2006) and Chairperson of the Audit Committee of various Morgan Stanley Funds (since August 1994); CFO of the J. Paul Getty Trust. | 101 | Director of Electro Rent Corporation (equipment leasing). Prior to December 31, 2013, Director of The Ford Family Foundation. | ||||||||||||||||||
30
Morgan Stanley Institutional Fund, Inc.
Annual Report — December 31, 2015
Director and Officer Information (unaudited) (cont'd)
Independent Directors: (cont'd)
| Name, Age and Address of Independent Director | Positions(s) Held with Registrant | Length of Time Served* | Principal Occupation(s) During Past 5 Years and Other Relevant Professional Experience | Number of Portfolios in Fund Complex Overseen by Director** | Other Directorships Held by Independent Director*** | ||||||||||||||||||
| Michael F. Klein (57) c/o Kramer Levin Naftalis & Frankel LLP Counsel to the Independent Directors 1177 Avenue of the Americas New York, NY 10036 | Director | Since August 2006 | Managing Director, Aetos Capital, LLC (since March 2000); Co-President, Aetos Alternatives Management, LLC (since January 2004); and Co-Chief Executive Officer of Aetos Capital LLC (since August 2013); Chairperson of the Fixed Income Sub-Committee of the Investment Committee (since October 2006) and Director or Trustee of various Morgan Stanley Funds (since August 2006); formerly, Managing Director, Morgan Stanley & Co. Inc. and Morgan Stanley Dean Witter Investment Management, President, various Morgan Stanley Funds (June1998-March 2000) and Principal, Morgan Stanley & Co. Inc. and Morgan Stanley Dean Witter Investment Management (August 1997-December 1999). | 97 | Director of certain investment funds managed or sponsored by Aetos Capital, LLC. Director of Sanitized AG and Sanitized Marketing AG (specialty chemicals). | ||||||||||||||||||
| Michael E. Nugent (79) 522 Fifth Avenue New York, NY 10036 | Chair of the Board and Director | Chair of the Boards since July 2006 and Director since July 1991 | Chair of the Boards of various Morgan Stanley Funds (since July 2006); Chairperson of the Closed-End Fund Committee (since June 2012) and Director or Trustee of various Morgan Stanley Funds (since July 1991); formerly, Chairperson of the Insurance Committee (until July 2006), General Partner, TriumphCapital, L.P. (private investment partnership) (1988-2013). | 100 | None. | ||||||||||||||||||
| W. Allen Reed (68) c/o Kramer Levin Naftalis & Frankel LLP Counsel to the Independent Directors 1177 Avenue of the Americas New York, NY 10036 | Director | Since August 2006 | Chairperson of the Equity Sub-Committee of the Investment Committee (since October 2006) and Director or Trustee of various Morgan Stanley Funds (since August 2006); formerly, President and CEO of General Motors Asset Management; Chairman and Chief Executive Officer of the GM Trust Bank and Corporate Vice President of General Motors Corporation (August 1994-December 2005). | 98 | Director of Legg Mason, Inc.; formerly Director of the Auburn University Foundation (2010-2015). | ||||||||||||||||||
| Fergus Reid (83) c/o Joe Pietryka, Inc. 85 Charles Colman Blvd. Pawling, NY 12564 | Director | Since June 1992 | Chairman, Joe Pietryka, Inc.; Chairperson of the Governance Committee and Director or Trustee of various Morgan Stanley Funds (since June 1992). | 100 | Formerly, Trustee and Director of certain investment companies in the JP Morgan Fund Complex managed by JP Morgan Investment Management Inc. (1987-2012). | ||||||||||||||||||
31
Morgan Stanley Institutional Fund, Inc.
Annual Report — December 31, 2015
Director and Officer Information (unaudited) (cont'd)
Interested Director:
| Name, Age and Address of Interested Director | Positions(s) Held with Registrant | Length of Time Served* | Principal Occupation(s) During Past 5 Years | Number of Portfolios in Fund Complex Overseen by Interested Director** | Other Directorships Held by Interested Director*** | ||||||||||||||||||
| James F. Higgins (68) One New York Plaza, New York, NY 10004 | Director | Since June 2000 | Director or Trustee of various Morgan Stanley Funds (since June 2000); Senior Advisor of Morgan Stanley (since August 2000). | 99 | Formerly, Director of AXA Financial, Inc. and AXA Equitable Life Insurance Company (2002-2011) and Director of AXA MONY Life Insurance Company and AXA MONY Life Insurance Company of America (2004-2011). | ||||||||||||||||||
* This is the earliest date the Director began serving the Morgan Stanley Funds. Each Director serves an indefinite term, until his or her successor is elected.
** The Fund Complex includes (as of December 31, 2015) all open-end and closed-end funds (including all of their portfolios) advised by Morgan Stanley Investment Management Inc. (the "Adviser") and any funds that have an adviser that is an affiliated person of the Adviser (including, but not limited to, Morgan Stanley AIP GP LP).
*** This includes any directorships at public companies and registered investment companies held by the Director at any time during the past five years.
Executive Officers:
Name, Age and Address of Executive Officer | Position(s) Held with Registrant | Length of Time Served**** | Principal Occupation(s) During Past 5 Years | ||||||||||||
| John H. Gernon (52) 522 Fifth Avenue New York, NY 10036 | President and Principal Executive Officer | Since September 2013 | President and Principal Executive Officer of the Equity and Fixed Income Funds and the Morgan Stanley AIP Funds (since September 2013) and the Liquidity Funds and various money market funds (since May 2014) in the Fund Complex, Managing Director of the Adviser; Head of Product (since 2006). | ||||||||||||
| Stefanie V. Chang Yu (49) 522 Fifth Avenue New York, NY 10036 | Chief Compliance Officer | Since December 1997 | Managing Director of the Adviser and various entities affiliated with the Adviser; Chief Compliance Officer of various Morgan Stanley Funds and the Adviser (since January 2014); formerly, Vice President of various Morgan Stanley Funds (December 1997-January 2014). | ||||||||||||
| Joseph C. Benedetti (50) 522 Fifth Avenue New York, NY 10036 | Vice President | Since January 2014 | Managing Director of the Adviser and various entities affiliated with the Adviser; Vice President of various Morgan Stanley Funds (since January 2014); formerly, Assistant Secretary of various Morgan Stanley Funds (October 2004-January 2014). | ||||||||||||
| Francis J. Smith (50) 522 Fifth Avenue New York, NY 10036 | Treasurer and Principal Financial Officer | Treasurer since July 2003 and Principal Financial Officer since September 2002 | Executive Director of the Adviser and various entities affiliated with the Adviser; Treasurer (since July 2003) and Principal Financial Officer of various Morgan Stanley Funds (since September 2002). | ||||||||||||
| Mary E. Mullin (48) 522 Fifth Avenue New York, NY 10036 | Secretary | Since June 1999 | Executive Director of the Adviser; Secretary of various Morgan Stanley Funds (since June 1999). | ||||||||||||
**** This is the earliest date the officer began serving the Morgan Stanley Funds. Each officer serves a one-year term, until his or her successor is elected and has qualified.
32
Morgan Stanley Institutional Fund, Inc.
Annual Report — December 31, 2015
Adviser and Administrator
Morgan Stanley Investment Management Inc.
522 Fifth Avenue
New York, New York 10036
Distributor
Morgan Stanley Distribution, Inc.
522 Fifth Avenue
New York, New York 10036
Dividend Disbursing and Transfer Agent
Boston Financial Data Services, Inc.
2000 Crown Colony Drive
Quincy, Massachusetts 02169
Custodian
State Street Bank and Trust Company
One Lincoln Street
Boston, Massachusetts 02111
Legal Counsel
Dechert LLP
1095 Avenue of the Americas
New York, New York 10036
Counsel to the Independent Directors
Kramer Levin Naftalis & Frankel LLP
1177 Avenue of the Americas
New York, New York 10036
Independent Registered Public Accounting Firm
Ernst & Young LLP
200 Clarendon Street
Boston, Massachusetts 02116
Reporting to Shareholders
Each Morgan Stanley fund provides a complete schedule of portfolio holdings in its semi-annual and annual reports within 60 days of the end of the fund's second and fourth fiscal quarters. The semi-annual and annual reports are filed electronically with the Securities and Exchange Commission (SEC) on Form N-CSRS and Form N-CSR, respectively. Morgan Stanley also delivers the semi-annual and annual reports to fund shareholders and makes these reports available on its public website, www.morganstanley.com/im. Each Morgan Stanley fund also files a complete schedule of portfolio holdings with the SEC for the fund's first and third fiscal quarters on Form N-Q. Morgan Stanley does not deliver the reports for the first and third fiscal quarters to shareholders, nor are the reports posted to the Morgan Stanley public website. You may, however, obtain the Form N-Q filings (as well as the Form N-CSR and N-CSRS filings) by accessing the SEC's website, www.sec.gov. You may also review and copy them at the SEC's Public Reference Room in Washington, DC. Information on the operation of the SEC's Public Reference Room may be obtained by calling the SEC toll free at 1 (800) SEC-0330. You can also request copies of these materials, upon payment of a duplicating fee, by electronic request at the SEC's email address (publicinfo@sec.gov) or by writing the Public Reference Room of the SEC, Washington, DC 20549-0102.
Proxy Voting Policies and Procedures and Proxy Voting Record
You may obtain a copy of the Fund's Proxy Voting Policy and Procedures and information regarding how the Fund voted proxies relating to portfolio securities during the most recent twelve-month period ended June 30, without charge, upon request, by calling toll free 1 (800) 548-7786 or by visiting our website at www.morganstanley.com/im. This information is also available on the SEC's website at www.sec.gov.
This report is authorized for distribution only when preceded or accompanied by a prospectus of the Morgan Stanley Institutional Fund, Inc., which describes in detail each Portfolio's investment policies, risks, fees and expenses. Please read the prospectus carefully before you invest or send money. For additional information, including information regarding the investments comprising the Portfolio, please visit our website at www.morganstanley.com/im or call toll free 1 (800) 548-7786.
33
Printed in U.S.A.
This Report has been prepared for shareholders and may be distributed to others only if preceded or accompanied by a current prospectus.
Morgan Stanley Investment Management Inc.
522 Fifth Avenue
New York, New York 10036
© 2016 Morgan Stanley. Morgan Stanley Distribution, Inc.

IFIFEMANN
1407565 EXP. 02.28.17
INVESTMENT MANAGEMENT

Morgan Stanley Institutional Fund, Inc.
Global Quality Portfolio
Annual Report
December 31, 2015

Morgan Stanley Institutional Fund, Inc.
Annual Report — December 31, 2015
Table of Contents
Shareholders' Letter | 2 | ||||||
Expense Example | 3 | ||||||
Investment Overview | 4 | ||||||
Portfolio of Investments | 6 | ||||||
Statement of Assets and Liabilities | 7 | ||||||
Statement of Operations | 9 | ||||||
Statements of Changes in Net Assets | 10 | ||||||
Financial Highlights | 12 | ||||||
Notes to Financial Statements | 17 | ||||||
Report of Independent Registered Public Accounting Firm | 23 | ||||||
Federal Tax Notice | 24 | ||||||
U.S. Privacy Policy | 25 | ||||||
Director and Officer Information | 28 | ||||||
This report is authorized for distribution only when preceded or accompanied by prospectuses of the Morgan Stanley Institutional Fund, Inc. To receive a prospectus and/or statement of additional information (SAI), which contains more complete information such as investment objectives, charges, expenses, policies for voting proxies, risk considerations, and describes in detail each of the Portfolio's investment policies to the prospective investor, please call toll free 1 (800) 548-7786. Please read the prospectuses carefully before you invest or send money.
Additionally, you can access portfolio information including performance, characteristics, and investment team commentary through Morgan Stanley Investment Management's website: www.morganstanley.com/im.
Market forecasts provided in this report may not necessarily come to pass. There is no guarantee that any sectors mentioned will continue to perform as discussed herein or that securities in such sectors will be held by the Portfolio in the future. There is no assurance that a Portfolio will achieve its investment objective. Portfolios are subject to market risk, which is the possibility that market values of securities owned by the Portfolio will decline and, therefore, the value of the Portfolio's shares may be less than what you paid for them. Accordingly, you can lose money investing in this Portfolio. Please see the prospectus for more complete information on investment risks.
1
Morgan Stanley Institutional Fund, Inc.
Annual Report — December 31, 2015
Shareholders' Letter (unaudited)
Dear Shareholders,
We are pleased to provide this Annual report, in which you will learn how your investment in Global Quality Portfolio (the "Portfolio") performed during the latest twelve-month period.
Morgan Stanley Investment Management is a client-centric, investor-led organization. Our global presence, intellectual capital, and breadth of products and services enable us to partner with investors to meet the evolving challenges of today's financial markets. We aim to deliver superior investment service and to empower our clients to make the informed decisions that help them reach their investment goals.
As always, we thank you for selecting Morgan Stanley Investment Management, and look forward to working with you in the months and years ahead.
Sincerely,

John H. Gernon
President and Principal Executive Officer
January 2016
2
Morgan Stanley Institutional Fund, Inc.
Annual Report — December 31, 2015
Expense Example (unaudited)
Global Quality Portfolio
As a shareholder of the Portfolio, you incur two types of costs: (1) transactional costs; and (2) ongoing costs, including advisory fees, administration fees, distribution and shareholder services fees and other Portfolio expenses. This example is intended to help you understand your ongoing costs (in dollars) of investing in the Portfolio and to compare these costs with the ongoing costs of investing in other mutual funds.
This example is based on an investment of $1,000 invested at the beginning of the six-month period ended December 31, 2015 and held for the entire six-month period.
Actual Expenses
The table below provides information about actual account values and actual expenses. You may use the information in this table, together with the amount you invested, to estimate the expenses that you paid over the period. Simply divide your account value by $1,000 (for example, an $8,600 account value divided by $1,000 = 8.6), then multiply the result by the number in the table under the heading entitled "Actual Expenses Paid During Period" to estimate the expenses you paid on your account during this period.
Hypothetical Example for Comparison Purposes
The table below provides information about hypothetical account values and hypothetical expenses based on the Portfolio's actual expense ratio and an assumed rate of return of 5% per year before expenses, which is not the Portfolio's actual return. The hypothetical account values and expenses may not be used to estimate the actual ending account balance or expenses you paid for the period. You may use this information to compare the ongoing costs of investing in the Portfolio and other funds. To do so, compare this 5% hypothetical example with the 5% hypothetical examples that appear in the shareholder reports of the other funds.
Please note that the expenses shown in the table are meant to highlight your ongoing costs only and do not reflect any transactional costs, such as sales charges (loads). Therefore, the information for each class in the table is useful in comparing ongoing costs only, and will not help you determine the relative total costs of owning different funds. In addition, if these transactional costs were included, your costs would have been higher.
| Beginning Account Value 7/1/15 | Actual Ending Account Value 12/31/15 | Hypothetical Ending Account Value | Actual Expenses Paid During Period* | Hypothetical Expenses Paid During Period* | Net Expense Ratio During Period** | ||||||||||||||||||||||
Global Quality Portfolio Class I | $ | 1,000.00 | $ | 1,025.50 | $ | 1,020.27 | $ | 5.00 | $ | 4.99 | 0.98 | % | |||||||||||||||
Global Quality Portfolio Class A | 1,000.00 | 1,023.70 | 1,018.50 | 6.78 | 6.77 | 1.33 | |||||||||||||||||||||
Global Quality Portfolio Class L | 1,000.00 | 1,021.30 | 1,015.93 | 9.37 | 9.35 | 1.84 | |||||||||||||||||||||
Global Quality Portfolio Class C | 1,000.00 | 1,019.50 | 1,014.62 | 10.69 | 10.66 | 2.10 | |||||||||||||||||||||
Global Quality Portfolio Class IS | 1,000.00 | 1,025.70 | 1,020.42 | 4.85 | 4.84 | 0.95 | |||||||||||||||||||||
* Expenses are calculated using each Portfolio Class' annualized net expense ratio (as disclosed), multiplied by the average account value over the period, and multiplied by 184/365 (to reflect the most recent one-half year period).
** Annualized.
3
Morgan Stanley Institutional Fund, Inc.
Annual Report — December 31, 2015
Investment Overview (unaudited)
Global Quality Portfolio
The Portfolio seeks long-term capital appreciation.
Performance
For the year ended December 31, 2015, the Portfolio's Class I shares had a total return based on net asset value and reinvestment of distributions per share of 5.27%, net of fees. The Portfolio's Class I shares outperformed the Portfolio's benchmark, the MSCI World Index (the "Index"), which returned –0.87%.
Factors Affecting Performance
• After stocks looked into the void in September, the fourth quarter of 2015 started with a strong rally in October, followed by a relatively uneventful November and then fell again in December. After all was said and done, the Index ended the year down 0.9% in U.S. dollar (USD) terms (+2.1% in local currency) as a strong U.S. dollar continued to impact local market returns and fears of a China slowdown continued to add to volatility.
• In 2015, notable developed market laggards were the countries most exposed to the commodity complex: Canada (–24.2% in USD), Norway (–15.0%) and Australia (–10.0%). Some of the best performers were Denmark (+23.4%), Ireland (+16.5%) and Belgium (+12.1%). Benefiting from additional quantitative easing, Japan delivered decent performance, up 9.6% for the year; however, the eurozone (–2.8%) and the UK (–7.6%) underperformed. The U.S. was modestly up over the full year (+0.7%). Turning to developing markets, the MSCI Emerging Markets Index was down 15% for the year, with Greece (–61%) and Latin America (–31%) inflicting much of the damage. China ended the year down 7.8%, and Russia eased back into positive territory, up 4.2%.(i) (All country and regional performance is represented by the respective MSCI index in U.S. dollar terms.)
• On a sector basis, for the year, the Index was led by health care (+6.6%), consumer staples (+6.4%) and consumer discretionary (+5.5%), while energy (–22.8%), materials (–15.3%) and utilities (–6.6%) were the biggest laggards.
• The Portfolio outperformed the Index significantly for the year thanks to both sector allocation and stock selection. For stock selection, outperformance in information technology and consumer staples comfortably outweighed the underperformance in consumer discretionary and health care. Sector allocation was very strong as the major overweight in consumer staples, zero weights in energy, materials and utilities, and underweight financials all helped.
• Top absolute contributors to the Portfolio's performance for the year were Alphabet (formerly Google), Microsoft and Reckitt Benckiser. Top absolute detractors for the period were Twenty-First Century Fox, Time Warner and Procter & Gamble.(ii)
Management Strategies
• This time last year we identified a litany of problems facing equity markets — ranging from high valuations and earnings risk, to emerging markets malaise, to an underlying, likely destructive, tide of disinflation or outright deflation that showed few signs of abating. Suffice it to say that none of these have gone away. Rather, existing problems have intensified, new ones have emerged, and there are few hiding places across increasingly correlated asset classes.
• This difficult macro outlook and the gathering deflationary clouds are hardly a propitious backdrop for us as bottom-up stock pickers, as they present an increasingly difficult outlook for the companies we invest in — or hope to invest in. We are, of course, used to uncertainty, and this uncertainty is not in itself problematic, provided one is given a good margin of relative safety on valuation to hold an existing stock or invest in a new stock idea.
• For the Portfolio's existing holdings, we are not generally overly concerned about what we consider our highest-quality stocks, such as those in the consumer staples sector or pharmaceuticals industry, where the investment proposition amounts to seeking to own quality companies at fair prices,
(i) Country and sector performance data from FactSet.
(ii) The information contained in this overview regarding specific securities is for informational purposes only and should not be construed as a recommendation to purchase or sell the securities mentioned.
4
Morgan Stanley Institutional Fund, Inc.
Annual Report — December 31, 2015
Investment Overview (unaudited) (cont'd)
Global Quality Portfolio
albeit with some concerns such as emerging markets exposure and U.S. drug pricing, among others.
• As for new opportunities generally, the pickings are slim. We continue to concentrate on what we consider the higher-quality stocks in the higher-quality sectors, which combine steady, if moderate, top-line growth through recurring revenues, sustainable high margins through pricing power, and the ability to generate cash through high returns on unlevered capital. While not offering a perfect defense against any general market de-rating in the short-term, we believe these companies could continue to compound their earnings steadily, while throwing off cash, which could mitigate the impact of any de-rating in the medium-term. Overall for now, our approach continues to be not to blow the lights out, but just to keep the lights burning.

* Minimum Investment for Class I shares
** Commenced Operations on August 30, 2013.
In accordance with SEC regulations, the Portfolio's performance shown assumes that all recurring fees (including management fees) were deducted and all dividends and distributions were reinvested. The performance of Class A, L, C and IS shares will vary from the performance of Class I shares based upon their different inception dates and will be impacted by additional fees assessed to those classes (if applicable).
Performance Compared to the MSCI World Index(1) and the Lipper Global Large-Cap Growth Funds Index(2)
| Period Ended December 31, 2015 Total Returns(3) | |||||||||||||||||||
| One Year | Five Years | Ten Years | Since Inception(7) | ||||||||||||||||
| Portfolio — Class I Shares w/o sales charges(4) | 5.27 | % | — | — | 8.84 | % | |||||||||||||
| Portfolio — Class A Shares w/o sales charges(4) | 4.91 | — | — | 8.50 | |||||||||||||||
| Portfolio — Class A Shares with maximum 5.25% sales charges(4) | –0.62 | — | — | 6.04 | |||||||||||||||
| Portfolio — Class L Shares w/o sales charges(4) | 4.49 | — | — | 7.96 | |||||||||||||||
| Portfolio — Class C Shares w/o sales charges(6) | — | — | — | –0.13 | |||||||||||||||
| Portfolio — Class C Shares with maximum 1.00% deferred sales charges(6) | — | — | — | –1.09 | |||||||||||||||
| Portfolio — Class IS Shares w/o sales charges(5) | 5.38 | — | — | 7.75 | |||||||||||||||
MSCI World Index | –0.87 | — | — | 7.32 | |||||||||||||||
| Lipper Global Large-Cap Growth Funds Index | 1.76 | — | — | 7.93 | |||||||||||||||
Performance data quoted represents past performance, which is no guarantee of future results, and current performance may be lower or higher than the figures shown. Performance assumes that all dividends and distributions, if any, were reinvested. For the most recent month-end performance figures, please visit www.morganstanley.com/im. Investment return and principal value will fluctuate so that Portfolio shares, when redeemed, may be worth more or less than their original cost. Total returns do not reflect the deduction of taxes that a shareholder would pay on Portfolio distributions or the redemption of Portfolio shares. Returns for periods less than one year are not annualized. Performance of share classes will vary due to difference in expenses.
(1) The MSCI World Index is a free float-adjusted market capitalization weighted index designed to measure the equity market performance of developed markets. The term "free float" represents the portion of shares outstanding that are deemed to be available for purchase in the public equity markets by investors. The MSCI World Index currently consists of 23 developed market country indices. The performance of the Index is listed in US dollars and assumes reinvestment of net dividends. The Index is unmanaged and its returns do not include any sales charges or fees. Such costs would lower performance. It is not possible to invest directly in an index.
(2) The Lipper Global Large-Cap Growth Funds Index is an equally weighted performance index of the largest qualifying funds (based on net assets) in the Lipper Global Large-Cap Growth Funds classification. The Index, which is adjusted for capital gains distributions and income dividends, is unmanaged and should not be considered an investment. There are currently 10 funds represented in this Index. As of the date of this report, the Portfolio is in the Lipper Global Large-Cap Growth Funds classification.
(3) Total returns for the Portfolio reflect fees waived and expenses reimbursed, if applicable, by the Adviser. Without such waivers and reimbursements, total returns would have been lower.
(4) Commenced operations on August 30, 2013.
(5) Commenced offering on September 13, 2013.
(6) Commenced offering on April 30, 2015.
(7) For comparative purposes, average annual since inception returns listed for the Indexes refer to the inception date of Class I of the Portfolio, not the inception of the Index.
5
Morgan Stanley Institutional Fund, Inc.
Annual Report — December 31, 2015
Portfolio of Investments
Global Quality Portfolio
Shares | Value (000) | ||||||||||
Common Stocks (97.0%) | |||||||||||
France (6.7%) | |||||||||||
L'Oreal SA | 1,932 | $ | 325 | ||||||||
Pernod Ricard SA | 2,085 | 237 | |||||||||
Publicis Groupe SA | 2,420 | 161 | |||||||||
Sanofi | 3,563 | 304 | |||||||||
1,027 | |||||||||||
Germany (3.3%) | |||||||||||
Bayer AG (Registered) | 2,171 | 272 | |||||||||
SAP SE | 2,960 | 236 | |||||||||
508 | |||||||||||
Japan (1.8%) | |||||||||||
Japan Tobacco, Inc. | 7,300 | 268 | |||||||||
Netherlands (0.6%) | |||||||||||
RELX N.V. | 5,598 | 94 | |||||||||
Switzerland (11.7%) | |||||||||||
Nestle SA (Registered) | 10,598 | 786 | |||||||||
Novartis AG (Registered) | 6,302 | 539 | |||||||||
Roche Holding AG (Genusschein) | 1,696 | 467 | |||||||||
1,792 | |||||||||||
United Kingdom (18.4%) | |||||||||||
British American Tobacco PLC | 11,827 | 657 | |||||||||
Experian PLC | 6,926 | 122 | |||||||||
GlaxoSmithKline PLC | 17,402 | 351 | |||||||||
Prudential PLC | 7,593 | 170 | |||||||||
Reckitt Benckiser Group PLC | 8,920 | 821 | |||||||||
RELX PLC | 5,400 | 95 | |||||||||
Unilever PLC | 13,701 | 587 | |||||||||
2,803 | |||||||||||
United States (54.5%) | |||||||||||
3M Co. | 1,021 | 154 | |||||||||
Accenture PLC, Class A | 5,418 | 566 | |||||||||
Alphabet, Inc., Class A (a) | 1,057 | 822 | |||||||||
Altria Group, Inc. | 9,265 | 539 | |||||||||
Automatic Data Processing, Inc. | 3,350 | 284 | |||||||||
Danaher Corp. | 4,189 | 389 | |||||||||
Intuit, Inc. | 868 | 84 | |||||||||
Johnson & Johnson | 5,874 | 603 | |||||||||
Microsoft Corp. | 18,693 | 1,037 | |||||||||
Mondelez International, Inc., Class A | 10,811 | 485 | |||||||||
Moody's Corp. | 820 | 82 | |||||||||
Nielsen Holdings PLC | 8,293 | 387 | |||||||||
NIKE, Inc., Class B | 3,268 | 204 | |||||||||
Philip Morris International, Inc. | 2,143 | 189 | |||||||||
Reynolds American, Inc. | 12,808 | 591 | |||||||||
Time Warner, Inc. | 5,733 | 371 | |||||||||
Twenty-First Century Fox, Inc., Class A | 8,693 | 236 | |||||||||
Twenty-First Century Fox, Inc., Class B | 13,007 | 354 | |||||||||
Visa, Inc., Class A | 6,083 | 472 | |||||||||
Walt Disney Co. (The) | 4,609 | 484 | |||||||||
8,333 | |||||||||||
Total Common Stocks (Cost $13,896) | 14,825 | ||||||||||
Shares | Value (000) | ||||||||||
Short-Term Investment (2.0%) | |||||||||||
Investment Company (2.0%) | |||||||||||
| Morgan Stanley Institutional Liquidity Funds — Treasury Securities Portfolio — Institutional Class (See Note G) (Cost $309) | 309,060 | $ | 309 | ||||||||
Total Investments (99.0%) (Cost $14,205) (b)(c) | 15,134 | ||||||||||
Other Assets in Excess of Liabilities (1.0%) | 150 | ||||||||||
Net Assets (100.0%) | $ | 15,284 | |||||||||
(a) Non-income producing security.
(b) The approximate fair value and percentage of net assets, $6,492,000 and 42.5%, respectively, represent the securities that have been fair valued under the fair valuation policy for international investments as described in Note A-1 within the Notes to the Financial Statements.
(c) At December 31, 2015, the aggregate cost for Federal income tax purposes is approximately $14,365,000. The aggregate gross unrealized appreciation is approximately $1,117,000 and the aggregate gross unrealized depreciation is approximately $348,000 resulting in net unrealized appreciation of approximately $769,000.
Portfolio Composition
Classification | Percentage of Total Investments | ||||||
Pharmaceuticals | 16.8 | % | |||||
Tobacco | 14.8 | ||||||
Other* | 13.6 | ||||||
Media | 11.9 | ||||||
Software | 9.0 | ||||||
Information Technology Services | 8.7 | ||||||
Food Products | 8.4 | ||||||
Personal Products | 6.0 | ||||||
Internet Software & Services | 5.4 | ||||||
Household Products | 5.4 | ||||||
Total Investments | 100.0 | % | |||||
* Industries and/or investment types representing less than 5% of total investments.
The accompanying notes are an integral part of the financial statements.
6
Morgan Stanley Institutional Fund, Inc.
Annual Report — December 31, 2015
Global Quality Portfolio
Statement of Assets and Liabilities | December 31, 2015 (000) | ||||||
Assets: | |||||||
Investments in Securities of Unaffiliated Issuers, at Value (Cost $13,896) | $ | 14,825 | |||||
Investment in Security of Affiliated Issuer, at Value (Cost $309) | 309 | ||||||
Total Investments in Securities, at Value (Cost $14,205) | 15,134 | ||||||
Foreign Currency, at Value (Cost —@) | — | @ | |||||
Due from Adviser | 70 | ||||||
Tax Reclaim Receivable | 37 | ||||||
Dividends Receivable | 32 | ||||||
Receivable for Portfolio Shares Sold | 23 | ||||||
Receivable from Affiliate | — | @ | |||||
Other Assets | 33 | ||||||
Total Assets | 15,329 | ||||||
Liabilities: | |||||||
Payable for Professional Fees | 17 | ||||||
Payable for Custodian Fees | 16 | ||||||
Payable for Shareholder Services Fees — Class A | 1 | ||||||
Payable for Distribution and Shareholder Services Fees — Class L | 2 | ||||||
Payable for Distribution and Shareholder Services Fees — Class C | 1 | ||||||
Payable for Sub Transfer Agency Fees — Class I | — | @ | |||||
Payable for Sub Transfer Agency Fees — Class A | — | @ | |||||
Payable for Sub Transfer Agency Fees — Class L | 1 | ||||||
Payable for Sub Transfer Agency Fees — Class C | — | @ | |||||
Payable for Transfer Agency Fees — Class I | — | @ | |||||
Payable for Transfer Agency Fees — Class A | — | @ | |||||
Payable for Transfer Agency Fees — Class L | — | @ | |||||
Payable for Transfer Agency Fees — Class C | — | @ | |||||
Payable for Administration Fees | 1 | ||||||
Other Liabilities | 6 | ||||||
Total Liabilities | 45 | ||||||
Net Assets | $ | 15,284 | |||||
Net Assets Consist Of: | |||||||
Paid-in-Capital | $ | 14,298 | |||||
Accumulated Undistributed Net Investment Income | 7 | ||||||
Accumulated Net Realized Gain | 54 | ||||||
Unrealized Appreciation (Depreciation) on: | |||||||
Investments | 929 | ||||||
Foreign Currency Translations | (4 | ) | |||||
Net Assets | $ | 15,284 | |||||
The accompanying notes are an integral part of the financial statements.
7
Morgan Stanley Institutional Fund, Inc.
Annual Report — December 31, 2015
Global Quality Portfolio
Statement of Assets and Liabilities (cont'd) | December 31, 2015 (000) | ||||||
CLASS I: | |||||||
Net Assets | $ | 8,531 | |||||
| Shares Outstanding $0.001 par value shares of beneficial interest (unlimited shares authorized) (not in 000's) | 746,583 | ||||||
Net Asset Value, Offering and Redemption Price Per Share | $ | 11.43 | |||||
CLASS A: | |||||||
Net Assets | $ | 3,246 | |||||
| Shares Outstanding $0.001 par value shares of beneficial interest (unlimited shares authorized) (not in 000's) | 284,613 | ||||||
Net Asset Value, Redemption Price Per Share | $ | 11.40 | |||||
Maximum Sales Load | 5.25 | % | |||||
Maximum Sales Charge | $ | 0.63 | |||||
Maximum Offering Price Per Share | $ | 12.03 | |||||
CLASS L: | |||||||
Net Assets | $ | 2,848 | |||||
| Shares Outstanding $0.001 par value shares of beneficial interest (unlimited shares authorized) (not in 000's) | 250,541 | ||||||
Net Asset Value, Offering and Redemption Price Per Share | $ | 11.37 | |||||
CLASS C: | |||||||
Net Assets | $ | 648 | |||||
| Shares Outstanding $0.001 par value shares of beneficial interest (unlimited shares authorized) (not in 000's) | 57,353 | ||||||
Net Asset Value, Offering and Redemption Price Per Share | $ | 11.30 | |||||
CLASS IS: | |||||||
Net Assets | $ | 11 | |||||
| Shares Outstanding $0.001 par value shares of beneficial interest (unlimited shares authorized) (not in 000's) | 973 | ||||||
Net Asset Value, Offering and Redemption Price Per Share | $ | 11.43 | |||||
@ Amount is less than $500.
The accompanying notes are an integral part of the financial statements.
8
Morgan Stanley Institutional Fund, Inc.
Annual Report — December 31, 2015
Global Quality Portfolio
Statement of Operations | Year Ended December 31, 2015 (000) | ||||||
Investment Income: | |||||||
Dividends from Securities of Unaffiliated Issuers (Net of $21 of Foreign Taxes Withheld) | $ | 450 | |||||
Income from Securities Loaned — Net | 2 | ||||||
Dividends from Security of Affiliated Issuer (Note G) | — | @ | |||||
Total Investment Income | 452 | ||||||
Expenses: | |||||||
Advisory Fees (Note B) | 162 | ||||||
Professional Fees | 88 | ||||||
Custodian Fees (Note F) | 55 | ||||||
Registration Fees | 55 | ||||||
Offering Costs | 35 | ||||||
Shareholder Services Fees — Class A (Note D) | 9 | ||||||
Distribution and Shareholder Services Fees — Class L (Note D) | 22 | ||||||
Distribution and Shareholder Services Fees — Class C (Note D) | 3 | ||||||
Administration Fees (Note C) | 16 | ||||||
Shareholder Reporting Fees | 11 | ||||||
Transfer Agency Fees — Class I (Note E) | 2 | ||||||
Transfer Agency Fees — Class A (Note E) | 2 | ||||||
Transfer Agency Fees — Class L (Note E) | 2 | ||||||
Transfer Agency Fees — Class C (Note E) | 1 | ||||||
Transfer Agency Fees — Class IS (Note E) | 2 | ||||||
Pricing Fees | 6 | ||||||
Sub Transfer Agency Fees — Class I | 1 | ||||||
Sub Transfer Agency Fees — Class A | 1 | ||||||
Sub Transfer Agency Fees — Class L | 2 | ||||||
Sub Transfer Agency Fees — Class C | — | @ | |||||
Directors' Fees and Expenses | 1 | ||||||
Other Expenses | 16 | ||||||
Total Expenses | 492 | ||||||
Waiver of Advisory Fees (Note B) | (162 | ) | |||||
Expenses Reimbursed by Adviser (Note B) | (90 | ) | |||||
Reimbursement of Class Specific Expenses — Class C (Note B) | (1 | ) | |||||
Reimbursement of Class Specific Expenses — Class IS (Note B) | (2 | ) | |||||
Rebate from Morgan Stanley Affiliate (Note G) | (— | @) | |||||
Net Expenses | 237 | ||||||
Net Investment Income | 215 | ||||||
Realized Gain: | |||||||
Investments Sold | 611 | ||||||
Foreign Currency Transactions | 3 | ||||||
Net Realized Gain | 614 | ||||||
Change in Unrealized Appreciation (Depreciation): | |||||||
Investments | 251 | ||||||
Foreign Currency Translations | (1 | ) | |||||
Net Change in Unrealized Appreciation (Depreciation) | 250 | ||||||
Net Realized Gain and Change in Unrealized Appreciation (Depreciation) | 864 | ||||||
Net Increase in Net Assets Resulting from Operations | $ | 1,079 | |||||
The accompanying notes are an integral part of the financial statements.
9
Morgan Stanley Institutional Fund, Inc.
Annual Report — December 31, 2015
Global Quality Portfolio
Statements of Changes in Net Assets | Year Ended December 31, 2015 (000) | Year Ended December 31, 2014 (000) | |||||||||
Increase (Decrease) in Net Assets: | |||||||||||
Operations: | |||||||||||
Net Investment Income | $ | 215 | $ | 246 | |||||||
Net Realized Gain | 614 | 153 | |||||||||
Net Change in Unrealized Appreciation (Depreciation) | 250 | 3 | |||||||||
Net Increase in Net Assets Resulting from Operations | 1,079 | 402 | |||||||||
Distributions from and/or in Excess of: | |||||||||||
Class I: | |||||||||||
Net Investment Income | (172 | ) | (160 | ) | |||||||
Net Realized Gain | (324 | ) | (137 | ) | |||||||
Class A: | |||||||||||
Net Investment Income | (39 | ) | (37 | ) | |||||||
Net Realized Gain | (95 | ) | (40 | ) | |||||||
Class L: | |||||||||||
Net Investment Income | (19 | ) | (13 | ) | |||||||
Net Realized Gain | (84 | ) | (25 | ) | |||||||
Class C: | |||||||||||
Net Investment Income | (6 | ) | — | ||||||||
Net Realized Gain | (19 | ) | — | ||||||||
Class IS: | |||||||||||
Net Investment Income | (— | @) | (— | @) | |||||||
Net Realized Gain | (— | @) | (— | @) | |||||||
Total Distributions | (758 | ) | (412 | ) | |||||||
Capital Share Transactions:(1) | |||||||||||
Class I: | |||||||||||
Subscribed | 6,500 | 8,825 | |||||||||
Distributions Reinvested | 392 | 255 | |||||||||
Redeemed | (13,182 | ) | (1,983 | ) | |||||||
Class A: | |||||||||||
Subscribed | 715 | 2,990 | |||||||||
Distributions Reinvested | 129 | 75 | |||||||||
Redeemed | (2,004 | ) | (300 | ) | |||||||
Class L: | |||||||||||
Subscribed | 281 | 1,787 | |||||||||
Distributions Reinvested | 99 | 36 | |||||||||
Redeemed | (281 | ) | (56 | ) | |||||||
Class C: | |||||||||||
Subscribed | 661 | * | — | ||||||||
Distributions Reinvested | 25 | * | — | ||||||||
Redeemed | (16 | )* | — | ||||||||
Net Increase (Decrease) in Net Assets Resulting from Capital Share Transactions | (6,681 | ) | 11,629 | ||||||||
Total Increase (Decrease) in Net Assets | (6,360 | ) | 11,619 | ||||||||
Net Assets: | |||||||||||
Beginning of Period | 21,644 | 10,025 | |||||||||
End of Period (Including Accumulated Undistributed Net Investment Income of $7 and $25) | $ | 15,284 | $ | 21,644 | |||||||
The accompanying notes are an integral part of the financial statements.
10
Morgan Stanley Institutional Fund, Inc.
Annual Report — December 31, 2015
Global Quality Portfolio
Statements of Changes in Net Assets (cont'd) | Year Ended December 31, 2015 (000) | Year Ended December 31, 2014 (000) | |||||||||
(1) Capital Share Transactions: | |||||||||||
Class I: | |||||||||||
Shares Subscribed | 551 | 779 | |||||||||
Shares Issued on Distributions Reinvested | 34 | 23 | |||||||||
Shares Redeemed | (1,124 | ) | (176 | ) | |||||||
Net Increase (Decrease) in Class I Shares Outstanding | (539 | ) | 626 | ||||||||
Class A: | |||||||||||
Shares Subscribed | 61 | 259 | |||||||||
Shares Issued on Distributions Reinvested | 11 | 7 | |||||||||
Shares Redeemed | (170 | ) | (26 | ) | |||||||
Net Increase (Decrease) in Class A Shares Outstanding | (98 | ) | 240 | ||||||||
Class L: | |||||||||||
Shares Subscribed | 25 | 158 | |||||||||
Shares Issued on Distributions Reinvested | 8 | 3 | |||||||||
Shares Redeemed | (24 | ) | (5 | ) | |||||||
Net Increase in Class L Shares Outstanding | 9 | 156 | |||||||||
Class C: | |||||||||||
Shares Subscribed | 56 | * | — | ||||||||
Shares Issued on Distributions Reinvested | 2 | * | — | ||||||||
Shares Redeemed | (1 | )* | — | ||||||||
Net Increase in Class C Shares Outstanding | 57 | — | |||||||||
* For the period April 30, 2015 through December 31, 2015.
@ Amount is less than $500.
The accompanying notes are an integral part of the financial statements.
11
Morgan Stanley Institutional Fund, Inc.
Annual Report — December 31, 2015
Financial Highlights
Global Quality Portfolio
Class I | |||||||||||||||
Year Ended December 31, | Period from August 30, 2013^ to | ||||||||||||||
Selected Per Share Data and Ratios | 2015 | 2014 | December 31, 2013 | ||||||||||||
Net Asset Value, Beginning of Period | $ | 11.34 | $ | 11.28 | $ | 10.00 | |||||||||
Income (Loss) from Investment Operations: | |||||||||||||||
Net Investment Income (Loss)† | 0.15 | 0.17 | (0.00 | )‡ | |||||||||||
Net Realized and Unrealized Gain | 0.46 | 0.13 | 1.28 | ||||||||||||
Total from Investment Operations | 0.61 | 0.30 | 1.28 | ||||||||||||
Distributions from and/or in Excess of: | |||||||||||||||
Net Investment Income | (0.18 | ) | (0.13 | ) | — | ||||||||||
Net Realized Gain | (0.34 | ) | (0.11 | ) | — | ||||||||||
Total Distributions | (0.52 | ) | (0.24 | ) | — | ||||||||||
Net Asset Value, End of Period | $ | 11.43 | $ | 11.34 | $ | 11.28 | |||||||||
Total Return++ | 5.27 | % | 2.66 | % | 12.80 | %# | |||||||||
Ratios and Supplemental Data: | |||||||||||||||
Net Assets, End of Period (Thousands) | $ | 8,531 | $ | 14,579 | $ | 7,440 | |||||||||
Ratio of Expenses to Average Net Assets (1) | 0.97 | %+ | 1.11 | %+^^ | 1.19 | %+* | |||||||||
Ratio of Net Investment Income (Loss) to Average Net Assets (1) | 1.26 | %+ | 1.49 | %+ | (0.12 | )%+* | |||||||||
Ratio of Rebate from Morgan Stanley Affiliates to Average Net Assets | 0.00 | %§ | 0.00 | %§ | 0.01 | %* | |||||||||
Portfolio Turnover Rate | 61 | % | 31 | % | 8 | %# | |||||||||
(1) Supplemental Information on the Ratios to Average Net Assets: | |||||||||||||||
Ratios Before Expense Limitation: | |||||||||||||||
Expenses to Average Net Assets | 2.21 | % | 2.34 | % | 4.86 | %* | |||||||||
Net Investment Income (Loss) to Average Net Assets | 0.02 | % | 0.26 | % | (3.79 | )%* | |||||||||
^ Commencement of Operations.
† Per share amount is based on average shares outstanding.
‡ Amount is less than $0.005 per share.
++ Calculated based on the net asset value as of the last business day of the period.
+ The Ratios of Expenses and Net Investment Income (Loss) reflect the rebate of certain Portfolio expenses in connection with the investments in Morgan Stanley affiliates during the period. The effect of the rebate on the ratios is disclosed in the above table as "Ratio of Rebate from Morgan Stanley Affiliates to Average Net Assets."
^^ Effective October 1, 2014, the Adviser has agreed to limit the ratio of expenses to average net assets to the maximum ratio of 1.00% for Class I shares. Prior to October 1, 2014, the maximum ratio was 1.20% for Class I shares.
§ Amount is less than 0.005%.
# Not Annualized.
* Annualized.
The accompanying notes are an integral part of the financial statements.
12
Morgan Stanley Institutional Fund, Inc.
Annual Report — December 31, 2015
Financial Highlights
Global Quality Portfolio
Class A | |||||||||||||||
Year Ended December 31, | Period from August 30, 2013^ to | ||||||||||||||
Selected Per Share Data and Ratios | 2015 | 2014 | December 31, 2013 | ||||||||||||
Net Asset Value, Beginning of Period | $ | 11.32 | $ | 11.27 | $ | 10.00 | |||||||||
Income (Loss) from Investment Operations: | |||||||||||||||
Net Investment Income (Loss)† | 0.11 | 0.12 | (0.02 | ) | |||||||||||
Net Realized and Unrealized Gain | 0.45 | 0.14 | 1.29 | ||||||||||||
Total from Investment Operations | 0.56 | 0.26 | 1.27 | ||||||||||||
Distributions from and/or in Excess of: | |||||||||||||||
Net Investment Income | (0.14 | ) | (0.10 | ) | — | ||||||||||
Net Realized Gain | (0.34 | ) | (0.11 | ) | — | ||||||||||
Total Distributions | (0.48 | ) | (0.21 | ) | — | ||||||||||
Net Asset Value, End of Period | $ | 11.40 | $ | 11.32 | $ | 11.27 | |||||||||
Total Return++ | 4.91 | % | 2.34 | % | 12.70 | %# | |||||||||
Ratios and Supplemental Data: | |||||||||||||||
Net Assets, End of Period (Thousands) | $ | 3,246 | $ | 4,331 | $ | 1,612 | |||||||||
Ratio of Expenses to Average Net Assets (1) | 1.30 | %+ | 1.40 | %+^^ | 1.54 | %+* | |||||||||
Ratio of Net Investment Income (Loss) to Average Net Assets (1) | 0.98 | %+ | 1.03 | %+ | (0.45 | )%+* | |||||||||
Ratio of Rebate from Morgan Stanley Affiliates to Average Net Assets | 0.00 | %§ | 0.00 | %§ | 0.01 | %* | |||||||||
Portfolio Turnover Rate | 61 | % | 31 | % | 8 | %# | |||||||||
(1) Supplemental Information on the Ratios to Average Net Assets: | |||||||||||||||
Ratios Before Expense Limitation: | |||||||||||||||
Expenses to Average Net Assets | 2.52 | % | 2.62 | % | 5.00 | %* | |||||||||
Net Investment Loss to Average Net Assets | (0.24 | )% | (0.19 | )% | (3.91 | )%* | |||||||||
^ Commencement of Operations.
† Per share amount is based on average shares outstanding.
++ Calculated based on the net asset value which does not reflect sales charges, if applicable, as of the last business day of the period.
+ The Ratios of Expenses and Net Investment Income (Loss) reflect the rebate of certain Portfolio expenses in connection with the investments in Morgan Stanley affiliates during the period. The effect of the rebate on the ratios is disclosed in the above table as "Ratio of Rebate from Morgan Stanley Affiliates to Average Net Assets."
^^ Effective October 1, 2014, the Adviser has agreed to limit the ratio of expenses to average net assets to the maximum ratios of 1.35% for Class A shares. Prior to October 1, 2014, the maximum ratio was 1.55% for Class A shares.
§ Amount is less than 0.005%.
# Not Annualized.
* Annualized.
The accompanying notes are an integral part of the financial statements.
13
Morgan Stanley Institutional Fund, Inc.
Annual Report — December 31, 2015
Financial Highlights
Global Quality Portfolio
Class L | |||||||||||||||
Year Ended December 31, | Period from August 30, 2013^ to | ||||||||||||||
Selected Per Share Data and Ratios | 2015 | 2014 | December 31, 2013 | ||||||||||||
Net Asset Value, Beginning of Period | $ | 11.29 | $ | 11.25 | $ | 10.00 | |||||||||
Income (Loss) from Investment Operations: | |||||||||||||||
Net Investment Income (Loss)† | 0.05 | 0.06 | (0.03 | ) | |||||||||||
Net Realized and Unrealized Gain | 0.45 | 0.14 | 1.28 | ||||||||||||
Total from Investment Operations | 0.50 | 0.20 | 1.25 | ||||||||||||
Distributions from and/or in Excess of: | |||||||||||||||
Net Investment Income | (0.08 | ) | (0.05 | ) | — | ||||||||||
Net Realized Gain | (0.34 | ) | (0.11 | ) | — | ||||||||||
Total Distributions | (0.42 | ) | (0.16 | ) | — | ||||||||||
Net Asset Value, End of Period | $ | 11.37 | $ | 11.29 | $ | 11.25 | |||||||||
Total Return++ | 4.49 | % | 1.74 | % | 12.50 | %# | |||||||||
Ratios and Supplemental Data: | |||||||||||||||
Net Assets, End of Period (Thousands) | $ | 2,848 | $ | 2,723 | $ | 962 | |||||||||
Ratio of Expenses to Average Net Assets (1) | 1.81 | %+ | 1.93 | %+^^ | 2.04 | %+* | |||||||||
Ratio of Net Investment Income (Loss) to Average Net Assets (1) | 0.46 | %+ | 0.55 | %+ | (0.80 | )%+* | |||||||||
Ratio of Rebate from Morgan Stanley Affiliates to Average Net Assets | 0.00 | %§ | 0.00 | %§ | 0.01 | %* | |||||||||
Portfolio Turnover Rate | 61 | % | 31 | % | 8 | % | |||||||||
(1) Supplemental Information on the Ratios to Average Net Assets: | |||||||||||||||
Ratios Before Expense Limitation: | |||||||||||||||
Expenses to Average Net Assets | 3.06 | % | 3.15 | % | 6.27 | %* | |||||||||
Net Investment Loss to Average Net Assets | (0.79 | )% | (0.67 | )% | (5.03 | )%* | |||||||||
^ Commencement of Operations.
† Per share amount is based on average shares outstanding.
++ Calculated based on the net asset value as of the last business day of the period.
+ The Ratios of Expenses and Net Investment Income (Loss) reflect the rebate of certain Portfolio expenses in connection with the investments in Morgan Stanley affiliates during the period. The effect of the rebate on the ratios is disclosed in the above table as "Ratio of Rebate from Morgan Stanley Affiliates to Average Net Assets."
^^ Effective October 1, 2014, the Adviser has agreed to limit the ratio of expenses to average net assets to the maximum ratios of 1.85% for Class L shares. Prior to October 1, 2014, the maximum ratio was 2.05% for Class L shares.
§ Amount is less than 0.005%.
# Not Annualized.
* Annualized.
The accompanying notes are an integral part of the financial statements.
14
Morgan Stanley Institutional Fund, Inc.
Annual Report — December 31, 2015
Financial Highlights
Global Quality Portfolio
Class C | |||||||
Selected Per Share Data and Ratios | Period from April 30, 2015^ to December 31, 2015 | ||||||
Net Asset Value, Beginning of Period | $ | 11.77 | |||||
Income (Loss) from Investment Operations: | |||||||
Net Investment Loss† | (0.03 | ) | |||||
Net Realized and Unrealized Gain | 0.02 | ||||||
Total from Investment Operations | (0.01 | ) | |||||
Distributions from and/or in Excess of: | |||||||
Net Investment Income | (0.12 | ) | |||||
Net Realized Gain | (0.34 | ) | |||||
Total Distributions | (0.46 | ) | |||||
Net Asset Value, End of Period | $ | 11.30 | |||||
Total Return++ | (0.13 | )%# | |||||
Ratios and Supplemental Data: | |||||||
Net Assets, End of Period (Thousands) | $ | 648 | |||||
Ratios of Expenses to Average Net Assets (1) | 2.10 | %+* | |||||
Ratio of Net Investment Loss to Average Net Assets (1) | (0.39 | )%+* | |||||
Ratio of Rebate from Morgan Stanley Affiliates to Average Net Assets | 0.00 | %§* | |||||
Portfolio Turnover Rate | 61 | % | |||||
(1) Supplemental Information on the Ratios to Average Net Assets: | |||||||
Ratios Before Expense Limitation: | |||||||
Expense to Average Net Assets | 3.80 | %* | |||||
Net Investment Loss to Average Net Assets | (2.09 | )%* | |||||
^ Commencement of Offering.
† Per share amount is based on average shares outstanding.
++ Calculated based on the net asset value which does not reflect sales charges, if applicable, as of the last business day of the period.
+ The Ratios of Expenses and Net Investment Loss reflect the rebate of certain Portfolio expenses in connection with the investments in Morgan Stanley affiliates during the period. The effect of the rebate on the ratios is disclosed in the above table as "Ratio of Rebate from Morgan Stanley Affiliates to Average Net Assets."
§ Amount is less than 0.005%.
# Not Annualized.
* Annualized.
The accompanying notes are an integral part of the financial statements.
15
Morgan Stanley Institutional Fund, Inc.
Annual Report — December 31, 2015
Financial Highlights
Global Quality Portfolio
Class IS | |||||||||||||||
Year Ended December 31, | Period from September 13, 2013^ to | ||||||||||||||
Selected Per Share Data and Ratios | 2015 | 2014 | December 31, 2013 | ||||||||||||
Net Asset Value, Beginning of Period | $ | 11.34 | $ | 11.28 | $ | 10.28 | |||||||||
Income (Loss) from Investment Operations: | |||||||||||||||
Net Investment Income (Loss)† | 0.16 | 0.17 | (0.00 | )‡ | |||||||||||
Net Realized and Unrealized Gain | 0.45 | 0.13 | 1.00 | ||||||||||||
Total from Investment Operations | 0.61 | 0.30 | 1.00 | ||||||||||||
Distributions from and/or in Excess of: | |||||||||||||||
Net Investment Income | (0.18 | ) | (0.13 | ) | — | ||||||||||
Net Realized Gain | (0.34 | ) | (0.11 | ) | — | ||||||||||
Total Distributions | (0.52 | ) | (0.24 | ) | — | ||||||||||
Net Asset Value, End of Period | $ | 11.43 | $ | 11.34 | $ | 11.28 | |||||||||
Total Return++ | 5.38 | % | 2.67 | % | 9.73 | %# | |||||||||
Ratios and Supplemental Data: | |||||||||||||||
Net Assets, End of Period (Thousands) | $ | 11 | $ | 11 | $ | 11 | |||||||||
Ratio of Expenses to Average Net Assets (1) | 0.95 | %+ | 1.10 | %+^^ | 1.15 | %+* | |||||||||
Ratio of Net Investment Income (Loss) to Average Net Assets (1) | 1.31 | %+ | 1.51 | %+ | (0.10 | )%+* | |||||||||
Ratio of Rebate from Morgan Stanley Affiliates to Average Net Assets | 0.00 | %§ | 0.00 | %§ | 0.00 | %§* | |||||||||
Portfolio Turnover Rate | 61 | % | 31 | % | 8 | %# | |||||||||
(1) Supplemental Information on the Ratios to Average Net Assets: | |||||||||||||||
Ratios Before Expense Limitation | |||||||||||||||
Expenses to Average Net Assets | 16.35 | % | 19.72 | % | 9.57 | %* | |||||||||
Net Investment Loss to Average Net Assets | (14.09 | )% | (17.11 | )% | (8.52 | )%* | |||||||||
^ Commencement of Offering.
† Per share amount is based on average shares outstanding.
‡ Amount is less than $0.005 per share.
++ Calculated based on the net asset value as of the last business day of the period.
+ The Ratios of Expenses and Net Investment Income (Loss) reflect the rebate of certain Portfolio expenses in connection with the investments in Morgan Stanley affiliates during the period. The effect of the rebate on the ratios is disclosed in the above table as "Ratio of Rebate from Morgan Stanley Affiliates to Average Net Assets."
^^ Effective October 1, 2014, the Adviser has agreed to limit the ratio of expenses to average net assets to the maximum ratio of 0.95% for Class IS shares. Prior to October 1, 2014, the maximum ratio was 1.15% for Class IS shares.
§ Amount is less than 0.005%.
# Not Annualized.
* Annualized.
The accompanying notes are an integral part of the financial statements.
16
Morgan Stanley Institutional Fund, Inc.
Annual Report — December 31, 2015
Notes to Financial Statements
Morgan Stanley Institutional Fund, Inc. (the "Fund") is registered under the Investment Company Act of 1940, as amended (the "Act"), as an open-end management investment company. The Fund is comprised of twenty-six separate, active, diversified and non-diversified portfolios (individually referred to as a "Portfolio", collectively as the "Portfolios"). The Fund applies investment company accounting and reporting guidance.
The accompanying financial statements relate to the Global Quality Portfolio. The Portfolio's "Sub-Advisers," Morgan Stanley Investment Management Limited ("MSIM Limited") and Morgan Stanley Investment Management Company ("MSIM Company") (together, the "Sub-Advisers"), seek long-term capital appreciation by investing primarily in equity securities of high quality companies located throughout the world, including developed and emerging market countries. In seeking to identify high quality companies, the Sub-Advisers look for companies that they believe have the returns profile that can underpin compounding, that is, they are able to consistently compound shareholder wealth at attractive rates of return over the long-term. In the Sub-Advisers' view, such companies are typically businesses built on dominant market positions, underpinned by powerful, hard to replicate intangible assets and that can generate resilient high cross cycle returns on capital. In addition, the Sub-Advisers consider high quality companies to have some or all of the following characteristics: strong managements, resilient revenue streams, pricing power (high gross margins), typically low capital intensity and the opportunity for organic growth.
The Portfolio offers five classes of shares — Class I, Class A, Class L, Class C and Class IS. On April 30, 2015, the Portfolio commenced offering Class C shares and suspended offering of Class L shares. Existing Class L shareholders may invest through reinvestment of dividends and distributions.
A. Significant Accounting Policies: The following significant accounting policies are in conformity with U.S. generally accepted accounting principles ("GAAP"). Such policies are consistently followed by the Fund in the preparation of its financial statements. GAAP may require management to make estimates and assumptions that affect the reported amounts and disclosures in the financial statements. Actual results may differ from those estimates.
1. Security Valuation: (1) An equity portfolio security listed or traded on an exchange is valued at its latest reported sales price (or at the exchange official closing price if
such exchange reports an official closing price), if there were no sales on a given day, the security is valued at the mean between the last reported bid and asked prices; (2) all other equity portfolio securities for which over-the-counter ("OTC") market quotations are readily available are valued at its latest reported sales price. In cases where a security is traded on more than one exchange, the security is valued on the exchange designated as the primary market; (3) when market quotations are not readily available, including circumstances under which Morgan Stanley Investment Management Inc. (the "Adviser") or Sub-Advisers determine that the closing price, last sale price or the mean between the last reported bid and asked prices are not reflective of a security's market value, portfolio securities are valued at their fair value as determined in good faith under procedures established by and under the general supervision of the Fund's Board of Directors (the "Directors"). Occasionally, developments affecting the closing prices of securities and other assets may occur between the times at which valuations of such securities are determined (that is, close of the foreign market on which the securities trade) and the close of business of the New York Stock Exchange ("NYSE"). If developments occur during such periods that are expected to materially affect the value of such securities, such valuations may be adjusted to reflect the estimated fair value of such securities as of the close of the NYSE, as determined in good faith by the Directors or by the Adviser using a pricing service and/or procedures approved by the Directors; (4) quotations of foreign portfolio securities, other assets and liabilities and forward contracts stated in foreign currency are translated into U.S. dollar equivalents at the prevailing market rates prior to the close of the NYSE; (5) investments in mutual funds, including the Morgan Stanley Institutional Liquidity Funds, are valued at the net asset value ("NAV") as of the close of each business day; and (6) short-term debt securities with remaining maturities of 60 days or less at the time of purchase may be valued at amortized cost, unless the Adviser determines such valuation does not reflect the securities' market value, in which case these securities will be valued at their fair market value determined by the Adviser.
The Directors have responsibility for determining in good faith the fair value of the investments, and the Directors may appoint others, such as the Fund's Adviser or a valuation committee, to assist the Directors in
17
Morgan Stanley Institutional Fund, Inc.
Annual Report — December 31, 2015
Notes to Financial Statements (cont'd)
determining fair value and to make the actual calculations pursuant to the fair valuation methodologies previously approved by the Directors. Under procedures approved by the Directors, the Fund's Adviser has formed a Valuation Committee whose members are approved by the Directors. The Valuation Committee provides administration and oversight of the Fund's valuation policies and procedures, which are reviewed at least annually by the Directors. These procedures allow the Fund to utilize independent pricing services, quotations from securities and financial instrument dealers, and other market sources to determine fair value.
The Fund has procedures to determine the fair value of securities and other financial instruments for which market prices are not readily available. Under these procedures, the Valuation Committee convenes on a regular and ad hoc basis to review such securities and considers a number of factors, including valuation methodologies and significant unobservable valuation inputs, when arriving at fair value. The Valuation Committee may employ a market-based approach which may use related or comparable assets or liabilities, recent transactions, market multiples, book values, and other relevant information for the investment to determine the fair value of the investment. An income-based valuation approach may also be used in which the anticipated future cash flows of the investment are discounted to calculate fair value. Discounts may also be applied due to the nature or duration of any restrictions on the disposition of the investments. Due to the inherent uncertainty of valuations of such investments, the fair values may differ significantly from the values that would have been used had an active market existed. The Valuation Committee employs various methods for calibrating these valuation approaches including a regular review of valuation methodologies, key inputs and assumptions, transactional back-testing or disposition analysis, and reviews of any related market activity.
2. Fair Value Measurement: Financial Accounting Standards Board ("FASB") Accounting Standards CodificationTM ("ASC") 820, "Fair Value Measurement" ("ASC 820"), defines fair value as the value that the Fund would receive to sell an investment or pay to transfer a
liability in a timely transaction with an independent buyer in the principal market, or in the absence of a principal market the most advantageous market for the investment or liability. ASC 820 establishes a three-tier hierarchy to distinguish between (1) inputs that reflect the assumptions market participants would use in valuing an asset or liability developed based on market data obtained from sources independent of the reporting entity (observable inputs) and (2) inputs that reflect the reporting entity's own assumptions about the assumptions market participants would use in valuing an asset or liability developed based on the best information available in the circumstances (unobservable inputs) and to establish classification of fair value measurements for disclosure purposes. Various inputs are used in determining the value of the Fund's investments. The inputs are summarized in the three broad levels listed below.
• Level 1 – unadjusted quoted prices in active markets for identical investments
• Level 2 – other significant observable inputs (including quoted prices for similar investments, interest rates, prepayment speeds, credit risk, etc.)
• Level 3 – significant unobservable inputs including the Fund's own assumptions in determining the fair value of investments. Factors considered in making this determination may include, but are not limited to, information obtained by contacting the issuer, analysts, or the appropriate stock exchange (for exchange-traded securities), analysis of the issuer's financial statements or other available documents and, if necessary, available information concerning other securities in similar circumstances
The inputs or methodology used for valuing securities are not necessarily an indication of the risk associated with investing in those securities and the determination of the significance of a particular input to the fair value measurement in its entirety requires judgment and considers factors specific to each security.
18
Morgan Stanley Institutional Fund, Inc.
Annual Report — December 31, 2015
Notes to Financial Statements (cont'd)
The following is a summary of the inputs used to value the Portfolio's investments as of December 31, 2015.
Investment Type | Level 1 Unadjusted quoted prices (000) | Level 2 Other significant observable inputs (000) | Level 3 Significant unobservable inputs (000) | Total (000) | |||||||||||||||
Assets: | |||||||||||||||||||
Common Stocks | |||||||||||||||||||
Beverages | $ | — | $ | 237 | $ | — | $ | 237 | |||||||||||
| Diversified Financial Services | 82 | — | — | 82 | |||||||||||||||
Food Products | 485 | 786 | — | 1,271 | |||||||||||||||
Household Products | — | 821 | — | 821 | |||||||||||||||
Industrial Conglomerates | 543 | — | — | 543 | |||||||||||||||
| Information Technology Services | 1,322 | — | — | 1,322 | |||||||||||||||
Insurance | — | 170 | — | 170 | |||||||||||||||
| Internet Software & Services | 822 | — | — | 822 | |||||||||||||||
Media | 1,445 | 350 | — | 1,795 | |||||||||||||||
Personal Products | — | 912 | — | 912 | |||||||||||||||
Pharmaceuticals | 603 | 1,933 | — | 2,536 | |||||||||||||||
Professional Services | 387 | 122 | — | 509 | |||||||||||||||
Software | 1,121 | 236 | — | 1,357 | |||||||||||||||
| Textiles, Apparel & Luxury Goods | 204 | — | — | 204 | |||||||||||||||
Tobacco | 1,319 | 925 | — | 2,244 | |||||||||||||||
Total Common Stocks | 8,333 | 6,492 | — | 14,825 | |||||||||||||||
Short-Term Investment | |||||||||||||||||||
Investment Company | 309 | — | — | 309 | |||||||||||||||
Total Assets | $ | 8,642 | $ | 6,492 | $ | — | $ | 15,134 | |||||||||||
Transfers between investment levels may occur as the markets fluctuate and/or the availability of data used in an investment's valuation changes. The Portfolio recognizes transfers between the levels as of the end of the period. As of December 31, 2015, the Portfolio did not have any investments transfer between investment levels. At December 31, 2015, the fair value of certain securities were adjusted due to developments which occurred between the time of the close of the foreign markets on which they trade and the close of business on the NYSE which resulted in their Level 2 classification.
3. Foreign Currency Translation and Foreign Investments: The books and records of the Portfolio are maintained in U.S. dollars. Foreign currency amounts are translated into U.S. dollars as follows:
– investments, other assets and liabilities at the prevailing rate of exchange on the valuation date;
– investment transactions and investment income at the prevailing rates of exchange on the dates of such transactions.
Although the net assets of the Portfolio are presented at the foreign exchange rates and market values at the close of the period, the Portfolio does not isolate that portion of the results of operations arising as a result of changes in the foreign exchange rates from the fluctuations arising from changes in the market prices of securities held at period end. Similarly, the Portfolio does not isolate the effect of changes in foreign exchange rates from the fluctuations arising from changes in the market prices of securities sold during the period. Accordingly, realized and unrealized foreign currency gains (losses) on investments in securities are included in the reported net realized and unrealized gains (losses) on investment transactions and balances. However, pursuant to U.S. Federal income tax regulations, gains and losses from certain foreign currency transactions and the foreign currency portion of gains and losses realized on sales and maturities of foreign denominated debt securities are treated as ordinary income for U.S. Federal income tax purposes.
Net realized gains (losses) on foreign currency transactions represent net foreign exchange gains (losses) from foreign currency forward exchange contracts, disposition of foreign currencies, currency gains (losses) realized between the trade and settlement dates on securities transactions, and the difference between the amount of investment income and foreign withholding taxes recorded on the Portfolio's books and the U.S. dollar equivalent amounts actually received or paid. Net unrealized currency gains (losses) from valuing foreign currency denominated assets and liabilities at period end exchange rates are reflected as a component of unrealized appreciation (depreciation) in the Statement of Assets and Liabilities. The change in unrealized currency gains (losses) on foreign currency translations for the period is reflected in the Statement of Operations.
Foreign security and currency transactions may involve certain considerations and risks not typically associated with those of U.S. dollar denominated transactions as a result of, among other factors, fluctuations of exchange rates in relation to the U.S. dollar, the possibility of lower levels of governmental supervision and regulation of foreign securities markets and the possibility of political or economic instability.
Governmental approval for foreign investments may be required in advance of making an investment under
19
Morgan Stanley Institutional Fund, Inc.
Annual Report — December 31, 2015
Notes to Financial Statements (cont'd)
certain circumstances in some countries, and the extent of foreign investments in domestic companies may be subject to limitation in other countries. Foreign ownership limitations also may be imposed by the charters of individual companies to prevent, among other concerns, violations of foreign investment limitations. As a result, an additional class of shares (identified as "Foreign" in the Portfolio of Investments) may be created and offered for investment. The "local" and "foreign shares" market values may differ. In the absence of trading of the foreign shares in such markets, the Portfolio values the foreign shares at the closing exchange price of the local shares.
4. Securities Lending: The Portfolio lends securities to qualified financial institutions, such as broker-dealers, to earn additional income. Any increase or decrease in the fair value of the securities loaned that might occur and any interest earned or dividends declared on those securities during the term of the loan would remain in the Portfolio. The Portfolio would receive cash or securities as collateral in an amount equal to or exceeding 100% of the current fair value of the loaned securities. The collateral is marked-to-market daily by State Street Bank and Trust Company ("State Street"), the securities lending agent, to ensure that a minimum of 100% collateral coverage is maintained.
Based on pre-established guidelines, the securities lending agent invests any cash collateral that is received in an affiliated money market portfolio and repurchase agreements. Securities lending income is generated from the earnings on the invested collateral and borrowing fees, less any rebates owed to the borrowers and compensation to the lending agent, and is recorded as "Income from Securities Loaned — Net" in the Portfolio's Statement of Operations. Risks in securities lending transactions are that a borrower may not provide additional collateral when required or return the securities when due, and that the value of the short-term investments will be less than the amount of cash collateral plus any rebate that is required to be returned to the borrower.
The Portfolio has the right under the lending agreement to recover the securities from the borrower on demand.
At December 31, 2015, the Portfolio did not have any outstanding securities on loan.
5. Indemnifications: The Fund enters into contracts that contain a variety of indemnifications. The Fund's maximum exposure under these arrangements is unknown. However, the Fund has not had prior claims or losses pursuant to these contracts and expects the risk of loss to be remote.
6. Dividends and Distributions to Shareholders: Dividend income and distributions to shareholders are recorded on the ex-dividend date. Dividends from net investment income, if any, are declared and paid annually. Net realized capital gains, if any, are distributed at least annually.
7. Security Transactions, Income and Expenses: Security transactions are accounted for on the trade date (date the order to buy or sell is executed). Realized gains and losses on the sale of investment securities are determined on the specific identified cost method. Dividend income and other distributions are recorded on the ex-dividend date (except for certain foreign dividends which may be recorded as soon as the Portfolio is informed of such dividends) net of applicable withholding taxes. Interest income is recognized on the accrual basis except where collection is in doubt. Discounts are accreted and premiums are amortized over the life of the respective securities. Most expenses of the Fund can be directly attributed to a particular Portfolio. Expenses which cannot be directly attributed are apportioned among the Portfolios based upon relative net assets or other appropriate methods. Income, expenses (other than class specific expenses — distribution and shareholder services, transfer agency and sub transfer agency fees) and realized and unrealized gains or losses are allocated to each class of shares based upon their relative net assets.
B. Advisory/Sub-Advisory Fees: The Adviser, a wholly-owned subsidiary of Morgan Stanley, provides the Portfolio with advisory services under the terms of an Investment Advisory Agreement, paid quarterly, at the annual rate based on the daily net assets as follows:
| First $500 million | Next $500 million | Over $1 billion | |||||||||
| 0.80 | % | 0.75 | % | 0.70 | % | ||||||
For the year ended December 31, 2015, the advisory fee rate (net of waivers/rebate) was equivalent to an annual effective rate of 0.00% of the Portfolio's average daily net assets.
The Adviser has agreed to reduce its advisory fee and/or reimburse the Portfolio so that total annual portfolio operating
20
Morgan Stanley Institutional Fund, Inc.
Annual Report — December 31, 2015
Notes to Financial Statements (cont'd)
expenses, excluding certain investment related expenses, taxes, interest and other extraordinary expenses (including litigation), will not exceed 1.00% for Class I shares, 1.35% for Class A shares, 1.85% for Class L shares, 2.10% for Class C shares and 0.95% for Class IS shares. The fee waivers and/or expense reimbursements will continue for at least one year from the date of the Portfolio's prospectus or until such time as the Directors act to discontinue all or a portion of such waivers and/or reimbursements when they deem such action is appropriate. For the year ended December 31, 2015, approximately $162,000 of advisory fees were waived and approximately $93,000 of other expenses were reimbursed by the Adviser pursuant to this arrangement.
The Adviser has entered into a Sub-Advisory Agreement with the Sub-Advisers, each a wholly-owned subsidiary of Morgan Stanley. The Sub-Advisers provide the Portfolio with advisory services subject to the overall supervision of the Adviser and the Fund's Officers and Directors. The Adviser pays the Sub-Advisers on a monthly basis a portion of the net advisory fees the Adviser receives from the Portfolio.
C. Administration Fees: The Adviser also serves as Administrator to the Fund and provides administrative services pursuant to an Administration Agreement for an annual fee, accrued daily and paid monthly, of 0.08% of the Portfolio's average daily net assets.
Under a Sub-Administration Agreement between the Administrator and State Street, State Street provides certain administrative services to the Fund. For such services, the Administrator pays State Street a portion of the fee the Administrator receives from the Portfolio.
D. Distribution and Shareholder Services Fees: Morgan Stanley Distribution, Inc. ("MSDI" or the "Distributor"), a wholly-owned subsidiary of the Adviser and Sub-Adviser and an indirect subsidiary of Morgan Stanley, serves as the Fund's Distributor of Portfolio shares pursuant to a Distribution Agreement. The Fund has adopted a Shareholder Services Plan with respect to Class A shares pursuant to Rule 12b-1 under the Act. Under the Shareholder Services Plan, the Portfolio pays the Distributor a shareholder services fee, accrued daily and paid monthly, at an annual rate of 0.25% of the Portfolio's average daily net assets attributable to Class A shares.
The Fund has adopted a Distribution and Shareholder Services Plan with respect to Class L shares pursuant to Rule 12b-1 under the Act. Under the Distribution and Shareholder Services Plan,
the Portfolio pays the Distributor a distribution fee, accrued daily and paid monthly, at an annual rate of 0.50% and a shareholder services fee, accrued daily and paid monthly, at an annual rate of 0.25% of the Portfolio's average daily net assets attributable to Class L shares.
The Fund has adopted a Distribution and Shareholder Services Plan with respect to Class C shares pursuant to Rule 12b-1 under the Act. Under the Distribution and Shareholder Services Plan, the Portfolio pays the Distributor a distribution fee, accrued daily and paid monthly, at an annual rate of 0.75% and a shareholder services fee, accrued daily and paid monthly, at an annual rate of 0.25% of the Portfolio's average daily net assets attributable to Class C shares.
The distribution and shareholder services fees are used to support the expenses associated with servicing and maintaining accounts. The Distributor may compensate other parties for providing shareholder support services to investors who purchase Class A, Class L and Class C shares.
E. Dividend Disbursing and Transfer Agent: The Fund's dividend disbursing and transfer agent is Boston Financial Data Services, Inc. ("BFDS"). Pursuant to a Transfer Agency Agreement, the Fund pays BFDS a fee based on the number of classes, accounts and transactions relating to the Portfolios of the Fund.
F. Custodian Fees: State Street (the "Custodian") serves as Custodian for the Fund in accordance with a Custodian Agreement. The Custodian holds cash, securities, and other assets of the Fund as required by the Act. Custody fees are payable monthly based on assets held in custody, investment purchases and sales activity and account maintenance fees, plus reimbursement for certain out-of-pocket expenses.
G. Security Transactions and Transactions with Affiliates: For the year ended December 31, 2015, purchases and sales of investment securities for the Portfolio, other than long-term U.S. Government securities and short-term investments, were approximately $11,952,000 and $19,104,000, respectively. There were no purchases and sales of long-term U.S. Government securities for the year ended December 31, 2015.
The Portfolio invests in the Institutional Class of the Morgan Stanley Institutional Liquidity Funds — Treasury Securities Portfolio (the "Liquidity Funds"), an open-end management investment company managed by the Adviser, both directly and as a portion of the securities held as collateral on loaned
21
Morgan Stanley Institutional Fund, Inc.
Annual Report — December 31, 2015
Notes to Financial Statements (cont'd)
securities. Advisory fees paid by the Portfolio are reduced by an amount equal to its pro-rata share of the advisory and administration fees paid by the Portfolio due to its investment in the Liquidity Funds. For the year ended December 31, 2015, advisory fees paid were reduced by less than $500 relating to the Portfolio's investment in the Liquidity Funds.
A summary of the Portfolio's transactions in shares of the Liquidity Funds during the year ended December 31, 2015 is as follows:
| Value December 31, 2014 (000) | Purchases at Cost (000) | Sales (000) | Dividend Income (000) | Value December 31, 2015 (000) | |||||||||||||||
| $ | 523 | $ | 9,477 | $ | 9,691 | $ | — | @ | $ | 309 | |||||||||
@ Amount is less than $500.
The Portfolio has an unfunded Deferred Compensation Plan (the "Compensation Plan"), which allows each independent Director to defer payment of all, or a portion, of the fees he or she receives for serving on the Board of Directors. Each eligible Director generally may elect to have the deferred amounts credited with a return equal to the total return on one or more of the Morgan Stanley funds that are offered as investment options under the Compensation Plan. Appreciation/depreciation and distributions received from these investments are recorded with an offsetting increase/decrease in the deferred compensation obligation and do not affect the NAV of the Portfolio.
H. Federal Income Taxes: It is the Portfolio's intention to continue to qualify as a regulated investment company and distribute all of its taxable and tax-exempt income. Accordingly, no provision for Federal income taxes is required in the financial statements.
The Portfolio may be subject to taxes imposed by countries in which it invests. Such taxes are generally based on income and/or capital gains earned or repatriated. Taxes are accrued based on net investment income, net realized gains and net unrealized appreciation as such income and/or gains are earned. Taxes may also be based on transactions in foreign currency and are accrued based on the value of investments denominated in such currency.
FASB ASC 740-10, "Income Taxes — Overall", sets forth a minimum threshold for financial statement recognition of the benefit of a tax position taken or expected to be taken in a tax return. Management has concluded there are no significant uncertain tax positions that would require recognition in the financial statements. If applicable, the Portfolio recognizes
interest accrued related to unrecognized tax benefits in "Interest Expense" and penalties in "Other Expenses" in the Statement of Operations. The Portfolio files tax returns with the U.S. Internal Revenue Service, New York and various states. Generally, each of the tax years in the three-year period ended December 31, 2015, remains subject to examination by taxing authorities.
The tax character of distributions paid may differ from the character of distributions shown in the Statements of Changes in Net Assets due to short-term capital gains being treated as ordinary income for tax purposes. The tax character of distributions paid during fiscal 2015 and 2014 was as follows:
| 2015 Distributions Paid From: | 2014 Distributions Paid From: | ||||||||||||||
| Ordinary Income (000) | Long-Term Capital Gain (000) | Ordinary Income (000) | Long-Term Capital Gain (000) | ||||||||||||
| $ | 237 | $ | 522 | $ | 339 | $ | 73 | ||||||||
The amount and character of income and gains to be distributed are determined in accordance with income tax regulations which may differ from GAAP. These book/tax differences are either considered temporary or permanent in nature.
Temporary differences are attributable to differing book and tax treatments for the timing of the recognition of gains (losses) on certain investment transactions and the timing of the deductibility of certain expenses.
Permanent differences, primarily due to differing treatments of gains (losses) related to foreign currency transactions and a nondeductible expense, resulted in the following reclassifications among the components of net assets at December 31, 2015:
| Accumulated Undistributed Net Investment Income (000) | Accumulated Undistributed Net Realized Gain (000) | Paid-in-Capital (000) | |||||||||
| $ | 3 | $ | (2 | ) | $ | (1 | ) | ||||
At December 31, 2015, the components of distributable earnings for the Portfolio on a tax basis were as follows:
| Undistributed Ordinary Income (000) | Undistributed Long-Term Capital Gain (000) | ||||||
| $ | 7 | $ | 214 | ||||
I. Other: At December 31, 2015, the Portfolio had record owners of 10% or greater. Investment activities of these shareholders could have a material impact on the Portfolio. The aggregate percentage of such owners was 60.9%.
22
Morgan Stanley Institutional Fund, Inc.
Annual Report — December 31, 2015
Report of Independent Registered Public Accounting Firm
To the Shareholders and Board of Directors of
Morgan Stanley Institutional Fund, Inc. —
Global Quality Portfolio
We have audited the accompanying statement of assets and liabilities, including the portfolio of investments, of Global Quality Portfolio (one of the portfolios constituting Morgan Stanley Institutional Fund, Inc.) (the "Portfolio") as of December 31, 2015, the related statement of operations for the year then ended, the statements of changes in net assets for each of the two years in the period then ended and the financial highlights for each of the years or periods indicated therein. These financial statements and financial highlights are the responsibility of the Portfolio's management. Our responsibility is to express an opinion on these financial statements and financial highlights based on our audits.
We conducted our audits in accordance with the standards of the Public Company Accounting Oversight Board (United States). Those standards require that we plan and perform the audit to obtain reasonable assurance about whether the financial statements and financial highlights are free of material misstatement. We were not engaged to perform an audit of the Portfolio's internal control over financial reporting. Our audits included consideration of internal control over financial reporting as a basis for designing audit procedures that are appropriate in the circumstances, but not for the purpose of expressing an opinion on the effectiveness of the Portfolio's internal control over financial reporting. Accordingly, we express no such opinion. An audit also includes examining, on a test basis, evidence supporting the amounts and disclosures in the financial statements and financial highlights, assessing the accounting principles used and significant estimates made by management, and evaluating the overall financial statement presentation. Our procedures included confirmation of securities owned as of December 31, 2015, by correspondence with the custodian and others. We believe that our audits provide a reasonable basis for our opinion.
In our opinion, the financial statements and financial highlights referred to above present fairly, in all material respects, the financial position of the Global Quality Portfolio (one of the portfolios constituting Morgan Stanley Institutional Fund, Inc.) at December 31, 2015, the results of its operations for the year then ended, the changes in its net assets for each of the two years in the period then ended and the financial highlights for each of the years or periods indicated therein, in conformity with U.S. generally accepted accounting principles.

Boston, Massachusetts
February 26, 2016
23
Morgan Stanley Institutional Fund, Inc.
Annual Report — December 31, 2015
Federal Tax Notice (unaudited)
For Federal income tax purposes, the following information is furnished with respect to the distributions paid by the Portfolio during its taxable year ended December 31, 2015. For corporate shareholders, 63.5% of the dividends qualified for the dividends received deduction.
The Portfolio designated and paid approximately $522,000 as a long-term capital gain distribution.
For Federal income tax purposes, the following information is furnished with respect to the Portfolio's earnings for its taxable year ended December 31, 2015. When distributed, certain earnings may be subject to a maximum tax rate of 15% as provided for the Jobs and Growth Tax Relief Reconciliation Act of 2003. The Portfolio designated up to a maximum of approximately $237,000 as taxable at this lower rate.
In January, the Portfolio provides tax information to shareholders for the preceding calendar year.
24
Morgan Stanley Institutional Fund, Inc.
Annual Report — December 31, 2015
U.S. Privacy Policy (unaudited)
AN IMPORTANT NOTICE CONCERNING OUR U.S. PRIVACY POLICY
This privacy notice describes the U.S. privacy policy of Morgan Stanley Distribution, Inc., and the Morgan Stanley family of mutual funds ("us", "our", "we").
We are required by federal law to provide you with notice of our U.S. privacy policy ("Policy"). This Policy applies to both our current and former clients unless we state otherwise and is intended for individual clients who purchase products or receive services from us for personal, family or household purposes. This Policy is not applicable to partnerships, corporations, trusts or other non-individual clients or account holders, nor is this Policy applicable to individuals who are either beneficiaries of a trust for which we serve as trustee or participants in an employee benefit plan administered or advised by us. This Policy is, however, applicable to individuals who select us to be a custodian of securities or assets in individual retirement accounts, 401(k) accounts, or accounts subject to the Uniform Gifts to Minors Act.
This notice sets out our business practices to protect your privacy; how we collect and share personal information about you; and how you can limit our sharing or certain uses by others of this information. We may amend this Policy at any time, and will inform you of any changes to our Policy as required by law.
WE RESPECT YOUR PRIVACY
We appreciate that you have provided us with your personal financial information and understand your concerns about your information. We strive to safeguard the information our clients entrust to us. Protecting the confidentiality and security of client information is an important part of how we conduct our business.
This notice describes what personal information we collect about you, how we collect it, when we may share it with others, and how certain others may use it. It discusses the steps you may take to limit our sharing of certain information about you with our affiliated companies, including, but not limited to our affiliated banking businesses, brokerage firms and credit service affiliates. It also discloses how you may limit our affiliates' use of shared information for marketing purposes.
Throughout this Policy, we refer to the nonpublic information that personally identifies you as "personal information." We also use the term "affiliated company" in this notice. An affiliated company is a company in our family of companies and includes companies with the Morgan Stanley name. These affiliated companies are financial institutions such as broker-dealers, banks, investment advisers and credit card issuers. We refer to any company that is not an affiliated company as a nonaffiliated third party. For purposes of Section 5 of this notice, and your ability to limit certain uses of personal information by our affiliates, this notice applies to the use of personal information by our affiliated companies.
1. WHAT PERSONAL INFORMATION DO WE COLLECT FROM YOU?
We may collect the following types of information about you: (i) information provided by you, including information from applications and other forms we receive from you, (ii) information about your transactions with us or our affiliates, (iii) information about your transactions with nonaffiliated third parties, (iv) information from consumer reporting agencies, (v) information obtained from our websites, and (vi) information obtained from other sources. For example:
• We collect information such as your name, address, e-mail address, telephone/fax numbers, assets, income and investment objectives through applications and other forms you submit to us.
• We may obtain information about account balances, your use of account(s) and the types of products and services you prefer to receive from us through your dealings and transactions with us and other sources.
• We may obtain information about your creditworthiness and credit history from consumer reporting agencies.
• We may collect background information from and through third-party vendors to verify representations you have made and to comply with various regulatory requirements.
2. WHEN DO WE DISCLOSE PERSONAL INFORMATION WE COLLECT ABOUT YOU?
We may disclose personal information we collect about you in each of the categories listed above to affiliated and nonaffiliated third parties.
25
Morgan Stanley Institutional Fund, Inc.
Annual Report — December 31, 2015
U.S. Privacy Policy (unaudited) (cont'd)
a. Information We Disclose to Affiliated Companies.
We may disclose personal information that we collect about you to our affiliated companies to manage your account(s) effectively, to service and process your transactions, and to let you know about products and services offered by us and affiliated companies, to manage our business, and as otherwise required or permitted by law. Offers for products and services from affiliated companies are developed under conditions designed to safeguard your personal information.
b. Information We Disclose to Third Parties.
We may disclose personal information that we collect about you to nonaffiliated third parties to provide marketing services on our behalf or to other financial institutions with whom we have joint marketing agreements. We may also disclose all of the information we collect to other nonaffiliated third parties for our everyday business purposes, such as to process transactions, maintain account(s), respond to court orders and legal investigations, report to credit bureaus, offer our own products and services, protect against fraud, for institutional risk control, to perform services on our behalf, and as otherwise required or permitted by law.
When we share personal information about you with a nonaffiliated third party, they are required to limit their use of personal information about you to the particular purpose for which it was shared and they are not allowed to share personal information about you with others except to fulfill that limited purpose or as may be permitted or required by law.
3. HOW DO WE PROTECT THE SECURITY AND CONFIDENTIALITY OF PERSONAL INFORMATION WE COLLECT ABOUT YOU?
We maintain physical, electronic and procedural security measures that comply with applicable law and regulations to help safeguard the personal information we collect about you. We have internal policies governing the proper handling of client information by employees. Third parties that provide support or marketing services on our behalf may also receive personal information about you, and we require them to adhere to appropriate security standards with respect to such information.
4. HOW CAN YOU LIMIT OUR SHARING CERTAIN PERSONAL INFORMATION ABOUT YOU WITH OUR AFFILIATED COMPANIES FOR ELIGIBILITY DETERMINATION?
By following the opt-out procedures in Section 6 below, you may limit the extent to which we share with our affiliated companies, personal information that was collected to determine your eligibility for products and services such as your credit reports and other information that you have provided to us or that we may obtain from third parties ("eligibility information"). Eligibility information does not include your identification information or personal information pertaining to our transactions or experiences with you. Please note that, even if you direct us not to share eligibility information with our affiliated companies, we may still share your personal information, including eligibility information, with our affiliated companies under circumstances that are permitted under applicable law, such as to process transactions or to service your account.
5. HOW CAN YOU LIMIT THE USE OF CERTAIN PERSONAL INFORMATION ABOUT YOU BY OUR AFFILIATED COMPANIES FOR MARKETING?
By following the opt-out instructions in Section 6 below, you may limit our affiliated companies from marketing their products or services to you based on personal information we disclose to them. This information may include, for example, your income and account history with us. Please note that, even if you choose to limit our affiliated companies from using personal information about you that we may share with them for marketing their products and services to you, our affiliated companies may use your personal information that they obtain from us to market to you in circumstances permitted by law, such as if the affiliated party has its own relationship with you.
26
Morgan Stanley Institutional Fund, Inc.
Annual Report — December 31, 2015
U.S. Privacy Policy (unaudited) (cont'd)
6. HOW CAN YOU SEND US AN OPT-OUT INSTRUCTION?
If you wish to limit our sharing of eligibility information about you with our affiliated companies, or our affiliated companies' use of personal information for marketing purposes, as described in this notice, you may do so by:
• Calling us at (800) 548-7786
Monday–Friday between 8a.m. and 6p.m. (EST)
• Writing to us at the following address:
Boston Financial Data Services, Inc.
c/o Privacy Coordinator
P.O. Box 219804
Kansas City, Missouri 64121
If you choose to write to us, your request should include: your name, address, telephone number and account number(s) to which the opt-out applies and whether you are opting out with respect to sharing of eligibility information (Section 4 above), or information used for marketing (Section 5 above), or both. Written opt-out requests should not be sent with any other correspondence. In order to process your request, we require that the request be provided by you directly and not through a third party. Once you have informed us about your privacy preferences, your opt-out preference will remain in effect with respect to this Policy (as it may be amended) until you notify us otherwise. If you are a joint account owner, we will accept instructions from any one of you and apply those instructions to the entire account.
Please understand that if you limit our sharing or our affiliated companies' use of personal information, you and any joint account holder(s) may not receive information about our affiliated companies' products and services, including products or services that could help you manage your financial resources and achieve your investment objectives.
If you have more than one account or relationship with us, please specify the accounts to which you would like us to apply your privacy choices. If you have accounts or relationships with our affiliates, you may receive multiple privacy policies from them, and will need to separately notify those companies of your privacy choices for those accounts or relationships.
7. WHAT IF AN AFFILIATED COMPANY BECOMES A NONAFFILIATED THIRD PARTY?
If, at any time in the future, an affiliated company becomes a nonaffiliated third party, further disclosures of personal information made to the former affiliated company will be limited to those described in Section 2(b) above relating to nonaffiliated third parties. If you elected under Section 6 to limit disclosures we make to affiliated companies, or use of personal information by affiliated companies, your election will not apply to use by any former affiliated company of your personal information in their possession once it becomes a nonaffiliated third party.
SPECIAL NOTICE TO RESIDENTS OF VERMONT
The following section supplements our Policy with respect to our individual clients who have a Vermont address and supersedes anything to the contrary in the above Policy with respect to those clients only.
The State of Vermont requires financial institutions to obtain your consent prior to sharing personal information that they collect about you with nonaffiliated third parties, or eligibility information with affiliated companies, other than in certain limited circumstances. Except as permitted by law, we will not share personal information we collect about you with nonaffiliated third parties or eligibility information with affiliated companies, unless you provide us with your written consent to share such information.
SPECIAL NOTICE TO RESIDENTS OF CALIFORNIA
The following section supplements our Policy with respect to our individual clients who have a California address and supersedes anything to the contrary in the above Policy with respect to those clients only.
In response to a California law, if your account has a California home address, your personal information will not be disclosed to nonaffiliated third parties except as permitted by applicable California law, and we will limit sharing such personal information with our affiliates to comply with California privacy laws that apply to us.
27
Morgan Stanley Institutional Fund, Inc.
Annual Report — December 31, 2015
Director and Officer Information (unaudited)
Independent Directors:
| Name, Age and Address of Independent Director | Positions(s) Held with Registrant | Length of Time Served* | Principal Occupation(s) During Past 5 Years and Other Relevant Professional Experience | Number of Portfolios in Fund Complex Overseen by Director** | Other Directorships Held by Independent Director*** | ||||||||||||||||||
| Frank L. Bowman (71) c/o Kramer Levin Naftalis & Frankel LLP Counsel to the Independent Directors 1177 Avenue of the Americas New York, NY 10036 | Director | Since August 2006 | President, Strategic Decisions, LLC (consulting) (since February 2009); Director or Trustee of various Morgan Stanley Funds (since August 2006); Chairperson of the Compliance and Insurance Committee (since October 2015); Formerly, Chairperson of the Insurance Sub-Committee of the Compliance and Insurance Committee (February 2007-December 2015); served as President and Chief Executive Officer of the Nuclear Energy Institute (policy organization) (February 2005-November 2008); retired as Admiral, U.S. Navy after serving over 38 years on active duty including 8 years as Director of the Naval Nuclear Propulsion Program in the Department of the Navy and the U.S. Department of Energy (1996-2004); served as Chief of Naval Personnel (July 1994-September 1996); and on the Joint Staff as Director of Political Military Affairs (June 1992-July1994); knighted as Honorary Knight Commander of the Most Excellent Order of the British Empire; awarded the Officier de l'Orde National du Mérite by the French Government; elected to the National Academy of Engineering (2009). | 98 | Director of BP p.l.c.; Director of Naval and Nuclear Technologies LLP; Director Emeritus of the Armed Services YMCA; Director of the U.S. Naval Submarine League; Member of the National Security Advisory Council of the Center for U.S. Global Engagement and a member of the CNA Military Advisory Board; Chairman of the Charity, J Street Cup Golf, Trustee of Fairhaven United Methodist Church; and Director of other various non-profit organizations. | ||||||||||||||||||
| Kathleen A. Dennis (62) c/o Kramer Levin Naftalis & Frankel LLP Counsel to the Independent Directors 1177 Avenue of the Americas New York, NY 10036 | Director | Since August 2006 | President, Cedarwood Associates (mutual fund and investment management consulting) (since July 2006); Chairperson of the Money Market and Alternatives Sub-Committee of the Investment Committee (since October 2006) and Director or Trustee of various Morgan Stanley Funds (since August 2006); formerly, Senior Managing Director of Victory Capital Management (1993-2006). | 98 | Director of various nonprofit organizations. | ||||||||||||||||||
| Nancy C. Everett (61) c/o Kramer Levin Naftalis & Frankel LLP Counsel to the Independent Directors 1177 Avenue of the Americas New York, NY 10036 | Director | Since January 2015 | Chief Executive Officer, Virginia Commonwealth University Investment Company (since November 2015); Owner, OBIR, LLC (investment management consulting) (since June 2014); formerly, Managing Director, BlackRock Inc. (February 2011-December 2013); and Chief Executive Officer, General Motors Asset Management (a/k/a Promark Global Advisors, Inc.) (June 2005-May 2010). | 98 | Member of Virginia Commonwealth University School of Business Foundation; formerly, Member of Virginia Commonwealth University Board of Visitors (2013-2015); Member of Committee on Directors for Emerging Markets Growth Fund, Inc. (2007-2010); Chairperson of Performance Equity Management, LLC (2006-2010); and Chairperson, GMAM Absolute Return Strategies Fund, LLC (2006-2010). | ||||||||||||||||||
28
Morgan Stanley Institutional Fund, Inc.
Annual Report — December 31, 2015
Director and Officer Information (unaudited) (cont'd)
Independent Directors: (cont'd)
| Name, Age and Address of Independent Director | Positions(s) Held with Registrant | Length of Time Served* | Principal Occupation(s) During Past 5 Years and Other Relevant Professional Experience | Number of Portfolios in Fund Complex Overseen by Director** | Other Directorships Held by Independent Director*** | ||||||||||||||||||
| Jakki L. Haussler (58) c/o Kramer Levin Naftalis & Frankel LLP Counsel to the Independent Directors 1177 Avenue of the Americas New York, NY 10036 | Director | Since January 2015 | Chairman and Chief Executive Officer, Opus Capital Group (since January 1996); and formerly, Director, Capvest Venture Fund, LP (May 2000-December 2011); Partner, Adena Ventures, LP (July 1999-December 2010); Director, The Victory Funds (February 2005-July 2008). | 98 | Director of Cincinnati Bell Inc. and Member, Audit Committee and Compensation Committee; Director of Northern Kentucky University Foundation and Member, Investment Committee; Member of Chase College of Law Transactional Law Practice Center Board of Advisors; Director of Best Transport; Chase College of Law Board of Visitors; formerly Member, University of Cincinnati Foundation Investment Committee; Member, Miami University Board of Visitors (2008-2011); Trustee of Victory Funds (2005-2008) and Chairman, Investment Committee (2007-2008) and Member, Service Provider Committee (2005-2008). | ||||||||||||||||||
| Dr. Manuel H. Johnson (67) c/o Johnson Smick International, Inc. 220 I Street, N.E. — Suite 200 Washington, D.C. 20002 | Director | Since July 1991 | Senior Partner, Johnson Smick International, Inc. (consulting firm); Chairperson of the Investment Committee (since October 2006) and Director or Trustee of various Morgan Stanley Funds (since July 1991); Co-Chairman and a founder of the Group of Seven Council (G7C) (international economic commission); formerly Chairperson of the Audit Committee (July 1991-September 2006), Vice Chairman of the Board of Governors of the Federal Reserve System and Assistant Secretary of the U.S. Treasury. | 100 | Director of NVR, Inc. (home construction). | ||||||||||||||||||
| Joseph J. Kearns (73) c/o Kearns & Associates LLC 23823 Malibu Road S-50-440 Malibu, CA 90265 | Director | Since August 1994 | President, Kearns & Associates LLC (investment consulting); Chairperson of the Audit Committee (since October 2006) and Director or Trustee of various Morgan Stanley Funds (since August 1994); formerly, Deputy Chairperson of the Audit Committee (July 2003-September 2006) and Chairperson of the Audit Committee of various Morgan Stanley Funds (since August 1994); CFO of the J. Paul Getty Trust. | 101 | Director of Electro Rent Corporation (equipment leasing). Prior to December 31, 2013, Director of The Ford Family Foundation. | ||||||||||||||||||
29
Morgan Stanley Institutional Fund, Inc.
Annual Report — December 31, 2015
Director and Officer Information (unaudited) (cont'd)
Independent Directors: (cont'd)
| Name, Age and Address of Independent Director | Positions(s) Held with Registrant | Length of Time Served* | Principal Occupation(s) During Past 5 Years and Other Relevant Professional Experience | Number of Portfolios in Fund Complex Overseen by Director** | Other Directorships Held by Independent Director*** | ||||||||||||||||||
| Michael F. Klein (57) c/o Kramer Levin Naftalis & Frankel LLP Counsel to the Independent Directors 1177 Avenue of the Americas New York, NY 10036 | Director | Since August 2006 | Managing Director, Aetos Capital, LLC (since March 2000); Co-President, Aetos Alternatives Management, LLC (since January 2004); and Co-Chief Executive Officer of Aetos Capital LLC (since August 2013); Chairperson of the Fixed Income Sub-Committee of the Investment Committee (since October 2006) and Director or Trustee of various Morgan Stanley Funds (since August 2006); formerly, Managing Director, Morgan Stanley & Co. Inc. and Morgan Stanley Dean Witter Investment Management, President, various Morgan Stanley Funds (June1998-March 2000) and Principal, Morgan Stanley & Co. Inc. and Morgan Stanley Dean Witter Investment Management (August 1997-December 1999). | 97 | Director of certain investment funds managed or sponsored by Aetos Capital, LLC. Director of Sanitized AG and Sanitized Marketing AG (specialty chemicals). | ||||||||||||||||||
| Michael E. Nugent (79) 522 Fifth Avenue New York, NY 10036 | Chair of the Board and Director | Chair of the Boards since July 2006 and Director since July 1991 | Chair of the Boards of various Morgan Stanley Funds (since July 2006); Chairperson of the Closed-End Fund Committee (since June 2012) and Director or Trustee of various Morgan Stanley Funds (since July 1991); formerly, Chairperson of the Insurance Committee (until July 2006), General Partner, TriumphCapital, L.P. (private investment partnership) (1988-2013). | 100 | None. | ||||||||||||||||||
| W. Allen Reed (68) c/o Kramer Levin Naftalis & Frankel LLP Counsel to the Independent Directors 1177 Avenue of the Americas New York, NY 10036 | Director | Since August 2006 | Chairperson of the Equity Sub-Committee of the Investment Committee (since October 2006) and Director or Trustee of various Morgan Stanley Funds (since August 2006); formerly, President and CEO of General Motors Asset Management; Chairman and Chief Executive Officer of the GM Trust Bank and Corporate Vice President of General Motors Corporation (August 1994-December 2005). | 98 | Director of Legg Mason, Inc.; formerly Director of the Auburn University Foundation (2010-2015). | ||||||||||||||||||
| Fergus Reid (83) c/o Joe Pietryka, Inc. 85 Charles Colman Blvd. Pawling, NY 12564 | Director | Since June 1992 | Chairman, Joe Pietryka, Inc.; Chairperson of the Governance Committee and Director or Trustee of various Morgan Stanley Funds (since June 1992). | 100 | Formerly, Trustee and Director of certain investment companies in the JP Morgan Fund Complex managed by JP Morgan Investment Management Inc. (1987-2012). | ||||||||||||||||||
30
Morgan Stanley Institutional Fund, Inc.
Annual Report — December 31, 2015
Director and Officer Information (unaudited) (cont'd)
Interested Director:
| Name, Age and Address of Interested Director | Positions(s) Held with Registrant | Length of Time Served* | Principal Occupation(s) During Past 5 Years | Number of Portfolios in Fund Complex Overseen by Interested Director** | Other Directorships Held by Interested Director*** | ||||||||||||||||||
| James F. Higgins (68) One New York Plaza, New York, NY 10004 | Director | Since June 2000 | Director or Trustee of various Morgan Stanley Funds (since June 2000); Senior Advisor of Morgan Stanley (since August 2000). | 99 | Formerly, Director of AXA Financial, Inc. and AXA Equitable Life Insurance Company (2002-2011) and Director of AXA MONY Life Insurance Company and AXA MONY Life Insurance Company of America (2004-2011). | ||||||||||||||||||
* This is the earliest date the Director began serving the Morgan Stanley Funds. Each Director serves an indefinite term, until his or her successor is elected.
** The Fund Complex includes (as of December 31, 2015) all open-end and closed-end funds (including all of their portfolios) advised by Morgan Stanley Investment Management Inc. (the "Adviser") and any funds that have an adviser that is an affiliated person of the Adviser (including, but not limited to, Morgan Stanley AIP GP LP).
*** This includes any directorships at public companies and registered investment companies held by the Director at any time during the past five years.
Executive Officers:
Name, Age and Address of Executive Officer | Position(s) Held with Registrant | Length of Time Served**** | Principal Occupation(s) During Past 5 Years | ||||||||||||
| John H. Gernon (52) 522 Fifth Avenue New York, NY 10036 | President and Principal Executive Officer | Since September 2013 | President and Principal Executive Officer of the Equity and Fixed Income Funds and the Morgan Stanley AIP Funds (since September 2013) and the Liquidity Funds and various money market funds (since May 2014) in the Fund Complex, Managing Director of the Adviser; Head of Product (since 2006). | ||||||||||||
| Stefanie V. Chang Yu (49) 522 Fifth Avenue New York, NY 10036 | Chief Compliance Officer | Since December 1997 | Managing Director of the Adviser and various entities affiliated with the Adviser; Chief Compliance Officer of various Morgan Stanley Funds and the Adviser (since January 2014); formerly, Vice President of various Morgan Stanley Funds (December 1997-January 2014). | ||||||||||||
| Joseph C. Benedetti (50) 522 Fifth Avenue New York, NY 10036 | Vice President | Since January 2014 | Managing Director of the Adviser and various entities affiliated with the Adviser; Vice President of various Morgan Stanley Funds (since January 2014); formerly, Assistant Secretary of various Morgan Stanley Funds (October 2004-January 2014). | ||||||||||||
| Francis J. Smith (50) 522 Fifth Avenue New York, NY 10036 | Treasurer and Principal Financial Officer | Treasurer since July 2003 and Principal Financial Officer since September 2002 | Executive Director of the Adviser and various entities affiliated with the Adviser; Treasurer (since July 2003) and Principal Financial Officer of various Morgan Stanley Funds (since September 2002). | ||||||||||||
| Mary E. Mullin (48) 522 Fifth Avenue New York, NY 10036 | Secretary | Since June 1999 | Executive Director of the Adviser; Secretary of various Morgan Stanley Funds (since June 1999). | ||||||||||||
**** This is the earliest date the officer began serving the Morgan Stanley Funds. Each officer serves a one-year term, until his or her successor is elected and has qualified.
31
Morgan Stanley Institutional Fund, Inc.
Annual Report — December 31, 2015
Adviser and Administrator
Morgan Stanley Investment Management Inc.
522 Fifth Avenue
New York, New York 10036
Sub-Advisers
Morgan Stanley Investment Management Limited
25 Cabot Square, Canary Wharf
London, E14 4QA, England
Morgan Stanley Investment Management Company
23 Church Street
16-01 Capital Square, Singapore 049481
Distributor
Morgan Stanley Distribution, Inc.
522 Fifth Avenue
New York, New York 10036
Dividend Disbursing and Transfer Agent
Boston Financial Data Services, Inc.
2000 Crown Colony Drive
Quincy, Massachusetts 02169
Custodian
State Street Bank and Trust Company
One Lincoln Street
Boston, Massachusetts 02111
Legal Counsel
Dechert LLP
1095 Avenue of the Americas
New York, New York 10036
Counsel to the Independent Directors
Kramer Levin Naftalis & Frankel LLP
1177 Avenue of the Americas
New York, New York 10036
Independent Registered Public Accounting Firm
Ernst & Young LLP
200 Clarendon Street
Boston, Massachusetts 02116
Reporting to Shareholders
Each Morgan Stanley fund provides a complete schedule of portfolio holdings in its semi-annual and annual reports within 60 days of the end of the fund's second and fourth fiscal quarters. The semi-annual and annual reports are filed electronically with the Securities and Exchange Commission (SEC) on Form N-CSRS and Form N-CSR, respectively. Morgan Stanley also delivers the semi-annual and annual reports to fund shareholders and makes these reports available on its public website, www.morganstanley.com/im. Each Morgan Stanley fund also files a complete schedule of portfolio holdings with the SEC for the fund's first and third fiscal quarters on Form N-Q. Morgan Stanley does not deliver the reports for the first and third fiscal quarters to shareholders, nor are the reports posted to the Morgan Stanley public website. You may, however, obtain the Form N-Q filings (as well as the Form N-CSR and N-CSRS filings) by accessing the SEC's website, www.sec.gov. You may also review and copy them at the SEC's Public Reference Room in Washington, DC. Information on the operation of the SEC's Public Reference Room may be obtained by calling the SEC toll free at 1 (800) SEC-0330. You can also request copies of these materials, upon payment of a duplicating fee, by electronic request at the SEC's email address (publicinfo@sec.gov) or by writing the Public Reference Room of the SEC, Washington, DC 20549-0102.
Proxy Voting Policies and Procedures and Proxy Voting Record
You may obtain a copy of the Fund's Proxy Voting Policy and Procedures and information regarding how the Fund voted proxies relating to portfolio securities during the most recent twelve-month period ended June 30, without charge, upon request, by calling toll free 1 (800) 548-7786 or by visiting our website at www.morganstanley.com/im. This information is also available on the SEC's website at www.sec.gov.
This report is authorized for distribution only when preceded or accompanied by a prospectus of the Morgan Stanley Institutional Fund, Inc., which describes in detail each Portfolio's investment policies, risks, fees and expenses. Please read the prospectus carefully before you invest or send money. For additional information, including information regarding the investments comprising the Portfolio, please visit our website at www.morganstanley.com/im or call toll free 1 (800) 548-7786.
32
Printed in U.S.A.
This Report has been prepared for shareholders and may be distributed to others only if preceded or accompanied by a current prospectus.
Morgan Stanley Investment Management Inc.
522 Fifth Avenue
New York, New York 10036
© 2016 Morgan Stanley. Morgan Stanley Distribution, Inc.

IFIGQANN
1405170 EXP. 02.28.17
INVESTMENT MANAGEMENT

Morgan Stanley Institutional Fund, Inc.
Global Franchise Portfolio
Annual Report
December 31, 2015

Morgan Stanley Institutional Fund, Inc.
Annual Report — December 31, 2015
Table of Contents
Shareholders' Letter | 2 | ||||||
Expense Example | 3 | ||||||
Investment Overview | 4 | ||||||
Portfolio of Investments | 6 | ||||||
Statement of Assets and Liabilities | 7 | ||||||
Statement of Operations | 9 | ||||||
Statements of Changes in Net Assets | 10 | ||||||
Financial Highlights | 12 | ||||||
Notes to Financial Statements | 17 | ||||||
Report of Independent Registered Public Accounting Firm | 23 | ||||||
Federal Tax Notice | 24 | ||||||
U.S. Privacy Policy | 25 | ||||||
Director and Officer Information | 28 | ||||||
This report is authorized for distribution only when preceded or accompanied by prospectuses of the Morgan Stanley Institutional Fund, Inc. To receive a prospectus and/or statement of additional information (SAI), which contains more complete information such as investment objectives, charges, expenses, policies for voting proxies, risk considerations, and describes in detail each of the Portfolio's investment policies to the prospective investor, please call toll free 1 (800) 548-7786. Please read the prospectuses carefully before you invest or send money.
Additionally, you can access portfolio information including performance, characteristics, and investment team commentary through Morgan Stanley Investment Management's website: www.morganstanley.com/im.
Market forecasts provided in this report may not necessarily come to pass. There is no guarantee that any sectors mentioned will continue to perform as discussed herein or that securities in such sectors will be held by the Portfolio in the future. There is no assurance that a Portfolio will achieve its investment objective. Portfolios are subject to market risk, which is the possibility that market values of securities owned by the Portfolio will decline and, therefore, the value of the Portfolio's shares may be less than what you paid for them. Accordingly, you can lose money investing in this Portfolio. Please see the prospectus for more complete information on investment risks.
1
Morgan Stanley Institutional Fund, Inc.
Annual Report — December 31, 2015
Shareholders' Letter (unaudited)
Dear Shareholders,
We are pleased to provide this Annual report, in which you will learn how your investment in Global Franchise Portfolio (the "Portfolio") performed during the latest twelve-month period.
Morgan Stanley Investment Management is a client-centric, investor-led organization. Our global presence, intellectual capital, and breadth of products and services enable us to partner with investors to meet the evolving challenges of today's financial markets. We aim to deliver superior investment service and to empower our clients to make the informed decisions that help them reach their investment goals.
As always, we thank you for selecting Morgan Stanley Investment Management, and look forward to working with you in the months and years ahead.
Sincerely,

John H. Gernon
President and Principal Executive Officer
January 2016
2
Morgan Stanley Institutional Fund, Inc.
Annual Report — December 31, 2015
Expense Example (unaudited)
Global Franchise Portfolio
As a shareholder of the Portfolio, you incur two types of costs: (1) transactional costs; and (2) ongoing costs, including advisory fees, administration fees, distribution and shareholder services fees and other Portfolio expenses. This example is intended to help you understand your ongoing costs (in dollars) of investing in the Portfolio and to compare these costs with the ongoing costs of investing in other mutual funds.
This example is based on an investment of $1,000 invested at the beginning of the six-month period ended December 31, 2015 and held for the entire six-month period.
Actual Expenses
The table below provides information about actual account values and actual expenses. You may use the information in this table, together with the amount you invested, to estimate the expenses that you paid over the period. Simply divide your account value by $1,000 (for example, an $8,600 account value divided by $1,000 = 8.6), then multiply the result by the number in the table under the heading entitled "Actual Expenses Paid During Period" to estimate the expenses you paid on your account during this period.
Hypothetical Example for Comparison Purposes
The table below provides information about hypothetical account values and hypothetical expenses based on the Portfolio's actual expense ratio and an assumed rate of return of 5% per year before expenses, which is not the Portfolio's actual return. The hypothetical account values and expenses may not be used to estimate the actual ending account balance or expenses you paid for the period. You may use this information to compare the ongoing costs of investing in the Portfolio and other funds. To do so, compare this 5% hypothetical example with the 5% hypothetical examples that appear in the shareholder reports of the other funds.
Please note that the expenses shown in the table are meant to highlight your ongoing costs only and do not reflect any transactional costs, such as sales charges (loads). Therefore, the information for each class in the table is useful in comparing ongoing costs only, and will not help you determine the relative total costs of owning different funds. In addition, if these transactional costs were included, your costs would have been higher.
| Beginning Account Value 7/1/15 | Actual Ending Account Value 12/31/15 | Hypothetical Ending Account Value | Actual Expenses Paid During Period | Hypothetical Expenses Paid During Period | Net Expense Ratio During Period*** | ||||||||||||||||||||||
Global Franchise Portfolio Class I | $ | 1,000.00 | $ | 1,028.40 | $ | 1,020.21 | $ | 5.06 | * | $ | 5.04 | * | 0.99 | % | |||||||||||||
Global Franchise Portfolio Class A | 1,000.00 | 1,027.00 | 1,018.90 | 6.39 | * | 6.36 | * | 1.25 | |||||||||||||||||||
Global Franchise Portfolio Class L | 1,000.00 | 1,024.70 | 1,016.48 | 8.83 | * | 8.79 | * | 1.73 | |||||||||||||||||||
Global Franchise Portfolio Class C | 1,000.00 | 1,051.10 | 1,007.49 | 5.25 | ** | 5.14 | ** | 2.03 | |||||||||||||||||||
Global Franchise Portfolio Class IS | 1,000.00 | 1,028.40 | 1,020.47 | 4.81 | * | 4.79 | * | 0.94 | |||||||||||||||||||
* Expenses are calculated using each Portfolio Class' annualized net expense ratio (as disclosed), multiplied by the average account value over the period, and multiplied by 184/365 (to reflect the most recent one-half year period).
** Expenses are calculated using the Portfolio Class' annualized net expense ratio (as disclosed), multiplied by the average account value over the period, and multiplied by 92/365 (to reflect the actual days in period).
*** Annualized.
3
Morgan Stanley Institutional Fund, Inc.
Annual Report — December 31, 2015
Investment Overview (unaudited)
Global Franchise Portfolio
The Portfolio seeks long-term capital appreciation.
Performance
For the year ended December 31, 2015, the Portfolio's Class I shares had a total return based on net asset value and reinvestment of distributions per share of 6.50%, net of fees. The Portfolio's Class I shares outperformed the Portfolio's benchmark, the MSCI World Index (the "Index"), which returned –0.87%.
Factors Affecting Performance
• After stocks looked into the void in September, the fourth quarter of 2015 started with a strong rally in October, followed by a relatively uneventful November and then fell again in December. After all was said and done, the Index ended the year down 0.9% in U.S. dollar (USD) terms (+2.1% in local currency) as a strong U.S. dollar continued to impact local market returns and fears of a China slowdown continued to add to volatility.
• In 2015, notable developed market laggards were the countries most exposed to the commodity complex: Canada (–24.2% in USD), Norway (–15.0%) and Australia (–10.0%). Some of the best performers were Denmark (+23.4%), Ireland (+16.5%) and Belgium (+12.1%). Benefiting from additional quantitative easing, Japan delivered decent performance, up 9.6% for the year; however, the eurozone (–2.8%) and the UK (–7.6%) underperformed. The U.S. was modestly up over the full year (+0.7%). Turning to developing markets, the MSCI Emerging Markets Index was down 15% for the year, with Greece (–61%) and Latin America (–31%) inflicting much of the damage. China ended the year down 7.8%, and Russia eased back into positive territory, up 4.2%.(i) (All country and regional performance is represented by the respective MSCI index in U.S. dollar terms.)
• On a sector basis, for the year, the Index was led by health care (+6.6%), consumer staples (+6.4%) and consumer discretionary (+5.5%), while energy (–22.8%), materials (–15.3%) and utilities (–6.6%) were the biggest laggards.
• The Portfolio outperformed the Index significantly for the year thanks to both sector allocation and stock selection. Sector allocation was very strong as the major overweight in consumer staples and zero weights in energy, materials and utilities all helped, although the underweight in health care was a bit of a drag on performance. For stock selection, outperformance in information technology and consumer staples comfortably outweighed the underperformance in consumer discretionary.
• Top absolute contributors to the Portfolio's performance for the year were Microsoft, Reckitt Benckiser and Mondelez International. Top absolute detractors for the period were Time Warner, Twenty-First Century Fox, and Procter & Gamble.(ii)
Management Strategies
• This time last year we identified a litany of problems facing equity markets — ranging from high valuations and earnings risk, to emerging markets malaise, to an underlying, likely destructive, tide of disinflation or outright deflation that showed few signs of abating. Suffice it to say that none of these have gone away. Rather, existing problems have intensified, new ones have emerged, and there are few hiding places across increasingly correlated asset classes.
• This difficult macro outlook and the gathering deflationary clouds are hardly a propitious backdrop for us as bottom-up stock pickers, as they present an increasingly difficult outlook for the companies we invest in — or hope to invest in. We are, of course, used to uncertainty, and this uncertainty is not in itself problematic, provided one is given a good margin of relative safety on valuation to hold an existing stock or invest in a new stock idea.
• For the Portfolio's existing holdings, we are not generally overly concerned about what we consider our highest-quality stocks, such as those in the consumer staples sector, where the investment proposition amounts to seeking to own quality companies at fair prices, albeit with some concerns such as emerging markets exposure.
• As for new opportunities generally, the pickings are slim. We continue to concentrate on what we consider the higher-quality stocks in the higher-quality sectors, which combine steady, if moderate, top-line growth through recurring revenues, sustainable high margins through pricing power, and the ability to generate cash through high returns on unlevered capital. While not offering a perfect defense against any general market de-rating in the short-term, we believe these companies could continue to compound their earnings steadily, while throwing off cash, which could mitigate the impact of any de-rating in the medium-term. Overall for now, our approach continues to be not to blow the lights out, but just to keep the lights burning.
(i) Country and sector performance data from FactSet.
(ii) The information contained in this overview regarding specific securities is for informational purposes only and should not be construed as a recommendation to purchase or sell the securities mentioned.
4
Morgan Stanley Institutional Fund, Inc.
Annual Report — December 31, 2015
Investment Overview (unaudited)
Global Franchise Portfolio
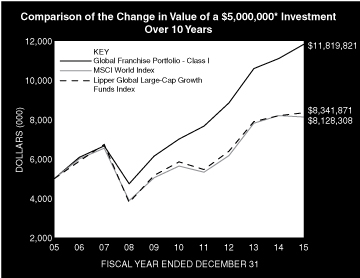
* Minimum Investment for Class I shares
In accordance with SEC regulations, the Portfolio's performance shown assumes that all recurring fees (including management fees) were deducted and all dividends and distributions were reinvested. The performance of Class A, L, C and IS shares will vary from the performance of Class I shares based upon their different inception dates and will be negatively impacted by additional fees assessed to those classes (if applicable).
Performance Compared to the MSCI World Index(1) and the Lipper Global Large-Cap Growth Funds Index(2)
| Period Ended December 31, 2015 Total Returns(3) | |||||||||||||||||||
Average Annual | |||||||||||||||||||
| One Year | Five Years | Ten Years | Since Inception(8) | ||||||||||||||||
| Portfolio — Class I Shares w/o sales charges(4) | 6.50 | % | 11.02 | % | 8.98 | % | 11.02 | % | |||||||||||
| Portfolio — Class A Shares w/o sales charges(4) | 6.25 | 10.71 | 8.70 | 10.72 | |||||||||||||||
| Portfolio — Class A Shares with maximum 5.25% sales charges(4) | 0.69 | 9.52 | 8.11 | 10.30 | |||||||||||||||
| Portfolio — Class L Shares w/o sales charges(5) | 5.72 | — | — | 7.92 | |||||||||||||||
| Portfolio — Class C Shares w/o sales charges(7) | — | — | — | 5.11 | |||||||||||||||
| Portfolio — Class C Shares with maximum 1.00% deferred sales charges(7) | — | — | — | 4.12 | |||||||||||||||
| Portfolio — Class IS Shares w/o sales charges(6) | — | — | — | 0.45 | |||||||||||||||
MSCI World Index | –0.87 | 7.59 | 4.98 | 5.81 | |||||||||||||||
| Lipper Global Large-Cap Growth Funds Index | 1.76 | 7.35 | 5.25 | 5.39 | |||||||||||||||
Performance data quoted represents past performance, which is no guarantee of future results, and current performance may be lower or higher than the figures shown. Performance assumes that all dividends and distributions, if any, were reinvested. For the most recent month-end performance figures, please visit www.morganstanley.com/im. Investment return and principal value will fluctuate so that Portfolio shares, when redeemed, may be worth more or less than their original cost. Total returns do not reflect the deduction of taxes that a shareholder would pay on Portfolio distributions or the redemption of Portfolio shares. Returns for periods less than one year are not annualized. Performance of share classes will vary due to difference in expenses.
(1) The MSCI World Index is a free float-adjusted market capitalization weighted index that is designed to measure the global equity market performance of developed markets. The term "free float" represents the portion of shares outstanding that are deemed to be available for purchase in the public equity markets by investors. The MSCI World Index currently consists of 23 developed market country indices. The performance of the Index is listed in U.S. dollars and assumes reinvestment of net dividends. The Index is unmanaged and its returns do not include any sales charges or fees. Such costs would lower performance. It is not possible to invest directly in an index.
(2) The Lipper Global Large-Cap Growth Funds Index is an equally weighted performance index of the largest qualifying funds (based on net assets) in the Lipper Global Large-Cap Growth Funds classification. The Index, which is adjusted for capital gains distributions and income dividends, is unmanaged and should not be considered an investment. There are currently 10 funds represented in this Index. As of the date of this report, the Portfolio is in the Lipper Global Large-Cap Growth Funds classification.
(3) Total returns for the Portfolio reflect fees waived and expenses reimbursed, if applicable, by the Adviser. Without such waivers and reimbursements, total returns would have been lower.
(4) Commenced operations on November 28, 2001.
(5) Commenced offering on April 27, 2012.
(6) Commenced offering on May 29, 2015.
(7) Commenced offering on September 30, 2015.
(8) For comparative purposes, average annual since inception returns listed for the Indexes refer to the inception date of Class I of the Portfolio, not the inception of the Index.
5
Morgan Stanley Institutional Fund, Inc.
Annual Report — December 31, 2015
Portfolio of Investments
Global Franchise Portfolio
Shares | Value (000) | ||||||||||
Common Stocks (95.8%) | |||||||||||
France (8.3%) | |||||||||||
L'Oreal SA | 96,567 | $ | 16,247 | ||||||||
Pernod Ricard SA | 135,788 | 15,438 | |||||||||
Publicis Groupe SA | 94,440 | 6,264 | |||||||||
Sanofi | 137,513 | 11,733 | |||||||||
49,682 | |||||||||||
Germany (2.2%) | |||||||||||
SAP SE | 163,025 | 12,985 | |||||||||
Italy (0.8%) | |||||||||||
Davide Campari-Milano SpA | 558,081 | 4,805 | |||||||||
Japan (2.3%) | |||||||||||
Japan Tobacco, Inc. | 377,800 | 13,872 | |||||||||
Netherlands (0.5%) | |||||||||||
RELX N.V. | 191,325 | 3,217 | |||||||||
Switzerland (7.9%) | |||||||||||
Nestle SA (Registered) | 630,936 | 46,767 | |||||||||
United Kingdom (22.6%) | |||||||||||
British American Tobacco PLC | 789,496 | 43,848 | |||||||||
Experian PLC | 640,512 | 11,318 | |||||||||
Reckitt Benckiser Group PLC | 455,876 | 41,963 | |||||||||
RELX PLC | 175,480 | 3,077 | |||||||||
Unilever PLC | 794,788 | 34,031 | |||||||||
134,237 | |||||||||||
United States (51.2%) | |||||||||||
3M Co. | 39,594 | 5,964 | |||||||||
Accenture PLC, Class A | 259,633 | 27,132 | |||||||||
Altria Group, Inc. | 480,719 | 27,983 | |||||||||
Automatic Data Processing, Inc. | 127,024 | 10,761 | |||||||||
Intuit, Inc. | 70,940 | 6,846 | |||||||||
Microsoft Corp. | 916,406 | 50,842 | |||||||||
Mondelez International, Inc., Class A | 609,201 | 27,317 | |||||||||
Moody's Corp. | 57,837 | 5,803 | |||||||||
NIKE, Inc., Class B | 153,112 | 9,570 | |||||||||
Philip Morris International, Inc. | 170,962 | 15,029 | |||||||||
Reynolds American, Inc. | 611,059 | 28,200 | |||||||||
Time Warner, Inc. | 287,568 | 18,597 | |||||||||
Twenty-First Century Fox, Inc., Class A | 418,306 | 11,361 | |||||||||
Twenty-First Century Fox, Inc., Class B | 510,087 | 13,890 | |||||||||
Visa, Inc., Class A | 321,211 | 24,910 | |||||||||
Walt Disney Co. (The) | 193,437 | 20,326 | |||||||||
304,531 | |||||||||||
Total Common Stocks (Cost $461,932) | 570,096 | ||||||||||
Shares | Value (000) | ||||||||||
Short-Term Investment (3.4%) | |||||||||||
Investment Company (3.4%) | |||||||||||
| Morgan Stanley Institutional Liquidity Funds — Treasury Securities Portfolio — Institutional Class (See Note G) (Cost $20,401) | 20,401,319 | $ | 20,401 | ||||||||
Total Investments (99.2%) (Cost $482,333) (a)(b) | 590,497 | ||||||||||
Other Assets in Excess of Liabilities (0.8%) | 4,793 | ||||||||||
Net Assets (100.0%) | $ | 595,290 | |||||||||
(a) The approximate fair value and percentage of net assets, $265,565,000 and 44.6%, respectively, represent the securities that have been fair valued under the fair valuation policy for international investments as described in Note A-1 within the Notes to the Financial Statements.
(b) At December 31, 2015, the aggregate cost for Federal income tax purposes is approximately $485,239,000. The aggregate gross unrealized appreciation is approximately $113,565,000 and the aggregate gross unrealized depreciation is approximately $8,307,000 resulting in net unrealized appreciation of approximately $105,258,000.
Portfolio Composition
Classification | Percentage of Total Investments | ||||||
Tobacco | 21.8 | % | |||||
Other* | 14.4 | ||||||
Media | 13.0 | ||||||
Food Products | 12.6 | ||||||
Software | 12.0 | ||||||
Information Technology Services | 10.6 | ||||||
Personal Products | 8.5 | ||||||
Household Products | 7.1 | ||||||
Total Investments | 100.0 | % | |||||
* Industries and/or investment types representing less than 5% of total investments.
The accompanying notes are an integral part of the financial statements.
6
Morgan Stanley Institutional Fund, Inc.
Annual Report — December 31, 2015
Global Franchise Portfolio
Statement of Assets and Liabilities | December 31, 2015 (000) | ||||||
Assets: | |||||||
Investments in Securities of Unaffiliated Issuers, at Value (Cost $461,932) | $ | 570,096 | |||||
Investment in Security of Affiliated Issuer, at Value (Cost $20,401) | 20,401 | ||||||
Total Investments in Securities, at Value (Cost $482,333) | 590,497 | ||||||
Foreign Currency, at Value (Cost $21) | 21 | ||||||
Receivable for Portfolio Shares Sold | 4,191 | ||||||
Dividends Receivable | 1,237 | ||||||
Tax Reclaim Receivable | 657 | ||||||
Receivable from Affiliate | — | @ | |||||
Other Assets | 79 | ||||||
Total Assets | 596,682 | ||||||
Liabilities: | |||||||
Payable for Advisory Fees | 1,075 | ||||||
Payable for Portfolio Shares Redeemed | 106 | ||||||
Payable for Sub Transfer Agency Fees — Class I | 51 | ||||||
Payable for Sub Transfer Agency Fees — Class A | 5 | ||||||
Payable for Sub Transfer Agency Fees — Class L | 1 | ||||||
Payable for Sub Transfer Agency Fees — Class C | — | @ | |||||
Payable for Administration Fees | 39 | ||||||
Payable for Shareholder Services Fees — Class A | 16 | ||||||
Payable for Distribution and Shareholder Services Fees — Class L | 6 | ||||||
Payable for Distribution and Shareholder Services Fees — Class C | 6 | ||||||
Payable for Custodian Fees | 23 | ||||||
Payable for Professional Fees | 13 | ||||||
Payable for Directors' Fees and Expenses | 10 | ||||||
Payable for Transfer Agency Fees — Class I | 3 | ||||||
Payable for Transfer Agency Fees — Class A | 1 | ||||||
Payable for Transfer Agency Fees — Class L | — | @ | |||||
Payable for Transfer Agency Fees — Class C | — | @ | |||||
Other Liabilities | 37 | ||||||
Total Liabilities | 1,392 | ||||||
Net Assets | $ | 595,290 | |||||
Net Assets Consist Of: | |||||||
Paid-in-Capital | $ | 486,869 | |||||
Accumulated Undistributed Net Investment Income | 207 | ||||||
Accumulated Net Realized Gain | 111 | ||||||
Unrealized Appreciation (Depreciation) on: | |||||||
Investments | 108,164 | ||||||
Foreign Currency Translations | (61 | ) | |||||
Net Assets | $ | 595,290 | |||||
The accompanying notes are an integral part of the financial statements.
7
Morgan Stanley Institutional Fund, Inc.
Annual Report — December 31, 2015
Global Franchise Portfolio
Statement of Assets and Liabilities (cont'd) | December 31, 2015 (000) | ||||||
CLASS I: | |||||||
Net Assets | $ | 505,321 | |||||
| Shares Outstanding $0.001 par value shares of beneficial interest (unlimited shares authorized) (not in 000's) | 24,853,981 | ||||||
Net Asset Value, Offering and Redemption Price Per Share | $ | 20.33 | |||||
CLASS A: | |||||||
Net Assets | $ | 75,297 | |||||
| Shares Outstanding $0.001 par value shares of beneficial interest (unlimited shares authorized) (not in 000's) | 3,773,014 | ||||||
Net Asset Value, Redemption Price Per Share | $ | 19.96 | |||||
Maximum Sales Load | 5.25 | % | |||||
Maximum Sales Charge | $ | 1.11 | |||||
Maximum Offering Price Per Share | $ | 21.07 | |||||
CLASS L: | |||||||
Net Assets | $ | 8,898 | |||||
| Shares Outstanding $0.001 par value shares of beneficial interest (unlimited shares authorized) (not in 000's) | 446,942 | ||||||
Net Asset Value, Offering and Redemption Price Per Share | $ | 19.91 | |||||
CLASS C: | |||||||
Net Assets | $ | 5,765 | |||||
| Shares Outstanding $0.001 par value shares of beneficial interest (unlimited shares authorized) (not in 000's) | 291,849 | ||||||
Net Asset Value, Offering and Redemption Price Per Share | $ | 19.75 | |||||
CLASS IS: | |||||||
Net Assets | $ | 9 | |||||
| Shares Outstanding $0.001 par value shares of beneficial interest (unlimited shares authorized) (not in 000's) | 465 | ||||||
Net Asset Value, Offering and Redemption Price Per Share | $ | 20.33 | |||||
@ Amount is less than $500.
The accompanying notes are an integral part of the financial statements.
8
Morgan Stanley Institutional Fund, Inc.
Annual Report — December 31, 2015
Global Franchise Portfolio
Statement of Operations | Year Ended December 31, 2015 (000) | ||||||
Investment Income: | |||||||
Dividends from Securities of Unaffiliated Issuers (Net of $509 of Foreign Taxes Withheld) | $ | 13,697 | |||||
Dividends from Security of Affiliated Issuer (Note G) | 1 | ||||||
Total Investment Income | 13,698 | ||||||
Expenses: | |||||||
Advisory Fees (Note B) | 4,470 | ||||||
Administration Fees (Note C) | 450 | ||||||
Sub Transfer Agency Fees — Class I | 220 | ||||||
Sub Transfer Agency Fees — Class A | 40 | ||||||
Sub Transfer Agency Fees — Class L | 2 | ||||||
Sub Transfer Agency Fees — Class C | — | @ | |||||
Shareholder Services Fees — Class A (Note D) | 174 | ||||||
Distribution and Shareholder Services Fees — Class L (Note D) | 70 | ||||||
Distribution and Shareholder Services Fees — Class C (Note D) | 6 | ||||||
Professional Fees | 115 | ||||||
Custodian Fees (Note F) | 91 | ||||||
Registration Fees | 58 | ||||||
Shareholder Reporting Fees | 38 | ||||||
Transfer Agency Fees — Class I (Note E) | 12 | ||||||
Transfer Agency Fees — Class A (Note E) | 3 | ||||||
Transfer Agency Fees — Class L (Note E) | 2 | ||||||
Transfer Agency Fees — Class C (Note E) | — | @ | |||||
Transfer Agency Fees — Class IS (Note E) | 1 | ||||||
Directors' Fees and Expenses | 14 | ||||||
Pricing Fees | 5 | ||||||
Other Expenses | 42 | ||||||
Total Expenses | 5,813 | ||||||
Reimbursement of Class Specific Expenses — Class I (Note B) | (35 | ) | |||||
Reimbursement of Class Specific Expenses — Class IS (Note B) | (1 | ) | |||||
Waiver of Advisory Fees (Note B) | (22 | ) | |||||
Rebate from Morgan Stanley Affiliate (Note G) | (1 | ) | |||||
Net Expenses | 5,754 | ||||||
Net Investment Income | 7,944 | ||||||
Realized Gain: | |||||||
Investments Sold | 24,297 | ||||||
Foreign Currency Transactions | 82 | ||||||
Net Realized Gain | 24,379 | ||||||
Change in Unrealized Appreciation (Depreciation): | |||||||
Investments | 3,723 | ||||||
Foreign Currency Translations | 9 | ||||||
Net Change in Unrealized Appreciation (Depreciation) | 3,732 | ||||||
Net Realized Gain and Change in Unrealized Appreciation (Depreciation) | 28,111 | ||||||
Net Increase in Net Assets Resulting from Operations | $ | 36,055 | |||||
@ Amount is less than $500.
The accompanying notes are an integral part of the financial statements.
9
Morgan Stanley Institutional Fund, Inc.
Annual Report — December 31, 2015
Global Franchise Portfolio
Statements of Changes in Net Assets | Year Ended December 31, 2015 (000) | Year Ended December 31, 2014 (000) | |||||||||
Increase (Decrease) in Net Assets: | |||||||||||
Operations: | |||||||||||
Net Investment Income | $ | 7,944 | $ | 11,259 | |||||||
Net Realized Gain | 24,379 | 29,627 | |||||||||
Net Change in Unrealized Appreciation (Depreciation) | 3,732 | (13,194 | ) | ||||||||
Net Increase in Net Assets Resulting from Operations | 36,055 | 27,692 | |||||||||
Distributions from and/or in Excess of: | |||||||||||
Class I: | |||||||||||
Net Investment Income | (7,968 | ) | (8,695 | ) | |||||||
Net Realized Gain | (20,632 | ) | (25,999 | ) | |||||||
Class A: | |||||||||||
Net Investment Income | (1,064 | ) | (1,011 | ) | |||||||
Net Realized Gain | (3,228 | ) | (3,789 | ) | |||||||
Class L: | |||||||||||
Net Investment Income | (84 | ) | (94 | ) | |||||||
Net Realized Gain | (397 | ) | (502 | ) | |||||||
Class C: | |||||||||||
Net Investment Income | (52 | ) | — | ||||||||
Net Realized Gain | (148 | ) | — | ||||||||
Class IS: | |||||||||||
Net Investment Income | (— | @) | — | ||||||||
Net Realized Gain | (— | @) | — | ||||||||
Total Distributions | (33,573 | ) | (40,090 | ) | |||||||
Capital Share Transactions:(1) | |||||||||||
Class I: | |||||||||||
Subscribed | 92,850 | 122,018 | |||||||||
Distributions Reinvested | 27,499 | 33,162 | |||||||||
Redeemed | (133,336 | ) | (199,802 | ) | |||||||
Class A: | |||||||||||
Subscribed | 18,018 | 6,952 | |||||||||
Distributions Reinvested | 4,251 | 4,753 | |||||||||
Redeemed | (10,970 | ) | (28,751 | ) | |||||||
Class L: | |||||||||||
Subscribed | 216 | 670 | |||||||||
Distributions Reinvested | 480 | 595 | |||||||||
Redeemed | (1,167 | ) | (865 | ) | |||||||
Class C: | |||||||||||
Subscribed | 7,443 | * | — | ||||||||
Distributions Reinvested | 199 | * | — | ||||||||
Redeemed | (1,527 | )* | — | ||||||||
Class IS: | |||||||||||
Subscribed | 10 | ** | — | ||||||||
Net Increase (Decrease) in Net Assets Resulting from Capital Share Transactions | 3,966 | (61,268 | ) | ||||||||
Total Increase (Decrease) in Net Assets | 6,448 | (73,666 | ) | ||||||||
Net Assets: | |||||||||||
Beginning of Period | 588,842 | 662,508 | |||||||||
End of Period (Including Accumulated Undistributed Net Investment Income of $207 and $1,316) | $ | 595,290 | $ | 588,842 | |||||||
The accompanying notes are an integral part of the financial statements.
10
Morgan Stanley Institutional Fund, Inc.
Annual Report — December 31, 2015
Global Franchise Portfolio
Statements of Changes in Net Assets (cont'd) | Year Ended December 31, 2015 (000) | Year Ended December 31, 2014 (000) | |||||||||
(1) Capital Share Transactions: | |||||||||||
Class I: | |||||||||||
Shares Subscribed | 4,439 | 5,784 | |||||||||
Shares Issued on Distributions Reinvested | 1,330 | 1,659 | |||||||||
Shares Redeemed | (6,324 | ) | (9,484 | ) | |||||||
Net Decrease in Class I Shares Outstanding | (555 | ) | (2,041 | ) | |||||||
Class A: | |||||||||||
Shares Subscribed | 858 | 334 | |||||||||
Shares Issued on Distributions Reinvested | 209 | 241 | |||||||||
Shares Redeemed | (532 | ) | (1,404 | ) | |||||||
Net Increase (Decrease) in Class A Shares Outstanding | 535 | (829 | ) | ||||||||
Class L: | |||||||||||
Shares Subscribed | 11 | 33 | |||||||||
Shares Issued on Distributions Reinvested | 24 | 30 | |||||||||
Shares Redeemed | (57 | ) | (41 | ) | |||||||
Net Increase (Decrease) in Class L Shares Outstanding | (22 | ) | 22 | ||||||||
Class C: | |||||||||||
Shares Subscribed | 353 | * | — | ||||||||
Shares Issued on Distributions Reinvested | 10 | * | — | ||||||||
Shares Redeemed | (71 | )* | — | ||||||||
Net Increase in Class C Shares Outstanding | 292 | — | |||||||||
Class IS: | |||||||||||
Shares Subscribed | — | @@** | — | ||||||||
@ Amount is less than $500.
@@ Amount is less than 500 shares.
* For the period September 30, 2015 through December 31, 2015.
** For the period May 29, 2015 through December 31, 2015.
The accompanying notes are an integral part of the financial statements.
11
Morgan Stanley Institutional Fund, Inc.
Annual Report — December 31, 2015
Financial Highlights
Global Franchise Portfolio
Class I | |||||||||||||||||||||||
Year Ended December 31, | |||||||||||||||||||||||
Selected Per Share Data and Ratios | 2015 | 2014 | 2013 | 2012 | 2011 | ||||||||||||||||||
Net Asset Value, Beginning of Period | $ | 20.27 | $ | 20.77 | $ | 18.13 | $ | 16.24 | $ | 15.29 | |||||||||||||
Income from Investment Operations: | |||||||||||||||||||||||
Net Investment Income† | 0.31 | 0.41 | 0.36 | 0.40 | 0.31 | ||||||||||||||||||
Net Realized and Unrealized Gain | 1.02 | 0.57 | 3.17 | 2.11 | 1.11 | ||||||||||||||||||
Total from Investment Operations | 1.33 | 0.98 | 3.53 | 2.51 | 1.42 | ||||||||||||||||||
Distributions from and/or in Excess of: | |||||||||||||||||||||||
Net Investment Income | (0.35 | ) | (0.37 | ) | (0.35 | ) | (0.32 | ) | (0.30 | ) | |||||||||||||
Net Realized Gain | (0.92 | ) | (1.11 | ) | (0.54 | ) | (0.30 | ) | (0.17 | ) | |||||||||||||
Total Distributions | (1.27 | ) | (1.48 | ) | (0.89 | ) | (0.62 | ) | (0.47 | ) | |||||||||||||
Net Asset Value, End of Period | $ | 20.33 | $ | 20.27 | $ | 20.77 | $ | 18.13 | $ | 16.24 | |||||||||||||
Total Return++ | 6.50 | % | 4.82 | % | 19.71 | % | 15.38 | % | 9.38 | % | |||||||||||||
Ratios and Supplemental Data: | |||||||||||||||||||||||
Net Assets, End of Period (Thousands) | $ | 505,321 | $ | 515,012 | $ | 570,261 | $ | 404,762 | $ | 211,677 | |||||||||||||
Ratio of Expenses to Average Net Assets (1) | 0.98 | %+ | 0.97 | %+ | 0.95 | %+ | 0.98 | %+ | 1.00 | %+ | |||||||||||||
Ratio of Net Investment Income to Average Net Assets (1) | 1.46 | %+ | 1.94 | %+ | 1.79 | %+ | 2.21 | %+ | 1.87 | %+ | |||||||||||||
Ratio of Rebate from Morgan Stanley Affiliates to Average Net Assets | 0.00 | %§ | 0.00 | %§ | 0.00 | %§ | 0.01 | % | 0.00 | %§ | |||||||||||||
Portfolio Turnover Rate | 37 | % | 33 | % | 24 | % | 34 | % | 30 | % | |||||||||||||
(1) Supplemental Information on the Ratios to Average Net Assets: | |||||||||||||||||||||||
Ratios Before Expense Limitation: | |||||||||||||||||||||||
Expenses to Average Net Assets | 0.99 | % | N/A | N/A | N/A | 1.01 | % | ||||||||||||||||
Net Investment Income to Average Net Assets | 1.45 | % | N/A | N/A | N/A | 1.86 | % | ||||||||||||||||
† Per share amount is based on average shares outstanding.
++ Calculated based on the net asset value as of the last business day of the period.
+ The Ratios of Expenses and Net Investment Income reflect the rebate of certain Portfolio expenses in connection with the investments in Morgan Stanley affiliates during the period. The effect of the rebate on the ratios is disclosed in the above table as "Ratio of Rebate from Morgan Stanley Affiliates to Average Net Assets."
§ Amount is less than 0.005%.
The accompanying notes are an integral part of the financial statements.
12
Morgan Stanley Institutional Fund, Inc.
Annual Report — December 31, 2015
Financial Highlights
Global Franchise Portfolio
Class A | |||||||||||||||||||||||
Year Ended December 31, | |||||||||||||||||||||||
Selected Per Share Data and Ratios | 2015 | 2014 | 2013 | 2012 | 2011 | ||||||||||||||||||
Net Asset Value, Beginning of Period | $ | 19.92 | $ | 20.44 | $ | 17.86 | $ | 16.01 | $ | 15.10 | |||||||||||||
Income from Investment Operations: | |||||||||||||||||||||||
Net Investment Income† | 0.24 | 0.34 | 0.28 | 0.35 | 0.26 | ||||||||||||||||||
Net Realized and Unrealized Gain | 1.02 | 0.55 | 3.14 | 2.09 | 1.09 | ||||||||||||||||||
Total from Investment Operations | 1.26 | 0.89 | 3.42 | 2.44 | 1.35 | ||||||||||||||||||
Distributions from and/or in Excess of: | |||||||||||||||||||||||
Net Investment Income | (0.30 | ) | (0.30 | ) | (0.30 | ) | (0.29 | ) | (0.27 | ) | |||||||||||||
Net Realized Gain | (0.92 | ) | (1.11 | ) | (0.54 | ) | (0.30 | ) | (0.17 | ) | |||||||||||||
Total Distributions | (1.22 | ) | (1.41 | ) | (0.84 | ) | (0.59 | ) | (0.44 | ) | |||||||||||||
Net Asset Value, End of Period | $ | 19.96 | $ | 19.92 | $ | 20.44 | $ | 17.86 | $ | 16.01 | |||||||||||||
Total Return++ | 6.25 | % | 4.45 | % | 19.42 | % | 15.14 | % | 8.98 | % | |||||||||||||
Ratios and Supplemental Data: | |||||||||||||||||||||||
Net Assets, End of Period (Thousands) | $ | 75,297 | $ | 64,515 | $ | 83,135 | $ | 35,901 | $ | 15,327 | |||||||||||||
Ratio of Expenses to Average Net Assets (1) | 1.25 | %+ | 1.27 | %+ | 1.20 | %+^ | 1.23 | %+ | 1.25 | %+ | |||||||||||||
Ratio of Net Investment Income to Average Net Assets (1) | 1.15 | %+ | 1.64 | %+ | 1.42 | % | 1.99 | %+ | 1.62 | %+ | |||||||||||||
Ratio of Rebate from Morgan Stanley Affiliates to Average Net Assets | 0.00 | %§ | 0.00 | %§ | 0.00 | %§ | 0.01 | % | 0.00 | %§ | |||||||||||||
Portfolio Turnover Rate | 37 | % | 33 | % | 24 | % | 34 | % | 30 | % | |||||||||||||
(1) Supplemental Information on the Ratios to Average Net Assets: | |||||||||||||||||||||||
Ratios Before Expense Limitation: | |||||||||||||||||||||||
Expenses to Average Net Assets | 1.25 | % | N/A | N/A | N/A | 1.26 | % | ||||||||||||||||
Net Investment Income to Average Net Assets | 1.15 | % | N/A | N/A | N/A | 1.61 | % | ||||||||||||||||
† Per share amount is based on average shares outstanding.
++ Calculated based on the net asset value which does not reflect sales charges, if applicable, as of the last business day of the period.
+ The Ratios of Expenses and Net Investment Income reflect the rebate of certain Portfolio expenses in connection with the investments in Morgan Stanley affiliates during the period. The effect of the rebate on the ratios is disclosed in the above table as "Ratio of Rebate from Morgan Stanley Affiliates to Average Net Assets."
^ Effective September 16, 2013, the Adviser has agreed to limit the ratio of expenses to average net assets to the maximum ratio of 1.35% for Class A shares. Prior to September 16, 2013, the maximum ratio was 1.25% for Class A shares.
§ Amount is less than 0.005%.
The accompanying notes are an integral part of the financial statements.
13
Morgan Stanley Institutional Fund, Inc.
Annual Report — December 31, 2015
Financial Highlights
Global Franchise Portfolio
Class L | |||||||||||||||||||
Year Ended December 31, | Period from April 27, 2012^ to | ||||||||||||||||||
Selected Per Share Data and Ratios | 2015 | 2014 | 2013 | December 31, 2012 | |||||||||||||||
Net Asset Value, Beginning of Period | $ | 19.87 | $ | 20.39 | $ | 17.83 | $ | 18.13 | |||||||||||
Income from Investment Operations: | |||||||||||||||||||
Net Investment Income† | 0.15 | 0.25 | 0.20 | 0.10 | |||||||||||||||
Net Realized and Unrealized Gain | 1.00 | 0.55 | 3.11 | 0.16 | |||||||||||||||
Total from Investment Operations | 1.15 | 0.80 | 3.31 | 0.26 | |||||||||||||||
Distributions from and/or in Excess of: | |||||||||||||||||||
Net Investment Income | (0.19 | ) | (0.21 | ) | (0.21 | ) | (0.26 | ) | |||||||||||
Net Realized Gain | (0.92 | ) | (1.11 | ) | (0.54 | ) | (0.30 | ) | |||||||||||
Total Distributions | (1.11 | ) | (1.32 | ) | (0.75 | ) | (0.56 | ) | |||||||||||
Net Asset Value, End of Period | $ | 19.91 | $ | 19.87 | $ | 20.39 | $ | 17.83 | |||||||||||
Total Return++ | 5.72 | % | 4.00 | % | 18.78 | % | 1.36 | %# | |||||||||||
Ratios and Supplemental Data: | |||||||||||||||||||
Net Assets, End of Period (Thousands) | $ | 8,898 | $ | 9,315 | $ | 9,112 | $ | 4,525 | |||||||||||
Ratio of Expenses to Average Net Assets (1) | 1.72 | %+ | 1.72 | %+ | 1.70 | %+^^ | 1.73 | %+* | |||||||||||
Ratio of Net Investment Income to Average Net Assets (1) | 0.72 | %+ | 1.19 | %+ | 1.03 | %+ | 0.84 | %+* | |||||||||||
Ratio of Rebate from Morgan Stanley Affiliates to Average Net Assets | 0.00 | %§ | 0.00 | %§ | 0.00 | %§ | 0.01 | %* | |||||||||||
Portfolio Turnover Rate | 37 | % | 33 | % | 24 | % | 34 | %# | |||||||||||
(1) Supplemental Information on the Ratios to Average Net Assets: | |||||||||||||||||||
Ratios Before Expense Limitation: | |||||||||||||||||||
Expenses to Average Net Assets | 1.73 | % | N/A | N/A | N/A | ||||||||||||||
Net Investment Income to Average Net Assets | 0.71 | % | N/A | N/A | N/A | ||||||||||||||
^ Commencement of Offering.
† Per share amount is based on average shares outstanding.
++ Calculated based on the net asset value as of the last business day of the period.
+ The Ratios of Expenses and Net Investment Income reflect the rebate of certain Portfolio expenses in connection with the investments in Morgan Stanley affiliates during the period. The effect of the rebate on the ratios is disclosed in the above table as "Ratio of Rebate from Morgan Stanley Affiliates to Average Net Assets."
^^ Effective September 16, 2013, the Adviser has agreed to limit the ratio of expenses to average net assets to the maximum ratio of 1.85% for Class L shares. Prior to September 16, 2013, the maximum ratio was 1.75% for Class L shares.
§ Amount is less than 0.005%.
# Not Annualized.
* Annualized.
The accompanying notes are an integral part of the financial statements.
14
Morgan Stanley Institutional Fund, Inc.
Annual Report — December 31, 2015
Financial Highlights
Global Franchise Portfolio
Class C | |||||||
Selected Per Share Data and Ratios | Period from September 30, 2015^ to December 31, 2015 | ||||||
Net Asset Value, Beginning of Period | $ | 19.79 | |||||
Income from Investment Operations: | |||||||
Net Investment Income† | 0.01 | ||||||
Net Realized and Unrealized Gain | 1.02 | ||||||
Total from Investment Operations | 1.03 | ||||||
Distributions from and/or in Excess of: | |||||||
Net Investment Income | (0.28 | ) | |||||
Net Realized Gain | (0.79 | ) | |||||
Total Distributions | (1.07 | ) | |||||
Net Asset Value, End of Period | $ | 19.75 | |||||
Total Return++ | 5.11 | %# | |||||
Ratios and Supplemental Data: | |||||||
Net Assets, End of Period (Thousands) | $ | 5,765 | |||||
Ratios of Expenses to Average Net Assets (1) | 2.03 | %+* | |||||
Ratio of Net Investment Income to Average Net Assets (1) | 0.11 | %+* | |||||
Ratio of Rebate from Morgan Stanley Affiliates to Average Net Assets | 0.00 | %§* | |||||
Portfolio Turnover Rate | 37 | % | |||||
^ Commencement of Offering.
† Per share amount is based on average shares outstanding.
++ Calculated based on the net asset value which does not reflect sales charges, if applicable, as of the last business day of the period.
+ The Ratios of Expenses and Net Investment Income reflect the rebate of certain Portfolio expenses in connection with the investments in Morgan Stanley affiliates during the period. The effect of the rebate on the ratios is disclosed in the above table as "Ratio of Rebate from Morgan Stanley Affiliates to Average Net Assets."
§ Amount is less than 0.005%.
# Not Annualized.
* Annualized.
The accompanying notes are an integral part of the financial statements.
15
Morgan Stanley Institutional Fund, Inc.
Annual Report — December 31, 2015
Financial Highlights
Global Franchise Portfolio
Class IS | |||||||
Selected Per Share Data and Ratios | Period from May 29, 2015^ to December 31, 2015 | ||||||
Net Asset Value, Beginning of Period | $ | 21.49 | |||||
Income from Investment Operations: | |||||||
Net Investment Income† | 0.12 | ||||||
Net Realized and Unrealized Gain | 0.00 | ‡ | |||||
Total from Investment Operations | 0.12 | ||||||
Distributions from and/or in Excess of: | |||||||
Net Investment Income | (0.36 | ) | |||||
Net Realized Gain | (0.92 | ) | |||||
Total Distributions | (1.28 | ) | |||||
Net Asset Value, End of Period | $ | 20.33 | |||||
Total Return++ | 0.45 | %# | |||||
Ratios and Supplemental Data: | |||||||
Net Assets, End of Period (Thousands) | $ | 9 | |||||
Ratio of Expenses to Average Net Assets (1) | 0.94 | %+* | |||||
Ratio of Net Investment Income to Average Net Assets (1) | 0.95 | %+* | |||||
Ratio of Rebate from Morgan Stanley Affiliates to Average Net Assets | 0.00 | %§* | |||||
Portfolio Turnover Rate | 37 | % | |||||
(1) Supplemental Information on the Ratios to Average Net Assets: | |||||||
Ratios Before Expense Limitation | |||||||
Expenses to Average Net Assets | 16.54 | %* | |||||
Net Investment Loss to Average Net Assets | (14.65 | )%* | |||||
^ Commencement of Offering.
† Per share amount is based on average shares outstanding.
‡ Amount is less than $0.005.
++ Calculated based on the net asset value as of the last business day of the period.
+ The Ratios of Expenses and Net Investment Income reflect the rebate of certain Portfolio expenses in connection with the investments in Morgan Stanley affiliates during the period. The effect of the rebate on the ratios is disclosed in the above table as "Ratio of Rebate from Morgan Stanley Affiliates to Average Net Assets."
§ Amount is less than 0.005%.
# Not Annualized.
* Annualized.
The accompanying notes are an integral part of the financial statements.
16
Morgan Stanley Institutional Fund, Inc.
Annual Report — December 31, 2015
Notes to Financial Statements
Morgan Stanley Institutional Fund, Inc. (the "Fund") is registered under the Investment Company Act of 1940, as amended (the "Act"), as an open-end management investment company. The Fund is comprised of twenty-six separate, active, diversified and non-diversified portfolios (individually referred to as a "Portfolio", collectively as the "Portfolios"). The Fund applies investment company accounting and reporting guidance.
The accompanying financial statements relate to the Global Franchise Portfolio. The Portfolio's adviser, Morgan Stanley Investment Management Inc. (the "Adviser") and sub-advisers, Morgan Stanley Investment Management Limited ("MSIM Limited") and Morgan Stanley Investment Management Company ("MSIM Company") (together, the "Sub-Advisers"), seek long-term capital appreciation by investing primarily in equity securities of issuers located throughout the world that they believe have, among other things, resilient business franchises and growth potential.
The Portfolio offers five classes of shares — Class I, Class A, Class L, Class C and Class IS. The Portfolio's Class A shares were closed to new investors with certain exceptions. The Portfolio suspended offering of Class L shares. Existing Class L shareholders may invest through reinvestment of dividends and distributions. On May 29, 2015, the Portfolio commenced offering Class IS shares. On September 30, 2015, the Portfolio commenced offering Class C shares and recommenced offering Class A shares.
A. Significant Accounting Policies: The following significant accounting policies are in conformity with U.S. generally accepted accounting principles ("GAAP"). Such policies are consistently followed by the Fund in the preparation of its financial statements. GAAP may require management to make estimates and assumptions that affect the reported amounts and disclosures in the financial statements. Actual results may differ from those estimates.
1. Security Valuation: (1) An equity portfolio security listed or traded on an exchange is valued at its latest reported sales price (or at the exchange official closing price if such exchange reports an official closing price), if there were no sales on a given day, the security is valued at the mean between the last reported bid and asked prices; (2) all other equity portfolio securities for which over-the-counter ("OTC") market quotations are readily available are valued at its latest reported sales price. In cases where a security is traded on more than one exchange, the security is valued on the exchange designated as the primary market; (3) when market quotations are not readily available, including circumstances under which the Adviser or
Sub-Advisers determine that the closing price, last sale price or the mean between the last reported bid and asked prices are not reflective of a security's market value, portfolio securities are valued at their fair value as determined in good faith under procedures established by and under the general supervision of the Fund's Board of Directors (the "Directors"). Occasionally, developments affecting the closing prices of securities and other assets may occur between the times at which valuations of such securities are determined (that is, close of the foreign market on which the securities trade) and the close of business of the New York Stock Exchange ("NYSE"). If developments occur during such periods that are expected to materially affect the value of such securities, such valuations may be adjusted to reflect the estimated fair value of such securities as of the close of the NYSE, as determined in good faith by the Directors or by the Adviser using a pricing service and/or procedures approved by the Directors; (4) quotations of foreign portfolio securities, other assets and liabilities and forward contracts stated in foreign currency are translated into U.S. dollar equivalents at the prevailing market rates prior to the close of the NYSE; (5) investments in mutual funds, including the Morgan Stanley Institutional Liquidity Funds, are valued at the net asset value ("NAV") as of the close of each business day; and (6) short-term debt securities with remaining maturities of 60 days or less at the time of purchase may be valued at amortized cost, unless the Adviser determines such valuation does not reflect the securities' market value, in which case these securities will be valued at their fair market value determined by the Adviser.
The Directors have responsibility for determining in good faith the fair value of the investments, and the Directors may appoint others, such as the Fund's Adviser or a valuation committee, to assist the Directors in determining fair value and to make the actual calculations pursuant to the fair valuation methodologies previously approved by the Directors. Under procedures approved by the Directors, the Fund's Adviser has formed a Valuation Committee whose members are approved by the Directors. The Valuation Committee provides administration and oversight of the Fund's valuation policies and procedures, which are reviewed at least annually by the Directors. These procedures allow the Fund to utilize independent pricing services, quotations from securities and financial instrument dealers, and other market sources to determine fair value.
17
Morgan Stanley Institutional Fund, Inc.
Annual Report — December 31, 2015
Notes to Financial Statements (cont'd)
The Fund has procedures to determine the fair value of securities and other financial instruments for which market prices are not readily available. Under these procedures, the Valuation Committee convenes on a regular and ad hoc basis to review such securities and considers a number of factors, including valuation methodologies and significant unobservable valuation inputs, when arriving at fair value. The Valuation Committee may employ a market-based approach which may use related or comparable assets or liabilities, recent transactions, market multiples, book values, and other relevant information for the investment to determine the fair value of the investment. An income-based valuation approach may also be used in which the anticipated future cash flows of the investment are discounted to calculate fair value. Discounts may also be applied due to the nature or duration of any restrictions on the disposition of the investments. Due to the inherent uncertainty of valuations of such investments, the fair values may differ significantly from the values that would have been used had an active market existed. The Valuation Committee employs various methods for calibrating these valuation approaches including a regular review of valuation methodologies, key inputs and assumptions, transactional back-testing or disposition analysis, and reviews of any related market activity.
2. Fair Value Measurement: Financial Accounting Standards Board ("FASB") Accounting Standards CodificationTM ("ASC") 820, "Fair Value Measurement" ("ASC 820"), defines fair value as the value that the Fund would receive to sell an investment or pay to transfer a liability in a timely transaction with an independent buyer in the principal market, or in the absence of a principal market the most advantageous market for the investment or liability. ASC 820 establishes a three-tier hierarchy to distinguish between (1) inputs that reflect the assumptions market participants would use in valuing an asset or liability developed based on market data obtained from sources independent of the reporting entity (observable inputs) and (2) inputs that reflect the reporting entity's own assumptions about the assumptions market participants would use in valuing an asset or liability developed based on the best information available in the circumstances (unobservable inputs) and to establish classification of fair value measurements for disclosure purposes. Various inputs are used in determining the value of the Fund's investments. The inputs are summarized in the three broad levels listed below.
• Level 1 – unadjusted quoted prices in active markets for identical investments
• Level 2 – other significant observable inputs (including quoted prices for similar investments, interest rates, prepayment speeds, credit risk, etc.)
• Level 3 – significant unobservable inputs including the Fund's own assumptions in determining the fair value of investments. Factors considered in making this determination may include, but are not limited to, information obtained by contacting the issuer, analysts, or the appropriate stock exchange (for exchange-traded securities), analysis of the issuer's financial statements or other available documents and, if necessary, available information concerning other securities in similar circumstances
The inputs or methodology used for valuing securities are not necessarily an indication of the risk associated with investing in those securities and the determination of the significance of a particular input to the fair value measurement in its entirety requires judgment and considers factors specific to each security.
The following is a summary of the inputs used to value the Portfolio's investments as of December 31, 2015.
Investment Type | Level 1 Unadjusted quoted prices (000) | Level 2 Other significant observable inputs (000) | Level 3 Significant unobservable inputs (000) | Total (000) | |||||||||||||||
Assets: | |||||||||||||||||||
Common Stocks | |||||||||||||||||||
Beverages | $ | — | $ | 20,243 | $ | — | $ | 20,243 | |||||||||||
| Diversified Financial Services | 5,803 | — | — | 5,803 | |||||||||||||||
Food Products | 27,317 | 46,767 | — | 74,084 | |||||||||||||||
Household Products | — | 41,963 | — | 41,963 | |||||||||||||||
Industrial Conglomerates | 5,964 | — | — | 5,964 | |||||||||||||||
| Information Technology Services | 62,803 | — | — | 62,803 | |||||||||||||||
Media | 64,174 | 12,558 | — | 76,732 | |||||||||||||||
Personal Products | — | 50,278 | — | 50,278 | |||||||||||||||
Pharmaceuticals | — | 11,733 | — | 11,733 | |||||||||||||||
Professional Services | — | 11,318 | — | 11,318 | |||||||||||||||
Software | 57,688 | 12,985 | — | 70,673 | |||||||||||||||
| Textiles, Apparel & Luxury Goods | 9,570 | — | — | 9,570 | |||||||||||||||
Tobacco | 71,212 | 57,720 | — | 128,932 | |||||||||||||||
Total Common Stocks | 304,531 | 265,565 | — | 570,096 | |||||||||||||||
Short-Term Investment | |||||||||||||||||||
Investment Company | 20,401 | — | — | 20,401 | |||||||||||||||
Total Assets | $ | 324,932 | $ | 265,565 | $ | — | $ | 590,497 | |||||||||||
18
Morgan Stanley Institutional Fund, Inc.
Annual Report — December 31, 2015
Notes to Financial Statements (cont'd)
Transfers between investment levels may occur as the markets fluctuate and/or the availability of data used in an investment's valuation changes. The Portfolio recognizes transfers between the levels as of the end of the period. As of December 31, 2015, the Portfolio did not have any investments transfer between investment levels. At December 31, 2015, the fair value of certain securities were adjusted due to developments which occurred between the time of the close of the foreign markets on which they trade and the close of business on the NYSE which resulted in their Level 2 classification.
3. Foreign Currency Translation and Foreign Investments: The books and records of the Portfolio are maintained in U.S. dollars. Foreign currency amounts are translated into U.S. dollars as follows:
– investments, other assets and liabilities at the prevailing rate of exchange on the valuation date;
– investment transactions and investment income at the prevailing rates of exchange on the dates of such transactions.
Although the net assets of the Portfolio are presented at the foreign exchange rates and market values at the close of the period, the Portfolio does not isolate that portion of the results of operations arising as a result of changes in the foreign exchange rates from the fluctuations arising from changes in the market prices of securities held at period end. Similarly, the Portfolio does not isolate the effect of changes in foreign exchange rates from the fluctuations arising from changes in the market prices of securities sold during the period. Accordingly, realized and unrealized foreign currency gains (losses) on investments in securities are included in the reported net realized and unrealized gains (losses) on investment transactions and balances. However, pursuant to U.S. Federal income tax regulations, gains and losses from certain foreign currency transactions and the foreign currency portion of gains and losses realized on sales and maturities of foreign denominated debt securities are treated as ordinary income for U.S. Federal income tax purposes.
Net realized gains (losses) on foreign currency transactions represent net foreign exchange gains (losses) from foreign currency forward exchange contracts, disposition of foreign currencies, currency gains (losses) realized between the trade and settlement dates on securities
transactions, and the difference between the amount of investment income and foreign withholding taxes recorded on the Portfolio's books and the U.S. dollar equivalent amounts actually received or paid. Net unrealized currency gains (losses) from valuing foreign currency denominated assets and liabilities at period end exchange rates are reflected as a component of unrealized appreciation (depreciation) in the Statement of Assets and Liabilities. The change in unrealized currency gains (losses) on foreign currency translations for the period is reflected in the Statement of Operations.
Foreign security and currency transactions may involve certain considerations and risks not typically associated with those of U.S. dollar denominated transactions as a result of, among other factors, fluctuations of exchange rates in relation to the U.S. dollar, the possibility of lower levels of governmental supervision and regulation of foreign securities markets and the possibility of political or economic instability.
Governmental approval for foreign investments may be required in advance of making an investment under certain circumstances in some countries, and the extent of foreign investments in domestic companies may be subject to limitation in other countries. Foreign ownership limitations also may be imposed by the charters of individual companies to prevent, among other concerns, violations of foreign investment limitations. As a result, an additional class of shares (identified as "Foreign" in the Portfolio of Investments) may be created and offered for investment. The "local" and "foreign shares" market values may differ. In the absence of trading of the foreign shares in such markets, the Portfolio values the foreign shares at the closing exchange price of the local shares.
4. Indemnifications: The Fund enters into contracts that contain a variety of indemnifications. The Fund's maximum exposure under these arrangements is unknown. However, the Fund has not had prior claims or losses pursuant to these contracts and expects the risk of loss to be remote.
5. Dividends and Distributions to Shareholders: Dividend income and distributions to shareholders are recorded on the ex-dividend date. Dividends from net investment income, if any, are declared and paid annually. Net realized capital gains, if any, are distributed at least annually.
19
Morgan Stanley Institutional Fund, Inc.
Annual Report — December 31, 2015
Notes to Financial Statements (cont'd)
6. Security Transactions, Income and Expenses: Security transactions are accounted for on the trade date (date the order to buy or sell is executed). Realized gains and losses on the sale of investment securities are determined on the specific identified cost method. Dividend income and other distributions are recorded on the ex-dividend date (except for certain foreign dividends which may be recorded as soon as the Portfolio is informed of such dividends) net of applicable withholding taxes. Interest income is recognized on the accrual basis except where collection is in doubt. Discounts are accreted and premiums are amortized over the life of the respective securities. Most expenses of the Fund can be directly attributed to a particular Portfolio. Expenses which cannot be directly attributed are apportioned among the Portfolios based upon relative net assets or other appropriate methods. Income, expenses (other than class specific expenses — distribution and shareholder services, transfer agency and sub transfer agency fees) and realized and unrealized gains or losses are allocated to each class of shares based upon their relative net assets.
B. Advisory/Sub-Advisory Fees: The Adviser, a wholly-owned subsidiary of Morgan Stanley, provides the Portfolio with advisory services under the terms of an Investment Advisory Agreement, paid quarterly, at the annual rate based on the daily net assets as follows:
| First $500 million | Next $500 million | Over $1 billion | |||||||||
| 0.80 | % | 0.75 | % | 0.70 | % | ||||||
For the year ended December 31, 2015, the advisory fee rate (net of waivers/rebate) was equivalent to an annual effective rate of 0.79% of the Portfolio's average daily net assets.
The Adviser has agreed to reduce its advisory fee and/or reimburse the Portfolio so that total annual portfolio operating expenses, excluding certain investment related expenses, taxes, interest and other extraordinary expenses (including litigation), will not exceed 1.00% for Class I shares, 1.35% for Class A shares, 1.85% for Class L shares, 2.10% for Class C shares and 0.95% for Class IS shares. The fee waivers and/or expense reimbursements will continue for at least one year from the date of the Portfolio's prospectus or until such time as the Directors act to discontinue all or a portion of such waivers and/or reimbursements when they deem such action is appropriate. For the year ended December 31, 2015, approximately $22,000 of advisory fees were waived and approximately $36,000 of other expenses were reimbursed by the Adviser pursuant to this arrangement.
The Adviser has entered into a Sub-Advisory Agreement with the Sub-Advisers, each a wholly-owned subsidiary of Morgan Stanley. The Sub-Advisers provide the Portfolio with advisory services subject to the overall supervision of the Adviser and the Fund's Officers and Directors. The Adviser pays the Sub-Advisers on a monthly basis a portion of the net advisory fees the Adviser receives from the Portfolio.
C. Administration Fees: The Adviser also serves as Administrator to the Fund and provides administrative services pursuant to an Administration Agreement for an annual fee, accrued daily and paid monthly, of 0.08% of the Portfolio's average daily net assets.
Under a Sub-Administration Agreement between the Administrator and State Street Bank and Trust Company ("State Street"), State Street provides certain administrative services to the Fund. For such services, the Administrator pays State Street a portion of the fee the Administrator receives from the Portfolio.
D. Distribution and Shareholder Services Fees: Morgan Stanley Distribution, Inc. ("MSDI" or the "Distributor"), a wholly-owned subsidiary of the Adviser and Sub-Advisers and an indirect subsidiary of Morgan Stanley, serves as the Fund's Distributor of Portfolio shares pursuant to a Distribution Agreement. The Fund has adopted a Shareholder Services Plan with respect to Class A shares pursuant to Rule 12b-1 under the Act. Under the Shareholder Services Plan, the Portfolio pays the Distributor a shareholder services fee, accrued daily and paid monthly, at an annual rate of 0.25% of the Portfolio's average daily net assets attributable to Class A shares.
The Fund has adopted a Distribution and Shareholder Services Plan with respect to Class L shares pursuant to Rule 12b-1 under the Act. Under the Distribution and Shareholder Services Plan, the Portfolio pays the Distributor a distribution fee, accrued daily and paid monthly, at an annual rate of 0.50% and a shareholder services fee, accrued daily and paid monthly, at an annual rate of 0.25% of the Portfolio's average daily net assets attributable to Class L shares.
The Fund has adopted a Distribution and Shareholder Services Plan with respect to Class C shares pursuant to Rule 12b-1 under the Act. Under the Distribution and Shareholder Services Plan, the Portfolio pays the Distributor a distribution fee, accrued daily and paid monthly, at an annual rate of 0.75% and a shareholder services fee, accrued daily and paid monthly, at an annual rate of 0.25% of the Portfolio's average daily net assets attributable to Class C shares.
20
Morgan Stanley Institutional Fund, Inc.
Annual Report — December 31, 2015
Notes to Financial Statements (cont'd)
The distribution and shareholder services fees are used to support the expenses associated with servicing and maintaining accounts. The Distributor may compensate other parties for providing shareholder support services to investors who purchase Class A, Class L and Class C shares.
E. Dividend Disbursing and Transfer Agent: The Fund's dividend disbursing and transfer agent is Boston Financial Data Services, Inc. ("BFDS"). Pursuant to a Transfer Agency Agreement, the Fund pays BFDS a fee based on the number of classes, accounts and transactions relating to the Portfolios of the Fund.
F. Custodian Fees: State Street (the "Custodian") serves as Custodian for the Fund in accordance with a Custodian Agreement. The Custodian holds cash, securities, and other assets of the Fund as required by the Act. Custody fees are payable monthly based on assets held in custody, investment purchases and sales activity and account maintenance fees, plus reimbursement for certain out-of-pocket expenses.
G. Security Transactions and Transactions with Affiliates: For the year ended December 31, 2015, purchases and sales of investment securities for the Portfolio, other than long-term U.S. Government securities and short-term investments, were approximately $204,594,000 and $237,746,000, respectively. There were no purchases and sales of long-term U.S. Government securities for the year ended December 31, 2015.
The Portfolio invests in the Institutional Class of the Morgan Stanley Institutional Liquidity Funds — Treasury Securities Portfolio (the "Liquidity Funds"), an open-end management investment company managed by the Adviser. Advisory fees paid by the Portfolio are reduced by an amount equal to its pro-rata share of the advisory and administration fees paid by the Portfolio due to its investment in the Liquidity Funds. For the year ended December 31, 2015, advisory fees paid were reduced by approximately $1,000 relating to the Portfolio's investment in the Liquidity Funds.
A summary of the Portfolio's transactions in shares of the Liquidity Funds during the year ended December 31, 2015 is as follows:
| Value December 31, 2014 (000) | Purchases at Cost (000) | Sales (000) | Dividend Income (000) | Value December 31, 2015 (000) | |||||||||||||||
| $ | 11,760 | $ | 164,964 | $ | 156,323 | $ | 1 | $ | 20,401 | ||||||||||
The Portfolio has an unfunded Deferred Compensation Plan (the "Compensation Plan"), which allows each independent
Director to defer payment of all, or a portion, of the fees he or she receives for serving on the Board of Directors. Each eligible Director generally may elect to have the deferred amounts credited with a return equal to the total return on one or more of the Morgan Stanley funds that are offered as investment options under the Compensation Plan. Appreciation/depreciation and distributions received from these investments are recorded with an offsetting increase/decrease in the deferred compensation obligation and do not affect the NAV of the Portfolio.
H. Federal Income Taxes: It is the Portfolio's intention to continue to qualify as a regulated investment company and distribute all of its taxable and tax-exempt income. Accordingly, no provision for Federal income taxes is required in the financial statements.
The Portfolio may be subject to taxes imposed by countries in which it invests. Such taxes are generally based on income and/or capital gains earned or repatriated. Taxes are accrued based on net investment income, net realized gains and net unrealized appreciation as such income and/or gains are earned. Taxes may also be based on transactions in foreign currency and are accrued based on the value of investments denominated in such currency.
FASB ASC 740-10, "Income Taxes — Overall", sets forth a minimum threshold for financial statement recognition of the benefit of a tax position taken or expected to be taken in a tax return. Management has concluded there are no significant uncertain tax positions that would require recognition in the financial statements. If applicable, the Portfolio recognizes interest accrued related to unrecognized tax benefits in "Interest Expense" and penalties in "Other Expenses" in the Statement of Operations. The Portfolio files tax returns with the U.S. Internal Revenue Service, New York and various states. Generally, each of the tax years in the four-year period ended December 31, 2015, remains subject to examination by taxing authorities.
The tax character of distributions paid may differ from the character of distributions shown in the Statements of Changes in Net Assets due to short-term capital gains being treated as ordinary income for tax purposes. The tax character of distributions paid during fiscal 2015 and 2014 was as follows:
| 2015 Distributions Paid From: | 2014 Distributions Paid From: | ||||||||||||||
| Ordinary Income (000) | Long-Term Capital Gain (000) | Ordinary Income (000) | Long-Term Capital Gain (000) | ||||||||||||
| $ | 9,168 | $ | 24,405 | $ | 9,800 | $ | 30,290 | ||||||||
21
Morgan Stanley Institutional Fund, Inc.
Annual Report — December 31, 2015
Notes to Financial Statements (cont'd)
The amount and character of income and gains to be distributed are determined in accordance with income tax regulations which may differ from GAAP. These book/tax differences are either considered temporary or permanent in nature.
Temporary differences are primarily due to differing book and tax treatments in the timing of the recognition of gains (losses) on certain investment transactions and the timing of the deductibility of certain expenses.
Permanent differences, primarily due to differing treatments of gains (losses) related to foreign currency transactions and a nondeductible expense, resulted in the following reclassifications among the components of net assets at December 31, 2015:
| Accumulated Undistributed Net Investment Income (000) | Accumulated Net Realized Gain (000) | Paid-in- Capital (000) | |||||||||
| $ | 115 | $ | (81 | ) | $ | (34 | ) | ||||
At December 31, 2015, the components of distributable earnings for the Portfolio on a tax basis were as follows:
| Undistributed Ordinary Income (000) | Undistributed Long-Term Capital Gain (000) | ||||||
| $ | 213 | $ | 3,019 | ||||
I. Other: At December 31, 2015, the Portfolio had record owners of 10% or greater. Investment activities of these shareholders could have a material impact on the Portfolio. The aggregate percentage of such owners was 35.5%.
22
Morgan Stanley Institutional Fund, Inc.
Annual Report — December 31, 2015
Report of Independent Registered Public Accounting Firm
To the Shareholders and Board of Directors of
Morgan Stanley Institutional Fund, Inc. —
Global Franchise Portfolio
We have audited the accompanying statement of assets and liabilities, including the portfolio of investments, of Global Franchise Portfolio (one of the portfolios constituting Morgan Stanley Institutional Fund, Inc.) (the "Portfolio") as of December 31, 2015, and the related statement of operations for the year then ended, the statements of changes in net assets for each of the two years in the period then ended and the financial highlights for each of the years or periods indicated therein. These financial statements and financial highlights are the responsibility of the Portfolio's management. Our responsibility is to express an opinion on these financial statements and financial highlights based on our audits.
We conducted our audits in accordance with the standards of the Public Company Accounting Oversight Board (United States). Those standards require that we plan and perform the audit to obtain reasonable assurance about whether the financial statements and financial highlights are free of material misstatement. We were not engaged to perform an audit of the Portfolio's internal control over financial reporting. Our audits included consideration of internal control over financial reporting as a basis for designing audit procedures that are appropriate in the circumstances, but not for the purpose of expressing an opinion on the effectiveness of the Portfolio's internal control over financial reporting. Accordingly, we express no such opinion. An audit also includes examining, on a test basis, evidence supporting the amounts and disclosures in the financial statements and financial highlights, assessing the accounting principles used and significant estimates made by management, and evaluating the overall financial statement presentation. Our procedures included confirmation of securities owned as of December 31, 2015, by correspondence with the custodian and others. We believe that our audits provide a reasonable basis for our opinion.
In our opinion, the financial statements and financial highlights referred to above present fairly, in all material respects, the financial position of Global Franchise Portfolio (one of the portfolios constituting Morgan Stanley Institutional Fund, Inc.) at December 31, 2015, the results of its operations for the year then ended, the changes in its net assets for each of the two years in the period then ended and the financial highlights for each of the years or periods indicated therein, in conformity with U.S. generally accepted accounting principles.

Boston, Massachusetts
February 26, 2016
23
Morgan Stanley Institutional Fund, Inc.
Annual Report — December 31, 2015
Federal Tax Notice (unaudited)
For Federal income tax purposes, the following information is furnished with respect to the distributions paid by the Portfolio during its taxable year ended December 31, 2015. For corporate shareholders, 55.7% of the dividends qualified for the dividends received deduction.
The Portfolio designated and paid approximately $24,405,000 as a long-term capital gain distribution.
For Federal income tax purposes, the following information is furnished with respect to the Portfolio's earnings for its taxable year ended December 31, 2015. When distributed, certain earnings may be subject to a maximum tax rate of 15% as provided for the Jobs and Growth Tax Relief Reconciliation Act of 2003. The Portfolio designated up to a maximum of approximately $9,168,000 as taxable at this lower rate.
In January, the Portfolio provides tax information to shareholders for the preceding calendar year.
24
Morgan Stanley Institutional Fund, Inc.
Annual Report — December 31, 2015
U.S. Privacy Policy (unaudited)
AN IMPORTANT NOTICE CONCERNING OUR U.S. PRIVACY POLICY
This privacy notice describes the U.S. privacy policy of Morgan Stanley Distribution, Inc., and the Morgan Stanley family of mutual funds ("us", "our", "we").
We are required by federal law to provide you with notice of our U.S. privacy policy ("Policy"). This Policy applies to both our current and former clients unless we state otherwise and is intended for individual clients who purchase products or receive services from us for personal, family or household purposes. This Policy is not applicable to partnerships, corporations, trusts or other non-individual clients or account holders, nor is this Policy applicable to individuals who are either beneficiaries of a trust for which we serve as trustee or participants in an employee benefit plan administered or advised by us. This Policy is, however, applicable to individuals who select us to be a custodian of securities or assets in individual retirement accounts, 401(k) accounts, or accounts subject to the Uniform Gifts to Minors Act.
This notice sets out our business practices to protect your privacy; how we collect and share personal information about you; and how you can limit our sharing or certain uses by others of this information. We may amend this Policy at any time, and will inform you of any changes to our Policy as required by law.
WE RESPECT YOUR PRIVACY
We appreciate that you have provided us with your personal financial information and understand your concerns about your information. We strive to safeguard the information our clients entrust to us. Protecting the confidentiality and security of client information is an important part of how we conduct our business.
This notice describes what personal information we collect about you, how we collect it, when we may share it with others, and how certain others may use it. It discusses the steps you may take to limit our sharing of certain information about you with our affiliated companies, including, but not limited to our affiliated banking businesses, brokerage firms and credit service affiliates. It also discloses how you may limit our affiliates' use of shared information for marketing purposes.
Throughout this Policy, we refer to the nonpublic information that personally identifies you as "personal information." We also use the term "affiliated company" in this notice. An affiliated company is a company in our family of companies and includes companies with the Morgan Stanley name. These affiliated companies are financial institutions such as broker-dealers, banks, investment advisers and credit card issuers. We refer to any company that is not an affiliated company as a nonaffiliated third party. For purposes of Section 5 of this notice, and your ability to limit certain uses of personal information by our affiliates, this notice applies to the use of personal information by our affiliated companies.
1. WHAT PERSONAL INFORMATION DO WE COLLECT FROM YOU?
We may collect the following types of information about you: (i) information provided by you, including information from applications and other forms we receive from you, (ii) information about your transactions with us or our affiliates, (iii) information about your transactions with nonaffiliated third parties, (iv) information from consumer reporting agencies, (v) information obtained from our websites, and (vi) information obtained from other sources. For example:
• We collect information such as your name, address, e-mail address, telephone/fax numbers, assets, income and investment objectives through applications and other forms you submit to us.
• We may obtain information about account balances, your use of account(s) and the types of products and services you prefer to receive from us through your dealings and transactions with us and other sources.
• We may obtain information about your creditworthiness and credit history from consumer reporting agencies.
• We may collect background information from and through third-party vendors to verify representations you have made and to comply with various regulatory requirements.
2. WHEN DO WE DISCLOSE PERSONAL INFORMATION WE COLLECT ABOUT YOU?
We may disclose personal information we collect about you in each of the categories listed above to affiliated and nonaffiliated third parties.
25
Morgan Stanley Institutional Fund, Inc.
Annual Report — December 31, 2015
U.S. Privacy Policy (unaudited) (cont'd)
a. Information We Disclose to Affiliated Companies.
We may disclose personal information that we collect about you to our affiliated companies to manage your account(s) effectively, to service and process your transactions, and to let you know about products and services offered by us and affiliated companies, to manage our business, and as otherwise required or permitted by law. Offers for products and services from affiliated companies are developed under conditions designed to safeguard your personal information.
b. Information We Disclose to Third Parties.
We may disclose personal information that we collect about you to nonaffiliated third parties to provide marketing services on our behalf or to other financial institutions with whom we have joint marketing agreements. We may also disclose all of the information we collect to other nonaffiliated third parties for our everyday business purposes, such as to process transactions, maintain account(s), respond to court orders and legal investigations, report to credit bureaus, offer our own products and services, protect against fraud, for institutional risk control, to perform services on our behalf, and as otherwise required or permitted by law.
When we share personal information about you with a nonaffiliated third party, they are required to limit their use of personal information about you to the particular purpose for which it was shared and they are not allowed to share personal information about you with others except to fulfill that limited purpose or as may be permitted or required by law.
3. HOW DO WE PROTECT THE SECURITY AND CONFIDENTIALITY OF PERSONAL INFORMATION WE COLLECT ABOUT YOU?
We maintain physical, electronic and procedural security measures that comply with applicable law and regulations to help safeguard the personal information we collect about you. We have internal policies governing the proper handling of client information by employees. Third parties that provide support or marketing services on our behalf may also receive personal information about you, and we require them to adhere to appropriate security standards with respect to such information.
4. HOW CAN YOU LIMIT OUR SHARING CERTAIN PERSONAL INFORMATION ABOUT YOU WITH OUR AFFILIATED COMPANIES FOR ELIGIBILITY DETERMINATION?
By following the opt-out procedures in Section 6 below, you may limit the extent to which we share with our affiliated companies, personal information that was collected to determine your eligibility for products and services such as your credit reports and other information that you have provided to us or that we may obtain from third parties ("eligibility information"). Eligibility information does not include your identification information or personal information pertaining to our transactions or experiences with you. Please note that, even if you direct us not to share eligibility information with our affiliated companies, we may still share your personal information, including eligibility information, with our affiliated companies under circumstances that are permitted under applicable law, such as to process transactions or to service your account.
5. HOW CAN YOU LIMIT THE USE OF CERTAIN PERSONAL INFORMATION ABOUT YOU BY OUR AFFILIATED COMPANIES FOR MARKETING?
By following the opt-out instructions in Section 6 below, you may limit our affiliated companies from marketing their products or services to you based on personal information we disclose to them. This information may include, for example, your income and account history with us. Please note that, even if you choose to limit our affiliated companies from using personal information about you that we may share with them for marketing their products and services to you, our affiliated companies may use your personal information that they obtain from us to market to you in circumstances permitted by law, such as if the affiliated party has its own relationship with you.
26
Morgan Stanley Institutional Fund, Inc.
Annual Report — December 31, 2015
U.S. Privacy Policy (unaudited) (cont'd)
6. HOW CAN YOU SEND US AN OPT-OUT INSTRUCTION?
If you wish to limit our sharing of eligibility information about you with our affiliated companies, or our affiliated companies' use of personal information for marketing purposes, as described in this notice, you may do so by:
• Calling us at (800) 548-7786
Monday–Friday between 8a.m. and 6p.m. (EST)
• Writing to us at the following address:
Boston Financial Data Services, Inc.
c/o Privacy Coordinator
P.O. Box 219804
Kansas City, Missouri 64121
If you choose to write to us, your request should include: your name, address, telephone number and account number(s) to which the opt-out applies and whether you are opting out with respect to sharing of eligibility information (Section 4 above), or information used for marketing (Section 5 above), or both. Written opt-out requests should not be sent with any other correspondence. In order to process your request, we require that the request be provided by you directly and not through a third party. Once you have informed us about your privacy preferences, your opt-out preference will remain in effect with respect to this Policy (as it may be amended) until you notify us otherwise. If you are a joint account owner, we will accept instructions from any one of you and apply those instructions to the entire account.
Please understand that if you limit our sharing or our affiliated companies' use of personal information, you and any joint account holder(s) may not receive information about our affiliated companies' products and services, including products or services that could help you manage your financial resources and achieve your investment objectives.
If you have more than one account or relationship with us, please specify the accounts to which you would like us to apply your privacy choices. If you have accounts or relationships with our affiliates, you may receive multiple privacy policies from them, and will need to separately notify those companies of your privacy choices for those accounts or relationships.
7. WHAT IF AN AFFILIATED COMPANY BECOMES A NONAFFILIATED THIRD PARTY?
If, at any time in the future, an affiliated company becomes a nonaffiliated third party, further disclosures of personal information made to the former affiliated company will be limited to those described in Section 2(b) above relating to nonaffiliated third parties. If you elected under Section 6 to limit disclosures we make to affiliated companies, or use of personal information by affiliated companies, your election will not apply to use by any former affiliated company of your personal information in their possession once it becomes a nonaffiliated third party.
SPECIAL NOTICE TO RESIDENTS OF VERMONT
The following section supplements our Policy with respect to our individual clients who have a Vermont address and supersedes anything to the contrary in the above Policy with respect to those clients only.
The State of Vermont requires financial institutions to obtain your consent prior to sharing personal information that they collect about you with nonaffiliated third parties, or eligibility information with affiliated companies, other than in certain limited circumstances. Except as permitted by law, we will not share personal information we collect about you with nonaffiliated third parties or eligibility information with affiliated companies, unless you provide us with your written consent to share such information.
SPECIAL NOTICE TO RESIDENTS OF CALIFORNIA
The following section supplements our Policy with respect to our individual clients who have a California address and supersedes anything to the contrary in the above Policy with respect to those clients only.
In response to a California law, if your account has a California home address, your personal information will not be disclosed to nonaffiliated third parties except as permitted by applicable California law, and we will limit sharing such personal information with our affiliates to comply with California privacy laws that apply to us.
27
Morgan Stanley Institutional Fund, Inc.
Annual Report — December 31, 2015
Director and Officer Information (unaudited)
Independent Directors:
| Name, Age and Address of Independent Director | Positions(s) Held with Registrant | Length of Time Served | Principal Occupation(s) During Past 5 Years and Other Relevant Professional Experience | Number of Portfolios in Fund Complex Overseen by Director** | Other Directorships Held by Independent Director*** | ||||||||||||||||||
| Frank L. Bowman (71) c/o Kramer Levin Naftalis & Frankel LLP Counsel to the Independent Directors 1177 Avenue of the Americas New York, NY 10036 | Director | Since August 2006 | President, Strategic Decisions, LLC (consulting) (since February 2009); Director or Trustee of various Morgan Stanley Funds (since August 2006); Chairperson of the Compliance and Insurance Committee (since October 2015); Formerly, Chairperson of the Insurance Sub-Committee of the Compliance and Insurance Committee (February 2007-December 2015); served as President and Chief Executive Officer of the Nuclear Energy Institute (policy organization) (February 2005-November 2008); retired as Admiral, U.S. Navy after serving over 38 years on active duty including 8 years as Director of the Naval Nuclear Propulsion Program in the Department of the Navy and the U.S. Department of Energy (1996-2004); served as Chief of Naval Personnel (July 1994-September 1996); and on the Joint Staff as Director of Political Military Affairs (June 1992-July1994); knighted as Honorary Knight Commander of the Most Excellent Order of the British Empire; awarded the Officier de l'Orde National du Mérite by the French Government; elected to the National Academy of Engineering (2009). | 98 | Director of BP p.l.c.; Director of Naval and Nuclear Technologies LLP; Director Emeritus of the Armed Services YMCA; Director of the U.S. Naval Submarine League; Member of the National Security Advisory Council of the Center for U.S. Global Engagement and a member of the CNA Military Advisory Board; Chairman of the Charity, J Street Cup Golf, Trustee of Fairhaven United Methodist Church; and Director of other various non-profit organizations. | ||||||||||||||||||
| Kathleen A. Dennis (62) c/o Kramer Levin Naftalis & Frankel LLP Counsel to the Independent Directors 1177 Avenue of the Americas New York, NY 10036 | Director | Since August 2006 | President, Cedarwood Associates (mutual fund and investment management consulting) (since July 2006); Chairperson of the Money Market and Alternatives Sub-Committee of the Investment Committee (since October 2006) and Director or Trustee of various Morgan Stanley Funds (since August 2006); formerly, Senior Managing Director of Victory Capital Management (1993-2006). | 98 | Director of various nonprofit organizations. | ||||||||||||||||||
| Nancy C. Everett (61) c/o Kramer Levin Naftalis & Frankel LLP Counsel to the Independent Directors 1177 Avenue of the Americas New York, NY 10036 | Director | Since January 2015 | Chief Executive Officer, Virginia Commonwealth University Investment Company (since November 2015); Owner, OBIR, LLC (investment management consulting) (since June 2014); formerly, Managing Director, BlackRock Inc. (February 2011-December 2013); and Chief Executive Officer, General Motors Asset Management (a/k/a Promark Global Advisors, Inc.) (June 2005-May 2010). | 98 | Member of Virginia Commonwealth University School of Business Foundation; formerly, Member of Virginia Commonwealth University Board of Visitors (2013-2015); Member of Committee on Directors for Emerging Markets Growth Fund, Inc. (2007-2010); Chairperson of Performance Equity Management, LLC (2006-2010); and Chairperson, GMAM Absolute Return Strategies Fund, LLC (2006-2010). | ||||||||||||||||||
28
Morgan Stanley Institutional Fund, Inc.
Annual Report — December 31, 2015
Director and Officer Information (unaudited) (cont'd)
Independent Directors: (cont'd)
| Name, Age and Address of Independent Director | Positions(s) Held with Registrant | Length of Time Served | Principal Occupation(s) During Past 5 Years and Other Relevant Professional Experience | Number of Portfolios in Fund Complex Overseen by Director** | Other Directorships Held by Independent Director*** | ||||||||||||||||||
| Jakki L. Haussler (58) c/o Kramer Levin Naftalis & Frankel LLP Counsel to the Independent Directors 1177 Avenue of the Americas New York, NY 10036 | Director | Since January 2015 | Chairman and Chief Executive Officer, Opus Capital Group (since January 1996); and formerly, Director, Capvest Venture Fund, LP (May 2000-December 2011); Partner, Adena Ventures, LP (July 1999-December 2010); Director, The Victory Funds (February 2005-July 2008). | 98 | Director of Cincinnati Bell Inc. and Member, Audit Committee and Compensation Committee; Director of Northern Kentucky University Foundation and Member, Investment Committee; Member of Chase College of Law Transactional Law Practice Center Board of Advisors; Director of Best Transport; Chase College of Law Board of Visitors; formerly Member, University of Cincinnati Foundation Investment Committee; Member, Miami University Board of Visitors (2008-2011); Trustee of Victory Funds (2005-2008) and Chairman, Investment Committee (2007-2008) and Member, Service Provider Committee (2005-2008). | ||||||||||||||||||
| Dr. Manuel H. Johnson (67) c/o Johnson Smick International, Inc. 220 I Street, N.E. — Suite 200 Washington, D.C. 20002 | Director | Since July 1991 | Senior Partner, Johnson Smick International, Inc. (consulting firm); Chairperson of the Investment Committee (since October 2006) and Director or Trustee of various Morgan Stanley Funds (since July 1991); Co-Chairman and a founder of the Group of Seven Council (G7C) (international economic commission); formerly Chairperson of the Audit Committee (July 1991-September 2006), Vice Chairman of the Board of Governors of the Federal Reserve System and Assistant Secretary of the U.S. Treasury. | 100 | Director of NVR, Inc. (home construction). | ||||||||||||||||||
| Joseph J. Kearns (73) c/o Kearns & Associates LLC 23823 Malibu Road S-50-440 Malibu, CA 90265 | Director | Since August 1994 | President, Kearns & Associates LLC (investment consulting); Chairperson of the Audit Committee (since October 2006) and Director or Trustee of various Morgan Stanley Funds (since August 1994); formerly, Deputy Chairperson of the Audit Committee (July 2003-September 2006) and Chairperson of the Audit Committee of various Morgan Stanley Funds (since August 1994); CFO of the J. Paul Getty Trust. | 101 | Director of Electro Rent Corporation (equipment leasing). Prior to December 31, 2013, Director of The Ford Family Foundation. | ||||||||||||||||||
29
Morgan Stanley Institutional Fund, Inc.
Annual Report — December 31, 2015
Director and Officer Information (unaudited) (cont'd)
Independent Directors: (cont'd)
| Name, Age and Address of Independent Director | Positions(s) Held with Registrant | Length of Time Served | Principal Occupation(s) During Past 5 Years and Other Relevant Professional Experience | Number of Portfolios in Fund Complex Overseen by Director** | Other Directorships Held by Independent Director*** | ||||||||||||||||||
| Michael F. Klein (57) c/o Kramer Levin Naftalis & Frankel LLP Counsel to the Independent Directors 1177 Avenue of the Americas New York, NY 10036 | Director | Since August 2006 | Managing Director, Aetos Capital, LLC (since March 2000); Co-President, Aetos Alternatives Management, LLC (since January 2004); and Co-Chief Executive Officer of Aetos Capital LLC (since August 2013); Chairperson of the Fixed Income Sub-Committee of the Investment Committee (since October 2006) and Director or Trustee of various Morgan Stanley Funds (since August 2006); formerly, Managing Director, Morgan Stanley & Co. Inc. and Morgan Stanley Dean Witter Investment Management, President, various Morgan Stanley Funds (June1998-March 2000) and Principal, Morgan Stanley & Co. Inc. and Morgan Stanley Dean Witter Investment Management (August 1997-December 1999). | 97 | Director of certain investment funds managed or sponsored by Aetos Capital, LLC. Director of Sanitized AG and Sanitized Marketing AG (specialty chemicals). | ||||||||||||||||||
| Michael E. Nugent (79) 522 Fifth Avenue New York, NY 10036 | Chair of the Board and Director | Chair of the Boards since July 2006 and Director since July 1991 | Chair of the Boards of various Morgan Stanley Funds (since July 2006); Chairperson of the Closed-End Fund Committee (since June 2012) and Director or Trustee of various Morgan Stanley Funds (since July 1991); formerly, Chairperson of the Insurance Committee (until July 2006), General Partner, TriumphCapital, L.P. (private investment partnership) (1988-2013). | 100 | None. | ||||||||||||||||||
| W. Allen Reed (68) c/o Kramer Levin Naftalis & Frankel LLP Counsel to the Independent Directors 1177 Avenue of the Americas New York, NY 10036 | Director | Since August 2006 | Chairperson of the Equity Sub-Committee of the Investment Committee (since October 2006) and Director or Trustee of various Morgan Stanley Funds (since August 2006); formerly, President and CEO of General Motors Asset Management; Chairman and Chief Executive Officer of the GM Trust Bank and Corporate Vice President of General Motors Corporation (August 1994-December 2005). | 98 | Director of Legg Mason, Inc.; formerly Director of the Auburn University Foundation (2010-2015). | ||||||||||||||||||
| Fergus Reid (83) c/o Joe Pietryka, Inc. 85 Charles Colman Blvd. Pawling, NY 12564 | Director | Since June 1992 | Chairman, Joe Pietryka, Inc.; Chairperson of the Governance Committee and Director or Trustee of various Morgan Stanley Funds (since June 1992). | 100 | Formerly, Trustee and Director of certain investment companies in the JP Morgan Fund Complex managed by JP Morgan Investment Management Inc. (1987-2012). | ||||||||||||||||||
30
Morgan Stanley Institutional Fund, Inc.
Annual Report — December 31, 2015
Director and Officer Information (unaudited) (cont'd)
Interested Director:
| Name, Age and Address of Interested Director | Positions(s) Held with Registrant | Length of Time Served | Principal Occupation(s) During Past 5 Years | Number of Portfolios in Fund Complex Overseen by Interested Director** | Other Directorships Held by Interested Director*** | ||||||||||||||||||
| James F. Higgins (68) One New York Plaza, New York, NY 10004 | Director | Since June 2000 | Director or Trustee of various Morgan Stanley Funds (since June 2000); Senior Advisor of Morgan Stanley (since August 2000). | 97 | Formerly, Director of AXA Financial, Inc. and AXA Equitable Life Insurance Company (2002-2011) and Director of AXA MONY Life Insurance Company and AXA MONY Life Insurance Company of America (2004-2011). | ||||||||||||||||||
* This is the earliest date the Director began serving the Morgan Stanley Funds. Each Director serves an indefinite term, until his or her successor is elected.
** The Fund Complex includes (as of December 31, 2015) all open-end and closed-end funds (including all of their portfolios) advised by Morgan Stanley Investment Management Inc. (the "Adviser") and any funds that have an adviser that is an affiliated person of the Adviser (including, but not limited to, Morgan Stanley AIP GP LP).
*** This includes any directorships at public companies and registered investment companies held by the Director at any time during the past five years.
Executive Officers:
Name, Age and Address of Executive Officer | Position(s) Held with Registrant | Length of Time Served**** | Principal Occupation(s) During Past 5 Years | ||||||||||||
| John H. Gernon (52) 522 Fifth Avenue New York, NY 10036 | President and Principal Executive Officer | Since September 2013 | President and Principal Executive Officer of the Equity and Fixed Income Funds and the Morgan Stanley AIP Funds (since September 2013) and the Liquidity Funds and various money market funds (since May 2014) in the Fund Complex, Managing Director of the Adviser; Head of Product (since 2006). | ||||||||||||
| Stefanie V. Chang Yu (49) 522 Fifth Avenue New York, NY 10036 | Chief Compliance Officer | Since December 1997 | Managing Director of the Adviser and various entities affiliated with the Adviser; Chief Compliance Officer of various Morgan Stanley Funds and the Adviser (since January 2014); formerly, Vice President of various Morgan Stanley Funds (December 1997-January 2014). | ||||||||||||
| Joseph C. Benedetti (50) 522 Fifth Avenue New York, NY 10036 | Vice President | Since January 2014 | Managing Director of the Adviser and various entities affiliated with the Adviser; Vice President of various Morgan Stanley Funds (since January 2014); formerly, Assistant Secretary of various Morgan Stanley Funds (October 2004-January 2014). | ||||||||||||
| Francis J. Smith (50) 522 Fifth Avenue New York, NY 10036 | Treasurer and Principal Financial Officer | Treasurer since July 2003 and Principal Financial Officer since September 2002 | Executive Director of the Adviser and various entities affiliated with the Adviser; Treasurer (since July 2003) and Principal Financial Officer of various Morgan Stanley Funds (since September 2002). | ||||||||||||
| Mary E. Mullin (48) 522 Fifth Avenue New York, NY 10036 | Secretary | Since June 1999 | Executive Director of the Adviser; Secretary of various Morgan Stanley Funds (since June 1999). | ||||||||||||
**** This is the earliest date the officer began serving the Morgan Stanley Funds. Each officer serves a one-year term, until his or her successor is elected and has qualified.
31
Morgan Stanley Institutional Fund, Inc.
Annual Report — December 31, 2015
Adviser and Administrator
Morgan Stanley Investment Management Inc.
522 Fifth Avenue
New York, New York 10036
Sub-Advisers
Morgan Stanley Investment Management Limited
25 Cabot Square, Canary Wharf
London, E14 4QA, England
Morgan Stanley Investment Management Company
23 Church Street
16-01 Capital Square, Singapore 049481
Distributor
Morgan Stanley Distribution, Inc.
522 Fifth Avenue
New York, New York 10036
Dividend Disbursing and Transfer Agent
Boston Financial Data Services, Inc.
2000 Crown Colony Drive
Quincy, Massachusetts 02169
Custodian
State Street Bank and Trust Company
One Lincoln Street
Boston, Massachusetts 02111
Legal Counsel
Dechert LLP
1095 Avenue of the Americas
New York, New York 10036
Counsel to the Independent Directors
Kramer Levin Naftalis & Frankel LLP
1177 Avenue of the Americas
New York, New York 10036
Independent Registered Public Accounting Firm
Ernst & Young LLP
200 Clarendon Street
Boston, Massachusetts 02116
Reporting to Shareholders
Each Morgan Stanley fund provides a complete schedule of portfolio holdings in its semi-annual and annual reports within 60 days of the end of the fund's second and fourth fiscal quarters. The semi-annual and annual reports are filed electronically with the Securities and Exchange Commission (SEC) on Form N-CSRS and Form N-CSR, respectively. Morgan Stanley also delivers the semi-annual and annual reports to fund shareholders and makes these reports available on its public website, www.morganstanley.com/im. Each Morgan Stanley fund also files a complete schedule of portfolio holdings with the SEC for the fund's first and third fiscal quarters on Form N-Q. Morgan Stanley does not deliver the reports for the first and third fiscal quarters to shareholders, nor are the reports posted to the Morgan Stanley public website. You may, however, obtain the Form N-Q filings (as well as the Form N-CSR and N-CSRS filings) by accessing the SEC's website, www.sec.gov. You may also review and copy them at the SEC's Public Reference Room in Washington, DC. Information on the operation of the SEC's Public Reference Room may be obtained by calling the SEC toll free at 1 (800) SEC-0330. You can also request copies of these materials, upon payment of a duplicating fee, by electronic request at the SEC's email address (publicinfo@sec.gov) or by writing the Public Reference Room of the SEC, Washington, DC 20549-0102.
Proxy Voting Policies and Procedures and Proxy Voting Record
You may obtain a copy of the Fund's Proxy Voting Policy and Procedures and information regarding how the Fund voted proxies relating to portfolio securities during the most recent twelve-month period ended June 30, without charge, upon request, by calling toll free 1 (800) 548-7786 or by visiting our website at www.morganstanley.com/im. This information is also available on the SEC's website at www.sec.gov.
This report is authorized for distribution only when preceded or accompanied by a prospectus of the Morgan Stanley Institutional Fund, Inc., which describes in detail each Portfolio's investment policies, risks, fees and expenses. Please read the prospectus carefully before you invest or send money. For additional information, including information regarding the investments comprising the Portfolio, please visit our website at www.morganstanley.com/im or call toll free 1 (800) 548-7786.
32
Printed in U.S.A.
This Report has been prepared for shareholders and may be distributed to others only if preceded or accompanied by a current prospectus.
Morgan Stanley Investment Management Inc.
522 Fifth Avenue
New York, New York 10036
© 2016 Morgan Stanley. Morgan Stanley Distribution, Inc.

IFIGFANN
1405519 EXP. 02.28.17
Item 2. Code of Ethics.
(a) The Fund has adopted a code of ethics (the “Code of Ethics”) that applies to its principal executive officer, principal financial officer, principal accounting officer or controller, or persons performing similar functions, regardless of whether these individuals are employed by the Fund or a third party.
(b) No information need be disclosed pursuant to this paragraph.
(c) Not applicable.
(d) Not applicable.
(e) Not applicable.
(f)
(1) The Fund’s Code of Ethics is attached hereto as Exhibit 12 A.
(2) Not applicable.
(3) Not applicable.
Item 3. Audit Committee Financial Expert.
The Fund’s Board of Directors has determined that Joseph J. Kearns, an “independent” Director, is an “audit committee financial expert” serving on its audit committee. Under applicable securities laws, a person who is determined to be an audit committee financial expert will not be deemed an “expert” for any purpose, including without limitation for the purposes of Section 11 of the Securities Act of 1933, as a result of being designated or identified as an audit committee financial expert. The designation or identification of a person as an audit committee financial expert does not impose on such person any duties, obligations, or liabilities that are greater than the duties, obligations, and liabilities imposed on such person as a member of the audit committee and Board of Directors in the absence of such designation or identification.
Item 4. Principal Accountant Fees and Services.
(a)(b)(c)(d) and (g). Based on fees billed for the periods shown:
2015
|
| Registrant |
| Covered Entities(1) |
| ||
Audit Fees |
| $ | 1,046,857 |
| N/A |
| |
|
|
|
|
|
| ||
Non-Audit Fees |
|
|
|
|
| ||
Audit-Related Fees |
| $ |
| (2) | $ |
| (2) |
Tax Fees |
| $ | 108,000 | (3) | $ | 8,237,026 | (4) |
All Other Fees |
| $ |
|
| $ | 212,000 | (5) |
Total Non-Audit Fees |
| $ | 108,000 |
| $ | 8,449,026 |
|
|
|
|
|
|
| ||
Total |
| $ | 1,154,857 |
| $ | 8,449,026 |
|
2014
|
| Registrant |
| Covered Entities(1) |
| ||
Audit Fees |
| $ | 1,053,918 |
| N/A |
| |
|
|
|
|
|
| ||
Non-Audit Fees |
|
|
|
|
| ||
Audit-Related Fees |
| $ |
| (2) | $ |
| (2) |
Tax Fees |
| $ | 103,120 | (3) | $ | 8,655,656 | (4) |
All Other Fees |
| $ |
|
| $ | 285,341 | (5) |
Total Non-Audit Fees |
| $ | 103,120 |
| $ | 8,940,997 |
|
|
|
|
|
|
| ||
Total |
| $ | 1,157,038 |
| $ | 8,940,997 |
|
N/A- Not applicable, as not required by Item 4.
(1) Covered Entities include the Adviser (excluding sub-advisors) and any entity controlling, controlled by or under common control with the Adviser that provides ongoing services to the Registrant.
(2) Audit-Related Fees represent assurance and related services provided that are reasonably related to the performance of the audit of the financial statements of the Covered Entities’ and funds advised by the Adviser or its affiliates, specifically data verification and agreed-upon procedures related to asset securitizations and agreed-upon procedures engagements.
(3) Tax Fees represent tax compliance, tax planning and tax advice services provided in connection with the preparation and review of the Registrant’s tax returns.
(4) Tax Fees represent tax compliance, tax planning and tax advice services provided in connection with the review of Covered Entities’ tax returns.
(5) All other fees represent project management for future business applications and improving business and operational processes.
(e)(1) The audit committee’s pre-approval policies and procedures are as follows:
APPENDIX A
AUDIT COMMITTEE
AUDIT AND NON-AUDIT SERVICES
PRE-APPROVAL POLICY AND PROCEDURES
OF THE
MORGAN STANLEY RETAIL AND INSTITUTIONAL FUNDS
AS ADOPTED AND AMENDED JULY 23, 2004,(1)
1. Statement of Principles
The Audit Committee of the Board is required to review and, in its sole discretion, pre-approve all Covered Services to be provided by the Independent Auditors to the Fund and Covered Entities in order to assure that services performed by the Independent Auditors do not impair the auditor’s independence from the Fund.
The SEC has issued rules specifying the types of services that an independent auditor may not provide to its audit client, as well as the audit committee’s administration of the engagement of the independent auditor. The SEC’s rules establish two different approaches to pre-approving services, which the SEC considers to be equally valid. Proposed services either: may be pre-approved without consideration of specific case-by-case services by the Audit Committee (“general pre-approval”); or require the specific pre-approval of the Audit Committee or its delegate (“specific pre-approval”). The Audit Committee believes that the combination of these two approaches in this Policy will result in an effective and efficient procedure to pre-approve services performed by the Independent Auditors. As set forth in this Policy, unless a type of service has received general pre-approval, it will require specific pre-approval by the Audit Committee (or by any member of the Audit Committee to which pre-approval authority has been delegated) if it is to be provided by the Independent Auditors. Any proposed services exceeding pre-approved cost levels or budgeted amounts will also require specific pre-approval by the Audit Committee.
The appendices to this Policy describe the Audit, Audit-related, Tax and All Other services that have the general pre-approval of the Audit Committee. The term of any general pre-approval is 12 months from the date of pre-approval, unless the Audit Committee considers and provides a different period and states otherwise. The Audit Committee will annually review and pre-approve the services that may be provided by the Independent Auditors without obtaining specific pre-approval from the Audit Committee. The Audit Committee will add to or subtract from the list of general pre-approved services from time to time, based on subsequent determinations.
(1) This Audit Committee Audit and Non-Audit Services Pre-Approval Policy and Procedures (the “Policy”), adopted as of the date above, supersedes and replaces all prior versions that may have been adopted from time to time.
The purpose of this Policy is to set forth the policy and procedures by which the Audit Committee intends to fulfill its responsibilities. It does not delegate the Audit Committee’s responsibilities to pre-approve services performed by the Independent Auditors to management.
The Fund’s Independent Auditors have reviewed this Policy and believes that implementation of the Policy will not adversely affect the Independent Auditors’ independence.
2. Delegation
As provided in the Act and the SEC’s rules, the Audit Committee may delegate either type of pre-approval authority to one or more of its members. The member to whom such authority is delegated must report, for informational purposes only, any pre-approval decisions to the Audit Committee at its next scheduled meeting.
3. Audit Services
The annual Audit services engagement terms and fees are subject to the specific pre-approval of the Audit Committee. Audit services include the annual financial statement audit and other procedures required to be performed by the Independent Auditors to be able to form an opinion on the Fund’s financial statements. These other procedures include information systems and procedural reviews and testing performed in order to understand and place reliance on the systems of internal control, and consultations relating to the audit. The Audit Committee will approve, if necessary, any changes in terms, conditions and fees resulting from changes in audit scope, Fund structure or other items.
In addition to the annual Audit services engagement approved by the Audit Committee, the Audit Committee may grant general pre-approval to other Audit services, which are those services that only the Independent Auditors reasonably can provide. Other Audit services may include statutory audits and services associated with SEC registration statements (on Forms N-1A, N-2, N-3, N-4, etc.), periodic reports and other documents filed with the SEC or other documents issued in connection with securities offerings.
The Audit Committee has pre-approved the Audit services in Appendix B.1. All other Audit services not listed in Appendix B.1 must be specifically pre-approved by the Audit Committee (or by any member of the Audit Committee to which pre-approval has been delegated).
4. Audit-related Services
Audit-related services are assurance and related services that are reasonably related to the performance of the audit or review of the Fund’s financial statements and, to the extent they are Covered Services, the Covered Entities or that are traditionally performed by the Independent Auditors. Because the Audit Committee believes that the provision of Audit-related services does not impair the independence of the auditor and is consistent with the SEC’s rules on auditor independence, the Audit Committee may grant general pre-approval to Audit-related services. Audit-related services include, among others, accounting consultations related to accounting, financial reporting or disclosure matters
not classified as “Audit services”; assistance with understanding and implementing new accounting and financial reporting guidance from rulemaking authorities; agreed-upon or expanded audit procedures related to accounting and/or billing records required to respond to or comply with financial, accounting or regulatory reporting matters; and assistance with internal control reporting requirements under Forms N-SAR and/or N-CSR.
The Audit Committee has pre-approved the Audit-related services in Appendix B.2. All other Audit-related services not listed in Appendix B.2 must be specifically pre-approved by the Audit Committee (or by any member of the Audit Committee to which pre-approval has been delegated).
5. Tax Services
The Audit Committee believes that the Independent Auditors can provide Tax services to the Fund and, to the extent they are Covered Services, the Covered Entities, such as tax compliance, tax planning and tax advice without impairing the auditor’s independence, and the SEC has stated that the Independent Auditors may provide such services.
Pursuant to the preceding paragraph, the Audit Committee has pre-approved the Tax Services in Appendix B.3. All Tax services in Appendix B.3 must be specifically pre-approved by the Audit Committee (or by any member of the Audit Committee to which pre-approval has been delegated).
6. All Other Services
The Audit Committee believes, based on the SEC’s rules prohibiting the Independent Auditors from providing specific non-audit services, that other types of non-audit services are permitted. Accordingly, the Audit Committee believes it may grant general pre-approval to those permissible non-audit services classified as All Other services that it believes are routine and recurring services, would not impair the independence of the auditor and are consistent with the SEC’s rules on auditor independence.
The Audit Committee has pre-approved the All Other services in Appendix B.4. Permissible All Other services not listed in Appendix B.4 must be specifically pre-approved by the Audit Committee (or by any member of the Audit Committee to which pre-approval has been delegated).
7. Pre-Approval Fee Levels or Budgeted Amounts
Pre-approval fee levels or budgeted amounts for all services to be provided by the Independent Auditors will be established annually by the Audit Committee. Any proposed services exceeding these levels or amounts will require specific pre-approval by the Audit Committee. The Audit Committee is mindful of the overall relationship of fees for audit and non-audit services in determining whether to pre-approve any such services.
8. Procedures
All requests or applications for services to be provided by the Independent Auditors that do not require specific approval by the Audit Committee will be submitted to the Fund’s Chief Financial Officer and must include a detailed description of the services to be
rendered. The Fund’s Chief Financial Officer will determine whether such services are included within the list of services that have received the general pre-approval of the Audit Committee. The Audit Committee will be informed on a timely basis of any such services rendered by the Independent Auditors. Requests or applications to provide services that require specific approval by the Audit Committee will be submitted to the Audit Committee by both the Independent Auditors and the Fund’s Chief Financial Officer, and must include a joint statement as to whether, in their view, the request or application is consistent with the SEC’s rules on auditor independence.
The Audit Committee has designated the Fund’s Chief Financial Officer to monitor the performance of all services provided by the Independent Auditors and to determine whether such services are in compliance with this Policy. The Fund’s Chief Financial Officer will report to the Audit Committee on a periodic basis on the results of its monitoring. Both the Fund’s Chief Financial Officer and management will immediately report to the chairman of the Audit Committee any breach of this Policy that comes to the attention of the Fund’s Chief Financial Officer or any member of management.
9. Additional Requirements
The Audit Committee has determined to take additional measures on an annual basis to meet its responsibility to oversee the work of the Independent Auditors and to assure the auditor’s independence from the Fund, such as reviewing a formal written statement from the Independent Auditors delineating all relationships between the Independent Auditors and the Fund, consistent with Independence Standards Board No. 1, and discussing with the Independent Auditors its methods and procedures for ensuring independence.
10. Covered Entities
Covered Entities include the Fund’s investment adviser(s) and any entity controlling, controlled by or under common control with the Fund’s investment adviser(s) that provides ongoing services to the Fund(s). Beginning with non-audit service contracts entered into on or after May 6, 2003, the Fund’s audit committee must pre-approve non-audit services provided not only to the Fund but also to the Covered Entities if the engagements relate directly to the operations and financial reporting of the Fund. This list of Covered Entities would include:
Morgan Stanley Retail Funds
Morgan Stanley Investment Advisors Inc.
Morgan Stanley & Co. Incorporated
Morgan Stanley DW Inc.
Morgan Stanley Investment Management Inc.
Morgan Stanley Investment Management Limited
Morgan Stanley Investment Management Private Limited
Morgan Stanley Asset & Investment Trust Management Co., Limited
Morgan Stanley Investment Management Company
Morgan Stanley Services Company, Inc.
Morgan Stanley Distributors Inc.
Morgan Stanley Trust FSB
Morgan Stanley Institutional Funds
Morgan Stanley Investment Management Inc.
Morgan Stanley Investment Advisors Inc.
Morgan Stanley Investment Management Limited
Morgan Stanley Investment Management Private Limited
Morgan Stanley Asset & Investment Trust Management Co., Limited
Morgan Stanley Investment Management Company
Morgan Stanley & Co. Incorporated
Morgan Stanley Distribution, Inc.
Morgan Stanley AIP GP LP
Morgan Stanley Alternative Investment Partners LP
(e)(2) Beginning with non-audit service contracts entered into on or after May 6, 2003, the audit committee also is required to pre-approve services to Covered Entities to the extent that the services are determined to have a direct impact on the operations or financial reporting of the Registrant. 100% of such services were pre-approved by the audit committee pursuant to the Audit Committee’s pre-approval policies and procedures (attached hereto).
(f) Not applicable.
(g) See table above.
(h) The audit committee of the Board of Directors has considered whether the provision of services other than audit services performed by the auditors to the Registrant and Covered Entities is compatible with maintaining the auditors’ independence in performing audit services.
Item 5. Audit Committee of Listed Registrants.
(a) The Fund has a separately-designated standing audit committee established in accordance with Section 3(a)(58)(A) of the Exchange Act whose members are:
Joseph J. Kearns, Jakki L. Haussler, Michael F. Klein and Allen W. Reed.
(b) Not applicable.
Item 6. Schedule of Investments
(a) Refer to Item 1.
(b) Not applicable.
Item 7. Disclosure of Proxy Voting Policies and Procedures for Closed-End Management Investment Companies.
Applicable only to reports filed by closed-end funds.
Item 8. Portfolio Managers of Closed-End Management Investment Companies
Applicable only to reports filed by closed-end funds.
Item 9. Closed-End Fund Repurchases
Applicable only to reports filed by closed-end funds.
Item 10. Submission of Matters to a Vote of Security Holders
Not applicable.
Item 11. Controls and Procedures
(a) The Fund’s principal executive officer and principal financial officer have concluded that the Fund’s disclosure controls and procedures are sufficient to ensure that information required to be disclosed by the Fund in this Form N-CSR was recorded, processed, summarized and reported within the time periods specified in the Securities and Exchange Commission’s rules and forms, based upon such officers’ evaluation of these controls and procedures as of a date within 90 days of the filing date of the report.
(b) There were no changes in the registrant’s internal control over financial reporting that occurred during the second fiscal quarter of the period covered by this report that has materially affected, or is reasonably likely to materially affect, the registrant’s internal control over financial reporting.
Item 12. Exhibits
(a) The Code of Ethics for Principal Executive and Senior Financial Officers is attached hereto.
(b) A separate certification for each principal executive officer and principal financial officer of the registrant are attached hereto as part of EX-99.CERT.
SIGNATURES
Pursuant to the requirements of the Securities Exchange Act of 1934 and the Investment Company Act of 1940, the registrant has duly caused this report to be signed on its behalf by the undersigned, thereunto duly authorized.
Morgan Stanley Institutional Fund, Inc. |
|
|
|
/s/ John H. Gernon |
|
John H. Gernon |
|
Principal Executive Officer |
|
February 18, 2016 |
|
Pursuant to the requirements of the Securities Exchange Act of 1934 and the Investment Company Act of 1940, this report has been signed by the following persons on behalf of the registrant and in the capacities and on the dates indicated.
/s/ John H. Gernon |
|
John H. Gernon |
|
Principal Executive Officer |
|
February 18, 2016 |
|
|
|
/s/ Francis Smith |
|
Francis Smith |
|
Principal Financial Officer |
|
February 18, 2016 |
|